As filed with the Securities and Exchange Commission on March 01, 20104, 2011
UNITED STATES
SECURITIES AND EXCHANGE COMMISSION
Washington, D.C. 20549
FORM 20-F
| | |
| o | | REGISTRATION STATEMENT PURSUANT TO SECTION 12(b) OR (g) OF THE SECURITIES
EXCHANGE ACT OF 1934 |
OR
| | |
| þ | | ANNUAL REPORT PURSUANT TO SECTION 13 OR 15(d) OF THE SECURITIES
EXCHANGE ACT OF 1934 |
| |
For the fiscal year ended December 31, 20092010 |
OR
| | |
| o | | TRANSITION REPORT PURSUANT TO SECTION 13 OR 15(d) OF THE SECURITIES
EXCHANGE ACT OF 1934 |
OR
| | |
| o | | SHELL COMPANY REPORT PURSUANT TO SECTION 13 OR 15(d) OF THE SECURITIES
EXCHANGE ACT OF 1934 |
Commission file number 1-15170
GlaxoSmithKline plc
(Exact name of Registrant as specified in its charter)
England
(Jurisdiction of incorporation or organization)
980 Great West Road, Brentford, Middlesex TW8 9GS England
(Address of principal executive offices)
Simon BicknellVictoria Whyte
Company Secretary
GlaxoSmithKline plc
980 Great West Road
Brentford, TW8 9GS
England
+44 20 8047 5000
company.secretary@gsk.com
(Name, Telephone, E-mail and/or Facsimile number and Address of Company Contact Person)
Securities registered or to be registered pursuant to Section 12(b) of the Act:
| | | |
| Title of Each Class | | Name of Each Exchange On Which Registered |
| | |
American Depositary Shares, each representing 2 Ordinary Shares,
Par value 25 pence | | New York Stock Exchange |
| 4.850% Notes due 2013 | | New York Stock Exchange |
| 5.650% Notes due 2018 | | New York Stock Exchange |
| 6.375% Notes due 2038 | | New York Stock Exchange |
Floating Rate Notes due 2010 | | New York Stock Exchange |
Securities registered or to be registered pursuant to Section 12(g) of the Act:
None
(Title of class)
Securities for which there is a reporting obligation pursuant to Section 15(d) of the Act:
None
(Title of class)
Indicate the number of outstanding shares of each of the issuer’s classes of capital or common stock as of the close of the period covered by the annual report.
| | | | | |
|
| | | | |
| Ordinary Shares of Par value 25 pence each | | 5,190,934,201 | 5,196,264,019 | |
| | | | |
Indicate by check mark if the registrant is a well-known seasoned issuer, as defined in Rule 405 of the Securities Act.
þ Yes o No
If this report is an annual or transition report, indicate by check mark if the registrant is not required to file reports pursuant to Section 13 or 15(d) of the Securities Exchange Act of 1934.
o Yes þ No
Note — Checking the box above will not relieve any registrant required to file reports pursuant to Section 13 or 15(d) of the Securities Exchange Act of 1934 from their obligations under those Sections.
Indicate by check mark whether the registrant (1) has filed all reports to be filed by Section 13 or 15(d) of the Securities Exchange Act of 1934 during the preceding 12 months (or for such shorter period that the registrant was required to file such reports), and (2) has been subject to such filing requirements for the past 90 days.
þ Yes o No
Indicate by check mark whether the registrant has submitted electronically and posted on its corporate Web site, if any, every Interactive Data File required to be submitted and posted pursuant to Rule 405 of Regulation S-T (§232.405 of this chapter) during the preceding 12 months (or for such shorter period that the registrant was required to submit and post such files).
o Yes o No
Indicate by check mark whether the registrant is a large accelerated filer, an accelerated filer, or a non-accelerated filer. See definition of “accelerated filer” and “large accelerated filer” in Rule 12b-2 of the Exchange Act. (Check one):
| | | | | |
|
Large accelerated filerþ | | Accelerated filero | | Accelerated filero | | Non-accelerated filero |
Indicate by check mark which basis of accounting the registrant has used to prepare the financial statements included in this filing:
| | | | | | | |
|
| U.S. GAAPo | | International Financial Reporting Standards as issued | | Othero |
| | by the International Accounting Standards Boardþ | | þ | | Othero |
If “Other” has been checked in response to the previous question, indicate by check mark which financial statement item the registrant has elected to follow.
Item 17o Item 18o
If this is an annual report, indicate by check mark whether the registrant is a shell company (as defined in Rule 12b-2 of the Exchange Act).
o Yes þ No
Contents
 | | | | |
Business review | | | | |
| | | 08 | |
| | | 10 | |
| | | 12 | |
| | | 14 | |
| | | 18 | |
| | | 19 | |
| | | 20 | |
| | | 21 | |
| | | 22 | |
| | | 29 | |
| | | 34 | |
| | | 41 | |
| | | 47 | |
| | | 53 | |
| | | | |
|
| | | | |
Governance and remuneration | | | | |
| | | 58 | |
| | | 60 | |
| | | 64 | |
| | | 69 | |
| | | 71 | |
| | | 74 | |
| | | 81 | |
| | | 91 | |
| | | 94 | |
| | | 96 | |
| | | 101 | |
| | | | |
|
| | | | |
Financial statements | | | | |
| | | 102 | |
| | | 103 | |
| | | 104 | |
| | | 109 | |
| | | | |
|
| | | | |
Shareholder information | | | | |
| | | 186 | |
| | | 194 | |
| | | 197 | |
| | | 201 | |
| | | 202 | |
| | | 202 | |
| | | 202 | |
| | | 204 | |
| | | 205 | |
| | | 206 | |
| | | 209 | |
| | | 217 | |
| | | 218 | |
| | | 219 | |
| | | 220 | |
| | | | |
| EX-1.1 |
| EX- 4.3 |
| EX- 4.7 |
| EX-12.1 |
| EX-12.2 |
| EX-13.1 |
| EX-15.1 |
Business review
This discusses our financial and non-financial activities, resources, development and performance during 2010 and outlines the factors, including the trends and the principal risks and uncertainties, which are likely to affect future development.
Governance and remuneration
This discusses our management structures and governance procedures. It also sets out the remuneration policies operated for our Directors and Corporate Executive Team members.
Financial statements
The financial statements provide a summary of the Group’s financial performance throughout 2010 and its position as at 31st December 2010. The consolidated financial statements are prepared in accordance with IFRS as adopted by the European Union and also IFRS as issued by the International Accounting Standards Board.
Shareholder information
This includes the full product development pipeline and discusses shareholder return in the form of dividends and share price movements.
Underlying sales growth excludes pandemic products,AvandiaandValtrex.See page 21.
CER% represents growth at constant exchange rates. Sterling % or £% represents growth at actual exchange rates. See page 21.
The calculation of results before major restructuring is described in Note 1 to the financial statements, ‘Presentation of the financial statements’.
GSK Annual Report 2010
01
We exist to improve the
quality of human life by
enabling people todo more,
feel better and live longer.
| | We work by respecting people, maintaining our focus on the patient and consumer whilst operating with both integrity and transparency. |
| | We are looking to deliver shareholder value through growth of a diversified and global business, by delivering more products of value, simplifying our operating model and by running our business responsibly. |
| | What follows is our report to shareholders for 2010. |
Notice regarding limitations on Director Liability under English Law
Under the UK Companies Act 2006, a safe harbour limits the liability of Directors in respect of statements in and omissions from the Report of the Directors contained on pages 8 to 101. Under English law the Directors would be liable to the company, but not to any third party, if the Report of the Directors contains errors as a result of recklessness or knowing misstatement or dishonest concealment of a material fact, but would not otherwise be liable.
Report of the Directors
Pages 8 to 101 inclusive comprise the Report of the Directors that has been drawn up and presented in accordance with and in reliance upon English company law and the liabilities of the Directors in connection with that report shall be subject to the limitations and restrictions provided by such law.
Website
Notwithstanding the references we make in this Annual Report to GlaxoSmithKline’s website, none of the information made available on the website constitutes part of this Annual Report or shall be deemed to be incorporated by reference herein.
Cautionary statement regarding forward-looking statements
The Group’s reports filed with or furnished to the US Securities and Exchange Commission (SEC), including this document and written information released, or oral statements made, to the public in the future by or on behalf of the Group, may contain forward-looking statements. Forward-looking statements give the Group’s current expectations or forecasts of future events. An investor can identify these statements by the fact that they do not relate strictly to historical or current facts. They use words such as ‘anticipate’, ‘estimate’, ‘expect’, ‘intend’, ‘will’, ‘project’, ‘plan’, ‘believe’ and other words and terms of similar meaning in connection with any discussion of future operating or financial performance. In particular, these include statements relating to future actions, prospective products or product approvals, future performance or results of current and anticipated products, sales efforts, expenses, the outcome of contingencies such as legal proceedings, and financial results. The Group undertakes no obligation to update any forward-looking statements, whether as a result of new information, future events or otherwise.
Forward-looking statements involve inherent risks and uncertainties. The Group cautions investors that a number of important factors, including those in this document, could cause actual results to differ materially from those contained in any forward-looking statement. Such factors include, but are not limited to, those discussed under ‘Risk factors’ on pages 4353 to 4757 of this Annual Report.
GSK Annual Report 2010
0102
ContentsGSK at a glance
Business review
This discusses our financial
and non-financial activities, resources,
development and performance
during 2009 and outlines the
factors, including the trends and
the principal risks and uncertainties,
whichWe are likely to affect future
development.
Governance and remuneration
This discusses our management
structures and governance
procedures. It also sets out the
remuneration policies operated
for our Directors and Corporate
Executive Team members.
Financial statements
The financial statements provide a
summaryone of the Group’s financialworld’s leading
performance throughout 2009research-based pharmaceutical and
its position as at 31st Decemberhealthcare companies. We are
2009. The consolidated financial
statements are prepared in
accordance withcommitted to improving the IFRS as adoptedquality
of human life by the European Unionenabling people
to do more, feel better and also
IFRS as issued by the International
Accounting Standards Board.live longer.
Shareholder informationHow we do it
This includesGSK has focused its business on the full product
development pipelinedelivery of three strategic priorities, which aim to increase growth, reduce risk and discusses
shareholder returnimprove GSK’s long-term financial performance:
| • | | Grow a diversified global business |
|
| • | | Deliver more products of value |
|
| • | | Simplify GSK’s operating model |
Where we do it
GSK is a global organisation with offices in over 100 countries and major research centres in the form of
dividendsUK, USA, Belgium and share price movements.
Notice regarding limitationsChina. Our shares are listed on Director Liability under English Law
Under the UK Companies Act 2006, a safe harbour limits the liability of DirectorsLondon and New York Stock Exchanges and our corporate head office is in respect of statements in and omissions from the Report of the Directors contained on pages 8 to 90. Under English law the Directors would be liable to the company, but not to any third party, if the Report of the Directors contains errors as a result of recklessness or knowing misstatement or dishonest concealment of a material fact, but would not otherwise be liable.
Report of the Directors
Pages 6 to 90 inclusive comprise the Report of the Directors that has been drawn up and presented in accordance with and in reliance upon English company law and the liabilities of the Directors in connection with that report shall be subject to the limitations and restrictions provided by such law.
Business review
2009 Performance overview
Financial trends
Products, intellectual property and competition
Global manufacturing and supply
Research and development
Our employees
Our responsibility
Regulation
World market, economy and outlook
Financial review 2009
Financial position and resources
Risk factors
Financial review 2008Brentford, UK.
Governance and remuneration
Our Board
Our Corporate Executive team
Governance and policy
Dialogue with shareholders
Internal control framework
Committee reports
Remuneration policy
Director terms and conditions
Director and Senior Management remuneration
Directors’ interests
Directors’ interests in contracts
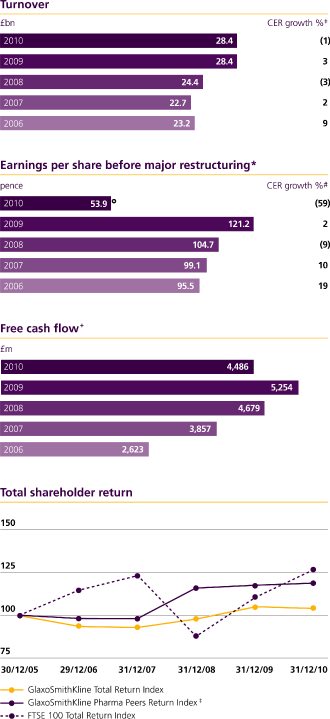
2010 numbers
| | |
| £28.4bn | | 32.1p |
| Turnover | | Earnings per share |
| | |
| 53.9p | | 65p |
Earnings per share before
major restructuring | | Dividend per share |
Financial statementsGroup sales
Directors’ statement of responsibilities
Report of Independent Registered Public Accounting Firm
Financial statements
Notes to the financial statements
Shareholder informationQuarterly trendFive year recordProduct development pipelineShare price and dividendsNature of trading marketAnnual General MeetingInvestor relations and RegistrarTaxation information for shareholdersGlossary of terms
| | | | | | | |
| Research & development | | Consumer Healthcare |
| | | |
| c.30 | | £3.96bn | | 20% | | No.1 |
| A peer-leading pipeline | | In 2010, we spent £3.96bn | | Growth ofHorlicks | | Sensodynehas been the |
| with around 30 late-stage | | in R&D before major | | in India in 2010. | | world’s fastest growing |
| assets. | | restructuring, or 14% | | | | toothpaste brand over |
| | | of our total sales. | | | | the last 5 years. |
| | | We are one of the world’s | | | | |
| | | biggest investors in R&D and are | | | | |
| | | the biggest private sector funder | | | | |
| | | of R&D in the UK. | | | | |
| | | | | | | |
| | | | | | | |
| | | | | | | |
| | | | | | | |
| | | | | | | |
| 10 | | 14% | | c.1bn | | 2 |
| 10 new compounds and | | We are committed to | | Units ofLucozade, Ribena | | New Consumer Healthcare |
| vaccines starting phase III | | improving returns in R&D, | | andHorlicksmanufactured | | Research and Innovation |
| clinical trials since the start | | aiming to increase our | | in the UK every year. | | centres opened in China |
| of 2010. | | estimated return | | | | and India. |
| | | on investment in | | | | |
| | | this area to 14%. | | | | |
| | | | | | | |
| | | | | | | |
| Vaccines | | Emerging markets |
| | | |
| 1.4bn | | | | 24% | | |
| Doses of our vaccines | | | | Of total GSK turnover from | | |
| supplied to 179 countries | | | | emerging markets, by the broader | | |
| around the world in 2010. | | | | definition (Pharmaceutical and | | |
| | | | | Consumer Healthcare turnover | | |
| | | | | in all markets excluding USA, | | |
| | | | | Western Europe, Canada, Japan, | | |
| | | | | Australia and New Zealand). | | |
GSK Annual Report 20092010
03
| | | | | |
| 96,500 | | 5% | | 3 |
| Employees. | | Share of world | | Leading presence in |
| | | pharmaceutical market. | | Consumer Healthcare |
| | | (Source: IMS Health) | | global categories: OTC, |
| | | | | Oral Care, Nutritionals. |
02
Chairman & CEO summaryGSK’s business model
Our strategy is deliveringA balanced, synergistic business, with multiple growth drivers supporting a core pharmaceutical R&D operation.
Responsible business
Malaria vaccine
Potentially the first malaria vaccine with phase III trials ongoing in 7 African countries.
300 million
Commitment to supply 300m doses ofSynflorixat a reduced price to developing countries over the next decade through the AMC financing mechanism.
5-year commitment
To treat school age children in Africa at risk of intestinal worms.
Leader
GSK ranked first in both Access to Medicine Indexes in 2008 and we believe that GSK is now moving2010.
2050
Target date for value chain, from raw materials to a position where it can deliver long-term financial performance on a sustainable basis for shareholders.product disposal, to be carbon neutral.
0304
Chairman & CEO summary
Dear Shareholder
Since ourOver the last Annual Report, GSK has made significant progress to transform its business model.
Our strategy is deliveringtwo and we believe that GSK is now moving to a position where it can deliver long-term financial performance on a sustainable basis for shareholders.
Return to sales growth
In 2009, we saw GSK return to sales growth. Our strategic priority, to diversify and drive growth in key investment areas such as Emerging Markets, Consumer Healthcare and Vaccines, has supported this growth.
In doing so we have developed many more engines of growth for the company. This increased diversification is helping to reduce risk through lower sales volatility – evident in that GSK absorbed the impact of losing more than £1 billion of sales to genericisation in the US market in 2009.
Of course, sales of our influenza products to governments responding to the H1N1 pandemic also contributed to sales.
For manyhalf years we have invested in developingbeen implementing a strategy to transform our influenza capabilities. Five months afterbusiness model to address the WHO declared H1N1 a global flu pandemic, GSK was able to supply an approved vaccinesignificant challenges our industry faces as payers search for governments across the world. We are continuing to work closely with them to respond to their needs.
New product momentum sustained
We remain focused on broadeningever more cost-effective healthcare, and strengthening our product portfolio. Last year, GSK received 12 product approvals and completed 11 new filings.
In the last 3 years, GSK has obtained more FDA approvalsdemand escalates for new medicines and vaccines than any other company.better medicines. This is being done with the direct aim of enhancing returns to our shareholders and improving the lives of patients and consumers.
Over the next 18 monthsTo achieve this we have substantially re-engineered GSK’s business through major restructuring and a more rigorous approach to capital allocation. The effects of these changes in 2010 were masked to some degree by specific events. Reported sales, for example, were impacted by generic competition toValtrex,and reduced sales fromAvandiaand pandemic related products. Meanwhile earnings were impacted by the significant charge we took to help resolve long-standing legal matters. This belies the good progress we have made to execute our strategy and which is evident in diversified underlying sales growth and the increasing potential to launchof our pipeline. We believe GSK is becoming a number of brand new medicinesmore balanced, synergistic business with a lower risk profile and vaccines, includingBenlysta,which would be the first new treatmentoption for systemic lupus in over 50 years.
This momentum is set against a continued goal of maintaining around 30 assets in our late stagesignificant potential upside from the pipeline.
Improving return on investment
We remain mindful of the need to improve and demonstrate better returns on investment. Across the entire business, we continue to implement our restructuring programme to simplify operations and reduce costs. In 2009 this programme delivered £1 billion of annual savings.
In particular, in Research and Development we are strongly focused on allocating capital to areas where we can get the best return on investment.
We continueGSK is also a business built on strong values and a deep commitment to look at howoperating with integrity. In 2010 we can make better decisions around pipeline progression and maintain our strategy to increase the level of externally sourced compounds in our pipeline, through more option-based agreements.
In addition, we are reducing R&D investment and associated infrastructure in therapy areas where we believe the prospects for successful registration and launch of differentiated medicines are low.
Based on the investment made in our late stage pipeline and our long-term sales expectation, we estimate our projected rate of R&D return to be around 11%. We believe this is an improvement on the industry average over the last ten years. Our long-term goal is to gohave taken further and realise an aspirational rate of return for GSK’s R&D of around 14%.
More responsive, more flexible, more open
Equally important are GSK’s financial and social responsibilities to ensure the long-term success and sustainability of our business.
We are determinedsteps to make our company more responsive, more flexible and more open to society’s expectations.
Increasing returns to shareholders
In 2010 we were able to fund returns to shareholders, bolt-on acquisitions and the significant increase in legal settlements whilst reducing net debt by £0.6 billion.
Adjusted 2010 net cash inflow before legal matters was £8.8 billion, up 9%. Cash outflow for legal settlements was £2 billion.
GSK remains financially very strong. We continueincreased our dividend by 7% to 65p in 2010 and our priority is to deliver further growth in the dividend. Since 2005, dividends have increased each year with average growth of 8% over the five-year period. We have also started a new long-term share buy-back programme to enhance returns to shareholders, with buy-backs of £1-2 billion expected in 2011.

05
Chairman & CEO summary
Continuing focus on return on investment
Our drive for change, and to improve returns on investment through restructuring and effective capital allocation, continued to make progress during the year.
Reinvestment of costs saved through our restructuring programme has enabled us to diversify and strengthen GSK’s sales base. To date, £1.7 billion of cost has been extracted from the business and we are on track to deliver £2.2 billion of annual savings by 2012.
We have taken cost out from lower returning activities and reinvested it in manykey growth areas such as improving accessEmerging Markets, Vaccines and Consumer Healthcare. 2010 reported sales for these businesses were up 22%, 15% and 5% respectively.
This is helping to medicines, enhancing researchreduce GSK’s dependency on sales of products generated in ‘white pills/western markets’.† Sales from these markets and products have decreased from 40% in 2007, to 25% in 2010. Over time, this should help to reduce the adverse impact of patent expirations on the Group.
Delivering diversified underlying sales growth
In 2010, reported sales fell 1%, impacted by the continued effect of generic competition toValtrex,the rapid loss of sales ofAvandiafollowing regulatory decisions in the Autumn and a difficult comparison with the prior year which included significant sales of pandemic products.
However, underlying sales growth (sales excluding these 3 factors) was up 4.5%. This growth was achieved despite the ongoing impacts of US healthcare reform and EU government austerity measures and is testament to the strength of the rest of our portfolio.
In 2011, we expect underlying sales momentum to continue and translate into sustainable reported growth in 2012.
Increasing pipeline potential
Reforming R&D to improve returns on investment has been a key element of the strategy we are implementing. We saw further evidence that this strategy is making progress during 2010.
GSK now has a peer-leading portfolio of around 30 opportunities in phase III and registration. This portfolio is diverse with 5 biopharmaceuticals and 5 vaccines in addition to NCEs. It is also highly innovative with more than 20 assets not currently available for neglected tropicalany indication. One such asset –Benlysta –is potentially the first new treatment for lupus in 50 years and is currently being considered for approval by regulators in the USA and Europe.
Importantly, we are delivering sustained progress, with 10 NCEs and new vaccines entering phase III since the start of 2010. By the end of 2012, we expect phase III data on around 15 assets, including potential new treatments for type 1 and 2 diabetes, several rare diseases raisingand multiple cancer types.
We have made fundamental changes to how we allocate our R&D expenditure, directing it to our late stage pipeline; reducing cost and risk through externalising parts of early-stage discovery; dismantling infrastructure; and terminating development in areas with low financial and scientific return. Our target remains to deliver a rate of return for GSK’s R&D of around 14%. We are the ethical standards for conducting our research and our commercial activities, and being more transparent about the way weonly pharmaceutical company to have explicitly set such a challenging target.
Operating a values-based business with integrity
Continuing to run our business.
Progressive dividend
As one ofbusiness in a responsible way is also central to the FTSE 100’s top dividend payers,changes we strongly believe in the importance of returning funds to our shareholders. In line with GSK’s progressive dividend policy, the Board has approved a total dividend for the year of 61 pence, a 7% increase on last year’s dividend.
Improving long-term prospectshave made at GSK.
In conclusion,2010, we are making progress against our strategic priorities. We have seen goodcontinued progress in our sales performance;significant commitment to work on neglected tropical diseases. Our candidate malaria vaccine is progressing through phase III trials in Africa. If all goes well, this will be the first ever vaccine against malaria, with the potential to save the lives of millions of children and infants in Africa. We also announced that we will donate enough of our albendazole medicine to protect all school-aged children in Africa against intestinal worms. Intestinal worms cause more ill health in school-aged children than any other infection, so this will have a major positive health impact.
Improving the environmental sustainability of our business is also a priority and we have launched a new set of ambitious targets. Our goal is to reduce the environmental impact of our whole value chain, from raw materials to product disposal, and to be carbon neutral by 2050.
We are maintainingcontinuing to work towards resolving a strong focus on cost reduction; we are delivering more new medicines, vaccines and consumer healthcare products; andnumber of long-standing legal matters. There is no doubt that the scale of legal provisioning that has been required is significant. However, we continue to takebelieve that it is in the Group’s best interests to resolve this inherent unpredictability and reduce GSK’s overall litigation exposure. These legal cases underline just how important it is for us to be led by our values in everything we do.
Changes to the Board
In September we announced that Julian Heslop will retire as CFO at the end of March and be replaced by Simon Dingemans, who joined the company as CFO-designate in January 2011.
We would like to thank Julian for his dedicated service to GSK as CFO and a member of the Board over the last six years – his integrity, diligence and outstanding technical ability have ensured that GSK has remained financially strong during a period of significant economic turmoil. Simon’s appointment as CFO will bring valuable new initiativesexperience and capability to build society’s trust. Insupport us in implementing our strategy.
Conclusion
There is no doubt that our operating environment remains challenging and that the pharmaceutical industry is undergoing a period of intense change. However we believe that GSK is well placed to succeed in this environment.
Our journey to create a more balanced, synergistic business with increasing pipeline potential is progressing well and in accomplishing this we would like to recognise the enormoussignificant contribution of our employees and our wide network ofmany partners.
There is no doubt We remain confident that we are operating in a challenging environment. However, with further successful execution of our strategy, we believe GSK’s long-term prospects are improvingcan generate increased value for shareholders as well as deliver better outcomes to patients and that we will enhance our position as a leading-edge healthcare company.consumers.
| | | |
| |   |
| | |
Sir Christopher Gent | | Andrew Witty |
| Chairman | | Chief Executive Officer |
GSK Annual Report 2009
2010
06
Discover the world of GSK
GSK Annual Report 2010
0407
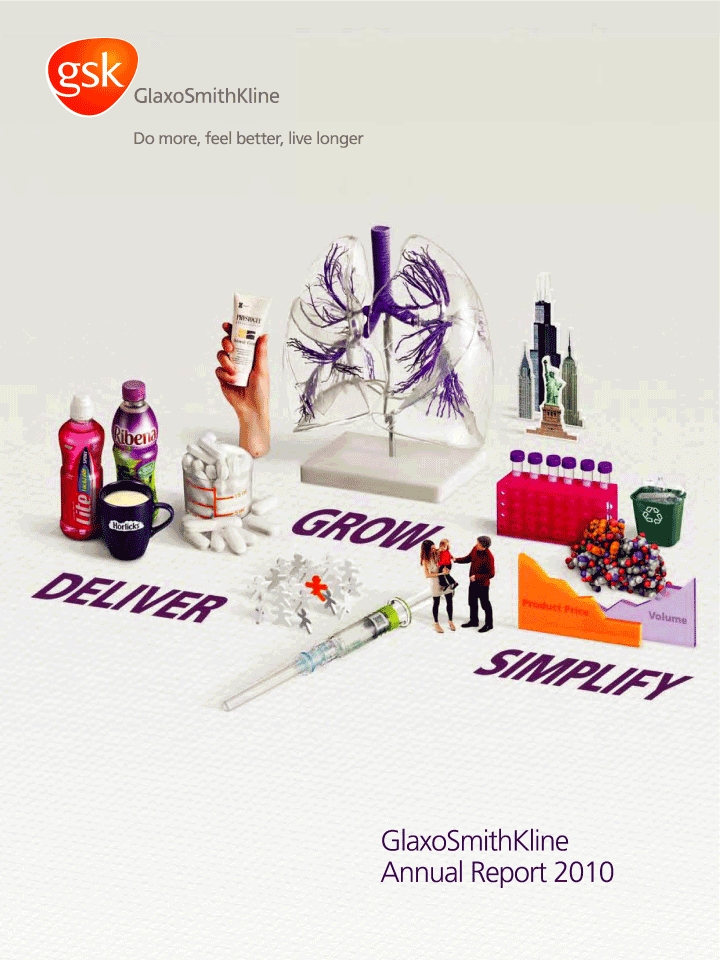
Our strategy
We areSince 2008, we have focused on deliveringour business around the delivery of three strategic priorities, which aim to transform GSK into a company that delivers moreincrease growth, has lessreduce risk and an improvedimprove our long-term financial performance.
To be a successful and sustainable business we must also fulfil our social responsibilities. We are doing this by making our company more responsive, more flexible and more open.performance:
Strategic priorities
Grow a diversified global business –
We are diversifying our business to create a more balanced product portfolio and move away from a reliance on traditional ‘white pill/ pills/western markets’*. Sales generated from these markets and products have decreased from 40% in 2007, to 25% in 2010. Over time this should help to reduce the adverse impact of patent expirations on the Group.
We are investingexpect to generate future sales growth by strengthening our core pharmaceuticals business and supplementing it with increased investment in key growth areas such as Emerging Markets, vaccines, Japan, Vaccinesdermatology and ourConsumer Healthcare. Sales in Emerging Markets were up 22%, vaccines up 15%, Japan up 14%, dermatology up 6% (on a pro-forma basis excluding 2010 acquisitions) and Consumer Healthcare business.
up 5% for 2010.Deliver more products of value –We
With the aim to sustainof sustaining an industry-leading pipeline of products ensuring that they demonstratedeliver value for healthcare providers. Our R&D strategy is built aroundproviders, we have been focusing on improving rates of return and delivering the best science diversifying throughin our R&D organisation. This has required a multi-faceted approach. For example we have increased the level of externalisation of our research, taken difficult decisions around pipeline progressions and improvingfocused on disease areas where we believe the returns on investment.
prospects for successful registration and launch of differentiated medicines are greater.We have one of the largest and most diverse development pipelines in the industry with approximately 30 late-stage assets. The vast majority of these programmes address unmet medical need and importantly nearly two-thirds are new chemical entities or new vaccines.
SimplifySimplifying the operating model –GSK
As our business continues to change shape, it is a large and complex organisation. We are transforming our operationalessential that we transform the operating model to reduce complexities, improve efficiencyefficiencies and reduce costs.cost. Through our global restructuring programme, we have removed £1.7 billion of cost since 2008 and are on track to deliver our target of £2.2 billion of annual savings by 2012. These savings have been extracted from our developed country sales and marketing, support functions, R&D and manufacturing infrastructure and reinvested in higher returning activities such as Emerging Markets, vaccines and Consumer Healthcare.
Outlook
Whilst our operating environment remains challenging, we have made significant progress through restructuring and a rigorous returns-based approach to capital allocation. We expect underlying sales momentum (sales excludingValtrex, Avandiaand pandemic related products) to continue in 2011 and to translate into reported growth in 2012 at constant exchange rates, despite further anticipated pricing reductions in the USA and Europe.
The US patent for compositions containing the combination of active substances inSeretide/ Advair expired during 2010, but various patents over the Diskus delivery device exist in the USA for a number of years up to 2016. The outlook for the timing and impact of entry of ‘follow-on’ competition is uncertain. GSK has not been notified of any acceptance by the US FDA of an application for a ‘follow-on’ product that refers toSeretide/Advairand contains the same active ingredients (as would be expected to precede the introduction of such a product), and is not able to predict when this may occur or when any such ‘follow-on’ product may enter the US market. Other products may experience generic competition in advance of the stated patent expiry as a result of settlement of patent proceedings. See Note 44, ‘Legal proceedings’, pages 178 to 185.
GSK has a peer-leading development pipeline, with over 20 assets not currently on the market for any indication. By the end of 2012, we expect Phase III data on around 15 additional assets.
With improvements in our net debt position, we are increasing returns to shareholders. We increased GSK’s dividend in 2010 and our priority is to deliver further growth in the dividend. We also have commenced a new long-term share buy-back programme.
We remain confident that we can generate increased value for shareholders as well as deliver better outcomes to patients and consumers.
Our plans
| • | | Drive growth in the pharmaceutical business in our core markets |
|
| • | | Fulfil the potential of Emerging Markets |
|
| • | | Expand our business in Japan |
|
| • | | Build our leadership in dermatology |
|
| • | | Grow the Vaccines and Consumer Healthcare businesses |
Our plans
| • | | Focus on the best science |
|
| • | | Diversify through externalisation |
|
| • | | Re-personalise R&D |
|
| • | | Focus on return on investment |
Our plans
| • | | Evolve our commercial model |
|
| • | | Re-shape manufacturing |
|
| • | | Streamline our processes |
|
| • | | Reduce working capital |
GSK Annual Report 20092010
08
2010 performance overview

| | | | |
Our strategies | | Our measures | | Our progress in 2010 |
| | | | |
| We have focused the business around the delivery of three strategic priorities. | | We use a number of measures to track our progress against the strategic priorities over the medium to long term. These include the following:
| | We made good progress during the year, with a number of notable successes: |
| | | | |
|
Grow a diversified global business
Broadening and balancing our portfolio and moving away from a reliance on ‘white pills/western markets’.† | | • Performance of core Pharmaceuticals and vaccines businesses | | • Excluding pandemic products,AvandiaandValtrex,underlying pharmaceutical (including vaccines) sales* were £21.1 billion and grew 4% in the year.
|
| | | |
|
• Diversification of sales | |
• Sales from ‘white pills/western markets’† fell from 40% of turnover in 2007 to 25% in 2010
|
| | | |
|
• Contribution of Emerging Markets to our overall sales and growth | |
• Sales in our Emerging Markets pharmaceutical business grew by 22% to more than £3.6 billion and now represent 15% of pharmaceutical turnover.
|
| | | |
|
• Growth of Consumer Healthcare business | |
• Sales in our Consumer Healthcare business grew by 5% to £5.0 billion and now represent 17.6% of Group turnover.
|
| | | |
|
• Build our leadership position in dermatology | |
• Dermatology sales grew on a pro-forma basis (excluding 2010 acquisitions) by approximately 6% to nearly £1.1 billion, representing nearly 4% of Group turnover.
|
| | | |
|
• Expansion of Japanese business | |
• Sales in GSK Japan grew 14% to nearly £2.0 billion. |
| | |
• We received approvals for four new compounds.
|
| | | |
|
• Build biopharmaceutical portfolio | |
•Arzerrarecorded sales of £26 million on its first full year on the US market and was launched in Europe.Benlystafiled for approval in both the USA and Europe.
|
| | | | |
Deliver more
products of value
Transforming R&D to ensure we not only deliver the current pipeline but are also able to sustain the flow of products for years to come. | |
• Contribution to sales of new products | |
• New products launched since 2007 (excluding flu pandemic vaccines) grew 36% and contributed 7% of pharmaceutical sales in 2010.
|
| | | |
|
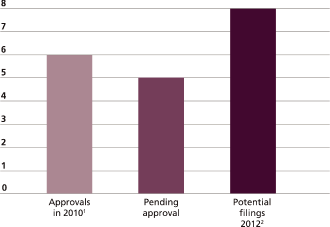
• Number of reimbursable product approvals and filings | |
• We received six product approvals in the USA and EU since the start of 2010
|
| | | • Seven assets are currently filed with regulators.
|
| | | |
|
• Sustaining late-stage pipeline | |
• We maintained around 30 assets in phase III and registration, with ten new chemical entities and new vaccines entering phase III since the start of 2010.
|
| | | |
|
• Enhanced R&D productivity and increased externalisation for Drug Discovery | |
• Our objective is to increase our estimated rate of return for R&D from around 11% to 14%.
|
| | | • During 2010 we signed eight new collaborations to increase the external nature of our discovery, giving 54 external discovery engines to complement our 38 Discovery Performance Units.
|
| | | | |
Simplifying the operating model
Simplifying our operating model to ensure that it is fit for purpose and able to support our business in the most cost efficient way. | |
• Delivery of major restructuring programme | |
• We have achieved annual cost savings of £1.7 billion and remain on track to reach £2.2 billion of annualised savings by 2012.
|
| | | |
|
• Reduce working capital. | |
• Working capital reduced by £1.3 billion in 2010 (including £600 million of cash from lower pandemic receivables). |
| | |
| * | | The calculation of underlying sales growth is described on page 21. |
0609
20092010 performance overview
Key performance indicators
| | |
| ‡ | | This index includes Abbott Labs, Amgen, AstraZeneca, Bristol Myers Squibb, Eli Lilly, Johnson & Johnson, Merck, Novartis, Pfizer, Roche Holdings and Sanofi-Aventis. |
|
| o | | Reflects £4bn legal charge. |
|
| # | | The calculation of CER growth is described on page 21. |
|
| * | | The calculation of results before major restructuring is described in Note 1 to the financial statements, ‘Presentation of the financial statements’. |
| |
| + | | The calculation of free cash flow is described on page 39. |
|
‡ | | The calculation of CER growth is described on page 10.44. |
Our strategies
We have focused the business around the delivery of three strategic priorities.
Grow a diversified global business
Broadening In 2010, reported sales were down 1% but underlying sales growth (sales excluding pandemic products,Avandiaand balancing our portfolio, diversifying into new product areas and capturing opportunities that exist beyond our established geographic footprint.Valtrex)was 4.5%.
Deliver more productsEarnings per share in 2010 was adversely impacted by legal costs of value
Transforming R&D to ensure we not only deliver the current pipeline but are also able to sustain the flow of products for years to come.£4,001 million (2009 – £591 million). Excluding legal costs, EPS before major restructuring was 120.7 pence, 11% down on 2009.
SimplifyingThe reduced level of free cash flow in 2010 reflected the operating model
Simplifying our operating model to ensure that it is fit for purpose and able to support our businesshigher legal settlements in the most cost efficient way.
GSK Annual Report 2009
07
2009 performance overview
| | | | | | |
Our measures | | Our progress in 2009 |
| | |
We use a number of measures to track our progress against the strategic priorities over the medium to long term. These include the following: | | We made good progress during the year, with a number of notable successes |
| | |
| | |
•
| | Performance of core pharmaceuticals and vaccines businesses | | • | | The core pharmaceuticals and vaccines businesses delivered sales of £19.1 billion and grew 5% in the year. This excludes genericised products,Avandia and influenza products. Including pandemic products, sales were £20.9 billion, up 12% for 2009. |
| | |
| | |
•
| | Diversification of sales | | • | | Sales from white pill/western markets fell from 36% of turnover in 2008 to 30% in 2009. |
| | |
| | |
•
| | Contribution of Emerging Markets to our overall sales and growth | | • | | Sales in the Emerging Markets pharmaceutical business grew 20% to nearly £3 billion, now representing 10% of Group turnover. |
| | | | • | | We completed 10 bolt-on acquisitions in 2009. |
| | |
| | |
•
| | Growth of Consumer Healthcare market share | | • | | Consumer Healthcare market share gains were delivered in the OTC and Oral healthcare businesses, but share declined in Nutritional healthcare. |
| | | | • | | Consumer Healthcare sales grew 7% to £4.7 billion, with growth in all categories: OTC up 8%; Oral healthcare up 7%; Nutritional healthcare up 3%year. Free cash flow before legal settlements was £6,533 million (2009 – £5,508 million). |
| | |
| | |
•
| | Expansion of Japanese business | | • | | Sales reached £1.6 billion in 2009, up 22%, driven byAdoair andRelenza. |
| | | | • | | Products launched in the last three years contributed around £260 million sales in 2009. |
| | |
| | |
•
| | Build biopharmaceutical portfolio | | • | | Arzerra was launched in the USA, a positive opinion was received forProlia and positive phase III data was announced forBenlysta in 2009. |
| | | | • | | Around 17% of our pipeline now comprises biopharmaceutical assets. |
| | |
| | |
•
| | Contribution to sales of new products | | • | | New pharmaceutical products launched since 2007 contributed sales of £1.3 billion, or £2.1 billion including H1N1 pandemic vaccine. |
| | |
| | |
•
| | Number of reimbursable product approvals and filings | | • | | We received 12 product approvals and completed 11 new filings in 2009. In the last three years we have obtained more FDA approvals for new molecular entities and vaccines than any other company. |
| | |
| | |
•
| | Sustaining late-stage pipeline | | • | | We maintained around 30 assets in phase III and registration, with five new programmes entering phase III during 2009. |
| | |
| | |
•
| | Enhanced R&D productivity and increased externalisation for Drug Discovery | | • | | Our projected rate of return based on investment made in our late stage pipeline and expected future long-term sales performance is around 11%. Our long-term goal is to improve our rate of return for R&D to around 14%. |
| | | | • | | We have ‘externalised’ approximately 30% of our discovery research with 47 external partners. |
| | |
| | |
•
| | Delivery of major restructuring programme | | • | | Annual cost savings of £1 billion have already been achieved. The programme has been expanded again to deliver annual savings of £2.2 billion by 2012. |
GSK Annual Report 2009
08
Report of the Directors
| | | | |
| | | | |
| | | 6 | |
| | | 9 | |
| | | 11 | |
| | | 14 | |
| | | 15 | |
| | | 20 | |
| | | 21 | |
| | | 26 | |
| | | 27 | |
| | | 28 | |
| | | 36 | |
| | | 43 | |
| | | 48 | |
| | | | |
| | | 54 | |
| | | 56 | |
| | | 58 | |
| | | 62 | |
| | | 63 | |
| | | 64 | |
| | | 65 | |
| | | 65 | |
| | | 67 | |
| | | 71 | |
| | | 71 | |
| | | | |
| | | 73 | |
| | | 74 | |
| | | 81 | |
| | | 81 | |
| | | 82 | |
| | | 83 | |
| | | 84 | |
| | | 85 | |
| | | 86 | |
| | | 89 | |
| | | 90 | |
| | | 90 | |
| | | | |
This report is prepared in accordance with International Financial Reporting Standards (IFRS), as adopted by the European Union and also with IFRS as issued by the International Accounting Standards Board. | | | | |
EX-1.1 |
EX-4.5 |
EX-12.1 |
EX-12.2 |
EX-13.1 |
EX-15.1 |
The Report of the Directors provides users of the financial statements with a more complete picture of GSK. It supplements the information in the financial statements with a discussion of other aspects of our activities, our future and the environment in which we operate.
Business review
This discusses our financial and non-financial activities, resources, development and performance during 2009 and outlines the factors, including the trends and the principal risks and uncertainties, which are likely to affect future development.
Corporate governance
This discusses our management structures and governance procedures. It includes disclosures on compliance with the Combined Code on Corporate Governance of the Financial Reporting Council (Combined Code) and with US laws and regulation.
Remuneration Report
This sets out the remuneration policies operated for our Directors and the Corporate Executive Team (CET) members. There are disclosures on Directors’ remuneration including those required by The Large and Medium-sized Companies and Groups (Accounts and Reports) Regulations 2008.
GSK Annual Report 20092010
09
Financial trends
| | | | | | | | | | | | | | | | | | | | | | | | | | | | | |
| | | 2009 | | | Growth* | | | 2008 | | | Growth* | | | 2007 | |
Total results | | £m | | | CER% | | | £% | | | £m | | | CER% | | | £% | | | £m | |
| | | | | | | | | | | | | | | | | | | | |
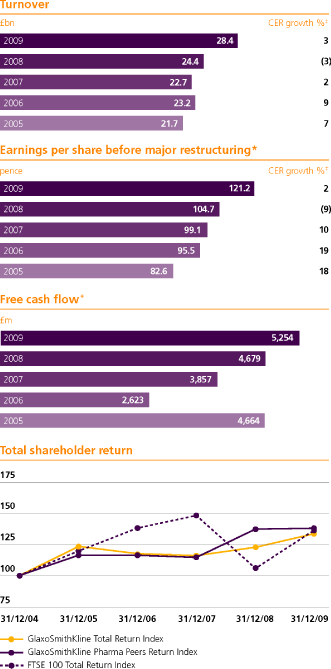
| Turnover | | | 28,368 | | | | 3 | | | | 16 | | | | 24,352 | | | | (3 | ) | | | 7 | | | | 22,716 | |
| | | | | | | | | | | | | | | | | | | | |
| Cost of sales | | | (7,380 | ) | | | 6 | | | | 15 | | | | (6,415 | ) | | | 13 | | | | 21 | | | | (5,317 | ) |
| Selling, general and administration | | | (9,592 | ) | | | 6 | | | | 25 | | | | (7,656 | ) | | | 2 | | | | 10 | | | | (6,954 | ) |
| Research and development | | | (4,106 | ) | | | 1 | | | | 12 | | | | (3,681 | ) | | | 4 | | | | 11 | | | | (3,327 | ) |
| Other operating income | | | 1,135 | | | | | | | | | | | | 541 | | | | | | | | | | | | 475 | |
| | | | | | | | | | | | | | | | | | | | |
| Operating profit | | | 8,425 | | | | 4 | | | | 18 | | | | 7,141 | | | | (20 | ) | | | (6 | ) | | | 7,593 | |
| | | | | | | | | | | | | | | | | | | | |
| Profit before taxation | | | 7,891 | | | | 4 | | | | 19 | | | | 6,659 | | | | (24 | ) | | | (11 | ) | | | 7,452 | |
| Profit after taxation for the year | | | 5,669 | | | | 6 | | | | 20 | | | | 4,712 | | | | (25 | ) | | | (11 | ) | | | 5,310 | |
| | | | | | | | | | | | | | | | | | | | |
| Profit attributable to minority interests | | | 138 | | | | | | | | | | | | 110 | | | | | | | | | | | | 96 | |
| Profit attributable to shareholders | | | 5,531 | | | | | | | | | | | | 4,602 | | | | | | | | | | | | 5,214 | |
| | | | | | | | | | | | | | | | | | | | |
| Basic earnings per share (pence) | | | 109.1p | | | | 8 | | | | 23 | | | | 88.6p | | | | (21 | ) | | | (6 | ) | | | 94.4p | |
| Diluted earnings per share (pence) | | | 108.2p | | | | | | | | | | | | 88.1p | | | | | | | | | | | | 93.7p | |
| | | | | | | | | | | | | | | | | | | |
| | | | | | | | | | | | | | | | | | | | | | | | | | | | | |
Results before major restructuring | | | | | | | | | | | | | | | | | | | | | | | | | | | | |
| | | | | | | | | | | | | | | | | | | | | | | | | | | | | |
| | | | | | | | | | | | | | | | | | | | |
| Turnover | | | 28,368 | | | | 3 | | | | 16 | | | | 24,352 | | | | (3 | ) | | | 7 | | | | 22,716 | |
| | | | | | | | | | | | | | | | | | | | |
| Cost of sales | | | (7,095 | ) | | | 13 | | | | 23 | | | | (5,776 | ) | | | 4 | | | | 11 | | | | (5,206 | ) |
| Selling, general and administration | | | (9,200 | ) | | | 6 | | | | 25 | | | | (7,352 | ) | | | – | | | | 8 | | | | (6,817 | ) |
| Research and development | | | (3,951 | ) | | | 2 | | | | 13 | | | | (3,506 | ) | | | 2 | | | | 8 | | | | (3,237 | ) |
| Other operating income | | | 1,135 | | | | | | | | | | | | 541 | | | | | | | | | | | | 475 | |
| | | | | | | | | | | | | | | | | | | | |
| Operating profit | | | 9,257 | | | | (1 | ) | | | 12 | | | | 8,259 | | | | (10 | ) | | | 4 | | | | 7,931 | |
| | | | | | | | | | | | | | | | | | | | |
| Profit before taxation | | | 8,726 | | | | (1 | ) | | | 12 | | | | 7,782 | | | | (14 | ) | | | – | | | | 7,790 | |
| Profit after taxation for the year | | | 6,283 | | | | – | | | | 13 | | | | 5,551 | | | | (14 | ) | | | – | | | | 5,571 | |
| | | | | | | | | | | | | | | | | | | | |
| Profit attributable to minority interests | | | 138 | | | | | | | | | | | | 110 | | | | | | | | | | | | 96 | |
| Profit attributable to shareholders | | | 6,145 | | | | | | | | | | | | 5,441 | | | | | | | | | | | | 5,475 | |
| | | | | | | | | | | | | | | | | | | | |
| Basic earnings per share (pence) | | | 121.2p | | | | 2 | | | | 16 | | | | 104.7p | | | | (9 | ) | | | 6 | | | | 99.1p | |
| Diluted earnings per share (pence) | | | 120.3p | | | | | | | | | | | | 104.1p | | | | | | | | | | | | 98.3p | |
| | | | | | | | | | | | | | | | | | | | |
Research and development – total | | | | | | | | | | | | | | | | | | | | | | | | | | | | |
| | | | | | | | | | | | | | | | | | | | |
| Pharmaceuticals | | | 3,947 | | | | | | | | | | | | 3,557 | | | | | | | | | | | | 3,215 | |
| Consumer Healthcare | | | 159 | | | | | | | | | | | | 124 | | | | | | | | | | | | 112 | |
| | | | | | | | | | | | | | | | | | | | |
| Total | | | 4,106 | | | | | | | | | | | | 3,681 | | | | | | | | | | | | 3,327 | |
| | | | | | | | | | | | | | | | | | | | |
Net finance cost cover – total | | | | | | | | | | | | | | | | | | | | | | | | | | | | |
| | | | | | | | | | | | | | | | | | | | |
| Net finance costs | | | 713 | | | | | | | | | | | | 530 | | | | | | | | | | | | 191 | |
| Cover | | | 12 times | | | | | | | | | | 14 times | | | | | | | | | | | 40 times | |
| | | | | | | | | | | | | | | | | | | | |
| Net finance cost cover is profit before tax plus net finance costs, divided by net finance costs. | | | | | | | | | | | | | | | | |
| Tax rate – total | | | 28.2% | | | | | | | | | | | | 29.2% | | | | | | | | | | | | 28.7% | |
| Tax rate – before major restructuring | | | 28.0% | | | | | | | | | | | | 28.7% | | | | | | | | | | | | 28.5% | |
| | | | | | | | | | | | | | | | | | | |
Borrowings | | | | | | | | | | | | | | | | | | | | | | | | | | | | |
| | | | | | | | | | | | | | | | | | | |
| Net debt | | | 9,444 | | | | | | | | | | | | 10,173 | | | | | | | | | | | | 6,039 | |
| Gearing | | | 88% | | | | | | | | | | | | 122% | | | | | | | | | | | | 61% | |
| | | | | | | | | | | | | | | | | | | |
The gearing ratio is calculated as net debt as a percentage of total equity.
| | |
* | | CER% represents growth at constant exchange rates. Sterling% or £% represents growth at actual exchange rates. See page 10. |
| | The calculation of results before major restructuring, is described in Note 1 to the financial statements, ‘Presentation of the financial statements’. |
GSK Annual Report 2009
10
History and development of the company
GlaxoSmithKline plc is a public limited company incorporated on
6th December 1999 under English law. Its shares are listed on the London Stock Exchange and the New York Stock Exchange. On 27th December 2000 the company acquired Glaxo Wellcome plc and SmithKline Beecham plc, both English public limited companies, by way of a scheme of arrangement for the merger of the two companies. GSK and its subsidiary and associated undertakings constitute a major global healthcare group engaged in the creation, discovery, development, manufacture and marketing of pharmaceutical and consumer health-related products.
GSK has its corporate head office in London and has its US headquarters in Research Triangle Park, North Carolina, with operations in some 120 countries, and products sold in over
150 countries.
Annual Report and Summary
This report is the Annual Report of GlaxoSmithKline plc for the year ended 31st December 2009, prepared in accordance with United Kingdom requirements. It was approved by the Board of Directors on 24th February 2010 and published on 25th February 2010.
A summary of the year, intended for the shareholder not needing the full detail of the Annual Report, is produced as a separate document and issued to all shareholders. The summary does not constitute a set of summary financial statements as defined by section 428 of the Companies Act 2006. The Annual Report is issued to shareholders who have elected to receive it.
In this Report ‘GlaxoSmithKline’, the ‘Group’ or ‘GSK’ means GlaxoSmithKline plc and its subsidiary undertakings; the ‘company’ means GlaxoSmithKline plc; ‘GlaxoSmithKline share’ means an Ordinary Share of GlaxoSmithKline plc of 25p; American Depositary Shares (ADS) each represent two GlaxoSmithKline shares.
Brand names
Brand names appearing in italics throughout this report are trademarks either owned by and/or licensed to GlaxoSmithKline or associated companies, with the exception ofBaycolandLevitra, trademarks of Bayer,Benlysta, a trademark of Human Genome Science,Boniva/Bonviva, a trademark of Roche,Citrucel, a trademark of Merrell Pharmaceuticals,Volibris, a trademark of Gilead,NicoDerm, a trademark of Elan, Johnson & Johnson, Merrell, Novartis, Sanofi-Aventis or GlaxoSmithKline,Prolia, a trademark of Amgen andVesicare, a trademark of Astellas Pharmaceuticals in many countries and of Yamanouchi Pharmaceuticals in certain countries, all of which are used in certain countries under licence by the Group.
Currencies
The currencies that most influence the Group’s results remain the US dollar, the Euro, the Yen and Sterling. Details of the exchange rates used by the Group are given in Note 5 ‘Exchange Rates’ on
page 106.
During 2009, average Sterling exchange rates were weaker against the US Dollar, the Euro and the Yen compared with 2008. However, and as a result of the significant currency movements seen in Q4 2008, year end Sterling exchange rates were actually stronger against all three currencies compared with those at
31st December 2008.
Results before major restructuring
In October 2007, the Board approved the implementation of a detailed formal plan for, and GSK announced, a significant new Operational Excellence programme to improve the effectiveness and productivity of its operations. A second formal plan, representing a significant expansion of the Operational Excellence programme, was approved by the Board and announced in February 2009. A further expansion was approved by the Board and announced in February 2010. Total costs for the implementation of the expanded programme are expected to increase from £3.6 billion to approximately £4.5 billion, to be incurred over the period from 2007 to 2012. The programme is now expected to deliver total annual pre-tax savings of approximately £2.2 billion by 2012, with savings realised across the business. GSK presents the restructuring costs incurred solely as a direct result of the Operational Excellence programme in a separate column in the income statement titled ‘Major restructuring’. In addition to the restructuring costs of the Operational Excellence programme, the major restructuring column in the income statement includes restructuring costs incurred solely as a direct result of any restructuring programmes that follow, and relate to, material acquisitions where the operations of the acquired business overlap extensively with GSK’s existing operations. The $1.65 billion (£814 million) acquisition of Reliant Pharmaceuticals in December 2007 and the $3.6 billion (£2.2 billion) acquisition of Stiefel Laboratories in July 2009 are the only acquisitions since October 2007 that meet these criteria.
The Group’s results before the costs of the Operational Excellence programme and acquisition-related restructuring programmes meeting the criteria described above are described as ‘Results before major restructuring’. This presentation, which GSK intends to apply consistently to future major restructuring programmes that have a material impact on GSK’s operating results and on the manner in which GSK’s business is conducted, has been adopted to show clearly the Group’s results both before and after the costs of these restructuring programmes. Management believes that this presentation assists shareholders in gaining a clearer understanding of the Group’s financial performance and in making projections of future financial performance, as results that include such costs, by virtue of their size and nature, have limited comparative value. This presentation is also consistent with the way management assesses the Group’s financial performance.
CER growth
In order to illustrate underlying performance, it is the Group’s practice to discuss its results in terms of constant exchange rate (CER) growth. This represents growth calculated as if the exchange rates used to determine the results of overseas companies in Sterling had remained unchanged from those used in the previous year. CER% represents growth at constant exchange rates. £% represents growth at actual exchange rates.
All commentaries in this Report are presented in terms of CER unless otherwise stated.
Exchange rates
The Group operates in many countries and earns revenues and incurs costs in many currencies. The results of the Group, as reported in Sterling, are affected by movements in exchange rates between Sterling and other currencies. Average exchange rates prevailing during the period are used to translate the results and cash flows of overseas subsidiaries, associates and joint ventures into Sterling. Period end rates are used to translate the net assets of those entities.
GSK Annual Report 2009
11
Products, intellectual property and competition
Pharmaceutical products
GSK’s principal pharmaceutical products are currently directed to nine main therapeutic areas including dermatologicals following the acquisition of Stiefel Laboratories in July 2009. A description of the products is on pages 12 to 13 and an analysis of sales by therapeutic area, is on page 29.
Competition
Our principal pharmaceutical competitors range from small to large pharmaceutical companies often with substantial resources. Some of these companies are:
Pharmaceuticals may be subject to competition from other products during the period of patent protection and, once off patent, from generic versions. The manufacturers of generic products typically do not incur significant research and development or education and marketing development costs and consequently are able to offer their products at considerably lower prices than the branded competitors. As a research and development based company we will normally seek to achieve a sufficiently high profit margin and sales volume during the period of patent protection to repay the original investment, which is generally substantial, and to generate profits and fund research for the future. Competition from generic products generally occurs as patents in major markets expire. Increasingly patent challenges are made prior to patent expiry, claiming that the innovator patent is not valid and/or that it is not infringed by the generic product. Following the loss of patent protection, generic products rapidly capture a large share of the market, particularly in the USA.
We believe that remaining competitive is dependent upon the discovery and development of new products, together with effective marketing of existing products.
Within the pharmaceutical industry, the introduction of new products and processes by our competitors may affect pricing or result in changing patterns of product use. There is no assurance that products will not become outmoded, notwithstanding patent or trademark protection. In addition, increased government and other pressures for physicians and patients to use generic pharmaceuticals, rather than brand-name medicines, may increase competition for products that are no longer protected by a patent.
Intellectual property
Intellectual property is a key business asset for our company, and the effective legal protection of our intellectual property (via patents, trademarks, registered designs, copyrights and domain name registrations) is critical in ensuring a reasonable return on investment in R&D.
Patents
It is our policy to try to obtain patents on commercially important, protectable inventions discovered or developed through our R&D activities. Patent protection for new active ingredients is available in major markets and patents can also be obtained for new drug formulations, manufacturing processes, medical uses and devices for administering products. Although we may obtain patents for our products, this does not prevent them from being challenged before they expire. Further, the grant of a patent does not mean that the issued patent will necessarily be held valid and enforceable by a court. If a court determines that a patent we hold is invalid, non infringed or unenforceable, it will not protect the market from third party entry prior to patent expiry. Significant litigation concerning such challenges is summarised in Note 44 to the financial statements, ‘Legal proceedings’.
The life of a patent in most countries is 20 years from the filing date, however the long development time for pharmaceutical products may result in a substantial amount of this patent life being used up before launch. In some markets (including the USA and in Europe) it is possible to have some of this lost time restored and this leads to variations in the amount of patent life actually available for each product we market. Further, certain countries provide a period of data or market exclusivity that prevents a third party company from relying on our clinical trial data to enter the market with its copy for the period of exclusivity.
The patent expiry dates for our significant products are in the following table. Dates provided are for expiry of patents in the USA and major European markets on the active ingredient, unless otherwise indicated, and include extensions of patent term (including for paediatric use in the USA) where available.
GSK Annual Report 2009
12
Products, intellectual property and competition
| | | | | | | | | | | |
| Products | | Compounds | | Indication(s) | | Major | | Patent expiry dates |
| | | | | | | competitor brands | | USA | | EU |
| | | | | | | | | | | |
Respiratory | | | | | | | | | | |
Seretide/Advair | | salmeterol xinafoate/ | | asthma/COPD | | Singulair, Symbicort, | | 2010 | | 20131 |
| | | fluticasone propionate | | | | Spiriva, Asmanex, Pulmicort, | | (combination) | | (combination) |
| | | | | | | Foster | | 2011-2016 | | 2011 |
| | | | | | | | | (Diskus device) | | (Diskus device) |
| | | | | | | | | | | |
Flixotide/Flovent | | fluticasone propionate | | asthma/COPD | | Qvar, Singulair | | 2011-2025 | | 2011-2017 |
| | | | | | | | | (devices) | | (devices) |
| | | | | | | | | | | |
Serevent | | salmeterol xinafoate | | asthma/COPD | | Foradil, Spiriva | | 2011-2016 | | 2011-2019 |
| | | | | | | | | (Diskus device) | | (devices) |
| | | | | | | | | | | |
Veramyst | | fluticasone furoate | | rhinitis | | Nasacort | | 2021 | | 2023 |
| | | | | | | | | | | |
Anti-virals | | | | | | | | 2016 | | 2016 |
Epzicom/Kivexa | | lamivudine and abacavir | | HIV/AIDS | | Truvada, Atripla | | (combination) | | (combination) |
| | | | | | | | | | | |
Combivir | | lamivudine and zidovudine | | HIV/AIDS | | Truvada, Atripla | | 2012 | | 2013 |
| | | | | | | | | (combination) | | (combination) |
| | | | | | | | | | | |
Trizivir | | lamivudine, zidovudine | | HIV/AIDS | | Truvada, Atripla | | 2016 | | 2016 |
| | | and abacavir | | | | | | (combination) | | (combination) |
| | | | | | | | | | | |
Agenerase | | amprenavir | | HIV/AIDS | | Prezista, Kaletra, Reyataz | | 2013 | | 2014 |
| | | | | | | | | | | |
Lexiva | | fosamprenavir | | HIV/AIDS | | Prezista, Kaletra, Reyataz | | 2017 | | 2019 |
| | | | | | | | | | | |
Epivir | | lamivudine | | HIV/AIDS | | Truvada, Atripla | | 2010 | | 2011 |
| | | | | | | | | | | |
Ziagen | | abacavir | | HIV/AIDS | | Truvada, Atripla | | 2012 | | 2014 |
| | | | | | | | | | | |
Valtrex | | valaciclovir | | genital herpes, coldsores, | | Famvir | | expired | | expired |
| | | | | shingles | | | | | | |
| | | | | | | | | | | |
Zeffix | | lamivudine | | chronic hepatitis B | | Hepsera | | 2010 | | 2011 |
| | | | | | | | | | | |
Relenza | | zanamivir | | influenza | | Tamiflu | | 2013 | | 2014 |
| | | | | | | | | | | |
| | | | | | | | | | | |
Central nervous system | | | | | | | | |
Lamictal | | lamotrigine | | epilepsy, bipolar disorder | | Keppra, Dilantin | | expired | | expired |
| | | | | | | | | | | |
Imigran/Imitrex | | sumatriptan | | migraine | | Zomig, Maxalt, Relpax | | expired | | expired |
| | | | | | | | | | | |
Seroxat/Paxil | | paroxetine | | depression, various | | Effexor, Cymbalta, | | expired | | expired |
| | | | | anxiety disorders | | Lexapro | | | | |
| | | | | | | | | | | |
Wellbutrin SR | | bupropion | | depression | | Effexor, Cymbalta, | | expired | | expired |
| | | | | | | Lexapro | | | | |
| | | | | | | | | | | |
Requip | | ropinirole | | Parkinson’s disease, | | Mirapex | | expired | | 2011 |
| | | | | restless legs syndrome | | | | | | (use in |
| | | | | | | | | | | treating |
| | | | | | | | | | | Parkinson’s |
| | | | | | | | | | | disease) |
| | | | | | | | | | | |
Treximet | | sumatriptan and naproxen | | migraine | | Zomig, Maxalt, Relpax | | 2017 | | NA |
| | | | | | | | | (combination | | |
| | | | | | | | | and use) | | |
| | | | | | | | | | | |
Cardiovascular and urogenital | | | | | | | | |
Avodart | | dutasteride | | benign prostatic hyperplasia | | Proscar, Flomax, finasteride | | 2015 | | 2017 |
| | | | | | | | | | | |
Lovaza | | omega-3 acid ethyl esters | | very high triglycerides | | Tricor | | 2017 | | NA |
| | | | | | | | | (Formulation) | | |
| | | | | | | | | | | |
Coreg CR | | carvedilol phosphate | | mild-to-severe heart failure, | | Toprol XL | | 20232 | | NA |
| | | | | hypertension, left ventricular | | | | | | |
| | | | | dysfunction post MI | | | | | | |
| | | | | | | | | | | |
Fraxiparine | | nadroparin | | deep vein thrombosis, | | Lovenox, Fragmin | | expired | | expired |
| | | | | pulmonary embolism | | Innohep | | | | |
| | | | | | | | | | | |
Arixtra | | fondaparinux | | deep vein thrombosis, | | Lovenox, Fragmin | | expired | | expired |
| | | | | pulmonary embolism | | Innohep | | | | |
| | | | | | | | | | | |
Vesicare | | solifenacin | | overactive bladder | | Detrol, Detrol LA, Enablex, | | 2018 | | NA |
| | | | | | | Sanctura | | | | |
| | | | | | | | | | | |
| | |
1 The UK and Irish patents have been revoked by the courts 2 Generic competition possible in 2010 following conclusion of patent proceedings |
GSK Annual Report 2009
13
Products, intellectual property and competition
| | | | | | | | | | | |
| Products | | Compounds | | Indication(s) | | Major | | Patent expiry dates |
| | | | | | | competitor brands | | USA | | EU |
| | | | | | | | | | | |
Metabolic | | | | | | | | | | |
Avandia | | rosiglitazone maleate | | type 2 diabetes | | Actos, Januvia | | 2012 | | 2013 |
| | | | | | | | | | | |
Avandamet | | rosiglitazone maleate and | | type 2 diabetes | | Competact, Janumet | | 2012 | | 2013 |
| | | metformin HCI | | | | Actoplus met | | | | |
| | | | | | | | | | | |
Anti-bacterials | | | | | | | | | | |
Augmentin | | amoxicillin/clavulanate | | common infections | | | | expired | | expired |
| | | potassium | | | | | | | | |
| | | | | | | | | | | |
Altabax | | retapamulin | | skin infections | | | | 2021 | | 2022 |
| | | | | | | | | | | |
| | | | | | | | | | | |
Oncology and emesis | | | | | | | | |
Arzerra | | ofatumumab | | refractory chronic | | MabThera/Rituxan | | 2023 | | 2023 |
| | | | | lymphocytic leukaemia | | | | | | |
| | | | | | | | | | | |
Hycamtin | | topotecan | | ovarian cancer, small cell | | Doxil, Gemzar | | 2010 | | 2011 |
| | | | | lung cancer, cervical cancer | | | | | | |
| | | | | | | | | | | |
Promacta/ | | eltrombopag | | idiopathic thrombocytopenic | | Nplate | | 2022 | | 2024 |
Revolade | | | | purpura | | | | | | |
| | | | | | | | | | | |
Tykerb/Tyverb | | lapatanib | | advanced and metastatic | | Herceptin | | 2020 | | 2023 |
| | | | | breast cancer in HER2 | | | | | | |
| | | | | positive patients | | | | | | |
| | | | | | | | | | | |
Votrient | | pazopanib | | metastatic renal cell carcinoma | | Sutent, Nexavar | | 2023 | | 2025 |
| | | | | | | | | | | |
| | | | | | | | | | | |
Vaccines | | | | | | | | | | |
Infanrix/Pediarix | | diphtheria, tetanus, pertussis, | | diphtheria, tetanus, pertussis, | | Pentavac, Pentaxim, | | 2017 | | 2016 |
| | | polio, hepatitis B (HepB), | | polio, hepatitis B (HepB), | | Pediacel, Pentacel | | | | |
| | | inactivated antigens | | | | | | | | |
| | | | | | | | | | | |
Fluarix | | split inactivated influenza virus | | seasonal influenza | | Vaxigrip, Mutagrip, Fluzone, | | 2022 | | 2022 |
| | | subtypes A and type B antigens | | | | Influvac, Aggripal, Fluad | | | | |
| | | | | | | | | | | |
FluLaval | | split inactivated influenza virus | | seasonal influenza | | Vaxigrip, Mutagrip, Fluzone, | | none | | none |
| | | subtypes A and type B antigens | | | | Influvac, Aggripal, Fluad | | | | |
| | | | | | | | | | | |
Cervarix | | HPV 16 & 18 virus like particles | | human papilloma virus
type 16 & 18 | | Gardasil, Silgard | | 2026 | | 2019 |
| | | (VLPs), AS04 adjuvant (MPL + | | | | | | | | |
| | | aluminium hydroxide) | | | | | | | | |
| | | | | | | | | | | |
Synflorix | | conjugated pneumococcal | | invasive pneumococcal | | Prevenar | | NA | | 2020 |
| | | polysaccharide | | disease | | | | | | |
| | | | | | | | | | | |
Rotarix | | live attenuated rotavirus | | rotavirus gastroenteritis | | Rotateq | | 2022 | | 2020 |
| | | strain GIP(8) | | | | | | | | |
| | | | | | | | | | | |
Trademarks
All of GSK’s commercial products are protected by registered trademarks in major markets. There may be local variations, for example, in the USA the trademarkAdvaircovers the same product sold in the EU asSeretide. Trademark protection may generally be extended as long as the trademark is used by renewing it when necessary. GSK’s trademarks are important for maintaining the brand identity of its products. GSK enforces its trademark rights to prevent infringements.
Consumer Healthcare products
Our portfolio comprises three main categories: Over-the-counter (OTC) medicines, Oral healthcare and Nutritional healthcare.
Sales of key Consumer Healthcare products in 2009 are shown on page 30.
Our leading Consumer Healthcare products include the following:
OTC medicines
• | | alli, the first licenced weight loss medicine to be available without a prescription, launched in the USA in 2007 and across Europe in 2009 |
• | | Panadol, the global paracetamol/acetaminophen analgesic |
• | | Smoking control productsNicoDerm,NiQuitin CQ,Nicabateand in the USA,Nicorette |
• | | Other brands includeBreathe Rightnasal strips,Tums,Citrucel,ContacandFiberChoice. |
GSK Annual Report 2009
14
Products, intellectual property and competition
Oral healthcare
• | | Aquafresh, a range of toothpastes, toothbrushes and mouthwashes |
• | | Sensodyne, a range of toothpastes, toothbrushes and mouthwashes includingPronamelto protect from acid erosion |
• | | Biotene, acquired late in 2008, the leading treatment for dry mouth |
• | | Polident,PoligripandCoregadenture care cleansers and adhesives |
• | | Other brands includeOdol,MacleansandDr Best. |
Nutritional healthcare
• | | Lucozade, a range of energy and sports drinks |
• | | Horlicks, a range of milk-based malted food and chocolate drinks |
• | | Ribena, a blackcurrant juice-based drink. |
Consumer Healthcare competition
GSK holds leading global positions in all its key consumer product areas. Worldwide it is the second largest in OTC medicines and the third largest in Oral healthcare. In Nutritional healthcare it holds the leading position in the UK, India and Ireland.
The environment in which the Consumer Healthcare business operates has become ever more challenging:
consumers are demanding better quality, better value and improved performance
retailers have consolidated and globalised which has strengthened their negotiation power
cycle times for innovation have reduced.
The main competitors include the major international companies Colgate-Palmolive, Johnson & Johnson, Procter & Gamble, Unilever and Pfizer. In addition, there are many other smaller companies that compete with GSK in certain markets.
The major competitor products in OTC medicines are:
in the USA: Metamucil (laxative), Pepcid (indigestion) and private label smoking control products
in the UK: Lemsip (cold remedy), Nurofen and Anadin (analgesics), and Nicorette and Nicotinell (smoking control treatments).
In Oral healthcare the major competitors are Colgate-Palmolive’s Colgate and Procter & Gamble’s Crest.
In Nutritional healthcare the major competitors toHorlicksare Ovaltine and Milo malted food and chocolate drinks. Competitors toRibenaare primarily local fruit juice products, whileLucozade competes with other energy drinks.
Global manufacturing and supply (GMS)
More than 29,000 people work in GMS across our network of 78 sites in 33 countries. GMS supports the commercial ambition of GSK by delivering quality medicines and consumer products to patients and customers around the world.
The scale of manufacturing in GSK is huge, with the manufacture of over 4 billion packs per year in 28,000 different presentations (including tablets, creams/ointments, inhalers, injections, liquids and steriles), which are then supplied to over 150 markets. Over £3.7 billion was spent by GMS on production in 2009.
GMS operates a procurement operation on behalf of the Group. We spend over £2 billion annually with external suppliers, purchasing active ingredients, chemical intermediates, packaging components and part-finished and finished products.
During 2009, as our internal customers sought every opportunity to grow their businesses, we focused on the cost-competitive supply of quality product to meet their ambitions. We worked diligently to leverage our network of sites and contractors to give us built-in flexibility to sustain future growth and adapt to emerging commercial business models. In an increasingly rigorous external regulatory environment, we have continued to leverage technology in support of process understanding, control, and capability.
Our Primary supply sites supply high quality, competitively priced bulk actives and focus on improvements in primary technologies and processes. Our New Product and Global Supply sites work closely with R&D’s development teams to ensure that the right technical competencies are in place to support rapid and successful new product introduction. These sites serve as the focal point for developing and introducing new secondary manufacturing technologies. The sites in our Regional Pharma supply division focus on reducing costs, allowing GSK to compete more effectively in all its markets. Our Consumer Healthcare sites deliver high-quality, competitively priced products and support rapid new product introduction in a highly innovative and competitive business. New technologies have become a fundamental platform for driving innovation, lowering costs, and providing flexibility in operations.
We are embedding new ways of working that are simplifying the business and achieving greater efficiencies. It is our focus on customer service, including support for new product launches, our strong compliance culture, our commitment to health, safety and the environment, and our commitment to developing our people that have delivered strong results for GSK even as the external environment has become more demanding.
Vaccine manufacturing, which is managed as an integral part of the Biologicals business, is particularly complex as it requires the use of innovative technologies and living micro-organisms. Sophisticated quality assurance and quality control procedures are in place to ensure the vaccine’s quality and safety. This includes animal use according to health authorities’ requirements. Due to their biological nature, individual health authorities may subject vaccines to a second control to guarantee the highest quality standards.
GSK Annual Report 2009
15
Research and development
Research and development – Pharmaceuticals
GSK R&D has built one of the strongest, broadest pipelines of potential new medicines in the industry. In 2009, PharmaceuticalWe believe the pipeline has the potential to deliver value to patients and payers and improve rates of financial return on our R&D was actively managing over 150 projects in human clinical trials across the globe. Delivering thisinvestment. Appropriately progressing our pipeline to patientsproducts safely and efficiently to deliver innovative new medicines for patients is the number one goal.primary goal of our R&D function.
The development of new products typically is a long, expensive and uncertain process, and it is not possible to predict which compounds in development will succeed or fail. The risks inherent in the R&D process are described more fully in the ‘Risk factors’ section, under ‘Risk that R&D will not deliver commercially successful new products’.
GSK allocates its R&D investment with reference to the potential returns available from its target therapeutic markets and the technical and commercial risks associated with products in the pipeline. Those factors are reviewed at each phase of the development process and are central in the decision to proceed to the next stage. Costs incurred at each stage are carefully managed to maximise the likely future return consistent with the Group’s overall objective of increasing its IRR from its R&D activities from its current level, estimated in 2009 to be around 11%, to 14%. The returns generated are, however, primarily determined by the eventual commercial impact of new products as they achieve regulatory approval and are launched.
This projected rate of return includes products launched from 1st January 2007 and compounds in phases IIb and III of the development process. The calculation is based on actual sales from 2007 to 2009 and forecast sales for the relevant products up to 2030, adjusted to reflect expected failure rates, which are broadly in line with standard industry failure rates. The cost base used in this calculation comprises an estimate of attributable R&D costs and actual and projected milestone payments where appropriate. Estimated profit margins, capital investment and working capital requirements are factored into the calculation, based on our historical performance.
Details of the full product development pipeline, made up of both pharmaceutical and vaccine assets, are set out on pages 197 to 200 and the performance of marketed products is discussed in detail under ‘Financial review 2010’ on pages 34 to 40.
Discovering potential medicines
Our early research identifiesstage R&D (drug discovery) seeks to identify the biological targets interferinginvolved with a particular disease,the development of diseases, and createsthen to create small molecules or biopharmaceuticals that interact with these disease targets.
The wealth of scientific discoveries in recent years has made it essential that we are highly selective in where we invest our drug discovery resources; focusing resources on those areas most likely to deliver significant medical advances and returns on investment.A refocus onWe conducted a re-evaluation of the best scienceadvances and discoveries in global biomedical science. This led us to exit areas of research we judged unlikely to provide sufficient scientific and therefore financial returns. We have also tried to create an entrepreneurial environment in drug discovery building onpursuing the success of the existing model of Centres of Excellence for Drug Discovery (CEDDs), groups focused around defined therapy areas. Taking the CEDD model one step further webest scientific opportunities whether internal or external. We created a number of smaller Discovery Performance Units (DPUs) within each CEDD. These, which are small, integrated groups of between 5-70 scientists, who focuswith each group focusing on aone particular disease or pathway.pathway and responsible for driving discovery and development of potential new medicines through to early stage clinical trials (up to the completion of Phase IIa). There are now 36 DPUs in GSK.nearly 40 DPUs.
Each DPU develops a business plan with specific deliverables and investment covering multiple years. The numberplans also include areas of DPUs in each CEDD varies according to the science, and some standalone DPUs were created to explore new therapy areas (such as Ophthalmology), or new ways of working (such as the academic DPU which forms drug discoveryopportunity for collaborations with academia).
The CEDDs are now one year into their 3-year business plan defining overall budgetexternal organisations that could enhance a DPU’s deliverables and clear objectives. The business plans have been reviewed at the end of year 1, and our discovery organisation is on track to deliver GSK’s objectives.
We continue to identify compounds from other companies that would enhance the portfolio and to create innovativereturn. These can include collaborations to ensure that we are seen as a partner of choice forwith large and small companies.companies and academia. Our internal R&D expertise allowsgives us to have a strong positionbasis in identifying and forming these collaborations, which in drug discovery are typically in-licensing or option-based collaborations.
The Discovery Investment Board (DIB) reviews the business development,plans of each DPU. The DIB is responsible for revising the plans, identifying areas for improvement and makes us able to complement our internal pipelinemonitoring DPU delivery against agreed targets and investment. Membership of the DIB comprises senior R&D and commercial management and external individuals with acquisitions, in-licensing, co-marketing/ co-promotion deals, or future options collaborations.
No individual DPU has annual expenditure of more than 10% of the total annual R&D expenditure.
Delivering these medicines to patients
ProgressionA compound that advances into late-stage development consists of optimising both the physical product properties of the medicine, i.e. the chemical steps and formulation required to manufacture and deliver it as well as the(typically after Phase lla) will undergo much larger scale studies in humans confirmingto investigate its efficacy and safety. The combination ofsafety further. At the same time, we work at optimising both the compound’s physical properties and its formulation so that it can be produced and delivered efficiently and in sufficient quantities through the manufacturing process. We then convert the results of these two stepsactivities into a regulatory file for submission to regulatory agenciesagencies.
Medicines Development Teams (MDTs) are small units of six to ten people who have responsibility for a compound through the later stages of development to filing with the regulatory agencies. There are around 30 assets in late-stage development, comprising more than 50 individual projects.
GSK also actively seeks out opportunities to add products to its late-stage portfolio through relationships with other companies. For late-stage assets, these typically take the form of in-licensing or co-promotion arrangements and approvalare most likely to be aligned to existing areas of therapy expertise or investment.
The Product Management Board (PMB), assesses the technical, commercial and investment case for patient useeach project to progress in development. The PMB is co-chaired by the responsibilityChairman, R&D and the President, North America Pharmaceuticals, and includes the heads of each pharmaceutical region and global manufacturing.
Projects are reviewed by the PMB at certain key decision points: ‘Commit to Medicine Development’, ‘Commit to Phase III’ and ‘Commit to File and Launch’. Funding is generally allocated up to the next key decision point, typically between two and four years ahead. The PMB also carries out an annual late-stage funding review, where investment in all projects is reviewed, adjusted if necessary and prioritised.
No individual late-stage project has incurred annual expenditure of more than 10% of the regulatory team.
Medicines Development is organised by therapy areas in Medicine Development Centres (MDCs): Cardiovascular and Metabolic, Infectious Diseases, Neurosciences and Respiratory. Each MDC has ultimate accountability for developing experimental drugs into regulatory-approved medicines for patients. The MDCs are responsible for creating value through the execution of full product development plans and ensuring strong partnerships with the rest oftotal annual R&D and GSK, in particular the CEDDs, preclinical development, the regulatory and commercial groups, and manufacturing.
expenditure.Governance
In 2009 emphasis was put on the simplification of the clinical development organisation, and on focusing investment on project spend versus infrastructure. This reflects the increased focus of R&D on return on investment.
Adapting our structure to maximise our chance to succeed
decisions are overseen by a number of boards. The oversight of strategic issues and overall budget management across R&D’s units&D is owned by the R&D Executive team (RADEX). DIB and PMB control investment decisions in Oncologyearly and Biopharmaceuticals are integrating the discovery and the late stage R&D as described above.
The Scientific Advisory Board (SAB) is chaired by the SVP Medicines Discovery and Development and includes a number of external scientific experts. The SAB reviews and challenges the science underlying development group. This allows usprogrammes and provides advice on related issues to build critical mass in those two growth areas for GSK, and to focus on delivering a strong pipeline. Both integrated units are now fully set up, and have been very successfulthe PMB at progressing their pipeline in 2009 (see pipeline chart).
Our China Discovery team focused on neurodegeneration and neuroinflammation celebrated its second anniversary in 2009. It has grown to approximately 280 employees in 2009, and has developed an impressive early stage portfolio. As products enter the clinic, the team is now establishing clinical capabilities.
key investment points.
GSK Annual Report 20092010
1611
Research and development
Governance
Key projects reaching significant milestones are reviewed each month by a product management board, responsible for determining if a medicine has met criteria for passing into the next phase of development.
GSK’s Chief Medical Officer, working withas Chair of the Global Safety Board, is ultimately accountable for oversight of all major decisions regarding patient safety. OurThe Global Safety Board is responsible internally for approving pivotal studies and investigating any issues related to patient safety arising during the development programme and post-launch.
The oversight of strategic issues Information from GSK clinical trials is widely and budget management across R&D is owned by the R&D Executive team (RADEX).easily available.
Diseases of the developing world
Continued investment in research into diseases of the developing world is essential if there is to be a long-term improvement in the health of people who live in these regions. As part of our response to this challenge, we operate a drug discovery unit based at Tres Cantos (Spain), which focuses on malaria and tuberculosis. We are adapting our business model to pursue an open innovation strategy for R&D for diseases of the developing world. Elements of this new approach include: being more open with our intellectual property; being more open with our resources; and being more open with our data and compounds. Additional R&D sites in the USA and the UK are focused on the development of new medicines to treat HIV/AIDS and drug resistant bacteria, while vaccine research is conducted in Rixensart (Belgium).
Through these R&D efforts, we are addressing the prevention and treatment of all three of the World Health Organization’s (WHO) priority infectious diseases.
Vaccines R&D
GSK isWe are active in the fields of vaccine research, development and production and hashave a portfolio of over 30 vaccines approved for marketing. We have over 1,600 scientists devoted to discovering innovative vaccines that contribute to the health and well-being of people of all generations around the world. The discovery and development of a new vaccine is a complex process requiring long-term investment and, with more than 20 vaccines in clinical development, we have one of the strongest vaccine pipelines in the industry. AlthoughTraditionally vaccines have traditionally been used to ward off illness, GSK’sillness; our vaccine division is working now to develop therapeutic immunotherapeutics aimed at educating the patient’s immune system to identify and attack cancer cells in a highly specific manner.
Vaccine discovery involves many collaborations with academia and the biotech industry to identify new vaccine antigens which are then expressed in yeast, bacteria or mammalian cells and purified to a very high level. This is followed by formulation of the clinical lots of the vaccine. This may involve mixing antigens with selected GSK novel proprietary adjuvant systems, which are combinations of selected adjuvants designed to elicit the most appropriate immune response to a specific antigen. The right combination of antigen and adjuvant system can help the body mobilise the most effective immunological pathway, which is designed to provide maximum protection against specific diseases in targeted populations.
Once formulated, the candidate vaccine is evaluated from a safety and efficacy perspective through the different phases of preclinical testing, then through the clinical trials involving healthy individuals. These will range from safety analysis in a small group of volunteers in phase I, dose adjustment and proof of concept in phase II, to
large-scale safety and efficacy analysis in phase III. The results obtained during clinical trials and data regarding the development of a quality and large-scale production process and facilities are then combined into a regulatory file which is submitted to the authorities in the countries where the vaccine will be made available.
The Biologicals Scientific Committee (BSC) defines the overall R&D and new product licensing strategy for our vaccines business. It is chaired by the Biologicals President and includes heads of our vaccines R&D, disease areas, clinical, epidemiology, business development and other departments as members. The BSC assesses high potential vaccine in-licensing opportunities, decides on exploratory projects and in-licensing opportunities and also endorses target product profiles before the start of early vaccine projects. In addition the BSC aligns R&D, clinical and commercial plans for early projects and is responsible for prioritising exploratory, research and early vaccine projects.
The Development Review Committee (DRC) oversees the late development vaccine portfolio including strategy, project prioritisation and resource allocation. The DRC is chaired by the head of Global Vaccine Development and its membership includes the heads of clinical research, global industrial operations, global commercial centre of excellence, R&D, industrialisation and medical.
After launch, post marketing studies of considerable size are set up to assess vaccination programmes and to monitor vaccine safety.
GSK Annual Report 2009
17
ResearchIn 2010 two distinct R&D groups were formed for vaccines to provide specific focus for prophylactics and for our Antigen Specific Cancer Immunotherapeutic (ASCI) portfolio. A new Global Vaccine Development organisation was created pulling together our clinical and late development R&D organisations. It has allowed us to give a clear focus to projects through Vaccine Development Leaders who have overall responsibility for the development of a particular project.
Animals and research
For ethical, regulatory and scientific reasons, research using animals remains a small but vital part of research and development of new medicines and vaccines. We only use animals where there is no alternative and constantly strive to reduce the numbers used. We are committed to maintaining high standards for the humane care and treatment of all laboratory animals and undertake internal and external review to assure these standards.
The vast majority of the experimental methods do not use animals. We are actively engaged in research to develop and validate more tests that either avoid the use of animals in research or reduce the numbers needed. When animals are used, in research, all due measures are taken to prevent or minimise pain and distress.
We decided not to initiate funding of studies using great apes after 28th October 2008. This is a voluntary decision and provides a tangible demonstration of our commitment to the 3Rs of animal research, which advocates the replacement and reduction of animals in research and refining of experiments to improve animal welfare.
We understand that use of animals for research purposes commands a high level of public interest. Our statement on ‘The care and ethical use of animals in research’, our views on use of non-human primates and details of our voluntary decision not to use great apes (chimpanzees), together with further information and reports, are available.
Research and development – Consumer
Healthcare
The continuous creation and development of innovative products keeps our brands relevant, vibrant and valuable. Our portfolio spans three major categories: OTC medicines, Oral healthcare and Nutritional healthcare. For our major brands, dedicated R&D teams, including Regulatory,regulatory, partner with and work alongside their commercial brand team colleagues in office-free hub environments that foster collaboration and fast decision-making. Hubs have quickly become a preferred way of working at our Innovation Centres in Weybridge, UK, and Parsippany, USA, and we are expandinghave expanded this model rapidly into other key Consumer Healthcare territories, includingto China and India.
GSK Annual Report 2009
18
Research and development
We have a full and diverse product development pipeline. Our key late stage projects are highlighted here,include novel technologies, new combinations and superior formulations.
GSK Annual Report 2010
12
Pipeline summary
We have a full and diverse product development pipeline. All our projects comprising both new chemical entities, andbiological entities or vaccines, new combinations and formulations ofnew indications for existing assets.compounds that are in Phase III, have been filed for approval or have been recently approved are highlighted here. The most advanced status is shown and includes 2009 approvals.2010 and 2011 approvals in the USA and EU.
| | | | | |
| 10 | | 6 | | 5 |
assets moved into | | approvals in USA | | assets terminated |
Phase III | | or EU | | from Phase III development |
| | | | | |
IPX066†, for Parkinson’s disease
1120212†, a MEK
inhibitor, for metastatic
melanoma
2118436, a BRaf inhibitor,
for metastatic melanoma
573719 + vilanterol†,
a combination drug
for COPD
1605786†, for
Crohn��s disease
Zoster vaccine, for the
prevention of shingles
2402968†, for Duchenne
muscular dystrophy
migalastat HCI†,for
Fabry disease
1349572†, an integrase
inhibitor, for HIV and as
a fixed dose combination
withEpzicom/Kivexa
2696273†, for adenosine
deaminase severe
combined immune
deficiency | | Tyverb/Tykerb,for
first line therapy for
hormone receptor positive
breast cancer (USA/EU)
Arzerra,for refractory
chronic lymphocytic leukaemia (EU)
Revolade/Promacta,
for idiopathic
thrombocytopaenic
purpura (EU)
Duodart/Jalyn,a fixed
dose combination drug
for benign prostatic
hyperplasia (USA/EU)
Votrient, for renal
cell cancer (EU)
Prolia,for post-
menopausal osteoporosis
(EU) | | Avandamet XR,
for type 2 diabetes
Avandia +statin,
for type 2 diabetes
almorexant,for
primary insomnia
New generation flu,for
influenza prophylaxis
Simplirix,for genital
herpes prophylaxis. |
† In-licence or other alliance relationship with a third party
Key:
Phase III
Large comparative study (compound versus placebo and/or established treatment) in patients to establish clinical benefit and safety.
Filed
Following successful Phase III trials, we file the product for approval by the regulatory authorities.
Approval
Only when approval is granted can we begin to market the medicine or vaccine.
Our full pipeline is on pages 189197 to 192.200.
| | |
Therapeutic | | Compound |
| | |
Biopharmaceuticals
| | Arzerra (ofatumumab)† |
| | |
| | Arzerra (ofatumumab)† |
| | |
| | Arzerra (ofatumumab)† |
| | |
| | Benlysta (belimumab)† |
| | |
| | ofatumumab† |
| | |
| | otelixizumab† |
| | |
| | Prolia (denosumab)† |
| | |
| | Syncria† |
| | |
Cardiovascular& Metabolic
| | Arixtra |
| | |
| | Avandamet XR |
| | |
| | Avandia + simvastatin |
| | |
| | darapladib† |
| | |
Neurosciences
| | almorexant† |
| | |
| | Horizant (1838262)†* |
| | |
| | retigabine† |
| | |
Oncology
| | Avodart |
| | |
| | Duodart (Avodart + |
| | alpha blocker) |
| | |
| | Votrient (pazopanib) + |
| | Tyverb/Tykerb |
| | |
| | Revolade/Promacta† |
| | |
| | Revolade/Promacta† |
| | |
| | Revolade/Promacta† |
| | |
| | Tyverb/Tykerb |
| | |
| | Tyverb/Tykerb |
| | |
| | Tyverb/Tykerb |
| | |
| | Tyverb/Tykerb |
| | |
| | Votrient (pazopanib) |
| | |
| | Votrient (pazopanib) |
| | |
| | Votrient (pazopanib) |
| | |
Respiratory
| | 642444† |
| | |
| | Relovair (642444† + |
| | 655698) |
| | |
Vaccines
| | Cervarix† |
| | |
| | MAGE-A3 (ASCI) |
| | |
| | MAGE-A3 (ASCI) |
| | |
| | Menhibrix (Hib-MenCY-TT) |
| | |
| | Mosquirix |
| | |
| | New generation flu vaccine |
| | |
| | Nimenrix (MenACWY-TT) |
| | |
| | Simplirix |
| | |
| | |
† | | In-license or other alliance relationship with a third party |
|
* | | See Note 40 to the financial statements, ‘Post balance sheet events’. |
|
ASCI = Antigen Specific Cancer Therapeutic |
GSK Annual Report 20092010
1913
Research and developmentPipeline summary
| | | | | | | | | | | |
| Therapeutic area | | Compound |
| Indication | | Phase 3 | III | | Filed | | Approved |
| | Approved | | | | | | | | | |
Biopharmaceuticals | | albiglutide† | | type 2 diabetes | | l | | | | |
| | | | | | | | | | |
| | Arzerra† | | chronic lymphocytic leukaemia, first line therapy and use in relapsed patients | | l | | | | |
| | | | | | | | | | |
| | Arzerra† | | diffuse large B cell lymphoma (relapsed patients) | | l | | | | |
| | | | | | | | | | |
| | Arzerra† | | follicular lymphoma (refractory & relapsed patients) | | l | | | | |
| | | | | | | | | | |
| | otelixizumab† | | type 1 diabetes | | l | | | | |
| | | | | | | | | | |
| | Benlysta† | | systemic lupus erythematosus | | | | l | | |
| | | | | | | | | | |
| | denosumab† | | bone metastatic disease | | | | l | | |
| | | | | | | | | | |
| | Arzerra† | | chronic lymphocytic leukaemia (refractory patients) | | | | | | l |
| | | | | | | | | | |
| | Prolia† | | hormone ablative/chemotherapy bone loss in prostate cancer patients | | | | | | l |
| | | | | | | | | | |
| | Prolia† | | postmenopausal osteoporosis | | | | | | l |
| | | | | | | | | | |
Cardiovascular & metabolic | | darapladib† | | atherosclerosis | | l | | | | |
| | | | | | | | | | |
Infectious diseases | | Relenza† | | treatment of influenza | | l | | | | |
| | | | | | | | | | |
Neurosciences | | IPX066† | | Parkinson’s disease | | l | | | | |
| | | | | | | | | | |
| | Horizant† | | restless legs syndrome | | | | l | | |
| | | | | | | | | | |
| | Trobalt/Potiga(retigabine/ezogabine)† | | epilepsy – partial seizures | | | | l | | |
| | | | | | | | | | |
Oncology | | 1120212† | | metastatic melanoma | | l | | | | |
| | | | | | | | | | |
| | 2118436 | | metastatic melanoma | | l | | | | |
| | | | | | | | | | |
| | Votrient | | ovarian cancer, maintenance therapy | | l | | | | |
| | | | | | | | | | |
| | Revolade/Promacta† | | chronic liver disease induced thrombocytopaenia | | l | | | | |
| | | | | | | | | | |
| | Revolade/Promacta† | | hepatitis C induced thrombocytopaenia | | l | | | | |
| | | | | | | | | | |
| | Tyverb/Tykerb | | breast cancer, adjuvant therapy | | l | | | | |
| | | | | | | | | | |
| | Tyverb/Tykerb | | gastric cancer | | l | | | | |
| | | | | | | | | | |
| | Tyverb/Tykerb | | head & neck squamous cell carcinoma (resectable disease) | | l | | | | |
| | | | | | | | | | |
| | Votrient | | renal cell cancer, adjuvant therapy | | l | | | | |
| | | | | | | | | | |
| | Votrient | | sarcoma | | l | | | | |
| | | | | | | | | | |
| | Votrient + Tyverb/Tykerb | | inflammatory breast cancer | | l | | | | |
| | | | | | | | | | |
| | Avodart | | reduction in the risk of prostate cancer | | | | l | | |
| | | | | | | | | | |
| | Duodart/Jalyn | | benign prostatic hyperplasia -fixed dose combination | | | | | | l |
| | | | | | | | | | |
| | Revolade/Promacta† | | idiopathic thrombocytopaenic purpura | | | | | | l |
| | | | | | | | | | |
| | Tyverb/Tykerb | | breast cancer, first line therapy | | | | | | l |
| | | | | | | | | | |
| | Votrient | | renal cell cancer | | | | | | l |
| | | | | | | | | | |
Respiratory & | | 573719 | | COPD | | l | | | | |
| | | | | | | | | | |
immuno-inflammation | | 573719 + vilanterol† | | COPD | | l | | | | |
| | | | | | | | | | |
| | vilanterol (642444)† | | COPD | | l | | | | |
| | | | | | | | | | |
| | 1605786 (CCX282)† | | Crohn’s disease | | l | | | | |
| | | | | | | | | | |
| | Relovair
(vilanterol† + 685698) | | asthma | | l | | | | |
| | | | | | | | | | |
| | Relovair
(vilanterol + 685698) | | COPD | | l | | | | |
| | | | | | | | | | |
Paediatric vaccines | | Mosquirix | | malaria prophylaxis (plasmodium falciparum) | | l | | | | |
| | | | | | | | | | |
| | Nimenrix(MenACWY-TT) | | neisseria meningitis groups A, C, W & Y disease prophylaxis | | | | l | | |
| | | | | | | | | | |
| | MenHibrix(Hib-MenCY-TT) | | neisseria meningitis groups C & Y & haemophilus influenzae type b disease prophylaxis | | | | l | | |
| | | | | | | | | | |
Other vaccines | | Flu vaccine | | seasonal influenza prophylaxis | | l | | | | |
| | | | | | | | | | |
| | Zoster | | herpes zoster prevention | | l | | | | |
| | | | | | | | | | |
| | Flu (pre-) pandemic | | pre-pandemic & pandemic influenza prophylaxis | | | | l | | |
| | | | | | | | | | |
| | Pumarix | | pandemic influenza prophylaxis | | | | l | | |
| | | | | | | | | | |
Antigen Specific Cancer | | MAGE-A3 | | treatment of melanoma | | l | | | | |
| | | | | | | | | | |
Immunotherapeutic (ASCI) | | MAGE-A3 | | treatment of non-small cell lung cancer | | l | | | | |
| | | | | | | | | | |
Rare diseases | | 2402968† | | Duchenne muscular dystrophy | | l | | | | |
| | | | | | | | | | |
| | 2696273† | | adenosine deaminase severe combined immune
deficiency | | l | | | | |
| | | | | | | | | | |
| | migalastat HCI† | | Fabry disease | | l | | | | |
| | | | | | | | | | |
Dermatology | | tazarotene foam | | acne vulgaris | | l | | | | |
| | | | | | | | | | |
| | Duaclow dose | | acne vulgaris | | | | l | | |
| | | | | | | | | | |
| | calcipotriene | | mild to moderate plaque psoriasis | | | | | | l |
| | | | | | | | | | |
| | itraconazole tablets | | onychomycosis | | | | | | l |
| | | | | | | | | | |
| | Veltin | | acne vulgaris | | | | | | l |
| | | | | | | | | | |
HIV | | 1349572† | | HIV infections | | l | | | | |
| | | | | | | | | | |
| | 1349572† + abacavir
sulphate + lamivudine | | HIV infections | | l | | | | |
| | | | | | | | | | |
† In-licence or other alliance relationship with a third party
GSK Annual Report 2010
14
Products, competition and intellectual property
Pharmaceutical products
Our principal pharmaceutical products are currently directed to nine main therapeutic areas. A description of the products is on pages 15 to 16 and an analysis of sales by therapeutic area, is on page 35.
Competition
Our principal pharmaceutical competitors range from small to large pharmaceutical companies often with substantial resources. Some of these companies are:
| • | | Abbott Laboratories |
|
| • | | Amgen |
|
| • | | AstraZeneca |
|
| • | | Bristol-Myers Squibb |
|
| • | | Eli Lilly |
|
| • | | Johnson & Johnson |
|
| • | | Merck |
|
| • | | Novartis |
|
| • | | Pfizer |
|
| • | | Roche Holdings |
|
| • | | Sanofi-Aventis |
Pharmaceuticals may be subject to competition from other products during the period of patent protection and, once off patent, from generic versions. The manufacturers of generic products typically do not incur significant research and development or education and marketing development costs and consequently are able to offer their products at considerably lower prices than the branded competitors. As a research and development based company we will normally seek to achieve a sufficiently high profit margin and sales volume during the period of patent protection to repay the original investment, which is generally substantial, and to generate profits and fund research for the future. Competition from generic products generally occurs as patents in major markets expire. Increasingly patent challenges are made prior to patent expiry, claiming that the innovator patent is not valid and/or that it is not infringed by the generic product. Following the loss of patent protection, generic products rapidly capture a large share of the market, particularly in the USA.
We believe that remaining competitive is dependent upon the discovery and development of new products that deliver value to healthcare providers and improved outcomes for patients, together with effective marketing of existing products.
Within the pharmaceutical industry, the introduction of new products and processes by our competitors may affect pricing or result in changing patterns of product use. There is no assurance that products will not become outmoded, notwithstanding patent or trademark protection. In addition, increased government and other pressures for physicians and patients to use generic pharmaceuticals, rather than brand-name medicines, may increase competition for products.
Intellectual property
Intellectual property is a key business asset for our company, and the effective legal protection of our intellectual property (via patents, trademarks, registered designs, copyrights and domain name registrations) is critical in ensuring a reasonable return on investment in R&D.
Trademarks
All of GSK’s commercial products are protected by registered trademarks in major markets. There may be local variations, for example, in the USA the trademark Advair covers the same product sold in the EU as Seretide. Trademark protection may generally be extended as long as the trademark is used by renewing it when necessary. GSK’s trademarks are important for maintaining the brand identity of its products. GSK enforces its trademark rights to prevent infringements.
Patents
It is our policy to try to obtain patents on commercially important, protectable inventions discovered or developed through our R&D activities. Patent protection for new active ingredients is available in major markets and patents can also be obtained for new drug formulations, manufacturing processes, medical uses and devices for administering products. Although we may obtain patents for our products, this does not prevent them from being challenged before they expire. Further, the grant of a patent does not mean that the issued patent will necessarily be held valid and enforceable by a court. If a court determines that a patent we hold is invalid, non infringed or unenforceable, it will not protect the market from third party entry prior to patent expiry. Significant litigation concerning such challenges is summarised in Note 44 to the financial statements, ‘Legal proceedings’.
The life of a patent in most countries is 20 years from the filing date. However the long development time for pharmaceutical products may result in a substantial amount of this patent life being used up before launch. In some markets (including the USA and Europe) it is possible to have some of this lost time restored and this leads to variations in the amount of patent life actually available for each product we market. Further, certain countries provide a period of data or market exclusivity that prevents a third party company from relying on our clinical trial data to enter the market with its copy for the period of exclusivity.
The patent expiry dates for our significant products are in the following table. Dates provided are for expiry of patents in the USA and major European markets on the active ingredient, unless otherwise indicated, and include extensions of patent term, including for paediatric use in the USA, where available. The patents on vaccines relate to vaccine compositions.
GSK Annual Report 2010
15
Products, competition and intellectual property
Pharmaceutical products
| | | | | | | | | | | |
| | | | | | | | | USA | | EU |
| Products | | Compounds | | Indication(s) | | Major | | Patent expiry dates |
| | | | | | | competitor brands | | USA | | EU |
| Respiratory |
Veramyst | | fluticasone furoate | | rhinitis | | Nasacort | | 2021 | | 2023 |
| | | | | | | | | | | |
Flixotide/Flovent | | fluticasone propionate | | asthma/COPD | | Qvar, Singulair | | expired
(compound)
2011-2016
(Diskus device)
2013-2025
(HFA-device/
formulation) | | expired
(compound)
expired
(Diskus device)
2012-2017
(HFA-device/
formulation) |
| | | | | | | | | | | |
Seretide/Advair* | | salmeterol xinafoat/ fluticasone propionate | | asthma/COPD | | Singulair, Symbicort,
Spiriva, Asmanex, Pulmicort,
Foster | | expired
(combination)
2011-2016
(Diskus device)
2013-2025
(HFA-device/
formulation) | | 20131
(combination)
expired
(Diskus device)
2012-2017
(HFA-device/
formulation) |
| | | | | | | | | | | |
Serevent | | salmeterol xinafoate | | asthma/COPD | | Foradil, Spiriva | | expired
(compound)
2011-2016
(Diskusdevice)
NA | | expired
(compound)
expired
(Diskusdevice)
2012-2019
(HFA-device/
formulation) |
| | | | | | | | | | | |
| Anti-virals |
Relenza | | zanamivir | | influenza | | Tamiflu | | 2013 | | 2014 |
| | | | | | | | | | | |
Valtrex | | valaciclovir | | genital herpes, coldsores, shingles | | Famvir | | expired | | expired |
| | | | | | | | | | | |
Zeffix/Epivir-HBV | | lamivudine | | chronic hepatitis B | | Hepsera | | 2013
(use) | | 2012
(use) |
| | | | | | | | | | | |
| Central nervous system |
Lamictal | | lamotrigine | | epilepsy, bipolar disorder | | Keppra, Dilantin | | expired | | expired |
| | | | | | | | | | | |
Imigran/lmitrex | | sumatriptan | | migraine | | Zomig, Maxalt, Relpax | | expired | | expired |
| | | | | | | | | | | |
Requip | | ropinirole | | Parkinson’s disease, restless legs syndrome | | Mirapex | | expired | | expired |
| | | | | | | | | | | |
Requip XL | | ropinirole | | Parkinson’s disease | | Mirapex | | 2012†
(formulation) | | 2011
(use) |
| | | | | | | | | | | |
Seroxat/Paxil | | paroxetine | | depression, various
anxiety disorders | | Effexor, Cymbalta,
Lexapro | | expired | | expired |
| | | | | | | | | | | |
Treximet | | sumatriptan and naproxen | | migraine | | Zomig, Maxalt, Relpax | | 20171
(combination
and use) | | NA |
| | | | | | | | | | | |
Wellbutrin SR | | bupropion | | depression | | Effexor, Cymbalta, Lexapro | | expired | | expired |
| | | | | | | | | | | |
| Cardiovascular and urogenital |
Arixtra | | fondaparinux | | deep vein thrombosis, pulmonary embolism | | Lovenox, Fragmin
Innohep | | expired | | expired |
| | | | | | | | | | | |
Avodart | | dutasteride | | benign prostatic hyperplasia | | Proscar, Flomax, finasteride | | 20151 | | 2017 |
| | | | | | | | | | | |
Coreg CR | | carvedilol phosphate | | mild-to-severe heart failure,
hypertension, left ventricular
dysfunction post MI | | Toprol XL | | 2016†
(formulation) | | NA |
| | | | | | | | | | | |
Fraxiparine | | nadroparin | | deep vein thrombosis,
pulmonary embolism | | Lovenox, Fragmin
Innohep | | expired | | expired |
| | | | | | | | | | | |
Lovaza | | omega-3 acid ethyl esters | | very high triglycerides | | Tricor | | 20171
(formulation) | | NA |
| | | | | | | | | | | |
| | |
| * | | See Outlook on page 7 for details of uncertainty on the timing of follow-on competition. |
|
| † | | Generic competition possible in 2011. |
GSK Annual Report 2010
16
Products, competition and intellectual property
Pharmaceutical products
| | | | | | | | | | | |
| | | | | | | | | USA | | EU |
| Products | | Compounds | | Indication(s) | | Major | | Patent expiry dates |
| | | | | | | competitor brands | | USA | | EU |
| | | | | | | | | | | |
| Anti-bacterials |
Augmentin | | amoxicillin/clavulanate | | common bacterial
potassium infections | | generic products | | expired | | expired |
| | | | | | | | | | | |
| | | | | | | | | | | |
| Oncology |
Arzerra | | ofatumumab | | refractory chronic lymphocytic leukaemia | | MabThera/Rituxan | | pending | | pending |
| | | | | | | | | | | |
Hycamtin | | topotecan | | ovarian cancer, small cell
lung cancer, cervical cancer | | Doxil, Gemzar | | expired | | 2011 |
| | | | | | | | | | | |
Promacta/Revolade | | eltrombopag | | idiopathic thrombocytopenic
purpura | | Nplate | | 2021 | | 2021 |
| | | | | | | | | | | |
Tykerb/Tyverb | | lapatanib | | advanced and metastatic
breast cancer in HER2
positive patients | | Herceptin | | 2020 | | 2023 |
| | | | | | | | | | | |
Votrient | | pazopanib | | metastatic renal cell carcinoma | | Sutent, Nexavar, Afinitor | | 2021 | | 2021 |
| | | | | | | | | | | |
| | | | | | | | | | | |
| Vaccines |
Boostrix | | diphtheria, tetanus, acellular
pertussis | | booster vaccination | | Adacel | | 2017 | | 2017 |
| | | | | | | | | | | |
Infanrix/Pediarix | | diphtheria, tetanus, pertussis,
polio, hepatitis B (HepB),
inactivated antigens | | diphtheria, tetanus, pertussis,
polio, hepatitis B (HepB), | | Pentacel, Pediacel,
Pentaxim, Pentavac | | 2017 | | 2014 |
| | | | | | | | | | | |
Cervarix | | HPV 16 & 18 virus like particles
(VLPs), AS04 adjuvant (MPL +
aluminium hydroxide) | | human papilloma virus
type 16 & 18 | | Gardasil (Silgard) | | 2020 | | 2020 |
| | | | | | | | | | | |
Fluarix | | split inactivated influenza virus
subtypes A and type B antigens | | seasonal influenza | | Vaxigrip, Mutagrip, Fluzone,
Influvac, Aggripal, Fluad | | 2022 | | 2022 |
| | | | | | | | | | | |
FluLaval | | split inactivated influenza virus
subtypes A and type B antigens | | seasonal influenza | | Vaxigrip, Mutagrip, Fluzone,
Influvac, Aggripal, Fluad | | none | | none |
| | | | | | | | | | | |
Pandemrix | | derived split inactivated
influenza virus antigen,
A503 adjuvant | | A(H1N1)v2009 influenza
prophylaxis | | Focetria, Celvapan, emerflu | | 2014 | | 2014 |
| | | | | | | | | | | |
Prepandrix | | derived split inactivated
influenza virus antigen,
A503 adjuvant | | influenza prophylaxis | | Aflunov | | 2014 | | 2014 |
| | | | | | | | | | | |
Synflorix | | conjugated pneumococcal
polysaccharide | | invasive pneumococcal
disease | | Prevenar (Prevnar) | | NA | | 2021 |
| | | | | | | | | | | |
| | | | | | | | | | | |
| HIV |
Combivir | | lamivudine and zidovudine | | HIV/AIDS | | Truvada, Atripla | | 20121
(combination) | | 2013
(combination) |
Epivir | | lamivudine | | HIV/AIDS | | Truvada, Atripla | | expired | | expired |
Epzicom/Kivexa | | lamivudine and abacavir | | HIV/AIDS | | Truvada, Atripla | | 2016
(combination) | | 2016
(combination) |
| | | | | | | | | | | |
Lexiva | | fosamprenavir | | HIV/AIDS | | Prezista, Kaletra, Reyataz | | 2017 | | 2019 |
| | | | | | | | | | | |
Selzentry | | maraviroc | | HIV/AIDS | | Isentress, Intelence, Prezista | | 2021 | | 2021 |
Trizivir | | lamivudine, zidovudine and abacavir | | HIV/AIDS | | Truvada, Atripla | | 2016
(combination) | | 2016
(combination) |
| | | | | | | | | | | |
| | |
| 1 | | See Note 44 to the financial statements, ‘Legal proceedings’ |
GSK Annual Report 2010
17
Products, competition and intellectual property
Consumer Healthcare products
| | | | | | | | |
| | | | | | | | | |
chronic lymphocytic leukaemia (refractory patients)Brand | |  | | Application | | Markets | | Competition |
| | | | | | | | | |
diffuse large B cell lymphoma (relapsed patients)Oral healthcare |
Aquafresh | |  toothpastes, toothbrushes, mouthwashes | | prevention of caries, gum
disease and bad breath | | global | | Colgate-Palmolive’s Colgate, Procter & Gamble’s Crest |
| | | | | | | | | |
follicular lymphoma (refractory patients)Sensodyne | | toothpastes, toothbrushes | | prevention of dental
sensitivity | | global | | Colgate-Palmolive sensitivity toothpastes |
| | | | | | | | | |
systemic lupus erythematosusBiotene | | mouthwash, gel | | treat dry mouth | | many markets | | none |
| | | | | | | | | |
rheumatoid arthritisPolident
Poligrip
Corega | | denture adhesive,
denture cleanser | | to improve comfort of fitted dentures and to clean dentures | | global | | Fixodent |
| | | | | | | | | |
type 1 diabetesOTC medicines |
Panadol | | tablets, capulets, infant drops | | paracetamol-based treatment
of headache and joint pain,
fever, cold symptoms | | global, except USA | | Nurofen |
| | | | | | | | | |
post-menopausal osteoporosisNicoDerm,
NiQuitin CQ,
andNicabate.
AlsoNicorette
(USA only) | |  gum, patch, mini lozenge,
original lozenge | | treatment of nicotine
withdrawal as an aid to
quitting smoking | | global | | Novartis’ Nicotinell,
retailers’ own brands |
| | | | | | | | | |
type 2 diabetesNutritional healthcare |
Lucozade | | energy and sports drinks | | energy and hydration | | UK, Ireland, some
other markets | | various sports drinks |
| | | | | | | | | |
treatment of acute coronary syndromeHorlicks | |
and foods | | nutrition | | UK, Ireland, India | | Ovaltine, Milo |
| | | | | | | | | |
type 2 diabetes – extended releaseRibena | | |
| blackcurrant juice-based drink | | vitamin C-delivering
health drink | | UK, Ireland, some
other markets | | | | |
type 2 diabetes | | |
| | | | | | | | |
atherosclerosis | | |
| | | | | | | | |
insomnia | | |
| | | | | | | | |
restless legs syndrome | | |
| | | | | | | | |
epilepsy – partial seizures | | |
| | | | | | | | |
reduction in the risk of prostate cancer | | |
| | | | | | | | |
benign prostatic hyperplasia – fixed dose combination | | |
|
| | | | | | | | |
inflammatory breast cancer | | |
|
| | | | | | | | |
idiopathic thrombocytopaenic purpura | | |
| | | | | | | | |
chronic liver disease induced thrombocytopaenia | | |
| | | | | | | | |
hepatitis C induced thrombocytopaenia | | |
| | | | | | | | |
breast cancer, first line therapy | | |
| | | | | | | | |
breast cancer, adjuvant therapy | | |
| | | | | | | | |
gastric cancer | | |
| | | | | | | | |
head & neck squamous cell carcinomas (resectable disease) | | |
| | | | | | | | |
renal cell cancer | | |
| | | | | | | | |
ovarian cancer, maintenance therapy | | |
| | | | | | | | |
sarcoma | | |
| | | | | | | | |
COPD | | |
| | | | | | | | |
COPD | | |
|
| | | | | | | | |
cervical dysplasia and cancer prophylaxis caused by HPV 16/18 | | |
| | | | | | | | |
treatment of melanoma | | |
| | | | | | | | |
treatment of non-small cell lung cancer | | |
| | | | | | | | |
Neisseria meningitis groups C & Y disease & Haemophilus influenzae type b disease prophylaxis | | |
| | | | | | | | |
malaria prophylaxis (Plasmodium falciparum) | | |
| | | | | | | | |
seasonal influenza prophylaxis for the elderly | | |
| | | | | | | | |
Neisseria meningitis groups A, C, W & Y disease prophylaxis | | |
| | | | | | | | |
genital herpes prophylaxis | | Robinsons |
| | | | | | | | | |
Consumer Healthcare competition
GSK holds leading positions in all its key consumer product areas. Worldwide it is the second largest in OTC medicines and the third largest in Oral healthcare. In Nutritional healthcare it holds the leading position in the UK, Ireland and India.
The environment in which the Consumer Healthcare business operates has become ever more challenging:
| • | | consumers are demanding better quality, better value and improved performance |
|
| • | | retailers have consolidated and globalised which has strengthened their negotiation power |
|
| • | | cycle times for innovation have reduced. |
The main competitors include the major international companies Colgate-Palmolive, Johnson & Johnson, Procter & Gamble, Unilever and Pfizer. In addition, there are many other smaller companies that compete with GSK in certain markets.
The major competitor products in OTC medicines are:
| • | | in the USA: Metamucil (laxative), Pepcid (indigestion) and private label smoking control products |
|
| • | | in the UK: Lemsip (cold remedy), Nurofen and Anadin (analgesics), and Nicorette and Nicotinell (smoking control treatments). |
In Oral healthcare the major competitors are Colgate-Palmolive’s Colgate and Procter & Gamble’s Crest.
In Nutritional healthcare the major competitors toHorlicksare Ovaltine and Milo malted food and chocolate drinks. Competitors toRibenaare primarily local fruit juice products, whileLucozadecompetes with other energy drinks.
GSK Annual Report 20092010
2018
Our employeesRegulation
GSK ValuesRegulation – Pharmaceuticals
Region and Behaviourscountry-specific laws and regulations are major factors in determining whether a product may be successfully developed and approved. They define the information needed to evaluate the safety and efficacy of pharmaceutical products, as well as governing their testing, approval, manufacturing, labelling and marketing. There is an increasing level of co-operation and exchange of information among the major regulatory authorities encompassing development plans, data to support product registration, post-marketing safety information and inspections.
ChangesAlthough the evaluation of benefit and risk continue to be paramount considerations for the approval of a new drug in the healthcare market overUSA, there is enhanced focus by the past decade necessitateFDA on the transformationsafety of our business modelmedicines from approval through the post-marketing phase of the product. In 2010 the FDA announced four strategic priorities for the next five years: advance regulatory science and innovation, strengthen the safety and integrity of the global supply chain, strengthen compliance and enforcement activities to one that is more customer-centricsupport public health; and innovative; how we perform as a collective organisationaddress the unmet public health needs of special populations. We will determine our success. In order to be effective with growing complexity and exponential speedengaged in these key areas of change in our external environment, GSK needs to create an internal learning culture that is embodied by GSK Values and Behaviours. For more details on GSK Values and Behaviours, see our Corporate Responsibility Report.
Recruitment, talent management and leadership developmentinterest.
In 2009, like every year, recruiting, retainingEurope, new regulations aimed at strengthening the safety monitoring of medicines have now been agreed by EU legislators and developing our employeeswill be implemented from 2011. Discussions continue on draft legislation on improving citizens’ access to reliable information on medicines, and on strengthening EU laws to protect citizens from the threats posed by fake medicines. The European Medicines Agency (EMA) and the Heads of National Medicines Agencies (HMA) both published five-year strategic plans during 2010; these were criticalaimed mainly at strengthening the operation of the existing EU regulatory network. The EU Commission published a report on the operation of the EMA in preparation for a potential legislative proposal for changes to enhancingthe regulatory framework by 2014, and sustaining our performance and reputation. Proactive talent acquisition initiatives underpin our abilityalso continued with its review of the regulation of Clinical Trials in Europe – this review is expected to attract specialist and leadership talent externally. Our assessment process is aligned to a core set of competencies, of which ethics and integrity are central.
A global view of talent and strategic capabilities required looking at the quality, depth and breadth of our talent across the world. We need good succession plans, not just for senior roles but for all our critical positions across the organisation. We maintain a robust leadership strategy to identify and develop our highly skilled leadership cadre and use a systematic, disciplined approach to leadership development, providing tools and programmes to help leaders master skills needed to meet customer, employees and investor expectations. In 2009, we launched a First Line Leader programme for all new leaders – whether new to GSK or new to managing people. We also launched a GSK-wide mentoring scheme where each senior leader will mentor at least one individualconclude in 2010.
Performance and reward2012.
The performanceregulatory environment in Emerging Markets and development planning (PDP) process means employees have business-aligned objectives and behavioural goals. Our reward systems support high performance and helpAsia-Pacific continues to attract and retain the best people. Performance-based pay & bonuses and share-based equity plans align employee interestsevolve, with business targets.
Communication and employee involvement
Our communication channels are designed to keep employees informed, engaged and involved in activities across all areas of our organisation. We encourage two-way, open and honest communication with employees, and in 2009 improvements in web usage technology engaged more employees.
Feedback and monitoring mechanisms are part of every major communication event, and Q&A and feedback facilities are a core feature of our web communications channels. Other broader processes include an internal online opinion survey where in 2009 more than 93,000 employees were invited to provide feedback on individual empowerment, employee engagement and our company values.
As our business evolves, there will be changes that affect employees and we remain committed to consulting on these changes via a number of internal consultation forumscountries continuing to develop their regulatory review systems. We actively participate in a number of specific regional and discussions withnational regulatory initiatives, which provide opportunities for meaningful scientific and regulatory dialogue between industry, agencies and other stakeholders. We continue to include broader sets of patient populations from a number of these countries in medicine development programmes in order to increase global patient access to new innovative medicines, and optimise regulatory approvals.
Regulation – Consumer Healthcare
The consumer healthcare industry is subject to national regulation comparable to that for prescription medicines for the testing, approval, manufacturing, labelling and marketing of products. High standards of technical appraisal frequently involve a lengthy approval process before a new product may be launched.
GSK Consumer Healthcare continues to gain centralised regulatory approvals for over-the-counter products. Since the 2009 history-making first for the OTC industry when the European Employee Consultation ForumMedicines Agency granted centralised approval of the weight loss medicinealliwhich has now been granted approval in more than 50 countries; a line extension chewable product has also been granted centralised approval. Additionally, GSK Consumer Healthcare has embraced the principle of centralised applications and similar bodieshas achieved GSK’s first pan-Gulf Cooperation Council approvals foralliandNiquitinin 2010, permitting launch across all seven markets of the Gulf region.
Value for money
Payers around the world are concerned about the cost of healthcare and the pricing of medicines. The requirement to satisfy healthcare purchasers on value for money is becoming an additional hurdle for product acceptance over and above the regulatory tests of safety, efficacy and quality.
Price controls
In many countries the prices of pharmaceutical products are controlled by law. Governments may also influence prices through their control of national healthcare organisations, which may bear a large part of the cost of supplying medicines to consumers.
Recent government healthcare reforms in countries where this is national practice.
such as France, Spain and Germany may restrict pricing and reimbursement.InclusionCurrently in the USA, there are no government price controls over private sector purchases, but federal law requires pharmaceutical manufacturers to pay prescribed rebates on certain drugs to be eligible for reimbursement under several state and diversity
We are committedfederal healthcare programmes. In 2010, the US President and Congress passed the Affordable Care Act (ACA) to employment policies free from discrimination against existing or potential employees onreform the grounds of age, race, ethnicUS healthcare system to drive down cost, improve quality and national origin, gender, sexual orientation, faith or disability. GSK is committed to offering people with disabilitiesincrease access to millions of Americans without health insurance. These reforms have the full rangepotential to create positive changes in the US healthcare system and expand access to our products. However, the ACA also increased prescribed rebates under government-run programmes and changed the balance between private and public sector purchases.
Despite passage of recruitmentthe ACA, the pressure to control healthcare costs will continue into 2011 and career opportunities. Every effort is made to retain and support employees who become disabled while working at GSK. For more details on diversity measures, see our Corporate Responsibility Report.
Healthy and safe high performance
To meet our mission and strategy, Employee Health and Performance initiatives focus on the health factors that enable employees to perform at the highest level by sustaining energy and engagement. The programmes developed to deliver this health strategy range from the traditional –beyond. Issues such as immunisations, smoking control,cross-border trade, the acceleration of generics to market, comparative effectiveness research, and weight management –pharmaceutical pricing will continue to cutting-edge programmesbe part of the ongoing healthare debate in the areasUSA. Fortunately, we are positioned to be a constructive contributor to these debates since there has been increased recognition that chronic disease is the primary driver of teamhealthcare spending and personal resilience, ergonomics and Energy for Performance. These programmes, available in many languages, are designed to address the root causes of excessive work pressure and low energy and engagement at work and at home. They are complimented by our commitment to flexible workingpharmaceutical products deliver important interventions that enables employees to do their best work in an environment that helps them integrate their work and personal lives. For more details on the scope and impact of these programmes, see our Corporate Responsibility Report.help hold down healthcare costs.
GSK Annual Report 20092010
19
Manufacturing and supply
GSK’s manufacturing covers Pharmaceutical, Consumer Healthcare and Vaccines.
Pharmaceutical Global Manufacturing and Supply (GMS)
More than 27,000 people work in GMS across our network of 77 sites in 32 countries. GMS supports the commercial ambition of GSK by delivering quality medicines and consumer products to patients and customers around the world.
The scale of manufacturing in GSK is huge, with the manufacture of over 4 billion packs per year in 28,000 different presentations (including tablets, creams/ointments, inhalers, injections, liquids and steriles), which are then supplied to over 150 markets. Over £4.1 billion was spent by GMS on production in 2010.
GMS operates a procurement operation on behalf of the Group. We spend over £2 billion annually with external suppliers, purchasing active ingredients, chemical intermediates, packaging components and part-finished and finished products.
During 2010, as our internal customers sought every opportunity to grow their businesses, we focused on the cost-competitive supply of quality product to meet their ambitions. We worked diligently to leverage our network of sites and contractors to give us built-in flexibility to sustain future growth and adapt to emerging commercial business models. In an increasingly rigorous external regulatory environment, we have continued to leverage technology in support of process understanding, control, and capability.
Our Pharmaceutical Launch and Global Supply sites work closely with R&D’s development teams to ensure that the right technical competencies are in place to support rapid and successful new product introduction. These sites serve as the focal point for developing and introducing new secondary manufacturing technologies. The Primary supply sites in our Pharmaceutical Launch and Global Supply division supply high quality, competitively priced bulk actives and focus on improvements in primary technologies and processes. The sites in our Antibiotics and Emerging Markets supply division focus on manufacturing products in the late stage of their life cycle, allowing GSK to compete more effectively in all its markets.
Consumer Healthcare manufacturing
Most of Consumer Healthcare Manufacturing is also managed by GMS apart from our Coleford site which is managed directly by Nutritional healthcare.
Our Consumer Healthcare sites deliver high-quality, competitively priced products and support rapid new product introduction in a highly innovative and competitive business. New technologies have become a fundamental platform for driving innovation, lowering costs and providing flexibility in operations.
We are continuously improving and embedding new ways of working that are simplifying the business and achieving greater efficiencies. It is our focus on customer service, including support for new product launches, our strong compliance culture, our commitment to health, safety and the environment, and our commitment to developing our people that have delivered strong results for GSK even as the external environment has become more demanding.
Vaccine manufacturing
Vaccine manufacturing, which is managed separately from GMS, is an integral part of the Biologicals business, and is particularly complex as it requires the use of innovative technologies and living micro-organisms. Comprehensive quality assurance and quality control procedures are in place to ensure the vaccine’s quality and safety. Due to their biological nature, individual health authorities may subject vaccines to a second control to guarantee the highest quality standards.
GMS supports GSK’s commercial ambition to deliver quality medicines and consumer healthcare products to patients and consumers around the world.
GSK Annual Report 2010
20
World market – pharmaceuticals
The global recession caused by the international financial crisis continued to impact the world’s economies during 2010. Although many countries and industry sectors saw some improvement over 2009, significant growth remained elusive and the recovery was fragile at best.
Following its 22% rise in 2009, the FTSE 100 Index achieved more modest gains in 2010, at 9%. In the USA, the Dow Jones Industrial Average rose by 11%. Stock exchanges across Europe recorded mixed performances, with the 16% rise in Germany contrasting with losses of 17% and 13% in Spain and Italy respectively. In Asia, the Chinese stock market posted an annual decline of almost 15% and the Nikkei in Japan one of 3%.
The debt crisis in Greece spread to other economies such as Spain, Portugal, Italy, Ireland and Romania. As we moved towards the end of the year, many governments introduced austerity measures to complement the fiscal stimulus initiatives of 2009. These cuts, which in some cases were both severe and rapid, were implemented across education, healthcare and other public services. Each government took a different approach to healthcare with specific pricing cuts being applied to selected medicines and vaccines. These measures affected the pharmaceutical industry to varying degrees depending on each company’s exposure to the areas impacted. At the same time, 2010 also saw the implementation of healthcare reform in the USA with associated discounts and price cuts for the pharmaceutical industry.
Global pharmaceutical sales in 2010 were £476 billion, compared with £468 billion in 2009.
| | | | | | | | | |
| World market by | | Value | | | % of | |
| geographic region | | £bn | | | total | |
USA | | | 194 | | | | 41 | |
Europe | | | 129 | | | | 27 | |
Rest of World | | | 153 | | | | 32 | |
| Emerging markets | | | 67 | | | | 14 | |
| Asia Pacific | | | 20 | | | | 4 | |
| Japan | | | 52 | | | | 11 | |
| Canada | | | 13 | | | | 3 | |
| | | | | | | |
| Total | | | 476 | | | | 100 | |
| | | | | | | |
Market growth on a CER basis was USA 4.2%, Europe 3% and Rest of World 8.2%.
| | | | | | | | | |
| World market – | | Value | | | % of | |
| top six therapeutic classes | | £bn | | | total | |
| Central nervous system | | | 76 | | | | 16 | |
| Cardiovascular | | | 69 | | | | 15 | |
| Antineoplastic/lmmunomodulatory | | | 63 | | | | 13 | |
| Alimentary tract and metabolic | | | 57 | | | | 12 | |
Anti-infectives (bacterial,
viral and fungal) excluding vaccines | | | 49 | | | | 10 | |
| | | | | | | |
| Respiratory | | | 33 | | | | 7 | |
| | | | | | | |
(Note: data based on 12 months to 30th September 2010)
Data for market share and market growth rates are GSK estimates based on the most recent data from independent external sources including IMS Health, and where appropriate, are valued in Sterling at relevant exchange rates.
GSK Annual Report 2010
21
GSK sales performance
GSK delivered underlying sales growth (excluding pandemic related products,AvandiaandValtrex) for 2010 of 4.5% despite the ongoing impacts of EU government austerity measures and US healthcare reform which reduced sales by approximately £380 million.
Commentary on GSK’s segmental sales performance uses the performance measures set out below.
Our responsibilityUnderlying sales growth
Underlying sales growth excludes the sales of pandemic products,AvandiaandValtrex. Management believes this measure assists shareholders in gaining a clearer understanding of the Group’s sales performance and prospects because of the size and nature of the loss of sales from these products. A reconciliation to Group and pharmaceutical turnover is as follows:
| | | | | | | | | | | | | |
| | | | | | | | |
| | | 2010 | | | 2009 | | | Growth | |
| | | £m | | | £m | | | CER% | |
| Group turnover | | | 28,392 | | | | 28,368 | | | | (1.2 | ) |
Avandia, Valtrex and pandemic products | | | (2,285 | ) | | | (3,668 | ) | | | | |
| | | | | | | | |
| Underlying Group turnover | | | 26,107 | | | | 24,700 | | | | 4.5 | |
| | | | | | | | |
| | | | | | | | | | | | | |
| | | | | | | | |
| | | 2010 | | | 2009 | | | Growth | |
| | | £m | | | £m | | | CER% | |
| Pharmaceutical turnover | | | 23,382 | | | | 23,694 | | | | (2 | ) |
Avandia, Valtrex and pandemic products | | | (2,285 | ) | | | (3,668 | ) | | | | |
| | | | | | | | |
| Underlying pharmaceutical turnover | | | 21,097 | | | | 20,026 | | | | 4 | |
| | | | | | | | |
Sales of these products by segment were:
| | | | | | | | | | | | | | | | | | | | | | | | | |
| | | | | | | | | | | | | | | | | |
| | | | | | | | | | | Emerging | | | Asia Pacific/ | | | Other trading | | | | |
| 2010 | | USA | | | Europe | | | Markets | | | Japan | | | and unallocated | | | Total | |
| | £m | | | £m | | | £m | | | £m | | | £m | | | £m | |
| Pandemic products | | | 44 | | | | 494 | | | | 227 | | | | 462 | | | | 86 | | | | 1,313 | |
Avandia | | | 237 | | | | 88 | | | | 42 | | | | 24 | | | | 49 | | | | 440 | |
Valtrex | | | 252 | | | | 68 | | | | 28 | | | | 176 | | | | 8 | | | | 532 | |
| | | | | | | | | | | | | | | | | | | |
| | | | | | | | | | | | | | | | | | | | | | | | | |
| | | | | | | | | | | | | | | | | |
| | | | | | | | | | | Emerging | | | Asia Pacific/ | | | Other trading | | | | |
| 2009 | | USA | | | Europe | | | Markets | | | Japan | | | and unallocated | | | Total | |
| | £m | | | £m | | | £m | | | £m | | | £m | | | £m | |
| Pandemic products | | | 324 | | | | 737 | | | | 89 | | | | 331 | | | | 122 | | | | 1,603 | |
Avandia | | | 425 | | | | 171 | | | | 76 | | | | 41 | | | | 58 | | | | 771 | |
Valtrex | | | 942 | | | | 160 | | | | 26 | | | | 152 | | | | 14 | | | | 1,294 | |
| | | | | | | | | | | | | | | | | | | |
White pills/western markets
White pills/western markets refers to sales of tablets and simple injectables (excluding biopharmaceuticals and vaccines) in North America and Europe.
CER growth
In order to illustrate underlying performance, it is the Group’s practice to discuss its results in terms of constant exchange rate (CER) growth. This represents growth calculated as if the exchange rates used to determine the results of overseas companies in Sterling had remained unchanged from those used in the previous year. CER% represents growth at constant exchange rates. £% represents growth at actual exchange rates.
All commentaries in this Report are presented in terms of CER unless otherwise stated.
GSK Annual Report 2010
22
US pharmaceuticals segment review
Commitment| | | | | | | | | | | | | |
| | | | | | | | | | |
| | | | | | | 2009 | | | | |
| | | 2010 | | | (restated) | | | Growth | |
| | | £m | | | £m | | | CER% | |
| Turnover | | | 7,648 | | | | 8,578 | | | | (11 | ) |
| | | | | | | | | | | | | |
| Operating profit | | | 5,043 | | | | 5,933 | | | | (16 | ) |
| | | | | | | | | | |
We are emerging from a period of significant patent expirations, and are making good progress to transform our US business model and operations to meet current and future challenges.
Sales in the USA were down 11% to £7.6 billion, primarily due to the impact of generic competition toValtrex, a significant reduction in sales of pandemic related products and lower sales ofAvandia. Underlying sales (excluding pandemic related products,AvandiaandValtrex) were up 3% in the USA during the year despite the discontinuation of GSK’s promotion ofBoniva, the sale ofWellbutrin XLand the impact of US healthcare reform across the product range. Underlying growth was driven by strong performances from a number of our promoted medicines, includingFlovent(up 8%),Ventolin(up 16%),Boostrix(up 51%),Avodart(up 5%),Lovaza(up 17%) and our oncology products (up 13%). New products launched since 2007 (excluding flu pandemic vaccines) grew 29% and contributed 8% of 2010 sales.
The reduced turnover was partially offset by lower SG&A costs reflecting savings from the restructuring programme and a receipt for the exclusive promotion rights toBonivafor 2010. Operating profit declined by 16%.
In the USA, the healthcare market is changing radically and rapidly. A significant proportion of healthcare costs continue to be paid by federal and local governments. Large pharmacy benefit managers and health plans dominate the private market. Physicians are consolidating their practices into medical centers, group practices and integrated delivery networks. Hospitals are consolidating too, with 500 fewer now than there were just three years ago. Payers are demanding higher quality care with lower costs and are increasingly linking reimbursement with improved health outcomes.
Implementation of landmark healthcare reform legislation in the USA also began during the year. As a result, in January 2010, Medicaid drug rebates increased from 15% to 23% and were extended to include Medicaid managed care plans and new formulations of existing products. Also in January, eligibility for certain government drug pricing programs was expanded to include additional hospitals and health centers.
In response to these evolving market conditions, we are making fundamental changes to our US operations to ensure that we deliver the value our customers – patients, healthcare providers and payers – demand. These changes are enabling us to more effectively meet customer needs and expectations, better deploy our resources and support an evolving, more specialised product portfolio. For example, the majority of our US pharmaceuticals sales representatives now have either customer-centred or portfolio-focused responsibilities, rather than product specific responsibilities. These changes have enabled us to increase the productivity of our sales force while reducing its size by approximately 25% since 2008. Most importantly, our new customer-centric model aligns with our customers’ desire to work with us as a business-to-business partner.
We have been making continued efforts to change the company’s model to improve levels of openness and transparency. For example in 2008, we voluntarily stopped all corporate responsibilitypolitical contributions, and in 2009, we became the first company to report voluntarily payments to healthcare professionals in the USA on a named, individual basis for speaking and consulting services.
In 2011 the US business is implementing a new system for evaluating and compensating our professional sales representatives. Under the new programme, bonuses to sales representatives who work directly with customers will no longer be based on achievement of individual sales targets. Instead, they will be assessed on scientific and business knowledge, feedback from customers in their region, including demonstration of the company’s values, and overall performance of the business unit they support. This programme will be fully implemented in July 2011.
Consistent with our values of integrity and transparency, we have also sharpened the focus of our support for continuing medical education (CME). For example, we implemented a system where we limit grant applications to approximately 20 academic medical centres and national-level professional medical associations. All CME providers that we support must be directly accredited by a recognised accrediting body, and we now only fund CME by not-for-profit providers.
Although the US healthcare and business environment is challenging, it also presents opportunities for companies that can deliver truly innovative medicines to the market. Since 2007, we have launched more than 20 new products in the US market. In 2011, we look forward to a regulatory decision onBenlysta, which if approved will be the first new treatment for Lupus in the last 50 years. Overall we believe the improvements we are making to our cost structure and how we operate are enabling us to compete more effectively in the evolving marketplace.
Our Research Triangle Park campus in North Carolina, USA, is a home to a number of business functions.
GSK Annual Report 2010
23
Europe pharmaceuticals segment review
| | | | | | | | | | | | | |
| | | | | | | | | | |
| | | | | | | 2009 | | | | |
| | | 2010 | | | (restated) | | | Growth | |
| | | £m | | | £m | | | CER% | |
| Turnover | | | 6,548 | | | | 7,087 | | | | (6 | ) |
| | | | | | | | | | | | | |
| Operating profit | | | 3,744 | | | | 3,993 | | | | (4 | ) |
| | | | | | | | | | |
Our European pharmaceutical business delivered solid performance in 2010, despite significant government led austerity measures and price cuts.
Although reported sales were down 6% to £6.5 billion, underlying performance (excluding pandemic related products,AvandiaandValtrex)was flat. This was a creditable performance as it includes approximately £150 million sales impact from government price cuts. It was driven by the introduction of new products and growth from other products in our portfolio. Despite likely continued government pricing pressure in 2011, this strong product portfolio gives us confidence in future performance of this business.
We introduced five new products in 2010. A particular highlight wasDuodart,our treatment combination ofAvodartand tamsulosin for benign prostatic hyperplasia. Other recently introduced brands such asAvamys, Requip Modutab, Tyverb, VolibrisandWellbutrinall achieved double digit growth.
Our major product, Seretide for asthma and COPD, while impacted by the price cuts, achieved sales of £1.6 billion, up 2% whilst maintaining its leadership position in the respiratory market. We continue to bring the benefits of this product to more patients across Europe. Our portfolio of vaccines also contributed to growth withSynflorix,a pneumococcal conjugate vaccine, winning several national tenders and increasing sales by 38% to £43 million.
To manage our operating costs, the business has also delivered improvements in efficiency. Close control of our operating expenses delivered savings in excess of 10% and our programme to reduce the diversity of cartons, labels and leaflets used across our range of medicines delivered further savings. As part of this initiative we will reduce 35 different formats of tablet blister packs to just 3 by 2013.
An 11% reduction in SG&A costs, reflecting savings from the restructuring programme, helped to limit the decline in operating profit to 4%.
Our commitment to work with communities across Europe to support greater access and to build trust with stakeholders continues. An example is a project in Bulgaria to promote awareness for vaccines among vulnerable ethnic minority groups through collaboration between the health mediators, general practitioners and the representatives of the regional health inspectorates. The initiative facilitates the access of these groups to the national healthcare system, focusing on prevention and health awareness. A particular benefit from this work in 2010 was an improved rate of immunisation in this group which in turn reduced the impact from an outbreak of measles.
As we enter 2011, the continuing pressure on cost and the change to a value-based medicine approach (where in addition to demonstration of safety and efficacy, governments or their agencies assess medicines for the value they deliver to their healthcare system) makes the development of effective dialogue with governments, regulators and payers across Europe absolutely vital. Within our business we continue to place emphasis on being able to demonstrate the cost effectiveness of GSK products and to deliver new medicines and vaccines that address unmet medical need and also have demonstrable value. Much of our work is targeted on building evidence on the cost effectiveness of our medicines when compared to current treatments. For example, in the UK we have agreed an innovative pricing agreement with the National Institute for Clinical Excellence (NICE) for our advanced kidney cancer medicine,Votrient.IfVotrientis not as effective as sunitinib, the current standard of care, in the comparative trials which are currently underway, we have offered a future financial rebate.
GSK Annual Report 2010
24
Emerging Markets pharmaceuticals segment review
| | | | | | | | | | | | | |
| | | | | | | | | | |
| | | | | | | 2009 | | | | |
| | | 2010 | | | (restated) | | | Growth | |
| | | £m | | | £m | | | CER% | |
| Turnover | | | 3,556 | | | | 2,895 | | | | 22 | |
| | | | | | | | | | | | | |
| Operating profit | | | 1,271 | | | | 948 | | | | 31 | |
| | | | | | | | | | |
Our Emerging Markets pharmaceutical business continues to perform very strongly with sales up 22% to £3.6 billion in 2010. Underlying growth in these markets (excluding pandemic related products,AvandiaandValtrex)was 20%. This is the second consecutive year following the introduction of GSK’s strategic initiatives that the Emerging Markets business has outgrown pharmaceutical market growth in this region, estimated at 15%.
We delivered particularly strong performances in Latin America which grew 44% and in China and the CIS, which grew 21% and 20% respectively. In addition, we produced growth across all three sectors of the Emerging Markets business – Innovative brands (new patent protected products), Classic brands (non-patent protected) and Vaccines.
Our Innovative brands business showed consistent performance in 2010, with sales growth of 16% to approximately £1.1 billion. Sales of respiratory medicine,Seretide,were over £300 million, and grew 16%, with particularly strong performances in key markets including China.
Our Classic brands business also continues to go from strength to strength with sales growth of 18% to £1.6 billion, including continued double-digit growth ofAugmentinafter 30 years on the market. Vaccine sales were up 38% to £927 million, with pandemic flu products and pneumococcal vaccineSynflorixperforming particularly well. Excluding pandemic flu vaccines, sales grew 14%.
Turnover by main business sector
Emerging Markets pharmaceuticals operating profit increased by 31% on a turnover increase of 22%, reflecting strong Synflorix and pandemic vaccine sales, together with the benefit of acquisitions, partially offset by increased SG&A investment across the region.
Operational highlights for the year include a number of new strategic alliances. We strengthened our footprint in key emerging markets through a number of business acquisitions, including Laboratorios Phoenix, a leading Argentinian Classic brands business. A number of vaccine production alliances were also concluded during the year including an alliance with JSC Binnopharm, a Russian pharmaceutical manufacturer, to enable the local secondary manufacture of a number of key GSK vaccines in Russia.
We continue to introduce flexible pricing strategies. The work is at an early stage, however the results of some of our initiatives so far are promising. For example, we significantly reduced prices of some of GSK’s newest and most innovative products, includingAvodart, AvamysandCervarix,with the aim of increasing affordability and volumes sold in middle income countries.
For the least developed countries (LDCs), last year we established a new Developing Countries and Market Access business unit. This new unit has a dedicated focus on expanding access to our medicines and vaccines to more of the 700 million people who live in the world’s poorest countries. It has the added benefit of helping us build sustainable GSK businesses in those parts of the developing world where we currently have little or no presence. It is responsible for implementing our pricing policy where we are capping the prices of our patented medicines in LDCs to 25% of the Western price, and reinvesting 20% of our profits from medicines sold in these countries back into the same countries’ healthcare infrastructure.
During the year, we were also pleased to announce the signing of the Advance Market Commitment (AMC) for pneumococcal vaccines with the Global Alliance for Vaccines and Immunisation (GAVI), providing 300 million doses ofSynflorixover 10 years at a reduced price, to protect children in the poorest countries across the world against invasive pneumococcal disease.
GSK Annual Report 2010
25
Asia Pacific/Japan pharmaceuticals segment review
| | | | | | | | | | | | | |
| | | | | | | | | | |
| | | | | | | 2009 | | | | |
| | | 2010 | | | (restated) | | | Growth | |
| | | £m | | | £m | | | CER% | |
| Turnover | | | 3,102 | | | | 2,628 | | | | 9 | |
| | | | | | | | | | | | | |
| Operating profit | | | 1,730 | | | | 1,352 | | | | 15 | |
| | | | | | | | | | |
In 2010, sales in Asia Pacific grew 1% to £1.1 billion. Excluding the sales of pandemic related products,AvandiaandValtrex,underlying growth in Asia Pacific was 8% which benefitted from the acquisitions of Stiefel’s dermatology portfolio and UCB’s Asian business. Strong performances were also delivered fromAvamys(up 80%),Tykerb(up 20%),Seretide(up 5%) and vaccines (up 8% excluding flu pandemic).
Operating profit for Asia Pacific improved 4% to £0.5 billion, reflecting improved sales of Synflorix and Cervarix and the favourable impact of product mix on cost of goods, partially offset by lower sales of Relenza.
The middle income countries in the Asia Pacific region have been at the centre of GSK’s flexible pricing initiatives. For example as part of our innovative pricing model, monthly sales of ourCervarixvaccine have increased by approximately six times in the Philippines following a 60% price reduction. Similarly, in Indonesia and Vietnam we have introduced equivalent pricing strategies for this vaccine which has resulted in a more than six-fold increase in the number of women vaccinated.Cervarixis now the number one human papillomavirus vaccine in South East Asia, with Malaysia securing the region’s first ever tender for the product during the year.Synflorixis also growing well, delivering sales of £12 million.
The year also saw important strategic alliances signed with major local pharmaceutical companies including Dong-A in South Korea and Savipharm in Vietnam.
Japanese pipeline potential
| | |
| 1 | | Includes 4 New Chemical Entities |
|
| 2 | | Includes New Chemical Entities, line extensions, new promotions or re-formulations |
GSK Japan delivered another very strong year, with sales up 14% to £1,959 million. Underlying sales growth, excluding pandemic products,ValtrexandAvandia,was 6%. This growth was driven primarily byAdoair (Seretide/Advair),up 17%, and contributions from newly launched products such asCervarix, Avolve/AvodartandXyzal,partially offset by aPaxilsales decline of 11%, and declines in the mature respiratory productsFlixotide/Floventdown 18%, andSerevent,down 26%, which in part reflected biennial price reductions.
Our vaccine franchise has become an important pillar for the company in Japan.Arepanrixbecame one of only two flu vaccines ever allowed for import into Japan when it received regulatory approval in January 2010.Cervarixhas had a strong launch in Japan with 2010 sales of £57 million. The product was also recognised as one of the three vaccines that would receive public funding from the Japanese government from 2011 onwards.
Operating profit for Japan increased by 20% to £1.2 billion, reflecting higher Cervarix and pandemic vaccine sales and the favourable impact of product mix on cost of goods, partially offset by lower sales of Relenza.
During the year, GSK Japan received approvals for six compounds, includingRevoladeandXyzal,and one new indication, Botox for spasticity. In addition, oral pulmonary arterial hypertension treatment,Volibris,was launched during the year.
GSK Japan established a rare diseases development centre in April 2010 to accelerate delivery of medicines for rare diseases for which treatment is not yet available. As part of this initiative, GSK increased investment in Japan by investing in Japan Chemical Research, a company with leading technology to manufacture bio-pharmaceuticals.
GSK Annual Report 2010
26
ViiV Healthcare segment review
| | | | | | | | | | | | | |
| | | | | | | | | | |
| | | | | | | 2009 | | | | |
| | | 2010 | | | (restated) | | | Growth | |
| | | £m | | | £m | | | CER% | |
| Turnover | | | 1,556 | | | | 1,605 | | | | (3 | ) |
| | | | | | | | | | | | | |
| Operating profit | | | 851 | | | | 1,071 | | | | (21 | ) |
| | | | | | | | | | |
ViiV Healthcare celebrated its first anniversary in November 2010. The business was established by GSK and Pfizer as an independent company focused on delivering advances in clinical outcomes and enhancing the quality of life for people living with HIV. The company’s unique structure and wide portfolio of 10 available medicines, provides financial stability and the investment capital required to take a sustainable, long-term view of the HIV market.
Overall, sales of HIV products by ViiV Healthcare were down 3% to £1.6 billion in 2010. Sales of former Pfizer productsCelsentri/ SelzentryandViracept(combined sales of £118 million) and growth fromEpzicom/Kivexa(up 1% to £555 million) partially offset reductions in the sales from other established HIV products includingTrizivir(down 28% to £144 million),Combivir(down 16% to £363 million),Lexiva/Telzir(down 12% to £155 million) andEpivir(down 12% to £115 million) which continue to be impacted by uptake of newer alternative products.
Strong growth forCelsentri/Selzentrycompared with 2009 was supported by the wide acceptance of genotypic testing across Europe, increasing first-line use in the USA and country launches in Poland, Romania, Australia, Japan and Mexico. Upward trends inEpzicom/Kivexasales reflected the role of nucleoside reverse transcriptase inhibitors (NRTIs) as a mainstay of treatment in HIV. As part of the strategic focus on International markets (all countries excluding Europe and North America), ViiV Healthcare established new independent local operating companies in several important geographies and opened regional hubs in Asia Pacific, CIS and Latin America in 2010. As a result, revenue in the International region grew by 22%.
ViiV Healthcare operating profits decreased 21% primarily as a result of US healthcare reform and higher SG&A and R&D costs partially offset by a one-time royalty settlement. The higher SG&A costs were primarily due to the amortisation of acquired intangible assets.
2010 also saw great progress in building a late-stage pipeline. In October, Shionogi-ViiV Healthcare announced the start of their Phase III development programme for the novel integrase inhibitor S/GSK1349572 (‘572), with a further Phase III trial for fixed dose combination ‘572-Tri (‘572+Epzicom/Kivexa) initiated in February 2011.
ViiV Healthcare is committed to connectingsupporting the communities most affected by the HIV epidemic. One way the company does this is by developing innovative approaches to improve access to medicines. For example, in July 2010, ViiV Healthcare was the first company to make its entire current and future anti-retroviral portfolio available to generic manufacturers through royalty-free voluntary licences. These cover all of the least developed, low income countries and sub-Saharan Africa, the 69 countries where 80% of people with HIV live. Similarly, the not-for-profit pricing policy has been expanded to these 69 countries. During the year, ViiV Healthcare also launched the Positive Action Southern Initiative in the USA to reduce healthcare disparities among communities with the greatest needs.
Improving paediatric care of HIV
In 2010, as part of its commitment to address major unmet needs in HIV, ViiV Healthcare formed key partnerships with the Elizabeth Glaser Pediatric AIDS Foundation and amFAR to improve care of paediatric HIV and prevent mother to child transmission (MTCT) of the virus, which is the fourth Millennium Development Goal. The Positive Action for Children Fund gave more than £3 million to community projects to support mothers and children affected by HIV and to prevent MTCT. A further request for proposals at the end of the year expanded the Fund’s reach and scope.
GSK Annual Report 2010
27
Consumer Healthcare segment review
| | | | | | | | | | | | | |
| | | | | | | | | | |
| | | | | | | 2009 | | | | |
| | | 2010 | | | (restated) | | | Growth | |
| | | £m | | | £m | | | CER% | |
| Turnover | | | 5,010 | | | | 4,674 | | | | 5 | |
| | | | | | | | | | | | | |
| Operating profit | | | 1,043 | | | | 931 | | | | 8 | |
| | | | | | | | | | |
Consumer Healthcare sales grew 5% to £5 billion in 2010, significantly ahead of Consumer Healthcare market growth estimated to be approximately 2%. We delivered growth in all of the three categories in which we operate – Oral healthcare (up 6%), Over-the-Counter (OTC) Medicines (up 3%) and Nutritional healthcare (up 9%).
Europe sales were level with last year with sales of £2.0 billion as growth in Oral healthcare and Nutritional healthcare was offset by a decline in OTC sales. The business in the USA grew 1% to £1.0 billion, led by Oral healthcare.
Growth was particularly strong in the rest of the world which grew 13% to £2.0 billion. In the Indian sub-continent we continued to deliver new innovations for theHorlicksbrand while launching three ‘Priority’ brands –Lucozade,SensodyneandBreathe Right, resulting in combined sales growth of 20%. In China, we delivered sales growth of 20% through expanded consumer availability forFenbid,ContacandBactroban, strong uptake from newly launchedLucozadeand continued good performance from other products includingSensodyne,Breathe Rightand denture care brands. To accelerate research and innovation in these key emerging markets, we opened an Oral Healthcare Research Centre in Gurgaon, India, and an Innovation Centre in Beijing, China. The Middle East, Africa and Pakistan markets together delivered sales growth of 18%, largely through strongPanadolandEnosales growth. South America grew sales by 16%, also led by strongPanadolandEnoconsumption, with lower growth in Japan and Australia/New Zealand of 4% and 6%, respectively.
Oral healthcare grew 6% to £1.6 billion, led by a strong performance fromSensodyne, which continued as the fastest-growing toothpaste in the world, a position it has held for the last 5 years. This is a remarkable record for a brand in its 50th year. Following our 2010 launch in India, we now marketSensodynein 124 countries. However,Aquafreshsales declined slightly.Biotene, the dry mouth treatment acquired in 2008, grew strongly.
OTC medicines recorded sales of £2.5 billion, up 3%. A good performance from smoking control products was helped by the new tax on tobacco in Japan and substantial sales in Brazil for a government-funded smoking cessation initiative. In addition to supplying products for Brazil’s initiative, we have provided training on smoking cessation to 1,400 clinics across the country.Panadol, the leading paracetamol analgesic outside the USA, delivered strong sales growth, helped by the roll-out ofPanadol Advancewith Optizorb technology that dissolves five times faster than regular paracetamol tablets.
Dermatology products grew 8% to £256 million but respiratory tract products declined 6% to £380 million.
Nutritional healthcare grew 9% to £952 million, led byHorlicks, with more modest growth fromRibenaandLucozade.
Operating profit increased 8% on a turnover increase of 5%, reflecting efficiencies of scale in SG&A costs, which grew more slowly than sales.
During the year, we opened a new bottle manufacturing plant at our Coleford, UK factory for Nutritional Healthcare, enabling us to mouldLucozadeandRibenabottles, formulate the drinks and fill the bottles, all at one plant. The bottle-forming facility moulds 1 billion PET bottles per year from plastic chips. This investment eliminates over 2,400 road-haulage trips of more than 110 miles from our former bottle supplier.
We recently announced our intention to accelerate growth and focus our Consumer Healthcare business around a portfolio of ‘Priority’ brands and the emerging markets. These two dimensions represent around 90% of our current Consumer Healthcare sales base. We intend to divest the remaining 10% of sales (£500 million) which mostly consist of European and American non-core OTC brands. Our aim is to divest these products by late 2011, subject to interest and realising appropriate value for shareholders. We expect to use the proceeds to fund increased returns to shareholders.
Finally, as part of our objective to deliver a sustainable business the largest array of solar panels in North America now powers our regional distribution centre in York, Pennsylvania. Almost 11,000 door-sized solar panels cover a rooftop that is equivalent to eight football fields, generating 3,400,000 kWhr per year. This solar array will eliminate nearly 1,800 tonnes of carbon dioxide emissions per year, a load on the environment that would take 15,000 mature trees to absorb.
11,000 solar panels cover the rooftop of GSK’s Consumer Healthcare regional distribution centre in York, Pennsylvania
GSK Annual Report 2010
28
Pharmaceutical research and development review
In 2010, Group R&D expenditure before major restructuring was £3,964 million (2009 – £3,951 million) representing 14.0% of total turnover (2009 – 13.9%). The company expects R&D costs before major restructuring as a percentage of turnover to remain around 14% in 2011.
We are delivering sustained asset progression with 10 new chemical entities and new vaccines entering Phase III since the start of 2010. Seven assets are filed with regulators or pending filing. Five projects have been terminated from Phase III development, as listed on page 12, because of adverse trial results or feedback from regulators. By the end of 2012, we expect Phase III data on around 15 additional assets, including treatments for type 1 and type 2 diabetes, rare diseases and multiple cancer types.
Our pharmaceuticals R&D segment comprises R&D activities for the pharmaceuticals business, excluding vaccines, Consumer Healthcare and other local and central costs. The table below analyses the Group R&D expenditure by these categories.
| | | | | | | | | | | | | |
| | | | | | | | | | |
| | | 2010 | | | 2009 | | | 2008 | |
| | | £m | | | £m | | | £m | |
| Pharmaceuticals - direct project costs | | | 1,432 | | | | 1,489 | | | | 1,209 | |
| (excl. vaccines) - indirect costs | | | 959 | | | | 1,056 | | | | 844 | |
| - unallocated costs | | | 563 | | | | 474 | | | | 490 | |
| | | | | | | | |
| Pharmaceuticals R&D | | | 2,954 | | | | 3,019 | | | | 2,543 | |
| In-market pharmaceutical development | | | 147 | | | | 81 | | | | 40 | |
| Vaccines | | | 533 | | | | 524 | | | | 369 | |
| Corporate and other costs | | | 172 | | | | 177 | | | | 304 | |
| | | | | | | | |
| | | | 3,806 | | | | 3,801 | | | | 3,256 | |
| Consumer Healthcare | | | 158 | | | | 150 | | | | 114 | |
| | | | | | | | |
| R&D before major restructuring | | | 3,964 | | | | 3,951 | | | | 3,370 | |
| Major restructuring | | | 493 | | | | 155 | | | | 170 | |
| | | | | | | | |
| Total R&D | | | 4,457 | | | | 4,106 | | | | 3,540 | |
| | | | | | | | |
The proportion of pharmaceuticals R&D investment made in the late-stage portfolio continues to grow from 56% of the direct and indirect costs in 2006 to 61% in 2010.
Sales of new pharmaceutical products launched since 2007 (excluding pandemic flu vaccines) grew by 36% to £1,727 million in 2010 and represented 7% of total pharmaceutical sales.
| | | | | | | | | | | | | |
| | | | | | | | | | |
| | | 2010 | | | 2009 | | | Growth | |
| | | £m | | | £m | | | CER% | |
Veramyst | | | 193 | | | | 142 | | | | 33 | |
Cervarix | | | 242 | | | | 187 | | | | 26 | |
Coreg CR | | | 157 | | | | 161 | | | | (3 | ) |
Lamictal XR | | | 68 | | | | 18 | | | | >100 | |
Requip XL | | | 148 | | | | 123 | | | | 22 | |
Rotarix | | | 235 | | | | 282 | | | | (18 | ) |
Synflorix | | | 221 | | | | 73 | | | | >100 | |
Treximet | | | 56 | | | | 55 | | | | 2 | |
Tykerb | | | 227 | | | | 169 | | | | 34 | |
| Others | | | 180 | | | | 52 | | | | >100 | |
| | | | | | | | |
| | | | 1,727 | | | | 1,262 | | | | 36 | |
| | | | | | | | |
Investment and pipeline progress in 2010
Globally, over 13,000 people work in R&D, with many of these based in our major R&D centres in the UK, USA, Belgium and China. Over 11,000 people work in pharmaceuticals R&D. In the course of 2010 we managed over 150 projects with trials in humans.
Focusing on returns in pharmaceutical R&D
We have been making fundamental changes to how we allocate our pharmaceutical R&D investment: terminating development in areas with low scientific and financial return; dismantling infrastructure; reducing cost and risk through externalising parts of early-stage discovery and directing investment to our late stage pipeline. Progress in 2010 included:
In early 2010, we announced our intention to cease discovery research into certain areas of neurology, such as pain and depression, and instead concentrate activities in neurodegenerative and neuroinflammatory diseases where we feel the prospects for successful registration and launch of differentiated medicines are greater. This change led us to exit five R&D centres. In two of the largest of these – Verona, Italy and Zagreb, Croatia – the operations were transferred to external groups thereby preserving the majority of jobs.
We have successfully out-licensed and spun off some of the early stage neurology assets in the UK through deals with Convergence Pharmaceuticals and Proximagen Group.
Through these changes and other actions we have achieved a reduction in our footprint of 29% since 2006.
We continue to increase the external nature of our discovery activities. During 2010 we signed eight new collaborations to access novel discovery, giving us a total of 54 external discovery engines to complement our 38 DPUs.
We have streamlined the resourcing of our clinical trials contract research organisations, reducing this from over 100 to just two suppliers. While this provides savings in terms of economies of scale, it will also ensure consistency and rigour in clinical trials around the globe.
We combined our Molecular Discovery Research (MDR) and Preclinical Development (PCD) in 2010 to create an end-to-end scientific and technical platform supporting the discovery and development efforts. The remit of this group remains to create the materials and knowledge that enable our R&D to take ideas, generate hypotheses and test them in preclinical and clinical settings and ultimately launch new medicines.
Other developments in pharmaceutical R&D
GSK Rare Diseases was created in 2010 to enable us to focus on this specialised area of drug discovery and development. Opportunities in new treatments for rare diseases are growing as increased scientific (including genetic) understanding allows researchers to identify which rare diseases are most likely to respond to therapeutic intervention. We signed two significant new rare disease alliances this year: with Amicus, for the treatment of Fabry disease, and Fondazione Telethon to research and develop novel stem-cell derived treatments to address rare genetic disorders, using gene therapy carried out on a patient’s own stem cells. These new agreements demonstrate our approach to seeking out innovative medicines that add value for both patients and payers.
This year, we also made progress on our commitment to encourage new research into neglected tropical diseases. Our research centre in Tres Cantos, Spain, released the results of our year-long screening of more than two million compounds in GSK’s chemical library to seek out those that could inhibit the malaria parasite,P. falciparum.We have made all of this data publically available online. More than 80% of the 13,500 molecule structures released are proprietary to GSK, and therefore the information released is entirely new to the research community.
GSK Annual Report 2010
29
Responsible business
Creating a successful and sustainable business is about more than financial results. We place great importance not just on what we achieve but on how we achieve it. Running a responsible, values-based business is embedded in our strategy
We are working hard to build a culture in which our decisions are guided by our values:
Always demonstrate the highest integrity in our conduct
We know that the research and development, manufacture and sale of our products can raise ethical socialissues, and environmental concerns. Thus,we aim to be open about how we tackle them. We understand how important it is to communicate with our stakeholders, seeking to understand their views and being transparent about any setbacks we have experienced as well as the progress we have made.
For example, our commitment to putting patients first means we are focusing on improving access to our medicines and vaccines for all patients irrespective of where they live and their ability to pay. We believe this is the right thing to do and that it will contribute to sustainable business growth.
Ultimately we believe that responsible business is good for society and good for GSK. It helps us to operate efficiently, to gain the trust of our stakeholders, to create the products that patients and healthcare payers really need and to foster the right conditions for expansion of our business.
Our 2010 Corporate Responsibility Report (CR Report) will be published on 21st March 2011.
Our Principles
Our principles sum up our approach to responsible business and are underpinned by our values. They provide guidance for employees on the standards to which GSK is committed.
Access to medicines
We will continue to research and develop medicines to treat diseases of the developing world. We will find sustainable ways to improve access to medicines for disadvantaged people, and will seek partnerships to support this activity. Read more on page 30.
Standards of ethical conduct
We expect employees to meet high ethical standards in all aspects of our business, by conducting our activities with honesty and integrity, adhering to our corporate responsibility isprinciples, and complying with applicable laws and regulations. Read more on page 33.
Research and innovation
In undertaking our research and in innovating we may explore and apply new technologies and will constructively engage stakeholders on any concerns that may arise. We will ensure that our products are subject to rigorous scientific evaluation and testing for safety, effectiveness and quality. We will comply with or exceed all regulations and legal standards applicable to the research and development of our products. Read more on page 11.
Products and customers
We will promote our products in line with high ethical, medical and scientific standards and will comply with all applicable laws and regulations. Read more on page 18.
Caring for the environment
We will operate in an integralenvironmentally responsible manner through systematic management of our environmental impacts, measurement of our performance and embedded partsetting challenging performance targets. We will improve the efficiency of all our activities to minimise material and energy use and waste generated. We aim to find opportunities to use renewable materials and to recycle our waste. Read more on page 32.
Employment practices
We will treat our employees with respect and dignity, encourage diversity and ensure fair treatment through all phases of employment. We will provide a safe and healthy working environment, support employees to perform to their full potential and take responsibility for the performance and reputation of the way business. Read more on page 33.
Human rights
We are committed to upholding the UN Universal Declaration of Human Rights, the OECD guidelines for Multi-National Enterprises and the core labour standards set out by the International Labour Organization. We expect the same standards of our suppliers, contractors and business partners working on GSK’s behalf. Read more in our CR Report.
Leadership and advocacy
We will establish our own challenging standards in corporate responsibility, appropriate to the complexities and specific needs of our business, building on external guidelines and experience. We will share best practice and seek to influence others, while remaining competitive in order to sustain our business. Read more in our CR Report.
Engagement with stakeholders
We want to understand the concerns of those with an interest in corporate responsibility issues. We will engage with a range of stakeholders and will communicate openly about how we are addressing CR issues, in ways that aim to meet the needs of different groups while allowing us to pursue legitimate business goals. Read more in our CR Report.
Community investment
We will make a positive contribution to the communities in which we operate, and will invest in health and education programmes and partnerships that aim to bring sustainable improvements to under-served people in the developed and developing world. Read more on page 30.
GSK does business.Annual Report 2010
30
Improving access to medicines
Access to healthcare in the developing world
There are no easy solutions to the challenge of providing sustainable access to healthcare in developing countries. Poverty is the single biggest barrier. In many countries people do not have enough food, access to a clean water supply, hospitals or clinics in which to receive treatment and healthcare professionals to care for them.
We are committed to playing a full part in addressing the healthcare challenges of the developing world by taking an innovative, responsible and, above all, sustainable approach. GSK is making a vital contribution to developing country healthcare through action in a number of areas including: preferential pricing of our anti-retrovirals and anti-malarials;anti-retrovirals; tiered pricing of our vaccines;vaccines and medicines; investing in R&D that targets diseases particularly affecting the developing world (see page 16)11); being flexible with our IP; pursuing an open innovation strategy; community investment activities and partnerships that foster effective healthcare and capacity building (see page 22)31); and seeking innovative partnerships and solutions. We cover our contribution to improving access to medicines extensively in our Corporate Responsibility Report.
We were a clear leader in the firstboth Access to Medicines (ATM) Index producedIndexes published by the ATM Foundation in 2008.2008 and 2010. We will continue to build on our product, pricing and partnership commitments to help improve healthcare in the developing world. In February 2009,2010 we announced a series offurther expanded our commitments forto the UN defined list of least developed countries, includingLeast Developed Countries (LDCs) by establishing a more flexible approachDeveloping Countries and Market Access operating unit with a focus on the LDCs to intellectual property for research into neglected diseases,broaden patient access to GSK medicines and to help build our presence in other developing countries.
While much has been achieved, a commitment to invest in healthcare infrastructure and price caps on our patented medicines. A significant increase in resources from the global community is still needed to support R&D and to provide access to the resultant medicines and vaccines.
While much has been achieved, sustainable Sustainable progress will only occurbe made if the significant barriers that stand in the way of better access to healthcare are tackled as a shared responsibility by all sectors of global society – governments, international agencies, charities, academic institutions, the pharmaceutical industry and others.
Access to medicines in the developed world
Programmes in the USA
We are working to provide access to medicines for people with limited financial resources and without prescription drugmedicine insurance.
For uninsured Americans who do not qualify for Medicare or Medicaid, GSK and nineten other pharmaceutical companies created Together Rx Access, a programme for qualified individuals offering reductions in the pharmacy cost on more than 300 medicines. Over 2 million Together Rx Access cardholders saved about $20 million in 2009.In addition, GSK offers several patient assistance programmes to help low-income or uninsured Americans have access to GSK’s oncology and specialty products, vaccines and prescription drugs. GSK’s patient assistance programmes provided products to over 452,000 patients during 2010.
Programmes in other countries
We have also introduced Orange Cards providing discounts on certain GSK prescription medicines for eligible patients in a number of other countries. The nature of the discounts varies between countries and the ways in which the healthcare systems operate.
Patient Advocacy
The Patient Advocacy initiative has demonstrated significant progress since its inception in 2002. Initially launched as a US programme, it is now a critical initiative throughout GSK. Patient Advocacy teams in the USA and Europe share best practices and established processes to optimise interaction with patient groups. Typically these relationships provide mutual opportunities: to learn about patient needs and priorities and for patient groups to develop an understanding of drug development challenges.
In 2009, we continued to partner with patient groups on common issues: advocating for access to medicines and treatment, increasing funding for health programs and improving health care delivery. We are considered to be a trustworthy partner with patient groups and we have worked with patient groups and our trade associations to increase the transparency of all of our interactions.
Our work with communities
We work asinvest in community partnership programmes that seek to improve access to medicines and healthcare to improve the lives of people across the world. We aim to make a real difference to these communities by working with our partners to find innovative solutions to healthcare challenges. We believe that business has an important role to play in society and we strive to leverage our resources in a way that delivers shared value to our communities and business. We partner with under-served communities inand support organisations whose goals and objectives reflect our mission of improving the developed and developing world supporting programmes that are innovative, sustainable and bring real benefits to these communities. quality of human life.
Our global community investment in 20092010 was £163£222 million. This compares with £124£163 million in 20082009 on a like for likelike-for-like basis. This increase is due to expansion of our US patient assistance programme, increased humanitarian product donations and scale up of our donation of albendazole for the Lymphatic Filariasislymphatic filariasis (LF) programme.programme, a donation of H1N1 vaccine to the World Health Organization, plus increased grants for HIV and AIDS and the 20% reinvestment initiative for LDCs. Our 20092010 giving comprised product donations of £101£147 million, cash giving of £43£53 million, in-kind donations of £2£4 million plus costs of £17£18 million to manage and deliver community programmes in almost 100 countries. The product donations include £80£100 million for GSK’s patient assistance programmes, £13£17 million worth of albendazole for the LF programme and £8£9 million for humanitarian product donations. Since 2008 our product donations have been valued at cost (average cost of goods) rather than wholesale price (WAC) as this is a more accurate reflection of the cost to GSK. We believe we are the first pharmaceutical company to adopt this practice. For comparative purposes the total value of donations in 20092010 using WAC for products would be £467£564 million compared with £343£467 million in 2008.2009.
We do not operate a single charitable foundation for our community investment programmes, but have a number of country-based foundations and their 20092010 grants are included in the investment total.
GSK Annual Report 2009
22
Our responsibility
Our cash giving was targeted primarily at health and education initiatives as follows:
Global Health Programmeshealth programmes
In developing countries millions of people continue to suffer and die from preventable or treatable diseases. Our global health programmes are designed to improve health and quality of life for people in these communities through provision of medicines, education and advocacy, and investment in disease prevention and healthcare infrastructure. Our global programmes are long-term commitments and designed to be scaleable, replicable and sustainable.
By working in partnership, with NGOs and leading health organisations, we believe it is possible to achieve significant and long-lasting improvements in healthcare. This section highlights our major health programmes.
GSK Annual Report 2010
31
Eliminating lymphatic filariasis (LF)
Our effort to eliminate LF, one of the world’s most disabling diseases, continued in close partnership with the governments of countries where the disease is endemic, the World Health Organization and over 40 partner organisations. As a founding partner and leader in the global eliminationthis effort, we are committed to donating as much of the anti-parasitic drug albendazole as required to reach the one billion people at risk in over 80 countries. In 2009, 4252010, 556 million albendazole treatments were donated to 2826 countries. We have donated over 1.4almost two billion albendazole treatments since the global elimination programme started in 2000.
Positive Action on HIV/AIDS
When Positive Action is our pioneering globalwas created in 1992 it was the first pharmaceutical company programme working withof its kind to support communities affected by HIV and AIDS. StartedNow under the auspices of ViiV Healthcare, the new HIV-focused company, the programme targets its funds towards community-focused projects that reach those most affected by HIV, particularly in 1992, it supports community-based organisationsmarginalised or vulnerable populations. Positive Action works with these communities to enable them to tackle stigma and discrimination, to test innovations in education, care and treatment and to deliver effective HIV and AIDS education, prevention and healthcare services. In July 2009 we announced the creationgreater involvement of a newthose living with HIV. Our Positive Action for Children Fund. The Fund willlaunched in 2009 to make £50 million available over ten10 years to help prevent mother-to-child transmission of HIV and to support orphans and vulnerable children. This new Fund will complement our ongoing workIt supported 12 projects in 2010. At the end of 2010, the latest call for proposals was made broadening the reach and support to the HIV community. With the launchscope of ViiV Healthcare, our Positive Action programmes will be managedits response for babies and children affected by this new HIV-focused company.HIV.
The GlaxoSmithKline African Malaria Partnership
In 2009, Coalitions Against Malaria created by our malaria advocacy programme ‘Mobilising for Malaria’ continued to increase awareness of malaria and mobilise resources in the target countries: UK, Belgium, France, Ethiopia, Mozambique and Cameroon. This year we announced the launch of the next phase of theThe African Malaria Partnership with projects focused on community health workersis our programme to alleviate the mortality and education/behaviour changesuffering malaria brings to affected communities in the community. FourAfrica. In 2010 four new malaria grants were awarded in 2009, with a total commitment of £1.5 million over three years. They includefor community programmes to provide health education to affected populations and to train community health workers. The partnerships with:are: Save the Children (UK) in Kenya; Family Health International in Ghana; African Medical and Research Foundation (AMREF) in Tanzania; and Planned Parenthood Federation of Nigeria.
PHASE
The PHASE programme (Personal Hygiene And Sanitation Education), initiated by us in 1998, is now providing education to hundreds of thousands of school children in 13 countries to improve their health and hygiene to fight infectious diseases. In 2009 we expanded our programme in Uganda, and extended PHASE to the slum areas of Mumbai, India. We have also brought PHASE to the UK and it is being piloted in three schools in Hounslow, near our global headquarters.
Humanitarian product donations
During 2009, we donated essential products, such as antibiotics, throughWorking with our non-profit partners, including AmeriCares, Direct Relief International, MAP International, Interchurch Medical Assistance and Project HOPE, to supportwe supported humanitarian relief efforts and community healthcare. Following a serieshealthcare in over 90 countries.
We responded to the healthcare needs of naturalthe many communities affected by disasters, in the Asia-Pacific region and Central America, the total value of our international humanitarian product donations was £8 million at average cost.
Immediately followingincluding the devastating earthquake that struck Haiti in January 2010, GSK provided donationsdonated supplies of medicines ofvalued at over £1 million from stocks heldmillion. Included in warehousesthese shipments were significant volumes of several non-profit partners. We are continuingantibiotics as well as respiratory and diabetes treatments. Our consumer division provided a range of products, including toothpastes, antacids, pain relievers and vitamins. During the cholera outbreak we responded to donate requested medicines to support mediuma further specific request for antibiotics and longer-term needs. We have also donated £250,000 to the British Red Cross to support the deployment of a Mass Sanitation Unitmass sanitation unit serving more than 50,000 people living in temporary relief camps. Following the earthquake in Chile, in response to an urgent request we supplied 95,000 doses of Hepatitis A vaccine, antibiotics and more than 6,000 dental hygiene kits.
In Pakistan we provided medicines from local stocks for water and sanitation needs.the thousands of people affected by the flooding. We also made cash donations amounting to £170,000, including a contribution to the World Food Programme to support emergency food supply.
The total value of our international humanitarian product donations was £9 million at average cost.
Community initiativesLocal programmes
We support communities in the many different markets in which we operate. Our programmes are dedicateddesigned to strengtheningfit local circumstances and cultures and aligned with an overall goal of supporting access to medicines and healthcare. Local community priorities vary from community to community and population to population, but there are often common challenges to address, whether in terms of a particular health need or the fabric of communities through providing health and education initiatives and support for local civic and cultural institutions that improve the quality of life. human or institutional capacity required to effectively tackle those needs.
In the UK, we contributed £5.6£5.4 million in 20092010 to our continuing programme of charitable activities supporting over 80 organisations in health, medical research, science education, the arts and the environment. This included the UK IMPACT awards scheme which provides small charities with grants and consulting support for their work in addressing the health needs of local communities.
Programmes in North America at a national and local level focused on improving public education in the areas of science and mathematics, and increasing access to healthcare for children and the homeless, and healthcare (prevention/access) for people dealing with breast or gynaecologic cancers.homeless. GSK’s IMPACT Awards recognise organisations that have significantly improved the health of their local communities in Philadelphia and were expanded beyond UK and Philadelphia to reach communities near ourin Research Triangle Park, North Carolina facility.Carolina. Total funding for our North American programmes was $20$18 million.
In Argentina the Pro Mujer programme works with low-income women who do not have access to affordable financial services or healthcare and provides access to small loans to set up their own businesses as well as training and affordable healthcare services.
GSK continues to be areturned the CommunityMark company – this award for excellence in community investment was awarded in 2008 for three years.
GSK Annual Report 2009
23
Our responsibilityinvestment.
Health initiatives
Our contribution to improve healthcare included the following grants:
| | | | |
Non-profit partner | | Amount in 2009 | | Purpose of grant |
| | | | |
Children’s Health Fund USA | | $1,461,000 | | To continue the Referral Management Initiative (RMI) which ensures continuity of specialist medical care for high-risk children who are often homeless and for general support |
| | | | |
GSK IMPACT Awards UK and USA | | £787,000 | | To recognise excellence in non-profit community health organisations. Charities receive unrestricted grants for their work dealing with diverse and difficult social issues and access to healthcare |
| | | | |
Medical Research Charities
UK | | £400,000 | | To support medical research programmes |
| | | | |
Education initiatives
|
| | | | |
Non-profit partner | | Amount in 2009 | | Purpose of grant |
| | | | |
Institute for a Competitive Workforce
USA | | $100,000 | | To improve education and create a skilled workforce for the future, working in partnership with a broad business coalition and staffed by the US Chamber of Commerce |
| | | | |
‘Science in the Summer’ Philadelphia, Pittsburgh and North Carolina | | $558,000 | | To teach basic scientific concepts and inspire school children through an enquiry-based science education programme |
| | | | |
Project ENTHUSE
UK | | £200,000 | | To support Continuing Professional Development (CPD) for science teachers and ultimately encourage children to engage with science and pursue careers in science and technology |
| | | | |
Royal Society of Chemistry
UK | | £100,000 | | To support a programme to target science teachers in the UK, who are not chemistry specialists, and provide them with the key skills and confidence to be effective in their chemistry teaching |
| | | | |
Employee involvement
Our employees are encouraged to contribute to their local communities through employee volunteering schemes. Support includes employee time, cash donations to charities where employees volunteer and matching gift programmes.
Through the US GSK Matching Gift Program, we matched 15,00012,000 employee and retiree gifts at a value of $4.7$3 million in 20092010 plus over $1 million to the United Way campaign. GSK’s GIVE programme provided grants of over $314,000$367,000 to 353365 organisations where US employees volunteered and £272,000£205,000 to 410150 UK-based non-profit organisations via the GSK Making a Difference programme.
In 2009, our Group-wide volunteer initiative was launched to give every GSK employee one paid day off each year to volunteer for a good cause. Employees supportedIn 2010 this continued with employees supporting a wide range of charities and projects including work in local schools, shelters for the homeless, community gardens, nursing homes and aiding communities affected by natural disasters.
The GSK PULSE Volunteer Partnership is a new initiative launched in April 2009 that empowers high-performingenables GSK employees to volunteer formake a period of threedifference to six months lending their professional expertise. PULSE volunteerscommunities and patients in need around the world. Volunteers work full-time with one of our partner non-profit or non-governmental organisations (NGO)(NGOs). Through this experience, volunteers address a clear NGO need, while developing their own leadership capabilities. During 2009 and 2010, PULSE deployed 116 volunteers in 33 countries to create sustainable change for impoverished communities around the world. From our 2009 in-take, we had 58 PULSE volunteers, working in 18 different countries for 25 non-governmental organisations. Employeeswork with 42 NGOs. Volunteers continue to receive their full GSK salary during their placement and in 2009three to six month assignment. In 2010, this figure, along with the operating costs for managing the programme, represented ana total in-kind donation of £428,000.£2.4 million.
GSK Annual Report 20092010
2432
Our responsibility
Environmental sustainability
We are committed to integrating environmental sustainability into our business, especially conserving resources and addressing climate change. We see this as an opportunity as well as a responsibility.
Strategy and plans
We revised our environmental sustainability strategy in 2010, building on the strategy originally introduced in 2001. The new strategy recognises our impacts across the entire value chain, from raw materials to the disposal of our products. Our objective is to benefit the environment, engage employees in tackling key issues and benefit GSK financially-potentially saving £100 million a year by 2020 through reduced energy, materials and distribution costs.
Analysis of GSK’s impacts shows that we need to concentrate in three main areas:
carbon dioxide and other emissions that contribute to climate change
environmental stewardship, which covers the use of materials, generation of waste and pollution.
We have set ambitious goals for key impacts, including a 25% reduction in our carbon footprint, a 20% reduction in water use across the value chain and zero waste to landfill, all by 2020. The targets are detailed in our Corporate Responsibility report.
Climate change and energy
Our long-term vision is for our entire value chain to be carbon neutral by 2050. This very ambitious target means that there will be no net greenhouse gas emissions from manufacturing, distributing, using and disposing of our products, including sourcing raw materials.
We need to act beyond our own operations because 40% of our carbon footprint stems from our supply chain and a further 40% derives from propellants when customers use our inhalers. This was confirmed by a global carbon footprint review of our entire value chain, carried out for the first time in 2010.
GSK’s carbon footprint (million tonne CO2e per annum)
We met our goal of eliminating the use of chlorofluorocarbons (CFCs) in our products by the end of 2010. This has reduced greenhouse emissions associated with our inhaler products from 24 million tonnes of carbon dioxide equivalents in 1998 to approximately 4.7 million tonnes in 2010. We have research programmes under way to find ways to further reduce the impacts from these products.
In 2010 we reduced energy consumption for operations and transport by 5.5% and greenhouse gas emissions by 5.8% relative to sales. The cumulative reduction for 2006-2010 is 9.1% for energy and 10.7% for emissions. This is below our target of 20%, mainly because progress was slow in the early years of the five-year period.
A central fund to finance energy saving projects has accelerated progress since 2007. In 2010 we completed 188 projects, which will avoid around 52,000 tonnes of greenhouse gas emissions a year.
We are also increasing investment in on-site generation of renewable energy, supported by a renewable energy fund created in 2010. GSK Consumer Healthcare installed North America’s largest roof mounted solar photo voltaic system at its regional distribution centre in York, Pennsylvania. It will save nearly 1,800 tonnes of carbon dioxide emissions per year.
GSK’s global operations were certified to Carbon Trust Standard in 2010, the first company to achieve this recognition of excellence in carbon management for all global operations.
Water
Water is a particularly important natural resource, and we recognise that GSK can play a positive role in managing it more sustainably. We endorsed the United Nations CEO Water Mandate in 2009.
In 2010 we reduced water consumption by almost 500 million litres despite significant business growth in our vaccines manufacturing business. Net water consumption fell by 1.6% per £1 of sales, a cumulative reduction of 15.7% since 2006, exceeding our target of 10%.
We also exceeded our targets for improving the quality of waste water.
Environmental stewardship
We aim to use materials efficiently and safely, minimising waste and pollution and avoiding harm to people and the environmentenvironment.
GlaxoSmithKline’s environmental responsibility spans our demandIncreasing the efficiency with which we use materials is a priority. Our long-term aspiration is to achieve 5% mass efficiency by 2020 for rawnew pharmaceutical products transferred from R&D to manufacturing. This is about five times the typical level in the pharmaceutical industry and will reduce input materials through converting them intoand waste by 80%. The average mass efficiency for new products to their impacts after use.during the 2006-2010 period has reached 3.3%.
Our vision for environmental sustainability is ultimately to transform how we do business following the principles of industrial ecology, using renewable resources and converting wastes to by-products that become inputs to other processes.
The first steps towards this goal are to optimiseImprovements in the efficiency of our processes, minimising thesolvent use of energy and other resources andalso reduced the amount of wastevolatile organics released to air by 12.8% per £1 of sales in 2010, cumulatively 35.8% since 2006.
Packaging provides further opportunities to conserve resources and in 2010 we generate.began to implement the sustainable packaging strategy developed in 2009. We also began to update our green packaging guide for designers and managers. In doing so, we also need2010, the US American Institute of Chemical Engineers presented its Industrial Practice Award in Sustainable Engineering to reduce carbon dioxide emissions from energy used, as a contribution to tackling climate change.our operational sustainability team for its work embedding sustainability into R&D and manufacturing.
Our environmental activities are overseen by a Sustainability Council composed of senior executives. Environmental management
We manage environmental issues (as well as occupational health and safety) using a management system aligned with recognised international standards. Each business is accountable for its own sustainability plans and performance. Our central audit group includes environmental issues in its routine audits of our sites and business processes.
Strategy We are working increasingly closely with suppliers and plans
Our strategy has three elements, beginning with embedding thecontract manufacturers to reduce environmental fundamentals such as energy management and waste reduction to eliminate adverse impacts from our operations. The second stage is to embrace sustainability in all of our businesses, developing a culture of product stewardship and sustainable resource use. The strategy also requires transparency, informing stakeholders of our actions and performance – we provide fuller disclosure in our Corporate Responsibility Report.the supply chain.
We have a ten-year strategic plan with targets that are refreshed every five years. In 2010 we will update the plan with new, more challenging targets to 2020. Key targets for 2010 that we have been pursuing since 2006, and progress towards them, include:
a 20% reduction per unit of sales in energy use and emissions from operations and transport – we have achieved 6% reduction in energy use and 5% in emissions
2% average material efficiency for products transferred from research and development – the current average is 2.8%
2% annual reduction in water use per unit of sales – we have achieved 15% reduction since 2006
Mass efficiency
Increasing the efficiency with which we use materials is a priority. In 2009 we increased a target originally introduced in 2005, aiming for a 2.5% efficiency by 2015 for new products launched after 2010. For the first time, we also set a mass efficiency target for our manufacturing sites to achieve additional improvements after they take over processes from R&D. Our long-term aspiration is to achieve 5% efficiency by 2020 – five times the typical level in the pharmaceutical industry, which will reduce input materials and waste by 80%.
Mass efficiency (average 2005-2009)
Climate change
Our biggest direct climate impact comes from propellants used in inhalers for diseases such as asthma. We have reduced this impact by replacing CFC gases and continue to research ways to minimise greenhouse gases released by these products.
Since 2007 we have been implementing a climate change programme with ambitious targets for our emissions and energy use in operations and transport. We are aiming for a 20% reduction per unit of sales by 2010 and a cut of 45% by 2015 (from 2006 levels). In 2009 emissions and energy consumption per unit of sales fell by 5% and 6% respectively. These reductions follow two years of limited progress, which means that we need an outstanding performance in 2010 to meet our interim 20% target.
Energy reduction has been identified as a key objective for the business. As a result, energy consumption is now included in the key business metrics and in 2009 the remuneration of senior managers in manufacturing was linked to the achievement of energy reduction targets. We have also created a central fund to finance energy saving projects. A climate change team has identified more than 800 energy saving projects which have helped in the last two years to avoid around 85,000 tonnes of greenhouse gas emissions.
GSK Annual Report 20092010
2533
Ethical conduct
We are committed to creating a strong ethical culture at GSK. We do this by emphasising our values, developing robust policies, recruiting and engaging the right people and equipping them with the information they need to make ethical decisions. Putting patients first is the core principle of being an ethical pharmaceutical company.
Our responsibilityCode of Conduct sets out fundamental standards for all employees. It is supported by the Employee Guide to Business Conduct which helps employees make ethical decisions and emphasises GSK’s key values:
Always demonstrate the highest integrity in your conduct
We stress our commitment to performance with integrity. This means that all employees must understand our values and what we stand for as well as mitigatingthe policies and procedures that underpin our climate change impact,approach.
Our internal compliance systems are designed to identify and address breaches of our codes and reinforce GSK’s values. There is continual external pressure to enhance these systems and our compliance oversight and audits are helping to drive this change. We fully investigate suspected breaches and take appropriate disciplinary action, including dismissal where appropriate.
In 2010 we reviewed and strengthened our approach to preventing, detecting and addressing bribery and corruption. We launched a dedicated anti-bribery and corruption unit which will ensure we take a consistent approach across GSK and strengthens our monitoring capability.
Also, we introduced a Third Party Code of Conduct which applies to all GSK suppliers. This sets out the standards we expect suppliers to meet and covers ethical conduct; labour practices, environmental, health and safety standards; and management. To help suppliers understand how to interact appropriately with GSK staff, the Code includes key principles from our Employee Guide to Business Conduct such as our policy on receiving gifts.
Our due diligence process for potential acquisitions takes account of ethical risks and we integrate our ethics and compliance requirements as standard practice in newly acquired businesses. We seek to enter into joint ventures with organisations that share our values.
Our employees
Recruitment, talent management and leadership develoment
In 2010, like every year, recruiting, retaining and developing our employees were critical to enhancing and sustaining our performance and reputation. Proactive talent acquisition initiatives underpin our ability to attract specialist and leadership talent externally. Our assessment process is aligned to a core set of competencies, of which ethics and integrity are central.
We need good succession plans, not just for senior roles but for all our critical positions across the organisation. We maintain a robust leadership strategy to identify and develop our highly skilled leadership cadre and use a systematic, disciplined approach to leadership development, providing tools and programmes to help leaders master skills needed to meet customer, employee and investor expectations. In 2010, we provided training to nearly 8,000 GSK leaders worldwide and also developed new programmes for future senior leaders and senior executives.
Performance and reward
The performance and development planning process means employees have business-aligned objectives and behavioural goals. Our reward systems are geared to promote high performance and help to attract and retain the best people. Performance-based pay, bonuses and share-based equity plans align employee interests with business targets.
Communication and employee involvement
Our communication channels are designed to keep employees informed, engaged and involved in activities across all areas of our organisation. We encourage two-way, open and honest communication with employees, and in 2010 we launched a new updated global intranet portal, ConnectGSK.
Feedback and monitoring mechanisms are part of every major communication event, and Q&A and feedback facilities are a core feature of our web communications channels. In 2010 we also aimintroduced ‘Idea Engine’, an online tool which allows employees to identify wayssubmit ideas and recommendations.
As our business evolves, there will be changes that affect employees and we can respondremain committed to changing disease patterns caused by climate change.
GSK’s carbon footprint
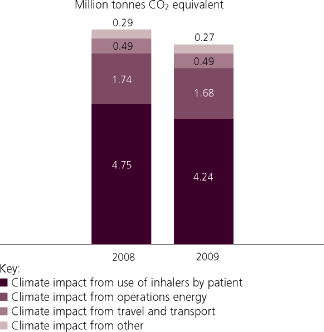
Other environmental concernsEmployee numbers by region
Sustainability requires a holistic view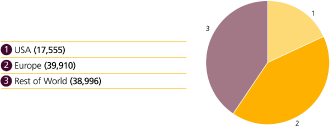
Inclusion and diversity
We are committed to employment policies free from discrimination against existing or potential employees on the grounds of everything that we do, especially relatingrace, colour, religion or belief, gender, sexual orientation, gender identity or expression, age, national origin, genetic make-up, disability or chronic health conditions. GSK is committed to offering people with disabilities access to the optimal usefull range of all resources. Waterrecruitment and career opportunities. Every effort is a particularly important natural resource,made to retain and support employees who become disabled while working at GSK. For more details on diversity measures, see our Corporate Responsibility Report.
Healthy and safe high performance
To meet our mission and strategy, Employee Health and Performance initiatives focus on the health factors that enable employees to perform at the highest level by sustaining energy and engagement. The programmes developed to deliver this health strategy range from the traditional – such as immunisations, smoking control and weight management – to cutting-edge programmes in the areas of team and personal resilience, ergonomics and Energy for Performance. These programmes, available in many languages, are designed to address the root causes of excessive work pressure and low energy and engagement at work and at home. They are complemented by our commitment to flexible thinking about the way we recognisedeliver our work that businesses can play a positive roleenables employees to do their best work in managing itan environment that helps them integrate their work and personal lives. For more sustainably. We endorseddetails on the United Nations CEO Water Mandate in 2009. Water consumption in 2009 fell by 5% (per unit of sales), which exceeds our target.
We also have targets for improving the quality of wastewater, reducing waste disposalscope and emissions to air. In 2009 we exceeded targets in eachimpact of these areas and are on track to completely eliminate ozone-depleting CFCs by the end of 2010. Our environmental audit scores are also moving close toprogrammes, see our 2010 targets.
Packaging provides opportunities to reduce resources use and we have several projects to reduce the environmental impact of packaging. For instance, we are now using lighter toothpaste caps, saving 90 tonnes of plastic a year.
Corporate Responsibility Report.
GSK Annual Report 20092010
2634
Regulation
Regulation – Pharmaceuticals
Region and country-specific laws and regulations define the information needed to show the safety and efficacy of pharmaceutical products, as well as governing their testing, approval, manufacturing, labelling and marketing. These regulatory requirements are a major factor in determining whether a marketable product may be successfully developed and approved.
In this highly regulated environment, there is increasing cooperation and exchange of information among the major regulatory authorities. Consequently, in 2009 we have transformed the structure of our Regulatory Affairs department to better match the global regulatory environment in which we operate. The existing US, EU and International groups have been integrated into one department, Global Regulatory Affairs. This change enables us to more effectively formulate global strategies to obtain regulatory approvals for GSK products, based on regional expertise. The new structure will also make us better positioned to interact with our regulatory customers in this dynamic, globally-connected external environment.
Although the evaluation of benefit and risk continue to be paramount considerations for the approval of a new drug in the USA, there is an increased focus on the safety of medicines. The FDA Amendments Act of 2007 mandates a rigorous FDA review of safety from approval through the post-marketing phase of the product, and the FDA is examining better ways to identify counterfeit medicines and to communicate new risk information to the public. We remain engaged in these key areas of interest.
In Europe, new regulations aimed at strengthening the safety monitoring of medicines, improving citizens’ access to reliable information on medicines and strengthening EU laws to protect citizens better from the threats posed by fake medicines are under discussion by EU legislators. Meanwhile, preparation continues for the implementation in 2010 of new rules aimed at simplifying and harmonising the EU regulatory framework on changes to authorised medicinal products. It is hoped that these changes will minimise inefficiencies in the procedures, and reduce the overall administrative burden.
The regulatory environment in Emerging Markets and Asia-Pacific continues to evolve, with a number of countries continuing to develop their regulatory review systems. GSK actively participates in a number of specific regional and national regulatory initiatives, which provide opportunities for meaningful scientific and regulatory dialogue between industry, agencies and other stakeholders. GSK continues to include broader sets of patient populations from a number of these countries in medicine development programmes in order to increase global patient access to new innovative medicines, and optimise regulatory approvals.
Regulation – Consumer Healthcare
The consumer healthcare industry is subject to national regulation comparable to that for prescription medicines for the testing, approval, manufacturing, labelling and marketing of products. High standards of technical appraisal frequently involve a lengthy approval process before a new product is launched.
January 2009 saw the history-making first for the OTC industry when the European Medicines Agency granted centralised approval of the weight loss medicinealli. This resulted in the pan-European launch ofallias the first licenced weight loss treatment available without a prescription across all 27 EU countries. With additional national licences,allihas now been granted approval in 38 countries.
Value for money
Payers around the world are concerned about the cost of healthcare and the pricing of medicines. The requirement to satisfy healthcare purchasers on value for money is becoming an additional hurdle for product acceptance over and above the regulatory tests of safety, efficacy and quality.
Price controls
In many countries the prices of pharmaceutical products are controlled by law. Governments may also influence prices through their control of national healthcare organisations, which may bear a large part of the cost of supplying medicines to consumers.
Recent government healthcare reforms in countries such as France, Spain and Germany may restrict pricing and reimbursement.
Currently in the USA, there are no government price controls over private sector purchases, but federal law requires pharmaceutical manufacturers to pay prescribed rebates on certain drugs to be eligible for reimbursement under several state and federal healthcare programmes. In 2009, the US President and Congress dedicated much of the year’s legislative process to reforming America’s healthcare system to drive down cost, improve quality, and increase access to millions of Americans without health insurance. These reforms had the potential to create positive changes in the US healthcare system and expand access to GSK’s products. They also had the potential to increase prescribed rebates under government-run programmes and change the balance between private and public sector purchases. The pressure to control healthcare costs and the need for health reform will continue into 2010 and beyond. Issues such as cross-border trade, the acceleration of generics to market, comparative effectiveness research, and pharmaceutical pricing will continue to be part of the ongoing reform debate in the USA. Fortunately, GSK is positioned to be a constructive contributor to these debates since there has been increased recognition that chronic disease is the primary driver of healthcare spending and pharmaceutical products deliver important interventions that help hold down healthcare costs.
GSK Annual Report 2009
27
World market, economy and outlook
World market – pharmaceuticals
Global pharmaceutical sales in 2009 were £468 billion compared with £366 billion in 2008.
| | | | | | | | | |
| World market by | | Value | | | % of | |
| geographic region | | £bn | | | total | |
| | | | | |
USA | | | 187 | | | | 40 | |
Europe | | | 131 | | | | 28 | |
| France | | | 25 | | | | 5 | |
| Germany | | | 24 | | | | 5 | |
| Italy | | | 16 | | | | 3 | |
| UK | | | 12 | | | | 3 | |
Rest of World | | | 150 | | | | 32 | |
| Emerging markets | | | 66 | | | | 14 | |
| Asia Pacific | | | 20 | | | | 4 | |
| Japan | | | 50 | | | | 11 | |
| Canada | | | 11 | | | | 2 | |
| | | | | |
| Total | | | 468 | | | | 100 | |
| | | | | |
Market growth on a CER basis was USA 3.6%, Europe 4% and Rest of World 9.9%.
At 30th September 2009, GSK had two of the world’s top 60 pharmaceutical products. These wereSeretide/Advair and Valtrex.
| | | | | | | | | |
| World market – | | Value | | | % of | |
| top six therapeutic classes | | £bn | | | total | |
| | | | | |
| Central nervous system | | | 74 | | | | 16 | |
| Cardiovascular | | | 68 | | | | 15 | |
| Alimentary tract and metabolic | | | 57 | | | | 12 | |
| Antineoplastic/Immunomodulatory | | | 52 | | | | 11 | |
Anti-infectives (bacterial, viral and fungal)
excluding vaccines | | | 50 | | | | 11 | |
| Respiratory | | | 32 | | | | 7 | |
| | | | | |
| | |
(Note: data based on 12 months to 30th September 2009) |
Data for market share and market growth rates are GSK estimates based on the most recent data from independent external sources, and where appropriate, are valued in Sterling at relevant exchange rates. Figures quoted for product market share reflect sales by GSK and licensees.
World economy
The world economy deteriorated further during the early part of 2009 as the international financial crisis deepened. The economies of many countries contracted during the year, although some emerging markets still showed growth.
Aggressive cuts in official interest rates, fiscal stimulus measures and national initiatives to support the international banking system led to some improvements towards the end of the year. However, the economic recovery during 2010 is likely to remain fragile and uneven, with the emerging markets providing the strongest growth.
Equity prices strengthened during 2009, with the FTSE 100 Index increasing by 22% and the Dow Jones Industrial Average by 19%. Inflationary pressures remained well under control, however, and only a modest increase in inflation is expected in 2010.
The potential healthcare reforms in the USA create some uncertainty for 2010 but our strategy is designed to put the Group in a position to be able to deliver long-term sustainable financial performance despite such uncertainties.
Outlook
In 2009, GSK returned to sales growth. The company’s strategy is delivering and it is confident of its prospects in 2010. GSK believes it is moving to a position where it can deliver its goal of long-term sustainable financial performance.
GSK Annual Report 2009
28
Financial review 20092010
Pharmaceutical turnover
All growth rates included in the review of turnover are at constant exchange rates (CER) unless otherwise stated. The calculation of underlying turnover is described on page 21. Sterling growth rates may be found in the tables of pharmaceutical turnover by therapeutic areas on page 2935 and by geographic region on page 30.segment below.
Pharmaceutical turnover grewdeclined 2% to £23.7£23.4 billion. Pharmaceuticals growth was helpedExcluding pandemic products,AvandiaandValtrex,underlying turnover increased by sales of pandemic related products, includingRelenzaand H1N1 vaccine products. On a regional basis, the USA declined 13% reflecting continued erosion of several products due to generic competition. Strong performances were delivered in Europe (up 9%), Emerging Markets (up 20%) and Asia Pacific/Japan (up 16%). The sales contribution of Stiefel, which was acquired on 22nd July 2009, totalled £248 million.
Pharmaceutical turnover by therapeutic area
GSK turnover grew by 2% in 2009 as the impact of US generic competition to a range of GSK’s products, lowerAvandiasales and a declining HIV business was more than offset by strong growth of key products such asSeretide/Advair,Avodart,Lovaza,Relenzaand the vaccines franchise including the H1N1 pandemic vaccine.
Respiratory
Respiratory sales increased 5% to £7.0 billion.
Seretide/Advairgrew 5% to £5.0 billion, with especially strong growth in Emerging Markets (up 21% to £276 million) and Japan (up 79% to £195 million).Ventolinsales grew 26% to £477 million, driven by its performance in the USA where sales more than doubled to £153 million.Veramystsales rose 72% to £142 million.
Anti-virals
Anti-virals increased 12% to £4.2 billion.
Relenzasales were £720 million in 2009 (2008 – £57 million) reflecting the successful capacity expansion to meet government orders across the world and a strong retail performance in Japan (£191 million). Sales ofValtrexdeclined 8% to £1.3 billion as a result of generic competition to the product in the USA which began in November 2009.
Sales of HIV medicines totalled £1.6 billion (down 7%) for the year.Epzicomsales grew 8% to £546 million but this was more than offset by declines across the rest of the portfolio. ViiV Healthcare, the new specialist HIV company established by GSK and Pfizer, was officially launched on 3rd November 2009.
CNS
CNS sales decreased 44% to £1.9 billion.
The majority of GSK’s CNS franchise is impacted by generic competition in the USA. TheWellbutrin decline of 67% primarily reflected the sale ofWellbutrin XLin the USA to Biovail in the second quarter of 2009.
Cardiovascular and urogenital
Cardiovascular and urogenital sales increased 8% to £2.3 billion.
Continued strong growth of key products such asArixtra, up 29% to £254 million,Avodart, up 16% to £530 million, andLovaza, up 31% to £450 million, were partly offset by generic competition toCoreg4%.
Metabolic
Metabolic sales decreased 14% to £1.2 billion.
Sales ofAvandia, down 16% to £771 million, continued to decline across all regions.Bonviva/Boniva sales declined in the USA by 16% but grew in Europe and the Rest of the World.
Oncology and emesis
Oncology and emesis sales increased 10% to £0.6 billion.
Tyverb/Tykerb, up 45% to £169 million, grew strongly in Europe and the Rest of World following product approvals gained during 2008.Zofrandeclined 11% as a result of generic competition.
Vaccines
Vaccine sales increased 30% to £3.7 billion.
Pandemic vaccine sales of £883 million were recorded during the year, most of which were delivered in the fourth quarter, as GSK partnered with governments to respond to the H1N1 pandemic.
Sales of GSK’s newSynflorixvaccine totalled £73 million, reflecting launches in several markets and the beginning of shipments to the Brazilian Government as part of the 10-year, $1.5 billion agreement signed in August 2009. Other strong contributors to growth for the year includedBoostrix (up 73% to £139 million),Cervarix(up 38% to £187 million) andRotarix(up 50% to £282 million). Partially offsetting these performances, sales ofInfanrix/Pediarixfell 15% to £649 million primarily as a result of the continued impact of increased competition in the DTPa sector in the USA. Hepatitis vaccines sales also fell (down 11% to £665 million) in part due to a competitor product returning to the US market.
GSK Annual Report 2009
29
Financial review 2009
Pharmaceutical turnover by therapeutic area 2009
| | | | | | | | | | | | | | | | | | | | | | | | | | | | | | | | | | | | | | | | | | | | | | | | | | | | | | | | | |
| | | Total | | | USA | | | Europe | | | Rest of World | |
| Therapeutic area/ | | % of | | | 2009 | | | 2008 | | | | | | | Growth | | | 2009 | | | | | | | Growth | | | 2009 | | | | | | | Growth | | | 2009 | | | | | | | Growth | |
| major products | | total | | | £m | | | £m | | | CER% | | | £% | | | £m | | | CER% | | | £% | | | £m | | | CER% | | | £% | | | £m | | | CER% | | | £% | |
| | | | | | | | | | | | | | | | | | | | | | | | | | | | | | | | | | | | | | | | |
Respiratory | | | 29 | | | | 6,977 | | | | 5,817 | | | | 5 | | | | 20 | | | | 3,323 | | | | 3 | | | | 22 | | | | 2,201 | | | | 3 | | | | 11 | | | | 1,453 | | | | 14 | | | | 30 | |
Avamys/Veramyst | | | | | | | 142 | | | | 72 | | | | 72 | | | | 97 | | | | 68 | | | | 2 | | | | 21 | | | | 45 | | | | >100 | | | | >100 | | | | 29 | | | | >100 | | | | >100 | |
Flixonase/Flonase | | | | | | | 171 | | | | 186 | | | | (20 | ) | | | (8 | ) | | | 27 | | | | (56 | ) | | | (48 | ) | | | 43 | | | | (21 | ) | | | (17 | ) | | | 101 | | | | 2 | | | | 23 | |
Flixotide/Flovent | | | | | | | 775 | | | | 677 | | | | – | | | | 14 | | | | 396 | | | | 5 | | | | 25 | | | | 178 | | | | (4 | ) | | | 2 | | | | 201 | | | | (6 | ) | | | 9 | |
Seretide/Advair | | | | | | | 4,977 | | | | 4,137 | | | | 5 | | | | 20 | | | | 2,592 | | | | 1 | | | | 20 | | | | 1,609 | | | | 5 | | | | 14 | | | | 776 | | | | 23 | | | | 39 | |
Serevent | | | | | | | 236 | | | | 263 | | | | (19 | ) | | | (10 | ) | | | 73 | | | | (14 | ) | | | 1 | | | | 116 | | | | (18 | ) | | | (15 | ) | | | 47 | | | | (31 | ) | | | (15 | ) |
Ventolin | | | | | | | 477 | | | | 339 | | | | 26 | | | | 41 | | | | 153 | | | | >100 | | | | >100 | | | | 150 | | | | 1 | | | | 9 | | | | 174 | | | | 2 | | | | 12 | |
Zyrtec | | | | | | | 75 | | | | 38 | | | | 58 | | | | 97 | | | | – | | | | – | | | | – | | | | – | | | | – | | | | – | | | | 75 | | | | 58 | | | | 97 | |
| | | | | | | | | | | | | | | | | | | | | | | | | | | | | | | | | | | | | | | | |
Anti-virals | | | 18 | | | | 4,150 | | | | 3,206 | | | | 12 | | | | 29 | | | | 1,897 | | | | – | | | | 19 | | | | 1,074 | | | | 16 | | | | 26 | | | | 1,179 | | | | 32 | | | | 56 | |
| HIV | | | | | | | 1,605 | | | | 1,513 | | | | (7 | ) | | | 6 | | | | 716 | | | | (6 | ) | | | 12 | | | | 635 | | | | (10 | ) | | | – | | | | 254 | | | | (3 | ) | | | 7 | |
Agenerase, Lexiva | | | | | | | 178 | | | | 160 | | | | (4 | ) | | | 11 | | | | 99 | | | | 1 | | | | 19 | | | | 62 | | | | (8 | ) | | | 2 | | | | 17 | | | | (13 | ) | | | 6 | |
Combivir | | | | | | | 425 | | | | 433 | | | | (13 | ) | | | (2 | ) | | | 187 | | | | (12 | ) | | | 4 | | | | 151 | | | | (17 | ) | | | (9 | ) | | | 87 | | | | (7 | ) | | | – | |
Epivir | | | | | | | 129 | | | | 139 | | | | (19 | ) | | | (7 | ) | | | 48 | | | | (13 | ) | | | 2 | | | | 49 | | | | (24 | ) | | | (16 | ) | | | 32 | | | | (18 | ) | | | (6 | ) |
Epzicom/Kivexa | | | | | | | 546 | | | | 442 | | | | 8 | | | | 24 | | | | 223 | | | | 6 | | | | 25 | | | | 244 | | | | 6 | | | | 17 | | | | 79 | | | | 25 | | | | 44 | |
Trizivir | | | | | | | 201 | | | | 212 | | | | (17 | ) | | | (5 | ) | | | 104 | | | | (17 | ) | | | (2 | ) | | | 82 | | | | (21 | ) | | | (11 | ) | | | 15 | | | | – | | | | 7 | |
Ziagen | | | | | | | 105 | | | | 106 | | | | (13 | ) | | | (1 | ) | | | 51 | | | | (4 | ) | | | 13 | | | | 35 | | | | (14 | ) | | | (3 | ) | | | 19 | | | | (28 | ) | | | (24 | ) |
| |
Valtrex | | | | | | | 1,294 | | | | 1,195 | | | | (8 | ) | | | 8 | | | | 942 | | | | (9 | ) | | | 8 | | | | 160 | | | | – | | | | 11 | | | | 192 | | | | (13 | ) | | | 6 | |
| |
Relenza | | | | | | | 720 | | | | 57 | | | | >100 | | | | >100 | | | | 137 | | | | >100 | | | | >100 | | | | 212 | | | | >100 | | | | >100 | | | | 371 | | | | >100 | | | | >100 | |
Zeffix | | | | | | | 217 | | | | 188 | | | | (1 | ) | | | 15 | | | | 17 | | | | (7 | ) | | | 13 | | | | 29 | | | | (4 | ) | | | 7 | | | | 171 | | | | – | | | | 17 | |
| | | | | | | | | | | | | | | | | | | | | | | | | | | | | | | | | | | | | | | | |
Central nervous system | | | 8 | | | | 1,870 | | | | 2,897 | | | | (44 | ) | | | (35 | ) | | | 651 | | | | (69 | ) | | | (64 | ) | | | 574 | | | | (7 | ) | | | 2 | | | | 645 | | | | 4 | | | | 25 | |
Imigran/Imitrex | | | | | | | 266 | | | | 687 | | | | (65 | ) | | | (61 | ) | | | 123 | | | | (79 | ) | | | (78 | ) | | | 96 | | | | (8 | ) | | | – | | | | 47 | | | | (2 | ) | | | 15 | |
Lamictal | | | | | | | 500 | | | | 926 | | | | (53 | ) | | | (46 | ) | | | 267 | | | | (68 | ) | | | (62 | ) | | | 154 | | | | (4 | ) | | | 5 | | | | 79 | | | | 6 | | | | 16 | |
Requip | | | | | | | 209 | | | | 266 | | | | (30 | ) | | | (21 | ) | | | 26 | | | | (78 | ) | | | (75 | ) | | | 138 | | | | (5 | ) | | | 4 | | | | 45 | | | | 16 | | | | 45 | |
Requip XL | | | | | | | 123 | | | | 43 | | | | >100 | | | | >100 | | | | 32 | | | | >100 | | | | >100 | | | | 89 | | | | >100 | | | | >100 | | | | 2 | | | | – | | | | – | |
Seroxat/Paxil | | | | | | | 523 | | | | 514 | | | | (15 | ) | | | 2 | | | | 42 | | | | (51 | ) | | | (47 | ) | | | 99 | | | | (21 | ) | | | (14 | ) | | | 382 | | | | (5 | ) | | | 19 | |
Treximet | | | | | | | 55 | | | | 25 | | | | 88 | | | | >100 | | | | 55 | | | | 84 | | | | >100 | | | | – | | | | – | | | | – | | | | – | | | | – | | | | – | |
Wellbutrin, Wellbutrin XL | | | | | | | 132 | | | | 342 | | | | (67 | ) | | | (61 | ) | | | 88 | | | | (76 | ) | | | (72 | ) | | | 30 | | | | 50 | | | | 67 | | | | 14 | | | | (7 | ) | | | – | |
| | | | | | | | | | | | | | | | | | | | | | | | | | | | | | | | | | | | | | | | |
Cardiovascular and urogenital | | | 10 | | | | 2,298 | | | | 1,847 | | | | 8 | | | | 24 | | | | 1,415 | | | | 8 | | | | 28 | | | | 583 | | | | 3 | | | | 14 | | | | 300 | | | | 18 | | | | 32 | |
Arixtra | | | | | | | 254 | | | | 170 | | | | 29 | | | | 49 | | | | 141 | | | | 35 | | | | 60 | | | | 95 | | | | 18 | | | | 34 | | | | 18 | | | | 55 | | | | 64 | |
Avodart | | | | | | | 530 | | | | 399 | | | | 16 | | | | 33 | | | | 319 | | | | 11 | | | | 32 | | | | 148 | | | | 13 | | | | 25 | | | | 63 | | | | 51 | | | | 62 | |
Coreg | | | | | | | 172 | | | | 203 | | | | (29 | ) | | | (15 | ) | | | 171 | | | | (28 | ) | | | (15 | ) | | | – | | | | – | | | | – | | | | 1 | | | | (67 | ) | | | (67 | ) |
Fraxiparine | | | | | | | 229 | | | | 226 | | | | (7 | ) | | | 1 | | | | – | | | | – | | | | – | | | | 173 | | | | (10 | ) | | | (3 | ) | | | 56 | | | | 6 | | | | 17 | |
Levitra | | | | | | | 75 | | | | 60 | | | | 7 | | | | 25 | | | | 70 | | | | 4 | | | | 23 | | | | 4 | | | | 33 | | | | 33 | | | | 1 | | | | – | | | | – | |
Lovaza | | | | | | | 450 | | | | 290 | | | | 31 | | | | 55 | | | | 448 | | | | 31 | | | | 55 | | | | – | | | | – | | | | – | | | | 2 | | | | 100 | | | | 100 | |
Vesicare | | | | | | | 104 | | | | 71 | | | | 24 | | | | 46 | | | | 104 | | | | 24 | | | | 46 | | | | – | | | | – | | | | – | | | | – | | | | – | | | | – | |
Volibris | | | | | | | 19 | | | | 2 | | | | >100 | | | | >100 | | | | – | | | | – | | | | – | | | | 18 | | | | >100 | | | | >100 | | | | 1 | | | | – | | | | – | |
| | | | | | | | | | | | | | | | | | | | | | | | | | | | | | | | | | | | | | | | |
Metabolic | | | 5 | | | | 1,181 | | | | 1,191 | | | | (14 | ) | | | (1 | ) | | | 581 | | | | (17 | ) | | | (2 | ) | | | 275 | | | | (15 | ) | | | (6 | ) | | | 325 | | | | (8 | ) | | | 6 | |
Avandiaproducts | | | | | | | 771 | | | | 805 | | | | (16 | ) | | | (4 | ) | | | 425 | | | | (17 | ) | | | (2 | ) | | | 171 | | | | (21 | ) | | | (14 | ) | | | 175 | | | | (9 | ) | | | 1 | |
Avandia | | | | | | | 462 | | | | 512 | | | | (21 | ) | | | (10 | ) | | | 276 | | | | (22 | ) | | | (8 | ) | | | 67 | | | | (24 | ) | | | (18 | ) | | | 119 | | | | (18 | ) | | | (9 | ) |
Avandamet | | | | | | | 268 | | | | 256 | | | | (8 | ) | | | 5 | | | | 122 | | | | (6 | ) | | | 12 | | | | 99 | | | | (19 | ) | | | (11 | ) | | | 47 | | | | 19 | | | | 31 | |
Bonviva/Boniva | | | | | | | 255 | | | | 237 | | | | (7 | ) | | | 8 | | | | 155 | | | | (16 | ) | | | (1 | ) | | | 89 | | | | 7 | | | | 20 | | | | 11 | | | | 57 | | | | 57 | |
| | | | | | | | | | | | | | | | | | | | | | | | | | | | | | | | | | | | | | | | |
Anti-bacterials | | | 7 | | | | 1,592 | | | | 1,429 | | | | 2 | | | | 11 | | | | 173 | | | | (16 | ) | | | (1 | ) | | | 662 | | | | (4 | ) | | | 4 | | | | 757 | | | | 13 | | | | 22 | |
Augmentin | | | | | | | 667 | | | | 587 | | | | 4 | | | | 14 | | | | 45 | | | | (22 | ) | | | (8 | ) | | | 295 | | | | – | | | | 8 | | | | 327 | | | | 14 | | | | 23 | |
| | | | | | | | | | | | | | | | | | | | | | | | | | | | | | | | | | | | | | | | |
Oncology and emesis | | | 3 | | | | 629 | | | | 496 | | | | 10 | | | | 27 | | | | 308 | | | | 7 | | | | 27 | | | | 204 | | | | 10 | | | | 21 | | | | 117 | | | | 23 | | | | 39 | |
Hycamtin | | | | | | | 172 | | | | 140 | | | | 7 | | | | 23 | | | | 100 | | | | 4 | | | | 23 | | | | 59 | | | | 10 | | | | 20 | | | | 13 | | | | 20 | | | | 30 | |
Promacta | | | | | | | 13 | | | | – | | | | – | | | | – | | | | 13 | | | | – | | | | – | | | | – | | | | – | | | | – | | | | – | | | | – | | | | – | |
Tyverb/Tykerb | | | | | | | 169 | | | | 102 | | | | 45 | | | | 66 | | | | 54 | | | | (4 | ) | | | 15 | | | | 75 | | | | 62 | | | | 79 | | | | 40 | | | | >100 | | | | >100 | |
Zofran | | | | | | | 109 | | | | 110 | | | | (11 | ) | | | (1 | ) | | | 9 | | | | >100 | | | | >100 | | | | 52 | | | | (24 | ) | | | (17 | ) | | | 48 | | | | (5 | ) | | | 9 | |
| | | | | | | | | | | | | | | | | | | | | | | | | | | | | | | | | | | | | | | | |
Vaccines | | | 16 | | | | 3,706 | | | | 2,539 | | | | 30 | | | | 46 | | | | 815 | | | | 9 | | | | 30 | | | | 1,744 | | | | 37 | | | | 51 | | | | 1,147 | | | | 37 | | | | 52 | |
Boostrix | | | | | | | 139 | | | | 70 | | | | 73 | | | | 99 | | | | 73 | | | | 77 | | | | >100 | | | | 40 | | | | 38 | | | | 54 | | | | 26 | | | | >100 | | | | >100 | |
Cervarix | | | | | | | 187 | | | | 125 | | | | 38 | | | | 50 | | | | 4 | | | | – | | | | – | | | | 138 | | | | 23 | | | | 33 | | | | 45 | | | | 100 | | | | >100 | |
Fluarix/FluLaval | | | | | | | 211 | | | | 215 | | | | (13 | ) | | | (2 | ) | | | 73 | | | | (27 | ) | | | (14 | ) | | | 71 | | | | (18 | ) | | | (9 | ) | | | 67 | | | | 17 | | | | 29 | |
| Flu pandemic | | | | | | | 883 | | | | 66 | | | | >100 | | | | >100 | | | | 187 | | | | >100 | | | | >100 | | | | 525 | | | | >100 | | | | >100 | | | | 171 | | | | >100 | | | | >100 | |
| Hepatitis (Engerix/ | | | | | | | 665 | | | | 665 | | | | (11 | ) | | | – | | | | 257 | | | | (21 | ) | | | (7 | ) | | | 262 | | | | (8 | ) | | | – | | | | 146 | | | | 2 | | | | 15 | |
Fendrix, Havrix, Twinrix) | | | | | | | | | | | | | | | | | | | | | | | | | | | | | | | | | | | | | | | | | | | | | | | | | | | | | | | | |
Infanrix, Pediarix | | | | | | | 649 | | | | 682 | | | | (15 | ) | | | (5 | ) | | | 134 | | | | (47 | ) | | | (37 | ) | | | 406 | | | | (3 | ) | | | 8 | | | | 109 | | | | 5 | | | | 17 | |
Rotarix | | | | | | | 282 | | | | 167 | | | | 50 | | | | 69 | | | | 76 | | | | >100 | | | | >100 | | | | 53 | | | | 14 | | | | 23 | | | | 153 | | | | 33 | | | | 49 | |
Synflorix | | | | | | | 73 | | | | – | | | | – | | | | – | | | | – | | | | – | | | | – | | | | 32 | | | | – | | | | – | | | | 41 | | | | – | | | | – | |
| | | | | | | | | | | | | | | | | | | | | | | | | | | | | | | | | | | | | | | | |
Other | | | 4 | | | | 1,063 | | | | 959 | | | | 1 | | | | 11 | | | | 17 | | | | – | | | | 6 | | | | 364 | | | | 7 | | | | 13 | | | | 682 | | | | (2 | ) | | | 10 | |
| | | | | | | | | | | | | | | | | | | | | | | | | | | | | | | | | | | | | | | | |
| | | | | | | | 23,466 | | | | 20,381 | | | | 1 | | | | 15 | | | | 9,180 | | | | (13 | ) | | | 3 | | | | 7,681 | | | | 9 | | | | 18 | | | | 6,605 | | | | 16 | | | | 32 | |
| | | | | | | | | | | | | | | | | | | | | | | | | | | | | | | | | | | | | | | | |
| Stiefel products | | | | | | | 248 | | | | | | | | – | | | | – | | | | | | | | | | | | | | | | | | | | | | | | | | | | | | | | | |
| | | | | | | | | | | | | | | | | | | | | | | | | | | | | | | | | | | | | | | | | | | | | | | |
| | | | 100 | | | | 23,714 | | | | | | | | 2 | | | | 16 | | | | | | | | | | | | | | | | | | | | | | | | | | | | | | | | | | | | | |
| | | | | | | | | | | | | | | | | | | | | | | | | | | | | | | | | | | | | | | | | | | | | | | | | | | | |
| | |
CER% represents growth at constant exchange rates. £% represents growth at actual exchange rates. Turnover by quarter is given in the financial record on pages 180 to 183. |
GSK Annual Report 2009
30
Financial review 2009
RegionalSegmental analysis
The turnover reported in the table below represents sales invoiced by GSK’s local entity to its customers in the local market plus co-promotion income within each market.
| | | | | | | | | | | | | | | | | |
| | | 2009 | | | 2008 | | | Growth* | |
| | | £m | | | £m | | | CER% | | | £% | |
| | | | | | | | | | |
| USA | | | 9,180 | | | | 8,894 | | | | (13 | ) | | | 3 | |
| Europe | | | 7,681 | | | | 6,483 | | | | 9 | | | | 18 | |
| Emerging Markets | | | 2,973 | | | | 2,290 | | | | 20 | | | | 30 | |
| Asia Pacific/Japan | | | 2,700 | | | | 1,918 | | | | 16 | | | | 41 | |
Other trading‡ | | | 1,180 | | | | 796 | | | | 31 | | | | 48 | |
| | | | | | | | | | |
| | | | 23,714 | | | | 20,381 | | | | 2 | | | | 16 | |
| | | | | | | | | | |
| | |
* | | CER% represents growth at constant exchange rates. £% represents growth at actual exchange rates. |
|
‡ | | Including Stiefel |
USA
Sales in the USA declined 13% to £9.2 billion, principally reflecting continued decline ofAvandia(down 22%), competition toInfanrix/Pediarix(down 47%), a return to market of a competitor to the Hepatitis franchise (down 21%) and generic competition to significant products such asLamictal(down 68%),Imigran(down 79%),Valtrex(down 9%),Requip(down 78%) andCoreg(down 28%). In addition,Wellbutrin XL(down 82%), was sold to Biovail in Q2 2009. These declines were partly offset by significant sales ofRelenzaand pandemic vaccines, a doubling ofVentolinsales, good growth ofLovaza(up 31%) and contributions from recently launched products such asBoostrixandRotarix.
Europe
Sales in Europe increased 9% to £7.7 billion with continued growth ofSeretideandRelenzaand particularly strong vaccines growth, driven by pandemic vaccine, offsetting the impact of generic competition to a number of products and continued price cuts from governments across the region.
Emerging Markets
Sales in Emerging Markets increased 20% to £3.0 billion with strong growth across the region and all therapeutic areas, helped by the acquisitions of the UCB and BMS businesses in different countries of the region.
Asia Pacific/Japan
Sales in Asia Pacific/Japan grew 16% to £2.7 billion reflecting continuedSeretide/Advairgrowth, strongRelenzasales, particularly to the retail market in Japan, and strong vaccines growth.
Consumer Healthcare turnover
| | | | | | | | | | | | | | | | | | | | | |
| | | % of | | | 2009 | | | 2008 | | | Growth* | |
| | | total | | | £m | | | £m | | | CER% | | | £% | |
| | | | | | | | | | | | | |
Over-the-counter medicines | | | 50 | | | | 2,319 | | | | 1,935 | | | | 8 | | | | 20 | |
alli | | | | | | | 203 | | | | 75 | | | | >100 | | | | >100 | |
Breathe Right | | | | | | | 92 | | | | 81 | | | | (1 | ) | | | 14 | |
| Cold sore franchise | | | | | | | 96 | | | | 89 | | | | (3 | ) | | | 8 | |
| Nicotine replacement therapy | | | | | | | 339 | | | | 299 | | | | (1 | ) | | | 13 | |
Panadol franchise | | | | | | | 393 | | | | 324 | | | | 10 | | | | 21 | |
Tums | | | | | | | 106 | | | | 91 | | | | (1 | ) | | | 16 | |
| | | | | | | | | | | | | | | | | | | | | |
Oral healthcare | | | 32 | | | | 1,484 | | | | 1,240 | | | | 7 | | | | 20 | |
Aquafresh franchise | | | | | | | 496 | | | | 452 | | | | (1 | ) | | | 10 | |
Biotene | | | | | | | 26 | | | | 1 | | | | >100 | | | | >100 | |
| Denture care | | | | | | | 336 | | | | 271 | | | | 8 | | | | 24 | |
Sensodyne franchise | | | | | | | 457 | | | | 363 | | | | 13 | | | | 26 | |
| | | | | | | | | | | | | | | | | | | | | |
Nutritional healthcare | | | 18 | | | | 851 | | | | 796 | | | | 3 | | | | 7 | |
Lucozade | | | | | | | 376 | | | | 382 | | | | (3 | ) | | | (2 | ) |
Horlicks | | | | | | | 255 | | | | 204 | | | | 17 | | | | 25 | |
Ribena | | | | | | | 160 | | | | 161 | | | | (4 | ) | | | (1 | ) |
| | | | | | | | | | | | | |
| | | | 100 | | | | 4,654 | | | | 3,971 | | | | 7 | | | | 17 | |
| | | | | | | | | | | | | |
| | | | | | | | | | | | | | | | | |
| | | | | | | | | | | | | |
| | | 2010 | | | 2009 | | | Growth* | |
| | | £m | | | £m | | | CER% | | | £% | |
| USA | | | 7,648 | | | | 8,578 | | | | (11 | ) | | | (11 | ) |
| Europe | | | 6,548 | | | | 7,087 | | | | (6 | ) | | | (8 | ) |
| Emerging Markets | | | 3,556 | | | | 2,895 | | | | 22 | | | | 23 | |
| Asia Pacific/Japan | | | 3,102 | | | | 2,628 | | | | 9 | | | | 18 | |
| ViiV Healthcare | | | 1,566 | | | | 1,605 | | | | (3 | ) | | | (2 | ) |
| Other | | | 962 | | | | 901 | | | | (1 | ) | | | 7 | |
| | | | | | | | | | | |
| | | | 23,382 | | | | 23,694 | | | | (2 | ) | | | (1 | ) |
| | | | | | | | | | | |
| | |
| * | | CER% represents growth at constant exchange rates. £% represents growth at actual exchange rates. Turnover by quarter is given in the financial record on pages 184188 to 185.192. |
Sales in the USA declined 11% to £7.6 billion, primarily due to generic competition toValtrex,a significant reduction in sales of pandemic related products and lower sales ofAvandia. Excluding these products, underlying turnover grew 3%, despite the discontinuation of GSK’s promotion ofBoniva,the sale ofWellbutrin XLin May 2009, and the impact of US healthcare reform across the product range. New products (excluding pandemic vaccines) launched since 2007 grew 29% and contributed 8% of 2010 sales.
Europe pharmaceuticals sales declined 6% to £6.5 billion, primarily due to the impact of a significant reduction in sales of pandemic related products, generic competition toValtrexand lower sales ofAvandia.Excluding these products, underlying sales were flat, reflecting the impact of government austerity measures.
Emerging Markets pharmaceutical sales grew 22% to £3.6 billion, with strong growth across most product categories and also helped by pandemic related product sales of £227 million (2009 – £89 million). Asia Pacific/Japan pharmaceutical sales grew 9% to £3.1 billion. Excluding pandemic related products,ValtrexandAvandia,underlying sales grew 20% in Emerging Markets and 7% in Asia Pacific/Japan.
Pharmaceutical turnover by therapeutic area
Pharmaceutical turnover declined by 2% in 2010 as the impact of generic competition toValtrex, lower Avandiaand pandemic product sales was partly offset by growth of key products such asSeretide/Advair, Avamys/Veramyst, Avodart, Lovaza, Tyverb/Tykerb, Ventolinand the vaccines franchise.
Respiratory
Respiratory sales increased 3% to £7.2 billion.
Seretide/Advairsales grew 2% to £5.1 billion, with strong growth in Japan, up 17% to £246 million and Emerging Markets, up 16% to £328 million. Sales in the USA were level at £2.6 billion and grew 2% in Europe to £1.6 billion.
Several other respiratory products delivered growth includingAvamys/Veramyst,up 33% to £193 million,Ventolin,up 8% to £522 million andFlovent,up 2% to £804 million.
Anti-virals
Anti-virals decreased 56% to £1.1 billion.
Relenzasales were £121 million (2009 – £720 million), down 84%, against the previous year where significant government pandemic orders were received.Valtrexsales declined 60% to £532 million reflecting generic competition in the USA and Europe.
Central nervous system (CNS)
CNS sales decreased 8% to £1.8 billion.
The majority of GSK’s CNS franchise is impacted by generic competition in the USA. TheWellbutrin decline of 39% primarily reflected the sale ofWellbutrin XLin the USA to Biovail in the second quarter of 2009.
Cardiovascular and urogenital
Cardiovascular and urogenital sales increased 11% to £2.6 billion, reflecting continued strong growth of key products suchas Arixtra,up 19% to £301 million,Avodart,up 18% to £629 million, andLovaza,up 17% to £530 million.
Metabolic
Metabolic sales decreased 44% to £0.7 billion.
Avandiaproduct sales declined by 44% to £440 million. On 23rd September 2010 the European Medicines Agency suspended marketing authorisation for all rosiglitazone containing products, includingAvandia,and the US Food and Drug Administration announced additional measures to ensure the benefits ofAvandiacontinue to outweigh its risks, including a Risk Evaluation and Mitigation Strategy (REMS) programme. As a result, GSK expects global sales of rosiglitazone containing products, includingAvandia,to be minimal in the future.
Oncology and emesis
Oncology and emesis sales increased 9% to £0.7 billion.
Tyverb/Tykerb,up 34% to £227 million, grew strongly in all segments. Newly launched oncology productsVotrient, ArzerraandPromactadelivered sales of £38 million, £31 million and £31 million, respectively.
Vaccines
Total vaccine sales grew 15% to £4.3 billion, including £1.2 billion of pandemic vaccine sales (2009 – £883 million). Excluding flu pandemic vaccine sales, growth was 10%. Several new vaccines contributed to this growth includingSynflorix,more than doubling to £221 million,Boostrix,up 29% to £181 million andCervarix,up 26% to £242 million. Sales of Hepatitis vaccines grew 7% to £720 million,Infanrix/Pediarixgrew 8% to £700 million and seasonal flu sales grew 14% to £241 million.Rotarixsales were down 18% to £235 million, as the product continues to recover market share lost following its temporary suspension from several markets earlier in the year.
Dermatologicals
Dermatology sales were £1.1 billion, including heritage GSK products and those acquired through business acquisitions, principally Stiefel in July 2009. The estimated sales growth in 2010 for the business on a pro-forma basis, excluding 2010 acquisitions, was approximately 6%. In addition, GSK’s heritage consumer dermatology portfolio, reported within Consumer Healthcare, contributed sales of £256 million, up 8%.
GSK Annual Report 2010
35
Financial review 2010
Pharmaceutical turnover by therapeutic area 2010
| | | | | | | | | | | | | | | | | | | | | | | | | | | | | | | | | | | | | | | | | | | | | | | | | | | | | | | | | | | | | | | | | |
| | | | | | | | | | | | | | |
| Total | | | USA | | | Europe | | | Emerging Markets | | | Rest of World | |
| Therapeutic area/ | | 2010 | | | 2009 | | | | | | | Growth | | | 2010 | | | | | | | Growth | | | 2010 | | | | | | | Growth | | | 2010 | | | | | | | Growth | | | 2010 | | | | | | | Growth | |
| major products | | £m | | | £m | | | CER% | | | £% | | | £m | | | CER% | | | £% | | | £m | | | CER% | | | £% | | | £m | | | CER% | | | £% | | | £m | | | CER% | | | £% | |
Respiratory | | | 7,238 | | | | 6,977 | | | | 3 | | | | 4 | | | | 3,394 | | | | 1 | | | | 2 | | | | 2,149 | | | | – | | | | (2 | ) | | | 616 | | | | 19 | | | | 21 | | | | 1,079 | | | | 4 | | | | 14 | |
Avamys/Veramyst | | | 193 | | | | 142 | | | | 33 | | | | 36 | | | | 69 | | | | – | | | | 1 | | | | 56 | | | | 27 | | | | 24 | | | | 31 | | | | >100 | | | | >100 | | | | 37 | | | | 94 | | | | >100 | |
Flixonase/Flonase | | | 164 | | | | 171 | | | | (5 | ) | | | (4 | ) | | | 37 | | | | 37 | | | | 37 | | | | 40 | | | | (7 | ) | | | (7 | ) | | | 39 | | | | 11 | | | | 11 | | | | 48 | | | | (30 | ) | | | (27 | ) |
Flixotide/Flovent | | | 804 | | | | 775 | | | | 2 | | | | 4 | | | | 431 | | | | 8 | | | | 9 | | | | 159 | | | | (9 | ) | | | (11 | ) | | | 48 | | | | 38 | | | | 41 | | | | 166 | | | | (10 | ) | | | (1 | ) |
Seretide/Advair | | | 5,139 | | | | 4,977 | | | | 2 | | | | 3 | | | | 2,604 | | | | – | | | | – | | | | 1,601 | | | | 2 | | | | – | | | | 328 | | | | 16 | | | | 19 | | | | 606 | | | | 10 | | | | 21 | |
Serevent | | | 201 | | | | 236 | | | | (16 | ) | | | (15 | ) | | | 64 | | | | (12 | ) | | | (12 | ) | | | 98 | | | | (16 | ) | | | (16 | ) | | | 2 | | | | (33 | ) | | | (33 | ) | | | 37 | | | | (23 | ) | | | (16 | ) |
Ventolin | | | 522 | | | | 477 | | | | 8 | | | | 9 | | | | 179 | | | | 16 | | | | 17 | | | | 142 | | | | (3 | ) | | | (5 | ) | | | 112 | | | | 19 | | | | 20 | | | | 89 | | | | (2 | ) | | | 10 | |
Zyrtec | | | 82 | | | | 75 | | | | 4 | | | | 9 | | | | – | | | | – | | | | – | | | | – | | | | – | | | | – | | | | 14 | | | | – | | | | – | | | | 68 | | | | 5 | | | | 11 | |
| | | | | | | | | | | | | | | | | | | | | | | | | | | | | | | | | | | | | | | | | | | | | | | |
Anti-virals | | | 1,086 | | | | 2,416 | | | | (56 | ) | | | (55 | ) | | | 370 | | | | (68 | ) | | | (68 | ) | | | 109 | | | | (73 | ) | | | (73 | ) | | | 223 | | | | (3 | ) | | | (1 | ) | | | 384 | | | | (44 | ) | | | (39 | ) |
Hepsera | | | 128 | | | | 114 | | | | 6 | | | | 12 | | | | – | | | | – | | | | – | | | | 1 | | | | – | | | | – | | | | 58 | | | | 10 | | | | 14 | | | | 69 | | | | 2 | | | | 10 | |
Relenza | | | 121 | | | | 720 | | | | (84 | ) | | | (83 | ) | | | 43 | | | | (69 | ) | | | (69 | ) | | | 6 | | | | (97 | ) | | | (97 | ) | | | 1 | | | | (97 | ) | | | (97 | ) | | | 71 | | | | (80 | ) | | | (79 | ) |
Valtrex | | | 532 | | | | 1,294 | | | | (60 | ) | | | (59 | ) | | | 252 | | | | (73 | ) | | | (73 | ) | | | 68 | | | | (56 | ) | | | (58 | ) | | | 28 | | | | 8 | | | | 8 | | | | 184 | | | | 2 | | | | 11 | |
Zeffix | | | 233 | | | | 217 | | | | 4 | | | | 7 | | | | 13 | | | | (24 | ) | | | (24 | ) | | | 26 | | | | (10 | ) | | | (10 | ) | | | 136 | | | | 17 | | | | 18 | | | | 58 | | | | (5 | ) | | | 4 | |
| | | | | | | | | | | | | | | | | | | | | | | | | | | | | | | | | | | | | | | | | | | | | | | |
Central nervous | | | 1,753 | | | | 1,870 | | | | (8 | ) | | | (6 | ) | | | 505 | | | | (23 | ) | | | (22 | ) | | | 540 | | | | (4 | ) | | | (6 | ) | | | 223 | | | | 17 | | | | 17 | | | | 485 | | | | (2 | ) | | | 7 | |
system | | | | | | | | | | | | | | | | | | | | | | | | | | | | | | | | | | | | | | | | | | | | | | | | | | | | | | | | | | | | | | | | |
Imigran/Imitrex | | | 212 | | | | 266 | | | | (21 | ) | | | (20 | ) | | | 75 | | | | (39 | ) | | | (39 | ) | | | 85 | | | | (10 | ) | | | (11 | ) | | | 5 | | | | – | | | | – | | | | 47 | | | | 2 | | | | 12 | |
Lamictal | | | 504 | | | | 500 | | | | 1 | | | | 1 | | | | 257 | | | | (4 | ) | | | (4 | ) | | | 143 | | | | (6 | ) | | | (7 | ) | | | 57 | | | | 23 | | | | 19 | | | | 47 | | | | 42 | | | | 52 | |
Requip | | | 233 | | | | 209 | | | | 11 | | | | 11 | | | | 44 | | | | 69 | | | | 69 | | | | 137 | | | | 2 | | | | (1 | ) | | | 3 | | | | 50 | | | | 50 | | | | 49 | | | | 2 | | | | 14 | |
Seroxat/Paxil | | | 482 | | | | 523 | | | | (12 | ) | | | (8 | ) | | | 27 | | | | (36 | ) | | | (36 | ) | | | 82 | | | | (15 | ) | | | (17 | ) | | | 73 | | | | (3 | ) | | | (4 | ) | | | 300 | | | | (9 | ) | | | (2 | ) |
Treximet | | | 56 | | | | 55 | | | | 2 | | | | 2 | | | | 55 | | | | 2 | | | | – | | | | – | | | | – | | | | – | | | | – | | | | – | | | | – | | | | 1 | | | | – | | | | – | |
Wellbutrin | | | 81 | | | | 132 | | | | (39 | ) | | | (39 | ) | | | 24 | | | | (73 | ) | | | (73 | ) | | | 39 | | | | 33 | | | | 30 | | | | 13 | | | | 30 | | | | 30 | | | | 5 | | | | (25 | ) | | | 25 | |
| | | | | | | | | | | | | | | | | | | | | | | | | | | | | | | | | | | | | | | | | | | | | | | |
Cardiovascular | | | 2,570 | | | | 2,298 | | | | 11 | | | | 12 | | | | 1,571 | | | | 10 | | | | 11 | | | | 610 | | | | 7 | | | | 5 | | | | 134 | | | | 25 | | | | 24 | | | | 255 | | | | 23 | | | | 33 | |
and urogenital | | | | | | | | | | | | | | | | | | | | | | | | | | | | | | | | | | | | | | | | | | | | | | | | | | | | | | | | | | | | | | | | |
Arixtra | | | 301 | | | | 254 | | | | 19 | | | | 19 | | | | 177 | | | | 25 | | | | 26 | | | | 99 | | | | 8 | | | | 4 | | | | 10 | | | | 43 | | | | 43 | | | | 15 | | | | 18 | | | | 36 | |
Avodart | | | 629 | | | | 530 | | | | 18 | | | | 19 | | | | 337 | | | | 5 | | | | 6 | | | | 175 | | | | 22 | | | | 18 | | | | 33 | | | | 50 | | | | 50 | | | | 84 | | | | 90 | | | | >100 | |
Coreg | | | 171 | | | | 172 | | | | (1 | ) | | | (1 | ) | | | 170 | | | | (1 | ) | | | (1 | ) | | | – | | | | – | | | | – | | | | – | | | | – | | | | – | | | | 1 | | | | – | | | | – | |
Fraxiparine | | | 222 | | | | 229 | | | | (2 | ) | | | (3 | ) | | | – | | | | – | | | | – | | | | 154 | | | | (9 | ) | | | (11 | ) | | | 55 | | | | 29 | | | | 31 | | | | 13 | | | | (7 | ) | | | (7 | ) |
Lovaza | | | 530 | | | | 450 | | | | 17 | | | | 18 | | | | 528 | | | | 17 | | | | 18 | | | | – | | | | – | | | | – | | | | – | | | | – | | | | – | | | | 2 | | | | – | | | | – | |
Vesicare | | | 114 | | | | 104 | | | | 9 | | | | 10 | | | | 113 | | | | 8 | | | | 9 | | | | – | | | | – | | | | – | | | | – | | | | – | | | | – | | | | 1 | | | | – | | | | – | |
Volibris | | | 46 | | | | 19 | | | | >100 | | | | >100 | | | | – | | | | – | | | | – | | | | 40 | | | | >100 | | | | >100 | | | | 1 | | | | – | | | | – | | | | 5 | | | | >100 | | | | >100 | |
| | | | | | | | | | | | | | | | | | | | | | | | | | | | | | | | | | | | | | | | | | | | | | | |
Metabolic | | | 678 | | | | 1,181 | | | | (44 | ) | | | (43 | ) | | | 238 | | | | (59 | ) | | | (59 | ) | | | 166 | | | | (38 | ) | | | (40 | ) | | | 91 | | | | (24 | ) | | | (24 | ) | | | 183 | | | | (17 | ) | | | (11 | ) |
Avandiaproducts | | | 440 | | | | 771 | | | | (44 | ) | | | (43 | ) | | | 237 | | | | (45 | ) | | | (44 | ) | | | 88 | | | | (48 | ) | | | (49 | ) | | | 42 | | | | (43 | ) | | | (45 | ) | | | 73 | | | | (32 | ) | | | (26 | ) |
Bonviva/Boniva | | | 78 | | | | 255 | | | | (69 | ) | | | (69 | ) | | | – | | | | (100 | ) | | | (100 | ) | | | 64 | | | | (26 | ) | | | (28 | ) | | | 2 | | | | – | | | | – | | | | 12 | | | | 22 | | | | 33 | |
| | | | | | | | | | | | | | | | | | | | | | | | | | | | | | | | | | | | | | | | | | | | | | | |
Anti-bacterials | | | 1,396 | | | | 1,457 | | | | (4 | ) | | | (4 | ) | | | 75 | | | | (28 | ) | | | (27 | ) | | | 536 | | | | (14 | ) | | | (16 | ) | | | 609 | | | | 10 | | | | 10 | | | | 176 | | | | 1 | | | | 7 | |
Augmentin | | | 625 | | | | 667 | | | | (6 | ) | | | (6 | ) | | | 11 | | | | (76 | ) | | | (76 | ) | | | 240 | | | | (17 | ) | | | (19 | ) | | | 291 | | | | 15 | | | | 14 | | | | 83 | | | | 10 | | | | 17 | |
| | | | | | | | | | | | | | | | | | | | | | | | | | | | | | | | | | | | | | | | | | | | | | | |
Oncology and | | | 688 | | | | 629 | | | | 9 | | | | 9 | | | | 350 | | | | 13 | | | | 14 | | | | 201 | | | | 1 | | | | (1 | ) | | | 62 | | | | 7 | | | | 9 | | | | 75 | | | | 17 | | | | 25 | |
emesis | | | | | | | | | | | | | | | | | | | | | | | | | | | | | | | | | | | | | | | | | | | | | | | | | | | | | | | | | | | | | | | | |
Arzerra | | | 31 | | | | 3 | | | | >100 | | | | >100 | | | | 26 | | | | >100 | | | | >100 | | | | 4 | | | | – | | | | – | | | | – | | | | – | | | | – | | | | 1 | | | | – | | | | – | |
Hycamtin | | | 144 | | | | 172 | | | | (16 | ) | | | (16 | ) | | | 83 | | | | (17 | ) | | | (17 | ) | | | 48 | | | | (17 | ) | | | (19 | ) | | | 7 | | | | 17 | | | | 17 | | | | 6 | | | | (14 | ) | | | (14 | ) |
Promacta | | | 31 | | | | 13 | | | | >100 | | | | >100 | | | | 25 | | | | 92 | | | | 92 | | | | 5 | | | | – | | | | – | | | | – | | | | – | | | | – | | | | 1 | | | | – | | | | – | |
Tyverb/Tykerb | | | 227 | | | | 169 | | | | 34 | | | | 34 | | | | 70 | | | | 28 | | | | 30 | | | | 94 | | | | 28 | | | | 25 | | | | 30 | | | | 36 | | | | 36 | | | | 33 | | | | 72 | | | | 83 | |
Votrient | | | 38 | | | | 1 | | | | >100 | | | | >100 | | | | 33 | | | | >100 | | | | >100 | | | | 4 | | | | – | | | | – | | | | – | | | | – | | | | – | | | | 1 | | | | – | | | | – | |
| | | | | | | | | | | | | | | | | | | | | | | | | | | | | | | | | | | | | | | | | | | | | | | |
Vaccines | | | 4,326 | | | | 3,706 | | | | 15 | | | | 17 | | | | 763 | | | | (7 | ) | | | (6 | ) | | | 1,681 | | | | (2 | ) | | | (4 | ) | | | 927 | | | | 38 | | | | 39 | | | | 955 | | | | 85 | | | | 100 | |
Boostrix | | | 181 | | | | 139 | | | | 29 | | | | 30 | | | | 110 | | | | 51 | | | | 51 | | | | 43 | | | | 10 | | | | 8 | | | | 9 | | | | 29 | | | | 29 | | | | 19 | | | | (16 | ) | | | – | |
Cervarix | | | 242 | | | | 187 | | | | 26 | | | | 29 | | | | 13 | | | | >100 | | | | >100 | | | | 116 | | | | (14 | ) | | | (16 | ) | | | 25 | | | | 4 | | | | 9 | | | | 88 | | | | >100 | | | | >100 | |
Fluarix, FluLaval | | | 241 | | | | 211 | | | | 14 | | | | 14 | | | | 110 | | | | 51 | | | | 51 | | | | 63 | | | | (8 | ) | | | (11 | ) | | | 40 | | | | (5 | ) | | | (5 | ) | | | 28 | | | | – | | | | 12 | |
| Flu Pandemic | | | 1,192 | | | | 883 | | | | 31 | | | | 35 | | | | 1 | | | | (99 | ) | | | (99 | ) | | | 488 | | | | (6 | ) | | | (7 | ) | | | 226 | | | | >100 | | | | >100 | | | | 477 | | | | >100 | | | | >100 | |
| Hepatitis | | | 720 | | | | 665 | | | | 7 | | | | 8 | | | | 307 | | | | 19 | | | | 19 | | | | 242 | | | | (6 | ) | | | (8 | ) | | | 88 | | | | 8 | | | | 10 | | | | 83 | | | | 15 | | | | 26 | |
Infanrix, Pediarix | | | 700 | | | | 649 | | | | 8 | | | | 8 | | | | 146 | | | | 8 | | | | 9 | | | | 429 | | | | 8 | | | | 6 | | | | 50 | | | | 13 | | | | 11 | | | | 75 | | | | 3 | | | | 17 | |
Rotarix | | | 235 | | | | 282 | | | | (18 | ) | | | (17 | ) | | | 74 | | | | (4 | ) | | | (3 | ) | | | 38 | | | | (28 | ) | | | (28 | ) | | | 102 | | | | (22 | ) | | | (21 | ) | | | 21 | | | | (17 | ) | | | (13 | ) |
Synflorix | | | 221 | | | | 73 | | | | >100 | | | | >100 | | | | – | | | | – | | | | – | | | | 43 | | | | 38 | | | | 34 | | | | 149 | | | | >100 | | | | >100 | | | | 29 | | | | >100 | | | | >100 | |
| | | | | | | | | | | | | | | | | | | | | | | | | | | | | | | | | | | | | | | | | | | | | | | |
Dermatologicals | | | 1,087 | | | | 707 | | | | 51 | | | | 54 | | | | 358 | | | | 70 | | | | 70 | | | | 246 | | | | 48 | | | | 45 | | | | 286 | | | | 52 | | | | 56 | | | | 197 | | | | 26 | | | | 37 | |
Bactroban | | | 119 | | | | 123 | | | | (3 | ) | | | (3 | ) | | | 51 | | | | (14 | ) | | | (14 | ) | | | 27 | | | | 8 | | | | 4 | | | | 28 | | | | 7 | | | | 4 | | | | 13 | | | | – | | | | 18 | |
Dermovate | | | 74 | | | | – | | | | – | | | | – | | | | – | | | | – | | | | – | | | | 19 | | | | – | | | | – | | | | 30 | | | | – | | | | – | | | | 25 | | | | – | | | | – | |
Duac | | | 116 | | | | 46 | | | | >100 | | | | >100 | | | | 67 | | | | >100 | | | | >100 | | | | 23 | | | | >100 | | | | >100 | | | | 11 | | | | >100 | | | | >100 | | | | 15 | | | | >100 | | | | >100 | |
Soriatane | | | 71 | | | | 28 | | | | >100 | | | | >100 | | | | 71 | | | | >100 | | | | >100 | | | | – | | | | – | | | | – | | | | – | | | | – | | | | – | | | | – | | | | – | | | | – | |
Zovirax | | | 152 | | | | 129 | | | | 15 | | | | 18 | | | | 53 | | | | >100 | | | | >100 | | | | 27 | | | | (10 | ) | | | (10 | ) | | | 26 | | | | 9 | | | | 13 | | | | 46 | | | | (14 | ) | | | (8 | ) |
| | | | | | | | | | | | | | | | | | | | | | | | | | | | | | | | | | | | | | | | | | | | | | | |
Other | | | 994 | | | | 848 | | | | 16 | | | | 17 | | | | 24 | | | | 53 | | | | 41 | | | | 310 | | | | 9 | | | | 6 | | | | 385 | | | | 37 | | | | 38 | | | | 275 | | | | – | | | | 6 | |
| | | | | | | | | | | | | | | | | | | | | | | | | | | | | | | | | | | | | | | | | | | | | | | |
| | | | 21,816 | | | | 22,089 | | | | (2 | ) | | | (1 | ) | | | 7,648 | | | | (11 | ) | | | (11 | ) | | | 6,548 | | | | (6 | ) | | | (8 | ) | | | 3,556 | | | | 22 | | | | 23 | | | | 4,064 | | | | 6 | | | | 15 | |
| | | | | | | | | | | | | | | | | | | | | | | | | | | | | | | | | | | | | | | | | | | | | | | | | | | | | |
ViiV Healthcare (HIV) | | | 1,566 | | | | 1,605 | | | | (3 | ) | | | (2 | ) | | | 660 | | | | (8 | ) | | | (8 | ) | | | 585 | | | | (5 | ) | | | (8 | ) | | | 146 | | | | 35 | | | | 39 | | | | 175 | | | | 7 | | | | 16 | |
Combivir | | | 363 | | | | 425 | | | | (16 | ) | | | (15 | ) | | | 143 | | | | (24 | ) | | | (24 | ) | | | 117 | | | | (21 | ) | | | (23 | ) | | | 63 | | | | 22 | | | | 29 | | | | 40 | | | | (3 | ) | | | 5 | |
Epivir | | | 115 | | | | 129 | | | | (12 | ) | | | (11 | ) | | | 40 | | | | (17 | ) | | | (17 | ) | | | 37 | | | | (22 | ) | | | (24 | ) | | | 18 | | | | 31 | | | | 38 | | | | 20 | | | | – | | | | 5 | |
Epzicom/Kivexa | | | 555 | | | | 546 | | | | 1 | | | | 2 | | | | 210 | | | | (7 | ) | | | (6 | ) | | | 245 | | | | 3 | | | | – | | | | 29 | | | | 38 | | | | 38 | | | | 71 | | | | 14 | | | | 22 | |
Lexiva | | | 155 | | | | 178 | | | | (12 | ) | | | (13 | ) | | | 80 | | | | (19 | ) | | | (19 | ) | | | 51 | | | | (15 | ) | | | (18 | ) | | | 13 | | | | 86 | | | | 86 | | | | 11 | | | | – | | | | 10 | |
Selzentry | | | 80 | | | | 1 | | | | >100 | | | | >100 | | | | 34 | | | | – | | | | – | | | | 41 | | | | >100 | | | | >100 | | | | 2 | | | | – | | | | – | | | | 3 | | | | – | | | | – | |
Trizivir | | | 144 | | | | 201 | | | | (28 | ) | | | (28 | ) | | | 73 | | | | (30 | ) | | | (30 | ) | | | 60 | | | | (26 | ) | | | (27 | ) | | | 4 | | | | (43 | ) | | | (43 | ) | | | 7 | | | | (13 | ) | | | (13 | ) |
| | | | | | | | | | | | | | | | | | | | | | | | | | | | | | | | | | | | | | | | | | | | | | | |
| | | | 23,382 | | | | 23,694 | | | | (2 | ) | | | (1 | ) | | | | | | | | | | | | | | | | | | | | | | | | | | | | | | | | | | | | | | | | | | | | | | | | |
| | | | | | | | | | | | | | | | | | | | | | | | | | | | | | | | | | | | | | | | | | | | | | | | | | | | | | | | | | | | | |
CER% represents growth at constant exchange rates. £% represents growth at actual exchange rates. Turnover by quarter is given in the financial record on pages 194 to 198.
GSK Annual Report 2010
36
Financial review 2010
ViiV Healthcare (HIV)
Sales of HIV products by ViiV Healthcare were down 3% to £1.6 billion. Sales of the former Pfizer productsSelzentryandViracept,with combined sales of £118 million and growth fromEpzicom/Kivexa,up 1% to £555 million, were offset by reductions in the sales from other HIV products includingTrizivir,down 28% to £144 million,Combivir,down 16% to £363 million andEpivir,down 12% to £115 million.
Consumer Healthcare turnover
| | | | | | | | | | | | | | | | | | | | | |
| | | | | | | | | | | | | |
| | | % of | | | 2010 | | | 2009 | | | Growth* | |
| | | total | | | £m | | | £m | | | CER% | | | £% | |
| Over-the-counter | | | | | | | | | | | | | | | | | | | | |
| medicines | | | 49 | | | | 2,456 | | | | 2,339 | | | | 3 | | | | 5 | |
| Oral healthcare | | | 32 | | | | 1,602 | | | | 1,484 | | | | 6 | | | | 8 | |
| Nutritional healthcare | | | 19 | | | | 952 | | | | 851 | | | | 9 | | | | 12 | |
| | | | | | | | | | | | | | |
| | | | 100 | | | | 5,010 | | | | 4,674 | | | | 5 | | | | 7 | |
| | | | | | | | | | | | | | |
| | |
| * | | CER% represents growth at constant exchange rates. £% represents growth at actual exchange rates. Turnover by quarter is given on page 199. |
Total Consumer Healthcare sales forwere up 5% to £5.0 billion, significantly exceeding market growth estimated by GSK to be approximately 2%. Sales in the year rose 7%Rest of World grew 13% to £4.7£2.0 billion, withdriven by strong growth in all regionsIndia and categories.China, which grew by 19% and 18%, respectively. Europe sales were level with last year with sales of £2.0 billion and the business in the USA grew 1% to £1.0 billion.
OTC medicines
OTC product sales grew 8%3% to £2.3£2.4 billion in 2009,2010, driven by sales ofPanadol,(up 10% to £393 million) andalli, which more than doubled to £203 million, as a result of launches throughout Europe which began in April 2009. Sales of nicotine replacement therapy products declinedand dermatology products, partly offset by 1%.lower respiratory tract products and lower sales ofalli.
Oral healthcare
Sales of Oral healthcare products rose 7%6% to £1.5£1.6 billion.Sensodyneperformed strongly with sales up 13% to £457 million. Dentureand denture care sales grew 8% to £336 million.also grew. Sales ofAquafreshdeclined 1%, as a reduction in the US ‘white trays’ market offset growth of 5% in the USAquafreshtoothpaste brands, which were helped by the launch of the new iso-active product.slightly.
Nutritional healthcare
Nutritional healthcare sales grew 3%9% to £0.9£1.0 billion, driven by the very strong performance ofHorlicks(up 17% to £255 million) partly offset by a declineand growth inLucozadesales (down 3% to £376 million) which was impacted by lower sales in the ‘impulse’ market of the UK market.sales.
GSK Annual Report 2009
31
Financial review 2009
Results before major restructuring and
total results
In October 2007 the Board approved the implementation of a detailed formal plan for, and GSK announced, a significant new Operational Excellence restructuring programme. A second formal plan, representing a significant expansion of the Operational Excellence programme, was approved by the Board and announced in February 2009. Having conducted a further series of business reviews, GSK has announced aA further expansion ofwas approved by the restructuring programme to deliver £0.5 billion of incremental pre-tax savings by 2012. Approximately 70% of these savings will be directed to the bottom line to enhance profitability, with the remainder being reinvestedBoard and announced in the business. The charges for this incremental programme are expected to total £0.9 billion and be phased: 65% in 2010 and 30% in 2011, with the balance mostly in 2012. In total, approximately 70% will be cash expenditures and 30% will be asset write-downs. Cumulative savings for the new programme will be phased approximately as follows: £150 million in 2010, £350 million in 2011 and the majority of the balance in 2012.February 2010.
The restructuring programme, comprising these detailed formal plans, covers all areas of GSK’s business, including manufacturing, selling, R&D and infrastructure. With an estimated total cost of approximately £4.5 billion, the expanded programme is expected to deliver annual pre-tax savings of approximately £2.2 billion by the time it is substantially complete in 2012. Approximately 50%75% of these costs were incurred by 31st December 2009,2010, and approximately 30%20% are expected to be incurred in 2010 and2011 with the balance mostly in 2011.2012. In total, approximately 75% of these costs are expected to be cash expenditures and 25% are expected to be accounting write-downs.
Uncertainties exist over the exact amount and timing of cash outflows, as a result of potential future exchange rate fluctuations and as many elements of the restructuring programme are subject to employee consultation procedures, making it difficult to predict with precision when these procedures will be completed. However, the majority of the remaining cash payments are expected to be made in 2010 and 2011. Given the extent and cost of the Operational Excellence restructuring programme, management believes it has a material impact on GSK’s operating results and on the manner in which GSK’s business is conducted. GSK presents the restructuring costs incurred solely as a direct result of the Operational Excellence restructuring programme, which in 20092010 amounted to £764£1,242 million before tax (2008(2009 – £1,089£764 million), in a separate column in the income statement titled ‘Major restructuring’.
In addition to the restructuring costs of the Operational Excellence programme, the major restructuring column in the income statement includes restructuring costs incurred solely as a direct result of any restructuring programmes that follow, and relate to, material acquisitions where the operations of the acquired business overlap extensively with GSK’s existing operations.
The restructuring activities that follow, and relate to, such acquisitions are of the same nature as those undertaken under the Operational Excellence programme and are also carried out following a detailed formal plan. Management therefore considers it appropriate to present the costs of these restructuring activities in the same manner. The restructuring costs incurred in 2010 as a direct result of the acquisition of Stiefel Laboratories, Inc. in July 2009, is the only acquisition during the year that meets the criteria set out above. This is the only acquisition during the year where the costs incurred as a direct result of a related restructuring programme has been included in the major restructuring column. The restructuring costs expected to be incurred as a direct result of this acquisition are estimated to be approximately £205were £103 million of which(2009 – £71 million was charged in 2009.million). The restructuring costs incurred as a direct result of the acquisition of Reliant Pharmaceuticals Inc., the only other acquisition since October 2007 that meets the criteria set out above, were all charged and paid in 2008.
GSK Annual Report 2010
37
Financial review 2010
The Group’s results before the costs of the Operational Excellence programme and acquisition-related restructuring programmes meeting the criteria described above are also presented in a separate column in the income statement and are described as ‘Results before major restructuring’. This presentation, which GSK intends to apply consistently to future major restructuring programmes that have a material impact on GSK’s operating results and on the manner in which GSK’s business is conducted, has been adopted to show clearly the Group’s results both before and after the costs of these restructuring programmes. Management believes that this presentation assists shareholders in gaining a clearer understanding of the Group’s financial performance and in making projections of future financial performance, as results that include such costs, by virtue of their size and nature, have limited comparative value. This presentation is also consistent with the way management assesses the Group’s financial performance.
Only the restructuring costs incurred solely as a direct result of the Operational Excellence programme and the restructuring programmes following the Reliant and Stiefel acquisitions have been reported in the major restructuring column in the income statement. These restructuring costs principally have arisen from impairments to property, plant and equipment and the termination of the employment contracts of staff made redundant as part of the restructuring activities. As set out in Note 7 to the financial statements, ‘Major restructuring programme’, asset impairments and staff redundancies together accounted for £574£753 million of the £835£1,348 million restructuring costs incurred in 20092010 and reported in the major restructuring column.
The remaining costs of £261 million in 2009 arose from miscellaneous expenditures incurred solely as a direct result of the restructuring programmes, including the termination of leases, accelerated depreciation, site closure costs and consultancy and project management fees. No costs arising from GSK’s ongoing operating activities have been reported in the major restructuring column.
GSK Annual Report 2009
32
Financial review 2009
Any restructuring costs that do not arise solely as a direct result of the Operational Excellence programme and restructuring programmes following, and relating to, acquisitions meeting the criteria described above continue to be reported in operating expenses within results before major restructuring. These costs included restructuring costs related to minor acquisitions and £5 million of income in 2010 (2009 – £4 million of costs in 2009 (2008 – £20 million)cost) that related to restructuring activity initiated before the commencement of the Operational Excellence programme. None of this restructuring activity had a material impact on GSK’s operating results or on the manner in which its business is conducted.
The remaining costs of £595 million in 2010 arose from miscellaneous expenditures incurred solely as a direct result of the restructuring programmes, including the termination of leases, accelerated depreciation, site closure costs and consultancy and project management fees. No costs arising from GSK’s ongoing operating activities have been reported in the major restructuring column.
During the anticipated duration of the Operational Excellence programme, GSK does not currently expect to incur any material restructuring costs except those related to that programme and acquisitions meeting the criteria described above. If any further, unanticipated material restructuring costs were to arise during this period, GSK would expect to include them also in the major restructuring column.
GSK’s operating profit, profit before taxation, taxation and profit for the year are discussed below in terms of both total results, which include major restructuring costs, and results before major restructuring.
Operating profit – total results
Total results include restructuring costs related to the Operational Excellence programme and the acquisitions of Reliant and Stiefel.
| | | | | | | | | | | | | | | | | | | | | | | | | | | | | | | | | | | | | | | | | | | | | | | | | |
| | | 2009 | | 2008 | | Growth | | | | | | | |
| | | £m | | % | | £m | | % | | CER% | | £% | | | 2010 | | 2009 | | Growth | |
| | | | | | | | | | | | | | £m | | % | | £m | | % | | CER% | | £% | |
| Turnover | | 28,368 | | 100 | | 24,352 | | 100 | | 3 | | 16 | | | 28,392 | | 100 | | 28,368 | | 100 | | | (1 | ) | | – | |
| | | | | | | | | | | | | | | | | | | | | | | | |
| Cost of sales | | | (7,380 | ) | | | (26.0 | ) | | | (6,415 | ) | | | (26.3 | ) | | 6 | | 15 | | | | (7,592 | ) | | | (26.7 | ) | | | (7,380 | ) | | | (26.0 | ) | | 3 | | 3 | |
| Selling, general and administration | | | (9,592 | ) | | | (33.8 | ) | | | (7,656 | ) | | | (31.4 | ) | | 6 | | 25 | | | | (13,053 | ) | | | (46.0 | ) | | | (9,592 | ) | | | (33.8 | ) | | 36 | | 36 | |
| Research and development | | | (4,106 | ) | | | (14.4 | ) | | | (3,681 | ) | | | (15.2 | ) | | 1 | | 12 | | | | (4,457 | ) | | | (15.7 | ) | | | (4,106 | ) | | | (14.4 | ) | | 8 | | 9 | |
| Other operating income | | 1,135 | | 3.9 | | 541 | | 2.2 | | 95 | | 110 | | | 493 | | 1.7 | | 1,135 | | 3.9 | |
| | | | | | | | | | | | | | | | | | | | | | | | |
| Operating profit | | 8,425 | | 29.7 | | 7,141 | | 29.3 | | 4 | | 18 | | | 3,783 | | 13.3 | | 8,425 | | 29.7 | | | (59 | ) | | | (55 | ) |
| | | | | | | | | | | | | | | | | | | | | | | | |
Cost of sales
Cost of sales as a percentageincreased to 26.7% of turnover reduced marginally to(2009 – 26.0% of turnover (2008 – 26.3%), principally reflecting the impact of generic competition to higher margin products in the USA (principallyValtrex),lowerAvandiasales, US healthcare reforms and changes to the product mix,European austerity price cuts, and inventory and other asset write-downs, partially offset by benefitssavings from the restructuringOperational Excellence programme and lower restructuring costs of £285£187 million (2008(2009 – £639£285 million).
Selling, general and administration
SG&A costs as a percentage of turnover increased by 2.412.2 percentage points to 33.8%. This included full year legal charges of £591 million (2008 – £611 million) and charges related to the major restructuring programme of £392 million (2008 – £304 million)46.0%. Excluding legal and restructuring costs of £4,001 million (2009 – £591 million), SG&A costs were 30.3%31.9% of turnover (2008(2009 – 27.7%31.7%). ThisThe increase of 0.2 percentage points reflected a 1% Sterling (1% CER) increase in SG&A on a flat sterling turnover growth. SG&A included restructuring costs of £665 million (2009 – £392 million), investment in growth markets and the full year impact of the acquisition of Stiefel increased pension costs,partly offset by operational excellence savings in the donation of H1N1 product to WHOUSA and Europe and lower exchange losses on inter-company transactions (compared with exchange gains last year)transactions. Advertising and promotion declined 1%, partially offset by the benefits of the current restructuring programme.selling and distribution increased 1% and general and administration excluding legal increased 2%.
Research and development
R&D expenditure was 14.4% (2008 – 15.2%)15.7% of total turnover which(2009 – 14.4%) reflecting an increase in expenditure of 9% sterling (8% CER) on a flat sterling turnover growth. This included £167restructuring costs of £493 million of(2009 – £155 million), ViiV Healthcare R&D investments and lower intangible asset write-offs (2008impairments of £126 million (2009 – £85£167 million) partially offset by lower charges relating to the major restructuring programme of £155 million (2008 – £175 million) and a provision release due to reassessment of a receivable balance. Increased investment in vaccines R&D and late stage pharmaceutical R&D were broadly offset by savings from the restructuringOperational Excellence programme. In addition, the comparison to prior year was unfavourably impacted by the one-off recognition of a recoverable balance in 2009.
Other operating income
Other operating income was £493 million (2009 – £1,135 million) primarily reflecting royalty income of £296 million including gains(2009 – £296 million), income from the transfer to Genentech of the exclusive promotion rights toBonivain the USA, and asset disposals of £579£134 million (2008(2009 – £293£875 million) primarily reflecting, partially offset by equity investment impairments of £65 million (2009 – £135 million). The 2009 income included the disposal ofWellbutrin XL,and various assetsasset disposals to Aspen Pharmacare, royalty income of £296 million (2008 – £307 million), a royalty dispute settlement gain of £78 million and a one-timethe accounting gain of £296 million on the creation of ViiV Healthcare, partially offset by equity investment impairments of £135 million.Healthcare.
GSK Annual Report 2010
38
Financial review 2010
Operating profit – total results
Total operatingOperating profit after restructuring charges of £1,345 million (2009 – £832 million) for the year ended 31st December 2010 was £8,425£3,783 million, a decrease of 59% CER (a decrease of 55% in sterling terms) compared with 2009. Excluding legal costs of £4,001 million (2009 – £591 million), operating profit was £7,784 million an increase of 4%18% decline in CER and 18%terms (14% in Sterling terms, compared with 2008. The operating profit margin increased 0.4 percentage pointssterling terms) principally reflecting a 1% decline in turnover, higher other operating income and broadly flat R&D expenditure, partially offset by increases in cost of sales, higher R&D expenditure and SG&A.lower other operating income.
Profit before taxation – total results
Net finance costs
| | | | | | | | | | | | | | |
| | | 2009 | | 2008 | | | 2010 | | 2009 | |
| Finance income | | £m | | £m | | | £m | | £m | |
| | | | |
| Interest and other finance income | | 67 | | 321 | | | 102 | | 67 | |
| Unwinding of discounts on assets | | 2 | | 1 | | | 1 | | 2 | |
| Fair value adjustments and hedges | | 1 | | | (9 | ) | | 13 | | 1 | |
| | | | | | | | |
| | | 70 | | 313 | | | 116 | | 70 | |
| | | | | | | | |
| | | |
Finance costs | | |
| | | | | | | | |
| Interest costs | | | (770 | ) | | | (829 | ) | | | (767 | ) | | | (770 | ) |
| Unwinding of discounts on liabilities | | | (11 | ) | | | (16 | ) | | | (18 | ) | | | (11 | ) |
| Fair value adjustments and hedges | | | (2 | ) | | 2 | | | | (21 | ) | | | (2 | ) |
| Other finance expense | | | | (25 | ) | | – | |
| | | | | | | | |
| | | | (783 | ) | | | (843 | ) | | | (831 | ) | | | (783 | ) |
| | | | | | | | |
GSK Annual Report 2009
33
Financial review 2009
Profit on disposal of interest in associateassociates
Profit on disposal of interest in associateassociates was £8 million (2009 – £115 million asmillion). The 2009 profit arose from the sale of 5.7 million shares fromQuest shares. Subsequent to the Group’s holding2010 year-end the Group sold its entire shareholding in Quest, Diagnostics Inc. were soldwhich will give rise to a pre-tax profit on disposal of associates in the first quarter2011 of 2009.approximately £600 million (£250 million after tax).
Share of after tax profits of associates and joint ventures
The share of after tax profits of associates of £81 million (2009 – £64 million (2008 – £48 million) arisesarose principally from the Group’s holding in Quest.
Profit before taxation – total results
Taking account of net finance costs, the profit on disposal of interest in associates and the share of profits of associates, total profit before taxation was £7,891£3,157 million compared with £6,659£7,891 million in 2008,2009, a 4%64% CER increasedecline and a 19%60% sterling increase.decline.
Operating profit – results before major
restructuring
The results before major restructuring are set out below:
| | | | | | | | | | | | | | | | | | | | | | | | | | | | | | | | | | | | | | | | | | | | | | | | | |
| | | 2009 | | 2008 | | Growth | | | | | | | |
| | | £m | | % | | £m | | % | | CER% | | £% | | | 2010 | | 2009 | | Growth | |
| | | | | | | | | | | | | | £m | | % | | £m | | % | | CER% | | £% | |
| Turnover | | 28,368 | | 100 | | 24,352 | | 100 | | 3 | | 16 | | | 28,392 | | 100 | | 28,368 | | 100 | | | (1 | ) | | – | |
| | | | | | | | | | | | | | | | | | | | | | | | |
| Cost of sales | | | (7,095 | ) | | | (25.0 | ) | | | (5,776 | ) | | | (23.7 | ) | | 13 | | 23 | | | | (7,405 | ) | | | (26.1 | ) | | | (7,095 | ) | | | (25.0 | ) | | 4 | | 4 | |
| Selling, general and administration | | | (9,200 | ) | | | (32.4 | ) | | | (7,352 | ) | | | (30.2 | ) | | 6 | | 25 | | | | (12,388 | ) | | | (43.6 | ) | | | (9,200 | ) | | | (32.4 | ) | | 35 | | 35 | |
| Research and development | | | (3,951 | ) | | | (13.9 | ) | | | (3,506 | ) | | | (14.4 | ) | | 2 | | 13 | | | | (3,964 | ) | | | (14.0 | ) | | | (3,951 | ) | | | (13.9 | ) | | – | | – | |
| Other operating income | | 1,135 | | 3.9 | | 541 | | 2.2 | | 95 | | 110 | | | 493 | | 1.8 | | 1,135 | | 3.9 | |
| | | | | | | | | | | | | | | | | | | | | | | | |
| Operating profit | | 9,257 | | 32.6 | | 8,259 | | 33.9 | | | (1 | ) | | 12 | | | 5,128 | | 18.1 | | 9,257 | | 32.6 | | | (48 | ) | | | (45 | ) |
| | | | | | | | | | | | | | | | | | | | | | | | |
GSK Annual Report 2010
Cost of sales
Cost of sales increased to 25.0%26.1% of turnover (2008(2009 – 23.7%25.0%), principally reflecting the impact of generic competition to higher margin products in the USA (principallyValtrex),lowerAvandia sales, US healthcare reforms and changes to the product mix, partlyEuropean austerity price cuts, and inventory and other asset write-downs, partially offset by benefitssavings from the restructuringOperational Excellence programme. In 2010The company expects cost of sales as a percentage of turnover is expectedin 2011 to beremain around 26%.
Selling, general and administration
SG&A costs as a percentage of turnover increased by 2.211.2 percentage points to 32.4%43.6%, including full yearprimarily reflecting higher legal charges of £4,001 million (2009 – £591 million.million). See Note 29 to the financial statements ‘other provisions’ for further details.
Excluding legal costs SG&A costs were 29.5% of turnover (2009 – 30.3%). The increasedecrease of 0.8 percentage points reflected investmenta 3% Sterling (2% CER) decline in growth markets,expenditure compared with prior year on a flat sterling turnover growth. The decline in expenditure reflected operational excellence savings in the acquisition of Stiefel, increased pension costs, the donation of H1N1 product to WHOUSA and Europe and lower exchange losses on inter-company transactions, (compared with exchange gains last year), partially offset by investment in growth markets and the benefitsfull year impact of the current restructuring programme. In 2010acquisition of Stiefel.
Advertising and promotion declined 1%, selling and distribution declined 4% and general and administration excluding legal declined 1%. Collectively these items accounted for a 2% decline in total SG&A. The company expects SG&A costs excluding legal charges are expected to be around 29%30.5% of turnover.turnover in 2011.
Research and development
R&D expenditure was 13.9% (2008 – 14.4%)14.0% of total turnover which(2009 – 13.9%) reflecting flat expenditure on a flat sterling turnover growth. This included £167 million of intangible asset write-offs
(2008 – £85 million) partially offset by a provision release due to reassessment of a receivable balance. Increased investment in vaccines R&D and late-stage pharmaceutical R&D were broadly offset by savings from the restructuring programme. In 2010Operational Excellence programme, lower intangible asset impairments of £126 million (2009 – £167 million) and higher ViiV Healthcare R&D investment. The comparison to prior year was unfavourably impacted by the one-off recognition of a recoverable balance in 2009. The company expects R&D costs as a percentage of turnover are expected to remain at around 14%. in 2011.
Other operating income
Other operating income was £493 million (2009 – £1,135 million) primarily reflecting royalty income of £296 million including gains(2009 – £296 million), income from the transfer to Genentech of the exclusive promotion rights toBonivain the USA, and asset disposals of £579£134 million (2008(2009 – £293£875 million) primarily reflecting, partially offset by equity investment impairments of £65 million (2009 – £135 million). The 2009 income included the disposal ofWellbutrin XL,and various assetsasset disposals to Aspen Pharmacare, royalty income of £296 million (2008 – £307 million), a royalty dispute settlement gain of £78 million and a one-timethe accounting gain of £296 million on the creation of ViiV Healthcare, partially offset by equity investment impairments of £135 million.
Healthcare. In 20092011, the company expects other operating income andto be around £600 million, excluding the profit arising on disposalthe proposed Consumer Healthcare divestments of associates amounted to £1,250 million. An equivalent overall income of around £800-900 million is expected for 2010.non-core OTC brands.
39
Financial review 2010
Operating profit – results before major restructuring
Operating profit before major restructuring for the year ended 31st December 2010 was £9,257£5,128 million, a 48% decline in CER terms (a decrease of 45% in sterling terms). Excluding legal costs of £4,001 million (2009 — £591 million), operating profit was £9,129 million, an 11% decline in CER terms (a decrease of 7% in sterling terms) principally reflecting a 1% CER decline but up 12% in Sterling terms, compared with 2008.turnover, higher cost of sales, higher R&D expenditure and lower other operating income partly offset by reduced SG&A costs. Operating profit margin excluding legal costs and other operating income was 30.4% in 2010. The company expects the operating profit margin was 32.6% compared with a 2008 margin of 33.9%. The decline in margin was primarily due to generic competition in the USA which impacted cost of goods and increased investment to support the Group’s diversification strategy which impacted SG&A, partly offset by a higher level of other operating income.
As the impact of generic competition reduces and SG&A investment levels stabilise, GSK’s operating profit margin in 2010 is currently expected to be broadly similar to 2009 (excludingexcluding legal costs and the ViiV Healthcare accounting gain).
Further information onother operating profit before major restructuring is providedincome to be around 1 percentage point lower in Note 6, ‘Segment information’.2011.
Profit before taxation – results before major restructuring
Net finance costs
| | | | | | | | | | | | | | | | | |
| | | 2009 | | 2008 | | | | | | |
| Finance income | | £m | | £m | | | 2010 | | 2009 | |
| | | | |
| Finance income | | | £m | | £m | |
| | 67 | | 321 | | | 102 | | 67 | |
| Unwinding of discounts on assets | | 2 | | 1 | | | 1 | | 2 | |
| Fair value adjustments and hedges | | 1 | | | (9 | ) | | 13 | | 1 | |
| | | | | | | | |
| | | 70 | | 313 | | | 116 | | 70 | |
| | | | | | | | |
| | | |
Finance costs | | |
| | | | | | | | |
| Interest costs | | | (770 | ) | | | (829 | ) | | | (767 | ) | | | (770 | ) |
| Unwinding of discounts on liabilities | | | (8 | ) | | | (11 | ) | | | (15 | ) | | | (8 | ) |
| Fair value adjustments and hedges | | | (2 | ) | | 2 | | | | (21 | ) | | | (2 | ) |
| Other finance expense | | | | (25 | ) | | – | |
| | | | | | | | |
| | | | (780 | ) | | | (838 | ) | | | (828 | ) | | | (780 | ) |
| | | | | | | | |
Net interest payable for the year was to 712 million (2009 – £710 million) and the company expects a similar change in 2011.
Profit on disposal of interest in associate
Profit on disposal of interestsinterest in associates was £115£8 million as(2009 –£115 million). The 2009 profit arose from the sale of 5.7 million Quest shares wereshares. Subsequent to the 2010 year-end, GSK sold its entire shareholding in the first quarterQuest, which will give rise to a pre-tax profit on disposal of 2009.associates of approximately £600 million (£250 million after tax).
GSK Annual Report 2009
34
Financial review 2009
Share of after tax profits of associates and joint ventures
The share of after tax profits of associates of £81 million (2009 – £64 million (2008 – £48 million) arises arose principally from the Group’s holding in Quest Diagnostics Inc.
Profit before taxation – results before major restructuring
Taking account of net finance costs, the profit on disposal of interests in associates and the share of profits of associates, profit before tax before major restructuring was £8,726£4,505 million compared with £7,782£8,726 million in 2008,2009, a 1%52% CER decline but 12% increaseand a 48% decline in sterling terms.
Taxation charge
| | | | | | | | | | | | | | | | | |
| | | 2009 | | 2008 | | | | | | |
| | | £m | | £m | | | 2010 | | 2009 | |
| | | | | | £m | | £m | |
| UK corporation tax | | 456 | | 289 | | |
| UK corporation tax at the UK statutory rate | | | 82 | | 600 | |
| Less double taxation relief | | | | (156 | ) | | | (183 | ) |
| | | | | | |
| | | | | (74 | ) | | 417 | |
| Overseas taxation | | 1,958 | | 1,589 | | | 1,496 | | 1,997 | |
| | | | | | | | |
| Current taxation | | 2,414 | | 1,878 | | | 1,422 | | 2,414 | |
| Deferred taxation | | | (192 | ) | | 69 | | | | (118 | ) | | | (192 | ) |
| | | | | | | | |
| Taxation on total profits | | 2,222 | | 1,947 | | | 1,304 | | 2,222 | |
| | | | | | | | |
The lower tax charge for 2010 reflects higher legal charges of £4 billion (2009 – £0.6 billion).
The charge for taxation on total profits amounted to £2,222£1,304 million and represented an effective tax rate of 28.2% (200841.3% (2009 – 29.2%28.2%).
The charge for taxation on profit before major restructuring charges amountingamounted to £2,443£1,544 million representsand represented an effective tax rate of 28.0% (200834.3% (2009 – 28.7%28.0%). GSK currently expects a similar effective tax rate in 2010. The Group’s balance sheet at 31st December 2009 included a tax payable liabilityon 2011 profits excluding the profit on the disposal of £1,451 million and a tax recoverable assetthe Quest shareholding of £58 million.
On 19th November 2009 the IRS conceded all asserted tax deficiencies and penalties arising from its reclassification of an intercompany financing arrangement from debt to equity resulting in no additional tax cost to GSK. The IRS claim had previously been estimated at $864 million for 2001–2003. GSK and the IRS are now in the process of finalisingaround 27%. However, the tax computations fordue on the 2001–2003 tax years. It is anticipated that resolutionprofit realised on the disposal of the issueshareholding in Quest will increase the years 2004overall tax rate for 2011 to 2008 will be reflected in a closing agreement. Resolutionaround 29.5%. This excludes the effect of the issue had no impactany tax that may arise on the Group’s results.proposed Consumer Healthcare divestments of non-core brands.
GSK continues to believe that it has made adequate provision for the liabilities likely to arise from open assessments. The ultimate liability for such matters may vary from the amounts provided and is dependent upon the outcome of litigation proceedings and negotiations with the relevant tax authorities.
Profit for the year
| | | | | | | | | | | | | | | | | | | | | | | | | | | | | | | | | |
| | | 2009 | | 2008 | | Growth | | | | | | | | |
| | | £m | | £m | | CER% | | £% | | | 2010 | | 2009 | | Growth | |
| | | | | | | | | | £m | | £m | | CER% | | £% | |
| Total profit after taxation for the year | | 5,669 | | 4,712 | | 6 | | 20 | | | 1,853 | | 5,669 | | | (71 | ) | | | (67 | ) |
| Total profit attributable to shareholders | | 5,531 | | 4,602 | | 6 | | 20 | | | 1,634 | | 5,531 | | | (75 | ) | | | (70 | ) |
| Basic earnings per share (pence) | | 109.1 | p | | 88.6 | p | | | 32.1 | p | | 109.1 | p | | | (75 | ) | | | (71 | ) |
| Basic earnings per ADS (US$) | | | $3.40 | | | $3.28 | | | | $1.00 | | | $3.40 | |
| | | | | | | | | | | | | | | | |
| Results before major restructuring profit after taxation for the year | | 6,283 | | 5,551 | | – | | 13 | | | 2,961 | | 6,283 | | | (56 | ) | | | (53 | ) |
| Results before major restructuring profit attributable to shareholders | | 6,145 | | 5,441 | | – | | 13 | | | 2,742 | | 6,145 | | | (59 | ) | | | (55 | ) |
| Adjusted earnings per share (pence) | | 121.2 | p | | 104.7 | p | | 2 | | 16 | | | 53.9 | p | | 121.2 | p | | | (59 | ) | | | (56 | ) |
| Adjusted earnings per ADS (US$) | | | $3.78 | | | $3.87 | | | | $1.67 | | | $3.78 | |
| Weighted average number of shares (millions) | | 5,069 | | 5,195 | | | 5,085 | | 5,069 | |
| | | | | | | | | | | | | | | | |
| Diluted total earnings per share (pence) | | 108.2 | p | | 88.1 | p | | | 31.9 | p | | 108.2 | p | |
| Diluted total earnings per ADS (US$) | | | $3.38 | | | $3.26 | | | | $0.99 | | | $3.38 | |
| Diluted weighted average number of shares (millions) | | 5,108 | | 5,226 | | | 5,129 | | 5,108 | |
| | | | | | | | | | | | | | | | |
Total results including restructuring costs produced a basic EPS of 109.1p32.1p compared with 88.6p109.1p in 2008.2009. This was an 8% growth Ina 75% decline in CER terms and a 23% growth71% decline in sterling terms. Excluding major restructuring costs, EPS was 121.2p53.9p compared with 104.7p.121.2p. This was a 2% growth59% decline at CER and a 16% increase56% decrease in sterling terms. The 143 percentage point currency benefit arose from the weakness of Sterling against most major international currencies duringcompared with last year, partly offset by the year.strengthening of Sterling against the Euro.
Dividend
The Board has declared a fourth interim dividend of 1819 pence per share resulting in a dividend for the year of 61 pence;65 pence, a four4 pence increase overon the 5761 pence per share for 2008.2009. The equivalent interim dividend receivable by ADR holders is 57.369661.5296 cents per ADS based on an exchange rate of £1/$1.5936.1.6192. The ex-dividend date was 10th9th February 2010,2011, with a record date of 12th11th February 20102011 and a payment date of 8th7th April 2010.2011.
GSK Annual Report 2010
40
Financial review 2010
Critical accounting policies
The consolidated financial statements are prepared in accordance with IFRS, as adopted for use in the European Union, and also with IFRS as issued by the IASB, following the accounting policies approved by the Board and described in Note 2 to the financial statements, ‘Accounting principles and policies’. Management is required to make estimates and assumptions that affect the amounts of assets, liabilities, revenue and expenses reported in the financial statements. Actual amounts and results could differ from those estimates.
GSK Annual Report 2009
35
Financial review 2009
The critical accounting policies adopted relate to the following areas:
Property, plant & equipment
Pensions and other post-employment benefits.
| • | | Turnover |
|
| • | | Taxation |
|
| • | | Legal and other disputes |
|
| • | | Property, plant & equipment |
|
| • | | Goodwill |
|
| • | | Other intangible assets |
|
| • | | Pensions and other post-employment benefits. |
Information on the judgements and estimates made in these areas is given in Note 3 to the financial statements, ‘Key accounting judgements and estimates’.
In respect of the Turnover accounting policy, the Group’s largest business is US pharmaceuticals, and the US market has the most complex arrangements for rebates, discounts and allowances. The following briefly describes the nature of the arrangements in existence in the Group’s US pharmaceuticals business.business:
GSK has arrangements with certain indirect customers whereby the customer is able to buy products from wholesalers at reduced prices. A chargeback represents the difference between the invoice price to the wholesaler and the indirect customer’s contractual discounted price. Accruals for estimating chargebacks are calculated based on the terms of each agreement, historical experience and product growth rates.
Customer rebates are offered to key managed care and group purchasing organisations (GPO) and other direct and indirect customers. These arrangements require the customer to achieve certain performance targets relating to value of product purchased, formulary status or pre-determined market shares relative to competitors. The accrual for customer rebates is estimated based on the specific terms in each agreement, historical experience and product growth rates.
The US Medicaid programme is a state-administered programme providing assistance to certain poor and vulnerable patients. In 1990, the Medicaid Drug Rebate Program was established to reduce state and federal expenditure on prescription drugs. GSK participates by providing rebates to states. Accruals for Medicaid rebates are calculated based on the specific terms of individual state agreements using a combination of historical experience, product and population growth, anticipated price increases and the impact of contracting strategies.
Cash discounts are offered to customers to encourage prompt payment. These are accrued for at the time of invoicing and adjusted subsequently to reflect actual experience.
Where there is historical experience of customer returns, GSK records an accrual for estimated sales returns by applying historical experience of customer returns to the amounts invoiced, together with market related information such as stock levels at wholesalers, anticipated price increases and competitor activity.
| • | | GSK has arrangements with certain indirect customers whereby the customer is able to buy products from wholesalers at reduced prices. A chargeback represents the difference between the invoice price to the wholesaler and the indirect customer’s contractual discounted price. Accruals for estimating chargebacks are calculated based on the terms of each agreement, historical experience and product growth rates |
|
| • | | Customer rebates are offered to key managed care and group purchasing organisations (GPO) and other direct and indirect customers. These arrangements require the customer to achieve certain performance targets relating to the value of product purchased, formulary status or pre-determined market shares relative to competitors. The accrual for customer rebates is estimated based on the specific terms in each agreement, historical experience and product growth rates |
|
| • | | The US Medicaid programme is a state-administered programme providing assistance to certain poor and vulnerable patients. In 1990, the Medicaid Drug Rebate Program was established to reduce state and federal expenditure on prescription drugs. In 2010, the Patient and Affordable Care Act became law. GSK participates by providing rebates to states. Accruals for Medicaid rebates are calculated based on the specific terms of individual state agreements using a combination of historical experience, product and population growth, anticipated price increases and the impact of contracting strategies |
|
| • | | Cash discounts are offered to customers to encourage prompt payment. These are accrued for at the time of invoicing and adjusted subsequently to reflect actual experience |
|
| • | | Where there is historical experience of customer returns, GSK records an accrual for estimated sales returns by applying historical experience of customer returns to the amounts invoiced, together with market related information such as stock levels at wholesalers, anticipated price increases and competitor activity. |
A reconciliation of gross turnover to net turnover for the US pharmaceuticals business is as follows:
| | | | | | | | | | | | | | | | | | | | | | | | | | |
| | | | | | | | | | | | | | | | | | | | | | | | | | | | | | |
| | | 2009 | | 2008 | | 2007 | | | 2009 | | 2008 | |
| | | £m | | % | | £m | | % | | £m | | % | | | 2010 | | (restated) | | (restated) | |
| | | | | | | | | | | | | | £m | | % | | £m | | % | | £m | | % | |
| Gross turnover | | 12,504 | | 100 | | 11,602 | | 100 | | 11,826 | | 100 | | | 10,802 | | 100 | | 11,674 | | 100 | | 10,782 | | 100 | |
| | | |
| Chargebacks | | | (1,193 | ) | | 10 | | | (892 | ) | | 8 | | | (917 | ) | | 8 | | | | (993 | ) | | 9 | | | (1,124 | ) | | 10 | | | (836 | ) | | 8 | |
| Managed care, Medicare Part D and GPO rebates | | | (917 | ) | | 7 | | | (764 | ) | | 6 | | | (727 | ) | | 6 | | | | (894 | ) | | 8 | | | (907 | ) | | 8 | | | (756 | ) | | 7 | |
| US government and state programmes | | | (663 | ) | | 5 | | | (554 | ) | | 5 | | | (481 | ) | | 4 | | | | (742 | ) | | 7 | | | (542 | ) | | 5 | | | (470 | ) | | 4 | |
| Cash discounts | | | (219 | ) | | 2 | | | (207 | ) | | 2 | | | (208 | ) | | 2 | | | | (193 | ) | | 2 | | | (200 | ) | | 2 | | | (191 | ) | | 1 | |
| Customer returns | | | (179 | ) | | 1 | | | (126 | ) | | 1 | | | (131 | ) | | 1 | | | | (179 | ) | | 1 | | | (172 | ) | | 1 | | | (118 | ) | | 1 | |
| Prior year adjustments | | 30 | | – | | 38 | | – | | 73 | | – | | | 38 | | – | | 24 | | – | | 35 | | – | |
| Other items | | | (183 | ) | | 2 | | | (203 | ) | | 1 | | | (162 | ) | | 1 | | | | (191 | ) | | 2 | | | (175 | ) | | 1 | | | (192 | ) | | 2 | |
| | | | | | | | | | | | | | | | | | | | | | | | |
| Total deductions | | | (3,324 | ) | | 27 | | | (2,708 | ) | | 23 | | | (2,553 | ) | | 22 | | | | (3,154 | ) | | 29 | | | (3,096 | ) | | 27 | | | (2,528 | ) | | 23 | |
| | | | | | | | | | | | | | | | | | | | | | | | |
| Net turnover | | 9,180 | | 73 | | 8,894 | | 77 | | 9,273 | | 78 | | | 7,648 | | 71 | | 8,578 | | 73 | | 8,254 | | 77 | |
| | | | | | | | | | | | | | | | | | | | | | | | |
Sterling valuesInformation relating to 2009 and 2008 has been restated following changes to the segmental reporting, as set out in Note 6 to the financial statements, ‘Segment information’.
Rebates given under US government and state programmes have increased by approximately 16% compared with 2008in the year as a result of average exchange rate movements.
Chargebacks have increased in 2009 as a result of higher direct chargebacks onRelenzasales. Managed care, Medicare Part D and GPO rebates increased slightly as a result of higher contracting discountsthe US healthcare reform amendments. The additional expense arising from competitive pressures in the market place.new legislation include Managed Medicaid Sales being discounted at Fee-for-Service rates, an increase to the Basic Medicaid Rebate, a new definition of Average Manufacturers Price and incremental Consumer Price Index penalty on line extensions.
The total accruals for rebates, discounts, allowances and returns in the US pharmaceuticals business were as follows:
| | | | | | | | | | |
| | | | | | | | | | | | | | |
| | | At 31st | | At 31st | | | At 31st | |
| | | December | | December | | | At 31st | | December | |
| | | 2009 | | 2008 | | | December | | 2009 | |
| | | £m | | £m | | | 2010 | | (restated) | |
| | | | | | £m | | £m | |
| Chargebacks | | 46 | | 50 | | | 50 | | 41 | |
Managed care, Medicare Part D
and GPO rebates | | 429 | | 474 | | | 422 | | 426 | |
| US government and state programmes | | 354 | | 345 | | | 445 | | 322 | |
| Cash discounts | | 20 | | 25 | | | 21 | | 20 | |
| Customer returns | | 205 | | 259 | | | 254 | | 192 | |
| Other | | 27 | | 50 | | | 28 | | 26 | |
| | | | | | | | |
| Total | | 1,081 | | 1,203 | | | 1,220 | | 1,027 | |
| | | | | | | | |
Sterling values have decreased largelyThe accrual for rebates to US government and state programmes has increased as a result of year-end exchange rate movements; in dollar terms, the 2009 provision is largely unchanged from 2008.US healthcare reform implemented during 2010.
A monthly process is operated to monitor inventory levels at wholesalers for any abnormal movements. This process uses gross sales volumes, prescription volumes based on third party data sources and information received from key wholesalers. The aim of this is to maintain inventories at a consistent level from year to year based on the pattern of consumption.
On this basis, US pharmaceutical inventory levels at wholesalers and in other distribution channels at 31st December 20092010 were estimated to amount to approximately one month of turnover. This calculation uses third party information, the accuracy of which cannot be totally verified, but is believed to be sufficiently reliable for this purpose.
GSK Annual Report 20092010
3641
Financial position and resources
Financial position
| | | | | | | | | | | | | | | | | |
| | | 2009 | | 2008 | | | | | |
| | | £m | | £m | | | 2010 | | 2009 | |
| | | | | | £m | | £m | |
Assets | | |
Non-current assets | | |
| Property, plant and equipment | | 9,374 | | 9,678 | | | 9,045 | | 9,374 | |
| Goodwill | | 3,361 | | 2,101 | | | 3,606 | | 3,361 | |
| Other intangible assets | | 8,183 | | 5,869 | | | 8,532 | | 8,183 | |
| Investments in associates and joint ventures | | 895 | | 552 | | | 1,081 | | 895 | |
| Other investments | | 454 | | 478 | | | 711 | | 454 | |
| Deferred tax assets | | 2,374 | | 2,760 | | | 2,566 | | 2,374 | |
| Derivative financial instruments | | 68 | | 107 | | | 97 | | 68 | |
| Other non-current assets | | 583 | | 579 | | | 556 | | 583 | |
| | | | | | | | |
Total non-current assets | | 25,292 | | 22,124 | | | 26,194 | | 25,292 | |
| | | | | | | | |
Current assets | | |
| Inventories | | 4,064 | | 4,056 | | | 3,837 | | 4,064 | |
| Current tax recoverable | | 58 | | 76 | | | 56 | | 58 | |
| Trade and other receivables | | 6,492 | | 6,265 | | | 5,793 | | 6,492 | |
| Derivative financial instruments | | 129 | | 856 | | | 93 | | 129 | |
| Liquid investments | | 268 | | 391 | | | 184 | | 268 | |
| Cash and cash equivalents | | 6,545 | | 5,623 | | | 6,057 | | 6,545 | |
| Assets held for sale | | 14 | | 2 | | | 16 | | 14 | |
| | | | | | | | |
Total current assets | | 17,570 | | 17,269 | | | 16,036 | | 17,570 | |
| | | | | | | | |
Total assets | | 42,862 | | 39,393 | | | 42,230 | | 42,862 | |
| | | | | | |
| | | | |
Liabilities | | |
Current liabilities | | |
| Short-term borrowings | | | (1,471 | ) | | | (956 | ) | | | (291 | ) | | | (1,471 | ) |
| Trade and other payables | | | (6,772 | ) | | | (6,075 | ) | | | (6,888 | ) | | | (6,772 | ) |
| Derivative financial instruments | | | (168 | ) | | | (752 | ) | | | (188 | ) | | | (168 | ) |
| Current tax payable | | | (1,451 | ) | | | (780 | ) | | | (1,047 | ) | | | (1,451 | ) |
| Short-term provisions | | | (2,256 | ) | | | (1,454 | ) | | | (4,380 | ) | | | (2,256 | ) |
| | | | | | | | |
Total current liabilities | | | (12,118 | ) | | | (10,017 | ) | | | (12,794 | ) | | | (12,118 | ) |
| | | | | | | | |
Non-current liabilities | | |
| Long-term borrowings | | | (14,786 | ) | | | (15,231 | ) | | | (14,809 | ) | | | (14,786 | ) |
| Deferred tax liabilities | | | (645 | ) | | | (714 | ) | | | (707 | ) | | | (645 | ) |
| Pensions and other post-employment benefits | | | (2,981 | ) | | | (3,039 | ) | | | (2,672 | ) | | | (2,981 | ) |
| Other provisions | | | (985 | ) | | | (1,645 | ) | | | (904 | ) | | | (985 | ) |
| Derivative financial instruments | | – | | | (2 | ) | | | (5 | ) | | – | |
| Other non-current liabilities | | | (605 | ) | | | (427 | ) | | | (594 | ) | | | (605 | ) |
| | | | | | | | |
Total non-current liabilities | | | (20,002 | ) | | | (21,058 | ) | | | (19,691 | ) | | | (20,002 | ) |
| | | | | | | | |
Total liabilities | | | (32,120 | ) | | | (31,075 | ) | | | (32,485 | ) | | | (32,120 | ) |
| | | | | | | | |
Net assets | | 10,742 | | 8,318 | | | 9,745 | | 10,742 | |
| | | | | | | | |
Equity | | |
| Share capital | | 1,416 | | 1,415 | | | 1,418 | | 1,416 | |
| Share premium account | | 1,368 | | 1,326 | | | 1,428 | | 1,368 | |
| Retained earnings | | 6,321 | | 4,622 | | | 4,779 | | 6,321 | |
| Other reserves | | 900 | | 568 | | | 1,262 | | 900 | |
| | | | | | | | |
Shareholders’ equity | | 10,005 | | 7,931 | | | 8,887 | | 10,005 | |
| | | | | | | | |
| Minority interests | | 737 | | 387 | | |
| Non-controlling interests | | | 858 | | 737 | |
| | | | | | | | |
Total equity | | 10,742 | | 8,318 | | | 9,745 | | 10,742 | |
| | | | | | | | |
Property, plant and equipment
GSK’s business is science-based, technology-intensive and highly regulated by governmental authorities. The Group allocates significant financial resources to the renewal and maintenance of its property, plant and equipment to minimise risks of interruption of production and to achieve compliance with regulatory standards. A number of its processes use chemicals and hazardous materials.
The total cost of the Group’s property, plant and equipment at 31st December 20092010 was £18,757£18,895 million, with a net book value of £9,374£9,045 million. Of this, land and buildings represented £3,762£3,729 million, plant and equipment £3,433£3,144 million and assets in construction £2,179£2,172 million. In 2009,2010, GSK invested £1,423£1,038 million in new and renewal property, plant and equipment. This is mainly related to a large number of projects for the renewal, improvement and expansion of facilities at various worldwide sites. Property is mainly held freehold. New investment is financed from Group liquid resources. At 31st December 2009,2010, GSK had capital contractual commitments for future expenditure of £416£377 million and operating lease commitments of £337£415 million. GSK believes that its facilities are adequate for its current needs.
The Group observes stringent procedures and uses specialist skills to manage environmental risks from these activities. Environmental issues, sometimes dating from operations now modified or discontinued, are reported under ‘Responsibility and the environment’ (page 24)‘Environmental sustainability’ on page 32 and in Note 44 to the financial statements, ‘Legal proceedings’.
Goodwill
Goodwill has increased during the year from £2,101£3,361 million at 31st December 20082009 to £3,361£3,606 million. The increase primarily reflects the goodwill arising on the acquisition of Stiefel Laboratories, Inc.Laboratorios Phoenix S.A.I.C.yF. of £885 million, the Pfizer HIV business of £255£72 million and certain businesses from UCB S.A.the impact of £87 million.a strengthening of overseas currencies.
Other intangible assets
Other intangible assets include the cost of intangibles acquired from third parties and computer software. The net book value of other intangible assets as at 31st December 20092010 was £8,183£8,532 million (2008(2009 – £5,869£8,183 million). The increase in 20092010 reflects additions of £3,167£252 million through business combinations, and currency movements, partly offset by currency movements and the amortisation and impairment of existing intangibles. The largest element of the additions is £1,513 million relating to the acquisition of Stiefel Laboratories, Inc. reflecting the brands acquired together with the Stiefel trade name. In addition, £595 million relates to the fair value of the Pfizer HIV intellectual property acquired following the creation of the ViiV Healthcare business during the year and a further £445 million arises from the acquisition of certain businesses from UCB S.A.
GSK Annual Report 2009
37
Financial position and resources
Investments
GSK held investments, including associates and joint ventures, with a carrying value at 31st December 2010 of £1,792 million (2009 of– £1,349 million (2008 – £1,030 million). The market value at 31st December 20092010 was £2,225£2,688 million (2008(2009 – £1,883£2,225 million). The largest of these investments are in two associates: Quest Diagnostics Inc., which had a book value at 31st December 20092010 of £410£494 million (2008(2009 – £463£410 million) and Aspen Pharmacare Holdings Limited acquired this year, which had a book value at 31st December 20092010 of £397 million (2009 – £372 million.million). The investments include equity stakes in companies where the Group has research collaborations, which provide access to biotechnology developments of potential interest and interests in companies that arise from business divestments.
Derivative financial instruments: assets
GSK had both non-current and current derivative financial instruments held at fair value of £197£190 million (2008(2009 – £963£197 million). The small decrease primarily reflects lower currency volatilitya decrease in Euro, US dollarnet investment hedging volumes.
GSK Annual Report 2010
42
Financial position and Yen market rates.resources
Inventories
Inventory of £4,064£3,837 million has increaseddecreased by £8£227 million during the year. The increase arises from H1N1 vaccinedecrease reflects initiatives to reduce manufacturing cycle times andSynflorix stock-builds following regulatory approval in key markets; reduce stockholding days through more efficient use of inventory throughout the acquisition of Stiefel Laboratories, Inc.; strategic stock building to support growth in Emerging Markets and Japan, offset by a weakening of overseas currencies and improvements following implementation of the working capital reduction programme.supply chain.
Trade and other receivables
Trade and other receivables of £6,492£5,793 million have increaseddecreased from 20082009 reflecting the relatively high vaccine salesrecovery of significant levels of H1N1 indebt during the last quarter together with the Stiefel acquisition,year and specific actions taken to reduce overdue and other receivables as part of a Group initiative to reduce working capital. These reductions were partly offset by the impacta strengthening of a weakening of overseas currencies on the translation ofyear-end foreign currency receivables, the sale of long outstanding debt in certain European markets and Taiwan and reductions in overdue receivables in certain European and Asian markets.exchange rates.
Derivative financial instruments: liabilities
GSK held current and non-current derivative financial instruments held at fair value of £193 million (2009 – £168 million (2008 – £752 million current and £2 million non-current)current) relating primarily to hedging exchange on translation of currency assets on consolidation. The decrease againsmall increase reflects lowermarginally higher currency volatility on the Euro, US dollar and Yen.
Trade and other payables
Trade and other payables amounting to £6,772£6,888 million have increased from 2008 primarily2009, reflecting working capital improvement initiatives to extend supplier terms towards the Group’s 60 day60-day term objective and the acquisition of Stiefel Laboratories Inc., partly offset by a weakeningstrengthening of year-end foreign exchange rates.
Provisions
The Group carried deferred tax provisions and other short-term and non-current provisions of £3,886£5,991 million at 31st December 2009 (20082010 (2009 – £3,813£3,886 million) in respect of estimated future liabilities, of which £4,000 million (2009 – £2,020 millionmillion) related to legal and other disputes. Provision has been made for legal and other disputes, indemnified disposal liabilities and the costs of restructuring programmes to the extent that at the balance sheet date an actuala legal or constructive obligation existed and could be reasonablyreliably estimated.
Pensions and other post-employment benefits
The Group accounts for pension and other post-employment arrangements in accordance with IAS 19. The deficits, net of surpluses before allowing for deferred taxation were £1,745£1,224 million (2008(2009 – £1,697£1,745 million) on pension arrangements and £1,213£1,425 million (2008(2009 – £1,303£1,213 million) on unfunded post-employment liabilities. The pension liabilities increaseddecreased following an increase in asset values in the UK and the USA, deficit reduction contributions by the company and a weakening of long term interest rates, including a reductiondecrease in the long-term inflation rate, partly offset by reductions in the rate used to discount UK pension liabilities from 6.20%5.7% to 5.70%5.5% and an increase in the estimated long term inflation rate inused to discount US pension liabilities from 5.75% to 5.2%.
In December 2010, the UK partly offset by a positive impactscheme purchased an insurance contract, that will guarantee payment of exchange movements and higher asset values.specified pensioner liabilities. This contract was valued at £0.7 billion at 31st December 2010.
Net debt
| | | | | | | | | | | | | | | | | |
| | | 2009 | | 2008 | | | | | |
| | | £m | | £m | | | 2010 | | 2009 | |
| | | | | | £m | | £m | |
| Cash, cash equivalents and liquid investments | | 6,813 | | 6,014 | | | 6,241 | | 6,813 | |
| Borrowings – repayable within one year | | | (1,471 | ) | | | (956 | ) | | | (291 | ) | | | (1,471 | ) |
| Borrowings – repayable after one year | | | (14,786 | ) | | | (15,231 | ) | | | (14,809 | ) | | | (14,786 | ) |
| | | | | | | | |
| Net debt | | | (9,444 | ) | | | (10,173 | ) | | | (8,859 | ) | | | (9,444 | ) |
| | | | | | | | |
Net debt decreased by £729£585 million primarily from a weakening ofdue to the foreign currenciesfree cash flow generated by the company exceeding the amounts paid in which Groupdividends to shareholders and invested in new businesses.
Movements in net debt is denominated.
| | | | | | | | | |
| | | | | |
| | | 2010 | | | 2009 | |
| | | £m | | | £m | |
| Net debt at beginning of year | | | (9,444 | ) | | | (10,173 | ) |
| (Decrease)/increase in cash and bank overdrafts | | | (642 | ) | | | 1,054 | |
| Cash inflow from liquid investments | | | (91 | ) | | | (87 | ) |
| Net increase in long-term loans | | | – | | | | (1,358 | ) |
| Net repayment of short-term loans | | | 1,290 | | | | 102 | |
| Debt of subsidiary undertakings acquired | | | (20 | ) | | | (9 | ) |
| Exchange movements | | | 61 | | | | 1,041 | |
| Other movements | | | (13 | ) | | | (14 | ) |
| | | | | |
| Net debt at end of year | | | (8,859 | ) | | | (9,444 | ) |
| | | | | |
Total equity
A summary of the movements in equity is set out below.
| | | | | | | | | | | | | | | | | |
| | | 2009 | | 2008 | | | | | | |
| | | £m | | £m | | | 2010 | | 2009 | |
| | | | | | £m | | £m | |
| Total equity at beginning of year | | 8,318 | | 9,910 | | | 10,742 | | 8,318 | |
| Total comprehensive income for the year | | 4,996 | | 4,829 | | | 2,086 | | 4,996 | |
| Dividends to shareholders | | | (3,003 | ) | | | (2,929 | ) | | | (3,205 | ) | | | (3,003 | ) |
| Ordinary Shares issued | | 43 | | 62 | | | 62 | | 43 | |
| Ordinary Shares purchased and cancelled | | – | | | (3,706 | ) | |
| Changes in minority shareholdings | | 338 | | – | | |
| Put option over minority interest | | | (2 | ) | | – | | |
| Changes in non-controlling interests | | | – | | 338 | |
| Put option over non-controlling interest | | | – | | | (2 | ) |
| Consideration received for shares transferred by ESOP Trusts | | 13 | | 10 | | | 17 | | 13 | |
| Ordinary Shares acquired by ESOP Trusts | | | (57 | ) | | | (19 | ) | | | (16 | ) | | | (57 | ) |
| Share-based incentive plans | | 171 | | 241 | | | 175 | | 171 | |
| Tax on share-based incentive plans | | 14 | | | (1 | ) | | 2 | | 14 | |
| Distributions to minority interests | | | (89 | ) | | | (79 | ) | |
| Distributions to non-controlling interests | | | | (118 | ) | | | (89 | ) |
| | | | | | | | |
| Total equity at end of year | | 10,742 | | 8,318 | | | 9,745 | | 10,742 | |
| | | | | | | | |
At 31st December 2009,2010, total equity had increaseddecreased from £8,318£10,742 million at 31st December 20082009 to £10,742£9,745 million. The increase arisesdecrease arose principally from retained profitthe increased provision for legal charges in the year partly offset by actuarial losses on defined benefit pension plans.year.
GSK Annual Report 2009
38
Financial position and resources
Share purchases
In 2009,2010, the Employee Share Ownership Plan (ESOP) Trusts acquired £57£16 million of shares in GSK plc (2008(2009 – £19£57 million). Shares are held by the Trusts to satisfy future exercises of options and awards under the Group share option and award schemes. A proportion of the shares held by the Trusts are in respect of awards where the rules of the scheme require GSK to satisfy exercises through market purchases rather than the issue of new shares. The shares held by the Trusts are matched to options and awards granted.
At 31st December 2009,2010, the ESOP Trusts held 105 million (2009 – 118 million
(2008 – 129 million) GSK shares against the future exercise of share options and share awards. The carrying value of £1,138£845 million
(2008 (2009 – £1,445£1,138 million) has been deducted from other reserves. The market value of these shares was £1,554£1,308 million (2008(2009 – £1,657£1,554 million).
GSK Annual Report 2010
43
Financial position and resources
GSK did not repurchasepurchase any of its own shares for cancellation in 2009
(2008 – £3,706 million) or any shares to be held as Treasury shares
(20082010 (2009 – £nil). In order to ensureOn 3rd February 2011, GSK announced that GSK has sufficient flexibility to deliver its strategic priorities the company does not expectintends to make any significant repurchases under the existing share buy-back programme during 2010.repurchase £1-2 billion of shares in 2011, depending on market conditions and other factors. The exact amount and timing of future purchases after 2011, and whether the extent to which repurchased shares will be held as Treasury shares rather than beingor be cancelled, will be determined by the company and is dependent on market conditions and other factors. At 31st December 2009,2010, GSK held 474.2 million shares as Treasury shares (2008(2009 – 474.2 million shares), at a cost of £6,286 million (2008(2009 – £6,286 million), which has been deducted from retained earnings.
There have been no purchases since 31st December 2009 underNo shares were purchased in the existing programme.period 1st January 2011 to 3rd February 2011. In the period 4th February 2011 to 24th February 2011 10.4 million shares were purchased at a cost of £123.4 million.
Commitments and contingent liabilities
Financial commitments are summarised in Note 39 to the financial statements, ‘Commitments’. Other contingent liabilities and obligations in respect of short and long-term debt are set out in Note 31 to the financial statements, ‘Contingent liabilities’ and Note 32 to the financial statements, ‘Net debt’.
Amounts provided for pensions and post-retirement benefits are set out in Note 28 to the financial statements, ‘Pensions and other post-employment benefits’. Amounts provided for restructuring programmes and legal, environmental and other disputes are set out in Note 29 to the financial statements, ‘Other provisions’.
Contractual obligations and commitments
The following table sets out the Group’s contractual obligations and commitments at 31st December 20092010 as they fall due for payment.
| | | | | | | | | | | | | | | | | | | | | | | | | | | | | | | | | | | | | | | | | |
| | | Total | | Under 1 yr | | 1-3 yrs | | 3-5 yrs | | 5 yrs+ | | | | | |
| | | £m | | £m | | £m | | £m | | £m | | | Total | | Under 1 yr | | 1-3 yrs | | 3-5 yrs | | 5 yrs+ | |
| | | | | | | £m | | £m | | £m | | £m | | £m | |
| Loans | | 16,127 | | 1,431 | | 2,647 | | 2,538 | | 9,511 | | | 14,997 | | 259 | | 4,158 | | 2,407 | | 8,173 | |
| Interest on loans | | 10,733 | | 757 | | 1,507 | | 1,130 | | 7,339 | | | 10,312 | | 755 | | 1,394 | | 1,097 | | 7,066 | |
| Finance lease obligations | | 130 | | 40 | | 56 | | 19 | | 15 | | | 103 | | 32 | | 45 | | 18 | | 8 | |
| Finance lease charges | | 16 | | 4 | | 8 | | 3 | | 1 | | | 16 | | 5 | | 8 | | 3 | | – | |
| Operating lease commitments | | 337 | | 111 | | 122 | | 35 | | 69 | | | 415 | | 123 | | 119 | | 57 | | 116 | |
| Intangible assets | | 12,280 | | 694 | | 1,189 | | 2,022 | | 8,375 | | | 11,762 | | 720 | | 1,626 | | 2,150 | | 7,266 | |
| Property, plant & equipment | | 416 | | 300 | | 74 | | 42 | | – | | | 380 | | 278 | | 95 | | 7 | | – | |
| Business combinations | | | 285 | | 253 | | 12 | | 20 | | – | |
| Investments | | 86 | | 37 | | 12 | | 37 | | – | | | 37 | | 16 | | – | | 21 | | – | |
| Purchase commitments | | 82 | | 60 | | 21 | | 1 | | – | | | 1,127 | | 239 | | 314 | | 293 | | 281 | |
| Pensions | | 1,460 | | 365 | | 730 | | 365 | | – | | | 1,095 | | 365 | | 730 | | – | | – | |
| Other commitments | | 52 | | 8 | | 17 | | 22 | | 5 | | | 242 | | 110 | | 78 | | 49 | | 5 | |
| | | | | | | | | | | | | | | |
| Total | | 41,719 | | 3,807 | | 6,383 | | 6,214 | | 25,315 | | | 40,771 | | 3,155 | | 8,579 | | 6,122 | | 22,915 | |
| | | | | | | | | | | | | | | |
Commitments in respect of loans and future interest payable on loans are disclosed before taking into account the effect of derivatives. The Group has entered into a number of research collaborations to develop new compounds with other pharmaceutical companies. The terms of these arrangements can include upfront fees, equity investments, loans and commitments to fund specified levels of research. In addition, the Group will often agree to make further payments if future ‘milestones’ are achieved. As some of these agreements relate to compounds in the early stages of development, milestone payments will continue for a number of years if the compounds move successfully through the development process. Generally the closer the product is to marketing approval the greater the possibility of success. The paymentsamounts shown above within intangible assets represent the maximum that would be paid if all milestones are achieved.
were achieved, and include £8.6 billion of which relates to externalised projects in the discovery portfolio. A number of new commitments were made in 20092010 under licensing and other agreements, including arrangements with ChromaAmicus Therapeutics Limited, Concert Pharmaceuticals, Inc., IdenixAmplimmune Inc., Apeiron Biologics AG, Fondazione Telethon, Isis Pharmaceuticals Inc. Prosensa B.V. and Seattle Genetics, Inc.Shionogi & Co. Limited.
In 2009, GSK reached an agreement with the trustees of the UK pension schemes to make additional contributions over a five year period, to eliminate the pension deficit identified at the 31st December 2008 actuarial funding valuation. The table above shows this commitment but excludes the normal ongoing annual funding requirement of approximately £150£130 million. For further information on pension obligations, see Note 28 to the financial statements, ‘Pensions and other post-employment benefits’.
GSK Annual Report 2009
39
Financial position and resources
Contingent liabilities
The following table sets out contingent liabilities, comprising discounted bills, performance guarantees, letters of credit and other items arising in the normal course of business, and when they are expected to expire.
| | | | | | | | | | | | | | | | | | | | | | | | | | | | | | | | | | | | | | | | | |
| | | Total | | Under 1 yr | | 1-3 yrs | | 3-5 yrs | | 5 yrs+ | | | | | |
| | | £m | | £m | | £m | | £m | | £m | | | Total | | Under 1 yr | | 1-3 yrs | | 3-5 yrs | | 5 yrs+ | |
| | | | | | £m | | £m | | £m | | £m | | £m | |
| Guarantees | | 110 | | 72 | | 28 | | – | | 10 | | | 110 | | 64 | | 1 | | 1 | | 44 | |
| Other contingent liabilities | | 40 | | 5 | | 12 | | 2 | | 21 | | | 55 | | 22 | | 10 | | 1 | | 22 | |
| | | | | | | | | | | | | | |
| Total | | 150 | | 77 | | 40 | | 2 | | 31 | | | 165 | | 86 | | 11 | | 2 | | 66 | |
| | | | | | | | | | | | | | |
In the normal course of business, GSK has provided various indemnification guarantees in respect of business disposals in which legal and other disputes have subsequently arisen. A provision is made where an outflow of resources is considered probable and a reasonable estimate can be made of the likely outcome of the dispute and this is included in Note 29 to the financial statements, ‘Other provisions’.
It is the Group’s policy to provide for the settlement costs of asserted claims and environmental disputes when an outflow of resources is considered probable and a reasonablereliable estimate may be made. Prior to this point no liability is recorded. Legal and environmental costs are discussed in ‘Risk factors’ on pages 4353 to 4757 and Note 44 to the financial statements, ‘Legal proceedings’. GSK continues to believe that it has made adequate provision for the liabilities likely to arise from open taxation assessments. The ultimate liability for such matters may vary significantly from amounts provided and is dependent upon the outcome of litigation proceedings and negotiations with the relevant tax authorities. This is discussed further in Note 14 to the financial statements, ‘Taxation’.
GSK Annual Report 2010
44
Financial position and resources
Cash flow
A summary of the consolidated cash flow is set out below.
| | | | | | | | | | | | | | | | | |
| | | 2009 | | 2008 | | | | | | |
| | | £m | | £m | | | 2010 | | 2009 | |
| | | | | | £m | | £m | |
| Net cash inflow from operating activities | | 7,841 | | 7,205 | | | 6,797 | | 7,841 | |
| Net cash outflow from investing activities | | | (4,013 | ) | | | (1,149 | ) | | | (1,868 | ) | | | (4,013 | ) |
| Net cash outflow from financing activities | | | (2,774 | ) | | | (4,908 | ) | | | (5,571 | ) | | | (2,774 | ) |
| | | | | | | | |
| Increase in cash and bank overdrafts | | 1,054 | | 1,148 | | |
| (Decrease)/increase in cash and bank overdrafts | | | | (642 | ) | | 1,054 | |
| Exchange adjustments | | | (158 | ) | | 1,103 | | | 81 | | | (158 | ) |
| Cash and bank overdrafts at beginning of year | | 5,472 | | 3,221 | | | 6,368 | | 5,472 | |
| | | | | | | | |
| Cash and bank overdrafts at end of year | | 6,368 | | 5,472 | | | 5,807 | | 6,368 | |
| | | | | | | | |
| | | |
| Cash and bank overdrafts at end of year comprise: | | |
| Cash and cash equivalents | | 6,545 | | 5,623 | | | 6,057 | | 6,545 | |
| Overdrafts | | | (177 | ) | | | (151 | ) | | | (250 | ) | | | (177 | ) |
| | | | | | | | |
| | | 6,368 | | 5,472 | | | 5,807 | | 6,368 | |
| | | | | | | | |
The net cash inflow from operating activities after taxation paid was £7,841£6,797 million, an increasea decrease of £636£1,044 million over 20082009 reflecting higher profit before tax, excluding the impact of the significant increase in non-cash charges madelegal settlements in the year primarily from the major restructuring programmes.partly offset by a net working capital reduction.
The net cash outflow from investing activities was £4,013£1,868 million, an increasea decrease of £2,864£2,145 million which primarily reflected a significant increase in the cost oflower business purchases during 2010 of £354 million. In 2009 includingbusiness purchases were £2,792 million primarily Stiefel Laboratories, Inc. for £1,993 million net of cash acquired of £74 million, certain businesses from UCB S.A. for £472 million net of cash acquired of £5 million, and AZ Tika for £146 million. In 2008, the comparable acquisitions comprised Sirtris Pharmaceuticals for £324 million net of cash acquired of £52 million, and the Egyptian business of BMS for £130 million net of deferred consideration of £10 million. In addition salespurchases of liquid investments realised cash of £905property, plant and equipment were lower by £404 million in 2008.2010.
Free cash flow
Free cash flow is the amount of cash generated by the business after meeting its obligations for interest, tax and dividends paid to minoritynon-controlling interests, and after capital expenditure on non-current tangible and intangible assets. For 2009 free
Free cash flow was £5,254adversely impacted by legal settlements of £2,047 million an increase of 12% over 2008. This principally reflected(2009 – £254 million). Free cash flow excluding legal settlements was £6,533 million in 2010, compared with £5,508 million in 2009, the higher operating profit before non-cash charges (primarily fromimprovement reflecting the major restructuring programmes)reduction in working capital and lower expenditure on intangible assets. This was partly offset by higher levels of net interest paid as a result of the debt issuance during the year of€1.6 billion under the EMTN programme and reduced interest income on deposits.property, plant & equipment.
Free cash flow is used by GSK’s management for planning and reporting purposes and in discussions with and presentations to investment analysts and rating agencies. GSK’s free cash flow measure is not defined in IFRS. This measure may not be directly comparable with similarly described measures used by other companies. A reconciliation of net cash inflow from operating activities, which is the closest equivalent IFRS measure, to free cash flow is shown below.
Reconciliation of free cash flow
| | | | | | | | | |
| | | 2009 | | | 2008 | |
| | | £m | | | £m | |
| | | | |
| Net cash inflow from operating activities | | | 7,841 | | | | 7,205 | |
| Purchase of property, plant and equipment | | | (1,418 | ) | | | (1,437 | ) |
| Purchase of non-current intangible assets | | | (455 | ) | | | (632 | ) |
| Disposal of property, plant and equipment | | | 48 | | | | 20 | |
| Interest paid | | | (780 | ) | | | (730 | ) |
| Interest received | | | 90 | | | | 320 | |
| Dividends received from joint ventures and associated undertaking | | | 17 | | | | 12 | |
| Dividends paid to minority interests | | | (89 | ) | | | (79 | ) |
| | | | |
| Free cash flow | | | 5,254 | | | | 4,679 | |
| | | | |
GSK Annual Report 2009
40
Financial position and resources
Movements in net debt
| | | | | | | | | |
| | | 2009 | | | 2008 | |
| | | £m | | | £m | |
| | | | |
| Net debt at beginning of year | | | (10,173 | ) | | | (6,039 | ) |
| Increase in cash and bank overdrafts | | | 1,054 | | | | 1,148 | |
| Cash inflow from liquid investments | | | (87 | ) | | | (905 | ) |
| Net increase in long-term loans | | | (1,358 | ) | | | (5,523 | ) |
| Net repayment of short-term loans | | | 102 | | | | 3,059 | |
| Debt of subsidiary undertakings acquired | | | (9 | ) | | | – | |
| Exchange movements | | | 1,041 | | | | (1,918 | ) |
| Other movements | | | (14 | ) | | | 5 | |
| | | | |
| Net debt at end of year | | | (9,444 | ) | | | (10,173 | ) |
| | | | |
| | | | | | | | | |
| | | | | | | |
| | | 2010 | | | 2009 | |
| | | £m | | | £m | |
| Net cash inflow from operating activities | | | 6,797 | | | | 7,841 | |
| Purchase of property, plant and equipment | | | (1,014 | ) | | | (1,418 | ) |
| Purchase of non-current intangible assets | | | (621 | ) | | | (455 | ) |
| Disposal of property, plant and equipment | | | 92 | | | | 48 | |
| Interest paid | | | (775 | ) | | | (780 | ) |
| Interest received | | | 107 | | | | 90 | |
| Dividends received from joint ventures and associated undertaking | | | 18 | | | | 17 | |
| Distributions to non-controlling interests | | | (118 | ) | | | (89 | ) |
| | | | | |
| Free cash flow | | | 4,486 | | | | 5,254 | |
| | | | | |
Investment appraisal
GSK has a formal process for assessing potential investment proposals in order to ensure decisions are aligned with the Group’s overall strategy. This process includes an analysis of the impact of the project on earnings, its return on invested capital and an assessment of the return based on discounted cash flows. The discount rate used to perform financial analysis is decided internally, to allow determination of the extent to which investments cover the Group’s cost of capital. For specific investments the discount rate may be adjusted to take into account country or other risk weightings.
Capital expenditure and financial investment
Cash payments for tangible and intangible fixed assets amounted to £1,873£1,635 million (2008(2009 – £2,069 million; 2007 – £2,143£1,873 million). Disposals realised £404£218 million (2008(2009 – £191 million; 2007 – £44£404 million). Cash payments to acquire equity investments of £154£279 million (2008(2009 – £87 million; 2007 – £186£154 million) were made in the year and sales of equity investments realised £27 million (2009 – £59 million (2008 – £42 million; 2007 – £45 million).
Future cash flow
The Group expects that future operating cash flow will be sufficient to fund its operating and debt service costs, to satisfy normal levels of capital expenditure, to meet obligations under existing licensing agreements, to meet the expenditure arising from the major restructuring programmes (the precise timing of which is uncertain) outlined in Note 7 to the financial statements, ‘Major restructuring programmes’ and to meet other routine outflows including tax and dividends, subject to the ‘Risk factors’ discussed on pages 4353 to 47.57. GSK may from time to time have additional demands for finance, such as for acquisitions.acquisitions and share repurchases. It has access to other sources of liquidity from short and long-term capital markets and banks and other financial institutions, in addition to the cash flow from operations, for such needs.
GSK Annual Report 2010
45
Financial position and resources
Payment policies
Group companies are responsible for monitoring and managing their working capital. The terms of sales collections and supplier payments reflect local commercial practice.
In the UK, the company and each of its UK subsidiaries have policies to ensure that suppliers are paid on time. In particular, the UK companies seek:
| • | | to settle terms of payment with suppliers when agreeing the terms of the transaction |
| |
| • | | to ensure that suppliers are made aware of the agreed terms of payment |
| |
| • | | to abide by the terms of payment. |
The policy permits arrangements for accelerated payment to small suppliers.
Payment performance
At 31st December 2009,2010, the average number of days’ payable outstanding represented by trade payables of the parent company was nil (2008(2009 – nil) and in respect of the company and its UK subsidiaries in aggregate was 4450 days (2008(2009 – 2044 days).
Treasury policies
GSK reports in Sterling and pays dividends out of Sterling profits. The role of Corporate Treasury is to manage and monitor our external and internal funding requirements and financial risks in support of our strategic objectives. Treasury activities are governed by policies and procedures approved by the Board of Directors, most recently on 1st7th October 2009.2010.
A Treasury Management Group (“TMG”)(TMG) chaired by our Chief Financial Officer, meets on a monthly basis to review treasury activities. Its members receive management information relating to treasury activities.
Capital management
GSK operates on a global basis, primarily through subsidiary companies established in the markets in which we trade. With significant levels of patent or trademark protection, our products compete largely on product efficacy or differentiation rather than on price. Selling margins are sufficient to cover normal operating costs and our operating subsidiariesoperations are generally cash generative.
Operating cash flow is used to fund investment in research and development of new products. It is also used to make the routine outflows of capital expenditure, tax, dividends, repayment of maturing debt and, to the extent determined by the Board, share repurchases. In 2011, as part of a new long-term share buy-back programme and depending on market conditions and other factors, we expect to re-purchase £1-2 billion of shares.
Our policy is to borrow centrally using a variety of capital market issues and borrowing facilities to meet anticipated funding requirements.
These borrowings, together with cash generated from operations, are on-lent, contributed as equity to certain subsidiaries or used to pay dividends and make acquisitions. GSK did not make any share repurchases in 2009.2010.
For further details see Note 41 to the financial statements ‘Financial instruments and related disclosures’.
GSK Annual Report 2009
41
Financial position and resources
Liquidity
As at 31st December 2009,2010, our cash and liquid investments were held as follows:
| | | | | | | | | |
| | | 2009 | | | 2008 | |
| | | £m | | | £m | |
| | | | |
| Bank balances and deposits | | | 5,206 | | | | 3,778 | |
US Treasury and Treasury repo
only money market funds | | | 1,305 | | | | 1,852 | |
| Corporate debt instruments | | | 10 | | | | 75 | |
| Government securities | | | 292 | | | | 309 | |
| | | | |
| | | | 6,813 | | | | 6,014 | |
| | | | |
| |
| £4.9 billion of this amount is managed centrally and available within three months. We had net debt at 31st December 2009 of £9.4 billion. The table below summarises cash and gross debt after the effects of hedging. |
| |
| | | 2009 | | | 2008 | |
| | | £m | | | £m | |
| | | | |
| Cash and liquid investments | | | 6,813 | | | | 6,014 | |
| Gross debt – fixed | | | (13,706 | ) | | | (13,814 | ) |
| – floating | | | (2,550 | ) | | | (2,373 | ) |
| – non-interest bearing | | | (1 | ) | | | – | |
| | | | |
| Net debt | | | (9,444 | ) | | | (10,173 | ) |
| | | | |
| | | | | | | | | |
| | | | | | | |
| | | 2010 | | | 2009 | |
| | | £m | | | £m | |
| Bank balances and deposits | | | 5,660 | | | | 5,206 | |
| US Treasury and Treasury repo only money market funds | | | 360 | | | | 1,305 | |
| Corporate debt instruments | | | 10 | | | | 10 | |
| Government securities | | | 211 | | | | 292 | |
| | | | | |
| | | | 6,241 | | | | 6,813 | |
| | | | | |
AtOur centrally managed cash reserves amounted to £3.0 billion at 31st December 2009, we2010, all available within 3 months. This excludes £0.9 billion centrally managed cash held by ViiV Healthcare, an 85% owned subsidiary. We also had centrally available cash reserves$3.9 billion of £4.9 billion andundrawn committed undrawn bank facilities of $3.9 billion.facilities. As at that date we had short-term debt and bankshort term overdrafts and loans repayable within one year of £1.5 billion.£259 million. We had net debt of £8.9 billion at 31st December 2010. The table below summarises cash and gross debt after the effects of hedging.
| | | | | | | | | |
| | | | | | | |
| | | 2010 | | | 2009 | |
| | | £m | | | £m | |
| Cash and liquid investments | | | 6,241 | | | | 6,813 | |
| Gross debt – fixed | | | (13,740 | ) | | | (13,706 | ) |
| – floating | | | (1,358 | ) | | | (2,550 | ) |
| – non-interest bearing | | | (2 | ) | | | (1 | ) |
| | | | | |
| Net debt | | | (8,859 | ) | | | (9,444 | ) |
| | | | | |
We manage our net borrowing requirements through a portfolio of long-term borrowings, including bonds, together with short-term finance under a $10 billion commercial paper programme. The commercial paper programme is backed byand $3.9 billion of committed facilities. The facilities were last renewed in October 2009.2010. We consider this level of committed facilities to be adequate given our current cash holdings.liquidity requirements. For further information on these facilities, see Note 32 to the financial statements, ‘Net debt’. We also benefit from strong positive cash flow from operating units.
We have a European Medium Term Note programme of £15 billion. At 31st December 2009,2010, we had £8.5£8.3 billion of notes in issue under this programme. We also have a US shelf registration statement. At 31st December 2009,2010, we had $11$10.1 billion (£6.96.5 billion) of notes in issue under this programme. The TMG monitors the cash flow forecast on a monthly basis.
The long-term borrowings mature at dates between 2012 and 2042. Our long-term debt ratings have remained stable since February 2008. Currently we are rated A+ stable outlook by Standard and Poor’s and A1 stable outlook by Moody’s.Moody’s Investors Service ‘Moody’s’. Our short-term debt ratings are A-1 and P-1 with Standard and Poor’s and Moody’s respectively.
The maturity profile of gross debt is shown in the table below:GSK Annual Report 2010
46
Financial position and resources
Maturity profile of gross debt
GSK Annual Report 2009
42
Financial position and resources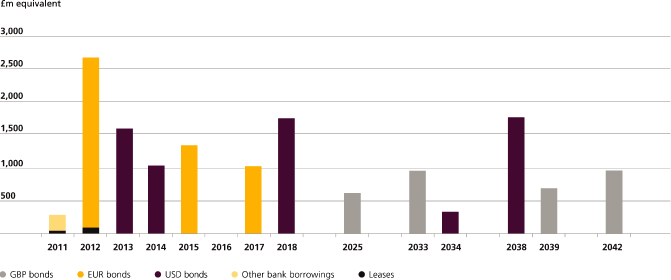
Treasury operations
The objective of treasury activity is to manage the post-tax net cost or income of financial operations to the benefit of earnings. Corporate Treasury does not operate as a profit centre. We use a variety of financial instruments to finance our operations and derivative financial instruments to manage market risks from these operations. These derivatives, principally comprising forward foreign currency contracts, interest rate and currency swaps, are used to swap borrowings and liquid assets into our required currencies and to manage exposure to funding risks from changes in foreign exchange and interest rates.
We do not hold or issue derivatives for speculative purposes. Our treasury policies specifically prohibit such activity. All transactions in financial instruments are undertaken to manage the risks arising from underlying business activities, not for speculation.
Foreign exchange management
Foreign currency transaction exposures arising on internal and external trade flows are not hedged. The exposure of overseas operating subsidiaries to transaction risk is minimised by matching local currency income with local currency costs.
For this purpose, our internal trading transactions are matched centrally and we manage intercompanyinter-company payment terms to reduce foreign currency risk. Exceptional foreign currency cash flows are hedged selectively under the management of Corporate Treasury.
We manage the short-term cash surpluses or borrowing requirements of subsidiary companies centrally using forward contracts to hedge future repayments back into the originating currency.
We seek to denominate borrowings in the currencies of our principal assets and cash flows. These are primarily denominated in US dollars, Euros and Sterling. Certain borrowings arecan be swapped into other currencies as required.
Borrowings denominated in, or swapped into, foreign currencies that match investments in our overseas assets may be treated as a hedge against the relevant assets. Forward contracts are also used in major currencies to reduce our exposure to our investment in overseas Group assets (see ‘Net Investment Hedges’ section of Note 41 for further details). The TMG reviews the ratio of borrowings to assets for major currencies.
Interest rate risk management
The policy on interest rate risk management limits the amount of floating rate interest payments to a prescribed percentage of trading profit.
We use ana series of interest rate swapswaps to re-denominate one of our external borrowings into the interest rate coupon required by GSK. The duration of this swap matches the duration of the principal instrument. Interest rate derivative instruments are accounted for as fair value or cash flow hedges of the relevant assets or liabilities.
Counterparty risk management
Our policy on counterparty risk management is to work with a select group of relationship banks. Global counterparty limits are assigned to each of GSK’s banking and investment counterparties based on long-term credit ratings from Moody’s and Standard and Poor’s. Corporate Treasury’s usage of these limits is monitored daily by a Corporate Compliance Officer (CCO) who operates independently of Corporate Treasury. Any breach of these limits is reported to the CFO immediately. The CCO also monitors the credit rating of these counterparties and, when changes in ratings occur, notifies Corporate Treasury so that changes can be made to investment levels or authority limits as appropriate. A full counterparty analysis is presented to the TMG annually for approval.
Financial assets and liabilities
An analysis of net debt is given in Note 32 to the financial statements, ‘Net debt’. An analysis of financial assets and liabilities at carrying value and fair value is given in Note 41 to the financial statements, ‘Financial instruments and related disclosures’.
We continue to benefit from strong positive cash flow from operating activities. Our net debt has decreased in the year to 31st December 2009, despite GSK’s acquisition activities in2010, reflecting the period which totalled approximately £2.8 billion. For further information on these activities, see Note 38 tobenefits of our ongoing restructuring programme and the financial statements, ‘Acquisitions and Disposals’.success of our working capital initiatives.
The financial assets and liabilities at 31st December 20092010 are representative of our treasury policies and strategies applied since July 2007.approved by the Board of Directors, most recently on 7th October 2010. In 20092010, GSK raised approximately £1.4 billion (2008 – £6.3 billion)did not raise any debt in the Capital Markets. We did notMarkets or make any share repurchases in 2009.repurchases.
GSK Annual Report 20092010
4347
Financial review 2009
In accordance with US SEC disclosure requirements, the following discussion compares results for the year to 31st December 2009 with the results for the year to 31st December 2008.
Financial information and the discussion that follows is presented on the basis that GSK was organised and managed in 2009.
Exchange
The currencies that most influence the Group’s results remain the US dollar, the Euro and the Japanese Yen.
During 2009, average Sterling exchange rates were weaker against the US Dollar, the Euro and the Yen compared with 2008. 2009 year-end Sterling exchange rates were stronger against all three currencies compared with those at 31st December 2008.
Pharmaceutical turnover
All growth rates included in the review of turnover are at constant exchange rates (CER) unless otherwise stated. Sterling growth rates may be found in the tables of pharmaceutical turnover by therapeutic areas on page 48 and by geographic region on page 49.
Pharmaceutical turnover grew 2% to £23.7 billion. Pharmaceuticals growth was helped by sales of pandemic products. On a regional basis, the USA declined 13% reflecting continued erosion of several products due to generic competition. Strong performances were delivered in Europe, up 9%), Emerging Markets, up 20% and Asia Pacific/Japan, up 16%. The sales contribution of Stiefel, which was acquired on 22nd July 2009, totalled £248 million.
Pharmaceutical turnover by therapeutic area
GSK turnover grew by 2% in 2009 as the impact of US generic competition to a range of GSK’s products, lowerAvandiasales and a declining HIV business was more than offset by strong growth of key products such asSeretide/Advair, Avodart, Lovaza, Relenzaand the vaccines franchise including the H1N1 pandemic vaccine.
Respiratory
Respiratory sales increased 5% to £7.0 billion.
Seretide/Advairgrew 5% to £5.0 billion, with especially strong growth in Emerging Markets, up 21% to £276 million and Japan, up 79% to £195 million.Ventolinsales grew 26% to £477 million, driven by its performance in the USA where sales more than doubled to £153 million.Veramystsales rose 72% to £142 million.
Anti-virals
Anti-virals increased 12% to £4.2 billion.
Relenzasales were £720 million in 2009 (2008 – £57 million) reflecting the successful capacity expansion to meet government orders across the world and a strong retail performance in Japan of £191 million. Sales ofValtrexdeclined 8% to £1.3 billion as a result of generic competition to the product in the USA which began in November 2009.
Sales of HIV medicines totalled £1.6 billion, down 7% for the year.Epzicomsales grew 8% to £546 million but this was more than offset by declines across the rest of the portfolio. ViiV Healthcare, the specialist HIV company established by GSK and Pfizer, was officially launched on 3rd November 2009.
CNS
CNS sales decreased 44% to £1.9 billion.
The majority of GSK’s CNS franchise is impacted by generic competition in the USA. TheWellbutrin decline of 67% primarily reflected the sale ofWellbutrin XLin the USA to Biovail in the second quarter of 2009.
Cardiovascular and urogenital
Cardiovascular and urogenital sales increased 8% to £2.3 billion.
Continued strong growth of key products such asArixtra,up 29% to £254 million,Avodart,up 16% to £530 million, andLovaza,up 31% to £450 million, were partly offset by generic competition toCoreg.
Metabolic
Metabolic sales decreased 14% to £1.2 billion.
Sales ofAvandia,down 16% to £771 million, continued to decline across all regions.Bonviva/Bonivasales declined in the USA by 16% but grew in Europe and the Rest of the World.
Oncology and emesis
Oncology and emesis sales increased 10% to £0.6 billion.
Tyverb/Tykerb,up 45% to £169 million, grew strongly in Europe and the Rest of World following product approvals gained during 2008.Zofrandeclined 11% as a result of generic competition.
Vaccines
Vaccine sales increased 30% to £3.7 billion.
Pandemic vaccine sales of £883 million were recorded during the year, most of which were delivered in the fourth quarter, as GSK partnered with governments to respond to the H1N1 pandemic.
Sales of GSK’s newSynflorix vaccine totalled £73 million, reflecting launches in several markets and the beginning of shipments to the Brazilian Government as part of the 10-year, $1.5 billion agreement signed in August 2009. Other strong contributors to growth for the year includedBoostrix,up 73% to £139 million,Cervarix,up 38% to £187 million andRotarix,up 50% to £282 million. Partially offsetting these performances, sales ofInfanrix/Pediarix fell 15% to £649 million, primarily as a result of the continued impact of increased competition in the DTPa sector in the USA. Hepatitis vaccines sales also fell 11% to £665 million in part due to a competitor product returning to the US market.
GSK Annual Report 2010
48
Financial review 2009
Pharmaceutical turnover by therapeutic area 2009
| | | | | | | | | | | | | | | | | | | | | | | | | | | | | | | | | | | | | | | | | | | | | | | | | | | | | |
| | | | | | | | | | | |
| | | Total | | | USA | | | Europe | | | Rest of World | |
| Therapeutic area/ | | 2009 | | | 2008 | | | | | | | Growth | | | 2009 | | | | | | | Growth | | | 2009 | | | | | | | Growth | | | 2009 | | | | | | | Growth | |
| major products | | £m | | | £m | | | CER% | | | £% | | | £m | | | CER% | | | £% | | | £m | | | CER% | | | £% | | | £m | | | CER% | | | £% | |
Respiratory | | | 6,977 | | | | 5,817 | | | | 5 | | | | 20 | | | | 3,323 | | | | 3 | | | | 22 | | | | 2,201 | | | | 3 | | | | 11 | | | | 1,453 | | | | 14 | | | | 30 | |
Avamys/Veramyst | | | 142 | | | | 72 | | | | 72 | | | | 97 | | | | 68 | | | | 2 | | | | 21 | | | | 45 | | | | >100 | | | | >100 | | | | 29 | | | | >100 | | | | >100 | |
Flixonase/Flonase | | | 171 | | | | 186 | | | | (20 | ) | | | (8 | ) | | | 27 | | | | (56 | ) | | | (48 | ) | | | 43 | | | | (21 | ) | | | (17 | ) | | | 101 | | | | 2 | | | | 23 | |
Flixotide/Flovent | | | 775 | | | | 677 | | | | – | | | | 14 | | | | 396 | | | | 5 | | | | 25 | | | | 178 | | | | (4 | ) | | | 2 | | | | 201 | | | | (6 | ) | | | 9 | |
Seretide/Advair | | | 4,977 | | | | 4,137 | | | | 5 | | | | 20 | | | | 2,592 | | | | 1 | | | | 20 | | | | 1,609 | | | | 5 | | | | 14 | | | | 776 | | | | 23 | | | | 39 | |
Serevent | | | 236 | | | | 263 | | | | (19 | ) | | | (10 | ) | | | 73 | | | | (14 | ) | | | 1 | | | | 116 | | | | (18 | ) | | | (15 | ) | | | 47 | | | | (31 | ) | | | (15 | ) |
Ventolin | | | 477 | | | | 339 | | | | 26 | | | | 41 | | | | 153 | | | | >100 | | | | >100 | | | | 150 | | | | 1 | | | | 9 | | | | 174 | | | | 2 | | | | 12 | |
Zyrtec | | | 75 | | | | 38 | | | | 58 | | | | 97 | | | | – | | | | – | | | | – | | | | – | | | | – | | | | – | | | | 75 | | | | 58 | | | | 97 | |
| | | | | | | | | | | | | | | | | | | | | | | | | | | | | | | | | | | | | | |
Anti-virals | | | 4,150 | | | | 3,206 | | | | 12 | | | | 29 | | | | 1,897 | | | | – | | | | 19 | | | | 1,074 | | | | 16 | | | | 26 | | | | 1,179 | | | | 32 | | | | 56 | |
| HIV | | | 1,605 | | | | 1,513 | | | | (7 | ) | | | 6 | | | | 716 | | | | (6 | ) | | | 12 | | | | 635 | | | | (10 | ) | | | – | | | | 254 | | | | (3 | ) | | | 7 | |
Agenerase, Lexiva | | | 178 | | | | 160 | | | | (4 | ) | | | 11 | | | | 99 | | | | 1 | | | | 19 | | | | 62 | | | | (8 | ) | | | 2 | | | | 17 | | | | (13 | ) | | | 6 | |
Combivir | | | 425 | | | | 433 | | | | (13 | ) | | | (2 | ) | | | 187 | | | | (12 | ) | | | 4 | | | | 151 | | | | (17 | ) | | | (9 | ) | | | 87 | | | | (7 | ) | | | – | |
Epivir | | | 129 | | | | 139 | | | | (19 | ) | | | (7 | ) | | | 48 | | | | (13 | ) | | | 2 | | | | 49 | | | | (24 | ) | | | (16 | ) | | | 32 | | | | (18 | ) | | | (6 | ) |
Epzicom/Kivexa | | | 546 | | | | 442 | | | | 8 | | | | 24 | | | | 223 | | | | 6 | | | | 25 | | | | 244 | | | | 6 | | | | 17 | | | | 79 | | | | 25 | | | | 44 | |
Trizivir | | | 201 | | | | 212 | | | | (17 | ) | | | (5 | ) | | | 104 | | | | (17 | ) | | | (2 | ) | | | 82 | | | | (21 | ) | | | (11 | ) | | | 15 | | | | – | | | | 7 | |
Ziagen | | | 105 | | | | 106 | | | | (13 | ) | | | (1 | ) | | | 51 | | | | (4 | ) | | | 13 | | | | 35 | | | | (14 | ) | | | (3 | ) | | | 19 | | | | (28 | ) | | | (24 | ) |
Valtrex | | | 1,294 | | | | 1,195 | | | | (8 | ) | | | 8 | | | | 942 | | | | (9 | ) | | | 8 | | | | 160 | | | | – | | | | 11 | | | | 192 | | | | (13 | ) | | | 6 | |
Relenza | | | 720 | | | | 57 | | | | >100 | | | | >100 | | | | 137 | | | | >100 | | | | >100 | | | | 212 | | | | >100 | | | | >100 | | | | 371 | | | | >100 | | | | >100 | |
Zeffix | | | 217 | | | | 188 | | | | (1 | ) | | | 15 | | | | 17 | | | | (7 | ) | | | 13 | | | | 29 | | | | (4 | ) | | | 7 | | | | 171 | | | | – | | | | 17 | |
| | | | | | | | | | | | | | | | | | | | | | | | | | | | | | | | | | | | | | |
Central nervous system | | | 1,870 | | | | 2,897 | | | | (44 | ) | | | (35 | ) | | | 651 | | | | (69 | ) | | | (64 | ) | | | 574 | | | | (7 | ) | | | 2 | | | | 645 | | | | 4 | | | | 25 | |
Imigran/lmitrex | | | 266 | | | | 687 | | | | (65 | ) | | | (61 | ) | | | 123 | | | | (79 | ) | | | (78 | ) | | | 96 | | | | (8 | ) | | | – | | | | 47 | | | | (2 | ) | | | 15 | |
Lamictal | | | 500 | | | | 926 | | | | (53 | ) | | | (46 | ) | | | 267 | | | | (68 | ) | | | (62 | ) | | | 154 | | | | (4 | ) | | | 5 | | | | 79 | | | | 6 | | | | 16 | |
Requip | | | 209 | | | | 266 | | | | (30 | ) | | | (21 | ) | | | 26 | | | | (78 | ) | | | (75 | ) | | | 138 | | | | (5 | ) | | | 4 | | | | 45 | | | | 16 | | | | 45 | |
Requip XL | | | 123 | | | | 43 | | | | >100 | | | | >100 | | | | 32 | | | | >100 | | | | >100 | | | | 89 | | | | >100 | | | | >100 | | | | 2 | | | | – | | | | – | |
Seroxat/Paxil | | | 523 | | | | 514 | | | | (15 | ) | | | 2 | | | | 42 | | | | (51 | ) | | | (47 | ) | | | 99 | | | | (21 | ) | | | (14 | ) | | | 382 | | | | (5 | ) | | | 19 | |
Treximet | | | 55 | | | | 25 | | | | 88 | | | | >100 | | | | 55 | | | | 84 | | | | >100 | | | | – | | | | – | | | | – | | | | – | | | | – | | | | – | |
Wellbutrin, Wellbutrin XL | | | 132 | | | | 342 | | | | (67 | ) | | | (61 | ) | | | 88 | | | | (76 | ) | | | (72 | ) | | | 30 | | | | 50 | | | | 67 | | | | 14 | | | | (7 | ) | | | – | |
| | | | | | | | | | | | | | | | | | | | | | | | | | | | | | | | | | | | | | |
Cardiovascular and urogenital | | | 2,298 | | | | 1,847 | | | | 8 | | | | 24 | | | | 1,415 | | | | 8 | | | | 28 | | | | 583 | | | | 3 | | | | 14 | | | | 300 | | | | 18 | | | | 32 | |
Arixtra | | | 254 | | | | 170 | | | | 29 | | | | 49 | | | | 141 | | | | 35 | | | | 60 | | | | 95 | | | | 18 | | | | 34 | | | | 18 | | | | 55 | | | | 64 | |
Avodart | | | 530 | | | | 399 | | | | 16 | | | | 33 | | | | 319 | | | | 11 | | | | 32 | | | | 148 | | | | 13 | | | | 25 | | | | 63 | | | | 51 | | | | 62 | |
Coreg | | | 172 | | | | 203 | | | | (29 | ) | | | (15 | ) | | | 171 | | | | (28 | ) | | | (15 | ) | | | – | | | | – | | | | – | | | | 1 | | | | (67 | ) | | | (67 | ) |
Fraxiparine | | | 229 | | | | 226 | | | | (7 | ) | | | 1 | | | | – | | | | – | | | | – | | | | 173 | | | | (10 | ) | | | (3 | ) | | | 56 | | | | 6 | | | | 17 | |
Levitra | | | 75 | | | | 60 | | | | 7 | | | | 25 | | | | 70 | | | | 4 | | | | 23 | | | | 4 | | | | 33 | | | | 33 | | | | 1 | | | | – | | | | – | |
Lovaza | | | 450 | | | | 290 | | | | 31 | | | | 55 | | | | 448 | | | | 31 | | | | 55 | | | | – | | | | – | | | | – | | | | 2 | | | | 100 | | | | 100 | |
Vesicare | | | 104 | | | | 71 | | | | 24 | | | | 46 | | | | 104 | | | | 24 | | | | 46 | | | | – | | | | – | | | | – | | | | – | | | | – | | | | – | |
Volibris | | | 19 | | | | 2 | | | | >100 | | | | >100 | | | | – | | | | – | | | | – | | | | 18 | | | | >100 | | | | >100 | | | | 1 | | | | – | | | | – | |
| | | | | | | | | | | | | | | | | | | | | | | | | | | | | | | | | | | | | | |
Metabolic | | | 1,181 | | | | 1,191 | | | | (14 | ) | | | (1 | ) | | | 581 | | | | (17 | ) | | | (2 | ) | | | 275 | | | | (15 | ) | | | (6 | ) | | | 325 | | | | (8 | ) | | | 6 | |
Avandiaproducts | | | 771 | | | | 805 | | | | (16 | ) | | | (4 | ) | | | 425 | | | | (17 | ) | | | (2 | ) | | | 171 | | | | (21 | ) | | | (14 | ) | | | 175 | | | | (9 | ) | | | 1 | |
Avandia | | | 462 | | | | 512 | | | | (21 | ) | | | (10 | ) | | | 276 | | | | (22 | ) | | | (8 | ) | | | 67 | | | | (24 | ) | | | (18 | ) | | | 119 | | | | (18 | ) | | | (9 | ) |
Avandamet | | | 268 | | | | 256 | | | | (8 | ) | | | 5 | | | | 122 | | | | (6 | ) | | | 12 | | | | 99 | | | | (19 | ) | | | (11 | ) | | | 47 | | | | 19 | | | | 31 | |
Bonviva/Boniva | | | 255 | | | | 237 | | | | (7 | ) | | | 8 | | | | 155 | | | | (16 | ) | | | (1 | ) | | | 89 | | | | 7 | | | | 20 | | | | 11 | | | | 57 | | | | 57 | |
| | | | | | | | | | | | | | | | | | | | | | | | | | | | | | | | | | | | | | |
Anti-bacterials | | | 1,592 | | | | 1,429 | | | | 2 | | | | 11 | | | | 173 | | | | (16 | ) | | | (1 | ) | | | 662 | | | | (4 | ) | | | 4 | | | | 757 | | | | 13 | | | | 22 | |
Augmentin | | | 667 | | | | 587 | | | | 4 | | | | 14 | | | | 45 | | | | (22 | ) | | | (8 | ) | | | 295 | | | | – | | | | 8 | | | | 327 | | | | 14 | | | | 23 | |
| | | | | | | | | | | | | | | | | | | | | | | | | | | | | | | | | | | | | | |
Oncology and emesis | | | 629 | | | | 496 | | | | 10 | | | | 27 | | | | 308 | | | | 7 | | | | 27 | | | | 204 | | | | 10 | | | | 21 | | | | 117 | | | | 23 | | | | 39 | |
Hycamtin | | | 172 | | | | 140 | | | | 7 | | | | 23 | | | | 100 | | | | 4 | | | | 23 | | | | 59 | | | | 10 | | | | 20 | | | | 13 | | | | 20 | | | | 30 | |
Promacta | | | 13 | | | | – | | | | – | | | | – | | | | 13 | | | | – | | | | – | | | | – | | | | – | | | | – | | | | – | | | | – | | | | – | |
Tyverb/Tykerb | | | 169 | | | | 102 | | | | 45 | | | | 66 | | | | 54 | | | | (4 | ) | | | 15 | | | | 75 | | | | 62 | | | | 79 | | | | 40 | | | | >100 | | | | >100 | |
Zofran | | | 109 | | | | 110 | | | | (11 | ) | | | (1 | ) | | | 9 | | | | >100 | | | | >100 | | | | 52 | | | | (24 | ) | | | (17 | ) | | | 48 | | | | (5 | ) | | | 9 | |
| | | | | | | | | | | | | | | | | | | | | | | | | | | | | | | | | | | | | | |
Vaccines | | | 3,706 | | | | 2,539 | | | | 30 | | | | 46 | | | | 815 | | | | 9 | | | | 30 | | | | 1,744 | | | | 37 | | | | 51 | | | | 1,147 | | | | 37 | | | | 52 | |
Boostrix | | | 139 | | | | 70 | | | | 73 | | | | 99 | | | | 73 | | | | 77 | | | | >100 | | | | 40 | | | | 38 | | | | 54 | | | | 26 | | | | >100 | | | | >100 | |
Cervarix | | | 187 | | | | 125 | | | | 38 | | | | 50 | | | | 4 | | | | – | | | | – | | | | 138 | | | | 23 | | | | 33 | | | | 45 | | | | 100 | | | | >100 | |
Fluarix, FluLaval | | | 211 | | | | 215 | | | | (13 | ) | | | (2 | ) | | | 73 | | | | (27 | ) | | | (14 | ) | | | 71 | | | | (18 | ) | | | (9 | ) | | | 67 | | | | 17 | | | | 29 | |
| Flu pandemic | | | 883 | | | | 66 | | | | >100 | | | | >100 | | | | 187 | | | | >100 | | | | >100 | | | | 525 | | | | >100 | | | | >100 | | | | 171 | | | | >100 | | | | >100 | |
Hepatitis(Engerix/ | | | 665 | | | | 665 | | | | (11 | ) | | | – | | | | 257 | | | | (21 | ) | | | (7 | ) | | | 262 | | | | (8 | ) | | | – | | | | 146 | | | | 2 | | | | 15 | |
Fendrix, Havrix, Twinrix) | | | | | | | | | | | | | | | | | | | | | | | | | | | | | | | | | | | | | | | | | | | | | | | | | | | | |
Infanrix, Pediarix | | | 649 | | | | 682 | | | | (15 | ) | | | (5 | ) | | | 134 | | | | (47 | ) | | | (37 | ) | | | 406 | | | | (3 | ) | | | 8 | | | | 109 | | | | 5 | | | | 17 | |
Rotarix | | | 282 | | | | 167 | | | | 50 | | | | 69 | | | | 76 | | | | >100 | | | | >100 | | | | 53 | | | | 14 | | | | 23 | | | | 153 | | | | 33 | | | | 49 | |
Synflorix | | | 73 | | | | – | | | | – | | | | – | | | | – | | | | – | | | | – | | | | 32 | | | | – | | | | – | | | | 41 | | | | – | | | | – | |
| | | | | | | | | | | | | | | | | | | | | | | | | | | | | | | | | | | | | | |
Other | | | 1,063 | | | | 959 | | | | 1 | | | | 11 | | | | 17 | | | | – | | | | 6 | | | | 364 | | | | 7 | | | | 13 | | | | 662 | | | | (2 | ) | | | 10 | |
| | | | | | | | | | | | | | | | | | | | | | | | | | | | | | | | | | | | | | |
| | | | 23,446 | | | | 20,381 | | | | 1 | | | | 15 | | | | 9,180 | | | | (13 | ) | | | 3 | | | | 7,681 | | | | 9 | | | | 18 | | | | 6,585 | | | | 16 | | | | 32 | |
| | | | | | | | | | | | | | | | | | | | | | | | | | | | | | | | | | | | | | |
| Stiefel products | | | 248 | | | | | | | | – | | | | – | | | | | | | | | | | | | | | | | | | | | | | | | | | | | | | | | | | | | |
| | | | | | | | | | | | | | | | | | | | | | | | | | | | | | | | | | | | | | | | | | | | | | | | | | |
| | | | 23,714 | | | | | | | | 2 | | | | 16 | | | | | | | | | | | | | | | | | | | | | | | | | | | | | | | | | | | | | |
| | | | | | | | | | | | | | | | | | | | | | | | | | | | | | | | | | | | | | | | | | | | | | | | | | |
CER% represents growth at constant exchange rates. £% represents growth at actual exchange rates.
GSK Annual Report 2010
49
Financial review 2009
Regional analysis
The turnover reported in the table below represents sales invoiced by GSK’s local entity to its customers in the local market plus
co-promotion income within each market.
| | | | | | | | | | | | | | | | | |
| | | | | | | | | | |
| | | 2009 | | | 2008 | | | Growth* | |
| | | £m | | | £m | | | CER% | | | £% | |
| USA | | | 9,180 | | | | 8,894 | | | | (13 | ) | | | 3 | |
| Europe | | | 7,681 | | | | 6,483 | | | | 9 | | | | 18 | |
| Emerging Markets | | | 2,973 | | | | 2,290 | | | | 20 | | | | 30 | |
| Asia Pacific/Japan | | | 2,700 | | | | 1,918 | | | | 16 | | | | 41 | |
| Other trading‡ | | | 1,180 | | | | 796 | | | | 29 | | | | 46 | |
| | | | | | | | | | | |
| | | | 23,714 | | | | 20,381 | | | | 2 | | | | 16 | |
| | | | | | | | | | | |
| | |
| * | | CER% represents growth at constant exchange rates. £% represents growth at actual exchange rates. |
|
| ‡ | | Including Stiefel |
USA
Sales in the USA declined 13% to £9.2 billion, principally reflecting continued decline ofAvandia (down 22%), competition toInfanrix/Pediarix(down 47%), a return to market of a competitor to the Hepatitis franchise (down 21%) and generic competition to significant products such asLamictal (down 68%),Imigran(down 79%),Valtrex(down 9%),Requip(down 78%) andCoreg(down 28%). In addition,Wellbutrin XL(down 82%), was sold to Biovail in Q2 2009. These declines were partly offset by significant sales ofRelenzaand pandemic vaccines, a doubling ofVentolinsales, good growth ofLovaza(up 31%) and contributions from recently launched products such asBoostrixandRotarix.
Europe
Sales in Europe increased 9% to £7.7 billion with continued growth ofSeretideandRelenzaand particularly strong vaccines growth, driven by pandemic vaccine, offsetting the impact of generic competition to a number of products and continued price cuts from governments across the region.
Emerging Markets
Sales in Emerging Markets increased 20% to £3.0 billion with strong growth across the region and all therapeutic areas, helped by the acquisitions of the UCB and BMS businesses in different countries of the region.
Asia Pacific/Japan
Sales in Asia Pacific/Japan grew 16% to £2.7 billion reflecting continuedSeretide/Advairgrowth, strongRelenzasales, particularly to the retail market in Japan, and strong vaccines growth.
Consumer Healthcare turnover
| | | | | | | | | | | | | | | | | | | | | |
| | | | | | | | | | | |
| | | % of | | | 2009 | | | 2008 | | | Growth* | |
| | | total | | | £m | | | £m | | | CER% | | | £% | |
Over-the-counter medicines | | | 50 | | | | 2,319 | | | | 1,935 | | | | 8 | | | | 21 | |
alli | | | | | | | 203 | | | | 75 | | | | >100 | | | | >100 | |
Breathe Right | | | | | | | 92 | | | | 81 | | | | (1 | ) | | | 14 | |
| Cold sore franchise | | | | | | | 96 | | | | 89 | | | | (3 | ) | | | 8 | |
| Nicotine replacement therapy | | | | | | | 339 | | | | 299 | | | | (1 | ) | | | 13 | |
Panadolfranchise | | | | | | | 393 | | | | 324 | | | | 10 | | | | 21 | |
Tums | | | | | | | 106 | | | | 91 | | | | (1 | ) | | | 16 | |
| | | | | | | | | | | | | | | | | | | | | |
Oral healthcare | | | 32 | | | | 1,484 | | | | 1,240 | | | | 7 | | | | 20 | |
Aquafreshfranchise | | | | | | | 496 | | | | 452 | | | | (1 | ) | | | 10 | |
Biotene | | | | | | | 26 | | | | 1 | | | | >100 | | | | >100 | |
| Denture care | | | | | | | 336 | | | | 271 | | | | 8 | | | | 24 | |
Sensodynefranchise | | | | | | | 457 | | | | 363 | | | | 13 | | | | 26 | |
| | | | | | | | | | | | | | | | | | | | | |
Nutritional healthcare | | | 18 | | | | 851 | | | | 796 | | | | 3 | | | | 7 | |
Lucozade | | | | | | | 376 | | | | 382 | | | | (3 | ) | | | (2 | ) |
Horlicks | | | | | | | 255 | | | | 204 | | | | 17 | | | | 25 | |
Ribena | | | | | | | 160 | | | | 161 | | | | (4 | ) | | | (1 | ) |
| | | | | | | | | | | | | | |
| | | | 100 | | | | 4,654 | | | | 3,971 | | | | 7 | | | | 18 | |
| | | | | | | | | | | | | | |
| | |
| * | | CER% represents growth at constant exchange rates. £% represents growth at actual exchange rates. |
Total Consumer Healthcare sales for the year rose 7% to £4.7 billion, with growth in all regions and categories.
OTC medicines
OTC product sales grew 8% to £2.3 billion in 2009, driven by sales ofPanadol(up 10% to £393 million) andalli,which more than doubled to £203 million, as a result of launches throughout Europe which began in April 2009. Sales of nicotine replacement therapy products declined by 1%.
Oral healthcare
Sales of Oral healthcare products rose 7% to £1.5 billion.Sensodyneperformed strongly with sales up 13% to £457 million. Denture care sales grew 8% to £336 million. Sales ofAquafreshdeclined 1%, as a reduction in the US ‘white trays’ market offset growth of 5% in the USAquafreshtoothpaste brands, which were helped by the launch of the new iso-active product.
Nutritional healthcare
Nutritional healthcare sales grew 3% to £0.9 billion, driven by the very strong performance ofHorlicks(up 17% to £255 million) partly offset by a decline inLucozadesales (down 3% to £376 million) which was impacted by lower sales in the ‘impulse’ market of the UK market.
GSK Annual Report 2010
50
Financial review 2009
Results before major restructuring and total results
In October 2007, GSK announced a significant new Operational Excellence restructuring programme. A second formal plan, representing a significant expansion of the Operational Excellence programme, was approved by the Board and announced in February 2009.
In addition to the costs of the Operational Excellence programme, the major restructuring column in the income statement includes restructuring costs incurred solely as a direct result of any restructuring programmes that follow, and relate to, material acquisitions where the operations of the acquired business overlap extensively with GSK’s existing operations.
The acquisition of Stiefel Laboratories, Inc. in July 2009 was the only acquisition that meets the criteria set out above. This is the only acquisition in 2009 where the costs incurred as a direct result of a related restructuring programme has been included in the major restructuring column. The restructuring costs expected to be incurred as a direct result of this acquisition are estimated to be approximately £205 million, of which £71 million was charged in 2009. The restructuring costs incurred as a direct result of the acquisition of Reliant Pharmaceuticals Inc., the only other acquisition since October 2007 that meets the criteria set out above, were all charged and paid in 2008.
Only the restructuring costs incurred solely as a direct result of the Operational Excellence programme and the restructuring programmes following the Reliant and Stiefel acquisitions have been reported in the major restructuring column in the income statement. As set out in Note 7 to the financial statements, ‘Major restructuring programme’, asset impairments and staff redundancies together accounted for £574 million of the £835 million restructuring costs incurred in 2009. The remaining costs of £261 million in 2009 arose from miscellaneous expenditures incurred solely as a direct result of the restructuring programmes. No costs arising from GSK’s ongoing operating activities have been reported in the major restructuring column.
For the latest position on Results before major restructuring and total results see Results before major restructuring and total results in the 2010 Financial review on page 36.
GSK’s operating profit, profit before taxation, taxation and profit for the year are discussed below in terms of both total results, which include major restructuring costs, and results before major restructuring.
Operating profit – total results
Total results include restructuring costs related to the Operational Excellence programme and the acquisitions of Reliant and Stiefel.
| | | | | | | | | | | | | | | | | | | | | | | | | |
| | | | | | | | |
| | | 2009 | | | 2008 | | | Growth | |
| | | £m | | | % | | | £m | | | % | | | CER% | | | £% | |
| Turnover | | | 28,368 | | | | 100 | | | | 24,352 | | | | 100 | | | | 3 | | | | 16 | |
| | | | | | | | | | | | | | | | | |
| Cost of sales | | | (7,380 | ) | | | (26.0 | ) | | | (6,415 | ) | | | (26.3 | ) | | | 6 | | | | 15 | |
| Selling, general and administration | | | (9,592 | ) | | | (33.8 | ) | | | (7,656 | ) | | | (31.4 | ) | | | 6 | | | | 25 | |
| Research and development | | | (4,106 | ) | | | (14.4 | ) | | | (3,681 | ) | | | (15.2 | ) | | | 1 | | | | 12 | |
| Other operating income | | | 1,135 | | | | 3.9 | | | | 541 | | | | 2.2 | | | | | | | | | |
| | | | | | | | | | | | | | | | | |
| Operating profit | | | 8,425 | | | | 29.7 | | | | 7,141 | | | | 29.3 | | | | 4 | | | | 18 | |
| | | | | | | | | | | | | | | | | |
Cost of sales
Cost of sales as a percentage of turnover reduced marginally to 26.0% of turnover (2008 – 26.3%), principally reflecting the impact of generic competition to higher margin products in the USA and changes to the product mix, offset by benefits from the restructuring programme and lower restructuring costs of £285 million
(2008 – £639 million).
Selling, general and administration
SG&A costs as a percentage of turnover increased by 2.4 percentage points to 33.8%. This included full year legal charges of £591 million (2008 – £611 million) and charges related to the major restructuring programme of £392 million (2008 – £304 million). Excluding legal and restructuring costs, SG&A costs were 30.3% of turnover (2008 – 27.7%). This reflected investment in growth markets, the acquisition of Stiefel, increased pension costs, the donation of H1N1 product to WHO and exchange losses on inter-company transactions (compared with exchange gains last year), partially offset by the benefits of the current restructuring programme.
Research and development
R&D expenditure was 14.4% (2008 – 15.2%) of total turnover, which included £167 million of intangible asset write-offs (2008 – £85 million) partially offset by lower charges relating to the major restructuring programme of £155 million (2008 – £175 million) and a provision release due to reassessment of a receivable balance. Increased investment in vaccines R&D and late stage pharmaceutical R&D were broadly offset by savings from the restructuring programme.
Other operating income
Other operating income was £1,135 million including gains from asset disposals of £579 million (2008 – £293 million) primarily reflecting the disposal ofWellbutrin XLand various assets to Aspen Pharmacare, royalty income of £296 million (2008 – £307 million), a royalty dispute settlement gain of £78 million, and a one-time accounting gain of £296 million on the creation of ViiV Healthcare, partially offset by equity investment impairments of £135 million.
Operating profit–total results
Total operating profit for the year was £8,425 million, an increase of 4% CER and 18% in Sterling terms, compared with 2008. The operating profit margin increased 0.4 percentage points reflecting higher other operating income and broadly flat R&D expenditure, partially offset by increases in cost of sales and SG&A.
GSK Annual Report 2010
51
Financial review 2009
Profit before taxation – total results
Net finance costs
| | | | | | | | | |
| | | | | | | |
| Finance income | | 2009 | | | 2008 | |
| | £m | | | £m | |
| Interest and other finance income | | | 67 | | | | 321 | |
| Unwinding of discounts on assets | | | 2 | | | | 1 | |
| Fair value adjustments and hedges | | | 1 | | | | (9 | ) |
| | | | | |
| | | | 70 | | | | 313 | |
| | | | | |
| | | | | | | | | |
Finance costs | | | | | | | | |
| | | | | |
| Interest costs | | | (770 | ) | | | (829 | ) |
| Unwinding of discounts on liabilities | | | (11 | ) | | | (16 | ) |
| Fair value adjustments and hedges | | | (2 | ) | | | 2 | |
| | | | | |
| | | | (783 | ) | | | (843 | ) |
| | | | | |
Profit on disposal of interest in associate
Profit on disposal of interest in associate was £115 million as 5.7 million shares from the Group’s holding in Quest Diagnostics Inc. were sold in the first quarter of 2009.
Share of after tax profits of associates and joint ventures
The share of after tax profits of associates of £64 million (2008 – £48 million) arises principally from the Group’s holding in Quest.
Profit before taxation – total results
Taking account of net finance costs, the profit on disposal of interest in associates and the share of profits of associates, total profit before taxation was £7,891 million compared with £6,659 million in 2008, a 4% CER increase and a 19% sterling increase.
Operating profit – results before major restructuring
The results before major restructuring are set out below:
| | | | | | | | | | | | | | | | | | | | | | | | | |
| | | | | | | | |
| | | 2009 | | | 2008 | | | Growth | |
| | | £m | | | % | | | £m | | | % | | | CER% | | | £% | |
| Turnover | | | 28,368 | | | | 100 | | | | 24,352 | | | | 100 | | | | 3 | | | | 16 | |
| | | | | | | | | | | | | | | | | |
| Cost of sales | | | (7,095 | ) | | | (25.0 | ) | | | (5,776 | ) | | | (23.7 | ) | | | 13 | | | | 23 | |
Selling, general
and administration | | | (9,200 | ) | | | (32.4 | ) | | | (7,352 | ) | | | (30.2 | ) | | | 6 | | | | 25 | |
| Research and development | | | (3,951 | ) | | | (13.9 | ) | | | (3,506 | ) | | | (14.4 | ) | | | 2 | | | | 13 | |
| Other operating income | | | 1,135 | | | | 3.9 | | | | 541 | | | | 2.2 | | | | | | | | | |
| | | | | | | | | | | | | | | | | |
| Operating profit | | | 9,257 | | | | 32.6 | | | | 8,259 | | | | 33.9 | | | | (1 | ) | | | 12 | |
| | | | | | | | | | | | | | | | | |
Cost of sales
Cost of sales increased to 25.0% of turnover (2008 – 23.7%), principally reflecting the impact of generic competition to higher margin products in the USA and changes to the product mix, partly offset by benefits from the restructuring programme.
Selling, general and administration
SG&A costs as a percentage of turnover increased by 2.2 percentage points to 32.4%, including full year legal charges of £591 million. The increase reflected investment in growth markets, the acquisition of Stiefel, increased pension costs, the donation of H1N1 product to WHO and exchange losses on inter-company transactions (compared with exchange gains last year), partially offset by the benefits of the current restructuring programme.
Research and development
R&D expenditure was 13.9% (2008 – 14.4%) of total turnover, which included £167 million of intangible asset write-offs (2008 – £85 million) partially offset by a provision release due to reassessment of a receivable balance. Increased investment in vaccines R&D and late-stage pharmaceutical R&D were broadly offset by savings from the restructuring programme.
Other operating income
Other operating income was £1,135 million including gains from asset disposals of £579 million (2008 – £293 million) primarily reflecting the disposal ofWellbutrin XLand various assets to Aspen Pharmacare, royalty income of £296 million (2008 – £307 million), a royalty dispute settlement gain of £78 million, and a one-time accounting gain of £296 million on the creation of ViiV Healthcare, partially offset by equity investment impairments of £135 million. In 2009 other operating income and profit on disposal of associates amounted to £1,250 million.
Operating profit – results before major restructuring
Operating profit before major restructuring for the year was £9,257 million, a 1% CER decline, but up 12% in Sterling terms, compared with 2008. The operating profit margin was 32.6% compared with a 2008 margin of 33.9%. The decline in margin was primarily due to generic competition in the USA which impacted cost of goods and increased investment to support the Group’s diversification strategy which impacted SG&A, partly offset by a higher level of other operating income.
Further information on operating profit before major restructuring is provided in Note 6, ‘Segment information’.
GSK Annual Report 2010
52
Financial review 2009
Profit before taxation – results before major restructuring
Net finance costs
| | | | | | | | | |
| | | | | | | |
| Finance income | | 2009 | | | 2008 | |
| | | £m | | | £m | |
| Interest and other income | | | 67 | | | | 321 | |
| Unwinding of discounts on assets | | | 2 | | | | 1 | |
| Fair value adjustments and hedges | | | 1 | | | | (9 | ) |
| | | | | |
| | | | 70 | | | | 313 | |
| | | | | |
| | | | | | | | | |
Finance costs | | | | | | | | |
| | | | | |
| Interest costs | | | (770 | ) | | | (829 | ) |
| Unwinding of discounts on liabilities | | | (8 | ) | | | (11 | ) |
| Fair value adjustments and hedges | | | (2 | ) | | | 2 | |
| | | | | |
| | | | (780 | ) | | | (838 | ) |
| | | | | |
Profit on disposal of interest in associate
Profit on disposal of interests in associates was £115 million as 5.7 million Quest shares were sold in the first quarter of 2009.
Share of after tax profits of associates and joint ventures
The share of after tax profits of associates of £64 million (2008 – £48 million) arises principally from the Group’s holding in Quest Diagnostics Inc.
Profit before taxation – results before major restructuring
Taking account of net finance costs, the profit on disposal of interests in associates and the share of profits of associates, profit before tax before major restructuring was £8,726 million compared with £7,782 million in 2008, a 1% CER decline but 12% increase in sterling terms.
Taxation
| | | | | | | | | |
| | | | | | | |
| | | 2009 | | | 2008 | |
| | | £m | | | £m | |
| UK corporation tax | | | 417 | | | | 289 | |
| Overseas taxation | | | 1,997 | | | | 1,589 | |
| | | | | |
| Current taxation | | | 2,414 | | | | 1,878 | |
| Deferred taxation | | | (192 | ) | | | 69 | |
| | | | | |
| Taxation on total profits | | | 2,222 | | | | 1,947 | |
| | | | | |
The charge for taxation on total profits amounted to £2,222 million and represented an effective tax rate of 28.2% (2008 – 29.2%). The charge for taxation on profit before major restructuring charges amounting to £2,443 million represents an effective tax rate of 28.0% (2008 – 28.7%). The Group’s balance sheet at 31st December 2009 included a tax payable liability of £1,451 million and a tax recoverable asset of £58 million.
On 19th November 2009 the IRS conceded all asserted tax deficiencies and penalties arising from its reclassification of an inter-company financing arrangement from debt to equity resulting in no additional tax cost to GSK.
For the latest position on Taxation see ‘Taxation’ in the Financial review on page 39.
Profit for the year
| | | | | | | | | | | | | | | | | |
| | | | | | | | | | |
| | | 2009 | | | 2008 | | | Growth | |
| | | £m | | | £m | | | CER% | | | £% | |
| Total profit after taxation for the year | | | 5,669 | | | | 4,712 | | | | 6 | | | | 20 | |
| Total profit attributable to shareholders | | | 5,531 | | | | 4,602 | | | | 6 | | | | 20 | |
| Basic earnings per share (pence) | | | 109.1 | p | | | 88.6 | p | | | | | | | | |
| Basic earnings per ADS (US$) | | | $3.40 | | | | $3.28 | | | | | | | | | |
| | | | | | | | | | | |
| Results before major restructuring profit after taxation for the year | | | 6,283 | | | | 5,551 | | | | – | | | | 13 | |
| Results before major restructuring profit attributable to shareholders | | | 6,145 | | | | 5,441 | | | | – | | | | 13 | |
| Adjusted earnings per share (pence) | | | 121.2 | p | | | 104.7 | p | | | 2 | | | | 16 | |
| Adjusted earnings per ADS (US$) | | | $3.78 | | | | $3.87 | | | | | | | | | |
| Weighted average number of shares (millions) | | | 5,069 | | | | 5,195 | | | | | | | | | |
| | | | | | | | | | | |
| Diluted total earnings per share (pence) | | | 108.2 | p | | | 88.1 | p | | | | | | | | |
| Diluted total earnings per ADS (US$) | | | $3.38 | | | | $3.26 | | | | | | | | | |
| Diluted weighted average number of shares (millions) | | | 5,108 | | | | 5,226 | | | | | | | | | |
| | | | | | | | | | | |
Total results including restructuring costs produced a basic EPS of 109.1p compared with 88.6p in 2008. This was an 8% growth in CER terms and a 23% growth in sterling terms. Excluding major restructuring costs, EPS was 121.2p compared with 104.7p.
Dividend
The Board declared a fourth interim dividend of 18 pence per share resulting in a dividend for the year of 61 pence; a four pence increase over the 57 pence per share for 2008.
GSK Annual Report 2010
53
Risk factors
There are risks and uncertainties relevant to the Group’s business, financial condition and results of operations that may affect the Group’s performance and ability to achieve its objectives. The factors below are among those that the Group thinks, based on the CET’s most recent annual workshop to identify the most significant risks facing the Group,believes could cause its actual results to differ materially from expected and historical results. There are other risks and uncertainties that may affect the Group’s performance and ability to achieve its objectives that are not currently known to the Group, or which are deemed immaterial.
For each of theThe Group reviews and assesses significant risks described below, the Groupon a regular basis and has implemented an oversight programme to help ensure that there is a system of internal control that involvesin place. This system includes policies and procedures, communication and training programmes, supervision and monitoring and processes for escalating issues to the appropriate level of senior management. Such a system helps facilitate the Group’s ability to respond appropriately to risks and to achieve Group objectives and helps ensure compliance with applicable laws, regulations and internal policies. The Group’s management of risks is further discussed on pages 71 to 73 ‘Corporate Governance’.
It is not possible, however, for the Group to implement controls to respond to all the risks that it may face, and there can be no assurance that the steps the Group has taken to address certain risks will manage these risks effectively or at all.
The Group’s management of these risks is further discussed on page 66 ‘Corporate Governance’.
The majorsix principal risks that might affect GSK’s business are:are broken down in the following areas:
Risk that R&D will not deliver commercially successful
new products
ContinuedThe Group operates in highly competitive markets. In the pharmaceuticals and vaccines businesses, it faces competition from both proprietary products of large international manufacturers and from producers of generic pharmaceuticals. Significant product innovations, technical advances or the intensification of price competition by competitors may materially and adversely affect the Group’s financial results. The Group cannot always predict the timing or impact of competitive products or their potential impact on sales of the Group’s products. In light of the competitive environment in which the Group operates, continued development of commercially viable new products as well as the development of additional uses for existing products is critical to the Group’s ability to replace sales of older products that decline upon expiration of exclusive rights, and to increase overall sales.
Developing new products is a costly, lengthy and uncertain process.
A new product candidate can fail at any stage of the development process, and one or more late stage product candidates could fail to receive regulatory approval.
New product candidates may appear promising in development but, after significant investment of Group economic and human resources, may fail to reach the market or have only limited commercial success. This, for example, could be as a result of efficacy or safety concerns, an inability to obtain necessary regulatory approvals, difficulty manufacturing or excessive manufacturing costs, erosion of patent terms as a result of a lengthy development period, infringement of patents or other intellectual property rights of others or an inability to differentiate the product adequately from those with which it competes. Furthermore, health authorities such as the US FDA, the European Medicines Agency and the Japan Pharmaceuticals and Medicines Device Agency have increased their focus on safety and product differentiation when assessing the benefit/risk balance of drugs, which has made it more difficult for pharmaceutical products to gain regulatory approval.
There is also increasing pressure on healthcare budgets as the average age of the population in developed markets increases and the absolute population in developing markets grows. Payers have therefore increasingly demanded greater incremental benefit from drugs before agreeing to reimburse suppliers at prices suppliers consider appropriate. A failure to develop commercially successful products or develop additional uses for existing products for any of these reasons could materially and adversely affect the Group’s financial results.
Intellectual property protection
Patent infringement litigationCompetition from generic manufacturers
The Group faces intense competition from manufacturers of generic pharmaceutical products in all of its major markets. Generic products often enter the market upon expiration of patents or data exclusivity periods for the Group’s patents,products. Introduction of generic products, particularly in commonthe USA where the Group has its highest turnover and margins, typically leads to a dramatic loss of sales and reduces the Group’s revenues and margins for its proprietary products. The Group had eleven pharmaceutical products with all patents, can be challenged at any time.over £500 million in annual global sales in 2010. Among these productsare Augmentin, Lamictal IR, Ventolin,and Valtrex for which there is generic competition in the USA and certain markets in Europe. In addition, as detailed on page 7, the timing and impact of entry for a follow-on product toSeretide/Advair thatcontains the same active ingredients is uncertain.
Generic drug manufacturers have also exhibited a readiness to market generic versions of many of the Group’s most important products prior to the expiration of the Group’s patents. Efforts by generic manufacturers may involve challenges to the validity or enforceability of a patent or assertions that their generic product does not infringe the Group’s patents. If GSKthe Group is not successful in defending an attack on its patents and maintaining exclusive rights to market one or more of its major products, particularly in the USA where the Group has its highest turnover and margins,Europe, the Group’s financial results maywould be materially and adversely affected. See Note 44 toThe expiration dates for patents for the financial statements, ‘Legal proceedings’, for a discussion of patent-related proceedings in which the Group is involvedGroup’s major products and page 12 for a description of the resolutions of prior proceedingslitigation settlements which may affect the dates on which generic versions of the Group’s products may be introduced.
Generic drug manufacturersintroduced are seeking to market generic versions of many of the Group’s most important products, priorset out on page 15. Legal proceedings involving patent challenges are set out in Note 44 to the expiration of the Group’s patents, and have exhibited a readiness to do so for other products in the future. The US launch of generic products competing withLamictal,Imitrex,Paxil CR,Requip,Wellbutrin XLandValtrexhad a significant impact on the Group’s overall turnover and earnings for 2009.financial statements, ‘Legal proceedings’.
Potential changes in intellectual property laws and
regulations
Proposals to change existing patent and data exclusivity laws and regulations in major markets in which the Group sells its products are a continuing feature of the political process in those countries. These include proposals that could have the effect of making prosecution of patents for new products more difficult and time-consumingtime consuming or that could adversely affect the exclusivity period for the Group’s products, including biological products. Should such proposals be enacted, they may materially and adversely affect the Group’s financial results. For example, in 2010, as part of the comprehensive healthcare reform in the USA, new regulations for follow-on biologics were introduced that allow a sufficiently similar biologic to be able to rely on an innovator’s approval following a 12-year data exclusivity period. In addition, the current administration in the USA has proposed reducing from 12 years to seven the period of time pharmaceutical companies may keep their products exclusive of generic competition.
GSK Annual Report 2010
54
Risk factors
Weakness of intellectual property protection in
certain countries
In some of the countries in which the Group operates, patent protection may be significantly weaker than in the USA or the European Union. Some developing countries have reduced, or threatened to reduce, effective patent protection for pharmaceutical products generally, or in particular therapeutic areas, to facilitate early competition within their markets from generic manufacturers. Any loss of patent protection, including reducing the scope of patent rights or compulsory licensing (in which a government forces a manufacturer to license its intellectual property to a competitor), could materially and adversely affect the Group’s financial results in those national markets but is not expected to be material to the Group overall.markets. Absence of adequate patent protection could limit the opportunity to look torely on such markets for future sales growth.growth for the Group’s products.
Risk of substantial adverse outcome of litigation and
government investigations
See Note 44 to the financial statements, ‘Legal proceedings’, for a discussion of proceedings and governmental investigations -currently involving mattersthe Group which, if proven, could give rise to civil and/or criminal liabilities – in which the Group is currently involved.liabilities. Unfavourable resolution of these and similar future proceedings or investigations may have a material adverse effect on the Group’s financial condition and results of operations. The Group has made material provisions in 20092010 and prior years related to such legal proceedings and investigations, which reduced its earnings.
GSK Annual Report 2009
44
Risk factors
TheIn the future, the Group may also make additional significant provisions related to legal proceedings and investigations in the future, which would reduce its earnings. In many cases, the Group believes that it is the practice of the plaintiff bar is to claim damages in amounts that bear no reasonable relationship to the underlying harm.harm allegedly caused by the Group’s products or its actions. Accordingly, it may be potentially misleading for the Group to quantify, based on the amount of damages claimed, its potential exposure to claims, proceedings and investigations of the type described in Note 44 to the financial statements, ‘Legal proceedings’.
Recent insurance loss experience, including pharmaceutical product liability exposures, has increased the cost of, and narrowedreduced the capacity of insurers to provide coverage afforded by, insurance for pharmaceutical companies generally, including the Group.
In order to contain insurance costs in recent years, the Group has continued to adjust its coverage profile, accepting a greater degree of un-insured exposure.exposure in some areas, and a lesser degree in others, in order to optimise the value of insurance markets. In addition, where claims are made under insurance policies, insurers mayregularly reserve the right to deny coverage on various grounds. If denial of coverage is ultimately upheld on these claims, this could result in additional charges that may materially and adversely affect the Group’s financial results.
Product liability litigation
Pre-clinical and clinical trials are conducted during the development of potential products to determine the safety and efficacy of products for use by humans following approval by regulatory bodies.authorities. Notwithstanding thesethe efforts the Group makes to determine the safety of its products through regulated clinical trials, unanticipated side effects may become evident only when drugs and vaccines are introduced into the marketplace, unanticipated side effects may become evident.marketplace.
In other instances, third parties may perform analyses of published clinical trial results which, although not necessarily accurate or meaningful, may raise questions regarding the safety of pharmaceutical products which may be publicised by the media and may result in product liability claims. The Group is currently a defendant in a number of product liability lawsuits, including class actions, that involve substantial claims for damages related to the Group’s pharmaceutical products. Litigation, particularly in the USA, is inherently unpredictable and excessive verdicts that are not justified by the evidence can occur.unpredictable. Class actions that sweep together all persons who were prescribed the Group’s products can inflate the potential liability by the force of numbers. Claims for pain and suffering and punitive damages are frequently asserted in product liability actions and, if allowed, can represent potentially open ended exposure and thus could materially and adversely affect the Group’s financial results.
Anti-trust litigation
In the USA, it has become increasingly common for patent infringement actions to prompt claims that anti-trust laws have been violated during the initial prosecution of the patent or during litigation involving the defence of that patent. Such claims by direct and indirect purchasers and other payers are typically filed as class actions. The relief sought may include treble damages and restitution claims. Damages in adverse anti-trust verdicts are subject to automatic trebling in the USA. Similarly, anti-trust claims may be brought following settlement of patent litigation, alleging that such settlements are anti-competitive and in violation of anti-trust laws. A successful anti-trust claim against the Group could materially and adversely affect the Group’s financial results.
Sales and marketing and regulation
The Group operates globally in complex legal and regulatory environments that often vary among jurisdictions. The failure to comply with applicable laws, rules and regulations in these jurisdictions may result in civil and criminal legal proceedings. As those rules and regulations change or as governmental interpretation of those rules and regulations evolve, prior conduct may be called into question.
In the USA, for example, the Group is responding to federal and state governmental investigations into pricing, marketing and reimbursement of its prescription drug products. These investigations could result in related restitution or civil false claims act litigation on behalf of the federal or state governments, as well as related proceedings initiated against the Group by or on behalf of consumers and private payers. Such proceedings may result in trebling of damages awarded or fines in respect of each violation of law. Criminal proceedings may also be initiated against the Group. Any of these consequences could materially and adversely affect the Group’s financial results.
GSK Annual Report 2010
55
Third party competitionRisk factors
The Group operates in highly competitive markets. In the pharmaceuticals business, it faces competition both from proprietary products of large international manufacturers and producers of generic pharmaceuticals. Significant product innovations, technical advances or the intensification of price competition by competitors may materially and adversely affect the Group’s financial results. The Group cannot predict the timing or impact of competitive products or their potential impact on sales of the Group’s products. Continued consolidation in the pharmaceutical industry may adversely affect the Group’s competitive position, while continued consolidation among the Group’s customers may increase pricing pressures.
The Group had nine pharmaceutical products with over £500 million in annual global sales in 2009. Among these products areAugmentin IRandES,Lamictal IR,PaxilandValtrexfor which there is generic competition in the USA.
If any of the Group’s major products were to become subject to a problem such as unplanned loss of patent protection, unexpected side effects, regulatory proceedings, publicity affecting doctor or patient confidence or pressure from competitive products, or if a new, more effective treatment should be introduced, the Group’s financial results may be materially and adversely affected.
In particular, the Group faces intense competition from manufacturers of generic pharmaceutical products in all of its major markets. Generic products often enter the market upon expiration of patents or data exclusivity periods for the Group’s products. Introduction of generic products typically leads to a dramatic loss of sales and reduces the Group’s revenues and margins for its proprietary products. The expiration dates for patents for the Group’s major products and a description of litigation settlements which may affect the dates on which generic versions of the Group’s products may be introduced are set out on page 12. Legal proceedings involving patent challenges are set out in Note 44 to the financial statements, ‘Legal proceedings’.
Governmental, payer and payerregulatory controls
Pricing
Pharmaceutical products are subject to price controls or pressures and other restrictions in many markets, including Japan, Germany, Spain, France and Italy. Some governments intervene directly in setting prices.
GSK Annual Report 2009
45
Risk factors
In addition, in some markets major purchasers of pharmaceutical products (whether governmental agencies or private health care providers) have the economic power to exert substantial pressure on prices or the terms of access to formularies.
The Group cannot accurately predict whether existing controls, pressures or restrictions will increase or whether new controls, pressures or restrictions will be introduced. Such measures may materially and adversely affect the Group’s ability to introduce new products profitably and its financial results.
For example, in the USA, where the Group has its highest margins and the most sales for any country, pricingthere are no government price controls over private sector purchases, but federal law requires pharmaceutical manufacturers to pay prescribed rebates on certain drugs to be eligible for reimbursement under several state and federal healthcare programmes, primarily Medicare and Medicaid. Pricing pressures could significantlyare likely to increase as experiencethe US government’s share of national health spending continues to develop under the outpatient pharmaceutical programme covering Medicare beneficiaries that began in 2006. Also, changesincrease. Additionally, due to the related enabling legislation could afford the US government a direct role in negotiating prices under the Medicare programme.
In addition, the US Congress is consideringpassage of comprehensive health care reform legislation that couldin 2010, the US government’s role in providing or subsidising health insurance is expected to significantly expand in 2014, which indicates the scope ofgrowing role and leverage the government health care programs that include specific price control mechanisms or that could increasewill bring to bear on the Group’s rebate liability with respect to thoseUS federal programs.
Additionally,In recent years, a number of states have also proposed or implemented various schemes to control prices for their low-income and senior citizens’ programmes, including increasing the rebate liability of pharmaceutical companies, importation from other countries and bulk purchases of drugs. The growthGiven the new state mandates contained in the US health care reform law, which will increase the number of patients covered through large managed care institutions inMedicaid eligible participants, and the USA, which has increased with implementation of the Medicare benefit, also increaseseconomic pressures on state government budgets, pricing pressures on the Group’s products.products are likely to increase. Any of these trends may materially and adversely affect the Group’s financial results.
Regulatory controls
The Group must comply with a broad range of regulatory controls on the testing, approval, manufacturing and marketing of many of its pharmaceutical, vaccine and consumer healthcare products, particularly in the USA and countries of the European Union, that affect not only the cost of product development but also the time required to reach the market and the uncertainty of successfully doing so. HealthAs detailed on page 18 health authorities have increased their focus on safety when assessing the risk/benefit risk/balance of drugs in the context of not only initial product approval but also in the context of approval of additional indications and review of information regarding marketed products. Stricter regulatory controls also heighten the risk of changes in product profile or withdrawal by regulators on the basis of post-approval concerns over product safety, which could reduce revenues and can result in product recalls and product liability lawsuits. There is also greater regulatory scrutiny, especially in the USA, on advertising and promotion and in particular on direct-to-consumer advertising.
In addition, in some cases, the Group may voluntarily cease marketing a product or face declining sales based on concerns about efficacy or safety (for example, the decline in sales ofAvandia beginning in 2007 following publicity around questions regarding risks associated with the product), whether or not scientifically justified, even in the absence of regulatory action. The development of the post-approval adverse event profile for a product or the product class may materially and adversely affect the Group’s financial results.
Risk of interruption of product supply
The manufacture of pharmaceutical products and their constituent materials requires compliance with good manufacturing practice regulations. The Group’s manufacturing sites are subject to review and approval by the FDA and other regulatory agencies. Compliance failure by suppliers of key services and materials or the Group’s own manufacturing facilities could lead to product recalls and seizures, interruption of production and delays in the approvals of new products pending resolution of manufacturing issues. Non-compliance can also result in fines and disgorgement of profits. Any interruption of supply or the incurrenceincurring of fines or disgorgement could materially and adversely affect the Group’s financial results.
Although the Group undertakes business continuity planning, single sourcing for certain components, bulk active materials and finished products creates a risk of failure of supply in the event of regulatory non-compliance or physical disruption at the manufacturing sites.
Risk from concentration of sales to wholesalers
In the USA, in line with other pharmaceutical companies, the Group sells its products throughUnaffiliated third-party suppliers provide a small number of wholesalers in addition to hospitals, pharmacies, physiciansgoods and other groups. Salesservices to the three largest wholesalers amountedGroup’s operations. Many of these services, for example, services provided by clinical research organisations to approximately 85%support development of key products, are very important to the operations of the Group’s US pharmaceutical sales in 2009. At 31st December 2009businesses. Materials provided by third-party suppliers are necessary for the commercial production of our products, including speciality chemicals, commodities and components necessary for the manufacture and packaging of many of the Group’s Pharmaceutical and Consumer Healthcare products. While the Group had trade receivables due from these three wholesalers totalling £867 million (31st December 2008 – £1,067 million). The Group is exposed to a concentration of credit risk in respectdoes not believe that any of these wholesalers such that, if onethird-party relationships are individually significant in the context of the overall Group, the failure of any third-party supplier to fulfil its contractual obligations in a timely manner may result in delays or more of them is affected by financial difficulty, it couldservice interruptions, which may materially and adversely affect the Group’s financial results.
Global political and economic conditions
As described on page 27, many of the world’s largest economies, including the major markets in which the Group operates, and financial institutions have recently faced extreme financial difficulty, including a decline in asset prices, liquidity problems and limited availability of credit. Many of these economies have experienced sharp recessions. While some economies have shown signs of recovery, the rate of recovery may be slow.
Continued economic weakness may have a material adverse effect on the Group’s sales, results of operations, financial condition and ability to raise capital. Some of the Group’s businesses, including Consumer Healthcare, may be particularly sensitive to declines in consumer spending. In addition, further or renewed declines in asset prices may result in a lower return on the Group’s financial investments and may cause the value of the Group’s investments in its pension plans to decrease, requiring the Group to increase its funding of those pension plans.
The Group conducts a substantial portion of its operations outside the UK. The Group’s management of foreign exchange rates is discussed in Business Review, ‘Foreign exchange management’ (see page 42). Fluctuations in exchange rates between Sterling and other currencies, especially the US dollar, the Euro and the Japanese Yen, could materially and adversely affect the Group’s financial results.
The Group has no control over changes in inflation and interest rates, foreign currency exchange rates and controls or other economic factors affecting its businesses or the possibility of political unrest, legal and regulatory changes or nationalisation in jurisdictions in which the Group operates.
GSK Annual Report 2009
46
Risk factors
Taxation and treasuryTreasury
The Group’s effective tax rate is driven by rates of tax in jurisdictions that are both higher and lower than that applied in the UK. In addition, many jurisdictions such as the UK, Belgium and the USA currently offer regimes that encourage innovation and new scientific endeavours by providing tax incentives, for example R&D tax credits. Furthermore, given the scale and international nature of the Group’s business, intra-group transfer pricing is an inherent tax risk as it is for other international businesses. Changes in tax laws or in their application with respect to matters such as transfer pricing, foreign dividends, controlled companies, R&D tax credits or a restriction in tax relief allowed on the interest on intra-Groupintra-group debt, could increase the Group’s effective tax rate and materially and adversely affect its financial results.
GSK Annual Report 2010
56
Risk factors
The tax charge included in the financial statements is the Group’s best estimate of its tax liability but, until such time as audits by tax authorities are concluded, there is a degree of uncertainty regarding the final tax liability for the period. The Group’s policy is to submit tax returns within the statutory time limits and engage tax authorities to ensure that the Group’s tax affairs are as current as possible, and that any differences in the interpretation of tax legislation and regulation are resolved as quickly as possible. In exceptional cases where matters cannot be settled by agreement with tax authorities, GSK may have to resolve disputes through formal appeals or other proceedings. The Group isFor example, the Canadian Tax Authorities are currently appealingseeking leave to appeal a court decision in respect of transfer pricing with the Canadian Tax Authorities as discussed in Note 14 to the financial statements, ‘Taxation’.
The Group deals in high value transactions on a frequent basis which may result in an increased risk of financial loss due to the mismanagement of cash or entering into high risk positions on hedge transactions, any of which could materially and adversely affect the Group’s financial results.
There are a number of further risks which could affect the financial condition or results of the Group, as follows:
Pandemic influenzaAnti-bribery and corruption
The market for pandemic influenza vaccinesGroup’s extensive and increasing international operations may give rise to possible claims of bribery and corruption. Failure to comply with applicable legislation such as the US Foreign Corrupt Practices Act and the recently enacted UK Bribery Act could expose the Group and senior officers to civil and criminal sanction, including fines, prosecution, potential debarment from public procurement and reputational damage, all of which could materially and adversely affect the Group’s financial results. The compliance mechanisms and monitoring programmes that the Group has in place may not adequately prevent or detect possible violations under applicable anti-bribery and corruption legislation.
Risk from concentration of sales to wholesalers
In the USA, similar to other pharmaceutical companies, the Group sells its products through a small number of wholesalers in addition to hospitals, pharmacies, physicians and other groups. Sales to the three largest wholesalers amounted to approximately 85% of the Group’s US pharmaceutical sales in 2010. At 31st December 2010, the Group had trade receivables due from these three wholesalers totalling £890 million (31st December 2009 – £867 million). The Group is experiencing significant volatility givenexposed to a concentration of credit risk in respect of these wholesalers such that, if one or more are affected by financial difficulty, it could materially and adversely affect the Group’s financial results.
Global political and economic conditions
As described on page 20, many of the world’s largest economies, including the major markets in which the Group operates, and financial institutions have in the recent past faced extreme financial difficulty, including a decline in asset prices, liquidity problems and limited availability of credit. Although many of these economies have recovered in 2010, the economic recovery and its pace proved uneven.
Continued economic weakness may have a material adverse effect on the Group’s sales, results of operations, financial condition and ability to raise capital. Some of the Group’s businesses, including Pharmaceuticals and Consumer Healthcare, may be particularly sensitive to declines in consumer spending. In addition, further or renewed declines in asset prices may result in a lower return on the Group’s financial investments and may cause the value of the Group’s investments in its pension plans to decrease, requiring the Group to increase its funding of those pension plans.
The Group conducts a substantial portion of its operations outside the UK. The Group’s management of foreign exchange rates is discussed in Business review, ‘Foreign exchange management’ (see page 46). Fluctuations in exchange rates between Sterling and other currencies, especially the US dollar, the Euro and the Japanese Yen, could materially and adversely affect the Group’s financial results.
The Group has no control over changes in risk perception, developing epidemiologyinflation and the relative mild nature of the virus, which was not anticipated by governmentsinterest rates, foreign currency exchange rates and controls or other economic factors affecting its businesses or the medical community. Some governmentspossibility of political unrest, legal and regulatory changes or nationalisation in jurisdictions in which the Group operates.
The Group operates in a number of Middle Eastern and North African markets that have placed orders for the pandemic vaccine or that have announced changes in their planned immunisation programmes have renegotiated their contracts, and other governments are seeking, or may in the future seek, to renegotiate their contracts. While deliveries of pandemic vaccines provided significant contributionssubsequent to the Group’s results in 2008 (H5N1 vaccines)year-end are experiencing political unrest. These events may lead to business disruption and 2009 (H1N1 vaccines), and the Group expects the level of sales in 2010 (H1N1, possibly stockpile agreements) to be roughly the same as in 2009, there can be no assuranceliquidity problems that sales of influenza vaccines will meet these estimates or contribute significantly tocould adversely impact the Group’s results in 2011 or beyond.results.
Environmental liabilities
The environmental laws of various jurisdictions impose actual and potential obligations on the Group to remediate contaminated sites. The Group has also been identified as a potentially responsible party under the US Comprehensive Environmental Response Compensation and Liability Act at a number of sites for remediation costs relating to the Group’s use or ownership of such sites.
Failure to manage properly the environmental risks could result in additional remedial costs that may materially and adversely affect the Group’s financial results. See Note 44 to the financial statements, ‘Legal proceedings’, for a discussion of environmental-relatedenvironmental related proceedings in which the Group is involved.
Accounting standards
New or revised accounting standards, rules and interpretations circulatedissued from time to time by an international standard setting boardthe International Accounting Standards Board could result in changes to the recognition of income and expense that may materially and adversely affect the Group’s financial results.
International standardFinancial Reporting Standards changes in the market valuation of certain financial instruments arerequire gains and losses under such instruments to be reflected in the Group’s reported results before those gains or losses are actually realised andrealised. This could have a significant impact on the income statement in any given period. Accounting for deferred taxation on inter-company inventory may give rise to volatility depending upon the ownership ofGroup entity that owns the inventory.
GSK Annual Report 2010
57
Risk factors
Regulators regularly review the financial statements of listed companies for compliance with accounting and regulatory requirements.
The Group believes that it complies with the appropriate regulatory requirements concerning its financial statements and disclosures. However, other companies have experienced investigations into potential non-compliance with accounting and disclosure requirements that have resulted in restatements of previously reported results and sometimes significant penalties, which may materiallypenalties. Any such investigation and adversely affect the Group’s financial results.
Failure of third party providers
Unaffiliated third-party suppliers provide a number of goods and services to the Group’s operations. Many of these services, for example services provided by clinical research organisations to support development of key products, are very important to the operations of the Group’s businesses. Materials provided by third-party suppliers are necessary for the commercial production of our products, including speciality chemicals, commodities and components necessary for the manufacture, fill-finish and packaging of many of the Group’s pharmaceutical and Consumer Healthcare products. While the Group does not believe that any of these third-party relationships are individually significant in the context of the overall Group, the failure of any third-party supplier to fulfil its contractual obligations in a timely manner may result in delays or service interruptions, which mayrequired restatement could materially and adversely affect the Group’s financial results.
Protection of electronic information and assets
The Group relies on critical and sensitive data, such as personally identifiable information, trade secrets, intellectual property and corporate strategic plans. The securitySecurity of suchthis type of data is exposed to increasing external threats. The Group is also subject to various standards for the protection of personally identifiable information. Failure to implement appropriate safeguards to adequately protect against any unauthorised or unintentional access, acquisition, use, modification, loss or disclosure of this critical or sensitive data may adversely affect the Group’s operations.
GSK Annual Report 2009
47
Risk factors
Alliances and acquisitions
As part of the Group’s strategy to diversify into new product areas and markets, the Group has grown, and expects to continue to grow, in part through acquisitions and business alliances. There is intense competition for alliance and acquisition candidates in the pharmaceutical industry, and, as such, the Group may be unable to make these deals on acceptable terms or at all. In acquiring or forming alliances with companies, the Group may assume significant debt, become subject to unknown or contingent liabilities or fail to realise the benefits expected from these transactions. For example, most pharmaceutical companies, including those that the Group may consider acquiring, are involved in patent disputes, product liability litigation, government investigations and other legal proceedings whose outcome is subject to considerable uncertainty. The assumption of debt or unknown or contingent liabilities or the failure to realise the expected benefits may materially and adversely affect the Group’s financial results.
The process of integrating companies the Group may acquire may result in disruption to the ongoing business as the effort of integrating organisations in different locations and with, among other things, differing systems and corporate cultures may divert attention and resources, result in the loss of key employees or have other adverse consequences, any of which may materially and adversely affect the Group’s financial results.
Attraction and retention
The Group relies heavily on recruiting and retaining talented employees with a range of skills to meet its objectives. The Group faces intense competition for qualified individuals, as the supply of people with specific skills or in specific geographic regions may be limited, particularly given the Group’s plans to expand its operations in emerging markets,Emerging Markets, Biologicals and Consumer Healthcare.
The inability to attract staff with specific technical and leadership skills, retain key employees or ensure effective succession planning for critical positions may materially and adversely affect the Group’s financial results.
Implementing the Group’s strategic priorities
The Group has established three strategic priorities: to grow a diversified business, deliver more products of value, and simplify its operating model. There can be no assurance that theThe Group willmay not be able to implement its strategic priorities fully or thatand even if the Group is able to implement its strategic priorities the strategic priorities willmay not deliver the expected benefits.
For example, the strategic priority to grow a diversified business involves expanding the Group’s business into emerging markets.Emerging Markets. The Group’s pharmaceutical sales in emerging marketsEmerging Markets grew 20%22% in 20092010 to nearly £3£3.6 billion, which represents 10%and represented 15% of the Group’s 20092010 pharmaceutical turnover. There is no guarantee that the Group’s sales in emerging marketsEmerging Markets will continue to grow or that these markets will continue to experience relatively high growth rates. Some emerging markets may be especially vulnerable to the after-effects of the recent global financial crisis, or may have very limited resources to spend on healthcare. Competition in these markets for staff with the skills and training suitable for employment at an enterprise such as the Group’s may be intense. In some emerging markets, the Group may be required to rely on third-partythird party agents, which may put the Group at risk of liability, and some emerging markets lack sufficient protection against crimes such as counterfeiting. A failure to continue to expand its business in emerging growth markets could materially and adversely affect the Group’s financial results.
In addition, the Group is undertaking an Operational Excellencea restructuring programme that has an estimated cost of approximately £4.5 billion and is expected to deliver annual pre-tax savings of approximately £2.2 billion by the time it is substantially complete in 2012. There can be no assurance that theThe Group willmay not be able to execute fully this transformation of its business. Furthermore, changes in the Group’s structure, operations, revenues, costs or efficiency resulting from these restructuring activities or other strategic initiatives could result in higher than expected costs or other difficulties. Failure to realise the expected cost savings by the end of the restructuring programme or to achieve and maintain a competitive cost base could materially and adversely affect the Group’s financial results.
GSK Annual Report 20092010
4858
Financial review 2008Our Board
In accordance with US SEC disclosure requirements,
Sir Christopher Gent
(Aged 62)
Appointed on 1st June 2004.
Chairman.
Sir Christopher is a Non-Executive Director of Ferrari SpA and was the following discussion compares resultsChief Executive Officer of Vodafone Group plc, until his retirement in July 2003. He is a Non-Executive Director of Lehman Brothers Holdings Inc, a member of KPMG’s Chairman’s Advisory Group, a Senior Adviser at Bain & Co. and a member of the Advisory Board of Reform.
Andrew Witty (Aged 46)
Appointed on 31st January 2008.
Chief Executive Officer.
Andrew was named Chief Executive Officer Designate for GSK in October 2007 and was appointed Chief Executive Officer (CEO) on 21st May 2008. He joined the Group in 1985 and has held senior positions in Asia, Africa and the USA. Immediately prior to being appointed CEO, Andrew was President, Pharmaceuticals Europe, a position he held from January 2003. He is a Board Member of PhRMA and President of European Federation of Pharmaceutical Industries and Associations. He was appointed as Lead Non-Executive Board Member for the yearDepartment of Business, Innovation and Skills and as a Board Member of the INSEAD Business School in January 2011 and is a member of the Prime Minister’s Business Advisory Group. He is a Member of the Singapore Economic Development Board’s International Advisory Council and an Adviser to 31st December 2008 with the resultsGovernor of Guangzhou, China.
Professor Sir Roy Anderson
(Aged 63)
Appointed on 1st October 2007.
Non-Executive Director.
Sir Roy is Professor of Infectious Disease Epidemiology in the Faculty of Medicine, Imperial College, London. He is a member of the International Advisory Board of Hakluyt & Co. Ltd. and he is a Trustee of the Natural History Museum, London. He is a fellow of the Royal Society and a Foreign Associate Member of the Institute of Medicine at the US National Academy of Sciences and the French Academy of Sciences. His former positions include Rector of Imperial College and Chief Scientific Adviser at the Ministry of Defence in the UK.
Dr Stephanie Burns
(Aged 56)
Appointed on 12th February 2007.
Non-Executive Director.
Stephanie is Chairman and Chief Executive Officer of Dow Corning Corporation and sits on the US President’s Export Council. She is also the chair of the American Chemistry Council, is an officer of the Society of Chemical Industry, America Section, and on the Board for the yearSociety for Women’s Health Research. Dr Burns holds a PhD in organic chemistry from Iowa State University.
Larry Culp (Aged 47)
Appointed on 1st July 2003.
Non-Executive Director.
Larry is President and Chief Executive Officer of Danaher Corporation. Prior to 31st December 2007.joining Danaher, he held positions in Accenture, previously Andersen Consulting.
ExchangeSir Crispin Davis (Aged 61)
The currenciesAppointed on 1st July 2003.
Non-Executive Director.
Sir Crispin is Chairman and Director of StarBev Netherlands BV, a member of Citigroup’s Global Advisory Board and serves on the Council of Oxford University. He was previously Chief Executive Officer of Reed Elsevier PLC, and prior to that most influence the Group’s results remain the US dollar, the Euro and the Japanese Yen.
In 2008, the pound weakened by 28% against the US dollar, to $1.44/£1 at year-end. In addition, the pound weakened by 24% against the Euro and by 40% against the Yen. A new £/€ record lowappointment, Chief Executive of 1.02Aegis Group plc, which he joined from Guinness plc, where he was set in December.
World market – pharmaceuticals
Global pharmaceutical sales in 2008 were £366 billion compared with £329 billion in 2007.
| | | | | | | | | |
| World market by | | Value | | | % of | |
| geographic region | | £bn | | | total | |
| | | | |
USA | | | 145 | | | | 39 | |
Europe | | | 112 | | | | 31 | |
| France | | | 21 | | | | 6 | |
| Germany | | | 20 | | | | 6 | |
| Italy | | | 13 | | | | 3 | |
| UK | | | 12 | | | | 3 | |
Rest of World | | | 109 | | | | 30 | |
| Emerging markets | | | 49 | | | | 13 | |
| Asia Pacific | | | 17 | | | | 5 | |
| Japan | | | 33 | | | | 9 | |
| Canada | | | 10 | | | | 3 | |
| | | | |
| Total | | | 366 | | | | 100 | |
| | | | |
At 30th September 2008, GSK had threea member of the world’s top 60 pharmaceutical products. These wereLamictal,Seretide/Advairmain Board andValtrex.
| | | | | | | | | |
| World market - | | Value | | | % of | |
| top six therapeutic classes | | £bn | | | total | |
| | | | |
| Central nervous system | | | 60 | | | | 16 | |
| Cardiovascular | | | 54 | | | | 15 | |
| Alimentary tract and metabolic | | | 44 | | | | 12 | |
| Antineoplastic/Immunomodulatory | | | 40 | | | | 11 | |
| Anti-infectives (bacterial, viral and fungal) excluding vaccines | | | 38 | | | | 10 | |
| Respiratory | | | 25 | | | | 7 | |
| | | | |
| | |
(Note: data based on 12 months to 30th September 2008.) |
Pharmaceutical turnover
All growth rates included in the review Group Managing Director of turnover are at constant exchange rates (CER) unless otherwise stated. Sterling growth rates may be found in the tables of pharmaceutical turnover by therapeutic areas on page 49.
Total pharmaceutical turnover declined 3%United Distillers. In his earlier career, he worked for the year to £20.4 billion, driven largely by US performance, down 11% to £8.9 billion, whichProcter & Gamble, where he was impacted by expected generic competition to several mature brands and further declines inAvandiasales. Sales in Asia Pacific and Japan fell 1% to £1.9 billion, reflecting lower government orders forRelenzaand the impact of pharmaceutical price cuts in Japan. These declines were partly offset by growth in Europe, up 3% to £6.5 billion, and Emerging Markets, up 12% to £2.3 billion. In sterling terms, pharmaceutical turnover grew by 6%, reflecting the weakness of Sterling against most major currencies.
Pharmaceutical turnover by therapeutic area
GSK turnover declined by 3% in 2008 as the impact of lowerAvandiasales, US generic competition to a range of GSK’s products and lower flu pre-pandemic sales was partly offset by strong growth of key products such asAdvair,Valtrex,Epzicom,Avodart,Lovazaand the vaccines franchise.
Respiratory
Respiratory sales increased 5% to £5.8 billion.
Sales ofSeretide/Advairfor asthma and COPD rose 8% to £4.1 billion. In the USA,Advairsales rose 6% to £2.2 billion, with a return to volume growth in the second halfPresident of the year. During 2008,North American Food Division.
Simon Dingemans (Aged 47)
Appointed on 4th January 2011.
Executive Director and Chief Financial Officer Designate.
Simon joined GSK from Goldman Sachs where he was a Managing Director and Partner. He has over 25 years of experience in investment banking, including most recently as leader of Goldman Sachs’ European M&A business and before that as head of UK Investment Banking.
Julian Heslop (Aged 57)
Appointed on 1st April 2005.
Chief Financial Officer.
Julian joined Glaxo Wellcome as Financial Controller in April 1998. In January 2001 he was appointed Senior Vice President, Operations Controller. Prior to joining the FDA grantedAdvairan indication in COPD for prevention of exacerbationsGroup he held senior finance roles at Grand Metropolitan. Julian will retire as Chief Financial Officer and this has helped grow the COPD sector of ourAdvairbusiness. In Europe, sales increased by 4% to £1.4 billion.Advairperformance was particularly strong in Emerging Markets, up 26% to £215 million, and Japan, where sales of the product more than doubled to £83 million following its launch in 2007.
Anti-virals
Anti-virals decreased 4% to £3.2 billion.
GSK’s HIV business continues to experience strong competition.Epzicom/Kivexagrew by 23% to £442 million but this was more than offset by declines across the rest of the portfolio. Sales ofValtrex, for herpes, rose 16% to £1.2 billion with US sales up 20% fuelling the growth. Sales of flu anti-viralRelenza fell 80% to £57 million reflecting fewer government orders for pre-pandemic stockpiling.Executive Director on 31st March 2011.
GSK Annual Report 20092010
4959
Financial review 2008
Pharmaceutical turnover by therapeutic area 2008Our Board
| | | | | | | | | | | | | | | | | | | | | | | | | | | | | | | | | | | | | | | | | | | | | | | | | | | | | | | | | |
| | | Total | | | USA | | | Europe | | | Rest of World | |
| Therapeutic area/ | | % of | | | 2008 | | | 2007 | | | | | | | Growth | | | 2008 | | | | | | | Growth | | | 2008 | | | | | | | Growth | | | 2008 | | | | | | | Growth | |
| major products | | total | | | £m | | | £m | | | CER% | | | £% | | | £m | | | CER% | | | £% | | | £m | | | CER% | | | £% | | | £m | | | CER% | | | £% | |
| | | | | | | | | | | | | | | | | | | | | | | | | | | | | | | | | | | | | | | | |
Respiratory | | | 29 | | | | 5,817 | | | | 5,032 | | | | 5 | | | | 16 | | | | 2,720 | | | | 6 | | | | 14 | | | | 1,982 | | | | 2 | | | | 14 | | | | 1,115 | | | | 9 | | | | 22 | |
Seretide/Advair | | | | | | | 4,137 | | | | 3,499 | | | | 8 | | | | 18 | | | | 2,161 | | | | 6 | | | | 14 | | | | 1,416 | | | | 4 | | | | 17 | | | | 560 | | | | 29 | | | | 42 | |
Flixotide/Flovent | | | | | | | 677 | | | | 621 | | | | (2 | ) | | | 9 | | | | 317 | | | | 3 | | | | 12 | | | | 175 | | | | (4 | ) | | | 11 | | | | 185 | | | | (9 | ) | | | 3 | |
Serevent | | | | | | | 263 | | | | 269 | | | | (12 | ) | | | (2 | ) | | | 72 | | | | (9 | ) | | | (3 | ) | | | 136 | | | | (9 | ) | | | 1 | | | | 55 | | | | (23 | ) | | | (10 | ) |
Veramyst | | | | | | | 72 | | | | 21 | | | | >100 | | | | >100 | | | | 56 | | | | >100 | | | | >100 | | | | 11 | | | | – | | | | – | | | | 5 | | | | >100 | | | | >100 | |
Flixonase/Flonase | | | | | | | 186 | | | | 199 | | | | (15 | ) | | | (7 | ) | | | 52 | | | | (29 | ) | | | (28 | ) | | | 52 | | | | (6 | ) | | | 6 | | | | 82 | | | | (8 | ) | | | 5 | |
| | | | | | | | | | | | | | | | | | | | | | | | | | | | | | | | | | | | | | | | |
Anti-virals | | | 16 | | | | 3,206 | | | | 3,027 | | | | (4 | ) | | | 6 | | | | 1,600 | | | | (1 | ) | | | 7 | | | | 850 | | | | (12 | ) | | | – | | | | 756 | | | | (1 | ) | | | 10 | |
| HIV | | | | | | | 1,513 | | | | 1,442 | | | | (5 | ) | | | 5 | | | | 640 | | | | (7 | ) | | | – | | | | 636 | | | | (6 | ) | | | 7 | | | | 237 | | | | 4 | | | | 13 | |
Epzicom/Kivexa | | | | | | | 442 | | | | 324 | | | | 23 | | | | 36 | | | | 178 | | | | 15 | | | | 25 | | | | 209 | | | | 25 | | | | 40 | | | | 55 | | | | 48 | | | | 67 | |
Combivir | | | | | | | 433 | | | | 455 | | | | (14 | ) | | | (5 | ) | | | 180 | | | | (14 | ) | | | (8 | ) | | | 166 | | | | (19 | ) | | | (8 | ) | | | 87 | | | | 1 | | | | 10 | |
Trizivir | | | | | | | 212 | | | | 233 | | | | (18 | ) | | | (9 | ) | | | 106 | | | | (18 | ) | | | (12 | ) | | | 92 | | | | (18 | ) | | | (6 | ) | | | 14 | | | | (20 | ) | | | (7 | ) |
Agenerase, Lexiva | | | | | | | 160 | | | | 141 | | | | 2 | | | | 13 | | | | 83 | | | | (1 | ) | | | 6 | | | | 61 | | | | – | | | | 15 | | | | 16 | | | | 40 | | | | 60 | |
Epivir | | | | | | | 139 | | | | 156 | | | | (20 | ) | | | (11 | ) | | | 47 | | | | (19 | ) | | | (11 | ) | | | 58 | | | | (22 | ) | | | (9 | ) | | | 34 | | | | (18 | ) | | | (13 | ) |
Ziagen | | | | | | | 106 | | | | 109 | | | | (11 | ) | | | (3 | ) | | | 45 | | | | (9 | ) | | | – | | | | 36 | | | | (11 | ) | | | – | | | | 25 | | | | (14 | ) | | | (11 | ) |
| |
Valtrex | | | | | | | 1,195 | | | | 934 | | | | 16 | | | | 28 | | | | 870 | | | | 20 | | | | 30 | | | | 144 | | | | 9 | | | | 25 | | | | 181 | | | | 4 | | | | 20 | |
| |
Zeffix | | | | | | | 188 | | | | 168 | | | | – | | | | 12 | | | | 15 | | | | 8 | | | | 15 | | | | 27 | | | | – | | | | 17 | | | | 146 | | | | (1 | ) | | | 11 | |
Relenza | | | | | | | 57 | | | | 262 | | | | (80 | ) | | | (78 | ) | | | 20 | | | | (86 | ) | | | (85 | ) | | | 6 | | | | (92 | ) | | | (92 | ) | | | 31 | | | | (49 | ) | | | (44 | ) |
| | | | | | | | | | | | | | | | | | | | | | | | | | | | | | | | | | | | | | | | |
Central nervous system | | | 14 | | | | 2,897 | | | | 3,348 | | | | (21 | ) | | | (13 | ) | | | 1,815 | | | | (29 | ) | | | (24 | ) | | | 565 | | | | (1 | ) | | | 12 | | | | 517 | | | | (3 | ) | | | 11 | |
Lamictal | | | | | | | 926 | | | | 1,097 | | | | (22 | ) | | | (16 | ) | | | 711 | | | | (26 | ) | | | (20 | ) | | | 147 | | | | (8 | ) | | | 3 | | | | 68 | | | | 2 | | | | 10 | |
Imigran/Imitrex | | | | | | | 687 | | | | 685 | | | | (8 | ) | | | – | | | | 550 | | | | (9 | ) | | | (1 | ) | | | 96 | | | | (3 | ) | | | 8 | | | | 41 | | | | (8 | ) | | | 8 | |
Seroxat/Paxil | | | | | | | 514 | | | | 553 | | | | (19 | ) | | | (7 | ) | | | 79 | | | | (49 | ) | | | (45 | ) | | | 115 | | | | (14 | ) | | | (4 | ) | | | 320 | | | | (7 | ) | | | 10 | |
Wellbutrin | | | | | | | 342 | | | | 529 | | | | (40 | ) | | | (35 | ) | | | 310 | | | | (44 | ) | | | (39 | ) | | | 18 | | | | >100 | | | | >100 | | | | 14 | | | | 8 | | | | 8 | |
Requip | | | | | | | 266 | | | | 346 | | | | (31 | ) | | | (23 | ) | | | 102 | | | | (60 | ) | | | (57 | ) | | | 133 | | | | 29 | | | | 46 | | | | 31 | | | | 65 | | | | 82 | |
Requip XL | | | | | | | 43 | | | | – | | | | – | | | | – | | | | 9 | | | | – | | | | – | | | | 34 | | | | – | | | | – | | | | – | | | | – | | | | – | |
Treximet | | | | | | | 25 | | | | – | | | | – | | | | – | | | | 25 | | | | – | | | | – | | | | – | | | | – | | | | – | | | | – | | | | – | | | | – | |
| | | | | | | | | | | | | | | | | | | | | | | | | | | | | | | | | | | | | | | | |
Cardiovascular and urogenital | | | 9 | | | | 1,847 | | | | 1,554 | | | | 8 | | | | 19 | | | | 1,107 | | | | 6 | | | | 14 | | | | 512 | | | | 10 | | | | 28 | | | | 228 | | | | 15 | | | | 25 | |
Avodart | | | | | | | 399 | | | | 285 | | | | 27 | | | | 40 | | | | 242 | | | | 27 | | | | 38 | | | | 118 | | | | 21 | | | | 39 | | | | 39 | | | | 48 | | | | 56 | |
Lovaza | | | | | | | 290 | | | | 5 | | | | >100 | | | | >100 | | | | 289 | | | | >100 | | | | >100 | | | | – | | | | – | | | | – | | | | 1 | | | | – | | | | – | |
Coreg | | | | | | | 203 | | | | 587 | | | | (68 | ) | | | (65 | ) | | | 200 | | | | (68 | ) | | | (66 | ) | | | – | | | | – | | | | – | | | | 3 | | | | (67 | ) | | | (50 | ) |
Coreg CR | | | | | | | 165 | | | | 88 | | | | 73 | | | | 88 | | | | 163 | | | | 72 | | | | 85 | | | | – | | | | – | | | | – | | | | 2 | | | | – | | | | – | |
Coreg IR | | | | | | | 38 | | | | 499 | | | | (93 | ) | | | (92 | ) | | | 37 | | | | (93 | ) | | | (92 | ) | | | – | | | | – | | | | – | | | | 1 | | | | (83 | ) | | | (83 | ) |
Fraxiparine | | | | | | | 226 | | | | 184 | | | | 7 | | | | 23 | | | | – | | | | – | | | | – | | | | 178 | | | | – | | | | 18 | | | | 48 | | | | 36 | | | | 45 | |
Arixtra | | | | | | | 170 | | | | 100 | | | | 53 | | | | 70 | | | | 88 | | | | 49 | | | | 60 | | | | 71 | | | | 56 | | | | 82 | | | | 11 | | | | 67 | | | | 83 | |
Vesicare | | | | | | | 71 | | | | 50 | | | | 32 | | | | 42 | | | | 71 | | | | 32 | | | | 42 | | | | – | | | | – | | | | – | | | | – | | | | – | | | | – | |
Levitra | | | | | | | 60 | | | | 49 | | | | 12 | | | | 22 | | | | 57 | | | | 11 | | | | 21 | | | | 3 | | | | – | | | | 50 | | | | – | | | | – | | | | – | |
| | | | | | | | | | | | | | | | | | | | | | | | | | | | | | | | | | | | | | | | |
Metabolic | | | 6 | | | | 1,191 | | | | 1,508 | | | | (28 | ) | | | (21 | ) | | | 590 | | | | (39 | ) | | | (34 | ) | | | 294 | | | | (11 | ) | | | 1 | | | | 307 | | | | (14 | ) | | | (5 | ) |
Avandia products | | | | | | | 805 | | | | 1,219 | | | | (40 | ) | | | (34 | ) | | | 434 | | | | (49 | ) | | | (44 | ) | | | 198 | | | | (22 | ) | | | (12 | ) | | | 173 | | | | (25 | ) | | | (19 | ) |
Avandia | | | | | | | 512 | | | | 877 | | | | (46 | ) | | | (42 | ) | | | 299 | | | | (53 | ) | | | (49 | ) | | | 82 | | | | (33 | ) | | | (26 | ) | | | 131 | | | | (30 | ) | | | (25 | ) |
Avandamet | | | | | | | 256 | | | | 292 | | | | (21 | ) | | | (12 | ) | | | 109 | | | | (32 | ) | | | (26 | ) | | | 111 | | | | (13 | ) | | | – | | | | 36 | | | | – | | | | 6 | |
Bonviva/Boniva | | | | | | | 237 | | | | 161 | | | | 34 | | | | 47 | | | | 156 | | | | 25 | | | | 36 | | | | 74 | | | | 48 | | | | 68 | | | | 7 | | | | >100 | | | | >100 | |
| | | | | | | | | | | | | | | | | | | | | | | | | | | | | | | | | | | | | | | | |
Anti-bacterials | | | 7 | | | | 1,429 | | | | 1,323 | | | | (2 | ) | | | 8 | | | | 174 | | | | (17 | ) | | | (11 | ) | | | 635 | | | | (6 | ) | | | 8 | | | | 620 | | | | 7 | | | | 15 | |
Augmentin | | | | | | | 587 | | | | 530 | | | | – | | | | 11 | | | | 49 | | | | (31 | ) | | | (27 | ) | | | 272 | | | | – | | | | 14 | | | | 266 | | | | 11 | | | | 18 | |
Altabax | | | | | | | 16 | | | | 11 | | | | 36 | | | | 45 | | | | 15 | | | | 27 | | | | 36 | | | | 1 | | | | – | | | | – | | | | – | | | | – | | | | – | |
| | | | | | | | | | | | | | | | | | | | | | | | | | | | | | | | | | | | | | | | |
Oncology and emesis | | | 2 | | | | 496 | | | | 477 | | | | (6 | ) | | | 4 | | | | 243 | | | | (17 | ) | | | (11 | ) | | | 169 | | | | 9 | | | | 25 | | | | 84 | | | | 9 | | | | 20 | |
Hycamtin | | | | | | | 140 | | | | 119 | | | | 7 | | | | 18 | | | | 81 | | | | 7 | | | | 16 | | | | 49 | | | | 5 | | | | 23 | | | | 10 | | | | 11 | | | | 11 | |
Zofran | | | | | | | 110 | | | | 196 | | | | (51 | ) | | | (44 | ) | | | 3 | | | | (97 | ) | | | (96 | ) | | | 63 | | | | (21 | ) | | | (10 | ) | | | 44 | | | | (17 | ) | | | (8 | ) |
Tykerb | | | | | | | 102 | | | | 51 | | | | 80 | | | | 100 | | | | 47 | | | | 22 | | | | 31 | | | | 42 | | | | >100 | | | | >100 | | | | 13 | | | | >100 | | | | >100 | |
| | | | | | | | | | | | | | | | | | | | | | | | | | | | | | | | | | | | | | | | |
Vaccines | | | 12 | | | | 2,539 | | | | 1,993 | | | | 15 | | | | 27 | | | | 629 | | | | (7 | ) | | | – | | | | 1,155 | | | | 28 | | | | 44 | | | | 755 | | | | 21 | | | | 34 | |
| Hepatitis | | | | | | | 665 | | | | 529 | | | | 14 | | | | 26 | | | | 275 | | | | 28 | | | | 38 | | | | 263 | | | | – | | | | 14 | | | | 127 | | | | 16 | | | | 27 | |
Infanrix/Pediarix | | | | | | | 682 | | | | 543 | | | | 12 | | | | 26 | | | | 212 | | | | 1 | | | | 8 | | | | 377 | | | | 21 | | | | 39 | | | | 93 | | | | 11 | | | | 22 | |
Fluarix, FluLaval | | | | | | | 215 | | | | 174 | | | | 11 | | | | 24 | | | | 85 | | | | (20 | ) | | | (13 | ) | | | 78 | | | | 63 | | | | 90 | | | | 52 | | | | 37 | | | | 49 | |
| Flu pandemic | | | | | | | 66 | | | | 146 | | | | (55 | ) | | | (55 | ) | | | 1 | | | | (99 | ) | | | (99 | ) | | | 64 | | | | 25 | | | | 25 | | | | 1 | | | | – | | | | – | |
Cervarix | | | | | | | 125 | | | | 10 | | | | >100 | | | | >100 | | | | – | | | | – | | | | – | | | | 104 | | | | >100 | | | | >100 | | | | 21 | | | | >100 | | | | >100 | |
Rotarix | | | | | | | 167 | | | | 91 | | | | 71 | | | | 84 | | | | 21 | | | | – | | | | – | | | | 43 | | | | 61 | | | | 87 | | | | 103 | | | | 46 | | | | 51 | |
Boostrix | | | | | | | 70 | | | | 66 | | | | (5 | ) | | | 6 | | | | 35 | | | | (20 | ) | | | (13 | ) | | | 26 | | | | 21 | | | | 37 | | | | 9 | | | | 14 | | | | 29 | |
| | | | | | | | | | | | | | | | | | | | | | | | | | | | | | | | | | | | | | | | |
Other | | | 5 | | | | 959 | | | | 901 | | | | (3 | ) | | | 6 | | | | 16 | | | | (78 | ) | | | (75 | ) | | | 321 | | | | 14 | | | | 26 | | | | 622 | | | | (1 | ) | | | 7 | |
| | | | | | | | | | | | | | | | | | | | | | | | | | | | | | | | | | | | | | | | |
| | | | 100 | | | | 20,381 | | | | 19,163 | | | | (3 | ) | | | 6 | | | | 8,894 | | | | (11 | ) | | | (4 | ) | | | 6,483 | | | | 3 | | | | 17 | | | | 5,004 | | | | 5 | | | | 16 | |
| | | | | | | | | | | | | | | | | | | | | | | | | | | | | | | | | | | | | | | | |
| | |
CER% represents growth at constant exchange rates. £% represents growth at actual exchange rates. |
GSK Annual Report 2009
50
Financial review 2008
CNSSir Deryck Maughan
(Aged 63)
CNS sales decreased 21%Appointed on 1st June 2004.
Non-Executive Director.
Sir Deryck is a Partner of Kohlberg Kravis Roberts & Co, a Non-Executive Director of Thomson Reuters and BlackRock Inc., as well as serving on the Board of Directors of Lincoln Center. He was formerly Chairman and Chief Executive Officer of Citigroup International and of Salomon Brothers Inc.
James Murdoch (Aged 38)
Appointed on 20th May 2009.
Non-Executive Director.
James is Chairman and Chief Executive, Europe and Asia of News Corporation. He is also Non-Executive Chairman of BSkyB, a member of the Board of News Corporation and Non-Executive Director of Sotheby’s. He previously served as Chief Executive Officer of BSkyB from 2003 to £2.9 billion.2007 and was also Chairman and Chief Executive Officer of Star TV from 2000 to 2003.
The majorityDr Daniel Podolsky
(Aged 57)
Appointed on 1st July 2006.
Non-Executive Director.
Daniel is President of GSK’s CNS franchise is now impacted by generic competitionthe University of Texas Southwestern Medical Center and holds the Phillip O’Bryan Montgomery, Jr., M.D. Distinguished Presidential Chair in the USA, as generic competition toLamictal,ImigranAcademic Administration, and the remaining presentation ofWellbutrinstarted during the course of 2008. There was, however, some positive news asTreximetwas approved for migraine by the FDADoris and Bryan Wildenthal Distinguished Chair in April 2008.
Cardiovascular and urogenital
Cardiovascular and urogenital sales increased 8% to £1.8 billion.
Strong growth across mostMedical Science. He is a member of the portfolioInstitute of products was partly offset by generic competition toCoreg IR.Lovaza, for very high triglycerides, which was acquired from Reliant Pharmaceuticals in 2007, grew 71% on a proforma basis to £290 million and grew its US market share by 33%.Avodart, for benign prostatic hyperplasia (enlarged prostate), grew 27% to £399 million taking a further percentage point of market share,Arixtra, for deep vein thrombosis and pulmonary embolism, grew 53% to £170 million andCoreg CRgrew 73% to £165 million.
Metabolic
Metabolic sales decreased 28% to £1.2 billion.
Strong growth ofBonviva/Boniva, for postmenopausal osteoporosis, up 34% to £237 million was not enough to offset a full year impact toAvandiawhose sales started to fall in May 2007.Avandiaproduct sales declined 40% during the year to £805 million, with US sales falling 49% to £434 million and European sales down 22% to £198 million. In Emerging Markets,Avandia product sales returned to growth in the second halfMedicine of the year (Q4 sales were up 12%).US National Academy of Sciences.
Oncology and emesisDr Moncef Slaoui (Aged 51)
Appointed on 17th May 2006.
Chairman, Research & Development.
Moncef joined GSK Biologicals in 1988 where he engineered the development of a robust vaccines pipeline and subsequently led Worldwide Business Development for pharmaceuticals before his appointment to lead R&D. In June 2010 Moncef was given overall responsibility for GSK’s Oncology Business and emesis sales decreased 6%over the next twelve months responsibility for GSK Biologicals will also transition to £0.5 billion.
Tykerb, for breast cancer, continued to grow following approval in the USA last year. Approvals in other countries were achieved throughout 2008, with the European approval being achieved in June.
Vaccines
Vaccine sales increased 15% to £2.5 billion.
Within the vaccines portfolio, there were strong performances from Hepatitis vaccines (up 14% to £665 million) and combination paediatric vaccinesInfanrix/Pediarix(up 12% to £682 million).Rotarix, for rotavirus gastroenteritis, rose 71% to £167 million, largely driven by government tender orders in Latin America and the launchhim. He is a member of the productBoard of the Agency for Science, Technology & Research (A*STAR) and has a PhD in the USA in August. New cervical cancer vaccine,Cervarix, recorded sales of £125 million for the year, following several tender wins, including national government orders in the UKMolecular Biology and the Netherlands.Immunology from Université Libre de Bruxelles.
Regional analysisTom de Swaan (Aged 64)
Appointed on 1st January 2006.
Non-Executive Director.
Tom is Chairman of the Supervisory Board of VanLanschot Bankiers, a member of the Board of Directors of Zurich Financial Services and a Non-Executive Director of KPMG’s Public Interest Committee. He is also Vice Chairman of the Supervisory Board and Chairman of the Audit Committee of Royal Ahold and a member of the Supervisory Board of Royal DSM. He was previously a member of the Managing Board and Chief Financial Officer of ABN AMRO.
USASir Robert Wilson
(Aged 67)
SalesAppointed on 1st November 2003.
Non-Executive Director & Senior Independent Director.
Sir Robert is Non-Executive Chairman of BG Group plc. He was previously Executive Chairman of Rio Tinto plc until his retirement in the USA declined 11% to £8.9 billion, principally reflecting a full year impact onAvandia(down 49%)October 2003 and generic competition to significant products such asLamictal(down 26%),Imigran(down 9%),Wellbutrin XL(down 45%),Requip(down 60%)Chairman of The Economist Group between 2003 andCoreg IR(down 93%). These declines were partly offset byAdvair(up 6%),Valtrex(up 20%) andLovaza(up 71% on proforma basis). 2009.
Europe
Sales in Europe increased 3% to £6.5 billion with continued growth ofSeretideand particularly strong vaccines growth offsetting the impact of generic competition to a number of products and continued price cuts from governments across the region.
Emerging Markets
Sales in Emerging Markets increased 12% to £2.3 billion with strong growth in Russia (up 36%), China (up 22%) and Latin America (up 16%). The growth was fuelled primarily by vaccines, up 32% to £0.5 billion, and the respiratory franchise, up 16% to £0.4 billion.
Asia Pacific/Japan
Increased sales ofSeretide/Advair(up 48% to £204 million) were offset by lower orders forRelenzain Japan and some price cuts.
Consumer Healthcare turnover
| | | | | | | | | | | | | | | | | | | | | |
| | | % of | | | 2008 | | | 2007 | | | Growth | |
| | | total | | | £m | | | £m | | | CER% | | | £% | |
| | | | | | | | | | | | | |
Over-the-counter | | | 49 | | | | 1,935 | | | | 1,788 | | | | (2 | ) | | | 8 | |
medicines | | | | | | | | | | | | | | | | | | | | |
Panadol franchise | | | | | | | 324 | | | | 263 | | | | 12 | | | | 23 | |
| Smoking cessation products | | | | | | 299 | | | | 314 | | | | (12 | ) | | | (5 | ) |
Tums | | | | | | | 91 | | | | 88 | | | | (5 | ) | | | 3 | |
| Cold sore franchise | | | | | | | 89 | | | | 79 | | | | 3 | | | | 13 | |
Breathe Right | | | | | | | 81 | | | | 63 | | | | 17 | | | | 29 | |
alli | | | | | | | 75 | | | | 150 | | | | (53 | ) | | | (50 | ) |
| | | | | | | | | | | | | |
Oral healthcare | | | 31 | | | | 1,240 | | | | 1,049 | | | | 6 | | | | 18 | |
Aquafreshfranchise | | | | | | | 452 | | | | 398 | | | | 3 | | | | 14 | |
Sensodyne franchise | | | | | | | 363 | | | | 293 | | | | 12 | | | | 24 | |
| Dental care | | | | | | | 271 | | | | 222 | | | | 8 | | | | 22 | |
| | | | | | | | | | | | | |
Nutritional healthcare | | | 20 | | | | 796 | | | | 716 | | | | 8 | | | | 11 | |
Lucozade | | | | | | | 382 | | | | 347 | | | | 7 | | | | 10 | |
Horlicks | | | | | | | 204 | | | | 174 | | | | 13 | | | | 17 | |
Ribena | | | | | | | 161 | | | | 156 | | | | – | | | | 3 | |
| | | | | | | | | | | | | |
| | | | 100 | | | | 3,971 | | | | 3,553 | | | | 3 | | | | 12 | |
| | | | | | | | | | | | | |
| | |
* | | CER% represents growth at constant exchange rates. £% represents growth at actual exchange rates. |
Total Consumer Healthcare sales for the year rose 3% to £4 billion. This compares with growth of 14% in 2007, which benefited from launch stocking of new anti-obesity treatmentalli. 2008 sales ofalliwere £75 million, down 53%. Excludingalli, Consumer Healthcare sales rose 5% in 2008 (up 9% in 2007).
GSK Annual Report 20092010
51
Financial review 2008
OTC medicines
OTC product sales declined 2% to £1.9 billion in 2008, with sales of smoking cessation products down 12% to £299 million.Panadolsales grew 12% to £324 million, twice the global average in 2008.
Oral healthcare
Sales of Oral healthcare products rose 6% to £1.2 billion, whereas the market grew just 2%. There were strong performances fromSensodyne, up 12% to £363 million, andAquafresh, up 3% to £452 million.Sensodyne’s growth represented 35% of world toothpaste growth in 2008 in markets where GSK competes.
Nutritional healthcare
Within Nutritionals,Horlickssales rose 13% to £204 million,Lucozadesales rose 7% to £382 million andRibena sales were flat at £161 million, although sales ofLucozade andRibenain the second half of the year declined slightly, largely as a result of poor weather in the UK.
Results before major restructuring and total
results
In October 2007, GSK announced a significant new Operational Excellence restructuring programme. A second plan, representing a significant expansion of the Operational Excellence programme, was approved by the Board and announced in February 2009. This restructuring programme covers all areas of GSK’s business, including manufacturing, selling, R&D and infrastructure. With an estimated total cost of approximately £3.6 billion, the expanded programme had been expected to deliver annual pre-tax savings of approximately £1.7 billion by the time it was expected to be substantially complete in 2011. Approximately 40% of these costs were incurred by 31st December 2008. Given the extent and cost of the Operational Excellence programme, GSK presents the restructuring costs incurred solely as a direct result of the Operational Excellence programme, which in 2008 amounted to £1,089 million before tax (2007 – £338 million), in a separate column in the income statement titled ‘Major restructuring’.
In addition to these restructuring costs, this column in the income statement includes restructuring costs incurred solely as a direct result of any restructuring programmes that follow, and relate to material acquisitions where the operations of the acquired business overlap extensively with GSK’s existing operations.
The $1.65 billion (£814 million) acquisition of Reliant Pharmaceuticals Inc. in December 2007 is the only acquisition since October 2007 that meets these criteria. The total restructuring costs incurred as a direct result of this acquisition were £34 million, all of which have been charged and paid in 2008.
As set out in Note 7 to the financial statements, ‘Major restructuring programme’, asset impairments and staff redundancies together accounted for £887 million of the £1,123 million restructuring costs incurred in 2008 and reported in the major restructuring column (2007 – £338 million).
The remaining costs of £236 million in 2008 arose from miscellaneous expenditures incurred solely as a direct result of the restructuring programmes, including consultancy and project management fees, the termination of leases, site closure costs and, with respect to 2008, the recognition of foreign exchange losses following the liquidation of a subsidiary in Puerto Rico.
No costs arising from GSK’s ongoing operating activities have been reported in the major restructuring column.
Any restructuring costs that do not arise solely as a direct result of the Operational Excellence programme and restructuring programmes following, and relating to, acquisitions meeting the criteria described above were reported in operating expenses within results before major restructuring. These costs included restructuring costs related to minor acquisitions and £20 million of costs in 2008 (2007 – £92 million) that related to restructuring activity initiated before the commencement of the Operational Excellence programme. None of this restructuring activity had a material impact on GSK’s operating results or on the manner in which its business is conducted.
GSK’s operating profit, profit before taxation, taxation and profit for the year are discussed below in terms of both total results, which include major restructuring costs, and results before major restructuring.
Operating profit – total results
Total results include restructuring costs related to the new Operational Excellence programme, which commenced in October 2007, and the Reliant restructuring programme.
| | | | | | | | | | | | | | | | | | | | | | | | | |
| | | 2008 | | | 2007 | | | Growth | |
| | | £m | | | % | | | £m | | | % | | | CER% | | | £% | |
| | | | | | | | | | | | | | | | |
| Turnover | | | 24,352 | | | | 100 | | | | 22,716 | | | | 100.0 | | | | (3 | ) | | | 7 | |
| | | | | | | | | | | | | | | | |
| Cost of sales | | | (6,415 | ) | | | (26.3 | ) | | | (5,317 | ) | | | (23.4 | ) | | | 13 | | | | 21 | |
| Selling, general and administration | | (7,656 | ) | | | (31.4 | ) | | | (6,954 | ) | | | (30.6 | ) | | | 2 | | | | 10 | |
| Research and development | | | (3,681 | ) | | | (15.2 | ) | | | (3,327 | ) | | | (14.7 | ) | | | 4 | | | | 11 | |
| Other operating income | | | 541 | | | | 2.2 | | | | 475 | | | | 2.1 | | | | 11 | | | | 14 | |
| | | | | | | | | | | | | | | | |
| Operating profit | | | 7,141 | | | | 29.3 | | | | 7,593 | | | | 33.4 | | | | (20 | ) | | | (6 | ) |
| | | | | | | | | | | | | | | | |
Cost of sales
Cost of sales increased to 26.3% of turnover (2007 – 23.4%). At constant exchange rates, cost of sales as a percentage of turnover increased by 3.8 percentage points to 27.2%, reflecting charges related to the major restructuring programmes of £639 million (2007 – £111 million) and unfavourable product and regional mix compared with 2007, partly offset by savings from the restructuring programmes.
Selling, general and administration
SG&A costs, including legal charges, were 31.4% of turnover (2007 – 30.6%), an increase of 0.8 percentage points. At constant exchange rates, the increase was 1.4 percentage points. Legal costs of £611 million (2007 – £255 million) included a £278 million charge announced in January 2009 related to the US investigation into GSK’s marketing and promotional practices which originated in Colorado. SG&A costs included charges of £304 million (2007 – £137 million) related to the major restructuring programmes. Excluding legal costs, SG&A decreased by 1.6%.
GSK Annual Report 2009
52
Financial review 2008
Research and development
R&D expenditure increased 4% and included charges related to the major restructuring programmes of £175 million (2007 – £90 million). Excluding these charges, R&D expenditure increased 2% in CER terms as investment in the late stage pipeline was partly offset by restructuring savings.
Other operating income
Other operating income of £541 million (2007 – £475 million) included strong growth in royalty income to £307 million (2007 - £216 million). Product, intellectual property and equity investment disposals realised £230 million in 2008 compared with £90 million in 2007. The Roche litigation settlement was included in 2007.
Operating profit – total results
Total operating profit of £7,141 million decreased by 6% in sterling terms and 20% in CER terms compared with 2007. Pharmaceuticals operating profit was £6,331 million, down 21%, while Consumer Healthcare operating profit fell by only 2% to £810 million.
In the year, gains from asset disposals and settlements were £293 million (2007 – £213 million), costs for legal matters were £611 million (2007 – £255 million), fair value movements on financial instruments resulted in a charge of £10 million (2007 - - income of £41 million) and charges relating to previous restructuring programmes were £20 million (2007 – £92 million). Charges related to the major restructuring programmes were £1,118 million (2007 – £338 million). The impact of all these items on total operating profit was a £1,466 million charge in 2008 compared with a £431 million charge in 2007.
Profit before taxation – total results
Net finance costs
| | | | | | | | | |
| | | 2008 | | | 2007 | |
| Finance income | | £m | | | £m | |
| | | | |
| Interest and other finance income | | | 322 | | | | 255 | |
| Fair value adjustments and hedges | | | (9 | ) | | | 7 | |
| | | | |
| | | | 313 | | | | 262 | |
| | | | |
| | | | | | | | | |
Finance costs | | | | | | | | |
| | | | |
| Interest costs | | | (829 | ) | | | (434 | ) |
| Unwinding of discount on liabilities | | | (16 | ) | | | (27 | ) |
| Fair value adjustments and hedges | | | 2 | | | | 8 | |
| | | | |
| | | | (843 | ) | | | (453 | ) |
| | | | |
Share of after tax profits of associates and joint ventures
The share of after tax profits of associates of £48 million (2007 – £50 million) arises principally from the Group’s holding in Quest Diagnostics Inc.
Profit before taxation – total results
Taking account of net finance costs and the share of profits of associates, total profit before taxation was £6,659 million compared with £7,452 million in 2007, a 24% CER decline and an 11% sterling decline.
Operating profit – results before major
restructuring
The results before major restructuring are set out below:
| | | | | | | | | | | | | | | | | | | | | | | | | |
| | | 2008 | | | 2007 | | | Growth | |
| | | £m | | | % | | | £m | | | % | | | CER% | | | £% | |
| | | | | | | | | | | | | | | | |
| Turnover | | | 24,352 | | | | 100 | | | | 22,716 | | | | 100.0 | | | | (3 | ) | | | 7 | |
| | | | | | | | | | | | | | | | |
| Cost of sales | | | (5,776 | ) | | | (23.7 | ) | | | (5,206 | ) | | | (22.9 | ) | | | 4 | | | | 11 | |
| Selling, general and administration | | | (7,352 | ) | | | (30.2 | ) | | | (6,817 | ) | | | (30.0 | ) | | | – | | | | 8 | |
| Research and development | | | (3,506 | ) | | | (14.4 | ) | | | (3,237 | ) | | | (14.3 | ) | | | 2 | | | | 8 | |
| Other operating income | | | 541 | | | | 2.2 | | | | 475 | | | | 2.1 | | | | 11 | | | | 14 | |
| | | | | | | | | | | | | | | | |
| Operating profit | | | 8,259 | | | | 33.9 | | | | 7,931 | | | | 34.9 | | | | (10 | ) | | | 4 | |
| | | | | | | | | | | | | | | | |
Cost of sales
Cost of sales increased by 0.8 percentage points to 23.7% of turnover. At constant exchange rates the increase was 1.5 percentage points of turnover, principally reflecting the impact of generic competition to higher margin products in the USA, lowerAvandiasales and a higher proportion of sales generated in lower margin vaccines, brands sold in Emerging Markets and Consumer Healthcare products. This was partly offset by savings from the restructuring programmes.
Selling, general and administration
SG&A costs, including legal charges, were 30.2% of turnover (2007 – 30.0%). At constant exchange rates, SG&A costs increased by 0.7 percentage points to 30.7% of turnover. Legal costs of £611 million (2007 – £255 million) included a £278 million charge announced in January 2009 related to the US investigation into GSK’s marketing and promotional practices which originated in Colorado. Excluding legal costs, SG&A as a percentage of turnover fell 1.2 percentage points to 27.7% (2007 – 28.9%). This was a 3% growth in sterling terms, but a 4% reduction at constant exchange rates, reflecting the benefits of the restructuring programmes. Selling and distribution fell by 1%, advertising and promotion by 5% and general and administration expenditure, excluding legal charges, by 7%.
Research and development
R&D expenditure increased by 2% to 14.4% of turnover (2007 – 14.3%) as investment in the late stage pipeline was partly offset by restructuring savings.
GSK Annual Report 2009
53
Financial review 2008
Other operating income
Other operating income of £541 million (2007 – £475 million) included strong growth in royalty income to £307 million (2007 – £216 million). Product, intellectual property and equity investment disposals realised £230 million in 2008 compared with £90 million in 2007. The Roche litigation settlement was included in 2007.
Operating profit – results before major restructuring
Operating profit before major restructuring of £8,259 million for the year increased by 4% in sterling terms but decreased by 10% in CER terms compared with 2007. Pharmaceuticals operating profit was £7,427 million, down 11%, while Consumer Healthcare operating profit was flat in CER terms at £832 million. Excluding legal costs, operating profit decreased by 6%, which was greater than the turnover decline of 3%, primarily due to higher cost of sales as a percentage of turnover.
In the year, gains from asset disposals and settlements were £293 million (2007 – £213 million), costs for legal matters were £611 million (2007 – £255 million), fair value movements on financial instruments resulted in a charge of £10 million (2007 – income of £41 million) and charges relating to previous restructuring programmes were £20 million (2007 – £92 million). The impact of these items on operating profit before major restructuring was a £348 million charge in 2008 (2007 – £93 million).
Profit before taxation – results before major
restructuring
Net finance costs
| | | | | | | | | |
| | | 2008 | | | 2007 | |
| Finance income | | £m | | | £m | |
| | | | |
| Interest and other income | | | 322 | | | | 255 | |
| Fair value adjustments and hedges | | | (9 | ) | | | 7 | |
| | | | |
| | | | 313 | | | | 262 | |
| | | | |
| | | | | | | | | |
Finance costs | | | | | | | | |
| | | | |
| Interest costs | | | (829 | ) | | | (434 | ) |
| Unwinding of discount on liabilities | | | (11 | ) | | | (27 | ) |
| Fair value adjustments and hedges | | | 2 | | | | 8 | |
| | | | |
| | | | (838 | ) | | | (453 | ) |
| | | | |
Taking account of net finance costs and the share of profits of associates, profit before tax before major restructuring was £7,782 million compared with £7,790 million in 2007, a 14% CER decline but flat in sterling terms.
Taxation
| | | | | | | | | |
| | | 2008 | | | 2007 | |
| | | £m | | | £m | |
| | | | |
| UK corporation tax | | | 289 | | | | 452 | |
| Overseas taxation | | | 1,589 | | | | 1,962 | |
| | | | |
| Current taxation | | | 1,878 | | | | 2,414 | |
| Deferred taxation | | | 69 | | | | (272 | ) |
| | | | |
| Taxation on total profits | | | 1,947 | | | | 2,142 | |
| | | | |
The charge for taxation on profit before major restructuring charges, amounting to £2,231 million (2007 – £2,219 million), and represents an effective tax rate of 28.7% (2007 – 28.5%). The charge for taxation on total profits amounted to £1,947 million (2007 – £2,142 million) and represented an effective tax rate of 29.2% (2007 – 28.7%). The Group’s balance sheet at 31st December 2008 included a tax payable liability of £780 million and a tax recoverable asset of £76 million.
The Group’s main open tax issues are in the USA, Canada and Japan.
For the latest position on Taxation see ‘Taxation’ in the 2009 Financial Review on page 34.
Profit for the year
| | | | | | | | | | | | | | | | | |
| | | 2008 | | | 2007 | | | Growth | |
| | | £m | | | £m | | | CER% | | | £% | |
| | | | | | | | | | |
| Total profit after taxation for the year | | | 4,712 | | | | 5,310 | | | | (25 | ) | | | (11 | ) |
| Total profit attributable to shareholders | | | 4,602 | | | | 5,214 | | | | (26 | ) | | | (12 | ) |
| Basic earnings per share (pence) | | | 88.6 | p | | | 94.4 | p | | | (21 | ) | | | (6 | ) |
| Basic earnings per ADS (US$) | | | $3.28 | | | | $3.77 | | | | | | | | | |
| | | | | | | | | | |
| Results before major restructuring profit after taxation for the year | | | 5,551 | | | | 5,571 | | | | (14 | ) | | | – | |
| Results before major restructuring profit attributable to shareholders | | | 5,441 | | | | 5,475 | | | | (15 | ) | | | (1 | ) |
| Adjusted earnings per share (pence) | | | 104.7 | p | | | 99.1 | p | | | (9 | ) | | | 6 | |
| Adjusted earnings per ADS (US$) | | | $3.87 | | | | $3.96 | | | | | | | | | |
| Weighted average number of shares (millions) | | | 5,195 | | | | 5,524 | | | | | | | | | |
| | | | | | | | | | |
| Diluted total earnings per share (pence) | | | 88.1 | p | | | 93.7 | p | | | | | | | | |
| Diluted total earnings per ADS (US$) | | | $3.26 | | | | $3.75 | | | | | | | | | |
| Diluted weighted average number of shares (millions) | | | 5,226 | | | | 5,567 | | | | | | | | | |
| | | | | | | | | | |
Total results including restructuring costs produced a basic EPS of 88.6p compared with 94.4p in 2007. This was a 21% decline at CER and a 6% decline in sterling terms.
Dividend
The Board has declared a fourth interim dividend of 17 pence per share resulting in a dividend for the year of 57 pence, a four pence increase over the dividend of 53 pence per share for 2007.
GSK Annual Report 2009
5460
Our Board
| | | | | | |
| |  | |  | |  |
Sir Christopher Gent
(Aged 61)
Appointed on 1st June 2004.
Chairman.
Sir Christopher is a Non-Executive Director of Ferrari SpA and was the Chief Executive Officer of Vodafone Group plc, until his retirement in July 2003. He is a Non-Executive Director of Lehman Brothers Holdings Inc, a member of KPMG’s Chairman’s Advisory Group, a Senior Adviser at Bain & Co. and a member of the Advisory Board of Reform. | | Professor Sir Roy Anderson
(Aged 62)
Appointed on 1st October 2007.
Non-Executive Director.
Professor Anderson is Professor of Infectious Disease Epidemiology in the Faculty of Medicine, Imperial College, London. He is a member of the International Advisory Board of Hakluyt & Co. Ltd. He is a fellow of the Royal Society and a Foreign Associate Member of the Institute of Medicine at the US National Academy of Sciences and the French Academy of Sciences. His former positions include Rector of Imperial College and Chief Scientific Adviser at the Ministry of Defence in the UK. | | Larry Culp (Aged 46)
Appointed on 1st July 2003.
Non-Executive Director.
Mr Culp is President and Chief Executive Officer of Danaher Corporation. Prior to joining Danaher, he held positions in Accenture, previously Andersen Consulting. | | Julian Heslop (Aged 56)
Appointed on 1st April 2005.
Chief Financial Officer.
Mr Heslop joined Glaxo Wellcome as Financial Controller in April 1998. In January 2001 he was appointed Senior Vice President, Operations Controller. Prior to joining the Group he held senior finance roles at Grand Metropolitan. |
| | | | | | |
| |  | |  | |  |
Andrew Witty (Aged 45)
Appointed on 31st January 2008. Chief Executive Officer.
Mr Witty was named Chief Executive Officer Designate for GSK in October 2007 and was appointed Chief Executive Officer (CEO) on 21st May 2008. He joined the Group in 1985 and has held senior positions in Asia, Africa and the USA. Immediately prior to being appointed CEO, Andrew was President, Pharmaceuticals Europe, a position he held from January 2003. He is a member of the Business Council for Britain, a Board Member of PhRMA, President of EFPIA, a Member of the Singapore Economic Development Board’s International Advisory Council and an Adviser to the Governor of Guangzhou, China. | | Dr Stephanie Burns
(Aged 55)
Appointed on 12th February 2007.
Non-Executive Director.
Dr Burns is Chairman, President and Chief Executive Officer of Dow Corning Corporation. She is also a member of the American Chemical Society and sits on the Executive Committee of the Society of Chemical Industry, America Section, serves on the Board of Directors of the American Chemistry Council, and on the Board of Directors for the Society for Women’s Health Research. Dr Burns holds a PhD in organic chemistry from Iowa State University. | | Sir Crispin Davis (Aged 60)
Appointed on 1st July 2003.
Non-Executive Director.
Until March 2009 Sir Crispin was Chief Executive Officer of Reed Elsevier PLC. Prior to that appointment, he was Chief Executive of Aegis Group plc, which he joined from Guinness plc, where he was a member of the main Board and Group Managing Director of United Distillers. He spent his early career with Procter & Gamble, including as President of the company’s US Food Division. | | Sir Deryck Maughan
(Aged 62)
Appointed on 1st June 2004.
Non-Executive Director.
Sir Deryck is a Partner of Kohlberg Kravis Roberts & Co, and a Non-Executive Director of Thomson Reuters and BlackRock Inc. He was formerly Chairman and Chief Executive Officer of Citigroup International and of Salomon Brothers Inc. |
GSK Annual Report 2009
55
Our Board
| | | | | | |
| |  | |  | | |
James Murdoch (Aged 37)
Appointed on 20th May 2009.
Non-Executive Director.
Mr Murdoch is Chairman and Chief Executive, Europe and Asia of News Corporation. He is also Non-Executive Chairman of BSkyB and a member of the Board of News Corporation. He served as Chief Executive Officer of BSkyB from 2003 to 2007 and was also previously Chairman and Chief Executive Officer of Star TV. He also serves on the Leadership Council of The Climate Group. | | Dr Moncef Slaoui (Aged 50)
Appointed on 17th May 2006.
Chairman, Research & Development.
Dr Slaoui joined GSK Biologicals in 1988 where he engineered the development of a robust vaccines pipeline and subsequently led Worldwide Business Development for pharmaceuticals before his appointment to lead R&D. He is a member of the Board of the Agency for Science, Technology & Research (A*STAR) and has a PhD in Molecular Biology and Immunology from Université Libre de Bruxelles. | | Sir Robert Wilson
(Aged 66)
Appointed on 1st November 2003.
Non-Executive Director & Senior Independent Director.
Sir Robert is Non-Executive Chairman of BG Group plc. He was previously Executive Chairman of Rio Tinto plc until his retirement in October 2003 and Chairman of The Economist Group between 2003 and 2009. | | |
| | | | | | |
| |  | | | | |
Dr Daniel Podolsky
(Aged 56)
Appointed on 1st July 2006.
Non-Executive Director.
Dr Podolsky is President of the University of Texas Southwestern Medical Center in Dallas and holds the Phillip O’Bryan Montgomery, Jr., M.D. Distinguished Presidential Chair in Academic Administration, and the Doris and Bryan Wildenthal Distinguished Chair in Medical Science. He is a member of the Institute of Medicine of the US National Academy of Sciences. He is also Chairman of the Board and Scientific Co-Founder of the GI Company. | | Tom de Swaan (Aged 63)
Appointed on 1st January 2006.
Non-Executive Director.
Mr de Swaan is Chairman of the Supervisory Board of VanLanschot Bankiers and a member of the Board of Directors of Zurich Financial Services. He is also Vice Chairman of the Supervisory Board and Chairman of the Audit Committee of Royal Ahold and a member of the Supervisory Board of Royal DSM. Until January 2006, he was a member of the Managing Board and Chief Financial Officer of ABN AMRO. | | Other Directors
Sir Ian Prosser and Dr Ronaldo Schmitz both retired from the Board on 20th May 2009. | | |
GSK Annual Report 2009
56
Our Corporate Executive Team (CET)
Andrew Witty
Chief Executive Officer
Andrew was appointed Chief Executive Officer in May 2008. He joined Glaxo UK in 1985. During his career with the company he has held the roles of Managing Director South Africa, Vice President and General Manager Marketing in the USA and Senior Vice President, Asia Pacific. He was appointed President, Pharmaceuticals Europe for GlaxoSmithKline in January 2003.
Simon Bicknell
Senior Vice President,
Governance, Ethics and Assurance
Simon was appointed to the role in January 2011. He is responsible for risk management, compliance and internal auditing. He was formerly SVP, Company Secretary & Corporate Compliance Officer
Simon ensures that compliance and risk management are effectively embedded within the business and oversees corporate governance for the Group. He is also responsible for internal audit and assurance.Officer. Simon joined the Corporate Secretariat in 1984. He was appointed Deputy Company Secretary of Glaxo Wellcome in 1995 and Company Secretary of GlaxoSmithKline plc in 2000.May 2000 and combined this position with his role as Corporate Compliance Officer from April 2006 until his current appointment.
John Clarke
President, Consumer Healthcare
John is responsible for the Consumer Healthcare business which produces oral healthcare, over-the-counter and nutritional healthcare products. He joined Beecham in 1976 and was the President of the Future Group before his current appointment in January 2006.
Deirdre Connelly
President, North America Pharmaceuticals
Deirdre joined GSK in February 2009 after working at Eli Lilly and Company for 24 years. She held a variety of positions including sales professional, General Manager of Puerto Rico, Executive Director of Human Resources and most recently President of US Operations.
Simon Dingemans
Chief Financial Officer Designate
Simon was appointed Chief Financial Officer Designate on 4th January 2011. He joined GSK from Goldman Sachs where he was a Managing Director and Partner. He has over 25 years of experience in investment banking, including most recently as leader of Goldman Sachs’ European M&A business and before that as head of UK Investment Banking.
Marc Dunoyer
President, Pharmaceuticals Asia Pacific/Head of Rare Diseases Unit and Chairman of GSK Japan
Marc was appointed President, Pharmaceuticals Asia Pacific/ Japan in May 2008. In addition to his current role he was appointed Chairman GSK Japan in January 2010 and in February 2010 to lead theGSK’s rare diseases business of GSK from R&D to commercialisation. He joined the Group in 1999 and was previously President, Pharmaceuticals Japan from January 2000 until his current appointment.
May 2008. He was President, Pharmaceuticals Asia Pacific/ Japan from May 2008 until July 2010.Eddie Gray
President,
Pharmaceuticals Europe
Eddie became responsible for the Group’s operations in Europe in January 2008. He joined Beecham in 1988 and, prior to his current appointment, was Senior Vice President and General Manager, Pharmaceuticals UK.

Julian Heslop
Chief Financial Officer
Julian became Chief Financial Officer in April 2005. As head of the finance function he is responsible for activities such as financial reporting and control, tax and treasury, finance systems and insurance. He joined Glaxo Wellcome as Financial Controller in April 1998.
He will leave the CET when he retires from GSK at the end of March 2011.Abbas Hussain
President, Emerging Markets
& Asia Pacific
Abbas joined GSK in June 2008 from Eli Lilly and Company, where he spent 20 years overseeing markets throughout Europe, Africa/Middle East and Australasia.
Duncan Learmouth
Senior Vice President, Global Communications
Duncan is responsible for the Group’s investor relations, internal and external communications, corporate responsibility and partnerships with communities. He joined Glaxo in 1991 and was Vice President, Global Investor Relations, before appointment to his current position in July 2006.
Bill Louv
Senior Vice President, Core Business Services & Chief Information Officer
Bill was appointed Chief Information Officer in January 2007. In addition to this role he was appointed to create and lead Core Business Services in April 2010. He is responsible for information technology across GSK. Bill joined Glaxo in 1994 as Vice President, Medical Data Sciences. Prior to his current role,roles, Bill was Senior Vice President, R&D Information Technology.
GSK Annual Report 20092010
5761
Our Corporate Executive Team (CET)
Dan Phelan
Chief of Staff
Dan is responsible for Corporate Strategy and Development, IT, HR, Real Estate and Facilities, Environmental Health and Safety, and Global Security. He joined Smith Kline & French in 1981 and previously held the role of Senior Vice President, Human Resources until his appointment as Chief of Staff in May 2008.
David Pulman
President, Global
Manufacturing and Supply
David is responsible for the Global Manufacturing and Supply organisation and Global Procurement. He joined Glaxo in 1978. He has broad experience of manufacturing operations having previously led the Primary Supply, European manufacturing, North American manufacturing, Global Logistics and Manufacturing Strategy organisations.
David Redfern
Chief Strategy Officer
David is responsible for proactive exploration of new business opportunities, strategic planning and strategic planning.dermatology. In addition to his current role he was appointed Chairman of the Board of ViiV Healthcare Ltd. with effect from 1st April 2011. He began his career with GSK in 1994 in Corporate Development before being appointed Finance Director of Europe Pharmaceuticals in 1999. He was appointed Area Director for Central Europe in 2003 and Northern Europe in 2005.

Moncef Slaoui
Chairman, Research & Development
Moncef leads the Group’s drug discovery and development activities.activities as well as its Oncology business. Over the next 12 months he will assume operational responsibility for GSK biologicals. He joined the Group in 1988 and was a key player in building GSK’s vaccines pipeline. In 2003 he was appointed Senior Vice President, Worldwide Business Development until his current appointment in June 2006.
Jean Stéphenne
Chairman and President, and General Manager, Biologicals
Jean has led GSK’s global vaccines business since 1989. Previously he was Vice President of Human Vaccines Research and Development and Production. He joined the company in 1974 as Head of Bacterial and Viral Vaccines production. Jean was named Baron by King Albert II of the Belgians in 2000 in recognition of his leading contribution to R&D and industry in Belgium.

Claire Thomas
Senior Vice President, Human Resources
Claire leads the global Human Resources (HR) function. Previously, she oversaw HR in Pharmaceuticals International and in Pharmaceuticals Europe. Claire joined the company in 1996 and was appointed Director of Human Resources for UK Pharmaceuticals in 1997. Claire was honoured as an Outstanding European Woman of Achievement in 2007.
Dan Troy
Senior Vice President and General Counsel
Dan joined GSK as Senior Vice President and General Counsel in September 2008. PreviouslyBefore that he was a Partner at the Washington law firm Sidley Austin LLP and Chief Counsel for the FDA. From 2006-20072006—2007 he chaired the AmericaAmerican Bar Association’s Section of Administrative Law, and was previously adjunct scholar at the American Enterprise Institute in Washington, DC.
Patrick Vallance
Senior Vice-President, Medicines Discovery and Development
Patrick was appointed Senior Vice President, Medicines Discovery and Development in July 2010. He is responsible for ensuring a flow of new medicines through the R&D pipeline from early discovery through to approval of the medicine. Patrick joined GSK in 2006. Prior to that he was a clinical academic and led the Division of Medicines at University College London.
Changes to the CET
Duncan Learmouth, Senior Vice President, Global Communications left the CET in August 2010 for a new role as Senior Vice President, Developing Countries and Market Access. Phil Thomson was appointed Senior Vice President, Global Communications in August 2010 and, although he is not a member, is invited to attend CET meetings as required.
Dan Phelan, Chief of Staff stepped down from the CET in December 2010 to act as an advisor to the CEO in advance of his eventual retirement from GSK.
GSK Annual Report 20092010
5862
Corporate governance
Dear Shareholder
On behalf of the Board, I am pleased to present the Corporate Governance Report for 2010.
Review of 2010
Although our operating environment remains challenging, I believe that we made significant progress during 2010 in substantially re-engineering GSK’s business through restructuring and a more rigorous approach to capital allocation. The effect of these changes also became increasingly evident in 2010 through the delivery of diversified underlying sales growth, increasing pipeline potential and improved cash generation before legal settlements. By becoming a more balanced, synergistic business with a broad and diverse pipeline generating increasing potential, the Board believes that we can generate increased value for shareholders and deliver even better outcomes to patients and consumers.
Corporate governance developments
2010 has seen a continuation of reviews and consultations aimed at examining and improving corporate governance arrangements, predominantly in the light of the recent global financial crisis. GSK has been an active participant in debating the issues raised by these consultations where they have been relevant to the long term interests of our shareholders. We have also taken the opportunity to review our board practices and governance procedures against the standards contained in the Financial Reporting Council’s (FRC) updated UK Corporate Governance Code (updated Code) published in June 2010, formerly the Combined Code on Corporate Governance (Combined Code). Our review indicated that we are in a strong position to comply fully with its provisions and I will report formally on GSK’s compliance with the updated Code next year.
Board role and effectiveness
As Chairman, my role primarily is to provide leadership to the Board, necessary to promote the success of the company and create value for shareholders in the long term, while ensuring that sound effective corporate governance practices are embedded in the organisation and its decision-making processes.
There are a number of ingredients that make up an effectively functioning board. GSK’s approach is set out in greater detail in the following Report. A notable example of this in practice has been the exercise by the Audit & Risk Committee of the oversight powers delegated to it by the Board. The decision to resolve the inherent unpredictability and reduce overall litigation exposure has been a core focus for this Committee and the Board. The Audit & Risk Committee holds regular dialogue with executive management, who provide updates on the progress being made to resolve outstanding legal matters. The Board acknowledges that the scale of the legal provisioning required for 2010 has been significant, but continues to believe it is in the best long term interests of shareholders to resolve such matters.
As usual, we have conducted a rigorous evaluation to test the Board and its Committees’ effectiveness. I am pleased to note the FRC endorsed in its updated Code the approach of externally facilitated board evaluations being undertaken at least every three years; an approach that GSK has previously adopted. Details of the latest Board evaluation and the actions that have been identified and agreed upon to drive standards of Board governance and performance can be found on page 68 of the Report.
Other areas of board practice that I would also like to particularly focus on here are business awareness, succession planning and shareholder engagement, key areas where we have made good progress during 2010.
Business awareness and succession planning
Each year the Board seeks to further develop its knowledge and understanding of the business and to gain greater visibility of executive talent and management succession. In 2010 the Board made several visits to some of the Group’s sites and met with key talent and senior executives.
In March, the Board visited our Vaccines site in Wavre in Belgium to receive an update on the progress of our main vaccines business, which continues to grow in terms of its contribution to the Group. This included specific briefings on three important vaccine development programmes; namely MAGE-A3, Synflorix and Malaria. The Board was also very pleased to meet and thank GSK staff at the site for the extraordinary efforts they had made to enable the Group to respond to the H1N1 pandemic in 2009.
In July, the Board visited GMS and R&D sites in Research Triangle Park and Zebulon in the United States. These visits included briefings with several Discovery Performance Units, a tour of a pharmaceutical development pilot plant, together with workshops with senior executives. The Board also held a reception with locally based executives and key talent.
GSK Annual Report 2010
63
Corporate governance
GSK continues to target growth in Emerging Markets and has established an important new corporate hub for the Group in the Far East in Singapore. During the summer, Abbas Hussain, President, Emerging Markets & Asia Pacific and a Corporate Executive Team (CET) member, relocated to Singapore to be more centrally located in this region. In October, the Board held a joint strategy review meeting with CET members in Singapore and was pleased to visit a GMS site and tour one of GMS’ production facilities and a pilot plant. The Board also had a workshop on the results of GSK’s investment in green chemistry and continuous manufacture technology in Singapore, which will contribute to the Group’s efforts to reduce costs and minimise our impact on the environment. The Board was also pleased to have the opportunity to meet with local senior executives and key talent.
In addition to these planned visits, our Non-Executive Directors are encouraged to attend CET meetings and R&D related executive meetings. This provides them with a good perspective of how management operates and gives a greater insight into key business issues. It also provides a further opportunity for Board members to observe the skills, knowledge, integrity and behaviour of our senior management cadre and key executive talent, whilst enabling our employees to give direct feedback to Board members.
Shareholder engagement
At GSK we value an open, constructive and effective interaction with our shareholders.
In particular, the CEO, CFO and I maintain an ongoing dialogue with institutional investors through a regular programme of meetings which cover a range of issues.
During 2010, Andrew Witty attended over 60 one-on-one meetings with investors, covering over 50 separate funds. Julian Heslop attended nearly 40 one-on-one meetings with investors, covering over 35 separate funds. In addition, both met with multiple additional investors via group meetings and at broker conferences. I personally met a representative cross section of our shareholders during the course of the year and am available to meet with shareholders on request along with other Board colleagues. Also, along with the Remuneration Committee Chairman, the Head of Human Resources and the Company Secretary, I attended meetings with institutional investors to specifically discuss remuneration policy and governance related matters, a process we conduct annually.
We believe this level and quality of engagement is key to ensuring that the Board and senior management understand our shareholders’ views and perspectives. On this theme, we welcome the introduction by the FRC of the Stewardship Code for Institutional Investors, a code of good practice for major shareholders, which aims to further strengthen the quality of the engagement process between major shareholders and the companies that they invest in.
At the company’s 2011 AGM all Board directors who are able to attend will be available, as usual, to meet with investors after the meeting to discuss issues on a face-to-face basis.
Combined Code compliance statement
Throughout 2010, the company complied with the provisions and applied the Main Principles of Section 1 of the Combined Code, except that Dr Stephanie Burns, Larry Culp and Tom de Swaan were unable to attend the company’s 2010 AGM. Dr Stephanie Burns and Larry Culp were prevented from attending due to travel disruption caused by the ash clouds from the volcano in Iceland and Tom de Swaan was required to chair a shareholder meeting of another public company on the same day. This resulted in a partial non-compliance with code provision D.2.3.
Annual re-election of directors
GSK, like a number of other organisations and interested parties, expressed the view during the consultation period on updating the Combined Code that the FRC’s proposal to mandate annual re-election of directors could be damaging. We feared that it could erode the principle of the unitary Board, was likely to increase short-termism and could make it even more difficult to recruit new Board members. Nevertheless, this change has been included as a new provision in the updated Code and the Board has agreed that each Board member should stand for re-election at the 2011 AGM. We will monitor the effect of this provision over time.
The Corporate Governance Report that follows sets out how GSK complied with the provisions and applied the principles of the Combined Code during the year.
Sir Christopher Gent
Chairman
GSK Annual Report 2010
64
Corporate governance
Governance and policy
This section discusses GSK’s management structures and governance procedures. The section,procedures and together with the Remuneration Report on pages 73 and 90,81 to 101, includes details of how the company applies and complies with the principles and provisions of the Combined Code on Corporate Governance ofmaintained by the Financial Reporting Council (Combined Code)FRC and with US laws and regulation.regulations.
The Board and Corporate Executive Team
The Directors are listed under ‘Our Board’ on pages 5458 to 55.59 and the members of the CET under ‘Our Corporate Executive Team’ on pages 60 to 61.
The Board is responsible for the Group’s system of corporate governance and is ultimately accountable for the Group’s activities, strategy, risk management and financial performance.
Independence
The Board considers all its Non-Executive Directors to be independent in character and judgement and free from any business or other relationship which could materially interfere with the exercise of their judgement.
Dr Schmitz served The Chairman satisfied the independence criteria on the Board for more than ten years until his retirement as a Director on 20th May 2009, having been appointedappointment to the Board of Glaxo Wellcome plc on 1st January 1997. During consideration of the Annual Review of Board effectiveness at its meeting in January 2009, the Board concluded that Dr Schmitz remained independent, notwithstanding his length of service. In the opinion of the Board, Dr Schmitz continued to demonstrate the characteristics of independence, such as objectively challenging management and taking part in rigorous debate, while at the same time possessing an outstanding knowledge of the company’s business and affairs, together with his experience gained as Chairman of the Audit Committee. In a long cycle investment business, such as GSK, it was considered to be particularly important to have experienced members on the Board. Sir Ian Prosser was also considered to be independent in accordance with the recommendations of the Combined Code prior to his retirement from the Board.
When Sir Christopher Gent was appointed to the Board as Deputy Chairman, he was determined by the Board to be independent. Upon taking up the chairmanship of the Board on 1st January 2005, in accordance with the Combined Code, he was excluded from the determination of whether at least half the Board are independent Non-Executive Directors. Sir Christopher Gent is a member of the Remuneration Committee, as permitted by the Combined Code, in light of his independence upon appointment as Chairman.
The Board considers that Professor Sir Roy Anderson, Dr Burns, Mr Culp, Sir Crispin Davis, Sir Deryck Maughan, Mr Murdoch, Dr Podolsky, Mr de Swaan and Sir Robert Wilson are independent in accordance with the recommendations of the Combined Code.
At the date of publication and throughout 2009,2010, a majority of the Board members, excluding the Chairman, were independent Non-Executive Directors.
Chairman, CEO and CEOSenior Independent Director
Sir Christopher Gent has chaired the company since 1st January 2005 and was Chairman throughout 2009.
Mr2010. His biographical details can be found on page 58. Andrew Witty is the Chief Executive Officer (CEO). Mr Witty’sCEO and his biographical details can be found on pages 5458 and 56. 60.
The Chairman leads and manages the Board and representswhile the Board to the CEO and other CET members as necessary between Board meetings. The CEO manages the Group and implements the strategy and policies adopted by the Board. The Chairman and the Chairmen of Board Committees communicate regularly with the CEO and other CET members. The division of responsibilities between the role of Chairman and the CEO has been set out in writing, and agreed by the Board.
The CEO is responsible for executive management of the Group and is assisted by the CET. The CET meets at least 11 times per year and otherwise as necessary. The members
Under the terms of their engagement, the Chairman and each Non-Executive Director are expected to devote such time as is necessary for the proper performance of their responsibilities are listed under ‘Our Corporate Executive Team’ (pages 56 to 57).
Senior Independent Directorduties.
Sir Robert Wilson was appointed Senior Independent Director (SID) on 20th May 2009, following Sir Ian Prosser’s retirement from the Board on that date. Sir Ian had heldHis responsibilities include the role since January 2005.annual evaluation of the performance of the Chairman, the Board, its Committees and Directors in collaboration with the Committee Chairmen in those years when the process is internally facilitated. He is also available as an additional point of contact on the Board for shareholders.
Board process
The Board is responsible for the long-term success of the company and has the authority, and is accountable to shareholders, for ensuring that the Group is appropriately managed and achieves the strategic objectives it sets. The Board discharges those responsibilities through an annual programme of meetings which includes the approval of overall budgetary planning and business strategy. The Board reviews the Group’s internal controls and risk management policies and approves its governance structure and code of ethics.conduct.
The Board appraises and approves major financing, investment and licensing decisions in excess of defined thresholds. In addition, the Board evaluates and monitors the performance of the Group as a whole. This includes:
| • | | engaging at Board meetings with and challenging the CEO, the other Executive Directors and members of the CET as appropriate, on the financial and operating performance of GSK and external issues material to the Group’s prospects, |
|
| • | | evaluating progress towards the achievement of the Group’s financial and business objectives and annual plans and the Non- Executive Directors scrutinising the performance of management in meeting these objectives and plans, and |
|
| • | | monitoring, through reports received directly or from various committees, the significant risks facing the Group. |
evaluating progress towards the achievement of the Group’s financial and business objectives and annual plans
monitoring, through reports received directly or from various committees, the significant risks facing the Group.
GSK Annual Report 2009
59
Corporate governance
The Board has overall responsibility for succession planning for the CEO and the other Executive and Non-Executive Directors. The Board has given the CEO broad authority to operate the business of the Group, and the CEO is accountable for, and reports to the Board on, the performance of the business. CET members make regular presentations to the Board on their areas of responsibility, and theresponsibility. The Board meetsDirectors meet with all the CET members on an annual basis to discuss and develop proposals collectively in relation to the Group’s strategy.
A primary element of the induction process for new Non-Executive Directors is undertaken by members of the CET, and all Non-Executive Directors are encouraged to have separate informal discussions at their discretion with any CET members.
The Board met six times in 2009,2010, with each member attending as follows:
| | | | | | | | | |
| | | Number of meetings | | | | |
| | | held whilst a Board | | | Number of | |
| | | member | | | meetings attended | |
| | | | |
| Sir Christopher Gent | | | 6 | | | | 6 | |
| Mr A Witty | | | 6 | | | | 6 | |
| Mr J Heslop | | | 6 | | | | 6 | |
| Dr M Slaoui | | | 6 | | | | 6 | |
| Professor Sir Roy Anderson | | | 6 | | | | 6 | |
| Dr S Burns | | | 6 | | | | 6 | |
| Mr L Culp | | | 6 | | | | 6 | |
| Sir Crispin Davis | | | 6 | | | | 6 | |
| Sir Deryck Maughan | | | 6 | | | | 6 | |
| Mr J Murdoch* | | | 4 | | | | 4 | |
| Dr D Podolsky | | | 6 | | | | 6 | |
| Mr T de Swaan | | | 6 | | | | 6 | |
| Sir Robert Wilson | | | 6 | | | | 6 | |
| Sir Ian Prosser* | | | 3 | | | | 3 | |
| Dr R Schmitz* | | | 3 | | | | 3 | |
| | | | |
| | | | | | | | | |
| | | | | | | |
| | | Number of meetings | | | | |
| | | held whilst a Board | | | Number of | |
| | | member | | | meetings attended | |
| Sir Christopher Gent | | | 6 | | | | 6 | |
| Andrew Witty | | | 6 | | | | 6 | |
| Julian Heslop | | | 6 | | | | 6 | |
| Dr Moncef Slaoui | | | 6 | | | | 6 | |
| Professor Sir Roy Anderson | | | 6 | | | | 6 | |
| Dr Stephanie Burns | | | 6 | | | | 6 | |
| Larry Culp | | | 6 | | | | 5 | |
| Sir Crispin Davis | | | 6 | | | | 6 | |
| Sir Deryck Maughan* | | | 6 | | | | 4 | |
| James Murdoch | | | 6 | | | | 6 | |
| Dr Daniel Podolsky | | | 6 | | | | 6 | |
| Tom de Swaan | | | 6 | | | | 5 | |
| Sir Robert Wilson | | | 6 | | | | 6 | |
| | | | | | | |
| | |
| * | | Mr James MurdochSir Deryck was appointedunable to attend two meetings for personal reasons. He gave his comments to the BoardChairman on 20th May 2009. Sir Ian Prosser and Dr Ronaldo Schmitz retired from the Board on 20th May 2009.matters to be discussed in advance of both meetings. |
In addition to the six scheduled meetings, the Board also met on a quorate basis on sixthree occasions.
GSK Annual Report 2010
65
Corporate governance
Where Directors are unable to attend a Board or Committee meeting, they communicate their comments and observations on the matters to be considered via the Chairman of the Board or the relevant Board Committee Chairman for raising as appropriate at the relevant meeting. Attendance at meetings is considered as part of the one-to-one meetings conducted by the Chairman with each Director.
Business environment and personal development
To ensure that the Board is kept up-to-date on important matters, including legal, governance and regulatory developments, presentations are made on a regular basis by both external and internal advisers.
In addition, Non-Executive Directors also gain greater insight and understanding of the business and access to GSK employees through visits to Group operational facilities and attendance at various internal management meetings, including CET, Research & Development Executive and Product Marketing Board meetings, on an ad hoc basis.
A customised induction process is conducted by the Company Secretary for each of the new Non-Executive Directors focusing on their particular experience and taking account of their different backgrounds. ThisA primary element of this process includes meeting members of the CET informally on a collective and individual basis as appropriate, together with other senior executives, and visiting particular operational facilities of the Group.
In addition, the Chairman meets with each Director annually on a one-to-one basis to discuss and agree their individual ongoing training and development requirements.
Independent advice
The Board recognises that there may be occasions when one or more of the Directors feel it is necessary to take independent legal and/or financial advice at the company’s expense. There is an agreed procedure to enable them to do so.
Indemnification of Directors
Qualifying third party indemnity provisions (as defined in section 234 of the Companies Act 2006) are in force for the benefit of the Directors and former Directors who held office during 2009.2010.
Directors’ conflicts of interest
Directors have a statutory duty to avoid a situation in which they have, or can have, a direct or indirect conflict of interest or possible conflict of interest with the company. The duty applies in particular to the exploitation of any property, information or opportunity, whether or not GSK could take advantage of it. The company’s Articles of Association include a general power for the Board to authorise such conflicts. There is no breach of duty if the relevant matter has been so authorised in advance.
The Board has an established proceduresprocedure for handling situational conflicts of interest, which areis in line with the best practice guidance issued by the General Counsel 100 Group and in accordance with the company’s Articles. It has authorised the Nominations Committee to grant and review periodically, but in any event annually, any potential or actual conflict authorisations. Directors are not counted in the quorum for the authorisation of their own actual or potential conflicts. The Company Secretary minutes the consideration of any conflict. Authorisations granted are recorded by the Company Secretary in a register of conflict authorisations which are noted by the Board at its next meeting.
On an ongoing basis, the Directors are responsible for informing the Company Secretary of any new, actual or potential conflicts that may arise or if there are any changes in circumstances that may affect an authorisation previously given. Even when provided with authorisation, a Director is not absolved from his or her statutory duty to promote the success of the company. If an actual conflict arises post authorisation, the Board will choose to exclude the Director from receipt of the relevant information and participation in the debate, or suspend the Director from the Board, or, as a last resort, require the Director to resign.
The Nominations Committee reviewed the register of conflict authorisations in October 2010 and concluded that the conflicts had been appropriately authorised and the process for authorisation continues to operate effectively.
Company Secretary
The Company Secretary is responsible to the Board and is available to individual Directors in respect of Board procedures. TheSimon Bicknell was Company Secretary is Mr Simon Bicknell, whountil 31st December 2010 and was appointed in May 2000. He is a barrister and joined the Group in 1984. He is Secretary to all of the Board Committees, except the Remuneration Committee. TheVictoria Whyte, formerly Deputy Company Secretary, Mrs Victoria Whyte, was appointed Company Secretary with effect from 1st January 2011. She was Secretary to the Remuneration Committee with effect from 27th January 2009.during 2010 and acts as Secretary to all of the Board Committees since her appointment as Company Secretary. She is a solicitor and a Fellow of the Institute of Chartered Secretaries and Administrators.
Board Committees
The Board has established a number of committees and provides sufficient resources to enable them to undertake their duties. Executive Directors are not members of the Audit & Risk, Remuneration, Nominations or Corporate Responsibility Committees, although they may be invited to attend meetings. Each Director is a member of the Corporate Administration & Transactions and Finance Committees.
GSK Annual Report 20092010
6066
Corporate governance
Corporate governance framework
| | |
| * | | There have been 4 Executive Directors since the appointment of the Chief Financial Officer Designate on 4th January 2011
(there will be 3 Executive Directors following the retirement of the Chief Financial Officer on 31st March 2011). |
Current membership of these Committees is shown in the table below.
| | | | | | | | | | | | | | | | | | | | | | | | | | | | | | | | |
| | | Corporate | | | Corporate | |
| | | Audit & Risk | | Remuneration | | Nominations | | Responsibility | | | Audit & Risk | | Remuneration | | Nominations | | Responsibility | |
| | | | | | | | | | | | | | | | |
| Sir Christopher Gent | | – | | M | | C | | C | | | – | | M | | C | | C | |
| Professor Sir Roy Anderson | | M | | – | | – | | – | | | M | | – | | – | | – | |
| Dr S Burns | | – | | – | | – | | M | | |
| Mr L Culp | | – | | M | | M | | – | | |
| Dr Stephanie Burns | | | – | | – | | – | | M | |
| Larry Culp | | | – | | M | | M | | – | |
| Sir Crispin Davis | | – | | C | | M | | – | | | – | | C | | M | | – | |
| Sir Deryck Maughan | | M | | – | | M | | – | | | M | | – | | M | | – | |
| Mr J Murdoch | | – | | M | | – | | M | | |
| Dr D Podolsky | | M | | – | | – | | M | | |
| Mr T de Swaan | | C | | M | | – | | – | | |
| James Murdoch | | | – | | M | | – | | M | |
| Dr Daniel Podolsky | | | M | | – | | – | | M | |
| Tom de Swaan | | | C | | M | | – | | – | |
| Sir Robert Wilson | | M | | M | | M | | – | | | M | | – | | M | | – | |
| | | | | | | | | | | | | | | | |
| | |
Key: C = Chairman M = Member |
Key: C = Chairman M = Member
GSK Annual Report 20092010
6167
Corporate governance
Each Committee has written terms of reference which have been approved by the Board.Board and are reviewed at least annually to ensure that they comply with the latest legal and regulatory requirements and reflect best practice developments. The following is a summary of the role and terms of reference of each Committee. The current full terms of reference of each Committee may be obtained from the Company Secretary.
| | | | | | | | | | | |
| | | | | | | No of meetings | | Committee Report |
| Committee | | Role and Terms of Reference | | Membership comprises | | per year | | on page |
| | | | | | | | | | |
Audit & Risk | | Reviews the financial and internal reporting process, the external and internal audit processes, the system of internal controls, and the identification and management of risks and the external and internal audit process.risks. The Committee also proposes to shareholders the appointment, re-appointment and removal of the external auditors and is directly responsible for their remuneration and oversight of
their work. | | Independent
Non-Executive
Directors | | ³≥ 4 | | 67–6974-76 |
| | | | | | | | | | | |
Remuneration | | Determines the terms of service and remuneration of the Executive Directors and members of the CET and, with the assistance of external independent advisers, it evaluates and makes recommendations to the Board on overall executive remuneration policy.policy that assists the long-term success of the Group. | | Independent Non-Executive Directors and the Chairman | | ³≥ 4 | | 73–9081-101 |
| | | | | | | | | | |
| | | (The Chairman and the CEO are responsible for evaluating and making recommendations to the Board on the remuneration of Non-Executive Directors.) | | | | | | | | |
| | | | | | | | | | | |
Nominations | | Reviews the structure, size and composition of the Board (including the skills, knowledge, independence, experience and diversity) and appointment of members to the Board and the CET, and makes recommendations to the Board as appropriate. The Committee also monitors the planning of succession to the Board and Senior Management. The Committee also considers and if appropriate authorises directors’ conflicts of interest. | | Independent Non-Executive Directors and the Chairman | | ³≥ 2 | | 7077 |
| | | | | | | | | | | |
Corporate
Responsibility | | Provides a Board-level forum for the regular review of external issues that have the potential for serious impact upon the Group’s business and reputation. The Committee is also responsible for oversight of GSK’s worldwide donations and community support. | | Independent Non-Executive Directors and the Chairman | | ³≥ 3 | | 7178-80 |
| | | | | | | | | | | |
Finance | | Reviews and approves, on behalf of the Board, the Annual Report and Form 20-F, and convening of the AGM, together with the preliminary and quarterly statements of trading results. It also approves certain major licensing and capital transactions and changes to the Group’s Investment Instrument and Counterparty Limits. | | Executive and Non-Executive Directors | | As necessary | | – |
| | | | | | | | | | | |
Corporate
Administration &
& Transactions | | Reviews and approves matters in connection with the administration of the Group’s business and certain corporate transactions. | | Executive and Non-Executive Directors, CET members and the Company Secretary | | As necessary | | – |
| | | | | | | | | | | |
GSK Annual Report 20092010
6268
Corporate governance
Evaluation of the Board, Board Committees and Directors
The Board decided in 2009 to undertake an externally facilitated evaluation process every three years, which has since become a requirement within the UK Corporate Governance Code (updated Code). In 2008the intervening period the review will be facilitated by the SID or the Chairman. The next externally facilitated evaluation will be undertaken at the end of 2011.
A reminder of the form the Board commissioned Dr Long of Boardroom Review to act as an independent facilitatorevaluation reviews for 2008 and 2009 had taken, together with the Board’saction points agreed is set out below.
| | | | | | |
| | |
| | Method of evaluation | | Actions and areas of focus |
| | |
| 2008 | | Dr Long, Boardroom
Review, facilitated
this review | | • | | Utilise Board and Committee time more effectively and facilitate further contribution by Non-Executive Directors |
| | | | • | | Enhance continuous education process for
Non-Executive Directors |
| | | | • | | Provide greater visibility to executive talent and management succession planning process |
|
| 2009 | | Sir Robert Wilson,
Senior Independent
Director | | • | | Increase Board time devoted to strategic discussion and the indicators of success in the delivery of the R&D pipeline |
| | | | • | | Devote more time to focused consideration of the company’s key risks on an ongoing basis |
| | | | • | | Provide the Board with more regular updates and insights into the newly enhanced management succession planning process |
|
2010 Board evaluation process. The actions from this process formed
In accordance with established practice, the basis of the Board’s internal review process for 2009 namely:
Identify how to utilise the time spent in Board and Committee meetings more effectively and facilitate further contribution by Non-Executive Directors on a broader range of issues
Seek to enhance further the Non-Executive Directors’ continuing education process beyond their initial induction
Provide greater visibility to the Board of GSK’s executive talent and the management succession planning process.
The Senior Independent Director,SID, Sir Robert Wilson, conducted the 20092010 evaluation of the performance of the Chairman, the Board and its Committees and Directors in collaboration with the Committee Chairmen.
The Board evaluation process included a one-to-one interview with each Director. The topics discussed, which had been circulated to Directors in advance, included a variety of aspects associated with Board effectiveness, including Board and Committee rolesinformation flows, handling of strategic issues, collective effectiveness and responsibilities, culture and dynamics, processes and support and individual effectiveness. Feedback fromexploration of ways to further improve the evaluation was providedway in the form of a written report towhich the Board which then discussed its findings.operates.
The Chairman of each of the Board Committees undertook separate evaluations and the outcome of each was reported to and discussed with the respective Committee and the Board.
Feedback from the overall evaluation process was provided in the form of a written report to the Board, which then debated its findings.
The Board evaluation review concluded that therethe Board and its Committees were operating effectively at a high level. The Board continued to feel that it was receiving high quality information, in a readily understandable format and on a timely basis in order to fulfil its role.
There was a high level of satisfactionconfidence in the performance of the CEO and a strong belief that the Board dynamics facilitated open, honest and constructive discussion of issues. No major changes to the Board’s practices and procedures were deemed necessary.
In terms of the implementation of action points from the previous year, the Board:
had increased its focus on R&D activities and successful delivery of the pipeline and was pleased with progress from R&D during the year. Separately, on behalf of the Board, the Remuneration Committee initiated discussions with management and shareholders over the introduction of more strategically aligned performance criteria for the company’s long term incentive plans. As a result of a successful conclusion to these discussions, the grant of LTI options made in February 2011 was made with two additional performance criteria, one of which focuses on R&D new product performance. For more details, please refer to the Remuneration Report on pages 81 to 101
had sought assistance from the Audit & Risk Committee to more fully understand the Group’s key risks. This work is ongoing and the Board will continue to consider regular reports from the Audit & Risk Committee during 2011, in advance of the Board’s annual review of the effectiveness of the company’s risk management next year
was pleased with the operation by the Nominations Committee of the enhanced succession planning process. This had resulted in the appointment of the CFO Designate and positive progress was being made on the recruitment of new Board members to refresh the Board.
The Board agreed the following actions after discussion of the evaluation report to ensure that it continues to improve the way in which Mr Witty had grown intoit operates:
given the CEO rolefundamental strategic challenges facing the pharmaceutical industry, the Board will seek to continue to allocate more time on a regular basis to focus on strategic issues and the significant challenges facing the industry, with the openessdirect aim of dialogue betweenfurther enhancing returns to shareholders
to further enhance information flows by providing Board members with a wider variety of external perspectives on the company and the industry
R&D will continue to be a major expense to the company and the Board will be seeking to assess the extent to which the new policies implemented in recent years have added value
to continue to support Executive Management on ethical leadership within the Group.
The Directors, and Non-Executive Directors. Board membersled by the SID, also met separately, without the Chairman being present, to discuss the Chairman’s performance. They considered that his leadership, performance and contribution. There was alsooverall contribution were of a high standard. As a result of this high level of confidence shared by all Directors in Sir Christopher’s Chairmanship of the Board. He had the unanimous and unequivocal supportBoard, it was unanimously agreed to extend his appointment as Chairman for a period of five years with effect from 1st January 2011, subject to re-election by shareholders. This would ensure continuity of leadership of the otherBoard during a period when several Non-Executive Directors both Executive and Non-Executive.
The Board and its Committees were believed towould be operating effectively at a high level.
The Board agreedapproaching retirement after having served nine years on the following actions after discussion of the evaluation report:Board.
GSK Annual Report 2010
69
Identify how to increase further the amount of Board time devoted to strategic discussion and the indicators of success in delivery of the R&D pipelineCorporate governance
Devote more time to focused consideration of the company’s key risks on an ongoing basis
Provide the Board with more regular updates and insights into the newly enhanced management succession planning process.
The Board has taken a policy decision to undertake an externally facilitated evaluation process every three years. In the intervening period the review will be facilitated by the SID or the Chairman.
Dialogue with shareholders
Financial results are announced quarterly.
The company reports formally to shareholders twiceon a year, when its half-yearquarterly basis and full-year results are announced. Thethe full-year results are included in the company’s Annual Report which is published for shareholders.
Report. The company now produces an annual Summary which is sent to all shareholders to advise them of the availability of the Annual Report and Notice of Meeting on www.gsk.com. Meeting.
The CEO and CFO give presentations on the half-year and full-year results toin face-to-face meetings with institutional investors, analysts and the media.
Theremedia which are normallyalso accessible via webcast teleconferences afterand teleconference. After the release of the first second and third quarterquarterly results, the company holds webcast teleconferences for institutional investors, analysts and the media.
The AGM takes place in London, and formal notification is sent to shareholders at least one month in advance. At the Meeting, a business presentation is made to shareholders and all Directors able to attend are available, formally during the AGM, and informally afterwards, for questions. Committee Chairmen ordinarily attend the AGM to respond to shareholders’ questions. The entire Board was in attendance at the company’s AGM in May 2009,2010, save for Sir Deryck MaughanDr Stephanie Burns and Larry Culp, who waswere prevented from attending due to urgent business commitments which arose shortly beforetravel disruption caused by the meeting.ash clouds from the volcano in Iceland, and Tom de Swaan who was required to chair a shareholder meeting of another public company on the same day. All resolutions at the AGM are decided on a poll as required by the company’s Articles of Association. The results of the poll are announced to the London Stock Exchange and posted on the company’s website.Exchange. Details of the 20102011 AGM are set out in the section ‘Annual General Meeting’ (see page 65) and the Notice of AGM is published on the company’s website.71).
To ensure that the Non-Executive Directors are aware of and understand the views of major shareholders about the company, the Board has in place a briefing process, which is managed by the Chairman, focusing on sector-specific issues, as well as general shareholder preferences.
The Group’s Investor Relations department, with offices in London and Philadelphia, acts as a focal point for contact with investors throughout the year.
The CEO, CFO and Chairman maintain a dialogue with institutional shareholders on performance, plans and objectives through a programme of regular meetings. Since his appointment as CEO in May 2008, MrAndrew Witty has undertaken an extensive ongoing series of meetings with GSK’s institutional shareholders.
The Group’s Investor Relations department, with offices in London and Philadelphia, acts as a focal point for contact with investors throughout the year.
The Chairman meets regularly with institutional investors to hear their views and discuss issues of mutual importance and communicates the views of investors to the Board as a whole. The SID is also available to shareholders.
The Chairman of the Remuneration Committee, the Chairman, the Senior Vice President, Human Resources and the SVP, Human ResourcesCompany Secretary meet annually with major shareholders to discuss executive remuneration policy.policy and governance matters.
All Non-Executive Directors, including new appointees, are available to meet with major shareholders if requested.
GSK Annual Report 2009
63
Corporate governance
Share capital and control
Details of the company’s authorised and issued share capital and the number of shares held in Treasury as at 31st December 2009,2010 can be found in Note 33 to the financial statements, ‘Share capital and share premium account’. GSK’s shares are listed on the London Stock Exchange and are also quoted on the New York Stock Exchange (NYSE) in the form of American Depositary shares (ADS). Each ADS represents two Ordinary Shares.
The holders of Ordinary Shares are entitled to receive dividends, when declared and the company’s report and accounts, toAnnual Report, attend and speak at General Meetingsgeneral meetings of the company, to appoint proxies and to exercise voting rights.
There are no restrictions on transfer, or limitations on the holding of Ordinary Shares and no requirements to obtain prior approval tofor any transfers. No Ordinary Shares carry any special rights with regard to control of the company and there are no restrictions on voting rights. Major shareholders have the same voting rights per share as all other shareholders. There are no known arrangements under which financial rights are held by a person other than the holder of the shares and no known agreements on restrictions on share transfers or on voting rights.
Shares acquired through GSK share schemes and plans rank equally with the other shares in issue and have no special rights. The trustees of the company’s Employee Share Ownership Plan (ESOP) trusts have waived their rights to dividends on shares held by the ESOP trusts.
Change of control and essential contracts
The company does not have contracts or other arrangements which individually are essential to the businesses, nor is it party to any significant agreements that would take effect, alter or terminate upon a change of control following a takeover bid.
The company does not have agreements with any Director or Officer that would provide compensation for loss of office or employment resulting from a takeover, except that provisions of the company’s share plans may cause options and awards granted under such plans to vest on a takeover. Details of the termination provisions in the company’s framework contracts for Executive Directors are given on page 81.91.
Interests in voting rights
Other than as stated below, as far as the company is aware, there are no persons with significant direct or indirect holdings in the company. Information provided to the company pursuant to the Financial Services Authority’s (FSA) Disclosure and Transparency Rules (DTRs) is published on a Regulatory Information Service.
At 19th24th February 2010,2011, the company had received notifications in accordance with the FSA’s DTRs of the following notifiable interests in the voting rights in the company’s issued share capital:
| | | | | | | |
| | | | | | | | | | | | | |
| | | No . of | | Percentage of issued | | | No. of | | Percentage of issued | |
| | | shares | | capital (%)* | | | shares | | capital (%)* | |
| | | | | | | | |
| BlackRock, Inc. | | 334,849,249 | | 6.45 | | | 291,516,314 | | 5.62 | |
| Legal & General Group Plc | | 217,546,535 | | 4.19 | | | 194,024,944 | | 3.74 | |
| | | | | | | | |
| | |
| * | | Percentage of Ordinary Shares in issue, excluding Treasury shares as at 19th February 2010.shares. |
GSK Annual Report 2010
70
Corporate governance
The Bank of New York Mellon is the Depositary for the company’s ADS, which are listed on the New York Stock Exchange.NYSE. Ordinary Shares representing the company’s ADRAmerican Depositary Receipt program, which are managed by the Depositary, are registered in the name of BNY (Nominees) Limited. Details of the number of Ordinary Shares held by the Depositary can be found on page 177.209.
The company has not acquired or disposed of any interests in its own shares during the period under review. Details of shares purchased in prior years, those cancelled, and those held as Treasury shares are disclosed in Note 33 to the financial statements ‘Share capital and share premium account’.
Directors and Officers
The interests of Directors and Officers and their connected persons in the issued share capital of the company are given in the Remuneration Report (pages 7381 to 90)101).
The rules about the appointment and replacement of Directors are contained in the company’s Articles of Association. The company’s Articles must be approved by shareholders in accordance with the legislation in force from time to time.
The Articles provide that Directors may be appointed by an ordinary resolution of the members or by a resolution of the Directors, provided that, in the latter instance, a directorDirector appointed in this way retires at the first AGM following his appointment.
The Articles also provide that Directors should normally be subject to re-election at the AGM at intervals of three years or annually if they have held office for a continuous period of nine years or more. However, the Board has agreed that all Directors will seek either election or re-election in 2011 in accordance with the updated Code.
The company’s members may remove a directorDirector by passing an ordinary resolution of which special notice has been given, or by passing a special resolution. A Director may automatically cease to be a Director if:
|
| • | | he becomes bankrupt or compounds with his creditors generally |
| he/she resigns |
| |
| • | | he ceaseshe/she offers to be a Director by virtue ofresign and the Companies Acts or the Articles |
| Board accept that offer |
| |
| • | | heall other Directors (being at least three in number) require him/ her to resign |
|
| • | | he/she is suffering from physical or mental ill health |
| |
|
| • | | hehe/she has missed Directors’ meetings for a continuous period of six months without permission and the Board resolves that hehe/she shall cease to be a Director |
| |
| • | | he/she becomes bankrupt or compounds with his/her creditors generally |
| |
| • | | hehe/she ceases to be a Director by virtue of the Articles or the Companies Acts, or |
|
| • | | he/she is prohibited from being a Director by law |
|
|
• | | he resigns |
|
|
• | | he offers to resign and the Board accept that offer, or |
|
|
• | | all other Directors (being at least three in number) require him to resign.law. |
GSK Annual Report 2009
64
Corporate governance
Articles of Association
The powers of the Directors are determined by UK legislation and the company’s Articles of Association. The Articles may be amended by a special resolution of the members. The Directors may exercise all the company’s powers provided that the Articles or applicable legislation do not stipulate that any such powers must be exercised by the members. The Directors have been authorised to issue and allot Ordinary Shares under current Article 10.9. The power under current Article 109 and the authority for the company to make purchases of its own shares are subject to shareholder authorities which are sought on an annual basis at the AGM. Any shares purchased by the company may be cancelled or held as Treasury shares.
Share buy-back programme
A £12 billion programme of share repurchases commenced in July 2007. Shares costing £6.2 billion have beenwere repurchased under this programme. No repurchases were made during 2009 and the company does not expect to make any significant repurchases inor 2010. The company announced publicly on 3rd February 2011 that it intends to commence a new long-term share buy-back programme coveredand expects to buy-back £1-2 billion of shares in 2011. In the period 4th February 2011 to 24th February 2011, 10.4 million shares were purchased at a cost of £123.4 million. The programme covers purchases by the company of shares for cancellation or to be held as Treasury shares, in accordance with the authority renewed by shareholders at the AGM in May 2009,2010, when the company was authorised to purchase a maximum of just underover 519 million shares. Details of shares purchased, in prior years, those cancelled, and those held as Treasury shares are disclosed in Note 33 to the financial statements ‘Share capital and share premium account’.
The exact amount and timing of any future purchases, and whether the extent to which repurchased shares will be held as Treasury shares rather than beingor cancelled, will be determined by the company and is dependent on market conditions and other factors.
Donations to political organisations and political expenditure
With effect from 1st January 2009, to ensure a consistent approach to political contributions across the Group, GSK introduced a global policy to stop voluntarily all political contributions.
| | | | | | | | | | | | | | | | |
| | | 2009 | | 2008 | | | | | | | |
| Political donations to: | | | 2010 | | 2009 | | 2008 | |
| | £ | | £ | | | £ | | £ | | £ | |
| | | | | | | | | |
| EU political organisations | | – | | – | | | – | | – | | – | |
| | | | | | | | | |
| Non-EU political organisations | | |
| comprising: | | |
| Non-EU political organisations comprising: | | |
| USA | | – | | 319,000 | | | – | | – | | 319,000 | |
| Canada | | – | | 28,000 | | | – | | – | | 28,000 | |
| | | | | | | | | | |
| | | – | | 347,000 | | | – | | – | | 347,000 | |
| | | | | | | | | | |
Prior toNotwithstanding the introduction of this policy, in accordance with the Group’s new approach to political contributions, the USA was the largest recipient of political donations. In line with US law, the corporate donations were not made at a federal level, but only to candidates and political parties at the state and local levels. In 2008, GSK supported those candidates who sought an environment that appropriately rewarded high-risk, high-investment industries.
The situation was similar in Canada, and in the Rest of the World donations were very rare and of low value.
Notwithstanding the new policy,Federal Election Campaign Act, the company continues to support a GSK Political Action Committee (PAC) for employees in the USA which givesthat facilitates voluntary political donations. Adonations by eligible GSK employees. The PAC is an employee organisation which allowsnot controlled by GSK. Decisions on the amount and recipients of contributions are made by participating employees exercising their legal right to contribute to a fund forpool their resources and make political donations. Employees decide upon the recipients of the PAC donations.contributions which are subject to strict limitations. In 2009,2010 a total of £540,551£531,613 (£539,359540,551 in 2008)2009) was donated to political organisations by the GSK PAC.
At the AGM in May 2001, shareholders first authorised the company to make donations to EU political organisations and to incur EU political expenditure, under the provisions of the Political Parties, Elections and Referendums Act 2000, of up to £100,000 each year. This authority has since been renewed annually. The lawCompanies Act 2006 requires companies to continue to obtain shareholder approval before they can make donations to EU political organisations or incur EU political expenditure.
However, the company does not make and does not intend to make donations to political parties or independent election candidates, nor does it make any donations to EU political organisations or incur EU political expenditure.
The definitions of political donations, political expenditure and political organisations used in the legislation are very wide. In particular, the definition of EU political organisations may extend to bodies such as those concerned with policy review, law reform, the representation of the business community and special interest groups such as those concerned with the environment, which the company and its subsidiaries might wish to support.
GSK Annual Report 2010
71
Corporate governance
As a result, the definitions may cover legitimate business activities not in the ordinary sense considered to be political donations or political expenditure. Such activities are not designed to support any political party or independent election candidate. The authority which the Board has sought annually is a precautionary measure to ensure that the company and its subsidiaries do not inadvertently breach the legislation.
GSK Annual Report 2009
65
Corporate governance
Annual General Meeting
The AGM will be held at 2.30pm on Thursday, 6th5th May 20102011 at The Queen Elizabeth II Conference Centre, Broad Sanctuary, Westminster, London SW1P 3EE. The business to be transacted at the meeting will include:
Receiving and adopting GlaxoSmithKline’s 20092010 Annual Report
• | | Approving the 2009 Remuneration Report |
|
| | The Remuneration Report on pages 73 to 90 sets out the remuneration policies operated by GlaxoSmithKline and disclosures on Directors’ remuneration, including those required by the Companies Act 2006 and The Large and Medium-sized Companies and Groups (Accounts and Reports) Regulations 2008. A resolution will be proposed to approve the Remuneration Report. |
Approving the 2010 Remuneration Report
The Remuneration Report on pages 81 to 101 sets out the remuneration policies operated by GSK and disclosures on Directors’ remuneration, including those required by the Companies Act 2006 and The Large and Medium-sized Companies and Groups (Accounts and Reports) Regulations 2008. A resolution will be proposed to approve the Remuneration Report.
• | | Retirement and re-election of Directors |
|
| | Dr Stephanie Burns, Mr Julian Heslop, Sir Deryck Maughan, Dr Daniel Podolsky and Sir Robert Wilson will each retire and offer themselves for re-election to the Board under current Article 85 of the company’s Articles of Association. |
Retirement and re-election of Directors
Simon Dingemans, who was appointed before the AGM will retire in accordance with the Articles and, being eligible, will offer himself for election at the AGM. All the continuing Directors will retire by rotation at the 2011 AGM and offer themselves for re-election.
• | | Re-appointment and remuneration of auditors |
|
| | Resolutions will be proposed to authorise the Audit & Risk Committee to re-appoint PricewaterhouseCoopers LLP as auditors and to determine their remuneration. |
Re-appointment and remuneration of auditors
Resolutions will be proposed to authorise the Audit & Risk Committee to re-appoint PricewaterhouseCoopers LLP as auditors and to determine their remuneration.
• | | Special business |
|
| | The company will seek authority to: |
Special business
The company will seek authority to:
| | • | | make donations to EU political organisations and incur EU political expenditure, each capped at £50,000£100,000 |
| |
| | • | | allot Ordinary Shares in the company |
| |
| | • | | give the Directors authority to disapply pre-emption rights when allotting new shares in connection with rights issues or otherwise up to a maximum of 5% of the current issued share capital and to purchase its own Ordinary Shares up to a maximum of just under 10% of the current issued share capital |
| |
| | • | | exempt the auditors from having to state the name of their senior statutory auditor for the company in GSK’s Annual Report |
| |
| | • | | reduce the notice required to call a general meeting to not less than 14 clear days |
|
| • | | amend the company’s Articles of Association in line with the Companies Act 2006, the Shareholder Rights Directive and to include a limit on annual fees paid to Directors.days. |
Shareholders are entitled to appoint one or more proxies to attend the AGM and to speak and vote on their behalf provided that, in the event that a single shareholder appoints multiple proxies, each proxy is appointed to exercise the rights attached to a different share or shares held by that member.
Details on how to appoint or be appointed a corporate representative or proxy can be found on page 194. The Notice of AGM will be published on the company’s website.208.
Internal control framework
The Board recognises its responsibility to present a balanced and understandable assessment of the Group’s position and prospects.
The Board has accountability for reviewing and approving the adequacy and effectiveness of internal controls operated by the Group, including financial, operational and compliance controls and risk management. The Board has delegated responsibility for such review to the Audit & Risk Committee (the Committee), which receives regular reporting aligned with GSK’s Assurance Programme. It is the responsibility of management, through the CET, to implement Board policies on risk and control. The CET is responsible for identifying, approving, monitoring and enforcing key policies that go to the heart of how the Group conducts business.
The internal control framework includes central direction, resource allocation and risk management of the key activities of research and development, manufacturing, marketing and sales, legal, human resources, information systems and financial practice. As part of this framework, there is a comprehensive planning system with an annual budget approved by the Board. The results of operating units are reported monthly and compared with the budget. Forecasts are prepared regularly during the year.
The Group also has in place established procedures to identify and consolidate reporting entities. The Group’s control activities include policies and practices covering appropriate authorisation and approval of transactions, application of financial reporting standards and reviews of significant judgements and financial performance.
Extensive financial, regulatory and operational controls, procedures and risk activities are reviewed by the Group’s internal auditors. Responsibility, however,However, responsibility is clearly delegated to local business units, supported by a regional management structure. These principles are designed to provide an environment of central leadership coupled with local operating autonomy as the framework for the exercise of accountability and control within the Group.
The Group also attaches importance to clear principles and procedures designed to achieve appropriate accountability and control. A Group policy, ‘Risk Management and Legal Compliance’, mandates that business units establish processes for managing and monitoring risks significant to their businesses and the Group.
The internal control framework also relies on the following mechanisms for overseeing and reporting risk and compliance issues.
GSK Annual Report 2010
72
Corporate governance
Risk Oversight and Compliance Council (ROCC)
The ROCC is a council of senior executives authorised by the Board to assist the Audit & Risk Committee oversee the risk management and internal control activities of the Group. Membership comprises several CET members and some of the heads of departments with internal control, risk management, assurance, audit and compliance responsibilities.
The ROCC meets on a regular basis to review and assess significant risks and their mitigation plans and provide oversight of internal controls to ensure compliance with applicable laws, regulations and internal GSK policies. The ROCC, responding to the Group policy referred to above, has provided the business units with a framework for risk management and upward reporting of significant risks. Mitigation planning and identification of a manager with overall responsibility for management of any given risk is a requirement.
GSK Annual Report 2009
66
Corporate governance
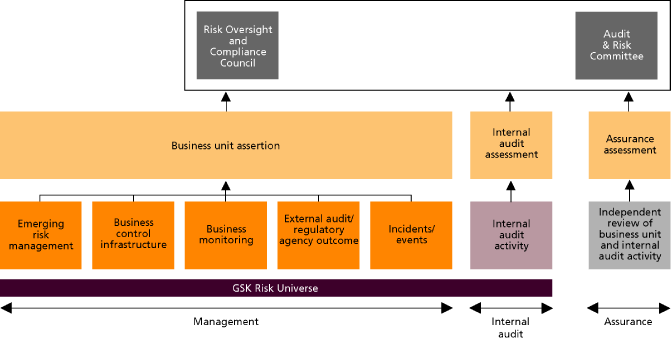
Risk Management and Compliance Boards (RMCBs)
RMCBs have been established in each of the major business units. Membership often comprises members of the senior executive team of the respective business unit, augmented by specialists where appropriate. The RMCBs oversee management of all risks that are considered important for their respective business units, including those risks that are designated as significant to GlaxoSmithKlineGSK as a whole, thus increasing the number of risks that are actively managed across the Group.
Each business unit and corporate function must periodically review the significant risks facing their businesses. This review should include identifying operational risks, legal compliance risks and risks to the achievement of strategic goals and objectives. The review must occur at least annually and should be embedded within, and aligned with, the annual planning process to ensure that significant risks are identified with changes in management direction and the external environment.
Assurance
In 2009, an Assurance Programme was implemented to further enhance governance and provide an independent assessment of governance, risk management and control processes for the organisation. Within GSK this comprises four main elements:
Internal Audit
GSK’s Internal Audit group has responsibility for independently assessing the adequacy and effectiveness of the management over significant risk areas and reporting it to the Audit & Risk Committee in line with an agreed annual Assurance Plan. GSK’s internal audit functions have undergone significant transformation as the four global audit functions (Group Internal Audit, Manufacturing Internal Audit, R&D Internal Audit, and Environment, Health, Safety and Sustainability Internal Audit) have been consolidated into a single organisation under the leadership of the Head of Audit and Assurance. The Head of Audit and Assurance reports to GSK’s Company Secretary & Corporate Compliance Officer with a separate reporting responsibility to the Chairman of the Audit & Risk Committee.
This new alignment of the global audit functions further strengthens GSK’s governance model by affording the Internal Audit group greater independence, reduces fragmentation among global audit functions and provides a direct reporting line from the Internal Audit group to GSK’s Company Secretary & Corporate Compliance Officer and to the Chairman of the Audit & Risk Committee to ensure significant issues are escalated in a timely manner. This has helped eliminate overlaps, gaps and potential for over/under auditing that existed in the previous structure.
It also provides a clear platform for developing a common approach to the conduct of internal audits which helps ensure consistency and that audit activities are performed in the most efficient and effective way.
Assurance reporting
Assurance reporting to the Audit & Risk Committee will follow a structured programme integrating reporting from business units, Assurance and Internal Audit.
Business units and corporate functions are required to present reports annually to the ROCC and Audit & Risk Committee that detail its risk management and compliance approach, providing a balanced assessment of the status of internal controls over key risks, and highlighting any significant compliance issues. Management must oversee risks that are considered important for their respective business units, including those risks that are designated as significant to the Group. Information regarding the controls in place to manage these risks will be provided to assure the Audit & Risk Committee that these risks are adequately managed within the internal control framework.
Internal Audit reports to the Audit & Risk Committee at the same time as the business unit and provides an independent assessment of whether adequate controls are in place to manage significant risks.
GSK Annual Report 2009
67
Corporate governance
When issues or control deficiencies are identified, Internal Audit recommends processes for improvement. GSK managers develop corrective action plans to eliminate the causes of non-compliance and address gaps in internal controls. Internal Audit tracks these plans to completion and reports results to senior management and the Audit & Risk Committee.
Significant compliance issues and internal audit results are escalated to the Audit & Risk Committee at the earliest opportunity.
Risk management
The Group’s risk management programme extends beyond the legal and regulatory issues and considers the Group’s overall strategy and changes in the external environment. Furthermore, risk management principles are embedded within management practices and are part of the business strategy and objectives setting process.
For details of risks affecting the Group, see ‘Risk factors’ on pages 43 to 47 and Note 44 to the financial statements, ‘Legal proceedings’.
Strategic Risk Evaluations (SREs)
SREs are a new approach to delivering enterprise-wide assurance on significant issues facing GSK and are conducted by our assurance teams in partnership with the business. The approach is designed to evaluate areas where there is an incomplete understanding of risk, and enable the development and implementation of appropriate mitigation plans. Each SRE is sponsored by a CET member or ‘risk owner’ with oversight for each SRE provided by the ROCC.
Corporate Ethics & Compliance (CEC)
The ROCC is also supportedand the RMCBs are assisted by the CEC department, which is responsible for supporting the development and implementation of practices that facilitate employees’ compliance with laws and Group policy. The department provides assistance to help employees meet high ethical standards and comply with applicable laws and regulations and corporate responsibility.
The thrust of the Group’s compliance effort is due diligence in preventing and detecting misconduct or non-compliance with law or regulation by promotingand the promotion of ethical behaviour, compliance with all laws and regulations, corporate responsibility at all levels and effective compliance systems.
GSK employees are encouraged to seek help and to report concerns or suspected cases of misconduct without the fear of retaliation. Employees can do this through line management or via GSK’s integrity and confidential reporting lines managed by CEC. All concerns and allegations are fairly and independently investigated and disciplinary action, if applicable, is commensurate with the issues presented.
The CEC department is managed by the Company Secretary & Corporate Compliance Officer,Senior Vice President, Governance, Ethics and Assurance, who reports directly to the CEO. The Company Secretary & Corporate Compliance OfficerHe chairs the ROCC and provides summary reports on the ROCC’s activities and the Group’s significant risks to the CET and the Audit & Risk Committee on a regular basis. The Corporate Compliance Officer’sHis direct reporting line to the Audit & Risk Committee provides a mechanism for bypassing the executive management should the need ever arise.
GSK Annual Report 2010
73
Corporate governance
Assurance
In 2009, an Assurance Programme was implemented to further enhance governance and provide an independent assessment of governance, risk management and control processes for the organisation. Within GSK this comprises four main elements:
Internal Audit
GSK’s Internal Audit group has responsibility for independently assessing the adequacy and effectiveness of the management of significant risk areas and reporting outcomes to the Committee in line with an agreed Assurance Plan. The internal audit group is comprised of four principal teams focused in the following areas:
Manufacturing (including Environmental Health, Safety and Sustainability)
All internal audit activity is conducted by a single organisation under the leadership of the Head of Audit & Assurance. The Head of Audit & Assurance has a dual reporting line into the Senior Vice President, Governance, Ethics and Assurance and the Committee Chairman. The global audit function allows for more holistic assurance, consistency in approach, and independence in reporting. This has helped eliminate overlaps, gaps and the potential for over/ under auditing.
Internal Audit undertakes a continuous process of risk assessment that contributes to the evolution of GSK’s audit strategies and compilation and delivery of the audit schedule. This approach allows Audit & Assurance to respond expeditiously to changes in the business and risk environment and ensure that audit strategies are fit-for-purpose.
When issues or control deficiencies are identified during audit engagements, Internal Audit recommends processes for improvement. GSK managers develop corrective action plans to address the causes of non-compliance and gaps in internal controls. Internal Audit tracks these plans to completion and reports results to executive management and the Committee. Internal audit results are also compiled and reported to the ROCC and the Committee as detailed in the Assurance reporting section below.
To supplement the audit programme, Strategic Risk Evaluations (SREs) are performed on significant issues facing GSK and are conducted by our assurance teams in partnership with the business. The approach is designed to evaluate risk areas and enable the development and implementation of appropriate mitigation plans. During 2010 two new SREs were performed covering the areas of change management and evaluation of risks associated with existing and proposed sales force incentive schemes. In addition, Audit & Assurance provided implementation support for the 2009 SREs which included acquisitions — due diligence and use of pseudoephedrine in GSK products.
Assurance reporting
Assurance reporting to the Committee follows a structured programme integrating reporting from business units, Assurance and Internal Audit.
Business units and corporate functions are required to present reports annually to the ROCC and the Committee that detail their risk management and compliance approach, providing a balanced assessment of the status of internal controls over key risks, and highlighting any significant compliance issues. Managers must oversee risks that are considered important for their respective business units, including those risks that are designated as significant to the Group. Information regarding the controls in place to manage these risks is provided to assure the Committee that these risks are adequately managed within the internal control framework.
In addition, significant compliance issues and internal audit results are escalated to the ROCC and the Committee at the earliest opportunity.
Risk management
The Group’s risk management programme extends beyond legal and regulatory issues and considers the Group’s overall strategy and changes in the external environment. Furthermore, risk management principles are embedded within management practices and are part of the business strategy and objectives setting process.
For details of risks affecting the Group, see ‘Risk factors’ on pages 53 to 57 and Note 44 to the financial statements, ‘Legal proceedings’.
Effectiveness of controls
The internal control framework has been in operation for the whole of the year under review and continues to operate up to the date of approval of this report. The system of internal controls is designed to manage rather than eliminate the risk of not achieving business objectives, and can only provide reasonable and not absolute assurance against material misstatement or loss.
The Audit & Risk Committee receives reports on areas of significant risk to the Group and on related internal controls. Following consideration of these reports and those received via the Assurance framework, the Audit & Risk Committee reports annually to the Board on the effectiveness of controls.
There are areas of the Group’s business where it is necessary to take risks to achieve a satisfactory return for shareholders, such as investment in R&D and in acquiring new products or businesses. In these cases, it is the Group’s objective to apply its expertise in the prudent management rather than elimination of risk. The Directors’ review relates to the company and its subsidiaries and does not extend to material associated undertakings, joint ventures or other investments.
The Board, through the Audit & Risk Committee, has reviewed the assessment of risks and the internal control framework that operates in GlaxoSmithKlineGSK and has considered the effectiveness of the system of internal control in operation in the Group for the year covered by this report and up to the date of its approval by the Board. The process followed by the Board in reviewing the system of internal controls accords with the guidance on internal control issued by the Turnbull Committee.
GSK Annual Report 2010
74
Corporate governance
Committee reports
Board Committees report regularly to the Board on the performance of the activities they have been assigned.
Audit & Risk Committee Report

 Dear Shareholder
During 2010, the Committee has focused on a number of activities associated with and beyond its core financial internal control responsibilities.
The implementation of the new Assurance model at the end of 2009 involved the consolidation of each of the audit groups into a new Audit & Assurance function which has enabled reporting to the Committee to be streamlined and helped to ensure that business unit risks and internal audit activity can be fully aligned.
To reflect the Group’s strategy to expand further into the Emerging Markets, an Eastern hemisphere audit hub has been established as a focus for audit activity in the Asia Pacific region.
In response to the new UK Bribery Act a dedicated Anti-Bribery and Compliance (ABAC) team has been established, which is part of Audit & Assurance.
At the end of 2010, work commenced to assist the Board further in reviewing, and the CET in understanding, the nature and extent of the risks GSK is taking in order to achieve its strategic objectives. This work will be ongoing as the FRC’s review of the Turnbull Guidance continues. I will report further as this work progresses.
I have continued to visit more of the Group’s operations to help make the Committee more accessible to employees and senior management; to discuss the issues brought to the Committee by management; and meet more of the network of Compliance Officers, on whom the Group relies, to oversee and drive compliance within GSK.
The Committee also continues to examine how to further improve our approach to Audit & Assurance, as this is an ongoing initiative and further progress in this area will be reported next year.
Tom de Swaan
Audit & Risk Committee Chairman
| | | | | | | | | |
| | | |
| | | | | | | Attendance at | |
| | | | | | | full meetings | |
| Members | | Committee member since | | | during 20092010 | |
| | | | |
Mr TTom de Swaan | | 1st January 2006 | | | | 6/6 | |
| (Chairman from | | | | | | | | |
| 1st September 2006) | | | | | | | | |
| | | | | | | | | |
| Professor Sir Roy | | 20th May 2009 | | | 2/3 | 6/6 | |
| Anderson | | | | | | | | |
| | | | | | | | | |
| Sir Deryck Maughan | | 21st January 2005 | | | | 5/6 | |
| | | | | | | | |
Dr DDaniel Podolsky | | 1st January 2007 | | | 5/6 | |
| | | | | | | 6/6 | |
| Sir Robert Wilson | | 12th December 2003 | | | | 6/6 | |
| | | | | | | | | |
Sir Ian Prosser* | | 27th December 2000 | | | 3/3 | |
| | | | | | | | |
Dr R Schmitz* | | 27th December 2000 | | | 3/3 | |
| | | |
| | |
* | | Sir Ian Prosser and Dr Schmitz retired from the Board on 20th May 2009. |
The structure of the Committee’s meetings was changed during 2009. Meetings have been split into two parts. Part one deals with the more fundamental aspects of internal financial control and considers standing items, such as receiving reports from the external auditors and Audit & Assurance. The entire Board is invited to attend part two of the meetings which usually considers developments in the external risk environment, receives legal updates, new business unit and corporate function reports and reports on the outcome of Strategic Review Evaluations and other topical issues.
In addition to the six scheduled meetings, the Committee also met on a quorate basis on five occasions.
GSK Annual Report 2009
68
Corporate governance
Other attendees at Committee meetings:meetings include:
| • | | CEO |
| |
| • | | CFO |
| |
| • | | Chairman |
| |
| • | | General Counsel |
| |
| • | | Head of Audit & Assurance |
| |
| • | | Company Secretary |
|
| • | | Chairman, Research & Corporate ComplianceDevelopment |
|
| • | | Chief Medical Officer |
| |
| • | | Head of Global Internal Audit, as appropriateGovernance, Ethics and Assurance |
| |
| • | | External Auditors. |
The Committee’s main responsibilities include:
| • | | Reviewing the corporate accounting and financial reporting process |
| |
| • | | Monitoring the integrity of the financial statements |
| |
| • | | Evaluating the system of internal control and identifying and managing risks, including in relation to the financial reporting process and the preparation of consolidated accounts |
| |
| • | | Overseeing activities of each of the Group’s compliance and audit functions and overseeing compliance with laws, regulations and ethical codes of practice. |
The Committee’s oversight role requires it to address regularly the relationships between management and the internal and external auditors and understand and monitor the reporting relationships and tiers of accountability between them.
GSK Annual Report 2010
75
Corporate governance
The Committee receives regular reports from members of the CET and senior managers covering the key risk management and compliance activities of the Group, including those covering R&D, manufacturing, sales and marketing and corporate functions. Further details of the reporting framework to the Committee are set out on pages 6571 to 6773 ‘Internal control framework’.
In December 2009 the Committee’s terms of reference were amended to reflect its role in overseeing the identification and management of risk under the new assurance-based audit framework referred to on pages 66 to 67.page 73. At the same time the name of the Audit Committee was changed to the Audit & Risk Committee.
Qualifications of Audit & Risk Committee Membersmembers
Committee members, with the exception of Professor Sir Roy Anderson and Dr Daniel Podolsky, bring considerable financial and accounting experience to the Committee’s work. Members have past employment experience in either finance or accounting roles or comparable experience in corporate activities. Professor Sir Roy Anderson and Dr Daniel Podolsky’s backgrounds as world renowned medical scientists and researchers enable them to bring scientific expertise to the Committee’s deliberations.
| | | |
| |
| | | Financial & accounting experience |
| | |
| Mr Tom de Swaan | | • Chief Financial Officer of ABN AMRO until 31st December 2005 |
| | | • Determined by the Board to be the Audit Committee Financial Expert, as defined by the Sarbanes Oxley Act of 2002 (Sarbanes-Oxley) |
| | | • Non-Executive Director of KPMG’s Public Interest Committee |
| |
| Sir Deryck Maughan | | • A Partner of Kohlberg Kravis Roberts & Co. (KKR) and Chairman of KKR Japan |
| | | • Former Chairman & CEO of Citigroup International and Vice Chairman of Citigroup Inc. |
| | | • Former Chairman and Co-Chief Executive Officer of Salomon Smith Barney |
| | | • Former Chairman and Chief Executive Officer of Salomon Brothers Inc. |
| | | |
| Sir Robert Wilson | | • Economist, and former Non-Executive Chairman of The Economist Group |
| | | • Chairman of BG Group plc |
| | | • Retired from Rio TintoRioTinto in 2003 where he held Senior Management positions culminating in his appointment as Executive Chairman |
| |
| | | |
| |
| | | Scientific expertise |
| | | |
Professor Sir Roy
Anderson | | • A world renowned medical scientist with advanced knowledge of infectious disease epidemiology |
| | | • Professor of Infectious Disease Epidemiology in the Faculty of Medicine, Imperial College, London |
| | | • Fellow of the Royal Society |
| | | • Foreign Associate Member of the Institute of Medicine at the US National Academy of Sciences |
| | | • Foreign Associate Member of the French Academy of Sciences |
| | | • Former Rector of Imperial College, London |
| | | • Former Chief Scientific Adviser at the Ministry of Defence in the UK |
| | | |
| Dr Daniel Podolsky | | • A world renowned researcher with advanced knowledge of underlying mechanisms of disease and new therapies for gastrointestinal disorders |
| | | • President of the University of Texas Southwestern Medical CentreCenter and Professor of Internal Medicine |
| | | • Member, Institute of Medical/Medicine of the US National Academy of Sciences |
| | | • Former Mallinckrodt Professor of Medicine, Harvard Medical School |
| | | • Former Chief Academic Officer, Partners Healthcare |
| | | |
GSK Annual Report 20092010
6976
Corporate governance
In 2009,2010, the Committee worked to a structured programme of activities, with standing items that the Committee is required to consider at each meeting, together with other matters focused to coincide with key events of the annual financial reporting cycle:
| | | |
| | |
External auditors | | reported on all critical accounting policies, significant judgements and practices used by the Group, alternative accounting treatments which had been discussed with management and their resultant conclusion, material written communications with management and any restrictions on access to information |
| | | |
CFO | | reported on the financial performance of the company and on technical financial and accounting matters |
| | | |
General Counsel | | reported on material litigation |
| | | |
Company Secretary
& Corporate
Compliance Officer | | reported on corporate governance and on the activities undertaken by the ROCC |
| | |
Heads of audit and assurance and the Group’s compliance and audit groups | | the majority of the Heads of these groups reported on their audit scope, annual coverage, audit resources and on the results of audits conducted throughout the year |
| | | |
Company Secretary, as Chairman of the Disclosure Committee | | reported on matters that affected the quality and timely disclosure of financial and other material information to the Board, to the public markets and to shareholders. This enabled the Audit & Risk Committee to review the clarity and completeness of the disclosures in the published annual financial statements, interim reports, quarterly and preliminary results announcements and other formal announcements relating to financial performance prior to approval by the Board. |
| | | |
The Audit & Risk Committee, management, internal auditors and the full Board work together to ensure the quality of the company’s corporate accounting and financial reporting. The Committee serves as the primary link between the Board and the external and internal auditors. This facilitates the necessary independence from management and encourages the external and internal auditors to communicate freely and regularly with the Committee. In 2009,2010, the Committee met both collectively and separately with the external auditors and the Head of Audit and& Assurance, and the Corporate Compliance Officer without members of management being present.
External auditors’ appointment and fees
The Committee has primary responsibility for making a recommendation to shareholders on the appointment, re-appointment and removal of the external auditors by annually assessing the qualifications, expertise, resources and independence of the external auditors and the effectiveness of the audit process.
In evaluating the effectiveness of the audit process prior to making a recommendation on the re-appointment of the external auditors, the Committee reviews the effectiveness of their performance against criteria which it agrees, in conjunction with management, at the beginning of each year’s audit. As part of this process, the Committee considers feedback on the prior year’s external audit gathered through a survey facilitated by the auditors’ client service review team, which is independent of the engagement team that undertook the audit work. The survey seeks feedback from a number of sources, including certain members of the Board who were involved in the audit process and the financial management team at corporate and business unit level.
Before agreeing the audit fee proposed by the external auditors the Committee considers cost comparisons to ensure that it is fair and appropriate for GSK. There are no contractual obligations that restrict the Committee’s capacity to recommend a particular firm as external auditors to the Group. PricewaterhouseCoopers LLP have remained in place as auditors since the Group’s inception in December 2000. Their performance has been reviewed annually by the Committee since that time.
In making its assessment, the Committee considers papers which detail the relevant UK legislative, regulatory and professional requirements relating to external auditors and evaluates reports from the external auditors on their compliance with the requirements, on the safeguards that have been established and on their own internal quality control procedures. Consideration is also given by the Committee to the need to include the risk of the withdrawal of the external auditors from the market in its risk evaluation and planning. The external auditors are required to rotate the audit engagement partner every five years. The current audit partner commenced his engagement on 1st January 2008 and is not subject to rotation until after the audit of GSK’s financial statements for 2012 has been concluded.
The Sarbanes-Oxley Act of 2002 prohibits the engagement of the external auditors for the provision of certain services such as legal, actuarial, internal audit outsourcing, financial information systems design. Where the external auditors are permitted to provide non-auditnon- audit services, the Committee ensures that auditor objectivity and independence are safeguarded by a policy requiring pre-approval by the Committee for such services. These services may include audit, services, audit-related, services, tax services and other services. Pre-approval is detailed as to the particular service or categories of services, and is subject to a specific budget.
There are guidelines which set out the Group’s policy on engaging the external auditors to provide non-audit services, which include ascertaining that: the skills and experience of the external auditors make them a suitable supplier of the non-audit services; adequate safeguards are in place so that the objectivity and independence of the Group audit are not threatened or compromised; and the fee levels relative to the annual audit fee are within the limits set by the Committee.
The external auditors and management report regularly to the Committee regarding the extent of services provided in accordance with this pre-approval and the fees for the services performed. The Committee may also pre-approve additional services on a case-by-casecase-by- case basis. Expenditure on audit and non-audit services is set out in Note 9 to the financial statements, ‘Operating profit’.
The guidelines set out in the company’s policy on engaging the external auditors to provide non-audit services include ascertaining that: the skills and experienceGSK Annual Report 2010
77
Corporate governance
Code of the external auditors make them a suitable supplier of the non-audit services; adequate safeguards are in place so that the objectivity and independence of the audit are not threatened or compromised; and the fee levels relative to the annual audit fee are within the limits set by the Committee.Conduct
The company also has a number of well-established policies, including a Code of Ethics, which is available on its website,Conduct and a help-line facility for the reporting and investigation of unlawful conduct. No waivers to the Code were made in 2009.
GSK Annual Report 2009
70
Corporate governance
Nominations Committee Report

 Sir Christopher Gent
Nominations Committee Chairman
| | | | | | | | | |
| | | |
| | | | | | | Attendance at | |
| | | | | | | full meetings | |
| Members | | Committee member since | | | during 20092010 | |
| | | | | |
| Sir Christopher Gent | | 9th December 2004 | | | | 5/53/3 | |
| (Chairman from | | | | | | | | |
| 1st January 2005) | | | | | | | | |
Mr LLarry Culp | | 28th March 2008 | | | | 5/52/3 | |
| Sir Crispin Davis | | 9th July 2009 | | | | 2/23/3 | |
| Sir Deryck Maughan | | 9th July 2009 | | | | 2/23 | |
| Sir Robert Wilson | | 28th March 2008 | | | | 5/5 | |
Sir Ian Prosser* | | 27th December 2000 | | | | 2/2 | |
(Committee Chairman
February-December 2003) | | | | | | | | |
Dr R Schmitz* | | 17th May 2004 | | | | 2/23/3 | |
| | | | | | |
In addition to the three scheduled meetings, the Committee also met on a quorate basis on two occasions.
| | |
* | | Sir Ian Prosser and Dr Schmitz retired from the Board on 20th May 2009. |
Other attendees at Committee meetings:
| • | | CEO |
| |
| • | | Chief of Staff |
|
• | | Head of HRHuman Resources |
| |
| • | | Company Secretary |
| |
| • | | where relevant, appropriate external advisers. |
The Nominations Committee’s (the Committee) main responsibilities include proposing the appointment of Board and Committee members.
During 2009,2010, the Committee’s main focus was on the recruitment ofsuccession process for the CFO and the search for new Non-Executive Directors to refresh the Board and on the appointment of a new Head of North American Pharmaceuticals.
When recruiting Non-Executive Directors, the Committee considers the particular skills, knowledge and experience that would benefit the Board most significantly for each appointment. Broad selection criteria are used which focus on achieving a balance between the representation of European, UK and US markets, and having individuals with CEO experience and skills developed in various sectors and specialities. During 2009, particular focus was placed upon recruiting replacements for Sir Ian Prosser and Dr Ronaldo Schmitz who retired at the AGM in 2009. The Committee recommended the appointment of Mr James Murdoch as a Non-Executive Director.
The process continues into 2010, with the Committee placing emphasis on candidates who are current CEOs or have financial expertise. Professional search agencies are engaged specialising in the recruitment of high calibre Non-Executive Directors. Dossiers of potential Non-Executive appointees are provided to the Committee and candidates are shortlisted for interview on merit and against objective criteria after considering their relevant qualifications.Board.
When appointing new Executive Directors or CET members, the Committee considers the skills, knowledge and experience required for the particular executive position. The Committee will consider potential external and internal candidates before recommending to the Board to approve the new appointment. All new Directors offer themselves for election at the company’s next AGM. Their appointments are announced publicly.
Ms Deirdre Connelly was appointed President, North America PharmaceuticalsThe succession process for the CFO focused on 9th February 2009the need both for GSK to operate with creativity and continued financial discipline and also becameto identify a membercandidate who would be able to bring experience and capability to support our strategy to grow and diversify GSK’s business through organic means and bolt-on acquisitions. The successful candidate would also be responsible for delivering further cost savings as part of our global restructuring programme and implementing additional measures to simplify our operational model. After considering potential external and internal candidates, the CET.
On the Committee’s recommendation,Committee was pleased to recommend Simon Dingemans to the Board, as the company’s CFO Designate.
Simon Dingemans was a Managing Director and Partner at Goldman Sachs’ European M&A business and previously head of UK Investment Banking. During his 25 years in investment banking he built up relationships and offered strategic advice across multiple industry sectors, including pharmaceuticals and consumer healthcare. He had worked closely with GSK for many years and had helped establish ViiV Healthcare a new world-leading, specialist HIV company.
The Board approved and announced the following changesappointment of Simon Dingemans in September 2010 and he then joined GSK in January 2011.
The Committee also recommended the appointment of Dr Patrick Vallance to the CET and as SVP, Drug Discovery and Medicines Development with effect from 1st July 2010. He joined GSK in May 2006 as Head of Drug Discovery. He has since transformed GSK’s discovery engine to focus on therapy areas that are underpinned by the most promising and mature science, and which took effectoffer fresh insights into diseases. In his new role, he assumed responsibility for Medicines Development and will be responsible for ensuring that GSK maintains a flow of potential new medicines through the R&D pipeline from early discovery through to late stage development.
When recruiting Non-Executive Directors, the Committee considers the particular skills, knowledge, independence, diversity and experience that would benefit the Board most significantly for each appointment. Broad selection criteria are used which focus on achieving a balance between the retirementrepresentation of Sir Ian ProsserEuropean, UK, US and Emerging Markets, and having individuals with CEO level experience and skills developed in various sectors and specialities.
During 2010, particular focus continued to be placed upon recruiting a replacement for Dr Ronaldo Schmitz who retired from the Board at the conclusion of the AGM in May 2009: Sir Robert Wilson replaced Sir Ian as the SID, Sir Crispin Davis replaced Sir Robert as the Chairman of the Remuneration Committee, Professor Sir Roy Anderson became a member of the Audit & Risk Committee, Mr de Swaan stepped down from the Corporate Responsibility Committee and became a member of the Remuneration Committee, Mr Murdoch became a member of the Corporate Responsibility Committee. In addition, on the Committee’s recommendation, the Board approved the appointment of Sir Crispin and Sir Deryck Maughan as members of the Nominations Committee with effect from 9th July 2009. The Committee also recommendedhas placed an emphasis on candidates who are current or recently retired CEOs, CFOs, Audit partners or who have other significant financial expertise and preferably an individual who brings increased diversity to the Board approvedBoard’s composition and deliberations. Professional search agencies have been engaged who specialise in the appointmentrecruitment of Mr Murdoch as a memberhigh calibre Non-Executive Directors. Dossiers of potential Non-Executive appointees have been considered by the Remuneration Committee with effect from 1st October 2009.and shortlisted for interview on merit and against objective criteria, after considering their relevant qualifications. Positive progress has been made on the recruitment of new Non-Executive Directors to refresh the Board.
GSK Annual Report 2010
78
Corporate governance
Remuneration Report
The Remuneration Report can be found on pages 7381 to 90.101.
GSK Annual Report 2009
71
Corporate governance
Corporate Responsibility Committee Report
Corporate Responsibility Committee Chairman
| | | | | | | | | |
| | |
| | | | | | | Attendance at | |
| | | | | | full meetings | |
| Members | | Committee member since | | | during 20092010 | |
| | | | |
Sir Christopher Gent
(Chairman from
1st January 2005) | | 9th December 2004 | | 5/5 | |
(Chairman from
1st January 2005) | | | | 4/4 | |
Dr SStephanie Burns | | 6th December 2007 | | 5/5 | | 3/4 | |
Mr JJames Murdoch | | 20th May 2009 | | 2/2 | | 4/4 | |
Dr DDaniel Podolsky | | 1st July 2006 | | 4/5 | |
Sir Ian Prosser* | | 17th May 2004 | | 2/3 | |
Mr T de Swaan* | | 1st July 2006 | | 3/34/4 | |
| | | | | |
| | |
* | | Sir Ian Prosser retired from the Board on 20th May 2009 and Mr de Swaan also ceased to be a member of the Committee on that date. |
Other attendees at Committee meetings may include:meetings:
| • | | CEO |
| |
| • | | General Counsel |
| |
| • | | Head of CorporateGovernance, Ethics and Assurance |
|
| • | | Head of Global Communications & Community Partnerships |
| |
| • | | Head of Corporate Responsibility |
| |
| • | | Company Secretary.Secretary |
|
| • | | Independent External Corporate Responsibility Adviser. |
Independent External Corporate Responsibility Adviser
To augment GSK’s engagement with stakeholder opinion, in March 2009, Ms Sophia Tickell was appointed as an independent external adviser to the Committee. MsCorporate Responsibility Committee (the Committee). Sophia Tickell is the co-founder and Director of Meteos, from which she directs the Pharma Futures Series, which aims to align better societal and shareholder value, and she chairsvalue. She also sits on the International Advisory GroupExpert Review Committee of the Access to Medicines Transparency Alliance. MsFoundation and is a member of the European Healthcare Innovation Leadership Network.
Sophia Tickell attends the meetings of the Committee and advisesprovides independent advice and guidance on corporate and social responsibility matters to both the company in this capacity.Chairman and CEO.
Main responsibilities of the Committee
The main responsibilities of the Corporate Responsibility Committee are set out on page 61.67. The Committee has a rolling agenda and receives reports from the members of the CET and senior managers to ensure that progress on meeting GSK’s Corporate Responsibility Principles is reviewed. FiveThe Committee annually reviews progress on the following five Corporate Responsibility (CR) Principles: access to medicines; standards of ethical conduct; research and innovation; employment practices; and global community partnerships are reviewed annually. Other
| • | | access to medicines |
|
| • | | standards of ethical conduct |
|
| • | | research and innovation |
|
| • | | employment practices; and |
|
| • | | community investment |
GSK’s other CR Principles are discussed at least once every two years. The Committee also reviews and approves the Corporate Responsibility Report.
During the yearWork of the Committee reviewed areas including:during 2010
• | | pandemic ‘flu, including access to vaccine and antiviral medicine in developing countries |
| |
• |
| CR Principles | | accessCommittee’s area of focus during 2010 |
|
| Access to medicines | | Access to and pricing of medicines in developing countriesmiddle income and least developed countries. |
| |
•Standards of ethical conduct | | Embedding ethical values in the organisation. |
|
| Research and innovation | | Policy on use of animals in research and development. Research integrity and transparency. Governance of research conducted by external suppliers and collaborators. R&D on treatments for rare conditions and for diseases of the developing world and a patent poolworld. The potential of stem cell science for regenerative medicines. |
| |
•Employment practices | | community partnershipsDiversity and investmentinclusion. Leading and developing employees. Employee relations including consultation arrangements. Realignment of the pay for performance strategy. Management of health and safety risks in manufacturing. |
| |
•Community investment | | humanitarian donationsCommunity partnerships and investment. Humanitarian donations. |
| |
•Caring for the environment | | sales and marketing practices including harmonisationEnvironmental sustainability strategy. Management of GSK Codes of Practiceenvironment risks in manufacturing. |
| |
•Products and customers | | disclosureDisclosure of payments to healthcare professionalsprofessionals. |
| |
• | | communication of clinical trial results |
|
• | | use of animals in research |
|
• | | employment practices including diversity and inclusion |
|
• | | employee wellbeing |
|
• | | employee relations including consultation arrangements and employment litigation in the USA |
|
• | | supply chain management |
|
• | | climate change, energy use reduction and manufacturing efficiency |
|
• | | data privacy |
|
• | | corruption prevention. |
Corporate responsibility is integrated into the management of GSK’s business. Throughout this Annual Report you will read of advances to ensure that GSK publishesworks as efficiently and effectively as possible whilst ensuring that we always act responsibly.
For those interested in more detail we publish a comprehensive Corporate Responsibility Report.
79
The Combined CodeCorporate governance
Throughout 2009, the company complied with the provisions and applied the Main Principles of Section 1 of the Combined Code, except as regards an aspect of the following provision:
• | | D.2.3 – The chairman should arrange for the chairmen of the audit, remuneration and nomination committees to be available to answer questions at the AGM and for all directors to attend. |
|
| | The entire Board was in attendance at the company’s AGM in May 2009, save for Sir Deryck Maughan who was prevented from attending due to urgent business commitments which arose shortly before the meeting. He therefore needed to convey his apologies for absence. |
US law and regulation
A number of provisions of US law and regulation apply to GSK because the company’s shares are quoted on the NYSE in the form of ADS.
NYSE rules
In general, the NYSE rules permit the company to follow UK corporate governance practices instead of those applied in the USA, provided that the company explains any significant variations. This explanation is contained in the company’s Form 20-F filing, which can be accessed from the Securities and Exchange Commission’s (SEC) EDGAR database or via the company’s website. NYSE rules that came into effect in 2005 require the company to file annual and interim written affirmations concerning the Audit & Risk Committee and the company’s statement on significant differences in corporate governance.
GSK Annual Report 2009
72
Corporate governance
Sarbanes-Oxley Act of 2002
Following a number of corporate and accounting scandals in the USA, Congress passed the Sarbanes-Oxley Act of 2002. Sarbanes-OxleySarbanes- Oxley is a wide ranging piece of legislation concerned largely with financial reporting and corporate governance.
As recommended by the SEC, GSK has established a Disclosure Committee. The Committee reports to the CEO, the CFO and to the Audit & Risk Committee. It is chaired by the Company Secretary and the members consist of senior managers from finance, legal, compliance, corporate communications and investor relations.
External legal counsel, and the external auditors and internal experts are invited to attend its meetings periodically. It has responsibility for considering the materiality of information and, on a timely basis, determining the disclosure of that information. It has responsibility for the timely filing of reports with the SEC and the formal review of the Annual Report and Form 20-F. In 2009,2010, the Committee met 6 times.
Sarbanes-Oxley requires that the Annual Report contains a statement as to whether a member of the company’s Audit & Risk Committee is an Audit Committee Financial Expert as defined by Sarbanes-Oxley. For a summary regarding the Board’s judgement on this matter, refer to page 68.75. Additional disclosure requirements arise under section 302 and section 404 of Sarbanes-Oxley in respect of disclosure controls and procedures and internal control over financial reporting.
Section 302: Corporate responsibility for financial reports
Sarbanes-Oxley also introduced a requirement for the CEO and the CFO to complete formal certifications, confirming that:
| • | | they have each reviewed the Annual Report and Form 20-F |
| |
| • | | based on their knowledge, it contains no material misstatements or omissions |
| |
| • | | based on their knowledge, the financial statements and other financial information fairly present, in all material respects, the financial condition, results of operations and cash flows as of the dates, and for the periods, presented in the Annual Report and Form 20-F |
| |
| • | | they are responsible for establishing and maintaining disclosure controls and procedures that ensure that material information is made known to them, and have evaluated the effectiveness of these controls and procedures as at the year-end, the results of such evaluation being contained in the Annual Report and Form 20-F |
| |
| • | | they are responsible for establishing and maintaining internal control over financial reporting that provides reasonable assurance regarding the reliability of financial reporting and the preparation of financial statements for external purposes in accordance with generally accepted accounting principles |
| |
| • | | they have disclosed in the Annual Report and Form 20-F any changes in internal controls over financial reporting during the period covered by the Annual Report and Form 20-F that have materially affected, or are reasonably likely to affect materially, the company’s internal control over financial reporting |
| |
| • | | they have disclosed, based on their most recent evaluation of internal control over financial reporting, to the external auditors and the Audit & Risk Committee, all significant deficiencies and material weaknesses in the design or operation of internal controls over financial reporting which are reasonably likely to affect adversely the company’s ability to record, process, summarise and report financial information, and any fraud (regardless of materiality) involving persons that have a significant role in the company’s internal control over financial reporting. |
The Group has carried out an evaluation under the supervision and with the participation of the Group’s management, including the CEO and CFO, of the effectiveness of the design and operation of the Group’s disclosure controls and procedures as at 31st December 2009.2010.
There are inherent limitations to the effectiveness of any system of disclosure controls and procedures, including the possibility of human error and the circumvention or overriding of the controls and procedures. Accordingly, even effective disclosure controls and procedures can only provide reasonable assurance of achieving their control objectives.
Based on the Group’sGroup's evaluation, the CEO and CFO have concluded that, as at 31st December 2009,2010, the disclosure controls and procedures were effective to provide reasonable assurance that information required to be disclosed in the reports that the Group files and submits under the US Securities Exchange Act of 1934, as amended, is recorded, processed, summarised and reported as and when required and that it is accumulated and communicated to management, including the CEO and CFO, as appropriate, to allow timely decisions regarding disclosure.
The CEO and CFO completed these certifications on 1st4th March 2010.2011.
GSK Annual Report 2010
80
Corporate governance
Section 404: Management’s annual report on internal control over financial reporting
In accordance with the requirements of section 404 of Sarbanes-Oxley,Sarbanes- Oxley, the following report is provided by management in respect of the Company’s internal control over financial reporting (as defined in Rules 13a-15(f) and 15d-15(f) under the US Securities Exchange Act of 1934):
| • | | Management is responsible for establishing and maintaining adequate internal control over financial reporting for the Group. Internal control over financial reporting is designed to provide reasonable assurance regarding the reliability of financial reporting and the preparation of financial statements for external purposes in accordance with IFRS |
| |
| • | | Management conducted an evaluation of the effectiveness of internal control over financial reporting based on the framework in Internal Control –— Integrated Framework issued by the Committee of Sponsoring Organisations of the Treadway Commission |
| |
| • | | Management has assessed the effectiveness of internal control over financial reporting, as at 31st December 20092010 and has concluded that such internal control over financial reporting was effective. In addition, there have been no changes in the Group’s internal control over financial reporting during 20092010 that have materially affected, or are reasonably likely to affect materially, the Group’s internal control over financial reporting |
| |
| • | | PricewaterhouseCoopers LLP, which has audited the consolidated financial statements of the Group for the year ended 31st December 2009,2010, has also assessed the effectiveness of the Group’s internal control over financial reporting under Auditing Standard No. 5 of the Public Company Accounting Oversight Board (United States). Their audit report may be found on page 93.103. |
GSK Annual Report 20092010
7381
Remuneration Report

 Sir Crispin Davis
Remuneration Committee Chairman
Dear Shareholder
AsOn behalf of the new Chairman of GSK’s Remuneration CommitteeBoard, I am pleased to present the Committee’sour Remuneration Report for 20092010, for which we will be seeking your approval from shareholders at our AGM in May.
As you know, we made some importantOver the last few years, the Remuneration Committee (the Committee) has implemented a number of changes, to GSK’s remuneration policy for our UK Executive Directors last year to deliver appropriately structured pay through alignment withincluding more tailored benchmarking versus the market, and simplifying and aligning remuneration across the Corporate Executive Team. Throughout we have consulted with shareholders and have been encouraged by the level of support.
As previewed last year, in 2010 our priority was to align more closely Executive remuneration with GSK’s strategic priorities, and to enhance our governance practices. This report describes how we are progressing against these objectives.
Strategic alignment of long-term incentives
The Board has carried out a thorough review of GSK’s key strategic priorities, which are described on page 7 of the Annual Report. The Board firmly believes achievement against these priorities will deliver strong long-term financial performance and shareholder value creation on a sustainable basis.
Accordingly in 2010 we have moved to align long-term performance incentives more closely with the Group’s key strategic priorities. ThereThis will help ensure senior management are fully focused on the right priorities, with incentives to deliver against them.
The long-term incentive awards we made in February 2011 were therefore based on four equally weighted performance measures which directly link to the Group’s key strategic priorities and the overarching goal to deliver value to shareholders:
| | | | |
| Key Strategic Priorities | | | | Long-Term Incentive Performance Measure |
|
• Grow a diversified global business | | → | | • Business diversification performance |
|
• Deliver more products of value | | → | | • R&D new product performance |
|
• Simplify the operating model | | → | | • Adjusted free cash flow |
|
• Deliver value to shareholders | | → | | • Relative total shareholder return (TSR) |
The targets set out by the Committee are challenging and will require significant stretch performance. The targets for adjusted free cash flow and relative TSR are set out on page 88. However, given the very close linkage of the performance measures for business diversification and R&D new product performance to our strategy, these targets are commercially very sensitive and will not be published at date of grant. We will, though, update you regularly on the progress achieved during the performance period. The targets and outcomes for the awards will be disclosed in full at the end of the performance period.
We believe the combination of these four measures applied to our Performance Share Plan and Deferred Annual Bonus Plan will ensure that we have a balanced framework of targets which focus on each of our strategic objectives.
This year was a high level ofthe first year that all Executives were eligible to participate in our Deferred Annual Bonus Plan, which was introduced in 2009 to encourage long-term shareholding and to drive shareholder engagement in relation to these changes, and we werereturns. I am very pleased to receive such a strong votereport that take-up has been very positive.
Governance
Following on from the progress we reported in favour of last year’s Remuneration Report, at the AGM.
Senior management alignment and competitiveness
Since then, we have made further progress in simplifying and aligning the remuneration structures across the Corporateare now pleased to report that all our continuing Executive Team (CET). As a result of this, primary pay benchmarks will be based on the nature of each individual role rather than the industry benchmark previously used. Share options will normally no longer be granted; instead, CET members will receive Performance Share Plan awards, and will also be eligible to participate in GSK’s Deferred Annual Bonus Plan. There will also be a more standardised pay mix across CET roles below the Executive Directors.
The Committee would not want to reward failure and so considers that severance terms should be more limited. WeDirectors’ contracts have therefore determined that the contracts of any new CET appointees would normally include severance terms of one year’s base salary only, with no bonus entitlement. In addition, I am pleasedonly. Similarly to report that the CEOAndrew Witty, Dr Moncef Slaoui, Chairman, R&D, has voluntarily agreed to remove histhe contractual entitlement to bonus from his severance terms. The severance terms in the event of termination of his employment andcontract for Simon Dingemans, our new CFO, are also based on one year’s base salary.
In order to noteeffectively manage risk, we will continue to operate the increase in his holding of GSK shares.
Strategic alignment
The introduction of a second performance measure in the Performance Share Plan has provided a clear focus on cash generation in the business. We are continuing to develop measures that further align our remuneration with the ongoing work to transform GSK. Given the importance of long term organic growth and R&D productivity to the future of GSK, we are assessing the most meaningful ways of measuring success in these areas so that they may be considered as performance measures for future awards.
Good governance
There have been a number of corporate governance developments in the past year in response to the economic turmoil, with more likely to come in 2010.
When we reviewed our arrangements last year we wanted to ensure that we did not motivate excessive risk taking. We introduced a new Deferred Annual Bonus Plan, and were one of the first companies to introduce a ‘clawback’ mechanism introduced in 2009 for annual bonuses and long-term incentive awards should problems arise in the years after a bonusan award has been made. We have adapted UK pension arrangements in the light of new pension tax legislation to continue to monitor best practice governance developments,meet our long-standing commitments. However, the company will not offset any additional individual tax costs.
Each year, we review the market competitiveness of Executive Directors’ base salaries and commit to regular reviewspackages, taking into account the prevailing economic conditions and the positioning and relativities of our remuneration arrangementspay across the broader GSK workforce. As a result of that review, to ensure that they continue to encourageappropriate market competitiveness in the right behaviours from our leadership team.
The following report provides further detail on GSK’s current remuneration arrangementscontext of Dr Moncef Slaoui’s enhanced role, including the transition of responsibility for Biologicals, he will receive an increase to his base salary. Andrew Witty and Simon Dingemans will not receive any increase in base salary.
We believe that the changes we have made and those to be implemented. The Committee believes that these changesin recent years support the futurelong-term success of the business and as such are in the best interests of shareholders.
Sir Crispin Davis
Remuneration Committee Chairman
24th February 20101st March 2011
GSK Annual Report 20092010
7482
Remuneration Report
The Remuneration Committee
Role of the Committee
The role of the Committee is to set the company’s remuneration policy for Executive Directors and CETCorporate Executive Team (CET) members (together the Executives), ensuringso that GSK is able to recruit, retain and motivate its Executives. The policy is regularly reviewed to ensure that it is consistent with the company’s scale and scope of operations, supports the business strategy and growth plans and helps drive the creation of shareholder value.
In setting remuneration policy and levels for the most senior executives, the Committee gives consideration to remuneration policy and levels for the wider employee population.population of the Group, as well as ensuring that remuneration is consistent with industry and broader market norms.
Terms of reference
The Committee’s full terms of reference are available. The terms of reference, which conform withare reviewed annually, were revised in January 2011 in the requirementslight of the Combined Code can be obtained from the Company Secretary.best practice and corporate governance developments.
Governance
The Board considers all of the members of the Committee to be independent Non-Executive Directors, in accordance with the Combined Code, with the exception of theSir Christopher Gent, Chairman of the company, Sir Christopher Gent, who was independent on appointment to the company.appointment.
The Committee met 6six times during 2009,2010, with each member attending as follows:
| | | | | | | | | | | | | |
| | | | | | | Number of | | | Number of | |
| | | | | | | meetings | | | meetings | |
| | | | | | | held in | | | attended in | |
| | | Committee member | | | 2009 whilst | | | 2009 whilst | |
| Members | | since | | | a member | | | a member | |
| | | | | | | | | | |
| Sir Crispin Davis | | 1st July 2003 | | | | 6 | | | | 6 | |
(Chairman from
20th May 2009) | | | | | | | | | | | | |
| Sir Robert Wilson | | 1st January 2004 | | | | 6 | | | | 6 | |
(Chairman from 17th May
2004 to 20th May 2009) | | | | | | | | | | | | |
| Mr L Culp | | 1st January 2004 | | | | 6 | | | | 5 | |
| Sir Christopher Gent | | 1st January 2007 | | | | 6 | | | | 6 | |
| Mr J Murdoch | | 1st October 2009 | | | | 1 | | | | 1 | |
| Mr T de Swaan* | | 20th May 2009 | | | | 4 | | | | 4 | |
| Dr Ronaldo Schmitz** | | 25th May 2005 | | | | 2 | | | | 2 | |
| | | | | | | | | |
| | | | | | | | |
| | |
| | | | | | Attendance | |
| | | | | | at full | |
| | | | | | meetings | |
| | Committee member | | | during | |
| Members | | since | | | 2010 | |
| | |
| Sir Crispin Davis | | 1st July 2003 | | | | 6/6 | |
| (Chairman from 20th May 2009) | | | | | | | | |
| Sir Robert Wilson | | 1st January 2004 | | | | 3/3 | |
| (to 25th March 2010) | | | | | | | | |
| Larry Culp* | | 1st January 2004 | | | | 4/6 | |
| Sir Christopher Gent | | 1st January 2007 | | | | 6/6 | |
| James Murdoch | | 1st October 2009 | | | | 6/6 | |
| Tom de Swaan** | | 20th May 2009 | | | | 6/6 | |
| | |
| | |
| * | | MrLarry Culp was unable to attend two meetings for personal reasons. He reviewed the papers and provided his views to the Committee Chairman in advance of these meetings. |
|
| ** | | Tom de Swaan is also the Chairman of the Audit & Risk Committee. |
|
** | | Dr Schmitz retired from the Board |
In addition to the six scheduled meetings, the Committee also met on 20th May 2009 having been a member of the Committee prior to that date.
Two quorate meetings were held during the yearbasis on three occasions, principally to approve the formal grant and vesting of long-term incentive (LTI) awards in accordance with GSK’s remuneration policy.
With the exception of Mrs Whyte (Deputy Company SecretaryAndrew Witty (CEO) and Secretary to the Committee), no employees of the company were involved in the conduct of Committee meetings. Mr Witty (CEO), Mr Heslop (CFO), Mr Bicknell (Senior Vice President, Company Secretary & Corporate Compliance Officer), Mr Phelan (Chief of Staff), MsClaire Thomas (Senior Vice President, Human Resources) and Mr Powley (Senior Vice President, Corporate Compensation) were invited to attend part of some meetings of the Committee as required. They do not attend where their individual remuneration is discussed and no director isNo Executives or Committee attendees are involved in deciding hisany decision or are present at any discussion as to their own remuneration.
In addition, Allen Powley (Senior Vice President, Corporate Compensation) and Judy Lynch (Senior Vice President, Benefits) were also invited to some meetings as required.
With the exception of Victoria Whyte (Company Secretary and Secretary to the Committee), no employees of the company are involved in the conduct of Committee meetings.
The Committee has access to external advice as required. Deloitte LLP has been appointed by the Committee to provide it with independent advice on executive remuneration. During the year, Deloitte LLP provided independent commentary on matters under consideration by the Committee, and provided updates on best practice, legislative requirements and market practice.
Deloitte LLP also provided other consulting, tax and consultingassurance services to GSK during the year, but did not provide advice on executive remuneration matters other than for the Committee.
Towers Watson and Pay Governance provided additional market data to the Committee.
Commitment to shareholders
The Committee engages in regular dialogue with shareholders and holds an annual meetingmeetings with GSK’s largest investors to discuss and take feedback on its remuneration policy, governance matters and any key developments during the year. In particular, the Committee discusses any significant changes to the policy or the measures used to assess performance.
Summary of policy
As a result ofThe annual meetings were held in November 2010, at which Sir Crispin Davis, Committee Chairman, shared progress on remuneration matters in the remuneration review in 2008, changes were made to the remuneration packages of the CEOlast 12 months and the CFOproposals for 2009.
The remuneration structure of all CET members (including the2011 as outlined on page 84. Sir Christopher Gent, Chairman, Research & Development) has now been harmonised with that of the CEO and CFO. As a result of this, with effect from 2010, share options will normally no longer be granted to any CET members. Instead, CET members will receive additional performance share awards, and will also be eligible to participate in GSK’s Deferred Annual Bonus Plan.updated attendees on Corporate Governance developments.
GSK Annual Report 20092010
7583
Remuneration Report
Key elementsA diary of remunerationthe Committee’s key activities and matters addressed during 2010 is set out below:
| | | | | | | | | | | | |
Month
| | |
Executives’ Remuneration | | |
Annual bonus | | |
Long-term incentive plans | | |
Governance and other matters
|
| | | | | | | | | | | | |
| January | | | Approve CET 2010 remuneration, including salaries of CEO, CFO and Chairman, R&D | | | Set CEO 2010 bonus
objectives
Review bonus plan
arrangements for
Chairman, R&D | | | | | | Annual Committee
evaluation results
Review remuneration report
Review 2010 remuneration
budget
Review voting policy
guidelines on remuneration |
| | | | | | | | | | | | |
| | | | | | | | Policy for 2010 onwards |
| | | | |
Salary February | | | | | • | | Salary levels reviewed annually influenced by the Executive’s roleReview and experience. Benchmarked against relevant comparator group(s) |
approve
Executive Directors’
and CET 2009 bonuses | | | |
AnnualSet 2010 PSP cash flow target
Approve 2007 PSP and Share Option Plan vesting
Grant 2010 LTI awards to Executive Directors, CET and below
Approve deferred annual bonus award elections | | | • | | The majority of bonus is based on the achievement of financial targets (based on Group profit before interest and tax, and on business unit operating profit)Approve remuneration
report |
| | | | | | • | | Individual performance against pre-determined personal objectives is also taken into account in determining individual bonus payments |
| | | | | | • | | There are R&D specific key performance indicators for R&D employees |
| | | | | • | | Achievement of additional operational efficiency goals will also be taken into account in determining the annual bonuses in respect of 2009 and 2010 |
| | | | | • | | No individual, including the CEO, will have a maximum bonus opportunity of more than 200% of salary |
| | | | | • | | The Committee reviews the ongoing financial impact of any prior year activities and an Executive’s role in them and may make appropriate adjustments to individual bonus awards to reflect the circumstances |
| | | |
Deferred | | | | | • | | Individuals may elect to defer up to 50% of any bonus earned |
Annual | | | | | • | | In respect of 2009, only the CEO and CFO were eligible to participate |
Bonus Plan | | | | | • | | From 2010, all Executives may participate |
| | | | | • | | Deferred bonuses may be matched up to one-for-one subject to relative Total Shareholder Return (TSR) performance over three years (TSR vesting as for PSP) |
| | | |
Performance
Share | | • 60% | | | • | | Vesting based on relative TSR using a comparator group currently comprising 10 other pharmaceutical
companies |
Plan (PSP) | | | | | • | | Half of TSR component is measured over three years and half over four years |
| | | | | • | | 30% vesting at median, with 100% vesting for upper quartile performance |
| | | | | • | | Twelve-month averaging period for TSR |
| | | | |
| | • 40% | | | • | | Vesting based on adjusted free cash flow measured over three years |
| | | | | • | | 25% vesting at threshold, rising to 100% for stretching performance exceeding the set threshold by a specified margin |
| | | | | |
| | | | | | • | | The operating maximum face value | | | | | |
| March | | | | | | | | | Scope review of annualstrategic alignment of LTI performance share awards is as follows: 500% of salary for the CEO and Chairman, Research & Development and 400% for the CFOmeasures | | | Review voting policy
guidelines on remuneration |
| | | | |
Share Option
Plan | | | | | • | | Options no longer normally to be granted to any Executives | |
| | | | | | | | | | | | | |
| July | | | Agree CFO retirement and appointment packages | | | Review progress
against 2010 bonus
objectives | | | Review of strategic alignment of LTI performance measures
Grant interim 2010 LTI awards | | | Review of general market developments (including pensions) |
| | | | | | | | | | | | |
| | | | | | | | | | | | |
| October | | | Agree CET 2011 salary
review process | | | Review CET 2010
bonus process | | | Review of strategic alignment of LTI performance measures | | | Annual Committee
assessment |
| | | | | | | | | | | | |
| | | | | | | | | | | | |
| November | | | Annual meetings with
investors | | | | | | Annual meetings with investors | | | |
| | | | | | | | | | | | |
| | | | | | | | | | | | |
| December | | | Consider feedback from
annual meetings with investors on remuneration
policy
Review remuneration benchmarking and competitiveness below
CET level | | | | | | Consider new LTI performance
targets framework | | | Review tax change
implications for pension
arrangements |
GSK Annual Report 2010
84
Remuneration Report
Remuneration policy for 2011
The table below outlines the key elements of remuneration for 2011 for GSK’s Executives.
The remuneration structure of all CET members (including Dr Moncef Slaoui and Simon Dingemans, CFO Designate) has now been harmonised with that of Andrew Witty. As a result of this, since 2010, share options are normally no longer granted to any of the CET members. Instead, CET members receive additional performance share awards and are also eligible to participate in GSK’s Deferred Annual Bonus Plan.
To further improve the alignment of our Executive remuneration arrangements with GSK’s key strategic priorities and to incentivise management to deliver long-term financial performance and shareholder value creation on a sustainable basis, two new business-specific performance measures were introduced for the long-term incentive awards made to Executives in February 2011. This is to ensure that there is a balanced framework of measures focusing on all of GSK’s strategic objectives. Further information on the long-term incentive performance measures is outlined on pages 87 to 89.
Fixed pay
| | |
| | |
| Salary | | • Salary levels reviewed annually and influenced by Executive’s role and experience. Benchmarked against relevant comparator group(s) |
| | |
| | |
| | | |
| Pension | | | | | • | | For UK Executives, defined contribution plan and legacy final salary plans (closed to new entrants since 2001). UK Executives participating in the defined contribution plan benefit from a company contributioncontributions of 20% of base salary, plus a matched contribution of 5% of base salary |
| | | |
| | | • Following changes to UK pension tax regime, changes made to arrangements for UK Executives to continue to meet long-standing commitments within this new regime – see page 89 |
| | |
| | •For US Executives, GSK operates a US Cash Balance Plan and(US Plan). US Executives participating in US Plan benefit from contributions of up to 38% of salary |
| | |
Variable pay
| | | | | | | | | | |
| | | | | | | | | | |
| Annual bonus | | | • Maximum bonus opportunity of 200% of salary | | | • Majority of bonus based on achievement of financial targets (Group profit before interest and tax and business unit operating profit) |
| | | | | | | | | | |
| | | | | | | | | | • Individual performance against pre-determined personal objectives |
| | | | | | | | | | |
| | | | | | | | | | • R&D-specific key performance indicators for R&D employees |
| | | | | | | | | | |
| | | | | | | | | | • ‘Clawback’ – Committee reviews ongoing financial impact of any prior year activities and Executive’s role in them and may make appropriate adjustments to individual bonus awards to reflect circumstances. |
| | | | | | | | | | |
| | | | | | |
| | | | | | | | | | |
| Deferred Annual Bonus Plan | | | • Individuals may elect to defer up to 50% of any bonus earned | | | • Awards vest at end of three-year performance period based on four equally weighted performance measures: |
| | | | | | | | |
- Business diversification performance
- R&D new product performance
- Adjusted free cash flow
- Relative TSR |
| | • Deferred bonuses may be matched up to one-for-one subject to performance | | |
| | | | | | | | | | |
| | | | | | | | | | |
| | | | | | |
| Performance Share Plan (PSP) | | | For 2011, performance share awards are as follows: | | | • Relative TSR is calculated on twelve month averaging period, using comparator group comprising 10 pharmaceutical companies. 30% vests at median, with 100% vesting for upper quartile performance.
• For business diversification, R&D new product measures and adjusted free cash flow, 25% vests at threshold, rising to 100% for stretching performance exceeding set threshold by a specified margin |
| | | | | | % of
Salary | | |
| | | • CEO
| | | 500 | | | |
| | | • Chairman, R&D
| | | 500 | | | | |
| | | • CFO Designate | | | 350 | | | | |
GSK Annual Report 20092010
7685
Remuneration Report
Total remuneration benchmarking
The Committee reviews GSK’s total remuneration against comparable companies on a regular basis, to ensure that remuneration arrangements are structured appropriately to deliver value for money for shareholders over the longer term and are competitive. The relevant comparator group(s) are now determined for each individual Executive.
For benchmarking purposes, total remuneration incorporates base salary, bonus and LTIs. When setting pay, the Committee also considers pension arrangements.
| | | | | | |
| UK cross-industry comparator group | | | Global pharmaceutical comparator group* |
| | | group |
| AngloAmerican | | | France | | Sanofi-Aventis |
| AstraZeneca | | | Switzerland | | Novartis |
| Barclays | | | | | Roche Holdings |
| BG Group | | | UK | | AstraZeneca |
| BHP Billiton | | | USA | | Abbott Laboratories |
| BP | | | | | Amgen** |
| British American Tobacco | | | | | Bristol-Myers Squibb |
| Diageo | | | | | Eli Lilly |
| HSBC | | | | | Johnson & Johnson |
| Reckitt Benckiser | | | | | Merck |
| Royal Dutch Shell | | | | | Pfizer |
| Rio Tinto | | | | | |
| Standard Chartered | | | | | |
| Tesco | | | | | |
| Unilever | | | | | |
| Vodafone | | | | | |
| | | | |
| | |
| * | | Revised to reflect the de-listing of Schering-Plough and Wyeth during 2009 (see page 88) |
|
** | | Amgen is included for benchmarking but as ofsince 2009 ishas not been in the current TSR comparator group. |
Individual elements of remuneration
The balance between the fixed (base salary) and variable (annual bonus and LTI) elements of remuneration varies depending on performance. The charts to the right show the anticipated mix between fixed and variable pay on an expected value basis under the new remuneration policy. The actual mix may be higher or lower, depending on the performance of GSK and the individual. Typically, a significant portion (approximately 75% – 85%) of an Executive Director’s package is variable.
Base salary
Base salaries are set by reference to the relevant comparator group at a level considered appropriate to secure and retain the talent needed to deliver GSK’s strategic priorities. Salary levels are reviewed annually and are influenced by the Executive’s role, experience and the pay environment.
Until 2008, GSK’s remuneration policy was based on the principle of achieving competitiveness with the global pharmaceutical industry, which was the primary pay comparator. The Committee now decides on an individual Executive basis whether the primary pay comparator should be the global pharmaceutical sector, the UK-based large cross-industry multinationals and/or some other comparator group(s).
| | | | | |
Primary Comparator Group | | UK cross-industry | | Global pharmaceutical |
| | | | | | | |
Mr | | UK | | | Global | |
| Primary Comparator Group | | cross-industry | | | pharmaceutical | |
| | | | | | |
| Andrew Witty, CEO | | | ü | | | | | |
MrJulian Heslop, CFOCFO* | | | ü | | | | | |
| Simon Dingemans, CFO Designate** | | | ü | | | | | |
| Dr Moncef Slaoui, Chairman, R&D | | | | | | | ü | |
| | | | | | |
Salary levels are reviewed annually and are influenced by the Executive’s role, experience and the pay environment. | | |
| * | | Julian Heslop will retire from the Board on 31st March 2011 |
| |
| ** | | CEO |
| |
| 1 Salary |
| |
| 2 Cash bonus |
| |
| 3 Deferred bonus including match |
| |
| 4 Performance shares |
| |
| |
| CFO |
| |
| 1 Salary |
| |
| 2 Cash bonus |
| |
| 3 Deferred bonus including match |
| |
| 4 Performance shares |
| |
| |
| |
| Chairman, R&D |
| |
| 1 Salary |
| |
| 2 Cash bonus |
| |
| 3 Deferred bonus including match |
| |
| 4 Performance shares |
| Simon Dingemans joined the Board on 4th January 2011 |
For 2010,2011, the Committee considered the currentprevailing economic conditions, the market competitiveness of each Executive Director’s package and the newpositioning and relativities of pay across the broader GSK harmonised pay philosophy. Accordingly, itworkforce. It agreed with the CEO and CFOAndrew Witty that their payhis salary would be held at 20092010 levels. As part of
It decided that the alignment of pay structures across the CET, Dr Slaoui’sonly Executive Director to receive a base salary willincrease this year should be adjusted to reflectDr Moncef Slaoui. In particular, the new balance and alsoCommittee considered his package in the market ratecontext of payhis enhanced role, including the transition of responsibility for his responsibilities. Biologicals.
The table immediately following sets out current base salaries and those proposed for 2010.
2011. Salary increases typically take effect from 1st April each year.
| | | | | | | | | | | | | | | | | | | | | |
| | | 2009 base | | | Effective date for | | | 2010 base | | | Effective date for | | | % | |
| | | salary | | | 2009 salary | | | salary | | | 2010 salary | | | change | |
| | |
| Mr Witty | | | £1,000,000 | | | 1st April 2009 | | | £1,000,000 | | | 1st April 2010 | | | 0 | |
| Mr Heslop | | | £525,000 | | | 1st April 2009 | | | £525,000 | | | 1st April 2010 | | | 0 | |
| Dr Slaoui | | | $875,000 | | | 1st April 2009 | | | $975,000 | | | 1st April 2010 | | | 11.43 | |
| | |
| | | | | | | | | | | | | | | | | | | | | |
| |
| | | 2010 base | | | Effective date for | | | 2011 base | | | Effective date for | | | % | |
| | | salary | | | 2010 salary | | | salary | | | 2011 salary | | | change | |
| |
| Andrew Witty, CEO | | | £1,000,000 | | | 1st April 2010 | | | £1,000,000 | | | 1st April 2011 | | | 0 | |
| |
| Julian Heslop, | | | £525,000 | | | 1st April 2010 | | | – | | | | – | | | | – | |
| CFO* | | | | | | | | | | | | | | | | | | | | |
| |
| Simon Dingemans, | | | – | | | | – | | | | £660,000 | | | 4th January 2011 | | | – | |
| CFO Designate** | | | | | | | | | | | | | | | | | | | | |
| |
| Dr Moncef Slaoui, | | | $975,000 | | | 1st April 2010 | | | $1,125,000 | | | 1st April 2011 | | | 15 | |
| Chairman, R&D | | | | | | | | | | | | | | | | | | | | |
| |
| | |
| * | | Julian Heslop will retire from the Board on 31st March 2011 |
|
| ** | | Simon Dingemans joined the Board on 4th January 2011 |
Variable pay
A significant proportion of GSK’s total remuneration package (approximately 75% – 85%) is variable. There is a particular emphasis on long-term share-based incentives, in order to closely align Executives’ interests with those of shareholders.
The balance between the fixed (base salary) and variable (annual bonus and LTI) elements of remuneration varies depending on performance. The charts below show the anticipated mix between fixed and variable pay on an expected value basis under the current remuneration policy, excluding pensions. The actual mix may be higher or lower, depending on the performance of GSK and the individual.
CEO
CFO Designate
Chairman, R&D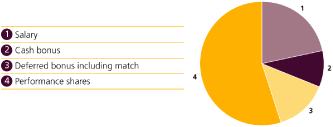
GSK Annual Report 20092010
7786
Remuneration Report
Safeguards and risk management
The Committee would not want to reward failure and views it as important that incentive payouts are only made in circumstances when performance outcome reflects genuine achievement against the original targets.
In addition, given the nature of GSK’s business and the increased focus on risk within the Group, the Committee has taken a number of steps to ensure that the design of incentive arrangements underpins effective risk management. The Chairman of the Audit & Risk Committee is a member of the Committee and provides input on the Audit & Risk Committee’s review of the Group’s performance and oversight on any risk factors relevant to remuneration matters considered by the Committee.
Under the annual bonus, each year the Committee reviews the ongoing financial impact of any prior year activities and the role of individual Executives in such activities, and the Committee may make appropriate adjustments to individual bonus awards to reflect those circumstances (the ‘clawback’ mechanism). The Committee ensures that where there has been continuity of Executive responsibility, between initiation of an adverse event and its emergence as a problem, the adverse event should be taken into account in assessing annual bonuses in the year the problem is identified. Accordingly, charges for legacy legal matters were excluded from the assessment of 2010 financial performance. This reflects the view of the Committee that current management was not responsible for these legal actions and that it should be supported in seeking to resolve these matters in the long term interests of shareholders.
Under the long-term incentive plans approved by shareholders in 2009, the Committee may reduce the grant or vesting levels if it determines that a participant has engaged in conduct which is contrary to the legitimate expectations of the company for an employee in the participant’s position.
There are also further safeguards relating to each of the business-specific performance measures under the long-term incentive plans which are outlined in detail on page 89.
In addition, from 2009, the Committee decided that long-term incentive awards for good leavers should normally vest at the end of the original vesting period set at grant, rather than vesting in the year of departure. This ensures continued alignment with shareholders’ interests following cessation of employment.
Annual bonus
The annualAnnual bonus is designed to drive the achievement of GSK’s annual financial and strategic business targets as well asand delivery of personal objectives.
For 20102011 the on-target bonus for the Executive Directors is given in the table below.
| | | | | |
| |
| | �� | On-target bonus as a % of base salary | |
| |
| Andrew Witty, CEO | | | 125125% | % |
| Simon Dingemans, CFO Designate | | | 8080% | % |
| Dr Moncef Slaoui, Chairman, R&D | | | 8585% | % |
| | | |
Maximum bonuses are set by reference to individual on-target bonus levels. There is a cap on bonus payments of 200% of salary. ThatThis cap remains unchanged for 2010.2011. Annual bonus is not pensionable.
Last year, the Committee revised the annual bonus plan to strengthen the alignment to the new business strategy (details of which are set out in pages 4 to 7) and budgeting process.
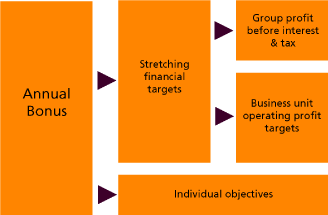
TheFor 2011, the majority of the annual bonus opportunity is based on a formal review of performance against stretching financial targets based on Group profit before interest and tax and business unit operating profit targets, with the remainder being based on achievements against specific individual objectives. There is a significant weighting towards the financial performance measures. The Committee has decided that profit should remain the key financial metric as one of the company’s Key Performance Indicators. However, during 2011, the Committee intends to review the annual bonus plan to ensure the strategic alignment of GSK’s short-term incentives.
Annual bonuses are calibrated to reflect the stretching targets which have been established to drive significant changes to GSK’s business model. The bonus threshold will be 90% of target with the maximum being payable for achievement of 110% of target. The bonus threshold of 90% reflects the stretching nature of the bonus targets.
Bonus targets for the CEOAndrew Witty are set by the Board.Board in January each year. In setting the objectives for the CEO,Andrew Witty, the Board focuses on the strategies that have been developed for the company, which are set out on pages 4 topage 7 of the Annual Report. For reasons of commercial sensitivity, the specific objectives are kept confidential. Following the end of the financial year, the Board reviews the CEO’shis performance generally and against the set objectives, and the Committee then determines the bonus payable.
For the other Executives, the CEOAndrew Witty sets their objectives in line with company strategy, and makes recommendations to the Committee regarding performance against their objectives.those objectives at the end of the year. These recommendations are then considered by the Committee when determining the level of bonuses payable.
Each year, the Committee reviews the ongoing financial impact of any prior year activities and the role of individual Executives in such activities, and the Committee may make appropriate adjustments to individual bonus awards to reflect those circumstances. The Chairman of the Audit & Risk Committee is a member of the Committee and provides input on the Audit & Risk Committee’s review of the Group’s performance. No such adjustments were made in respect of bonuses for 2009.
Bonus measures for R&D employees, including Dr Moncef Slaoui, are linked to the pipeline. A robust governance structure has been established to ensure that the bonus payable fairly reflects R&D productivity and performance as well as performance against profit targets. This process requires the review of progress against targets by the R&D Bonus Compensation Review Committee, which includes the CEOAndrew Witty and the company’s two Non-Executive Directors who are designated as Scientific Experts, Professor Sir Roy Anderson and Dr Daniel Podolsky. The Committee reviewed the planplan’s operation during the year and decided that it should continue as the annual bonus for R&D. The Committee will continue to keep its operation under review and may in future consider extending it to other Executives including the CEO.
2009 bonus awards
The objectives set for the company for 2009 focused in particular on the continued development and launch of late stage pipeline assets, delivery of commercial targets and execution of restructuring programmes to simplify the operating model.
The Committee took into account GSK’s success in achieving the above objectives, as well as each individual’s performance, when determining the bonus awards for 2009. Actual bonus payments for Executive Directors are shown on page 83 and ranged from 115% to 200% of base salaries as at 31st December 2009.
The bonuses set by the Committee reflect GSK’s increased sales, profit and cash flow performance during the year, in challenging market conditions, and with significant loss of sales to generics in the USA. It also includes the achievement of key strategic and individual objectives, including:
• | | delivering continued growth of the vaccine portfolio |
|
• | | further geographic diversification, particularly within emerging markets and consumer healthcare |
|
• | | achieving key milestones in the transformation of R&D productivity, particularly in relation to the late stage R&D pipeline products |
|
• | | simplification of GSK’s business model and achievement of operational efficiencies. |
review.GSK Annual Report 20092010
7887
Remuneration Report
Deferred annual bonus plan
A new Deferred Annual Bonus Plan was introduced in 2009 to encourage long-term shareholding, to discourage excessive risk taking and to help drive long-term shareholder returns relative to other global pharmaceutical companies.
Eligibility for the 2009 bonus year was restricted to the CEO and CFO, but all CET members will be invited to participate from the 2010 bonus year onwards, as part of the simplification of the CET remuneration structure.
Up to 50% of any annual bonus earned may be deferred for three years. The company will match shares up to one-for-one depending on the company’s relative TSR over this period. The performance measure and vesting schedule will be consistent with the three-year TSR component of the Performance Share Plan described below.
The CEO has elected to participate in GSK’s Deferred Annual Bonus plan in respect of his bonus for 2009. As a result, 15% of the CEO’s bonus has been deferred into 24,291 shares in the company, and a matching award of the same number of shares has been made which may vest in February 2013 subject to the company’s relative TSR performance and his continued employment.
Dividend equivalents will accrue and be delivered in respect of any deferred shares and matching shares that vest.
Long-term incentive plans
New LTIAwards are now made to Executives under the following long-term incentive plans, which were approved by shareholders at the 2009 AGM.AGM:
To provide better alignment to UK market practice, in 2009(a) Deferred Annual Bonus Plan
(b) Performance Share Plan
From 2010, awards under the CEO and the CFO did not receive share option grants.plan are no longer granted to Executives. Instead, their LTIs were only in the form of performance shares. They also had the opportunity to defer part of any bonus earned into shares, and as outlined above, to be eligible toCET members receive matching shares subject to the achievement of additional performance conditions. The Chairman, Research & Development continued to receive share options in 2009,awards and was notare also eligible to participate in the new deferred annual bonus arrangement. However, from 2010 onwards the remuneration arrangements of all CET members (including the Chairman, Research & Development) have been aligned with those of the CEO and CFO. As a result, share options will normally no longer be granted. Instead, CET members will receive performance share awards.
Under the new LTI plans, the Committee may reduce the grant or vesting levels if it determines that a participant has engaged in conduct which is contrary to the legitimate expectations of the company for an employee in the participant’s position.Deferred Annual Bonus Plan.
Typically, awards are delivered to US resident executives in the form of ADS. Awards are delivered in the form of Ordinary Shares to executives resident in the UK and other countries. All awards are made under plans which incorporate dilution limits consistent with the guidelines provided by the Association of British Insurers. Current estimated dilution from existing awards under all GSK employee share schemesplans made sinceover the merger islast 10 years are approximately 6.4%6.14% of the company’s issued share capital at 31st December 2009.2010.
The LTI plans are summarised in the relevant sections below together with the basis on which awards will be madeTo provide a closer link between shareholder returns and payments to the Executives, notional dividends are reinvested and paid out in 2010.
proportion to the shares deferred and vesting of awards. The value of reinvested dividends is incorporated into the benchmarking of award levels.Structure and performance measures
a) Deferred Annual Bonus Plan
The Deferred Annual Bonus Plan encourages long-term shareholding, discourages excessive risk taking and helps focus on GSK’s key strategic priorities.
Starting from the 2010 bonus year, all CET members have been eligible to participate in the plan.
Up to 50% of any annual bonus earned may be deferred for three years. The company will match shares up to one-for-one depending on the company’s performance against the measures outlined below during the three-year performance period.
b) Performance shares
The Performance Share Plan ensures focus on the delivery of GSK’s strategic priorities and long-term shareholder returns relative to other pharmaceutical companies andcompanies.
Under the Performance Share Plan, awards are made which vest at the end of a three-year performance period subject to the achievement of the company’s performance against the measures outlined below.
There is an individual award limit on the maximum initial value of performance shares that may be granted to an individual in any one year. Other than in exceptional circumstances, the maximum face value of performance shares that may be granted to an individual in any one year will be six times base salary.
The table below shows award levels in February 2011 for each Executive Director in line with that policy:
| | | | | | | | |
|
| | 2011 | | | 2011 award level | |
| | award | | | % of base salary | |
|
| Andrew Witty, CEO | | 424,448 shares | | | | 500% | |
| Simon Dingemans, | | 196,095 shares | | | | 350% | |
| CFO Designate | | | | | | | | |
| Dr Moncef Slaoui, | | 147,521 ADS | | | | 500% | |
| Chairman, R&D | | | | | | | | |
| | | | |
Performance measures
Following the appointment of Andrew Witty in 2008, the Board carried out a thorough review of GSK’s key strategic priorities, which are described on page 7 of the Annual Report. The Board firmly believes that the delivery of GSK’s strategic priorities.
Underthese objectives will transform GSK into an organisation that can deliver long-term financial performance and shareholder value creation on a sustainable basis. Over the plan, measurementlast few years, the focus of performancethe Committee has been broadened so thatto improve the most senior team is incentivised against operational measures alignedalignment of Executive remuneration arrangements with GSK’s business strategy as well as TSR. TSR remains an appropriate comparative measure since it focuses on the returnthese priorities to shareholders, is a well-understood and tested mechanismincentivise management to measure performance and allows comparison between companies operating in different countries. Therefore, typically a proportion of any award made to Executives will continue to be subject to relative TSR. The balance will be based on strategic or operational measures to support our business strategy. For 2009 and 2010 the emphasis has and will be on working capital and cash management.
There will be no retesting of performance.
2010 Awards
Performance share awards to Executives for 2010 were made in February 2010.
•TSR measuredeliver these goals.
For awards made to Executives in 2010, 60%February 2011, we have therefore introduced two new business-specific performance measures on business diversification and R&D new product performance. This is in addition to our adjusted free cash flow and relative TSR measures, and is in order to ensure that we have a balanced framework of measures focusing on all of GSK’s strategic objectives, as outlined in the diagram below.
The awards, which will vest subject to performance at the end of the award will bethree-year performance period beginning 1st January 2011 and ending on 31st December 2013, are based on four equally weighted measures: business diversification, R&D new product, adjusted free cash flow and relative TSR using a comparator group currently comprising 10 other global pharmaceutical companies. For this TSR element, the percentage vesting at median is 30%, with full vesting for upper quartile TSR performance. The graph below shows the TSR vesting schedule for awards granted in 2010.TSR.
Proportion vesting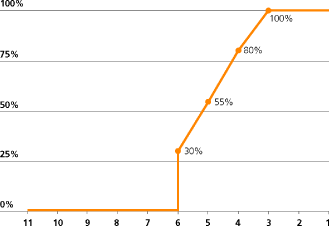
TSR rank position
To provide a focus on sustained longer-term performance,Details of the performance period was extendedmeasures, targets and the thresholds for allthe 2011 long-term incentive awards made from 2009 so that half ofare given in the TSR element of each award will be measured over three years and half over four years.
To measure performance on a stable basis and to reflect better the long-term nature of the pharmaceutical industry, the TSR averaging period is twelve months for awards made from 2009 onwards.following table.
GSK Annual Report 20092010
7988
Remuneration Report
| | | | | | | | | | | | | | |
Long- term incentive measures for 2011 awards | | | | % of
award | | | Vesting schedule for 2011 awards |
|
| | | | | | |
| Business diversification performance | | | | 25 | % | | | Due to commercial sensitivity, targets for business diversification and R&D new product measures will be disclosed along with outcomes in the 2013 Remuneration Report. |
| Incentivises growth of a global, diversified business | | | | | | | |
| | | | | | | | | | | | | |
|
| Designed to focus on our major growth areas: Vaccines, Consumer Healthcare, Emerging Markets and Japan (excluding Vaccines) and Dermatology businesses. | | | | | | | | | | Proportion of threshold
achieved | | Proportion of award
available |
| | | | | | | | | | Below threshold | | | 0 | % |
| Aggregate revenue target for four business divisions over three-year performance period reflects strong growth against previous periods and above market growth. | | | | | | | | | | Threshold
Maximum | | | 25
100 | %
% |
| | | | | | | |
|
| | | | | | |
R&D new product performance | | | | 25 | % | | | The target for maximum performance (expressed as a percentage of the threshold) for these two measures is shown below:
|
| Recognises importance of R&D to future business growth | | | | | | | | | | Measure
| | Maximum expressed
as % of threshold
|
| Revenue target based on New Product Sales to incentivise better R&D performance. | | | | | | | | | | Business | | | 114 | % |
| | | | | | | | | diversification | | | | |
New Products defined as products launched in performance period and two preceding years. Therefore, for 2011-13 performance period, products launched in years 2009-13 will be included in measurement. | | | | | | | | | |
R&D new product | | |
122 |
%
|
Aggregate three-year revenue target for 2011 awards for New Product Sales reflects growth on historic performance. | | | | | | | | | | | | | | |
| | | | | | |
Adjusted free cash flow | | | | 25 | % | | | | |
Three year
adjusted free
cash flow targets | |
% vesting |
| Recognises importance of effective working capital and cash management | | | | | | | | Below threshold
Threshold | | £16.15 billion | | |
0
25 | %
% |
| | | | | | | | | | £16.65 billion | | | 50 | % |
| | | | | | | | | | £18.32 billion | | | 75 | % |
| | | | | | | | Maximum | | £19.15 billion | | | 100 | % |
| | | | | | | |
|
| | | | | | |
Relative TSR | | | | 25 | % | | | | | | | | | |
Focuses on delivery of value to shareholders
Relative TSR using a comparator group comprising 10 global pharmaceutical companies.
With move to four complementary measures, relative TSR now measured over three years in line with performance period for all other performance measures.
To measure performance on a stable basis and better reflect long-term nature of pharmaceutical industry, twelve-month averaging period is used for relative TSR.
| | | | | | | | 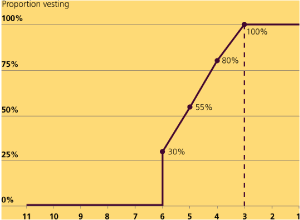 |
|
| | | | | | | |
TSR
rank position
| |
Median
performance
| |
Upper quartile
performance |
GSK Annual Report 2010
89
Remuneration Report
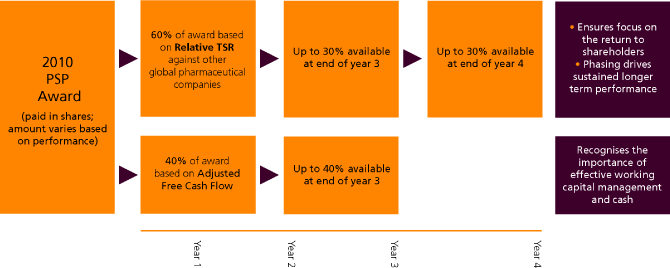
The Board believes that the current strategic priorities are fundamental long-term objectives. However, it recognises the possibility that these goals may evolve over time. Therefore the Committee intends to review the long-term incentive performance measures periodically to ensure that they remain appropriate.
•AdjustedInevitably measures linked directly to strategy are very sensitive. In particular, the Committee does not consider it appropriate to disclose the targets for business diversification and R&D new product performance at grant, as it may result in competitive harm. However, we are committed to fully disclosing the targets at the end of the performance period, together with details of the extent to which the performance targets have been met. In addition, the Committee also commits to providing an update on achievement to date against the targets during the performance period.
In addition to setting robust targets, the Committee has also implemented a number of safeguards to ensure that targets are met in a sustainable way and that any performance outcome reflects genuine achievement against the original targets and therefore value for shareholders.
Under the business diversification and R&D new product measures, in the light of any significant event (including acquisitions and divestments), the Committee will review the target and payment scale and make any adjustments it considers appropriate to maintain the integrity of the original targets. In addition, the Committee reserves the right to reduce vesting levels if targets are achieved in a manner which undermines the overall health of the business.
The Committee will normally include the revenue from opportunistic events such as pandemics when assessing performance under the business diversification and R&D new product measures. It is recognised that a successful response to an event such as a pandemic can generate significant value for shareholders. Such responses usually require supply capacity and/or other resource to be diverted from other products. However, before including that revenue, the Committee must be satisfied that the decision to pursue the opportunistic revenue was clearly in the best interests of shareholder value creation and that otherwise the performance under the relevant measure was sufficiently positive. Ultimately, the Committee will expect management to have acted in a way which enhanced shareholder value.
Under the business diversification measure, where above market growth has not been achieved at the end of a performance period, the Committee will normally reduce the vesting levels.
It is part of the Group’s strategy to increase the return on its R&D investment. If the R&D new product revenue target is achieved, but the Committee determines that insufficient progress has been made during the measurement period in increasing the return on R&D investment, the Committee may reduce the level of vesting under the R&D new product measure.
Under the adjusted free cash flow measure,
To recognise the importance of effective working capital and cash management, the remaining 40% will vest subject to the achievement of adjusted free cash flow targets. The target may be adjusted for material factors which could distort free cash flow as a performance measure. These will typically include exchange rate movements and may also include legal and major taxation settlements and special pension contributions, which could materially distort this calculation. The impact of any acquisition or divestment will be quantified and adjusted for after the event. Major adjustments in the calculation will be disclosed to shareholders. For the awards in 2010, the targets are:
| | | | | | | | |
| | Adjusted free cash flow targets | | | % vesting |
| | | | | |
Threshold vesting | | £17.3 billion | | | | 25 | % |
| | £17.8 billion | | | | 50 | % |
| | £19.6 billion | | | | 75 | % |
Maximum vesting | | £20.5 billion | | | | 100 | % |
| | | | | |
Between the above points, vesting will be calculated on a straight-line basis. The element based on adjusted free cash flow will be measured over three years.
•Award values
There is an individual award limit on the maximum initial value of performance shares that may be granted to an individual in any one year. Other than in exceptional circumstances, the maximum face value of performance shares that may be granted to an individual in any one year will be six times salary. The value of performance share awards granted to the Executive Directors in 2010 is shown in the table below:
| | | | | | | | | |
| | | % of base | | | 2010 |
| | | salary | | | Award |
| | | | | | |
| CEO | | | 500% | | | | 415,454 | Shares |
| CFO | | �� | 400% | | | | 174,491 | Shares |
| Chairman, R&D | | | 500% | * | | | 130,627 | ADS |
| | | | | | |
| | |
* | | Adjusted from 2009 to reflect removal of share options. |
To provide a closer link between shareholder returns and payments to the Executives, notional dividends are reinvested and paid out in proportion to the vesting of the award. The value of reinvested dividends is incorporated into the benchmarking of award levels.
Vesting of 2007 Awards
The Committee reviewed performance of the performance share awards granted to the Executive Directors in February 2007, with the three-year performance period starting on 1st January 2007 and ending on 31st December 2009. The company ranked at the median of the revised comparator group and therefore 35% of the awards vested. The awards made to other senior executives in 2007 were dependent in part on TSR performance and in part on EPS performance. The EPS portion of those awards did not vest.
The vesting tables for recent performance share awards together with share option awards are shown on page 80.
b) Share options
As part of the remuneration review undertaken in 2008, it was decided that share options would no longer be granted to the CEO and CFO, to align their packages better with the UK market. As outlined above, it has since been decided to simplify the remuneration structure for all CET members, and so share options will normally no longer be granted to CET members from 2010 onwards.
Details of subsisting options, and the performance conditions attached to each grant, are provided in the audited section of this report.
Vesting of 2007 Awards
The performance conditions for the share option awards granted in 2007 were not met and, as a result, these awards lapsed.
c) Historical vesting for GSK’s LTIs
GSK’s LTI performance conditions continue to be challenging as is demonstrated by the table on page 80. TSR has been an important part of the LTI measures for many years. This measure has been retained under the current policy.
GSK Annual Report 2009
80
Remuneration Report
The following table shows the vesting levels of GSK’s performance share and share option awards to Executives since the remuneration review during 2003. A TSR vesting percentage of 0% indicates that GSK’s TSR performance was below the median of the comparator group for that performance period.
| | | | | | | | | | | |
| | | | | Performance Share | | | Share Option | |
| | | | | Plan | | | Plan | |
| | | | | Vesting | | | Vesting | |
| | | | | under TSR | | | under EPS | |
| | | Performance period | | measure % | | | measure % | |
| |
| 2003 | | 01/01/04 – 31/12/06 | | | 0 | | | | 100 | |
| 2004 | | 01/01/05 – 31/12/07 | | | 38.47 | | | | 100 | |
| 2006 | | 01/01/06 – 31/12/08 | | | 0 | | | | 50.7 | |
| 2007 | | 01/01/07 – 31/12/09 | | | 35 | | | | 0 | |
| | | | | | | | | |
| | | Average annual vesting | | | 18.37 | | | | 62.67 | |
| | | | | | | | | |
No award was made during 2005 due to a change in the award cycle.
Pensions
Pensions provide an important tool for creating a long-term culture and loyalty.
The Executives participate in GSK senior executive pension plans. The pension arrangements are structured in accordance with the plans operated for Executives in the country in which they are likely to retire. Details of individual arrangements for the Executive Directors are set out on page 89.100.
New Executives to GSK will be eligible for either a defined contribution scheme or a cash balance pension plan. Existing obligations under defined benefit schemes in the UK will continue to be honoured.
a) UK pension arrangements
The company currently operates a defined contribution plan, and legacy final salary plans which are closed to new entrants. Newly hired Executives in the UK will participate in the defined contribution plan.
During 20092010 the UK Government announced a series of changes to pensions, which will initially impact the pensions of approximately 600 executives80 people in GSK. The proposed pension legislation (if implemented in full) couldwill have significant negative consequences for UK executives and the effectiveness of pensions will be significantlymuch reduced. Pensions have been and continue to be an important tool for creating a long-term culture and promoting employee retention,retention. Therefore the Committee has decided that existing pension promises be honoured and therefore GSK is keepingpensions above the situation under active review.new limits be delivered via GSK’s existing unfunded scheme.
Executives participating in the defined contribution plan receive a company contribution of 15%–20% of base salary depending on grade. They will also have the opportunity to receive up to a further 5% in matched contributions in line with the policy for all other members of the pension plan.
The legacy final salary plans provide for up to two-thirds of final salary at age 60. For employees subject to the cap, benefits in excess of the cap are currently provided through unfunded arrangements. Under the legacy final salary plans, actuarial reduction factors apply where a participant leaves employment of his/her own accord before the age of 60.
If employment is terminated by the company other than for cause then, in the same way as for all other members of the legacy final salary plans, the reduction factors will not apply.
b) US pension arrangements
In the USA, GSK operates a US Cash Balance Plan which provides for an annual contribution and interest on the sum accumulated in the cash balance plan but with no contractual promise to provide specific levels of retirement income. The plan incorporates an Executive Pension Credit for senior US executives. Contribution rates under the plan range from 15% to 38% of base salary depending on grade. All current senior US executives are eligible for the Executive Pension Credit.
For capped employees in the USA, benefits above the cap are provided through an unfunded non-qualified plan.
GSK Annual Report 2010
90
Remuneration Report
Share ownership requirements
To align the interests of Executives with those of shareholders, Executives are required to build up and maintain significant holdings of shares in GSK over time.
Current share ownership requirements (SOR) are set out in the table below:
| | | | | |
|
| | | Share Ownership Requirement |
| |
| CEO | | 4 x base salary |
| Other Executive Directors | | 3 x base salary |
| CET members | | 2 x base salary |
| |
During the year, Mr Witty has been building up his shareholding by actively purchasing shares in the market. He has spent a total of £300,000 of after tax earnings since the publication of the last Annual Report to help build towards his SOR, in addition to the acquisition of shares through dividend reinvestment. He has also elected to participate in GSK’s Deferred Annual Bonus plan in respect of £300,000 (15%) of his 2009 pre-tax bonus. The resultant award of 24,291 deferred shares is included in Mr Witty’s SOR in the table below.
Shareholdings for the purpose of SOR as at 24th February 2010 were:
| | | | | | | | | | | | |
| | | Holding for | | | Holding for | | | |
| | | SOR purposes | | | SOR purposes | | | % increase in |
| | | (as at 31/12/08) | | | (as at 24/02/10) | | | shareholding |
| | | | | | | | | |
| Mr Witty | | | 73,753 | | | | 144,879 | | | | 96 |
| | | Ordinary shares | | | Ordinary shares | | | | |
| Mr Heslop | | | 47,750 | | | | 74,250 | | | | 55 |
| | | Ordinary shares | | | Ordinary shares | | | | |
| Dr Slaoui | | | 49,799 | | | | 95,836 | | | | 92 |
| | | Ordinary shares | | | Ordinary shares | | | | |
| | | | | | | | | |
Executives are required to continue to satisfy these shareholding requirements for a minimum of twelve months following retirement from the company to support the long-term nature of the business. Shareholdings for the purpose of SOR as at 25th February 2011 were:
| | | | | | | | | | | | | |
| | | | | | | | |
| | | Holding for | | | Holding for | | | | |
| | | Ordinary shares | | | Ordinary shares | | | | |
| | | for SOR purposes | | | for SOR purposes | | | % increase in | |
| | | as at 31/12/09 | | | as at 25/02/11 | * | | shareholding | |
| | | | | | | | |
| Andrew Witty | | | 91,472 | | | | 226,199 | | | | 147 | |
| Julian Heslop | | | 49,350 | | | | 92,182 | | | | 87 | |
| Simon Dingemans** | | | – | | | | 40,000 | | | | – | |
| Dr Moncef Slaoui | | | 66,938 | | | | 169,906 | | | | 154 | |
| | | | | | | | |
| | |
| * | | Shares to be sold for tax following the vesting of the 2008 PSP awards have been excluded. |
|
| ** | | The disclosure for Simon Dingemans is from the date he joined the Board on 4th January 2011. |
Other remuneration elements
The Executives participate in various all-employee share plans in either the UK or the USA.
The ShareSave planPlan and the ShareReward planPlan are UK HM Revenue & Customs approved plans open to all UK employees and UK-based Executive Directors on the same terms.
MrShareSave participants may save up to £250 a month from their net salary for a fixed term of three years and at the end of the savings period they have the option to buy GSK shares at a discount of 20% of the market price set at the launch of each plan. Andrew Witty and MrJulian Heslop are ShareSave members, of the ShareSave plan. Mr Witty and Mr Heslopeach contribute £250 a month into the plan.Plan. This provides them both with the option to buy shares at the end of the three-year savings periodperiod.
ShareReward participants can contribute up to £125 a month from their gross salary to purchase GSK shares and the company matches the number of GSK shares bought each month under this arrangement. The shares are held in line with the opportunity available to alltrust and if they are left there for five years, they can be removed free of UK employees.
GSK Annual Report 2009
81
Remuneration Report
Mrtax and national insurance contributions. Andrew Witty, Julian Heslop and Mr Heslop alsoSimon Dingemans each contribute £125 pera month to buy shares under the ShareReward plan. The company matches the number of shares bought each month.Plan.
The Executives also receive other benefits including healthcare (medical and dental), personal financial advice and life assurance. The cash value of the benefits received by the Executive Directors in 20092010 is shown on page 83.94. Dr Moncef Slaoui normally resides in the USA. He has been seconded to the UK for a two year period from 1st November 2010 to enable him to be closer to GSK Biologicals as he assumes operational responsibility for this business.
Variable pay — performance periods ended
31st December 2010
This section provides further details on performance
achieved under the company’s annual bonus and long-term
incentive plans for performance periods that ended on
31st December 2010.
Annual bonus
For 2010, the majority of the annual bonus was based on the achievement of financial targets (based on Group profit before interest and tax and on business unit operating profit) and individual performance. The achievement of additional operational efficiency goals was also taken into account in determining the 2010 annual bonus levels.
The objectives set for the company for 2010 focused in particular on the continued development and launch of late stage pipeline assets, delivery of commercial targets and execution of restructuring programmes to simplify the operating model.
Despite 2010 being a challenging year for GSK and the pharmaceutical industry due to the effect of generic competition in the USA, the rapid loss of sales ofAvandiafollowing regulatory decisions in the Autumn, US healthcare reform and significant legacy litigation costs, management achieved key financial and strategic objectives, including:
| • | | delivering underlying sales growth (excluding pandemic products,AvandiaandValtrex) |
|
| • | | strong sales performance in investment areas of the business, particularly Emerging Markets and Consumer Healthcare |
|
| • | | increasing R&D pipeline potential and achieving key milestones in the transformation of R&D productivity, particularly in relation to the late stage R&D pipeline products |
|
| • | | simplification of GSK’s business model, improved cash generation, before legal settlements, and achievement of operational efficiencies. |
Overall, the Committee took into account GSK’s success in achieving the above objectives, as well as each individual’s performance, when determining the bonus awards for 2010. However, because management did not fully achieve the group profit before interest targets that were set, bonuses were determined accordingly. Actual bonus payments for Executive Directors are shown on page 94 and ranged from 79% to 147% of base salaries as at 31st December 2010 (2009–115% to 200%).
| | | | | | | | | | | | | |
| | | | | | | | |
| | | Annual bonus | | | Annual bonus | | | | |
| | | 2010
000 | | | 2009
000 | | | % change | |
| | | | | | | | |
| Andrew Witty | | | £1,177 | | | | £2,000 | | | | (41 | ) |
| Julian Heslop | | | £417 | | | | £602 | | | | (31 | ) |
| Dr Moncef Slaoui | | | $1,434 | | | | $1,439 | | | | – | |
| | | | | | | | |
The following Executive Directors elected to participate in the Deferred Annual Bonus Plan in respect of 2010. Matching Awards may vest in February 2014, subject to their continued employment and achievement of the long-term incentive performance measures outlined on page 87 of the report.
| | | | | | | | | | | | |
| | | | | | | |
| Executive | | % of total bonus | | | Deferred Award | | | Matching Award | |
| | | | | | | |
| Andrew Witty | | 32% | | | 31,921 shares | | | 31,921 shares | |
| Dr Moncef Slaoui | | 50% | | | 18,756 ADS | | | 18,756 ADS | |
| | | | | | | |
GSK Annual Report 2010
91
Remuneration Report
Long-term incentive plans
Performance share plan – Vesting of 2008 Awards
The Committee reviewed the performance criteria of the performance share plan awards granted to the Executive Directors in 2008, with the three-year performance period starting on 1st January 2008 and ending on 31st December 2010. The company ranked at median position in the comparator group of 10 companies and therefore 35% of the awards vested.
The awards made to other senior executives in 2008 were dependent in part on relative TSR performance and in part on EPS performance. The EPS portion of those awards did not vest.
The vesting schedules for the 2008, 2009 and 2010 awards are shown on page 99.
Share options – Vesting of 2008 Awards
The share option awards granted to Executives in 2008 were based on EPS performance. The performance conditions for the 2008 awards were not met and, as a result, all these awards lapsed.
Historical vesting for GSK’s LTIs
GSK’s LTI performance conditions continue to be challenging as is demonstrated by the table below. Relative TSR has been an important part of the LTI measures for many years. This measure has been retained under the current remuneration policy.
The following table shows the vesting levels of GSK’s performance share and share option awards to Executives since 2003. A TSR vesting percentage of 0% indicates that GSK’s relative TSR performance was below the median of the comparator group for that performance period.
| | | | | | | | | | | | | |
| | | | | | | | |
| | | | | | | | Performance Share | | | Share Option | |
| | | | | | | Plan | | | Plan | |
| | | | | | | | |
| | | | | | | Vesting | | | Vesting | |
| | | | | | | under TSR | | | under EPS | |
| Performance period | | | measure % | | | measure % | |
| 2003 | | | 2004 - 2006 | | | | 0 | | | | 100 | |
| 2004 | | | 2005 - 2007 | | | | 38.47 | | | | 100 | |
| 2006 | | | 2006 - 2008 | | | | 0 | | | | 50.7 | |
| 2007 | | | 2007 - 2009 | | | | 35 | | | | 0 | |
| 2008 | | | 2008 - 2010 | | | | 35 | | | | 0 | |
| | | | | | | | |
| | | Average annual vesting | | | | 21.69 | | | | 50.14 | |
| | | | | | | | | | |
No award was made during 2005 due to a change in the award cycle.
Executive Director terms and conditions
Executive Director contracts
The policy set out below provides the framework for contracts for Executive Directors.
| | | |
| | | |
Notice period on
termination by the
employing company or
executive | | 12 calendar months |
| | | |
| Termination payment | | 1 x annual salary |
| | 1 x annual on-target bonus* |
| | No mitigation required**
payable on termination
|
| | | |
| Vesting of LTIs | | Rules of relevant incentive plan, as approved by shareholders |
| | | |
| Pension | | Based on existing arrangements
and terms of the relevant pension plan |
| | | |
| Non-compete clause | | 12 months from termination notice date**date* |
| | | |
| | |
* | | The CEO has agreed an amendment to his contract to remove a contractual entitlement to bonus as part of his termination package. The contracts of new Executives will not normally include a bonus element in any termination payment. However, to the extent that the company imposes non-compete provisions and restricts the individual from working elsewhere, a compensatory payment may be made. |
|
** | | The ability to impose a 12-month non-compete period (and a non-solicitation restriction) on an Executive is considered important by the company in order to have the ability to protect the Group’s intellectual property and staff. In light of this, the Committee believes that it would not be appropriate to provide for mitigation in the contracts. |
In 2010, Andrew Witty and Dr Moncef Slaoui agreed an amendment to their contractual terms to remove an entitlement to bonus as part of their termination package. The contracts for new Executives will not normally include a bonus element in any termination payment.
The terms of the new contracts seek to balance commercial imperatives and best practice. Where the company considers it important that an individual does not work elsewhere during his notice period, it may make a compensatory payment in respect of bonus for the period of restraint.
Julian Heslop is retiring early from the company on 31st March 2011. Under the terms of his contract entered into in 2005, he is entitled to receive one year’s notice on termination and his payment will include one year’s annual salary and 12 months’ on-target bonus.
Simon Dingemans joined the Board on 4th January 2011 as CFO Designate, and will become the CFO on 1st April 2011 following Julian Heslop’s retirement. In line with the company’s policy going forward, Simon Dingemans’ contract provides for a termination payment based on one year’s base salary only.
GSK Annual Report 2010
92
Remuneration Report
The following table sets out the details of the Executive Directors’ service contracts:
| | | | | | | | | | | | | |
| Current Directors | | Date of contract | | | Effective date | | | Expiry date | |
| | | | | | | | | | |
| Mr A Witty* | | | 18.06.08 | | | | 22.05.08 | | | | 31.08.24 | |
| Mr J Heslop | | | 16.03.05 | | | | 01.04.05 | | | | 31.01.14 | |
| Dr M Slaoui | | | 16.05.06 | | | | 01.06.06 | | | | 01.08.19 | |
| | | | | | | | | | |
| | | | | | |
| | | | | | |
|
| Current Directors | | Date of contract | | Effective date | | Expiry date |
|
| Andrew Witty* | | 18th June 2008 | | 22nd May 2008 | | 31st August 2024 |
|
| Julian Heslop | | 16th March 2006 | | 1st April 2005 | | 31st January 2014 |
|
| Simon Dingemans | | 8th September 2010 | | 4th January 2011 | | 30th April 2028 |
|
| Dr Moncef Slaoui** | | 21st December 2010 | | 21st December 2010 | | 1st August 2019 |
|
| | | | | | |
| | |
| * | | MrAndrew Witty’s contract was renewed in June 2008 following his appointment as CEO, and was supplementedamended on 4th February 2010 to reflect the changes to his severance terms outlined above. |
|
| ** | | Dr Moncef Slaoui’s previous contract dated 16th May 2008 was replaced on 21st December 2010 to reflect the changes to his severance terms outlined above. |
No termination payments will be made in respect of any part of a notice period extending beyond the contract expiry date.
Other entitlements
In addition to the contractual provisions outlined above, in the event that Executive Directors’ service agreements are terminated by their employing company, the following will apply:
| • | | in the case of outstanding awards under the GlaxoSmithKline Annual Investment Plan (which was closed to new deferrals with effect from the first quarter of 2006) provided that their agreement is terminated other than for cause, the executive must exercise any Bonus Investment Rights within six months of termination to receive any deferred amount,amounts, and any income and gains, are automatically distributed as soon as administratively practicable after termination.gains; and |
| |
| • | | in line with the policy applicable to US senior executives, Dr Moncef Slaoui may become eligible, at a future date, to receive continuing medical and dental insurance after retirement. |
Following the merger, those participants in the legacy share option schemes who elected to exchange their legacy options for options over GlaxoSmithKlineGSK shares will receivereceived an additional cash benefit equal to 10% of the grant price of the original option. This additional benefit iswas triggered when the option iswas exercised or lapses.lapsed. To qualify for this additional cash benefit, participants had to retain their options until at least the second anniversary of the effective date of the merger. Following the payments made during 2010, there are no further payments due under this arrangement.
Outside appointments for Executive Directors
Any outside appointments must beare considered by the Nominations Committee to ensure they would not cause a conflict of interest and are then approved by the Chairman on behalf of the Board. It is the company’s policy that remuneration earned from such appointments may be kept by the individual Executive Director.
Chairman and Non-Executive Directors Non-Executive Director termsTerms and conditions
Non-Executive DirectorsSir Christopher Gent’s letter of GlaxoSmithKline do not have service contracts but instead have letters of appointment was dated 26th May 2004, under which it iswas agreed that theyhe would serve the company as a Non-Executive DirectorDeputy Chairman until 31st December 2004 and from 1st January 2005 as Chairman until the conclusion of the AGM following the third anniversary of theirhis appointment. In each case this can beThis was extended for a further term of three years by mutual agreement. Noagreement, with effect from his re-election as a Director at the AGM held on 21st May2008. This has been further extended for a period of five years subject to re-election with effect from 1st January 2011. (Further details are provided on page 68 of the Corporate Governance Report).
The terms of engagement of Non-Executive Directors serve a term longerother than three years without offering themselves forSir Christopher Gent, are also set out in letters of appointment. For all Non-Executive Directors, their initial appointment and any subsequent re-appointment are subject to election, and thereafter, periodic re-election by the shareholders.
The letters of appointment for Non-Executive Directors aredo not entitled tocontain provision for notice periods or for compensation if their appointment isappointments are terminated.
The following table shows the date of the initial letter of appointment of each Non-Executive Director:
| | | | | |
| | |
|
| Non-Executive Director | | Date of letter of appointment |
|
| Sir Christopher Gent | | 26th May 2004 |
| Professor Sir Roy Anderson | | 28th September 2007 |
| Dr Stephanie Burns | | 12th February 2007 |
| Larry Culp | | 9th June 2003 |
| Sir Crispin Davis | | 9th June 2003 |
| Sir Deryck Maughan | | 26th May 2004 |
| James Murdoch | | 26th February 2009 |
| Dr Daniel Podolsky | | 3rd July 2008 |
| Tom de Swaan | | 21st December 2005 |
| Sir Robert Wilson | | 9th June 2003 |
| | |
Chairman and Non-Executive Directors’ fees
The company aims to provide the Chairman and Non-Executive Directors with fees that are competitive with those paid by other companies of equivalent size and complexity subject to the limits contained in GSK’s Articles of Association.
The Chairman’s fees are currently £540,000 per annum plus an allocation of shares to the value of £135,000 per annum.
Non-Executive Directors’ fees applying at 31st December 2010 are as follows:
| | | | |
| | | | |
Professor Sir Roy Anderson |
| | Per annum | |
| | | 28.09.07 |
| |
Dr S BurnsStandard annual cash retainer fee | | | 12.02.07£75,000 | |
Mr L Culp |
Supplemental fees | | | 09.06.03 | |
Sir Crispin Davis |
| Chairman of Audit & Risk Committee | | | 09.06.03£80,000 | |
Sir Deryck Maughan |
| Senior Independent Director and Scientific/Medical Experts | | | 26.05.04£30,000 | |
Mr J Murdoch |
| Chairmen of the Remuneration and Corporate Responsibility Committees* | | | 26.02.09£20,000 | |
Dr D Podolsky |
Non-Executive Director undertaking
intercontinental travel to meetings | | | 03.07.06 | |
Mr T de Swaan | | | 21.12.05 | |
Sir Robert Wilson | | | 09.06.03 | |
Sir Ian Prosser* | | | 19.06.00 | |
Dr R Schmitz* | | | 19.06.00£7,500
per meeting | |
| | | | |
| | |
| * | | Sir Ian Prosser and Dr Ronaldo Schmitz retired fromChristopher Gent is the Board at the conclusioncurrent Chairman of the AGM on 20th May 2009.Corporate Responsibility Committee, but does not receive the additional fee listed above. |
GSK Annual Report 20092010
8293
Remuneration Report
Non-Executive Directors’ fees
The company aims to provide Non-Executive Directors with fees that are competitive with those paid by other companies of equivalent size and complexity. Fees applying at 31st December 2009 are as follows:
| | |
| | Per annum |
| | |
Standard annual cash retainer fee | | £75,000 |
| | |
Supplemental fees
| | |
| | |
Chairman of the Audit & Risk Committee | | £80,000 |
| | |
Senior Independent Director
and Scientific/Medical Experts | | £30,000 |
| | |
Chairman of the Remuneration and Corporate Responsibility Committee | | £20,000 |
| | |
Non-Executive Director undertaking
intercontinental travel to meetings | | £7,500
per meeting |
| | |
The Chairman is the current Chairman of the Corporate
Responsibility Committee, but does not receive the additional fee listed above.
To reflect the increased focus within the company on compliance and risk, GSK has significantly enlarged the remit and responsibilities of the Audit & Risk Committee, and the commitment required from Tom de Swaan, its Chairman. The company agreed that the time requirement for his role as Committee Chairman moving from approximately 30 days to approximately 80 days per annum should be reflected through an increase in the fees payable. Further details of the changes to the Committee’s terms of reference and the new Audit and Assurance model are given on pages 66 to 69.
Following an independent review, the supplemental fee for the Chairman of the Audit & Risk Committee was increased from £30,000 per annum to £80,000 per annum with effect from 1st October 2009.
Full details of the current Committee’s terms of reference and GSK’s Audit & Assurance model are given on pages 71 to 76.
In recent years there has been an increase in the time commitment, demands and responsibility placed on the role of a non-executive director, and this has generally led to an increase in their fees. As a result of these developments in the market, Non-Executive Director fees at GSK were independently reviewed during 2010. The review highlighted that there was scope to increase Non-Executive Director fees. However, in light of the current environment, the Board decided not to increase their fees at this time. They will continue to be kept under review.
Exchange rate
Fees that are paid in US dollars were converted at the following exchange rates:
| | | | | | | | | |
| | | | | | | |
|
| | | | | | Exchange rate | |
| Date of approval | | Period rate applied | | | £1/US$ |
| | | | | |
29.07.04 |
| 29th July 2004 | | | 01.10.04 – 31.03.08 | | | US $1.8162 | US$1.8162 | |
28.03.0828th March 2008 | | | 01.04.08 – 30.09.09 | | | US $1.9918 | US$1.9918 | |
03.12.09*3rd December 2009* | | | 01.10.09 – 31.12.09 | | | US $1.6395 | US$1.6395 | |
| | | | 01.01.10 – 31.12.10 | | | US $1.6326 | US$1.6326 | |
| | | 01.01.11 – 31.12.11 | | | | US$1.5798 | |
|
| | | | | | |
| | |
| * | | Given the recent fluctuations in the Sterling: US dollar exchange rate;rate, it was agreed that with effect from 1st October 2009 the exchange rate would be set annually based on the average daily rate for the last quarter of the year prior to payment. The rate would be reviewed if exchange rates moved significantly during the year. |
Non-Executive Directors’ share allocation plan
To enhance the link between Directors and shareholders, GSK requires Non-Executive Directors to receive a significant part of their fees in the form of shares. At least 25% of the Non-Executive Directors’ total fees, excluding the Chairman, are paid in the form of shares or ADS and allocated to a share account. The Non-Executive Directors may also take the opportunity to invest part or all of the balance of their fees into the same share account.
The shares or ADS which are notionally awarded to the Non-Executive Directors and allocated to their interest accounts are included within the Directors’ interests tables on page 85.96. The accumulated balance of these shares or ADS, together with notional dividends subsequently reinvested, are not paid out to the Non-Executive Directors until retirement from the Board. Upon retirement, the Non-Executive Directors will receive either the shares or ADS or a cash amount equal to the value of the shares or ADS at the date of retirement.retirement or date of payment if later.
Chairman
Sir Christopher Gent’s letter of appointment to the Board was dated 26th May 2004, under which it was agreed that he would serve the company as Deputy Chairman until 31st December 2004 and from 1st January 2005 as Chairman until the conclusion of the AGM following the third anniversary of his appointment. This was extended for a further term of three years by mutual agreement, with effect from his re-election as a Director at the AGM held on 21st May 2008.
The Chairman’s fees are currently £540,000 per annum plus an allocation of shares to the value of £135,000 per annum.
TSR performance graph
The following graph sets out the performance of the company relative to the FTSE 100 Index of which the company is a constituent and to the pharmaceutical performance comparator group from 1st January 20042006 to 31st December 2009.2010. The graph has been prepared in accordance with the Regulations as defined on page 101 and is not an indication of the likely vesting of awards granted under any of the company’s incentive plans.
TSR performance
Directors and Senior Management remuneration
The following tables set out, for the Directors of GlaxoSmithKline plc, the remuneration earned in 2009, their interests in shares of GlaxoSmithKline plc, their interests in share options and incentive plans and their pension benefits. The members of the CET also participate in the same remuneration plans as the Executive Directors. The aggregate remuneration and interests of the Directors and Senior Management are also provided.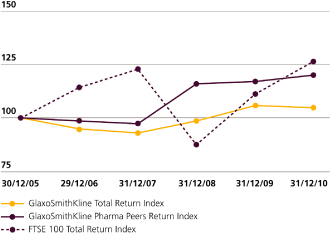
GSK Annual Report 20092010
8394
Remuneration Report
Annual remuneration
| | | | | | | | | | | | | | | | | | | | | | | | | | | | | | | | | | | | | | | | | | | | | | | | | | | | | | | | |
| | | 2009 | | 2008 | | | | | |
| | | Total | | Total | | | 2010 | | 2009 |
| | | Fees and | | Other | | Annual | | annual | | Fees and | | Other | | Annual | | annual | | | Total | | Total | |
| | | salary | | benefits | | bonus | | remuneration | | salary | | benefits | | bonus | | remuneration | | | Fees and | | Other | | Annual | | annual | | Fees and | | Other | | Annual | | annual | |
| | | Footnote | | 000 | | 000 | | 000 | | 000 | | 000 | | 000 | | 000 | | 000 | | | salary | | benefits | | bonus | | remuneration | | salary | | benefits | | bonus | | remuneration | |
| | | | | | | | | | | | | | | | | | | | |
| Footnote | | Footnote | | 000 | | 000 | | 000 | | 000 | | 000 | | 000 | | 000 | | 000 | |
| | |
Executive Directors | | |
| Mr A Witty | | a,b,c | | | £948 | | | £180 | | | £2,000 | | | £3,128 | | | £687 | | | £92 | | | £999 | | | £1,778 | | |
| Mr J Heslop | | b | | | £507 | | | £56 | | | £602 | | | £1,165 | | | £476 | | | £32 | | | £418 | | | £926 | | |
| Dr M Slaoui | | b,d | | | $865 | | | $507 | | | $1,439 | | | $2,811 | | | $805 | | | $405 | | | $942 | | | $2,152 | | |
| Andrew Witty | | | a,b,c,e | | | £1,000 | | | £126 | | | £1,177 | | | £2,303 | | | £948 | | | £89 | | | £2,000 | | | £3,037 | |
| Julian Heslop | | | a,b | | | £525 | | | £108 | | | £417 | | | £1,050 | | | £507 | | | £56 | | | £602 | | | £1,165 | |
| | |
| Dr Moncef Slaoui | | | c,d,e | | | $953 | | | $405 | | | $1,434 | | | $2,792 | | | $865 | | | $355 | | | $1,439 | | | $2,659 | |
| | |
| | | | | | | | | | | | | | | | | | | | | | | | | | | | | | | | | | | | | | | |
| | | |
Non-Executive Directors | | |
| Professor Sir Roy Anderson | | | £120 | | – | | – | | | £120 | | | £116 | | – | | – | | | £116 | | | | £128 | | – | | – | | | £128 | | | £120 | | – | | – | | | £120 | |
| Sir Crispin Davis | | | £102 | | – | | – | | | £102 | | | £86 | | – | | – | | | £86 | | | | £118 | | – | | – | | | £118 | | | £102 | | – | | – | | | £102 | |
| Sir Christopher Gent | | | £675 | | | £5 | | – | | | £680 | | | £650 | | | £1 | | – | | | £651 | | | | £675 | | | £2 | | – | | | £677 | | | £675 | | | £5 | | – | | | £680 | |
| Mr J Murdoch | | e | | | £54 | | – | | – | | | £54 | | – | | – | | – | | – | | |
| Mr T de Swaan | | | £133 | | – | | – | | | £133 | | | £116 | | – | | – | | | £116 | | |
| James Murdoch | | | f | | | £98 | | – | | – | | | £98 | | | £54 | | – | | – | | | £54 | |
| Tom de Swaan | | | | £177 | | | £1 | | – | | | £178 | | | £133 | | – | | – | | | £133 | |
| Sir Robert Wilson | | | £116 | | – | | – | | | £116 | | | £106 | | – | | – | | | £106 | | | | £128 | | – | | – | | | £128 | | | £116 | | – | | – | | | £116 | |
| |
| Dr S Burns | | | $188 | | – | | – | | | $188 | | | $194 | | – | | – | | | $194 | | |
| Mr L Culp | | | $188 | | – | | – | | | $188 | | | $179 | | – | | – | | | $179 | | |
| Dr Stephanie Burns | | | | $146 | | – | | – | | | $146 | | | $188 | | – | | – | | | $188 | |
| Larry Culp | | | | $135 | | – | | – | | | $135 | | | $188 | | – | | – | | | $188 | |
| Sir Deryck Maughan | | | $188 | | – | | – | | | $188 | | | $179 | | – | | – | | | $179 | | | | $147 | | – | | – | | | $147 | | | $188 | | – | | – | | | $188 | |
| Dr D Podolsky | | | $245 | | – | | – | | | $245 | | | $252 | | – | | – | | | $252 | | |
| Dr Daniel Podolsky | | | | $208 | | – | | – | | | $208 | | | $245 | | – | | – | | | $245 | |
| | |
| | | | | | | | | | | | | | | | | | | | | | | | | | | | | | | | | | | | | | |
| | | |
Former Directors | | |
| Dr M Barzach | | i | | | £80 | | – | | – | | | £80 | | | £71 | | – | | – | | | £71 | | |
| Mr J Coombe | | – | | | £2 | | – | | | £2 | | – | | | £3 | | – | | | £3 | | |
| Dr Michèle Barzach | | | g | | – | | – | | – | | – | | | £80 | | – | | – | | | £80 | |
| Sir Ian Prosser | | h | | | £48 | | | £5 | | – | | | £53 | | | £111 | | – | | – | | | £111 | | | h | | – | | – | | – | | – | | | £48 | | | £5 | | – | | | £53 | |
| Dr R Schmitz | | h | | | £37 | | | £5 | | – | | | £42 | | | £86 | | – | | – | | | £86 | | |
| Dr Ronaldo Schmitz | | | h | | – | | – | | – | | – | | | £37 | | | £5 | | – | | | £42 | |
| |
| Dr JP Garnier | | b | | – | | | $5,885 | | – | | | $5,885 | | | $756 | | | $1,586 | | | $759 | | | $3,101 | | |
| Dr L Shapiro | | f | | – | | – | | – | | – | | | $85 | | – | | – | | | $85 | | |
| Mr C Viehbacher | | b,g | | – | | – | | – | | – | | | $687 | | | $123 | | – | | | $810 | | |
| Dr T Yamada | | b | | – | | | $19 | | – | | | $19 | | – | | | $2,243 | | – | | | $2,243 | | |
| Dr Jean-Pierre Garnier | | | b | | – | | | $118 | | – | | | $118 | | – | | | $5,885 | | – | | | $5,885 | |
| | | | | | | | | | | | | | | | | | | | | | | | | | | | | | | | | | | | | | | |
| Total remuneration | | | £3,893 | | | £4,363 | | | £3,525 | | | £11,781 | | | £4,201 | | | £2,483 | | | £2,336 | | | £9,020 | | | | £3,873 | | | £574 | | | £2,518 | | | £6,965 | | | £3,893 | | | £4,160 | | | £3,525 | | | £11,578 | |
| | | | | | | | | | | | | | | | | | | | | | | | | | | | | | | | | | | | | | | |
| | | |
| Analysed as: | | |
| Executive Directors | | | £2,009 | | | £561 | | | £3,525 | | | £6,095 | | | £1,598 | | | £343 | | | £1,926 | | | £3,867 | | | | £2,140 | | | £495 | | | £2,518 | | | £5,153 | | | £2,009 | | | £373 | | | £3,525 | | | £5,907 | |
| Non-Executive Directors | | | £1,719 | | | £5 | | – | | | £1,724 | | | £1,706 | | | £1 | | – | | | £1,707 | | | | £1,733 | | | £3 | | – | | | £1,736 | | | £1,719 | | | £5 | | – | | | £1,724 | |
| Former Directors | | | £165 | | | £3,797 | | – | | | £3,962 | | | £897 | | | £2,139 | | | £410 | | | £3,446 | | | – | | | £76 | | – | | | £76 | | | £165 | | | £3,782 | | – | | | £3,947 | |
| | | | | | | | | | | | | | | | | | | | |
| | | | | | | | | | | | | | | | | | | | |
| | |
| Total remuneration | | | £3,893 | | | £4,363 | | | £3,525 | | | £11,781 | | | £4,201 | | | £2,483 | | | £2,336 | | | £9,020 | | | | £3,873 | | | £574 | | | £2,518 | | | £6,965 | | | £3,893 | | | £4,160 | | | £3,525 | | | £11,578 | |
| | | | | | | | | | | | | | | | | | | | |
| | | | | | | | | | | | | | | | | | | | |
Remuneration for Directors on the US payroll is reported in Dollars. Dollar amounts are included in the totals based on conversion to Sterling at the average exchange rates for each year.
| | |
Remuneration for Directors on the US payroll is reported in Dollars. Dollar amounts are included in the totals based on conversion to Sterling at the average exchange rates for each year. |
|
| a) | | MrAndrew Witty joined the Board on 31st January 2008 and his remuneration is disclosed from this date.Julian Heslop both participate in Salary Sacrifice schemes. |
| |
| b) | | Following the merger, and in order to encourage employees to convert their non-savings related options held over legacy shares or ADS for options over GlaxoSmithKline shares or ADS, employees were granted an additional cash benefit equal to 10% of the grant price of the original option. This additional benefit, known as the Exchange Offer Incentive, (EOI), iswas only payable when the new option iswas exercised or lapseslapsed underwater. To qualify for this additional cash benefit, participants had to retain these options until at least the second anniversary of the effective date of the merger. During the year, MrAndrew Witty received £49,499 (2008£93,002 (2009 – £9,374), Mr£49,499) and Julian Heslop received £32,000 (2008£89,936 (2009 – £14,499) and£32,000). Dr SlaouiJean-Pierre Garnier received $32,281$5,512,369 in 2009 as a result of options granted to themhim in 1999 lapsing. Dr Garnier received $5,512,369 (2008 – $1,227,599), Mr Viehbacher received $nil (2008 – $50,744) and Dr Yamada received $nil (2008 – $2,225,018) as a result of options granted to them in 1999 lapsing.No further payments will be made. |
| |
| c) | | MrAndrew Witty hasand Dr Moncef Slaoui have elected to participate in GSK’s Deferred Annual Bonus planPlan in respect of his bonus fortheir 2010 bonuses. Andrew Witty also participated in 2009 as described on page 78.(Dr Moncef Slaoui was not eligible to participate in that year). |
| |
| d) | | Dr Moncef Slaoui is a Non-Executive Director of the Agency for Science, Technology and Research (A*STAR) in respect of which he received $3,951 (2008$1,005 (2009 – $3,961)$3,951) during 20092010 which is not included above. |
| |
| e) | | MrOther benefits in 2009 for Andrew Witty and Dr Moncef Slaoui have been restated to reflect certain elements of remuneration no longer being deemed a benefit. |
|
| f) | | James Murdoch was appointed to the Board with effect from 20th May 2009. |
| |
f)g) | | Dr Shapiro retired from the Board on 17th May 2006 and stepped down as a member of GSK’s Scientific Advisory Board on 21st July 2008. During 2008 sheMichele Barzach received fees of $85,000 of which $30,000 was in the form of ADS.€nil (2009 – €89,700) from GSK France for healthcare consultancy provided. These are included within fees and salary above. |
|
g) | | Mr Viehbacher was appointed to the Board on 31st January 2008 and his remuneration is disclosed from this date. He resigned from the Board on 8th September 2008 and left the company on 31st December 2008.above, |
| |
| h) | | Sir Ian Prosser and Dr RRonaldo Schmitz retired as Non-Executive Directors of the company on 20th May 2009. On leaving the Board both Sir Ian Prosser and Dr RRonaldo Schmitz received the accumulated balance of shares previously awarded under the Non-Executive Directors’ share arrangements based on the then current share price.
This differs from the value asprice at the datespayment date. A final payment in respect of allocationthe balance for Sir Ian Prosser was made during 2010. Further details are as set out in the table on page 85.96. These are not included within fees and salaries above. |
|
i) | | Dr Barzach received fees of €89,700 (2008 – €89,700) from GlaxoSmithKline France for healthcare consultancy provided. These are included within fees and salary above. |
|
None of the above Directors received reimbursement for expenses during the year requiring separate disclosure as required by the Regulations. |
None of the above Directors received reimbursement for expenses during the year requiring separate disclosure as required by the Regulations.
GSK Annual Report 2009
2010
8495
Remuneration Report
Non-Executive Directors’ remunerationfees
| | | | | | | | | | | | | | | |
| | | | | | | | | | | | | | | |
| | | | | | | | | | | | | | | |
| | | 2009 | | 2008 | | | 2010 | | | | 2009 | |
| | | Total | | Cash | | Shares/ADS | | Total | | Cash | | Shares/ADS | | | Total | | Cash | | Shares/ADS | | Total | | Cash | | Shares/ADS | |
| Fees | | 000 | | 000 | | 000 | | 000 | | 000 | | 000 | | | 000 | | 000 | | 000 | | 000 | | 000 | | 000 | |
| | | | | | | | | | | | | | | |
Current Non-Executive Directors | | |
| Professor Sir Roy Anderson | | | £120 | | | £90 | | | £30 | | | £116 | | | £87 | | | £29 | | | | £128 | | | £96 | | | £32 | | | £120 | | | £90 | | | £30 | |
| Sir Crispin Davis | | | £102 | | – | | | £102 | | | £86 | | – | | | £86 | | | | £118 | | – | | | £118 | | | £102 | | – | | | £102 | |
| Sir Christopher Gent | | | £675 | | | £540 | | | £135 | | | £650 | | | £520 | | | £130 | | | | £675 | | | £540 | | | £135 | | | £675 | | | £540 | | | £135 | |
| Mr J Murdoch | | | £54 | | | £40 | | | £14 | | – | | – | | – | | |
| Mr T de Swaan | | | £133 | | | £99 | | | £34 | | | £116 | | | £87 | | | £29 | | |
| James Murdoch | | | | £98 | | – | | | £98 | | | £54 | | | £40 | | | £14 | |
| Tom de Swaan | | | | £177 | | | £133 | | | £44 | | | £133 | | | £99 | | | £34 | |
| Sir Robert Wilson | | | £116 | | | £87 | | | £29 | | | £106 | | | £79 | | | £27 | | | | £128 | | | £96 | | | £32 | | | £116 | | | £87 | | | £29 | |
| Dr S Burns | | | $188 | | | $141 | | | $47 | | | $194 | | | $97 | | | $97 | | |
| Mr L Culp | | | $188 | | | $141 | | | $47 | | | $179 | | – | | | $179 | | |
| | | |
| Dr Stephanie Burns | | | | $146 | | | $73 | | | $73 | | | $188 | | | $141 | | | $47 | |
| Larry Culp | | | | $135 | | – | | | $135 | | | $188 | | | $141 | | | $47 | |
| Sir Deryck Maughan | | | $188 | | | $141 | | | $47 | | | $179 | | – | | | $179 | | | | $147 | | – | | | $147 | | | $188 | | | $141 | | | $47 | |
| Dr D Podolsky | | | $245 | | | $184 | | | $61 | | | $252 | | | $126 | | | $126 | | |
| Dr Daniel Podolsky | | | | $208 | | | $52 | | | $156 | | | $245 | | | $184 | | | $61 | |
| | | | | | | | | | | | | | | |
| | | | | | | | | | | | | | | |
Former Non-Executive Directors | | |
| Sir Ian Prosser | | | £48 | | | £31 | | | £17 | | | £111 | | | £56 | | | £55 | | | – | | – | | – | | | £48 | | | £31 | | | £17 | |
| Dr R Schmitz | | | £37 | | | £26 | | | £11 | | | £86 | | | £51 | | | £35 | | |
| Dr Ronaldo Schmitz | | | – | | – | | – | | | £37 | | | £26 | | | £11 | |
| | | | | | | | | | | | | | | | | | | | | | | | | | | |
| Total Remuneration | | | £1,804 | | | £1,302 | | | £502 | | | £1,706 | | | £1,001 | | | £705 | | | | £1,733 | | | £945 | | | £788 | | | £1,804 | | | £1,302 | | | £502 | |
| | | | | | | | | | | | | | | | | | | | | | | | | | | |
The table above sets out the remuneration received as Non-Executive Directors of the company.
Non-Executive Directors are required to take at least a part of their total fees in the form of shares allocated to a share account which is not paid out until retirement from the Board (see page 8293 for further details). The total value of these shares and ADS as at the date of award, together with the cash payment, forms their total fees, which are included within the Annual remuneration table under ‘Fees and salary’. The table above sets out the value of their fees received in the form of cash and shares and ADS.
The table below sets out the accumulated number of shares and ADS held by the Non-Executive Directors in relation to their fees received as Board members as at 31st December 2009,2010, together with the movements in their accounts over the year.
| | | | | | | | | | | | | |
| | | | | | | | | | | | | | | | | |
| | | Number of shares and ADS | |
| | | | | Allocated | | Dividends | | | | | | | Number of shares and ADS | |
| Non-Executive Directors’ share arrangements | | Footnote | | At 31.12.08 | | & elected | | reinvested | | Paid out | | At 31.12.09 | | | 31st December 2009 | | Allocated
& elected | | Dividends
reinvested | | Paid out | | 31st December 2010 | |
| | | | | | | | | | | | | | | |
Current Non-Executive Directors | | |
Shares | | |
| Professor Sir Roy Anderson | | 3,001 | | 2,578 | | 151 | | – | | 5,730 | | | 5,730 | | 2,585 | | 305 | | – | | 8,620 | |
| Sir Crispin Davis | | 32,683 | | 8,725 | | 1,501 | | – | | 42,909 | | | 42,909 | | 9,527 | | 2,206 | | – | | 54,642 | |
| Sir Christopher Gent | | a | | 39,589 | | 11,614 | | 1,822 | | – | | 53,025 | | | 53,025 | | 11,006 | | 2,709 | | – | | 66,740 | |
| Mr J Murdoch | | b | | – | | 1,075 | | 2 | | – | | 1,077 | | |
| Mr T de Swaan | | 5,784 | | 2,891 | | 277 | | – | | 8,952 | | |
| James Murdoch | | | 1,077 | | 7,896 | | 132 | | – | | 9,105 | |
| Tom de Swaan | | | 8,952 | | 3,605 | | 471 | | – | | 13,028 | |
| Sir Robert Wilson | | 9,221 | | 2,488 | | 424 | | – | | 12,133 | | | 12,133 | | 2,585 | | 623 | | – | | 15,341 | |
| | | |
ADS | | |
| Dr S Burns | | 3,645 | | 1,293 | | 158 | | – | | 5,096 | | |
| Mr L Culp | | 16,822 | | 1,293 | | 717 | | – | | 18,832 | | |
| Dr Stephanie Burns | | | 5,096 | | 1,984 | | 272 | | – | | 7,352 | |
| Larry Culp | | | 18,832 | | 3,609 | | 976 | | – | | 23,417 | |
| Sir Deryck Maughan | | 14,756 | | 1,293 | | 629 | | – | | 16,678 | | | 16,678 | | 3,917 | | 867 | | – | | 21,462 | |
| Dr D Podolsky | | 6,064 | | 1,689 | | 264 | | – | | 8,017 | | |
| Dr Daniel Podolsky | | | 8,017 | | 4,182 | | 436 | | – | | 12,635 | |
| | | |
Former Non-Executive Directors | | |
Shares | | |
| Sir Ian Prosser | | 30,802 | | 1,599 | | 1,308 | | 32,469 | | 1,240 | | | 1,240 | | – | | – | | 1,240 | | – | |
| Dr R Schmitz | | 23,519 | | 995 | | 997 | | 25,511 | | – | | |
| | | | | | | | | | | | | | | | | | | | | | | | | |
| | |
a) | | The Chairman receives an allocation of shares to the value of £135,000 per annum. |
|
b) | | Mr Murdoch was appointed to the Board with effect from 20th May 2009. |
GSK Annual Report 20092010
8596
Remuneration Report
The table below sets out the settlement of former Non-Executive Directors’ share arrangements on their leaving the Board:
| | | | | | | | | | | | | | | | | | | | | | | | | |
| | | | | | | | | | | | | | | | | |
| | | | | | | | | | | Value of | | | Value of | | | | | | | |
| | | | | | | Date of | | | awards on | | | awards on | | | Payments | |
| | Payments | |
| Footnote | | | leaving | | | allocation | | | leaving | | | in 2009 | |
| | | | | | | | | | | | | | in 2010 | |
| Sir Ian Prosser | | | a,b | | | | 20.05.09 | | | | £382,142 | | | | £356,644 | | | | £343,525 | |
Dr R Schmitz | | | a,c | | | | 20.05.09 | | | | £285,56615,767 | |
| | | | £269,906 | | | | £269,906 | |
| | | | | | | | | | | | | | |
| | |
| a) | | The changechanges in value of awards between allocation, leaving and leaving issubsequent payment are attributable to dividends re-investedreinvested and the change in the share price between the dates of award and dates of leaving.for each award. |
| |
| b) | | Awards to Sir Ian Prosser under the Non-Executive Directors’ share arrangements were partially settled in shares during 2009 with the balance of 1,240 shares to be settled in 2010. |
|
c) | | Awards to Dr R Schmitz under the Non-Executive Directors’ share arrangements were settled in cash during 2009. |
Directors’ interests
The following interests of the Directors of the company and their connected persons are shown in accordance with the FSA Listing Rules.
| | | | | | | | | | | | | | | | | | | | | | | | | | | | | |
| | | | | | | Shares | | | ADS | |
| | | | | | | | | | | | | 1st January | | | | | | | | | | |
| | | | | | | 19th February | | | 31st December | | | 2009 or date of | | | 19th February | | | 31st December | | | 1st January | |
| | | Footnote | | | 2010 | | | 2009 | | | appointment | | | 2010 | | | 2009 | | | 2009 | |
| | | | | | | | | | | | | | | | | | | |
Executive Directors | | | | | | | | | | | | | | | | | | | | | | | | | | | | |
| Mr A Witty | | | a | | | | 100,658 | | | | 91,472 | | | | 73,753 | | | | – | | | | – | | | | – | |
| Mr J Heslop | | | a | | | | 49,631 | | | | 49,350 | | | | 47,750 | | | | – | | | | – | | | | – | |
| Dr M Slaoui | | | b | | | | 61,402 | | | | 60,948 | | | | 48,636 | | | | 666 | | | | 592 | | | | 411 | |
| | | | | | | | | | | | | | | | | | | |
Non-Executive Directors | | | | | | | | | | | | | | | | | | | | | | | | | | | | |
| Professor Sir Roy Anderson | | | c | | | | 5,730 | | | | 5,730 | | | | 3,001 | | | | – | | | | – | | | | – | |
| Dr S Burns | | | c | | | | 44 | | | | 44 | | | | 44 | | | | 5,161 | | | | 5,161 | | | | 3,805 | |
| Mr L Culp | | | c | | | | – | | | | – | | | | – | | | | 18,832 | | | | 18,832 | | | | 16,822 | |
| Sir Crispin Davis | | | c | | | | 49,669 | | | | 49,669 | | | | 39,443 | | | | – | | | | – | | | | – | |
| Sir Christopher Gent | | | c | | | | 53,025 | | | | 53,025 | | | | 39,589 | | | | – | | | | – | | | | – | |
| Sir Deryck Maughan | | | c | | | | – | | | | – | | | | – | | | | 16,678 | | | | 16,678 | | | | 14,756 | |
| Mr J Murdoch | | | c,d | | | | 2,077 | | | | 2,077 | | | | – | | | | – | | | | – | | | | – | |
| Dr D Podolsky | | | c | | | | – | | | | – | | | | – | | | | 8,017 | | | | 8,017 | | | | 6,065 | |
| Mr T de Swaan | | | c | | | | 8,952 | | | | 8,952 | | | | 5,784 | | | | – | | | | – | | | | – | |
| Sir Robert Wilson | | | c | | | | 18,262 | | | | 18,262 | | | | 15,349 | | | | – | | | | – | | | | – | |
| | | | | | | | | | | | | | | | | | | |
| | | | | | | | | | | | | | | | | | | | | | | | | | | | | |
| | | | | | | | | | | | | | | | | | | | |
| | | | | | | Shares | | | ADS | |
| | | | | | | 24th February | | | 31st December | | | 1st January | | | 24th February | | | 31st December | | | 1st January | |
| Footnote | | | 2011 | | | 2010 | | | 2010 | | | 2011 | | | 2010 | | | 2010 | |
| |
Executive Directors | | | | | | | | | | | | | | | | | | | | | | | | | | | | |
| Andrew Witty | | | a,d | | | | 184,281 | | | | 151,213 | | | | 91,472 | | | | – | | | | – | | | | – | |
| Simon Dingemans | | | b | | | | 40,000 | | | | – | | | | – | | | | – | | | | – | | | | – | |
| Julian Heslop | | | a,d | | | | 76,900 | | | | 76,254 | | | | 49,350 | | | | – | | | | – | | | | – | |
| Dr Moncef Slaoui | | | c,d | | | | 59,622 | | | | 59,133 | | | | 60,948 | | | | 37,883 | | | | 18,459 | | | | 592 | |
| | | | | | | | | | | | | | | | | | | | |
| |
Non-Executive Directors | | | | | | | | | | | | | | | | | | | | | | | | | | | | |
| Professor Sir Roy Anderson | | | e | | | | 8,620 | | | | 8,620 | | | | 5,730 | | | | – | | | | – | | | | – | |
| Dr Stephanie Burns | | | e | | | | 44 | | | | 44 | | | | 44 | | | | 7,418 | | | | 7,418 | | | | 5,161 | |
| Larry Culp | | | e | | | | – | | | | – | | | | – | | | | 23,417 | | | | 23,417 | | | | 18,832 | |
| Sir Crispin Davis | | | e | | | | 61,402 | | | | 61,402 | | | | 49,669 | | | | – | | | | – | | | | – | |
| Sir Christopher Gent | | | e | | | | 66,741 | | | | 66,741 | | | | 53,025 | | | | – | | | | – | | | | – | |
| Sir Deryck Maughan | | | e | | | | – | | | | – | | | | – | | | | 21,462 | | | | 21,462 | | | | 16,678 | |
| James Murdoch | | | e | | | | 10,105 | | | | 10,105 | | | | 2,077 | | | | – | | | | – | | | | – | |
| Dr Daniel Podolsky | | | e | | | | – | | | | – | | | | – | | | | 12,635 | | | | 12,635 | | | | 8,017 | |
| Tom de Swaan | | | e | | | | 13,028 | | | | 13,028 | | | | 8,952 | | | | – | | | | – | | | | – | |
| Sir Robert Wilson | | | e | | | | 21,470 | | | | 21,470 | | | | 18,262 | | | | – | | | | – | | | | – | |
| | | | | | | | | | | | | | | | | | | | |
One GlaxoSmithKline ADS represents two GlaxoSmithKline shares. The interests of the above-mentioned Directors at 19th24th February 20102011 reflect the change between the year-end and that date.
| | |
| a) | | Includes shares purchased through the GlaxoSmithKline ShareReward Plan for MrAndrew Witty totalling 2,2162,577 at 31st December 20092010 (31st December 20082009 – 1,853)2,216) and 2,2812,628 shares at 19th24th February 20102011 and MrJulian Heslop totalling 2,2162,577 at 31st December 20092010 (31st December 20082009 – 1,853)2,216) and 2,2812,628 shares at 19th24th February 2010.2011. |
| |
| b) | | Simon Dingemans joined the Board on 4th January 2011. |
|
| c) | | Includes ADS purchased in the GlaxoSmithKline Stock Fund within the US Retirement Savings Plan and US Executive Supplemental Savings Plan. |
| |
c)d) | | The 2008 Performance Share Plan vesting conditions were approved on 24th February 2011, as detailed on page 91. However, the shares did not vest until 25th February 2011 and are not included in the totals above. |
|
| e) | | Includes shares and ADS received as part or all of their fees, as described under Non-Executive Directors’ share allocation plan on page 82.93. Dividends received on these shares and ADS were converted to shares and ADS as at 31st December 2009. |
|
d) | | Mr Murdoch was appointed to the Board with effect from 20th May 2009. His holdings are shown from that date.2010. |
GSK Annual Report 20092010
8697
Remuneration Report
Long-term Incentive plans
Share optionsoption plan awards
| | | | | | | | | | | | | | | | | | | | | | | | | | | | | | | | | |
| Options – Shares | | | | | | | | | | Granted | | | | | | | |
| | | Footnote | | | At 31.12.08 | | | Date of grant | | | Exercise period | | | Grant price | | | Number | | | Lapsed | | | At 31.12.09 | |
| | | | | | | | | | | | | | | | | | | | | | |
| Mr A Witty | | | | | | | 1,664,623 | | | | – | | | | – | | | | – | | | | – | | | | 114,921 | | | | 1,549,702 | |
| Mr J Heslop | | | a | | | | 1,020,361 | | | | 01.12.09 | | | | 01.12.12 – 31.05.16 | | | | £9.72 | | | | 933 | | | | 131,894 | | | | 889,400 | |
| Dr M Slaoui | | | b | | | | 170,712 | | | | – | | | | – | | | | – | | | | – | | | | 15,522 | | | | 155,190 | |
| | | | | | | | | | | | | | | | | | | | | | |
| | | | | | | | | | | | | | | | | | | |
| | | | | | | | | | | | | | | | | | | |
| Options – Shares | | | Granted | | | | | |
| | | | Footnote | | 31st December
2009 | | Date of grant | | Exercise period | | Grant price | | Number | | Lapsed | | 31st December
2010 | |
| | |
| Andrew Witty | | | 1,549,702 | | – | | – | | – | | – | | 259,200 | | 1,290,502 | |
| Julian Heslop | | | 889,400 | | – | | – | | – | | – | | 304,350 | | 585,050 | |
| Dr Moncef Slaoui | | | 155,190 | | – | | – | | – | | – | | 14,870 | | 140,320 | |
| | | | | | | | | | | | | | | | | | | |
| | | | | | | | | | | | | | | | | | | | | | | | | | |
| Options – ADS | | Granted | | | | | | | Granted | | | | | |
| | | At 31.12.08 | | Date of grant | | Exercise period | | Grant price | | Number | | Lapsed | | At 31.12.09 | | | | 31st December
2009 | | Date of grant | | Exercise period | | Grant price | | Number | | Lapsed | | 31st December
2010 | |
| Dr Moncef Slaoui | | | a | | 489,330 | | 22.02.10 | | 22.02.13 – 22.02.20 | | 37.32 | | 1,100 | | 168,695 | | 321,735 | |
| | | | | | | | | | | | | | | | | | | | | | | | | | | | | | | | | |
| Dr M Slaoui | | b | | 324,640 | | 17.02.09 | | 17.02.12 – 16.02.19 | | | $33.42 | | 164,690 | | – | | 489,330 | | |
| | | | | | | | | | | | | | | | |
| | |
| a) | | The grant of share options to Mr Heslop is in respect of his participation in the 2009 ShareSave plan. |
|
b) | | These details include the interests ofa change to Dr Slaoui’s connected person, who is also an employee of GSK. |
For those options outstanding at 31st December 2009,2010, the earliest and latest vesting and lapse dates for options above and below the market price for a GlaxoSmithKline share at the year-end are given in the table below.
| | | | | | | | | | | | | | | | | | | | | | | | | | | |
| Mr A Witty | | | | Weighted average | | | | | | | Vesting date | | | Lapse date | |
| | | | grant price | | | Number | | | earliest | | | latest | | | earliest | | | latest | |
| | | | | | | | | | | | | | | | |
| Options above market price | | vested | | | 16.29 | | | | 297,693 | | | | 25.02.03 | | | | 20.02.09 | | | | 24.02.10 | | | | 19.02.16 | |
| at year-end: | | unvested | | | 14.88 | | | | 195,500 | | | | 19.02.10 | | | | 19.02.10 | | | | 17.02.17 | | | | 17.02.17 | |
| | | | | | | | | | | | | | | | |
| Options below market price | | vested | | | 11.85 | | | | 385,500 | | | | 02.12.05 | | | | 30.11.07 | | | | 30.11.12 | | | | 01.12.14 | |
| at year-end: | | unvested | | | 11.63 | | | | 671,009 | | | | 18.12.11 | | | | 01.12.11 | | | | 31.05.12 | | | | 20.07.18 | |
| | | | | | | | | | | | | | | | |
| | | | | | | | | | | | | | | | | | | | | | | | | | | |
| Total share options as at 31st December 2009 | | | | | 12.99 | | | | 1,549,702 | | | | | | | | | | | | | | | | | |
| | | | | | | | | | | | | | | | |
| |
| Mr J Heslop | | | | Weighted average | | | | | | | Vesting date | | | Lapse date | |
| | | | grant price | | | Number | | | earliest | | | latest | | | earliest | | | latest | |
| | | | | | | | | | | | | | | | |
| Options above market price | | vested | | | 15.93 | | | | 286,717 | | | | 25.02.03 | | | | 20.02.09 | | | | 24.02.10 | | | | 19.02.16 | |
| at year-end: | | unvested | | | 14.88 | | | | 242,750 | | | | 19.02.10 | | | | 19.02.10 | | | | 17.02.17 | | | | 17.02.17 | |
| | | | | | | | | | | | | | | | |
| Options below market price | | vested | | | 11.90 | | | | 116,250 | | | | 27.10.06 | | | | 30.11.07 | | | | 25.10.13 | | | | 01.12.14 | |
| at year-end: | | unvested | | | 11.46 | | | | 243,683 | | | | 18.02.11 | | | | 30.11.12 | | | | 31.05.13 | | | | 16.02.18 | |
| | | | | | | | | | | | | | | | |
| | | | | | | | | | | | | | | | | | | | | | | | | | | |
| Total share options as at 31st December 2009 | | | | | 13.89 | | | | 889,400 | | | | | | | | | | | | | | | | | |
| | | | | | | | | | | | | | | | |
| |
| Dr M Slaoui | | | | Weighted average | | | Vesting date | | | Lapse date | |
| | | | grant price | | | Number | | | earliest | | | latest | | | earliest | | | latest | |
| | | | | | | | | | | | | | | | |
| Options above market price at year-end: | | vested | | | 14.68 | | | | 73,340 | | | | 20.02.09 | | | | 20.02.09 | | | | 19.02.16 | | | | 19.02.16 | |
| | | | | | | | | | | | | | | | |
| Options below market price at year-end: | | vested | | | 11.59 | | | | 81,850 | | | | 02.12.05 | | | | 30.11.07 | | | | 30.11.12 | | | | 01.12.14 | |
| | | | | | | | | | | | | | | | |
| | | | | | | | | | | | | | | | | | | | | | | | | | | |
| Total share options as at 31st December 2009 | | | | | 13.05 | | | | 155,190 | | | | | | | | | | | | | | | | | |
| | | | | | | | | | | | | | | | |
| | | | | | | | | | | | | | | | | | | | | | | | | | | |
| Options above market price at year-end: | | unvested | | | 51.38 | | | | 324,640 | | | | 19.02.10 | | | | 18.02.11 | | | | 17.02.17 | | | | 16.02.18 | |
| | | | | | | | | | | | | | | | |
| Options below market price at year-end: | | unvested | | | 33.42 | | | | 164,690 | | | | 17.02.12 | | | | 17.02.12 | | | | 15.02.19 | | | | 15.02.19 | |
| | | | | | | | | | | | | | | | |
| | | | | | | | | | | | | | | | | | | | | | | | | | | |
| Total ADS options as at 31st December 2009 | | | | | 45.33 | | | | 489,330 | | | | | | | | | | | | | | | | | |
| | | | | | | | | | | | | | | | |
| | | | | | | | | | | | | | | | | | | | | | | | | | | |
| | | | | | | | | | | | | | | | | | |
| | | | | Weighted average | | | | | | | Vesting date | | | Lapse date | |
| Andrew Witty | | | | grant price | | | Number | | | earliest | | | latest | | | earliest | | | latest | |
| Options above market price at year-end: | | vested | | | 15.26 | | | | 369,993 | | | | 29.03.04 | | | | 20.02.09 | | | | 28.03.11 | | | | 22.02.16 | |
| | | | | | | | | | | | | | | | | | | | |
| |
| Options below market price at year-end: | | vested | | | 11.39 | | | | 249,500 | | | | 02.12.05 | | | | 30.11.07 | | | | 30.11.12 | | | | 01.12.14 | |
| | | unvested | | | 11.63 | | | | 671,009 | | | | 18.02.11 | | | | 01.12.11 | | | | 31.05.12 | | | | 20.07.18 | |
| | | | | | | | | | | | | | | | | | | | |
| |
| Total share options as at 31st December 2010 | | | | | 12.62 | | | | 1,290,502 | | | | | | | | | | | | | | | | | |
| | | | | | | | | | | | | | | | | | | | |
| |
| | | | | | | | | | | | | | | | | | |
| | | | | Weighted average | | | | | | | Vesting date | | | Lapse date | |
| Julian Heslop | | | | grant price | | | Number | | | earliest | | | latest | | | earliest | | | latest | |
| Options above market price at year-end: | | vested | | | 15.59 | | | | 279,117 | | | | 29.03.04 | | | | 20.02.09 | | | | 28.03.11 | | | | 22.02.16 | |
| | | | | | | | | | | | | | | | | | | | | |
| |
| Options below market price at year-end: | | vested | | | 11.23 | | | | 62,250 | | | | 03.12.07 | | | | 03.12.07 | | | | 01.12.14 | | | | 01.12.14 | |
| | | unvested | | | 11.46 | | | | 243,683 | | | | 18.02.11 | | | | 30.11.12 | | | | 31.05.13 | | | | 16.02.18 | |
| | | | | | | | | | | | | | | | | | | | |
| |
| Total share options as at 31st December 2010 | | | | | 13.41 | | | | 585,050 | | | | | | | | | | | | | | | | | |
| | | | | | | | | | | | | | | | | | | | |
| |
| | | | | | | | | | | | | | | | | | |
| | | | | Weighted average | | | | | | | Vesting date | | | Lapse date | |
| Dr Moncef Slaoui | | | | grant price | | | Number | | | earliest | | | latest | | | earliest | | | latest | |
| Options above market price at year-end: | | vested | | | 14.68 | | | | 68,520 | | | | 20.02.09 | | | | 20.02.09 | | | | 23.02.16 | | | | 20.02.16 | |
| | | | | | | | | | | | | | | | | | | | |
| Options below market price at year-end: | | vested | | | 11.58 | | | | 71,800 | | | | 02.12.05 | | | | 03.12.07 | | | | 03.12.12 | | | | 01.12.14 | |
| | | | | | | | | | | | | | | | | | | | |
| Total share options as at 31st December 2010 | | | | | 13.09 | | | | 140,320 | | | | | | | | | | | | | | | | | |
| | | | | | | | | | | | | | | | | | | | |
| |
| Options above market price at year-end: | | vested | | | 56.92 | | | | 935 | | | | 27.07.09 | | | | 19.02.10 | | | | 25.07.16 | | | | 17.02.17 | |
| | | unvested | | | 44.75 | | | | 159,850 | | | | 18.02.11 | | | | 18.02.11 | | | | 16.02.18 | | | | 16.02.18 | |
| | | | | | | | | | | | | | | | | | | | |
| |
| Options below market price at year-end: | | unvested | | | 33.45 | | | | 160,950 | | | | 17.02.12 | | | | 21.02.13 | | | | 15.02.19 | | | | 20.02.20 | |
| | | | | | | | | | | | | | | | | | | | |
| |
| Total ADS options as at 31st December 2010 | | | | | 39.13 | | | | 321,735 | | | | | | | | | | | | | | | | | |
| | | | | | | | | | | | | | | | | | | | |
This includes those share options held by Dr Moncef Slaoui’s connected person, who is also an employee of GSK.
GSK Annual Report 20092010
8798
Remuneration Report
GSK granted share options to Executive Directors on an annual basis until 2009. The Directors hold these options under the various share option plans referred to in Note 42 to the financial statements, ‘Employee share schemes’. None of the Non-Executive Directors had an interest in any option over the company’s shares.
The table below sets out, for share options granted in respect of 2007 and 2008, the performance periods, the performance targets and whether or not the options have vested at 31st December 2009.2010.
| | | | | | | | | | | | | | | | | | | | | |
| | | | | | | | | | | | | | | | |
| | | | | | | | | | | | | | Performance target | |
| | | | | | | | | | | Vesting status | | | Annualised growth | | | Percentage of | |
| Grant | | Footnote | | | Performance period | | | at 31.12.0931st December 2010 | | | in EPS | | | award vesting | |
|
| February 2008 | | | a | | | | 2008 – 2010 | | | Unvested | | | > RPI + 6% | | | | 100% | |
| | | | | | | | | | | | | | | |
February 2007 | | | a | | | | 01.01.07 – 31.12.09 | | | Unvested | | | > RPI + 6% | | | | 100 | % |
February 2008 | | | | | | | 01.01.08 – 31.12.10 | | | Unvested | | | RPI + 5% | | | | 8383% | % |
| | | | | | | | | | | | | | | RPI + 4% | | | | 6767% | % |
| | | | | | | | | | | | | | | RPI + 3% | | | | 5050% | % |
| | | | | | | | | | | | | | | <RPI + 3% | | | | 00% | % |
| | | | | | | | | | | | | | | |
| | |
| a) | | The performance targets for these share options were not met, and as a result they lapsed on the third anniversary of the date of grant. |
The table below sets out, for share options granted in respect of 2009 and 2010 the performance period and targets.
| | | | | | | | | | | | | | | | | | | | |
| | | | | | | | | | | Performance target |
| | | | | | | Vesting status | | Annualised growth | | Percentage of |
Grant | | Performance period | | | at 31.12.09 | | in EPS | | award vesting |
| | | | | | | | | | | | | |
February 2009 – 50% of award | | | 01.01.09 – 31.12.11 | Performance target | |
| | | Unvested | | > RPI + 6% | | | 100 | % | | | Vesting status | | | Annualised growth | | | Percentage of | |
| Grant | | | | | | Performance period | | | at 31st December 2010 | | | in EPS | | | award vesting | |
|
| February 2009 – 50% of award | | | 01.01.09 | | | | 2009 – 31.12.122011 | | | Unvested | | | > RPI + 6% | | | | 100% | |
| February 2009 – 50% of award | | | | | | | 2009 – 2012 | | | Unvested | | | RPI + 5% | | | 85 | %85% | |
| | | | | | | | | | | | | | RPI + 4% | | | 65 | %65% | |
| | | | | | | | | | | | | | RPI + 3% | | | 30 | %30% | |
| | | | | | | | | | | | | | | <RPI + 3% | | | 0 | %0% | |
| | | | | | | | | | | | | | | | |
The highest and lowest closing prices during the year ended 31st December 20092010 for GlaxoSmithKline shares were £13.34£10.95 and £9.87,£13.40, respectively. The highest and lowest prices for GlaxoSmithKline ADS during the year ended 31st December 20092010 were $42.91$32.34 and $27.27,$42.97, respectively. The market price for a GlaxoSmithKline share on 31st December 20092010 was £13.20£12.40 (31st December 20082009 – £12.85)£13.20) and for a GlaxoSmithKline ADS was $42.25$39.22 (31st December 20082009 – $37.27)$42.25). The prices on 19th24th February 20102011 were £12.35£11.78 per GlaxoSmithKline share and $38.26$38.13 per GlaxoSmithKline ADS.
Performance Share Plan (PSP) awards
Performance share awards are made to Executive Directors on an annual basis. The Directors hold these options under the various PSP plans referred to in Note 42 to the financial statements.
| | | | | | | | | | | | | | | | | | | | | | | | | | | | | | | | | | | | | |
| Mr A Witty – Shares | | | | | | | | | | Market | | | | | | | | | | | | | | | | | | | Additional | | | | |
| | | | | | Number | | | price on | | | Vested | | | | | | | shares by | | | | |
| | | Unvested | | | granted in | | | date of | | | | | | | Market | | | | | | | | | | | dividends | | | Unvested | |
| Performance period | | at 31.12.08 | | | 2009 | | | grant | | | Number | | | price | | | Gain | | | Lapsed | | | reinvested | | | at 31.12.09 | |
| | | | | | | | | | | | | | | | | | | | | | | | | | | |
| 01.01.06 – 31.12.08 | | | 85,942 | | | | – | | | | £14.68 | | | | – | | | | – | | | | – | | | | 87,126 | | | | 1,184 | | | | – | |
| 01.01.07 – 31.12.09 | | | 91,821 | | | | – | | | | £14.88 | | | | – | | | | – | | | | – | | | | – | | | | 3,589 | | | | 95,410 | |
| 01.01.08 – 31.12.10 | | | 232,908 | | | | – | | | | £11.47 | | | | – | | | | – | | | | – | | | | – | | | | 9,102 | | | | 242,010 | |
| 01.01.08 – 31.12.10 | | | 63,443 | | | | – | | | | £12.21 | | | | – | | | | – | | | | – | | | | – | | | | 2,480 | | | | 65,923 | |
| 01.01.09 – 31.12.11 | | | – | | | | 470,809 | | | | £10.51 | | | | – | | | | – | | | | – | | | | – | | | | 5,337 | | | | 476,146 | |
| | | | | | | | | | | | | | | | | | | | | | | | | | | | |
| | | | | | | | | | | | | | | | | | | | | | | | | | | | | | | | | | | | | |
| Mr J Heslop – Shares | | | | | | | | | | Market | | | | | | | | | | | | | | | | | | | Additional | | | | |
| | | | | | Number | | | price on | | | Vested | | | | | | | shares by | | | | |
| | | Unvested | | | granted in | | | date of | | | | | | | Market | | | | | | | | | | | dividends | | | Unvested | |
| Performance period | | at 31.12.08 | | | 2009 | | | grant | | | Number | | | price | | | Gain | | | Lapsed | | | reinvested | | | at 31.12.09 | |
| | | | | | | | | | | | | | | | | | | | | | | | | | | |
| 01.01.06 – 31.12.08 | | | 111,613 | | | | – | | | | £14.68 | | | | – | | | | – | | | | – | | | | 113,150 | | | | 1,537 | | | | – | |
| 01.01.07 – 31.12.09 | | | 113,426 | | | | – | | | | £14.88 | | | | – | | | | – | | | | – | | | | – | | | | 4,433 | | | | 117,859 | |
| 01.01.08 – 31.12.10 | | | 108,690 | | | | – | | | | £11.47 | | | | – | | | | – | | | | – | | | | – | | | | 4,248 | | | | 112,938 | |
| 01.01.09 – 31.12.11 | | | – | | | | 197,740 | | | | £10.51 | | | | – | | | | – | | | | – | | | | – | | | | 2,242 | | | | 199,982 | |
| | | | | | | | | | | | | | | | | | | | | | | | | | | | |
| | | | | | | | | | | | | | | | | | | | | | | | | | | | | | | | | | | | | | | | | |
| | | | | | | | | | | | | | | | | | | | | | | | | | | | | | | |
| Andrew Witty – Shares | | | | | | | | | | | | | Vested | | | | | | | | | | | | | | |
| | | Unvested | | | | | | | Market price | | | | | | | | | | | | | | | | | | | Additional | | | Unvested | | | | |
| | | at 31st | | | Number | | | price on | | | | | | | | | | | | | | | | | | | shares by | | | at 31st | | | Number | |
| | | December | | | granted in | | | date of | | | | | | | Market | | | Vested | | | | | | | dividends | | | December | | | granted in | |
| Performance period | | 2009 | | | 2010 | | | grant | | | Number | | | price | | | Gain | | | Lapsed | | | reinvested | | | 2010 | | | 2011 | |
| |
| 2007 – 2009 | | | 95,410 | | | | – | | | | £14.88 | | | | 33,781 | | | | £12.09 | | | | 408,238 | | | | 62,735 | | | | 1,106 | | | | – | | | | – | |
| 2008 – 2010 | | | 242,010 | | | | – | | | | £11.47 | | | | – | | | | – | | | | – | | | | – | | | | 12,439 | | | | 254,449 | | | | – | |
| 2008 – 2010 | | | 65,923 | | | | – | | | | £12.21 | | | | – | | | | – | | | | – | | | | – | | | | 3,388 | | | | 69,311 | | | | – | |
| 2009 – 2011 | | | 476,146 | | | | – | | | | £10.51 | | | | – | | | | – | | | | – | | | | – | | | | 24,471 | | | | 500,617 | | | | – | |
| 2010 – 2012 | | | – | | | | 415,454 | | | | £12.04 | | | | – | | | | – | | | | – | | | | – | | | | 10,327 | | | | 425,781 | | | | – | |
| 2011 – 2013 | | | – | | | | – | | | | – | | | | – | | | | – | | | | – | | | | – | | | | – | | | | – | | | | 424,448 | |
| | | | | | | | | | | | | | | | | | | | | | | | | | | | | | | |
| |
| | | | | | | | | | | | | | | | | | | | | | | | | | | | | |
| |
| Julian Heslop – Shares | | | | | | | | | | | | | | Vested | | | | | | | | | | | | | | | |
| | | Unvested | | | | | | | Market | | | | | | | | | | | | | | | | | | | Additional | | | Unvested | | | | | |
| | | at 31st | | | Number | | | price on | | | | | | | | | | | | | | | | | | | shares by | | | at 31st | | | | | |
| | | December | | | granted in | | | date of | | | | | | | Market | | | Vested | | | | | | | dividends | | | December | | | | | |
| Performance period | | 2009 | | | 2010 | | | grant | | | Number | | | price | | | Gain | | | Lapsed | | | reinvested | | | 2010 | | | | | |
| |
| 2007 – 2009 | | | 117,859 | | | | – | | | | £14.88 | | | | 41,729 | | | | £12.09 | | | | 504,294 | | | | 77,497 | | | | 1,367 | | | | – | | | | | |
| 2008 – 2010 | | | 112,938 | | | | – | | | | £11.47 | | | | – | | | | – | | | | – | | | | – | | | | 5,805 | | | | 118,743 | | | | | |
| 2009 – 2011 | | | 199,982 | | | | – | | | | £10.51 | | | | – | | | | – | | | | – | | | | – | | | | 10,278 | | | | 210,260 | | | | | |
| 2010 – 2012 | | | – | | | | 174,491 | | | | £12.04 | | | | – | | | | – | | | | – | | | | – | | | | 4,337 | | | | 178,828 | | | | | |
| | | | | | | | | | | | | | | | | | | | | | | | | | | | | | | |
GSK Annual Report 20092010
8899
Remuneration Report
| | | | | | | | | | | | | | | | | | | | | | | | | | | | | | | | | | | | | |
| Dr M Slaoui – Shares | | | | | | | | | | Market | | | | | | | | | | | | | | | | | | | Additional | | | | |
| | | | | | Number | | | price on | | | Vested | | | | | | | shares by | | | | |
| | | Unvested | | | granted in | | | date of | | | | | | | Market | | | | | | | | | | | dividends | | | Unvested | |
| Performance period | | at 31.12.08 | | | 2009 | | | grant | | | Number | | | price | | | Gain | | | Lapsed | | | reinvested | | | at 31.12.09 | |
| | | | | | | | | | | | | | | | | | | | | | | | | | | |
| 01.01.06 – 31.12.08 | | | 32,055 | | | | – | | | | £14.68 | | | | 16,248 | | | | 11.91 | | | | 193,518 | | | | 16,248 | | | | 441 | | | | – | |
| | | | | | | | | | | | | | | | | | | | | | | | | | | |
| |
| Dr M Slaoui – ADS | | | | | | | | | | Market | | | | | | | | | | | | | | | | | | | Additional | | | | |
| | | | | | Number | | | price on | | | Vested | | | | | | | ADS by | | | | |
| | | Unvested | | | granted in | | | date of | | | | | | | Market | | | | | | | | | | | dividends | | | Unvested | |
| Performance period | | at 31.12.08 | | | 2009 | | | grant | | | Number | | | price | | | Gain | | | Lapsed | | | reinvested | | | at 31.12.09 | |
| | | | | | | | | | | | | | | | | | | | | | | | | | | |
| 01.01.07 – 31.12.09 | | | 76,284 | | | | – | | | | $58.00 | | | | – | | | | – | | | | – | | | | – | | | | 3,002 | | | | 79,286 | |
| 01.01.08 – 31.12.10 | | | 73,115 | | | | – | | | | $44.75 | | | | – | | | | – | | | | – | | | | – | | | | 2,876 | | | | 75,991 | |
| 01.01.09 – 31.12.11 | | | – | | | | 2,620 | | | | $33.42 | | | | – | | | | – | | | | – | | | | – | | | | 66 | | | | 2,686 | |
| 01.01.09 – 31.12.11 | | | – | | | | 69,000 | | | | $33.50 | | | | – | | | | – | | | | – | | | | – | | | | 804 | | | | 69,804 | |
| | | | | | | | | | | | | | | | | | | | | | | | | | | |
| | | | | | | | | | | | | | | | | | | | | | | | | | | | | | | | | | | | | | | | | |
| | | | | | | | | | | | | | | | | | | | | | | | | | | | | |
| Dr Moncef Slaoui – ADS | | | | | | | | | | | | | | Vested | | | | | | | | | | | | | | |
| | | Unvested | | | | | | | Market | | | | | | | | | | | | | | | | | | | Additional | | | Unvested | | | | |
| | | at 31st | | | Number | | | price on | | | | | | | | | | | | | | | | | | | shares by | | | at 31st | | | Number | |
| | | December | | | granted in | | | date of | | | | | | | Market | | | Vested | | | | | | | dividends | | | December | | | granted in | |
| Performance period | | 2009 | | | 2010 | | | grant | | | Number | | | price | | | Gain | | | Lapsed | | | reinvested | | | 2010 | | | 2011 | |
| 2007 – 2009 | | | 79,286 | | | | – | | | | $58.00 | | | | 27,454 | | | | $37.42 | | | | $1,027,342 | | | | 52,748 | | | | 916 | | | | – | | | | – | |
| 2008 – 2010 | | | 75,991 | | | | – | | | | $44.75 | | | | – | | | | – | | | | – | | | | 1,778 | | | | 3,939 | | | | 78,152 | | | | – | |
| 2009 – 2011 | | | 2,686 | | | | – | | | | $33.42 | | | | – | | | | – | | | | – | | | | 2,825 | | | | 139 | | | | – | | | | – | |
| 2009 – 2011 | | | 69,804 | | | | – | | | | $33.50 | | | | – | | | | – | | | | – | | | | – | | | | 3,618 | | | | 73,422 | | | | – | |
| 2010 – 2012 | | | – | | | | 133,247 | | | | – | | | | – | | | | – | | | | – | | | | 2,684 | | | | 3,256 | | | | 133,819 | | | | – | |
| 2011 – 2013 | | | – | | | | – | | | | – | | | | – | | | | – | | | | – | | | | – | | | | – | | | | – | | | | 147,521 | |
| | | | | | | | | | | | | | | | | | | | | | | | | | | | | | | |
This includes those performance shares held by Dr Moncef Slaoui’s connected person, who is also an employee of GSK. Lapses for performance periods 2008 to 2011 relate to a change in connected person.
| | | | | | | | | | | | | | | | | | | | | | | | | | | | | | | | | | | | | | | | | |
| | | | | | | | | | | | | | | | | | | | | | | | | | | | | |
| Simon Dingemans - Shares | | | | | | | | | | | | | | | | | Vested | | | | | | | | | | | | |
| | | Unvested | | | | | | | Market | | | | | | | | | | | | | | | | | | | Additional | | | Unvested | | | | |
| | | at 31st | | | Number | | | price on | | | | | | | | | | | | | | | | | | | shares by | | | at 31st | | | Number | |
| | | December | | | granted in | | | date of | | | | | | | Market | | | Vested | | | | | | | dividends | | | December | | | granted in | |
| Performance period | | 2009 | | | 2010 | | | grant | | | Number | | | price | | | Gain | | | Lapsed | | | reinvested | | | 2010 | | | 2011 | |
| 2011 – 2013 | | | – | | | | – | | | | – | | | | – | | | | – | | | | – | | | | – | | | | – | | | | – | | | | 196,095 | |
| | | | | | | | | | | | | | | | | | | | | | | | | | | | | | | |
Under the terms of the PSP the number of shares actually vesting is determined following the end of the relevant measurement period and is dependent on GSK’s performance during that period as described on pages 7887 to 79.89. The Committee adjusted the comparator group by removing Schering-Plough and Wyeth following their de-listing during 2009 and revised the vesting schedule accordingly. For outstanding and future awards, TSR performance will be measured against the revised comparator group including GSK, as set out below.
Dividends are reinvested on the performance shares awarded to Executives, throughout the performance period and up to the date of the final award. The dividend reinvestment is calculated as of the dividend payment date. Under the terms of the PSP, US participants may defer receipt of all or part of their vested awards. The total gain on vesting of PSP awards made by Executive Directors and connected persons is £193,518 (2008£1,575,333 (2009 – £4,826,067)£193,518).
The following vesting schedules apply to PSP awards made in 2007 and 2008.
| | | | | | | | | | | | | | | | | |
| | | | | | | | | | | TSR vesting schedule |
| Award | | % of Award | | | Performance Period | | | TSR rank with 12 other companies | | | Percentage of award vesting |
| | | | | | | | | | | | |
| 2007 | | | 100 | | | | 01.01.07 – 31.12.09 | | | | 1 | | | | 100 | % |
| 2008 | | | 100 | | | | 01.01.08 – 31.12.10 | | | | 2 | | | | 100 | % |
| | | | | | | | | | | | 3 | | | | 87 | % |
| | | | | | | | | | | | 4 | | | | 74 | % |
| | | | | | | | | | | | 5 | | | | 61 | % |
| | | | | | | | | | | | 6 | | | | 48 | % |
| | | | | | | | | | | Median | | | | 35 | % |
| | | | | | | | | | | Below median | | | | 0 | % |
| | | | | | | | | | | | |
The following vesting schedules apply to PSP awards made in 2009.
| | | | | | | | | | | | | | | | | |
| | | | | | | | | | | TSR vesting schedule |
| Award | | % of Award | | | Performance Period | | | TSR rank with 10 other companies | | | Percentage of award vesting |
| | | | | | | | | | | | |
| 2009 | | | 30 | | | | 01.01.09 – 31.12.11 | | | | 1 | | | | 100 | % |
| | | | 30 | | | | 01.01.09 – 31.12.12 | | | | 2 | | | | 100 | % |
| | | | | | | | | | | | 3 | | | | 100 | % |
| | | | | | | | | | | | 4 | | | | 80 | % |
| | | | | | | | | | | | 5 | | | | 55 | % |
| | | | | | | | | | | Median | | | | 30 | % |
| | | | | | | | | | | Below median | | | | 0 | % |
| | | | | | | | | | | | |
| | | | | | | | | | | |
| | | | | | | | | |
| | | | | | | | | | |
| | | | | Adjusted free cash flow vesting schedule | | TSR vesting schedule | |
| | | Cash flow Targets | | | |
| Award | | % of Award | | Performance Period | | £bn | | Percentage of award vesting | | % of Award | | Performance Period | | TSR rank with 12 other companies | | Percentage of award vesting | |
| | | | | | | | | |
| 2008 | | | 100 | | 2008 – 2010 | | 1 | | | 100% | |
| | | | 2 | | | 100% | |
| | | | 3 | | | 87% | |
| | | | 4 | | | 74% | |
| | | | 5 | | | 61% | |
| | | | 6 | | | 48% | |
| | | | Median | | | 35% | |
| | | | Below median | | | 0% | |
| | | | | | | | | | | |
The following vesting schedules apply to PSP awards made in 2009 and 2010. | |
The following vesting schedules apply to PSP awards made in 2009 and 2010. | |
| | |
| | | | | | | | | | | |
| | |
| | | | TSR vesting schedule | |
| | |
| Award | | | % of Award | | Performance Period | | TSR rank with 10 other companies | | Percentage of award vesting | |
| 2009 | | 40 | | 01.01.09 – 31.12.11 | | 13.5 – 16.0 | | | 25% – 100 | % | | 30 | | 2009 – 2011 | | 1 | | | 100% | |
| | | | | | | | | | | 30 | | 2009 – 2012 | | 2 | | | 100% | |
| 2010 | | | 30 | | 2010 – 2012 | | 3 | | | 100% | |
| | | | 30 | | 2010 – 2013 | | 4 | | | 80% | |
| | | | 5 | | | 55% | |
| | | | Median | | | 30% | |
| | | | Below median | | | 0% | |
| | | | | | | | | | | |
| | |
| | | | | | | | | | | |
| | |
| | | | | | Adjusted free cash flow vesting schedule | |
| | |
| | | | Cash flow Targets | | | |
| Award | | | % of Award | | Performance Period | | £bn | | Percentage of award vesting | |
| 2009 | | | 40 | | 2009 – 2011 | | 13.5 – 16.0 | | | 25% – 100% | |
| 2010 | | | 40 | | 2010 – 2012 | | 17.3 – 20.5 | | | 25% – 100% | |
| | | | | | | | | | | |
GSK Annual Report 20092010
89100
Remuneration Report
Share ValueDeferred Annual Bonus Plan awardsAwards
| | | | | | | | | | | | | | | | | | | | | | | | | | | | | |
Dr M Slaoui – Shares and ADS
| | | | | | | | | | Market | | | | | | | |
| | | | | | Number | | | price on | | | Vested & deferred | | | | |
| | Unvested | | | granted in | | | date of | | | | | | | Market | | | | | | | Unvested | |
| Plan year | | at 31.12.08 | | | 2009 | | | grant | | | Number | | | price | | | Gain | | | at 31.12.09 | |
| 2006 (Shares) | | | 1,200 | | | | – | | | | £14.68 | | | | 1,200 | | | | £11.33 | | | | £13,596 | | | | – | |
| 2007 (ADS) | | | 890 | | | | – | | | | $58.00 | | | | – | | | | – | | | | – | | | | 890 | |
| 2008 (ADS) | | | 890 | | | | – | | | | $44.75 | | | | – | | | | – | | | | – | | | | 890 | |
| 2008 (ADS) | | | 2,980 | | | | – | | | | $48.55 | | | | – | | | | – | | | | – | | | | 2,980 | |
| 2009 (ADS) | | | – | | | | 1,490 | | | | $33.42 | | | | – | | | | – | | | | – | | | | 1,490 | |
| | | | | | | | | | | | | | | | | | | | |
| | | | | | | | | | | | | | | | | | | | | | | | | | | | | | | | | | | | | | | | | |
| | | | | | | | | | | | | | | | | | | | | | | | | | | | | | | | | | | | | |
| Andrew Witty – Shares | | | | | | | | | | | | | | Vested | | | | | | | | | | | | | | |
| | | Unvested | | | | | | | Market | | | | | | | | | | | | | | | | | | | Additional | | | Unvested | | | | |
| | | at 31st | | | Number | | | price on | | | | | | | | | | | | | | | | | | | shares by | | | at 31st | | | Number | |
| | | December | | | granted in | | | date of | | | | | | | Market | | | Vested | | | | | | | dividends | | | December | | | granted in | |
| Performance period | | 2009 | | | 2010 | | | grant | | | Number | | | price | | | Gain | | | Lapsed | | | reinvested | | | 2010 | | | 2011 | |
| |
| 2010 – 2012 | | | – | | | | 24,291 | | | | 12.35 | | | | – | | | | – | | | | – | | | | – | | | | 616 | | | | 24,907 | | | | – | |
| |
| 2011 – 2013 | | | – | | | | – | | | | – | | | | – | | | | – | | | | – | | | | – | | | | – | | | | – | | | | 31,921 | |
| | | | | | | | | | | | | | | | | | | | | | | | | | | | | | | |
| | | | | | | | | | | | | | | | | | | | | | | | | | | | | | | | | | | | | | | | | |
| | | | | | | | | | | | | | | | | | | | | | | | | | | | | | | | | | | | | |
| Dr Moncef Slaoui - ADS | | | | | | | | | | | | | Vested | | | | | | | | | | | | | | | |
| | | Unvested | | | | | | | Market | | | | | | | | | | | | | | | | | | | Additional | | | Unvested | | | | |
| | | at 31st | | | Number | | | price on | | | | | | | | | | | | | | | | | | | shares by | | | at 31st | | | Number | |
| | | December | | | granted in | | | date of | | | | | | | Market | | | Vested | | | | | | | dividends | | | December | | | granted in | |
| Performance period | | 2009 | | | 2010 | | | grant | | | Number | | | price | | | Gain | | | Lapsed | | | reinvested | | | 2010 | | | 2011 | |
| |
| 2011 – 2013 | | | – | | | | – | | | | – | | | | – | | | | – | | | | – | | | | – | | | | – | | | | – | | | | 18,756 | |
| |
| | | | | | | | | | | | | | | | | | | | | | | | | | | | | | | |
| Share Value Plan awards | | | | | | | | | | | | | | | | | | | | | | | | | | | | |
| | |
| | | | | | | | | | | | | | | | | | | | | | | | | | | | | |
| Dr Moncef Slaoui – Shares and ADS | | | | | | | | | | Vested & deferred | | | | | | | |
| | | Unvested | | | Market | | | | | | | | | | | | | | | Unvested | | | | |
| Plan year | | at 31st | | | price on | | | | | | | | | | | | | | | at 31st | | | Number | |
| | | December | | | date of | | | | | | | Market | | | | | | | December | | | granted in | |
| | | 2009 | | | grant | | | Number | | | price | | | Gain | | | 2010 | | | 2011 | |
| 2007 | | | 510 | | | | $58.00 | | | | 510 | | | | $37.32 | | | | 19,033 | | | | – | | | | – | |
| 2008 | | | 640 | | | | $44.75 | | | | – | | | | – | | | | – | | | | 640 | | | | – | |
| 2009 | | | 640 | | | | $33.42 | | | | – | | | | – | | | | – | | | | 640 | | | | – | |
| 2010 | | | 640 | | | | $37.32 | | | | – | | | | – | | | | – | | | | 640 | | | | – | |
| 2011 | | | – | | | | $38.13 | | | | – | | | | – | | | | – | | | | – | | | | 2,450 | |
| | | | | | | | | | | | | | | | | | | | | | |
As an Executive Director, Dr Moncef Slaoui is not eligible to receive awards under the Share Value Plan. The awards shown above reflect the holdings of Dr Moncef Slaoui’s connected person, an employee of GSK. The awards are subject to three-year vesting periods and vesting is contingent on continued employment with GSK.
Pension benefits
The accrued annual pension benefits and transfer values for Executive Directors in office on 31st December 20092010 on retirement are set out below.
The Companies Act 2006 requires disclosure of the accrued benefit at the end of the year, the change in accrued benefit over the year, the transfer value at both the beginning and end of the year and the change in the transfer value over the year. The FSA’s Listing Rules require additional disclosure of the change in the accrued benefit, net of inflation and the transfer value of this change. Pensions for the Executive Directors have been disclosed in the currency in which the pension is payable.
| | | | | | | | | | | | | | | | | | | | | | | | | | | | | | | | | | | | | |
| | | | | | | | | | | | | | | | | | | | | | | | | | | | | | | Change in | | | | |
| | | | | | | | | | | Change in | | | Personal | | | | | | | | | | | | | | | accrued | | | Transfer value | |
| | | Accrued | | | Accrued | | | accrued | | | contributions | | | Transfer | | | Transfer | | | Change | | | benefit over | | | of change | |
| | | benefit at | | | benefit at | | | benefit | | | made during | | | value at | | | value at | | | in transfer | | | year net | | | in accrued | |
| Executive Directors | | 31.12.08 | | | 31.12.09 | | | over year | | | the year | | | 31.12.08 | | | 31.12.09 | | | value | | | of inflation | | | benefit | * |
| | 000 | | | 000 | | | 000 | | | 000 | | | 000 | | | 000 | | | 000 | * | | 000 | | | 000 | |
| | | | | | | | | | | | | | | | | | | | | | | | | | |
| Mr A Witty | | | £315 | | | | £446 | | | | £131 | | | | £30 | | | | £3,848 | | | | £6,272 | | | | £2,394 | | | | £115 | | | | £1,638 | |
| Mr J Heslop | | | £170 | | | | £201 | | | | £31 | | | | £16 | | | | £2,837 | | | | £3,787 | | | | £934 | | | | £23 | | | | £471 | |
| Dr M Slaoui | | | $131 | | | | $187 | | | | $56 | | | | – | | | | $731 | | | | $1,101 | | | | $370 | | | | $54 | | | | $370 | |
| Dr M Slaoui | | | €55 | | | | €59 | | | | €4 | | | | – | | | | €608 | | | | €647 | | | | €39 | | | | €3 | | | | €39 | |
| | | | | | | | | | | | | | | | | | | | | | | | | | |
| | | | | | | | | | | | | | | | | | | | | | | | | | | | | | | | | | | | | |
| | | | | | | | | | | | | | | | | | | | | | | | | | |
| | | Accrued | | | | | | | | | | | | | | | | | | | | | | | | | | | Change in | | | | |
| | | benefit at | | | Accrued | | | Change in | | | Personal | | | Transfer | | | Transfer | | | | | | | accrued | | | Transfer value | |
| | | 31st | | | benefit at | | | accrued | | | contributions | | | value at | | | value at | | | Change | | | benefit over | | | of change | |
| | | December | | | 31st December | | | benefit | | | made during | | | 31st December | | | 31st December | | | in transfer | | | year net | | | in accrued | |
| | | 2009 | | | 2010 | | | over year | | | the year | | | 2009 | | | 2010 | | | value | | | of inflation | | | benefit* | |
| Executive Directors | | 000 | | | 000 | | | 000 | | | 000 | | | 000 | | | 000 | | | 000* | | | 000 | | | 000 | |
| Andrew Witty | | | £446 | | | | £497 | | | | £51 | | | | £30 | | | | £6,272 | | | | £9,651 | | | | £3,349 | | | | £51 | | | | £987 | |
| Julian Heslop | | | £201 | | | | £222 | | | | £21 | | | | £16 | | | | £3,787 | | | | £5,308 | | | | £1,505 | | | | £21 | | | | £563 | |
| Dr Moncef Slaoui | | | $187 | | | | $230 | | | | $43 | | | | – | | | | $1,101 | | | | $1,518 | | | | $417 | | | | $41 | | | | – | |
| Dr Moncef Slaoui | | | €59 | | | | €65 | | | | €6 | | | | – | | | | €647 | | | | €689 | | | | €42 | | | | €5 | | | | – | |
| | | | | | | | | | | | | | | | | | | | | | | | | | | | |
| | |
| * | | These are shown net of contributions made by the individual. |
MrAndrew Witty and MrJulian Heslop participate in the Glaxo Wellcome Defined Benefit Plan with an accrual rate of 1/30th of final pensionable salary per annum. In 2000 all benefits accrued under the Glaxo Wellcome UK pension arrangements were augmented by the Trustees of the plans by 5% to reflect a distribution of surplus. This augmentation will apply to that element of MrAndrew Witty and MrJulian Heslop’s pension earnings before 31st March 2000.
Mr Witty’s and Mr Heslop’s transfer values have been calculated on the basis of actuarial advice in accordance with pensions regulation. The transfer value represents the present value of future payments to be made under the pension plan. Mr Witty’s annual accrued benefit has increased by £130,556 (£114,770 excluding the effects of inflation), and the transfer value less personal contributions has increased by £2,394,197 over the year. Mr Heslop’s annual accrued benefit has increased by £31,040 (£22,504 excluding the effects of inflation) and the transfer value less personal contributions has increased by £934,150 over the year.
GSK Annual Report 2009
90101
Remuneration Report
The transfer values for Andrew Witty and Julian Heslop are calculated in accordance with pensions’ regulation and represent the present value of potential payments under the pension plan. The actuarial assumptions for the calculation have changed since 31st December 2009 and these changes have increased the transfer values by £2,117,956 (63% of increase) for Andrew Witty and £778,368 (52% of increase) for Julian Heslop. The balance of the increase in transfer value is the result of the increased valuation of the pension benefit accrued in the year and the reduced period of service to the assumed retirement age.
Dr Moncef Slaoui is a member of the US Executive Cash Balance Pension Plan. The plan provides for an Executive Pension Credit, under which GSK makes annual contributions calculated as a percentage of the executive’s base salary. GSK makes contributions at 38% of base pay. The fund increases at an interest rate set annually in advance based on the 30 year US Treasury bond rate to provide a cash sum at retirement. The plan has no entitlement to a spouse’s pension or to pension increases.
The transfer value, or cash sum, has increased by $369,981$416,924 for Dr Moncef Slaoui over the year as a result of further accumulation of interest and contributions paid by the company.
Dr Moncef Slaoui was an active participant in the Belgium Fortis Plan until 31st May 2006. This plan is a defined benefit plan with a lump sum payable at normal retirement which is age 60 for the plan. The transfer value, or cash sum, of Dr Moncef Slaoui’s plan has increased by€38,893 €41,598 over the year as a result of further accumulation of interest.
Dr Moncef Slaoui is a member of the US Retirement Savings Plan, a 401k savings scheme open to all US employees and the Executive Supplemental Savings Plan, a savings scheme open to executives to accrue benefits above US government limits imposed on the Retirement Savings Plan. Contributions to both plans are invested in a range of funds and the value of the accumulated funds is paid at retirement.
During 2009,2010, contributions of $108,249$138,290 (£69,390)88,648) were paid into these two schemes by GSK in respect of Dr Moncef Slaoui.
Directors’ interests in contracts
Except as described in Note 35 to the financial statements, ‘Related party transactions’, during or at the end of the financial year no Director or connected person had any material interest in any contract of significance in relation to the Group’s business with a Group company.
Directors and Senior Management
Further information is also provided on compensation and interests of Directors and Senior Management as a group (‘the group’). For this purpose, the group is defined as the Executive and Non-Executive Directors and members of the CET. For the financial year 2009,2010, the total compensation paid to members of the group for the periods during which they served in that capacity was £23,187,437,£20,377,021, the aggregate increase in accrued pension benefits, net of inflation, was £1,225,166£1,252,061 and the aggregate payment to defined contribution schemes was £393,409.£613,889.
During 2009,2010, the members of the group were granted 941,00094,320 share options and 665,9401,100 ADS options under the Share Option plan,Plan, were awarded 1,073,04924,291 shares under the Deferred Annual Bonus Plan, 1,273,718 shares and 308,370421,417 ADS under the Performance Share Plan, were awarded 2,500and nil shares and 1,490640 ADS under the Share Value Plan. No notional shares or ADS were granted under the Deferred Investment Award Plan in 2009.2010. Members of the group were awarded through the reinvestment of dividends 61,370with 131,316 shares and 20,21840,260 ADS in the Performance Share Plan, 616 shares in the Deferred Annual Bonus Plan and 4,8545,521 notional shares in the Deferred Investment Award Plan.
At 19th24th February 2010,2011, the group (comprising 2729 persons) owned 872,256922,342 shares and 85,15690,057 ADS, constituting less than 2%1% of the issued share capital of the company (with none of such 27 persons beneficially owning 1% or more of the issued share capital of the company).company. The group also held, at that date: options to purchase 7,269,8176,452,022 shares and 2,109,7201,153,094 ADS; 2,263,2304,747,585 shares and 748,7821,250,945 ADS awarded under the Performance Share Plan, including those shares and ADS that are vested and deferred; 40,1391,350 vested and deferred ADS under the legacy SmithKline Beecham Mid-Term Incentive Plan; 20,13013,510 shares and 6,2503,730 ADS awarded under the Share Value Plan; 88,315 shares and 31,913 ADS under the Deferred Annual Bonus Plan and 88,4351,561 notional shares awarded under the Deferred Investment Award Plan. These holdings were issued under the various executive share option plans described in Note 42 to the financial statements, ‘Employee share schemes’.
Directors’ interests in contracts
Except as described in Note 35 to the financial statements, ‘Related party transactions’, during or at the end of the financial year no Director or connected person had any material interest in any contract of significance in relation to the Group’s business with a Group company.
Basis of preparation
The Directors’ Remuneration Report has been prepared in accordance with the Companies Act 2006 and The Large and Medium-sized Companies and Groups (Accounts and Reports) Regulations 2008 (the Regulations) and meets the relevant requirements of the FSA Listing Rules.
The Remuneration reportReport has been approved by the Board of Directors and signed on its behalf by
Sir Christopher GentCrispin Davis
Remuneration Committee Chairman
24th February 20101st March 2011
GSK Annual Report 20092010
91
Financial statements
The financial statements provide a summary of the Group’s financial performance throughout 2009 and its position as at 31st December 2009. The consolidated financial statements are prepared in accordance with the IFRS as adopted by the European Union and also IFRS as issued by the International Accounting Standards Board.
Financial statements
The consolidated financial statements present the profit and cash flow for the year and the balance sheet position at the end of the year.
Notes to the financial statements
The notes to the financial statements provide supporting analyses to the primary statements.
GSK Annual Report 2009
92102
Directors’ statement of responsibilities
Directors’ statement of responsibilities in relation
to the Group financial statements
The Directors are responsible for preparing the Annual Report, the Remuneration Report and the Group financial statements in accordance with applicable law and regulations.
Company law requires the Directors to prepare financial statements for each financial year. Under that law the Directors have electedare required to prepare the Group financial statements in accordance with International Financial Reporting Standards (IFRS) as adopted by the European Union. In preparing the Group financial statements, the Directors have also elected to comply with IFRS, as issued by the International Accounting Standards Board (IASB). Under company law the Directors must not approve the Group financial statements unless they are satisfied that they give a true and fair view of the state of affairs of the Group and of the profit or loss of the Group for that period.
In preparing those financial statements, the Directors are required to:
select suitable accounting policies and then apply them consistently;
make judgements and accounting estimates that are reasonable and prudent;
state that the Group financial statements comply with IFRS as adopted by the European Union and IFRS as issued by the IASB, subject to any material departures disclosed and explained in the financial statements.
| • | | select suitable accounting policies and then apply them consistently; |
|
| • | | make judgements and accounting estimates that are reasonable and prudent; |
|
| • | | state that the Group financial statements comply with IFRS as adopted by the European Union and IFRS as issued by the IASB, subject to any material departures disclosed and explained in the Group financial statements. |
The Directors are responsible for keeping adequate accounting records that are sufficient to show and explain the company’s transactions and disclose with reasonable accuracy at any time the financial position of the Group and to enable them to ensure that the Group financial statements and the Directors’ Remuneration Report comply with the Companies Act 2006 and Article 4 of the IAS Regulation. They are also responsible for safeguarding the assets of the Group and hence for taking reasonable steps for the prevention and detection of fraud and other irregularities.
The Group financial statements for the year ended 31st December 2009,2010, comprising principal statements and supporting notes, are set out in ‘Financial statements’ on pages 94 and 176104 to 185 of this Report.report.
The responsibilities of the auditors in relation to the Group financial statements are set out in the Report of Independent Registered Public Accounting FirmAuditors’ report on page 93.103.
The Group financial statements for the year ended 31st December 20092010 are included in the Annual Report. The Directors are responsible for the maintenance and integrity of the Annual Report on the website in accordance with UK legislation governing the preparation and dissemination of financial statements. Access to the website is available from outside the UK, where comparable legislation may be different.
Each of the current Directors, whose names and functions are listed in the Corporate governanceGovernance section of the Annual Report 20092010 confirms that, to the best of his or her knowledge:
the Group financial statements, which have been prepared in accordance with IFRS as adopted by the EU and IFRS as issued by IASB, give a true and fair view of the assets, liabilities, financial position and profit of the Group; and
the Business review section contained in the Annual Report includes a fair review of the development and performance of the business and the position of the Group, together with a description of the principal risks and uncertainties that it faces.
Disclosure of information to auditors
The Directors in office at the date of this Report have each confirmed that:
so far as he or she is aware, there is no relevant audit information of which the company’s auditors are unaware; and
he or she has taken all the steps that he or she ought to have taken as a Director to make himself or herself aware of any relevant audit information and to establish that the company’s auditors are aware of that information.
| • | | so far as he or she is aware, there is no relevant audit information of which the company’s auditors are unaware; and |
|
| • | | he or she has taken all the steps that he or she ought to have taken as a Director to make himself or herself aware of any relevant audit information and to establish that the company’s auditors are aware of that information. |
This confirmation is given and should be interpreted in accordance with the provisions of Section 418 of the Companies Act 2006.
Going concern basis
The Business review on pages 67 to 5357 contains information on the performance of the Group, its financial position, cash flows, net debt position and borrowing facilities. Further information, including Treasury risk management policies, exposures to market and credit risk and hedging activities, is given in Note 41 to the financial statements, ‘Financial instruments and related disclosures’.
After making enquiries, the Directors have a reasonable expectation that the Group has adequate resources to continue in operational existence for the foreseeable future. For this reason, they continue to adopt the going concern basis in preparing the financial statements.
Internal control
The Board, through the Audit & Risk Committee, has reviewed the assessment of risks and the internal control framework that operates in GSK and has considered the effectiveness of the system of internal control in operation in the Group for the year covered by this report and up to the date of its approval by the Board of Directors.
The Combined Code
The Board considers that GlaxoSmithKline plc applies the Main Principles of Section 1 of the Combined Code onmaintained by the FRC, as described in the Corporate Governance of the Financial Reporting Council, as described under ‘Corporate governance’section on pages 5458 to 72,83, and has complied with its provisions except as describeddisclosed on page 71.63.
As required by the FSA’s Listing Rules of the Financial Services Authority, the auditors have considered the Directors’ statement of compliance in relation to those points of the Combined Code which are specified for their review.
Annual Report
The Annual Report for the year ended 31st December 2009,2010, comprising the Report of the Directors, the Remuneration Report, the Financial statements and additional information for investors, has been approved by the Board of Directors and signed on its behalf by
Sir Christopher Gent
Chairman
24th February 20101st March 2011
GSK Annual Report 20092010
93103
Report of Independent Registered Public Accounting Firm
To the Board of Directors and Shareholders of GlaxoSmithKline plc
In our opinion, the accompanying consolidated balance sheets and the related consolidated income statement, consolidated statements of cash flows, consolidated statements of comprehensive income and, consolidated statement of changes in equity present fairly, in all material respects, the financial position of GlaxoSmithKline plc and its subsidiaries at 31st December 20092010 and 31st December 2008,2009, and the results of their operations and cash flows for each of the three years in the period ended 31st December 2009,2010, in conformity with International Financial Reporting Standards (IFRSs) as issued by the International Accounting Standards Board. Also, in our opinion the Company maintained, in all material respects, effective internal control over financial reporting as of 31st December 2009,2010, based on criteria established in Internal Control – Integrated Framework issued by the Committee of Sponsoring Organizations of the Treadway Commission COSO. The Company’s management is responsible for these financial statements, for maintaining effective internal control over financial reporting and for its assessment of the effectiveness of internal control over financial reporting, included in ‘Managements annual report on internal control over financial reporting’ on page 72.80. Our responsibility is to express opinions on these financial statements and on the Company’s internal control over financial reporting based on our integrated audits. We conducted our audits in accordance with the standards of the Public Company Accounting Oversight Board (United States). Those standards require that we plan and perform the audits to obtain reasonable assurance about whether the financial statements are free of material misstatement and whether effective internal control over financial reporting was maintained in all material respects. Our audits of the financial statements included examining, on a test basis, evidence supporting the amounts and disclosures in the financial statements, assessing the accounting principles used and significant estimates made by management, and evaluating the overall financial statement presentation. Our audit of internal control over financial reporting included obtaining an understanding of internal control over financial reporting, assessing the risk that a material weakness exists, and testing and evaluating the design and operating effectiveness of internal control based on the assessed risk. Our audits also included performing such other procedures as we considered necessary in the circumstances. We believe that our audits provide a reasonable basis for our opinions.
A company’s internal control over financial reporting is a process designed to provide reasonable assurance regarding the reliability of financial reporting and the preparation of financial statements for external purposes in accordance with generally accepted accounting principles. A company’s internal control over financial reporting includes those policies and procedures that (i) pertain to the maintenance of records that, in reasonable detail, accurately and fairly reflect the transactions and dispositions of the assets of the company; (ii) provide reasonable assurance that transactions are recorded as necessary to permit preparation of financial statements in accordance with generally accepted accounting principles, and that receipts and expenditures of the company are being made only in accordance with authorizations of management and directors of the company; and (iii) provide reasonable assurance regarding prevention or timely detection of unauthorized acquisition, use, or disposition of the company’s assets that could have a material effect on the financial statements.
Because of its inherent limitations, internal control over financial reporting may not prevent or detect misstatements. Also, projections of any evaluation of effectiveness to future periods are subject to the risk that controls may become inadequate because of changes in conditions, or that the degree of compliance with the policies or procedures may deteriorate.
PricewaterhouseCoopers LLP
London
United Kingdom
1st4th March 20102011
GSK Annual Report 20092010
94104
Consolidated income statement
for the year ended 31st December 20092010
| | | | | | | | | | | |
| | | | | | | | | | | | | | | | | | | | | | |
| | | | 2009 | | | 2010 | |
| | | Results | | | Results | | | | | |
| | | before major | | Major | | | before major | | Major | | | |
| | | restructuring | | restructuring | | Total | | | restructuring | | restructuring | | Total | |
| | | Notes | | £m | | £m | | £m | | | Notes | | £m | | £m | | £m | |
| | | | | | | | | | | | | | | | | |
| Turnover | | 6 | | 28,368 | | – | | 28,368 | | | 6 | | 28,392 | | – | | 28,392 | |
| Cost of sales | | | (7,095 | ) | | | (285 | ) | | | (7,380 | ) | | | (7,405 | ) | | | (187 | ) | | | (7,592 | ) |
| | | | | | | | | | | | | | | | | |
| Gross profit | | 21,273 | | | (285 | ) | | 20,988 | | | 20,987 | | | (187 | ) | | 20,800 | |
| Selling, general and administration | | | (9,200 | ) | | | (392 | ) | | | (9,592 | ) | | | (12,388 | ) | | | (665 | ) | | | (13,053 | ) |
| Research and development | | | (3,951 | ) | | | (155 | ) | | | (4,106 | ) | | | (3,964 | ) | | | (493 | ) | | | (4,457 | ) |
| Other operating income | | 8 | | 1,135 | | – | | 1,135 | | | 8 | | 493 | | – | | 493 | |
| | | | | | | | | | | | | | | | | |
Operating profit | | 9,10 | | 9,257 | | | (832 | ) | | 8,425 | | | 9 | | 5,128 | | | (1,345 | ) | | 3,783 | |
| | | |
| Finance income | | 11 | | 70 | | – | | 70 | | | 11 | | 116 | | – | | 116 | |
| Finance costs | | 12 | | | (780 | ) | | | (3 | ) | | | (783 | ) | | 12 | | | (828 | ) | | | (3 | ) | | | (831 | ) |
| Profit on disposal of interest in associate | | 115 | | – | | 115 | | |
| Profit on disposal of interest in associates | | | 8 | | – | | 8 | |
| Share of after tax profits of associates and joint ventures | | 13 | | 64 | | – | | 64 | | | 13 | | 81 | | – | | 81 | |
| | | | | | | | | | | | | | | | | |
Profit before taxation | | 8,726 | | | (835 | ) | | 7,891 | | | 4,505 | | | (1,348 | ) | | 3,157 | |
| | | |
| Taxation | | 14 | | | (2,443 | ) | | 221 | | | (2,222 | ) | | 14 | | | (1,544 | ) | | 240 | | | (1,304 | ) |
| | | | | | | | | | | | | | | | | |
Profit after taxation for the year | | 6,283 | | | (614 | ) | | 5,669 | | | 2,961 | | | (1,108 | ) | | 1,853 | |
| | | | | | | | | | | | | | | | |
| | | |
| Profit attributable to minority interests | | 138 | | – | | 138 | | |
| Profit attributable to non-controlling interests | | | 219 | | – | | 219 | |
| Profit attributable to shareholders | | 6,145 | | | (614 | ) | | 5,531 | | | 2,742 | | | (1,108 | ) | | 1,634 | |
| | | | | | | | | | | | | | | | | |
| | | 6,283 | | | (614 | ) | | 5,669 | | | 2,961 | | | (1,108 | ) | | 1,853 | |
| | | | | | | | | | | | | | | | | |
| | | |
| Basic earnings per share (pence) | | 15 | | 109.1 | p | | 15 | | 32.1 | p |
| Diluted earnings per share (pence) | | 15 | | 108.2 | p | | 15 | | 31.9 | p |
| | | | | | | | | | | | | | | | | |
The calculation of ‘Results before major restructuring’ is described in Note 1, ‘Presentation of the financial statements’.
Consolidated statement of comprehensive income
for the year ended 31st December 20092010
| | | | | | | | | | | | |
| | | | | | | | | | | 2009 | |
| | | 2010 | | | | | |
| | | £m | |
| | | |
| Profit for the year | | | | | | | | | | | 5,6691,853 | |
| | | | | | | | | | | | |
| Exchange movements on overseas net assets and net investment hedges | | | 166 | | | | | | | | (194 | ) |
Reclassification of exchange on liquidation or disposal of overseas subsidiary | | | | | | | | subsidiaries | | | (442 | ) |
| Tax on exchange movements | | | | | | | | | | | 19– | |
| Fair value movements on available-for-sale investments | | | | | | | | | | | 4294 | |
| Deferred tax on fair value movements on available-for-sale investments | | | | | | | | | | | (2425 | ) |
| Reclassification of fair value movements on available-for-sale investments | | | | | | | | | | | –1 | |
| Deferred tax reversed on reclassification of available-for-sale investments | | | | | | | | | | | 13 | |
Actuarial (losses)/gains on defined benefit plans | | | | | | | | | | | (6593 | ) |
Deferred tax on actuarial movements in defined benefit plans | | | | | | | | | | | 183 | |
| Fair value movements on cash flow hedges | | | | | | | | | | | (68 | ) |
| Deferred tax on fair value movements on cash flow hedges | | | | | | | | | | | 21 | |
Reclassification of cash flow hedges to income and expensestatement | | | | | | | | | | | 13 | |
| Fair value movement on subsidiary acquisition | | | – | |
| Cash flow hedge reclassified to goodwill | | | 6 | |
| Actuarial losses on defined benefit plans | | | (61 | ) |
| Deferred tax on actuarial movements in defined benefit plans | | | 1 | |
| | | | | | | | | | | | |
Other comprehensive income/(expense)/income for the year | | | | | | | | | | | (673 | ) |
| | 233 | |
| | | | | | | | |
| | | | | |
| Total comprehensive income for the year | | | | | | | | | | | 4,9962,086 | |
| | | | |
| | | | | | | | | | | | |
| Total comprehensive income for the year attributable to: | | | | | | | | | | | | |
| Shareholders | | | | | | | | | | | 4,8951,847 | |
MinorityNon-controlling interests | | | | | | | | | | | 101239 | |
| | | |
| Total comprehensive income for the year | | | | | | | | | | | 4,9962,086 | |
| | | |
GSK Annual Report 20092010
95105
| | | | | | | | | | | | | | | | | | | | | | | |
| 2008 | | 2007 | |
| Results | | | | | | | | | | | Results | | | | | | | |
| before major | | | Major | | | | | | | before major | | | Major | | | | |
| restructuring | | | restructuring | | | Total | | | restructuring | | | restructuring | | | Total | |
| £m | | | £m | | | £m | | | £m | | | £m | | | £m | |
| | | | | | | | | | | | | | | |
| | 24,352 | | | | – | | | | 24,352 | | | | 22,716 | | | | – | | | | 22,716 | |
| | (5,776 | ) | | | (639 | ) | | | (6,415 | ) | | | (5,206 | ) | | | (111 | ) | | | (5,317 | ) |
| | | | | | | | | | | | | | | |
| | 18,576 | | | | (639 | ) | | | 17,937 | | | | 17,510 | | | | (111 | ) | | | 17,399 | |
| | (7,352 | ) | | | (304 | ) | | | (7,656 | ) | | | (6,817 | ) | | | (137 | ) | | | (6,954 | ) |
| | (3,506 | ) | | | (175 | ) | | | (3,681 | ) | | | (3,237 | ) | | | (90 | ) | | | (3,327 | ) |
| | 541 | | | | – | | | | 541 | | | | 475 | | | | – | | | | 475 | |
| | | | | | | | | | | | | | | |
| | 8,259 | | | | (1,118 | ) | | | 7,141 | | | | 7,931 | | | | (338 | ) | | | 7,593 | |
| | | | | | | | | | | | | | | | | | | | | | | |
| | 313 | | | | – | | | | 313 | | | | 262 | | | | – | | | | 262 | |
| | (838 | ) | | | (5 | ) | | | (843 | ) | | | (453 | ) | | | – | | | | (453 | ) |
| | – | | | | – | | | | – | | | | – | | | | – | | | | – | |
| | 48 | | | | – | | | | 48 | | | | 50 | | | | – | | | | 50 | |
| | | | | | | | | | | | | | | |
| | 7,782 | | | | (1,123 | ) | | | 6,659 | | | | 7,790 | | | | (338 | ) | | | 7,452 | |
| | | | | | | | | | | | | | | | | | | | | | | |
| | (2,231 | ) | | | 284 | | | | (1,947 | ) | | | (2,219 | ) | | | 77 | | | | (2,142 | ) |
| | | | | | | | | | | | | | | |
| | 5,551 | | | | (839 | ) | | | 4,712 | | | | 5,571 | | | | (261 | ) | | | 5,310 | |
| | | | | | | | | | | | | | | |
| | | | | | | | | | | | | | | | | | | | | | | |
| | 110 | | | | – | | | | 110 | | | | 96 | | | | – | | | | 96 | |
| | 5,441 | | | | (839 | ) | | | 4,602 | | | | 5,475 | | | | (261 | ) | | | 5,214 | |
| | | | | | | | | | | | | | | |
| | 5,551 | | | | (839 | ) | | | 4,712 | | | | 5,571 | | | | (261 | ) | | | 5,310 | |
| | | | | | | | | | | | | | | |
| | | | | | | | | | | | | | | | | | | | | | | |
| | | | | | | | | | 88.6 | p | | | | | | | | | | | 94.4 | p |
| | | | | | | | | | 88.1 | p | | | | | | | | | | | 93.7 | p |
| | | | | | | | | | | | | | | |
| | | | | |
| 2008 | | | 2007 | |
| £m | | £m | |
| | | |
| 4,712 | | | 5,310 | |
| | | | | |
| 1,017 | | | 411 | |
| 84 | | | – | |
| 15 | | | 21 | |
| (47 | ) | | (53 | ) |
| 5 | | | 8 | |
| (34 | ) | | (46 | ) |
| 3 | | | 11 | |
| (1,370 | ) | | 671 | |
| 441 | | | (195 | ) |
| 6 | | | (6 | ) |
| (3 | ) | | 2 | |
| – | | | – | |
| – | | | – | |
| | | |
| | | | | |
| 117 | | | 824 | |
| | | |
| | | | | |
| 4,829 | | | 6,134 | |
| | | |
| | | | | |
| | | | | |
| 4,670 | | | 6,012 | |
| 159 | | | 122 | |
| | | |
| 4,829 | | | 6,134 | |
| | | |
| | | | | | | | | | | | | | | | | | | | | | | |
| | | | |
| 2009 | | | 2008 | |
| Results | | | | | | | | | | | Results | | | | | | | |
| before major | | | Major | | | | | | | before major | | | Major | | | | |
| restructuring | | | restructuring | | | Total | | | restructuring | | | restructuring | | | Total | |
| £m | | | £m | | | £m | | | £m | | | £m | | | £m | |
| | | | | | | | | | | | | | | | |
| | 28,368 | | | | – | | | | 28,368 | | | | 24,352 | | | | – | | | | 24,352 | |
| | (7,095 | ) | | | (285 | ) | | | (7,380 | ) | | | (5,776 | ) | | | (639 | ) | | | (6,415 | ) |
| | | | | | | | | | | | | | | | |
| | 21,273 | | | | (285 | ) | | | 20,988 | | | | 18,576 | | | | (639 | ) | | | 17,937 | |
| | (9,200 | ) | | | (392 | ) | | | (9,592 | ) | | | (7,352 | ) | | | (304 | ) | | | (7,656 | ) |
| | (3,951 | ) | | | (155 | ) | | | (4,106 | ) | | | (3,506 | ) | | | (175 | ) | | | (3,681 | ) |
| | 1,135 | | | | – | | | | 1,135 | | | | 541 | | | | – | | | | 541 | |
| | | | | | | | | | | | | | | | |
| | 9,257 | | | | (832 | ) | | | 8,425 | | | | 8,259 | | | | (1,118 | ) | | | 7,141 | |
| | | | | | | | | | | | | | | | | | | | | | | |
| | 70 | | | | – | | | | 70 | | | | 313 | | | | – | | | | 313 | |
| | (780 | ) | | | (3 | ) | | | (783 | ) | | | (838 | ) | | | (5 | ) | | | (843 | ) |
| | 115 | | | | – | | | | 115 | | | | – | | | | – | | | | – | |
| | 64 | | | | – | | | | 64 | | | | 48 | | | | – | | | | 48 | |
| | | | | | | | | | | | | | | | |
| | 8,726 | | | | (835 | ) | | | 7,891 | | | | 7,782 | | | | (1,123 | ) | | | 6,659 | |
| | | | | | | | | | | | | | | | | | | | | | | |
| | (2,443 | ) | | | 221 | | | | (2,222 | ) | | | (2,231 | ) | | | 284 | | | | (1,947 | ) |
| | | | | | | | | | | | | | | | |
| | 6,283 | | | | (614 | ) | | | 5,669 | | | | 5,551 | | | | (839 | ) | | | 4,712 | |
| | | | | | | | | | | | | | | | |
| | 138 | | | | – | | | | 138 | | | | 110 | | | | – | | | | 110 | |
| | 6,145 | | | | (614 | ) | | | 5,531 | | | | 5,441 | | | | (839 | ) | | | 4,602 | |
| | | | | | | | | | | | | | | | |
| | 6,283 | | | | (614 | ) | | | 5,669 | | | | 5,551 | | | | (839 | ) | | | 4,712 | |
| | | | | | | | | | | | | | | | |
| | | | | | | | | | | | | | | | | | | | | | | |
| | | | | | | | | | 109.1 | p | | | | | | | | | | | 88.6 | p |
| | | | | | | | | | 108.2 | p | | | | | | | | | | | 88.1 | p |
| | | | | | | | | | | | | | | | |
| | | | | | | |
| | | | |
| 2009 | | | 2008 | |
| £m | | | £m | |
| | | | |
| | 5,669 | | | | 4,712 | |
| | | | | | | |
| | (194 | ) | | | 1,017 | |
| | (44 | ) | | | 84 | |
| | 19 | | | | 15 | |
| | 42 | | | | (47 | ) |
| | (24 | ) | | | 5 | |
| | – | | | | (34 | ) |
| | 13 | | | | 3 | |
| | (6 | ) | | | 6 | |
| | 2 | | | | (3 | ) |
| | 1 | | | | – | |
| | (6 | ) | | | – | |
| | – | | | | – | |
| | (659 | ) | | | (1,370 | ) |
| | 183 | | | | 441 | |
| | |
| | (673 | ) | | | 117 | |
| | |
| | | | | | | |
| | 4,996 | | | | 4,829 | |
| | |
| | | | | | | |
| | | | | | | |
| | 4,895 | | | | 4,670 | |
| | 101 | | | | 159 | |
| | |
| | 4,996 | | | | 4,829 | |
| | |
GSK Annual Report 20092010
96106
Consolidated balance sheet
as at 31st December 20092010
| | | | | | | | | |
| | | | | | | | | | | | | | | | | | | |
| | | 2009 | | 2008 | | | 2010 | | 2009 | |
| | | Notes | | £m | | £m | | | Notes | | £m | | £m | |
| | | | | | | | | | | | | |
Non-current assets | | |
| Property, plant and equipment | | 17 | | 9,374 | | 9,678 | | | 17 | | 9,045 | | 9,374 | |
| Goodwill | | 18 | | 3,361 | | 2,101 | | | 18 | | 3,606 | | 3,361 | |
| Other intangible assets | | 19 | | 8,183 | | 5,869 | | | 19 | | 8,532 | | 8,183 | |
| Investments in associates and joint ventures | | 20 | | 895 | | 552 | | | 20 | | 1,081 | | 895 | |
| Other investments | | 21 | | 454 | | 478 | | | 21 | | 711 | | 454 | |
| Deferred tax assets | | 14 | | 2,374 | | 2,760 | | | 14 | | 2,566 | | 2,374 | |
| Derivative financial instruments | | 41 | | 68 | | 107 | | | 41 | | 97 | | 68 | |
| Other non-current assets | | 22 | | 583 | | 579 | | | 22 | | 556 | | 583 | |
| | | | | | | | | | | | | |
| Total non-current assets | | 25,292 | | 22,124 | | | 26,194 | | 25,292 | |
| | | | | | | | | | | | | |
Current assets | | |
| Inventories | | 23 | | 4,064 | | 4,056 | | | 23 | | 3,837 | | 4,064 | |
| Current tax recoverable | | 14 | | 58 | | 76 | | | 14 | | 56 | | 58 | |
| Trade and other receivables | | 24 | | 6,492 | | 6,265 | | | 24 | | 5,793 | | 6,492 | |
| Derivative financial instruments | | 41 | | 129 | | 856 | | | 41 | | 93 | | 129 | |
| Liquid investments | | 32 | | 268 | | 391 | | | 32 | | 184 | | 268 | |
| Cash and cash equivalents | | 25 | | 6,545 | | 5,623 | | | 25 | | 6,057 | | 6,545 | |
| Assets held for sale | | 26 | | 14 | | 2 | | | 26 | | 16 | | 14 | |
| | | | | | | | | | | | | |
| Total current assets | | 17,570 | | 17,269 | | | 16,036 | | 17,570 | |
| | | | | | | | | | | | | |
| Total assets | | 42,862 | | 39,393 | | | 42,230 | | 42,862 | |
| | | | | | | | | | | | | |
Current liabilities | | |
| Short-term borrowings | | 32 | | | (1,471 | ) | | | (956 | ) | | 32 | | | (291 | ) | | | (1,471 | ) |
| Trade and other payables | | 27 | | | (6,772 | ) | | | (6,075 | ) | | 27 | | | (6,888 | ) | | | (6,772 | ) |
| Derivative financial instruments | | 41 | | | (168 | ) | | | (752 | ) | | 41 | | | (188 | ) | | | (168 | ) |
| Current tax payable | | 14 | | | (1,451 | ) | | | (780 | ) | | 14 | | | (1,047 | ) | | | (1,451 | ) |
| Short-term provisions | | 29 | | | (2,256 | ) | | | (1,454 | ) | | 29 | | | (4,380 | ) | | | (2,256 | ) |
| | | | | | | | | | | | | |
| Total current liabilities | | | (12,118 | ) | | | (10,017 | ) | | | (12,794 | ) | | | (12,118 | ) |
| | | | | | | | | | | | | |
Non-current liabilities | | |
| Long-term borrowings | | 32 | | | (14,786 | ) | | | (15,231 | ) | | 32 | | | (14,809 | ) | | | (14,786 | ) |
| Deferred tax liabilities | | 14 | | | (645 | ) | | | (714 | ) | | 14 | | | (707 | ) | | | (645 | ) |
| Pensions and other post-employment benefits | | 28 | | | (2,981 | ) | | | (3,039 | ) | | 28 | | | (2,672 | ) | | | (2,981 | ) |
| Other provisions | | 29 | | | (985 | ) | | | (1,645 | ) | | 29 | | | (904 | ) | | | (985 | ) |
| Derivative financial instruments | | 41 | | – | | | (2 | ) | | 41 | | | (5 | ) | | – | |
| Other non-current liabilities | | 30 | | | (605 | ) | | | (427 | ) | | 30 | | | (594 | ) | | | (605 | ) |
| | | | | | | | | | | | | |
| Total non-current liabilities | | | (20,002 | ) | | | (21,058 | ) | | | (19,691 | ) | | | (20,002 | ) |
| | | | | | | | | | | | | |
| Total liabilities | | | (32,120 | ) | | | (31,075 | ) | | | (32,485 | ) | | | (32,120 | ) |
| | | | | | | | | | | | | |
| Net assets | | 10,742 | | 8,318 | | | 9,745 | | 10,742 | |
| | | | | | | | | | | | |
Equity | | |
| Share capital | | 33 | | 1,416 | | 1,415 | | | 33 | | 1,418 | | 1,416 | |
| Share premium account | | 33 | | 1,368 | | 1,326 | | | 33 | | 1,428 | | 1,368 | |
| Retained earnings | | 34 | | 6,321 | | 4,622 | | | 34 | | 4,779 | | 6,321 | |
| Other reserves | | 34 | | 900 | | 568 | | | 34 | | 1,262 | | 900 | |
| | | | | | | | | | | | | |
| Shareholders’ equity | | 10,005 | | 7,931 | | | 8,887 | | 10,005 | |
| | | | | | | | | | | | | |
| Minority interests | | 737 | | 387 | | |
| Non-controlling interests | | | 858 | | 737 | |
| | | | | | | | | | | | | |
| Total equity | | 10,742 | | 8,318 | | | 9,745 | | 10,742 | |
| | | | | | | | | | | | | |
Approved by the Board on 24th February 20101st March 2011
Sir Christopher Gent
Chairman
GSK Annual Report 20092010
97107
Consolidated statement of changes in equity
for the year ended 31st December 20092010
| | | | | | | | | | | | | | | | | | | | | | | | | | | | | | | | | | | | | | | | | | | | |
| | | Shareholders’ equity | | | | | | | | | |
| | | Share | | Share | | Retained | | Other | | Minority | | Total | | | Shareholders’ equity | | | | | |
| | | capital | | premium | | earnings | | reserves | | Total | | interests | | equity | | | Non- | | | |
| | | £m | | £m | | £m | | £m | | £m | | £m | | £m | | | Share | | Share | | Retained | | Other | | controlling | | Total | |
| | | | | | | | | | | | | | | | | capital | | premium | | earnings | | reserves | | Total | | interests | | equity | |
| At 1st January 2007 | | 1,498 | | 858 | | 6,965 | | 65 | | 9,386 | | 262 | | 9,648 | | |
| | | | £m | | £m | | £m | | £m | | £m | | £m | | £m | |
| | | | | | | | | | | | | | | | |
| At 1st January 2008 | | | 1,503 | | 1,266 | | 6,475 | | 359 | | 9,603 | | 307 | | 9,910 | |
| Profit for the year | | – | | – | | 5,214 | | – | | 5,214 | | 96 | | 5,310 | | | – | | – | | 4,602 | | – | | 4,602 | | 110 | | 4,712 | |
| Other comprehensive income for the year | | – | | – | | 890 | | | (92 | ) | | 798 | | 26 | | 824 | | |
| Distributions to minority interests | | – | | – | | – | | – | | – | | | (77 | ) | | | (77 | ) | |
| Dividends to shareholders | | – | | – | | | (2,793 | ) | | – | | | (2,793 | ) | | – | | | (2,793 | ) | |
| Ordinary shares issued | | 9 | | 408 | | – | | – | | 417 | | – | | 417 | | |
| Ordinary shares purchased and cancelled | | | (4 | ) | | – | | | (213 | ) | | 4 | | | (213 | ) | | – | | | (213 | ) | |
| Ordinary shares purchased and held as Treasury shares | | – | | – | | | (3,537 | ) | | – | | | (3,537 | ) | | – | | | (3,537 | ) | |
| Ordinary shares acquired by ESOP Trusts | | – | | – | | – | | | (26 | ) | | | (26 | ) | | – | | | (26 | ) | |
| Ordinary shares transferred by ESOP Trusts | | – | | – | | – | | 116 | | 116 | | – | | 116 | | |
| Write-down of shares held by ESOP Trusts | | – | | – | | | (292 | ) | | 292 | | – | | – | | - | | |
| Share-based incentive plans | | – | | – | | 237 | | – | | 237 | | – | | 237 | | |
| Tax on share-based incentive plans | | – | | – | | 4 | | – | | 4 | | – | | 4 | | |
| | | | | | | | | | | | | | | | |
| At 31st December 2007 | | 1,503 | | 1,266 | | 6,475 | | 359 | | 9,603 | | 307 | | 9,910 | | |
| Profit for the year | | – | | – | | 4,602 | | – | | 4,602 | | 110 | | 4,712 | | |
| Other comprehensive income for the year | | – | | – | | 121 | | | (53 | ) | | 68 | | 49 | | 117 | | |
| Distributions to minority interests | | – | | – | | – | | – | | – | | | (79 | ) | | | (79 | ) | |
| Other comprehensive income/(expense) for the year | | | – | | – | | 121 | | | (53 | ) | | 68 | | 49 | | 117 | |
| Distributions to non-controlling interests | | | – | | – | | – | | – | | – | | | (79 | ) | | | (79 | ) |
| Dividends to shareholders | | – | | – | | | (2,929 | ) | | – | | | (2,929 | ) | | – | | | (2,929 | ) | | – | | – | | | (2,929 | ) | | – | | | (2,929 | ) | | – | | | (2,929 | ) |
| Ordinary shares issued | | 2 | | 60 | | – | | – | | 62 | | – | | 62 | | | 2 | | 60 | | – | | – | | 62 | | – | | 62 | |
| Ordinary shares purchased and cancelled | | | (90 | ) | | – | | | (3,706 | ) | | 90 | | | (3,706 | ) | | – | | | (3,706 | ) | | | (90 | ) | | – | | | (3,706 | ) | | 90 | | | (3,706 | ) | | – | | | (3,706 | ) |
| Ordinary shares acquired by ESOP Trusts | | – | | – | | – | | | (19 | ) | | | (19 | ) | | – | | | (19 | ) | | – | | – | | – | | | (19 | ) | | | (19 | ) | | – | | | (19 | ) |
| Ordinary shares transferred by ESOP Trusts | | – | | – | | – | | 10 | | 10 | | – | | 10 | | | – | | – | | – | | 10 | | 10 | | – | | 10 | |
| Write-down of shares held by ESOP Trusts | | – | | – | | | (181 | ) | | 181 | | – | | – | | - | | | – | | – | | | (181 | ) | | 181 | | – | | – | | – | |
| Share-based incentive plans | | – | | – | | 241 | | – | | 241 | | – | | 241 | | | – | | – | | 241 | | – | | 241 | | – | | 241 | |
| Tax on share-based incentive plans | | – | | – | | | (1 | ) | | – | | | (1 | ) | | – | | | (1 | ) | | – | | – | | | (1 | ) | | – | | | (1 | ) | | – | | | (1 | ) |
| | | | | | | | | | | | | | | | | | | | | | | | | | | | | |
| At 31st December 2008 | | 1,415 | | 1,326 | | 4,622 | | 568 | | 7,931 | | 387 | | 8,318 | | | 1,415 | | 1,326 | | 4,622 | | 568 | | 7,931 | | 387 | | 8,318 | |
| Profit for the year | | – | | – | | 5,531 | | – | | 5,531 | | 138 | | 5,669 | | | – | | – | | 5,531 | | – | | 5,531 | | 138 | | 5,669 | |
| Other comprehensive expense for the year | | – | | – | | | (663 | ) | | 27 | | | (636 | ) | | | (37 | ) | | | (673 | ) | |
| Distributions to minority interests | | – | | – | | – | | – | | – | | | (89 | ) | | | (89 | ) | |
| Changes in minority shareholdings | | – | | – | | – | | – | | – | | 338 | | 338 | | |
| Put option over minority interest | | – | | – | | – | | | (2 | ) | | | (2 | ) | | – | | | (2 | ) | |
| Other comprehensive (expense)/income for the year | | | – | | – | | | (663 | ) | | 27 | | | (636 | ) | | | (37 | ) | | | (673 | ) |
| Distributions to non-controlling interests | | | – | | – | | – | | – | | – | | | (89 | ) | | | (89 | ) |
| Changes in non-controlling interests | | | – | | – | | – | | – | | – | | 338 | | 338 | |
| Put option over non-controlling interest | | | – | | – | | – | | | (2 | ) | | | (2 | ) | | – | | | (2 | ) |
| Dividends to shareholders | | – | | – | | | (3,003 | ) | | – | | | (3,003 | ) | | – | | | (3,003 | ) | | – | | – | | | (3,003 | ) | | – | | | (3,003 | ) | | – | | | (3,003 | ) |
| Ordinary shares issued | | 1 | | 42 | | – | | – | | 43 | | – | | 43 | | | 1 | | 42 | | – | | – | | 43 | | – | | 43 | |
| Ordinary shares acquired by ESOP Trusts | | – | | – | | – | | | (57 | ) | | | (57 | ) | | – | | | (57 | ) | | – | | – | | – | | | (57 | ) | | | (57 | ) | | – | | | (57 | ) |
| Ordinary shares transferred by ESOP Trusts | | – | | – | | – | | 13 | | 13 | | – | | 13 | | | – | | – | | – | | 13 | | 13 | | – | | 13 | |
| Write-down of shares held by ESOP Trusts | | – | | – | | | (351 | ) | | 351 | | – | | – | | - | | | – | | – | | | (351 | ) | | 351 | | – | | – | | – | |
| Share-based incentive plans | | – | | – | | 171 | | – | | 171 | | – | | 171 | | | – | | – | | 171 | | – | | 171 | | – | | 171 | |
| Tax on share-based incentive plans | | – | | – | | 14 | | – | | 14 | | – | | 14 | | | – | | – | | 14 | | – | | 14 | | – | | 14 | |
| | | | | | | | | | | | | | | | | | | | | | | | | | | | | |
| At 31st December 2009 | | 1,416 | | 1,368 | | 6,321 | | 900 | | 10,005 | | 737 | | 10,742 | | | 1,416 | | 1,368 | | 6,321 | | 900 | | 10,005 | | 737 | | 10,742 | |
| Profit for the year | | | – | | – | | 1,634 | | – | | 1,634 | | 219 | | 1,853 | |
| Other comprehensive income for the year | | | – | | – | | 144 | | 69 | | 213 | | 20 | | 233 | |
| Distributions to non-controlling interests | | | – | | – | | – | | – | | – | | | (118 | ) | | | (118 | ) |
| Dividends to shareholders | | | – | | – | | | (3,205 | ) | | – | | | (3,205 | ) | | – | | | (3,205 | ) |
| Ordinary shares issued | | | 2 | | 60 | | – | | – | | 62 | | – | | 62 | |
| Ordinary shares acquired by ESOP Trusts | | | – | | – | | – | | | (16 | ) | | | (16 | ) | | – | | | (16 | ) |
| Ordinary shares transferred by ESOP Trusts | | | – | | – | | – | | 17 | | 17 | | – | | 17 | |
| Write-down of shares held by ESOP Trusts | | | – | | – | | | (292 | ) | | 292 | | – | | – | | – | |
| Share-based incentive plans | | | – | | – | | 175 | | – | | 175 | | – | | 175 | |
| Tax on share-based incentive plans | | | – | | – | | 2 | | – | | 2 | | – | | 2 | |
| | | | | | | | | | | | | | | | | | | | | | | | | | | | | |
| At 31st December 2010 | | | 1,418 | | 1,428 | | 4,779 | | 1,262 | | 8,887 | | 858 | | 9,745 | |
| | | | | | | | | | | | | | | | |
GSK Annual Report 20092010
98108
Consolidated cash flow statement
for the year ended 31st December 20092010
| | | | | | | | | | | |
| | | | | | | | | | |
| | | | | | | | | | | | | | | | | | | 2010 | | 2009 | | 2008 | |
| | | 2009 | | 2008 | | 2007 | | | Notes | | £m | | £m | | £m | |
| | | Notes | | £m | | £m | | £m | | | | | | | | | |
| | | | | | | | | |
Cash flow from operating activities | | |
| Profit after taxation for the year | | 5,669 | | 4,712 | | 5,310 | | | 1,853 | | 5,669 | | 4,712 | |
| Adjustments reconciling profit after tax to operating cash flows | | 36 | | 3,876 | | 4,343 | | 2,770 | | | 36 | | 6,778 | | 3,876 | | 4,343 | |
| | | | | | | | | | | | | | | | | |
| Cash generated from operations | | 9,545 | | 9,055 | | 8,080 | | | 8,631 | | 9,545 | | 9,055 | |
| Taxation paid | | | (1,704 | ) | | | (1,850 | ) | | | (1,919 | ) | | | (1,834 | ) | | | (1,704 | ) | | | (1,850 | ) |
| | | | | | | | | | | | | | | | | |
| Net cash inflow from operating activities | | 7,841 | | 7,205 | | 6,161 | | | 6,797 | | 7,841 | | 7,205 | |
| | | | | | | | | | | | | | | | | |
| | |
Cash flow from investing activities | | |
| Purchase of property, plant and equipment | | | (1,418 | ) | | | (1,437 | ) | | | (1,516 | ) | | | (1,014 | ) | | | (1,418 | ) | | | (1,437 | ) |
| Proceeds from sale of property, plant and equipment | | 48 | | 20 | | 35 | | | 92 | | 48 | | 20 | |
| Purchase of intangible assets | | | (455 | ) | | | (632 | ) | | | (627 | ) | | | (621 | ) | | | (455 | ) | | | (632 | ) |
| Proceeds from sale of intangible assets | | 356 | | 171 | | 9 | | | 126 | | 356 | | 171 | |
| Purchase of equity investments | | | (154 | ) | | | (87 | ) | | | (186 | ) | | | (279 | ) | | | (154 | ) | | | (87 | ) |
| Proceeds from sale of equity investments | | 59 | | 42 | | 45 | | | 27 | | 59 | | 42 | |
| Purchase of businesses, net of cash acquired | | 38 | | | (2,792 | ) | | | (454 | ) | | | (1,027 | ) | | 38 | | | (354 | ) | | | (2,792 | ) | | | (454 | ) |
| Investments in associates and joint ventures | | 38 | | | (29 | ) | | | (9 | ) | | | (1 | ) | | 38 | | | (61 | ) | | | (29 | ) | | | (9 | ) |
| Decrease/(increase) in liquid investments | | 87 | | 905 | | | (39 | ) | |
| Decrease in liquid investments | | | 91 | | 87 | | 905 | |
| Interest received | | 90 | | 320 | | 247 | | | 107 | | 90 | | 320 | |
| Dividends from associates and joint ventures | | 17 | | 12 | | 12 | | | 18 | | 17 | | 12 | |
| Proceeds from disposal of associates | | 178 | | – | | – | | | – | | 178 | | – | |
| | | | | | | | | | |
| | | | | | | | | | |
| Net cash outflow from investing activities | | | (4,013 | ) | | | (1,149 | ) | | | (3,048 | ) | | | (1,868 | ) | | | (4,013 | ) | | | (1,149 | ) |
| | | | | | | | | | |
| | | | | | | | | | |
| | |
Cash flow from financing activities | | |
| Proceeds from own shares for employee share options | | 13 | | 9 | | 116 | | | 17 | | 13 | | 9 | |
| Shares acquired by ESOP Trusts | | | (57 | ) | | | (19 | ) | | | (26 | ) | | | (16 | ) | | | (57 | ) | | | (19 | ) |
| Issue of share capital | | 33 | | 43 | | 62 | | 417 | | | 33 | | 62 | | 43 | | 62 | |
| Purchase of own shares for cancellation | | – | | | (3,706 | ) | | | (213 | ) | | – | | – | | | (3,706 | ) |
| Purchase of Treasury shares | | – | | – | | | (3,538 | ) | |
| Increase in long-term loans | | 1,358 | | 5,523 | | 3,483 | | | – | | 1,358 | | 5,523 | |
| Repayment of long-term loans | | – | | – | | | (207 | ) | |
| Increase in short-term loans | | 646 | | 275 | | 2,057 | | | 6 | | 646 | | 275 | |
| Repayment of short-term loans | | | (748 | ) | | | (3,334 | ) | | | (425 | ) | | | (1,296 | ) | | | (748 | ) | | | (3,334 | ) |
| Net repayment of obligations under finance leases | | | (48 | ) | | | (48 | ) | | | (39 | ) | | | (45 | ) | | | (48 | ) | | | (48 | ) |
| Interest paid | | | (780 | ) | | | (730 | ) | | | (378 | ) | | | (775 | ) | | | (780 | ) | | | (730 | ) |
| Dividends paid to shareholders | | | (3,003 | ) | | | (2,929 | ) | | | (2,793 | ) | | | (3,205 | ) | | | (3,003 | ) | | | (2,929 | ) |
| Dividends paid to minority interests | | | (89 | ) | | | (79 | ) | | | (77 | ) | |
| Distributions to non-controlling interests | | | | (118 | ) | | | (89 | ) | | | (79 | ) |
| Other financing cash flows | | | (109 | ) | | 68 | | | (79 | ) | | | (201 | ) | | | (109 | ) | | 68 | |
| | | | | | | | | | | | | | | | | |
| Net cash outflow from financing activities | | | (2,774 | ) | | | (4,908 | ) | | | (1,702 | ) | | | (5,571 | ) | | | (2,774 | ) | | | (4,908 | ) |
| | | | | | | | | | | | | | | | | |
| | |
| Increase in cash and bank overdrafts | | 37 | | 1,054 | | 1,148 | | 1,411 | | |
| (Decrease)/increase in cash and bank overdrafts | | | 37 | | | (642 | ) | | 1,054 | | 1,148 | |
| | |
| Exchange adjustments | | | (158 | ) | | 1,103 | | 48 | | | 81 | | | (158 | ) | | 1,103 | |
| Cash and bank overdrafts at beginning of year | | 5,472 | | 3,221 | | 1,762 | | | 6,368 | | 5,472 | | 3,221 | |
| | | | | | | | | | | | | | | | | |
| Cash and bank overdrafts at end of year | | 6,368 | | 5,472 | | 3,221 | | | 5,807 | | 6,368 | | 5,472 | |
| | | | | | | | | | | | | | | | |
| | |
| Cash and bank overdrafts at end of year comprise: | | |
| Cash and cash equivalents | | 6,545 | | 5,623 | | 3,379 | | | 6,057 | | 6,545 | | 5,623 | |
| Overdrafts | | | (177 | ) | | | (151 | ) | | | (158 | ) | | | (250 | ) | | | (177 | ) | | | (151 | ) |
| | | | | | | | | | | | | | | | | |
| | | 6,368 | | 5,472 | | 3,221 | | | 5,807 | | 6,368 | | 5,472 | |
| | | | | | | | | | | | | | | | | |
GSK Annual Report 20092010
99109
Notes to the financial statements
1Presentation of the financial statements
Description of business
GlaxoSmithKline is a major global healthcare group which is engaged in the creation and discovery, development, manufacture and marketing of pharmaceutical products including vaccines, over-the-counter (OTC) medicines and health-related consumer products. GSK’s principal pharmaceutical products include medicines in the following therapeutic areas: respiratory, anti-virals including HIV, central nervous system, cardiovascular and urogenital, metabolic, anti-bacterials, oncology and emesis, dermatalogicalsvaccines and vaccines.dermatologicals.
Compliance with applicable law and IFRS
The financial statements have been prepared in accordance with the Companies Act 2006, Article 4 of the IAS Regulation and International Accounting Standards (IAS) and International Financial Reporting Standards (IFRS) and related interpretations, as adopted by the European Union.
The financial statements are also in compliance with IFRS as issued by the International Accounting Standards Board.
Composition of financial statements
The consolidated financial statements are drawn up in Sterling, the functional currency of GlaxoSmithKline plc, and in accordance with IFRS accounting presentation. The financial statements comprise:
Consolidated income statement
Consolidated statement of comprehensive income
Consolidated balance sheet
Consolidated statement of changes in equity
Consolidated cash flow statement
Notes to the financial statements.
| • | | Consolidated income statement |
|
| • | | Consolidated statement of comprehensive income |
|
| • | | Consolidated balance sheet |
|
| • | | Consolidated statement of changes in equity |
|
| • | | Consolidated cash flow statement |
|
| • | | Notes to the financial statements. |
Accounting convention
The financial statements have been prepared using the historical cost convention, as modified by the revaluation of certain items, as stated in the accounting policies.
Financial period
These financial statements cover the financial year from 1st January to 31st December 2009,2010, with comparative figures for the financial years from 1st January to 31st December 20082009 and, where appropriate, from 1st January to 31st December 2007.2008.
Composition of the Group
A list of the subsidiary and associated undertakings which, in the opinion of the Directors, principally affected the amount of profit or the net assets of the Group is given in Note 43, ‘Principal Group companies’.
Presentation of restructuring costs
In October 2007, the Board approved the implementation of a detailed formal plan for, and GSK announced, a significant new Operational Excellence restructuring programme. A second formal plan, representing a significant expansion of the Operational Excellence programme, was approved by the Board and announced in February 2009. A further expansion was approved by the Board and announced in February 2010. This restructuring programme, comprising these detailed formal plans, covers all areas of GSK’s business, including manufacturing, selling, R&D and infrastructure.
With an estimated total cost of approximately £4.5 billion, the expanded programme is expected to deliver annual pre-tax savings of approximately £2.2 billion by the time it is substantially complete in 2012. Given the extent and cost of the Operational Excellence programme, management believes it has a material impact on GSK’s operating results and on the manner in which GSK’s business is conducted. GSK presents the restructuring costs incurred solely as a direct result of the Operational Excellence programme in a separate column in the income statement titled ‘Major restructuring’.
In addition to the restructuring costs of the Operational Excellence programme, the major restructuring column in the income statement includes restructuring costs incurred solely as a direct result of any restructuring programmes that follow, and relate to, material acquisitions where the operations of the acquired business overlap extensively with GSK’s existing operations. The restructuring activities that follow, and relate to, such acquisitions are of the same nature as those undertaken under the Operational Excellence programme and are also carried out following a detailed formal plan. Management therefore considers it appropriate to present the costs of these restructuring activities in the same manner. The $1.65 billion (£814 million) acquisition of Reliant Pharmaceuticals in December 2007 and the $3.6 billion (£2.2 billion) acquisition of Stiefel Laboratories in July 2009 are the only acquisitions since October 2007 that meet the criteria set out above and are the only acquisitions where the costs incurred as a direct result of a related restructuring programme have been included within the major restructuring column.
The Group’s results before the costs of the Operational Excellence programme and acquisition-related restructuring programmes meeting the criteria described above are also presented in a separate column in the income statement and are described as ‘Results before major restructuring’. This presentation, which GSK intends to apply consistently to future major restructuring programmes that have a material impact on GSK’s operating results and on the manner in which GSK’s business is conducted, has been adopted to show clearly the Group’s results both before and after the costs of these restructuring programmes. Management believes that this presentation assists investors in gaining a clearer understanding of the Group’s financial performance and in making projections of future financial performance, as results that include such costs, by virtue of their size and nature, have limited comparative value. This presentation is also consistent with the way management assesses the Group’s financial performance.
Any restructuring costs that do not arise solely as a direct result of the Operational Excellence programme and restructuring programmes following, and relating to, acquisitions meeting the criteria described above continue to be reported in operating expenses within results before major restructuring.
GSK Annual Report 20092010
100110
Notes to the financial statements
1Presentation of the financial statements
continued
Accounting principles and policies
The preparation of the financial statements in conformity with generally accepted accounting principles requires management to make estimates and assumptions that affect the reported amounts of assets and liabilities and disclosure of contingent assets and liabilities at the date of the financial statements and the reported amounts of revenues and expenses during the reporting period. Actual results could differ from those estimates.
The financial statements have been prepared in accordance with the Group’s accounting policies approved by the Board and described in Note 2, ‘Accounting principles and policies’. Information on the application of these accounting policies, including areas of estimation and judgement is given in Note 3, ‘Key accounting judgements and estimates’. Where appropriate, comparative figures are reclassified to ensure a consistent presentation with current year information.
Implementation of new accounting standards
With effect from 1st January 2009,2010, GSK has implemented IFRS 8 ‘Operating segments’,3 (Revised) ‘Business combinations’ and IAS 127 (Revised) ‘Presentation of‘Consolidated and separate financial statements’, IAS 23 (Revised) ‘Borrowing costs’ and minor amendments to a number of other accounting standards. IFRS 3 (Revised) and IAS 27 (Revised) have been implemented prospectively, with no restatement of comparative information.
The implementationrevised accounting policy on business combinations is set out in Note 2, ‘Accounting principles and policies’, and acquisitions during the year are discussed in Note 38, ‘Acquisitions and disposals’. The revisions to IAS 27 had no impact on the current period.
Parent company financial statements
The financial statements of IFRS 8 has resultedthe parent company, GlaxoSmithKline plc, have been prepared in changes to the segmental information reported by GSK. Comparative information has beenaccordance with UK GAAP and with UK accounting presentation. The company balance sheet is presented on a consistent basis. Further information ispage 188 and the accounting policies are given in Note 6, ‘Segment information’.on page 189.
2Accounting principles and policies
Consolidation
The consolidated financial statements include:
the assets and liabilities, and the results and cash flows, of the company and its subsidiaries, including ESOP Trusts
the Group’s share of the results and net assets of associates and joint ventures.
The financial statements of entities consolidated are made up to 31st December each year.
Entities over which the Group has the power to govern the financial and operating policies are accounted for as subsidiaries. Where the Group has the ability to exercise joint control, the entities are accounted for as joint ventures, and where the Group has the ability to exercise significant influence, they are accounted for as associates. The results and assets and liabilities of associates and joint ventures are incorporated into the consolidated financial statements using the equity method of accounting.
Interests acquired in entities are consolidated from the date the Group acquires control and interests sold are de-consolidated from the date control ceases.
Transactions and balances between subsidiaries are eliminated and no profit before tax is taken on sales between subsidiaries until the products are sold to customers outside the Group. The relevant proportion of profits on transactions with joint ventures and associates is also deferred until the products are sold to third parties. Deferred tax relief on unrealised intra-Group profit is accounted for only to the extent that it is considered recoverable.
Goodwill arising on the acquisition of interests in subsidiaries, joint ventures and associates, representing the excess of the acquisition cost over the Group’s share of the fair values of the identifiable assets, liabilities and contingent liabilities acquired, is capitalised as a separate item in the case of subsidiaries and as part of the cost of investment in the case of joint ventures and associates. Goodwill is denominated in the currency of the operation acquired.
Where the cost of acquisition is below the fair value of the net assets acquired, the difference is recognised directly in the income statement.
Business combinations
Business combinations are accounted for using the acquisition accounting method. Identifiable assets, liabilities and contingent liabilities acquired are measured at fair value at acquisition date. The consideration transferred is measured at fair value and includes the fair value of any contingent consideration. The costs of acquisition are charged to the income statement in the period in which they are incurred.
Where not all of the equity of a subsidiary is acquired the non-controlling interest is recognised either at fair value or at the non-controlling interest’s share of the net assets of the subsidiary, on a case-by-case basis. Changes in the Group’s ownership percentage of subsidiaries are accounted for within equity.
GSK Annual Report 20092010
101111
Notes to the financial statements
2Accounting principles and policiescontinued
Foreign currency translation
Foreign currency transactions are booked in the functional currency of the Group company at the exchange rate ruling on the date of transaction. Foreign currency monetary assets and liabilities are retranslated into the functional currency at rates of exchange ruling at the balance sheet date. Exchange differences are included in the income statement.
On consolidation, assets and liabilities, including related goodwill, of overseas subsidiaries, associates and joint ventures, are translated into Sterling at rates of exchange ruling at the balance sheet date. The results and cash flows of overseas subsidiaries, associates and joint ventures are translated into Sterling using average rates of exchange.
Exchange adjustments arising when the opening net assets and the profits for the year retained by overseas subsidiaries, associates and joint ventures are translated into Sterling, less exchange differences arising on related foreign currency borrowings which hedge the Group’s net investment in these operations, are taken to a separate component of equity.
When translating into Sterling the assets, liabilities, results and cash flows of overseas subsidiaries, associates and joint ventures which are reported in currencies of hyper-inflationary economies, adjustments are made where material to reflect current price levels. Any loss on net monetary assets is charged to the consolidated income statement.
Revenue
Revenue is recognised in the income statement when goods or services are supplied or made available to external customers against orders received, title and risk of loss is passed to the customer, and reliable estimates can be made of relevant deductions. deductions and all relevant obligations have been fulfilled, such that the earnings process is regarded as being complete.
Turnover represents net invoice value after the deduction of discounts and allowances given and accruals for estimated future rebates and returns. The methodology and assumptions used to estimate rebates and returns are monitored and adjusted regularly in the light of contractual and legal obligations, historical trends, past experience and projected market conditions. Market conditions are evaluated using wholesaler and other third-party analyses, market research data and internally generated information. Value added tax and other sales taxes are excluded from revenue.
Where the Group co-promotes a product and the third party records the sale, the Group records its share of revenue as co-promotion income within turnover. The nature of co-promotion activities is such that the Group records no costs of sales. Pharmaceutical turnover includes co-promotion revenue of £294 million (2009 – £439 million (2008million; 2008 – £378 million; 2007 – £274 million).
Royalty income is recognised in other operating income on an accruals basis in accordance with the terms of the relevant licensing agreements.
Expenditure
Expenditure is recognised in respect of goods and services received when supplied in accordance with contractual terms. Provision is made when an obligation exists for a future liability in respect of a past event and where the amount of the obligation can be reliably estimated. Manufacturing start-up costs between validation and the achievement of normal production are expensed as incurred. Advertising and promotion expenditure is charged to the income statement as incurred. Shipment costs on intercompanyinter-company transfers are charged to cost of sales; distribution costs on sales to customers are included in selling, general and administrative expenditure.
Restructuring costs are recognised and provided for, where appropriate, in respect of the direct expenditure of a business reorganisation where the plans are sufficiently detailed and well advanced, and where appropriate communication to those affected has been undertaken.
Research and development
Research and development expenditure is charged to the income statement in the period in which it is incurred. Development expenditure is capitalised when the criteria for recognising an asset are met, usually when a regulatory filing has been made in a major market and approval is considered highly probable. Property, plant and equipment used for research and development is capitalised and depreciated in accordance with the Group’s policy.
Environmental expenditure
Environmental expenditure related to existing conditions resulting from past or current operations and from which no current or future benefit is discernible is charged to the income statement. The Group recognises its liability on a site-by-site basis when it can be reliably estimated. This liability includes the Group’s portion of the total costs and also a portion of other potentially responsible parties’ costs when it is probable that they will not be able to satisfy their respective shares of the clean-up obligation. Recoveries of reimbursements are recorded as assets when virtually certain.
Legal and other disputes
Provision is made for the anticipated settlement costs of legal or other disputes against the Group where an outflow of resources is considered probable and a reasonablereliable estimate can be made of the likely outcome. In addition, provision is made for legal or other expenses arising from claims received or other disputes. In respect of product liability claims related to certain products, where there is sufficient history of claims made and settlements to enable management to make a reliable estimate of the provision required to cover unasserted claims. In certain cases, an incurred but not reported (IBNR) actuarial technique is used to determine a reasonable estimate of the Group’s exposure to unasserted claims for those products and a provision is made on that basis.this estimate.
No provision is made for other unasserted claims. In respect of a number ofThe Group may become involved in legal proceedings, in respect of which the Group is involved, it is not possible to make a reasonablereliable estimate of the expected financial effect, if any, that willcould result from ultimate resolution of the proceedings. In these cases, the Group may disclose information with respect to the nature and facts of the caseappropriate disclosure about such cases would be included but no provision is typicallywould be made. Costs associated with claims made by the Group against third parties are charged to the income statement as they are incurred.
GSK Annual Report 20092010
102112
Notes to the financial statements
2Accounting principles and policiescontinued
Pensions and other post-employment benefits
The costs of providing pensions under defined benefit schemes are calculated using the projected unit credit method and spread over the period during which benefit is expected to be derived from the employees’ services, consistent with the advice of qualified actuaries. Pension obligations are measured as the present value of estimated future cash flows discounted at rates reflecting the yields of high quality corporate bonds.
Pension scheme assets are measured at fair value at the balance sheet date. Actuarial gains and losses, differences between the expected and actual returns of assets and the effect of changes in actuarial assumptions, are recognised in the statement of comprehensive income in the year in which they arise.
The Group’s contributions to defined contribution plans are charged to the income statement as incurred. The costs of other post-employment liabilities are calculated in a similar way to defined benefit pension schemes and spread over the period during which benefit is expected to be derived from the employees’ services, in accordance with the advice of qualified actuaries.
Employee share plans
Incentives in the form of shares are provided to employees under share option and share award schemes.
The fair values of these options and awards are calculated at their grant dates using a Black-Scholes option pricing model and charged to the income statement over the relevant vesting periods.
The Group provides finance to ESOP Trusts to purchase company shares on the open market to meet the obligation to provide shares when employees exercise their options or awards. Costs of running the ESOP Trusts are charged to the income statement. Shares held by the ESOP Trusts are deducted from other reserves. A transfer is made between other reserves and retained earnings over the vesting periods of the related share options or awards to reflect the ultimate proceeds receivable from employees on exercise.
Property, plant and equipment
Property, plant and equipment (PP&E) is stated at the cost of purchase or construction less provisions for depreciation and impairment. Financing costs are capitalised within the cost of qualifying assets in construction.
Depreciation is calculated to write off the cost less residual value of PP&E, excluding freehold land, using the straight-line basis over the expected useful life. Residual values and lives are reviewed, and where appropriate adjusted, annually. The normal expected useful lives of the major categories of PP&E are:
| | | |
| |
| Freehold buildings | | 20 to 50 years |
| Leasehold land and buildings | | Lease term or 20 to 50 years |
| Plant and machinery | | 10 to 20 years |
| Fixtures and equipment | | 3 to 10 years |
| |
On disposal of PP&E, the cost and related accumulated depreciation and impairments are removed from the financial statements and the net amount, less any proceeds, is taken to the income statement.
Leases
Leasing agreements which transfer to the Group substantially all the benefits and risks of ownership of an asset are treated as finance leases, as if the asset had been purchased outright. The assets are included in PP&E or computer software and the capital elements of the leasing commitments are shown as obligations under finance leases. Assets held under finance leases are depreciated on a basis consistent with similar owned assets or the lease term if shorter. The interest element of the lease rental is included in the income statement. All other leases are operating leases and the rental costs are charged to the income statement on a straight-line basis over the lease term.
Goodwill
Goodwill is stated at cost less impairments. Goodwill is deemed to have an indefinite useful life and is tested for impairment annually.
Where the fair value of the interest acquired in an entity’s assets, liabilities and contingent liabilities exceeds the consideration paid, this excess is recognised immediately as a gain in the income statement.
Other intangible assets
Intangible assets are stated at cost less provisions for amortisation and impairments.
Licences, patents, know-how and marketing rights separately acquired or acquired as part of a business combination are amortised over their estimated useful lives, generally not exceeding 20 years, using the straight-line basis, from the time they are available for use. The estimated useful lives for determining the amortisation charge take into account patent lives, where applicable, as well as the value obtained from periods of non-exclusivity. Asset lives are reviewed, and where appropriate adjusted, annually. Contingent milestone payments are recognised at the point that the contingent event becomes certain. Any development costs incurred by the Group and associated with acquired licences, patents, know-how or marketing rights are written off to the income statement when incurred, unless the criteria for recognition of an internally generated intangible asset are met, usually when a regulatory filing has been made in a major market and approval is considered highly probable.
Acquired brands are valued independently as part of the fair value of businesses acquired from third parties where the brand has a value which is substantial and long-term and where the brands either are contractual or legal in nature or can be sold separately from the rest of the businesses acquired. Brands are amortised over their estimated useful lives of up to 20 years, except where it is considered that the useful economic life is indefinite.
The costs of acquiring and developing computer software for internal use and internet sites for external use are capitalised as intangible fixed assets where the software or site supports a significant business system and the expenditure leads to the creation of a durable asset. ERP systems software is amortised over seven years and other computer software over three to five years.
GSK Annual Report 20092010
103113
Notes to the financial statements
2Accounting principles and policiescontinued
Impairment of non-current assets
The carrying values of all non-current assets are reviewed for impairment when there is an indication that the assets might be impaired. Additionally, goodwill, intangible assets with indefinite useful lives and intangible assets which are not yet available for use are tested for impairment annually. Any provision for impairment is charged to the income statement in the year concerned.
Impairments of goodwill are not reversed. Impairment losses on other non-current assets are only reversed if there has been a change in estimates used to determine recoverable amounts and only to the extent that the revised recoverable amounts do not exceed the carrying values that would have existed, net of depreciation or amortisation, had no impairments been recognised.
Investments in associates and joint ventures
Investments in associates and joint ventures are carried in the consolidated balance sheet at the Group’s share of their net assets at date of acquisition and of their post-acquisition retained profits or losses together with any goodwill arising on the acquisition.
Available-for-sale investments
Liquid investments and other investments are classified as available-for-sale investments and are initially recorded at fair value plus transaction costs and then remeasured at subsequent reporting dates to fair value. Unrealised gains and losses on available-for-sale investments are recognised directly in other comprehensive income. Impairments arising from the significant or prolonged decline in fair value of an equity investment reduce the carrying amount of the asset directly and are charged to the income statement.
On disposal or impairment of the investments, any gains and losses that have been deferred in other comprehensive income are reclassified to the income statement. Dividends on equity investments are recognised in the income statement when the Group’s right to receive payment is established. Equity investments are recorded in non-current assets unless they are expected to be sold within one year.
Purchases and sales of equity investments are accounted for on the trade date and purchases and sales of other available-for-sale investments are accounted for on settlement date.
Inventories
Inventories are included in the financial statements at the lower of cost (including raw materials, direct labour, other direct costs and related production overheads) and net realisable value. Cost is generally determined on a first in, first out basis. Pre-launch inventory is held as an asset when there is a high probability of regulatory approval for the product. Before that point a provision is made against the carrying value to its recoverable amount; the provision is then reversed at the point when a high probability of regulatory approval is determined.
Trade receivables
Trade receivables are carried at original invoice amount less any provisions for doubtful debts. Provisions are made where there is evidence of a risk of non-payment, taking into account ageing, previous experience and general economic conditions. When a trade receivable is determined to be uncollectable it is written off, firstly against any provision available and then to the income statement.
Subsequent recoveries of amounts previously provided for are credited to the income statement. Long-term receivables are discounted where the effect is material.
Trade payables
Trade payables are held at amortised cost which equates to nominal value. Long-term payables are discounted where the effect is material.
Cash and cash equivalents
Cash and cash equivalents comprise cash in hand, current balances with banks and similar institutions and highly liquid investments generally with original maturities of three months or less. They are readily convertible into known amounts of cash and have an insignificant risk of changes in value.
Borrowings
All borrowings are initially recorded at the amount of proceeds received, net of transaction costs. Borrowings are subsequently carried at amortised cost, with the difference between the proceeds, net of transaction costs, and the amount due on redemption being recognised as a charge to the income statement over the period of the relevant borrowing.
Taxation
Current tax is provided at the amounts expected to be paid applying tax rates that have been enacted or substantively enacted by the balance sheet date.
Deferred tax is provided in full, using the liability method, on temporary differences arising between the tax bases of assets and liabilities and their carrying amounts in the financial statements. Deferred tax assets are recognised to the extent that it is probable that future taxable profits will be available against which the temporary differences can be utilised. Deferred tax is provided on temporary differences arising on investments in subsidiaries, associates and joint ventures, except where the timing of the reversal of the temporary difference can be controlled and it is probable that the temporary difference will not reverse in the foreseeable future. Deferred tax is provided using rates of tax that have been enacted or substantively enacted by the balance sheet date. Deferred tax liabilities and assets are not discounted.
GSK Annual Report 20092010
104114
Notes to the financial statements
2Accounting principles and policiescontinued
Derivative financial instruments and hedging
Derivative financial instruments are used to manage exposure to market risks from treasury operations.risks. The principal derivative instruments used by GlaxoSmithKlineGSK are foreign currency swaps, interest rate swaps and forward foreign exchange contracts. The Group does not hold or issue derivative financial instruments for trading or speculative purposes.
Derivative financial instruments are classified as held-for-trading and are carried in the balance sheet at fair value. Derivatives designated as hedging instruments are classified on inception as cash flow hedges, net investment hedges or fair value hedges.
Changes in the fair value of derivatives designated as cash flow hedges are recognised in other comprehensive income to the extent that the hedges are effective. Ineffective portions are recognised in profit or loss immediately. Amounts deferred in other comprehensive income are reclassified to the income statement when the hedged item affects profit or loss.
Net investment hedges are accounted for in a similar way to cash flow hedges.
Changes in the fair value of derivatives designated as fair value hedges are recorded in the income statement, together with the changes in the fair value of the hedged asset or liability.
Changes in the fair value of any derivative instruments that do not qualify for hedge accounting are recognised immediately in the income statement.
Discounting
Where the time effect of money is material, balances are discounted to current values using appropriate rates of interest. The unwinding of the discounts is recorded in finance income and finance costs.
3Key accounting judgements and estimates
In preparing the financial statements, management is required to make estimates and assumptions that affect the amounts of assets, liabilities, revenue and expenses reported in the financial statements. Actual amounts and results could differ from those estimates. The following are considered to be the key accounting judgements and estimates made.
Turnover
Revenue is recognised when title and risk of loss is passed to the customer, and reliable estimates can be made of relevant deductions. deductions and all relevant obligations have been fulfilled, such that the earnings process is regarded as being complete.
Gross turnover is reduced by rebates, discounts, allowances and product returns given or expected to be given, which vary by product arrangements and buying groups. These arrangements with purchasing organisations are dependent upon the submission of claims some time after the initial recognition of the sale. Accruals are made at the time of sale for the estimated rebates, discounts or allowances payable or returns to be made, based on available market information and historical experience.
Because the amounts are estimated they may not fully reflect the final outcome, and the amounts are subject to change dependent upon, amongst other things, the types of buying group and product sales mix.
The level of accrual is reviewed and adjusted regularly in the light of contractual and legal obligations, historical trends, past experience and projected market conditions. Market conditions are evaluated using wholesaler and other third-party analyses, market research data and internally generated information. Future events could cause the assumptions on which the accruals are based to change, which could affect the future results of the Group.
Taxation
Current tax is provided at the amounts expected to be paid, and deferred tax is provided on temporary differences between the tax bases of assets and liabilities and their carrying amounts, at the rates that have been enacted or substantively enacted by the balance sheet date.
The Group has open tax issues with a number of revenue authorities. GSK continues to believe that it has made adequate provision for the liabilities likely to arise from open assessments. Where open issues exist the ultimate liability for such matters may vary from the amounts provided and is dependent upon the outcome of negotiations with the relevant tax authorities or, if necessary, litigation proceedings.
GSK Annual Report 20092010
105115
Notes to the financial statements
3Key accounting judgements and estimates
continued
Legal and other disputes
GSK provides for anticipated settlement costs where an outflow of resources is considered probable and a reasonablereliable estimate may be made of the likely outcome of the dispute and legal and other expenses arising from claims against the Group.
The company’s Directors, having taken legal advice, have established provisions after taking into account the relevant facts and circumstances of each matter and in accordance with accounting requirements. Provisions forIn respect of product liability claims onrelated to certain products have been made on an ‘incurred but not reported’ basis wherethere is sufficient history of claims made and settlements is available. No provisions have been made for otherto enable management to make a reliable estimate of the provision required to cover unasserted claims. In respect of a number ofcertain cases, an incurred but not reported (IBNR) actuarial technique is used to determine this estimate. The Group may become involved in legal proceedings, in respect of which the Group is involved, it is not possible to make a reasonablereliable estimate of the expected financial effect, if any, that willcould result from ultimate resolution of the proceedings. In these cases, the Group may disclose information with respect to the nature and facts of theappropriate disclosure about such cases would be included, but no provision is typicallywould be made. At 31st December 20092010 provisions for legal and other disputes amounted to £2,020 million (2008£4.0 billion (2009 – £1,903 million)£2.0 billion).
The ultimate liability for legal claims may vary from the amounts provided and is dependent upon the outcome of litigation proceedings, investigations and possible settlement negotiations. The position could change over time and, therefore, there can therefore, be no assurance that any losses that result from the outcome of any legal proceedings will not exceed the amount of the provisions reported in the Group’s financial statements.statements by a material amount.
Property, plant and equipment
TheAs set out in Note 17, ‘Property plant and equipment’ the carrying values of property, plant and equipment are tested for impairment when there is an indication that the values of the assets might be impaired. Impairment is determined by reference to the higher of fair value less costs to sell and value in use, measured by assessing risk-adjusted future cash flows discounted using appropriate interest rates. These future cash flows are based on business forecasts and are therefore inherently judgemental. Future events could cause the assumptions used in these impairment tests as set out in Note 17, ‘Property, plant and equipment’, to change, with a consequent adverse effect on the future results of the Group.
Goodwill
Goodwill arising on business combinations is capitalised and allocated to an appropriate cash generating unit. It is deemed to have an indefinite life and so is not amortised. Annual impairment tests of the relevant cash generating units are performed. Impairment tests are based on established market multiples or risk-adjusted future cash flows discounted using appropriate interest rates. These future cash flows are based on business forecasts and are therefore inherently judgemental. Future events could cause the assumptions used in these impairment tests, as set out in Note 18, ‘Goodwill’, to change with a consequent adverse effect on the future results of the Group.
Other intangible assets
Where intangible assets are acquired by GSK from third parties the costs of acquisition are capitalised. Licences to compounds in development are amortised from the point at which they are available for use, over their estimated useful lives, which may include periods of non-exclusivity. Estimated useful lives are reviewed annually and impairment tests are undertaken if events occur which call into question the carrying values of the assets. Brands acquired with businesses are capitalised independently where they are separable and have an expected life of more than one year. Brands are amortised on a straight-line basis over their estimated useful lives, not exceeding 20 years, except where the end of the useful economic life cannot be foreseen. Where brands are not amortised, they are subject to annual impairment tests.
Both initial valuations and valuations for subsequent impairment tests are based on established market multiples or risk-adjusted future cash flows discounted using appropriate interest rates. These future cash flows are based on business forecasts and are therefore inherently judgemental. Future events could cause the assumptions used in these impairment reviews to change with a consequent adverse effect on the future results of the Group.
Pensions and other post-employment benefits
The costs of providing pensions and other post-employment benefits are charged to the income statement in accordance with IAS 19 over the period during which benefit is derived from the employee’s services. The costs are assessed on the basis of assumptions selected by management. These assumptions include future earnings and pension increases, discount rates, expected long term rates of return on assets and mortality rates, and are disclosed in Note 28, ‘Pensions and other post-employment benefits’.
The expected long term rates of return on bonds are determined based on the portfolio mix of index-linked, government and corporate bonds. An equity risk premium is added to this for equities.
Discount rates are derived from AA rated corporate bond yields except in countries where there is no deep market in corporate bonds where government bond yields are used. Sensitivity analysis is provided in Note 28, ‘Pensions and other post-employment benefits’, but a 0.25% reduction in the discount rate would lead to an increase in the net pension deficit of approximately £440£472 million and an increase in the annual pension cost of approximately £7£4 million. The selection of different assumptions could affect the future results of the Group.
GSK Annual Report 20092010
106116
Notes to the financial statements
4New accounting requirements
The following new and amended accounting standards and IFRIC interpretations have been issued by the IASB and are likely to affect future Annual Reports, although, in their current forms, none is expected to have a material impact on the results or financial position of the Group.
IFRS 3 (Revised) ‘Business combinations’ was issued in January 2008 and will apply to business combinations arising from 1st January 2010. Amongst other changes, the new Standard will require recognition of subsequent changes in the fair value of contingent consideration in the income statement rather than against goodwill, and transaction costs to be recognised immediately in the income statement. Fair value gains or losses on existing investments in an acquired company will be recognised in the income statement at the date of acquisition.
IAS 27 (Revised) ‘Consolidated and separate financial statements’ was issued in January 2008 and will be implemented at the same time as IFRS 3 (Revised). In respect of transactions with non-controlling interests in Group entities that do not result in a change of control, the revised Standard requires that the difference between the consideration paid or received and the recorded non-controlling interest is recognised in equity. In the case of divestment of a subsidiary, any retained interest will be remeasured to fair value and the difference between fair value and the previous carrying value will be recognised immediately in the income statement.
IFRS 3 (Revised) and IAS 27 (Revised) will both be applied prospectively to transactions occurring on or after 1st January 2010.
An amendment to IAS 39 ‘Financial instruments: Recognition and measurement – Eligible hedged items’ was issued in July 2008 and will be implemented by GSK from 1st January 2010. The amendment clarifies two aspects of hedge accounting relating to hedging with options and the identification of inflation as a hedged risk.
An amendment to IAS 32 ‘Financial instruments: Presentation – Classification of rights issues’ was issued in October 2009 and will be implemented by GSK from 1st January 2011. The amendment requires an issue to all existing shareholders of rights to acquire additional shares to all existing shareholders to be recognised in equity, regardless of the currency of the shares.
IFRIC 17 ‘Distributions of non-cash assets to owners’ was published in November 2008 and will be implemented by GSK from 1st January 2010. The Interpretation specifies how an entity should account for distributions of non-cash assets to its owners.
The following new standards and interpretations have not yet been endorsed by the EU:
The IASB’slASB’s annual improvements project was published in April 2009May 2010 and most of the changes are effective from 1st January 2010.2011. The project makes minor amendments to a number of Standards in areas including operating segments, share-based payments, leases, intangible assetsconsolidation, business combinations and financial instruments.
An amendment to IFRS 2 ‘Share-based payment – Group cash-settled share-based payment transactions’ was issued in June 2009 and will be implemented by GSK from 1st January 2010. The amendment clarifies the scope of IFRS 2 and the accounting for group cash-settled share-based payment transactions in the financial statements of individual group entities.
IAS 24 (Revised) ‘Related party disclosures’ was issued in November 2009 and will be implemented by GSK from 1st January 2011. The revised Standard clarifies the definition of a related party and provides some exemptions for government related entities.
IFRS 9 ‘Financial instruments’ was issued in November 2009 and will be implemented by GSK from 1st January 2013. The Standard is the first step in the project to replace IAS 39 and covers the classification and measurement of financial assets. The IASB intends to expand IFRS 9 to add new requirements for the classification and measurement of financial liabilities, derecognition of financial instruments, impairment and hedge accounting to become a complete replacement of IAS 39 by the end of 2010.
IFRIC 19 ‘Extinguishing financial liabilities with equity instruments’ was issued in November 2009 and will be implemented by GSK from 1st January 2011. The Interpretation addresses the accounting by an entity that issues equity instruments in order to settle a financial liability in part or in full.
An amendment to IFRIC 14 ‘Pre-payments of a minimum funding requirement’ was issued in November 2009 and will be implemented by GSK from 1st January 2011. The amendment permits a voluntary prepayment of a minimum funding requirement to be recognised as an asset.
The following new standards and interpretations have not yet been endorsed by the EU: IFRS 9 ‘Financial instruments’ was first issued in November 2009 and amended in October 2010 and will be implemented by GSK from 1st January 2013. The Standard will eventually replace IAS 39 and covers the classification, measurement and derecognition of financial assets and financial liabilities. The IASB intends to expand IFRS 9 to add new requirements for impairment and hedge accounting and to become a complete replacement of IAS 39 by the end of 2011.
An amendment to IFRS 7 ‘Disclosures – Transfers of financial assets’ was issued in October 2010 and will be implemented by GSK from 1st January 2012. The amendment requires additional disclosures regarding the risk exposures relating to transfers of financial assets.
An amendment to IAS 12 ‘Deferred tax: recovery of underlying assets’ was issued in December 2010 and will be implemented by GSK from 1st January 2012. The amendment requires that the deferred tax on non-depreciable assets measured using the revaluation model should be calculated on a sale basis.
5Exchange rates
The Group uses the average of exchange rates prevailing during the period to translate the results and cash flows of overseas subsidiaries, joint ventures and associated undertakings into Sterling and period end rates to translate the net assets of those undertakings. The currencies which most influence these translations and the relevant exchange rates were:
| | | | | | | | | | | | | |
| | | | | | | | | | | | | | | | | | | |
| | | 2009 | | 2008 | | 2007 | | | 2010 | | 2009 | | 2008 | |
| | | | | | | | | | | | | |
| Average rates: | | |
| £/US$ | | 1.56 | | 1.85 | | 2.00 | | | 1.55 | | 1.56 | | 1.85 | |
| £/Euro | | 1.12 | | 1.26 | | 1.46 | | | 1.16 | | 1.12 | | 1.26 | |
| £/Yen | | 146 | | 192 | | 235 | | | 136 | | 146 | | 192 | |
| | |
| Period end rates: | | |
| £/US$ | | 1.61 | | 1.44 | | 1.99 | | | 1.56 | | 1.61 | | 1.44 | |
| £/Euro | | 1.13 | | 1.04 | | 1.36 | | | 1.17 | | 1.13 | | 1.04 | |
| £/Yen | | 150 | | 131 | | 222 | | | 127 | | 150 | | 131 | |
| | | | | | | | | | | | | |
GSK Annual Report 20092010
107117
Notes to the financial statements
6Segment information
GSK has implemented IFRS 8 ‘Operating segments’revised its segmental information disclosures to reflect changes in the internal reporting structures with effect from 1st January 20092010. ViiV Healthcare is now shown as a separate segment. Stiefel has been integrated with the GSK heritage dermatology business and thisis reported within the relevant geographical pharmaceutical segments. The other trading and other unallocated pharmaceuticals information has resultedbeen combined. In addition, the responsibility for certain products in a changetwo small markets moved from the pharmaceuticals business to the segmental information reported by GSK.Consumer Healthcare. Comparative information has been presented onrestated onto a consistent basis.
GSK’s operating segments are being reported based on the financial information provided to the Chief Executive Officer, who is regarded as the ‘Chief Operating Decision Maker’ (CODM), and the responsibilities of the Corporate Executive Team (CET). Individual members of the CET are responsible for geographic regions of the Pharmaceuticals business, ViiV Healthcare and for the Consumer Healthcare business as a whole, respectively, before major restructuring. No geographic information is regularly provided to the CODM.
R&D investment is essential for the sustainability of the pharmaceutical businesses. However, for segment reporting, the USA, Europe, Emerging Markets and Asia Pacific/Japan regional pharmaceutical operating profits exclude allocations of globally funded R&D as well as central costs, principally corporate functions and unallocated manufacturing costs. GSK’s management reporting process allocates all intra-Group profit on a product sale to the market in which that sale is recorded, and the profit analyses below have been presented on that basis.
The Other trading and unallocated pharmaceuticals segment includes Canada, Puerto Rico, Stiefel, central vaccine tender sales and contract manufacturing sales. The Stiefel business is being integrated into GSKsales, together with costs such as vaccines R&D, central dermatology costs and with effect from 1st January 2010, results will be reported within the relevant geographical pharmaceuticals segments, in line with the way in which the business will be managed.
GSK acquired the HIV business of Pfizer with effect from 30th October 2009 in return for a 15% minority stake in the combined HIV businesses, now called ViiV Healthcare Limited. In line with the way the ViiV Healthcare business iscentral manufacturing costs not attributed to be managed, it will be reported as a separate segment from 1st January 2010. For 2009, the GSK HIV business is reported within the relevant Pharmaceuticals segments; incremental income and costs since the creation of ViiV Healthcare have been reported within Other trading pharmaceuticals.other segments.
The Pharmaceuticals R&D segment (which excludes vaccines R&D) is the responsibility of the Chairman, Research & Development and is therefore being reported as a separate segment.
Unallocated pharmaceuticals costs include costs such as vaccines R&D and central manufacturing costs not attributed to other segments.
Corporate and other unallocated costs and disposal profits include corporate functions, costs for legal matters, fair value movements on financial instruments and investments and unallocated profits on asset disposals.
| | | | | | | | | | | | | |
| | | | | | | 2008 | | | 2007 | |
| Turnover by segment | | 2009 | | | (restated) | | | (restated) | |
| | £m | | | £m | | | £m | |
| | | | | | | | | |
| US pharmaceuticals | | | 9,180 | | | | 8,894 | | | | 9,273 | |
| Europe pharmaceuticals | | | 7,681 | | | | 6,483 | | | | 5,560 | |
| Emerging Markets pharmaceuticals | | | 2,973 | | | | 2,290 | | | | 1,895 | |
| Asia Pacific/Japan pharmaceuticals | | | 2,700 | | | | 1,918 | | | | 1,701 | |
| Other trading pharmaceuticals | | | 1,180 | | | | 796 | | | | 734 | |
| | | | | | | | | |
| Pharmaceuticals turnover | | | 23,714 | | | | 20,381 | | | | 19,163 | |
| Consumer Healthcare turnover | | | 4,654 | | | | 3,971 | | | | 3,553 | |
| | | | | | | | | |
| | | | 28,368 | | | | 24,352 | | | | 22,716 | |
| | | | | | | | | |
| |
| Pharmaceutical turnover by therapeutic area | | 2009 | | | 2008 | | | 2007 | |
| | £m | | | £m | | | £m | |
| | | | | | | | | |
| Respiratory | | | 6,977 | | | | 5,817 | | | | 5,032 | |
| Anti-virals | | | 4,150 | | | | 3,206 | | | | 3,027 | |
| Central nervous system | | | 1,870 | | | | 2,897 | | | | 3,348 | |
| Cardiovascular and urogenital | | | 2,298 | | | | 1,847 | | | | 1,554 | |
| Metabolic | | | 1,181 | | | | 1,191 | | | | 1,508 | |
| Anti-bacterials | | | 1,592 | | | | 1,429 | | | | 1,323 | |
| Oncology and emesis | | | 629 | | | | 496 | | | | 477 | |
| Vaccines | | | 3,706 | | | | 2,539 | | | | 1,993 | |
| Other | | | 1,311 | | | | 959 | | | | 901 | |
| | | | | | | | | |
| | | | 23,714 | | | | 20,381 | | | | 19,163 | |
| | | | | | | | | |
| |
| Consumer Healthcare turnover by category | | 2009 | | | 2008 | | | 2007 | |
| | £m | | | £m | | | £m | |
| | | | | | | | | |
| OTC medicines | | | 2,319 | | | | 1,935 | | | | 1,788 | |
| Oral healthcare | | | 1,484 | | | | 1,240 | | | | 1,049 | |
| Nutritional healthcare | | | 851 | | | | 796 | | | | 716 | |
| | | | | | | | | |
| | | | 4,654 | | | | 3,971 | | | | 3,553 | |
| | | | | | | | | |
| | | | | | | | | | | | | |
| | | | | | | | |
| Turnover by segment | | | | | | 2009 | | | 2008 | |
| | 2010 | | | (restated) | | | (restated) | |
| | £m | | | £m | | | £m | |
| | | | | | | | |
| US pharmaceuticals | | | 7,648 | | | | 8,578 | | | | 8,254 | |
| Europe pharmaceuticals | | | 6,548 | | | | 7,087 | | | | 5,847 | |
| Emerging Markets pharmaceuticals | | | 3,556 | | | | 2,895 | | | | 2,177 | |
| Asia Pacific/Japan pharmaceuticals | | | 3,102 | | | | 2,628 | | | | 1,848 | |
| ViiV Healthcare | | | 1,566 | | | | 1,605 | | | | 1,513 | |
| Other trading and unallocated pharmaceuticals | | | 962 | | | | 901 | | | | 742 | |
| | | | | | | | |
| Pharmaceuticals turnover | | | 23,382 | | | | 23,694 | | | | 20,381 | |
| Consumer Healthcare turnover | | | 5,010 | | | | 4,674 | | | | 3,971 | |
| | | | | | | | |
| | | | 28,392 | | | | 28,368 | | | | 24,352 | |
| | | | | | | | |
| | | | | | | | | | | | | |
| | | | | | | | |
| Pharmaceutical turnover by therapeutic area | | | | | | 2009 | | | 2008 | |
| | 2010 | | | (restated) | | | (restated) | |
| | £m | | | £m | | | £m | |
| | | | | | | | |
| Respiratory | | | 7,238 | | | | 6,977 | | | | 5,817 | |
| Anti-virals | | | 1,086 | | | | 2,416 | | | | 1,584 | |
| Central nervous system | | | 1,753 | | | | 1,870 | | | | 2,897 | |
| Cardiovascular and urogenital | | | 2,570 | | | | 2,298 | | | | 1,847 | |
| Metabolic | | | 678 | | | | 1,181 | | | | 1,191 | |
| Anti-bacterials | | | 1,396 | | | | 1,457 | | | | 1,301 | |
| Oncology and emesis | | | 688 | | | | 629 | | | | 496 | |
| Vaccines | | | 4,326 | | | | 3,706 | | | | 2,539 | |
| Dermatologicals | | | 1,087 | | | | 707 | | | | 414 | |
| ViiV Healthcare (HIV) | | | 1,566 | | | | 1,605 | | | | 1,513 | |
| Other | | | 994 | | | | 848 | | | | 782 | |
| | | | | | | | |
| | | | 23,382 | | | | 23,694 | | | | 20,381 | |
| | | | | | | | |
| | | | | | | | | | | | | |
| | | | | | | | |
| Consumer Healthcare turnover by category | | 2010 | | | 2009 | | | 2008 | |
| | £m | | | £m | | | £m | |
| | | | | | | | |
| OTC medicines | | | 2,456 | | | | 2,339 | | | | 1,935 | |
| Oral healthcare | | | 1,602 | | | | 1,484 | | | | 1,240 | |
| Nutritional healthcare | | | 952 | | | | 851 | | | | 796 | |
| | | | | | | | |
| | | | 5,010 | | | | 4,674 | | | | 3,971 | |
| | | | | | | | |
GSK Annual Report 20092010
108118
Notes to the financial statements
6Segment informationcontinued
During 2009, the2010, US pharmaceuticals businessand ViiV Healthcare made sales to three wholesalers of approximately £2,561 million
(2009 – £2,760 million (2008million; 2008 – £2,460 million; 2007 – £2,060 million), £2,710£2,412 million (2008(2009 – £2,710 million; 20072008 – £2,880£2,710 million) and £1,642 million
(2009 – £1,680 million (2008million; 2008 – £1,980 million; 2007 – £2,360 million) respectively, after allocating final-customer discounts to the wholesalers.
| | | | | | | | | | | | | | | | | | | | |
| | | 2008 | | 2007 | | | | | | | |
| Segment profit | | 2009 | | (restated) | | (restated) | | | 2009 | | 2008 | |
| | £m | | £m | | £m | | | 2010 | | (restated) | | (restated) | |
| Segment profit | | | £m | | £m | | £m | |
| | | | | | | | | | | | |
| | 6,420 | | 5,947 | | 6,364 | | |
| Europe pharmaceuticals | | 4,509 | | 3,765 | | 3,110 | | |
| | |
| US Pharmaceuticals | | | 5,043 | | 5,933 | | 5,461 | |
| Europe Pharmaceuticals | | | 3,744 | | 3,993 | | 3,229 | |
| Emerging Markets pharmaceuticals | | 1,048 | | 947 | | 686 | | | 1,271 | | 948 | | 837 | |
| Asia Pacific/Japan pharmaceuticals | | 1,424 | | 1,078 | | 896 | | | 1,730 | | 1,352 | | 1,016 | |
| Other trading pharmaceuticals | | 490 | | 476 | | 358 | | |
| ViiV Healthcare | | | 851 | | 1,071 | | 1,005 | |
| Pharmaceuticals R&D | | | (3,082 | ) | | | (2,875 | ) | | | (2,707 | ) | | | (3,105 | ) | | | (3,082 | ) | | | (2,840 | ) |
| Other unallocated pharmaceuticals costs | | | (1,334 | ) | | | (726 | ) | | | (841 | ) | |
| Other trading and unallocated pharmaceuticals costs | | | | (783 | ) | | | (705 | ) | | | (110 | ) |
| | | | | | | | | | | | | |
| Pharmaceuticals operating profit | | 9,475 | | 8,612 | | 7,866 | | | 8,751 | | 9,510 | | 8,598 | |
| Consumer Healthcare operating profit | | 952 | | 881 | | 805 | | | 1,043 | | 931 | | 881 | |
| | | | | | | | | | | | | |
| Segment profit | | 10,427 | | 9,493 | | 8,671 | | | 9,794 | | 10,441 | | 9,479 | |
| | |
| Corporate and other unallocated costs and disposal profits | | | (1,170 | ) | | | (1,234 | ) | | | (740 | ) | | | (4,666 | ) | | | (1,184 | ) | | | (1,220 | ) |
| | | | | | | | | | | | | |
| Operating profit before major restructuring | | 9,257 | | 8,259 | | 7,931 | | | 5,128 | | 9,257 | | 8,259 | |
| Major restructuring | | | (832 | ) | | | (1,118 | ) | | | (338 | ) | | | (1,345 | ) | | | (832 | ) | | | (1,118 | ) |
| | | | | | | | | | | | | |
| Total operating profit | | 8,425 | | 7,141 | | 7,593 | | | 3,783 | | 8,425 | | 7,141 | |
| | |
| Finance income | | 70 | | 313 | | 262 | | | 116 | | 70 | | 313 | |
| Finance costs | | | (783 | ) | | | (843 | ) | | | (453 | ) | | | (831 | ) | | | (783 | ) | | | (843 | ) |
| Profit on disposal of interest in associate | | 115 | | – | | – | | | 8 | | 115 | | – | |
| Share of after tax profits of associates and joint ventures | | 64 | | 48 | | 50 | | | 81 | | 64 | | 48 | |
| | | | | | | | | | | | | |
| Profit before taxation | | 7,891 | | 6,659 | | 7,452 | | | 3,157 | | 7,891 | | 6,659 | |
| Taxation | | | (2,222 | ) | | | (1,947 | ) | | | (2,142 | ) | | | (1,304 | ) | | | (2,222 | ) | | | (1,947 | ) |
| | | | | | | | | | | | | |
| Profit after taxation for the year | | 5,669 | | 4,712 | | 5,310 | | | 1,853 | | 5,669 | | 4,712 | |
| | | | | | | | | | | | | |
| | |
| | | 2008 | | 2007 | | |
| Depreciation and amortisation by segment | | 2009 | | (restated) | | (restated) | | |
| | £m | | £m | | £m | | |
| | | | | | | | |
| US pharmaceuticals | | 112 | | 110 | | 46 | | |
| Europe pharmaceuticals | | 37 | | 36 | | 31 | | |
| Emerging Markets pharmaceuticals | | 39 | | 22 | | 18 | | |
| Asia Pacific/Japan pharmaceuticals | | 21 | | 10 | | 11 | | |
| Other trading pharmaceuticals | | 58 | | 4 | | 5 | | |
| Pharmaceuticals R&D | | 363 | | 318 | | 334 | | |
| Other unallocated pharmaceuticals | | 623 | | 541 | | 479 | | |
| | | | | | | | |
| Pharmaceuticals depreciation and amortisation | | 1,253 | | 1,041 | | 924 | | |
| Consumer Healthcare depreciation and amortisation | | 63 | | 60 | | 44 | | |
| | | | | | | | |
| Segment depreciation and amortisation | | 1,316 | | 1,101 | | 968 | | |
| Corporate and other unallocated depreciation and amortisation | | 78 | | 77 | | 54 | | |
| | | | | | | | |
| Depreciation and amortisation before major restructuring | | 1,394 | | 1,178 | | 1,022 | | |
| Major restructuring | | 168 | | 53 | | – | | |
| | | | | | | | |
| Total depreciation and amortisation | | 1,562 | | 1,231 | | 1,022 | | |
| | | | | | | | |
| | | | | | | | | | | | | |
| | | | | | | | |
| Depreciation and amortisation by segment | | | | | | 2009 | | | 2008 | |
| | 2010 | | | (restated) | | | (restated) | |
| | £m | | | £m | | | £m | |
| | | | | | | | |
| US pharmaceuticals | | | 101 | | | | 116 | | | | 110 | |
| Europe pharmaceuticals | | | 31 | | | | 24 | | | | 36 | |
| Emerging Markets pharmaceuticals | | | 51 | | | | 29 | | | | 22 | |
| Asia Pacific/Japan pharmaceuticals | | | 25 | | | | 15 | | | | 11 | |
| ViiV Healthcare | | | 29 | | | | 5 | | | | – | |
| Pharmaceuticals R&D | | | 262 | | | | 280 | | | | 267 | |
| Other trading and unallocated pharmaceuticals | | | 809 | | | | 789 | | | | 580 | |
| | | | | | | | |
| Pharmaceuticals depreciation and amortisation | | | 1,308 | | | | 1,258 | | | | 1,026 | |
| Consumer Healthcare depreciation and amortisation | | | 66 | | | | 63 | | | | 52 | |
| | | | | | | | |
| Segment depreciation and amortisation | | | 1,374 | | | | 1,321 | | | | 1,078 | |
| |
| Corporate and other unallocated depreciation and amortisation | | | 85 | | | | 80 | | | | 76 | |
| | | | | | | | |
| Depreciation and amortisation before major restructuring | | | 1,459 | | | | 1,401 | | | | 1,154 | |
| Major restructuring | | | 220 | | | | 161 | | | | 77 | |
| | | | | | | | |
| Total depreciation and amortisation | | | 1,679 | | | | 1,562 | | | | 1,231 | |
| | | | | | | | |
GSK Annual Report 20092010
109119
Notes to the financial statements
6Segment informationcontinued
| | | | | | | | | | | | | |
| | | | | | | | |
| PP&E, intangible asset and goodwill impairment by segment | | | | | | 2009 | | | 2008 | |
| | 2010 | | | (restated) | | | (restated) | |
| | £m | | | £m | | | £m | |
| | | | | | | | |
| US pharmaceuticals | | | – | | | | 1 | | | | 1 | |
| Europe pharmaceuticals | | | 1 | | | | 7 | | | | 2 | |
| Emerging Markets pharmaceuticals | | | 1 | | | | – | | | | – | |
| Asia Pacific/Japan pharmaceuticals | | | 2 | | | | 1 | | | | 2 | |
| ViiV Healthcare | | | – | | | | – | | | | – | |
| Pharmaceuticals R&D | | | 134 | | | | 118 | | | | 107 | |
| Other trading and unallocated pharmaceuticals | | | 129 | | | | 124 | | | | 30 | |
| | | | | | | | |
| Pharmaceuticals impairment | | | 267 | | | | 251 | | | | 142 | |
| Consumer Healthcare impairment | | | 5 | | | | 1 | | | | – | |
| | | | | | | | |
| Segment impairment | | | 272 | | | | 252 | | | | 142 | |
| | | | | | | | | | | | | |
| Corporate and other unallocated impairment | | | 4 | | | | 23 | | | | 52 | |
| | | | | | | | |
| Impairment before major restructuring | | | 276 | | | | 275 | | | | 194 | |
| Major restructuring | | | 89 | | | | 57 | | | | 197 | |
| | | | | | | | |
| Total impairment | | | 365 | | | | 332 | | | | 391 | |
| | | | | | | | |
| | | | | | | | | | | | | |
| | | | | | | | |
| PP&E, intangible asset and goodwill impairment reversals by segment | | | | | | 2009 | | | 2008 | |
| | 2010 | | | (restated) | | | (restated) | |
| | £m | | | £m | | | £m | |
| | | | | | | | |
| US pharmaceuticals | | | – | | | | (1 | ) | | | – | |
| Europe pharmaceuticals | | | – | | | | – | | | | – | |
| Emerging Markets pharmaceuticals | | | – | | | | – | | | | – | |
| Asia Pacific/Japan pharmaceuticals | | | – | | | | – | | | | – | |
| ViiV Healthcare | | | – | | | | – | | | | – | |
| Pharmaceuticals R&D | | | (1 | ) | | | (1 | ) | | | (10 | ) |
| Other trading and unallocated pharmaceuticals | | | (4 | ) | | | (9 | ) | | | – | |
| | | | | | | | |
| Pharmaceuticals impairment reversals | | | (5 | ) | | | (11 | ) | | | (10 | ) |
| Consumer Healthcare impairment reversals | | | – | | | | – | | | | – | |
| | | | | | | | |
| Segment impairment reversals | | | (5 | ) | | | (11 | ) | | | (10 | ) |
| | | | | | | | | | | | | |
| Corporate and other unallocated impairment reversals | | | – | | | | – | | | | (10 | ) |
| | | | | | | | |
| Impairment reversals before major restructuring | | | (5 | ) | | | (11 | ) | | | (20 | ) |
| Major restructuring | | | (14 | ) | | | – | | | | – | |
| | | | | | | | |
| Total impairment reversals | | | (19 | ) | | | (11 | ) | | | (20 | ) |
| | | | | | | | |
GSK Annual Report 2010
120
Notes to the financial statements
| | | | | | | | | | | | | |
| PP&E and intangible asset impairment by segment | | 2009 | | | 2008 | | | 2007 | |
| | £m | | | £m | | | £m | |
| | | | | | | | | |
| US pharmaceuticals | | | 1 | | | | 1 | | | | 1 | |
| Europe pharmaceuticals | | | 7 | | | | 2 | | | | – | |
| Emerging Markets pharmaceuticals | | | – | | | | – | | | | – | |
| Asia Pacific/Japan pharmaceuticals | | | 1 | | | | 2 | | | | – | |
| Other trading pharmaceuticals | | | – | | | | – | | | | – | |
| Pharmaceuticals R&D | | | 118 | | | | 107 | | | | 49 | |
| Other unallocated pharmaceuticals | | | 124 | | | | 30 | | | | 60 | |
| | | | | | | | | |
| Pharmaceuticals impairment | | | 251 | | | | 142 | | | | 110 | |
| Consumer Healthcare impairment | | | 1 | | | | – | | | | 2 | |
| | | | | | | | | |
| Segment impairment | | | 252 | | | | 142 | | | | 112 | |
| Corporate and other unallocated impairment | | | 23 | | | | 52 | | | | – | |
| | | | | | | | | |
| Impairment before major restructuring | | | 275 | | | | 194 | | | | 112 | |
| Major restructuring | | | 57 | | | | 197 | | | | 106 | |
| | | | | | | | | |
| Total impairment | | | 332 | | | | 391 | | | | 218 | |
| | | | | | | | | |
| | | | | | | | | | | | | |
| PP&E and intangible asset impairment reversals by segment | | 2009 | | | 2008 | | | 2007 | |
| | £m | | | £m | | | £m | |
| | | | | | | | | |
| US pharmaceuticals | | | (1 | ) | | | – | | | | (1 | ) |
| Europe pharmaceuticals | | | – | | | | – | | | | – | |
| Emerging Markets pharmaceuticals | | | – | | | | – | | | | – | |
| Asia Pacific/Japan pharmaceuticals | | | – | | | | – | | | | – | |
| Other trading pharmaceuticals | | | – | | | | – | | | | – | |
| Pharmaceuticals R&D | | | (1 | ) | | | (10 | ) | | | – | |
| Other unallocated pharmaceuticals | | | (9 | ) | | | – | | | | (66 | ) |
| | | | | | | | | |
| Pharmaceuticals impairment reversals | | | (11 | ) | | | (10 | ) | | | (67 | ) |
| Consumer Healthcare impairment reversals | | | – | | | | – | | | | – | |
| | | | | | | | | |
| Segment impairment reversals | | | (11 | ) | | | (10 | ) | | | (67 | ) |
| Corporate and other unallocated impairment reversals | | | – | | | | (10 | ) | | | – | |
| | | | | | | | | |
| Impairment reversals before major restructuring | | | (11 | ) | | | (20 | ) | | | (67 | ) |
| Major restructuring | | | – | | | | – | | | | – | |
| | | | | | | | | |
| Total impairment reversals | | | (11 | ) | | | (20 | ) | | | (67 | ) |
| | | | | | | | | |
| | | | | | | | | |
| | | | | |
| Net assets by segment | | | | | | 2009 | | | |
| | 2010 | | | (restated) | |
| | £m | | | £m | |
| | | | | |
| US pharmaceuticals | | | 616 | | | | 1,049 | |
| Europe pharmaceuticals | | | 1,031 | | | | 1,567 | |
| Emerging Markets pharmaceuticals | | | 1,840 | | | | 1,508 | |
| Asia Pacific/Japan pharmaceuticals | | | 1,057 | | | | 982 | |
| ViiV Healthcare | | | 832 | | | | 835 | |
| Pharmaceuticals R&D | | | 1,656 | | | | 2,278 | |
| Other trading and unallocated pharmaceuticals | | | 13,320 | | | | 13,037 | |
| | | | | |
| Pharmaceuticals net operating assets | | | 20,352 | | | | 21,256 | |
| Consumer Healthcare net operating assets | | | 2,972 | | | | 2,990 | |
| | | | | |
| Segment net operating assets | | | 23,324 | | | | 24,246 | |
| | | | | | | | | |
| Corporate and other unallocated operating net assets | | | (6,682 | ) | | | (5,334 | ) |
| | | | | |
| Net operating assets | | | 16,642 | | | | 18,912 | |
| | | | | | | | | |
| Net debt | | | (8,859 | ) | | | (9,444 | ) |
| Investments in associates and joint ventures | | | 1,081 | | | | 895 | |
| Derivative financial instruments | | | (3 | ) | | | 29 | |
| Current and deferred taxation | | | 868 | | | | 336 | |
| Assets held for sale | | | 16 | | | | 14 | |
| | | | | |
| Net assets | | | 9,745 | | | | 10,742 | |
| | | | | |
The other trading and unallocated pharmaceuticals segment includes assets for the centrally managed pharmaceutical and vaccine manufacturing operations, the depreciation on which, totalling £616 million (2009 – £618 million; 2008 – £536 million) is recovered through the standard cost of product charged to businesses.
Geographical information
The UK is regarded as being the Group’s country of domicile.
| | | | | | | | | | | | | | | | | | | | |
| | | 2008 | | 2007 | | | | | | | |
| Turnover by location of customer | | | 2009 | | 2008 | |
| | 2009 | | (restated) | | (restated) | | | 2010 | | (restated) | | (restated) | |
| | £m | | £m | | £m | | | £m | | £m | | £m | |
| | | | | | | | | | | | | |
| UK | | 1,852 | | 1,636 | | 1,570 | | | 1,820 | | 1,864 | | 1,636 | |
| USA | | 10,201 | | 9,746 | | 10,168 | | | 9,345 | | 10,315 | | 9,746 | |
| Rest of World | | 16,315 | | 12,970 | | 10,978 | | | 17,227 | | 16,189 | | 12,970 | |
| | | | | | | | | | | | | |
| External turnover | | 28,368 | | 24,352 | | 22,716 | | | 28,392 | | 28,368 | | 24,352 | |
| | | | | | | | | | | | | |
| | | | | | | | | | | | | | | | | | | | |
| Non-current assets by location | | 2009 | | 2008 | | | | |
| | £m | | £m | | |
| | | | | | | | |
| Turnover by location of subsidiary | | | 2010 | | 2009 | | 2008 | |
| | £m | | £m | | £m | |
| | | | | | | | | | | | | |
| UK | | 5,266 | | 4,368 | | | | | 4,965 | | 4,469 | | 3,096 | |
| USA | | 7,956 | | 6,264 | | | 13,072 | | 13,711 | | 12,925 | |
| Rest of World | | 8,758 | | 8,137 | | | 21,220 | | 19,661 | | 15,977 | |
| | | | | | | | | | | | | |
| Turnover including inter-segment turnover | | | 39,257 | | 37,841 | | 31,998 | |
| | | 21,980 | | 18,769 | | | | | | | |
| | | | | | | | �� | |
| UK | | | 2,032 | | 1,556 | | 1,042 | |
| USA | | | 3,717 | | 3,395 | | 3,114 | |
| Rest of World | | | 5,116 | | 4,522 | | 3,490 | |
| | | | | | | | |
| Inter-segment turnover | | | 10,865 | | 9,473 | | 7,646 | |
| | | | | | | | |
| | | |
| UK | | | 2,933 | | 2,913 | | 2,054 | |
| USA | | | 9,355 | | 10,316 | | 9,811 | |
| Rest of World | | | 16,104 | | 15,139 | | 12,487 | |
| | | | | | | | |
| External turnover | | | 28,392 | | 28,368 | | 24,352 | |
| | | | | | | | |
GSK Annual Report 2010
121
Notes to the financial statements
6Segment informationcontinued
| | | | | | | | | | | | | |
| | | | | | | | |
| Operating profit by location | | 2010 | | | 2009 | | | 2008 | |
| | £m | | | £m | | | £m | |
| | | | | | | | |
| UK | | | 1,033 | | | | 2,608 | | | | 1,861 | |
| USA | | | 420 | | | | 2,337 | | | | 1,951 | |
| Rest of World | | | 2,330 | | | | 3,480 | | | | 3,329 | |
| | | | | | | | |
| Total operating profit | | | 3,783 | | | | 8,425 | | | | 7,141 | |
| | | | | | | | |
| | | | | | | | | | | | | |
| | | | | | | | | |
| Net operating assets by location | | | | | | 2009 | | | | |
| | 2010 | | | (restated) | | | | |
| | £m | | | £m | | | | |
| | | | | | | | | |
| UK | | | 3,177 | | | | 4,540 | | | | | |
| USA | | | 4,235 | | | | 3,168 | | | | | |
| Rest of World | | | 9,230 | | | | 11,204 | | | | | |
| | | | | | | | | |
| Net operating assets | | | 16,642 | | | | 18,912 | | | | | |
| | | | | | | | | |
| | | | | | | | | | | | | |
| | | | | | | | | |
| Non-current assets by location | | | | | | 2009 | | | | |
| | 2010 | | | (restated) | | | | |
| | £m | | | £m | | | | |
| | | | | | | | | |
| UK | | | 5,066 | | | | 5,270 | | | | | |
| USA | | | 6,972 | | | | 6,863 | | | | | |
| Rest of World | | | 10,372 | | | | 9,847 | | | | | |
| | | | | | | | | |
| Non-current assets | | | 22,410 | | | | 21,980 | | | | | |
| | | | | | | | | |
Non-current assets by location excludes amounts relating to other investments, deferred tax assets, derivative financial instruments, pension assets, amounts recoverablereceivable under insurance contracts and certain other non-current receivables.
GSK Annual Report 2009
110
Notes to the financial statements
6 Segment informationcontinued
| | | | | | | | | |
| | | | | | | 2008 | |
| Total assets by segment | | 2009 | | | (restated) | |
| | £m | | | £m | |
| | | | | | |
| US pharmaceuticals | | | 2,536 | | | | 2,957 | |
| Europe pharmaceuticals | | | 2,450 | | | | 2,538 | |
| Emerging Markets pharmaceuticals | | | 1,925 | | | | 1,303 | |
| Asia Pacific/Japan pharmaceuticals | | | 1,278 | | | | 1,095 | |
| Other trading pharmaceuticals | | | 3,804 | | | | 108 | |
| Pharmaceuticals R&D | | | 2,842 | | | | 3,087 | |
| Other unallocated pharmaceuticals | | | 12,956 | | | | 13,399 | |
| | | | | | |
| Pharmaceuticals operating assets | | | 27,791 | | | | 24,487 | |
| Consumer Healthcare operating assets | | | 3,799 | | | | 3,859 | |
| | | | | | |
| Segment operating assets | | | 31,590 | | | | 28,346 | |
| Corporate and other unallocated assets | | | 921 | | | | 680 | |
| | | | | | |
| Total operating assets | | | 32,511 | | | | 29,026 | |
| Investments in associates and joint ventures | | | 895 | | | | 552 | |
| Liquid investments | | | 268 | | | | 391 | |
| Derivative financial instruments | | | 197 | | | | 963 | |
| Cash and cash equivalents | | | 6,545 | | | | 5,623 | |
| Current and deferred taxation | | | 2,432 | | | | 2,836 | |
| Assets held for sale | | | 14 | | | | 2 | |
| | | | | | |
| Total assets | | | 42,862 | | | | 39,393 | |
| | | | | | |
The other unallocated pharmaceuticals segment includes assets for the centrally managed pharmaceutical and vaccine manufacturing operations, the depreciation on which, totalling £618 million (2008 – £536 million; 2007 – £475 million) is recovered through the standard cost of product charged to businesses.
7Major restructuring programme
In October 2007, GSK announced a significant new Operational Excellence programme to improve the effectiveness and productivity of its operations. A significant expansion of the Operational Excellence programme was approved by the Board and announced in February 2009. A further expansion was approved by the Board and announced in February 2010. Total2010, when total approved costs for the implementation of the expanded programme are expected to increasewere increased from £3.6 billion to approximately £4.5 billion, to be incurred over the period from 2007 to 2012. Approximately 50%75% of these costs were incurred by 31st December 2009,2010, and approximately 30%20% are expected to be incurred in 20102011 with the balance mostly in 2011.2012. In total, approximately 75% of these costs are expected to be cash expenditures and 25% are expected to be asset write-downs. Uncertainties exist over the exact amount and timing of cash outflows as a result of potential future exchange rate fluctuations and as many elements of the restructuring programme are subject to employee consultation procedures, making it difficult to predict with precision when these procedures will be completed. However, the majority of the remaining cash payments are expected to be made in 20102011 and 2011.2012. The programme is now estimatedremains on track to deliver total annual pre-tax savings of up to £2.2 billion by 2012, with savings realised across the business. Of the total restructuring costs of £832£1,345 million incurred in 2009, £7612010, £1,242 million was incurred under the Operational Excellence programme in the following areas:
the closure of a number of manufacturing sites, including Dartford and Crawley in the UK and Cidra in Puerto Rico, giving rise to asset write-downs and staff reductions;
| • | | cost saving projects in R&D, focused primarily on the simplification and streamlining of support infrastructure, including some site rationalisations, principally Verona in Italy and Harlow and Tonbridge in the UK; |
|
| • | | the adoption of more customised sales approaches, leading to staff reductions in a number of sales forces, principally in the USA, France and Italy; |
|
| • | | the closure of a number of manufacturing sites, including Dartford and Crawley in the UK, giving rise to asset write-downs and staff reductions; and |
|
| • | | projects to simplify or eliminate processes, leading to staff reductions in administrative and support functions. |
the adoption of more customised sales approaches, leading to staff reductions in a number of sales forces, principally in France;
cost saving projects in R&D, focused primarily on the simplification and streamlining of support infrastructure, including some site rationalisations, and
projects to simplify or eliminate processes, leading to staff reductions in administrative and support functions.
In addition,The remaining costs of £71£103 million were incurred during the year under the restructuring programme related to the integration of the Stiefel Laboratories, Inc. business in the USA, following its acquisition in July 2009.
GSK Annual Report 20092010
111122
Notes to the financial statements
7Major restructuring programmecontinued
The analysis of the costs incurred under these programmes in 2010, 2009 2008 and 20072008 is as follows:
| | | | | | | | | | | | | | | | | |
| 2009 | | Asset | | | Staff | | | Other | | | | |
| | impairment | | | reductions | | | costs | | | Total | |
| | | £m | | | £m | | | £m | | | £m | |
| | | | | | | | | | | | |
| Cost of sales | | | (41 | ) | | | (112 | ) | | | (132 | ) | | | (285 | ) |
| Selling, general and administration | | | (1 | ) | | | (337 | ) | | | (54 | ) | | | (392 | ) |
| Research and development | | | (15 | ) | | | (68 | ) | | | (72 | ) | | | (155 | ) |
| | | | | | | | | | | | |
| Effect on operating profit | | | (57 | ) | | | (517 | ) | | | (258 | ) | | | (832 | ) |
| Net finance expense | | | | | | | | | | | | | | | (3 | ) |
| | | | | | | | | | | | |
| Effect on profit before taxation | | | | | | | | | | | | | | | (835 | ) |
| Effect on taxation | | | | | | | | | | | | | | | 221 | |
| | | | | | | | | | | | |
| Effect on earnings | | | | | | | | | | | | | | | (614 | ) |
| | | | | | | | | | | | |
| | | | | | | | | | | | | | | | | |
| 2008 | | Asset | | | Staff | | | Other | | | | |
| | impairment | | | reductions | | | costs | | | Total | |
| | | £m | | | £m | | | £m | | | £m | |
| | | | | | | | | | | | |
| Cost of sales | | | (181 | ) | | | (370 | ) | | | (88 | ) | | | (639 | ) |
| Selling, general and administration | | | (2 | ) | | | (177 | ) | | | (125 | ) | | | (304 | ) |
| Research and development | | | (14 | ) | | | (143 | ) | | | (18 | ) | | | (175 | ) |
| | | | | | | | | | | | |
| Effect on operating profit | | | (197 | ) | | | (690 | ) | | | (231 | ) | | | (1,118 | ) |
| Net finance expense | | | | | | | | | | | | | | | (5 | ) |
| | | | | | | | | | | | |
| Effect on profit before taxation | | | | | | | | | | | | | | | (1,123 | ) |
| Effect on taxation | | | | | | | | | | | | | | | 284 | |
| | | | | | | | | | | | |
| Effect on earnings | | | | | | | | | | | | | | | (839 | ) |
| | | | | | | | | | | | |
| | | | | | | | | | | | | | | | | | | | | | | | | | |
| 2007 | | Asset | | Staff | | Other | | | | |
| | impairment | | reductions | | costs | | Total | | |
| | | £m | | £m | | £m | | £m | | | | | | | | | |
| 2010 | | | Asset | | Staff | | Other | | | |
| | impairment | | reductions | | costs | | Total | |
| | £m | | £m | | £m | | £m | |
| | | | | | | | | | | | | | | | | |
| Cost of sales | | | (77 | ) | | | (34 | ) | | – | | | (111 | ) | | | (14 | ) | | | (58 | ) | | | (115 | ) | | | (187 | ) |
| Selling, general and administration | | | (1 | ) | | | (136 | ) | | – | | | (137 | ) | | | (17 | ) | | | (503 | ) | | | (145 | ) | | | (665 | ) |
| Research and development | | | (28 | ) | | | (62 | ) | | – | | | (90 | ) | | | (44 | ) | | | (117 | ) | | | (332 | ) | | | (493 | ) |
| | | | | | | | | | |
| Effect on operating profit | | | | (75 | ) | | | (678 | ) | | | (592 | ) | | | (1,345 | ) |
| Net finance expense | | | | (3 | ) |
| | | | | | | | | | | | | | | | | |
| Effect on profit before taxation | | | (106 | ) | | | (232 | ) | | – | | | (338 | ) | | | (1,348 | ) |
| Effect on taxation | | 77 | | | 240 | |
| | | | | | | | | | | | | | | | | |
| Effect on earnings | | | (261 | ) | | | (1,108 | ) |
| | | | | | | | | | | | | | | | | |
| | | | | | | | | | | |
| | | | | | | | | | |
| 2009 | | | Asset | | Staff | | Other | | | |
| | impairment | | reductions | | costs | | Total | |
| | £m | | £m | | £m | | £m | |
| | | | | | | | | | |
| Cost of sales | | | | (41 | ) | | | (112 | ) | | | (132 | ) | | | (285 | ) |
| Selling, general and administration | | | | (1 | ) | | | (337 | ) | | | (54 | ) | | | (392 | ) |
| Research and development | | | | (15 | ) | | | (68 | ) | | | (72 | ) | | | (155 | ) |
| | | | | | | | | | |
| Effect on operating profit | | | | (57 | ) | | | (517 | ) | | | (258 | ) | | | (832 | ) |
| Net finance expense | | | | (3 | ) |
| | | | | | | | | | |
| Effect on profit before taxation | | | | (835 | ) |
| Effect on taxation | | | 221 | |
| | | | | | | | | | |
| Effect on earnings | | | | (614 | ) |
| | | | | | | | | | |
| | | | | | | | | | | |
| | | | | | | | | | |
| 2008 | | | Asset | | Staff | | Other | | | |
| | impairment | | reductions | | costs | | Total | |
| | £m | | £m | | £m | | £m | |
| | | | | | | | | | |
| Cost of sales | | | | (181 | ) | | | (370 | ) | | | (88 | ) | | | (639 | ) |
| Selling, general and administration | | | | (2 | ) | | | (177 | ) | | | (125 | ) | | | (304 | ) |
| Research and development | | | | (14 | ) | | | (143 | ) | | | (18 | ) | | | (175 | ) |
| | | | | | | | | | |
| Effect on operating profit | | | | (197 | ) | | | (690 | ) | | | (231 | ) | | | (1,118 | ) |
| Net finance expense | | | | (5 | ) |
| | | | | | | | | | |
| Effect on profit before taxation | | | | (1,123 | ) |
| Effect on taxation | | | 284 | |
| | | | | | | | | | |
| Effect on earnings | | | | (839 | ) |
| | | | | | | | | | |
Asset impairments of £75 million (2009 – £57 million, (20082008 – £197 million, 2007 – £106 million) and other net costs totalling £240 million (2009 – £124 million, (20082008 – £137 million, 2007 – £nil)million) are non-cash items.items, principally accelerated depreciation. All other charges have been or will be settled in cash.cash and include the termination of leases, site closure costs, consultancy and project management fees.
GSK Annual Report 2010
123
Notes to the financial statements
7Major restructuring programmecontinued
These restructuring costs are reported in the major restructuring column of the Income statement on page 94.104. Other costs related toincome, resulting from minor restructuring activity initiated prior to October 2007 amountingamounted to £5 million (2009 – £4 million (2008cost, 2008 – £20 million) aremillion cost). This income/cost is reported within ‘Results before major restructuring’.
| | | | | | | | | |
| | | | | | | | | | | | | | | | | | | |
| The costs of the major restructuring programmes have arisen as follows: | | 2009 | | 2008 | | 2007 | | | 2010 | | 2009 | | 2008 | |
| | £m | | £m | | £m | | | £m | | £m | | £m | |
| | | | | | | | | | | | | |
| Increase in provision for major restructuring programmes (see Note 29) | | | (487 | ) | | | (740 | ) | | | (220 | ) | | | (837 | ) | | | (487 | ) | | | (740 | ) |
| Amount of provision reversed unused (see Note 29) | | 15 | | 7 | | – | | | 40 | | 15 | | 7 | |
| Impairments to property, plant and equipment (see Note 17) | | | (57 | ) | | | (197 | ) | | | (106 | ) | |
| Impairments losses recognised | | | | (75 | ) | | | (57 | ) | | | (197 | ) |
| Foreign exchange gain/(loss) recognised on liquidation of subsidiary | | 44 | | | (84 | ) | | – | | | – | | 44 | | | (84 | ) |
| Other non-cash charges | | | (168 | ) | | | (53 | ) | | – | | | | (240 | ) | | | (168 | ) | | | (53 | ) |
| Other cash costs | | | (179 | ) | | | (51 | ) | | | (12 | ) | | | (233 | ) | | | (179 | ) | | | (51 | ) |
| Net finance expense | | | (3 | ) | | | (5 | ) | | – | | | | (3 | ) | | | (3 | ) | | | (5 | ) |
| | | | | | | | | | | | | |
| Effect on profit before taxation | | | (835 | ) | | | (1,123 | ) | | | (338 | ) | | | (1,348 | ) | | | (835 | ) | | | (1,123 | ) |
| | | | | | | | | | | | | |
Other non-cash charges are principally accelerated depreciation arising where asset lives have been shortened as a result of the major restructuring programmes. Other cash costs include the termination of leases, and site closure costs and consultancy and project management fees.
GSK Annual Report 2009
112
Notes to the financial statements
8Other operating income
| | | | | | | | | |
| | | | | | | | | | | | | | | | | | | |
| | | 2009 | | 2008 | | 2007 | | | 2010 | | 2009 | | 2008 | |
| | | £m | | £m | | £m | | | £m | | £m | | £m | |
| | | | | | | | | | | | | |
| Royalty income | | 296 | | 307 | | 216 | | | 296 | | 296 | | 307 | |
| Milestone income | | 90 | | 11 | | 7 | | | 7 | | 90 | | 11 | |
| Impairment of equity investments | | | (135 | ) | | | (63 | ) | | | (19 | ) | | | (65 | ) | | | (135 | ) | | | (63 | ) |
| Disposal of equity investments | | 40 | | 33 | | 32 | | | 17 | | 40 | | 33 | |
| Disposal of other assets and legal settlements | | 539 | | 260 | | 181 | | |
| Disposal of other assets, asset rights and legal settlements | | | 227 | | 539 | | 260 | |
| Gain recognised on creation of ViiV Healthcare | | 296 | | – | | – | | | – | | 296 | | – | |
| Fair value adjustments on derivative financial instruments | | | (5 | ) | | | (10 | ) | | 41 | | |
| Fair value movements on derivative financial instruments | | | | (6 | ) | | | (5 | ) | | | (10 | ) |
| Other income | | 14 | | 3 | | 17 | | | 17 | | 14 | | 3 | |
| | | | | | | | | | | | | |
| | | 1,135 | | 541 | | 475 | | | 493 | | 1,135 | | 541 | |
| | | | | | | | | | | | | |
Royalty and milestone income is principally a core of recurring income from the out-licensing of intellectual property. Fair value adjustments on derivative
GSK Annual Report 2010
124
Notes to the financial instruments include movements on the now expired Quest collar and Theravance put and call options.statements
9Operating profit
| | | | | | | | | |
| | | | | | | | | | | | | | | | | | | |
| The following items have been included in operating profit: | | 2009 | | 2008 | | 2007 | | | 2010 | | 2009 | | 2008 | |
| | £m | | £m | | £m | | | £m | | £m | | £m | |
| | | | | | | | | | | | | |
| Employee costs (Note 10) | | 7,167 | | 6,524 | | 5,733 | | | 6,994 | | 7,167 | | 6,524 | |
| Advertising | | 923 | | 805 | | 744 | | | 971 | | 923 | | 805 | |
| Distribution costs | | 363 | | 310 | | 270 | | | 413 | | 363 | | 310 | |
| Depreciation of property, plant and equipment | | 1,130 | | 920 | | 796 | | | 1,146 | | 1,130 | | 920 | |
| Impairment of property, plant and equipment, net of reversals | | 149 | | 256 | | 97 | | | 186 | | 149 | | 256 | |
| Amortisation of intangible assets | | 432 | | 311 | | 226 | | | 533 | | 432 | | 311 | |
| Impairment of intangible assets, net of reversals | | 172 | | 115 | | 54 | | |
| Impairment of intangible assets and goodwill, net of reversals in 2008 | | | 160 | | 172 | | 115 | |
| Net foreign exchange losses/(gains) | | 163 | | | (145 | ) | | | (1 | ) | | 60 | | 163 | | | (145 | ) |
| Inventories: | | |
| Cost of inventories included in cost of sales | | 6,743 | | 5,734 | | 4,784 | | | 7,014 | | 6,743 | | 5,734 | |
| Write-down of inventories | | 276 | | 298 | | 265 | | | 305 | | 276 | | 298 | |
| Reversal of prior year write-down of inventories | | | (116 | ) | | | (118 | ) | | | (103 | ) | | | (66 | ) | | | (116 | ) | | | (118 | ) |
| Operating lease rentals: | | |
| Minimum lease payments | | 160 | | 143 | | 121 | | | 136 | | 160 | | 143 | |
| Contingent rents | | 13 | | 15 | | 13 | | | 14 | | 13 | | 15 | |
| Sub-lease payments | | 6 | | 1 | | 2 | | | 7 | | 6 | | 1 | |
Fees payable to the company’s auditor and its associates in relation to the Group
(see below) | | 24.1 | | 19.2 | | 16.3 | | | 22.2 | | 24.1 | | 19.2 | |
| | | | | | | | | | | | | |
The reversals of prior year write-downs of inventories principally arise from the reassessment of usage or demand expectations prior to inventory expiration.
| | | | | | | | | | | | | | | | | | | | |
| Fees payable to the company’s auditor and its associates | | 2009 | | 2008 | | 2007 | | |
| | £m | | £m | | £m | | |
| | | | | | | | |
| Fees payable to the company's auditor and its associates | | | 2010 | | 2009 | | 2008 | |
| | £m | | £m | | £m | |
| | | | | | | | | | | | | |
| Audit of parent company and consolidated financial statements | | 2.0 | | 1.6 | | 1.8 | | | 2.0 | | 2.0 | | 1.6 | |
| Audit of accounts of the Group’s UK and overseas subsidiaries, pursuant to legislation | | 10.2 | | 9.3 | | 7.9 | | | 11.2 | | 10.2 | | 9.3 | |
| Other assurance services, pursuant to legislation, including attestation under s.404 of Sarbanes-Oxley Act 2002 | | 3.0 | | 2.9 | | 2.9 | | | 3.3 | | 3.0 | | 2.9 | |
| | | | | | | | | | | | | |
| Audit and assurance services | | 15.2 | | 13.8 | | 12.6 | | | 16.5 | | 15.2 | | 13.8 | |
| Other tax services | | 7.3 | | 2.5 | | 2.5 | | | 2.5 | | 7.3 | | 2.5 | |
| All other services, including regulatory, compliance and treasury related services | | 1.6 | | 2.9 | | 1.2 | | | 3.2 | | 1.6 | | 2.9 | |
| | | | | | | | | | | | | |
| | | 24.1 | | 19.2 | | 16.3 | | | 22.2 | | 24.1 | | 19.2 | |
| | | | | | | | | | | | | |
At 31st December 2009,2010, the amount due to PricewaterhouseCoopers LLP and its associates for fees yet to be invoiced was £4.9£6.1 million, comprising statutory audit £4.4£5.6 million, taxation services £0.2 million and other services £0.3 million.
In 2009, fees payable to PricewaterhouseCoopers LLP and its associates for audit and assurance services remained flat in CER terms.
| | | | | | | | | |
| | | | | | | | | | | | | | | | | | | |
| In addition to the above, fees paid in respect of the GSK pension schemes were: | | 2009 | | 2008 | | 2007 | | | 2010 | | 2009 | | 2008 | |
| | £m | | £m | | £m | | | £m | | £m | | £m | |
| | | | | | | | | | | | | |
| Audit | | 0.4 | | 0.4 | | 0.2 | | | 0.4 | | 0.4 | | 0.4 | |
| Other services | | – | | – | | 0.1 | | | – | | – | | – | |
| | | | | | | | | | | | | |
GSK Annual Report 20092010
113125
Notes to the financial statements
10Employee costs
| | | | | | | | | |
| | | | | | | | | | | | | | | | | | | |
| | | 2009 | | 2008 | | 2007 | | | 2010 | | 2009 | | 2008 | |
| | | £m | | £m | | £m | | | £m | | £m | | £m | |
| | | | | | | | | | | | | |
| Wages and salaries | | 5,387 | | 4,640 | | 4,444 | | | 5,079 | | 5,387 | | 4,640 | |
| Social security costs | | 661 | | 653 | | 527 | | | 600 | | 661 | | 653 | |
| Pension and other post-employment costs, including augmentations (Note 28) | | 491 | | 505 | | 313 | | | 554 | | 491 | | 505 | |
| Cost of share-based incentive plans | | 179 | | 241 | | 237 | | | 179 | | 179 | | 241 | |
| Severance and other costs from integration and restructuring activities | | 449 | | 485 | | 212 | | | 582 | | 449 | | 485 | |
| | | | | | | | | | | | | |
| | | 7,167 | | 6,524 | | 5,733 | | | 6,994 | | 7,167 | | 6,524 | |
| | | | | | | | | | | | | |
In 2009,2010, wages and salaries increaseddecreased by 4%7% in CER terms.
The Group provides benefits to employees, commensurate with local practice in individual countries, including, in some markets, healthcare insurance, subsidised car schemes and personal life assurance.
| | | | | | | | | |
| | | | | | | | | | | | | | | | | | | |
| The average number of persons employed by the Group (including Directors) during the year: | | 2009 | | 2008 | | 2007 | | | 2010 | | 2009 | | 2008 | |
| | Number | | Number | | Number | | | Number | | Number | | Number | |
| | | | | | | | | | | | | |
| Manufacturing | | 31,467 | | 33,372 | | 33,975 | | | 30,883 | | 31,467 | | 33,372 | |
| Selling, general and administration | | 53,183 | | 52,115 | | 53,707 | | | 53,778 | | 53,183 | | 52,115 | |
| Research and development | | 14,204 | | 15,646 | | 15,719 | | | 13,824 | | 14,204 | | 15,646 | |
| | | | | | | | | | | | | |
| | | 98,854 | | 101,133 | | 103,401 | | | 98,485 | | 98,854 | | 101,133 | |
| | | | | | | | | | | | | |
The average number of Group employees excludes temporary and contract staff. The numbers of Group employees at the end of each financial year are given in the financial record on page 188.196. The average number of persons employed by GlaxoSmithKline plc in 20092010 was nil (2008(2009 – nil).
The compensation of the Directors and Senior Management (members of the CET) in aggregate, was as follows:
| | | | | | | | | |
| | | | | | | | | | | | | | | | | | | |
| | | 2009 | | 2008 | | 2007 | | | 2010 | | 2009 | | 2008 | |
| | | £m | | £m | | £m | | | £m | | £m | | £m | |
| | | | | | | | | | | | | |
| Wages and salaries | | 23 | | 17 | | 16 | | | 20 | | 23 | | 17 | |
| Social security costs | | 1 | | 1 | | 1 | | | 2 | | 1 | | 1 | |
| Pension and other post-employment costs | | 3 | | 3 | | 3 | | | 3 | | 3 | | 3 | |
| Cost of share-based incentive plans | | 4 | | 12 | | 15 | | | 11 | | 4 | | 12 | |
| | | | | | | | | | | | | |
| | | 31 | | 33 | | 35 | | | 36 | | 31 | | 33 | |
| | | | | | | | | | | | | |
11Finance income
| | | | | | | | | |
| | | | | | | | | | | | | | | | | | | |
| | | 2009 | | 2008 | | 2007 | | | 2010 | | 2009 | | 2008 | |
| | | £m | | £m | | £m | | | £m | | £m | | £m | |
| | | | | | | | | | | | | |
| Interest income arising from: | | |
| cash and cash equivalents | | 46 | | 107 | | 98 | | | 58 | | 46 | | 107 | |
| available-for-sale investments | | 15 | | 31 | | 49 | | | 8 | | 15 | | 31 | |
| derivatives at fair value through profit or loss | | | (5 | ) | | 159 | | 79 | | | 24 | | | (5 | ) | | 159 | |
| loans and receivables | | 11 | | 22 | | 27 | | | 12 | | 11 | | 22 | |
| Realised gains on liquid investments | | – | | 2 | | 1 | | | – | | – | | 2 | |
| Fair value adjustments on derivatives at fair value through profit or loss | | | (3 | ) | | 4 | | – | | |
| Fair value movements on derivatives at fair value through profit or loss | | | 13 | | | (3 | ) | | 4 | |
| Net investment hedge ineffectiveness | | 4 | | | (13 | ) | | 7 | | | – | | 4 | | | (13 | ) |
| Unwinding of discounts on assets | | 2 | | 1 | | 1 | | | 1 | | 2 | | 1 | |
| | | | | | | | | | | | | |
| | | 70 | | 313 | | 262 | | | 116 | | 70 | | 313 | |
| | | | | | | | | | | | | |
All derivatives at fair value through profit or loss other than designated and effective hedging instruments (see Note 41, ‘Financial instruments and related disclosures’) are classified as held-for-trading financial instruments under IAS 39. Interest income arising from derivatives at fair value through profit or loss relates to swap interest income.
GSK Annual Report 20092010
114126
Notes to the financial statements
12Finance costs
| | | | | | | | | |
| | | | | | | | | | | | | | | | | | | |
| | | 2009 | | 2008 | | 2007 | | | 2010 | | 2009 | | 2008 | |
| | | £m | | £m | | £m | | | £m | | £m | | £m | |
| | | | | | | | | | | | | |
| Interest expense arising on: | | |
| financial liabilities at amortised cost | | | (790 | ) | | | (664 | ) | | | (313 | ) | | | (767 | ) | | | (790 | ) | | | (664 | ) |
| derivatives at fair value through profit or loss | | 20 | | | (165 | ) | | | (121 | ) | | – | | 20 | | | (165 | ) |
| Fair value hedges: | | |
| fair value adjustments on derivatives designated as hedging instruments | | | (37 | ) | | 92 | | 10 | | |
| fair value movements on derivatives designated as hedging instruments | | | 26 | | | (37 | ) | | 92 | |
| fair value adjustments on hedged items | | 38 | | | (90 | ) | | | (8 | ) | | | (27 | ) | | 38 | | | (90 | ) |
| Fair value adjustments on other derivatives at fair value through profit or loss | | | (2 | ) | | – | | 6 | | |
| Fair value movements on other derivatives at fair value through profit or loss | | | | (16 | ) | | | (2 | ) | | – | |
| Reclassification of cash flow hedge from other comprehensive income | | | (1 | ) | | – | | – | | | | (3 | ) | | | (1 | ) | | – | |
| Unwinding of discounts on provisions | | | (11 | ) | | | (16 | ) | | | (27 | ) | | | (18 | ) | | | (11 | ) | | | (16 | ) |
| Net investment hedge ineffectiveness | | | | (1 | ) | | – | | – | |
| Other finance expense | | | | (25 | ) | | – | | – | |
| | | | | | | | | | | | | |
| | | | (783 | ) | | | (843 | ) | | | (453 | ) | | | (831 | ) | | | (783 | ) | | | (843 | ) |
| | | | | | | | | | | | | |
All derivatives at fair value through profit or loss except designated and effective hedging instruments are classified as held-for-trading financial instruments under IAS 39.
13Associates and joint ventures
| | | | | | | | | |
| | | | | | | | | | | | | | | | | | | |
| | | 2009 | | 2008 | | 2007 | | | 2010 | | 2009 | | 2008 | |
| | | £m | | £m | | £m | | | £m | | £m | | £m | |
| | | | | | | | | | | | | |
| Associates: | | |
| Share of after tax profits of Quest Diagnostics Inc. | | 73 | | 47 | | 48 | | | 79 | | 73 | | 47 | |
| Share of after tax profits of Aspen Pharmacare Holdings Limited | | 2 | | – | | – | | | 32 | | 2 | | – | |
| Share of after tax losses of other associates | | | (3 | ) | | | (3 | ) | | | (3 | ) | | | (7 | ) | | | (3 | ) | | | (3 | ) |
| | | | | | | | | | | | | |
| | | 72 | | 44 | | 45 | | | 104 | | 72 | | 44 | |
| Share of after tax (losses)/profits of joint ventures | | | (8 | ) | | 4 | | 5 | | | | (23 | ) | | | (8 | ) | | 4 | |
| | | | | | | | | | | | | |
| | | 64 | | 48 | | 50 | | | 81 | | 64 | | 48 | |
| | | | | | | | | | | | |
| | | |
| Share of turnover of joint ventures | | 13 | | 13 | | 13 | | | 18 | | 13 | | 13 | |
| Sales to joint ventures and associates | | 26 | | 9 | | 9 | | | 90 | | 26 | | 9 | |
| | | | | | | | | | | | | |
Summarised income statement information in respect of the Group’s associates is set out below:
| | | | | | | | | |
| | | | | | | | | | | | | | | | | | | |
| | | 2009 | | 2008 | | 2007 | | | 2010 | | 2009 | | 2008 | |
| | | £m | | £m | | £m | | | £m | | £m | | £m | |
| | | | | | | | | | | | | |
| Total turnover: | | |
| Quest Diagnostics Inc. | | 4,779 | | 3,919 | | 3,352 | | | 4,754 | | 4,779 | | 3,919 | |
| Aspen Pharmacare Holdings Limited | | 67 | | – | | – | | | 1,171 | | 67 | | – | |
| Others | | 7 | | 3 | | – | | | 65 | | 7 | | 3 | |
| | | | | | | | | | | | | |
| | | 4,853 | | 3,922 | | 3,352 | | | 5,990 | | 4,853 | | 3,922 | |
| | | | | | | | | | | | |
| | | |
| Total profit: | | |
| Quest Diagnostics Inc. | | 467 | | 314 | | 170 | | | 465 | | 467 | | 314 | |
| Aspen Pharmacare Holdings Limited | | 12 | | – | | – | | | 233 | | 12 | | – | |
| Others | | | (14 | ) | | | (7 | ) | | | (3 | ) | | | (23 | ) | | | (14 | ) | | | (7 | ) |
| | | | | | | | | | | | | |
| | | 465 | | 307 | | 167 | | | 675 | | 465 | | 307 | |
| | | | | | | | | | | | | |
The results of Aspen Pharmacare Holdings Limited included in the summarised income statement information above represent the estimated earnings of the Aspen group in the period since becoming an associated undertaking and are based on analysts forecasts.period.
Subsequent to the year-end, GSK sold its entire shareholding in Quest Diagnostics Inc.
GSK Annual Report 20092010
115127
Notes to the financial statements
14Taxation
| | | | | | | | | |
| | | | | | | | | | | | | | | | | | | |
| Taxation charge based on profits for the year | | 2009 | | 2008 | | 2007 | | | 2010 | | 2009 | | 2008 | |
| | £m | | £m | | £m | | | £m | | £m | | £m | |
| | | | | | | | | | | | | |
| UK corporation tax at the UK statutory rate | | 600 | | 2,213 | | 791 | | | 82 | | 600 | | 2,213 | |
| Less double taxation relief | | | (183 | ) | | | (1,924 | ) | | | (339 | ) | | | (156 | ) | | | (183 | ) | | | (1,924 | ) |
| | | | | | | | | | | | | |
| | | 417 | | 289 | | 452 | | | | (74 | ) | | 417 | | 289 | |
| Overseas taxation | | 1,997 | | 1,589 | | 1,962 | | | 1,496 | | 1,997 | | 1,589 | |
| | | | | | | | | | | | | |
| Current taxation | | 2,414 | | 1,878 | | 2,414 | | | 1,422 | | 2,414 | | 1,878 | |
| Deferred taxation | | | (192 | ) | | 69 | | | (272 | ) | | | (118 | ) | | | (192 | ) | | 69 | |
| | | | | | | | | | | | | |
| | | 2,222 | | 1,947 | | 2,142 | | | 1,304 | | 2,222 | | 1,947 | |
| | | | | | | | | | | | | |
Additional UK corporation| | | | | | | | | | | | | |
| | | | | | | | |
| Reconciliation of the taxation rate on Group profits | | 2010 | | | 2009 | | | 2008 | |
| | % | | | % | | | % | |
| | | | | | | | |
| UK statutory rate of taxation | | | 28.0 | | | | 28.0 | | | | 28.5 | |
| Differences in overseas taxation rates | | | 8.1 | | | | 3.5 | | | | 1.9 | |
| Benefit of special tax status | | | (2.6 | ) | | | (1.8 | ) | | | (2.4 | ) |
| R&D credits | | | (3.7 | ) | | | (1.9 | ) | | | (1.3 | ) |
| Inter-company stock profit | | | 1.7 | | | | 0.5 | | | | 2.1 | |
| Impact of share based payments | | | 1.4 | | | | 0.1 | | | | 0.7 | |
| Tax on profit of associates | | | (1.2 | ) | | | (0.2 | ) | | | (0.4 | ) |
| Losses for which no benefit is recognised | | | 5.5 | | | | 0.6 | | | | 0.0 | |
| Other permanent differences | | | 6.2 | | | | (0.9 | ) | | | 1.2 | |
| Prior year items | | | (6.5 | ) | | | 0.1 | | | | (1.6 | ) |
| Restructuring | | | 4.4 | | | | 0.2 | | | | 0.5 | |
| | | | | | | | |
| Tax rate | | | 41.3 | | | | 28.2 | | | | 29.2 | |
| | | | | | | | |
The higher tax and double taxation relief in 2008 arose from dividends received from overseas subsidiaries.
| | | | | | | | | | | | | |
| Reconciliation of the taxation rate on Group profits | | 2009 | | | 2008 | | | 2007 | |
| | % | | | % | | | % | |
| | | | | | | | | |
| UK statutory rate of taxation | | | 28.0 | | | | 28.5 | | | | 30.0 | |
| Differences in overseas taxation rates | | | 3.5 | | | | 1.9 | | | | 4.3 | |
| Benefit of special tax status | | | (1.8 | ) | | | (2.4 | ) | | | (3.6 | ) |
| R&D credits | | | (1.9 | ) | | | (1.3 | ) | | | (1.5 | ) |
| Intercompany stock profit | | | 0.5 | | | | 2.1 | | | | (0.8 | ) |
| Impact of share based payments | | | 0.1 | | | | 0.7 | | | | 0.6 | |
| Tax on profit of associates | | | (0.2 | ) | | | (0.4 | ) | | | (0.3 | ) |
| Other differences | | | (0.3 | ) | | | 1.2 | | | | (0.3 | ) |
| Prior year items | | | 0.1 | | | | (1.6 | ) | | | 0.1 | |
| Restructuring | | | 0.2 | | | | 0.5 | | | | 0.2 | |
| | | | | | | | | |
| Tax rate | | | 28.2 | | | | 29.2 | | | | 28.7 | |
| | | | | | | | | |
| | | | | | | | | | | | | |
| Tax on items charged to equity and statement of comprehensive income | | 2009 | | | 2008 | | | 2007 | |
| | £m | | | £m | | | £m | |
| | | | | | | | | |
| Current taxation | | | | | | | | | | | | |
| Share based payments | | | 1 | | | | 4 | | | | 21 | |
| Foreign exchange movements | | | 19 | | | | 15 | | | | 21 | |
| | | | | | | | | |
| | | | 20 | | | | 19 | | | | 42 | |
| | | | | | | | | |
| | | | | | | | | | | | | |
| Deferred taxation | | | | | | | | | | | | |
| Share based payments | | | 13 | | | | (5 | ) | | | (17 | ) |
| Defined benefit plans | | | 183 | | | | 441 | | | | (195 | ) |
| Fair value movement on cash flow hedges | | | 2 | | | | (3 | ) | | | 2 | |
| Fair value movements on available-for-sale investments | | | (11 | ) | | | 8 | | | | 19 | |
| | | | | | | | | |
| | | | 187 | | | | 441 | | | | (191 | ) |
| | | | | | | | | |
| | | | 207 | | | | 460 | | | | (149 | ) |
| | | | | | | | | |
Allrate for the year ended 31st December 2010 reflects the impact of the relatively low tax relief arising on the £4 billion of legal provisions charged during the year and the non-deductibility of costs associated with certain site closures, partly offset by the settlement of certain historical tax matters. The percentages within the above items have been charged toreconciliation are exacerbated by the statement of comprehensive income except for tax on share based payments.relatively low reported profit.
The Group operates in countries where the tax rate differs from the UK tax rate. The impact of these overseas taxes on the overall rate of tax is shown above. Profits arising from certain operations in Singapore are accorded special status and are taxed at reduced rates compared with the normal rates of tax in thisthat territory. The effect of this reduction in the taxation charge increased earnings per share by 1.6p in 2010, 2.8p in 2009 and 2.8p in 2008 and 4.9p in 2007.2008. The Group is required under IFRS to create a deferred tax asset in respect of unrealised intercompanyinter-company profit arising on inventory held by the Group at the year-end by applying the tax rate of the country in which the inventory is held (rather than the tax rate of the country where the profit was originally made and the tax paid, which is the practice under UK and US GAAP). As a result of this difference in accounting treatment the Group tax rate on current period intercompanyinter-company profit under IFRS increased by 1.7% in 2010 (2009 – 0.5% in 2009 (2008increase; 2008 – 2.1% increase; 2007 – 0.8% decrease)increase) arising from changes in the location of work-in-progress and finished goods.
| | | | | | | | | | | | | |
| | | | | | | | |
| Tax on items charged to equity and statement of comprehensive income | | 2010 | | | 2009 | | | 2008 | |
| | £m | | | £m | | | £m | |
| | | | | | | | |
| Current taxation | | | | | | | | | | | | |
| Share based payments | | | – | | | | 1 | | | | 4 | |
| Foreign exchange movements | | | – | | | | 19 | | | | 15 | |
| | | | | | | | |
| | | | – | | | | 20 | | | | 19 | |
| | | | | | | | |
| | | | | | | | | | | | | |
| Deferred taxation | | | | | | | | | | | | |
| Share based payments | | | 2 | | | | 13 | | | | (5 | ) |
| Defined benefit plans | | | 1 | | | | 183 | | | | 441 | |
| Fair value movements on cash flow hedges | | | 1 | | | | 2 | | | | (3 | ) |
| Fair value movements on available-for-sale investments | | | (28 | ) | | | (11 | ) | | | 8 | |
| | | | | | | | |
| | | | (24 | ) | | | 187 | | | | 441 | |
| | | | | | | | |
| Total (charge)/credit to equity and statement of comprehensive income | | | (24 | ) | | | 207 | | | | 460 | |
| | | | | | | | |
All of the above items have been charged to the statement of comprehensive income except for tax on share based payments.
GSK Annual Report 2010
128
Notes to the financial statements
14Taxationcontinued
Issues relating to taxation
The integrated nature of the Group’s worldwide operations involvinginvolves significant investment in research and strategic manufacture at a limited number of locations, with consequential cross-border supply routes into numerous end-markets,end-markets. This gives rise to complexity and delay in negotiations with revenue authorities as to the profits on which individual Group companies are liable to tax. Resolution of such issues is a continuing fact of life for GSK.
During the year GSK Annual Report 2009
116
Notesagreed and settled further open years with major tax authorities up to and including 2008. In Canada, the financial statements
14 Taxationcontinued
Following its auditFederal Court of the period 2001 to 2003, the IRS issued Statutory NoticesAppeal overturned a judgement of Deficiency to GSK asserting income and withholding tax deficiencies, and associated penalties, arising from the IRS’s reclassification of an intercompany financing arrangement in those years from debt to equity, and its consequent recharacterisation of the amounts paid as dividends subject to withholding tax under the US – UK treaty. All amounts due under the financing arrangement were paid on a timely basis, with the final payment made in April 2008. GSK disagreed with the IRS’s position and, in August 2008, initiated actions in the United States Tax Court to contest the Statutory Notices of Deficiency. On 19th November 2009, GSK and the IRS filed a Stipulation with the Tax Court in which the IRS conceded all asserted tax deficiencies and penalties arising from its reclassification of the above intercompany financing arrangement from debt to equity, resulting in no additional tax cost to GSK. The IRS claim had previously been estimated at $864m for 2001-2003. GSK and the IRS are now in the process of finalising the tax computations for the 2001 to 2003 tax years. It is anticipated that resolution of the issue in the years 2004 to 2008 will be reflected in a closing agreement. Resolution of the issue had no impact on the Group’s results.
In Canada GSK is continuing to contest a court decision in respect of GSK’s transfer pricing in the early 1990s.1990’s and remanded the case back to the Tax Court for reconsideration. The dateparties are seeking leave to appeal to the Supreme Court of the appeal hearing has been set for March 2010. Canada.
GSK continues to believe that it has made adequate provision for the liabilities likely to arise from periods which are open and not yet agreed by tax authorities. The ultimate liability for such matters may vary from the amounts provided and is dependent upon the outcome of agreements with relevant tax authorities or litigation where appropriate or by agreement with the relevant tax authorities.appropriate.
No provision has been made for taxation which would arise on the distribution of profits retained by overseas subsidiaries, on the grounds that the Group is able to control the timing of the reversal of these temporary differences and it is probable that they will not reverse in the foreseeable future. The aggregate amount of these unremitted profits at the balance sheet date was approximately £30 billion (2009 – £29 billion (2008 – £28 billion). The introduction of the UK dividend exemption on 1st July 2009, now enables the reasonable quantification of the incremental liability from repatriation of profits to the UK. The deferred tax on unremitted earnings at 31st December 20092010 is estimated to be approximately £500 million (2009 – £500 million), which relates to taxes payable on repatriation and dividend withholding taxes levied by overseas tax jurisdictions.
| | | | | | | | | | | | | |
| Movement on current tax account | | Payable | | | Recoverable | | | Net | |
| | £m | | | £m | | | £m | |
| | | | | | | | | |
| At 1st January 2009 | | | (780 | ) | | | 76 | | | | (704 | ) |
| Exchange adjustments | | | 12 | | | | 1 | | | | 13 | |
| Charge for the year | | | (2,056 | ) | | | (358 | ) | | | (2,414 | ) |
| Cash paid | | | 1,393 | | | | 311 | | | | 1,704 | |
| Other movements | | | (20 | ) | | | 28 | | | | 8 | |
| | | | | | | | | |
| At 31st December 2009 | | | (1,451 | ) | | | 58 | | | | (1,393 | ) |
| | | | | | | | | |
Movement in deferred tax assets and liabilities
| | | | | | | | | | | | | | | | | | | | | | | | | | | | | | | | | | | | | | | | | | | | | | | | | |
| | | | | | | | | | | | | | | Pensions & | | | | | | | | | | | Manu- | | | | | | | Share | | | Other | | | | | | | |
Deferred taxation
assets/(liabilities) | | Accelerated | | | | | | | Intra- | | | other post | | | | | | | Legal | | | facturing | | | Stock | | | option | | | net | | | Offset | | | | |
| | capital | | | | | | | group | | | retirement | | | Tax | | | & other | | | restruct- | | | valuation | | | and award | | | temporary | | | within | | | | |
| | allowances | | | Intangibles | | | profit | | | benefits | | | losses | | | disputes | | | uring | | | adjustments | | | schemes | | | differences | | | countries | | | Total | |
| | £m | | | £m | | | £m | | | £m | | | £m | | | £m | | | £m | | | £m | | | £m | | | £m | | | £m | | | £m | |
| | | | | | | | | | | | | | | | | | | | | | | | | | | | | | | | | | | | |
Deferred tax assets at 1st January 2009 | | | 23 | | | | 152 | | | | 1,234 | | | | 1,062 | | | | 196 | | | | 249 | | | | 162 | | | | 15 | | | | 102 | | | | 830 | | | | (1,265 | ) | | | 2,760 | |
Deferred tax liabilities at 1st January 2009 | | | (726 | ) | | | (970 | ) | | | – | | | | – | | | | (23 | ) | | | – | | | | – | | | | (247 | ) | | | – | | | | (13 | ) | | | 1,265 | | | | (714 | ) |
| | | | | | | | | | | | | | | | | | | | | | | | | | | | | | | | | | | | |
| At 1st January 2009 | | | (703 | ) | | | (818 | ) | | | 1,234 | | | | 1,062 | | | | 173 | | | | 249 | | | | 162 | | | | (232 | ) | | | 102 | | | | 817 | | | | – | | | | 2,046 | |
| Exchange adjustments | | | 15 | | | | 36 | | | | (45 | ) | | | (87 | ) | | | (13 | ) | | | (28 | ) | | | (7 | ) | | | 22 | | | | – | | | | (59 | ) | | | – | | | | (166 | ) |
| Credit/(charge) to income | | | | | | | | | | | | | | | | | | | | | | | | | | | | | | | | | | | | | | | | | | | – | | | | | |
| statement | | | 89 | | | | 74 | | | | (6 | ) | | | (113 | ) | | | (52 | ) | | | 82 | | | | (11 | ) | | | 52 | | | | 11 | | | | 66 | | | | – | | | | 192 | |
| Credit/(charge) to equity | | | – | | | | – | | | | – | | | | – | | | | – | | | | – | | | | – | | | | – | | | | 13 | | | | – | | | | – | | | | 13 | |
| Credit/(charge) to statement of comprehensive income | | | – | | | | – | | | | – | | | | 183 | | | | – | | | | – | | | | – | | | | – | | | | – | | | | (9 | ) | | | – | | | | 174 | |
| Acquisitions | | | (5 | ) | | | (591 | ) | | | – | | | | (2 | ) | | | 75 | | | | – | | | | 13 | | | | (10 | ) | | | – | | | | (10 | ) | | | – | | | | (530 | ) |
| | | | | | | | | | | | | | | | | | | | | | | | | | | | | | | | | | | | |
| At 31st December 2009 | | | (604 | ) | | | (1,299 | ) | | | 1,183 | | | | 1,043 | | | | 183 | | | | 303 | | | | 157 | | | | (168 | ) | | | 126 | | | | 805 | | | | – | | | | 1,729 | |
| | | | | | | | | | | | | | | | | | | | | | | | | | | | | | | | | | |
| | | | | | | | | | | | | | | | | | | | | | | | | | | | | | | | | | | | | | | | | | | | | | | | | |
Deferred tax assets at 31st December 2009 | | | 24 | | | | 177 | | | | 1,183 | | | | 1,043 | | | | 211 | | | | 303 | | | | 157 | | | | 30 | | | | 126 | | | | 822 | | | | (1,702 | ) | | | 2,374 | |
Deferred tax liabilities at 31st December 2009 | | | (628 | ) | | | (1,476 | ) | | | – | | | | – | | | | (28 | ) | | | – | | | | – | | | | (198 | ) | | | – | | | | (17 | ) | | | 1,702 | | | | (645 | ) |
| | | | | | | | | | | | | | | | | | | | | | | | | | | | | | | | | | | | |
| | | | (604 | ) | | | (1,299 | ) | | | 1,183 | | | | 1,043 | | | | 183 | | | | 303 | | | | 157 | | | | (168 | ) | | | 126 | | | | 805 | | | | – | | | | 1,729 | |
| | | | | | | | | | | | | | | | | | | | | | | | | | | | | | | | | | | | |
GSK Annual Report 2009
117
Notes to the financial statements
14 Taxationcontinued| | | | | | | | | | | | | | | | | | | | | | | | | | | | | | | | | | | | | | | | | | | | | | | | | |
| | | | | | | | | | | | | | | | | | | | | | | | | | | | | | | | | | | |
| | | | | | | | | | | | | | | Pensions & | | | | | | | | | | | Manu- | | | | | | | Share | | | Other | | | | | | | |
| | | Accelerated | | | | | | | Intra- | | | other post | | | | | | | Legal | | | facturing | | | Stock | | | option | | | net | | | Offset | | | | |
| | | capital | | | | | | | group | | | employment | | | Tax | | | & other | | | restruct- | | | valuation | | | and award | | | temporary | | | within | | | | |
| | | allowances | | | Intangibles | | | profit | | | benefits | | | losses | | | disputes | | | uring | | | adjustments | | | schemes | | | differences | | | countries | | | Total | |
| | | £m | | | £m | | | £m | | | £m | | | £m | | | £m | | | £m | | | £m | | | £m | | | £m | | | £m | | | £m | |
| | | | | | | | | | | | | | | | | | | | | | | | | | | | | | | | | | | |
Deferred tax assets at
1st January 2010 | | | 24 | | | | 177 | | | | 1,183 | | | | 1,043 | | | | 211 | | | | 303 | | | | 157 | | | | 30 | | | | 126 | | | | 822 | | | | (1,702 | ) | | | 2,374 | |
Deferred tax liabilities at
1st January 2010 | | | (628 | ) | | | (1,476 | ) | | | – | | | | – | | | | (28 | ) | | | – | | | | – | | | | (198 | ) | | | – | | | | (17 | ) | | | 1,702 | | | | (645 | ) |
| | | | | | | | | | | | | | | | | | | | | | | | | | | | | | | | | | | |
| At 1st January 2010 | | | (604 | ) | | | (1,299 | ) | | | 1,183 | | | | 1,043 | | | | 183 | | | | 303 | | | | 157 | | | | (168 | ) | | | 126 | | | | 805 | | | | – | | | | 1,729 | |
| Exchange adjustments | | | (5 | ) | | | (10 | ) | | | 70 | | | | 15 | | | | 3 | | | | 7 | | | | 2 | | | | (2 | ) | | | – | | | | 31 | | | | – | | | | 111 | |
| Credit/(charge) to income statement | | | 146 | | | | 10 | | | | (126 | ) | | | (36 | ) | | | (88 | ) | | | 115 | | | | (42 | ) | | | 148 | | | | (35 | ) | | | 26 | | | | – | | | | 118 | |
| Credit to equity | | | – | | | | – | | | | – | | | | – | | | | – | | | | – | | | | – | | | | – | | | | 2 | | | | – | | | | – | | | | 2 | |
| Credit/(charge) to statement of comprehensive income | | | – | | | | – | | | | – | | | | 1 | | | | – | | | | – | | | | – | | | | – | | | | – | | | | (27 | ) | | | – | | | | (26 | ) |
| Acquisitions | | | – | | | | (40 | ) | | | – | | | | – | | | | – | | | | – | | | | – | | | | – | | | | – | | | | (35 | ) | | | – | | | | (75 | ) |
| | | | | | | | | | | | | | | | | | | | | | | | | | | | | | | | | | | |
| At 31st December 2010 | | | (463 | ) | | | (1,339 | ) | | | 1,127 | | | | 1,023 | | | | 98 | | | | 425 | | | | 117 | | | | (22 | ) | | | 93 | | | | 800 | | | | – | | | | 1,859 | |
| | | | | | | | | | | | | | | | | | | | | | | | | | | | | | | | | | | |
Deferred tax assets at
31st December 2010 | | | 49 | | | | 224 | | | | 1,127 | | | | 1,023 | | | | 98 | | | | 425 | | | | 117 | | | | 29 | | | | 93 | | | | 914 | | | | (1,533 | ) | | | 2,566 | |
Deferred tax liabilities at
31st December 2010 | | | (512 | ) | | | (1,563 | ) | | | – | | | | – | | | | – | | | | – | | | | – | | | | (51 | ) | | | – | | | | (114 | ) | | | 1,533 | | | | (707 | ) |
| | | | | | | | | | | | | | | | | | | | | | | | | | | | | | | | | | | |
| | | | (463 | ) | | | (1,339 | ) | | | 1,127 | | | | 1,023 | | | | 98 | | | | 425 | | | | 117 | | | | (22 | ) | | | 93 | | | | 800 | | | | – | | | | 1,859 | |
| | | | | | | | | | | | | | | | | | | | | | | | | | | | | | | | | | | |
The deferred tax chargecredit to income relating to changes in tax rates is £11 million (2009 – £9 million.million, 2008 – £18 million). All other deferred tax movements arise from the origination and reversal of temporary differences. Other net temporary differences mainly include accrued expenses and other provisions.for which a tax deduction is only available on a paid basis.
At 31st December 2009,GSK Annual Report 2010
129
Notes to the Group had recognised a deferred tax asset of £183 million (2008 – £173 million) in respect of income tax losses of approximately £617 million (2008 – £566 million). Of these losses, £76 million (2008 – £142 million) are due to expire between 2010-2019, £445 million (2008 – £357 million) are due to expire between 2020 – 2029 and £96 million (2008 – £67 million) are available indefinitely. At 31st December 2009,financial statements
14Taxationcontinued
| | | | | | | | | | | | | | | | | |
| | | | | |
| Tax losses | Recognised | | | Unrecognised | |
| | | 2010 | | | 2009 | | | 2010 | | | 2009 | |
| | | £m | | | £m | | | £m | | | £m | |
| | | | | | | | | | | |
| Trading losses expiring: | | | | | | | | | | | | | | | | |
| Within 10 years | | | 163 | | | | 76 | | | | 14 | | | | 34 | |
| In more than 10 years | | | 329 | | | | 445 | | | | 529 | | | | 159 | |
| Available indefinitely | | | 1 | | | | 96 | | | | 5,302 | | | | 4,204 | |
| | | | | | | | | | | |
| At 31st December | | | 493 | | | | 617 | | | | 5,845 | | | | 4,397 | |
| | | | | | | | | | | |
| Deferred tax asset | | | 98 | | | | 183 | | | | – | | | | – | |
| | | | | | | | | | | |
In addition, the Group had not recognised any deferred tax asset in respect of income tax losses of approximately £4,397 million (2008 – £4,526 million), of which £34 million (2008 – £37 million) are due to expire between 2010-2019, £159 million (2008 – £66 million) are due to expire between 2020 – 2029 and £4,204 million (2008 – £4,423 million) which are available indefinitely. The Group had capital losses at 31st December 20092010 of approximately £4.3 billion (2009 – £4.3 billion) in respect of which no deferred tax asset has been recognised. Deferred tax assets are recognised where it is probable that future taxable profit will be available to utilise losses.
Factors affecting the tax charge in future years
As a global organisation there are many factors which could affect the future effective tax rate of the Group. The mix of profits across different territories, transfer pricing and other disputes with tax authorities and the location of research and development activity can all have a significant impact on the Group’s effective tax rate.
Changes to tax legislation in territories where GSK has business operations could also impact the Group’s effective tax rate. The UK tax authorities haveGovernment has proposed some significant changes to the UK taxation system. In December 2009June 2010 the UK Government announced thata phased reduction in the main rate of corporation tax from 28% to 24% over 4 years from April 2011. The deferred tax movements reflect the reduction in the UK tax rate from 28% to 27% as it intendshas been substantively enacted. In November 2010 the UK Government reconfirmed its intention to introduce a Patent Box‘patent box’ regime applyingwhich would apply a reduced rate of corporation tax to income from patents. The changes are expected to havepatents with effect from April 2013, following a period of consultation. The UK Government also continues to consult with business on proposed changes to the Controlled Foreign Company regime. Theselegislation relating to controlled foreign companies. The majority of these changes are expected to be enacted in 2011.2012.
15Earnings per share
| | | | | | | | | |
| | | | | | | | | | | | | | | | | | | |
| | | 2009 | | 2008 | | 2007 | | | 2010 | | 2009 | | 2008 | |
| | | pence | | pence | | pence | | | pence | | pence | | pence | |
| | | | | | | | | | | | | |
| Basic earnings per share | | 109.1 | | 88.6 | | 94.4 | | | 32.1 | | 109.1 | | 88.6 | |
| Adjustment for major restructuring | | 12.1 | | 16.1 | | 4.7 | | | 21.8 | | 12.1 | | 16.1 | |
| | | | | | | | | | | | | |
| Basic earnings per share before major restructuring | | 121.2 | | 104.7 | | 99.1 | | | 53.9 | | 121.2 | | 104.7 | |
| | | | | | | | | | | | |
| Diluted earnings per share | | 108.2 | | 88.1 | | 93.7 | | | 31.9 | | 108.2 | | 88.1 | |
| Adjustment for major restructuring | | 12.1 | | 16.0 | | 4.6 | | | 21.6 | | 12.1 | | 16.0 | |
| | | | | | | | | | | | | |
| Diluted earnings per share before major restructuring | | 120.3 | | 104.1 | | 98.3 | | | 53.5 | | 120.3 | | 104.1 | |
| | | | | | | | | | | | | |
Basic and adjusted earnings per share have been calculated by dividing the profit attributable to shareholders by the weighted average number of shares in issue during the period after deducting shares held by the ESOP Trusts and Treasury shares. The trustees have waived their rights to dividends on the shares held by the ESOP Trusts.
Adjusted earnings per share is calculated using results before major restructuring earnings. The calculation of results before major restructuring is described in Note 1 ‘Presentation of the financial statements’.
Diluted earnings per share have been calculated after adjusting the weighted average number of shares used in the basic calculation to assume the conversion of all potentially dilutive shares. A potentially dilutive share forms part of the employee share schemes where its exercise price is below the average market price of GSK shares during the period and any performance conditions attaching to the scheme have been met at the balance sheet date.
The numbers of shares used in calculating basic and diluted earnings per share are reconciled below.
| | | | | | | | | | | | | |
| Weighted average number of shares in issue | | 2009 | | | 2008 | | | 2007 | |
| | millions | | | millions | | | millions | |
| | | | | | | | | |
| Basic | | | 5,069 | | | | 5,195 | | | | 5,524 | |
| Dilution for share options | | | 39 | | | | 31 | | | | 43 | |
| | | | | | | | | |
| Diluted | | | 5,108 | | | | 5,226 | | | | 5,567 | |
| | | | | | | | | |
Shares held by the ESOP Trusts are excluded. The trustees have waived their rights to dividends on the shares held by the ESOP Trusts.| | | | | | | | | | | | | |
| | | | | | | | |
| Weighted average number of shares in issue | | 2010 | | | 2009 | | | 2008 | |
| | millions | | | millions | | | millions | |
| | | | | | | | |
| Basic | | | 5,085 | | | | 5,069 | | | | 5,195 | |
| Dilution for share options | | | 43 | | | | 39 | | | | 31 | |
| | | | | | | | |
| Diluted | | | 5,128 | | | | 5,108 | | | | 5,226 | |
| | | | | | | | |
GSK Annual Report 20092010
118130
Notes to the financial statements
16Dividends
| | | | | | | | | | | | | | | | | | | | | |
| 2009 | | First interim | | | Second interim | | | Third interim | | | Fourth interim | | | Total | |
| | | | | | | | | | | | | | | |
| Total dividend (£m) | | | 701 | | | | 713 | | | | 763 | | | | 913 | | | | 3,090 | |
| Dividend per share (pence) | | | 14 | | | | 14 | | | | 15 | | | | 18 | | | | 61 | |
| Paid/payable | | 9th July 2009 | | | 8th October 2009 | | | 7th January 2010 | | | 8th April 2010 | | | | | |
| | | | | | | | | | | | | |
| | | | | | | | | | | | | | | | | | | | | |
2008 | | | | | | | | | | | | | | | | | | | | |
| | | | | | | | | | | | | | | |
| Total dividend (£m) | | | 683 | | | | 679 | | | | 730 | | | | 859 | | | | 2,951 | |
| Dividend per share (pence) | | | 13 | | | | 13 | | | | 14 | | | | 17 | | | | 57 | |
| Paid | | 10th July 2008 | | | 9th October 2008 | | | 8th January 2009 | | | 9th April 2009 | | | | | |
| | | | | | | | | | | | | |
2007
| | | | | | | | | | | | | | | | | | | | |
| | | | | | | | | | | | | | | |
| Total dividend (£m) | | | 670 | | | | 667 | | | | 708 | | | | 859 | | | | 2,904 | |
| Dividend per share (pence) | | | 12 | | | | 12 | | | | 13 | | | | 16 | | | | 53 | |
| Paid | | 12th July 2007 | | | 11th October 2007 | | | 10th January 2008 | | | 10th April 2008 | | | | | |
| | | | | | | | | | | | | | | |
| |
| Under IFRS interim dividends are only recognised in the financial statements when paid and not when declared. GSK normally pays a dividend two quarters after the quarter to which it relates and one quarter after it is declared. The 2009 financial statements recognise those dividends paid in 2009, namely the third and fourth interim dividends for 2008 and the first and second interim dividends for 2009. |
| |
| The amounts recognised in each year are as follows: |
| |
| | | | | | | | | | | 2009 | | | 2008 | | | 2007 | |
| | | | | | | | | | | £m | | | £m | | | £m | |
| | | | | | | | | | | | | | | | | |
| Dividends to shareholders | | | | | | | | | | | 3,003 | | | | 2,929 | | | | 2,793 | |
| | | | | | | | | | | | | | | | | |
| |
17 Property, plant and equipment |
| |
| | | | | | | | | | | Plant, | | | | | | | | |
| | | | | | | Land and | | | equipment | | | Assets in | | | | |
| | | | | | | buildings | | | and vehicles | | | construction | | | Total | |
| | | | | | | £m | | | £m | | | £m | | | £m | |
| | | | | | | | | | | | | | | | |
| Cost at 1st January 2008 | | | | | | | 4,634 | | | | 8,497 | | | | 1,956 | | | | 15,087 | |
| Exchange adjustments | | | | | | | 1,046 | | | | 1,471 | | | | 442 | | | | 2,959 | |
| Additions | | | | | | | 124 | | | | 425 | | | | 895 | | | | 1,444 | |
| Additions through business combinations | | | | | | | 13 | | | | 7 | | | | – | | | | 20 | |
| Disposals and write-offs | | | | | | | (128 | ) | | | (356 | ) | | | (27 | ) | | | (511 | ) |
| Reclassifications | | | | | | | 292 | | | | 643 | | | | (944 | ) | | | (9 | ) |
| Transfer to assets held for sale | | | | | | | (2 | ) | | | (1 | ) | | | – | | | | (3 | ) |
| | | | | | | | | | | | | | | | |
| Cost at 31st December 2008 | | | | | | | 5,979 | | | | 10,686 | | | | 2,322 | | | | 18,987 | |
| Exchange adjustments | | | | | | | (343 | ) | | | (493 | ) | | | (154 | ) | | | (990 | ) |
| Additions | | | | | | | 188 | | | | 432 | | | | 803 | | | | 1,423 | |
| Additions through business combinations | | | | | | | 67 | | | | 76 | | | | 8 | | | | 151 | |
| Capitalised borrowing costs | | | | | | | – | | | | – | | | | 1 | | | | 1 | |
| Disposals and write-offs | | | | | | | (184 | ) | | | (614 | ) | | | (5 | ) | | | (803 | ) |
| Reclassifications | | | | | | | 309 | | | | 430 | | | | (735 | ) | | | 4 | |
| Transfer to assets held for sale | | | | | | | (14 | ) | | | (2 | ) | | | – | | | | (16 | ) |
| | | | | | | | | | | | | | | | |
| Cost at 31st December 2009 | | | | | | | 6,002 | | | | 10,515 | | | | 2,240 | | | | 18,757 | |
| | | | | | | | | | | | | | | | |
| | | | | | | | | | | | | | | | | | | | | |
| | | | | | | | | | | | | | |
| 2010 | | First interim | | | Second interim | | | Third interim | | | Fourth interim | | | Total | |
| | | | | | | | | | | | | | |
| Total dividend (£m) | | | 764 | | | | 759 | | | | 816 | | | | 967 | | | | 3,306 | |
| Dividend per share (pence) | | | 15 | | | | 15 | | | | 16 | | | | 19 | | | | 65 | |
| | | | | | | | | | | | | | | | | | | | | |
| Paid/payable | | 8th July 2010 | | | 7th October 2010 | | | 6th January 2011 | | | 7th April 2011 | | | | | |
| | | | | | | | | | | | | | |
| | | | | | | | | | | | | | | | | | | | | |
2009 | | | | | | | | | | | | | | | | | | | | |
| | | | | | | | | | | | | | |
| Total dividend (£m) | | | 701 | | | | 713 | | | | 763 | | | | 919 | | | | 3,096 | |
| Dividend per share (pence) | | | 14 | | | | 14 | | | | 15 | | | | 18 | | | | 61 | |
| | | | | | | | | | | | | | | | | | | | | |
| Paid | | 9th July 2009 | | | 8th October 2009 | | | 7th January 2010 | | | 8th April 2010 | | | | |
| | | | | | | | | | | | | | |
| | | | | | | | | | | | | | | | | | | | | |
2008 | | | | | | | | | | | | | | | | | | | | |
| | | | | | | | | | | | | | |
| Total dividend (£m) | | | 683 | | | | 679 | | | | 730 | | | | 859 | | | | 2,951 | |
| Dividend per share (pence) | | | 13 | | | | 13 | | | | 14 | | | | 17 | | | | 57 | |
| | | | | | | | | | | | | | | | | | | | | |
| Paid | | 10th July 2008 | | | 9th October 2008 | | | 8th January 2009 | | | 9th April 2009 | | | | |
| | | | | | | | | | | | | | |
Under IFRS interim dividends are only recognised in the financial statements when paid and not when declared. GSK normally pays a dividend two quarters after the quarter to which it relates and one quarter after it is declared. The 2010 financial statements recognise those dividends paid in 2010, namely the third and fourth interim dividends for 2009 and the first and second interim dividends for 2010.
The amounts recognised in each year are as follows:
| | | | | | | | | | | | | |
| | | | | | | | |
| | | 2010 | | | 2009 | | | 2008 | |
| | | £m | | | £m | | | £m | |
| | | | | | | | |
| Dividends to shareholders | | | 3,205 | | | | 3,003 | | | | 2,929 | |
| | | | | | | | |
17Property, plant and equipment
| | | | | | | | | | | | | | | | | |
| | | | | | | | | | | |
| | | | | | | Plant, | | | | | | | |
| | | Land and | | | equipment | | | Assets in | | | | |
| | | buildings | | | and vehicles | | | construction | | | Total | |
| | | £m | | | £m | | | £m | | | £m | |
| | | | | | | | | | | |
| Cost at 1st January 2009 | | | 5,979 | | | | 10,686 | | | | 2,322 | | | | 18,987 | |
| Exchange adjustments | | | (343 | ) | | | (493 | ) | | | (154 | ) | | | (990 | ) |
| Additions | | | 188 | | | | 432 | | | | 803 | | | | 1,423 | |
| Additions through business combinations | | | 67 | | | | 76 | | | | 8 | | | | 151 | |
| Capitalised borrowing costs | | | – | | | | – | | | | 1 | | | | 1 | |
| Disposals and write-offs | | | (184 | ) | | | (614 | ) | | | (5 | ) | | | (803 | ) |
| Reclassifications | | | 309 | | | | 430 | | | | (735 | ) | | | 4 | |
| Transfer to assets held for sale | | | (14 | ) | | | (2 | ) | | | – | | | | (16 | ) |
| | | | | | | | | | | |
| Cost at 31st December 2009 | | | 6,002 | | | | 10,515 | | | | 2,240 | | | | 18,757 | |
| Exchange adjustments | | | 80 | | | | 60 | | | | (7 | ) | | | 133 | |
| Additions | | | 75 | | | | 293 | | | | 670 | | | | 1,038 | |
| Additions through business combinations | | | 20 | | | | 7 | | | | – | | | | 27 | |
| Capitalised borrowing costs | | | – | | | | – | | | | 6 | | | | 6 | |
| Disposals and write-offs | | | (111 | ) | | | (661 | ) | | | (2 | ) | | | (774 | ) |
| Reclassifications | | | 223 | | | | 432 | | | | (671 | ) | | | (16 | ) |
| Transfer to assets held for sale | | | (171 | ) | | | (105 | ) | | | – | | | | (276 | ) |
| | | | | | | | | | | |
| Cost at 31st December 2010 | | | 6,118 | | | | 10,541 | | | | 2,236 | | | | 18,895 | |
| | | | | | | | | | | |
GSK Annual Report 20092010
119131
Notes to the financial statements
17Property, plant and equipmentcontinued
| | | | | | | | | | | | | | | | | | | | | | | | | | |
| | | Plant, | | | | | | | | | | | | | |
| | | Land and | | equipment | | Assets in | | | | | Plant, | | | | | |
| | | buildings | | and vehicles | | construction | | Total | | | Land and | | equipment | | Assets in | | | |
| | | £m | | £m | | £m | | £m | | | buildings | | and vehicles | | construction | | Total | |
| | | | | | | | | | | £m | | £m | | £m | | £m | |
| Depreciation at 1st January 2008 | | | (1,534 | ) | | | (5,290 | ) | | – | | | (6,824 | ) | |
| | | | | | | | | | |
| Depreciation at 1st January 2009 | | | | (2,062 | ) | | | (6,630 | ) | | – | | | (8,692 | ) |
| Exchange adjustments | | | (385 | ) | | | (914 | ) | | – | | | (1,299 | ) | | 128 | | 312 | | – | | 440 | |
| Provision for the year | | | (228 | ) | | | (692 | ) | | – | | | (920 | ) | |
| Disposals and write-offs | | 85 | | 265 | | – | | 350 | | |
| Transfer to assets held for sale | | – | | 1 | | – | | 1 | | |
| | | | | | | | | | |
| | | |
| Depreciation at 31st December 2008 | | | (2,062 | ) | | | (6,630 | ) | | – | | | (8,692 | ) | |
| Exchange adjustments | | 128 | | 312 | | – | | 440 | | |
| Provision for the year | | | (283 | ) | | | (847 | ) | | – | | | (1,130 | ) | |
| Charge for the year | | | | (283 | ) | | | (847 | ) | | – | | | (1,130 | ) |
| Disposals and write-offs | | 129 | | 478 | | – | | 607 | | | 129 | | 478 | | – | | 607 | |
| Transfer to assets held for sale | | 1 | | 1 | | – | | 2 | | | 1 | | 1 | | – | | 2 | |
| | | | | | | | | | | | | | | | | |
| Depreciation at 31st December 2009 | | | (2,087 | ) | | | (6,686 | ) | | – | | | (8,773 | ) | | | (2,087 | ) | | | (6,686 | ) | | – | | | (8,773 | ) |
| Exchange adjustments | | | | (39 | ) | | | (51 | ) | | – | | | (90 | ) |
| Charge for the year | | | | (321 | ) | | | (825 | ) | | – | | | (1,146 | ) |
| Disposals and write-offs | | | 11 | | 508 | | – | | 519 | |
| Transfer to assets held for sale | | | 147 | | 95 | | – | | 242 | |
| | | | | | | | | | | | | | | | | |
| Depreciation at 31st December 2010 | | | | (2,289 | ) | | | (6,959 | ) | | – | | | (9,248 | ) |
| | | | | | | | | | |
| Impairment at 1st January 2008 | | | (122 | ) | | | (239 | ) | | | (81 | ) | | | (442 | ) | |
| Exchange adjustments | | | (22 | ) | | | (27 | ) | | | (14 | ) | | | (63 | ) | |
| Disposals and write-offs | | 50 | | 67 | | 27 | | 144 | | |
| Impairment losses | | | (70 | ) | | | (176 | ) | | | (20 | ) | | | (266 | ) | |
| Reclassifications | | – | | | (44 | ) | | 44 | | - | | |
| Reversal of impairments | | 3 | | 7 | | – | | 10 | | |
| | | | | | | | | | |
| | | |
| Impairment at 31st December 2008 | | | (161 | ) | | | (412 | ) | | | (44 | ) | | | (617 | ) | |
| Impairment at 1st January 2009 | | | | (161 | ) | | | (412 | ) | | | (44 | ) | | | (617 | ) |
| Exchange adjustments | | 6 | | 10 | | 4 | | 20 | | | 6 | | 10 | | 4 | | 20 | |
| Disposals and write-offs | | 28 | | 104 | | 4 | | 136 | | | 28 | | 104 | | 4 | | 136 | |
| Impairment losses | | | (27 | ) | | | (108 | ) | | | (25 | ) | | | (160 | ) | | | (27 | ) | | | (108 | ) | | | (25 | ) | | | (160 | ) |
| Reversal of impairments | | 1 | | 10 | | – | | 11 | | | 1 | | 10 | | – | | 11 | |
| | | | | | | | | | | | | | | | | |
| Impairment at 31st December 2009 | | | (153 | ) | | | (396 | ) | | | (61 | ) | | | (610 | ) | | | (153 | ) | | | (396 | ) | | | (61 | ) | | | (610 | ) |
| Exchange adjustments | | | – | | 2 | | | (1 | ) | | 1 | |
| Disposals and write-offs | | | 64 | | 111 | | – | | 175 | |
| Impairment losses | | | | (43 | ) | | | (160 | ) | | | (2 | ) | | | (205 | ) |
| Reversal of impairments | | | 14 | | 5 | | – | | 19 | |
| Transfer to assets held for sale | | | 18 | | – | | – | | 18 | |
| | | | | | | | | | | | | | | | | |
| | | |
| Total depreciation and impairment at 31st December 2008 | | | (2,223 | ) | | | (7,042 | ) | | | (44 | ) | | | (9,309 | ) | |
| Impairment at 31st December 2010 | | | | (100 | ) | | | (438 | ) | | | (64 | ) | | | (602 | ) |
| | | | | | | | | | |
| Total depreciation and impairment at 31st December 2009 | | | (2,240 | ) | | | (7,082 | ) | | | (61 | ) | | | (9,383 | ) | | | (2,240 | ) | | | (7,082 | ) | | | (61 | ) | | | (9,383 | ) |
| Total depreciation and impairment at 31st December 2010 | | | | (2,389 | ) | | | (7,397 | ) | | | (64 | ) | | | (9,850 | ) |
| | | | | | | | | | | | | | | | | |
| | | |
| Net book value at 1st January 2008 | | 2,978 | | 2,968 | | 1,875 | | 7,821 | | |
| | | | | | | | | | |
| | | |
| Net book value at 31st December 2008 | | 3,756 | | 3,644 | | 2,278 | | 9,678 | | |
| | | | | | | | | | |
| Net book value at 1st January 2009 | | | 3,756 | | 3,644 | | 2,278 | | 9,678 | |
| | | | | | | | | | |
Net book value at 31st December 2009 | | 3,762 | | 3,433 | | 2,179 | | 9,374 | | | 3,762 | | 3,433 | | 2,179 | | 9,374 | |
| | | | | | | | | | | | | | | | | |
Net book value at 31st December 2010 | | | 3,729 | | 3,144 | | 2,172 | | 9,045 | |
| | | | | | | | | | |
The net book value at 31st December 20092010 of the Group’s land and buildings comprises freehold properties £3,462£3,427 million (2008(2009 – £3,510£3,462 million), properties with leases of 50 years or more £239£238 million (2008(2009 – £185£239 million) and properties with leases of less than 50 years £61£64 million (2008(2009 – £61 million).
Included in land and buildings at 31st December 20092010 are leased assets with a cost of £561£582 million (2008(2009 – £519£561 million), accumulated depreciation of £261£280 million (2008(2009 – £263£261 million), impairment of £nil (2008(2009 – £8 million)£nil) and a net book value of £300£302 million (2008(2009 – £248£300 million). Included in plant, equipment and vehicles at 31st December 20092010 are leased assets with a cost of £126£95 million (2008(2009 – £77£126 million), accumulated depreciation of £44£54 million (2008(2009 – £36£44 million), and a net book value of £82£41 million (2008(2009 – £41£82 million). Some lease agreements include renewal or purchase options or escalation clauses.
The impairment losses principally arise from decisions to rationalise facilities and are calculated based on either fair value less costs to sell or value in use. The value in use calculations determine the net present value of the projected risk-adjusted, post-tax cash flows of the relevant asset or cash generating unit, applying a discount rate of the Group post-tax weighted average cost of capital (WACC) of 8%, adjusted where appropriate for countryrelevant specific risks. Where an impairment is indicated and a pre-tax cash flow calculation is expected to give a materially different result, the test would be reperformed using pre-tax cash flows and a pre-tax discount rate. The Group WACC is equivalent to a pre-tax discount rate of approximately 11%. The impairment losses have been charged to cost of sales (£95£142 million (2009 – £95 million), R&D (£47£46 million (2009 – £47 million) and SG&A (£18£17 million (2009 – £18 million), and include £57 million (2008(2009 – £197£57 million) arising from the major restructuring programmes.
Reversals of impairment arise from subsequent reviews of the impaired assets where the conditions which gave rise to the original impairments are deemed no longer to apply. All of the reversals have been credited to cost of sales.
GSK Annual Report 20092010
120132
Notes to the financial statements
18Goodwill
| | | | | | | |
| | | | | | | | | | | | | |
| | | 2009 | | 2008 | | | 2010 | | 2009 | |
| | | £m | | £m | | | £m | | £m | |
| | | | | | | | | |
| Cost at 1st January | | 2,101 | | 1,370 | | | 3,361 | | 2,101 | |
| Exchange adjustments | | | (116 | ) | | 437 | | | 95 | | | (116 | ) |
| Additions through business combinations | | 1,376 | | 294 | | | 160 | | 1,376 | |
| Impairment losses | | | | (10 | ) | | – | |
| | | | | | | | | |
| Cost at 31st December | | 3,361 | | 2,101 | | | 3,606 | | 3,361 | |
| | | | | | | | | |
| | | |
| Net book value at 1st January | | 2,101 | | 1,370 | | | 3,361 | | 2,101 | |
| | | | | | | | | |
| | | |
Net book value at 31st December | | 3,361 | | 2,101 | | | 3,606 | | 3,361 | |
| | | | | | | | | |
The impairment losses in the year arose from the decision to exit the Pliva Research Institute site in Zagreb, Croatia. This loss is reported in the consolidated income statement under the major restructuring programme within selling, general and administration.
The additions in the year, translated at acquisition exchange rates, arisearose primarily on the acquisition of the following businesses:
| | | | | | | | |
| | | | | | £m | |
| | | | | |
Stiefel Laboratories Inc. | | | | | | | 885 | |
Pfizer HIV business | | | | | | | 255 | |
UCB S.A. | | | | | | | 87 | |
NovaMin Technology Inc. | | | | | | | 53 | |
AZ Tika | | | | | | | 50 | |
Laboratoire Pharmaceutique Algérien | | | | | | | 35 | |
Others | | | | | | | 11 | |
| | | | | |
| | | | | | | 1,376 | |
| | | | | |
Laboratorios Phoenix S.A.I.C.yF. See Note 38, ‘Acquisitions and disposals’ for further details.
The carrying value of goodwill, translated at year-end exchange rates, is made up of balances arising on acquisition of the following businesses:
| | | | | | | | | | | | | | |
| | | | | | | | | | | | | | | | | | | |
| | | 2009 | | 2008 | | | 2010 | | 2009 | |
| | | Cash generating unit | | £m | | £m | | | Cash generating unit | | £m | | £m | |
| | | | | | | | | | | | | |
| Stiefel Laboratories, Inc. | | Stiefel Laboratories Inc. | | 901 | | – | | | US, Europe, Emerging Markets, Asia Pacific, Other pharmaceuticals | | 894 | | 901 | |
| ID Biomedical Corporation | | | US, Europe, Emerging Markets, Asia Pacific, Japan, Other pharmaceuticals | | 464 | | 426 | |
| Reliant Pharmaceuticals, Inc. | | US pharmaceuticals | | 434 | | 485 | | | US pharmaceuticals | | 448 | | 434 | |
| ID Biomedical Corporation | | Five pharmaceutical segments | | 426 | | 404 | | |
| Sirtris Pharmaceuticals, Inc. | | Five pharmaceutical segments | | 294 | | 329 | | | US, Europe, Emerging Markets, Asia Pacific, Japan, Other pharmaceuticals | | 304 | | 294 | |
| Pfizer HIV business | | ViiV Healthcare group | | 255 | | – | | | ViiV Healthcare | | 255 | | 255 | |
| GlaxoSmithKline K.K. | | Japan pharmaceuticals | | 208 | | 238 | | | Japan pharmaceuticals | | 246 | | 208 | |
| Domantis Limited | | Five pharmaceutical segments | | 181 | | 181 | | | US, Europe, Emerging Markets, Asia Pacific, Japan, Other pharmaceuticals | | 181 | | 181 | |
| CNS, Inc. | | Consumer Healthcare | | 137 | | 153 | | | Consumer Healthcare | | 142 | | 137 | |
| Polfa Poznan S.A. | | Poland pharmaceuticals | | 118 | | 128 | | | Europe pharmaceuticals | | 118 | | 118 | |
| Certain businesses from UCB S.A. | | Emerging Markets and Asia Pacific/Japan pharmaceuticals | | 87 | | – | | | Emerging Markets and Asia Pacific pharmaceuticals | | 89 | | 87 | |
| Laboratorios Phoenix S.A.I.C.yF. | | | Emerging Markets pharmaceuticals | | 66 | | – | |
| NovaMin Technology Inc. | | Consumer Healthcare | | 50 | | – | | | Consumer Healthcare | | 52 | | 50 | |
| Others | | 270 | | 183 | | | | | | | 347 | | 270 | |
| | | | | | | | | | | | | |
| | | 3,361 | | 2,101 | | | | | | | 3,606 | | 3,361 | |
| | | | | | | | | | | | | |
GSK Annual Report 20092010
121133
Notes to the financial statements
18 Goodwillcontinued
Goodwill is allocated to cash generating units which are tested for impairment at least annually. With effect from 1st January 2010, GSK revised its segmental disclosures to reflect changes in the internal reporting structure. ViiV Healthcare is now shown as a separate segment and the Stiefel business has been integrated with the GSK legacy dermatology business. Following these changes, the implementationgoodwill arising on the acquisition of IFRS 8 ‘Operating segments’ in 2009Stiefel has been allocated to the cash generating units to which someUS, Europe, Emerging Markets, Asia Pacific and Other pharmaceuticals CGUs for impairment testing purposes as the benefits of the goodwill balancesacquired business are allocated have changed. expected to arise from these businesses.
The goodwill arising on the acquisitions of ID Biomedical, Sirtris Pharmaceuticals and Domantis has been split between the five pharmaceutical segments (USA,US, Europe, Emerging Markets, Asia Pacific/Pacific, Japan and Other)Other pharmaceutical CGUs for impairment testing purposes as either the benefit of the acquired businesses is split among the five pharmaceutical segmentsCGUs or theythe acquired businesses do not generate independent cash flows.
In 2010, the allocation of Polfa Poznan S.A. goodwill has changed from Poland pharmaceuticals to the Europe pharmaceuticals cash generating unit. This change of allocation reflects the level at which GSK internal management monitors the Polfa Poznan S.A. goodwill.
The valuation of the US pharmaceuticals cash generating unit for Reliant Pharmaceuticalsgoodwill impairment testing purposes, has been prepared on a fair value less costs to sell basis, using turnover and earnings multiples derived from observed market data. The value of goodwill inherent in the US pharmaceuticals cash generating unit is considerably in excess of the book value of the acquired goodwill.
The recoverable amounts of the other cash generating units are assessed using either a value in use or a fair value less costs to sell model. Value in use is calculated as the net present value of the projected risk-adjusted post-tax cash flows plus a terminal value of the cash generating unit to which the goodwill is allocated. Initially a post-tax discount rate is applied to calculate the net present value of the post-tax cash flows. The post-tax discount rate used is based on the Group WACC of 8%, as most cash generating units have integrated operations across large parts of the Group. The Group WACC is equivalent to a pre-tax discount rate of approximately 11%. The discount rate is increased where specific country risks are sufficiently significant to have a material impact on the outcome of the impairment test. Where the impairment test indicates that the recoverable value of the unit is close to or below its carrying value, the test is reperformed using a pre-tax discount rate and pre-tax cash flows in order to determine if an impairment exists and to establish its magnitude.
Fair value is calculated using a similar discounted cash flow approach based on the Group’s acquisition valuation model. A post-tax discount rate is applied to the projected risk-adjusted post-tax cash flows and terminal value.
Details relating to the discounted cash flow models used in the impairment tests of the other significant goodwill balances are as follows:
| | | | | | | | |
| | | | | |
| | | | | | | | | Europe, Emerging Markets, Asia Pacific, | | |
| | | Stiefel Laboratories CGU | | ViiV Healthcare CGU | | Five pharmaceutical segments CGUs | | Other pharmaceuticals CGUs | | ViiV Healthcare CGU |
| | | | | | | | | | |
| Valuation basis | | Fair value less costs to sell | | Fair value less costs to sell | | Value in use | | Value in use | | Fair value less costs to sell |
| | | | | | | | | | |
| Key assumptions | | Sales growth rates | | Sales growth rates | | Sales growth rates | | Sales growth rates
Profit margins
Discount rate | | Sales growth rates
Profit margins
Discount rate |
| | | Profit margins | | Profit margins | | Profit margins | |
| | | Achievement of synergy targets | | Discount rate | | Discount rate | |
| | | Discount rate | | | | | |
| | | | | | | | | | |
| Determination of assumptions | | Growth rates are internal forecasts based on both internal and external market information. Margins reflect past experience, adjusted for expected changes. Post-acquisition synergy targets reflect management expectations of cost savings that can be achieved.
Discount rate based on Group WACC. | | Growth rates are internal forecasts based on both internal and external market information. Margins reflect past experience, adjusted for expected changes. Discount rate based on Group WACC. | | Growth rates are internal forecasts based on both internal and external market information. Margins reflect past experience, adjusted for expected changes. Discount rate based on Group WACC. | | Growth rates are internal forecasts based on both internal and external market information.
Margins reflect past experience, adjusted for expected changes.
Discount rate based on Group WACC. | | Growth rates are internal forecasts based on both internal and external market information. Margins reflect past experience, adjusted for expected changes. Discount rate based on Group WACC. |
| | | | | | | | | | |
Period of specific
projected cash flows | | 10 years | | 20 years | | 5 years | | 5 years | | | | 5 years |
| | | | | | | | | | |
| Discount rate | | 8% | | 8% | | 8% | | 8% | | | | 8% |
| | | | | | | | | | |
| Terminal growth rate | | 2% p.a. | | 2% p.a. | | 2% p.a. | | Europe | | 6% p.a. decline | | 2.5% p.a. |
| | | | | | | | | Emerging markets | | 1% p.a. | | |
| | | | Asia Pacific | | 0% p.a. | | |
| | | | Other | | 0% p.a. | | |
| | | | | |
GSK Annual Report 20092010
122134
Notes to the financial statements
18 Goodwillcontinued
| | | | | | | | | | | |
| | | Japan Pharmaceuticals CGU | | Consumer Healthcare CGU | | Poland Pharmaceuticals CGU | | | |
| | | for GlaxoSmithKline KK | | for CNS | | for Polfa Poznan | | Japan pharmaceuticals CGU | | Consumer Healthcare CGU |
| | | | | | | | | | |
| Valuation basis | | Fair value less costs to sell | | Fair value less costs to sell | | Value in use | | Fair value less costs to sell | | Fair value less costs to sell |
| | | | | | | | | | |
| Key assumptions | | Sales growth rates
Profit margins
Discount rate | | Sales growth rates
Advertising and promotion investment
Terminal growth rate
Discount rate | | Sales growth rates
Profit margins
Discount rate | | Sales growth rates
Profit margins
Discount rate | | Sales growth rates
Advertising and promotion investment
Terminal growth rate
Discount rate |
| | | | | | | | | | |
| Determination of assumptions | | Growth rates are internal forecasts based on both internal and external market information. Margins reflect past experience, adjusted for expected changes. Discount rate based on Group WACC. | | Growth rates are internal forecasts based on both internal and external market information. Advertising and promotion investment based on historical levels adjusted for management’s view of support needed for innovation and expansion. Terminal growth rate based on management’s estimate of future long-term average growth rates. Discount rate based on Group WACC. | | Growth rates are internal forecasts based on both internal and external market information. Margins reflect past experience, adjusted for expected changes. Discount rate based on Group WACC, adjusted for country- specific risks. | | Growth rates are internal forecasts based on both internal and external market information.
Margins reflect past experience, adjusted for expected changes.
Discount rate based on Group WACC. | | Growth rates are internal forecasts based on both internal and external market information.
Advertising and promotion investment based on historical levels adjusted for management’s view of support needed for innovation and expansion.
Terminal growth rate based on management’s estimate of future long-term average growth rates.
Discount rate based on Group WACC. |
| | | | | | | | | | |
Period of specific
projected cash flows | | 5 years | | 4 years | | 5 years | | 5 years | | 5 years |
| | | | | | | | | | |
| Discount rate | | 8% | | 8% | | 9.75% | | 8% | | 8% |
| | | | | | | | | | |
| Terminal growth rate | | 2% p.a. | | 3% p.a. | | 13% p.a. decline. | | 2% p.a. | | 3% p.a. |
| | | | | | | | | | |
The terminal growth rates do not exceed the long-term projected growth rates for the relevant markets. The terminal growth raterates used in the value in use calculationcalculations for the Poland Pharmaceuticalspharmaceuticals cash generating unit reflectsunits reflect the impact of future generic competition and takestake no account of new product launches.
The Consumer Healthcare cash generating unit comprises a collection of smaller cash generating units including brands with indefinite lives with a carrying value of £1,796 million (2008£1.83 billion (2009 – £1,794 million)£1.79 billion).
The Stiefel Laboratoriespharmaceutical cash generating unitunits also comprisescomprise a collection of smaller cash generating units including assets with indefinite lives with a carrying value of £708 million (2009 – £660 million.million). Details of indefinite life brands are given in Note 19 ‘Other intangible assets’.
In each case the valuations indicate sufficient headroom such that a reasonably possible change to key assumptions is unlikely to result in an impairment of the related goodwill.
GSK Annual Report 20092010
123135
Notes to the financial statements
19Other intangible assets
| | | | | | | | | | | | | | | | | | | | | | | | | | | | | | | | | | | | | | | | | |
| | | Computer | | Licences, | | Amortised | | Indefinite life | | | | | | | | | | | | | |
| | | software | | patents, etc. | | brands | | brands | | Total | | | Computer | | Licences, | | Amortised | | Indefinite life | | | |
| | | £m | | £m | | £m | | £m | | £m | | | software | | patents, etc. | | brands | | brands | | Total | |
| | | | | | | | | | | | | £m | | £m | | £m | | £m | | £m | |
| Cost at 1st January 2008 | | 801 | | 3,393 | | 266 | | 1,353 | | 5,813 | | |
| Exchange adjustments | | 110 | | 738 | | 65 | | 371 | | 1,284 | | |
| Capitalised internal development costs | | 27 | | – | | – | | – | | 27 | | |
| Additions through business combinations | | – | | 171 | | – | | – | | 171 | | |
| Other additions | | 58 | | 492 | | – | | 99 | | 649 | | |
| Disposals and asset write-offs | | | (2 | ) | | – | | – | | – | | | (2 | ) | |
| Transfer to assets held for sale | | 9 | | – | | – | | – | | 9 | | |
| | | | | | | | | | | | | | | | | | | | | |
| Cost at 31st December 2008 | | 1,003 | | 4,794 | | 331 | | 1,823 | | 7,951 | | |
| Cost at 1st January 2009 | | | 1,003 | | 4,794 | | 331 | | 1,823 | | 7,951 | |
| Exchange adjustments | | | (36 | ) | | | (193 | ) | | | (23 | ) | | | (99 | ) | | | (351 | ) | | | (36 | ) | | | (193 | ) | | | (23 | ) | | | (99 | ) | | | (351 | ) |
| Capitalised internal development costs | | 13 | | – | | – | | – | | 13 | | | 13 | | – | | – | | – | | 13 | |
| Additions through business combinations | | 30 | | 1,883 | | 51 | | 758 | | 2,722 | | | 30 | | 1,883 | | 51 | | 758 | | 2,722 | |
| Other additions | | 41 | | 391 | | – | | – | | 432 | | | 41 | | 391 | | – | | – | | 432 | |
| Disposals and asset write-offs | | | (17 | ) | | | (26 | ) | | – | | – | | | (43 | ) | | | (17 | ) | | | (26 | ) | | – | | – | | | (43 | ) |
| Reclassifications | | | (4 | ) | | – | | – | | – | | | (4 | ) | | | (4 | ) | | – | | – | | – | | | (4 | ) |
| | | | | | | | | | | | | | | | | | | | | |
| Cost at 31st December 2009 | | 1,030 | | 6,849 | | 359 | | 2,482 | | 10,720 | | | 1,030 | | 6,849 | | 359 | | 2,482 | | 10,720 | |
| Exchange adjustments | | | 14 | | 150 | | 7 | | 55 | | 226 | |
| Capitalised internal development costs | | | 81 | | – | | – | | – | | 81 | |
| Additions through business combinations | | | – | | 214 | | 11 | | 27 | | 252 | |
| Capitalised borrowing costs | | | – | | 2 | | – | | – | | 2 | |
| Other additions | | | 58 | | 469 | | – | | – | | 527 | |
| Disposals and asset write-offs | | | | (25 | ) | | | (13 | ) | | – | | – | | | (38 | ) |
| Reclassifications | | | 16 | | – | | – | | – | | 16 | |
| | | | | | | | | | | | | | | | | | | | | |
| Amortisation at 1st January 2008 | | | (530 | ) | | | (622 | ) | | | (10 | ) | | – | | | (1,162 | ) | |
| Cost at 31st December 2010 | | | 1,174 | | 7,671 | | 377 | | 2,564 | | 11,786 | |
| | | | | | | | | | | | |
| Amortisation at 1st January 2009 | | | | (698 | ) | | | (995 | ) | | | (24 | ) | | – | | | (1,717 | ) |
| Exchange adjustments | | | (75 | ) | | | (168 | ) | | | (3 | ) | | – | | | (246 | ) | | 27 | | 58 | | – | | – | | 85 | |
| Provision for the year | | | (96 | ) | | | (204 | ) | | | (11 | ) | | – | | | (311 | ) | |
| Disposals and asset write-offs | | 3 | | | (1 | ) | | – | | – | | 2 | | |
| | | | | | | | | | | | |
| Amortisation at 31st December 2008 | | | (698 | ) | | | (995 | ) | | | (24 | ) | | – | | | (1,717 | ) | |
| Exchange adjustments | | 27 | | 58 | | – | | – | | 85 | | |
| Provision for the year | | | (113 | ) | | | (306 | ) | | | (13 | ) | | – | | | (432 | ) | |
| Charge for the year | | | | (113 | ) | | | (306 | ) | | | (13 | ) | | – | | | (432 | ) |
| Disposals and asset write-offs | | 16 | | 1 | | – | | – | | 17 | | | 16 | | 1 | | – | | – | | 17 | |
| | | | | | | | | | | | | | | | | | | | | |
| Amortisation at 31st December 2009 | | | (768 | ) | | | (1,242 | ) | | | (37 | ) | | – | | | (2,047 | ) | | | (768 | ) | | | (1,242 | ) | | | (37 | ) | | – | | | (2,047 | ) |
| Exchange adjustments | | | | (8 | ) | | | (37 | ) | | – | | – | | | (45 | ) |
| Charge for the year | | | | (106 | ) | | | (411 | ) | | | (16 | ) | | – | | | (533 | ) |
| Disposals and asset write-offs | | | 20 | | 1 | | – | | – | | 21 | |
| | | | | | | | | | | | | | | | | | | | | |
| Impairment at 1st January 2008 | | | (24 | ) | | | (150 | ) | | – | | | (21 | ) | | | (195 | ) | |
| Exchange adjustments | | | (1 | ) | | | (46 | ) | | – | | | (8 | ) | | | (55 | ) | |
| Impairment losses | | | (7 | ) | | | (118 | ) | | – | | – | | | (125 | ) | |
| Reversal of impairments | | – | | 10 | | – | | – | | 10 | | |
| Amortisation at 31st December 2010 | | | | (862 | ) | | | (1,689 | ) | | | (53 | ) | | – | | | (2,604 | ) |
| | | | | | | | | | | | | | | | | | | | | |
| Impairment at 31st December 2008 | | | (32 | ) | | | (304 | ) | | – | | | (29 | ) | | | (365 | ) | |
| Impairment at 1st January 2009 | | | | (32 | ) | | | (304 | ) | | – | | | (29 | ) | | | (365 | ) |
| Exchange adjustments | | 1 | | 19 | | – | | 3 | | 23 | | | 1 | | 19 | | – | | 3 | | 23 | |
| Impairment losses | | | (4 | ) | | | (168 | ) | | – | | – | | | (172 | ) | | | (4 | ) | | | (168 | ) | | – | | – | | | (172 | ) |
| Disposals and asset write-offs | | 2 | | 22 | | – | | – | | 24 | | | 2 | | 22 | | – | | – | | 24 | |
| | | | | | | | | | | | | | | | | | | | | |
| Impairment at 31st December 2009 | | | (33 | ) | | | (431 | ) | | – | | | (26 | ) | | | (490 | ) | | | (33 | ) | | | (431 | ) | | – | | | (26 | ) | | | (490 | ) |
| Exchange adjustments | | | | (1 | ) | | | (13 | ) | | – | | | (1 | ) | | | (15 | ) |
| Impairment losses | | | | (5 | ) | | | (143 | ) | | | (2 | ) | | – | | | (150 | ) |
| Disposals and asset write-offs | | | 3 | | – | | 2 | | – | | 5 | |
| | | | | | | | | | | | |
| Impairment at 31st December 2010 | | | | (36 | ) | | | (587 | ) | | – | | | (27 | ) | | | (650 | ) |
| | | | | | | | | | | | | | | | | | | | | |
| | | |
| Total amortisation and impairment at 31st December 2008 | | | (730 | ) | | | (1,299 | ) | | | (24 | ) | | | (29 | ) | | | (2,082 | ) | |
| Total amortisation and impairment at 31st December 2009 | | | (801 | ) | | | (1,673 | ) | | | (37 | ) | | | (26 | ) | | | (2,537 | ) | | | (801 | ) | | | (1,673 | ) | | | (37 | ) | | | (26 | ) | | | (2,537 | ) |
| | | | | | | | | | | | |
| Net book value at 1st January 2008 | | 247 | | 2,621 | | 256 | | 1,332 | | 4,456 | | |
| Total amortisation and impairment at 31st December 2010 | | | | (898 | ) | | | (2,276 | ) | | | (53 | ) | | | (27 | ) | | | (3,254 | ) |
| | | | | | | | | | | | | | | | | | | | | |
| | | |
| Net book value at 31st December 2008 | | 273 | | 3,495 | | 307 | | 1,794 | | 5,869 | | |
| Net book value at 1st January 2009 | | | 273 | | 3,495 | | 307 | | 1,794 | | 5,869 | |
| | | | | | | | | | | | | | | | | | | | | |
| | | |
Net book value at 31st December 2009 | | 229 | | 5,176 | | 322 | | 2,456 | | 8,183 | | | 229 | | 5,176 | | 322 | | 2,456 | | 8,183 | |
| | | | | | | | | | | | | | | | | | | | | |
| | | |
Net book value at 31st December 2010 | | | 276 | | 5,395 | | 324 | | 2,537 | | 8,532 | |
| | | | | | | | | | | | |
GSK Annual Report 20092010
124136
Notes to the financial statements
19Other intangible assetscontinued
Amortisation and impairment losses, net of reversals, have been charged in the income statement as follows:
| | | | | | | | | | | | | | | | | | |
| | | | | | | | | | | | | | | | | | | | | | |
| | | Amortisation | | Net impairment losses | | | Amortisation | | Net impairment losses | |
| | | 2009 | | 2008 | | 2009 | | 2008 | | | 2010 | | 2009 | | 2010 | | 2009 | |
| | | £m | | £m | | £m | | £m | | | £m | | £m | | £m | | £m | |
| | | | | | | | | | | | | | | | | |
| Cost of sales | | 29 | | 34 | | 1 | | – | | | 26 | | 29 | | – | | 1 | |
| Selling, general and administration | | 270 | | 181 | | 1 | | 25 | | | 353 | | 270 | | 13 | | 1 | |
| Research and development | | 133 | | 96 | | 170 | | 90 | | | 154 | | 133 | | 137 | | 170 | |
| | | | | | | | | | | | | | | | | |
| | | 432 | | 311 | | 172 | | 115 | | | 533 | | 432 | | 150 | | 172 | |
| | | | | | | | | | | | | | | | | |
Included in the impairments above is £8 million arising from the major restructuring programmes.
The net book value of computer software includes £80£129 million (2008(2009 – £125£80 million) of internally generated costs.
Licences, patents, etc. includes a large number of acquired licences, patents, know-how agreements and marketing rights, which are either marketed or in use, or still in development. The net book value includes £6£5 million (2008(2009 – £7£6 million) of internally generated costs. Impairment losses of £168£143 million (2008(2009 – £118£168 million) principally arise on assets in development that are no longer being actively pursued. Note 38, ‘Acquisitions and disposals’ gives details of additions through business combinations in the year. The book values of the largest individual items are as follows:
| | | | | | | | | | |
| | | | | | | | | | | | | |
| | | 2009 | | 2008 | | | 2010 | | 2009 | |
| | | £m | | £m | | | £m | | £m | |
| | | | | | | | | |
Fluviral | | 648 | | 654 | | | 663 | | 648 | |
Lovaza | | 637 | | 781 | | | 593 | | 637 | |
Selzentry | | 337 | | – | | | 299 | | 337 | |
Arzerra | | 191 | | 156 | | | 294 | | 191 | |
Duac | | 165 | | – | | | 157 | | 165 | |
Fraxiparine | | 158 | | 180 | | | 135 | | 158 | |
| Others | | 3,040 | | 1,724 | | | 3,254 | | 3,040 | |
| | | | | | | | | |
| | | 5,176 | | 3,495 | | | 5,395 | | 5,176 | |
| | | | | | | | | |
Amortised brands include OTC rights relating toalli,, with a book value at 31st December 20092010 of £260£252 million (2008(2009 – £294£260 million).
Indefinite life brands comprise a portfolio of Consumer Healthcare products primarily acquired with the acquisitions of Sterling Winthrop, Inc. in 1994, Block Drug Company, Inc. in 2001 and CNS, Inc. in 2006, together with a number of pharmaceutical brands from the acquisition of Stiefel Laboratories, Inc. in 2009. The book values of the major brands are as follows:
| | | | | | | | | | |
| | | | | | | | | | | | | |
| | | 2009 | | 2008 | | | 2010 | | 2009 | |
| | | £m | | £m | | | £m | | £m | |
| | | | | | | | | |
Panadol | | 399 | | 411 | | | 426 | | 399 | |
Sensodyne | | 271 | | 289 | | | 270 | | 271 | |
| Stiefel trade name | | 209 | | – | | | 216 | | 209 | |
Breathe Right | | 193 | | 216 | | | 199 | | 193 | |
Physiogel | | 176 | | – | | | 182 | | 176 | |
Polident | | 115 | | 123 | | | 114 | | 115 | |
Corega | | 102 | | 109 | | | 102 | | 102 | |
Biotene | | 108 | | 99 | | | 111 | | 108 | |
Poligrip | | 71 | | 75 | | | 70 | | 71 | |
Solpadeine | | 59 | | 60 | | | 59 | | 59 | |
| Others | | 753 | | 412 | | | 788 | | 753 | |
| | | | | | | | | |
| | | 2,456 | | 1,794 | | | 2,537 | | 2,456 | |
| | | | | | | | | |
Each of these brands is considered to have an indefinite life, given the strength and durability of the brand and the level of marketing support. The brands are in relatively similar stable and profitable market sectors, with similar risk profiles, and their size, diversification and market shares mean that the risk of market-related factors causing a reduction in the lives of the brands is considered to be relatively low. The Group is not aware of any material legal, regulatory, contractual, competitive, economic or other factor which could limit their useful lives. Accordingly, they are not amortised.
Each brand is tested annually for impairment applying a fair value less costs to sell methodology, generally using four year post-tax cash flow forecasts with a terminal value calculation and a discount rate equal to the Group post-tax WACC of 8%, adjusted where appropriate for country-specific risks. The main assumptions include future sales price and volume growth, product contribution and the future expenditure required to maintain the product’s marketability and registration in the relevant jurisdictions. These assumptions are based on past experience and are reviewed as part of management’s budgeting and strategic planning cycle for changes in market conditions and sales erosion through competition. The terminal growth rates applied of between 2% and 3% are management’s estimates of future long-term average growth rates of the relevant markets. In each case the valuations indicate sufficient headroom such that a reasonably possible change to key assumptions is unlikely to result in an impairment of these brands.
GSK Annual Report 20092010
125137
Notes to the financial statements
20 Investments in associates and joint ventures
| | | | | | | | | | | | | | | | | | | | | | | | | | |
| | | | | | | | | | | | | | | | | | | | | | | | | | | | | | | | | | | | | |
| | | Joint | | Associated | | 2009 | | Joint | | Associated | | 2008 | | | Joint | | Associated | | 2010 | | Joint | | Associated | | 2009 | |
| | | ventures | | undertakings | | Total | | ventures | | undertakings | | Total | | | ventures | | undertakings | | Total | | ventures | | undertakings | | Total | |
| | | £m | | £m | | £m | | £m | | £m | | £m | | | £m | | £m | | £m | | £m | | £m | | £m | |
| | | | | | | | | | | | | | | | | | | | | | | | | |
| At 1st January | | 28 | | 524 | | 552 | | 15 | | 314 | | 329 | | | 46 | | 849 | | 895 | | 28 | | 524 | | 552 | |
| Exchange adjustments | | | (3 | ) | | | (44 | ) | | | (47 | ) | | 6 | | 131 | | 137 | | | 4 | | 8 | | 12 | | | (3 | ) | | | (44 | ) | | | (47 | ) |
| Additions | | 36 | | 312 | | 348 | | 6 | | 3 | | 9 | | | 30 | | 35 | | 65 | | 36 | | 312 | | 348 | |
| Disposals | | – | | | (69 | ) | | | (69 | ) | | – | | – | | – | | | – | | | (2 | ) | | | (2 | ) | | – | | | (69 | ) | | | (69 | ) |
| Transfer from other investments | | – | | 56 | | 56 | | – | | 39 | | 39 | | | – | | 40 | | 40 | | – | | 56 | | 56 | |
| Fair value adjustment | | – | | 8 | | 8 | | – | | 3 | | 3 | | |
| Retained (loss)/profit for the year | | | (15 | ) | | 62 | | 47 | | 1 | | 34 | | 35 | | |
| Distributions received | | | | (3 | ) | | | (18 | ) | | | (21 | ) | | | (7 | ) | | | (10 | ) | | | (17 | ) |
| Other movements | | | – | | 11 | | 11 | | – | | 8 | | 8 | |
| (Loss)/profit after tax recognised in the consolidated income statement | | | | (23 | ) | | 104 | | 81 | | | (8 | ) | | 72 | | 64 | |
| | | | | | | | | | | | | | | | | | | | | | | | | |
| At 31st December | | 46 | | 849 | | 895 | | 28 | | 524 | | 552 | | | 54 | | 1,027 | | 1,081 | | 46 | | 849 | | 895 | |
| | | | | | | | | | | | | | | | | | | | | | | | | |
The Group held two significant associated undertakings at 31st December 2009.2010.
Quest Diagnostics Inc., a US clinical laboratory business listed on the New York Stock Exchange. The investment had a book value at 31st December 20092010 of £410£494 million (2008(2009 – £463£410 million) and a market value of £1,153£1,064 million (2008(2009 – £1,316£1,153 million). At 31st December 2009,2010, the Group owned 16.8%18.1% of Quest (2008(2009 – 18.7%16.8%). During the year, the Group sold 5.7 million shares in Quest, realising a profit of £115 million. Although the Group holdsheld less than 20% of the ownership interest and voting control in Quest, the Group hashad the ability to exercise significant influence through both its significant shareholding and its nominated director’s active participation on the Quest Board of Directors and Board sub-committees.
In November 2009,Subsequent to the year-end GSK increasedsold its entire shareholding in Aspen Pharmacare Holdings LimitedQuest Diagnostics Inc. The sale comprised a secondary public offering and an accompanying repurchase of shares by acquiring 68.5 million shares in consideration for the transferQuest Diagnostics which together are expected to generate gross proceeds of certain assets. GSK’s shareholding in Aspen on$1.1 billion (£0.7 billion) after tax.
At 31st December 2009 was2010, the Group owned 81.7 million shares or 19%. of Aspen Pharmacare Holdings Limited. Aspen, listed on the Johannesburg Stock Exchange, is Africa’s largest pharmaceutical manufacturer and a major supplier of branded and generic pharmaceutical, healthcare and nutritional products to the southern African and selected international markets. After elimination of unrealised gains, theThe investment had a book value at 31st December 20092010 of £397 million (2009 – £372 million, including estimated goodwill of £259 million. Themillion) and a market value of the shares held by GSK at 31st December 2009 was£729 million (2009 – £505 million.million). Although the Group holds less than 20% of the ownership interest and voting control of Aspen, the Group has the ability to exercise significant influence through both its shareholding and its nominated director’s active participation on the Aspen Board of Directors.
The transfer from other investments in 20092010 relates to the Group’s holding in Aspen,JCR Pharmaceuticals Ltd, previously classified within Other investments.
In August 2009, GSK invested £20 million to establish a 40% interest in Shenzhen GlaxoSmithKline – Neptunus Biologicals Co., Ltd, a new joint venture primarily operating in the fields of research, development and manufacture of flu vaccines.
During 2009, GSK made additional capital contributions totalling £16 million to Shionogi-GlaxoSmithKline Holdings, L.P.
Summarised balance sheet information in respect of the Group’s associates is set out below:
| | | | | | | | | | |
| | | | | | | | | | | | | | |
| | | 2009 | | 2008 | | | 2010 | | 2009 | |
| | | £m | | £m | | | £m | | £m | |
| | | | | | | | | | |
| Total assets: | | |
| Quest Diagnostics Inc. | | 5,319 | | 5,836 | | | 5,466 | | 5,319 | |
| Aspen Pharmacare Holdings Limited | | 1,318 | | – | | | 1,913 | | 1,318 | |
| Others | | 121 | | 115 | | | 360 | | 121 | |
| | | | | | |
| | | 6,758 | | 5,951 | | | | | | |
| | | | | | | 7,739 | | 6,758 | |
| | | | | | | |
| Total liabilities: | | |
| Quest Diagnostics Inc. | | | (2,828 | ) | | | (3,333 | ) | | | (2,868 | ) | | | (2,828 | ) |
| Aspen Pharmacare Holdings Limited | | | (689 | ) | | – | | | | (786 | ) | | | (689 | ) |
| Others | | | (19 | ) | | | (20 | ) | | | (73 | ) | | | (19 | ) |
| | | | | | | | | | |
| | | | (3,536 | ) | | | (3,353 | ) | | | (3,727 | ) | | | (3,536 | ) |
| | | | | | | | | | |
| | |
| Net assets | | 3,222 | | 2,598 | | | 4,012 | | 3,222 | |
| | | | | | | | | | |
The summarised balance sheet information in respect of Aspen Pharmacare Holdings Limited is based on preliminary results information and analysts forecasts available at 31st December 2009.2010.
Investments in joint ventures comprise £57£66 million share of gross assets (2008(2009 – £36£57 million) and £11£12 million share of gross liabilities (2008(2009 – £8£11 million). These principally arise from 50% interests in two joint ventures, Shionogi-GlaxoSmithKlineShionogi-ViiV Healthcare Holdings, L.P., which is developing specified chemical compounds, and GlaxoSmithKlineViiV Healthcare Shire Canada, which primarily co-marketsCombivir,,TrizivirandEpivirin certain territories, both of which are now part of the ViiV Healthcare business. Investments in joint ventures also include a 28% interest in Pharmaceutical Insurance Limited, which is a mutual insurance company covering pharmaceutical business risk, and a 40%49% interest in GlaxoSmithKline – NeptunusBio, which is a flu vaccine research, development and manufacturing venture.
During 2010, GSK made additional capital contributions of £6 million to Shenzhen GlaxoSmithKline – NeptunusBio Co., Ltd and £24 million to Shionogi-ViiV Healthcare Holdings, L.P.
GSK Annual Report 20092010
126138
Notes to the financial statements
21Other investments
| | | | | | | | | | |
| | | | | | | | | | | | | |
| | | 2009 | | 2008 | | | 2010 | | 2009 | |
| | | £m | | £m | | | £m | | £m | |
| | | | | | | | | |
| At 1st January | | 478 | | 517 | | | 454 | | 478 | |
| Exchange adjustments | | | (48 | ) | | 129 | | | 7 | | | (48 | ) |
| Additions | | 175 | | 87 | | | 281 | | 175 | |
| Net fair value movements | | 57 | | | (94 | ) | | 96 | | 57 | |
| Impairment losses | | | (95 | ) | | | (65 | ) | | | (60 | ) | | | (95 | ) |
| Transfer to investments in associates and joint ventures | | | (56 | ) | | | (39 | ) | | | (40 | ) | | | (56 | ) |
| Disposals | | | (57 | ) | | | (57 | ) | | | (27 | ) | | | (57 | ) |
| | | | | | | | | |
| At 31st December | | 454 | | 478 | | | 711 | | 454 | |
| | | | | | | | | |
Other investments comprise non-current equity investments which are available-for-sale investments recorded at fair value at each balance sheet date. For investments traded in an active market, the fair value is determined by reference to the relevant stock exchange quoted bid price. For other investments, the fair value is estimated by management with reference to relevant available information, including the current market value of similar instruments or by reference to theand discounted cash flows of the underlying net assets. The Group holds a number of equity investments in entities where the Group has entered into research collaborations. Other investments include listed investments of £491 million (2009 – £245 million (2008 – £319 million)., the increase primarily arising from a number of additional investments during the year.
On disposal of investments, fair value movements are reclassified from reservesequity to the income statement based on average cost for shares acquired at different times. The transfer to associates relates to the Group’s holding in JCR Pharmaceuticals, which increased during the year to 27%.
The impairment losses recorded in the tables above have been recognised in the income statement for the year within other operating income, together with amounts reclassified from the fair value reserve on recognition of the impairments. These impairments initially result from prolonged or significant declines in the fair value of the equity investments below acquisition cost, subsequent to which any further declines in fair value are immediately taken to the income statement. At 31st December 2009
Other investments include assets that have been impaired, assets with a fair value of £105 million (2008 – £118 million) are included in other investments.as follows:
The transfer to associates relates to the Group’s holding in Aspen Pharmacare Holdings Limited, which increased during the year to 19%.| | | | | | | | | |
| | | | | |
| | | 2010 | | | 2009 | |
| | | £m | | | £m | |
| | | | | |
| Original cost | | | 429 | | | | 401 | |
| Impairments recognised in profit and loss | | | (340 | ) | | | (292 | ) |
| Subsequent fair value increases | | | 45 | | | | 43 | |
| | | | | |
| Carrying value at 31st December | | | 134 | | | | 152 | |
| | | | | |
22 Other non-current assets
| | | | | | | | | | | | | | | | | |
| | | 2009 | | 2008 | | | | | |
| | | £m | | £m | | | 2010 | | 2009 | |
| | | | | | | £m | | £m | |
| Amounts recoverable under insurance contracts | | 299 | | 293 | | |
| | | | | | |
| Amounts receivable under insurance contracts | | | 343 | | 299 | |
| Pension schemes in surplus | | 23 | | 39 | | | 23 | | 23 | |
| Other receivables | | 261 | | 247 | | | 190 | | 261 | |
| | | | | | | | | |
| | | 583 | | 579 | | | 556 | | 583 | |
| | | | | | | | | |
23 Inventories
| | | | | | | | | | |
| | | | | | | | | | | | | |
| | | 2009 | | 2008 | | | 2010 | | 2009 | |
| | | £m | | £m | | | £m | | £m | |
| | | | | | | | | |
| Raw materials and consumables | | 1,153 | | 1,127 | | | 1,466 | | 1,153 | |
| Work in progress | | 1,437 | | 1,295 | | | 751 | | 1,437 | |
| Finished goods | | 1,474 | | 1,634 | | | 1,620 | | 1,474 | |
| | | | | | | | | |
| | | 4,064 | | 4,056 | | | 3,837 | | 4,064 | |
| | | | | | | | | |
GSK Annual Report 20092010
127139
Notes to the financial statements
24Trade and other receivables
| | | | | | | | | | |
| | | | | | | | | | | | | |
| | | 2009 | | 2008 | | | 2010 | | 2009 | |
| | | £m | | £m | | | £m | | £m | |
| | | | | | | | | |
| Trade receivables | | 5,486 | | 5,333 | | | 4,727 | | 5,486 | |
| Prepaid pension contributions | | 1 | | 1 | | | 2 | | 1 | |
| Other prepayments and accrued income | | 301 | | 294 | | | 256 | | 301 | |
| Interest receivable | | 20 | | 39 | | | 16 | | 20 | |
| Employee loans and advances | | 48 | | 63 | | | 50 | | 48 | |
| Other receivables | | 636 | | 535 | | | 742 | | 636 | |
| | | | | | | | | |
| | | 6,492 | | 6,265 | | | 5,793 | | 6,492 | |
| | | | | | | | | |
Trade receivables include £32£42 million (2008(2009 – £4£32 million) due from associates and joint ventures.ventures and are stated after deducting the provision for bad and doubtful debts.
| | | | | | | | | | | | | | | | | |
| Bad and doubtful debt provision | | 2009 | | 2008 | | |
| | | | |
| | | | 2010 | | 2009 | |
| Bad and doubtful debt provision | | £m | | £m | | | £m | | £m | |
| | | | | | | | |
| At 1st January | | 129 | | 98 | | | 116 | | 129 | |
| Exchange adjustments | | | (10 | ) | | 29 | | | �� | | | (10 | ) |
| Charge for the year | | 21 | | 21 | | | 54 | | 21 | |
| Subsequent recoveries of amounts provided for | | | (18 | ) | | | (15 | ) | | | (19 | ) | | | (18 | ) |
| Utilised | | | (6 | ) | | | (4 | ) | | | (1 | ) | | | (6 | ) |
| | | | | | | | | |
| At 31st December | | 116 | | 129 | | | 150 | | 116 | |
| | | | | | | | | |
25 Cash and cash equivalents
| | | | | | | | | | |
| | | | | | | | | | | | | |
| | | 2009 | | 2008 | | | 2010 | | 2009 | |
| | | £m | | £m | | | £m | | £m | |
| | | | | | | | | |
| Cash at bank and in hand | | 856 | | 652 | | | 1,027 | | 856 | |
| Short-term deposits | | 5,689 | | 4,971 | | | 5,030 | | 5,689 | |
| | | | | | | | | |
| | | 6,545 | | 5,623 | | | 6,057 | | 6,545 | |
| | | | | | | | | |
26 Assets held for sale
| | | | | | | | | | |
| | | | | | | | | | | | | |
| | | 2009 | | 2008 | | | 2010 | | 2009 | |
| | | £m | | £m | | | £m | | £m | |
| | | | | | | | | |
| Land and buildings | | 13 | | 2 | | | 6 | | 13 | |
| Plant, equipment and vehicles | | 1 | | – | | | 10 | | 1 | |
| | | | | | | | | |
| | | 14 | | 2 | | | 16 | | 14 | |
| | | | | | | | | |
GSK Annual Report 20092010
128140
Notes to the financial statements
27 Trade and other payables
| | | | | | | | | | |
| | | | | | | | | | | | | |
| | | 2009 | | 2008 | | | 2010 | | 2009 | |
| | | £m | | £m | | | £m | | £m | |
| | | | | | | | | |
| Trade payables | | 1,855 | | 1,153 | | | 2,141 | | 1,855 | |
| Wages and salaries | | 1,089 | | 946 | | | 931 | | 1,089 | |
| Social security | | 125 | | 148 | | | 115 | | 125 | |
| Other payables | | 280 | | 233 | | | 296 | | 280 | |
| Deferred income | | 156 | | 103 | | | 70 | | 156 | |
| Customer return and rebate accruals | | 1,379 | | 1,337 | | | 1,632 | | 1,379 | |
| Other accruals | | 1,888 | | 2,155 | | | 1,703 | | 1,888 | |
| | | | | | | | | |
| | | 6,772 | | 6,075 | | | 6,888 | | 6,772 | |
| | | | | | | | | |
Customer return and rebate accruals are provided for by the Group at the point of sale in respect of the estimated rebates, discounts or allowances payable to customers, principally in the USA. ProvisionsUSA, and have increased during the year as a result of the US healthcare reform amendments. Accruals are made at the time of sale but the actual amounts paid are based on claims made some time after the initial recognition of the sale. As the amounts are estimated they may not fully reflect the final outcome and the amounts are subject to change dependent upon, amongst other things, the types of buying group and product sales mix. The level of provisionaccrual is reviewed and adjusted quarterly in the light of historical experience of actual rebates, discounts or allowances given and returns made and any changes in arrangements. Future events could cause the assumptions on which the provisionsaccruals are based to change, which could affect the future results of the Group.
Trade and other payables include £26 million (2009 – £23 million) due to associates and joint ventures. 28Pensions and other post-employment benefits
| | | | | | | | | | | | | |
| Pension and other post-employment costs | | 2009 | | | 2008 | | | 2007 | |
| | £m | | | £m | | | £m | |
| | | | | | | | | |
| UK pension schemes | | | 206 | | | | 236 | | | | 108 | |
| US pension schemes | | | 94 | | | | 60 | | | | 24 | |
| Other overseas pensions schemes | | | 101 | | | | 87 | | | | 89 | |
| Unfunded post-retirement healthcare schemes | | | 90 | | | | 118 | | | | 90 | |
| Other post-employment costs | | | – | | | | 4 | | | | 2 | |
| | | | | | | | | |
| | | | 491 | | | | 505 | | | | 313 | |
| | | | | | | |
| Analysed as: | | | | | | | | | | | | |
| Funded defined benefit/hybrid pension schemes | | | 338 | | | | 318 | | | | 171 | |
| Unfunded defined benefit pension schemes | | | 25 | | | | 23 | | | | 17 | |
| Unfunded post-retirement healthcare schemes | | | 90 | | | | 118 | | | | 90 | |
| | | | | | | | | |
| Defined benefit schemes | | | 453 | | | | 459 | | | | 278 | |
| Defined contribution pension schemes | | | 38 | | | | 42 | | | | 33 | |
| Other post-employment costs | | | – | | | | 4 | | | | 2 | |
| | | | | | | | | |
| | | | 491 | | | | 505 | | | | 313 | |
| | | | | | | | | |
The costs of the defined benefit pension and post-retirement healthcare schemes are charged in the income statement as follows:
| | | | | | | | | | | | | | | | | | | | | | | | | |
| | | | | | | | |
| | | | 2010 | | 2009 | | 2008 | |
Pension and other post-employment costs | | | £m | | £m | | £m | |
| | | | | | | | |
| UK pension schemes | | | 158 | | 206 | | 236 | |
| US pension schemes | | | 115 | | 94 | | 60 | |
| Other overseas pensions schemes | | | 125 | | 101 | | 87 | |
| Unfunded post-retirement healthcare schemes | | | 156 | | 90 | | 118 | |
| Other post-employment costs | | | – | | – | | 4 | |
| | | | | | | | |
| | | | 554 | | 491 | | 505 | |
| | | | | | | | |
| Analysed as: | | |
| Funded defined benefit/hybrid pension schemes | | | 325 | | 338 | | 318 | |
| Unfunded defined benefit pension schemes | | | 28 | | 25 | | 23 | |
| Unfunded post-retirement healthcare schemes | | | 156 | | 90 | | 118 | |
| | | | | | | | |
| Defined benefit schemes | | | 509 | | 453 | | 459 | |
| Defined contribution pension schemes | | | 45 | | 38 | | 42 | |
| Other post-employment costs | | | – | | – | | 4 | |
| | | | | | | | |
| | | | 554 | | 491 | | 505 | |
| | | | | | | | |
| | | |
| The costs of the defined benefit pension and post-retirement healthcare schemes are charged in the income statement as follows: | | The costs of the defined benefit pension and post-retirement healthcare schemes are charged in the income statement as follows: |
| | | | | | | | |
| Cost of sales | | 121 | | 179 | | 72 | | | 117 | | 121 | | 179 | |
| Selling, general and administration | | 195 | | 160 | | 129 | | | 254 | | 195 | | 160 | |
| Research and development | | 137 | | 120 | | 77 | | | 138 | | 137 | | 120 | |
| | | | | | | | | | | | | |
| | | 453 | | 459 | | 278 | | | 509 | | 453 | | 459 | |
| | | | | | | | | | | | | |
GSK entities operate pension arrangements which cover the Group’s material obligations to provide pensions to retired employees. These arrangements have been developed in accordance with local practices in the countries concerned. Pension benefits can be provided by state schemes; by defined contribution schemes, whereby retirement benefits are determined by the value of funds arising from contributions paid in respect of each employee; or by defined benefit schemes, whereby retirement benefits are based on employee pensionable remuneration and length of service. Some ‘hybrid’ defined benefit schemes also include defined contribution sections.
GSK Annual Report 2010
141
129
Notes to the financial statements
2828Pensions and other post-employment benefitscontinued
Pension costs of defined benefit schemes for accounting purposes have been calculated using the projected unit method. In certain countries pension benefits are provided on an unfunded basis, some administered by trustee companies. Formal, independent, actuarial valuations of the Group’s main plans are undertaken regularly, normally at least every three years.
Actuarial movements in the year are recognised through the statement of comprehensive income. Discount rates are derived from AA rated corporate bond yields except in countries where there is no deep market in corporate bonds where government bond yields are used. Discount rates are selected to reflect the term of the expected benefit payments. The expected rate of return on bonds reflects the portfolio mix of index-linked, government and corporate bonds. An equity risk premium of between 3% and 4% is added to longer term government bond yields to give the expected rate of return on equities. Projected inflation rate and pension increases are long-term predictions based on the yield gap between long-term index-linked and fixed interest Gilts. In the UK, mortality rates are determined by adjusting the PCA00 standard mortality tables to reflect recent scheme experience. These rates are then projected to reflect improvements in life expectancy in line with the medium cohort (i.e. improvements at recently observed higher levels which are assumed to continue to 2020) with minimum improvements thereafter of 1% per year for both males and 0.5% for females. In the USA, mortality rates are calculated using the RP2000 fully generational table, projected using scale AA, with the white collar adjustment.
The average life expectancy assumed now for an individual at the age of 60 and projected to apply in 20292030 for an individual then at the age of 60 is as follows:
| | | | | | | | | | | |
| | | | | | | | | | | | | | | | | | |
| | | UK | | USA | | | UK | | USA | |
| | | Male | | Female | | Male | | Female | | | Male | | Female | | Male | | Female | |
| | | Years | | Years | | Years | | Years | | | Years | | Years | | Years | | Years | |
| | | | | | | | | | | | |
| Current | | 27.3 | | 28.2 | | 24.5 | | 26.2 | | | 27.4 | | 28.7 | | 24.6 | | 26.3 | |
| Projected for 2029 | | 29.6 | | 29.5 | | 26.4 | | 27.3 | | |
| Projected for 2030 | | | 29.7 | | 30.5 | | 26.5 | | 27.4 | |
| | | | | | | | | | | | |
The assets of funded schemes are generally held in separately administered trusts, either as specific assets or as a proportion of a general fund, or are insurance contracts. Assets are invested in different classes in order to maintain a balance between risk and return. Investments are diversified to limit the financial effect of the failure of any individual investment. Following an asset liability study in 2007, the Group decided to adopt a strategy to reduce gradually the allocation of investment in equities. During 2009, it was agreed that the pace of reallocation would be increased primarily through investment of the deficit reduction contributions in bonds. The target allocation of equities and property in the US scheme has been reduced to 50% of the total.
In the UK the defined benefit pension schemes operated for the benefit of former Glaxo Wellcome employees and former SmithKline Beecham employees remain separate. These schemes were closed to new entrants in 2001 and subsequent UK employees are entitled to join a defined contribution scheme. In the USA the former Glaxo Wellcome and SmithKline Beecham defined benefit schemes were merged during 2001. In addition, the Group operates a number of post-retirement healthcare schemes, the principal one of which is in the USA.
The Group has applied the following financial assumptions in assessing the defined benefit liabilities:
| | | | | | | | | | | | | | | | | | | | | | | | | | | | | | | | | | | | | | |
| | | | | | | | | | | | | | | | | | | | | | | | | | | | | | | | | | | | | | | | | | | | | | | | | | | | | | | |
| | | UK | | USA | | Rest of World | | | UK | | USA | | Rest of World | |
| | | 2009 | | 2008 | | 2007 | | 2009 | | 2008 | | 2007 | | 2009 | | 2008 | | 2007 | | | 2010 | | 2009 | | 2008 | | 2010 | | 2009 | | 2008 | | 2010 | | 2009 | | 2008 | |
| | | % pa | | % pa | | % pa | | % pa | | % pa | | % pa | | % pa | | % pa | | % pa | | | % pa | | % pa | | % pa | | % pa | | % pa | | % pa | | % pa | | % pa | | % pa | |
| | | | | | | | | | | | | | | | | | | | | | | | |
| Rate of increase of future earnings | | 4.60 | | 3.90 | | 4.25 | | 4.50 | | 4.50 | | 5.00 | | 3.00 | | 3.10 | | 3.25 | | | 4.50 | | 4.60 | | 3.90 | | 4.50 | | 4.50 | | 4.50 | | 3.50 | | 3.00 | | 3.10 | |
| Discount rate | | 5.70 | | 6.20 | | 5.75 | | 5.75 | | 6.00 | | 6.00 | | 4.70 | | 5.00 | | 4.75 | | | 5.50 | | 5.70 | | 6.20 | | 5.20 | | 5.75 | | 6.00 | | 4.50 | | 4.70 | | 5.00 | |
| Expected pension increases | | 3.60 | | 2.90 | | 3.25 | | n/a | | n/a | | n/a | | 2.20 | | 2.10 | | 2.00 | | | 3.50 | | 3.60 | | 2.90 | | n/a | | n/a | | n/a | | 2.20 | | 2.20 | | 2.10 | |
| Cash balance credit/conversion rate | | n/a | | n/a | | n/a | | 4.75 | | 4.50 | | 4.75 | | 1.60 | | 1.20 | | 1.60 | | | n/a | | n/a | | n/a | | 4.20 | | 4.75 | | 4.50 | | 1.30 | | 1.60 | | 1.20 | |
| Inflation rate | | 3.60 | | 2.70 | | 3.25 | | 2.50 | | 2.50 | | 2.50 | | 1.70 | | 1.70 | | 1.75 | | | 3.50 | | 3.60 | | 2.70 | | 2.25 | | 2.50 | | 2.50 | | 1.70 | | 1.70 | | 1.70 | |
| | | | | | | | | | | | | | | | | | | | | | | | |
GSK Annual Report 20092010
142
130
Notes to the financial statements
2828Pensions and other post-employment benefitscontinued
The amounts recorded in the income statement and statement of comprehensive income for the three years ended 31st December 20092010 in relation to the defined benefit pension and post-retirement healthcare schemes were as follows:
| | | | | | | | | | | | | | | | | | | | | | | | | |
| | | Post-retirement | | | | | | | | | | | |
| | | Pensions | | benefits | | | Post-retirement | |
| 2009 | | UK | | USA | | Rest of World | | Group | | Group | | |
| | £m | | £m | | £m | | £m | | £m | | |
| Amounts charged to operating profit | | |
| Current service cost | | 121 | | 66 | | 64 | | 251 | | 35 | | |
| | | | Pensions | | benefits | |
| | | | UK | | USA | | Rest of World | | Group | | Group | |
2010 | | | £m | | £m | | £m | | £m | | £m | |
| | | | | | | | | | | | |
Amounts charged to operating profit
Current service cost | | | 130 | | 68 | | 70 | | 268 | | 31 | |
| Past service cost | | – | | | (6 | ) | | – | | | (6 | ) | | | (27 | ) | | – | | – | | – | | – | | 5 | |
| Expected return on pension scheme assets | | | (347 | ) | | | (121 | ) | | | (46 | ) | | | (514 | ) | | – | | | | (427 | ) | | | (134 | ) | | | (51 | ) | | | (612 | ) | | – | |
| Interest on scheme liabilities | | 378 | | 148 | | 62 | | 588 | | 74 | | | 425 | | 151 | | 64 | | 640 | | 73 | |
| Settlements and curtailments | | 54 | | 7 | | | (17 | ) | | 44 | | 8 | | | 30 | | 30 | | | (3 | ) | | 57 | | 47 | |
| | | | | | | | | | | | | | | | | | | | |
| | | 206 | | 94 | | 63 | | 363 | | 90 | | | 158 | | 115 | | 80 | | 353 | | 156 | |
| | | | | | | | | | | | | | | | | | | | |
| | | |
| Actuarial (losses)/gains recorded in the statement of comprehensive income | | | (578 | ) | | | (5 | ) | | | (77 | ) | | | (660 | ) | | 1 | | |
| Actuarial gains/(losses) recorded in the statement of comprehensive income | | | 73 | | 43 | | | (37 | ) | | 79 | | | (80 | ) |
| | | | | | | | | | | | | | | | | | | | |
| | | | | | | | | | | | | | | | | | | | | | | | | |
| | | Post-retirement | | | | | | | | | | | |
| | | Pensions | | benefits | | | Post-retirement | |
| 2008 | | UK | | USA | | Rest of World | | Group | | Group | | |
| | £m | | £m | | £m | | £m | | £m | | |
| | | | | | | | | | | | Pensions | | benefits | |
| Amounts charged to operating profit | | |
| Current service cost | | 126 | | 61 | | 59 | | 246 | | 30 | | |
| | | | UK | | USA | | Rest of World | | Group | | Group | |
2009 | | | £m | | £m | | £m | | £m | | £m | |
| | | | | | | | | | | | |
Amounts charged to operating profit
Current service cost | | | 121 | | 66 | | 64 | | 251 | | 35 | |
| Past service cost | | – | | 10 | | 2 | | 12 | | 4 | | | – | | | (6 | ) | | – | | | (6 | ) | | | (27 | ) |
| Expected return on pension scheme assets | | | (442 | ) | | | (144 | ) | | | (47 | ) | | | (633 | ) | | – | | | | (347 | ) | | | (121 | ) | | | (46 | ) | | | (514 | ) | | – | |
| Interest on scheme liabilities | | 377 | | 121 | | 53 | | 551 | | 62 | | | 378 | | 148 | | 62 | | 588 | | 74 | |
| Settlements and curtailments | | 175 | | 12 | | | (22 | ) | | 165 | | 22 | | | 54 | | 7 | | | (17 | ) | | 44 | | 8 | |
| | | | | | | | | | | | | | | | | | | | |
| | | 236 | | 60 | | 45 | | 341 | | 118 | | | 206 | | 94 | | 63 | | 363 | | 90 | |
| | | | | | | | | | | | | | | | | | | | |
| | | |
| Actuarial (losses)/gains recorded in the statement of comprehensive income | | | (776 | ) | | | (576 | ) | | | (82 | ) | | | (1,434 | ) | | 64 | | | | (578 | ) | | | (5 | ) | | | (77 | ) | | | (660 | ) | | 1 | |
| | | | | | | | | | | | | | | | | | | | |
| | | | | | | | | | | | | | | | | | | | | | | | | |
| | | Post-retirement | | | | | | | | | | | |
| | | Pensions | | benefits | | | Post-retirement | |
| 2007 | | UK | | USA | | Rest of World | | Group | | Group | | |
| | £m | | £m | | £m | | £m | | £m | | |
| | | | Pensions | | benefits | |
| | | | UK | | USA | | Rest of World | | Group | | Group | |
2008 | | | £m | | £m | | £m | | £m | | £m | |
| | | | | | | | | | | | |
| Amounts charged to operating profit | | |
| Current service cost | | 138 | | 60 | | 57 | | 255 | | 30 | | | 126 | | 61 | | 59 | | 246 | | 30 | |
| Past service cost | | – | | | (7 | ) | | 1 | | | (6 | ) | | – | | | – | | 10 | | 2 | | 12 | | 4 | |
| Expected return on pension scheme assets | | | (389 | ) | | | (141 | ) | | | (37 | ) | | | (567 | ) | | – | | | | (442 | ) | | | (144 | ) | | | (47 | ) | | | (633 | ) | | – | |
| Interest on scheme liabilities | | 335 | | 107 | | 41 | | 483 | | 54 | | | 377 | | 121 | | 53 | | 551 | | 62 | |
| Settlements and curtailments | | 24 | | 5 | | | (6 | ) | | 23 | | 6 | | | 175 | | 12 | | | (22 | ) | | 165 | | 22 | |
| | | | | | | | | | | | | | | | | | | | |
| | | 108 | | 24 | | 56 | | 188 | | 90 | | | 236 | | 60 | | 45 | | 341 | | 118 | |
| | | | | | | | | | | | | | | | | | | | |
| | | |
| Actuarial (losses)/gains recorded in the statement of comprehensive income | | 523 | | 66 | | 43 | | 632 | | 39 | | | | (776 | ) | | | (576 | ) | | | (82 | ) | | | (1,434 | ) | | 64 | |
| | | | | | | | | | | | | | | | | | | | |
The total actuarial losses recorded in the statement of comprehensive income since 1st January 2003 amount to £2,047£2,048 million.
The amounts included within settlements and curtailments include £110 million (2009 – £72 million (2008million; 2008 – £208 million; 2007 – £35 million) of augmentation costs arising from major restructuring programmes (see Note 29 ‘Other provisions’).
GSK Annual Report 20092010
143
131
Notes to the financial statements
2828Pensions and other post-employment benefitscontinued
The fair values of the assets and liabilities of the UK and US defined benefit pension schemes, together with aggregated data for other defined benefit pension schemes in the Group are as follows:
| | | | | | | | | | | | | | | | | | | | | | | | | | | | | | | | | | | | | | | | | | | | | |
| | | UK | | USA | | Rest of World | | Group | | | | | | | | | | | | | | | |
| | | Average | | | | | | | UK | | USA | | Rest of World | | Group | |
| At 31st December 2009 | | Expected rate | | Fair | | Expected rate | | Fair | | expected rate | | Fair | | Fair | | |
| | of return | | value | | of return | | value | | of return | | value | | value | | |
| | | | Average | | | | | |
| At 31st December 2010 | | | Expected rate | | Fair | | Expected rate | | Fair | | expected rate | | Fair | | Fair | |
| | of return | | value | | of return | | value | | of return | | value | | value | |
| | | % | | £m | | % | | £m | | % | | £m | | £m | | | % | | £m | | % | | £m | | % | | £m | | £m | |
| | | | | | | | | | | | | | | | | | | | | | |
| Equities | | 8.00 | | 4,209 | | 8.25 | | 914 | | 7.50 | | 232 | | 5,355 | | | 8.00 | | 4,698 | | 8.25 | | 1,092 | | 7.40 | | 251 | | 6,041 | |
| Property | | 7.00 | | 291 | | 7.25 | | 159 | | 7.00 | | 20 | | 470 | | | 7.00 | | 272 | | 7.25 | | 147 | | 7.00 | | 6 | | 425 | |
| Bonds | | 4.90 | | 2,632 | | 5.00 | | 907 | | 3.50 | | 562 | | 4,101 | | | 4.50 | | 2,460 | | 4.75 | | 1,012 | | 3.10 | | 572 | | 4,044 | |
| Other assets | | 0.50 | | 367 | | 0.25 | | 92 | | 3.80 | | 309 | | 768 | | | 3.50 | | 1,188 | | 0.25 | | 59 | | 3.80 | | 399 | | 1,646 | |
| | | | | | | | | | | | | | | | | | | | | | |
| Fair value of assets | | 7,499 | | 2,072 | | 1,123 | | 10,694 | | | 8,618 | | 2,310 | | 1,228 | | 12,156 | |
| Present value of scheme obligations | | | (8,446 | ) | | | (2,628 | ) | | | (1,364 | ) | | | (12,438 | ) | | | (9,119 | ) | | | (2,781 | ) | | | (1,479 | ) | | | (13,379 | ) |
| | | | | | | | | | | | | | | | | | | | | | |
| | | | (947 | ) | | | (556 | ) | | | (241 | ) | | | (1,744 | ) | | | (501 | ) | | | (471 | ) | | | (251 | ) | | | (1,223 | ) |
| | | | | | | | | | | | | | | | | | | | | | |
| Unrecognised past service cost | | | (2 | ) | | 1 | | | (1 | ) | | – | | | (2 | ) | | 1 | | | (1 | ) |
| | | | | | | | | | | | | | | | | | | | | | |
| Recognised on the balance sheet | | | (947 | ) | | | (558 | ) | | | (240 | ) | | | (1,745 | ) | | | (501 | ) | | | (473 | ) | | | (250 | ) | | | (1,224 | ) |
| | | | | | | | | | | | | | | | | | | | | | |
| | | |
| Included in other non-current assets | | – | | – | | 23 | | 23 | | | – | | – | | 23 | | 23 | |
Included in pensions and other post-employment
benefits | | | (947 | ) | | | (558 | ) | | | (263 | ) | | | (1,768 | ) | | | (501 | ) | | | (473 | ) | | | (273 | ) | | | (1,247 | ) |
| | | | | | | | | | | | | | | | | | | | | | |
| | | | (947 | ) | | | (558 | ) | | | (240 | ) | | | (1,745 | ) | | | (501 | ) | | | (473 | ) | | | (250 | ) | | | (1,224 | ) |
| | | | | | | | | | | | | | | | | | | | | | |
| | | |
| Actual return on plan assets | | 1,076 | | 243 | | 65 | | 1,384 | | | 881 | | 240 | | 43 | | 1,164 | |
| | | | | | | | | | | | | | | | | | | | | | |
| | |
| | | UK | | USA | | Rest of World | | Group | | |
| | | Average | | | | | | |
| At 31st December 2008 | | Expected rate | | Fair | | Expected rate | | Fair | | expected rate | | Fair | | Fair | | |
| | of return | | value | | of return | | value | | of return | | value | | value | | |
| | | % | | £m | | % | | £m | | % | | £m | | £m | | |
| | | | | | | | |
| Equities | | 7.75 | | 3,334 | | 8.25 | | 838 | | 7.00 | | 211 | | 4,383 | | |
| Property | | 6.75 | | 331 | | 7.25 | | 259 | | 6.75 | | 22 | | 612 | | |
| Bonds | | 4.75 | | 2,430 | | 5.25 | | 893 | | 3.25 | | 598 | | 3,921 | | |
| Other assets | | 2.75 | | 40 | | 1.50 | | 26 | | 4.25 | | 306 | | 372 | | |
| | | | | | | | |
| Fair value of assets | | 6,135 | | 2,016 | | 1,137 | | 9,288 | | |
| Present value of scheme obligations | | | (6,885 | ) | | | (2,738 | ) | | | (1,357 | ) | | | (10,980 | ) | |
| | | | | | | | |
| | | | (750 | ) | | | (722 | ) | | | (220 | ) | | | (1,692 | ) | |
| | | | | | | | |
| Unrecognised past service cost | | – | | – | | 1 | | 1 | | |
| Restriction on surplus | | – | | – | | | (6 | ) | | | (6 | ) | |
| | | | | | | | |
| Recognised on the balance sheet | | | (750 | ) | | | (722 | ) | | | (225 | ) | | | (1,697 | ) | |
| | | | | | | | |
| | | |
| Included in other non-current assets | | – | | – | | 39 | | 39 | | |
| Included in pensions and other post-employment benefits | | | (750 | ) | | | (722 | ) | | | (264 | ) | | | (1,736 | ) | |
| | | | | | | | |
| | | | (750 | ) | | | (722 | ) | | | (225 | ) | | | (1,697 | ) | |
| | | | | | | | |
| | | |
| Actual return on plan assets | | | (1,249 | ) | | | (470 | ) | | | (87 | ) | | | (1,806 | ) | |
| | | | | | | | |
In December 2010, the UK scheme purchased an insurance contract that will guarantee payment of specified pensioner liabilities. This is included within ‘Other assets’ and the ‘Present value of scheme obligations’ in the table above at a value of £698 million at 31st December 2010.
| | | | | | | | | | | | | | | | | | | | | | | | | | | | | |
| | | | | | | | | | | | | | | | | | | | |
| | | UK | | | USA | | | Rest of World | | | Group | |
| | | | | | | | | | | | | | | | | | | Average | | | | | | | |
| At 31st December 2009 | | Expected rate | | | Fair | | | Expected rate | | | Fair | | | expected rate | | | Fair | | | Fair | |
| | of return | | | value | | | of return | | | value | | | of return | | | value | | | value | |
| | | % | | | £m | | | % | | | £m | | | % | | | £m | | | £m | |
| | | | | | | | | | | | | | | | | | | | |
| Equities | | | 8.00 | | | | 4,209 | | | | 8.25 | | | | 914 | | | | 7.50 | | | | 232 | | | | 5,355 | |
| Property | | | 7.00 | | | | 291 | | | | 7.25 | | | | 159 | | | | 7.00 | | | | 20 | | | | 470 | |
| Bonds | | | 4.90 | | | | 2,632 | | | | 5.00 | | | | 907 | | | | 3.50 | | | | 562 | | | | 4,101 | |
| Other assets | | | 0.50 | | | | 367 | | | | 0.25 | | | | 92 | | | | 3.80 | | | | 309 | | | | 768 | |
| | | | | | | | | | | | | | | | | | | | |
| Fair value of assets | | | | | | | 7,499 | | | | | | | | 2,072 | | | | | | | | 1,123 | | | | 10,694 | |
| Present value of scheme obligations | | | | | | | (8,446 | ) | | | | | | | (2,628 | ) | | | | | | | (1,364 | ) | | | (12,438 | ) |
| | | | | | | | | | | | | | | | | | | | |
| | | | | | | | (947 | ) | | | | | | | (556 | ) | | | | | | | (241 | ) | | | (1,744 | ) |
| | | | | | | | | | | | | | | | | | | | |
| Unrecognised past service cost | | | | | | | – | | | | | | | | (2 | ) | | | | | | | 1 | | | | (1 | ) |
| | | | | | | | | | | | | | | | | | | | |
| Recognised on the balance sheet | | | | | | | (947 | ) | | | | | | | (558 | ) | | | | | | | (240 | ) | | | (1,745 | ) |
| | | | | | | | | | | | | | | | | | | | |
| Included in other non-current assets | | | | | | | – | | | | | | | | – | | | | | | | | 23 | | | | 23 | |
| Included in pensions and other post-employment benefits | | | | | | | (947 | ) | | | | | | | (558 | ) | | | | | | | (263 | ) | | | (1,768 | ) |
| | | | | | | | | | | | | | | | | | | | |
| | | | | | | | (947 | ) | | | | | | | (558 | ) | | | | | | | (240 | ) | | | (1,745 | ) |
| | | | | | | | | | | | | | | | | | | | |
| |
| Actual return on plan assets | | | | | | | 1,076 | | | | | | | | 243 | | | | | | | | 65 | | | | 1,384 | |
| | | | | | | | | | | | | | | | | | | | |
GSK Annual Report 20092010
144
132
Notes to the financial statements
28Pensions and other post-employment benefitscontinued
| | | | | | | | | | | | | | | | | | | | | | | | | | | | | | | | | | | | | | | | | | | | |
| | | UK | | USA | | Rest of World | | Group | | | | | | | | | | |
| | | Average | | | | | | | UK | | USA | | Rest of World | | Group | |
| At 31st December 2007 | | Expected rate | | Fair | | Expected rate | | Fair | | expected rate | | Fair | | Fair | | |
| | of return | | value | | of return | | value | | of return | | value | | value | | |
| | | % | | £m | | % | | £m | | % | | £m | | £m | | | | | | | | |
| | | | Average | | | | | |
| At 31st December 2008 | | | Expected rate | | Fair | | Expected rate | | Fair | | expected rate | | Fair | | Fair | |
| | of return | | value | | of return | | value | | of return | | value | | value | |
| | | | | | | | | | % | | £m | | % | | £m | | % | | £m | | £m | |
| Equities | | 8.00 | | 4,578 | | 8.50 | | 1,446 | | 7.50 | | 223 | | 6,247 | | | 7.75 | | 3,334 | | 8.25 | | 838 | | 7.00 | | 211 | | 4,383 | |
| Property | | 7.00 | | 338 | | 7.50 | | 213 | | 7.00 | | 20 | | 571 | | | 6.75 | | 331 | | 7.25 | | 259 | | 6.75 | | 22 | | 612 | |
| Bonds | | 5.00 | | 2,322 | | 5.00 | | 335 | | 4.00 | | 430 | | 3,087 | | | 4.75 | | 2,430 | | 5.25 | | 893 | | 3.25 | | 598 | | 3,921 | |
| Other assets | | 6.00 | | 55 | | 4.75 | | 10 | | 4.25 | | 212 | | 277 | | | 2.75 | | 40 | | 1.50 | | 26 | | 4.25 | | 306 | | 372 | |
| | | | | | | | | | | | | | | | | | | | | | |
| Fair value of assets | | 7,293 | | 2,004 | | 885 | | 10,182 | | | 6,135 | | 2,016 | | 1,137 | | 9,288 | |
| Present value of scheme obligations | | | (7,371 | ) | | | (1,945 | ) | | | (1,022 | ) | | | (10,338 | ) | | | (6,885 | ) | | | (2,738 | ) | | | (1,357 | ) | | | (10,980 | ) |
| | | | | | | | | | | | | | | | | | | | | | |
| | | | (78 | ) | | 59 | | | (137 | ) | | | (156 | ) | | | (750 | ) | | | (722 | ) | | | (220 | ) | | | (1,692 | ) |
| | | | | | | | | | | | | | | | | | | | | | |
| | |
| Unrecognised past service cost | | | – | | – | | 1 | | 1 | |
| Restriction on surplus | | | – | | – | | | (6 | ) | | | (6 | ) |
| | | | | | | | | | | | | | | | |
| Recognised on the balance sheet | | | | (750 | ) | | | (722 | ) | | | (225 | ) | | | (1,697 | ) |
| | | | | | | | | | | | | | | | |
| | | |
| Included in other non-current assets | | 10 | | 215 | | 30 | | 255 | | | – | | – | | 39 | | 39 | |
Included in pensions and other post-employment
benefits | | | (88 | ) | | | (156 | ) | | | (167 | ) | | | (411 | ) | | | (750 | ) | | | (722 | ) | | | (264 | ) | | | (1,736 | ) |
| | | | | | | | | | | | | | | | | | | | | | |
| | | | (78 | ) | | 59 | | | (137 | ) | | | (156 | ) | | | (750 | ) | | | (722 | ) | | | (225 | ) | | | (1,697 | ) |
| | | | | | | | | | | | | | | | | | | | | | |
| | |
| Actual return on plan assets | | 557 | | 187 | | 19 | | 763 | | | | (1,249 | ) | | | (470 | ) | | | (87 | ) | | | (1,806 | ) |
| | | | | | | | | | | | | | | | | | | | | | |
GSK Annual Report 20092010
145
133
Notes to the financial statements
28Pensions and other post-employment benefitscontinued
| | | | | | | | | | | | | | | |
| | | | | | | | | | | | | | | | | | | | | | | | | |
| | | Post-retirement | | | Post-retirement | |
| | | Pensions | | benefits | | | Pensions | | benefits | |
| | | UK | | USA | | Rest of World | | Group | | Group | | | | | | | | |
| Movements in defined benefit obligations | | £m | | £m | | £m | | £m | | £m | | | UK | | USA | | Rest of World | | Group | | Group | |
| | | | | | | | | | | | |
| Obligations at 1st January 2007 | | | (7,444 | ) | | | (1,949 | ) | | | (952 | ) | | | (10,345 | ) | | | (1,063 | ) | |
| Exchange adjustments | | – | | 34 | | | (80 | ) | | | (46 | ) | | 9 | | |
| Service cost | | | (138 | ) | | | (53 | ) | | | (58 | ) | | | (249 | ) | | | (30 | ) | |
| Interest cost | | | (335 | ) | | | (107 | ) | | | (41 | ) | | | (483 | ) | | | (54 | ) | |
| Settlements and curtailments | | | (24 | ) | | | (5 | ) | | 4 | | | (25 | ) | | | (6 | ) | |
| Actuarial gains | | 355 | | 20 | | 61 | | 436 | | 39 | | |
| Scheme participants’ contributions | | | (38 | ) | | – | | | (5 | ) | | | (43 | ) | | – | | |
| Benefits paid | | 253 | | 115 | | 49 | | 417 | | 44 | | |
| Transfers to other provisions | | – | | – | | – | | – | | 89 | | |
| | | | | | | | | | | | |
| Recognised on the balance sheet at 31st December 2007 | | | (7,371 | ) | | | (1,945 | ) | | | (1,022 | ) | | | (10,338 | ) | | | (972 | ) | |
| | | | | | | | | | | | |
| Unrecognised past service cost | | – | | – | | – | | – | | | (47 | ) | |
| | | | | | | | | | | | |
| Obligations at 31st December 2007 | | | (7,371 | ) | | | (1,945 | ) | | | (1,022 | ) | | | (10,338 | ) | | | (1,019 | ) | |
| Movements in defined benefit obligations | | | £m | | £m | | £m | | £m | | £m | |
| | | (7,371 | ) | | | (1,945 | ) | | | (1,022 | ) | | | (10,338 | ) | | | (1,019 | ) |
| Exchange adjustments | | – | | | (753 | ) | | | (353 | ) | | | (1,106 | ) | | | (351 | ) | | – | | | (753 | ) | | | (353 | ) | | | (1,106 | ) | | | (351 | ) |
| Service cost | | | (126 | ) | | | (71 | ) | | | (61 | ) | | | (258 | ) | | | (28 | ) | | | (126 | ) | | | (71 | ) | | | (61 | ) | | | (258 | ) | | | (28 | ) |
| Interest cost | | | (377 | ) | | | (121 | ) | | | (53 | ) | | | (551 | ) | | | (62 | ) | | | (377 | ) | | | (121 | ) | | | (53 | ) | | | (551 | ) | | | (62 | ) |
| Settlements and curtailments | | | (175 | ) | | | (12 | ) | | 19 | | | (168 | ) | | | (16 | ) | | | (175 | ) | | | (12 | ) | | 19 | | | (168 | ) | | | (16 | ) |
| Actuarial gains | | 915 | | 38 | | 58 | | 1,011 | | 64 | | | 915 | | 38 | | 58 | | 1,011 | | 64 | |
| Scheme participants’ contributions | | | (33 | ) | | – | | | (5 | ) | | | (38 | ) | | | (9 | ) | | | (33 | ) | | – | | | (5 | ) | | | (38 | ) | | | (9 | ) |
| Benefits paid | | 282 | | 126 | | 60 | | 468 | | 53 | | | 282 | | 126 | | 60 | | 468 | | 53 | |
| Transfers to other provisions | | – | | – | | – | | – | | 14 | | | – | | – | | – | | – | | 14 | |
| | | | | | | | | | | | | | | | | | | | | |
| Obligations at 31st December 2008 | | | (6,885 | ) | | | (2,738 | ) | | | (1,357 | ) | | | (10,980 | ) | | | (1,354 | ) | | | (6,885 | ) | | | (2,738 | ) | | | (1,357 | ) | | | (10,980 | ) | | | (1,354 | ) |
| Exchange adjustments | | – | | 294 | | 109 | | 403 | | 133 | | | – | | 294 | | 109 | | 403 | | 133 | |
| Service cost | | | (121 | ) | | | (58 | ) | | | (64 | ) | | | (243 | ) | | | (5 | ) | | | (121 | ) | | | (58 | ) | | | (64 | ) | | | (243 | ) | | | (5 | ) |
| Interest cost | | | (378 | ) | | | (148 | ) | | | (62 | ) | | | (588 | ) | | | (74 | ) | | | (378 | ) | | | (148 | ) | | | (62 | ) | | | (588 | ) | | | (74 | ) |
| Settlements and curtailments | | | (54 | ) | | | (7 | ) | | 68 | | 7 | | | (8 | ) | | | (54 | ) | | | (7 | ) | | 68 | | 7 | | | (8 | ) |
| Actuarial (losses)/gains | | | (1,307 | ) | | | (127 | ) | | | (102 | ) | | | (1,536 | ) | | 1 | | | | (1,307 | ) | | | (127 | ) | | | (102 | ) | | | (1,536 | ) | | 1 | |
| Scheme participants’ contributions | | | (17 | ) | | – | | | (8 | ) | | | (25 | ) | | | (11 | ) | | | (17 | ) | | – | | | (8 | ) | | | (25 | ) | | | (11 | ) |
| Benefits paid | | 345 | | 156 | | 71 | | 572 | | 69 | | | 345 | | 156 | | 71 | | 572 | | 69 | |
| Acquisitions | | | (29 | ) | | – | | | (19 | ) | | | (48 | ) | | | (4 | ) | | | (29 | ) | | – | | | (19 | ) | | | (48 | ) | | | (4 | ) |
| | | | | | | | | | | | | | | | | | | | | |
| Obligations at 31st December 2009 | | | (8,446 | ) | | | (2,628 | ) | | | (1,364 | ) | | | (12,438 | ) | | | (1,253 | ) | | | (8,446 | ) | | | (2,628 | ) | | | (1,364 | ) | | | (12,438 | ) | | | (1,253 | ) |
| Exchange adjustments | | | – | | | (84 | ) | | | (27 | ) | | | (111 | ) | | | (38 | ) |
| Service cost | | | | (130 | ) | | | (68 | ) | | | (70 | ) | | | (268 | ) | | | (31 | ) |
| Interest cost | | | | (425 | ) | | | (151 | ) | | | (64 | ) | | | (640 | ) | | | (73 | ) |
| Settlements and curtailments | | | | (30 | ) | | | (30 | ) | | 3 | | | (57 | ) | | | (44 | ) |
| Actuarial losses | | | | (381 | ) | | | (63 | ) | | | (29 | ) | | | (473 | ) | | | (80 | ) |
| Scheme participants’ contributions | | | | (20 | ) | | – | | | (8 | ) | | | (28 | ) | | | (13 | ) |
| Benefits paid | | | 313 | | 243 | | 80 | | 636 | | 73 | |
| | | | | | | | | | | | |
| Obligations at 31st December 2010 | | | | (9,119 | ) | | | (2,781 | ) | | | (1,479 | ) | | | (13,379 | ) | | | (1,459 | ) |
| Unrecognised past service cost | | – | | | (2 | ) | | 1 | | | (1 | ) | | 40 | | | – | | | (2 | ) | | 1 | | | (1 | ) | | 34 | |
| | | | | | | | | | | | | | | | | | | | | |
| Recognised on the balance sheet at 31st December 2009 | | | (8,446 | ) | | | (2,630 | ) | | | (1,363 | ) | | | (12,439 | ) | | | (1,213 | ) | |
| Recognised on the balance sheet at 31st December 2010 | | | | (9,119 | ) | | | (2,783 | ) | | | (1,478 | ) | | | (13,380 | ) | | | (1,425 | ) |
| | | | | | | | | | | | | | | | | | | | | |
The UK defined benefit schemes include defined contribution sections with obligations totalling £765£961 million at 31st December 2009 (20082010 (2009 – £553£765 million; 20072008 – £693£553 million).
The liability for the US post-retirement healthcare scheme has been assessed using the same assumptions as for the US pension scheme, together with the assumption for future medical inflation of 8.5% (20088% (2009 – 9.0%8.5%), reducing by 0.5% per yeargrading down to 5%4.75% in 20172018 and thereafter. During 2007, the US post-retirement healthcare scheme was amended. The main change was an increase in the cap on Group costs. During 2009, both the US pension and post-retirement healthcare plan were amended. The changes resulted in a one-off gain of £37 million in the income statement. At 31st December 20092010 the US plan obligation was £1,288 million (2009 – £1,102 million (2008million; 2008 – £1,223 million; 2007 – £879 million). However, in accordance with IAS 19 the unvested part of a benefit improvement is not recognised immediately on the balance sheet but is recognised gradually through the income statement. At 31st December 2009,2010, the unrecognised amount of £34 million (2009 – £40 million (2008million; 2008 – £51 million; 2007 – £47 million) primarily relates to the effect of thisthe change in the US post-retirement scheme. At 31st December 2008, the past service cost not recognised from this scheme, which amounted to £36 million (2009 – £42 million; 2008 – £53 million.million).
GSK Annual Report 20092010
146
134
Notes to the financial statements
28Pensions and other post-employment benefitscontinued
The defined benefit pension obligation is analysed as follows:
| | | | | | | | | | | | | | | |
| | | 2009 | | 2008 | | 2007 | | | | | | | | |
| | | £m | | £m | | £m | | | 2010 | | 2009 | | 2008 | |
| | | | | | | | | £m | | £m | | £m | |
| Funded | | | (12,126 | ) | | | (10,662 | ) | | | (10,079 | ) | | | (13,033 | ) | | | (12,126 | ) | | | (10,662 | ) |
| Unfunded | | | (312 | ) | | | (318 | ) | | | (259 | ) | | | (346 | ) | | | (312 | ) | | | (318 | ) |
| | | | | | | | | | | | | |
| | | | (12,438 | ) | | | (10,980 | ) | | | (10,338 | ) | | | (13,379 | ) | | | (12,438 | ) | | | (10,980 | ) |
| | | | | | | | | | | | | |
Post-retirement benefits are unfunded.
| | | | | | | | | | | | | | | |
| | | | | | |
| | | | Post-retirement | |
| | | | | | | | | | | | | | | | | | | | Pensions | | benefits | |
| | | Post-retirement | | | | | | | | |
| | | Pensions | | benefits | | | UK | | USA | | Rest of World | | Group | | Group | |
| Movements in fair values of assets | | UK | | USA | | Rest of World | | Group | | Group | | | £m | | £m | | £m | | £m | | £m | |
| | £m | | £m | | £m | | £m | | £m | | |
| | | | | | | | | | | | |
| Assets at 1st January 2007 | | 6,554 | | 1,953 | | 741 | | 9,248 | | – | | |
| Assets at 1st January 2008 | | | 7,293 | | 2,004 | | 885 | | 10,182 | | – | |
| Exchange adjustments | | – | | | (29 | ) | | 68 | | 39 | | – | | | – | | 598 | | 298 | | 896 | | – | |
| Expected return on assets | | 389 | | 141 | | 37 | | 567 | | – | | | 442 | | 144 | | 47 | | 633 | | – | |
| Settlements and curtailments | | – | | – | | 2 | | 2 | | – | | | – | | – | | 3 | | 3 | | – | |
| Actuarial gains/(losses) | | 168 | | 46 | | | (18 | ) | | 196 | | – | | | | (1,691 | ) | | | (614 | ) | | | (134 | ) | | | (2,439 | ) | | – | |
| Employer contributions | | 397 | | 8 | | 99 | | 504 | | 41 | | | 340 | | 10 | | 93 | | 443 | | 44 | |
| Scheme participants’ contributions | | 38 | | – | | 5 | | 43 | | 3 | | | 33 | | – | | 5 | | 38 | | 9 | |
| Benefits paid | | | (253 | ) | | | (115 | ) | | | (49 | ) | | | (417 | ) | | | (44 | ) | | | (282 | ) | | | (126 | ) | | | (60 | ) | | | (468 | ) | | | (53 | ) |
| | | | | | | | | | | | | | | | | | | | | |
| Assets at 31st December 2007 | | 7,293 | | 2,004 | | 885 | | 10,182 | | – | | |
| Assets at 31st December 2008 | | | 6,135 | | 2,016 | | 1,137 | | 9,288 | | – | |
| Exchange adjustments | | – | | 598 | | 298 | | 896 | | – | | | – | | | (221 | ) | | | (93 | ) | | | (314 | ) | | – | |
| Expected return on assets | | 442 | | 144 | | 47 | | 633 | | – | | | 347 | | 121 | | 46 | | 514 | | – | |
| Settlements and curtailments | | – | | – | | 3 | | 3 | | – | | | – | | – | | | (51 | ) | | | (51 | ) | | – | |
| Actuarial losses | | | (1,691 | ) | | | (614 | ) | | | (134 | ) | | | (2,439 | ) | | – | | | 729 | | 122 | | 19 | | 870 | | – | |
| Employer contributions | | 340 | | 10 | | 93 | | 443 | | 44 | | | 594 | | 190 | | 110 | | 894 | | 58 | |
| Scheme participants’ contributions | | 33 | | – | | 5 | | 38 | | 9 | | | 17 | | – | | 8 | | 25 | | 11 | |
| Benefits paid | | | (282 | ) | | | (126 | ) | | | (60 | ) | | | (468 | ) | | | (53 | ) | | | (345 | ) | | | (156 | ) | | | (71 | ) | | | (572 | ) | | | (69 | ) |
| Acquisitions | | | 22 | | – | | 18 | | 40 | | – | |
| | | | | | | | | | | | | | | | | | | | | |
| Assets at 31st December 2008 | | 6,135 | | 2,016 | | 1,137 | | 9,288 | | – | | |
| Assets at 31st December 2009 | | | 7,499 | | 2,072 | | 1,123 | | 10,694 | | – | |
| Exchange adjustments | | – | | | (221 | ) | | | (93 | ) | | | (314 | ) | | – | | | – | | 66 | | 26 | | 92 | | – | |
| Expected return on assets | | 347 | | 121 | | 46 | | 514 | | – | | | 427 | | 134 | | 51 | | 612 | | – | |
| Settlements and curtailments | | – | | – | | | (51 | ) | | | (51 | ) | | – | | |
| Actuarial gains | | 729 | | 122 | | 19 | | 870 | | – | | | 454 | | 106 | | | (8 | ) | | 552 | | – | |
| Employer contributions | | 594 | | 190 | | 110 | | 894 | | 58 | | | 531 | | 175 | | 108 | | 814 | | 60 | |
| Scheme participants’ contributions | | 17 | | – | | 8 | | 25 | | 11 | | | 20 | | – | | 8 | | 28 | | 13 | |
| Benefits paid | | | (345 | ) | | | (156 | ) | | | (71 | ) | | | (572 | ) | | | (69 | ) | | | (313 | ) | | | (243 | ) | | | (80 | ) | | | (636 | ) | | | (73 | ) |
| Acquisitions | | 22 | | – | | 18 | | 40 | | – | | |
| | | | | | | | | | | | | | | | | | | | | |
| Assets at 31st December 2009 | | 7,499 | | 2,072 | | 1,123 | | 10,694 | | – | | |
| Assets at 31st December 2010 | | | 8,618 | | 2,310 | | 1,228 | | 12,156 | | – | |
| | | | | | | | | | | | | | | | | | | | | |
The UK defined benefit schemes include defined contribution sections with account balances totalling £765£961 million at 31st December 2009 (20082010 (2009 – £553£765 million; 20072008 – £693£553 million).
During 2009,2010, the Group made special funding contributions to the UK pension schemes totalling £365 million (2009 – £332 million; 2008 – £200 million) and £91 million and(2009 – £95 millionmillion; 2008 – £nil) to the US scheme (2008 – £200 million to the UK pension schemes).scheme. In 2009, GSK reached an agreement with the trustees of the UK pension schemes to make additional contributions to eliminate the pension deficit identified at the 31st December 2008 actuarial funding valuation. The additional contributions are expected to be £365 million per year for 20102011 to 2013. The contributions are based on a discount rate of 5.25% and an inflation assumption of 2.8%. The next review of contribution levels is expected to be at the 31st December 2011 actuarial valuation although the Group has agreed to review mortality assumptions before then which could result in an earlier revision to contributions.valuation.
Employer contributions for 2010,2011, including special funding contributions, are estimated to be approximately £800 million in respect of defined benefit pension schemes and £60£65 million in respect of post-retirement benefits.
GSK Annual Report 20092010
147
135
Notes to the financial statements
28Pensions and other post-employment benefitscontinued
| | | | | | | | | | | | | | | |
| | | | | | |
| | | | | | | | | | | | | | | | | | | | | | | Post-retirement | |
| | | Post-retirement | | | Pensions | | benefits | |
| | | Pensions | | benefits | | | | | | | | |
| | | UK | | USA | | Rest of World | | Group | | Group | | | UK | | USA | | Rest of World | | Group | | Group | |
| History of experience gains and losses | | £m | | £m | | £m | | £m | | £m | | | £m | | £m | | £m | | £m | | £m | |
2010 | | |
| Experience gains/(losses) of scheme assets | | | 454 | | 106 | | | (8 | ) | | 552 | |
| Percentage of scheme assets at 31st December 2010 | | | | 5 | % | | | 5 | % | | | 1 | % | | | 5 | % | |
| | | | | | | | | | | | | |
| | | |
| Experience (losses)/gains of scheme liabilities | | | | (45 | ) | | 5 | | | (3 | ) | | | (43 | ) | | | (14 | ) |
| Percentage of scheme obligations at 31st December 2010 | | | – | | – | | – | | – | | | 1 | % |
| | | | | | | | | | | | |
| | | |
| Fair value of assets | | | 8,618 | | 2,310 | | 1,228 | | 12,156 | | – | |
| Present value of scheme obligations | | | | (9,119 | ) | | | (2,781 | ) | | | (1,479 | ) | | | (13,379 | ) | | | (1,459 | ) |
| | | | | | | | | | | | |
| Deficits in the schemes | | | | (501 | ) | | | (471 | ) | | | (251 | ) | | | (1,223 | ) | | | (1,459 | ) |
| | | | | | | | | | | | |
| | | | | | | | | | | | |
2009 | | |
| Experience gains of scheme assets | | 729 | | 122 | | 19 | | 870 | | | 729 | | 122 | | 19 | | 870 | |
| Percentage of scheme assets at 31st December 2009 | | | 10 | % | | | 6 | % | | | 2 | % | | | 8 | % | | | | 10 | % | | | 6 | % | | | 2 | % | | | 8 | % | |
| | | | | | | | | | | | | | | | | | | | |
| | | |
| Experience gains/(losses) of scheme liabilities | | 162 | | | (27 | ) | | | (15 | ) | | 120 | | 6 | | | 162 | | | (27 | ) | | | (15 | ) | | 120 | | 6 | |
| Percentage of scheme obligations at 31st December 2009 | | | 2 | % | | | 1 | % | | | 1 | % | | | 1 | % | | – | | | | 2 | % | | | 1 | % | | | 1 | % | | | 1 | % | | – | |
| | | | | | | | | | | | | | | | | | | | |
| | | |
| Fair value of assets | | 7,499 | | 2,072 | | 1,123 | | 10,694 | | – | | | 7,499 | | 2,072 | | 1,123 | | 10,694 | | _ | |
| Present value of scheme obligations | | | (8,446 | ) | | | (2,628 | ) | | | (1,364 | ) | | | (12,438 | ) | | | (1,253 | ) | | | (8,446 | ) | | | (2,628 | ) | | | (1,364 | ) | | | (12,438 | ) | | | (1,253 | ) |
| | | | | | | | | | | | | | | | | | | | | |
| Deficits in the schemes | | | (947 | ) | | | (556 | ) | | | (241 | ) | | | (1,744 | ) | | | (1,253 | ) | | | (947 | ) | | | (556 | ) | | | (241 | ) | | | (1,744 | ) | | | (1,253 | ) |
| | | | | | | | | | | | | | | | | | | | |
| | | |
2008 | | |
| Experience losses of scheme assets | | | (1,691 | ) | | | (614 | ) | | | (134 | ) | | | (2,439 | ) | | | | (1,691 | ) | | | (614 | ) | | | (134 | ) | | | (2,439 | ) | |
| Percentage of scheme assets at 31st December 2008 | | | 28 | % | | | 30 | % | | | 12 | % | | | 26 | % | | | | 28 | % | | | 30 | % | | | 12 | % | | | 26 | % | |
| | | | | | | | | | | | | | | | | | | | |
| | | |
| Experience (losses)/gains of scheme liabilities | | | (148 | ) | | 2 | | 1 | | | (145 | ) | | | (14 | ) | | | (148 | ) | | 2 | | 1 | | | (145 | ) | | | (14 | ) |
| Percentage of scheme obligations at 31st December 2008 | | | 2 | % | | – | | – | | | 1 | % | | | 1 | % | | | 2 | % | | – | | – | | | 1 | % | | | 1 | % |
| | | | | | | | | | | | | | | | | | | | |
| | | |
| Fair value of assets | | 6,135 | | 2,016 | | 1,137 | | 9,288 | | – | | | 6,135 | | 2,016 | | 1,137 | | 9,288 | | – | |
| Present value of scheme obligations | | | (6,885 | ) | | | (2,738 | ) | | | (1,357 | ) | | | (10,980 | ) | | | (1,354 | ) | | | (6,885 | ) | | | (2,738 | ) | | | (1,357 | ) | | | (10,980 | ) | | | (1,354 | ) |
| | | | | | | | | | | | | | | | | | | | | |
| Deficits in the schemes | | | (750 | ) | | | (722 | ) | | | (220 | ) | | | (1,692 | ) | | | (1,354 | ) | | | (750 | ) | | | (722 | ) | | | (220 | ) | | | (1,692 | ) | | | (1,354 | ) |
| | | | | | | | | | | | | | | | | | | | |
| | | |
2007 | | |
| Experience gains/(losses) of scheme assets | | 168 | | 46 | | | (18 | ) | | 196 | | | 168 | | 46 | | | (18 | ) | | 196 | |
| Percentage of scheme assets at 31st December 2007 | | | 2 | % | | | 2 | % | | | 2 | % | | | 2 | % | | | | 2 | % | | | 2 | % | | | 2 | % | | | 2 | % | |
| | | | | | | | | | | | | | | | | | | | |
| | | |
| Experience gains/(losses) of scheme liabilities | | 33 | | | (30 | ) | | 6 | | 9 | | – | | | 33 | | | (30 | ) | | 6 | | 9 | | – | |
| Percentage of scheme obligations at 31st December 2007 | | – | | | 2 | % | | | 1 | % | | – | | – | | | – | | | 2 | % | | | 1 | % | | – | | – | |
| | | | | | | | | | | | | | | | | | | | |
| | | |
| Fair value of assets | | 7,293 | | 2,004 | | 885 | | 10,182 | | – | | | 7,293 | | 2,004 | | 885 | | 10,182 | | – | |
| Present value of scheme obligations | | | (7,371 | ) | | | (1,945 | ) | | | (1,022 | ) | | | (10,338 | ) | | | (1,019 | ) | | | (7,371 | ) | | | (1,945 | ) | | | (1,022 | ) | | | (10,338 | ) | | | (1,019 | ) |
| | | | | | | | | | | | | | | | | | | | | |
| (Deficits)/surpluses in the schemes | | | (78 | ) | | 59 | | | (137 | ) | | | (156 | ) | | | (1,019 | ) | | | (78 | ) | | 59 | | | (137 | ) | | | (156 | ) | | | (1,019 | ) |
| | | | | | | | | | | | | | | | | | | | |
| | | |
2006 | | |
| Experience gains of scheme assets | | 227 | | 168 | | 26 | | 421 | | | 227 | | 168 | | 26 | | 421 | |
| Percentage of scheme assets at 31st December 2006 | | | 3 | % | | | 9 | % | | | 4 | % | | | 5 | % | | | | 3 | % | | | 9 | % | | | 4 | % | | | 5 | % | |
| | | | | | | | | | | | | | | | | | | | |
| | | |
| Experience (losses)/gains of scheme liabilities | | | (37 | ) | | | (16 | ) | | | (42 | ) | | | (95 | ) | | 17 | | | | (37 | ) | | | (16 | ) | | | (42 | ) | | | (95 | ) | | 17 | |
| Percentage of scheme obligations at 31st December 2006 | | – | | | 1 | % | | | 4 | % | | | 1 | % | | | 2 | % | | – | | | 1 | % | | | 4 | % | | | 1 | % | | | 2 | % |
| | | | | | | | | | | | | | | | | | | | |
| | | |
| Fair value of assets | | 6,554 | | 1,953 | | 741 | | 9,248 | | – | | | 6,554 | | 1,953 | | 741 | | 9,248 | | – | |
| Present value of scheme obligations | | | (7,444 | ) | | | (1,949 | ) | | | (952 | ) | | | (10,345 | ) | | | (1,063 | ) | | | (7,444 | ) | | | (1,949 | ) | | | (952 | ) | | | (10,345 | ) | | | (1,063 | ) |
| | | | | | | | | | | | | | | | | | | | | |
| (Deficits)/surpluses in the schemes | | | (890 | ) | | 4 | | | (211 | ) | | | (1,097 | ) | | | (1,063 | ) | | | (890 | ) | | 4 | | | (211 | ) | | | (1,097 | ) | | | (1,063 | ) |
| | | | | | | | | | | | | | | | | | | | |
| | | |
2005 | | |
| Experience gains of scheme assets | | 647 | | 3 | | 35 | | 685 | | |
| Percentage of scheme assets at 31st December 2005 | | | 11 | % | | – | | | 5 | % | | | 8 | % | | |
| | | | | | | | | | |
| | | |
| Experience losses of scheme liabilities | | | (94 | ) | | | (10 | ) | | | (35 | ) | | | (139 | ) | | | (4 | ) | |
| Percentage of scheme obligations at 31st December 2005 | | | 1 | % | | – | | | 4 | % | | | 1 | % | | – | | |
| | | | | | | | | | |
| | | |
| Fair value of assets | | 5,744 | | 1,976 | | 657 | | 8,377 | | – | | |
| Present value of scheme obligations | | | (7,054 | ) | | | (2,150 | ) | | | (922 | ) | | | (10,126 | ) | | | (1,308 | ) | |
| | | | | | | | | | | | |
| Deficits in the schemes | | | (1,310 | ) | | | (174 | ) | | | (265 | ) | | | (1,749 | ) | | | (1,308 | ) | |
| | | | | | | | | | | | |
GSK Annual Report 20092010
148
136
Notes to the financial statements
28Pensions and other post-employment benefitscontinued
Sensitivity analysis
Effect of changes in assumptions used on the annual defined benefit pension and post-retirement costs or the benefit obligations:
| | | | | |
| | |
| | £m | |
| |
| | | | | |
| A 0.25% decrease in discount rate would have the following approximate effect: | | | | |
| | | | | |
| Increase in annual pension cost | | | 74 | |
| Increase in annual post-retirement benefits cost | | | – | |
| Increase in pension obligation | | | 440472 | |
| Increase in post-retirement benefits obligation | | | 3641 | |
| |
| | | | | |
| A one year increase in life expectancy would have the following approximate effect: | | | | |
| | | | | |
| Increase in annual pension cost | | | 2420 | |
| Increase in annual post-retirement benefits cost | | | 74 | |
| Increase in pension obligation | | | 249305 | |
| Increase in post-retirement benefits obligation | | | 4960 | |
| |
| | | | | |
A 0.25% decrease in expected rates of returnsreturn on assets would have the following approximate effect: | | | | |
| | | | | |
| Increase in annual pension cost | | | 2428 | |
| |
| | | | | |
| A 1% increase in the rate of future healthcare inflation would have the following approximate effect: | | | | |
| | | | | |
| Increase in annual post-retirement benefits cost | | | 21 | |
| Increase in post-retirement benefits obligation | | | 4525 | |
| |
| | | | |
| A 0.25% increase in inflation would have the following approximate effect: | | | | |
| | | | | |
| Increase in annual pension cost | | | 2425 | |
| Increase in pension obligation | | | 316339 | |
| | |
29Other provisions
| | | | | | | | | | | | | | | | | | | | | | | | | | | | | | | | | | | | | | |
| | | Integration | | | | | | | | | | | | | | | | | |
| | | Legal | | Major | | Employee | | and | | | | | | | Integration | | | | | |
| | | and other | | restructuring | | related | | manufacturing | | Other | | | | | Legal | | Major | | Employee | | and | | | | | |
| | | disputes | | programmes | | provisions | | re-organisation | | provisions | | Total | | | and other | | restructuring | | related | | manufacturing | | Other | | | |
| | | £m | | £m | | £m | | £m | | £m | | £m | | | disputes | | programmes | | provisions | | reorganisation | | provisions | | Total | |
| | | | | | | | | | | | | | | £m | | £m | | £m | | £m | | £m | | £m | |
| At 1st January 2009 | | 1,903 | | 652 | | 268 | | 90 | | 186 | | 3,099 | | |
| At 1st January 2010 | | | 2,020 | | 574 | | 241 | | 55 | | 351 | | 3,241 | |
| Exchange adjustments | | | (211 | ) | | | (33 | ) | | | (20 | ) | | | (5 | ) | | | (17 | ) | | | (286 | ) | | 12 | | | (4 | ) | | 6 | | 1 | | 4 | | 19 | |
| Charge for the year | | 667 | | 487 | | 57 | | 1 | | 32 | | 1,244 | | | 4,111 | | 837 | | 39 | | – | | 15 | | 5,002 | |
| Reversed unused | | | (86 | ) | | | (15 | ) | | | (4 | ) | | | (7 | ) | | | (13 | ) | | | (125 | ) | | | (103 | ) | | | (40 | ) | | | (5 | ) | | | (4 | ) | | | (16 | ) | | | (168 | ) |
| Unwinding of discount | | 1 | | 3 | | – | | – | | 7 | | 11 | | | 7 | | 3 | | – | | – | | 8 | | 18 | |
| Utilised | | | (254 | ) | | | (450 | ) | | | (69 | ) | | | (21 | ) | | | (26 | ) | | | (820 | ) | | | (2,047 | ) | | | (610 | ) | | | (35 | ) | | | (17 | ) | | | (19 | ) | | | (2,728 | ) |
| Acquisition of subsidiary | | – | | – | | – | | – | | 17 | | 17 | | |
| Transfer to pensions obligations | | – | | | (72 | ) | | – | | – | | – | | | (72 | ) | | – | | | (110 | ) | | – | | – | | – | | | (110 | ) |
| Reclassifications and other movements | | – | | 2 | | 9 | | | (3 | ) | | 165 | | 173 | | | – | | 24 | | 5 | | | (8 | ) | | | (11 | ) | | 10 | |
| | | | | | | | | | | | | | | | | | | | | | | | | |
| At 31st December 2009 | | 2,020 | | 574 | | 241 | | 55 | | 351 | | 3,241 | | |
| At 31st December 2010 | | | 4,000 | | 674 | | 251 | | 27 | | 332 | | 5,284 | |
| | | | | | | | | | | | | | | | | | | | | | | | |
| | | |
| To be settled within one year | | 1,717 | | 399 | | 31 | | 7 | | 102 | | 2,256 | | | 3,654 | | 512 | | 34 | | 4 | | 176 | | 4,380 | |
| To be settled after one year | | 303 | | 175 | | 210 | | 48 | | 249 | | 985 | | | 346 | | 162 | | 217 | | 23 | | 156 | | 904 | |
| | | | | | | | | | | | | | | | | | | | | | | | | |
| At 31st December 2009 | | 2,020 | | 574 | | 241 | | 55 | | 351 | | 3,241 | | |
| At 31st December 2010 | | | 4,000 | | 674 | | 251 | | 27 | | 332 | | 5,284 | |
| | | | | | | | | | | | | | | | | | | | | | | | | |
GSK Annual Report 20092010
149
137
Notes to the financial statements
29Other provisionscontinued
Legal and other disputes
GSK is involved in a number of legal and other disputes, including notification of possible claims, as set out in Note 44 ‘Legal proceedings’. Provisions for legal and other disputes include amounts relating to USproduct liability, intellectual property, anti-trust, product liability,government investigations, contract terminations, self-insurance, environmental clean-up and property rental.
The charge for the year primarily relates to provisions in relation to the investigation by the US Government into the Group’s former manufacturing site at Cidra, Puerto Rico; product liability and anti-trust litigation relating to Paxil; the investigation by the US Attorney’s Office for the District of Colorado into the Group’s US sales and promotional practices, and product liability cases regardingAvandiaand other products. The discount on thesethe provisions increaseddecreased by £2 million in 2010 (2009 – £5 million in 2009 (2008 – £61 million decrease)increase) and was calculated using risk-adjusted projected cash flows and risk-free rates of return. The movement in 20092010 includes an increasea decrease of £10 million (2009 – £6 million increase) arising from a change in the discount rate in the year. Certain
In respect of product liability claims related to certain products, have athere is sufficient history of claims made and settlements which makes it possible to useenable management to make a reliable estimate of the provision required to cover unasserted claims. In certain cases an IBNR (incurred but not reported) actuarial technique is used to determine a reasonable estimate of the Group’s exposure for unasserted claims in relation to those products. Apart from the IBNR provision, no provisions have been made for unasserted claims.this estimate. The ultimate liability for such matters may vary from the amounts provided and is dependent upon the outcome of litigation proceedings, investigations and possible settlement negotiations.
It is in the nature of the Group’s business that a number of these matters, including those provided using the IBNR actuarial technique, may be the subject of negotiation and litigation over several years. The largest individual amounts provided are expected to be settled within three years.
At 31st December 2009,2010, it is expected that £97£117 million
(2008 (2009 – £112£97 million) of the provision made for legal and other disputes will be reimbursed by third party insurers. This amount is included within ’other‘Other receivables’ in Note 22, ‘Other non-current assets’ and Note 24, ‘Trade and other receivables’. For a discussion of legal issues, see Note 44 ‘Legal proceedings’.
Major restructuring programmes
In October 2007 GSK announced a significant new Operational Excellence programme to improve the effectiveness and productivity of its operations (see Note 7 ‘Major restructuring programme’). A significant expansion of the Operational Excellence programme was approved by the Board and announced in February 2009. A further expansion was approved by the Board and announced in February 2010.
Provisions for staff severance payments are made when management has made a formal decision to eliminate certain positions and this has been communicated to the groups of employees affected. No provision is made for staff severance payments that are made immediately.
Pension augmentations arising from staff redundancies of £110 million (2009 – £72 millionmillion) have been charged during the year and then transferred to the pension obligations provision as shown in Note 28 ‘Pensions and other post-employment benefits’. Asset write-downs have been recognised as impairments of property, plant and equipment in Note 17 ‘Property, plant and equipment’.
The majority of the amounts provided are expected to be utilised in the next two years.Employee related provisions
Employee related provisions includes the exchange offer incentive programme which operated at the time of the merger to encourage staff to convert Glaxo Wellcome or SmithKline Beecham share options into GlaxoSmithKline share options. The incentive is paid either when employees exercise the relevant options, or when the options lapse, up to 2010. There is no impact of discounting on this provision in 2009 (2008 – £nil), which was calculated using risk-free rates of return. The Group also providesinclude certain medical benefits to disabled employees and their spouses in the USA. At 31st December 2009,2010, the provision for these benefits amounted to £120 million (2009 – £118 million.million). Other employee benefits reflect a variety of provisions for severance costs, jubilee awards and other long-service benefits.
Integration and manufacturing re-organisationreorganisation
Provisions for integration and manufacturing re-organisationsreorganisations reflect costs related to ongoing restructuring programmes not included within the costs disclosed in Note 7, ‘Major restructuring programmes’.
Other provisions
The Group has recognisedIncluded in other provisions is contingent consideration in respect of thebusiness acquisitions, principally of Bristol Myers Squibb Pakistan (Private) Limited and Stiefel Laboratories Inc. as described in Note 38 ‘Acquisitions and disposals’.2009. The contingent consideration is payable upon certain criteria being met by certain specified dates in the future. The initial recognition of these provisions are included within ‘reclassifications and other movements’. The aggregate provision for these items amounts to £161£164 million at 31st December 2009.2010 (2009 – £161 million).
GSK Annual Report 20092010
150
138
Notes to the financial statements
3030Other non-current liabilities
| | | | | | | | | | |
| | | | | | | | | | | | | |
| | | 2009 | | 2008 | | | 2010 | | 2009 | |
| | | £m | | £m | | | £m | | £m | |
| | | | | | | | | |
| Accruals and deferred income | | 124 | | 96 | | | 103 | | 124 | |
| Other payables | | 481 | | 331 | | | 491 | | 481 | |
| | | | | | | | | |
| | | 605 | | 427 | | | 594 | | 605 | |
| | | | | | | | | |
3131Contingent liabilities
At 31st December 2009,2010, contingent liabilities, comprising guarantees, discounted bills and other items arising in the normal course of business, amounted to £150£165 million (2008(2009 – £134£150 million). At 31st December 2009,2010, £4 million (2009 – £9 million (2008 – £12 million) of financial assets were pledged as collateral for contingent liabilities. For discussions of tax and legal issues, refer to Note 14, ‘Taxation’ and Note 44, ‘Legal proceedings’.
3232Net debt
| | | | | | | | | | | | |
| | | | | | | | | | | | | | | | | | | | |
| | | 2009 | | 2008 | | | 2010 | | 2009 | |
| | | Listing exchange | | £m | | £m | | | Listing exchange | | £m | | £m | |
| | | | | | | | | | | | |
| Current assets: | | | | | | | | | | | |
| Liquid investments | | 268 | | 391 | | | | | | 184 | | | | 268 | |
| Cash and cash equivalents | | 6,545 | | 5,623 | | | | | | 6,057 | | | | 6,545 | |
| | | | | | | | | | | |
| | | 6,813 | | 6,014 | | | | | | 6,241 | | | | 6,813 | |
| | | | | | | | | | | | | | |
| Short-term borrowings: | | | | | | | | | | | |
3.25% € European Medium Term Note 2009 | | London Stock Exchange | | – | | | (481 | ) | |
| US$ Floating Rate Note 2010 | | New York Stock Exchange | | | (621 | ) | | – | | | New York Stock Exchange | | | – | | | | (621 | ) |
| Commercial paper | | | (621 | ) | | – | | | | | | – | | | | (621 | ) |
| Bank loans and overdrafts | | | (182 | ) | | | (426 | ) | | | | | (259 | ) | | | (182 | ) |
| Loan stock | | | (7 | ) | | – | | | | | | – | | | | (7 | ) |
| Other loans | | – | | | (1 | ) | |
| Obligations under finance leases | | | (40 | ) | | | (48 | ) | | | | | (32 | ) | | | (40 | ) |
| | | | | | | | | | | |
| | | | (1,471 | ) | | | (956 | ) | | | | | (291 | ) | | | (1,471 | ) |
| | | | | | | | | | | |
| Long-term borrowings: | | | | | | | | | | | |
| US$ Floating rate Note 2010 | | New York Stock Exchange | | – | | | (694 | ) | |
3.00% € European Medium Term Note 2012 | | London Stock Exchange | | | (662 | ) | | | (718 | ) | | London Stock Exchange | | | (640 | ) | | | (662 | ) |
5.125% € European Medium Term Note 2012 | | London Stock Exchange | | | (1,985 | ) | | | (2,154 | ) | | London Stock Exchange | | | (1,919 | ) | | | (1,985 | ) |
| 4.85% US$ US Medium Term Note 2013 | | New York Stock Exchange | | | (1,548 | ) | | | (1,728 | ) | | New York Stock Exchange | | | (1,599 | ) | | | (1,548 | ) |
| 4.375% US$ US Medium Term Note 2014 | | London Stock Exchange | | | (990 | ) | | | (1,146 | ) | | London Stock Exchange | | | (1,049 | ) | | | (990 | ) |
3.875% € European Medium Term Note 2015 | | London Stock Exchange | | | (1,404 | ) | | – | | | London Stock Exchange | | | (1,358 | ) | | | (1,404 | ) |
5.625% € European Medium Term Note 2017 | | London Stock Exchange | | | (1,100 | ) | | | (1,193 | ) | | London Stock Exchange | | | (1,062 | ) | | | (1,100 | ) |
| 5.65% US$ US Medium Term Note 2018 | | New York Stock Exchange | | | (1,701 | ) | | | (1,901 | ) | | New York Stock Exchange | | | (1,756 | ) | | | (1,701 | ) |
4.00% € European Medium Term Note 2025 | | London Stock Exchange | | | (653 | ) | | | (709 | ) | | London Stock Exchange | | | (632 | ) | | | (653 | ) |
| 5.25% £ European Medium Term Note 2033 | | London Stock Exchange | | | (979 | ) | | | (979 | ) | | London Stock Exchange | | | (981 | ) | | | (979 | ) |
| 5.375% US$ US Medium Term Note 2034 | | London Stock Exchange | | | (308 | ) | | | (344 | ) | | London Stock Exchange | | | (318 | ) | | | (308 | ) |
| 6.375% US$ US Medium Term Note 2038 | | New York Stock Exchange | | | (1,689 | ) | | | (1,888 | ) | | New York Stock Exchange | | | (1,744 | ) | | | (1,689 | ) |
| 6.375% £ European Medium Term Note 2039 | | London Stock Exchange | | | (693 | ) | | | (693 | ) | | London Stock Exchange | | | (694 | ) | | | (693 | ) |
| 5.25% £ European Medium Term Note 2042 | | London Stock Exchange | | | (984 | ) | | | (984 | ) | | London Stock Exchange | | | (985 | ) | | | (984 | ) |
| Loan stock | | – | | | (8 | ) | |
| Bank loans | | – | | | (1 | ) | | | | | (1 | ) | | | – | |
| Other loans and private financing | | – | | | (3 | ) | |
| Obligations under finance leases | | | (90 | ) | | | (88 | ) | | | | | (71 | ) | | | (90 | ) |
| | | | | | | | | | | |
| | | | (14,786 | ) | | | (15,231 | ) | | | | | (14,809 | ) | | | (14,786 | ) |
| | | | | | | | | | | |
| Net debt | | | (9,444 | ) | | | (10,173 | ) | | | | | (8,859 | ) | | | (9,444 | ) |
| | | | | | | | | | | |
GSK Annual Report 20092010
151
139
Notes to the financial statements
3232Net debtcontinued
Current assets
Liquid investments are classified as available-for-sale investments. At 31st31st December 2009,2010, they included US Treasury notesNotes and other government bonds. The effective interest rate on liquid investments at 31st31st December 20092010 was approximately 4.6% (20081.6% (2009 – approximately 5.5%4.6%). Liquid investment balances at 31st31st December 20092010 earning interest at floating and fixed rates amount to £1£2 million and £267£182 million respectively (2008(2009 – £1 million and £390£267 million).
The effective interest rate on cash and cash equivalents at 31st31st December 20092010 was approximately 0.7% (20081.3% (2009 – approximately 1.8%0.7%). Cash and cash equivalents balances at 31st31st December 20092010 earning interest at floating and fixed rates amount to £5,752 million and £166 million respectively (2009 – £6,372 million and £17 million, respectively (2008 – £5,520 million and £4 million).
GSK’s policy regarding the credit quality of cash and cash equivalents is referred to in Note 41, ‘Financial instruments and related disclosures’.
Short-term borrowings
Commercial paper comprisesGSK has a US $10 billion (£6.4 billion) commercial paper programme, of which none was in issue at 31st December 2010 (2009 – $1 billion (£621 million) was in issue at 31st December 2009 (2008 – $nil (£nil)), backed up by and committed facilities of 364 days duration of $3.9 billion (£2.42.5 billion) (2008(2009 – $3.9 billion (£2.72.4 billion)) renewable annually, and liquid investments, cash and cash equivalents as shown in the table above.
The weighted average interest rate on current bank loans and overdrafts at 31st31st December 20092010 was 4.8% (20084.5% (2009 – 1.59%4.8%).
Long-term borrowings
At the year-end, GSK had long-term borrowings of £14.8 billion (2008(2009 – £15.2£14.8 billion) of which £9.5£8.2 billion (2008(2009 – £9.8£9.5 billion) falls due in more than five years. The average effective interest rate of all notes at 31st December 2010 was approximately 5.2% (2009 – approximately 5.3%).
Long-term borrowings repayable after five years carry interest at effective rates between 3.88%3.92% and 6.38%6.46%. The repayment dates range from 20152017 to 2042. The average effective interest rate of all notes at 31st December 2009 was approximately 4.9% (2008 – approximately 5.0%).
Secured liabilities
GSK had no loans secured by charges on non-current and current assets in the year (2008(2009 – £nil). The Group has pledged investments in US Treasury Notes with a par value of $107 million (£69 million) (2009 – $103 million (2008 – $198(£64 million)) as security against irrevocable letters of credit issued on the Group’s behalf in respect of the Group’s self-insurance activity. Provisions in respect of self-insurance are included within the provisions for legal and other disputes discussed in Note 29, ‘Other provisions’.
| | | | | | | |
| | | | | | | | | | |
| | | 2009 | | 2008 | | | 2010 | | 2009 | |
| Finance lease obligations | | £m | | £m | | | £m | | £m | |
| | | | | | | | | |
| Rental payments due within one year | | 44 | | 53 | | | 37 | | 44 | |
| Rental payments due between one and two years | | 38 | | 39 | | | 32 | | 38 | |
| Rental payments due between two and three years | | 26 | | 30 | | | 21 | | 26 | |
| Rental payments due between three and four years | | 16 | | 17 | | | 13 | | 16 | |
| Rental payments due between four and five years | | 6 | | 6 | | | 8 | | 6 | |
| Rental payments due after five years | | 16 | | 9 | | | 8 | | 16 | |
| | | | | | | | | |
| Total future rental payments | | 146 | | 154 | | | 119 | | 146 | |
| Future finance charges | | | (16 | ) | | | (18 | ) | | | (16 | ) | | | (16 | ) |
| | | | | | | | | |
| Total finance lease obligations | | 130 | | 136 | | | 103 | | 130 | |
| | | | | | | | | |
Finance lease obligations at 31st31st December 20092010 bearing interest at floating and fixed rates amount to £70 million and £33 million, respectively (2009 – £89 million and £41 million, respectively (2008 – £98 million and £38 million).
GSK Annual Report 20092010
152
140
Notes to the financial statements
3333Share capital and share premium account
| | | | | | | | | | | | | | | |
| | | Share | | | | | | | |
| | | Ordinary Shares of 25p each | | premium | | | Share | |
| | | Number | | £m | | £m | | | Ordinary Shares of 25p each | | premium | |
| | | | | | | | | Number | | £m | | £m | |
| | | | | | | |
Share capital authorised | | |
At 31st December 2007 | | 10,000,000,000 | | 2,500 | | |
At 31st December 2008 | | 10,000,000,000 | | 2,500 | | |
At 31st December 2009 | | 10,000,000,000 | | 2,500 | | |
| | | | | | |
| At 31st December 2008 | | | 10,000,000,000 | | 2,500 | |
| At 31st December 2009 | | | 10,000,000,000 | | 2,500 | |
| At 31st December 2010 | | | 10,000,000,000 | | 2,500 | |
| | | | | | | |
Share capital issued and fully paid | | |
At 1st January 2007 | | 5,991,601,848 | | 1,498 | | 858 | | |
| At 1st January 2008 | | | 6,012,587,026 | | 1,503 | | 1,266 | |
| Issued under share option schemes | | 37,307,678 | | 9 | | 408 | | | 5,640,119 | | 2 | | 60 | |
| Share capital purchased and cancelled | | | (16,322,500 | ) | | | (4 | ) | | – | | | | (356,910,908 | ) | | | (90 | ) | | – | |
| | | | | | | | | | | | | |
| | |
At 31st December 2007 | | 6,012,587,026 | | 1,503 | | 1,266 | | |
| Issued under share option schemes | | 5,640,119 | | 2 | | 60 | | |
| Share capital purchased and cancelled | | | (356,910,908 | ) | | | (90 | ) | | – | | |
| | | | | | | | |
| | |
At 31st December 2008 | | 5,661,316,237 | | 1,415 | | 1,326 | | |
| At 31st December 2008 | | | 5,661,316,237 | | 1,415 | | 1,326 | |
| Issued under share option schemes | | 3,812,482 | | 1 | | 42 | | | 3,812,482 | | 1 | | 42 | |
| | | | | | | | | | | | | |
At 31st December 2009 | | 5,665,128,719 | | 1,416 | | 1,368 | | |
| At 31st December 2009 | | | 5,665,128,719 | | 1,416 | | 1,368 | |
| Issued under share option schemes | | | 5,329,458 | | 2 | | 60 | |
| | | | | | | | | | | | | |
| At 31st December 2010 | | | 5,670,458,177 | | 1,418 | | 1,428 | |
| | | | | | | | |
| | | | | | | | |
| | | | | | | | | | | |
| | | 31st December | | 31st December | | | 31st December | | 31st December | |
| | | 2009 | | 2008 | | | 2010 | | 2009 | |
| | | | | | | | | |
| Number (‘000) of shares issuable under outstanding options (Note 42) | | 213,110 | | 220,459 | | | 207,132 | | 213,110 | |
| | | | | | | | | |
| Number (‘000) of unissued shares not under option | | 4,121,761 | | 4,118,225 | | | 4,122,410 | | 4,121,761 | |
| | | | | | | | | |
At 31st December 2009,2010, of the issued share capital, 117,735,257105,472,070 shares were held in the ESOP Trust, 474,194,158 shares were held as Treasury shares and 5,073,199,3045,090,791,949 shares were in free issue. All issued shares are fully paid. The nominal, carrying and market values of the shares held in the ESOP Trust are disclosed in Note 42, ‘Employee share schemes’.
The company did not makepurchase any purchases of its own shares in 2009. There have been no2010. On 3rd February 2011, GSK announced that it would commence a new long-term share buy-back programme and expected to repurchase £1-2 billion of shares, depending on market conditions and other factors, in 2011. The exact amount and timing of purchases since 31st December 2009. GSK does not expectand whether the shares will be held as Treasury shares or be cancelled will be determined by the company and is dependent on market conditions and other factors. No shares were purchased in the period 1st January 2011 to make significant share repurchases in 2010.3rd February 2011. In the period 4th February 2011 to 24th February 2011 10.4 million shares were purchased at a cost of £123.4 million.
GSK Annual Report 20092010
153
141
Notes to the financial statements
3434Movements in equity
Retained earnings and other reserves amounted to £7,221£6,041 million at 31st December 2009 (20082010 (2009 – £5,190£7,221 million; 20072008 – £6,834£5,190 million) of which £472 million (2009 – £390 million (2008million; 2008 – £391 million; 2007 – £218 million) relates to joint ventures and associated undertakings. The cumulative translation exchange in equity is shown below in the following table:
| | | | | | | | | | | | | | | | | | | | | |
| | | | | | Net translation exchange included in: | | | | |
| | | | | | | | | | | | | | | | | | | Total | |
| | | | | | | Fair value | | | Retained | | | Minority | | | translation | |
| | | | | | | reserve | | | earnings | | | interest | | | exchange | |
| | | | | | | £m | | | £m | | | £m | | | £m | |
| | | | | | | | | | | | | | | | |
| At 1st January 2007 | | | | | | | 9 | | | | (59 | ) | | | (92 | ) | | | (142 | ) |
| Exchange movements on overseas net assets | | | | | | | – | | | | 394 | | | | 17 | | | | 411 | |
| | | | | | | | | | | | | | | | |
| At 31st December 2007 | | | | | | | 9 | | | | 335 | | | | (75 | ) | | | 269 | |
| Exchange movements on overseas net assets | | | | | | | 1 | | | | 952 | | | | 64 | | | | 1,017 | |
| Reclassification of exchange on liquidation of overseas subsidiary | | | | – | | | | 84 | | | | – | | | | 84 | |
| | | | | | | | | | | | | | | | |
| At 31st December 2008 | | | | | | | 10 | | | | 1,371 | | | | (11 | ) | | | 1,370 | |
| Exchange movements on overseas net assets | | | | | | | 1 | | | | (161 | ) | | | (34 | ) | | | (194 | ) |
| Reclassification of exchange on liquidation of overseas subsidiary | | | | – | | | | (44 | ) | | | – | | | | (44 | ) |
| | | | | | | | | | | | | | | | |
| At 31st December 2009 | | | | | | | 11 | | | | 1,166 | | | | (45 | ) | | | 1,132 | |
| | | | | | | | | | | | | | | | |
| |
| The analysis of other reserves is as follows: |
| | | | | | | | | | | | | | | | | | | | | |
| | | ESOP Trust | | | Fair value | | | Cash flow | | | Other | | | | |
| | | shares | | | reserve | | | hedge reserve | | | reserves | | | Total | |
| | | £m | | | £m | | | £m | | | £m | | | £m | |
| | | | | | | | | | | | | | | |
| At 1st January 2007 | | | (1,999 | ) | | | 137 | | | | (3 | ) | | | 1,930 | | | | 65 | |
| Transferred to income and expense in the year on disposals | | | – | | | | (34 | ) | | | – | | | | – | | | | (34 | ) |
| Transferred to income and expense in the year on impairment | | | – | | | | (12 | ) | | | – | | | | – | | | | (12 | ) |
| Net fair value movement in the year | | | – | | | | (42 | ) | | | (4 | ) | | | – | | | | (46 | ) |
| Ordinary Shares purchased and cancelled | | | – | | | | – | | | | – | | | | 4 | | | | 4 | |
| Ordinary Shares acquired by ESOP Trusts | | | (26 | ) | | | – | | | | – | | | | – | | | | (26 | ) |
| Ordinary Shares transferred by ESOP Trusts | | | 116 | | | | – | | | | – | | | | – | | | | 116 | |
| Write-down of shares held by ESOP Trusts | | | 292 | | | | – | | | | – | | | | – | | | | 292 | |
| | | | | | | | | | | | | | | |
| At 31st December 2007 | | | (1,617 | ) | | | 49 | | | | (7 | ) | | | 1,934 | | | | 359 | |
| Transferred to income and expense in the year on disposals | | | – | | | | (32 | ) | | | – | | | | – | | | | (32 | ) |
| Transferred to income and expense in the year on impairment | | | – | | | | (2 | ) | | | – | | | | – | | | | (2 | ) |
| Net fair value movement in the year | | | – | | | | (23 | ) | | | 4 | | | | – | | | | (19 | ) |
| Ordinary Shares purchased and cancelled | | | – | | | | – | | | | – | | | | 90 | | | | 90 | |
| Ordinary Shares acquired by ESOP Trusts | | | (19 | ) | | | – | | | | – | | | | – | | | | (19 | ) |
| Ordinary Shares transferred by ESOP Trusts | | | 10 | | | | – | | | | – | | | | – | | | | 10 | |
| Write-down of shares held by ESOP Trusts | | | 181 | | | | – | | | | – | | | | – | | | | 181 | |
| | | | | | | | | | | | | | | |
| At 31st December 2008 | | | (1,445 | ) | | | (8 | ) | | | (3 | ) | | | 2,024 | | | | 568 | |
| Transferred to income and expense in the year on disposals | | | – | | | | (40 | ) | | | 1 | | | | – | | | | (39 | ) |
| Transferred to income and expense in the year on impairment | | | – | | | | 40 | | | | – | | | | – | | | | 40 | |
| Net fair value movement in the year | | | – | | | | 30 | | | | (4 | ) | | | – | | | | 26 | |
| Ordinary Shares acquired by ESOP Trusts | | | (57 | ) | | | – | | | | – | | | | – | | | | (57 | ) |
| Ordinary Shares transferred by ESOP Trusts | | | 13 | | | | – | | | | – | | | | – | | | | 13 | |
| Write-down of shares held by ESOP Trusts | | | 351 | | | | – | | | | – | | | | – | | | | 351 | |
| Put option over minority interest | | | – | | | | – | | | | – | | | | (2 | ) | | | (2 | ) |
| | | | | | | | | | | | | | | |
| At 31st December 2009 | | | (1,138 | ) | | | 22 | | | | (6 | ) | | | 2,022 | | | | 900 | |
| | | | | | | | | | | | | | | |
| | | | | | | | | | | | | | | | | |
| | | | | | | | | | | |
| | | Net translation exchange included in: | | | | |
| | | | | | | | | | | Non- | | | Total | |
| | | Fair value | | | Retained | | | controlling | | | translation | |
| | | reserve | | | earnings | | | interests | | | exchange | |
| | | £m | | | £m | | | £m | | | £m | |
| | | | | | | | | | | |
| At 1st January 2008 | | | 9 | | | | 335 | | | | (75 | ) | | | 269 | |
| Exchange movements on overseas net assets | | | 1 | | | | 952 | | | | 64 | | | | 1,017 | |
| Reclassification of exchange on liquidation of overseas subsidiary | | | – | | | | 84 | | | | – | | | | 84 | |
| | | | | | | | | | | |
| At 31st December 2008 | | | 10 | | | | 1,371 | | | | (11 | ) | | | 1,370 | |
| Exchange movements on overseas net assets | | | 1 | | | | (161 | ) | | | (34 | ) | | | (194 | ) |
| Reclassification of exchange on liquidation of overseas subsidiary | | | – | | | | (44 | ) | | | – | | | | (44 | ) |
| | | | | | | | | | | |
| At 31st December 2009 | | | 11 | | | | 1,166 | | | | (45 | ) | | | 1,132 | |
| Exchange movements on overseas net assets | | | – | | | | 145 | | | | 21 | | | | 166 | |
| Reclassification of exchange on liquidation or disposal of overseas subsidiaries | | | – | | | | (2 | ) | | | – | | | | (2 | ) |
| | | | | | | | | | | |
| At 31st December 2010 | | | 11 | | | | 1,309 | | | | (24 | ) | | | 1,296 | |
| | | | | | | | | | | |
The analysis of other reserves is as follows:
| | | | | | | | | | | | | | | | | | | | | |
| | | | | | | | | | | | | | |
| | | ESOP Trust | | | Fair value | | | Cash flow | | | Other | | | | |
| | | shares | | | reserve | | | hedge reserve | | | reserves | | | Total | |
| | | £m | | | £m | | | £m | | | £m | | | £m | |
| | | | | | | | | | | | | | |
| At 1st January 2008 | | | (1,617 | ) | | | 49 | | | | (7 | ) | | | 1,934 | | | | 359 | |
| Transferred to income and expense in the year on disposals | | | – | | | | (32 | ) | | | – | | | | – | | | | (32 | ) |
| Transferred to income and expense in the year on impairment | | | – | | | | (2 | ) | | | – | | | | – | | | | (2 | ) |
| Net fair value movement in the year | | | – | | | | (23 | ) | | | 4 | | | | – | | | | (19 | ) |
| Ordinary Shares purchased and cancelled | | | – | | | | – | | | | – | | | | 90 | | | | 90 | |
| Ordinary Shares acquired by ESOP Trusts | | | (19 | ) | | | – | | | | – | | | | – | | | | (19 | ) |
| Ordinary Shares transferred by ESOP Trusts | | | 10 | | | | – | | | | – | | | | – | | | | 10 | |
| Write-down of shares held by ESOP Trusts | | | 181 | | | | – | | | | – | | | | – | | | | 181 | |
| | | | | | | | | | | | | | |
| At 31st December 2008 | | | (1,445 | ) | | | (8 | ) | | | (3 | ) | | | 2,024 | | | | 568 | |
| Transferred to income and expense in the year on disposals | | | – | | | | (40 | ) | | | 1 | | | | – | | | | (39 | ) |
| Transferred to income and expense in the year on impairment | | | – | | | | 40 | | | | – | | | | – | | | | 40 | |
| Net fair value movement in the year | | | – | | | | 30 | | | | (4 | ) | | | – | | | | 26 | |
| Ordinary Shares acquired by ESOP Trusts | | | (57 | ) | | | – | | | | – | | | | – | | | | (57 | ) |
| Ordinary Shares transferred by ESOP Trusts | | | 13 | | | | – | | | | – | | | | – | | | | 13 | |
| Write-down of shares held by ESOP Trusts | | | 351 | | | | – | | | | – | | | | – | | | | 351 | |
| Put option over non-controlling interest | | | – | | | | – | | | | – | | | | (2 | ) | | | (2 | ) |
| | | | | | | | | | | | | | |
| At 31st December 2009 | | | (1,138 | ) | | | 22 | | | | (6 | ) | | | 2,022 | | | | 900 | |
| Transferred to income and expense in the year on disposals | | | – | | | | (5 | ) | | | 3 | | | | – | | | | (2 | ) |
| Transferred to income and expense in the year on impairment | | | – | | | | 5 | | | | – | | | | – | | | | 5 | |
| Net fair value movement in the year | | | – | | | | 67 | | | | (1 | ) | | | – | | | | 66 | |
| Ordinary Shares acquired by ESOP Trusts | | | (16 | ) | | | – | | | | – | | | | – | | | | (16 | ) |
| Ordinary Shares transferred by ESOP Trusts | | | 17 | | | | – | | | | – | | | | – | | | | 17 | |
| Write-down of shares held by ESOP Trusts | | | 292 | | | | – | | | | – | | | | – | | | | 292 | |
| | | | | | | | | | | | | | |
| At 31st December 2010 | | | (845 | ) | | | 89 | | | | (4 | ) | | | 2,022 | | | | 1,262 | |
| | | | | | | | | | | | | | |
Other reserves include various non-distributable merger and pre-merger reserves amounting to £1,849 million at 31st December 2009 (20082010 (2009 – £1,849 million; 20072008 – £1,849 million). Other reserves also include the capital redemption reserve created as a result of the share buy-back programme amounting to £175 million at 31st December 2009 (20082010 (2009 – £175 million; 20072008 – £85£175 million).
GSK Annual Report 20092010
154
142
Notes to the financial statements
3535Related party transactions
GSK held a 16.8%18.1% interest in Quest Diagnostics Inc. at 31st December 2009 (20082010 (2009 – 18.7%16.8%). The Group and Quest Diagnostics are parties to a long-term contractual relationship under which Quest Diagnostics is the primary provider of clinical laboratory testing to support the Group’s clinical trials testing requirements worldwide. During 2009,2010, Quest Diagnostics provided services of £47£41 million (2008(2009 – £42£47 million) to the Group. At 31st December 2009,2010, the balance payable by GSK to Quest Diagnostics was £10 million (2008(2009 – £nil)£10 million).
In March 2009, 5,749,157 sharesSubsequent to the year-end, GSK sold its entire shareholding in the Group’s associate Quest Diagnostics Inc. were sold forThe sale comprised a cash considerationsecondary public offering and an accompanying repurchase of £178 million, the majority of the shares being sold direct toby Quest Diagnostics Inc. with the remainder being soldwhich together are expected to generate gross proceeds of $1.1 billion (£0.7 billion) after tax.
GSK held a 19% interest in the market.
On 30th November 2009, GSK completed the extension of its strategic relationship with Aspen Pharmacare Holdings Limited by the acquisition of a minority shareholding in the South African based pharmaceutical company. The transaction resulted in GSK acquiring 68.5 million shares in Aspen in consideration for the transfer of certain assets and in Aspen becoming an associate. A gain of £183 million on the transaction is included within other operating income. Atat 31st December 2009, GSK held 81.7 million shares, a2010 (2009 – 19% interest in Aspen.).
During December 2009,2010, GSK distributed £81 million (2009 – £18 millionmillion) of its products through Aspen’s extensive distribution network. At 31st December 2009,2010, the balance due to GSK from Aspen was £22 million (2009 – £18 million (2008 – £nil)million) and the balance payable by GSK to Aspen was £12 million (2009 – £13 million (2008 – £nil)million).
In 2009,2010, both the Group and Shionogi & Co. Ltd. entered into transactions with their 50/50 US joint venture company in support of the research and development activities conducted by that joint venture company. During 2009,2010, GSK provided services to the joint venture of £15£42 million (2008(2009 – £7£15 million). At 31st December 2009,2010, the balance due to GSK from the joint venture was £20 million (2009 – £14 million).
At 31st December 2010, GSK held a 50% interest in ViiV Healthcare Shire Canada, which primarily co-marketsCombivir,TrizivirandEpivirin certain territories. At 31st December 2010, the balance payable by GSK to ViiV Healthcare Canada was £4 million (2008(2009 – £5 million)£nil).
The aggregate compensation of the Directors and CET is given in Note 10, ‘Employee Costs’.
3636Adjustments reconciling profit after tax to operating cash flows
| | | | | | | | | |
| | | | | | | | | | | | | | | | | | | |
| | | 2009 | | 2008 | | 2007 | | | 2010 | | 2009 | | 2008 | |
| | | £m | | £m | | £m | | | £m | | £m | | £m | |
| | | | | | | | | | | | | |
| Profit after tax | | 5,669 | | 4,712 | | 5,310 | | | 1,853 | | 5,669 | | 4,712 | |
| | | |
| Tax on profits | | 2,222 | | 1,947 | | 2,142 | | | 1,304 | | 2,222 | | 1,947 | |
| Share of after tax profits of associates and joint ventures | | | (64 | ) | | | (48 | ) | | | (50 | ) | | | (81 | ) | | | (64 | ) | | | (48 | ) |
| Finance income net of finance costs | | 713 | | 530 | | 191 | | | 715 | | 713 | | 530 | |
| Depreciation | | 1,130 | | 920 | | 796 | | | 1,146 | | 1,130 | | 920 | |
| Amortisation of intangible assets | | 432 | | 311 | | 226 | | | 533 | | 432 | | 311 | |
| Impairment and assets written off | | 445 | | 436 | | 206 | | | 411 | | 445 | | 436 | |
| Profit on sale of intangible assets | | | (835 | ) | | | (170 | ) | | | (5 | ) | | | (118 | ) | | | (835 | ) | | | (170 | ) |
| Profit on sale of investments in associates | | | (115 | ) | | – | | – | | | | (8 | ) | | | (115 | ) | | – | |
| Profit on sale of equity investments | | | (40 | ) | | | (33 | ) | | | (32 | ) | | | (17 | ) | | | (40 | ) | | | (33 | ) |
| Changes in working capital: | | |
| Increase in inventories | | | (132 | ) | | | (411 | ) | | | (457 | ) | |
| (Increase)/decrease in trade receivables | | | (473 | ) | | 519 | | | (77 | ) | |
| (Increase)/decrease in other receivables | | | (134 | ) | | 22 | | | (2 | ) | |
| Decrease/(increase) in inventories | | | 238 | | | (132 | ) | | | (411 | ) |
| Decrease/(increase) in trade receivables | | | 905 | | | (473 | ) | | 519 | |
| Decrease/(increase) in other receivables | | | 6 | | | (134 | ) | | 22 | |
| Increase/(decrease) in trade payables | | 499 | | | (39 | ) | | 9 | | | 154 | | 499 | | | (39 | ) |
| Increase/(decrease) in other payables | | 409 | | | (162 | ) | | | (196 | ) | |
| (Decrease)/increase in pension and other provisions | | | (320 | ) | | 548 | | | (123 | ) | |
| (Decrease)/increase in other payables | | | | (179 | ) | | 409 | | | (162 | ) |
| Increase/(decrease) in pension and other provisions | | | 1,653 | | | (320 | ) | | 548 | |
| Share-based incentive plans | | 179 | | 241 | | 237 | | | 179 | | 179 | | 241 | |
| Other | | | (40 | ) | | | (268 | ) | | | (95 | ) | | | (63 | ) | | | (40 | ) | | | (268 | ) |
| | | | | | | | | | | | | |
| | | 3,876 | | 4,343 | | 2,770 | | | 6,778 | | 3,876 | | 4,343 | |
| | | | | | | | | | | | | |
| | | |
| Cash generated from operations | | 9,545 | | 9,055 | | 8,080 | | | 8,631 | | 9,545 | | 9,055 | |
| | | | | | | | | | | | | |
The increase in pension and other provisions primarily reflects the charge for legal costs in the year of £4.0 billion, partly offset by legal settlements of £2.0 billion and further contributions to the defined benefit pension schemes.
GSK Annual Report 20092010
155
143
Notes to the financial statements
3737Reconciliation of net cash flow to movement in net debt
| | | | | | | | | | | | | | | | | | | | | | | | | | | | | |
| | | | | | | | | | | | | | | | | | | 2009 | | | 2008 | | | 2007 | |
| | | | | | | | | | | | | | | | | | | £m | | | £m | | | £m | |
| | | | | | | | | | | | | | | | | | | | | | | | | |
| Net debt at beginning of year | | | | | | | | | | | | | | | | | | | (10,173 | ) | | | (6,039 | ) | | | (2,450 | ) |
| Increase in cash and bank overdrafts | | | | | | | | | | | 1,054 | | | | 1,148 | | | | 1,411 | |
| Cash (inflow)/outflow from liquid investments | | | | | | | | | | | | | | | | | | | (87 | ) | | | (905 | ) | | | 39 | |
| Net increase in long-term loans | | | | | | | | | | | | | | | | | | | (1,358 | ) | | | (5,523 | ) | | | (3,276 | ) |
| Net repayment of/(increase in) short-term loans | | | | | | | | | | | 102 | | | | 3,059 | | | | (1,632 | ) |
| Net repayment of obligations under finance leases | | | | | | | | | | | 48 | | | | 48 | | | | 39 | |
| Debt of subsidiary undertakings acquired | | | | | | | | | | | (9 | ) | | | – | | | | – | |
| Exchange adjustments | | | | | | | | | | | | | | | | | | | 1,041 | | | | (1,918 | ) | | | (88 | ) |
| Other non-cash movements | | | | | | | | | | | | | | | | | | | (62 | ) | | | (43 | ) | | | (82 | ) |
| | | | | | | | | | | | | | | | | | | | | | | | | |
| Movement in net debt | | | | | | | | | | | | | | | | | | | 729 | | | | (4,134 | ) | | | (3,589 | ) |
| | | | | | | | | | | | | | | | | | | | | | | | | |
| Net debt at end of year | | | | | | | | | | | | | | | | | | | (9,444 | ) | | | (10,173 | ) | | | (6,039 | ) |
| | | | | | | | | | | | | | | | | | | | | | | | | |
| |
| Analysis of changes in net debt | | At 31.12.08 | | | Exchange | | | Other | | | Reclassifications | | | Acquisitions | | | Cash flow | | | At 31.12.09 | |
| | £m | | | £m | | | £m | | | £m | | | £m | | | £m | | | £m | |
| | | | | | | | | | | | | | | | | | | | | |
| Liquid investments | | | 391 | | | | (36 | ) | | | – | | | | – | | | | – | | | | (87 | ) | | | 268 | |
| | | | | | | | | | | | | | | | | | | | | |
| | | | | | | | | | | | | | | | | | | | | | | | | | | | | |
| Cash and cash equivalents | | | 5,623 | | | | (171 | ) | | | – | | | | – | | | | 94 | | | | 999 | | | | 6,545 | |
| Overdrafts | | | (151 | ) | | | 13 | | | | – | | | | – | | | | – | | | | (39 | ) | | | (177 | ) |
| | | | | | | | | | | | | | | | | | | | | |
| | | | 5,472 | | | | (158 | ) | | | – | | | | – | | | | 94 | | | | 960 | | | | 6,368 | |
| | | | | | | | | | | | | | | | | | | | | |
| | | | | | | | | | | | | | | | | | | | | | | | | | | | | |
| Debt due within one year: | | | | | | | | | | | | | | | | | | | | | | | | | | | | |
| Commercial paper | | | – | | | | – | | | | – | | | | – | | | | – | | | | (621 | ) | | | (621 | ) |
| Eurobonds and Medium-Term Notes | | | (481 | ) | | | 69 | | | | (38 | ) | | | (641 | ) | | | – | | | | 470 | | | | (621 | ) |
| Other | | | (324 | ) | | | 33 | | | | (20 | ) | | | (25 | ) | | | (9 | ) | | | 293 | | | | (52 | ) |
| | | | | | | | | | | | | | | | | | | | | |
| | | | (805 | ) | | | 102 | | | | (58 | ) | | | (666 | ) | | | (9 | ) | | | 142 | | | | (1,294 | ) |
| | | | | | | | | | | | | | | | | | | | | |
| | | | | | | | | | | | | | | | | | | | | | | | | | | | | |
| Debt due after one year: | | | | | | | | | | | | | | | | | | | | | | | | | | | | |
| Eurobonds, Medium-Term Notes and private financing | | | (15,131 | ) | | | 1,128 | | | | 24 | | | | 641 | | | | – | | | | (1,358 | ) | | | (14,696 | ) |
| Other | | | (100 | ) | | | 5 | | | | (28 | ) | | | 25 | | | | – | | | | 8 | | | | (90 | ) |
| | | | | | | | | | | | | | | | | | | | | |
| | | | (15,231 | ) | | | 1,133 | | | | (4 | ) | | | 666 | | | | – | | | | (1,350 | ) | | | (14,786 | ) |
| | | | | | | | | | | | | | | | | | | | | |
| Net debt | | | (10,173 | ) | | | 1,041 | | | | (62 | ) | | | – | | | | 85 | | | | (335 | ) | | | (9,444 | ) |
| | | | | | | | | | | | | | | | | | | | | |
| | | | | | | | | | | | | |
| | | | | | | | |
| | | 2010 | | | 2009 | | | 2008 | |
| | | £m | | | £m | | | £m | |
| | | | | | | | |
| Net debt at beginning of year | | | (9,444 | ) | | | (10,173 | ) | | | (6,039 | ) |
| (Decrease)/increase in cash and bank overdrafts | | | (642 | ) | | | 1,054 | | | | 1,148 | |
| Cash inflow from liquid investments | | | (91 | ) | | | (87 | ) | | | (905 | ) |
| Net increase in long-term loans | | | – | | | | (1,358 | ) | | | (5,523 | ) |
| Net repayment of short-term loans | | | 1,290 | | | | 102 | | | | 3,059 | |
| Net repayment of obligations under finance leases | | | 45 | | | | 48 | | | | 48 | |
| Debt of subsidiary undertakings acquired | | | (20 | ) | | | (9 | ) | | | – | |
| Exchange adjustments | | | 61 | | | | 1,041 | | | | (1,918 | ) |
| Other non-cash movements | | | (58 | ) | | | (62 | ) | | | (43 | ) |
| | | | | | | | |
| Movement in net debt | | | 585 | | | | 729 | | | | (4,134 | ) |
| | | | | | | | |
| Net debt at end of year | | | (8,859 | ) | | | (9,444 | ) | | | (10,173 | ) |
| | | | | | | | |
| | | | | | | | | | | | | | | | | | | | | | | | | | | | | |
| | | | | | | | | | | | | | | | | | | | |
| Analysis of changes in net debt | | At 31.12.09 | | | Exchange | | | Other | | | Reclassifications | | | Acquisitions | | | Cash flow | | | At 31.12.10 | |
| | £m | | | £m | | | £m | | | £m | | | £m | | | £m | | | £m | |
| | | | | | | | | | | | | | | | | | | | |
| Liquid investments | | | 268 | | | | 7 | | | | – | | | | – | | | | – | | | | (91 | ) | | | 184 | |
| Cash and cash equivalents | | | 6,545 | | | | 77 | | | | – | | | | – | | | | 12 | | | | (577 | ) | | | 6,057 | |
| Overdrafts | | | (177 | ) | | | 4 | | | | – | | | | – | | | | – | | | | (77 | ) | | | (250 | ) |
| | | | | | | | | | | | | | | | | | | | |
| | | | 6,368 | | | | 81 | | | | – | | | | – | | | | 12 | | | | (654 | ) | | | 5,807 | |
| | | | | | | | | | | | | | | | | | | | |
| | | | | | | | | | | | | | | | | | | | | | | | | | | | | |
| Debt due within one year: | | | | | | | | | | | | | | | | | | | | | | | | | | | | |
| Commercial paper | | | (621 | ) | | | – | | | | – | | | | – | | | | – | | | | 621 | | | | – | |
| Eurobonds and Medium-Term Notes | | | (621 | ) | | | (24 | ) | | | – | | | | – | | | | – | | | | 645 | | | | – | |
| Other | | | (52 | ) | | | (1 | ) | | | (18 | ) | | | (15 | ) | | | (20 | ) | | | 65 | | | | (41 | ) |
| | | | | | | | | | | | | | | | | | | | |
| | | | (1,294 | ) | | | (25 | ) | | | (18 | ) | | | (15 | ) | | | (20 | ) | | | 1,331 | | | | (41 | ) |
| | | | | | | | | | | | | | | | | | | | |
| | | | | | | | | | | | | | | | | | | | | | | | | | | | | |
| Debt due after one year: | | | | | | | | | | | | | | | | | | | | | | | | | | | | |
| Eurobonds, Medium-Term Notes and private financing | | | (14,696 | ) | | | (1 | ) | | | (40 | ) | | | – | | | | – | | | | – | | | | (14,737 | ) |
| Other | | | (90 | ) | | | (1 | ) | | | – | | | | 15 | | | | – | | | | 4 | | | | (72 | ) |
| | | | | | | | | | | | | | | | | | | | |
| | | | (14,786 | ) | | | (2 | ) | | | (40 | ) | | | 15 | | | | – | | | | 4 | | | | (14,809 | ) |
| | | | | | | | | | | | | | | | | | | | |
| Net debt | | | (9,444 | ) | | | 61 | | | | (58 | ) | | | – | | | | (8 | ) | | | 590 | | | | (8,859 | ) |
| | | | | | | | | | | | | | | | | | | | |
For further information on significant changes in net debt see Note 32 ‘Net debt’.
3838Acquisitions and disposals
Details of the acquisition and disposal of subsidiarysignificant subsidiaries and associated undertakings,associates, joint ventures and other businesses are given below:
20092010
Acquisitions
Genelabs Technologies Inc.
Laboratorios Phoenix S.A.C.yF.
On 7th January 2009,10th June 2010, GSK acquired 100% of the Group acquired all of theissued share capital of Genelabs Technologies Inc,Laboratorios Phoenix S.A.C.yF., a California biotechnology company with a strongleading pharmaceutical business focused on the development, marketing and focused portfoliosale of branded generic and over-the-counter products in hepatitis C vaccines.Latin America for cash. The purchase price of £42£174 million included £12£11 million of net cash, £121 million of intangible assets, £72 million of goodwill and cash equivalents, with£30 million of other net liabilities. The goodwill arising on the remainder represented by preliminary net asset valuationsacquisition of £30 million.this business reflects the potential for business synergies and further sales growth through the increase in GSK’s market presence following the acquisition of an established market participant. None of the goodwill recognised is expected to be deductible for income tax purposes.
The results of Phoenix are reported as part of the Emerging Markets operating segment. This transaction has been accounted for by using the purchase method of accounting. Genelabs Technologies Inc. had
The pro-forma results of Laboratorios Phoenix S.A C.yF. for the full year are turnover of £nil£60 million and a loss after tax (before major restructuring) of £8 million for the year, of which turnover of £nil and £8 million of loss after tax related to the period since acquisition and are included in the Group accounts.£2 million.
GSK Annual Report 20092010
156
144
Notes to the financial statements
3838Acquisitions and disposalscontinued
20092010
Acquisitionscontinued
Genelabs Technologies Inc. continuedLaboratorios Phoenix S.A.C.yF.
| | | | | | | | | | | | | |
| | | Book | | | Fair value | | | Fair | |
| | | value | | | adjustment | | | value | |
| | | £m | | | £m | | | £m | |
| | | | | | | |
| Net assets acquired | | | | | | | | | | | | |
| Intangible assets | | | – | | | | 1 | | | | 1 | |
| Property, plant and equipment | | | 2 | | | | – | | | | 2 | |
| Other assets including cash and cash equivalents | | | 14 | | | | – | | | | 14 | |
| Deferred tax asset | | | – | | | | 26 | | | | 26 | |
| Other liabilities | | | (2 | ) | | | – | | | | (2 | ) |
| | | | | | | |
| | | | 14 | | | | 27 | | | | 41 | |
| Goodwill | | | – | | | | 1 | | | | 1 | |
| | | | | | | |
| Total consideration | | | 14 | | | | 28 | | | | 42 | |
| | | | | | | |
Bristol Myers Squibb Pakistan (Private) Limited| | | | | | | | | | | | | |
| | | | | | | | |
| | | | | | | Fair value | | | | |
| | | Book value | | | adjustments | | | Fair value | |
| | | £m | | | £m | | | £m | |
| | | | | | | | |
Net assets acquired | | | | | | | | | | | | |
| Intangible assets | | | – | | | | 121 | | | | 121 | |
| Property, plant and equipment | | | 6 | | | | 10 | | | | 16 | |
| Other assets including cash and cash equivalents | | | 39 | | | | 7 | | | | 46 | |
| Deferred tax provision | | | (1 | ) | | | (41 | ) | | | (42 | ) |
| Other liabilities | | | (27 | ) | | | (12 | ) | | | (39 | ) |
| | | | | | | | |
| | | | 17 | | | | 85 | | | | 102 | |
| Goodwill | | | – | | | | 72 | | | | 72 | |
| | | | | | | | |
| Total consideration | | | 17 | | | | 157 | | | | 174 | |
| | | | | | | | |
On 30th January 2009,Other acquisitions
During the Group acquired all of the share capital of Bristol Myers Squibb Pakistan (Private) Limited and certain associated trademarksyear, GSK completed three smaller subsidiary acquisitions for a consideration of £25 million. As a result, the Group has acquired a portfolio of over 30 well-established pharmaceutical brands, many of which occupy leading market positions in key therapeutic disease areas in Pakistan.cash. The total purchase price of £25£198 million was representedincluded £1 million of net cash.
| | | | | | | | | | | | | |
| | | | | | | | |
| | | | | | | Fair value | | | | |
| | | Book value | | | adjustments | | | Fair value | |
| | | £m | | | £m | | | £m | |
| | | | | | | | |
Net assets acquired | | | | | | | | | | | | |
| Intangible assets | | | 3 | | | | 128 | | | | 131 | |
| Property, plant and equipment | | | 9 | | | | 2 | | | | 11 | |
| Other assets including cash and cash equivalents | | | 20 | | | | 12 | | | | 32 | |
| Deferred tax provision | | | – | | | | (33 | ) | | | (33 | ) |
| Other liabilities | | | (10 | ) | | | – | | | | (10 | ) |
| | | | | | | | |
| | | | 22 | | | | 109 | | | | 131 | |
| Goodwill | | | – | | | | 75 | | | | 75 | |
| Fair value gain recognised on conversion of associate to subsidiary | | | – | | | | (8 | ) | | | (8 | ) |
| | | | | | | | |
| Total consideration | | | 22 | | | | 176 | | | | 198 | |
| | | | | | | | |
If the other acquisitions had been made at the beginning of the year, it is estimated that Group turnover would have increased by provisional valuations£51 million for the year. As some of intangible assetsthe subsidiaries have been fully integrated into the GSK business it is not practicable to separately identify the impact of £8 million, goodwill of £10 million and other net assets of £7 million. the acquisitions on the Group profit for the year.
The goodwill arising on the acquisitionacquisitions reflects the potential for productbusiness synergies and further sales growth throughoutthrough the region andincrease in GSK’s market presence following the acquisition of these established market participants. In addition, goodwill of £13 million was recognised in respect of further consideration for a prior year acquisition. None of the goodwill recognised is expected synergiesto be deductible for income tax purposes.
The results of the Group. This transaction has been accounted for byother acquisitions are reported primarily as part of the purchase methodEmerging Markets reportable operating segment.
The Group recognised a gain of accounting. Bristol Myers Squibb Pakistan (Private) Limited had£8 million as a turnoverresult of £15 million and a profit after tax of £0.3 million for the year, of which £14 million of turnover and £0.4 million of profit after tax relatedmeasuring at fair value an associate held prior to the period since acquisition and are includeddate. This gain is reported as Profit on disposal of interest in associates in the income statement.
Acquisition costs expensed in 2010 arising on other acquisitions totalled £7 million.
GSK Annual Report 2010
157
Notes to the financial statements
38 Acquisitions and disposalscontinued
2010
Acquisitionscontinued
Investments in associates and joint ventures
GSK made cash and non-cash contributions of £24 million in a joint venture in which the Group accounts.has a 50% share, £6 million in a joint venture in which the Group has a 49% share, an investment in an associate of £32 million to increase the Group’s share to 27% and other investments in associates totalling £3 million.
| | | | | | | | | | | | | |
| | | Book | | | Fair value | | | Fair | |
| | | value | | | adjustment | | | value | |
| | | £m | | | £m | | | £m | |
| | | | | | | |
| Net assets acquired | | | | | | | | | | | | |
| Intangible assets | | | 7 | | | | 1 | | | | 8 | |
| Property, plant and equipment | | | 5 | | | | 3 | | | | 8 | |
| Other assets including cash and cash equivalents | | | 6 | | | | – | | | | 6 | |
| Deferred tax provision | | | (1 | ) | | | – | | | | (1 | ) |
| Other liabilities | | | (5 | ) | | | (1 | ) | | | (6 | ) |
| | | | | | | |
| | | | 12 | | | | 3 | | | | 15 | |
| Goodwill | | | – | | | | 10 | | | | 10 | |
| | | | | | | |
| Total consideration | | | 12 | | | | 13 | | | | 25 | |
| | | | | | | |
| | | | | | | | | | | | | | | | | |
| | | | | | | | | | | |
| | | | | | | | | | | Associates | | | | |
| | | | | | | Other | | | and joint | | | | |
| Cash flows | | Phoenix | | | acquisitions | | | ventures | | | Total | |
| | £m | | | £m | | | £m | | | £m | |
| | | | | | | | | | | |
| Total cash consideration | | | 174 | | | | 198 | | | | 61 | | | | 433 | |
| Cash and cash equivalents acquired | | | (11 | ) | | | (1 | ) | | | – | | | | (12 | ) |
| | | | | | | | | | | |
| Cash consideration, net of cash acquired | | | 163 | | | | 197 | | | | 61 | | | | 421 | |
| | | | | | | | | | | |
| | | | | | | | | | | | | | | | | |
| Net cash consideration paid | | | 163 | | | | 191 | | | | 61 | | | | 415 | |
| Deferred consideration | | | – | | | | 6 | | | | – | | | | 6 | |
| | | | | | | | | | | |
| Cash consideration, net of cash acquired | | | 163 | | | | 197 | | | | 61 | | | | 421 | |
| | | | | | | | | | | |
2009
Acquisitions
Certain businesses from UCB S.A.
On 31st March 2009, the Group acquired from UCB S.A. its marketed product portfolio across certain territories in Africa, the Middle East, Asia Pacific and Latin America which includesincluded several leading pharmaceutical brands in a number of disease areas. Subsequent to this date the Group completed further country acquisitions which formed part of the original transaction. The purchase price of £477 million included £5 million of net cash, £445 million of intangible assets, £87 million of goodwill and £60 million of other net liabilities. These are provisional valuations and may change in the future. The goodwill arising on the acquisition of this business reflects the potential for product growth throughout the regions and the expected synergies for the Group. This transaction has been accounted for by the purchase method of accounting.
The transaction included acquisition of both a number of legal entities and product rights that had been previously marketed outside of those entities. The product portfolio acquired has beenwas integrated into the GSK business in the period sinceafter acquisition and it is not therefore practicable to identify the result after tax arising as a result of this transaction for the period of 2009 after acquisition.
PriorDuring 2009, prior to acquisition it is estimated that the product portfolio recorded turnover of £26 million. Since acquisition GSK has recorded turnover of £77 million in 2009 from the products acquired.
| | | | | | | | | | | | | |
| | | | | | | | | | |
| | | Book | | | Fair value | | | Fair | |
| | | value | | | adjustment | | | value | |
| | | £m | | | £m | | | £m | |
| | | | | | | | | | |
| Net assets acquired | | | | | | | | | | | | |
| Intangible assets | | | 417 | | | | 28 | | | | 445 | |
| Property, plant and equipment | | | 1 | | | | – | | | | 1 | |
| Cash and cash equivalents | | | 5 | | | | – | | | | 5 | |
| Deferred tax provision | | | – | | | | (56 | ) | | | (56 | ) |
| Other liabilities | | | (5 | ) | | | – | | | | (5 | ) |
| | | | | | | | | | |
| | | | 418 | | | | (28 | ) | | | 390 | |
| Goodwill | | | – | | | | 87 | | | | 87 | |
| | | | | | | | | | |
| Total consideration | | | 418 | | | | 59 | | | | 477 | |
| | | | | | | | | | |
GSK Annual Report 20092010
158
145
Notes to the financial statements
3838Acquisitions and disposalscontinued
2009
Certain businesses from UCB S.A.Acquisitionscontinued
| | | | | | | | | | | | | |
| | | Book | | | Fair value | | | Fair | |
| | | value | | | adjustment | | | value | |
| | | £m | | | £m | | | £m | |
| | | | | | | |
| Net assets acquired | | | | | | | | | | | | |
| Intangible assets | | | 417 | | | | 28 | | | | 445 | |
| Property, plant and equipment | | | 1 | | | | – | | | | 1 | |
| Cash and cash equivalents | | | 5 | | | | – | | | | 5 | |
| Deferred tax provision | | | – | | | | (56 | ) | | | (56 | ) |
| Other liabilities | | | (5 | ) | | | – | | | | (5 | ) |
| | | | | | | |
| | | | 418 | | | | (28 | ) | | | 390 | |
| Goodwill | | | – | | | | 87 | | | | 87 | |
| | | | | | | |
| Total consideration | | | 418 | | | | 59 | | | | 477 | |
| | | | | | | |
AZ Tika
On 21st April 2009, the Group acquired all of the share capital of AZ Tika, a wholly owned subsidiary of Astra Zeneca plc for a cash consideration of £146 million. As a result, the Group has acquired a number of leading over-the-counter products, predominantly sold in Sweden, includingAlvedon, the country’s leading analgesic treatment. The purchase price of £146 million was represented by intangible assets of £109 million, goodwill of £50 million and other net liabilities of £13 million. The goodwill arising on the acquisition reflects the potential for product growth and the expected synergies for the Group. This transaction has been accounted for by the purchase method of accounting. Prior to acquisition the products acquired were marketed outside the entity acquired. The products acquired have been integrated into the GSK business in the period since acquisition and it is not therefore practicable to identify the result after tax arising as a result of the transaction for the period after acquisition.
Prior to acquisition it is estimated that the product portfolio recorded turnover of £7 million. Since acquisition GSK has recorded turnover of £24 million from the products acquired.
| | | | | | | | | | | | | |
| | | Book | | | Fair value | | | Fair | |
| | | value | | | adjustment | | | value | |
| | | £m | | | £m | | | £m | |
| | | | | | | |
| Net assets acquired | | | | | | | | | | | | |
| Intangible assets | | | 72 | | | | 37 | | | | 109 | |
| Other assets including cash and cash equivalents | | | – | | | | 1 | | | | 1 | |
| Deferred tax provision | | | – | | | | (14 | ) | | | (14 | ) |
| | | | | | | |
| | | | 72 | | | | 24 | | | | 96 | |
| Goodwill | | | – | | | | 50 | | | | 50 | |
| | | | | | | |
| Total consideration | | | 72 | | | | 74 | | | | 146 | |
| | | | | | | |
Stiefel Laboratories, Inc.
On 22nd July 2009, the Group acquired all of the share capital of Stiefel Laboratories, Inc., the world’s largest private dermatological company for a cash consideration of £1,993 million net of cash acquired and including £326 million of debt repaid on acquisition. The purchase price of £2,219 million (including contingent cash consideration of £152 million payable upon certain criteria being met by specified dates in the future) included £74 million of cash and cash equivalents, £1,513 million of intangible assets, £885 million of goodwill, representing the potential for additional growth from the combination of the Stiefel business and GSK’s existing dermatology portfolio, and £253 million of other net liabilities. The purchase price includesincluded potential obligations to make additional payments of up to $300 million (£183 million) depending on the future performance of certain products. These are provisional valuations and may change in the future. Stiefel Laboratories Inc. had a turnover of £547 million and a loss after tax (including restructuring costs) of £103 million for the year ended 31st December 2009, of which £248 million of turnover and £78 million of loss after tax (including restructuring costs) related to the period since acquisition and are included in the Group accounts. SinceIn 2009, since acquisition, Stiefel made an operating profit of £35 million before restructuring costs and intangible assets amortisation.
The new business will provide significant opportunities for both sales and cost synergies. Stiefel’s products will benefit from GSK’s global distribution and commercial organisations, particularly in markets such as Brazil, Russia, India, China and Japan. GSK’s products will benefit from Stiefel’s speciality sales force relationships and experienced management in dermatology.
Cost synergies for the new business are expected primarily from combining manufacturing and administrative functions. As previously reported, GSK expects to deliver annual pre-tax cost savings of up to £155 million by 2012 with restructuring costs of approximately £205 million, of which £71 million was charged in 2009 and the remainder will be incurred over the next two years.million. Excluding restructuring costs, the Stiefel acquisition resulted in a dilution of GSK’s earnings per share of less than 1% in 2009 and is expected to result in an improvement of 1-2% in 2010.
GSK Annual Report 2009
146
Notes to the financial statements
38Acquisitions and disposalscontinued
2009
Stiefel Laboratories, Inc. continued2009.
| | | | | | | | | | | | | |
| | | | | | | | | | |
| | | Book | | | Fair value | | | Fair | |
| | | value | | | adjustment | | | value | |
| | | £m | | | £m | | | £m | |
| | | | | | | | | | |
| Net assets acquired | | | | | | | | | | | | |
| Intangible assets | | | 274 | | | | 1,239 | | | | 1,513 | |
| Property, plant and equipment | | | 111 | | | | – | | | | 111 | |
| Other assets including cash and cash equivalents | | | 210 | | | | 47 | | | | 257 | |
| Deferred tax provision | | | 35 | | | | (331 | ) | | | (296 | ) |
| Other liabilities | | | (251 | ) | | | – | | | | (251 | ) |
| | | | | | | | | | |
| | | | 379 | | | | 955 | | | | 1,334 | |
| Goodwill | | | – | | | | 885 | | | | 885 | |
| | | | | | | | | | |
| Total consideration | | | 379 | | | | 1,840 | | | | 2,219 | |
| | | | | | | | | | |
ViiV Healthcare Limited
On 30th October 2009, GSK acquired Pfizer Inc.’s HIV business and combined it with its own HIV business to form ViiV Healthcare Limited, a sub-group owned 85% by GSK and 15% by Pfizer. The consideration given by GSK, representing 15% of the net value of GSK’s HIV business, contingent consideration and transaction costs, was valued at £383 million. This was represented by £595 million of intangible assets, £172 million of deferred tax liability, £21 million of other net assets, £316 million increase in minoritynon-controlling interests and £255 million of goodwill representing the economies of scale gained from the combination of the two businesses and the potential for growth of both partners’ HIV products within ViiV Healthcare. These are provisional valuations and may change in the future. The minoritynon-controlling interest represents Pfizer’s interest in ViiV Healthcare including the right to preferential dividends based on the sales performance of certain products.
GSK has recognised an accounting gain of £296 million on this transaction arising on the disposal of a 15% interest in GSK’s HIV business to Pfizer recorded at book value, in return for 85% of Pfizer’s HIV business recorded at fair value.
GSK Annual Report 2010
159
Notes to the financial statements
38 Acquisitions and disposalscontinued
2009
Acquisitionscontinued
The acquired Pfizer HIV business had a turnover of £89 million and a loss after tax of £39 million for the year,in 2009, of which, after taking account of the transition status in various territories, £1 million of turnover and £23 million of loss after tax, has beenincluding restructuring costs, was recognised in the Group accounts including restructuring costs.in 2009.
| | | | | | | | | |
| | | | | | | | | | | | | | | |
| | | Book | | Fair value | | Fair | | | Book | | Fair value | | Fair | |
| | | value | | adjustment | | value | | | value | | adjustment | | value | |
| | | £m | | £m | | £m | | | £m | | £m | | £m | |
| | | | | | | | | | | | | |
| Net assets acquired | | |
| Intangible assets | | 13 | | 582 | | 595 | | | 13 | | 582 | | 595 | |
| Other assets including cash and cash equivalents | | 10 | | 11 | | 21 | | | 10 | | 11 | | 21 | |
| Deferred tax provision | | – | | | (172 | ) | | | (172 | ) | | – | | | (172 | ) | | | (172 | ) |
| | | | | | | | | | | | | |
| | | 23 | | 421 | | 444 | | | 23 | | 421 | | 444 | |
| Minority interests | | – | | | (316 | ) | | | (316 | ) | |
| Non-controlling interests | | | – | | | (316 | ) | | | (316 | ) |
| Goodwill | | – | | 255 | | 255 | | | – | | 255 | | 255 | |
| | | | | | | | | | | | | |
| Total consideration | | 23 | | 360 | | 383 | | | 23 | | 360 | | 383 | |
| | | | | | | | | | | | | |
| | | |
| Consideration | | |
| Fair value of assets contributed by GSK | | 328 | | | 328 | |
| Fair value of contingent equity contributed by GSK | | 37 | | | 37 | |
| Direct costs | | 18 | | | 18 | |
| | | | | | | | | | | | | |
| Total consideration | | 383 | | | 383 | |
| | | | | | | | | | | | | |
GSK Annual Report 2009
147Other acquisitions
Notes to the financial statements
38Acquisitions and disposalscontinued
2009
Acquisitions continued
Laboratoire Pharmaceutique Algérien
On 10th November 2009, GSK acquired 100% of the share capital of the Algerian pharmaceutical, manufacturing and distribution group, Laboratoire Pharmaceutique Algérien, for a cash consideration of £26 million net of cash acquired. The purchase price of £29 million included £3 million of cash and cash equivalents, £35 million of goodwill, £15 million of other net liabilities, and a £6 million reductionOther investments in the value of an existing investment. These are provisional valuations and may changeyear included £327 million in the future. The goodwill reflects the potential for business synergies and further sales growth through the increasefive subsidiaries, £16 million in GSK’s market presence following the acquisition of an established market participant. This transaction has been accounted for by the purchase method of accounting. Laboratoire Pharmaceutique Algérien had a turnover of £61 million for the year ended 31st December 2009. The result for the year has not yet been determined but is estimated to be a loss of £25 million. Turnover of £6 million and £1 million of loss related to the period after acquisition are recordedjoint venture in which the Group accounts.
| | | | | | | | | | | | | |
| | | Book | | | Fair value | | | Fair | |
| | | value | | | adjustment | | | value | |
| | | £m | | | £m | | | £m | |
| | | | | | | |
| Net assets acquired | | | | | | | | | | | | |
| Property, plant and equipment | | | 29 | | | | – | | | | 29 | |
| Cash and cash equivalents | | | 3 | | | | – | | | | 3 | |
| Other liabilities | | | (44 | ) | | | – | | | | (44 | ) |
| | | | | | | |
| | | | (12 | ) | | | – | | | | (12 | ) |
| Goodwill | | | – | | | | 35 | | | | 35 | |
| Fair value loss arising on increased investment in LPA Distribution | | | – | | | | 6 | | | | 6 | |
| | | | | | | |
| Total consideration | | | (12 | ) | | | 41 | | | | 29 | |
| | | | | | | |
NovaMin Technology Inc.
On 18th December 2009, GSK acquired 100% of the share capital of NovaMin Technology Inc., a privately held US company for a cash consideration of £87 million. The purchase price included £51 million of intangible assets, £53 million of goodwill and £17 million of net liabilities. These are provisional valuations and may change in the future. The company has a specialty oral care ingredient for the treatment of dentine hypersensitivity50% share and the goodwill arising from the acquisition represents the potential for additional growth from the combination of the company’s technology with specific GSK oral care products. This transaction has been accounted for by the purchase method of accounting. NovaMin Technology Inc. had a turnover of £0.1£20 million and a loss after tax of £0.5 million for the year, ofin an associate in which £nil of turnover and £nil of loss after tax related to the period since acquisition and are included in the Group accounts.has an initial 40% share.
| | | | | | | | | | | | | |
| | | Book | | | Fair value | | | Fair | |
| | | value | | | adjustment | | | value | |
| | | £m | | | £m | | | £m | |
| | | | | | | |
| Net assets acquired | | | | | | | | | | | | |
| Intangible assets | | | 1 | | | | 50 | | | | 51 | |
| Deferred tax provision | | | – | | | | (17 | ) | | | (17 | ) |
| | | | | | | |
| | | | 1 | | | | 33 | | | | 34 | |
| Goodwill | | | – | | | | 53 | | | | 53 | |
| | | | | | | |
| Total consideration | | | 1 | | | | 86 | | | | 87 | |
| | | | | | | |
| | | | | | | | | | | | | | | | | |
| | | | | | | | | | | |
| | | Certain | | | Stiefel | | | | | | | |
| | | businesses | | | Laboratories, | | | | | | | |
| Cash flows | | of UCB S.A. | | | Inc. | | | Other | | | Total | |
| | £m | | | £m | | | £m | | | £m | |
| | | | | | | | | | | |
| Cash consideration | | | 477 | | | | 2,067 | | | | 371 | | | | 2,915 | |
| Cash and cash equivalents acquired | | | (5 | ) | | | (74 | ) | | | (15 | ) | | | (94 | ) |
| | | | | | | | | | | |
| Net cash consideration | | | 472 | | | | 1,993 | | | | 356 | | | | 2,821 | |
| Contingent consideration | | | – | | | | 152 | | | | 2 | | | | 154 | |
| | | | | | | | | | | |
| Net purchase consideration | | | 472 | | | | 2,145 | | | | 358 | | | | 2,975 | |
| | | | | | | | | | | |
If the above acquisitions of subsidiaries had been made at the beginning of the year, it is estimated that Group turnover would have increased by £477 million for the year. As some of the acquisitions have been fully integrated into the GSK business it is not practicable to separately identify the impact of the acquisitions on the Group profit for the year.
Other acquisitions in the year include £16 million invested in Shionogi-GlaxoSmithKline Holdings, L.P., a joint venture in which the Group has a 50% share and £20 million invested in Shenzhen GlaxoSmithKline – Neptunus Biologicals Co., Ltd, an associate in which the Group has an initial 40% share.
| | | | | | | | | | | | | | | | | | | | | | | | | | | | | | | | | | | | | |
| | | | | | | | | | | Certain | | | | | | | Stiefel | | | Laboratoire | | | NovaMin | | | | | | | |
| Cash flows | | | | | | BMS | | | businesses | | | | | | | Laboratories, | | | Pharmaceutique | | | Technology | | | | | | | |
| | Genelabs | | | (Pakistan) | | | of UCB S.A. | | | AZ Tika | | | Inc. | | | Algérien | | | Inc | | | Other | | | Total | |
| | | £m | | | £m | | | £m | | | £m | | | £m | | | £m | | | £m | | | £m | | | £m | |
| | | | | | | | | | | | | | | | | | | | | | | | | | | |
| Cash consideration | | | 42 | | | | 23 | | | | 477 | | | | 146 | | | | 2,067 | | | | 29 | | | | 87 | | | | 44 | | | | 2,915 | |
| Cash and cash equivalents acquired | | | (12 | ) | | | – | | | | (5 | ) | | | – | | | | (74 | ) | | | (3 | ) | | | – | | | | – | | | | (94 | ) |
| | | | | | | | | | | | | | | | | | | | | | | | | | | |
| Net cash consideration | | | 30 | | | | 23 | | | | 472 | | | | 146 | | | | 1,993 | | | | 26 | | | | 87 | | | | 44 | | | | 2,821 | |
| Contingent consideration | | | – | | | | 2 | | | | – | | | | – | | | | 152 | | | | – | | | | – | | | | – | | | | 154 | |
| | | | | | | | | | | | | | | | | | | | | | | | | | | |
| Net purchase consideration | | | 30 | | | | 25 | | | | 472 | | | | 146 | | | | 2,145 | | | | 26 | | | | 87 | | | | 44 | | | | 2,975 | |
| | | | | | | | | | | | | | | | | | | | | | | | | | | |
GSK Annual Report 20092010
160
148
Notes to the financial statements
3838Acquisitions and disposalscontinued
2008
Acquisitionscontinued
Sirtris Pharmaceuticals Inc.
On 5th June 2008, the Group acquired 100% of the issued share capital of Sirtris Pharmaceuticals Inc., a biopharmaceutical company based in Massachusetts, USA for a cash consideration of £376 million. The company is focused on discovering and developing proprietary, orally available, small molecule drugs with the potential to treat diseases associated with ageing, including metabolic diseases such as Type 2 diabetes. Sirtris’ drug candidates are designed to mimic certain beneficial health effects of calorie restriction by activation of sirtuins, a recently discovered class of enzymes that Sirtris believes control the ageing process. This transaction has been accounted for by the purchase method of accounting. The goodwill arising on the acquisition reflects the potential for enabling GSK to enhance its metabolic, neurology, and immuno-inflammation research efforts by establishing a world-leading presence in the sirtuin field, aided by the existence in the company of a highly experienced development team that encompasses all aspects of sirtuin biology. Sirtris Pharmaceuticals Inc. had a turnover of £nil and a loss after tax of £25 million for the year,in 2008, of which £nil of turnover and £14 million of loss after tax related to the period sinceafter acquisition and are included in the Group accounts.accounts in 2008.
| | | | | | | | | | | | | |
| | | | | | | | | | |
| | | Book | | | Fair value | | | Fair | |
| | | value | | | adjustment | | | value | |
| | | £m | | | £m | | | £m | |
| | | | | | | | | | |
| Net assets acquired | | | | | | | | | | | | |
| Intangible assets | | | – | | | | 106 | | | | 106 | |
| Property, plant and equipment | | | 2 | | | | – | | | | 2 | |
| Other assets including cash and cash equivalents | | | 86 | | | | – | | | | 86 | |
| Deferred tax provision | | | – | | | | (21 | ) | | | (21 | ) |
| Other liabilities | | | (39 | ) | | | – | | | | (39 | ) |
| | | | | | | | | | |
| | | | 49 | | | | 85 | | | | 134 | |
| Goodwill | | | – | | | | 242 | | | | 242 | |
| | | | | | | | | | |
| Total consideration | | | 49 | | | | 327 | | | | 376 | |
| | | | | | | | | | |
Bristol Myers Squibb (Egypt)Other acquisitions
On 14th October 2008,Other investments in the year included £140 million in a subsidiary, of which £10 million was deferred, a further £6 million in a joint venture in which the Group acquired the Egyptian mature products business of Bristol Myers Squibb (BMS) forhas a cash consideration of £14050% share and £2 million of this amount £10 million is deferred with payment being made when alternative supply arrangements are established. The Group acquired 20 branded products that occupy leading market positions in four therapeutic disease areasan associate in Egypt, includingDuricef(antibiotic);CapozideandCapoten(ACE inhibitors);Theragran-H(iron supplement) andKenacomb(topical steroid). Total sales of this combined mature products pharmaceuticals business in 2007 were $48.5 million. The Group will also take ownership of BMS’s high quality manufacturing facility in Giza (Greater Cairo) that will continue to supply the acquired products. The Group will have the ability to export generic versions of the acquired products to markets outside of Egypt, thereby creating a further opportunity to drive sales growth in the Middle East and North Africa region and this fact is reflected in the goodwill arising on the acquisition. The business had a turnover of £25 million and a profit after tax of £4 million for the year, of which £4 million of turnover and £0.2 million of profit after tax are related to the period since acquisition and are included in the Group accounts.has a 36.8% holding.
| | | | | | | | | | | | | |
| | | Book | | | Fair value | | | Fair | |
| | | value | | | adjustment | | | value | |
| | | £m | | | £m | | | £m | |
| | | | | | | |
| Net assets acquired | | | | | | | | | | | | |
| Intangible assets | | | – | | | | 65 | | | | 65 | |
| Property, plant and equipment | | | 9 | | | | 9 | | | | 18 | |
| Inventory | | | 5 | | | | – | | | | 5 | |
| | | | | | | |
| | | | 14 | | | | 74 | | | | 88 | |
| Goodwill | | | – | | | | 52 | | | | 52 | |
| | | | | | | |
| Total consideration | | | 14 | | | | 126 | | | | 140 | |
| | | | | | | |
GSK Annual Report 2009
149
Notes to the financial statements
38Acquisitions and disposalscontinued| | | | | | | | | | | | | |
| | | | | | | | |
| Cash flows | | Sirtris | | | Other | | | Total | |
| | £m | | | £m | | | £m | |
| | | | | | | | |
| Cash consideration | | | 376 | | | | 139 | | | | 515 | |
| Cash and cash equivalents acquired | | | (52 | ) | | | – | | | | (52 | ) |
| | | | | | | | |
| Net cash payment on acquisitions | | | 324 | | | | 139 | | | | 463 | |
| | | | | | | | |
If Sirtris and BMS (Egypt)the subsidiaries had been acquired at the beginning of 2008, combined Group turnover for the year would have been £24,373 million and combined Group profit for the year would have been £4,705 million.
| | | | | | | | | | | | | | | | | | | | | | | | | |
| | | | | | | | | | | | | | | Shionogi- | | | | | | | |
| Cash flows | | | | | | | | | | Euclid SR | | | GlaxoSmithKline | | | | | | | |
| | Sirtris | | | BMS (Egypt) | | | Partners LP | | | Holdings, L.P. | | | Other | | | Total | |
| | | £m | | | £m | | | £m | | | £m | | | £m | | | £m | |
| | | | | | | | | | | | | | | | | | |
| Cash consideration | | | 376 | | | | 130 | | | | 2 | | | | 6 | | | | 1 | | | | 515 | |
| Cash and cash equivalents acquired | | | (52 | ) | | | – | | | | – | | | | – | | | | – | | | | (52 | ) |
| | | | | | | | | | | | | | | | | | |
| Net cash payment on acquisitions | | | 324 | | | | 130 | | | | 2 | | | | 6 | | | | 1 | | | | 463 | |
| | | | | | | | | | | | | | | | | | |
Euclid SR Partners, LP
During 2008, an additional £2 million was invested in Euclid SR Partners, LP, an associate in which the Group has a 38.6% share.
Shionogi-GlaxoSmithKline Holdings, L.P.
During 2008, an additional £6 million was invested in Shionogi-GlaxoSmithKline Holdings, L.P., a joint venture in which the Group has a 50% share.
2007
Acquisitions
Reliant Pharmaceuticals Inc.
On 18th December 2007, the Group acquired 100% of the issued share capital of Reliant Pharmaceuticals Inc., a pharmaceutical company based in the USA for a cash consideration of £814 million. The company specialises in the development and marketing of speciality medicines to combat heart disease which includes the US rights toLovaza, a treatment for adult patients with very high levels of triglycerides. This transaction has been accounted for by the purchase method of accounting. The goodwill arising on the acquisition reflects the potential for product growth throughout the USA and Puerto Rico and the expected synergies for the Group. Reliant Pharmaceuticals Inc. had a turnover of £276 million and a profit after tax of £8 million for the year, of which £8 million of turnover and £1 million of profit after tax related to the period since acquisition and are included in the Group accounts.
| | | | | | | | | | | | | |
| | | Book | | | Fair value | | | Fair | |
| | | value | | | adjustment | | | value | |
| | | £m | | | £m | | | £m | |
| | | | | | | |
| Net assets acquired | | | | | | | | | | | | |
| Intangible assets | | | 13 | | | | 600 | | | | 613 | |
| Property, plant and equipment | | | 2 | | | | 4 | | | | 6 | |
| Other assets including cash and cash equivalents | | | 80 | | | | 16 | | | | 96 | |
| Deferred tax provision | | | – | | | | (175 | ) | | | (175 | ) |
| Other liabilities | | | (75 | ) | | | (1 | ) | | | (76 | ) |
| | | | | | | |
| | | | 20 | | | | 444 | | | | 464 | |
| Goodwill | | | – | | | | 350 | | | | 350 | |
| | | | | | | |
| Total consideration | | | 20 | | | | 794 | | | | 814 | |
| | | | | | | |
GSK Annual Report 20092010
161
150
Notes to the financial statements
38Acquisitions and disposalscontinued
Domantis Limited
On 5th January 2007, the Group acquired 100% of the issued share capital of Domantis Limited, a drug discovery company based in the UK for a cash consideration of £234 million. The company is developing the next generation of antibody therapies. This transaction has been accounted for by the purchase method of accounting. The goodwill arising on the acquisition reflects the potential for combining the world-leading technology of Domantis with the development programme already in place within GSK to put the Group at the forefront of biotechnology. Domantis Limited had a turnover of £nil and a loss after tax of £10 million for the year, of which £nil of turnover and £9 million of loss after tax related to the period since acquisition and are included in the Group accounts.
| | | | | | | | | | | | | |
| | | Book | | | Fair value | | | Fair | |
| | | value | | | adjustment | | | value | |
| | | £m | | | £m | | | £m | |
| | | | | | | |
| Net assets acquired | | | | | | | | | | | | |
| Intangible assets | | | – | | | | 51 | | | | 51 | |
| Property, plant and equipment | | | 1 | | | | – | | | | 1 | |
| Other assets including cash and cash equivalents | | | 19 | | | | – | | | | 19 | |
| Deferred tax provision | | | – | | | | (14 | ) | | | (14 | ) |
| Other liabilities | | | (4 | ) | | | – | | | | (4 | ) |
| | | | | | | |
| | | | 16 | | | | 37 | | | | 53 | |
| Goodwill | | | – | | | | 181 | | | | 181 | |
| | | | | | | |
| Total consideration | | | 16 | | | | 218 | | | | 234 | |
| | | | | | | |
Praecis Pharmaceuticals Inc.
On 16th February 2007, the Group acquired 100% of the issued share capital of Praecis Pharmaceuticals, Inc., a biopharmaceutical company based in the USA, for a cash consideration of £39 million. The company has developed a more efficient method of identifying drug leads targeting human disease using proprietary technology. This transaction has been accounted for by the purchase method of accounting. Praecis Pharmaceuticals Inc. had a turnover of £nil and a loss after tax of £11 million for the year, of which £nil of turnover and £9 million of loss after tax related to the period since acquisition and are included in the Group accounts.
| | | | | | | | | | | | | |
| | | Book | | | Fair value | | | Fair | |
| | | value | | | adjustment | | | value | |
| | | £m | | | £m | | | £m | |
| | | | | | | |
| Net assets acquired | | | | | | | | | | | | |
| Intangible assets | | | – | | | | 7 | | | | 7 | |
| Property, plant and equipment | | | 1 | | | | – | | | | 1 | |
| Other assets including cash and cash equivalents | | | 25 | | | | – | | | | 25 | |
| Deferred tax asset | | | – | | | | 10 | | | | 10 | |
| Other liabilities | | | (6 | ) | | | – | | | | (6 | ) |
| | | | | | | |
| | | | 20 | | | | 17 | | | | 37 | |
| Goodwill | | | – | | | | 2 | | | | 2 | |
| | | | | | | |
| Total consideration | | | 20 | | | | 19 | | | | 39 | |
| | | | | | | |
| | | | | | | | | | | | | | | | | | | | | |
| Cash flows | | Reliant | | | Domantis | | | Praecis | | | Other | | | Total | |
| | £m | | | £m | | | £m | | | £m | | | £m | |
| | | | | | | | | | | | | | | |
| Cash consideration | | | 814 | | | | 234 | | | | 39 | | | | 1 | | | | 1,088 | |
| Cash and cash equivalents acquired | | | (20 | ) | | | (16 | ) | | | (24 | ) | | | – | | | | (60 | ) |
| | | | | | | | | | | | | | | |
| Net cash payment on acquisitions | | | 794 | | | | 218 | | | | 15 | | | | 1 | | | | 1,028 | |
| | | | | | | | | | | | | | | |
If Reliant, Domantis and Praecis had been acquired at the beginning of the year, combined Group turnover for the year would have been £22,984 million and combined Group profit for the year would have been £5,314 million.
GSK Annual Report 2009
151
Notes to the financial statements
3939Commitments
| | | | | | | |
| | | | | | | | | | | | |
| Contractual obligations and commitments | | 2009 | | 2008 | | | 2010 | | 2009 | |
| | £m | | £m | | | £m | | £m | |
| | | | | | | | | |
| Contracted for but not provided in the financial statements: | | |
| Intangible assets | | 12,280 | | 13,048 | | | 11,762 | | 12,280 | |
| Property, plant and equipment | | 416 | | 489 | | | 380 | | 416 | |
| Investments | | 86 | | 56 | | | 37 | | 86 | |
| Purchase commitments | | 82 | | 145 | | | 1,127 | | 82 | |
| Business combinations | | – | | 227 | | | 285 | | – | |
| Pensions | | 1,460 | | 597 | | | 1,095 | | 1,460 | |
| Other commitments | | 52 | | 46 | | | 242 | | 52 | |
| Interest on loans | | 10,733 | | 11,868 | | | 10,312 | | 10,733 | |
| Finance lease charges | | 16 | | 18 | | | 16 | | 16 | |
| | | | | | | | | |
| | | 25,125 | | 26,494 | | | 25,256 | | 25,125 | |
| | | | | | | | | |
The commitments related to intangible assets include milestone payments, which are dependent on successful clinical development or on meeting specified sales targets, and which represent the maximum that would be paid if all milestones, however unlikely, are achieved. The amounts are not risk-adjusted or discounted. As the majority of the intangible commitments are denominated in US dollars, the weakening of foreign currencies during the year has led to an decrease in the commitments reported above. A number of commitments were made in 20092010 under licensing and other agreements, including arrangements with ChromaAmicus Therapeutics, Limited, ConcertAmplimmune Inc., Apeiron Biologics AG, Fondazione Telethon, Isis Pharmaceuticals, Inc. and Shionogi & Co., IdenixLimited. These new arrangements were offset by reduced commitments due on prior year transactions including Actelion Pharmaceuticals Limited, Targacept, Inc., Prosensa B.V. and Seattle Genetics, Inc.Neurosearch A/S which were terminated or curtailed during the year.
The commitments relating to business combinations reflect three agreements signed in 2010 but not completed at the balance sheet date.
In 2009, GSK reached an agreement with the trustees of the UK pension schemes to make additional contributions to eliminate the pension deficit identified at the 31st December 2008 actuarial funding valuation. The table above shows this commitment, but excludes the normal ongoing annual funding requirement of approximately £150£130 million.
The Group also has other commitments which principally relate to revenue payments to be made under licences and other alliances.
Commitments in respect of future interest payable on loans are disclosed before taking into account the effect of interest rate swaps.
| | | | | | | |
| | | | | | | | | | | | |
| Commitments under non-cancellable operating leases | | 2009 | | 2008 | | | 2010 | | 2009 | |
| | £m | | £m | | | £m | | £m | |
| | | | | | | | | |
| Rental payments due within one year | | 111 | | 140 | | | 123 | | 111 | |
| Rental payments due between one and two years | | 72 | | 109 | | | 73 | | 72 | |
| Rental payments due between two and three years | | 50 | | 76 | | | 46 | | 50 | |
| Rental payments due between three and four years | | 21 | | 54 | | | 32 | | 21 | |
| Rental payments due between four and five years | | 14 | | 22 | | | 25 | | 14 | |
| Rental payments due after five years | | 69 | | 47 | | | 116 | | 69 | |
| | | | | | | | | |
| Total commitments under non-cancellable operating leases | | 337 | | 448 | | | 415 | | 337 | |
| | | | | | | | | |
4040Post balance sheet events
Subsequent to the year end, GSK completed the acquisition of the three business combinations referred to in Note 39 ‘Commitments’.
Since the year end, GSK has sold its entire shareholding in Quest Diagnostics Inc. The sale comprised a secondary public offering and an accompanying repurchase of shares by Quest Diagnostics which together are expected to generate gross proceeds of $1.1 billion (£0.7 billion) after tax.
On 17th3rd February 2010,2011, GSK receivedannounced that the company has initiated a Complete Response letter fromnew long-term share buy-back programme, and the FDA regardingintention is to repurchase £1-2 billion of shares in 2011, depending on market conditions. In the new drug application forHorizantExtended Release tablets for restless legs syndrome. The letter indicated that questions remained that precluded the approvalperiod 4th February 2011 to 24th February 2011, 10.4 million shares were purchased at a cost ofHorizantfor restless legs syndrome at that time. GSK is evaluating the letter and considering the appropriate next steps. The Group’s intangible assets include £85 million in relation to this compound. It is not yet possible to determine the amount, if any, of any impairment that may be recorded in future periods, pending completion of a full analysis of the situation. £123.4 million.
GSK Annual Report 20092010
162
152
Notes to the financial statements
4141Financial instruments and related disclosures
GlaxoSmithKline plc reports in Sterling and pays dividends out of Sterling profits. The role of Corporate Treasury is to manage and monitor our external and internal funding requirements and financial risks in support of our strategic objectives. Treasury activities are governed by policies and procedures approved by the Board of Directors, most recently on 1st7th October 2009.2010.
A Treasury Management Group (TMG) chaired by our Chief Financial Officer, meets on a monthly basis to review treasury activities. Its members receive management information relating to treasury activities. Our internal auditors review the Treasury internal control environment regularly.
GSK uses a variety of financial instruments to finance its operations and derivative financial instruments to manage risks from these operations. These derivatives, principally comprising forward foreign currency contracts, interest rate and currency swaps, are used to swap borrowings and liquid assets into currencies required for Group purposes and to manage exposure to funding risks from changes in foreign exchange rates and interest rates.
GSK does not hold or issue derivatives for speculative purposes and our Treasury policies specifically prohibit such activity. All transactions in financial instruments are undertaken to manage the risks arising from underlying business activities, not for speculation.
Capital management
We manage our capital to ensure that entities in the Group are able to operate as going concerns and to optimise return to shareholders through an appropriate balance of debt and equity. The Board reviews the Group’s dividend policy and funding requirements annually.
The capital structure of the Group consists of net debt (see Note 32, ‘Net debt’) and shareholders’ equity (see ’Consolidated‘Consolidated statement of changes in equity‘equity’ on page 97)107).
We continueOur commitment is to expect investment opportunitiesuse free cash flow to arise that will allow the Group tosupport increasing dividends, undertake share repurchases or, where returns are more attractive, invest in support of its strategic priorities. To ensure we have sufficient flexibility to take advantage of these opportunities we do not currently expect to make significant share repurchases in 2010.bolt-on acquisitions. Investment opportunities will continue to be assessed against strict financial criteria.
GSK operates on a global basis, primarily through subsidiary companies established in the markets in which we trade. With significant levels of patent or trademark protection, our pharmaceutical products compete largely on product efficacy or differentiation rather than on price.
differentiation. Selling margins are sufficient to cover normal operating costs and our operations are cash generative.
Operating cash flow is used to fund investment in research and development of new products. It is also used to make the routine outflows of capital expenditure, tax, dividends, repayment of maturing debt and, to the extent determined by the Board, share repurchases. In 2011, as part of a new long-term share buy-back programme and depending on market conditions and other factors, we expect to purchase £1-2 billion of shares.
Our policy is to borrow centrally, using a variety of capital market issues and borrowing facilities, to meet anticipated funding requirements.
These borrowings, together with cash generated from operations, are on-lent, contributed as equity to certain subsidiaries or used to pay dividends and make acquisitions. GSK did not make any share repurchases in 2009.2010.
Total capital (equity and net debt) of the Group has increaseddecreased from £18,491 million in 2008 to £20,186 million in 2009.2009 to £18,604 million in 2010. The increasedecrease of £1,695£1,582 million arises principally representsas a result of the retained profitexcess of dividend distribution for the year offset by actuarial losses on defined benefit pension plans and a reduction in net debt. Net debt reduced compared with 2008 primarily as a consequence of GSK’s decision£3,205 million over earnings attributable to suspend share repurchases in 2009.shareholders of £1,634 million. The Group’s positive cash generation along with the issuance of a€1.6 billion bond under our EMTN programme and $1 billion of commercial paper was sufficient to repay maturing short-term debt and finance the Group’s acquisitions and payment of legal costs in the year whilst also increasingyear. Net debt continued to reduce in 2010, reflecting the Group’s overall cash position at 31st December 2009.benefits of our ongoing restructuring programme and the success of our working capital initiatives.
Liquidity risk
We manage our net borrowing requirements through a portfolio of long-term borrowings, including bonds, together with short-term finance under the US$10 billion commercial paper programme. The commercial paper programme is backed byand $3.9 billion of committed facilities. The facilities were last renewed in October 2009.2010. We consider this level of committed facilities to be adequate given our current cash holdings.liquidity requirements. For further information on these facilities, please refer to Note 32 to the financial statements, ‘Net debt’. We also benefit from strong positive cash flow from operating units.
We have a European Medium Term Note programme of £15 billion. At 31st December 2009,2010, we had £8.5£8.3 billion of notes in issue under this programme. We also have a US shelf registration statement. At 31st December 2009,2010, we had $11$10.1 billion (£6.96.5 billion) of notes in issue under this programme. The TMG monitors the cash flow forecast on a monthly basis.
The long-term borrowings mature at dates between 2012 and 2042. Our long-term debt ratings have remained stable since February 2008. Currently we are rated A+ stable outlook by Standard and Poor’s and A1 stable outlook by Moody’s.Moody’s Investors Service ‘Moody’s’. Our short-term debt ratings are A-1 and P-1 with Standard and Poor’s and Moody’s respectively.
As well as our committed facilities we also had substantial cash and cash equivalents and liquid investments, which amounted to £6.8£6.2 billion at 31st December 2009.2010. We also benefit from strong positive cash flow from operating units. The TMG monitors the cash flow forecast on a monthly basis.
GSK Annual Report 2009
153Market risk
Notes to the financial statements
41Financial instruments and related disclosurescontinued
Market risk
Interest rate risk management
The policy on interest rate risk management limits the amount of floating interest payments to a prescribed percentage of trading profit.
We use ana series of interest rate swapswaps to redenominate one of our external borrowings into the interest rate coupon required by GSK. The duration of this swap matches the duration of the principal instrument. Interest rate derivative instruments are accounted for as fair value or cash flow hedges of the relevant assets or liabilities.
GSK Annual Report 2010
163
Notes to the financial statements
41 Financial instruments and related disclosurescontinued
Foreign exchange risk management
Foreign currency transaction exposures arising on internal and external trade flows are not hedged. The exposure of overseas operating subsidiaries to transaction risk is minimised by matching local currency income with local currency costs. For this purpose, our internal trading transactions are matched centrally and we manage intercompanyinter-company payment terms to reduce foreign currency risk. Exceptional foreign currency cash flows are hedged selectively under the management of Corporate Treasury. We manage the cash surpluses or borrowing requirements of subsidiary companies centrally using forward contracts to hedge future repayments back into the originating currency.
We seek to denominate borrowings in the currencies of our principal assets and cash flows. These are primarily denominated in US dollars, Euros and Sterling. Certain borrowings arecan be swapped into other currencies as required. Borrowings denominated in, or swapped into, foreign currencies that match investments in overseas Group assets may be treated as a hedge against the relevant assets. Forward contracts are also used in major currencies to reduce our exposure to our investment in overseas Group assets (see ‘Net investment hedges’ section of this note for further details). The TMG reviews the ratio of borrowings to assets for major currencies monthly.
Credit risk
The Group considers its maximum credit risk to be £13,434£12,285 million (2008(2009 – £13,265£13,434 million) which is the total of the Group’s financial assets with the exception of ’Other‘Other investments’ which do not bear credit risk. See page 155165 for details on the Group’s total financial assets.
GSK’s greatest concentration of credit risk is £1.3 billion (2008 – £1.9 billion)with JP Morgan Chase (Aa1/AA- rated with Moody’s and Standard and Poor’s respectively), comprising £1.2 billion invested in deposits and £0.1 billion of derivatives. In 2009, the greatest concentration of credit risk was £1.3 billion of investments in US Treasury and Treasury repo only money market funds which bear credit exposure to the US Government.Government (Aaa/AAA rated with Moody’s and Standard and Poor’s respectively).
Treasury-related credit risk
In 2009, credit risk remained high during the global credit crisis. GSK has continued to maintain its conservative approach to counterparty risk throughout this period. A report on relationship banks and their credit ratings is presented annually to the TMG for approval.
The aggregate credit risk in respect of financial instruments the Group may have with one counterparty is limited by reference to the long-term credit ratings assigned for that counterparty by Moody’s and Standard and Poor’s. The table below sets out the credit ratings of counterparties for liquid investments, cash and cash equivalents and derivatives. The gross asset position on each derivative contract is considered for the purpose of this table, though, under the ISDA contracts, the amount at risk is the net asset position with each counterparty.
| | | | | | | | | | | | | | | | | | | | | | | | | | | | | | | | | |
| | | Credit rating of counterparty | | | | |
| 2009 | | Aaa/AAA | | | Aa2/AA | | | Aa3/AA- | | | A1/A+ | | | A2/A | | | Baa2/BBB | | | Baa3/BBB- | | | Total | |
| | | £m | | | £m | | | £m | | | £m | | | £m | | | £m | | | £m | | | £m | |
| | | | |
| Bank balances and deposits | | | 793 | | | | 1,385 | | | | 1,359 | | | | 1,467 | | | | 102 | | | | 27 | | | | 73 | | | | 5,206 | |
| US Treasury and Treasury repo only money market funds | | | 1,305 | | | | – | | | | – | | | | – | | | | – | | | | – | | | | – | | | | 1,305 | |
| Corporate debt instruments | | | – | | | | – | | | | 10 | | | | – | | | | – | | | | – | | | | – | | | | 10 | |
| Government securities | | | 237 | | | | – | | | | – | | | | 43 | | | | – | | | | – | | | | 12 | | | | 292 | |
| 3rd party financial derivatives | | | – | | | | 48 | | | | 32 | | | | 106 | | | | – | | | | – | | | | – | | | | 186 | |
| | | | |
| Total | | | 2,335 | | | | 1,433 | | | | 1,401 | | | | 1,616 | | | | 102 | | | | 27 | | | | 85 | | | | 6,999 | |
| | | | |
| | | | | | | | | | | | | | | | | | | | | | | | | | | | | | | | | |
| | | Credit rating of counterparty | | | | |
| 2008 | | Aaa/AAA | | | Aa2/AA | | | Aa3/AA- | | | A1/A+ | | | A2/A | | | Baa2/BBB | | | Baa3/BBB- | | | Total | |
| | | £m | | | £m | | | £m | | | £m | | | £m | | | £m | | | £m | | | £m | |
| | | | |
| Bank balances and deposits | | | 64 | | | | 1,025 | | | | 646 | | | | 1,981 | | | | 32 | | | | – | | | | 27 | | | | 3,775 | |
| US Treasury and Treasury repo only money market funds | | | 1,852 | | | | – | | | | – | | | | – | | | | – | | | | – | | | | – | | | | 1,852 | |
| Corporate debt instruments | | | – | | | | – | | | | 75 | | | | – | | | | – | | | | – | | | | – | | | | 75 | |
| Government securities | | | 231 | | | | – | | | | – | | | | 49 | | | | – | | | | – | | | | 32 | | | | 312 | |
| 3rd party financial derivatives | | | – | | | | 160 | | | | 210 | | | | 540 | | | | – | | | | – | | | | – | | | | 910 | |
| | | | |
| Total | | | 2,147 | | | | 1,185 | | | | 931 | | | | 2,570 | | | | 32 | | | | – | | | | 59 | | | | 6,924 | |
| | | | |
| | | | | | | | | | | | | | | | | | | | | | | | | | | | | | | | | | | | | | | | | |
| | | | | |
| | | Credit rating of counterparty | | | | |
| 2010 | | Aaa/AAA | | | Aa2/AA | | | Aa3/AA- | | | A1/A+ | | | A2/A | | | Baa1/BBB+ | | | Baa2/BBB | | | Baa3/BBB- | | | Ba1/BB+ | | | Total | |
| | | £m | | | £m | | | £m | | | £m | | | £m | | | £m | | | £m | | | £m | | | £m | | | £m | |
| | | | | |
| Bank balances and deposits | | | – | | | | 1,772 | | | | 1,226 | | | | 2,494 | | | | 67 | | | | 1 | | | | – | | | | 84 | | | | 16 | | | | 5,660 | |
| US Treasury and Treasury repo only money market funds | | | 360 | | | | – | | | | – | | | | – | | | | – | | | | – | | | | – | | | | – | | | | – | | | | 360 | |
| Corporate debt instruments | | | – | | | | – | | | | 10 | | | | – | | | | – | | | | – | | | | – | | | | – | | | | – | | | | 10 | |
| Government securities | | | 192 | | | | – | | | | – | | | | – | | | | – | | | | – | | | | – | | | | 8 | | | | 11 | | | | 211 | |
| 3rd party financial derivatives | | | – | | | | 23 | | | | 49 | | | | 100 | | | | – | | | | – | | | | – | | | | – | | | | – | | | | 172 | |
| | | | | |
| Total | | | 552 | | | | 1,795 | | | | 1,285 | | | | 2,594 | | | | 67 | | | | 1 | | | | – | | | | 92 | | | | 27 | | | | 6,413 | |
| | | | | |
| | | | | | | | | | | | | | | | | | | | | | | | | | | | | | | | | | | | | | | | | |
| | | | | |
| | | Credit rating of counterparty | | | | |
| 2009 | | Aaa/AAA | | | Aa2/AA | | | Aa3/AA- | | | A1/A+ | | | A2/A | | | Baa1/BBB+ | | | Baa2/BBB | | | Baa3/BBB- | | | Ba1/BB+ | | | Total | |
| | | £m | | | £m | | | £m | | | £m | | | £m | | | £m | | | £m | | | £m | | | £m | | | £m | |
| | | | | |
| Bank balances and deposits | | | 793 | | | | 1,385 | | | | 1,359 | | | | 1,467 | | | | 102 | | | | – | | | | 27 | | | | 63 | | | | 10 | | | | 5,206 | |
| US Treasury and Treasury repo only money market funds | | | 1,305 | | | | – | | | | – | | | | – | | | | – | | | | – | | | | – | | | | – | | | | – | | | | 1,305 | |
| Corporate debt instruments | | | – | | | | – | | | | 10 | | | | – | | | | – | | | | – | | | | – | | | | – | | | | – | | | | 10 | |
| Government securities | | | 237 | | | | – | | | | – | | | | 43 | | | | – | | | | – | | | | – | | | | 11 | | | | 1 | | | | 292 | |
| 3rd party financial derivatives | | | – | | | | 48 | | | | 32 | | | | 106 | | | | – | | | | – | | | | – | | | | – | | | | – | | | | 186 | |
| | | | | |
| Total | | | 2,335 | | | | 1,433 | | | | 1,401 | | | | 1,616 | | | | 102 | | | | – | | | | 27 | | | | 74 | | | | 11 | | | | 6,999 | |
| | | | | |
The credit ratings in the above tables are as assigned by Moody’s Investor Services and Standard and Poor’s respectively. Where the opinion of the two rating agencies differ, GSK assigns the lower rating of the two to the counterparty. Where local rating agency data is the only source available, the ratings are converted to global ratings equivalent to those of Moody’s Investor Services or Standard and Poor’s using published conversion tables. 2008 figures have been restated to reflect equivalent global or sovereign ratings where appropriate rather than those of local ratings providers.
GSK Annual Report 20092010
164
154
Notes to the financial statements
4141Financial instruments and related disclosures
continued
Our centrally managed cash reserves amounted to £4.9£3.0 billion at 31st December 2009,2010, all available within 3 months. This excludes £0.9 billion centrally managed cash held by ViiV Healthcare, an 85% owned subsidiary. The Group investsmay invest centrally managed liquid assets in bank deposits, AAA/Aaa rated US Treasuries and US Treasury repo only money market funds and short term corporate debt instruments with a minimum short-term credit rating of A-1/P1 and bank deposits.P1.
Global counterparty limits are assigned to each of GSK’s banking and investment counterparties based on long-term credit ratings from Moody’s and Standard and Poor’s. Corporate Treasury’s usage of these limits is monitored daily by a Corporate Compliance Officer (CCO) who operates independently of Corporate Treasury. Any breach of these limits would be reported to the CFO immediately. The CCO also monitors the credit rating of these counterparties and, when changes in ratings occur, notifies Corporate Treasury so that changes can be made to investment levels or authority limits as appropriate.
Wholesale and retail credit risk
In the USA, in line with other pharmaceutical companies, the Group sells its products through a small number of wholesalers in addition to hospitals, pharmacies, physicians and other groups. Sales to the three largest wholesalers amount to approximately 85% of the Group’s US pharmaceutical sales. At 31st December 2009,2010, the Group had trade receivables due from these three wholesalers totalling £867£890 million (2008(2009 – £1,067£867 million). The Group is exposed to a concentration of credit risk in respect of these wholesalers such that, if one or more of them encounters financial difficulty, it could materially and adversely affect the Group’s financial results.
The Group’s credit risk monitoring activities relating to these wholesalers includes review of their quarterly financial information and Standard & Poor’s credit ratings, development of GSK internal risk ratings, and establishment and periodic review of credit limits. However, the Group believes there is no further credit risk provision required in excess of the normal provision for bad and doubtful debts (see Note 24, ‘Trade and other receivables’). Outside the USA no customer accounts for more than 5% of the trade receivables balance.
Fair value of financial assets and liabilities
The table on page 155165 presents the carrying amounts and the fair values of the Group’s financial assets and liabilities at 31st December 20092010 and 31st December 2008.2009.
The fair values of the financial assets and liabilities are included at the amount at which the instrument could be exchanged in a current transaction between willing parties, other than in a forced or liquidation sale.
The following methods and assumptions were used to estimate the fair values:
| • | | Cash and cash equivalents – approximates to the carrying amount |
| |
| • | | Liquid investments – based on quoted market prices or calculated based on observable inputs in the case of marketable securities; based on principal amounts in the case of non-marketable securities because of their short repricing periods |
| |
| • | | Other investments – investments traded in an active market determined by reference to the relevant stock exchange quoted bid price; other investments determined by reference to the current market value of similar instruments or by reference to the discounted cash flows of the underlying net assets |
| |
| • | | Short-term loans and overdrafts – approximates to the carrying amount because of the short maturity of these instruments |
| |
| • | | Long-term loans – based on quoted market prices in the case of the Eurobonds and other fixed rate borrowings; approximates to the carrying amount in the case of floating rate bank loans and other loans |
| |
| • | | Forward exchange contracts – based on market data and exchange rates at the balance sheet date |
| |
| • | | Currency swaps – based on market data at the balance sheet date |
| |
| • | | Interest rate swaps – based on the net present value of discounted cash flows |
| |
| • | | Receivables and payables – approximates to the carrying amount |
| |
| • | | Company-owned life insurance policies – based on cash surrender value |
|
| • | | Lease obligations – approximates to the carrying amount. |
Fair value of investments in GSK shares
At 31st December 2009,2010, the Employee Share Ownership Plan (ESOP) Trusts held GSK shares with a carrying value of £1,138£845 million (2008(2009 – £1,445£1,138 million) with a fair value of £1,554£1,308 million (2008(2009 – £1,657£1,554 million) based on quoted market price. The shares represent purchases by the ESOP Trusts to satisfy future exercises of options and awards under employee incentive schemes. The carrying value, which is the lower of cost or expected proceeds, of these shares has been recognised as a deduction from other reserves. At 31st December 2009,2010, GSK held Treasury shares at a cost of £6,286 million (2008(2009 – £6,286 million) which has been deducted from retained earnings.
Committed facilities
The Group has committed facilities to back up the commercial paper programme of $3.9 billion (£2.42.5 billion) (2008
(2009 – $3.9 billion (£2.72.4 billion)) of 364 days duration, renewable annually. At 31st December 2009, undrawn committed facilities totalled $3.9 billion (£2.4 billion) (2008 – $3.9 billion (£2.7 billion)).2010 these were undrawn.
GSK Annual Report 20092010
155165
Notes to the financial statements
4141Financial instruments and related disclosurescontinued
| | | | | | | | | | | | | | | | | | | |
| | | 2009 | | 2008 | | | 2010 | | 2009 | |
| | | Carrying | | Fair | | Carrying | | Fair | | | Carrying | | Fair | | Carrying | | Fair | |
| | | value | | value | | value | | value | | | value | | value | | value | | value | |
| | | £m | | £m | | £m | | £m | | | £m | | £m | | £m | | £m | |
| | | | | | | | | | | | | | | | | |
| Cash and cash equivalents | | 6,545 | | 6,545 | | 5,623 | | 5,623 | | | 6,057 | | 6,057 | | 6,545 | | 6,545 | |
| | | |
| Available-for-sale investments: | | |
| Liquid investments: | | |
| – Government bonds | | 254 | | 254 | | 299 | | 299 | | | 172 | | 172 | | 254 | | 254 | |
| – other | | 14 | | 14 | | 92 | | 92 | | | 12 | | 12 | | 14 | | 14 | |
| | | | | | | | | | |
| | | | | | | | | | |
| Total liquid investments | | 268 | | 268 | | 391 | | 391 | | | 184 | | 184 | | 268 | | 268 | |
| Other investments | | 454 | | 454 | | 478 | | 478 | | | 711 | | 711 | | 454 | | 454 | |
| | | |
| Loans and receivables: | | |
Trade and other receivables and Other non-current
assets in scope of IAS 39 | | 6,424 | | 6,424 | | 6,288 | | 6,288 | | |
Trade and other receivables and certain Other non-current
assets in scope of IAS 39 | | | 5,667 | | 5,667 | | 6,271 | | 6,271 | |
| | | |
| Financial assets at fair value through profit or loss: | | |
| Other non-current assets | | | 187 | | 187 | | 153 | | 153 | |
| | | |
| Held-for-trading financial assets: | | |
| Derivatives designated as accounting hedges | | 104 | | 104 | | 111 | | 111 | | | 97 | | 97 | | 104 | | 104 | |
| Other derivatives | | 93 | | 93 | | 852 | | 852 | | | 93 | | 93 | | 93 | | 93 | |
| | | | | | | | | | |
| | | | | | | | | | |
| Total financial assets | | 13,888 | | 13,888 | | 13,743 | | 13,743 | | | 12,996 | | 12,996 | | 13,888 | | 13,888 | |
| | | | | | | | | | |
| | | | | | | | | | |
| Financial liabilities measured at amortised cost: | | |
| Borrowings: | | |
| – bonds in a designated hedging relationship | | | (6,139 | ) | | | (6,499 | ) | | | (5,693 | ) | | | (5,813 | ) | | | (6,029 | ) | | | (6,401 | ) | | | (6,139 | ) | | | (6,499 | ) |
| – other bonds | | | (9,178 | ) | | | (9,864 | ) | | | (9,919 | ) | | | (10,214 | ) | | | (8,708 | ) | | | (9,653 | ) | | | (9,178 | ) | | | (9,864 | ) |
| – commercial paper | | | (621 | ) | | | (621 | ) | | – | | – | | | – | | – | | | (621 | ) | | | (621 | ) |
| – bank loans and overdrafts | | | (182 | ) | | | (182 | ) | | | (427 | ) | | | (427 | ) | | | (260 | ) | | | (260 | ) | | | (182 | ) | | | (182 | ) |
| – other loans and private financing | | | (7 | ) | | | (7 | ) | | | (12 | ) | | | (12 | ) | | – | | – | | | (7 | ) | | | (7 | ) |
| – obligations under finance leases | | | (130 | ) | | | (130 | ) | | | (136 | ) | | | (136 | ) | | | (103 | ) | | | (103 | ) | | | (130 | ) | | | (130 | ) |
| | | | | | | | | | |
| | | | | | | | | | |
| Total borrowings | | | (16,257 | ) | | | (17,303 | ) | | | (16,187 | ) | | | (16,602 | ) | | | (15,100 | ) | | | (16,417 | ) | | | (16,257 | ) | | | (17,303 | ) |
| Trade and other payables and Other non-current liabilities in scope of IAS 39 | | | (6,051 | ) | | | (6,051 | ) | | | (5,452 | ) | | | (5,452 | ) | |
| Trade and other payables, Other provisions and Other non-current liabilities in scope of IAS 39 | | | | (6,590 | ) | | | (6,590 | ) | | | (6,051 | ) | | | (6,051 | ) |
| | | |
| Held-for-trading financial liabilities: | | |
| Derivatives designated as accounting hedges | | | (55 | ) | | | (55 | ) | | | (638 | ) | | | (638 | ) | | | (23 | ) | | | (23 | ) | | | (55 | ) | | | (55 | ) |
| Other derivatives | | | (113 | ) | | | (113 | ) | | | (116 | ) | | | (116 | ) | | | (170 | ) | | | (170 | ) | | | (113 | ) | | | (113 | ) |
| | | | | | | | | | |
| | | | | | | | | | |
| Total financial liabilities | | | (22,476 | ) | | | (23,522 | ) | | | (22,393 | ) | | | (22,808 | ) | | | (21,883 | ) | | | (23,200 | ) | | | (22,476 | ) | | | (23,522 | ) |
| | | | | | | | | | | | | | | | | |
| Net financial assets and financial liabilities | | | (8,588 | ) | | | (9,634 | ) | | | (8,650 | ) | | | (9,065 | ) | | | (8,887 | ) | | | (10,204 | ) | | | (8,588 | ) | | | (9,634 | ) |
| | | | | | | | | | | | | | | | | |
GSK Annual Report 20092010
156166
Notes to the financial statements
4141Financial instruments and related disclosurescontinued
| The following tables categorise the Group’s financial assets and liabilities held at fair value by the valuation methodology applied in determining their fair value. Where possible, quoted prices in active markets are used (Level 1). Where such prices are not available, the asset or liability is classified as Level 2, provided all significant inputs to the valuation model used are based on observable market data. If one or more of the significant inputs to the valuation model is not based on observable market data, the instrument is classified as Level 3. |
Financial assets at fair value| | | | | | | | | | | | | | | | | |
| | | | | | | | | | | | | |
| At 31st December 2010 | | Level 1 | | | Level 2 | | | Level 3 | | | Total | |
| | £m | | | £m | | | £m | | | £m | |
| | | | | | | | | | | | | |
Financial assets at fair value | | | | | | | | | | | | | | | | |
| Available–for–sale financial assets: | | | | | | | | | | | | | | | | |
| Liquid investments | | | 159 | | | | 25 | | | | – | | | | 184 | |
| Other investments | | | 491 | | | | – | | | | 220 | | | | 711 | |
| Financial assets at fair value through profit or loss: | | | | | | | | | | | | | | | | |
| Other non-current assets | | | – | | | | 187 | | | | – | | | | 187 | |
| Held–for–trading financial assets: | | | | | | | | | | | | | | | | |
| Derivatives designated as accounting hedges | | | – | | | | 97 | | | | – | | | | 97 | |
| Other derivatives | | | – | | | | 92 | | | | 1 | | | | 93 | |
| | | | | | | | | | | | | |
| | | | 650 | | | | 401 | | | | 221 | | | | 1,272 | |
| | | | | | | | | | | | | |
| | | | | | | | | | | | | | | | | |
Financial liabilities at fair value | | | | | | | | | | | | | | | | |
| Held–for–trading financial liabilities: | | | | | | | | | | | | | | | | |
| Derivatives designated as accounting hedges | | | – | | | | (23 | ) | | | – | | | | (23 | ) |
| Other derivatives | | | – | | | | (169 | ) | | | (1 | ) | | | (170 | ) |
| | | | | | | | | | | | | |
| | | | – | | | | (192 | ) | | | (1 | ) | | | (193 | ) |
| | | | | | | | | | | | | |
| | | | | | | | | | | | | | | | | |
| At 31st December 2009 | | Level 1 | | | Level 2 | | | Level 3 | | | Total | |
| | £m | | | £m | | | £m | | | £m | |
| | | | | | | | | | |
| Held–for–trading financial assets | | | | | | | | | | | | | | | | |
| Derivatives designated as accounting hedges | | | – | | | | 104 | | | | – | | | | 104 | |
| Other derivatives | | | – | | | | 93 | | | | – | | | | 93 | |
| | | | | | | | | | | | | | | | | |
| Available–for–sale financial assets | | | | | | | | | | | | | | | | |
| Liquid investments | | | 249 | | | | 19 | | | | – | | | | 268 | |
| Other investments | | | 245 | | | | – | | | | 209 | | | | 454 | |
| | | | | | | | | | |
| | | | 494 | | | | 216 | | | | 209 | | | | 919 | |
| | | | | | | | | | |
Financial liabilities at fair value
| | | | | | | | | | | |
| | | | | | | | | | | | | | | | | | | |
| At 31st December 2009 | | Level 1 | | Level 2 | | Level 3 | | Total | | | Level 1 | | Level 2 | | Level 3 | | Total | |
| | £m | | £m | | £m | | £m | | | £m | | £m | | £m | | £m | |
| | | | | | | | | | | | | | | | | |
| Held–for–trading financial liabilities | | |
Financial assets at fair value | | |
| Available–for–sale financial assets: | | |
| Liquid investments | | | 249 | | 19 | | – | | 268 | |
| Other investments | | | 245 | | – | | 209 | | 454 | |
| Financial assets at fair value through profit or loss: | | |
| Other non-current assets | | | – | | 153 | | – | | 153 | |
| Held–for–trading financial assets: | | |
| Derivatives designated as accounting hedges | | – | | | (55 | ) | | – | | | (55 | ) | | – | | 104 | | – | | 104 | |
| Other derivatives | | – | | | (113 | ) | | – | | | (113 | ) | | – | | 93 | | – | | 93 | |
| | | | | | | | | | | | | | | | | |
| | | – | | | (168 | ) | | – | | | (168 | ) | | 494 | | 369 | | 209 | | 1,072 | |
| | | | | | | | | | | | | | | | | |
| | | |
Financial liabilities at fair value | | |
| Held–for–trading financial liabilities: | | |
| Derivatives designated as accounting hedges | | | – | | | (55 | ) | | – | | | (55 | ) |
| Other derivatives | | | – | | | (113 | ) | | – | | | (113 | ) |
| | | | | | | | | | | |
| | | | – | | | (168 | ) | | – | | | (168 | ) |
| | | | | | | | | | | |
Movements in the year for financial instruments measured using Level 3 valuation methods are presented below:
| | | | |
| | Other | |
| | investments | |
| | £m | |
| | |
At 1st January 2009 | | | 159 | |
Losses recognised in profit or loss | | | (11 | ) |
Gains recognised in other comprehensive income | | | 1 | |
Additions | | | 81 | |
Disposals | | | (4 | ) |
Transfers to/from Level 3 | | | – | |
Exchange | | | (17 | ) |
| | |
At 31st December 2009 | | | 209 | |
| | |
| | | | | | | | | |
| | | | | |
| | | 2010 | | | 2009 | |
| | | £m | | | £m | |
| | | | | |
| At 1st January | | | 209 | | | | 159 | |
| Losses recognised in the income statement | | | (13 | ) | | | (11 | ) |
| (Losses)/gains recognised in other comprehensive income | | | (1 | ) | | | 1 | |
| Additions | | | 51 | | | | 81 | |
| Disposals | | | (3 | ) | | | (4 | ) |
| Transfers from Level 3 | | | (26 | ) | | | – | |
| Exchange | | | 3 | | | | (17 | ) |
| | | | | |
| At 31st December | | | 220 | | | | 209 | |
| | | | | |
| | | | |
| | 2009 | |
| | £m | |
| | |
Losses relating to Level 3 financial assets included in Other operating
income which are attributable to assets held at the end of the year | | | (11 | ) |
| | |
Net losses of £13 million (2009 – £11 million) attributable to Level 3 financial instruments held at the end of the year were reported in other operating income. Transfers out of Level 3 of £26 million (2009 – £ nil) relate to equity investments which were listed on stock exchanges during the year. A reasonably possible change in assumptions is unlikely to result in a material change in the fair value of the Level 3 instruments.GSK Annual Report 20092010
157167
Notes to the financial statements
4141Financial instruments and related disclosurescontinued
Trade and other receivables and otherOther non-current assets in scope of IAS 39
The following table reconciles financial assets within Trade and other receivables and Other non-current assets which fall within the scope of IAS 39 to the relevant balance sheet amounts. The financial assets are predominantly non-interest earning. Financial instruments within Other non-current assets include company-owned life insurance policies. Other assets include tax receivables, pension surplus balances and prepayments, which are outside the scope of IAS 39.
| | | | | | | |
| | | | | | | | | | |
| | | 2009 | | 2008 | | | 2010 | | 2009 | |
| | | £m | | £m | | | £m | | £m | |
| | | | | | | | | |
| Trade and other receivables (Note 24) | | 6,492 | | 6,265 | | | 5,793 | | 6,492 | |
| Other non-current assets (Note 22) | | 583 | | 579 | | | 556 | | 583 | |
| | | | | | | | | |
| | | 7,075 | | 6,844 | | | 6,349 | | 7,075 | |
| | | | | | | | |
| | | |
| Analysed as: | | |
| Financial assets in scope of IAS 39 | | 6,424 | | 6,288 | | | 5,854 | | 6,424 | |
| Other assets | | 651 | | 556 | | | 495 | | 651 | |
| | | | | | | | | |
| | | 7,075 | | 6,844 | | | 6,349 | | 7,075 | |
| | | | | | | | | |
The following table shows the age of such financial assets which are past due and for which no provision for bad or doubtful debts has been made:
| | | | | | | |
| | | | | | | | | | |
| | | 2009 | | 2008 | | | 2010 | | 2009 | |
| | | £m | | £m | | | £m | | £m | |
| | | | | | | | | |
| Past due by 1–30 days | | 262 | | 310 | | | 134 | | 262 | |
| Past due by 31–90 days | | 105 | | 154 | | | 138 | | 105 | |
| Past due by 91–180 days | | 60 | | 115 | | | 61 | | 60 | |
| Past due by 181–365 days | | 54 | | 89 | | | 66 | | 54 | |
| Past due by more than 365 days | | 78 | | 117 | | | 67 | | 78 | |
| | | | | | | | | |
| | | 559 | | 785 | | | 466 | | 559 | |
| | | | | | | | | |
Amounts past due by greater than 90 days total £192£194 million (2008(2009 – £321£192 million). Of this balance £132£127 million (2008(2009 – £227£132 million) relates to receivables due from state hospital authorities in certain European countries. Given the profile of our customers, including large wholesalers and government backed agencies, no further credit risk has been identified with the trade receivables not past due other than those balances for which an allowance has been made.
Trade and other payables, Other provisions and otherOther non-current liabilities in scope of IAS 39
The following table reconciles financial liabilities within Trade and other payables, Other provisions and Other non-current liabilities which fall within the scope of IAS 39 to the relevant balance sheet amounts. The financial liabilities are predominantly non-interest bearing. Accrued wages and salaries are included within financial liabilities. Other liabilities include payments on account, and tax and social security payables and provisions which do not constitute contractual obligations to deliver cash or another financial asset, which are outside the scope of IAS 39.
| | | | | | | |
| | | | | | | | | | |
| | | 2009 | | 2008 | | | 2010 | | 2009 | |
| | | £m | | £m | | | £m | | £m | |
| | | | | | | | | |
| Trade and other payables (Note 27) | | | (6,772 | ) | | | (6,075 | ) | | | (6,888 | ) | | | (6,772 | ) |
| Other provisions (Note 29) | | | | (5,284 | ) | | | (3,241 | ) |
| Other non-current liabilities (Note 30) | | | (605 | ) | | | (427 | ) | | | (594 | ) | | | (605 | ) |
| | | | | | | | | |
| | | | (7,377 | ) | | | (6,502 | ) | | | (12,766 | ) | | | (10,618 | ) |
| | | | | | | | |
| | | |
| Analysed as: | | |
| Financial liabilities in scope of IAS 39 | | | (6,051 | ) | | | (5,452 | ) | | | (6,590 | ) | | | (6,051 | ) |
| Other liabilities | | | (1,326 | ) | | | (1,050 | ) | | | (6,176 | ) | | | (4,567 | ) |
| | | | | | | | | |
| | | | (7,377 | ) | | | (6,502 | ) | | | (12,766 | ) | | | (10,618 | ) |
| | | | | | | | | |
GSK Annual Report 20092010
158168
Notes to the financial statements
4141Financial instruments and related disclosurescontinued
Debt interest rate repricing table
The following table sets out the exposure of the Group to interest rates on debt before and after the effect of interest rate swaps. The maturity analysis of fixed rate debt is stated by contractual maturity and of floating rate debt by interest rate repricing dates. For the purpose of this table, debt is defined as all classes of borrowings other than obligations under finance leases.
| | | | | | | | | | | | | | | | | |
| | | | | | | | | | | | | | | | | | | | | | | | | | | | |
| | | 2009 | | 2008 | | | 2010 | | 2009 | |
| | | Effect of | | Effect of | | | | | Effect of | | Effect of | | | |
| | | interest | | interest | | | | | interest | | interest | | | |
| | | Debt | | rate swaps | | Total | | Debt | | rate swaps | | Total | | | Debt | | rate swaps | | Total | | Debt | | rate swaps | | Total | |
| | | £m | | £m | | £m | | £m | | £m | | £m | | | £m | | £m | | £m | | £m | | £m | | £m | |
| | | | | | | | | | | | | | | | | | | | | | | | | |
| Floating and fixed rate debt less than one year | | | (1,431 | ) | | | (990 | ) | | | (2,421 | ) | | | (901 | ) | | | (1,146 | ) | | | (2,047 | ) | | | (259 | ) | | | (1,049 | ) | | | (1,308 | ) | | | (1,431 | ) | | | (990 | ) | | | (2,421 | ) |
| Between one and two years | | – | | – | | – | | | (703 | ) | | – | | | (703 | ) | | | (2,559 | ) | | – | | | (2,559 | ) | | – | | – | | – | |
| Between two and three years | | | (2,647 | ) | | – | | | (2,647 | ) | | – | | – | | – | | | | (1,599 | ) | | – | | | (1,599 | ) | | | (2,647 | ) | | – | | | (2,647 | ) |
| Between three and four years | | | (1,548 | ) | | – | | | (1,548 | ) | | | (2,872 | ) | | – | | | (2,872 | ) | | | (1,049 | ) | | 1,049 | | – | | | (1,548 | ) | | – | | | (1,548 | ) |
| Between four and five years | | | (990 | ) | | 990 | | – | | | (1,728 | ) | | – | | | (1,728 | ) | | | (1,358 | ) | | – | | | (1,358 | ) | | | (990 | ) | | 990 | | – | |
| Between five and ten years | | | (4,205 | ) | | – | | | (4,205 | ) | | | (4,240 | ) | | 1,146 | | | (3,094 | ) | | | (2,819 | ) | | – | | | (2,819 | ) | | | (4,205 | ) | | – | | | (4,205 | ) |
| Greater than ten years | | | (5,306 | ) | | – | | | (5,306 | ) | | | (5,597 | ) | | – | | | (5,597 | ) | | | (5,354 | ) | | – | | | (5,354 | ) | | | (5,306 | ) | | – | | | (5,306 | ) |
| | | | | | | | | | | | | | | | | | | | | | | | | |
| Total | | | (16,127 | ) | | – | | | (16,127 | ) | | | (16,041 | ) | | – | | | (16,041 | ) | | | (14,997 | ) | | – | | | (14,997 | ) | | | (16,127 | ) | | – | | | (16,127 | ) |
| | | | | | | | | | | | | | | | | | | | | | | | |
| Original issuance profile: | | |
| Fixed rate interest | | | (14,696 | ) | | 990 | | | (13,706 | ) | | | (14,922 | ) | | 1,146 | | | (13,776 | ) | | | (14,757 | ) | | 1,049 | | | (13,708 | ) | | | (14,696 | ) | | 990 | | | (13,706 | ) |
| Floating rate interest | | | (1,430 | ) | | | (990 | ) | | | (2,420 | ) | | | (1,119 | ) | | | (1,146 | ) | | | (2,265 | ) | | | (239 | ) | | | (1,049 | ) | | | (1,288 | ) | | | (1,430 | ) | | | (990 | ) | | | (2,420 | ) |
| | | | | | | | | | | | | | | | | | | | | | | | | |
| Total interest bearing | | | (16,126 | ) | | – | | | (16,126 | ) | | | (16,041 | ) | | – | | | (16,041 | ) | | | (14,996 | ) | | – | | | (14,996 | ) | | | (16,126 | ) | | – | | | (16,126 | ) |
| Non-interest bearing | | | (1 | ) | | – | | | (1 | ) | | | (10 | ) | | – | | | (10 | ) | | | (1 | ) | | – | | | (1 | ) | | | (1 | ) | | – | | | (1 | ) |
| | | | | | | | | | | | | | | | | | | | | | | | | |
| | | | (16,127 | ) | | – | | | (16,127 | ) | | | (16,051 | ) | | – | | | (16,051 | ) | | | (14,997 | ) | | – | | | (14,997 | ) | | | (16,127 | ) | | – | | | (16,127 | ) |
| | | | | | | | | | | | | | | | | | | | | | | | | |
Sensitivity analysis
The sensitivity analysis has been prepared on the assumption that the amount of net debt, the ratio of fixed to floating interest rates of the debt and derivatives portfolio and the proportion of financial instruments in foreign currencies are all constant and on the basis of the hedge designations in place at 31st December.
Financial instruments affected by market risk include borrowings, deposits and derivative financial instruments. The following analyses are intended to illustrate the sensitivity of such financial instruments to changes in relevant foreign exchange and interest rates.
Foreign exchange sensitivity
The tabletables below showsshow the Group’s sensitivity to foreign exchange rates on its US dollar, Euro and Yen financial instruments excluding obligations under finance leases and certain non-derivative financial instruments not in net debt and which do not present a material exposure. These three currencies are the major foreign currencies in which GSK’s financial instruments are denominated. GSK has considered movements in these currencies over the last three years and has concluded that a 20% movement in rates is a reasonable benchmark. In thisthe table below, financial instruments are only considered sensitive to foreign exchange rates where they are not in the functional currency of the entity that holds them. IntercompanyInter-company loans which are fully hedged to maturity with a currency swap have been excluded from this analysis.
| | | | | | | | | | | | | | | | | | | |
| | | 2009 | | 2008 | | | | | | | | | |
| | | Increase/(decrease) | | Reduction | | Increase/(decrease) | | Reduction | | | 2010 | | 2009 | |
| | | in income | | in equity | | in income | | in equity | | | Increase | | Reduction | | Increase | | Reduction | |
| | | £m | | £m | | £m | | £m | | |
| Non-functional currency foreign exchange exposure | | | in income | | in equity | | in income | | in equity | |
| | £m | | £m | | £m | | £m | |
| | | | | | | | | | | | | | | | | |
| 20% appreciation of the US dollar | | 251 | | 755 | | 210 | | 991 | | | 386 | | – | | 214 | | 755 | |
| 20% appreciation of the Euro | | 8 | | 1,779 | | | (20 | ) | | 1,760 | | | 35 | | 1,697 | | 72 | | 1,779 | |
| 20% appreciation of the Yen | | – | | 45 | | 1 | | 52 | | | – | | – | | 5 | | 45 | |
| | | | | | | | | | | | | | | | | |
A 20% depreciation of the stated currencies would have an equal and opposite effect.
The movements in the income statement relate primarily to hedging instruments for US dollar legal provisions, and to trade payables and trade receivables. Whilst the hedging instruments provide economic hedges, the related provisions are not financial instruments and therefore are not included in the table above. The combined sensitivity of these hedging instruments and the provisions would be insignificant if the provisions were included.
The movements in equity relate to foreign exchange positions used to hedge Group assets denominated in Euro. The US dollar Euro and Yen.Yen positions were closed out in 2010. Therefore, a depreciation on the currency swap would give rise to a corresponding appreciation on the Group asset. Foreign exchange sensitivity on Group assets other than financial instruments is not included above.
GSK Annual Report 20092010
159169
Notes to the financial statements
4141Financial instruments and related disclosurescontinued
The table below presents the Group’s sensitivity to foreign exchange rates based on the composition of net debt adjusting for the effects of foreign exchange derivatives, which are not part of net debt but affect future currency foreign cash flows. These derivatives relate primarily to foreign exchange contracts used to hedge the Group’s currency net assets and US legal provisions.
| | | | | | | | | |
| | | | | |
| | | 2010 | | | 2009 | |
| | | Increase/(decrease) | | | Increase/(decrease) | |
| Impact of foreign exchange movements on net debt | | in net debt | | | in net debt | |
| | | £m | | | | £m | |
| | | | | |
| 20% appreciation of the US dollar | | | 851 | | | | 523 | |
| 20% appreciation of the Euro | | | 606 | | | | 686 | |
| 20% appreciation of the Yen | | | (13 | ) | | | 89 | |
| | | | | |
A 20% depreciation of the stated currencies would have an equal and opposite effect.
Interest rate sensitivity
The table below shows the Group’s sensitivity to interest rates on its floating rate Sterling, US dollar and Euro financial instruments, being the currencies in which GSK has historically issued debt and held investments. GSK has considered movements in these interest rates over the last three years and has concluded that a 2% (200 basis points) increase is a reasonable benchmark. Debt with a maturity of less than one year is floating rate for this calculation. A 2% (200 basis points) movement in interest rates is not deemed to have a material effect on equity.
| | | | | | | | | |
| | | 2009 | | | 2008 | |
| | | Increase/(decrease) | | | Increase/(decrease) | |
| | | in income | | | in income | |
| | | £m | | | £m | |
| | | | |
| 2% increase in Sterling interest rates | | | (2 | ) | | | 16 | |
| 2% increase in US dollar interest rates | | | 38 | | | | 13 | |
| 2% increase in Euro interest rates | | | 18 | | | | 4 | |
| | | | | | |
| | | | | | | | | |
| | | | | |
| | | 2010 | | | 2009 | |
| | | Increase/(decrease) | | | Increase/(decrease) | |
| | | in income | | | in income | |
| | | £m | | | £m | |
| | | | | |
| 2% (200 basis points) increase in Sterling interest rates | | | 29 | | | | (2 | ) |
| 2% (200 basis points) increase in US dollar interest rates | | | (18 | ) | | | 38 | |
| 2% (200 basis points) increase in Euro interest rates | | | 37 | | | | 18 | |
| | | | | |
These interest rates could not be decreased by 2% as they are currently less than 1.0%. The maximum increase/(decrease) in income would therefore be limited to £1(£8 million), £2 million (£4 million) and (£211 million) for Sterling, US Dollar and Euro interest rates respectively (2008(2009 – £1 million, (£16 million), (£14 million) and (£42 million)). Interest rate movements on obligations under finance leases, foreign currency derivatives trade payables, trade receivables and other financial instruments not in net debt do not present a material exposure to the Group’s balance sheet based on a 2% increase or decrease in these interest rates.
Contractual cash flows for non-derivative financial liabilities and derivative instruments
The following is an analysis of the anticipated contractual cash flows including interest payable for the Group’s non-derivative financial liabilities on an undiscounted basis. The impact of interest rate swaps has been excluded. For the purpose of this table, debt is defined as all classes of borrowings except for obligations under finance leases. Interest is calculated based on debt held at 31st December without taking account of future issuance. Floating rate interest is estimated using the prevailing interest rate at the balance sheet date. Cash flows in foreign currencies are translated using spot rates at 31st December.
| | | | | | | | | | | | | | | | | | | | | | | | | | | |
| | | Finance charge | | Trade and | | | | | | | | | | | | | | | |
| | | Obligations | | on obligations | | other | | | | | Finance charge | | Trade payables and | | | |
| | | Interest on | | under finance | | under finance | | payables not | | | | | Obligations | | on obligations | | other | | | |
| At 31st December 2009 | | Debt | | debt | | leases | | leases | | in net debt | | Total | | |
| | £m | | £m | | £m | | £m | | £m | | £m | | |
| | | | Interest on | | under finance | | under finance | | liabilities not | | | |
| At 31st December 2010 | | | Debt | | debt | | leases | | leases | | in net debt | | Total | |
| | £m | | £m | | £m | | £m | | £m | | £m | |
| | | | | | | | | | | | | | | | | | | | | | | | |
| Due in less than one year | | | (1,431 | ) | | | (757 | ) | | | (40 | ) | | | (4 | ) | | | (5,828 | ) | | | (8,060 | ) | | | (259 | ) | | | (755 | ) | | | (32 | ) | | | (5 | ) | | | (6,280 | ) | | | (7,331 | ) |
| Between one and two years | | – | | | (753 | ) | | | (32 | ) | | | (6 | ) | | | (161 | ) | | | (952 | ) | | | (2,564 | ) | | | (756 | ) | | | (27 | ) | | | (5 | ) | | | (178 | ) | | | (3,530 | ) |
| Between two and three years | | | (2,655 | ) | | | (754 | ) | | | (24 | ) | | | (2 | ) | | | (28 | ) | | | (3,463 | ) | | | (1,603 | ) | | | (638 | ) | | | (18 | ) | | | (3 | ) | | | (35 | ) | | | (2,297 | ) |
| Between three and four years | | | (1,553 | ) | | | (594 | ) | | | (14 | ) | | | (2 | ) | | | (14 | ) | | | (2,177 | ) | | | (962 | ) | | | (559 | ) | | | (11 | ) | | | (2 | ) | | | (57 | ) | | | (1,591 | ) |
| Between four and five years | | | (932 | ) | | | (536 | ) | | | (5 | ) | | | (1 | ) | | | (5 | ) | | | (1,479 | ) | | | (1,368 | ) | | | (538 | ) | | | (7 | ) | | | (1 | ) | | | (7 | ) | | | (1,921 | ) |
| Between five and ten years | | | (4,230 | ) | | | (2,088 | ) | | | (15 | ) | | | (1 | ) | | | (15 | ) | | | (6,349 | ) | | | (2,831 | ) | | | (2,053 | ) | | | (8 | ) | | – | | | (21 | ) | | | (4,913 | ) |
| Greater than ten years | | | (5,382 | ) | | | (5,251 | ) | | – | | – | | – | | | (10,633 | ) | | | (5,425 | ) | | | (5,013 | ) | | – | | – | | | (12 | ) | | | (10,450 | ) |
| | | | | | | | | | | | | | | | | | | | | | | | |
| Gross contractual cash flows | | | (16,183 | ) | | | (10,733 | ) | | | (130 | ) | | | (16 | ) | | | (6,051 | ) | | | (33,113 | ) | | | (15,012 | ) | | | (10,312 | ) | | | (103 | ) | | | (16 | ) | | | (6,590 | ) | | | (32,033 | ) |
| | | | | | | | | | | | | | | | | | | | | | | | | |
| | | | | | | | | | | | | | | | | | | | | | | | | | | |
| | | Finance charge | | Trade and | | | | | | | | | | | | | | | |
| | | Obligations | | on obligations | | other | | | | | Finance charge | | Trade payables and | | | |
| | | Interest on | | under finance | | under finance | | payables not | | | | | Obligations | | on obligations | | other | | | |
| At 31st December 2008 | | Debt | | debt | | leases | | leases | | in net debt | | Total | | |
| | £m | | £m | | £m | | £m | | £m | | £m | | |
| | | | Interest on | | under finance | | under finance | | liabilities not | | | |
| At 31st December 2009 | | | Debt | | debt | | leases | | leases | | in net debt | | Total | |
| | £m | | £m | | £m | | £m | | £m | | £m | |
| | | | | | | | | | | | | | | | | | | | | | | | |
| Due in less than one year | | | (907 | ) | | | (790 | ) | | | (48 | ) | | | (5 | ) | | | (5,246 | ) | | | (6,996 | ) | | | (1,431 | ) | | | (757 | ) | | | (40 | ) | | | (4 | ) | | | (5,828 | ) | | | (8,060 | ) |
| Between one and two years | | | (704 | ) | | | (767 | ) | | | (35 | ) | | | (4 | ) | | | (68 | ) | | | (1,578 | ) | | – | | | (753 | ) | | | (32 | ) | | | (6 | ) | | | (161 | ) | | | (952 | ) |
| Between two and three years | | – | | | (757 | ) | | | (27 | ) | | | (3 | ) | | | (25 | ) | | | (812 | ) | | | (2,655 | ) | | | (754 | ) | | | (24 | ) | | | (2 | ) | | | (28 | ) | | | (3,463 | ) |
| Between three and four years | | | (2,885 | ) | | | (757 | ) | | | (14 | ) | | | (2 | ) | | | (32 | ) | | | (3,690 | ) | | | (1,553 | ) | | | (594 | ) | | | (14 | ) | | | (2 | ) | | | (14 | ) | | | (2,177 | ) |
| Between four and five years | | | (1,736 | ) | | | (582 | ) | | | (4 | ) | | | (2 | ) | | | (5 | ) | | | (2,329 | ) | | | (932 | ) | | | (536 | ) | | | (5 | ) | | | (1 | ) | | | (5 | ) | | | (1,479 | ) |
| Between five and ten years | | | (4,156 | ) | | | (2,373 | ) | | | (8 | ) | | | (2 | ) | | | (76 | ) | | | (6,615 | ) | | | (4,230 | ) | | | (2,088 | ) | | | (15 | ) | | | (1 | ) | | | (15 | ) | | | (6,349 | ) |
| Greater than ten years | | | (5,678 | ) | | | (5,850 | ) | | – | | – | | – | | | (11,528 | ) | | | (5,382 | ) | | | (5,251 | ) | | – | | – | | – | | | (10,633 | ) |
| | | | | | | | | | | | | | | | | | | | | | | | |
| Gross contractual cash flows | | | (16,066 | ) | | | (11,876 | ) | | | (136 | ) | | | (18 | ) | | | (5,452 | ) | | | (33,548 | ) | | | (16,183 | ) | | | (10,733 | ) | | | (130 | ) | | | (16 | ) | | | (6,051 | ) | | | (33,113 | ) |
| | | | | | | | | | | | | | | | | | | | | | | | | |
GSK Annual Report 20092010
160170
Notes to the financial statements
4141Financial instruments and related disclosurescontinued
The following table provides an analysis of the anticipated contractual cash flows for the Group’s derivative instruments, excluding embedded derivatives and equity options which are not material, using undiscounted cash flows. Cash flows in foreign currencies are translated using spot rates at 31st December. The gross cash flows of foreign exchange contracts are presented for the purposes of this table, though, in practice, the Group uses standard settlement arrangements to reduce its liquidity requirements on these instruments.
| | | | | | | | | | | | |
| | | | | | | | | | | | | | | | | | | |
| | | 2009 | | 2008 | | | 2010 | | 2009 | |
| | | Receivables | | Payables | | Receivables | | Payables | | | Receivables | | Payables | | Receivables | | Payables | |
| | | £m | | £m | | £m | | £m | | | £m | | £m | | £m | | £m | |
| | | | | | | | | | | | | | | | |
| Less than one year | | 33,779 | | | (33,606 | ) | | 36,105 | | | (37,738 | ) | | 13,555 | | | (13,511 | ) | | 21,341 | | | (21,318 | ) |
| Between one and two years | | 124 | | | (136 | ) | | 184 | | | (204 | ) | | 288 | | | (365 | ) | | 72 | | | (51 | ) |
| Between two and three years | | 581 | | | (593 | ) | | 110 | | | (120 | ) | | 31 | | | (10 | ) | | 285 | | | (321 | ) |
| Between three and four years | | 42 | | | (54 | ) | | 521 | | | (532 | ) | | 14 | | | (7 | ) | | 21 | | | (19 | ) |
| Between four and five years | | – | | | (6 | ) | | 35 | | | (46 | ) | | – | | – | | 10 | | | (11 | ) |
| Greater than five years | | – | | – | | – | | | (6 | ) | | – | | – | | – | | – | |
| | | | | | | | | | | | | | | | |
| Gross contractual cash flows | | 34,526 | | | (34,395 | ) | | 36,955 | | | (38,646 | ) | | 13,888 | | | (13,893 | ) | | 21,729 | | | (21,720 | ) |
| | | | | | | | | | | | | | | | | |
Derivative financial instruments and hedging programmes
The following table sets out the fair values of derivatives held by GSK.
| | | | | | | | | | | | | | | | | | | | | |
| | | 2009 | | 2008 | | | | | | | | | |
| | | Fair value | | Fair value | | | 2010 | | 2009 | |
| | | Assets | | Liabilities | | Assets | | Liabilities | | | Fair value | | Fair value | |
| | | £m | | £m | | £m | | £m | | | Assets | | Liabilities | | Assets | | Liabilities | |
| | | | | | | | | | £m | | £m | | £m | | £m | |
Cash flow hedges – Cross currency swaps
(principal amount – £nil (2008 - £481 million)) | | – | | – | | – | | | (37 | ) | |
| | | | | | | | | | |
Fair value hedges – Interest rate swaps
(principal amount – £932 million (2008 - £1,042 million)) | | 68 | | – | | 107 | | – | | |
Fair value hedges – Interest rate swaps
(principal amount – £962 million (2009 – £932 million)) | | | 97 | | – | | 68 | | – | |
| | | |
Net investment hedges – Foreign exchange contracts
(principal amount – £(7,756) million (2008 - £(12,848) million)) | | 36 | | | (55 | ) | | 4 | | | (601 | ) | |
| | | |
Net investment hedges – Foreign exchange contracts
(principal amount – £3,506 million (2009 – £7,756 million)) | | | – | | | (23 | ) | | 36 | | | (55 | ) |
| | | | | | | | | | | | | | | | |
| Derivatives designated as accounting hedges | | 104 | | | (55 | ) | | 111 | | | (638 | ) | | 97 | | | (23 | ) | | 104 | | | (55 | ) |
| | | | | | | | | |
| | | |
Foreign exchange contracts
(principal amount – £8,568 million (2008 - £12,093 million)) | | 89 | | | (108 | ) | | 837 | | | (108 | ) | |
| | | |
Foreign exchange contracts
(principal amount – £6,474 million (2009 – £8,568 million)) | | | 88 | | | (160 | ) | | 89 | | | (108 | ) |
| Embedded and other derivatives | | 4 | | | (5 | ) | | 15 | | | (8 | ) | | 5 | | | (10 | ) | | 4 | | | (5 | ) |
| | | |
| | | | | | | | | | | | | | | | |
| Derivatives not designated as accounting hedges | | 93 | | | (113 | ) | | 852 | | | (116 | ) | | 93 | | | (170 | ) | | 93 | | | (113 | ) |
| | | | | | | | | | | | | | | | |
| Total derivative instruments | | 197 | | | (168 | ) | | 963 | | | (754 | ) | | 190 | | | (193 | ) | | 197 | | | (168 | ) |
| | | | | | | | | | | | | | | | | |
| | | |
| Analysed as: | | |
| Current | | 129 | | | (168 | ) | | 856 | | | (752 | ) | | 93 | | | (188 | ) | | 129 | | | (168 | ) |
| Non-current | | 68 | | – | | 107 | | | (2 | ) | | 97 | | | (5 | ) | | 68 | | – | |
| | | | | | | | | | | | | | | | |
| Total | | 197 | | | (168 | ) | | 963 | | | (754 | ) | | 190 | | | (193 | ) | | 197 | | | (168 | ) |
| | | | | | | | | | | | | | | | | |
GSK Annual Report 2009
161
Notes to the financial statements
41Financial instruments and related
disclosurescontinued
Derivative financial instruments
The principal amount on foreign exchange contracts is calculated based onthe net total of outstanding positions at the balance sheet date, calculated net by currency and buy/sell side position.date. The majority of contracts are for periods of 12 months or less.
At 31st December 2009,2010, the Group held outstanding foreign exchange contracts consisting primarily of currency swaps with a total credit fair value of £72 million (2009 – £19 million (2008 – £729 million debit)credit) which represent hedges of inter-company loans and deposits, but are not designated as accounting hedges. Changes in fair value are taken to profit and lossthe income statement in the period to offset the exchange gains and losses on the related inter-company lending and borrowing.
Cash flow hedges
The Group had entered into two cross currency swapsa number of foreign exchange forward contracts and designated them as a cash flow hedge converting fixed Euroof the exchange arising on the US dollar purchase consideration of a highly probable business acquisition. The acquisition occurred in October 2010 and the cash flow hedge matured at that date. The amount recognised in other comprehensive income in 2010 was removed upon maturity of the hedge and included in the initial carrying value of goodwill and intangibles recorded on the acquisition of the entity.
The Group has also entered into a number of foreign exchange forward contracts and designated them as cash flow hedges of the exchange exposure arising on the GBP equivalent interest cost on Euro debt withinloans issued and settled in July and December 2010.
The net fair value movements on cash flow hedges are disclosed in the Group’s Japanese subsidiary, payable annually, to fixed Yen payments. The bond and swaps matured on 3rd June 2009. The risk being hedged was the variabilityconsolidated statement of cash flows arising from currency fluctuations.comprehensive income. No ineffectiveness was recorded on the hedge. The amounts recognised in comprehensive income were reclassifiedcash flow hedges during 2010.
GSK Annual Report 2010
171
Notes to the income statement to offset the exchange gains or losses in the same period on the underlying bond as a result of revaluation at the relevant reporting date.financial statements
Fair value hedges
The Group has designated ana series of interest rate swapswaps as a fair value hedge. The risk being hedged is the variability of the fair value of the bond arising from interest rate fluctuations. Gains and losses on fair value hedges are disclosed in Note 12, ‘Finance costs’.
Net investment hedges
ForeignDuring the year, certain foreign exchange contracts have beenwere designated as net investment hedges in respect of the foreign currency translation risk principally arising on consolidation of the Group’s net investment in its US dollar,Dollar, Euro and Yen foreign operations. At 31st December 2010, the Group held such net investment hedges only in respect of its Euro foreign operations. In addition, Euro loan capital of €5.85 billion issued during 2009 of €1.6 billion, and €4.25 billion fromin previous years has beenis designated as a monetary net investment hedge in respect of the foreign currency translation risk principally arising on consolidation of the Group’s net investment in its Euro operations. Net investment hedge ineffectiveness is disclosed in Note 11, ‘Finance income’.
42Employee share schemes
The Group operates share option schemes, whereby options are granted to employees to acquire shares or ADS in GlaxoSmithKline plc at the grant price, savings-related share option schemes and share award schemes. In addition, GSK operates the Performance Share Plan, whereby awards are granted to employees to acquire shares or ADS in GlaxoSmithKline plc at no cost, subject to the achievement by the Group of specified performance targets and the Share Value Plan, whereby awards are granted to employees to acquire shares or ADS in GlaxoSmithKline plc at no cost after a three year vesting period. The granting of restricted share awards has replaced the granting of options to certain employees as the cost of the scheme more readily equates to the potential gain to be made by the employee.employee and from 2010 onwards, no further grants will be made under the savings-related share option schemes.
Grants under share option schemes are normally exercisable between three and ten years from the date of grant. Grants of restricted shares and share awards are normally exercisable at the end of the three year vesting/performance period. Grants under savings-related share option schemes are normally exercisable after three years’ saving. Grants under share option schemes and awards under the Performance Share Plan are normally granted to employees to acquire shares or ADS in GSK plc but in some circumstances will be settled in cash.
Options under the share option schemes are granted at the market price ruling at the date of grant. In accordance with UK practice, the majority of options under the savings-related share option schemes are granted at a price 20% below the market price ruling at the date of grant. Share options awarded to the Directors and, with effect from the 2004 grant, the CET are subject to performance criteria.
GSK Annual Report 2009
162
Notes to the financial statements
42Employee share schemescontinued
Option pricing
For the purposes of valuing options and awards to arrive at the share based payment charge, the Black-Scholes option pricing model has been used. The assumptions used in the model for 2007, 2008, 2009 and 20092010 are as follows:
| | | | | | | | | | | |
| | | | | | | | | | | | | | | | |
| | | 2009 | | 2008 | | 2007 | | | 2010 | | 2009 | | 2008 | |
| | | | | | | | | | | | |
| Risk-free interest rate | | | 1.4% – 2.9% | | | | 1.3% – 4.8% | | | | 4.7% – 5.3% | | | | 0.8% – 1.9 | % | | | 1.4% – 2.9 | % | | | 1.3% – 4.8 | % |
| Dividend yield | | | 5.2% | | | | 4.8% | | | | 4.0% | | | | 5.3 | % | | | 5.2 | % | | | 4.8 | % |
| Volatility | | | 23% – 29% | | | | 19% – 24% | | | | 17% – 25% | | | | 26% – 29 | % | | | 23% – 29 | % | | | 19% – 24 | % |
| Expected lives of options granted under: | | |
| Share option schemes | | 5 years | | 5 years | | 5 years | | | 5 years | | 5 years | | 5 years | |
| Savings-related share option and share award schemes | | 3-4 years | | 3 years | | 3 years | | | 3-4 years | | 3-4 years | | 3 years | |
| Weighted average share price for grants in the year: | | |
| Ordinary Shares | | | £11.72 | | | £11.59 | | | £14.41 | | | | £12.04 | | | £11.72 | | | £11.59 | |
| ADS | | | $33.73 | | | $45.02 | | | $57.59 | | | | $37.29 | | | $33.73 | | | $45.02 | |
| | | | | | | | | | | | | |
Volatility is determined based on the three and five year share price history where appropriate. The fair value of performance share plan grants take into account market conditions. Expected lives of options were determined based on weighted average historic exercises of options.
| | | | | | | | | | | | | | | | | | | | | | | | | | | | | |
| Options outstanding | | Share option | | Share option | | | Savings-related |
| | schemes – shares | | schemes – ADS | | | share option schemes |
| | | | | | | Weighted | | Weighted | | | | | | Weighted | | | Weighted | | | | | | | Weighted | | Weighted |
| | | Number | | | exercise | | fair | | Number | | | exercise | | | fair | | | Number | | | exercise | | fair |
| | | 000 | | | price | | value | | 000 | | | price | | | value | | | 000 | | | price | | value |
| | | | | | | | | | | | | | | | | | | | | | | | | | | | | |
| At 1st January 2007 | | | 156,703 | | | £15.22 | | | | | 88,431 | | | | $48.02 | | | | | | | | 8,173 | | | £11.11 | | |
| Options granted | | | 10,587 | | | £14.82 | | £3.07 | | | 8,624 | | | | $57.58 | | | | $10.93 | | | | 3,212 | | | £10.50 | | £2.87 |
| Options exercised | | | (9,863 | ) | | £12.10 | | | | | (18,149 | ) | | | $44.27 | | | | | | | | (1,140 | ) | | £9.74 | | |
| Options lapsed | | | (8,386 | ) | | £15.64 | | | | | (1,632 | ) | | | $50.90 | | | | | | | | (1,707 | ) | | £11.33 | | |
| | | | | | | | | | | | | | | | | | | | | | | | | | | | | |
| At 31st December 2007 | | | 149,041 | | | £15.38 | | | | | 77,274 | | | | $49.91 | | | | | | | | 8,538 | | | £11.02 | | |
| Options granted | | | 11,314 | | | £11.50 | | £1.32 | | | 7,690 | | | | $44.89 | | | | $3.84 | | | | 5,570 | | | £9.51 | | £2.56 |
| Options exercised | | | (2,198 | ) | | £11.84 | | | | | (1,989 | ) | | | $42.18 | | | | | | | | (453 | ) | | £10.26 | | |
| Options lapsed | | | (21,602 | ) | | £16.52 | | | | | (7,497 | ) | | | $53.13 | | | | | | | | (2,401 | ) | | £10.67 | | |
| | | | | | | | | | | | | | | | | | | | | | | | | | | | | |
| At 31st December 2008 | | | 136,555 | | | £14.93 | | | | | 75,478 | | | | $49.29 | | | | | | | | 11,254 | | | £10.38 | | |
| Options granted | | | 11,393 | | | £11.76 | | £1.16 | | | 7,741 | | | | $33.68 | | | | $3.41 | | | | 1,648 | | | £9.72 | | £2.22 |
| Options exercised | | | (2,660 | ) | | £11.80 | | | | | (353 | ) | | | $37.03 | | | | | | | | (1,460 | ) | | £11.34 | | |
| Options lapsed | | | (21,269 | ) | | £17.18 | | | | | (9,447 | ) | | | $55.64 | | | | | | | | (3,377 | ) | | £11.09 | | |
| | | | | | | | | | | | | | | | | | | | | | | | | | | | | |
| At 31st December 2009 | | | 124,019 | | | £14.32 | | | | | 73,419 | | | | $46.88 | | | | | | | | 8,065 | | | £9.77 | | |
| | | | | | | | | | | | | | | | | | | | | | | | | | | | | |
| Range of exercise prices | | | £10.76 | | – £19.40 | | | | | $33.42 | | | | – $58.88 | | | | | | | | £9.51 | | | – £11.45 | | |
| | | | | | | | | | | | | | | | | | | | | | | | | | | | | |
Weighted average market
price on exercise | | | | | | £12.33 | | | | | | | | | $40.48 | | | | | | | | | | | £12.04 | | |
| | | | | | | | | | | | | | | | | | | | | | | | | | | | | |
Weighted average remaining
contractual life | | | | | | 4.12 years | | | | | | | 4.77 years | | | | | | | | | | | 2.3 years | | |
| | | | | | | | | | | | | | | | | | | | | | | | | | | | | |
GSK Annual Report 20092010
163172
Notes to the financial statements
42 Employee share schemescontinued
In order to encourage employees to convert options, excluding savings-related share options, held over Glaxo Wellcome or SmithKline Beecham shares or ADS, into those over GlaxoSmithKline shares or ADS, a programme was established to give an additional cash benefit of 10% of the exercise price of the original option provided that the employee did not voluntarily leave the Group for two years from the date of the merger and did not exercise the option before the earlier of six months from the expiry date of the original option and two years from the date of the merger. The cash benefit will also be paid if the options expire unexercised if the market price is below the exercise price on the date of expiry.
| | | | | | | | | | | | | | | | | | | | | | | | | | | | | | | | | | | | | |
Options outstanding
at 31st December 2009 | | Share option | | | Share option | | | Savings-related | |
| | schemes – shares | | | schemes – ADS | | | share option schemes | |
| | | | | | Weighted | | | Latest | | | | | | | Weighted | | | Latest | | | | | | | Weighted | | | Latest | |
| | | Number | | | exercise | | | exercise | | | Number | | | exercise | | | exercise | | | Number | | | Exercise | | | exercise | |
| Year of grant | | 000 | | | price | | | date | | | 000 | | | price | | | date | | | 000 | | | price | | | date | |
| | | | | | | |
| 2000 | | | 12,367 | | | | £14.89 | | | | 10.09.10 | | | | 279 | | | | $58.88 | | | | 09.08.10 | | | | – | | | | – | | | | – | |
| 2001 | | | 32,944 | | | | £18.13 | | | | 25.11.11 | | | | 20,828 | | | | $51.85 | | | | 28.11.11 | | | | – | | | | – | | | | – | |
| 2002 | | | 13,469 | | | | £11.97 | | | | 03.12.12 | | | | 5,605 | | | | $37.66 | | | | 03.12.12 | | | | – | | | | – | | | | – | |
| 2003 | | | 18,595 | | | | £12.67 | | | | 13.12.13 | | | | 10,333 | | | | $43.54 | | | | 16.12.13 | | | | – | | | | – | | | | – | |
| 2004 | | | 6,080 | | | | £11.23 | | | | 02.12.14 | | | | 6,128 | | | | $43.16 | | | | 02.12.14 | | | | – | | | | – | | | | – | |
| 2005 | | | 171 | | | | £13.05 | | | | 30.10.15 | | | | 412 | | | | $47.32 | | | | 30.10.15 | | | | – | | | | – | | | | – | |
| 2006 | | | 8,498 | | | | £14.69 | | | | 25.11.16 | | | | 6,848 | | | | $51.28 | | | | 28.07.16 | | | | 254 | | | | £11.40 | | | | 25.04.10 | |
| 2007 | | | 9,850 | | | | £14.81 | | | | 25.07.17 | | | | 8,069 | | | | $57.59 | | | | 25.07.17 | | | | 1,289 | | | | £10.50 | | | | 24.04.11 | |
| 2008 | | | 10,828 | | | | £11.50 | | | | 23.07.18 | | | | 7,336 | | | | $44.91 | | | | 05.11.18 | | | | 4,881 | | | | £9.51 | | | | 22.04.12 | |
| 2009 | | | 11,217 | | | | £11.76 | | | | 19.07.19 | | | | 7,581 | | | | $33.68 | | | | 22.07.19 | | | | 1,641 | | | | £9.72 | | | | 21.04.13 | |
| | | | | | | |
| Total | | | 124,019 | | | | £14.32 | | | | | | | | 73,419 | | | | $46.88 | | | | | | | | 8,065 | | | | £9.77 | | | | | |
| | | | | | | |
Options normally become exercisable from three years from the date of grant but may, under certain circumstances, vest earlier as set out within the various scheme rules.
There has been no change in the effective exercise price of any outstanding options during the year.
| | | | | | | | | | | | | | | | | | | | | | | | | | | | | | | | | | | | | |
| Options exercisable | | | | | | Share option | | | | | | | Share option | | | | | | | Savings-related | |
| | | | | | schemes – shares | | | | | | | schemes – ADS | | | | | | | share option schemes | |
| | | | | | | | | | | Weighted | | | | | | | | | | | Weighted | | | | | | | | | | | Weighted | |
| | | | | | | Number | | | exercise | | | | | | | Number | | | exercise | | | | | | | Number | | | exercise | |
| | | | | | | 000 | | | price | | | | | | | 000 | | | price | | | | | | | 000 | | | price | |
| | | | | | | | | | | | | | | |
| At 31st December 2007 | | | | | | | 129,209 | | | | £15.47 | | | | | | | | 60,927 | | | | $48.70 | | | | | | | | 307 | | | | £9.52 | |
| | | | | | | | | | | | | | | | | | | | | | | | | | | | | | | | | | | | | |
| At 31st December 2008 | | | | | | | 109,207 | | | | £15.29 | | | | | | | | 55,384 | | | | $48.57 | | | | | | | | 3,248 | | | | £11.45 | |
| | | | | | | | | | | | | | | | | | | | | | | | | | | | | | | | | | | | | |
| At 31st December 2009 | | | | | | | 94,967 | | | | £14.86 | | | | | | | | 53,493 | | | | $47.63 | | | | | | | | 254 | | | | £11.40 | |
| | | | | | | | | | | | | | | |
GSK Annual Report 2009
164
Notes to the financial statements
42 Employee share schemescontinued
| | | | | | | | | | | | | | | | | | | | | | | | | | | | | |
| | | | | | | | | | | | | | | | | | | | | | | | | | | | | |
| Options outstanding | | Share option | | Share option | | | Savings-related |
| | schemes – shares | | schemes – ADS | | | share option schemes |
| | | | | | | Weighted | | Weighted | | | | | | Weighted | | | Weighted | | | | | | | Weighted | | Weighted |
| | | Number | | | exercise | | fair | | Number | | | exercise | | | fair | | | Number | | | exercise | | fair |
| | | 000 | | | price | | value | | 000 | | | price | | | value | | | 000 | | | price | | value |
| | | | | | | | | | | | | | | | | | | | | | | | | | | | | |
| At 1st January 2008 | | | 149,041 | | | £15.38 | | | | | 77,274 | | | | $49.91 | | | | | | | | 8,538 | | | £11.02 | | |
| Options granted | | | 11,314 | | | £11.50 | | £1.32 | | | 7,690 | | | | $44.89 | | | | $3.84 | | | | 5,570 | | | £9.51 | | £2.56 |
| Options exercised | | | (2,198 | ) | | £11.84 | | | | | (1,989 | ) | | | $42.18 | | | | | | | | (453 | ) | | £10.26 | | |
| Options lapsed | | | (21,602 | ) | | £16.52 | | | | | (7,497 | ) | | | $53.13 | | | | | | | | (2,401 | ) | | £10.67 | | |
| | | | | | | | | | | | | | | | | | | | | | | | | | | | | |
| At 31st December 2008 | | | 136,555 | | | £14.93 | | | | | 75,478 | | | | $49.29 | | | | | | | | 11,254 | | | £10.38 | | |
| Options granted | | | 11,393 | | | £11.76 | | £1.16 | | | 7,741 | | | | $33.68 | | | | $3.41 | | | | 1,648 | | | £9.72 | | £2.22 |
| Options exercised | | | (2,660 | ) | | £11.80 | | | | | (353 | ) | | | $37.03 | | | | | | | | (1,460 | ) | | £11.34 | | |
| Options lapsed | | | (21,269 | ) | | £17.18 | | | | | (9,447 | ) | | | $55.64 | | | | | | | | (3,377 | ) | | £11.09 | | |
| | | | | | | | | | | | | | | | | | | | | | | | | | | | | |
| At 31st December 2009 | | | 124,019 | | | £14.32 | | | | | 73,419 | | | | $46.88 | | | | | | | | 8,065 | | | £9.77 | | |
| Options granted | | | 11,257 | | | £12.04 | | £1.19 | | | 7,384 | | | | $37.29 | | | | $3.95 | | | | – | | | – | | – |
| Options exercised | | | (3,625 | ) | | £11.86 | | | | | (916 | ) | | | $36.59 | | | | | | | | (1,310 | ) | | £10.45 | | |
| Options lapsed | | | (21,551 | ) | | £15.10 | | | | | (7,776 | ) | | | $49.62 | | | | | | | | (800 | ) | | £10.02 | | |
| | | | | | | | | | | | | | | | | | | | | | | | | | | | | |
| At 31st December 2010 | | | 110,100 | | | £14.02 | | | | | 72,111 | | | | $45.73 | | | | | | | | 5,955 | | | £9.59 | | |
| | | | | | | | | | | | | | | | | | | | | | | | | | | | | |
| Range of exercise prices | | | £10.76 | | – | £19.40 | | | | | $33.42 | | – | | $58.00 | | | | | | | | £9.51 | | – | £10.50 | | |
| | | | | | | | | | | | | | | | | | | | | | | | | | | | | |
| Weighted average market price on exercise | | | | | | £12.39 | | | | | | | | | $38.71 | | | | | | | | | | | £12.46 | | |
| | | | | | | | | | | | | | | | | | | | | | | | | | | | | |
| Weighted average remaining contractual life | | 4.19 years | | | | | 4.39 years | | | | | | | | | 1.52 years | | |
| | | | | | | | | | | | | | | | | | | | | | | | | | | | | |
| | | | | | | | | | | | | | | | | | | | | | | | | | | | | | | | | | | | | |
| | | | | | | |
Options outstanding
at 31st December 2010 | | Share option | | | Share option | | | Savings-related | |
| | schemes – shares | | | schemes – ADS | | | share option schemes | |
| | | | | | Weighted | | | Latest | | | | | | | Weighted | | | Latest | | | | | | | Weighted | | | Latest | |
| | | Number | | | exercise | | | exercise | | | Number | | | exercise | | | exercise | | | Number | | | Exercise | | | exercise | |
| Year of grant | | 000 | | | price | | | date | | | 000 | | | price | | | date | | | 000 | | | price | | | date | |
| | | | | | | |
| 2001 | | | 29,047 | | | | £18.13 | | | | 29.11.11 | | | | 18,244 | | | | $51.85 | | | | 28.11.11 | | | | – | | | | – | | | | – | |
| 2002 | | | 11,414 | | | | £11.98 | | | | 03.12.12 | | | | 4,727 | | | | $37.68 | | | | 03.12.12 | | | | – | | | | – | | | | – | |
| 2003 | | | 16,256 | | | | £12.67 | | | | 16.12.13 | | | | 9,186 | | | | $43.54 | | | | 16.12.13 | | | | – | | | | – | | | | – | |
| 2004 | | | 5,074 | | | | £11.23 | | | | 03.12.14 | | | | 5,516 | | | | $43.17 | | | | 02.12.14 | | | | – | | | | – | | | | – | |
| 2005 | | | 155 | | | | £13.07 | | | | 02.11.15 | | | | 374 | | | | $47.31 | | | | 02.11.15 | | | | – | | | | – | | | | – | |
| 2006 | | | 6,979 | | | | £14.69 | | | | 28.11.16 | | | | 5,427 | | | | $51.32 | | | | 28.07.16 | | | | – | | | | – | | | | – | |
| 2007 | | | 9,041 | | | | £14.81 | | | | 25.07.17 | | | | 7,061 | | | | $57.54 | | | | 25.07.17 | | | | 175 | | | | £10.50 | | | | 25.04.11 | |
| 2008 | | | 10,306 | | | | £11.50 | | | | 27.07.18 | | | | 7,196 | | | | $44.90 | | | | 05.11.18 | | | | 4,351 | | | | £9.51 | | | | 23.04.12 | |
| 2009 | | | 10,827 | | | | £11.76 | | | | 22.07.19 | | | | 7,228 | | | | $33.68 | | | | 22.07.19 | | | | 1,429 | | | | £9.72 | | | | 22.04.13 | |
| 2010 | | | 11,001 | | | | £12.04 | | | | 21.07.20 | | | | 7,152 | | | | $37.29 | | | | 21.07.20 | | | | – | | | | – | | | | – | |
| | | | | | | |
| Total | | | 110,100 | | | | £14.02 | | | | | | | | 72,111 | | | | $45.73 | | | | | | | | 5,995 | | | | £9.59 | | | | | |
| | | | | | | |
| Options normally become exercisable from three years from the date of grant but may, under certain circumstances, vest earlier as set out within the various scheme rules. |
| There has been no change in the effective exercise price of any outstanding options during the year. |
| | | | | | | | | | | | | | | | | | | | | | | | | | | | | | | | | | | | | |
| | | | | | | | | | | | | | | |
| Options exercisable | | | | | | Share option | | | | | | | Share option | | | | | | | Savings-related | |
| | | | | | schemes – shares | | | | | | | schemes – ADS | | | | | | | share option schemes | |
| | | | | | | | | | | Weighted | | | | | | | | | | | Weighted | | | | | | | | | | | Weighted | |
| | | | | | | Number | | | exercise | | | | | | | Number | | | exercise | | | | | | | Number | | | exercise | |
| | | | | | | 000 | | | price | | | | | | | 000 | | | price | | | | | | | 000 | | | price | |
| | | | | | | | | | | | | | | |
| At 31st December 2008 | | | | | | | 109,207 | | | | £15.29 | | | | | | | | 55,384 | | | | $48.57 | | | | | | | | 3,248 | | | | £11.45 | |
| | | | | | | | | | | | | | | | | | | | | | | | | |
| At 31st December 2009 | | | | | | | 94,967 | | | | £14.86 | | | | | | | | 53,493 | | | | $47.63 | | | | | | | | 254 | | | | £11.40 | |
| | | | | | | | | | | | | | | | | | | | | | | | | |
| At 31st December 2010 | | | | | | | 81,362 | | | | £14.80 | | | | | | | | 53,831 | | | | $48.26 | | | | | | | | 175 | | | | £10.50 | |
| | | | | | | | | | | | | | | |
GSK Annual Report 2010
173
Notes to the financial statements
42 Employee share schemescontinued
GlaxoSmithKline share award schemes
Performance Share Plan
The Group operates a Performance Share Plan whereby awards are granted to Directors and senior executives at no cost. The percentage of each award that vests is based upon the performance of the Group over a three year measurement period. Awards granted to Directors and members of the CET prior to 2009 are subject to a single performance condition which compares GSK’s TSR over the period with the TSR of companies in the comparator group over the same period. For awards granted fromin 2009 onwardsand 2010 to Directors and members of the CET, 40% of the award will beis based on the achievement of adjusted free cash flow targets over a three year measurement period. The remaining 60% of the award will beis based on relative TSR performance against a comparator group as described on page 78.pages 85 and 87. Half of the TSR element of each award will beis measured over three years and half over four years.
For those awards made to all other eligible employees prior to 2009 the performance conditions consist of two parts, each of which applies to 50% of the award. The first part of the performance condition compares GSK’s EPS growth to the increase in the UK Retail Prices Index over the three year measurement period. The second part of the performance condition compares GSK’s TSR over the period with the TSR of companies in the comparator group over the same period. For awards granted from 2009 onwards, the first part of the performance condition continues to be based on EPS. The second part of the performance condition is based on strategic or operational business measures, over a three year measurement period, specific to the employee’s business area.
| | | | | | | | | | | |
| | | | | | | | | | | | | | | | | | |
| Number of shares and ADS issuable | | Shares | | Weighted | | ADS | | Weighted | | | Shares | | Weighted | | ADS | | Weighted | |
| | Number (000) | | fair value | | Number (000) | | fair value | | | Number (000) | | fair value | | Number (000) | | fair value | |
| At 1st January 2007 | 4,756 | | | | | | 4,034 | | | | |
| Awards granted | | 2,071 | | | £10.26 | | 1,501 | | | $34.87 | | |
| Awards exercised | | | (147 | ) | | | (77 | ) | | |
| Awards cancelled | | | (949 | ) | | | (1,131 | ) | | |
| | | | | | | | | | | | | | | | |
| At 31st December 2007 | | 5,731 | | 4,327 | | |
| At 1st January 2008 | | | 5,731 | | 4,327 | |
| Awards granted | | 2,834 | | | £7.77 | | 1,467 | | | $27.99 | | | 2,834 | | | £7.77 | | 1,467 | | | $27.99 | |
| Awards exercised | | | (1,519 | ) | | | (1,516 | ) | | | | (1,519 | ) | | | (1,516 | ) | |
| Awards cancelled | | | (511 | ) | | | (420 | ) | | | | (511 | ) | | | (420 | ) | |
| | | | | | | | | | | | | | | | |
| At 31st December 2008 | | 6,535 | | 3,858 | | | 6,535 | | 3,858 | |
| Awards granted | | 3,365 | | | £8.80 | | 1,392 | | | $29.45 | | | 3,365 | | | £8.80 | | 1,392 | | | $29.45 | |
| Awards exercised | | | (1,270 | ) | | | (21 | ) | | | | (1,270 | ) | | | (21 | ) | |
| Awards cancelled | | | (1,024 | ) | | | (1,497 | ) | | | | (1,024 | ) | | | (1,497 | ) | |
| | | | | | | | | | | | | | | | |
| At 31st December 2009 | | 7,606 | | 3,732 | | | 7,606 | | 3,732 | |
| Awards granted | | | 3,812 | | | £9.13 | | 1,624 | | | $29.91 | |
| Awards exercised | | | | (440 | ) | | | (386 | ) | |
| Awards cancelled | | | | (2,085 | ) | | | (1,357 | ) | |
| | | | | | | | | | | | | | | | |
| At 31st December 2010 | | | 8,893 | | 3,613 | |
| | | | | | | | | | |
Share Value Plan
The Group operates a Share Value Plan whereby awards are granted, in the form of shares, to certain employees at no cost. The awards vest after three years. There are no performance criteria attached.
| | | | | | | | | | | | | | | | | | | |
| | | Shares | | Weighted | | ADS | | Weighted | | | | | | | | | |
| | | Number (000) | | fair value | | Number (000) | | fair value | | | Shares | | Weighted | | ADS | | Weighted | |
| | | | | | | | | | Number (000) | | fair value | | Number (000) | | fair value | |
| At 1st January 2007 | | 8,794 | | 7,629 | | |
| Awards granted | | 5,155 | | | £13.22 | | 4,231 | | | $52.08 | | |
| Awards exercised | | | (3,643 | ) | | | (3,038 | ) | | |
| Awards cancelled | | | (672 | ) | | | (539 | ) | | |
| | | | | | | | | | | | | | | | |
| At 31st December 2007 | | 9,634 | | 8,283 | | |
| At 1st January 2008 | | | 9,634 | | 8,283 | |
| Awards granted | | 5,572 | | | £9.85 | | 4,640 | | | $36.46 | | | 5,572 | | | £9.85 | | 4,640 | | | $36.46 | |
| Awards exercised | | | (926 | ) | | | (931 | ) | | | | (926 | ) | | | (931 | ) | |
| Awards cancelled | | | (592 | ) | | | (630 | ) | | | | (592 | ) | | | (630 | ) | |
| | | | | | | | | | | | | | | | |
| At 31st December 2008 | | 13,688 | | 11,362 | | | 13,688 | | 11,362 | |
| Awards granted | | 5,572 | | | £9.86 | | 4,291 | | | $30.53 | | | 5,572 | | | £9.86 | | 4,291 | | | $30.53 | |
| Awards exercised | | | (4,345 | ) | | | (3,783 | ) | | | | (4,345 | ) | | | (3,783 | ) | |
| Awards cancelled | | | (680 | ) | | | (561 | ) | | | | (680 | ) | | | (561 | ) | |
| | | | | | | | | | | | | | | | |
| At 31st December 2009 | | 14,235 | | 11,309 | | | 14,235 | | 11,309 | |
| Awards granted | | | 5,844 | | | £10.04 | | 4,355 | | | $31.30 | |
| Awards exercised | | | | (4,993 | ) | | | (3,939 | ) | |
| Awards cancelled | | | | (834 | ) | | | (747 | ) | |
| | | | | | | | | | | | | | | | |
| At 31st December 2010 | | | 14,252 | | 10,978 | |
| | | | | | | | | | |
GSK Annual Report 20092010
165174
Notes to the financial statements
42 Employee share schemescontinued
Deferred Investment Award Plan
The Group operates a Deferred Investment Award Plan whereby awards are granted, in the form of notional shares, to certain senior executives at no cost. Awards typically vest over a three-year period commencing on the fourth anniversary from date of grant with 50% of the award initially vesting and then 25% in each of the subsequent two years. There are no performance criteria attached.
| | | | | | | | | | | |
| | | | | | | | | | | | | | | | | | |
| Number of shares and ADS issuable | | Shares | | Weighted | | ADS | | Weighted | | | Shares | | Weighted | | ADS | | Weighted | |
| | Number (000) | | fair value | | Number (000) | | fair value | | | Number (000) | | fair value | | Number (000) | | fair value | |
| | | | | | | | | | | | | | | | |
| At 1st January 2007 | | 133 | | 65 | | |
| Awards granted | | 95 | | | £13.20 | | 40 | | | $53.40 | | |
| Awards exercised | | – | | | (9 | ) | | |
| Awards cancelled | | | (4 | ) | | – | | |
| | | | | | | | |
| At 31st December 2007 | | 224 | | 96 | | |
| At 1st January 2008 | | | 224 | | 96 | |
| Awards granted | | 334 | | | £11.70 | | 70 | | | $43.80 | | | 334 | | | £11.70 | | 70 | | | $43.80 | |
| Awards exercised | | | (20 | ) | | | (20 | ) | | | | (20 | ) | | | (20 | ) | |
| Awards cancelled | | – | | | (27 | ) | | | – | | | (27 | ) | |
| | | | | | | | | | | | | | | | |
| At 31st December 2008 | | 538 | | 119 | | | 538 | | 119 | |
| Awards granted | | 46 | | | £12.04 | | 132 | | | $31.94 | | | 46 | | | £12.04 | | 132 | | | $31.94 | |
| Awards exercised | | | (15 | ) | | | (32 | ) | | | | (15 | ) | | | (32 | ) | |
| Awards cancelled | | | (20 | ) | | | (10 | ) | | | | (20 | ) | | | (10 | ) | |
| | | | | | | | | | | | | | | | |
| At 31st December 2009 | | 549 | | 209 | | | 549 | | 209 | |
| Awards granted | | | 290 | | | £12.20 | | 96 | | | $36.85 | |
| Awards exercised | | | | (72 | ) | | | (9 | ) | |
| Awards cancelled | | | | (23 | ) | | | (16 | ) | |
| | | | | | | | | | | | | | | | |
| At 31st December 2010 | | | 744 | | 280 | |
| | | | | | | | | | |
Employee Share Ownership Plan Trusts
The Group sponsors Employee Share Ownership Plan (ESOP) Trusts to acquire and hold shares in GlaxoSmithKline plc to satisfy awards made under employee incentive plans and options granted under employee share option schemes. The trustees of the ESOP Trusts purchase shares on the open market with finance provided by the Group by way of loans or contributions. Costs of running the ESOP Trusts are charged to the income statement. Shares held by the ESOP Trusts are deducted from other reserves and held at the value of proceeds receivable from employees on exercise. If there is deemed to be a permanent diminution in value this is reflected by a transfer to retained earnings. The Trusts also acquire and hold shares to meet notional dividends re-invested on deferred awards under the SmithKline Beecham Mid-Term Incentive Plan. The trustees have waived their rights to dividends on the shares held by the ESOP Trusts.
| | | | | | | |
| | | | | | | | | | |
| Shares held for share award schemes | | 2009 | | 2008 | | | 2010 | | 2009 | |
| | | | | | | | |
| Number of shares (’000) | | 57,197 | | 53,147 | | |
| Number of shares (‘000) | | | 51,125 | | 57,197 | |
| | | | | | | | |
| | | | | | | |
| | | | | | | | | | |
| | | £m | | £m | | | £m | | £m | |
| | | | | | | | |
| Nominal value | | 14 | | 13 | | | 13 | | 14 | |
| Carrying value | | 217 | | 234 | | | 208 | | 217 | |
| Market value | | 755 | | 683 | | | 634 | | 755 | |
| | | | | | | | |
| | | | | | | |
| | | | | | | | | | |
| Shares held for share option schemes | | 2009 | | 2008 | | | 2010 | | 2009 | |
| | | | | | | | |
| Number of shares (’000) | | 60,538 | | 75,822 | | |
| Number of shares (‘000) | | | 54,347 | | 60,538 | |
| | | | | | | | |
| | | | | | | | | |
| | | £m | | | £m | |
| | | | |
| Nominal value | | | 15 | | | | 19 | |
| Carrying value | | | 921 | | | | 1,211 | |
| Market value | | | 799 | | | | 974 | |
| | | | |
GSK Annual Report 2009| | | | | | | | | |
| | | | | |
| | | £m | | | £m | |
| | | | | |
| Nominal value | | | 14 | | | | 15 | |
| Carrying value | | | 637 | | | | 921 | |
| Market value | | | 674 | | | | 799 | |
| | | | | |
166175
Notes to the financial statements
43Principal Group companies
The following represent the principal subsidiary and associated undertakings of the GlaxoSmithKline Group at 31st December 2009.2010. Details are given of the principal country of operation, the location of the headquarters, the business sector and the business activities. The equity share capital of these undertakings is wholly owned by the Group except where its percentage interest is shown otherwise. All companies are incorporated in their principal country of operation except where stated.
| | | | | | | | | | | | | |
|
| Europe | | Location | | Subsidiary | | Sector | | Activity | | % |
| |
| England | | Brentford | | +GlaxoSmithKline Holdings Limited | | Ph,CH | | h | | | | |
| | | Brentford | | +GlaxoSmithKline Holdings (One) Limited | | Ph,CH | | h | | | | |
| | | Brentford | | +GlaxoSmithKline Services Unlimited | | Ph,CH | | s | | | | |
| | | Brentford | | +GlaxoSmithKline Mercury Limited | | Ph | | h | | | | |
| | | Brentford | | GlaxoSmithKline Finance plc | | Ph,CH | | f | | | | |
| | | Brentford | | GlaxoSmithKline Capital plc | | Ph,CH | | f | | | | |
| | | Brentford | | SmithKline Beecham Limited | | Ph,CH | | d e h m p r | | | | |
| | | Brentford | | Wellcome Limited | | Ph,CH | | h | | | | |
| | | Brentford | | Glaxo Group Limited | | Ph | | h | | | | |
| | | Brentford | | Glaxo Operations UK Limited | | Ph | | p | | | | |
| | | Brentford | | GlaxoSmithKline Export Limited | | Ph | | e | | | | |
| | | Brentford | | GlaxoSmithKline Research & Development Limited | | Ph | | d r | | | | |
| | | Brentford | | GlaxoSmithKline UK Limited | | Ph | | m p | | | | |
| | | Brentford | | Glaxochem Pte Ltd (i) | | Ph | | h | | | | |
| | Brentford | | Setfirst Limited | | Ph,CH | | h | | | | |
| | | Brentford | | The Wellcome Foundation Limited | | Ph | | p | | | | |
| | | Cambridge | | Domantis Limited | | Ph | | d r | | | | |
| | Brentford | | SmithKline Beecham Overseas Limited | | Ph | | h | | | | |
| | Brentford | | SmithKline Beecham Holdings (UK) Limited | | Ph | | h | | | | |
| | | Brentford | | ViiV Healthcare Limited | | Ph | | h | | | 85 | |
| | | Brentford | | ViiV Healthcare UK Limited | | Ph | | m s | | | 85 | |
| | | Brentford | | ViiV Healthcare Trading Services Limited | | Ph | | e f | | | 85 | |
| |
| Austria | | Vienna | | GlaxoSmithKline Pharma GmbH | | Ph | | m | | | | |
| |
| Belgium | | Genval | | GlaxoSmithKline S.A. | | Ph | | m | | | | |
| | | Rixensart | | GlaxoSmithKline Biologicals S.A. | | Ph | | d e m p r | | | | |
| |
| Czech Republic | | Prague | | GlaxoSmithKline s.r.o. | | Ph,CH | | m | | | | |
| |
| Denmark | | Orestadt | | GlaxoSmithKline Consumer Healthcare A/S | | CH | | m | | | | |
| | | Brøndby | | GlaxoSmithKline Pharma A/S | | Ph | | m | | | | |
| |
| Finland | | Espoo | | GlaxoSmithKline Oy | | Ph | | m | | | | |
| |
| France | | Marly le Roi | | Groupe GlaxoSmithKline S.A.S. | | Ph | | h | | | | |
| | | Marly le Roi | | Laboratoire GlaxoSmithKline S.A.S. | | Ph | | m r d | | | | |
| | | Marly le Roi | | Glaxo Wellcome Production S.A.S. | | Ph | | p | | | | |
| | | Marly le Roi | | GlaxoSmithKline Sante Grand Public S.A.S. | | CH | | m | | | | |
| | | Marly le Roi | | ViiV Healthcare S.A.S. | | Ph | | m | | | 85 | |
| | St. Amand Les Eaux | | GlaxoSmithKline Biologicals S.A.SS.A.S. | | Ph | | p | | | | |
| |
| Germany | | Buehl | | GlaxoSmithKline Consumer Healthcare GmbH & Co. KG | | CH | | d h m p r s | | | | |
| | | Munich | | GlaxoSmithKline GmbH & Co. KG | | Ph | | d h m p r s | | | | |
| |
| Greece | | Athens | | GlaxoSmithKline A.E.B.E | | Ph,CH | | m | | | | |
| |
| Hungary | | Budapest | | GlaxoSmithKline Medicine and Healthcare Products Limited | | Ph,CH | | e m | | | | |
| |
| Italy | | Verona | | GlaxoSmithKline S.p.A. | | Ph | | d h m r | | | | |
| | | Milan | | GlaxoSmithKline Consumer Healthcare S.p.A. | | CH | | m | | | | |
| | | Verona | | GlaxoSmithKline Manufacturing S.p.A. | | Ph | | p | | | | |
| |
GSK Annual Report 20092010
167176
Notes to the financial statements
43Principal Group companiescontinued
| | | | | | | | | | | | | |
|
| Europe | | Location | | Subsidiary | | Sector | | Activity | | % |
| |
| Luxembourg | | Mamer | | GlaxoSmithKline International (Luxembourg) S.A.R.L | | Ph,CH | | f h | | | | |
| |
| Netherlands | | Zeist | | GlaxoSmithKline B.V. | | Ph | | m | | | | |
| |
| | | UtrechtZeist | | GlaxoSmithKline Consumer Healthcare B.V. | | CH | | m | | | | |
| |
| Norway | | Oslo | | GlaxoSmithKline AS | | Ph | | m | | | | |
| |
| Poland | | Poznan | | GlaxoSmithKline Pharmaceuticals S.A. | | Ph | | p | | | 97 | |
| | | Poznan | | GSK Services Sp.z o.o. | | Ph | | m | | | | |
| | | Warsaw | | GlaxoSmithKline Consumer Healthcare Sp.z o.o. | | CH | | m e | | | | |
| |
| Portugal | | Alges | | GlaxoSmithKline-Produtos Farmaceuticos, Limitada | | Ph | | m | | | | |
| |
| Republic of | | Carrigaline | | SmithKline Beecham (Cork) Limited (i)(ii) | | Ph | | d p r | | | | |
| Ireland | | Cork | | GlaxoSmithKline Trading Services Limited (i)(ii) | | Ph | | e | | | | |
| | | Dublin | | GlaxoSmithKline Consumer Healthcare (Ireland) Limited (i)(ii) | | CH | | m | | | | |
| | | Dublin | | GlaxoSmithKline (Ireland) Limited | | Ph | | m | | | | |
| | | Dungarvan | | Stafford Miller (Ireland) Limited (i)(ii) | | CH | | p | | | | |
| | | Dungarvan | | GlaxoSmithKline Dungarvan Limited (i)(ii) | | CH | | p | | | | |
| |
| Romania | | BrasoviBrasov | | Europharm Holding S.A. | | Ph,CH | | s | | | | |
| |
| | | Bucharest | | GlaxoSmithKline (GSK) S.R.L. | | Ph | | m r s | | | | |
| |
| Russian | | Moscow | | GlaxoSmithKline Trading ZAO | | Ph | | m | | | | |
| Federation | | Moscow | | GlaxoSmithKline Healthcare ZAO | | CH | | m | | | | |
| |
| Spain | | Madrid | | GlaxoSmithKline S.A. | | Ph | | m | | | | |
| | | Madrid | | GlaxoSmithKline Consumer Healthcare S.A. | | CH | | m | | | | |
| | | Aranda de Duero | | Glaxo Wellcome, S.A. | | Ph | | p | | | | |
| |
| Sweden | | Solna | | GlaxoSmithKline AB | | Ph | | m | | | | |
| |
| Switzerland | | Muenchenbuchsee | | GlaxoSmithKline AG | | Ph | | m | | | | |
| |
| | | | | | | | | | | | | |
USA | | | | | | | | | | | | |
| |
| USA | | Coral GablesResearch Triangle Park | | Stiefel Laboratories, Inc. | | Ph | | h m p | | | | |
| | | HamiltonMarietta | | Corixa Corporation | | Ph | | m p | | | | |
| | | Philadelphia | | GlaxoSmithKline LLC | | Ph,CH | | d e h m p r s | | | | |
| | | Pittsburgh | | GlaxoSmithKline Consumer Healthcare, L.P. | | CH | | m p | | | 88 | |
| | | Pittsburgh | | Block Drug Company, Inc. | | CH | | h m | | | | |
| | | Wilmington | | GlaxoSmithKline Holdings (Americas) Inc. | | Ph,CH | | h | | | | |
| | | Wilmington | | GlaxoSmithKline Capital Inc. | | Ph | | f | | | | |
| | | Cambridge | | Sirtris Pharmaceuticals Inc. | | Ph | | r | | | | |
| | | Research Triangle Park | | ViiV Healthcare Company | | Ph | | m | | | 85 | |
| |
| | | | | | | | | | | | | |
Americas | | | | | | | | | | | | |
| |
| Bermuda | | Hamilton | | GlaxoSmithKline Insurance Ltd | | Ph,CH | | i | | | | |
| |
| Canada | | Mississauga | | GlaxoSmithKline Inc. | | Ph | | m p r | | | | |
| | | OakvilleMississauga | | GlaxoSmithKline Consumer Healthcare Inc. | | CH | | m | | | | |
| | | Laval | | ID Biomedical Corporation | | Ph | | h | | | | |
| | | Quebec City | | ID Biomedical Corporation of Quebec | | Ph | | d m p r | | | | |
| |
| Mexico | | Delegacion Tlalpan | | GlaxoSmithKline Mexico S.A. de C.V. | | Ph,CH | | e m p s | | | | |
| |
| Puerto Rico | | Guaynabo | | GlaxoSmithKline Puerto Rico Inc. | | Ph | | m | | | | |
| |
| | | | | | | | | | | | | |
| Asia Pacific | | | | | | | | | | |
| |
| Australia | | Boronia | | GlaxoSmithKline Australia Pty Ltd | | Ph,CH | | d e m p r | | | | |
| |
| China | | Beijing | | GlaxoSmithKline (China) Investment Co. Ltd | | Ph,CH | | d h m s | | | | |
| | | Hong Kong | | GlaxoSmithKline Limited | | Ph,CH | | m | | | | |
| | | Shanghai | | GlaxoSmithKline Biologicals (Shanghai) Ltd | | Ph | | m p | | | | |
| | | Tianjin | | Sino-American Tianjin Smith Kline & French Laboratories Ltd | | CH | | d m p r | | | 55 | |
| |
GSK Annual Report 20092010
168177
Notes to the financial statements
43Principal Group companiescontinued
| | | | | | | | | | | | | |
|
| Asia Pacific | | Location | | Subsidiary | | Sector | | Activity | | % |
| |
| India | | Mumbai | | GlaxoSmithKline Pharmaceuticals Limited | | Ph | | m p | | | 51 | |
| | | Nabha | | GlaxoSmithKline Consumer Healthcare Limited (ii)(iii) | | CH | | d e m p r | | | 43 | |
| |
| Malaysia | | Petaling Jaya | | GlaxoSmithKline Pharmaceutical Sdn Bhd | | Ph | | m | | | | |
| | | Selangor | | GlaxoSmithKline Consumer Healthcare Sdn Bhd | | CH | | m | | | | |
| |
| New Zealand | | Auckland | | GlaxoSmithKline NZ Limited | | Ph,CH | | m | | | | |
| |
| Pakistan | | Karachi | | GlaxoSmithKline Pakistan Limited | | Ph,CH | | m p e | | | 7982 | |
| |
| Philippines | | Makati | | GlaxoSmithKline Philippines Inc | | Ph,CH | | m | | | | |
| |
| Singapore | | Singapore | | Glaxochem Pte Ltd | | Ph | | h | | | | |
| | Singapore | | Glaxo Wellcome Manufacturing Pte Ltd | | Ph | | d h p r | | | | |
| | | Singapore | | GlaxoSmithKline Pte Ltd | | Ph,CH | | m | | | | |
| |
| South Korea | | Seoul | | GlaxoSmithKline Korea Limited | | Ph, ,CHCH | | m | | | | |
| |
| Thailand | | Bangkok | | GlaxoSmithKline (Thailand) Limited | | Ph,CH | | m | | | | |
| |
| | | | | | | | | | | | | |
Japan | | | | | | | | | | | | |
| |
| Japan | | Tokyo | | GlaxoSmithKline K.K. | | Ph,CH | | d m p | | | | |
| |
| | | | | | | | | | | | | |
| Latin America | | | | | | | | | | |
| |
| Argentina | | Buenos Aires | | GlaxoSmithKline Argentina S.A. | | Ph,CH | | d e m p r | | | | |
| | Buenos Aires | | Laboratorios Phoenix Sociedad Anonima Industrial Comercial y Financiera | | Ph | | d e m p | | | | |
| |
| Brazil | | Rio de Janeiro | | GlaxoSmithKline Brasil Limitada | | Ph,CH | | e m p | | | | |
| |
| Colombia | | Bogota | | GlaxoSmithKline Colombia S.A. | | Ph,CH | | m | | | | |
| |
| Venezuela | | Caracas | | GlaxoSmithKline Venezuela, C.A. | | Ph,CH | | m | | | | |
| |
| | | | | | | | | | | | | |
| Middle East & Africa | | | | | | | | | | |
| |
| Egypt | | Cairo | | GlaxoSmithKline S.A.E | | Ph | | m p | | | 91 | |
| |
| South Africa | | BryanstonJohannesburg | | GlaxoSmithKline South Africa (Pty) Limited | | Ph,CH | | e m p | | | | |
| |
| Turkey | | Istanbul | | GlaxoSmithKline Ilaclarillaclari Sanayi ve Ticaret A.S. | | Ph,CH | | m | | | | |
| |
| | | | | | | | | | | | | |
| |
| USA | | Location | | Associate | | Sector | | Activity | | % |
| |
| USA | | Madison | | Quest Diagnostics Incorporated (iii)(iv) | | Clinical testing | | | | | 1718 | |
| |
| | | | | | | | | | | | | |
| Middle East & Africa | | | | | | | | | | |
| |
| South Africa | | Johannesburg | | Aspen Pharmacare Holdings Limited (iii)(iv) | | Ph,CH | | m p r | | | 19 | |
| |
| (i) | | Incorporated in Singapore. |
|
| (ii) | | Exempt from the provisions of Section 7 of the Companies (Amendment) Act 1986 (Ireland). |
| |
(ii)(iii) | | Consolidated as a subsidiary undertaking in accordance with Section 1162 (4)(a) of the Companies Act 2006 on the grounds of dominant influence. |
| |
(iii)(iv) | | Equity accounted on the grounds of significant influence. Subsequent to the year-end GSK sold its entire shareholding in Quest Diagnostics Inc. See Note 20 for further details. |
| |
| + | | Directly held wholly owned subsidiary of GlaxoSmithKline plc. |
Key
| | |
| Business sector: | | Ph Pharmaceuticals, CH Consumer Healthcare |
| Business activity: | | d development, e exporting, f finance, h holding company, i insurance, m marketing, p production, r research,
s service |
Full details of all Group subsidiary and associated undertakings will be attached to the company’s Annual Return to be filed with the Registrar of Companies. Each of GlaxoSmithKline Capital Inc. and GlaxoSmithKline Capital plc is a wholly-owned finance subsidiary of the company, and the company has fully and unconditionally guaranteed the securities issued by each of GlaxoSmithKline Capital Inc. and GlaxoSmithKline Capital plc.
GSK Annual Report 20092010
169178
Notes to the financial statements
44Legal proceedings
The Group is involved in significant legal and administrative proceedings, principally product liability, intellectual property, tax, anti-trust and governmental investigations, as well as related private litigation. The Group makes provision for these proceedings on a regular basis as summarised in Note 2, ‘Accounting principles and policies’ and Note 29, ‘Other provisions’. In respect of a number ofThe Group may become involved in legal proceedings, in respect of which the Group is involved, it is not possible to make a reasonablereliable estimate of the expected financial effect, if any, that willcould result from ultimate resolution of the proceedings. In these cases, the Group may disclose information with respect to the nature and facts of theappropriate disclosures about such cases would be included but no provision is typicallywould be made. Intellectual property claims include challenges to the validity and enforceability of the Group’s patents on various products or processes as well as assertions of non-infringement of those patents. A loss in any of these cases could result in loss of patent protection for the product at issue. The consequences of any such loss could be a significant decrease in sales of that product and could materially affect future results of operations for the Group.
Legal expenses incurred and provisions related to legal claims are charged to selling, general and administration costs. Provisions are made, after taking appropriate legal and other specialist advice, whenwhere an outflow of resources is considered probable and a reasonablereliable estimate can be made of the likely outcome of the dispute. The Group has established an actuarially determined provision forIn respect of product liability claims related to certain products there is sufficient history of claims made and settlements to enable management to make a reliable estimate of the provision required to cover unasserted claims. In certain cases an incurred but not yet reported (IBNR) estimate using actuarial techniques as appropriate is used to determine and estimate the Group’s exposure, as described in Note 29, ‘Other provisions’. At 31st December 2009,2010, the Group’s aggregate provision for legal and other disputes (not including tax matters described in Note 14, ‘Taxation’) was £2.0£4.0 billion. The ultimate liability for legal claims may vary from the amounts provided and is dependent upon the outcome of litigation proceedings, investigations and possible settlement negotiations. The Group’s position could change over time, and, therefore, there can therefore, be no assurance that any losses that result from the outcome of any legal proceedings will not exceed the amount of the provisions reported in the Group’s financial accounts by a material amount. If this were to happen, it could have a material adverse impact on the results of operation of the Group in the reporting period in which the judgementsjudgments are incurred or the settlements entered into. The most significant of thosethese matters are described below.
Intellectual property
Advair/Seretide
In October 2007,A number of companies have challenged the Group filed a complaint withGroup’s patents coveringAdvair/Seretidein certain European jurisdictions, including in the Patent Dispute Chamber ofUK, Belgium, France, Germany, Ireland and the Regional Court in Düsseldorf, Germany against Neolab (UK) for infringement of its German patent claiming compositions containingNetherlands. As reported previously, the combination of salmeterol and fluticasone propionate used inGroup’sSeretide (known asVianiin Germany). The complaint was based on Neolab’s stated intention by letter to market a salmeterol/fluticasone combination patent covering the product in Germanythe UK was revoked in 2008 (which event did not occur). A trial took place2004. On 23rd February 2010, in the Patent Dispute Chamber of the Regional Court in Düsseldorf in January 2009 which resulted in a permanent injunction against Neolab.actions brought by Mylan, Hexal, Neolab has appealed and the appeal hearing has been scheduled for 8th July 2010.
In January 2009, Neolab filed an action to invalidate the combination patent inIvax, the Federal Court of Germany. Revocation actions againstin Munich revoked the Group’s GermanSeretidecombination patent for lack of inventive step. The Group has appealed this decision. In the Netherlands, in Germany have also been filedan action brought by Mylan Dura GmbH (March 2008), Hexal AG (December 2008) and Ivax (October 2009). The four revocation actions were heard together on 23rd February 2010. The court advised the parties that a decision will be issued within a few weeks following the hearing. The basic patent covering the combination product inSeretideexpires in September 2010 but is subject to a Supplementary Protection Certificate, which extends protection until September 2013.
In July 2009, Sandoz and Hexal, initiated a revocation action in the District Court of The Hague againston 26th January 2011 revoked the Group’s Dutch combination patent relating toSeretide. The hearing, originally scheduled for 19th February 2010, has been rescheduled for 26th November 2010. The basic patent covering the combination product inSeretideexpires in September 2010 but is subject to a Supplementary Protection Certificate (SPC) which extends protection for the product until September 2013. The Group is determining whether to appeal this decision.
A revocation action against the basic patent covering theSeretidecombination in Ireland was filed in the High Court in Dublin on behalf of Ivax in July 2008. The trial took place from 24th March to 12th May 2009. The High Court handed down a decision on 26th June 2009 finding the patent invalid for obviousness. The decision related solely to the Irish combination patent forSeretideand is not binding in any other decision. The Group filed an appeal of this decision in October 2009. No trial date has been set for the appeal.
An action for revocation of the FrenchSeretidecombination patent was filed by Sandoz with the Tribunal de Grande Instance of Paris on 5th October 2009. No trial dateParis. Trial has yet been set.scheduled for June 2011. The basic patent covering the combination product inSeretideexpiresexpired in September 2010 but is subject to a Supplementary Protection Certificate,SPC which extends protection until September 2013.
ArgatrobanIn January 2011, Sandoz initiated a revocation action against the Group’s BelgianSeretidepatent.
To date, no genericSeretideproduct has been approved in any major European market despite the revocation of certain Group patents coveringSeretidein some countries.
argatroban
In December 2007, Encysive Pharmaceuticals Inc., Mitsubishi Kasei Corporation and the Group filed an action in the USUnited States District Court for the Southern District of New York against Barr Laboratories, Inc. for infringement of Mitsubishi’s pharmaceutical composition patent covering Argatroban.argatroban. Pursuant to a license from Mitsubishi, Encysive has developed Argatrobanargatroban for the treatment of heparin-induced thrombocytopenia and holds the New Drug Application approved by the US FDA. Encysive has licensed the US marketing rights to Argatrobanfor argatroban to the Group. The Mitsubishi patent expires in June 2014. Barr had(now Teva Pharmaceuticals, Inc.) filed an Abbreviated New Drug Application (ANDA) with the FDA with a certification of invalidity, unenforceability and non-infringement of the Mitsubishi patent. A two-weekOn 17th June 2010, the Group and its partners prevailed against Teva, with the trial injudge ruling that Mitsubishi’s patent covering the caseformulation for injectable argatroban was held in January 2010,infringed and the parties are awaitingnot invalid. As a decision. FDA approval of that ANDA is stayed until the earlier of May 2010 or resolutionresult of the patent infringement action.
GSK Annual Report 2009
170
NotesCourt’s decision, Teva is precluded from launching its generic product until 20th June 2014, the expiration date of the patent. Teva appealed the decision to the financial statementsCourt of Appeals for the Federal Circuit.
44 Legal proceedingscontinued
Arzerra
In October 2009, the Group filed an action in the USUnited States District Court for the Southern District of Florida for a declaration that U.S.US Patent No. 6,331,415 (the so-called ‘Cabilly II’ patent), which is owned jointly by Genentech, Inc. and City of Hope, is invalid, unenforceable, or not infringed by GSK’sthe Group’s productArzerra(ofatumumab).Arzerrawas approved by the FDA for chronic lymphocytic leukaemia (an orphan indication) in October 2009. In February 2010, the Group voluntarily dismissed the case and filed a new case in the USUnited States District Court for the Northern District of California where the suit is currently pending.
On 23rd March 2010, Genentech and Biogen Idec filed suit against the Group in the United States District Court for the Southern District of California alleging that the Group’s sale ofArzerrainduces and contributes to infringement of US Patent No. 7,682,612. That patent claims the treatment of chronic lymphatic leukemia with an anti-CD-20 monoclonal antibody. The case is in its early stages.
GSK Annual Report 2010
179
Notes to the financial statements
44Legal proceedingscontinued
Avodart
In January 2008, the Group received notice that Barr Laboratories filed an ANDA with the FDA with an allegation of invalidity of the three patents listed in the Orange Book which cover the active ingredient inAvodart, and its use to treat benign prostatic hyperplasia (BPH).hyperplasia. Two of these patents expire in 2013, and one expires in 2015. In February 2008, the Group filed an action in the USUnited States District Court for the District of Delaware against Barr for infringement of these patents. The basic compoundIn March 2010, the Group and Barr (now Teva Pharmaceuticals, Inc.) reached a settlement of the litigation. On 12th May 2010, the district court dismissed the case. Pursuant to the settlement, Teva will obtain a license to enter the US market with a generic dutasteride product in the fourth quarter of 2015 or earlier under certain circumstances.
In November 2010, Banner Pharmacaps, Inc. sent the Group notice that it had filed an ANDA to market a generic version ofAvodart.Banner’s notification contained a ‘Paragraph IV certification alleging that two Group patents expiring in 2013 and one patent expiresexpiring in 2015. The other two2015 were invalid or not infringed by Banner’s proposed generic dutasteride product. These patents expireare the same patents that were the subject of the Group’s settlement with Teva in 2013. FDA approval of Barr’sMarch 2010. Since Teva was the first to file a complete ANDA is stayedwith a Paragraph IV certification, it holds 180-day exclusivity as to all later filers. Banner cannot enter the market until the earlierexpiration or forfeiture of JulyTeva’s 180 days of exclusivity. The Group sued Banner in the United States District Court for the District of Delaware in January 2011.
In December 2010, Anchen Pharmaceuticals, Inc. sent the Group notices that it had filed ANDAs with Paragraph IV certifications forAvodart and Jalyn,alleging that the Group patent expiring in 2015 that covers dutasteride was invalid or resolutionnot infringed by their proposed products.Jalynis a combination of dutasteride and tamsulosin and is covered by the same patents that coverAvodart. Anchen cannot launch its genericJalynproduct before the expiration of the patent infringement action.non-challenged patents in September 2013. Anchen cannot launch its genericAvodartproduct until the later of September 2013 or expiration or forfeiture of Teva’s 180-day exclusivity. The parties have agreed to settle this matter. The termsGroup sued Anchen in the United States District Court for the District of the settlement are subject to review by the Federal Trade Commission and must receive final court approval.Delaware in January 2011.
Benlysta
In February 2010, the UK Court of Appeal upheld an earlier High Court decision revoking the HGSHuman Genome Sciences (HGS) UK patentPatent No. EP0939804. The claim for revocation was brought by Eli Lilly in 2006 on the patent which claims the cytokine BLyS and any antibody that binds to BLyS, such asBenlysta(belimumab). GSKThe Group has a licence to this patent from HGS but was not a party to these litigation proceedings. The equivalent European patent was upheld in October 2009 on a final appeal from the European Patent Office following an opposition proceeding filed by Eli Lilly. This UK decision does not affect the other European patents arising from this same European Patent. HGS and GSK are considering an appeal of thisappealed the UK decision todecision. In July 2010, the UK Supreme Court.Court decided that it would hear the appeal. A hearing date for the appeal has been set for 18th July 2011. This decision doeswill not affect GSKthe Group’s or HGS’s freedomHGS’ ability to market and sellBenlystaBenlysta..
Boniva
The Group participated in the marketing ofBonivapursuant to a co-promotion agreement with Roche, which expired in January 2010. In September 2007, Roche Laboratories commenced actions in the US District Court for the District of New Jersey against eight generic drug manufacturers. In each case, Roche alleged infringement of Roche patents relating toBonivatablets. Each of the defendants had filed an ANDA with the FDA with a certification of invalidity, unenforceability or non-infringement of at least one of the Roche patents. Two manufacturers have challenged the basic compound patent, which expires in 2012. Final FDA approval of those ANDAs is stayed until the earlier of November 2010 or resolution of the relevant patent infringement action. In August 2008, Roche obtained a new patent on the monthly dosing regimen forBonivaand brought suit against all ANDA filers that were challenging its patents. The new patent expires in 2023. The cases are ongoing.
Combivir
Patents listed in the Orange Book forCombivirinclude composition of matter (3TC/lamivudine), combination (lamivudine and AZT) and lamivudine crystal form patents that expire in 2010, 2012 and 2016, respectively. In September 2007, the Group received notice that Teva Pharmaceuticals, Inc. filed an ANDA with the FDA alleging that the combination patent is invalid.
In November 2007, the Group filed an action in the United States District Court for the District of Delaware against Teva Pharmaceuticals USA Inc. for infringement of the combination patent. FDA approval of Teva’s ANDA is stayed untilIn April 2010, the earlier of March 2010 or resolutionGroup and Teva agreed to settle the suit filed by the Group. Under the terms of the patent infringement action favourablesettlement, Teva will obtain a license to Teva. The case isenter the US market in the discovery phase.fourth quarter of 2011, or earlier under certain circumstances. In October 2008, Teva filed a certification thatlight of the Group’s patent coveringsettlement, the crystal form of lamivudine is invalid or not infringed. The Group did not file suit under this patent.district court dismissed the case on 26th May 2010.
In July 2008, the Group received notice that Lupin Ltd. filed a certification with the FDA alleging that the combination patent is invalid or not infringed by its product. Lupin also filed a certification that the Group’s patent covering the crystal form of lamivudine is invalid or not infringed.
In August 2008, the Group filed suit against Lupin in the United States District Court for the District of Delaware for infringement of its combination patent. The Group did not file suit against Lupin under the crystal form patent. In March 2009, the action against Lupin was stayed by mutual consent pending resolution of the case against Teva. NeitherOn 26th May 2010, the Group’s case against Teva, northe first ANDA filer, was settled and dismissed. Lupin has challengedmay choose to reactivate its case against the basic compound patent that covers lamivudine, oneGroup under the terms of the active ingredients inCombivir. That patent expires in May 2010.
Coreg CR
The Group filed suit in April 2008 in the US District Court for the Eastern District of Pennsylvania under the crystal form patent and a patent covering the use ofCoreg CRtreating congestive heart failure. In October 2008, the Group filed a motionstay. However, Lupin will not be able to dismiss the action and gave Mutual a covenant not to sue under the patents. Mutual cannot obtain final approval to marketfor its generic product until 20th April 2010 based upon datathe expiration or forfeiture of Teva’s 180-day exclusivity granted by the FDA for the product. This matter has now concluded.period.
Hiberix, Infanrix HexaandMenitorix
On 3rd August 2009, Novartis sued the Group in Belgium for patent infringement in relation toHiberix,Infanrix Hexa, andMenitorixvaccine products and in relation to phase 3 development vaccine projects HibMenCY and MenACWY. Parallel infringement proceedings were also filed by Novartis in the UK forInfanrix Hexa,MenitorixandHiberix. The European Patent Office granted the Group’s request for an accelerated review to reconsider the validity of the patent and in December 2009, all Novartis claims relevant to the Group’s products were held invalid. The UK and Belgian infringement trials will be dismissed.
Levitra
The Group participates in the marketing ofLevitrapursuant to a co-promotion agreement with Bayer Healthcare. In July 2009, Bayer brought suit against Teva Pharmaceuticals in the USUnited States District Court for the District of Delaware against Teva Pharmacetuicals, Inc. for infringement of its patent relating toLevitraLevitra.. Teva had filed an ANDA with the FDA with a certification that the patent covering the active ingredient inLevitra,, which expires in 2018, is invalid, unenforceable or not infringed. A stay against FDA approval will be inwas put into effect by the filing of the lawsuit until the earlier of a decision in the case adverse to Bayer or November 2011.
GSK Annual Report 2009
171
Notes In January 2011, the trial date in the matter was extended from 31st October 2011 to 27th February 2012, and Teva consented to an extension of the stay against FDA approval by an amount equal to the financial statementsextension of the trial date. The Group is not a party to this suit.
44 Legal proceedingscontinued
Lovaza
In March 2009, the Group received notice that Teva Pharmaceuticals USA, Inc., Par Pharmaceutical, Inc., and Apotex Inc., had filed ANDAs with a certification that two patents coveringLovazaare invalid, unenforceable, or not infringed. The patents expire in 2013 and 2017. The Group is the licensee under these patents. Pronova Biopharma Norge AS, the owner of the patents, sued Teva, Par and Apotex in the USUnited States District Court for the District of Delaware. FDA approval of the ANDAs will be stayed until the earlier of May 2012 or a decision favourable to one of the generics. Trial has been set by the court for 28th March 2011. The Group is not a party to these suits.
Three additional patents coveringLovazawere granted to Pronova between March and June 2010. Pronova sued Teva, Par and Apotex on these patents, and a separate trial has been scheduled for 3rd January 2012. No additional 30-month stay attached to a suit under these patents.
GSK Annual Report 2010
180
Notes to the financial statements
44Legal proceedingscontinued
Malarone
In August 2009, the Group filed suit in the USUnited States District Court for the District of Delaware against Glenmark Generics Inc. USA for infringement of its patents related toMalaroneMalarone.. The Group had received notification that Glenmark had filed an ANDAforMalarone,, with certification alleging that the Group’s patents were invalid, unenforceable, or not infringed. These patents, which expire in 2014, cover the combination of atovaquone and proguanil hydrochloride and its use for preventing malaria. FDA approvalThe Group settled the case in April 2010. Under the terms of Glenmark’s ANDA is stayed until the settlement agreement, Glenmark has received a royalty-bearing licence to enter the market with its product in the third quarter of 2011 or earlier of January 2012 or a judgment adverse to GSK.in certain circumstances. The case was dismissed 24th May 2010.
Paxil/Seroxat
InFollowing a court-ordered mediation in the USA a numbersecond quarter of manufacturers or distributors of genericPaxilfiled applications with2010, the FDA to market their generic versions prior to the expiration in 2007 of the Group’s patent on paroxetine hyrdrochloride hemihydrate. Of these actions, only one remains pending, namely an actionGroup resolved all claims by and against Apotex in thePaxil/Seroxatpatent infringement and anti-trust litigation venued in the US District Court for the Eastern District of Pennsylvania, on patents with composition of matter and process of manufacture claims. An anti-trust counterclaimas well as litigation brought by Apotex against the Group in Canada. The litigation has been asserted by Apotex, as discussed under ‘Anti-trust’ on page 175. The case has now been set for trial in April 2010.dismissed with respect to all parties.
In Europe, generic products containing paroxetine hydrochloride are now on the market in most European countries. The Group’s Netherlands patent infringement action against Farmaceutisch Analytisch Laboratorium Duiven B.V. (FAL), and FAL’s counterclaims for unfair competition, was settled in July 2009.
Following the litigation in Canada with Apotex over several patents related to paroxetine, Apotex launched its generic product in Canada in October 2003. Apotex has now alleged that as a result of that litigation it had been enjoined from launching that product after receipt of regulatory approval. An action by Apotex to recover damages related to the delay occasioned by those injunctions is ongoing.
Requip XL
In January 2009, the Group received letters from Impax Laboratories, Inc. and Actavis South Atlantic LLC indicating that their ANDAs forRequip XLhad been accepted by the FDA. The letters included an allegation that the patent licensed by the Group from SkyePharma covering the extended release formulation was not infringed by their products. Additional ANDAs were filed in 2009 by Torrent Pharmaceuticals and Lupin Ltd. with certifications that the formulation patent was not infringed. The Group did not bring suits against these companies.
Treximet
In October 2008, the Group received a letter from Par Pharmaceuticals that the FDA had accepted its ANDA forTreximet,, which included a certification that patents owned by Pozen, Inc. relating toTreximet werewere invalid, unenforceable and/or not infringed. Pozen’s patents are licensed to the Group. In November 2008, Pozen filed suit against Par under three of its patents in the District Court for the Eastern District of Texas. In November 2008, the Group received a letter from Alphapharm and its designated agent, Mylan Pharmaceuticals, that the FDA had accepted its ANDA forTreximet,, which also included a certification that Pozen’s patents relating toTreximet werewere invalid, unenforceable and/or not infringed. Pozen filed suit against Alphapharm and Mylan in January 2009 for infringement of its patents in the District Court for the Eastern District of Texas and Delaware. The Delaware case has since been dismissed.Texas. In 2009, Pozen also sued Teva Pharmaceuticals USA, Inc. and Dr. Reddy’s under the same patents in the same court. A trial was held in October 2010, and the parties are awaiting a decision.Treximethas data exclusivity that precludes approval of a generic product until April 2011. The Group is not a party to any of the lawsuits brought by Pozen.
Valtrex
In July 2009, Apotex Inc. filed a complaint for a declaratory judgment in the District Court for the Middle District of North Carolina that Apotex’s valacyclovir product did not infringe a formulation patent owned by the Group forValtrex. Apotex filed a para iv certification in 2008 challenging this patent and GSK did not file suit challenging the certificate. GSK filed a response to this declaratory judgment complaint in August 2009 and did not contest the non-infringement allegation. In October 2009, Apotex filed a motion for judgment. The matter is pending a decision on the motion. In November 2009, Ranbaxy launched the first generic product for valacyclovir.
Vesicare
The Group marketsVesicarein the USA under license from Astellas Pharma Inc. In September 2009, Astellas filed suit against Teva Pharmaceuticals USA, Inc. in the Federal District Court for the Southern District of New York for infringement of its patent covering the active ingredient inVesicareVesicare.. Astellas had received notice that Teva Pharmaceuticals had filed an ANDA with a certification that the basic patent, which expires in 2018, was invalid or unenforceable. FDA approvalThe parties settled, and the case was dismissed 28th June 2010. Under the terms of Teva’s ANDA is stayed until the earlier ofsettlement, Teva will be able to enter the market in October 2018.
On 15th February 2012 or a decision 2011, Astellas and the Group announced that the Group will cease promotingVesicarein the case favourable to Teva.USA by January 2012.
Product liability
Pre-clinical and clinical trials are conducted during the development of potential products to determine the safety and efficacy of products for use by humans following approval by regulatory bodies. Notwithstanding these efforts, when drugs and vaccines are introduced into the marketplace, unanticipated safety issues may become evident. The Group is currently a defendant in a number of product liability lawsuits related to the Group’s pharmaceutical and consumer healthcare products. The most significant of those matters are described on pages 172 and 173.
GSK Annual Report 2009
172
Notes to the financial statementsbelow.
44 Legal proceedingscontinued
Avandia
The Group has been named in product liability lawsuits on behalf of individuals and purported class action cases asserting consumer fraud and/or personal injury claims on behalfarising out of purchasers and usersthe use ofAvandiaAvandia.. The federal cases are part of a multi-district litigation proceeding pending in the USUnited States District Court for the Eastern District of Pennsylvania. Cases have also been filed in a number of state courts. Cases filed in state court in Philadelphia have been coordinated in the Mass Tort Program. These mattersProgram; cases in state court in California have been coordinated in Los Angeles. Additionally, there are in the discovery phase, with the first trial scheduled for June 2010. Additionally, a14 purported nationwide class action suit was filed in February 2009 in the US District Court for the Eastern District of Pennsylvaniaactions seeking economic damages on behalf of all third party payers seeking economic damagesand consumers asserting claims arising under various state and federal laws, including The Racketeer Influenced and Corrupt Organizations Act (RICO), state unfair trade practices andand/or consumer protection laws. Plaintiffs
On 23rd September 2010, the FDA took action on rosiglitazone, keeping all rosiglitazone products on the market, but requiring additional labeling and restrictions on use to ensure that the benefits ofAvandiacontinue to outweigh its risks, including a Risk Evaluation and Mitigation Strategy (REMS) program to ensure the safe use of the medicine. In the EU, the EMA announced on 23 September 2010 that it had determined to suspend the marketing authorisation for rosigilitazone (including allAvandiaproducts). Regulatory agencies in other countries are reviewing or have indicated that they will be filing an amended complainttaken regulatory action. The Group is working to implement the decisions of the FDA, EMA and other regulatory agencies. On 7th February 2011, the FDA announced a change in the future.labeling for Avandia to restrict use to those patients already taking a rosiglitazone-containing medicine, to new patients who are unable to achieve adequate glycemic control with other diabetes medications, and to those patients who have decided not to take pioglitazone or pioglitazone-containing medicines.
Finally, oneThe Group has continued to receive a significant number of new product liability cases regarding Avandia in the USA, in part as a result of the regulatory action taken by FDA and in part based on other negative publicity concerning the product, and adjusted its provision for potential settlements accordingly, which provision includes an estimate of future claims. With respect to such product liability cases in the USA, the Group has reached agreements to settle the majority of claims pending as of February, 2011
One purported class action onAvandiahas been filed in Israel, and briefing of whether to certify the class action is underway. TenEleven class actions are pending in Canada, and are at an early stage.
BaycolGSK Annual Report 2010
181
Notes to the financial statements
44Legal proceedingscontinued
The GroupPaxil and Bayer Corporation, the principal US subsidiary of Bayer AG, have signed an allocation agreement under which Bayer Corporation has agreed to pay 95% of all settlements and compensatory damages judgments, with each party retaining responsibility for its own attorneys’ fees and any punitive damages. The federal cases have been consolidated in a multi-district litigation proceeding in the US District Court for the District of Minnesota. The multi-district litigation is in the process of winding down, with less than 10 plaintiffs remaining. To date two statewide class actions have been certified – a medical monitoring case in Pennsylvania and a Consumer Fraud and Deceptive Business Practices Act case in Illinois. The medical monitoring action was dismissed by the court on summary judgment, and the Supreme Court of Illinois likewise dismissed the consumer fraud claim on summary judgment in December 2009. A nationwide class of third-party payers was certified by a Pennsylvania state court. That case settled before trial. Another class action, in which the Group was not named as a defendant, had been certified in Oklahoma. That case has been decertified, and the deadline for appealing the decertification order has passed. More than 3,100 claims for death or serious injury have been settled and thousands of others alleging muscle aches and pains have been voluntarily or involuntarily dismissed.
PaxilandPaxil CR
The Group has received numerous lawsuits and claims alleging that use ofPaxil(paroxetine) has caused a variety of injuries. Many of these lawsuits and claims allege that the use ofPaxilduring pregnancy resulted in the birth of a child with birth defects or health issues. Other lawsuits and claims allege that patients who tookPaxilcommitted or attempted to commit suicide and/ or acts of violence. Finally, a third group of lawsuits and claims allege that the use ofPaxilcaused patients to suffer symptoms on discontinuing treatment withPaxil.
The cases filed in Philadelphia alleging injury during pregnancyGroup has reached agreements to settle the vast majority of the US claims pending as of February 2011. Other matters have been coordinateddismissed without payment. Some lawsuits remain scheduled for trial, including nine cases scheduled for trial in the Philadelphia Mass Tort Program. In October 2009, the first trial resultedProgram in an adverse jury verdict in the amountMay and June 2011 concerning use of $2.5 million (Kilker v. GlaxoSmithKline). No punitive damages were awarded. Post-trial motions are pending. The Group also hasPaxil during pregnancy. There remains purported class action litigation in Canada concerning use ofPaxilduring pregnancy.
In the claims and lawsuits alleging that treatment withPaxilhas caused homicidal or suicidal behaviour exhibited by users of the product, class certification was denied in January 2007 in a purported personal injury class action lawsuit. Cases remain pending in federal and state courts. The cases filed in Philadelphia have been coordinated in the Mass Tort Program.
With respect to the lawsuits filed in state and federal courts in the USA and Canada alleging thatPaxilis addictive and causes dependency and withdrawal reactions, virtually all the US actions have now been resolved. A California court granted plaintiffs’ motion to certify a class in a consumer fraud lawsuit seeking only economic damages, focused on discontinuation symptoms.
In Canada, the Court of Appeal affirmed the Quebec court denied plaintiffscourt’s denial of plaintiffs’ motion to certify a class of patients who allegedly experienced discontinuation symptoms. That decisionlitigation is on appeal. now concluded.
In the UK, public funding has been granted forwithdrawn from the hundreds of patientsclaimants who had received funding to pursue common issues in litigation alleging that paroxetine has caused them to suffer from withdrawal reactions and dependency. The Legal Services Commission’s decision to withdraw funding is being appealed to a Special Cases Review Panel by some claimants. Other claimants have discontinued their claims, and the trial is scheduledlisted to commence in January 2011.early 2011 in the High Court in London has been vacated.
Poligrip
ABeginning in 2005, a number of product liability lawsuits and claims have beenwere filed against the Group in both state and federal courts in the USA, including purported class actions, alleging that the zinc inPoligripcauses copper depletion and permanent neurologic injury. The first lawsuit alleging neurologic injuries from zinc inPoligripwas filed in August 2005. The federal cases are part of the Denture Cream Adhesive multi-district litigation (MDL) in the USUnited States District Court for the Southern District of Florida which was established in June 2009. Both the Group and Procter & Gamble are defendants in this litigation. Included in the MDL are purported class actions asserting economic loss claims under state consumer protection laws and claims for medical monitoring. With one exception (athree current exceptions (two state court casecases in Arkansas)Pennsylvania and one in New York), all of the state court cases have been consolidated in the Philadelphia Mass Tort Program in Philadelphia. A purportedProgram. Purported class actionactions asserting consumer fraud claims was recentlywere also filed in Canada. On 18th February 2010,The Group has reached agreements in principle to settle the vast majority of current cases. The Group announced that it washas voluntarily withdrawingwithdrawn all zinc-containing formulations ofPoligrip.from the market.
Thimerosal
The Group, along with a number of other pharmaceutical companies, has been named as a defendant in numerous individual personal injury lawsuits in state and federal district courts in the USA alleging that thimerosal, a preservative used in the manufacture of vaccines, causes neurodevelopmental disorders and other injuries, including autism.
Two of the cases are purported class actions, although there has been no determination whether any of those cases will be permitted to proceed as a class action. A number of purported class actions in other jurisdictions have been withdrawn or dismissed. Plaintiffs seek remedies including compensatory, punitive and statutory damages as well as the cost of a fund for medical monitoring and research.
As of the date of this report, in the limited number of cases that have approached trial dates, vaccine manufacturers and manufacturers of other thimerosal containing medicinal products have been successful in excluding testimony of plaintiffs’ expert witnesses on causation, specifically on grounds that plaintiffs have failed to establish that the hypothesised link between thimerosal and neurodevelopmental disorders is generally accepted as reliable within the relevant scientific community.
GSK Annual Report 2009
173
Notes to the financial statements
44 Legal proceedingscontinued
Additionally, inIn February 2009, the Office of Special Masters of the United States Court of Federal Claims rejected the first three of approximately 4,900 autism claims filed under the National Vaccine Injury Compensation Program (NVICP) on the grounds that claimants failed to produce reliable scientific evidence linking their vaccinations to their medical conditions, including autism.
The Group was not a party to these proceedings. The findings from them cannot be used as evidence in the pending lawsuits against the Group. All three decisions were upheld on appeal by the United States Court of Federal Claims. Two of the three NVICP claimants now have appealed the rulings to the USUnited States Court of Appeals for the Federal Circuit.Circuit which affirmed the decisions of the United States Court of Federal Claims. The third claimant has elected not to appeal further and has rejected the decision from the NVICP. This claimant now has the option of filing an action either against the Group and/or the physician who administered the vaccine in question. As of this date, no such action has been commenced.
The remaining approximately 4,900 NVICP claimants also will ultimately have the option of pursuing personal injury lawsuits against the vaccine manufacturers, including the Group. It is too early to determine
On 22nd February 2011, the United States Supreme Court issued its decision in Bruesewitz v. Wyeth, Inc., which involved the issue of whether the announcementNational Vaccine Injury Compensation Act (NVICA) precludes lawsuits against vaccine manufacturers claiming that vaccines covered by the NVICP are defectively designed. The Supreme Court affirmed the decision of the NVCIP decisions is likely to lead toUnited States Court of Appeal for the Third Circuit and held that the NVICA pre-empts all design defect claims against vaccine manufacturers brought by plaintiffs seeking compensation for injury or death caused by a vaccine’s side effects.
To date, the Group has not seen an increase in the number of civil caseslawsuits filed against it following the Group.announcement of the NVCIP decisions. Since the scope of the Bruesewitz ruling impacts only the ability of plaintiffs to pursue claims that the design of certain childhood vaccines was defective because it included the use of thimerosal as a preservative, its impact on the willingness of plaintiffs to pursue their civil lawsuits based on other legal theories remains unknown. As of the date of this report, there are no cases scheduled for trial in 20102011 in which the Group is a defendant.
GSK Annual Report 2010
182
Notes to the financial statements
44Legal proceedingscontinued
Sales and marketing and regulation
Marketing and promotion‘Colorado Investigation’
In February 2004, the Group received a subpoena from the USUnited States Attorney’s office in Colorado regarding the Group’s sales and promotional practices relating to nine of its largest selling products, for the period from January 1997 to 2004. That investigation was later taken over by the United States Attorney’s office for the District of Massachusetts and expanded to the present with respect to Advair. In particular, the government has inquired about alleged promotion of all of these drugs for off-label uses, as well as Group-sponsored continuing medical education programmes, other speaker events, special issue boards, advisory boards, speaker training programmes, clinical studies and related grants, fees, travel and entertainment. Although the original subpoena was issued from the US Attorney’s office in Colorado, the scope of the inquiry is nationwide. The Group continues to cooperate with the government in its investigation.
The government is also inquiring about the Group’s response to an October 2002 letter from the FDA’s Division of Drug Marketing, Advertising and Communication requesting information on the Group’s alleged promotion ofWellbutrin SRfor off-label use. The Group is co-operatingcooperating with the investigation and providing the requested information.
Avandia-relatedmatters
The Group is in the process of responding to a United States Department of Justice subpoena it received in June 2010 seeking documents relating to the development and marketing ofAvandia.The Group has also received Civil Investigative Demands from a number of State Attorneys General offices relating to the development and marketingAvandia,and is cooperating with these offices.
The Utah Attorney General’s Office and the Louisiana Attorney General’s Office both have filed suit against the Group asserting various statutory and common law claims relating to the Group’s development and marketing ofAvandia.The suits are in their early days.
UN Oil for Food Programme
Following a United Nations report alleging that bribes had been paid to Iraqi government officials in connection with the UN Oil for Food Programme, the Group received a subpoena from the SEC in February 2006 in respect of the Group’s participation in that programme. The USUnited States Department of Justice (DOJ) also initiated an investigation. In December 2007, the UK Serious Fraud Office (SFO) issued a formal notice to the Group requiring production of documents related to the Group’s participation in the programme. On 9th September 2010, the SFO notified the Group that it had completed its investigation and intends to take no further action. The Group has received no further contact from the SEC or DOJ in 2010 regarding this matter.
HIV division inquiry
On 26th July 2010, the Group received a subpoena from the Eastern District of New York’s US Attorney’s Office regarding sales and marketing practices for three HIV products, as well as educational programs, grants or payments to physicians regarding any drug used to treat HIV-infected adults. The Group is co-operatingcooperating with the investigations and has provided documents responsive to the subpoena and the notice, and continues to respond to follow up questions and requests.
investigation.Average wholesale price
The United States Department of Justice, a number of states and putative classes of private payers have for several years now been investigating and/or bringing civil litigation regarding allegations that numerous pharmaceutical companies, including GSK,the Group, have violated federal or state fraud and abuse laws as a result of the way ‘average wholesale price’ (AWP) and ‘wholesale acquisition cost’ (WAC) have been determined and reported for various drugs reimbursed under the Medicare, Medicaid and other insurance programmes. In 2005, the Group reached a $149 million civil settlement with the federal government to resolve allegations relating to the pricing and marketing ofZofranandKytril.The Group also amended its existing corporate integrity agreement as a requirement of the settlement. In 2007, the Group received final approval of a $70 million nationwide private payer class action settlement relating to the Group’s price reporting in an MDL proceeding in the USUnited States District Court for the District of Massachusetts.
| A number of states, through their respective attorneys general, and most of the counties in New York State have filed civil lawsuits in state and federal courts against the Group and many other drug companies claiming damages and restitution due to AWP and/or WAC price reporting for pharmaceutical products covered by the states’ Medicaid programmes. The states seek recovery on behalf of the states as payers and, in some cases, on behalf of in-state patients as consumers. |
| | |
|
| The Group has separately resolved AWP claims by state Medicaid programmes in more than two-thirds of the states through the DOJ Settlement or separate negotiations. Litigation concerning AWP issues is continuing with six states. |
| | |
|
| In November 2009, a Kentucky state court jury returned a $661,860 compensatory damages only verdict against the Group in another such case filed by the State of Kentucky. The jury found the Group liable for violating the state’s consumer protection laws, but not liable under the state’s Medicaid fraud and false advertising statutes. In January 2010, the judge in the case awarded the State of Kentucky an additional $5,828,000 in statutory penalties. The Group has settled the case with Kentucky. The judgment was vacated, and the Group denied liability as part of the settlement. |
GSK Annual Report 2010
183
Notes to the counties in New York State have filed civil lawsuits in state and federal courts against GSK and many other drug companies claiming damages and restitution due to AWP and/or WAC price reporting for pharmaceutical products covered by the states’ Medicaid programmes. The states seek recovery on behalf of the states as payers and, in some cases, on behalf of in-state patients as consumers.financial statements
44Legal proceedingscontinued
The Group has separately resolved AWP claims by state Medicaid programmes in more than two-thirds of the states through the DOJ Settlement or separate negotiations. Litigation concerning AWP issues is continuing with eight states, as well as with New York counties. In July 2008, an Alabama state court jury returned an $81 million verdict against the Group in one such case filed by the State of Alabama. In October 2009 the Alabama Supreme Court reversed the jury verdict and rendered judgment in GSK’s favour. The court expressly found that GSK had not defrauded the Alabama Medicaid programme. In January 2010 the Alabama Supreme Court declined Alabama’s petition for reconsideration of the reversal.
In November 2009 a Kentucky state court jury returned a $661,860 compensatory damages only verdict against the Group in another such case filed by the State of Kentucky. The jury found the Group liable for violating the state’s consumer protection laws, but not liable under the state’s Medicaid fraud and false advertising statutes. In January 2010 the judge in the case awarded the State of Kentucky an additional $5,828,000 in statutory penalties. The Group is considering whether to appeal.
Nominal pricing
The Group responded to two letter requests from the USUnited States Senate Committee on Finance, dated April 2004 and February 2005, for documents and information relating to the nominal price exception to the best price reporting requirements under the Medicaid Drug Rebate Programme. In January 2007, the committee released its findings that some pharmaceutical manufacturers inappropriately used the nominal price exception contrary to the committee’s interpretation of Congressional intent. In May 2004, the Group was advised by the USUnited States Department of Justice that it is investigating certain of the Group’s nominal pricing and bundled sales arrangements to determine whether those arrangements qualify under the exception to the best price reporting requirements or violate civil statutes or laws.
GSK Annual Report 2009
174
Notes to the financial statements
44 Legal proceedingscontinued
In March 2008, the Group received a broad letter request from the US Department of Justice seeking a range of documents relating to all of the Group’s nominal pricing arrangements since 1994 and any possible bundled sales. The Group is continuing to co-operatecooperate in the investigation and produce documents. The Group has also received subpoenas and requests for documents and information from Delaware and Michigan related to the Group’s nominal price arrangements. The Group is cooperating in those investigations and producing responsive documents. In addition to these governmental investigations, allegations concerning the nominal pricing have been made by certain government payers as part ofin the AWP340B Programme litigation. The Group has not entered into any nominal price arrangements since December 2003.
340B Programme
The Group is defending an action filed in federal court in the USUnited States District Court for the Northern District of California by the County of Santa Clara and one other county, which seeks to represent a putative class of hospitals, clinics and other entities in California that are eligible to receive discounted ‘ceiling prices’ on pharmaceuticals under a federal programme known as the ‘340B Programme’.Programme.’ Plaintiffs allege that the Group and numerous other pharmaceutical manufacturers have been setting ‘ceiling prices’ higher than allowed by law and, under the contract that governs the programme, and have therefore overcharged the entities in California that are eligible to participate in the 340B Programme.
The lawsuit was dismissed in 2006. It was reinstated in August 2008 following an appeal. It is now being actively litigated atThe United States Supreme Court agreed to review the issue of whether 340B entities have standing to sue manufacturers under the manufacturers’ 340B contract with the government. The trial court level. Part of plaintiffs’ claim is thatstayed all proceedings in the defendants miscalculated ‘Average Manufacturer Prices’ (AMPs) and ‘Best Prices’ (BPs) undercase until after the Medicaid rebate program which, because they form part ofSupreme Court’s decision. Oral argument before the ‘ceiling price’ formula, resulted in inflated ‘ceiling prices.’ Defendants have asserted, and continue to assert, that these plaintiffs areSupreme Court occurred on 19th January 2011. The Supreme Court has not entitled to challenge the calculation of AMPs and BPs as part of this lawsuit.yet issued its decision.
Paxil/Seroxat
Following the Group’s 2004 settlement of a lawsuit filed by the New York State Attorney General’s office alleging failure to disclose data on the use ofPaxilin children and adolescents, similar cases, some of which purported to be class actions, were filed by private plaintiffs seeking to recover amounts paid forPaxilpurchased for use by patients under the age of 18. Following a class settlement with consumers in 2007, the USUnited States District Court for the District of Minnesota in 2008 approved a $40 million class settlement of ensuing lawsuits seeking recovery on behalf of insurance companies and other third-party payers for payments for prescriptions ofPaxil to children and adolescents. The Group denied liability in both settlements. In 2009, a similar purported class action was filed in USUnited States District Court for the District of Minnesota on behalf of all federal, state and local government entities that paid for prescriptions ofPaxilto minors. There also remains a similar purported class action in Canada seeking economic damages on behalf of individuals, third party payers and governmental entities that purchasedPaxilfor use by patients under the age of 18.
Cidra, Puerto Rico manufacturing site
In October 2007 the Group announced plans to cease operations at its manufacturing facilities located in Cidra, Puerto Rico. On 30th July 2009; the Cidra site ceased operations and commenced decommissioning activities. The remaining operational staffs were released on 30th September 2009. On 6th October 2009, the US District Court for the Eastern District of North Carolina entered an order vacating the Consent Decree to which the Group and the FDA agreed regarding the Group’s manufacturing operations at the site. The Group has completed decommissioning activities and is currently pursuing opportunities to sell the site to a third party.
In October 2003, the US federal government executed a search warrant at the Cidra facility and seized records relating to the manufacturing operations at the site.
In April 2005, the Group received a subpoena from the USUnited States Attorney’s Office in Boston requesting production of records regarding its manufacturing at thefacilities located in Cidra, site, covering information that is similar to that seized by the US government in Puerto Rico, in 2003. Subsequently, the Group received additional subpoenas from the government related to the Cidra facility. The Group is co-operating with the US Attorney’s Office and producing the records responsive to the subpoenas.which have since ceased operations. In addition, in July 2007, the Group learned that the USUnited States District Court for the District of Massachusetts had unsealed a complaint brought by a former employee under the federal False Claims Act claiming monetary damages as a result of the alleged failure of the Cidra facility to comply with FDA Good Manufacturing Processes (GMPs) in the manufacture of various products.
TheOn 26th October 2010, the Group is also named in two purported consumer fraud class action lawsuits – one filed in California state court and the other infinalised an agreement with the US District CourtAttorney’s Office for the District of Massachusetts and the US Department of Justice with respect to the investigation of the Group’s former manufacturing facility in Cidra, Puerto Rico. Under the agreement and as a comprehensive settlement of pending claims against the Group arising from the investigation, the Group paid a total of $750 million (£500 million) in civil and criminal penalties, and SB Pharmco Puerto Rico, - alleging thatPaxilproducts were not manufactured according to GMP. Plaintiffs sought economic, statutory and punitive damages, along withInc., a request for injunctive relief. In the summersubsidiary of 2008, the Group, reachedpleaded guilty to certain charges. The Group is in the process of negotiating a tentative agreement to settle theseCorporate Integrity Agreement with the Office of Inspector General that will cover manufacturing compliance matters.
The settlement covers nationwide classes of consumer purchasersGroup has received Civil Investigative Demands and third party payers. It provides a claims procedure for class members to receive payment only for split/defectivePaxil CRtablets. The settlement received final trial court approval in September 2009. Objectorssubpoena from several State Attorneys General offices relating to the settlement filed appeals, but the appeals were dismissed in February 2010. Accordingly, the settlement has become final and effective in accordance with its terms. Under the settlement agreement, the consumer fraud class action lawsuits will be dismissed with prejudice. The related third party payer suit filedmatters at issue in the Philadelphia Courtfederal investigation. The enquiries are at an early stage, and the Group is cooperating with these offices.
SEC/DOJ FCPA Inquiry
The US Securities and Exchange Commission (SEC) and the US Department of Common Pleas was marked as settled, discontinuedJustice (DOJ) are conducting an industry-wide investigation into whether pharmaceutical companies may have engaged in violations of the Foreign Corrupt Practices Act relating to the sale of Pharmaceuticals, including in Argentina, Brazil, Canada, China, Germany, Italy, Poland, Russia and ended asSaudi Arabia. The Group is one of 5th October 2009.the companies that have been asked to respond to this inquiry and is cooperating with the SEC and DOJ.
GSK Annual Report 20092010
175184
Notes to the financial statements
4444 Legal proceedingscontinued
Anti-trustAnti-trust/competition
Paxil/Seroxat
The trial date forAs noted previously on page 180, the remainingGroup has settled its patent infringement action brought by the Group againstand anti-trust litigation with Apotex and Apotex’s counterclaim remains set for 15th April 2010 in the US District Court for the Eastern District of Pennsylvania. In this matter, the Group seeks substantial damages for Apotex’s alleged infringement of one of the Group’s patents on paroxetine hydrochloride, and Apotex in turn seeks damages from the Group in an amount substantially larger than the damages sought by the Group, for alleged violations of federal anti-trust laws, as well as those involving advertising and state anti-trust and consumer protection laws. Under the federal anti-trust laws, the damages sought by Apotex would be trebled in the event of an adverse jury verdict against the Group. On 2nd December 2009, the Court ordered that the Group and Apotex engage in mediation to attempt to reach settlement on the patent infringement claim regardingPaxil/ Seroxat,and the counterclaim.litigation has been dismissed as to all parties.
EU sector inquiry
In January 2008, the European Commission announced an inquiry into certain aspects of competition in the pharmaceutical sector and initiated inspections at the premises of a number of innovator and generic pharmaceutical companies, including the Group. The Commission published a preliminary report in November 2008 based on information provided to it by innovator and generic pharmaceutical companies.2008. The report suggests that defensive patenting strategies may lead to obstacles to innovation and that innovator companies employ measures to hinder generics coming onto the market. The final report was issued in July 2009. While not contradicting the preliminary report, the final report conceded that delays in generic entry waswere as much the fault of the regulatory environment as innovator companies’ defensive strategies. In this report, the Commission stated that it did not attack legitimate patenting practices and identified areas for follow up scrutiny by the Commission and recommended regulatory reform and improvement.
On 17th January 2011, the Commission requested information from the Group and a number of other pharmaceutical companies relating to patent settlement agreements affecting European Union and European Economic Area markets. The request for information is the second monitoring exercise by the Commission patent settlement agreements in the pharmaceuticals sector. The Group is in the process of responding to the Commission’s request.
Wellbutrin SR
In December 2004, January 2005 and February 2005, lawsuits, several of which purported to be class actions, were filed in the USUnited States District Court for the Eastern District of Pennsylvania against the Group on behalf of direct and indirect purchasers ofWellbutrin SRSR.. The complaints allege violations of US anti-trust laws through sham litigation and fraud on the patent office by the Group in obtaining and enforcing patents coveringWellbutrin SRSR.. The complaints followed the introduction of generic competition toWellbutrin SRin April 2004, after district and appellate court rulings that a generic manufacturer did not infringe the Group’s patents. While aA class of direct purchasers has been certified, no decisioncertified. The court recently entered an order granting the motion of the indirect purchaser plaintiffs to file a renewed motion for class certification. The court has yet been made by the Courtscheduled trial for 27th June 2011 with regard to certificationthe claims of an indirect purchaser class. Discovery has been substantially completed and the Group’s motion for summary judgment remains pending.certified class of direct purchasers.
Secondary wholesaler
In July 2006, RxUSA Wholesale, Inc., a ‘secondary wholesaler’,wholesaler,’ filed suit against the Group and many other pharmaceutical manufacturers and wholesalers in the USUnited States District Court for the Eastern District of New York. The complaint alleges that the defendants engaged in a conspiracy to refuse to supply pharmaceutical products to RxUSA in violation of federal and state anti-trust laws. The Group’s motion to dismiss the complaint was granted. The plaintiff has filed an appeal.United States Court of Appeals for the Second Circuit affirmed the dismissal of the complaint. The case is now concluded.
Wellbutrin XL
Actions have been filed against Biovail and GSKthe Group by purported classes of direct and indirect purchasers who allege unlawful monopolizationmonopolisation and other anti-trust violations related to the enforcement of Biovail’sWellbutrin XLpatents and the filing, by Biovail, of citizen petitions. The Group’s motion to dismiss the amended complaint of the indirect purchasers was granted in respect of some, but not all, of the claims of the class representatives and many of the claims asserted by the indirect purchasers. The case has proceeded to discovery with respect to the remaining claims as well as the ones brought by the purported class of direct purchasers. A class certification hearing is scheduled for April 2011.
Flonase
Purported direct and indirect purchaser class actions have been filed in the USUnited States District Court for the Eastern District of Pennsylvania alleging the Group illegally maintained monopoly power in the ‘market’ forFlonaseand charged plaintiffs supra-competitive prices. Additionally, a suit has been filed by Roxane Laboratories, Inc., a generic competitor, seeking lost profits from the Group’s alleged actions unlawfully delaying Roxane’s entry into the market. The predicate for all of these allegations was the filing by the Group of allegedly sham citizen petitions and subsequent litigation. The motion of the direct purchasers to certify a class was granted by the court. The Group has successfully narrowed the claims of the purported class of indirect purchasers through motions to dismiss their complaint and amended complaints. The Group’s motion to dismiss Roxane’s complaint was recently denied. Discovery with regard to all parties is scheduled to conclude in Q1 2010.
Commercial and corporate
SecuritiesSecurities/ERISA class actions
In November 2007, attorneys purporting to represent a class of purchasers of GlaxoSmithKline shares and ADS filed an amended consolidated complaint against the Group and senior officers in the US District Court for the Southern District of New York. It alleged that the Group and the individual defendants violated US securities laws and artificially inflated the price of GlaxoSmithKline’s stock by misleading investors about the safety ofAvandia. The amended consolidated complaint also alleges that several current and former senior officers and members of the Group engaged in insider trading. A motion to dismiss the complaint has been filed on behalf of the Group and the individual defendants. In May 2008, the District Court entered an order dismissing the case as to all defendants. Plaintiffs filed an appeal with the US Court of Appeals for the Second Circuit. In August 2009, the Court of Appeals affirmed the District Court’s dismissal. This matter has now concluded.
GSK Annual Report 2009
176
Notes to the financial statements
44 Legal proceedingscontinued
On 6th July 2009, a class action suit brought on behalf of current and former employees of Stiefel Laboratories, Inc., was filed in USUnited States District Court for the Southern District of Florida. The complaint alleges that Stiefel and its officers and directors violated US Employee Retirement Income Security Act (ERISA) and federal and state securities laws by inducing Stiefel employees to sell their shares in the employee stock plan back to Stiefel company at a greatly undervalued price and without disclosing to employees that Stiefel was about to be sold.sold to the Group. In January 2010, defendants’ motion to dismiss was granted in part and denied in part. Specifically, while the Court determined that the ERISA claims against the individual Stiefel defendants as well as the federal securities claims against the individual defendants and Stiefel could go forward, the Court dismissed the Florida Securities Act and common law breach of fiduciary duty claims holding that ERISA pre-empts state and common law, as well as a malpractice claim against Stiefel’s former accountants. Trial of the remaining claims is scheduled for July 2011.
A putative class action suit was filed against the Group on 27th August 2010 in the United States District Court for the Southern District of New York. The complaint alleges that the Group and its officers, directors and certain employees made misleading public statements aboutAvandia,and that when these alleged ‘misleading statements’ were exposed, the value of the Group’s stock dropped. Plaintiff has brought suit on behalf of himself and all other participants in the Group’s retirement plans, claiming that the Group and the individual defendants breached their fiduciary duties to plan participants under ERISA.
GSK Annual Report 2010
185
Notes to the financial statements
44Legal proceedingscontinued
Plaintiffs have amended their complaint to add allegations concerningWellbutrin SRandPaxil/ and to include additional Group defendants and individual members of the Group’s benefits committees. The Group filed a motion to dismiss on 4th February 2011.
Wage and hour claims
In December 2006, two purported class actions were filed against the Group on behalf of the entire Group’s US pharmaceutical sales representatives. These actions, which were filed in or transferred to the USUnited States District Court for the Central District of California, initially alleged that those representatives are not ‘exempt’ employees under California law and/or the US Fair Labor Standards Act (FLSA) and are consequently entitled to overtime pay, among other things.
Plaintiffs subsequently amended their complaints to assert a class action, limited solely to pharmaceutical sales representatives working in California, and only asserting claims under California’s wage and hour laws.
The suits seek a variety of compensatory, punitive and statutory damages. The Group moved for summary judgementjudgment dismissing the claims of the putative class representatives on the ground that they were exempt employees. The Court held that there are appeals pending in the United States Court of Appeals for the Ninth Circuit in cases involving other manufacturers ‘withwith virtually the same factual and legal arguments’.arguments. It therefore deferred ruling on the summary judgementjudgment motion and stayed any further activity in the case until the appellate court rules in at least one of the other companies’ pending cases.
A third case, filed in the USUnited States District Court for the District of Arizona in NovemberAugust 2008, sought to establish a nationwide collective action on behalf of the entire Group’s US pharmaceutical sales representatives on the ground that those representatives were not exempt employees under the US Fair Labor Standards Act.FLSA. Plaintiffs sought double damages for all overtime allegedly worked by the Group’s pharmaceutical sales representatives over a three year period. In November 2009, the Court granted the Group’s motion for summary judgment and dismissed the lawsuit on the ground that the sales representatives were ‘exempt’ employees under the outside sales exemption to the US Fair Labor Standards Act.FLSA. Plaintiffs asked the Court to reconsider and amend its judgment based on the rationale advanced by the US Department of Labor in a brief the Department had filed in a case involving another company. On 1st February 2010, the Court reaffirmed its dismissal the action. Plaintiffs subsequently filed a notice that they are appealingappealed the decision to the USUnited States Court of Appeals for the Ninth Circuit. On 14th February 2011, the Ninth Circuit issued an opinion in favour of the Group affirming the judgment of the United States District Court for the District of Arizona and finding that the Group’s pharmaceutical sales representatives are exempt employees under the outside sales exemption to the FLSA and, therefore, not entitled to overtime pay.
In November 2010, a purported class action was filed against the Group in the United States District Court for the Northern District of New York on behalf of the Group’s pharmaceutical sales representatives working in New York during the past six years. The plaintiff alleges that these sales representatives are not ‘exempt’ employees, and, therefore, are entitled to overtime under the New York wage and hour laws which closely follow the US Fair Labor Standards Act. In January 2011, a plaintiff filed a similar purported class action in Florida state court alleging that the Group’s pharmaceutical sales representatives are entitled to overtime under the FLSA.
Environmental matters
GSKThe Group has been notified of its potential responsibility relating to past operations and its past waste disposal practices at certain sites, primarily in the USA. Some of these matters are the subject of litigation, including proceedings initiated by the US federal or state governments for waste disposal, site remediation costs and tort actions brought by private parties.
GSKThe Group has been advised that it may be a responsible party at approximately 2928 sites, of which 1412 appear on the National Priority List created by the Comprehensive Environmental Response Compensation and Liability Act (Superfund). These proceedings seek to require the operators of hazardous waste facilities, transporters of waste to the sites and generators of hazardous waste disposed of at the sites to clean up the sites or to reimburse the government for cleanup costs. In most instances, GSKthe Group is involved as an alleged generator of hazardous waste. Although Superfund provides that the defendants are jointly and severally liable for cleanup costs, these proceedings are frequently resolved on the basis of the nature and quantity of waste disposed of by the generator at the site. GSK’sThe Group’s proportionate liability for cleanup costs has been substantially determined for about 20 of the sites referred to above.
GSK’sThe Group’s potential liability varies greatly from site to site. While the cost of investigation, study and remediation at such sites could, over time, be substantial, GSKthe Group routinely accrues amounts related to its share of the liability for such matters.
GSK Annual Report 20092010
177186
Shareholder informationFinancial record
The shareholder information section includes the financial record presenting historical information prepared in accordance with IFRS as adopted by the European Union, and also with IFRS as issued by the IASB, and the full product development pipeline. The section also discusses shareholder return in the form of dividends and share price movements and provides other information for shareholders.
The share price movements and dividends are shown by the graphs below. Details of the price movements and dividends are on pages 193 to 194.
| | | | |
Shareholder information
| | | 177 | |
Quarterly trend | | | 178 | |
Five year record | | | 186 | |
Product development pipeline
| | | 189 | |
Share price and dividends | | | 193 | |
Nature of trading market | | | 194 | |
Annual General Meeting | | | 194 | |
Investor relations and Registrar | | | 195 | |
Taxation information for shareholders | | | 196 | |
Glossary of terms
| | | 197 | |
Analysis of shareholdings at 31st December 2009
| | | | | | | | | | | | | | | | | |
| | | Number of | | | % of total | | | % of total | | | Number of | |
| | | accounts | | | accounts | | | shares | | | shares | |
| | | | | | | | | | |
Holding of shares | | | | | | | | | | | | | | | | |
| Up to 1,000 | | | 118,849 | | | | 72 | | | | 1 | | | | 42,629,294 | |
| 1,001 to 5,000 | | | 36,802 | | | | 22 | | | | 1 | | | | 78,738,160 | |
| 5,001 to 100,000 | | | 8,503 | | | | 5 | | | | 2 | | | | 124,902,813 | |
| 100,001 to 1,000,000 | | | 875 | | | | 1 | | | | 6 | | | | 312,712,630 | |
| Over 1,000,000 | | | 423 | | | | – | | | | 90 | | | | 5,106,145,822 | |
| | | | | | | | | | |
| | | | 165,452 | | | | 100 | | | | 100 | | | | 5,665,128,719 | |
| | | | | | | | | | |
Held by | | | | | | | | | | | | | | | | |
| Nominee companies | | | 27,603 | | | | 17 | | | | 74 | | | | 4,176,525,968 | |
| Investment and trust companies | | | 44 | | | | – | | | | – | | | | 2,385,639 | |
| Insurance companies | | | 9 | | | | – | | | | – | | | | 5,144 | |
| Individuals and other corporate bodies | | | 137,794 | | | | 83 | | | | 5 | | | | 276,192,537 | |
| BNY (Nominees) Limited | | | 1 | | | | – | | | | 13 | | | | 735,825,273 | |
| Held as Treasury shares by GlaxoSmithKline | | | 1 | | | | – | | | | 8 | | | | 474,194,158 | |
| | | | | | | | | | |
| | | | 165,452 | | | | 100 | | | | 100 | | | | 5,665,128,719 | |
| | | | | | | | | | | | |
The Bank of New York Mellon’s holding held through BNY (Nominees) Limited represents the company’s ADR programme, whereby each ADS represents two Ordinary Shares of 25p nominal value. At 19th February 2010, BNY (Nominees) Limited held 735,816,825 Ordinary Shares representing 14.17% of the issued share capital excluding Treasury shares at that date.
At 19th February 2010, the number of holders of shares in the USA was 1,088 with holdings of 1,310,916 shares, and the number of registered holders of the ADR was 33,963 with holdings of 367,903,742 ADR. Certain of these shares and ADR were held by brokers or other nominees. As a result the number of holders of record or registered holders in the USA is not representative of the number of beneficial holders or of the residence of beneficial holders.
GSK Annual Report 2009
178
Shareholder information
Quarterly trend
An unaudited analysis of the Group results and pharmaceutical sales by therapeutic area is provided by quarter in Sterling for the financial year 2009.2010.
| | | | | | | | | | | | | | | | | | | | | | | | | |
| Income statement – total | | 12 months 2009 | | | Q4 2009 | |
| | £m | | | CER% | | | £% | | | £m | | | CER% | | | £% | |
| | | | | | | | | | | | | | | | |
| Turnover – Pharmaceuticals | | | 23,714 | | | | 2 | | | | 16 | | | | 6,916 | | | | 15 | | | | 19 | |
| – Consumer Healthcare | | | 4,654 | | | | 7 | | | | 17 | | | | 1,178 | | | | 5 | | | | 6 | |
| | | | | | | | | | | | | | | | |
| Total turnover | | | 28,368 | | | | 3 | | | | 16 | | | | 8,094 | | | | 13 | | | | 17 | |
| Cost of sales | | | (7,380 | ) | | | 6 | | | | 15 | | | | (2,119 | ) | | | 4 | | | | 8 | |
| Selling, general and administrative | | | (9,592 | ) | | | 6 | | | | 25 | | | | (2,954 | ) | | | 13 | | | | 29 | |
| Research and development | | | (4,106 | ) | | | 1 | | | | 12 | | | | (1,127 | ) | | | (9 | ) | | | (7 | ) |
| Other operating income | | | 1,135 | | | | | | | | | | | | 553 | | | | | | | | | |
| | | | | | | | | | | | | | | | |
| Operating profit | | | 8,425 | | | | 4 | | | | 18 | | | | 2,447 | | | | 68 | | | | 55 | |
| | | | | | | | | | | | | | | | |
| Finance income | | | 70 | | | | | | | | | | | | 5 | | | | | | | | | |
| Finance costs | | | (783 | ) | | | | | | | | | | | (213 | ) | | | | | | | | |
| Profit on disposal of interest in associate | | | 115 | | | | | | | | | | | | | | | | | | | | | |
| Share of after tax profits of associates and joint ventures | | | 64 | | | | | | | | | | | | 11 | | | | | | | | | |
| | | | | | | | | | | | | | | | |
| Profit before taxation | | | 7,891 | | | | 4 | | | | 19 | | | | 2,250 | | | | 77 | | | | 61 | |
| Taxation | | | (2,222 | ) | | | | | | | | | | | (582 | ) | | | | | | | | |
| Tax rate % | | | 28.2 | % | | | | | | | | | | | 25.9 | % | | | | | | | | |
| | | | | | | | | | | | | | | | |
| Profit after taxation for the period | | | 5,669 | | | | 6 | | | | 20 | | | | 1,668 | | | | 79 | | | | 64 | |
| | | | | | | | | | | | | | | | |
| Profit attributable to minority interests | | | 138 | | | | | | | | | | | | 38 | | | | | | | | | |
| Profit attributable to shareholders | | | 5,531 | | | | | | | | | | | | 1,630 | | | | | | | | | |
| | | | | | | | | | | | | | | | |
| Basic earnings per share (pence) | | | 109.1 | p | | | 8 | | | | 23 | | | | 32.1 | p | | | 82 | | | | 66 | |
| | | | | | | | | | | | | | | | |
| Diluted earnings per share (pence) | | | 108.2 | p | | | | | | | | | | | 31.8 | p | | | | | | | | |
| | | | | | | | | | | | | | | | |
Income statement – results before major restructuring
| | | | | | | | | | | | | | | | | |
| | | | | | |
| Income statement – total | | | 12 months 2010 | | Q4 2010 | |
| | | | £m | | CER% | | £% | | £m | | CER% | | £% | |
| | | | | | | | | | | | | | |
| Turnover – Pharmaceuticals | | | 23,382 | | | (2 | ) | | | (1 | ) | | 5,930 | | | (16 | ) | | | (14 | ) |
| – Consumer Healthcare | | | 5,010 | | 5 | | 7 | | 1,267 | | 4 | | 7 | |
| | | | | | | | | | | | | | |
Total turnover | | | 28,392 | | | (1 | ) | | – | | 7,197 | | | (13 | ) | | | (11 | ) |
| Cost of sales | | | | (7,592 | ) | | 3 | | 3 | | | (2,077 | ) | | | (2 | ) | | | (2 | ) |
| Selling, general and administration | | | | (13,053 | ) | | 36 | | 36 | | | (4,461 | ) | | 48 | | 51 | |
| Research and development | | | | (4,457 | ) | | 8 | | 9 | | | (1,097 | ) | | | (4 | ) | | | (3 | ) |
| Other operating income | | | 493 | | 118 | |
| | | | | | | | | | | | | | |
| Operating profit | | | 3,783 | | | (59 | ) | | | (55 | ) | | | (320 | ) | | | (>100 | ) | | | (>100 | ) |
| Finance income | | | 116 | | 58 | |
| Finance costs | | | | (831 | ) | | | (240 | ) | |
| Profit on disposal of interest in associate | | | 8 | | 8 | |
| Share of after tax profits of associates and joint ventures | | | 81 | | 18 | |
| | | | | | | | | | | | | | |
Profit before taxation | | | 3,157 | | | (64 | ) | | | (60 | ) | | | (476 | ) | | | (>100 | ) | | | (>100 | ) |
| Taxation | | | | (1,304 | ) | | | (157 | ) | |
| Tax rate % | | | | 41.3 | % | | | 33.0 | % | |
| | | | | | | | | | | | | | |
Profit after taxation for the period | | | 1,853 | | | (71 | ) | | | (67 | ) | | | (633 | ) | | | (>100 | ) | | | (>100 | ) |
| | | | | | | | | | | | | | |
| Profit attributable to non-controlling interests | | | 219 | | 57 | |
| Profit attributable to shareholders | | | 1,634 | | | (690 | ) | |
| | | | | | | | | | | | | | |
Basic earnings per share (pence) | | | 32.1 | p | | | (75 | ) | | | (71 | ) | | (13.6 | )p | | | (>100 | ) | | | (>100 | ) |
| | | | | | | | | | | | | | |
Diluted earnings per share (pence) | | | 31.9 | p | | (13.4 | )p | |
| | | | | | | | | | | | | | |
| | | |
| Income statement – results before major restructuring | | Income statement – results before major restructuring |
| | | | | | | | | | | | | | | | | | |
| | | | | | | | | | | | | | | | | | | | | | | | |
| Total turnover | | 28,368 | | 3 | | 16 | | 8,094 | | 13 | | 17 | | | 28,392 | | | (1 | ) | | – | | 7,197 | | | (13 | ) | | | (11 | ) |
| Cost of sales | | | (7,095 | ) | | 13 | | 23 | | | (2,098 | ) | | 22 | | 28 | | | | (7,405 | ) | | 4 | | 4 | | | (1,980 | ) | | | (6 | ) | | | (6 | ) |
| Selling, general and administrative | | | (9,200 | ) | | 6 | | 25 | | | (2,780 | ) | | 11 | | 26 | | |
| Selling, general and administration | | | | (12,388 | ) | | 35 | | 35 | | | (4,289 | ) | | 51 | | 54 | |
| Research and development | | | (3,951 | ) | | 2 | | 13 | | | (1,092 | ) | | | (2 | ) | | – | | | | (3,964 | ) | | – | | – | | | (1,083 | ) | | | (3 | ) | | | (1 | ) |
| Other operating income | | 1,135 | | 553 | | | 493 | | 118 | |
| | | | | | | | | | | | | | | | | | | | | | | | |
| Operating profit | | 9,257 | | | (1 | ) | | 12 | | 2,677 | | 37 | | 27 | | | 5,128 | | | (48 | ) | | | (45 | ) | | | (37 | ) | | | (>100 | ) | | | (>100 | ) |
| | | | | | | | | | | | | | | | | | | | | | | | |
| Finance income | | 70 | | 5 | | | 116 | | 58 | |
| Finance costs | | | (780 | ) | | | (213 | ) | | | | (828 | ) | | | (240 | ) | |
| Profit on disposal of interest in associate | | 115 | | | 8 | | 8 | |
| Share of after tax profits of associates and joint ventures | | 64 | | 11 | | | 81 | | 18 | |
| | | | | | | | | | | | | | | | | | | | | | | | |
| Profit before taxation | | 8,726 | | | (1 | ) | | 12 | | 2,480 | | 40 | | 29 | | | 4,505 | | | (52 | ) | | | (48 | ) | | | (193 | ) | | | (>100 | ) | | | (>100 | ) |
| Taxation | | | (2,443 | ) | | | (646 | ) | | | | (1,544 | ) | | | (134 | ) | |
| Tax rate % | | | 28.0 | % | | | 26.0 | % | | | | 34.3 | % | | | 69.4 | % | |
| | | | | | | | | | | | | | | | | | | | | | | | |
| Profit after taxation for the period | | 6,283 | | – | | 13 | | 1,834 | | 42 | | 32 | | | 2,961 | | | (56 | ) | | | (53 | ) | | | (327 | ) | | | (>100 | ) | | | (>100 | ) |
| | | | | | | | | | | | | | | | | | | | | | | | |
| Profit attributable to minority interests | | 138 | | 38 | | |
| Profit attributable to non-controlling interests | | | 219 | | 57 | |
| Profit attributable to shareholders | | 6,145 | | 1,796 | | | 2,742 | | | (384 | ) | |
| | | | | | | | | | | | | | | | | | | | | | | | |
| Adjusted earnings per share (pence) | | 121.2 | p | | 2 | | 16 | | 35.4 | p | | 43 | | 33 | | | 53.9 | p | | �� | (59 | ) | | | (56 | ) | | (7.5 | )p | | | (>100 | ) | | | (>100 | ) |
| | | | | | | | | | | | | | | | | | | | | | | | |
| Diluted earnings per share (pence) | | 120.3 | p | | 35.1 | p | | | 53.5 | p | | (7.5 | )p | |
| | | | | | | | | | | | | | | | | | | | | | | | |
The calculation of results before major restructuring is described in Note 1 to the financial statements, ‘Presentation of the financial statements’.
GSK Annual Report 20092010
179187
Shareholder informationFinancial record
| | | | | | | | | | | | | | | | | | | | | | | | | | | | | | | | | | | | | |
| Q3 2009 | | | Q2 2009 | | | Q1 2009 | |
| | | £m | | | CER% | | | £% | | | £m | | | CER% | | | £% | | | £m | | | CER% | | | £% | |
| | | | | | | | | | | | | | | | | | | | | | | | | |
| | | | 5,593 | | | | 2 | | | | 14 | | | | 5,582 | | | | (4 | ) | | | 13 | | | | 5,623 | | | | (6 | ) | | | 18 | |
| | | | 1,165 | | | | 8 | | | | 17 | | | | 1,165 | | | | 9 | | | | 23 | | | | 1,146 | | | | 4 | | | | 25 | |
| | | | | | | | | | | | | | | | | | | | | | | | | |
| | | | 6,758 | | | | 3 | | | | 15 | | | | 6,747 | | | | (2 | ) | | | 15 | | | | 6,769 | | | | (5 | ) | | | 19 | |
| | | | (1,782 | ) | | | 5 | | | | 12 | | | | (1,692 | ) | | | 1 | | | | 12 | | | | (1,787 | ) | | | (17 | ) | | | 31 | |
| | | | (2,146 | ) | | | 4 | | | | 18 | | | | (2,292 | ) | | | 4 | | | | 28 | | | | (2,200 | ) | | | 1 | | | | 26 | |
| | | | (882 | ) | | | (5 | ) | | | 1 | | | | (973 | ) | | | 4 | | | | 19 | | | | (1,124 | ) | | | 20 | | | | 44 | |
| | | | 123 | | | | | | | | | | | | 405 | | | | | | | | | | | | 54 | | | | | | | | | |
| | | | | | | | | | | | | | | | | | | | | | | | | |
| | | | 2,071 | | | | 7 | | | | 25 | | | | 2,195 | | | | (5 | ) | | | 13 | | | | 1,712 | | | | (40 | ) | | | (13 | ) |
| | | | | | | | | | | | | | | | | | | | | | | | | |
| | | | 19 | | | | | | | | | | | | 18 | | | | | | | | | | | | 28 | | | | | | | | | |
| | | | (199 | ) | | | | | | | | | | | (168 | ) | | | | | | | | | | | (203 | ) | | | | | | | | |
| | | | | | | | | | | | | | | | | | | | | | | | | | | | 115 | | | | | | | | | |
| | | | 22 | | | | | | | | | | | | 17 | | | | | | | | | | | | 14 | | | | | | | | | |
| | | | | | | | | | | | | | | | | | | | | | | | | |
| | | | 1,913 | | | | 5 | | | | 23 | | | | 2,062 | | | | (6 | ) | | | 12 | | | | 1,666 | | | | (40 | ) | | | (11 | ) |
| | | | (542 | ) | | | | | | | | | | | (601 | ) | | | | | | | | | | | (497 | ) | | | | | | | | |
| | | | 28.3 | % | | | | | | | | | | | 29.1 | % | | | | | | | | | | | 29.8 | % | | | | | | | | |
| | | | | | | | | | | | | | | | | | | | | | | | | |
| | | | 1,371 | | | | 11 | | | | 30 | | | | 1,461 | | | | (7 | ) | | | 12 | | | | 1,169 | | | | (41 | ) | | | (12 | ) |
| | | | | | | | | | | | | | | | | | | | | | | | | |
| | | | 36 | | | | | | | | | | | | 26 | | | | | | | | | | | | 38 | | | | | | | | | |
| | | | 1,335 | | | | | | | | | | | | 1,435 | | | | | | | | | | | | 1,131 | | | | | | | | | |
| | | | | | | | | | | | | | | | | | | | | | | | | |
| | | | 26.3 | p | | | 11 | | | | 31 | | | | 28.3 | p | | | (4 | ) | | | 15 | | | | 22.3 | p | | | (39 | ) | | | (9 | ) |
| | | | | | | | | | | | | | | | | | | | | | | | | |
| | | | 26.1 | p | | | | | | | | | | | 28.1 | p | | | | | | | | | | | 22.2 | p | | | | | | | | |
| | | | | | | | | | | | | | | | | | | | | | | | | |
| | | | | | | | | | | | | | | | | | | | | | | | | | | | | | | | | | | | | |
| | | | | | | | | | | | | | | | | | | | | | | | | |
| | | | 6,758 | | | | 3 | | | | 15 | | | | 6,747 | | | | (2 | ) | | | 15 | | | | 6,769 | | | | (5 | ) | | | 19 | |
| | | | (1,732 | ) | | | 11 | | | | 19 | | | | (1,621 | ) | | | 6 | | | | 18 | | | | (1,644 | ) | | | 13 | | | | 27 | |
| | | | (2,064 | ) | | | 9 | | | | 24 | | | | (2,227 | ) | | | 3 | | | | 26 | | | | (2,129 | ) | | | (1 | ) | | | 24 | |
| | | | (862 | ) | | | (4 | ) | | | 3 | | | | (923 | ) | | | – | | | | 15 | | | | (1,074 | ) | | | 14 | | | | 38 | |
| | | | 123 | | | | | | | | | | | | 405 | | | | | | | | | | | | 54 | | | | | | | | | |
| | | | | | | | | | | | | | | | | | | | | | | | | |
| | | | 2,223 | | | | (3 | ) | | | 12 | | | | 2,381 | | | | (6 | ) | | | 12 | | | | 1,976 | | | | (31 | ) | | | (4 | ) |
| | | | | | | | | | | | | | | | | | | | | | | | | |
| | | | 19 | | | | | | | | | | | | 18 | | | | | | | | | | | | 28 | | | | | | | | | |
| | | | (199 | ) | | | | | | | | | | | (166 | ) | | | | | | | | | | | (202 | ) | | | | | | | | |
| | | | | | | | | | | | | | | | | | | | | | | | | | | | 115 | | | | | | | | | |
| | | | 22 | | | | | | | | | | | | 17 | | | | | | | | | | | | 14 | | | | | | | | | |
| | | | | | | | | | | | | | | | | | | | | | | | | |
| | | | 2,065 | | | | (5 | ) | | | 10 | | | | 2,250 | | | | (6 | ) | | | 11 | | | | 1,931 | | | | (31 | ) | | | (2 | ) |
| | | | (585 | ) | | | | | | | | | | | (652 | ) | | | | | | | | | | | (560 | ) | | | | | | | | |
| | | | 28.3 | % | | | | | | | | | | | 29.0 | % | | | | | | | | | | | 29.0 | % | | | | | | | | |
| | | | | | | | | | | | | | | | | | | | | | | | | |
| | | | 1,480 | | | | (3 | ) | | | 12 | | | | 1,598 | | | | (7 | ) | | | 11 | | | | 1,371 | | | | (31 | ) | | | (2 | ) |
| | | | | | | | | | | | | | | | | | | | | | | | | |
| | | | 36 | | | | | | | | | | | | 26 | | | | | | | | | | | | 38 | | | | | | | | | |
| | | | 1,444 | | | | | | | | | | | | 1,572 | | | | | | | | | | | | 1,333 | | | | | | | | | |
| | | | | | | | | | | | | | | | | | | | | | | | | |
| | | | 28.5 | p | | | (3 | ) | | | 13 | | | | 31.0 | p | | | (4 | ) | | | 14 | | | | 26.3 | p | | | (28 | ) | | | 3 | |
| | | | | | | | | | | | | | | | | | | | | | | | | |
| | | | 28.3 | p | | | | | | | | | | | 30.8 | p | | | | | | | | | | | 26.2 | p | | | | | | | | |
| | | | | | | | | | | | | | | | | | | | | | | | | |
| | | | | | | | | | | | | | | | | | | | | | | | | | | | | | | | | | | |
| | | | | | | | |
| Q3 2010 | | | Q2 2010 | | | Q1 2010 | |
| £m | | | CER% | | | £% | | | £m | | | CER% | | | £% | | | £m | | | CER% | | | £% | |
| | 5,553 | | | | (3 | ) | | | (1 | ) | | | 5,773 | | | | – | | | | 3 | | | | 6,126 | | | | 14 | | | | 9 | |
| | 1,260 | | | | 4 | | | | 8 | | | | 1,252 | | | | 3 | | | | 7 | | | | 1,231 | | | | 9 | | | | 7 | |
| | | | | | | | | | | | | | | | | | | | | | | | | | |
| | 6,813 | | | | (2 | ) | | | 1 | | | | 7,025 | | | | – | | | | 4 | | | | 7,357 | | | | 13 | | | | 9 | |
| | (1,906 | ) | | | 7 | | | | 7 | | | | (1,657 | ) | | | 4 | | | | 2 | | | | (1,952 | ) | | | 11 | | | | 9 | |
| | (2,040 | ) | | | (9 | ) | | | (5 | ) | | | (4,202 | ) | | | 82 | | | | (83 | ) | | | (2,350 | ) | | | 17 | | | | 7 | |
| | (1,004 | ) | | | 11 | | | | 14 | | | | (1,196 | ) | | | 21 | | | | (23 | ) | | | (1,160 | ) | | | 7 | | | | 3 | |
| | 95 | | | | | | | | | | | | 81 | | | | | | | | | | | | 199 | | | | | | | | | |
| | | | | | | | | | | | | | | | | | | | | | | | | | |
| | 1,958 | | | | (10 | ) | | | (5 | ) | | | 51 | | | | (106 | ) | | | (98 | ) | | | 2,094 | | | | 22 | | | | 22 | |
| | 22 | | | | | | | | | | | | 19 | | | | | | | | | | | | 17 | | | | | | | | | |
| | (197 | ) | | | | | | | | | | | (189 | ) | | | | | | | | | | | (205 | ) | | | | | | | | |
| | – | | | | | | | | | | | | – | | | | | | | | | | | | – | | | | | | | | | |
| | | | | | | | | | | | | | | | | | | | | | | | | | | | | | | | | | | |
| | 16 | | | | | | | | | | | | 22 | | | | | | | | | | | | 25 | | | | | | | | | |
| | | | | | | | | | | | | | | | | | | | | | | | | | |
| | 1,799 | | | | (11 | ) | | | (6 | ) | | | (97 | ) | | | | | | | | | | | 1,931 | | | | 15 | | | | 16 | |
| | (456 | ) | | | | | | | | | | | (155 | ) | | | | | | | | | | | (536 | ) | | | | | | | | |
| | 25.3 | % | | | | | | | | | | | 159.8 | % | | | | | | | | | | | 27.8 | % | | | | | | | | |
| | | | | | | | | | | | | | | | | | | | | | | | | | |
| | 1,343 | | | | (8 | ) | | | (2 | ) | | | (252 | ) | | | | | | | | | | | 1,395 | | | | 19 | | | | 19 | |
| | | | | | | | | | | | | | | | | | | | | | | | | | |
| | 55 | | | | | | | | | | | | 52 | | | | | | | | | | | | 55 | | | | | | | | | |
| | 1,288 | | | | | | | | | | | | (304 | ) | | | | | | | | | | | 1,340 | | | | | | | | | |
| | | | | | | | | | | | | | | | | | | | | | | | | | |
| | 25.3 | p | | | (10 | ) | | | (4 | ) | | | (6.0 | )p | | | (129 | ) | | | (121 | ) | | | 26.4 | p | | | 18 | | | | 18 | |
| | | | | | | | | | | | | | | | | | | | | | | | | | |
| | 25.1 | p | | | | | | | | | | | (5.9 | )p | | | | | | | | | | | 26.1 | p | | | | | | | | |
| | | | | | | | | | | | | | | | | | | | | | | | | | |
| | | | | | | | | | | | | | | | | | | | | | | | | | | | | | | | | | | |
| | | | | | | | | | | | | | | | | | | | | | | | | | | | | | | | | | | |
| | | | | | | | | | | | | | | | | | | | | | | | | | | | | | | | | | | |
| | | | | | | | | | | | | | | | | | | | | | | | | | |
| | 6,813 | | | | (2 | ) | | | 1 | | | | 7,025 | | | | – | | | | 4 | | | | 7,357 | | | | 13 | | | | 9 | |
| | (1,875 | ) | | | 9 | | | | 8 | | | | (1,626 | ) | | | (2 | ) | | | – | | | | (1,924 | ) | | | 19 | | | | 17 | |
| | (1,956 | ) | | | (9 | ) | | | (5 | ) | | | (3,845 | ) | | | 71 | | | | 73 | | | | (2,298 | ) | | | 18 | | | | 8 | |
| | (948 | ) | | | 8 | | | | 10 | | | | (994 | ) | | | 5 | | | | 8 | | | | (939 | ) | | | (9 | ) | | | (13 | ) |
| | 95 | | | | | | | | | | | | 81 | | | | | | | | | | | | 199 | | | | | | | | | |
| | 2,129 | | | | (9 | ) | | | (4 | ) | | | 641 | | | | (80 | ) | | | (73 | ) | | | 2,395 | | | | 21 | | | | 21 | |
| | | | | | | | | | | | | | | | | | | | | | | | | | |
| | 22 | | | | | | | | | | | | 19 | | | | | | | | | | | | 17 | | | | | | | | | |
| | (196 | ) | | | | | | | | | | | (188 | ) | | | | | | | | | | | (204 | ) | | | | | | | | |
| | – | | | | | | | | | | | | – | | | | | | | | | | | | – | | | | | | | | | |
| | 16 | | | | | | | | | | | | 22 | | | | | | | | | | | | 25 | | | | | | | | | |
| | | | | | | | | | | | | | | | | | | | | | | | | | | | | | | | | | | |
| | 1,971 | | | | (10 | ) | | | (5 | ) | | | 494 | | | | (86 | ) | | | (78 | ) | | | 2,233 | | | | 16 | | | | 16 | |
| | (480 | ) | | | | | | | | | | | (312 | ) | | | | | | | | | | | (618 | ) | | | | | | | | |
| | 24.4 | % | | | | | | | | | | | 63.2 | % | | | | | | | | | | | 27.7 | % | | | | | | | | |
| | | | | | | | | | | | | | | | | | | | | | | | | | |
| | 1,491 | | | | (5 | ) | | | 1 | | | | 182 | | | | (96 | ) | | | (89 | ) | | | 1,615 | | | | 18 | | | | 18 | |
| | | | | | | | | | | | | | | | | | | | | | | | | | |
| | 55 | | | | | | | | | | | | 52 | | | | | | | | | | | | 55 | | | | | | | | | |
| | 1,436 | | | | | | | | | | | | 130 | | | | | | | | | | | | 1,560 | | | | | | | | | |
| | | | | | | | | | | | | | | | | | | | | | | | | | |
| | 28.2 | p | | | (6 | ) | | | (1 | ) | | | 2.6 | p | | | (99 | ) | | | (92 | ) | | | 30.7 | p | | | 16 | | | | 17 | |
| | | | | | | | | | | | | | | | | | | | | | | | | | |
| | 28.0 | p | | | | | | | | | | | 2.5 | p | | | | | | | | | | | 30.4 | p | | | | | | | | |
| | | | | | | | | | | | | | | | | | | | | | | | | | |
GSK Annual Report 20092010
180188
Shareholder informationFinancial record
Quarterly trend
Pharmaceutical turnover – total Group
| | | | | | | | | | | | | | | | | | | | | | | | | | | | | | | | | | | | | | | | | | | | | | | | | | | | | | | | | | | | | | | | | | | | | | | | | | |
| | | Q4 2009 | | Q3 2009 | | Q2 2009 | | Q1 2009 | | | | | | | | | |
| | | £m | | CER% | | £% | | £m | | CER% | | £% | | £m | | CER% | | £% | | £m | | CER% | | £% | | | Q4 2010 | | Q3 2010 | | Q2 2010 | | Q1 2010 | |
| | | | | | | | | | | | | | | | | | | | | | | | | | | £m | | CER% | | £% | | £m | | CER% | | £% | | £m | | CER% | | £% | | £m | | CER% | | £% | |
| | | | | | | | | | | | | | | | | | | | | | | | | | |
Respiratory | | 1,914 | | 7 | | 11 | | 1,594 | | 6 | | 18 | | 1,734 | | 6 | | 25 | | 1,735 | | 1 | | 28 | | | 1,917 | | | (2 | ) | | – | | 1,726 | | 5 | | 8 | | 1,829 | | 2 | | 5 | | 1,766 | | 6 | | 2 | |
Avamys/Veramyst | | 33 | | 36 | | 32 | | 31 | | 59 | | 82 | | 47 | | >100 | | >100 | | 31 | | 85 | | >100 | | | 50 | | 45 | | 52 | | 40 | | 23 | | 29 | | 57 | | 19 | | 21 | | 46 | | 52 | | 48 | |
Flixonase/Flonase | | 35 | | | (14 | ) | | | (17 | ) | | 28 | | | (21 | ) | | | (15 | ) | | 39 | | | (46 | ) | | | (40 | ) | | 69 | | 11 | | 50 | | | 37 | | 3 | | 6 | | 32 | | 11 | | 14 | | 50 | | 21 | | 28 | | 45 | | | (30 | ) | | | (35 | ) |
Flixotide/Flovent | | 222 | | 3 | | 7 | | 169 | | – | | 13 | | 189 | | 1 | | 20 | | 195 | | | (6 | ) | | 20 | | | 220 | | | (5 | ) | | | (1 | ) | | 187 | | 7 | | 11 | | 201 | | 1 | | 6 | | 196 | | 5 | | 1 | |
Seretide/Advair | | 1,366 | | 7 | | 10 | | 1,152 | | 5 | | 17 | | 1,245 | | 9 | | 29 | | 1,214 | | – | | 27 | | | 1,346 | | | (4 | ) | | | (1 | ) | | 1,243 | | 5 | | 8 | | 1,286 | | – | | 3 | | 1,264 | | 9 | | 4 | |
Serevent | | 61 | | | (14 | ) | | | (13 | ) | | 54 | | | (18 | ) | | | (10 | ) | | 59 | | | (21 | ) | | | (11 | ) | | 62 | | | (24 | ) | | | (7 | ) | | 50 | | | (21 | ) | | | (18 | ) | | 48 | | | (13 | ) | | | (11 | ) | | 52 | | | (14 | ) | | | (12 | ) | | 51 | | | (16 | ) | | | (18 | ) |
Ventolin | | 139 | | 28 | | 34 | | 110 | | 28 | | 41 | | 112 | | 23 | | 40 | | 116 | | 23 | | 51 | | | 142 | | | (1 | ) | | 2 | | 130 | | 15 | | 18 | | 134 | | 16 | | 20 | | 116 | | 3 | | – | |
Zyrtec | | 22 | | 67 | | 83 | | 18 | | >100 | | >100 | | 17 | | 63 | | >100 | | 18 | | 9 | | 64 | | | 23 | | | (5 | ) | | 5 | | 19 | | – | | 6 | | 20 | | 6 | | 18 | | 20 | | 17 | | 11 | |
| | | | | | | | | | | | | | | | | | | | | | | | | | | | | | | | | | | | | | | | | | | | | | | | | |
| | | |
Anti-virals | | 1,033 | | 9 | | 12 | | 1,049 | | 15 | | 32 | | 952 | | 5 | | 27 | | 1,116 | | 18 | | 51 | | | 224 | | | (64 | ) | | | (62 | ) | | 218 | | | (68 | ) | | | (65 | ) | | 286 | | | (50 | ) | | | (47 | ) | | 358 | | | (44 | ) | | | (46 | ) |
HIV | | 412 | | | (3 | ) | | | (1 | ) | | 392 | | | (7 | ) | | 4 | | 382 | | | (10 | ) | | 6 | | 419 | | | (8 | ) | | 17 | | |
Agenerase, Lexiva | | 44 | | | (9 | ) | | | (6 | ) | | 43 | | | (3 | ) | | 8 | | 43 | | | (8 | ) | | 13 | | 48 | | 6 | | 37 | | |
Combivir | | 109 | | | (5 | ) | | | (4 | ) | | 102 | | | (15 | ) | | – | | 102 | | | (17 | ) | | | (2 | ) | | 112 | | | (16 | ) | | 7 | | |
Epivir | | 30 | | | (17 | ) | | | (17 | ) | | 34 | | | (14 | ) | | | (3 | ) | | 31 | | | (24 | ) | | | (9 | ) | | 34 | | | (21 | ) | | – | | |
Epzicom/Kivexa | | 149 | | 11 | | 16 | | 131 | | 6 | | 19 | | 129 | | 6 | | 24 | | 137 | | 10 | | 38 | | |
Trizivir | | 49 | | | (19 | ) | | | (17 | ) | | 48 | | | (12 | ) | | | (2 | ) | | 48 | | | (18 | ) | | | (4 | ) | | 56 | | | (20 | ) | | 4 | | |
Ziagen | | 27 | | | (7 | ) | | | (4 | ) | | 26 | | | (11 | ) | | | (4 | ) | | 25 | | | (19 | ) | | | (4 | ) | | 27 | | | (16 | ) | | 8 | | |
| | | |
Hepsera | | | 33 | | – | | 10 | | 32 | | 7 | | 14 | | 34 | | 7 | | 17 | | 29 | | 11 | | 7 | |
Relenza | | | 11 | | | (96 | ) | | | (96 | ) | | 18 | | | (91 | ) | | | (90 | ) | | 8 | | | (97 | ) | | | (87 | ) | | 84 | | | (60 | ) | | | (62 | ) |
Valtrex | | 222 | | | (34 | ) | | | (39 | ) | | 349 | | | (1 | ) | | 15 | | 379 | | 9 | | 37 | | 344 | | 2 | | 38 | | | 96 | | | (60 | ) | | | (57 | ) | | 95 | | | (75 | ) | | | (73 | ) | | 165 | | | (59 | ) | | | (56 | ) | | 176 | | | (46 | ) | | | (49 | ) |
| | | |
Relenza | | 256 | | >100 | | >100 | | 182 | | >100 | | >100 | | 60 | | >100 | | >100 | | 222 | | >100 | | >100 | | |
Zeffix | | 55 | | – | | 4 | | 54 | | 14 | | 29 | | 55 | | | (4 | ) | | 17 | | 53 | | | (13 | ) | | 15 | | | 64 | | 9 | | 16 | | 55 | | | (4 | ) | | 2 | | 62 | | 7 | | 13 | | 52 | | 4 | | | (2 | ) |
| | | | | | | | | | | | | | | | | | | | | | | | | | |
| | | | | | | | | | | | | | | | | | | | | | | | | | |
Central nervous system | | 504 | | | (27 | ) | | | (24 | ) | | 418 | | | (37 | ) | | | (29 | ) | | 449 | | | (53 | ) | | | (45 | ) | | 499 | | | (53 | ) | | | (40 | ) | | 450 | | | (14 | ) | | | (1 | ) | | 436 | | 1 | | 4 | | 450 | | | (4 | ) | | – | | 417 | | | (13 | ) | | | (16 | ) |
Imigran/Imitrex | | 81 | | | (50 | ) | | | (50 | ) | | 53 | | | (74 | ) | | | (72 | ) | | 68 | | | (65 | ) | | | (61 | ) | | 64 | | | (68 | ) | | | (61 | ) | | 50 | | | (40 | ) | | | (38 | ) | | 53 | | | (4 | ) | | – | | 52 | | | (25 | ) | | | (24 | ) | | 57 | | | (9 | ) | | | (11 | ) |
Lamictal | | 132 | | | (27 | ) | | | (25 | ) | | 121 | | | (21 | ) | | | (11 | ) | | 103 | | | (73 | ) | | | (68 | ) | | 144 | | | (61 | ) | | | (50 | ) | | 130 | | | (3 | ) | | | (2 | ) | | 131 | | 7 | | 8 | | 123 | | 15 | | 19 | | 120 | | | (11 | ) | | | (17 | ) |
Requip | | 65 | | 3 | | 12 | | 43 | | | (30 | ) | | | (23 | ) | | 51 | | | (22 | ) | | | (12 | ) | | 50 | | | (56 | ) | | | (47 | ) | | 60 | | | (9 | ) | | | (8 | ) | | 58 | | 33 | | 35 | | 60 | | 16 | | 18 | | 55 | | 14 | | 10 | |
Requip XL | | 40 | | 85 | | 100 | | 31 | | 87 | | >100 | | 30 | | >100 | | >100 | | 22 | | >100 | | >100 | | |
Seroxat/Paxil | | 139 | | | (16 | ) | | | (10 | ) | | 120 | | | (12 | ) | | 7 | | 138 | | | (13 | ) | | 9 | | 126 | | | (21 | ) | | 4 | | | 128 | | | (15 | ) | | | (8 | ) | | 115 | | | (11 | ) | | | (4 | ) | | 133 | | | (9 | ) | | | (4 | ) | | 106 | | | (12 | ) | | | (16 | ) |
Treximet | | 14 | | 15 | | 8 | | 15 | | >100 | | >100 | | 12 | | 25 | | 50 | | 14 | | – | | – | | | 14 | | – | | – | | 13 | | | (13 | ) | | | (13 | ) | | 16 | | 17 | | 33 | | 13 | | 7 | | | (7 | ) |
Wellbutrin, Wellbutrin XL | | 22 | | | (64 | ) | | | (67 | ) | | 16 | | | (70 | ) | | | (70 | ) | | 30 | | | (72 | ) | | | (69 | ) | | 64 | | | (63 | ) | | | (49 | ) | |
| | | | | | | | | | | | | | | | | | | | | | | | | | |
Wellbutrin | | | 22 | | | (5 | ) | | – | | 18 | | 13 | | 13 | | 21 | | | (33 | ) | | | (30 | ) | | 20 | | | (67 | ) | | | (69 | ) |
| | | | | | | | | | | | | | | | | | | | | | | | | | |
Cardiovascular and urogenital | | 615 | | 10 | | 12 | | 552 | | 5 | | 18 | | 580 | | 10 | | 33 | | 551 | | 6 | | 38 | | | 696 | | 11 | | 13 | | 650 | | 15 | | 18 | | 654 | | 10 | | 13 | | 570 | | 9 | | 3 | |
Arixtra | | 74 | | 31 | | 35 | | 60 | | 20 | | 36 | | 61 | | 39 | | 69 | | 59 | | 29 | | 69 | | | 80 | | 8 | | 8 | | 72 | | 17 | | 20 | | 79 | | 28 | | 30 | | 70 | | 25 | | 19 | |
Avodart | | 143 | | 16 | | 19 | | 131 | | 14 | | 28 | | 134 | | 21 | | 46 | | 122 | | 12 | | 44 | | | 177 | | 22 | | 24 | | 156 | | 16 | | 19 | | 157 | | 14 | | 17 | | 139 | | 20 | | 14 | |
Coreg | | 31 | | | (46 | ) | | | (49 | ) | | 39 | | | (30 | ) | | | (22 | ) | | 51 | | | (9 | ) | | 16 | | 51 | | | (23 | ) | | 6 | | | 41 | | 29 | | 32 | | 44 | | 8 | | 13 | | 44 | | | (16 | ) | | | (14 | ) | | 42 | | | (12 | ) | | | (18 | ) |
Fraxiparine | | 60 | | 2 | | 3 | | 56 | | | (12 | ) | | | (5 | ) | | 58 | | | (9 | ) | | – | | 55 | | | (8 | ) | | 8 | | | 55 | | | (8 | ) | | | (8 | ) | | 54 | | – | | | (4 | ) | | 57 | | | (3 | ) | | | (2 | ) | | 56 | | 4 | | 2 | |
Levitra | | 17 | | 6 | | – | | 20 | | 6 | | 25 | | 18 | | 8 | | 38 | | 20 | | 7 | | 43 | | |
Lovaza | | 129 | | 29 | | 32 | | 111 | | 27 | | 48 | | 104 | | 22 | | 55 | | 106 | | 54 | | >100 | | | 147 | | 11 | | 14 | | 138 | | 20 | | 24 | | 138 | | 29 | | 33 | | 107 | | 9 | | 1 | |
Vesicare | | 29 | | 26 | | 26 | | 25 | | 17 | | 39 | | 26 | | 31 | | 63 | | 24 | | 21 | | 71 | | | 31 | | 3 | | 7 | | 28 | | 8 | | 12 | | 30 | | 12 | | 15 | | 25 | | 13 | | 4 | |
Volibris | | 7 | | >100 | | >100 | | 6 | | >100 | | >100 | | 4 | | – | | – | | 2 | | – | | – | | | 16 | | >100 | | >100 | | 11 | | 100 | | 83 | | 10 | | >100 | | >100 | | 9 | | >100 | | >100 | |
| | | | | | | | | | | | | | | | | | | | | | | | | | | | | | | | | | | | | | | | | | | | | | | | | |
| | | |
Metabolic | | 300 | | | (15 | ) | | | (13 | ) | | 284 | | | (13 | ) | | | (2 | ) | | 303 | | | (12 | ) | | 6 | | 294 | | | (16 | ) | | 8 | | | 110 | | | (65 | ) | | | (63 | ) | | 125 | | | (58 | ) | | | (56 | ) | | 213 | | | (33 | ) | | | (30 | ) | | 230 | | | (18 | ) | | | (22 | ) |
Avandia products | | 191 | | | (17 | ) | | | (17 | ) | | 185 | | | (14 | ) | | | (3 | ) | | 198 | | | (14 | ) | | 2 | | 197 | | | (19 | ) | | 3 | | | 49 | | | (76 | ) | | | (74 | ) | | 70 | | | (65 | ) | | | (62 | ) | | 152 | | | (26 | ) | | | (23 | ) | | 169 | | | (10 | ) | | | (14 | ) |
Avandia | | 112 | | | (24 | ) | | | (24 | ) | | 108 | | | (19 | ) | | | (8 | ) | | 121 | | | (19 | ) | | | (3 | ) | | 121 | | | (23 | ) | | | (1 | ) | |
Avandamet | | 69 | | | (3 | ) | | | (1 | ) | | 66 | | | (6 | ) | | 5 | | 67 | | | (7 | ) | | 10 | | 66 | | | (16 | ) | | 6 | | |
Bonviva/Boniva | | 67 | | | (13 | ) | | | (12 | ) | | 60 | | | (5 | ) | | 7 | | 66 | | | (2 | ) | | 18 | | 62 | | | (4 | ) | | 27 | | | 18 | | | (73 | ) | | | (73 | ) | | 17 | | | (70 | ) | | | (72 | ) | | 20 | | | (70 | ) | | | (70 | ) | | 23 | | | (63 | ) | | | (63 | ) |
| | | | | | | | | | | | | | | | | | | | | | | | | | |
| | | | | | | | | | | | | | | | | | | | | | | | | | |
Anti-bacterials | | 409 | | 2 | | 3 | | 376 | | 3 | | 11 | | 381 | | 3 | | 16 | | 426 | | | (1 | ) | | 17 | | | 370 | | | (2 | ) | | | (2 | ) | | 333 | | | (4 | ) | | | (2 | ) | | 337 | | | (4 | ) | | | (3 | ) | | 356 | | | (6 | ) | | | (9 | ) |
Augmentin | | 173 | | 7 | | 9 | | 162 | | 8 | | 14 | | 146 | | 2 | | 12 | | 186 | | – | | 19 | | | 168 | | | (2 | ) | | | (3 | ) | | 153 | | | (7 | ) | | | (6 | ) | | 144 | | | (3 | ) | | | (1 | ) | | 160 | | | (10 | ) | | | (14 | ) |
| | | | | | | | | | | | | | | | | | | | | | | | | | | | | | | | | | | | | | | | | | | | | | | | | |
| | | |
Oncology and emesis | | 170 | | 17 | | 23 | | 149 | | 4 | | 16 | | 166 | | 19 | | 42 | | 144 | | 1 | | 27 | | | 172 | | – | | 1 | | 172 | | 13 | | 15 | | 175 | | 2 | | 5 | | 169 | | 23 | | 17 | |
Arzerra | | | 9 | | >100 | | >100 | | 9 | | – | | – | | 8 | | – | | – | | 5 | | – | | – | |
Hycamtin | | 45 | | 7 | | 10 | | 41 | | 9 | | 21 | | 43 | | 3 | | 23 | | 43 | | 10 | | 43 | | | 29 | | | (36 | ) | | | (36 | ) | | 35 | | | (15 | ) | | | (15 | ) | | 40 | | | (12 | ) | | | (7 | ) | | 40 | | – | | | (7 | ) |
Promacta | | 5 | | – | | – | | 3 | | – | | – | | 3 | | – | | – | | 2 | | – | | – | | | 10 | | 80 | | 100 | | 7 | | >100 | | >100 | | 8 | | >100 | | >100 | | 6 | | >100 | | >100 | |
Tyverb/Tykerb | | 48 | | 29 | | 37 | | 46 | | 54 | | 77 | | 41 | | 64 | | 86 | | 34 | | 42 | | 79 | | | 60 | | 23 | | 25 | | 58 | | 26 | | 26 | | 56 | | 32 | | 37 | | 53 | | 62 | | 56 | |
Zofran | | 24 | | 35 | | 41 | | 23 | | | (33 | ) | | | (30 | ) | | 30 | | | (16 | ) | | | (3 | ) | | 32 | | | (7 | ) | | 10 | | |
| | | | | | | | | | | | | | | | | | | | | | | | | | |
Votrient | | | 14 | | >100 | | >100 | | 11 | | – | | – | | 8 | | – | | – | | 5 | | – | | – | |
| | | | | | | | | | | | | | | | | | | | | | | | | | |
Vaccines | | 1,523 | | 78 | | 91 | | 802 | | | (2 | ) | | 10 | | 756 | | 14 | | 31 | | 625 | | 18 | | 43 | | | 994 | | | (36 | ) | | | (35 | ) | | 982 | | 19 | | 22 | | 939 | | 17 | | 24 | | 1,411 | | >100 | | >100 | |
Boostrix | | 35 | | 100 | | >100 | | 39 | | 55 | | 77 | | 39 | | 78 | | >100 | | 26 | | 62 | | 100 | | | 49 | | 37 | | 40 | | 59 | | 49 | | 51 | | 43 | | 8 | | 10 | | 30 | | 19 | | 15 | |
Cervarix | | 38 | | | (33 | ) | | | (31 | ) | | 28 | | | (40 | ) | | | (35 | ) | | 73 | | >100 | | >100 | | 48 | | >100 | | >100 | | | 67 | | 68 | | 76 | | 48 | | 64 | | 71 | | 50 | | | (33 | ) | | | (32 | ) | | 77 | | 60 | | 60 | |
Fluarix, FluLaval | | 42 | | | (33 | ) | | | (36 | ) | | 147 | | | (14 | ) | | 2 | | 14 | | >100 | | >100 | | 6 | | – | | – | | | 69 | | 64 | | 64 | | 167 | | 14 | | 14 | | – | | – | | – | | 5 | | | (43 | ) | | | (29 | ) |
| Flu pandemic | | 836 | | >100 | | >100 | | 11 | | – | | 10 | | 30 | | | (26 | ) | | | (12 | ) | | 6 | | 20 | | 20 | | | 161 | | | (82 | ) | | | (81 | ) | | 58 | | >100 | | >100 | | 275 | | >100 | | >100 | | 698 | | >100 | | >100 | |
| Hepatitis | | 151 | | | (19 | ) | | | (18 | ) | | 170 | | | (12 | ) | | | (2 | ) | | 195 | | | (2 | ) | | 17 | | 149 | | | (12 | ) | | 7 | | | 164 | | 5 | | 9 | | 189 | | 9 | | 11 | | 170 | | | (16 | ) | | | (13 | ) | | 197 | | 38 | | 32 | |
Infanrix, Pediarix | | 153 | | | (24 | ) | | | (21 | ) | | 167 | | | (10 | ) | | | (1 | ) | | 154 | | | (20 | ) | | | (8 | ) | | 175 | | | (5 | ) | | 14 | | | 190 | | 24 | | 24 | | 168 | | 1 | | 1 | | 176 | | 14 | | 14 | | 166 | | | (3 | ) | | | (5 | ) |
Rotarix | | 70 | | 5 | | 6 | | 84 | | 92 | | >100 | | 71 | | 69 | | >100 | | 57 | | 74 | | >100 | | | 79 | | 11 | | 13 | | 52 | | | (40 | ) | | | (38 | ) | | 39 | | | (49 | ) | | | (45 | ) | | 65 | | 19 | | 14 | |
Synflorix | | 48 | | – | | – | | 13 | | – | | – | | 12 | | – | | – | | – | | – | | – | | | 48 | | | (2 | ) | | – | | 90 | | >100 | | >100 | | 38 | | >100 | | >100 | | 45 | | – | | – | |
| | | | | | | | | | | | | | | | | | | | | | | | | | | | | | | | | | | | | | | | | | | | | | | | | |
Dermatologicals | | | 288 | | 10 | | 13 | | 272 | | 20 | | 24 | | 262 | | >100 | | >100 | | 265 | | >100 | | >100 | |
Bactroban | | | 29 | | 4 | | 4 | | 33 | | | (3 | ) | | – | | 30 | | | (6 | ) | | | (6 | ) | | 27 | | | (7 | ) | | | (10 | ) |
Dermovate | | | 22 | | – | | – | | 18 | | – | | – | | 19 | | – | | – | | 15 | | – | | – | |
Duac | | | 27 | | 13 | | 17 | | 33 | | 39 | | 43 | | 29 | | – | | – | | 27 | | – | | – | |
Soriatane | | | 17 | | – | | 6 | | 19 | | 58 | | 58 | | 17 | | – | | – | | 18 | | – | | – | |
Zovirax | | | 39 | | | (3 | ) | | 3 | | 31 | | 11 | | 15 | | 33 | | | (6 | ) | | – | | 49 | | 61 | | 58 | |
| | | | | | | | | | | | | | | | | | | | | | | | | | |
Other | | 311 | | 17 | | 20 | | 258 | | 15 | | 24 | | 261 | | | (1 | ) | | 13 | | 233 | | | (25 | ) | | | (11 | ) | | 306 | | 19 | | 21 | | 238 | | 14 | | 15 | | 239 | | 12 | | 15 | | 211 | | 20 | | 17 | |
| | | | | | | | | | | | | | | | | | | | | | | | | | |
| | | | | | | | | | | | | | | | | | | | | | | | | | | 5,527 | | | (17 | ) | | | (15 | ) | | 5,152 | | | (4 | ) | | | (1 | ) | | 5,384 | | – | | 4 | | 5,753 | | 15 | | 11 | |
| | | 6,779 | | 13 | | 17 | | 5,482 | | – | | 12 | | 5,582 | | | (4 | ) | | 13 | | 5,623 | | | (6 | ) | | 18 | | |
| | | | | | | | | | | | | | | | | | | | | | | | | | |
| Stiefel products | | 137 | | – | | – | | 111 | | – | | – | | |
VIIV Healthcare (HIV) | | | 403 | | | (4 | ) | | | (3 | ) | | 401 | | | (1 | ) | | 2 | | 389 | | 1 | | 3 | | 373 | | | (7 | ) | | | (11 | ) |
Combivir | | | 99 | | | (11 | ) | | | (9 | ) | | 96 | | | (10 | ) | | | (6 | ) | | 86 | | | (18 | ) | | | (16 | ) | | 82 | | | (23 | ) | | | (27 | ) |
Epivir | | | 29 | | | (3 | ) | | | (3 | ) | | 31 | | | (15 | ) | | | (9 | ) | | 27 | | | (13 | ) | | | (13 | ) | | 28 | | | (15 | ) | | | (18 | ) |
Epzicom/Kivexa | | | 146 | | | (3 | ) | | | (2 | ) | | 138 | | 3 | | 5 | | 140 | | 8 | | 9 | | 131 | | | (1 | ) | | | (4 | ) |
Lexiva | | | 36 | | | (18 | ) | | | (18 | ) | | 39 | | | (12 | ) | | | (9 | ) | | 39 | | | (12 | ) | | | (9 | ) | | 41 | | | (8 | ) | | | (15 | ) |
Selzentry | | | 22 | | >100 | | >100 | | 20 | | – | | – | | 19 | | – | | – | | 19 | | – | | – | |
Trizivir | | | 32 | | | (35 | ) | | | (35 | ) | | 38 | | | (21 | ) | | | (19 | ) | | 36 | | | (29 | ) | | | (27 | ) | | 38 | | | (27 | ) | | | (32 | ) |
| | | | | | | | | | | | | | | | | | | | | | | | | | | | | | | | | | | | | | | | | | | | | | | | | |
| | | 6,916 | | 15 | | 19 | | 5,593 | | 2 | | 14 | | | 5,930 | | | (16 | ) | | | (14 | ) | | 5,553 | | | (3 | ) | | | (1 | ) | | 5,773 | | – | | 3 | | 6,126 | | 14 | | 9 | |
| | | | | | | | | | | | | | | | | | | | | | | | | | | | | | | | | | | | | |
Pharmaceutical turnover includes co-promotion income.
GSK Annual Report 2009
2010
181189
Shareholder informationFinancial record
Quarterly trend
Pharmaceutical turnover – USA
| | | | | | | | | | | | | | | | | | | | | | | | | | | | | | | | | | | | | | | | | | | | | | | | | | | | | | | | | | | | | | | | | | | | | | | | | | |
| | | Q4 2009 | | Q3 2009 | | Q2 2009 | | Q1 2009 | | | | | | | | | |
| | | £m | | CER% | | £% | | £m | | CER% | | £% | | £m | | CER% | | £% | | £m | | CER% | | £% | | | Q4 2010 | | Q3 2010 | | Q2 2010 | | Q1 2010 | |
| | | | | | | | | | | | | | | | | | | | | | | | | | | £m | | CER% | | £% | | £m | | CER% | | £% | | £m | | CER% | | £% | | £m | | CER% | | £% | |
| | | | | | | | | | | | | | | | | | | | | | | | | | |
Respiratory | | 910 | | 5 | | 7 | | 744 | | 2 | | 17 | | 825 | | 5 | | 34 | | 844 | | | (1 | ) | | 37 | | | 875 | | | (6 | ) | | | (4 | ) | | 846 | | 9 | | 14 | | 868 | | 1 | | 5 | | 805 | | 3 | | | (5 | ) |
Avamys/Veramyst | | 15 | | | (17 | ) | | | (17 | ) | | 15 | | 8 | | 25 | | 18 | | 7 | | 29 | | 20 | | 17 | | 67 | | | 17 | | 7 | | 13 | | 15 | | | (7 | ) | | – | | 20 | | 11 | | 11 | | 17 | | | (10 | ) | | | (15 | ) |
Flixonase/Flonase | | 6 | | | (25 | ) | | | (25 | ) | | 3 | | | (57 | ) | | | (57 | ) | | 8 | | | (82 | ) | | | (76 | ) | | 10 | | 100 | | >100 | | | 5 | | | (17 | ) | | | (17 | ) | | 8 | | >100 | | >100 | | 18 | | >100 | | >100 | | 6 | | | (40 | ) | | | (40 | ) |
Flixotide/Flovent | | 115 | | 9 | | 12 | | 85 | | 4 | | 20 | | 97 | | 12 | | 43 | | 99 | | | (4 | ) | | 32 | | | 118 | | – | | 3 | | 105 | | 19 | | 24 | | 109 | | 8 | | 12 | | 99 | | 8 | | – | |
Seretide/Advair | | 704 | | 3 | | 4 | | 587 | | | (1 | ) | | 14 | | 648 | | 7 | | 37 | | 653 | | | (5 | ) | | 31 | | | 670 | | | (7 | ) | | | (5 | ) | | 649 | | 6 | | 11 | | 655 | | | (3 | ) | | 1 | | 630 | | 4 | | | (4 | ) |
Serevent | | 20 | | | (9 | ) | | | (9 | ) | | 16 | | | (18 | ) | | | (6 | ) | | 18 | | | (13 | ) | | 13 | | 19 | | | (18 | ) | | 12 | | | 15 | | | (25 | ) | | | (25 | ) | | 16 | | | (6 | ) | | – | | 17 | | | (6 | ) | | | (6 | ) | | 16 | | | (11 | ) | | | (16 | ) |
Ventolin | | 48 | | 100 | | >100 | | 35 | | >100 | | >100 | | 32 | | >100 | | >100 | | �� | | 38 | | >100 | | >100 | | | 49 | | – | | 2 | | 50 | | 37 | | 43 | | 45 | | 38 | | 41 | | 35 | | – | | | (8 | ) |
Zyrtec | | – | | – | | – | | – | | – | | – | | – | | – | | – | | – | | – | | – | | | – | | – | | – | | – | | – | | – | | – | | – | | – | | – | | – | | – | |
| | | | | | | | | | | | | | | | | | | | | | | | | | | | | | | | | | | | | | | | | | | | | | | | | |
| | | |
Anti-virals | | 413 | | | (14 | ) | | | (17 | ) | | 500 | | 8 | | 26 | | 496 | | 10 | | 40 | | 488 | | 2 | | 41 | | | 41 | | | (82 | ) | | | (81 | ) | | 57 | | | (84 | ) | | | (83 | ) | | 118 | | | (66 | ) | | | (64 | ) | | 154 | | | (42 | ) | | | (47 | ) |
HIV | | 189 | | | (3 | ) | | | (2 | ) | | 168 | | | (5 | ) | | 10 | | 164 | | | (8 | ) | | 15 | | 195 | | | (8 | ) | | 28 | | |
Agenerase, Lexiva | | 25 | | | (4 | ) | | | (4 | ) | | 24 | | – | | 14 | | 23 | | 6 | | 28 | | 27 | | 6 | | 50 | | |
Combivir | | 47 | | | (9 | ) | | | (11 | ) | | 43 | | | (10 | ) | | 5 | | 44 | | | (15 | ) | | 7 | | 53 | | | (16 | ) | | 18 | | |
Epivir | | 12 | | | (7 | ) | | | (14 | ) | | 12 | | | (9 | ) | | 9 | | 11 | | | (18 | ) | | – | | 13 | | | (18 | ) | | 18 | | |
Epzicom/Kivexa | | 63 | | 13 | | 15 | | 52 | | 2 | | 18 | | 50 | | – | | 28 | | 58 | | 5 | | 45 | | |
Trizivir | | 26 | | | (19 | ) | | | (19 | ) | | 23 | | | (13 | ) | | | (4 | ) | | 25 | | | (13 | ) | | 9 | | 30 | | | (22 | ) | | 11 | | |
Ziagen | | 13 | | | (7 | ) | | | (7 | ) | | 13 | | 10 | | 30 | | 11 | | | (18 | ) | | – | | 14 | | – | | 40 | | |
Hepsera | | | – | | – | | – | | – | | – | | – | | – | | – | | – | | – | | – | | – | |
Relenza | | | | (5 | ) | | – | | – | | 13 | | | (73 | ) | | | (71 | ) | | 5 | | | (84 | ) | | | (74 | ) | | 30 | | >100 | | >100 | |
Valtrex | | 129 | | | (45 | ) | | | (54 | ) | | 265 | | 3 | | 19 | | 291 | | 16 | | 49 | | 257 | | 8 | | 49 | | | 24 | | | (83 | ) | | | (81 | ) | | 27 | | | (91 | ) | | | (90 | ) | | 94 | | | (69 | ) | | | (68 | ) | | 107 | | | (55 | ) | | | (58 | ) |
Relenza | | 62 | | >100 | | >100 | | 45 | | >100 | | >100 | | 19 | | >100 | | >100 | | 11 | | – | | 38 | | |
Zeffix | | 4 | | – | | – | | 4 | | – | | – | | 5 | | | (25 | ) | | 25 | | 4 | | – | | 33 | | | 3 | | | (25 | ) | | | (25 | ) | | 3 | | | (25 | ) | | | (25 | ) | | 4 | | | (40 | ) | | | (20 | ) | | 3 | | – | | | (25 | ) |
| | | | | | | | | | | | | | | | | | | | | | | | | | |
| | | | | | | | | | | | | | | | | | | | | | | | | | |
Central nervous system | | 178 | | | (50 | ) | | | (50 | ) | | 115 | | | (67 | ) | | | (64 | ) | | 142 | | | (79 | ) | | | (74 | ) | | 216 | | | (73 | ) | | | (64 | ) | | 114 | | | (37 | ) | | | (36 | ) | | 124 | | 3 | | 8 | | 131 | | | (11 | ) | | | (8 | ) | | 136 | | | (32 | ) | | | (37 | ) |
Imigran/Imitrex | | 43 | | | (64 | ) | | | (65 | ) | | 19 | | | (89 | ) | | | (88 | ) | | 33 | | | (79 | ) | | | (76 | ) | | 28 | | | (83 | ) | | | (79 | ) | | 15 | | | (65 | ) | | | (65 | ) | | 18 | | | (11 | ) | | | (5 | ) | | 18 | | | (45 | ) | | | (45 | ) | | 24 | | | (11 | ) | | | (14 | ) |
Lamictal | | 72 | | | (40 | ) | | | (39 | ) | | 64 | | | (35 | ) | | | (24 | ) | | 45 | | | (86 | ) | | | (83 | ) | | 86 | | | (74 | ) | | | (64 | ) | | 66 | | | (11 | ) | | | (8 | ) | | 70 | | 5 | | 9 | | 60 | | 29 | | 33 | | 61 | | | (23 | ) | | | (29 | ) |
Requip | | 16 | | 27 | | 45 | | | (4 | ) | | | >(100 | ) | | | >(100 | ) | | 6 | | | (78 | ) | | | (67 | ) | | 8 | | | (90 | ) | | | (87 | ) | | 10 | | | (38 | ) | | | (38 | ) | | 13 | | >100 | | >100 | | 11 | | 83 | | 83 | | 10 | | 38 | | 25 | |
Requip XL | | 12 | | >100 | | >100 | | 7 | | 75 | | 75 | | 8 | | – | | – | | 5 | | – | | – | | |
Seroxat/Paxil | | 10 | | | (47 | ) | | | (47 | ) | | 5 | | | (54 | ) | | | (62 | ) | | 13 | | | (31 | ) | | | (19 | ) | | 14 | | | (61 | ) | | | (55 | ) | | – | | | (100 | ) | | | (100 | ) | | 5 | | – | | – | | 12 | | | (8 | ) | | | (8 | ) | | 10 | | | (29 | ) | | | (29 | ) |
Treximet | | 14 | | 8 | | 8 | | 15 | | >100 | | >100 | | 12 | | 25 | | | 50 | ) | | 14 | | – | | – | | | 14 | | – | | – | | 13 | | | (13 | ) | | | (13 | ) | | 15 | | 25 | | 25 | | 13 | | – | | | (7 | ) |
Wellbutrin, Wellbutrin XL | | 10 | | | (79 | ) | | | (82 | ) | | 4 | | | (86 | ) | | | (91 | ) | | 20 | | | (81 | ) | | | (78 | ) | | 54 | | | (68 | ) | | | (55 | ) | |
| | | | | | | | | | | | | | | | | | | | | | | | | | |
Wellbutrin | | | 7 | | | (30 | ) | | | (30 | ) | | 4 | | | (25 | ) | | – | | 5 | | | (70 | ) | | | (75 | ) | | 8 | | | (85 | ) | | | (85 | ) |
| | | | | | | | | | | | | | | | | | | | | | | | | | |
Cardiovascular and urogenital | | 375 | | 8 | | 9 | | 336 | | 4 | | 20 | | 360 | | 12 | | 43 | | 344 | | 7 | | 48 | | | 422 | | 10 | | 13 | | 409 | | 17 | | 22 | | 403 | | 8 | | 12 | | 337 | | 6 | | | (2 | ) |
Arixtra | | 43 | | 35 | | 39 | | 32 | | 23 | | 45 | | 33 | | 63 | | >100 | | 33 | | 26 | | 74 | | | 49 | | 12 | | 14 | | 43 | | 28 | | 34 | | 46 | | 36 | | 39 | | 39 | | 27 | | 18 | |
Avodart | | 83 | | 11 | | 11 | | 80 | | 10 | | 27 | | 83 | | 16 | | 51 | | 73 | | 8 | | 49 | | | 86 | | 1 | | 4 | | 87 | | 5 | | 9 | | 88 | | 2 | | 6 | | 76 | | 12 | | 4 | |
Coreg | | 31 | | | (45 | ) | | | (48 | ) | | 39 | | | (31 | ) | | | (20 | ) | | 50 | | | (7 | ) | | 16 | | 51 | | | (23 | ) | | 6 | | | 41 | | 29 | | 32 | | 43 | | 8 | | 10 | | 44 | | | (16 | ) | | | (12 | ) | | 42 | | | (12 | ) | | | (18 | ) |
Fraxiparine | | – | | – | | – | | – | | – | | – | | – | | – | | – | | – | | – | | – | | | – | | – | | – | | – | | – | | – | | – | | – | | – | | – | | – | | – | |
Levitra | | 16 | | – | | – | | 18 | | 7 | | 20 | | 17 | | – | | 31 | | 19 | | 8 | | 46 | | |
Lovaza | | 128 | | 29 | | 31 | | 111 | | 25 | | 48 | | 104 | | 24 | | 58 | | 105 | | 52 | | >100 | | | 146 | | 11 | | 14 | | 137 | | 20 | | 25 | | 138 | | 29 | | 33 | | 107 | | 10 | | 2 | |
Vesicare | | 29 | | 26 | | 26 | | 25 | | 17 | | 39 | | 26 | | 31 | | 63 | | 24 | | 21 | | 71 | | | 31 | | 3 | | 7 | | 27 | | 4 | | 8 | | 30 | | 12 | | 15 | | 25 | | 13 | | 4 | |
Volibris | | – | | – | | – | | – | | – | | – | | – | | – | | – | | – | | – | | – | | | – | | – | | – | | – | | – | | – | | – | | – | | – | | – | | – | | – | |
| | | | | | | | | | | | | | | | | | | | | | | | | | | | | | | | | | | | | | | | | | | | | | | | | |
| | | |
Metabolic | | 150 | | | (18 | ) | | | (18 | ) | | 132 | | | (15 | ) | | | (3 | ) | | 149 | | | (17 | ) | | 7 | | 150 | | | (18 | ) | | 13 | | | 40 | | | (75 | ) | | | (73 | ) | | 32 | | | (78 | ) | | | (76 | ) | | 77 | | | (51 | ) | | | (48 | ) | | 89 | | | (36 | ) | | | (41 | ) |
Avandia products | | 109 | | | (17 | ) | | | (17 | ) | | 97 | | | (14 | ) | | | (2 | ) | | 107 | | | (19 | ) | | 3 | | 112 | | | (18 | ) | | 13 | | | 40 | | | (65 | ) | | | (63 | ) | | 33 | | | (70 | ) | | | (66 | ) | | 75 | | | (33 | ) | | | (30 | ) | | 89 | | | (14 | ) | | | (21 | ) |
Avandia | | 69 | | | (22 | ) | | | (22 | ) | | 62 | | | (18 | ) | | | (7 | ) | | 71 | | | (22 | ) | | | (1 | ) | | 74 | | | (25 | ) | | 4 | | |
Avandamet | | 33 | | | (3 | ) | | | (3 | ) | | 29 | | | (8 | ) | | 12 | | 29 | | | (8 | ) | | 16 | | 31 | | | (4 | ) | | 29 | | |
Bonviva/Boniva | | 41 | | | (20 | ) | | | (20 | ) | | 35 | | | (17 | ) | | | (3 | ) | | 41 | | | (11 | ) | | 14 | | 38 | | | (15 | ) | | 15 | | | – | | | (100 | ) | | | (100 | ) | | – | | | (100 | ) | | | (100 | ) | | – | | – | | – | | – | | – | | – | |
| | | | | | | | | | | | | | | | | | | | | | | | | | |
| | | | | | | | | | | | | | | | | | | | | | | | | | |
Anti-bacterials | | 41 | | | (16 | ) | | | (18 | ) | | 39 | | | (15 | ) | | | (3 | ) | | 46 | | | (8 | ) | | 18 | | 47 | | | (24 | ) | | 4 | | | 16 | | | (38 | ) | | | (33 | ) | | 14 | | | (41 | ) | | | (36 | ) | | 21 | | | (29 | ) | | | (25 | ) | | 24 | | | (10 | ) | | | (17 | ) |
Augmentin | | 9 | | | (33 | ) | | | (40 | ) | | 9 | | | (22 | ) | | – | | 11 | | 13 | | 38 | | 16 | | | (29 | ) | | | (6 | ) | | – | | | (100 | ) | | | (100 | ) | | 1 | | | (89 | ) | | | (89 | ) | | 2 | | | (91 | ) | | | (82 | ) | | 8 | | | (44 | ) | | | (50 | ) |
| | | | | | | | | | | | | | | | | | | | | | | | | | | | | | | | | | | | | | | | | | | | | | | | | |
| | | |
Oncology and emesis | | 86 | | 30 | | 34 | | 64 | | | (11 | ) | | – | | 88 | | 19 | | 54 | | 70 | | | (12 | ) | | 21 | | | 75 | | | (16 | ) | | | (13 | ) | | 89 | | 34 | | 39 | | 94 | | 2 | | 7 | | 92 | | 41 | | 31 | |
Arzerra | | | 6 | | >100 | | 100 | | 8 | | – | | – | | 7 | | – | | – | | 5 | | – | | – | |
Hycamtin | | 26 | | 4 | | 4 | | 24 | | – | | 20 | | 24 | | 5 | | 26 | | 26 | | 6 | | 53 | | | 14 | | | (46 | ) | | | (46 | ) | | 21 | | | (17 | ) | | | (13 | ) | | 24 | | | (4 | ) | | – | | 24 | | – | | | (8 | ) |
Promacta | | 5 | | – | | – | | 3 | | – | | – | | 3 | | – | | – | | 2 | | – | | – | | | 6 | | 20 | | 20 | | 6 | | 100 | | 100 | | 7 | | >100 | | >100 | | 6 | | >100 | | >100 | |
Tyverb/Tykerb | | 14 | | | (7 | ) | | – | | 12 | | | (8 | ) | | – | | 17 | | 18 | | 55 | | 11 | | | (20 | ) | | 10 | | | 17 | | 14 | | 21 | | 18 | | 42 | | 50 | | 18 | | – | | 6 | | 17 | | 73 | | 55 | |
Zofran | | | (1 | ) | | 100 | | 90 | | | (1 | ) | | | (100 | ) | | | >(100 | ) | | 4 | | | (25 | ) | | – | | 7 | | 67 | | >100 | | |
| | | | | | | | | | | | | | | | | | | | | | | | | | |
Votrient | | | 11 | | >100 | | >100 | | 9 | | – | | – | | 8 | | – | | – | | 5 | | – | | – | |
| | | | | | | | | | | | | | | | | | | | | | | | | | |
Vaccines | | 294 | | 55 | | 65 | | 206 | | | (20 | ) | | | (6 | ) | | 196 | | 22 | | 58 | | 119 | | | (21 | ) | | 9 | | | 171 | | | (44 | ) | | | (42 | ) | | 278 | | 32 | | 35 | | 143 | | | (31 | ) | | | (27 | ) | | 171 | | 55 | | 44 | |
Boostrix | | 17 | | >100 | | >100 | | 24 | | 54 | | 85 | | 21 | | 78 | | >100 | | 11 | | 60 | | >100 | | | 28 | | 65 | | 65 | | 41 | | 67 | | 71 | | 26 | | 19 | | 24 | | 15 | | 55 | | 36 | |
Cervarix | | 4 | | – | | – | | – | | – | | – | | – | | – | | – | | – | | – | | – | | | 1 | | | (75 | ) | | | (75 | ) | | 4 | | – | | – | | 6 | | – | | – | | 2 | | – | | – | |
Fluarix, FluLaval | | 5 | | | (64 | ) | | | (77 | ) | | 63 | | | (19 | ) | | – | | 3 | | – | | – | | – | | – | | – | | | 28 | | >100 | | >100 | | 81 | | 29 | | 29 | | – | | – | | – | | 1 | | – | | – | |
| Flu pandemic | | 162 | | >100 | | >100 | | – | | – | | – | | 25 | | – | | – | | – | | – | | – | | | – | | | (100 | ) | | | (100 | ) | | 1 | | – | | – | | – | | – | | – | | – | | – | | – | |
| Hepatitis | | 51 | | | (27 | ) | | | (31 | ) | | 67 | | | (29 | ) | | | (18 | ) | | 87 | | 2 | | 32 | | 52 | | | (28 | ) | | | (2 | ) | | 56 | | 6 | | 10 | | 97 | | 39 | | 45 | | 62 | | | (33 | ) | | | (29 | ) | | 92 | | 92 | | 77 | |
Infanrix, Pediarix | | 27 | | | (50 | ) | | | (52 | ) | | 30 | | | (52 | ) | | | (46 | ) | | 38 | | | (43 | ) | | | (22 | ) | | 39 | | | (41 | ) | | | (24 | ) | | 36 | | 30 | | 33 | | 38 | | 23 | | 27 | | 40 | | 3 | | 5 | | 32 | | | (13 | ) | | | (18 | ) |
Rotarix | | 17 | | – | | – | | 22 | | >100 | | >100 | | 22 | | – | | – | | 15 | | – | | | 21 | | 18 | | 24 | | 17 | | | (27 | ) | | | (23 | ) | | 9 | | | (64 | ) | | | (59 | ) | | 27 | | 93 | | 80 | |
Synflorix | | – | | – | | – | | – | | – | | – | | – | | – | | – | | – | | – | | – | | | – | | – | | – | | – | | – | | – | | – | | – | | – | | – | | – | | – | |
| | | | | | | | | | | | | | | | | | | | | | | | | | | | | | | | | | | | | | | | | | | | | | | | | |
Dermatologicals | | | 94 | | 1 | | 3 | | 93 | | 22 | | 26 | | 74 | | >100 | | >100 | | 97 | | 100 | | >100 | |
Bactroban | | | 12 | | | (14 | ) | | | (14 | ) | | 14 | | | (7 | ) | | | (7 | ) | | 14 | | | (13 | ) | | | (7 | ) | | 11 | | | (20 | ) | | | (27 | ) |
Dermovate | | | – | | – | | – | | – | | – | | – | | – | | – | | – | | – | | – | | – | |
Duac | | | 15 | | | (7 | ) | | – | | 20 | | 27 | | 33 | | 15 | | – | | – | | 17 | | – | | – | |
Soriatane | | | 17 | | – | | 6 | | 19 | | 58 | | 58 | | 17 | | – | | – | | 18 | | – | | – | |
Zovirax | | | 14 | | 8 | | 8 | | 8 | | 75 | | 100 | | 5 | | 25 | | 25 | | 26 | | >100 | | >100 | |
| | | | | | | | | | | | | | | | | | | | | | | | | | |
Other | | 3 | | 67 | | – | | 7 | | | (75 | ) | | | (13 | ) | | 2 | | >100 | | >100 | | 5 | | – | | 25 | | | 6 | | >100 | | 100 | | 8 | | 14 | | 14 | | 6 | | >100 | | >100 | | 4 | | | (20 | ) | | | (20 | ) |
| | | | | | | | | | | | | | | | | | | | | | | | | | |
| | | | | | | | | | | | | | | | | | | | | | | | | | | 1,854 | | | (22 | ) | | | (20 | ) | | 1,950 | | | (8 | ) | | | (4 | ) | | 1,935 | | | (13 | ) | | | (10 | ) | | 1,909 | | | (1 | ) | | | (9 | ) |
| | | 2,450 | | | (4 | ) | | | (3 | ) | | 2,143 | | | (12 | ) | | 2 | | 2,304 | | | (15 | ) | | 8 | | 2,283 | | | (22 | ) | | 7 | | |
VIIV Healthcare (HIV) | | | 163 | | | (16 | ) | | | (14 | ) | | 162 | | | (8 | ) | | | (4 | ) | | 176 | | 3 | | 7 | | 159 | | | (11 | ) | | | (18 | ) |
Combivir | | | 34 | | | (30 | ) | | | (28 | ) | | 36 | | | (19 | ) | | | (16 | ) | | 39 | | | (16 | ) | | | (11 | ) | | 34 | | | (30 | ) | | | (36 | ) |
Epivir | | | 10 | | | (17 | ) | | | (17 | ) | | 10 | | | (25 | ) | | | (17 | ) | | 10 | | | (9 | ) | | | (9 | ) | | 10 | | | (15 | ) | | | (23 | ) |
Epzicom/Kivexa | | | 55 | | | (16 | ) | | | (13 | ) | | 50 | | | (8 | ) | | | (4 | ) | | 57 | | 10 | | 14 | | 48 | | | (10 | ) | | | (17 | ) |
Lexiva | | | 20 | | | (20 | ) | | | (20 | ) | | 19 | | | (25 | ) | | | (21 | ) | | 20 | | | (17 | ) | | | (13 | ) | | 21 | | | (15 | ) | | | (22 | ) |
Selzentry | | | 9 | | – | | – | | 8 | | – | | – | | 9 | | – | | – | | 8 | | – | | – | |
Trizivir | | | 16 | | | (38 | ) | | | (38 | ) | | 19 | | | (22 | ) | | | (17 | ) | | 19 | | | (24 | ) | | | (24 | ) | | 19 | | | (33 | ) | | | (37 | ) |
| | | | | | | | | | | | | | | | | | | | | | | | | | | | | | | | | | | | | | | | | | | | | | | | | |
Pharmaceutical turnover includes co-promotion income.
GSK Annual Report 20092010
182190
Shareholder informationFinancial record
Quarterly trend
Pharmaceutical turnover – Europe
| | | | | | | | | | | | | | | | | | | | | | | | | | | | | | | | | | | | | | | | | | | | | | | | | | |
| | | Q4 2009 | | Q3 2009 | | Q2 2009 | | Q1 2009 | | | | | | | | | | | | | | | | | | | | | | | | | | |
| | | £m | | CER% | | £% | | £m | | CER% | | £% | | £m | | CER% | | £% | | £m | | CER% | | £% | | | | | | | | | |
| | | | | | | | | | | | | | | | | | | | | | | | | | | Q4 2010 | | Q3 2010 | | Q2 2010 | | Q1 2010 | |
| | | | £m | | CER% | | £% | | £m | | CER% | | £% | | £m | | CER% | | £% | | £m | | CER% | | £% | |
Respiratory | | 594 | | 4 | | 8 | | 511 | | 7 | | 14 | | 550 | | 2 | | 11 | | 546 | | | (1 | ) | | 12 | | | 557 | | | (4 | ) | | | (6 | ) | | 488 | | | (3 | ) | | | (5 | ) | | 535 | | | (1 | ) | | | (3 | ) | | 569 | | 6 | | 4 | |
Avamys/Veramyst | | 11 | | 83 | | 83 | | 9 | | >100 | | >100 | | 16 | | >100 | | >100 | | 9 | | >100 | | >100 | | | 12 | | 9 | | 9 | | 10 | | 11 | | 11 | | 21 | | 31 | | 31 | | 13 | | 56 | | 44 | |
Flixonase/Flonase | | 10 | | | (17 | ) | | | (17 | ) | | 9 | | | (18 | ) | | | (18 | ) | | 12 | | | (25 | ) | | | (25 | ) | | 12 | | | (23 | ) | | | (8 | ) | | 10 | | | (10 | ) | | – | | 8 | | – | | | (11 | ) | | 12 | | – | | – | | 10 | | | (17 | ) | | | (17 | ) |
Flixotide/Flovent | | 49 | | | (4 | ) | | | (2 | ) | | 38 | | | (5 | ) | | – | | 43 | | | (5 | ) | | – | | 48 | | | (2 | ) | | 9 | | | 42 | | | (10 | ) | | | (14 | ) | | 33 | | | (11 | ) | | | (13 | ) | | 39 | | | (9 | ) | | | (9 | ) | | 45 | | | (6 | ) | | | (6 | ) |
Seretide/Advair | | 436 | | 7 | | 11 | | 378 | | 9 | | 17 | | 401 | | 3 | | 13 | | 394 | | – | | 14 | | | 416 | | | (3 | ) | | | (5 | ) | | 370 | | – | | | (2 | ) | | 392 | | – | | | (2 | ) | | 423 | | 10 | | 7 | |
Serevent | | 29 | | | (15 | ) | | | (12 | ) | | 27 | | | (16 | ) | | | (16 | ) | | 29 | | | (18 | ) | | | (15 | ) | | 31 | | | (22 | ) | | | (16 | ) | | 24 | | | (17 | ) | | | (17 | ) | | 24 | | | (11 | ) | | | (11 | ) | | 24 | | | (17 | ) | | | (17 | ) | | 26 | | | (16 | ) | | | (16 | ) |
Ventolin | | 42 | | – | | 5 | | 35 | | 3 | | 13 | | 36 | | 3 | | 9 | | 37 | | | (3 | ) | | 12 | | | 38 | | | (7 | ) | | | (10 | ) | | 32 | | | (9 | ) | | | (9 | ) | | 35 | | 3 | | | (3 | ) | | 37 | | – | | – | |
Zyrtec | | – | | – | | – | | – | | – | | – | | – | | – | | – | | – | | – | | – | | | – | | – | | – | | – | | – | | – | | – | | – | | – | | – | | – | | – | |
| | | | | | | | | | | | | | | | | | | | | | | | | | | | | | | | | | | | | | | | | | | | | | | | | |
| | | |
Anti-virals | | 251 | | 7 | | 12 | | 247 | | 13 | | 24 | | 236 | | | (2 | ) | | 8 | | 340 | | 45 | | 63 | | | 24 | | | (73 | ) | | | (73 | ) | | 24 | | | (71 | ) | | | (72 | ) | | 26 | | | (64 | ) | | | (64 | ) | | 35 | | | (78 | ) | | | (79 | ) |
HIV | | 155 | | | (10 | ) | | | (6 | ) | | 155 | | | (6 | ) | | 3 | | 156 | | | (14 | ) | | | (5 | ) | | 169 | | | (9 | ) | | 8 | | |
Agenerase, Lexiva | | 14 | | | (7 | ) | | | (7 | ) | | 15 | | | (7 | ) | | – | | 16 | | | (13 | ) | | – | | 17 | | | (7 | ) | | 13 | | |
Combivir | | 37 | | | (14 | ) | | | (12 | ) | | 36 | | | (13 | ) | | | (5 | ) | | 37 | | | (25 | ) | | | (16 | ) | | 41 | | | (17 | ) | | | (2 | ) | |
Epivir | | 11 | | | (27 | ) | | | (27 | ) | | 12 | | | (15 | ) | | | (8 | ) | | 12 | | | (33 | ) | | | (20 | ) | | 14 | | | (20 | ) | | | (7 | ) | |
Epzicom/Kivexa | | 63 | | 5 | | 11 | | 60 | | 10 | | 20 | | 59 | | – | | 9 | | 62 | | 10 | | 29 | | |
Trizivir | | 19 | | | (18 | ) | | | (14 | ) | | 19 | | | (23 | ) | | | (14 | ) | | 20 | | | (25 | ) | | | (17 | ) | | 24 | | | (17 | ) | | – | | |
Ziagen | | 9 | | | (11 | ) | | – | | 8 | | | (13 | ) | | – | | 9 | | | (20 | ) | | | (10 | ) | | 9 | | | (11 | ) | | – | | |
Hepsera | | | 1 | | – | | – | | – | | – | | – | | – | | – | | – | | – | | – | | – | |
Relenza | | | – | | – | | – | | 2 | | | (95 | ) | | | (95 | ) | | 2 | | | (96 | ) | | | (92 | ) | | 2 | | | (97 | ) | | | (98 | ) |
Valtrex | | 41 | | 5 | | 8 | | 38 | | | (3 | ) | | 9 | | 39 | | | (3 | ) | | 8 | | 42 | | – | | 20 | | | 15 | | | (61 | ) | | | (63 | ) | | 14 | | | (63 | ) | | | (63 | ) | | 16 | | | (59 | ) | | | (59 | ) | | 23 | | | (43 | ) | | | (45 | ) |
Relenza | | 39 | | >100 | | >100 | | 38 | | – | | – | | 25 | | >100 | | >100 | | 110 | | – | | – | | |
Zeffix | | 7 | | | (14 | ) | | – | | 7 | | – | | – | | 8 | | 17 | | 33 | | 7 | | | (14 | ) | | – | | | 6 | | | (14 | ) | | | (14 | ) | | 7 | | | (14 | ) | | – | | 6 | | | (13 | ) | | | (25 | ) | | 7 | | – | | – | |
| | | | | | | | | | | | | | | | | | | | | | | | | | |
| | | | | | | | | | | | | | | | | | | | | | | | | | |
Central nervous system | | 146 | | | (7 | ) | | | (3 | ) | | 139 | | | (9 | ) | | | (2 | ) | | 144 | | | (8 | ) | | 1 | | 145 | | | (2 | ) | | 12 | | | 132 | | | (8 | ) | | | (10 | ) | | 131 | | | (4 | ) | | | (6 | ) | | 137 | | | (3 | ) | | | (5 | ) | | 140 | | | (2 | ) | | | (3 | ) |
Imigran/Imitrex | | 25 | | | (8 | ) | | – | | 23 | | | (8 | ) | | | (4 | ) | | 23 | | | (13 | ) | | | (4 | ) | | 25 | | | (4 | ) | | 9 | | | 20 | | | (20 | ) | | | (20 | ) | | 22 | | – | | | (4 | ) | | 21 | | | (9 | ) | | | (9 | ) | | 22 | | | (12 | ) | | | (12 | ) |
Lamictal | | 39 | | | (5 | ) | | – | | 38 | | | (5 | ) | | 3 | | 38 | | | (8 | ) | | – | | 39 | | 3 | | 18 | | | 34 | | | (10 | ) | | | (13 | ) | | 35 | | | (8 | ) | | | (8 | ) | | 37 | | | (3 | ) | | | (3 | ) | | 37 | | | (3 | ) | | | (5 | ) |
Requip | | 37 | | | (8 | ) | | | (3 | ) | | 34 | | | (9 | ) | | | (3 | ) | | 35 | | 3 | | 13 | | 32 | | | (3 | ) | | 10 | | | 33 | | | (8 | ) | | | (11 | ) | | 32 | | – | | | (6 | ) | | 36 | | 6 | | 3 | | 36 | | 13 | | 13 | |
Requip XL | | 27 | | 67 | | 80 | | 23 | | 100 | | >100 | | 22 | | >100 | | >100 | | 17 | | >100 | | >100 | | |
Seroxat/Paxil | | 22 | | | (24 | ) | | | (24 | ) | | 22 | | | (26 | ) | | | (19 | ) | | 27 | | | (19 | ) | | | (13 | ) | | 28 | | | (14 | ) | | – | | | 19 | | | (9 | ) | | | (14 | ) | | 19 | | | (14 | ) | | | (14 | ) | | 22 | | | (15 | ) | | | (19 | ) | | 22 | | | (21 | ) | | | (21 | ) |
Treximet | | – | | – | | – | | – | | – | | – | | – | | – | | – | | – | | – | | – | | | – | | – | | – | | – | | – | | – | | – | | – | | – | | – | | – | | – | |
Wellbutrin, Wellbutrin XL | | 9 | | 33 | | 50 | | 8 | | 33 | | 33 | | 7 | | 100 | | >100 | | 6 | | 67 | | 100 | | |
| | | | | | | | | | | | | | | | | | | | | | | | | | |
Wellbutrin | | | 11 | | 22 | | 22 | | 10 | | 25 | | 25 | | 9 | | 43 | | 29 | | 9 | | 50 | | 50 | |
| | | | | | | | | | | | | | | | | | | | | | | | | | |
Cardiovascular and urogenital | | 155 | | 8 | | 13 | | 142 | | 2 | | 10 | | 145 | | 2 | | 12 | | 141 | | 2 | | 22 | | | 159 | | 6 | | 3 | | 144 | | 4 | | 1 | | 154 | | 8 | | 6 | | 153 | | 11 | | 9 | |
Arixtra | | 26 | | 14 | | 24 | | 24 | | 11 | | 26 | | 23 | | 24 | | 35 | | 22 | | 29 | | 57 | | | 24 | | – | | | (8 | ) | | 22 | | | (8 | ) | | | (8 | ) | | 27 | | 22 | | 17 | | 26 | | 23 | | 18 | |
Avodart | | 39 | | 12 | | 18 | | 36 | | 10 | | 24 | | 37 | | 21 | | 32 | | 36 | | 7 | | 29 | | | 50 | | 31 | | 28 | | 41 | | 19 | | 14 | | 44 | | 19 | | 19 | | 40 | | 17 | | 11 | |
Coreg | | – | | – | | – | | – | | – | | – | | – | | – | | – | | – | | – | | – | | | – | | – | | – | | – | | – | | – | | – | | – | | – | | – | | – | | – | |
Fraxiparine | | 45 | | – | | 2 | | 42 | | | (15 | ) | | | (11 | ) | | 43 | | | (15 | ) | | | (7 | ) | | 43 | | | (10 | ) | | 5 | | | 38 | | | (13 | ) | | | (16 | ) | | 34 | | | (17 | ) | | | (19 | ) | | 39 | | | (7 | ) | | | (9 | ) | | 43 | | – | | – | |
Levitra | | 1 | | – | | – | | 1 | | – | | – | | 1 | | – | | – | | 1 | | – | | – | | |
Lovaza | | – | | – | | – | | – | | – | | – | | – | | – | | – | | – | | – | | – | | | – | | – | | – | | – | | – | | – | | – | | – | | – | | – | | – | | – | |
Vesicare | | – | | – | | – | | – | | – | | – | | – | | – | | – | | – | | – | | – | | | – | | – | | – | | – | | – | | – | | – | | – | | – | | – | | – | | – | |
Volibris | | 7 | | >100 | | >100 | | 5 | | >100 | | >100 | | 4 | | – | | – | | 2 | | – | | – | | | 13 | | 86 | | 86 | | 10 | | 100 | | 100 | | 9 | | >100 | | >100 | | 8 | | >100 | | >100 | |
| | | | | | | | | | | | | | | | | | | | | | | | | | | | | | | | | | | | | | | | | | | | | | | | | |
| | | |
Metabolic | | 69 | | | (13 | ) | | | (9 | ) | | 67 | | | (14 | ) | | | (7 | ) | | 71 | | | (11 | ) | | | (3 | ) | | 68 | | | (21 | ) | | | (7 | ) | | 13 | | | (80 | ) | | | (81 | ) | | 37 | | | (42 | ) | | | (45 | ) | | 55 | | | (23 | ) | | | (23 | ) | | 61 | | | (7 | ) | | | (10 | ) |
Avandia products | | 40 | | | (17 | ) | | | (15 | ) | | 42 | | | (19 | ) | | | (13 | ) | | 46 | | | (18 | ) | | | (6 | ) | | 43 | | | (30 | ) | | | (20 | ) | | | (4 | ) | | – | | – | | 20 | | | (52 | ) | | | (52 | ) | | 34 | | | (22 | ) | | | (26 | ) | | 38 | | | (12 | ) | | | (12 | ) |
Avandia | | 15 | | | (25 | ) | | | (25 | ) | | 16 | | | (25 | ) | | | (20 | ) | | 18 | | | (20 | ) | | | (10 | ) | | 18 | | | (27 | ) | | | (18 | ) | |
Avandamet | | 24 | | | (12 | ) | | | (8 | ) | | 25 | | | (12 | ) | | | (4 | ) | | 26 | | | (18 | ) | | | (7 | ) | | 24 | | | (32 | ) | | | (23 | ) | |
Bonviva/Boniva | | 23 | | | (4 | ) | | – | | 22 | | 11 | | 22 | | 23 | | 6 | | 28 | | 21 | | 20 | | 40 | | | 14 | | | (35 | ) | | | (39 | ) | | 13 | | | (41 | ) | | | (41 | ) | | 17 | | | (22 | ) | | | (26 | ) | | 20 | | | (5 | ) | | | (5 | ) |
| | | | | | | | | | | | | | | | | | | | | | | | | | |
| | | | | | | | | | | | | | | | | | | | | | | | | | |
Anti-bacterials | | 181 | | | (3 | ) | | 1 | | 146 | | | (4 | ) | | 4 | | 146 | | | (4 | ) | | 4 | | 189 | | | (7 | ) | | 8 | | | 153 | | | (11 | ) | | | (13 | ) | | 121 | | | (9 | ) | | | (12 | ) | | 120 | | | (12 | ) | | | (14 | ) | | 142 | | | (21 | ) | | | (22 | ) |
Augmentin | | 82 | | 7 | | 11 | | 68 | | 2 | | 10 | | 61 | | – | | 7 | | 84 | | | (9 | ) | | 6 | | | 69 | | | (13 | ) | | | (16 | ) | | 55 | | | (16 | ) | | | (19 | ) | | 53 | | | (13 | ) | | | (13 | ) | | 63 | | | (23 | ) | | | (25 | ) |
| | | | | | | | | | | | | | | | | | | | | | | | | | | | | | | | | | | | | | | | | | | | | | | | | |
| | | |
Oncology and emesis | | 52 | | – | | 4 | | 51 | | 15 | | 24 | | 50 | | 12 | | 22 | | 51 | | 16 | | 38 | | | 55 | | 10 | | 6 | | 49 | | | (2 | ) | | | (4 | ) | | 47 | | | (4 | ) | | | (6 | ) | | 50 | | – | | | (2 | ) |
Arzerra | | | 3 | | – | | – | | 1 | | – | | – | | – | | – | | – | | – | | – | | – | |
Hycamtin | | 15 | | 7 | | 7 | | 14 | | 8 | | 17 | | 15 | | 17 | | 25 | | 15 | | 9 | | 36 | | | 12 | | | (20 | ) | | | (20 | ) | | 11 | | | (21 | ) | | | (21 | ) | | 12 | | | (20 | ) | | | (20 | ) | | 13 | | | (7 | ) | | | (13 | ) |
Promacta | | – | | – | | – | | – | | – | | – | | – | | – | | – | | – | | – | | – | | | 3 | | – | | – | | 1 | | – | | – | | 1 | | – | | – | | – | | – | | – | |
Tyverb/Tykerb | | 21 | | 12 | | 24 | | 19 | | 90 | | 90 | | 18 | | 88 | | >100 | | 17 | | >100 | | >100 | | | 25 | | 24 | | 19 | | 23 | | 21 | | 21 | | 22 | | 28 | | 22 | | 24 | | 41 | | 41 | |
Zofran | | 12 | | | (25 | ) | | | (25 | ) | | 12 | | | (20 | ) | | | (20 | ) | | 14 | | | (25 | ) | | | (13 | ) | | 14 | | | (25 | ) | | | (13 | ) | |
| | | | | | | | | | | | | | | | | | | | | | | | | | |
Votrient | | | 3 | | – | | – | | 1 | | – | | – | | – | | – | | – | | – | | – | | – | |
| | | | | | | | | | | | | | | | | | | | | | | | | | |
Vaccines | | 794 | | >100 | | >100 | | 344 | | | (3 | ) | | 7 | | 320 | | 7 | | 16 | | 286 | | 23 | | 43 | | | 393 | | | (49 | ) | | | (51 | ) | | 310 | | | (8 | ) | | | (10 | ) | | 365 | | 14 | | 14 | | 613 | | >100 | | >100 | |
Boostrix | | 11 | | 57 | | 57 | | 11 | | 43 | | 57 | | 10 | | 14 | | 43 | | 8 | | 40 | | 60 | | | 11 | | – | | – | | 12 | | 9 | | 9 | | 11 | | 10 | | 10 | | 9 | | 25 | | 13 | |
Cervarix | | 19 | | | (58 | ) | | | (58 | ) | | 17 | | | (61 | ) | | | (55 | ) | | 63 | | >100 | | >100 | | 39 | | >100 | | >100 | | | 25 | | 37 | | 32 | | 11 | | | (35 | ) | | | (35 | ) | | 21 | | | (65 | ) | | | (67 | ) | | 59 | | 51 | | 51 | |
Fluarix, FluLaval | | 11 | | | (43 | ) | | | (48 | ) | | 60 | | | (10 | ) | | 3 | | – | | – | | – | | – | | – | | – | | | 13 | | 18 | | 18 | | 50 | | | (13 | ) | | | (17 | ) | | – | | – | | – | | – | | – | | – | |
| Flu pandemic | | 511 | | >100 | | >100 | | 4 | | | (60 | ) | | | (60 | ) | | 5 | | | (86 | ) | | | (86 | ) | | 5 | | 25 | | 25 | | | 90 | | | (82 | ) | | | (82 | ) | | 2 | | | (50 | ) | | | (50 | ) | | 92 | | >100 | | >100 | | 304 | | >100 | | >100 | |
| Hepatitis | | 64 | | | (16 | ) | | | (14 | ) | | 65 | | – | | 7 | | 72 | | | (8 | ) | | – | | 61 | | | (5 | ) | | 9 | | | 63 | | – | | | (2 | ) | | 55 | | | (14 | ) | | | (15 | ) | | 63 | | | (13 | ) | | | (13 | ) | | 61 | | 2 | | – | |
Infanrix, Pediarix | | 101 | | | (14 | ) | | | (11 | ) | | 105 | | 8 | | 18 | | 91 | | | (13 | ) | | | (3 | ) | | 109 | | 14 | | 35 | | | 120 | | 22 | | 19 | | 96 | | | (6 | ) | | | (9 | ) | | 109 | | 22 | | 20 | | 104 | | | (2 | ) | | | (5 | ) |
Rotarix | | 14 | | 8 | | 8 | | 14 | | 9 | | 27 | | 12 | | 20 | | 20 | | 13 | | 22 | | 44 | | | 9 | | | (36 | ) | | | (36 | ) | | 8 | | | (43 | ) | | | (43 | ) | | 8 | | | (42 | ) | | | (33 | ) | | 13 | | 8 | | – | |
Synflorix | | 11 | | – | | – | | 11 | | – | | – | | 10 | | – | | – | | – | | – | | – | | | 8 | | | (27 | ) | | | (27 | ) | | 9 | | | (9 | ) | | | (18 | ) | | 14 | | 40 | | 40 | | 12 | | – | | – | |
| | | | | | | | | | | | | | | | | | | | | | | | | | | | | | | | | | | | | | | | | | | | | | | | | |
Dermatologicals | | | 62 | | 14 | | 11 | | 59 | | 15 | | 13 | | 63 | | >100 | | >100 | | 62 | | >100 | | 100 | |
Bactroban | | | 7 | | 33 | | 17 | | 7 | | – | | – | | 7 | | – | | – | | 6 | | – | | – | |
Dermovate | | | 5 | | – | | – | | 5 | | – | | – | | 5 | | – | | – | | 4 | | – | | – | |
Duac | | | 6 | | – | | – | | 5 | | 50 | | 25 | | 6 | | – | | – | | 6 | | – | | – | |
Soriatane | | | – | | – | | – | | – | | – | | – | | – | | – | | – | | – | | – | | – | |
Zovirax | | | 7 | | | (14 | ) | | – | | 6 | | – | | | (14 | ) | | 7 | | | (13 | ) | | | (13 | ) | | 7 | | | (13 | ) | | | (13 | ) |
| | | | | | | | | | | | | | | | | | | | | | | | | | |
Other | | 119 | | 12 | | 16 | | 87 | | 25 | | 30 | | 84 | | – | | 5 | | 74 | | | (7 | ) | | 4 | | | 99 | | – | | | (3 | ) | | 65 | | | (6 | ) | | | (7 | ) | | 78 | | 26 | | 18 | | 68 | | 24 | | 24 | |
| | | | | | | | | | | | | | | | | | | | | | | | | | |
| | | | | | | | | | | | | | | | | | | | | | | | | | | 1,647 | | | (24 | ) | | | (26 | ) | | 1,428 | | | (9 | ) | | | (11 | ) | | 1,580 | | 1 | | | (1 | ) | | 1,893 | | 16 | | 13 | |
| | | 2,361 | | 23 | | 29 | | 1,734 | | 3 | | 11 | | 1,746 | | 1 | | 9 | | 1,840 | | 7 | | 23 | | |
VIIV Healthcare (HIV) | | | 145 | | | (5 | ) | | | (6 | ) | | 136 | | | (10 | ) | | | (12 | ) | | 145 | | | (4 | ) | | | (6 | ) | | 159 | | | (3 | ) | | | (5 | ) |
Combivir | | | 28 | | | (22 | ) | | | (24 | ) | | 26 | | | (25 | ) | | | (28 | ) | | 30 | | | (19 | ) | | | (19 | ) | | 33 | | | (17 | ) | | | (20 | ) |
Epivir | | | 8 | | | (27 | ) | | | (27 | ) | | 9 | | | (25 | ) | | | (25 | ) | | 10 | | | (17 | ) | | | (17 | ) | | 10 | | | (21 | ) | | | (29 | ) |
Epzicom/Kivexa | | | 63 | | 2 | | – | | 57 | | | (2 | ) | | | (5 | ) | | 61 | | 5 | | 3 | | 64 | | 6 | | 3 | |
Lexiva | | | 10 | | | (21 | ) | | | (29 | ) | | 13 | | | (13 | ) | | | (13 | ) | | 13 | | | (13 | ) | | | (19 | ) | | 15 | | | (12 | ) | | | (12 | ) |
Selzentry | | | 11 | | >100 | | >100 | | 10 | | – | | – | | 9 | | – | | – | | 11 | | – | | – | |
Trizivir | | | 14 | | | (32 | ) | | | (26 | ) | | 15 | | | (16 | ) | | | (21 | ) | | 14 | | | (25 | ) | | | (30 | ) | | 17 | | | (29 | ) | | | (11 | ) |
| | | | | | | | | | | | | | | | | | | | | | | | | | | | | | | | | | | | | | | | | | | | | | | | | |
Pharmaceutical turnover includes co-promotion income.
GSK Annual Report 20092010
183191
Shareholder informationFinancial record
Quarterly trend
Pharmaceutical turnover – Rest of WorldEmerging Markets
| | | | | | | | | | | | | | | | | | | | | | | | | | | | | | | | | | | | | | | | | | | | | | | | | | |
| | | Q4 2009 | | Q3 2009 | | Q2 2009 | | Q1 2009 | | | | | | | | | | | | | | | | | | | | | | | | | | |
| | | £m | | CER% | | £% | | £m | | CER% | | £% | | £m | | CER% | | £% | | £m | | CER% | | £% | | | | | | | | | |
| | | | | | | | | | | | | | | | | | | | | | | | | | | Q4 2010 | | Q3 2010 | | Q2 2010 | | Q1 2010 | |
| | | | £m | | CER% | | £% | | £m | | CER% | | £% | | £m | | CER% | | £% | | £m | | CER% | | £% | |
Respiratory | | 410 | | 17 | | 25 | | 339 | | 14 | | 28 | | 359 | | 16 | | 33 | | 345 | | 9 | | 36 | | | 162 | | 17 | | 20 | | 145 | | 11 | | 14 | | 166 | | 19 | | 25 | | 143 | | 30 | | 24 | |
Avamys/Veramyst | | 7 | | >100 | | >100 | | 7 | | >100 | | >100 | | 13 | | >100 | | >100 | | 2 | | – | | – | | | 9 | | 100 | | >100 | | 8 | | >100 | | >100 | | 9 | | >100 | | >100 | | 5 | | >100 | | >100 | |
Flixonase/Flonase | | 19 | | | (9 | ) | | | (14 | ) | | 16 | | | (7 | ) | | 7 | | 19 | | 6 | | 19 | | 47 | | 14 | | 62 | | | 11 | | 38 | | 38 | | 9 | | | (11 | ) | | – | | 10 | | 10 | | – | | 9 | | 13 | | 13 | |
Flixotide/Flovent | | 58 | | | (2 | ) | | 5 | | 46 | | | (3 | ) | | 15 | | 49 | | | (11 | ) | | 4 | | 48 | | | (12 | ) | | 12 | | | 12 | | 33 | | 33 | | 10 | | – | | 11 | | 12 | | 50 | | 50 | | 14 | | 75 | | 75 | |
Seretide/Advair | | 226 | | 23 | | 32 | | 187 | | 15 | | 30 | | 196 | | 27 | | 45 | | 167 | | 26 | | 52 | | | 85 | | 14 | | 18 | | 77 | | 11 | | 17 | | 86 | | 12 | | 18 | | 80 | | 28 | | 23 | |
Serevent | | 12 | | | (20 | ) | | | (20 | ) | | 11 | | | (27 | ) | | – | | 12 | | | (38 | ) | | | (25 | ) | | 12 | | | (38 | ) | | | (8 | ) | | – | | | (100 | ) | | | (100 | ) | | 1 | | – | | – | | 1 | | – | | – | | – | | – | | | (100 | ) |
Ventolin | | 49 | | 15 | | 20 | | 40 | | – | | 5 | | 44 | | | (3 | ) | | 10 | | 41 | | | (5 | ) | | 11 | | | 30 | | 20 | | 20 | | 27 | | 18 | | 23 | | 31 | | 25 | | 29 | | 24 | | 14 | | 9 | |
Zyrtec | | 22 | | 67 | | 83 | | 18 | | >100 | | >100 | | 17 | | 63 | | >100 | | 18 | | 9 | | 64 | | | 4 | | – | | – | | 4 | | | (33 | ) | | | (33 | ) | | 4 | | 33 | | 33 | | 2 | | 100 | | 100 | |
| | | | | | | | | | | | | | | | | | | | | | | | | | | | | | | | | | | | | | | | | | | | | | | | | |
| | | |
Anti-virals | | 369 | | 71 | | 85 | | 302 | | 32 | | 54 | | 220 | | 5 | | 24 | | 288 | | 16 | | 57 | | | 61 | | | (13 | ) | | | (9 | ) | | 56 | | | (10 | ) | | | (7 | ) | | 59 | | 10 | | 13 | | 47 | | 9 | | – | |
HIV | | 68 | | 12 | | 15 | | 69 | | | (11 | ) | | | (7 | ) | | 62 | | | (5 | ) | | 13 | | 55 | | | (6 | ) | | 12 | | |
Agenerase, Lexiva | | 5 | | | (33 | ) | | | (17 | ) | | 4 | | – | | – | | 4 | | | (50 | ) | | – | | 4 | | 100 | | 100 | | |
Combivir | | 25 | | 26 | | 32 | | 23 | | | (23 | ) | | | (26 | ) | | 21 | | | (5 | ) | | 11 | | 18 | | | (17 | ) | | – | | |
Epivir | | 7 | | | (14 | ) | | – | | 10 | | | (18 | ) | | | (9 | ) | | 8 | | | (13 | ) | | – | | 7 | | | (25 | ) | | | (13 | ) | |
Epzicom/Kivexa | | 23 | | 24 | | 35 | | 19 | | 6 | | 19 | | 20 | | 55 | | 82 | | 17 | | 27 | | 55 | | |
Trizivir | | 4 | | | (20 | ) | | | (20 | ) | | 6 | | 67 | | 100 | | 3 | | – | | – | | 2 | | | (33 | ) | | | (33 | ) | |
Ziagen | | 5 | | – | | – | | 5 | | | (33 | ) | | | (44 | ) | | 5 | | | (20 | ) | | – | | 4 | | | (50 | ) | | | (33 | ) | |
Hepsera | | | 15 | | 8 | | 15 | | 16 | | 25 | | 33 | | 15 | | 8 | | 15 | | 12 | | – | | | (8 | ) |
Relenza | | | | (1 | ) | | – | | – | | 1 | | | (92 | ) | | | (92 | ) | | – | | – | | | (100 | ) | | 1 | | – | | – | |
Valtrex | | 52 | | | (4 | ) | | 6 | | 46 | | | (16 | ) | | 2 | | 49 | | | (15 | ) | | 7 | | 45 | | | (17 | ) | | 10 | | | 8 | | – | | – | | 7 | | – | | 17 | | 8 | | 33 | | 33 | | 5 | | – | | | (17 | ) |
Relenza | | 155 | | >100 | | >100 | | 99 | | >100 | | >100 | | 16 | | – | | – | | 101 | | >100 | | >100 | | |
Zeffix | | 44 | | 2 | | 5 | | 43 | | 19 | | 39 | | 42 | | | (5 | ) | | 14 | | 42 | | | (14 | ) | | 17 | | | 39 | | 28 | | 34 | | 32 | | 7 | | 10 | | 36 | | 21 | | 24 | | 29 | | 11 | | 4 | |
| | | | | | | | | | | | | | | | | | | | | | | | | | |
| | | | | | | | | | | | | | | | | | | | | | | | | | |
Central nervous system | | 180 | | 4 | | 12 | | 164 | | 11 | | 34 | | 163 | | 4 | | 27 | | 138 | | | (3 | ) | | 30 | | | 62 | | 22 | | 24 | | 63 | | 22 | | 24 | | 53 | | 11 | | 13 | | 45 | | 14 | | 7 | |
Imigran/Imitrex | | 13 | | – | | – | | 11 | | | (10 | ) | | 10 | | 12 | | – | | 20 | | 11 | | – | | 38 | | | 1 | | | (50 | ) | | | (50 | ) | | 1 | | – | | – | | 2 | | 100 | | 100 | | 1 | | – | | – | |
Lamictal | | 21 | | 11 | | 11 | | 19 | | 20 | | 27 | | 20 | | | (6 | ) | | 18 | | 19 | | – | | 12 | | | 16 | | 42 | | 33 | | 15 | | 27 | | 36 | | 14 | | 17 | | 17 | | 12 | | 8 | | | (8 | ) |
Requip | | 12 | | 22 | | 33 | | 13 | | 13 | | 63 | | 10 | | – | | 11 | | 10 | | 40 | | 100 | | | 1 | | – | | – | | 1 | | – | | – | | 1 | | – | | – | | – | | – | | – | |
Requip XL | | 1 | | – | | – | | 1 | | – | | – | | – | | – | | – | | – | | – | | – | | |
Seroxat/Paxil | | 107 | | | (8 | ) | | 1 | | 93 | | 1 | | 29 | | 98 | | | (8 | ) | | 23 | | 84 | | | (3 | ) | | 35 | | | 19 | | 5 | | – | | 19 | | – | | – | | 20 | | | (14 | ) | | | (5 | ) | | 15 | | – | | | (12 | ) |
Treximet | | – | | – | | – | | – | | – | | – | | – | | – | | – | | – | | – | | – | | | – | | – | | – | | – | | – | | – | | – | | – | | – | | – | | – | | – | |
Wellbutrin, Wellbutrin XL | | 3 | | – | | | (25 | ) | | 4 | | | (33 | ) | | 33 | | 3 | | | (20 | ) | | | (40 | ) | | 4 | | 50 | | 100 | | |
| | | | | | | | | | | | | | | | | | | | | | | | | | |
Wellbutrin | | | 4 | | 33 | | 33 | | 3 | | 33 | | – | | 3 | | – | | 50 | | 3 | | 50 | | 50 | |
| | | | | | | | | | | | | | | | | | | | | | | | | | |
Cardiovascular and urogenital | | 85 | | 25 | | 27 | | 74 | | 14 | | 30 | | 75 | | 19 | | 39 | | 66 | | 10 | | 32 | | | 36 | | 28 | | 24 | | 34 | | 21 | | 21 | | 36 | | 26 | | 33 | | 28 | | 25 | | 17 | |
Arixtra | | 5 | | 100 | | 67 | | 4 | | 67 | | 33 | | 5 | | – | | 67 | | 4 | | 50 | | 100 | | | 3 | | 50 | | 50 | | 3 | | 50 | | 50 | | 2 | | – | | – | | 2 | | 100 | | 100 | |
Avodart | | 21 | | 58 | | 75 | | 15 | | 50 | | 50 | | 14 | | 44 | | 56 | | 13 | | 50 | | 63 | | | 9 | | 50 | | 50 | | 8 | | 33 | | 33 | | 9 | | 60 | | 80 | | 7 | | 60 | | 40 | |
Coreg | | – | | – | | – | | – | | – | | – | | 1 | | | (100 | ) | | – | | – | | – | | – | | | – | | – | | – | | – | | – | | – | | – | | – | | – | | – | | – | | – | |
Fraxiparine | | 15 | | 7 | | 7 | | 14 | | – | | 17 | | 15 | | 17 | | 25 | | 12 | | – | | 20 | | | 15 | | 25 | | 25 | | 15 | | 27 | | 36 | | 14 | | 40 | | 40 | | 11 | | 22 | | 22 | |
Levitra | | – | | – | | – | | 1 | | – | | – | | – | | – | | – | | – | | – | | – | | |
Lovaza | | 1 | | – | | – | | – | | – | | – | | – | | – | | – | | 1 | | – | | – | | | – | | – | | – | | – | | – | | – | | – | | – | | – | | – | | – | | – | |
Vesicare | | – | | – | | – | | – | | – | | – | | – | | – | | – | | – | | – | | – | | | – | | – | | – | | – | | – | | – | | – | | – | | – | | – | | – | | – | |
Volibris | | – | | – | | – | | 1 | | – | | – | | – | | – | | – | | – | | – | | – | | | – | | – | | – | | 1 | | – | | – | | – | | – | | – | | – | | – | | – | |
| | | | | | | | | | | | | | | | | | | | | | | | | | | | | | | | | | | | | | | | | | | | | | | | | |
| | | |
Metabolic | | 81 | | | (9 | ) | | | (7 | ) | | 85 | | | (10 | ) | | 5 | | 83 | | | (4 | ) | | 14 | | 76 | | | (8 | ) | | 15 | | | 17 | | | (43 | ) | | | (39 | ) | | 12 | | | (61 | ) | | | (61 | ) | | 31 | | | (9 | ) | | | (3 | ) | | 31 | | 18 | | 11 | |
Avandia products | | 42 | | | (18 | ) | | | (16 | ) | | 46 | | | (9 | ) | | 5 | | 45 | | 2 | | 10 | | 42 | | | (8 | ) | | 11 | | | 3 | | | (76 | ) | | | (82 | ) | | 2 | | | (90 | ) | | | (90 | ) | | 18 | | | (14 | ) | | | (14 | ) | | 19 | | 6 | | 6 | |
Avandia | | 28 | | | (29 | ) | | | (26 | ) | | 30 | | | (16 | ) | | | (3 | ) | | 32 | | | (12 | ) | | | (3 | ) | | 29 | | | (14 | ) | | – | | |
Avandamet | | 12 | | 20 | | 20 | | 12 | | 9 | | 9 | | 12 | | 38 | | 50 | | 11 | | 14 | | 57 | | |
Bonviva/Boniva | | 3 | | 50 | | 50 | | 3 | | 50 | | 50 | | 2 | | 100 | | – | | 3 | | – | | >100 | | | – | | – | | | (100 | ) | | 1 | | – | | – | | 1 | | – | | – | | – | | – | | – | |
| | | | | | | | | | | | | | | | | | | | | | | | | | |
| | | | | | | | | | | | | | | | | | | | | | | | | | |
Anti-bacterials | | 187 | | 11 | | 11 | | 191 | | 14 | | 20 | | 189 | | 12 | | 26 | | 190 | | 13 | | 33 | | | 159 | | 14 | | 15 | | 151 | | 7 | | 9 | | 153 | | 8 | | 12 | | 146 | | 11 | | 4 | |
Augmentin | | 82 | | 16 | | 17 | | 85 | | 17 | | 20 | | 74 | | 3 | | 14 | | 86 | | 20 | | 43 | | | 78 | | 29 | | 26 | | 74 | | 6 | | 9 | | 69 | | 15 | | 17 | | 70 | | 12 | | 4 | |
| | | | | | | | | | | | | | | | | | | | | | | | | | | | | | | | | | | | | | | | | | | | | | | | | |
| | | |
Oncology and emesis | | 32 | | 21 | | 33 | | 34 | | 26 | | 48 | | 28 | | 32 | | 47 | | 23 | | 11 | | 28 | | | 17 | | 13 | | 13 | | 17 | | 6 | | 6 | | 16 | | – | | 14 | | 12 | | 8 | | – | |
Arzerra | | | – | | – | | – | | – | | – | | – | | – | | – | | – | | – | | – | | – | |
Hycamtin | | 4 | | 50 | | 100 | | 3 | | 100 | | 50 | | 4 | | | (50 | ) | | – | | 2 | | 50 | | – | | | 1 | | – | | – | | 2 | | – | | – | | 2 | | – | | – | | 2 | | 100 | | 100 | |
Promacta | | – | | – | | – | | – | | – | | – | | – | | – | | – | | – | | – | | – | | | – | | – | | – | | – | | – | | – | | – | | – | | – | | – | | – | | – | |
Tyverb/Tykerb | | 13 | | >100 | | >100 | | 15 | | >100 | | >100 | | 6 | | >100 | | 100 | | 6 | | 100 | | >100 | | | 9 | | 50 | | 50 | | 9 | | 29 | | 29 | | 7 | | 17 | | 17 | | 5 | | 67 | | 67 | |
Zofran | | 13 | | – | | 18 | | 12 | | | (17 | ) | | – | | 12 | | – | | 9 | | 11 | | – | | 10 | | |
| | | | | | | | | | | | | | | | | | | | | | | | | | |
Votrient | | | – | | – | | – | | – | | – | | – | | – | | – | | – | | – | | – | | – | |
| | | | | | | | | | | | | | | | | | | | | | | | | | |
Vaccines | | 435 | | 56 | | 66 | | 252 | | 20 | | 33 | | 240 | | 20 | | 36 | | 220 | | 46 | | 73 | | | 260 | | 11 | | 14 | | 216 | | 29 | | 32 | | 179 | | 18 | | 23 | | 272 | | >100 | | >100 | |
Boostrix | | 7 | | >100 | | >100 | | 4 | | 100 | | 100 | | 8 | | >100 | | >100 | | 7 | | 100 | | >100 | | | 4 | | >100 | | >100 | | 2 | | – | | – | | 1 | | | (80 | ) | | | (80 | ) | | 2 | | 100 | | 100 | |
Cervarix | | 15 | | 50 | | 50 | | 11 | | >100 | | >100 | | 10 | | 100 | | >100 | | 9 | | >100 | | >100 | | | 7 | | – | | – | | 8 | | 17 | | 33 | | 6 | | 50 | | 50 | | 4 | | | (33 | ) | | | (33 | ) |
Fluarix, FluLaval | | 26 | | 4 | | 13 | | 24 | | | (9 | ) | | 4 | | 11 | | 83 | | 83 | | 6 | | – | | – | | | 20 | | 43 | | 43 | | 19 | | 36 | | 36 | | 1 | | | (89 | ) | | | (89 | ) | | – | | | (100 | ) | | | (100 | ) |
| Flu pandemic | | 163 | | >100 | | >100 | | 7 | | – | | – | | – | | – | | – | | 1 | | – | | – | | | 25 | | | (60 | ) | | | (55 | ) | | 6 | | – | | – | | 43 | | – | | – | | 152 | | – | | – | |
| Hepatitis | | 36 | | | (8 | ) | | | (3 | ) | | 38 | | 10 | | 23 | | 36 | | 7 | | 24 | | 36 | | 3 | | 20 | | | 23 | | 17 | | 28 | | 20 | | | (9 | ) | | | (9 | ) | | 25 | | 9 | | 14 | | 20 | | 17 | | 11 | |
Infanrix, Pediarix | | 25 | | | (8 | ) | | – | | 32 | | 22 | | 39 | | 25 | | | (4 | ) | | 4 | | 27 | | 14 | | 29 | | | 13 | | 56 | | 44 | | 16 | | 7 | | 7 | | 11 | | 11 | | 22 | | 10 | | | (8 | ) | | | (17 | ) |
Rotarix | | 39 | | 6 | | 8 | | 48 | | 83 | | 100 | | 37 | | 20 | | 48 | | 29 | | 39 | | 61 | | | 45 | | 36 | | 36 | | 20 | | | (56 | ) | | | (53 | ) | | 20 | | | (34 | ) | | | (31 | ) | | 17 | | | (25 | ) | | | (29 | ) |
Synflorix | | 37 | | – | | – | | 2 | | – | | – | | 2 | | – | | – | | – | | – | | – | | | 35 | | 13 | | 13 | | 74 | | >100 | | >100 | | 14 | | – | | – | | 26 | | – | | – | |
| | | | | | | | | | | | | | | | | | | | | | | | | | | | | | | | | | | | | | | | | | | | | | | | | |
Dermatologicals | | | 82 | | 39 | | 44 | | 73 | | 35 | | 40 | | 69 | | 74 | | 82 | | 62 | | 75 | | 72 | |
Bactroban | | | 7 | | 17 | | 17 | | 8 | | 14 | | 14 | | 7 | | 14 | | – | | 6 | | | (14 | ) | | | (14 | ) |
Dermovate | | | 11 | | – | | – | | 7 | | – | | – | | 7 | | – | | – | | 5 | | – | | – | |
Duac | | | 3 | | >100 | | >100 | | 3 | | 50 | | 50 | | 2 | | – | | – | | 3 | | – | | – | |
Soriatane | | | – | | – | | – | | – | | – | | – | | – | | – | | – | | – | | – | | – | |
Zovirax | | | 6 | | 20 | | 20 | | 6 | | 20 | | 20 | | 8 | | – | | 14 | | 6 | | – | | – | |
| | | | | | | | | | | | | | | | | | | | | | | | | | |
Other | | 189 | | 20 | | 24 | | 164 | | 16 | | 23 | | 175 | | | (4 | ) | | 17 | | 154 | | | (32 | ) | | | (18 | ) | | 113 | | 62 | | 64 | | 106 | | 30 | | 34 | | 86 | | 24 | | 26 | | 80 | | 30 | | 27 | |
| | | | | | | | | | | | | | | | | | | | | | | | | | |
| | | | | | | | | | | | | | | | | | | | | | | | | | | 969 | | 16 | | 19 | | 873 | | 14 | | 17 | | 848 | | 17 | | 22 | | 866 | | 43 | | 36 | |
| | | 1,968 | | 28 | | 36 | | 1,605 | | 16 | | 31 | | 1,532 | | 10 | | 28 | | 1,500 | | 6 | | 32 | | |
VIIV Healthcare (HIV) | | | 50 | | 57 | | 67 | | 59 | | 73 | | 79 | | 19 | | | (17 | ) | | | (17 | ) | | 18 | | – | | | (5 | ) |
Combivir | | | 26 | | 67 | | 73 | | 24 | | 69 | | 85 | | 7 | | | (36 | ) | | | (36 | ) | | 6 | | | (33 | ) | | | (40 | ) |
Epivir | | | 6 | | 25 | | 50 | | 7 | | 75 | | 75 | | 2 | | | (33 | ) | | | (33 | ) | | 3 | | 50 | | 50 | |
Epzicom/Kivexa | | | 9 | | 14 | | 29 | | 12 | | 86 | | 71 | | 6 | | 50 | | 50 | | 2 | | – | | | (33 | ) |
Lexiva | | | 2 | | – | | | (33 | ) | | 7 | | >100 | | >100 | | 2 | | 50 | | – | | 2 | | >100 | | 100 | |
Selzentry | | | 1 | | – | | – | | – | | – | | – | | 1 | | – | | – | | – | | – | | – | |
Trizivir | | | – | | | (50 | ) | | | (100 | ) | | 3 | | | (75 | ) | | | (25 | ) | | – | | – | | – | | 1 | | – | | – | |
| | | | | | | | | | | | | | | | | | | | | | | | | | | | | | | | | | | | | | | | | | | | | | | | | |
Pharmaceutical turnover includes co-promotion income.
GSK Annual Report 20092010
184192
Shareholder informationFinancial record
Quarterly trend
Consumer Healthcare turnover – total Group
| | | | | | | | | | | | | | | | | | | | | | | | | | | | | | | | | | | | | | | | | | | | | | | | | |
| | | Q4 2009 | | | Q3 2009 | | | Q2 2009 | | | Q1 2009 | |
| | | £m | | | CER% | | | £% | | | £m | | | CER% | | | £% | | | £m | | | CER% | | | £% | | | £m | | | CER% | | | £% | |
| | | | | | | | | | | | | | | | | | | | | | | | | | | | | | | | | | | | |
| | | | | | | | | | | | | | | | | | | | | | | | | | | | | | | | | | | | | | | | | | | | | | | | | |
Over-the-counter medicines | | 612 | | | | 4 | | | | 6 | | | | 567 | | | | 9 | | | | 19 | | | | 573 | | | | 13 | | | | 29 | | | | 567 | | | | 5 | | | | 30 | |
alli | | | 40 | | | | 33 | | | | 33 | | | | 49 | | | | >100 | | | | >100 | | | | 82 | | | | >100 | | | | >100 | | | | 32 | | | | >100 | | | | >100 | |
Breathe Right | | | 22 | | | | (19 | ) | | | (19 | ) | | | 23 | | | | 5 | | | | 21 | | | | 20 | | | | (6 | ) | | | 11 | | | | 27 | | | | 24 | | | | 59 | |
| Cold sore franchise | | | 25 | | | | (11 | ) | | | (11 | ) | | | 28 | | | | 14 | | | | 27 | | | | 20 | | | | (11 | ) | | | 5 | | | | 23 | | | | (5 | ) | | | 15 | |
| Nicotene replacement | | | 90 | | | | (5 | ) | | | (3 | ) | | | 79 | | | | (16 | ) | | | (5 | ) | | | 88 | | | | 12 | | | | 35 | | | | 82 | | | | 12 | | | | 41 | |
Panadol | | | 104 | | | | 19 | | | | 24 | | | | 96 | | | | 7 | | | | 17 | | | | 94 | | | | 8 | | | | 21 | | | | 99 | | | | 6 | | | | 24 | |
Tums | | | 26 | | | | (4 | ) | | | (4 | ) | | | 25 | | | | – | | | | 19 | | | | 25 | | | | (5 | ) | | | 14 | | | | 30 | | | | 5 | | | | 43 | |
| | | | | | | | | | | | | | | | | | | | | | | | | | | | | | | | | | | | |
| | | | | | | | | | | | | | | | | | | | | | | | | | | | | | | | | | | | | | | | | | | | | | | | | |
Oral healthcare | | | 375 | | | | 6 | | | | 9 | | | | 375 | | | | 10 | | | | 21 | | | | 366 | | | | 7 | | | | 23 | | | | 368 | | | | 5 | | | | 27 | |
Aquafresh franchise | | | 121 | | | | (2 | ) | | | (1 | ) | | | 126 | | | | (2 | ) | | | 9 | | | | 121 | | | | (1 | ) | | | 13 | | | | 128 | | | | – | | | | 20 | |
Biotene | | | 7 | | | | >100 | | | | >100 | | | | 7 | | | | – | | | | – | | | | 6 | | | | – | | | | – | | | | 6 | | | | – | | | | – | |
| Denture care | | | 87 | | | | 9 | | | | 13 | | | | 85 | | | | 10 | | | | 25 | | | | 84 | | | | 9 | | | | 27 | | | | 80 | | | | 5 | | | | 33 | |
Sensodyne franchise | | | 114 | | | | 11 | | | | 14 | | | | 118 | | | | 20 | | | | 31 | | | | 113 | | | | 14 | | | | 30 | | | | 112 | | | | 7 | | | | 30 | |
| | | | | | | | | | | | | | | | | | | | | | | | | | | | | | | | | | | | |
| | | | | | | | | | | | | | | | | | | | | | | | | | | | | | | | | | | | | | | | | | | | | | | | | |
Nutritional healthcare | | | 191 | | | | 4 | | | | 3 | | | | 223 | | | | 4 | | | | 7 | | | | 226 | | | | 2 | | | | 8 | | | | 211 | | | | 1 | | | | 9 | |
Horlicks | | | 55 | | | | 19 | | | | 17 | | | | 64 | | | | 13 | | | | 21 | | | | 61 | | | | 17 | | | | 27 | | | | 75 | | | | 20 | | | | 34 | |
Lucozade | | | 86 | | | | (2 | ) | | | (3 | ) | | | 104 | | | | 4 | | | | 4 | | | | 106 | | | | (4 | ) | | | (1 | ) | | | 80 | | | | (12 | ) | | | (7 | ) |
Ribena | | | 38 | | | | – | | | | 3 | | | | 40 | | | | (9 | ) | | | (9 | ) | | | 44 | | | | (2 | ) | | | 2 | | | | 38 | | | | (5 | ) | | | 3 | |
| | | | | | | | | | | | | | | | | | | | | | | | | | | | | | | | | | | | |
| | | | 1,178 | | | | 5 | | | | 6 | | | | 1,165 | | | | 8 | | | | 17 | | | | 1,165 | | | | 9 | | | | 23 | | | | 1,146 | | | | 4 | | | | 25 | |
| | | | | | | | | | | | | | | | | | | | | | | | | | | | | | | | | | | | |
Consumer Healthcare turnover – USA
| | | | | | | | | | | | | | | | | | | | | | | | | | | | | | | | | | | | | | | | | | | | | | | | | |
| | | Q4 2009 | | | Q3 2009 | | | Q2 2009 | | | Q1 2009 | |
| | | £m | | | CER% | | | £% | | | £m | | | CER% | | | £% | | | £m | | | CER% | | | £% | | | £m | | | CER% | | | £% | |
| | | | | | | | | | | | | | | | | | | | | | | | | | | | | | | | | | | | |
| | | | | | | | | | | | | | | | | | | | | | | | | | | | | | | | | | | | | | | | | | | | | | | | | |
Over-the-counter medicines | | | 185 | | | | (11 | ) | | | (11 | ) | | | 174 | | | | (3 | ) | | | 12 | | | | 183 | | | | 1 | | | | 28 | | | | 180 | | | | 4 | | | | 44 | |
alli | | | 22 | | | | (18 | ) | | | (21 | ) | | | 20 | | | | – | | | | 11 | | | | 25 | | | | 12 | | | | 47 | | | | 29 | | | | >100 | | | | >100 | |
Breathe Right | | | 11 | | | | (31 | ) | | | (31 | ) | | | 15 | | | | – | | | | 15 | | | | 10 | | | | (20 | ) | | | – | | | | 14 | | | | 11 | | | | 56 | |
| Cold sore franchise | | | 11 | | | | (27 | ) | | | (27 | ) | | | 17 | | | | 40 | | | | 70 | | | | 9 | | | | (22 | ) | | | – | | | | 9 | | | | – | | | | 29 | |
| Nicotene replacement | | | 63 | | | | (7 | ) | | | (7 | ) | | | 58 | | | | (17 | ) | | | (3 | ) | | | 68 | | | | 13 | | | | 45 | | | | 58 | | | | 11 | | | | 53 | |
Panadol | | | – | | | | – | | | | – | | | | – | | | | – | | | | – | | | | – | | | | – | | | | – | | | | – | | | | – | | | | – | |
Tums | | | 23 | | | | – | | | | – | | | | 20 | | | | – | | | | 11 | | | | 22 | | | | (5 | ) | | | 16 | | | | 27 | | | | 6 | | | | 50 | |
| | | | | | | | | | | | | | | | | | | | | | | | | | | | | | | | | | | | |
| | | | | | | | | | | | | | | | | | | | | | | | | | | | | | | | | | | | | | | | | | | | | | | | | |
Oral healthcare | | | 75 | | | | 10 | | | | 10 | | | | 75 | | | | 20 | | | | 39 | | | | 71 | | | | 10 | | | | 42 | | | | 78 | | | | 14 | | | | 56 | |
Aquafresh franchise | | | 22 | | | | (12 | ) | | | (15 | ) | | | 23 | | | | – | | | | 15 | | | | 21 | | | | (6 | ) | | | 17 | | | | 27 | | | | (5 | ) | | | 35 | |
Biotene | | | 5 | | | | >100 | | | | >100 | | | | 4 | | | | – | | | | – | | | | 5 | | | | – | | | | – | | | | 5 | | | | – | | | | – | |
| Denture care | | | 19 | | | | – | | | | – | | | | 19 | | | | 13 | | | | 27 | | | | 20 | | | | – | | | | 33 | | | | 19 | | | | – | | | | 36 | |
Sensodyne franchise | | | 27 | | | | 29 | | | | 29 | | | | 28 | | | | 41 | | | | 65 | | | | 23 | | | | 20 | | | | 53 | | | | 26 | | | | 27 | | | | 73 | |
| | | | | | | | | | | | | | | | | | | | | | | | | | | | | | | | | | | | |
| | | | | | | | | | | | | | | | | | | | | | | | | | | | | | | | | | | | | | | | | | | | | | | | | |
Nutritional healthcare | | | – | | | | – | | | | – | | | | – | | | | – | | | | – | | | | – | | | | – | | | | – | | | | – | | | | – | | | | – | |
Horlicks | | | – | | | | – | | | | – | | | | – | | | | – | | | | – | | | | – | | | | – | | | | – | | | | – | | | | – | | | | – | |
Lucozade | | | – | | | | – | | | | – | | | | – | | | | – | | | | – | | | | – | | | | – | | | | – | | | | – | | | | – | | | | – | |
Ribena | | | – | | | | – | | | | – | | | | – | | | | – | | | | – | | | | – | | | | – | | | | – | | | | – | | | | – | | | | – | |
| | | | | | | | | | | | | | | | | | | | | | | | | | | | | | | | | | | | |
| | | | 260 | | | | (5 | ) | | | (5 | ) | | | 249 | | | | 3 | | | | 19 | | | | 254 | | | | 3 | | | | 32 | | | | 258 | | | | 7 | | | | 47 | |
| | | | | | | | | | | | | | | | | | | | | | | | | | | | | | | | | | | | |
GSK Annual Report 2009
185
Shareholder information
Quarterly trend
Consumer Healthcare turnover – Europe
| | | | | | | | | | | | | | | | | | | | | | | | | | | | | | | | | | | | | | | | | | | | | | | | | |
| | | Q4 2009 | | | Q3 2009 | | | Q2 2009 | | | Q1 2009 | |
| | | £m | | | CER% | | | £% | | | £m | | | CER% | | | £% | | | £m | | | CER% | | | £% | | | £m | | | CER% | | | £% | |
| | | | | | | | | | | | | | | | | | | | | | | | | | | | | | | | | | | | |
| | | | | | | | | | | | | | | | | | | | | | | | | | | | | | | | | | | | | | | | | | | | | | | | | |
Over-the-counter medicines | | | 221 | | | | 17 | | | | 18 | | | | 186 | | | | 27 | | | | 31 | | | | 185 | | | | 31 | | | | 38 | | | | 156 | | | | (2 | ) | | | 8 | |
alli | | | 17 | | | | – | | | | – | | | | 29 | | | | – | | | | – | | | | 56 | | | | – | | | | – | | | | 3 | | | | – | | | | – | |
Breathe Right | | | 5 | | | | (17 | ) | | | (17 | ) | | | 5 | | | | – | | | | 25 | | | | 5 | | | | – | | | | – | | | | 7 | | | | 20 | | | | 40 | |
| Cold sore franchise | | | 10 | | | | (9 | ) | | | (9 | ) | | | 9 | | | | – | | | | 13 | | | | 8 | | | | – | | | | (11 | ) | | | 11 | | | | (10 | ) | | | 10 | |
| Nicotene replacement | | | 19 | | | | 6 | | | | 6 | | | | 13 | | | | – | | | | – | | | | 15 | | | | 8 | | | | 15 | | | | 17 | | | | 6 | | | | 6 | |
Panadol | | | 33 | | | | 35 | | | | 43 | | | | 26 | | | | 32 | | | | 37 | | | | 20 | | | | 11 | | | | 11 | | | | 20 | | | | (11 | ) | | | 5 | |
Tums | | | – | | | | – | | | | – | | | | 1 | | | | – | | | | – | | | | – | | | | – | | | | – | | | | – | | | | – | | | | – | |
| | | | | | | | | | | | | | | | | | | | | | | | | | | | | | | | | | | | |
| | | | | | | | | | | | | | | | | | | | | | | | | | | | | | | | | | | | | | | | | | | | | | | | | |
Oral healthcare | | | 196 | | | | 1 | | | | 4 | | | | 190 | | | | 3 | | | | 9 | | | | 190 | | | | 4 | | | | 12 | | | | 184 | | | | 1 | | | | 16 | |
Aquafresh franchise | | | 72 | | | | (3 | ) | | | (1 | ) | | | 75 | | | | (3 | ) | | | 4 | | | | 71 | | | | (2 | ) | | | 8 | | | | 73 | | | | (2 | ) | | | 14 | |
Biotene | | | 1 | | | | – | | | | – | | | | 1 | | | | – | | | | – | | | | 1 | | | | – | | | | – | | | | – | | | | – | | | | – | |
| Denture care | | | 33 | | | | – | | | | 3 | | | | 32 | | | | 15 | | | | 19 | | | | 32 | | | | 7 | | | | 19 | | | | 28 | | | | – | | | | 17 | |
Sensodyne franchise | | | 50 | | | | – | | | | 4 | | | | 48 | | | | 7 | | | | 12 | | | | 50 | | | | 7 | | | | 16 | | | | 47 | | | | 2 | | | | 15 | |
| | | | | | | | | | | | | | | | | | | | | | | | | | | | | | | | | | | | |
| | | | | | | | | | | | | | | | | | | | | | | | | | | | | | | | | | | | | | | | | | | | | | | | | |
Nutritional healthcare | | | 107 | | | | (3 | ) | | | (3 | ) | | | 125 | | | | (2 | ) | | | (2 | ) | | | 130 | | | | (5 | ) | | | (3 | ) | | | 95 | | | | (15 | ) | | | (14 | ) |
Horlicks | | | 6 | | | | – | | | | – | | | | 4 | | | | (20 | ) | | | (20 | ) | | | 4 | | | | (20 | ) | | | (20 | ) | | | 5 | | | | (17 | ) | | | (17 | ) |
Lucozade | | | 74 | | | | (3 | ) | | | (3 | ) | | | 92 | | | | 2 | | | | 3 | | | | 92 | | | | (5 | ) | | | (3 | ) | | | 65 | | | | (16 | ) | | | (14 | ) |
Ribena | | | 26 | | | | (4 | ) | | | (4 | ) | | | 29 | | | | (12 | ) | | | (12 | ) | | | 33 | | | | (6 | ) | | | (3 | ) | | | 25 | | | | (7 | ) | | | (7 | ) |
| | | | | | | | | | | | | | | | | | | | | | | | | | | | | | | | | | | | |
| | | | 524 | | | | 6 | | | | 8 | | | | 501 | | | | 9 | | | | 13 | | | | 505 | | | | 10 | | | | 16 | | | | 435 | | | | (4 | ) | | | 5 | |
| | | | | | | | | | | | | | | | | | | | | | | | | | | | | | | | | | | | |
Consumer HealthcarePharmaceutical turnover – Rest of World
| | | | | | | | | | | | | | | | | | | | | | | | | | | | | | | | | | | | | | | | | | | | | | | | | |
| | | Q4 2009 | | | Q3 2009 | | | Q2 2009 | | | Q1 2009 | |
| | | £m | | | CER% | | | £% | | | £m | | | CER% | | | £% | | | £m | | | CER% | | | £% | | | £m | | | CER% | | | £% | |
| | | | | | | | | | | | | | | | | | | | | | | | | | | | | | | | | | | | |
| | | | | | | | | | | | | | | | | | | | | | | | | | | | | | | | | | | | | | | | | | | | | | | | | |
Over-the-counter medicines | | | 206 | | | | 8 | | | | 11 | | | | 207 | | | | 6 | | | | 16 | | | | 205 | | | | 8 | | | | 23 | | | | 231 | | | | 13 | | | | 38 | |
alli | | | 1 | | | | (50 | ) | | | (50 | ) | | | – | | | | – | | | | – | | | | 1 | | | | – | | | | – | | | | – | | | | – | | | | – | |
Breathe Right | | | 6 | | | | 20 | | | | 20 | | | | 3 | | | | 50 | | | | 50 | | | | 5 | | | | 33 | | | | 67 | | | | 6 | | | | 67 | | | | 100 | |
| Cold sore franchise | | | 4 | | | | 100 | | | | 100 | | | | 2 | | | | (25 | ) | | | (50 | ) | | | 3 | | | | – | | | | >100 | | | | 3 | | | | – | | | | – | |
| Nicotene replacement | | | 8 | | | | (14 | ) | | | 14 | | | | 8 | | | | (30 | ) | | | (20 | ) | | | 5 | | | | 20 | | | | – | | | | 7 | | | | 50 | | | | 75 | |
Panadol | | | 71 | | | | 13 | | | | 16 | | | | 70 | | | | – | | | | 11 | | | | 74 | | | | 7 | | | | 23 | | | | 79 | | | | 11 | | | | 30 | |
Tums | | | 3 | | | | – | | | | – | | | | 4 | | | | (33 | ) | | | 33 | | | | 3 | | | | – | | | | – | | | | 3 | | | | – | | | | – | |
| | | | | | | | | | | | | | | | | | | | | | | | | | | | | | | | | | | | |
| | | | | | | | | | | | | | | | | | | | | | | | | | | | | | | | | | | | | | | | | | | | | | | | | |
Oral healthcare | | | 104 | | | | 15 | | | | 21 | | | | 110 | | | | 18 | | | | 34 | | | | 105 | | | | 13 | | | | 33 | | | | 106 | | | | 8 | | | | 33 | |
Aquafresh franchise | | | 27 | | | | 9 | | | | 17 | | | | 28 | | | | – | | | | 17 | | | | 29 | | | | (4 | ) | | | 26 | | | | 28 | | | | 9 | | | | 22 | |
Biotene | | | 1 | | | | – | | | | – | | | | 2 | | | | – | | | | – | | | | – | | | | – | | | | – | | | | 1 | | | | – | | | | – | |
| Denture care | | | 35 | | | | 27 | | | | 35 | | | | 34 | | | | 4 | | | | 31 | | | | 32 | | | | 17 | | | | 33 | | | | 33 | | | | 14 | | | | 50 | |
Sensodyne franchise | | | 37 | | | | 16 | | | | 19 | | | | 42 | | | | 27 | | | | 40 | | | | 40 | | | | 21 | | | | 38 | | | | 39 | | | | 3 | | | | 30 | |
| | | | | | | | | | | | | | | | | | | | | | | | | | | | | | | | | | | | |
| | | | | | | | | | | | | | | | | | | | | | | | | | | | | | | | | | | | | | | | | | | | | | | | | |
Nutritional healthcare | | | 84 | | | | 15 | | | | 12 | | | | 98 | | | | 15 | | | | 21 | | | | 96 | | | | 14 | | | | 26 | | | | 116 | | | | 22 | | | | 40 | |
Horlicks | | | 49 | | | | 22 | | | | 20 | | | | 60 | | | | 17 | | | | 25 | | | | 57 | | | | 21 | | | | 33 | | | | 70 | | | | 24 | | | | 40 | |
Lucozade | | | 12 | | | | – | | | | (8 | ) | | | 12 | | | | 18 | | | | 9 | | | | 14 | | | | 8 | | | | 17 | | | | 15 | | | | 20 | | | | 50 | |
Ribena | | | 12 | | | | 10 | | | | 20 | | | | 11 | | | | – | | | | – | | | | 11 | | | | 11 | | | | 22 | | | | 13 | | | | – | | | | 30 | |
| | | | | | | | | | | | | | | | | | | | | | | | | | | | | | | | | | | | |
| | | | 394 | | | | 11 | | | | 14 | | | | 415 | | | | 11 | | | | 21 | | | | 406 | | | | 11 | | | | 26 | | | | 453 | | | | 14 | | | | 37 | |
| | | | | | | | | | | | | | | | | | | | | | | | | | | | | | | | | | | | |
| | | | | | | | | | | | | | | | | | | | | | | | | | | | | | | | | | | | | | | | | | | | | | | | | |
| | | | | | | | | | | |
| | | Q4 2010 | | | Q3 2010 | | | Q2 2010 | | | Q1 2010 | |
| | | £m | | | CER% | | | £% | | | £m | | | CER% | | | £% | | | £m | | | CER% | | | £% | | | £m | | | CER% | | | £% | |
Respiratory | | | 323 | | | | 5 | | | | 17 | | | | 247 | | | | 5 | | | | 17 | | | | 260 | | | | 2 | | | | 15 | | | | 249 | | | | 4 | | | | 8 | |
Avamys/Veramyst | | | 12 | | | | >100 | | | | >100 | | | | 7 | | | | 50 | | | | 75 | | | | 7 | | | | (30 | ) | | | (30 | ) | | | 11 | | | | >100 | | | | >100 | |
Flixonase/Flonase | | | 11 | | | | – | | | | – | | | | 7 | | | | (14 | ) | | | – | | | | 10 | | | | (33 | ) | | | 11 | | | | 20 | | | | (41 | ) | | | (49 | ) |
Flixotide/Flovent | | | 48 | | | | (16 | ) | | | (2 | ) | | | 39 | | | | (3 | ) | | | 5 | | | | 41 | | | | (15 | ) | | | – | | | | 38 | | | | (5 | ) | | | (5 | ) |
Seretide/Advair | | | 175 | | | | 2 | | | | 14 | | | | 147 | | | | 11 | | | | 21 | | | | 153 | | | | 10 | | | | 24 | | | | 131 | | | | 23 | | | | 28 | |
Serevent | | | 11 | | | | (18 | ) | | | – | | | | 7 | | | | (36 | ) | | | (36 | ) | | | 10 | | | | (18 | ) | | | (9 | ) | | | 9 | | | | (18 | ) | | | (18 | ) |
Ventolin | | | 25 | | | | (13 | ) | | | 4 | | | | 21 | | | | 11 | | | | 17 | | | | 23 | | | | (5 | ) | | | 15 | | | | 20 | | | | – | | | | 5 | |
Zyrtec | | | 19 | | | | (6 | ) | | | 6 | | | | 15 | | | | 17 | | | | 25 | | | | 16 | | | | – | | | | 14 | | | | 18 | | | | 12 | | | | 6 | |
| | | | | | | | | | | | | | | | | | | | | | | | | | | | | | | | | | | |
Anti-virals | | | 98 | | | | (59 | ) | | | (55 | ) | | | 81 | | | | (55 | ) | | | (48 | ) | | | 83 | | | | (14 | ) | | | (2 | ) | | | 122 | | | | (27 | ) | | | (27 | ) |
Hepsera | | | 17 | | | | (12 | ) | | | – | | | | 16 | | | | (6 | ) | | | – | | | | 19 | | | | 6 | | | | 19 | | | | 17 | | | | 21 | | | | 21 | |
Relenza | | | 17 | | | | (89 | ) | | | (88 | ) | | | 2 | | | | (98 | ) | | | (98 | ) | | | 1 | | | | – | | | | (92 | ) | | | 51 | | | | (49 | ) | | | (50 | ) |
Valtrex | | | 49 | | | | (2 | ) | | | 11 | | | | 47 | | | | 8 | | | | 18 | | | | 47 | | | | 2 | | | | 9 | | | | 41 | | | | – | | | | 5 | |
Zeffix | | | 16 | | | | (7 | ) | | | 7 | | | | 13 | | | | (14 | ) | | | (7 | ) | | | 16 | | | | 8 | | | | 23 | | | | 13 | | | | (7 | ) | | | (7 | ) |
| | | | | | | | | | | | | | | | | | | | | | | | | | | | | | | | | | | |
Central nervous system | | | 142 | | | | (4 | ) | | | 9 | | | | 118 | | | | (4 | ) | | | 4 | | | | 129 | | | | (1 | ) | | | 11 | | | | 96 | | | | 3 | | | | – | |
Imigran/Imitrex | | | 14 | | | | 18 | | | | 27 | | | | 12 | | | | – | | | | 20 | | | | 11 | | | | (9 | ) | | | – | | | | 10 | | | | – | | | | – | |
Lamictal | | | 14 | | | | 33 | | | | 56 | | | | 11 | | | | 63 | | | | 38 | | | | 12 | | | | 13 | | | | 50 | | | | 10 | | | | 67 | | | | 67 | |
Requip | | | 16 | | | | 27 | | | | 45 | | | | 12 | | | | (23 | ) | | | (8 | ) | | | 12 | | | | 11 | | | | 33 | | | | 9 | | | | – | | | | (10 | ) |
Seroxat/Paxil | | | 90 | | | | (11 | ) | | | 2 | | | | 72 | | | | (14 | ) | | | (3 | ) | | | 79 | | | | (5 | ) | | | 3 | | | | 59 | | | | (7 | ) | | | (12 | ) |
Treximet | | | – | | | | – | | | | – | | | | – | | | | – | | | | – | | | | 1 | | | | – | | | | – | | | | – | | | | – | | | | – | |
Wellbutrin | | | – | | | | – | | | | – | | | | 1 | | | | – | | | | – | | | | 4 | | | | 100 | | | | >100 | | | | – | | | | (50 | ) | | | – | |
| | | | | | | | | | | | | | | | | | | | | | | | | | | | | | | | | | | |
Cardiovascular and urogenital | | | 79 | | | | 23 | | | | 41 | | | | 63 | | | | 28 | | | | 37 | | | | 61 | | | | 19 | | | | 27 | | | | 52 | | | | 21 | | | | 24 | |
Arixtra | | | 4 | | | | – | | | | 33 | | | | 4 | | | | 100 | | | | 100 | | | | 4 | | | | – | | | | 33 | | | | 3 | | | | – | | | | – | |
Avodart | | | 32 | | | | 100 | | | | >100 | | | | 20 | | | | 89 | | | | >100 | | | | 16 | | | | 78 | | | | 78 | | | | 16 | | | | 88 | | | | 100 | |
Coreg | | | – | | | | – | | | | – | | | | 1 | | | | – | | | | – | | | | – | | | | – | | | | – | | | | – | | | | – | | | | – | |
Fraxiparine | | | 2 | | | | (67 | ) | | | (33 | ) | | | 5 | | | | >100 | | | | 67 | | | | 4 | | | | (60 | ) | | | (20 | ) | | | 2 | | | | – | | | | (33 | ) |
Lovaza | | | 1 | | | | – | | | | – | | | | 1 | | | | – | | | | – | | | | – | | | | – | | | | – | | | | – | | | | – | | | | – | |
Vesicare | | | – | | | | – | | | | – | | | | 1 | | | | – | | | | – | | | | – | | | | – | | | | – | | | | – | | | | – | | | | – | |
Volibris | | | 3 | | | | – | | | | – | | | | – | | | | – | | | | (100 | ) | | | 1 | | | | – | | | | – | | | | 1 | | | | – | | | | – | |
| | | | | | | | | | | | | | | | | | | | | | | | | | | | | | | | | | | |
Metabolic | | | 40 | | | | (32 | ) | | | (25 | ) | | | 44 | | | | (28 | ) | | | (19 | ) | | | 50 | | | | (8 | ) | | | (2 | ) | | | 49 | | | | 2 | | | | 2 | |
Avandia products | | | 10 | | | | (64 | ) | | | (60 | ) | | | 15 | | | | (50 | ) | | | (42 | ) | | | 25 | | | | (13 | ) | | | 4 | | | | 23 | | | | 4 | | | | (4 | ) |
Bonviva/Boniva | | | 4 | | | | – | | | | 100 | | | | 3 | | | | 67 | | | | – | | | | 2 | | | | – | | | | 100 | | | | 3 | | | | – | | | | – | |
| | | | | | | | | | | | | | | | | | | | | | | | | | | | | | | | | | | |
Anti-bacterials | | | 42 | | | | (2 | ) | | | 2 | | | | 47 | | | | – | | | | 12 | | | | 43 | | | | (2 | ) | | | 2 | | | | 44 | | | | 5 | | | | 10 | |
Augmentin | | | 21 | | | | (10 | ) | | | 5 | | | | 23 | | | | 24 | | | | 35 | | | | 20 | | | | 33 | | | | 33 | | | | 19 | | | | – | | | | – | |
| | | | | | | | | | | | | | | | | | | | | | | | | | | | | | | | | | | |
Oncology and emesis | | | 25 | | | | 41 | | | | 47 | | | | 17 | | | | (17 | ) | | | (6 | ) | | | 18 | | | | 21 | | | | 29 | | | | 15 | | | | 27 | | | | 36 | |
Arzerra | | | – | | | | – | | | | – | | | | – | | | | – | | | | – | | | | 1 | | | | – | | | | – | | | | – | | | | – | | | | – | |
Hycamtin | | | 2 | | | | (33 | ) | | | (33 | ) | | | 1 | | | | 100 | | | | – | | | | 2 | | | | (50 | ) | | | – | | | | 1 | | | | – | | | | – | |
Promacta | | | 1 | | | | – | | | | – | | | | – | | | | – | | | | – | | | | – | | | | – | | | | – | | | | – | | | | – | | | | – | |
Tyverb/Tykerb | | | 9 | | | | 14 | | | | 29 | | | | 8 | | | | 13 | | | | – | | | | 9 | | | | – | | | | – | | | | 7 | | | | >100 | | | | >100 | |
Votrient | | | – | | | | – | | | | – | | | | 1 | | | | – | | | | – | | | | – | | | | – | | | | – | | | | – | | | | – | | | | – | |
| | | | | | | | | | | | | | | | | | | | | | | | | | | | | | | | | | | |
Vaccines | | | 170 | | | | (28 | ) | | | (17 | ) | | | 178 | | | | 81 | | | | >100 | | | | 252 | | | | >100 | | | | >100 | | | | 355 | | | | >100 | | | | >100 | |
Boostrix | | | 6 | | | | (17 | ) | | | – | | | | 4 | | | | – | | | | – | | | | 5 | | | | 67 | | | | 67 | | | | 4 | | | | (67 | ) | | | (33 | ) |
Cervarix | | | 34 | | | | >100 | | | | >100 | | | | 25 | | | | >100 | | | | >100 | | | | 17 | | | | >100 | | | | >100 | | | | 12 | | | | >100 | | | | >100 | |
Fluarix, FluLaval | | | 8 | | | | (33 | ) | | | (33 | ) | | | 17 | | | | 50 | | | | 70 | | | | (1 | ) | | | – | | | | – | | | | 4 | | | | >100 | | | | >100 | |
| Flu pandemic | | | 46 | | | | (67 | ) | | | (57 | ) | | | 49 | | | | >100 | | | | >100 | | | | 140 | | | | – | | | | – | | | | 242 | | | | >100 | | | | >100 | |
| Hepatitis | | | 22 | | | | 11 | | | | 22 | | | | 17 | | | | – | | | | 6 | | | | 20 | | | | 29 | | | | 43 | | | | 24 | | | | 22 | | | | 33 | |
Infanrix, Pediarix | | | 21 | | | | 13 | | | | 31 | | | | 18 | | | | (6 | ) | | | 6 | | | | 16 | | | | (6 | ) | | | – | | | | 20 | | | | 13 | | | | 33 | |
Rotarix | | | 4 | | | | (33 | ) | | | (33 | ) | | | 7 | | | | 40 | | | | 40 | | | | 2 | | | | (75 | ) | | | (75 | ) | | | 8 | | | | 40 | | | | 60 | |
Synflorix | | | 5 | | | | (33 | ) | | | (17 | ) | | | 7 | | | | >100 | | | | >100 | | | | 10 | | | | >100 | | | | >100 | | | | 7 | | | | – | | | | – | |
| | | | | | | | | | | | | | | | | | | | | | | | | | | | | | | | | | | |
Dermatologicals | | | 50 | | | | (12 | ) | | | (2 | ) | | | 47 | | | | 2 | | | | 12 | | | | 56 | | | | 76 | | | | 93 | | | | 44 | | | | 95 | | | | 100 | |
Bactroban | | | 3 | | | | – | | | | 50 | | | | 4 | | | | (25 | ) | | | – | | | | 2 | | | | (33 | ) | | | (33 | ) | | | 4 | | | | 100 | | | | 100 | |
Dermovate | | | 6 | | | | – | | | | – | | | | 6 | | | | – | | | | – | | | | 7 | | | | – | | | | – | | | | 6 | | | | – | | | | – | |
Duac | | | 3 | | | | >100 | | | | >100 | | | | 5 | | | | 100 | | | | >100 | | | | 6 | | | | – | | | | – | | | | 1 | | | | – | | | | – | |
Soriatane | | | – | | | | – | | | | – | | | | – | | | | – | | | | – | | | | – | | | | – | | | | – | | | | – | | | | – | | | | – | |
Zovirax | | | 12 | | | | (15 | ) | | | (8 | ) | | | 11 | | | | (9 | ) | | | – | | | | 13 | | | | (14 | ) | | | (7 | ) | | | 10 | | | | (17 | ) | | | (17 | ) |
| | | | | | | | | | | | | | | | | | | | | | | | | | | | | | | | | | | |
Other | | | 88 | | | | – | | | | 11 | | | | 59 | | | | 14 | | | | 16 | | | | 69 | | | | (17 | ) | | | (4 | ) | | | 59 | | | | 11 | | | | 4 | |
| | | | | | | | | | | | | | | | | | | | | | | | | | | | | | | | | | | |
| | | | 1,057 | | | | (16 | ) | | | (6 | ) | | | 901 | | | | (1 | ) | | | 9 | | | | 1,021 | | | | 16 | | | | 31 | | | | 1,085 | | | | 35 | | | | 35 | |
| | | | | | | | | | | | | | | | | | | | | | | | | | | | | | | | | | | | | | | | | | | | | | | | | |
VIIV Healthcare (HIV) | | | 45 | | | | 5 | | | | 10 | | | | 44 | | | | 6 | | | | 22 | | | | 49 | | | | 24 | | | | 32 | | | | 37 | | | | (5 | ) | | | – | |
Combivir | | | 11 | | | | – | | | | 10 | | | | 10 | | | | (20 | ) | | | – | | | | 10 | | | | – | | | | – | | | | 9 | | | | – | | | | 13 | |
Epivir | | | 5 | | | | 100 | | | | 67 | | | | 5 | | | | (33 | ) | | | (17 | ) | | | 5 | | | | – | | | | – | | | | 5 | | | | (20 | ) | | | – | |
Epzicom/Kivexa | | | 19 | | | | 19 | | | | 19 | | | | 19 | | | | 23 | | | | 46 | | | | 16 | | | | – | | | | 7 | | | | 17 | | | | 7 | | | | 21 | |
Lexiva | | | 4 | | | | – | | | | 100 | | | | – | | | | (33 | ) | | | (100 | ) | | | 4 | | | | – | | | | 100 | | | | 3 | | | | – | | | | – | |
Selzentry | | | 1 | | | | – | | | | – | | | | 2 | | | | – | | | | – | | | | – | | | | – | | | | – | | | | – | | | | – | | | | – | |
Trizivir | | | 2 | | | | – | | | | – | | | | 1 | | | | 100 | | | | – | | | | 3 | | | | (100 | ) | | | (25 | ) | | | 1 | | | | >100 | | | | – | |
| | | | | | | | | | | | | | | | | | | | | | | | | | | | | | | | | | | |
Pharmaceutical turnover includes co-promotion income.
GSK Annual Report 20092010
186193
Shareholder informationFinancial record
Quarterly trend
Consumer Healthcare turnover
| | | | | | | | | | | | | | | | | | | | | | | | | | | | | | | | | | | | | | | | | | | | | | | | | |
| | | | | | | | | | | |
| | | Q4 2010 | | | Q3 2010 | | | Q2 2010 | | | Q1 2010 | |
| | | £m | | | CER% | | | £% | | | £m | | | CER% | | | £% | | | £m | | | CER% | | | £% | | | £m | | | CER% | | | £% | |
| Over-the-counter medicines | | | 645 | | | | 1 | | | | 4 | | | | 601 | | | | 1 | | | | 5 | | | | 593 | | | | (2 | ) | | | 3 | | | | 617 | | | | 11 | | | | 8 | |
| Oral healthcare | | | 411 | | | | 7 | | | | 10 | | | | 400 | | | | 4 | | | | 7 | | | | 410 | | | | 9 | | | | 12 | | | | 381 | | | | 5 | | | | 4 | |
| Nutritional healthcare | | | 211 | | | | 7 | | | | 10 | | | | 259 | | | | 12 | | | | 16 | | | | 249 | | | | 6 | | | | 10 | | | | 233 | | | | 12 | | | | 10 | |
| | | | | | | | | | | | | | | | | | | | | | | | | | | | | | | | | | | |
| | | | 1,267 | | | | 4 | | | | 7 | | | | 1,260 | | | | 4 | | | | 8 | | | | 1,252 | | | | 3 | | | | 7 | | | | 1,231 | | | | 9 | | | | 7 | |
| | | | | | | | | | | | | | | | | | | | | | | | | | | | | | | | | | | |
| | | | | | | | | | | | | | | | | | | | | | | | | | | | | | | | | | | | | | | | | | | | | | | | | |
| | | | | | | | | | | |
| | | Q4 2010 | | | Q3 2010 | | | Q2 2010 | | | Q1 2010 | |
| | | £m | | | CER% | | | £% | | | £m | | | CER% | | | £% | | | £m | | | CER% | | | £% | | | £m | | | CER% | | | £% | |
| USA | | | 279 | | | | 5 | | | | 7 | | | | 249 | | | | (4 | ) | | | – | | | | 263 | | | | – | | | | 4 | | | | 246 | | | | 3 | | | | (5 | ) |
| Europe | | | 503 | | | | (3 | ) | | | (5 | ) | | | 491 | | | | (2 | ) | | | (3 | ) | | | 493 | | | | (2 | ) | | | (3 | ) | | | 471 | | | | 9 | | | | 8 | |
| Rest of World | | | 485 | | | | 13 | | | | 22 | | | | 520 | | | | 15 | | | | (25 | ) | | | 496 | | | | 11 | | | | 22 | | | | 514 | | | | 13 | | | | 13 | |
| | | | | | | | | | | | | | | | | | | | | | | | | | | | | | | | | | | |
| | | | 1,267 | | | | 4 | | | | 7 | | | | 1,260 | | | | 4 | | | | 8 | | | | 1,252 | | | | 3 | | | | 7 | | | | 1,231 | | | | 9 | | | | 7 | |
| | | | | | | | | | | | | | | | | | | | | | | | | | | | | | | | | | | |
GSK Annual Report 2010
194
Financial record
Five year record
A record of financial performance is provided, analysed in accordance with current reporting practice. The information included in the Five year record is prepared in accordance with IFRS as adopted by the European Union and also with IFRS as issued by the International Accounting Standards Board.
| | | | | | | | | | | | | | | | | | | | | |
| | | 2009 | | | 2008 | | | 2007 | | | 2006 | | | 2005 | |
| Pharmaceutical turnover by therapeutic area | | £m | | | £m | | | £m | | | £m | | | £m | |
| | | | | | | | | | | | | | | |
| Respiratory | | | 6,977 | | | | 5,817 | | | | 5,032 | | | | 4,991 | | | | 5,050 | |
| Anti-virals | | | 4,150 | | | | 3,206 | | | | 3,027 | | | | 2,826 | | | | 2,598 | |
| Central nervous system | | | 1,870 | | | | 2,897 | | | | 3,348 | | | | 3,642 | | | | 3,219 | |
| Cardiovascular and urogenital | | | 2,298 | | | | 1,847 | | | | 1,554 | | | | 1,636 | | | | 1,331 | |
| Metabolic | | | 1,181 | | | | 1,191 | | | | 1,508 | | | | 1,870 | | | | 1,488 | |
| Anti-bacterials | | | 1,592 | | | | 1,429 | | | | 1,323 | | | | 1,363 | | | | 1,513 | |
| Oncology and emesis | | | 629 | | | | 496 | | | | 477 | | | | 1,069 | | | | 1,016 | |
| Vaccines | | | 3,706 | | | | 2,539 | | | | 1,993 | | | | 1,692 | | | | 1,389 | |
| Other | | | 1,311 | | | | 959 | | | | 901 | | | | 924 | | | | 979 | |
| | | | | | | | | | | | | | | |
| | | | 23,714 | | | | 20,381 | | | | 19,163 | | | | 20,013 | | | | 18,583 | |
| | | | | | | | | | | | | | | |
| | | | | | | | | | | | | | | | | | | | | |
| | | | | | | | | | | | | | |
| Turnover by business segment | | 2010 | | | 2009 | | | 2008 | | | 2007 | | | 2006 | |
| | £m | | | £m | | | £m | | | £m | | | £m | |
| Pharmaceutical | | | 23,382 | | | | 23,694 | | | | 20,381 | | | | 19,163 | | | | 20,013 | |
| Consumer Healthcare | | | 5,010 | | | | 4,674 | | | | 3,971 | | | | 3,553 | | | | 3,212 | |
| | | | | | | | | | | | | | |
| | | | 28,392 | | | | 28,368 | | | | 24,352 | | | | 22,716 | | | | 23,225 | |
| | | | | | | | | | | | | | |
| | | | | | | | | | | | | | | | | | | | | |
| | | 2009 | | | 2008 | | | 2007 | | | 2006 | | | 2005 | |
| Pharmaceutical turnover by geographic area | | £m | | | £m | | | £m | | | £m | | | £m | |
| | | | | | | | | | | | | | | |
| USA | | | 9,180 | | | | 8,894 | | | | 9,273 | | | | 10,353 | | | | 9,106 | |
| Europe | | | 7,681 | | | | 6,483 | | | | 5,560 | | | | 5,437 | | | | 5,458 | |
| Rest of World: | | | | | | | | | | | | | | | | | | | | |
| Emerging markets | | | 2,973 | | | | 2,290 | | | | 1,895 | | | | 1,783 | | | | 1,671 | |
| Japan | | | 1,649 | | | | 1,027 | | | | 867 | | | | 860 | | | | 854 | |
| Asia Pacific | | | 1,051 | | | | 891 | | | | 834 | | | | 806 | | | | 763 | |
| Canada | | | 635 | | | | 503 | | | | 477 | | | | 483 | | | | 443 | |
| Other | | | 545 | | | | 293 | | | | 257 | | | | 291 | | | | 288 | |
| Rest of World | | | 6,853 | | | | 5,004 | | | | 4,330 | | | | 4,223 | | | | 4,019 | |
| | | | | | | | | | | | | | | |
| | | | 23,714 | | | | 20,381 | | | | 19,163 | | | | 20,013 | | | | 18,583 | |
| | | | | | | | | | | | | | | |
| | | | | | | | | | | | | | | | | | | | | |
| | | | | | | | | | | | | | |
| Pharmaceutical turnover by therapeutic area | | 2010 | | | 2009 | | | 2008 | | | 2007 | | | 2006 | |
| | £m | | | £m | | | £m | | | £m | | | £m | |
| Respiratory | | | 7,238 | | | | 6,977 | | | | 5,817 | | | | 5,032 | | | | 4,991 | |
| Anti-virals | | | 1,086 | | | | 2,416 | | | | 1,584 | | | | 1,478 | | | | 1,191 | |
| HIV | | | 1,566 | | | | 1,605 | | | | 1,513 | | | | 1,442 | | | | 1,515 | |
| Central nervous system | | | 1,753 | | | | 1,870 | | | | 2,897 | | | | 3,348 | | | | 3,642 | |
| Cardiovascular and urogenital | | | 2,570 | | | | 2,298 | | | | 1,847 | | | | 1,554 | | | | 1,636 | |
| Metabolic | | | 678 | | | | 1,181 | | | | 1,191 | | | | 1,508 | | | | 1,870 | |
| Anti-bacterials | | | 1,396 | | | | 1,457 | | | | 1,301 | | | | 1,213 | | | | 1,271 | |
| Oncology and emesis | | | 688 | | | | 629 | | | | 496 | | | | 477 | | | | 1,069 | |
| Vaccines | | | 4,326 | | | | 3,706 | | | | 2,539 | | | | 1,993 | | | | 1,692 | |
| Dermatologicals | | | 1,087 | | | | 707 | | | | 414 | | | | 375 | | | | 367 | |
| Other | | | 994 | | | | 848 | | | | 782 | | | | 743 | | | | 769 | |
| | | | | | | | | | | | | | |
| | | | 23,382 | | | | 23,694 | | | | 20,381 | | | | 19,163 | | | | 20,013 | |
| | | | | | | | | | | | | | |
| | | | | | | | | | | | | | | | | | | | | |
| | | | | | | | | | | | | | |
| Pharmaceutical turnover by geographic area | | 2010 | | | 2009 | | | 2008 | | | 2007 | | | 2006 | |
| | £m | | | £m | | | £m | | | £m | | | £m | |
| USA | | | 8,308 | | | | 9,294 | | | | 8,894 | | | | 9,273 | | | | 10,353 | |
| Europe | | | 7,133 | | | | 7,720 | | | | 6,483 | | | | 5,560 | | | | 5,437 | |
| Emerging Markets | | | 3,702 | | | | 3,000 | | | | 2,282 | | | | 1,883 | | | | 1,769 | |
| Asia Pacific/Japan | | | 3,204 | | | | 2,715 | | | | 1,918 | | | | 1,701 | | | | 1,666 | |
| Other | | | 1,035 | | | | 965 | | | | 804 | | | | 746 | | | | 788 | |
| | | | | | | | | | | | | | |
| | | | 23,382 | | | | 23,694 | | | | 20,381 | | | | 19,163 | | | | 20,013 | |
| | | | | | | | | | | | | | |
Pharmaceutical turnover includes co-promotion income. In 2010 ViiV Healthcare turnover is included in the geographic area in which a sale is made.
| | | | | | | | | | | | | | | | | | | | | | | | | | | | | | | | |
| | | 2009 | | 2008 | | 2007 | | 2006 | | 2005 | | | | | | | | | | | |
| Consumer Healthcare turnover | | £m | | £m | | £m | | £m | | £m | | | 2010 | | 2009 | | 2008 | | 2007 | | 2006 | |
| | | | | | | | | | | | |
| Consumer Healthcare turnover | | | £m | | £m | | £m | | £m | | £m | |
| | 2,319 | | 1,935 | | 1,788 | | 1,561 | | 1,515 | | | 2,456 | | 2,339 | | 1,935 | | 1,788 | | 1,561 | |
| Oral healthcare | | 1,484 | | 1,240 | | 1,049 | | 993 | | 943 | | | 1,602 | | 1,484 | | 1,240 | | 1,049 | | 993 | |
| Nutritional healthcare | | 851 | | 796 | | 716 | | 658 | | 619 | | | 952 | | 851 | | 796 | | 716 | | 658 | |
| | | | | | | | | | | | | | | | | | | | | |
| | | 4,654 | | 3,971 | | 3,553 | | 3,212 | | 3,077 | | | 5,010 | | 4,674 | | 3,971 | | 3,553 | | 3,212 | |
| | | | | | | | | | | | | | | | | | | | | |
GSK Annual Report 20092010
187195
Shareholder informationFinancial record
| | | | | | | | | | | | | | | | | | | | | | |
| | | | | | | | | | | | |
| | | 2009 | | 2008 | | 2007 | | 2006 | | 2005 | | | | | | | | | | | |
| Financial results – total | | £m | | £m | | £m | | £m | | £m | | | 2010 | | 2009 | | 2008 | | 2007 | | 2006 | |
| | | | | | | | | | | | |
| Financial results – total | | | £m | | £m | | £m | | £m | | £m | |
| | 28,368 | | 24,352 | | 22,716 | | 23,225 | | 21,660 | | | 28,392 | | 28,368 | | 24,352 | | 22,716 | | 23,225 | |
| Operating profit | | 8,425 | | 7,141 | | 7,593 | | 7,808 | | 6,874 | | | 3,783 | | 8,425 | | 7,141 | | 7,593 | | 7,808 | |
| Profit before taxation | | 7,891 | | 6,659 | | 7,452 | | 7,799 | | 6,732 | | | 3,157 | | 7,891 | | 6,659 | | 7,452 | | 7,799 | |
| Profit after taxation | | 5,669 | | 4,712 | | 5,310 | | 5,498 | | 4,816 | | | 1,853 | | 5,669 | | 4,712 | | 5,310 | | 5,498 | |
| | | | | | | | | | | | | | | | | | | | | | |
| | | | | | | | | | | | | | | | | | | | | | | | | | | | | | | | |
| | | pence | | pence | | pence | | pence | | pence | | | | | | | | | | | |
| | | | | | | | | | | | | pence | | pence | | pence | | pence | | pence | |
| Basic earnings per share | | 109.1 | | 88.6 | | 94.4 | | 95.5 | | 82.6 | | | 32.1 | | 109.1 | | 88.6 | | 94.4 | | 95.5 | |
| Diluted earnings per share | | 108.2 | | 88.1 | | 93.7 | | 94.5 | | 82.0 | | | 31.9 | | 108.2 | | 88.1 | | 93.7 | | 94.5 | |
| | | | | | | | | | | | | | | | | | | | | | |
| | | | | | | | | | | | | | | | | | | | | | | | | | | | | | | | |
| | | 2009 | | 2008 | | 2007 | | | | | | | | | | | |
| Financial results – before major restructuring | | £m | | £m | | £m | | | 2010 | | 2009 | | 2008 | |
| | | | | | | |
| Financial results – before major restructuring | | | £m | | £m | | £m | |
| | 28,368 | | 24,352 | | 22,716 | | | 28,392 | | 28,368 | | 24,352 | | | | | |
| Operating profit | | 9,257 | | 8,259 | | 7,931 | | | 5,128 | | 9,257 | | 8,259 | |
| Profit before taxation | | 8,726 | | 7,782 | | 7,790 | | | 4,505 | | 8,726 | | 7,782 | |
| Profit after taxation | | 6,283 | | 5,551 | | 5,571 | | | 2,961 | | 6,283 | | 5,551 | |
| | | | | | | | | | | | | | | | | | |
| | | | | | | | | | | | | | | | | | | | | | | | | | | | | | | | |
| | | pence | | pence | | | | | | | | | | | | | | | | | |
| | | | | | | pence | | pence | | pence | |
| Adjusted earnings per share | | 121.2 | | 104.7 | | | 53.9 | | 121.2 | | 104.7 | | | | | |
| Adjusted diluted earnings per share | | 120.3 | | 104.1 | | | 53.5 | | 120.3 | | 104.1 | |
| | | | | | | | | | | | | | | | |
| | | | | | | | | | | | | | | | | | | | | | | | | | | | | | | | |
| | | 2009 | | 2008 | | 2007 | | 2006 | | 2005 | | | | | | | | | | | |
| | | millions | | millions | | millions | | millions | | millions | | | 2010 | | 2009 | | 2008 | | 2007 | | 2006 | |
| | | | | | | | | | | | | millions | | millions | | millions | | millions | | millions | |
| Weighted average number of shares in issue: | | |
| Basic | | 5,069 | | 5,195 | | 5,524 | | 5,643 | | 5,674 | | | 5,085 | | 5,069 | | 5,195 | | 5,524 | | 5,643 | |
| Diluted | | 5,108 | | 5,226 | | 5,567 | | 5,700 | | 5,720 | | | 5,128 | | 5,108 | | 5,226 | | 5,567 | | 5,700 | |
| | | | | | | | | | | | | | | | | | | | | |
| | | | | | | | | | | | | | | | | | | | | |
| | | % | | | % | | | % | | | % | | | % | |
| | | | | | | | | | | | | | | |
| Return on capital employed | | | 82.8 | | | | 73.1 | | | | 76.2 | | | | 90.6 | | | | 99.7 | |
| | | | | | | | | | | | | | | |
| | | | | | | | | | | | | | | | | | | | | |
| | | | | | | | | | | | | | |
| | | % | | | % | | | % | | | % | | | % | |
| Return on capital employed | | | 30.8 | | | | 82.8 | | | | 73.1 | | | | 76.2 | | | | 90.6 | |
| | | | | | | | | | | | | | | | |
Return on capital employed is calculated as total profit before taxation as a percentage of average net assets over the year.
| | | | | | | | | | | | | | | | | | | | | | | | | | | | | | | | |
| | | 2009 | | 2008 | | 2007 | | 2006 | | 2005 | | | | | | | | | | | |
| Balance sheet | | £m | | £m | | £m | | £m | | £m | | | 2010 | | 2009 | | 2008 | | 2007 | | 2006 | |
| | | | | | | | | | | | |
| Balance sheet | | | £m | | £m | | £m | | £m | | £m | |
| | 25,292 | | 22,124 | | 17,377 | | 14,561 | | 14,021 | | | 26,194 | | 25,292 | | 22,124 | | 17,377 | | 14,561 | |
| Current assets | | 17,570 | | 17,269 | | 13,626 | | 10,992 | | 13,177 | | | 16,036 | | 17,570 | | 17,269 | | 13,626 | | 10,992 | |
| | | | | | | | | | | | | | | | | | | | | |
| Total assets | | 42,862 | | 39,393 | | 31,003 | | 25,553 | | 27,198 | | | 42,230 | | 42,862 | | 39,393 | | 31,003 | | 25,553 | |
| | | | | | | | | | | | |
| | | | | | | | | | | | |
| Current liabilities | | | (12,118 | ) | | | (10,017 | ) | | | (10,345 | ) | | | (7,265 | ) | | | (9,511 | ) | | | (12,794 | ) | | | (12,118 | ) | | | (10,017 | ) | | | (10,345 | ) | | | (7,265 | ) |
| Non-current liabilities | | | (20,002 | ) | | | (21,058 | ) | | | (10,748 | ) | | | (8,640 | ) | | | (10,117 | ) | | | (19,691 | ) | | | (20,002 | ) | | | (21,058 | ) | | | (10,748 | ) | | | (8,640 | ) |
| | | | | | | | | | | | | | | | | | | | | |
| Total liabilities | | | (32,120 | ) | | | (31,075 | ) | | | (21,093 | ) | | | (15,905 | ) | | | (19,628 | ) | | | (32,485 | ) | | | (32,120 | ) | | | (31,075 | ) | | | (21,093 | ) | | | (15,905 | ) |
| | | | | | | | | | | | | | | | | | | | | |
| | | |
| Net assets | | 10,742 | | 8,318 | | 9,910 | | 9,648 | | 7,570 | | | 9,745 | | 10,742 | | 8,318 | | 9,910 | | 9,648 | |
| | | | | | | | | | | | | | | | | | | | |
| | | |
| Shareholders’ equity | | 10,005 | | 7,931 | | 9,603 | | 9,386 | | 7,311 | | | 8,887 | | 10,005 | | 7,931 | | 9,603 | | 9,386 | |
| Minority interests | | 737 | | 387 | | 307 | | 262 | | 259 | | |
| Non-controlling interests | | | 858 | | 737 | | 387 | | 307 | | 262 | |
| | | | | | | | | | | | | | | | | | | | | |
| Total equity | | 10,742 | | 8,318 | | 9,910 | | 9,648 | | 7,570 | | | 9,745 | | 10,742 | | 8,318 | | 9,910 | | 9,648 | |
| | | | | | | | | | | | | | | | | | | | | |
GSK Annual Report 20092010
188196
Shareholder informationFinancial record
Number of employees
| | | | | | | | | | | | | | | | | | | | | | | | | | | | | | | | |
| | | 2009 | | 2008 | | 2007 | | 2006 | | 2005 | | | | | | | | | | | |
| | | | | | | | | | | | | 2010 | | 2009 | | 2008 | | 2007 | | 2006 | |
| USA | | 22,594 | | 21,176 | | 24,838 | | 24,726 | | 23,822 | | | 17,555 | | 22,594 | | 21,176 | | 24,838 | | 24,726 | |
| Europe | | 42,048 | | 44,677 | | 46,869 | | 45,758 | | 43,999 | | | 39,910 | | 42,048 | | 44,677 | | 46,869 | | 45,758 | |
| Rest of World: | | |
| Asia Pacific, including China | | 21,011 | | 18,983 | | 17,525 | | 17,570 | | 15,991 | | | 23,388 | | 21,011 | | 18,983 | | 17,525 | | 17,570 | |
| Japan | | 3,264 | | 3,174 | | 3,284 | | 3,195 | | 3,098 | | | 3,461 | | 3,264 | | 3,174 | | 3,284 | | 3,195 | |
| Middle East, Africa | | 3,619 | | 3,403 | | 3,156 | | 3,204 | | 5,682 | | | 3,609 | | 3,619 | | 3,403 | | 3,156 | | 3,204 | |
| Latin America | | 5,169 | | 5,228 | | 5,249 | | 5,856 | | 5,664 | | | 6,432 | | 5,169 | | 5,228 | | 5,249 | | 5,856 | |
| Canada | | 2,208 | | 2,362 | | 2,562 | | 2,386 | | 2,472 | | | 2,106 | | 2,208 | | 2,362 | | 2,562 | | 2,386 | |
| | | | | | | | | | | | | | | | | | | | | |
| Rest of World | | 35,271 | | 33,150 | | 31,776 | | 32,211 | | 32,907 | | | 38,996 | | 35,271 | | 33,150 | | 31,776 | | 32,211 | |
| | | | | | | | | | | | | 96,461 | | 99,913 | | 99,003 | | 103,483 | | 102,695 | |
| | | 99,913 | | 99,003 | | 103,483 | | 102,695 | | 100,728 | | | | | | | | | | | |
| | | | | | | | | | | | |
| Manufacturing | | 31,162 | | 32,622 | | 33,995 | | 33,235 | | 31,615 | | | 30,611 | | 31,162 | | 32,622 | | 33,995 | | 33,235 | |
| Selling | | 44,621 | | 42,430 | | 44,499 | | 44,484 | | 44,393 | | | 43,918 | | 44,621 | | 42,430 | | 44,499 | | 44,484 | |
| Administration | | 9,405 | | 8,787 | | 8,960 | | 9,024 | | 9,225 | | | 8,850 | | 9,405 | | 8,787 | | 8,960 | | 9,024 | |
| Research and development | | 14,725 | | 15,164 | | 16,029 | | 15,952 | | 15,495 | | | 13,082 | | 14,725 | | 15,164 | | 16,029 | | 15,952 | |
| | | | | | | | | | | | | | | | | | | | | |
| | | 99,913 | | 99,003 | | 103,483 | | 102,695 | | 100,728 | | | 96,461 | | 99,913 | | 99,003 | | 103,483 | | 102,695 | |
| | | | | | | | | | | | | | | | | | | | | |
The geographic distribution of employees in the table above is based on the location of GSK’s subsidiary companies. The number of employees is the number of permanent employed staff at the end of the financial period. It excludes those employees who are employed and managed by GSK on a contract basis.
Exchange rates
As a guide to holders of ADS, the following tables set out, for the periods indicated, information on the exchange rate of US dollars for Sterling as reported by the Federal Reserve Bank of New York (‘noon buying rate’)*.
| | | | | | | | | | | | | | | | | | | | | |
| | | 2009 | | | 2008 | | | 2007 | | | 2006 | | | 2005 | |
| | | | | | | | | | | | | | | |
| Average | | | 1.56 | | | | 1.85 | | | | 2.00 | | | | 1.85 | | | | 1.81 | |
| | | | | | | | | | | | | | | |
| | | | | | | | | | | | | | | | | | | | | |
| | | | | | | | | | | | | | |
| | | 2010 | | | 2009 | | | 2008 | | | 2007 | | | 2006 | |
| Average | | | 1.55 | | | | 1.56 | | | | 1.85 | | | | 2.00 | | | | 1.85 | |
| | | | | | | | | | | | | | | | |
The average rate for the year is calculated as the average of the noon buying rates for each day of the year.
| | | | | | | | | | | | | | | | | | | | | | | | | | | | | | | | | | | | | | |
| | | Feb | | Jan | | Dec | | Nov | | Oct | | Sept | | | | | | | | | | | | | |
| | | 2010 | | 2010 | | 2009 | | 2009 | | 2009 | | 2009 | | | Feb | | Jan | | Dec | | Nov | | Oct | | Sept | |
| | | | | | | | | | | | | | | 2011 | | 2011 | | 2010 | | 2010 | | 2010 | | 2010 | |
| High | | 1.60 | | 1.64 | | 1.67 | | 1.68 | | 1.66 | | 1.67 | | | 1.62 | | 1.60 | | 1.59 | | 1.63 | | 1.60 | | 1.58 | |
| Low | | 1.54 | | 1.59 | | 1.59 | | 1.64 | | 1.58 | | 1.59 | | | 1.60 | | 1.55 | | 1.54 | | 1.55 | | 1.57 | | 1.53 | |
| | | | | | | | | | | | | | | | | | | | | | | | | | |
As at 31st December 2008, the Federal Reserve Bank of New York ceased publishing noon buying rates. The Bank of England 4pm buying rates have been used for subsequent calculations. | | |
| * | | On 31st December 2008, the Federal Reserve Bank of New York ceased publishing noon buying rates. The Bank of England 4pm buying rates have been used for subsequent calculations. |
The 4pm buying rate on 19th24th February 20102011 was £1 = US$1.54.1.61.
GSK Annual Report 20092010
189197
Product development pipeline
Key
| | | | | | |
Key | | | | |
| † | | In-license or other alliance relationship with third party | | BLA | | Biological License Application |
| S | | Month of first submission | | MAA | | Marketing Authorisation Application (Europe) |
| A | | Month of first regulatory approval (for MAA, this is the first EU | | NDA | | New Drug Application (USA) |
| | approval letter) | | Phase I | | Evaluation of clinical pharmacology, usually conducted in volunteers |
| AL/CR | | Month Approvable or Complete Response Letter received – indicates that ultimately approval can be given subject to resolution of outstanding queries |
PO | | Month of EU Positive Opinion |
TA | | FDA Tentative Approval |
| | |
BLA | | Biological License Application |
MAA | | Marketing Authorisation Application (Europe) |
NDA | | New Drug Application (USA) |
Phase I | | Evaluation of clinical pharmacology, usually conducted in volunteers |
| Phase II | | Determination of dose and initial evaluation of efficacy, conducted in a |
| | that ultimately approval may be given subject to resolution of | | | | small number of patients |
| | outstanding queries | | Phase III | | Large comparative study (compound versus placebo and/or established |
| PO | | Month of EU Positive Opinion | | | | treatment) in patients to establish clinical benefit and safety |
| TA | | FDA Tentative Approval | | | | |
MAA and NDA/BLA Regulatory milestones shown in the table below are those that have been achieved. Future submissionfiling dates are not included in this list.
| | | | | | | | | | | |
| |
| | | | | | | | | Achieved Regulatory |
| | | | | | | | | review milestones |
| Compound | | Type | | Indication | | Phase | | MAA | | NDA/BLA |
| |
| | | | | | | | | | |
| Biopharmaceuticals |
| 933776 | | beta amyloid monoclonal antibody | | Alzheimer’s diseasedisorders | | I | | | | |
1070806 | | | | | | | | | | |
| 1070806 | | IL18 monoclonal antibody | | metabolic disease | | I | | | | |
| 1223249 | | NOGO-A monoclonal antibody | | amyotrophic lateral sclerosis & multiple sclerosis | | I | | | | |
2401502† | | domain antibody targeted
targetted multi-component vaccine | | malignant melanoma | | I | | | | |
APN012586881 (APN01)† | | recombinant human angiotensin
converting enzymeanzyme 2 | | acute respiratory distress syndrome | | I | | | | |
iboctadekin† (+Doxil) Doxil) | | IL18 immunomodulator (+ topoisomerase II
inhibitor) | | ovarian cancer | | I | | | | |
iboctadekinotelixizumab† (+ rituximab) | | IL18 immunomodulator (+ anti-CD20
anti-CD3 monoclonal antibody)antibody (i.v.) | | follicular lymphomaGraves eye disease | | I | | | | |
otelixizumab† | | anti-CD3 monoclonal antibody (s.c. & i.v.) | | rheumatoid arthritis | | I | | | | |
otelixizumab† | | anti-CD3 monoclonal antibody (s.c.) | | type 1 diabetes | | I | | | | |
| 249320 | | myelin-associated glycoprotein monoclonal antibody | | stroke | | II | | | | |
| 315234 | | oncostatin M monoclonal antibody | | rheumatoid arthritis | | II | | | | |
679586 768974† | | monoclonal antibodyparathyroid hormone | | severe asthmaosteoporosis | | II | | | | |
Arzerra (ofatumumab)albiglutide† | | anti-CD20 human monoclonal antibodyglucagon-like peptide 1 (GLP 1) agonist | | follicular lymphoma (relapsed patients)heart failure | | II | | | | |
Benlysta (belimumab)† | | anti-B lymphocyte stimulator monoclonal antibody (s.c.) | | systemic lupus erythematosus | | II | | | | |
| mepolizumab | | anti-IL5 monoclonal antibody | | severe asthma & nasal polyposis | | II | | | | |
ofatumumab† | | anti-CD20 human monoclonal antibody (s.c.) | | multiple sclerosis | | II | | | | |
ofatumumab† | | anti-CD20 human monoclonal antibody (s.c.) | | rheumatoid arthritis | | II | | | | |
otelixizumab† | | anti-CD3 monoclonal antibody (i.v.) | | myaesthenia gravis | | II | | | | |
albiglutide† | | GLP 1 agonist | | type 2 diabetes | | III | | | | |
Arzerra (ofatumumab)† | | anti-CD20 human monoclonal antibody | | chronic lymphocytic leukaemia, first line therapy &
use in relapsed patients | | III | | | | |
Arzerra (ofatumumab)† | | anti-CD20 human monoclonal antibody | | diffuse large B cell lymphoma (relapsed patients) | | III | | | | |
Arzerra (ofatumumab)† | | anti-CD20 human monoclonal antibody | | follicular lymphoma (refractory & relapsed patients) | | III | | | | |
Benlysta (belimumab)† | | anti-B lymphocyte stimulator monoclonal antibody (i.v.) | | systemic lupus erythematosus | | III | | | | |
denosumab† | | anti-receptor activator for nuclear kappa (RANK)
ligand human monoclonal antibody | | bone metastatic disease | | III | | | | |
denosumab† | | anti-RANK ligand human monoclonal antibody | | hormone ablative/chemotherapy bone loss in cancer patients | | III | | | | |
ofatumumab† | | anti-CD20 human monoclonal antibody | | rheumatoid arthritis | | III | | | | |
otelixizumab† | | anti-CD3 monoclonal antibody (i.v.) | | type 1 diabetes | | III | | | | |
SyncriaBenlysta†
| | glucagon-like peptide 1 agonistanti-B lymphocyte stimulator monoclonal antibody (i.v.) | | type 2 diabetessystemic lupus erythematosus | | IIISubmitted | | S: Jun10 | | S: Jun10 |
Prolia (denosumab)denosumab† | | anti-RANKanti-receptor activator for nuclear kappa (RANK) ligand human monoclonal antibody | | post-menopausal osteoporosisbone metastatic disease | | Submitted | | PO:Dec09N/A | | N/A |
Arzerra (ofatumumab)† | | anti-CD20 human monoclonal antibody | | chronic lymphocytic leukaemia (refractory patients) | | Approved | | PO:Jan10A: Apr10 | | A:Oct09 |
Prolia† | | anti-RANK ligand human monoclonal antibody | | hormone ablative/chemotherapy bone loss in prostate cancer patients | | Approved | | N/A | | N/A |
Prolia† | | anti-RANK ligand human monoclonal antibody | | postmenopausal osteoporosis | | Approved | | A: May10 | | N/A |
| | | | | | | | | | |
| | | | | | | | | | | |
| Cardiovascular & Metabolic |
1278863 | | prolyl hydroxylase inhibitor | | anaemia | | I | | | | |
1521498 | | mu-opioid receptor inverse agonist | | obesity | | I | | | | |
1614235† | | sodium dependent glucose transport (SGLT1) inhibitor | | type 2 diabetes | | I | | | | |
| 2245840 | | SIRT1 activator | | sarcopaenia (also COPD & psoriasis) | | I | | | | |
184072 | | SIRT1 activator | | type 2 diabetes (also haematologic cancers) | | II | | | | |
| 256073 | | high affinity nicotinic acid receptor (HM74A)
agonist | | dyslipidaemiametabolic disorders | | II | | | | |
| 557296 | | oxytocin antagonist | | premature ejaculation | | II | | | | |
1292263 1278863 | | gastrin-releasing peptide (GPR119) receptor
agonistprolyl hydroxylase inhibitor | | type 2 diabetesanaemia associated with chronic renal disease | | II | | | | |
1362885 1278863 | | glycogen phosphorylaseprolyl hydroxylase inhibitor | | type 2 diabetesperipheral arterial disease | | II | | | | |
| 1292263 | | G-protein coupled receptor 119 (GRP119) agonist | | metabolic disorders | | II | | | | |
| 1521498 | | mu-opioid receptor inverse agonist | | compulsive eating disorders | | II | | | | |
| 2245840 | | SIRT1 activator | | type 2 diabetes (also COPD & haematologic cancers)psoriasis) | | II | | | | |
| losmapimod | | p38 kinase inhibitor | | cardiovascular disease (also COPD pain & depression)pain) | | II | | | | |
retosiban (221149) | | oxytocin antagonist | | threatened pre-term labour | | II | | | | |
rilapladib† | | Lp-PLA2 inhibitor | | atherosclerosis | | II | | | | |
Avandamet XR | | PPAR gamma agonist + metformin | | type 2 diabetes – extended release | | III | | N/A | | |
Avandia +simvastatin | | PPAR gamma agonist + statin | | type 2 diabetes | | III | | N/A | | |
darapladib† | | Lp-PLA2 inhibitor | | atherosclerosis | | III | | | | |
Arixtra | | synthetic factor Xa inhibitor | | treatment of acute coronary syndrome | | Approved | | A:Aug07 | | AL:Feb07
& Sep07 |
Avandia | | PPAR gamma agonist | | prevention of disease progression | | Approved | | A:Apr09 | | A:Jul08 |
| |
GSK Annual Report 20092010
190198
Product development pipeline
| | | | | | | | | | | |
| |
| | | | | | | | | Achieved Regulatory |
| | | | | | | | | review milestones |
| Compound | | Type | | Indication | | Phase | | MAA | | NDA/BLA |
| | | | | | | | | | | |
Infectious Diseases | | | | | | | | | | |
Infectious Diseases |
932121 2251052† | | plasmodium electron transport chainleucyl t-RNA synthetase inhibitor (oral & i.v.) | | malaria | | I | | | | |
945237 | | topoisomerase II inhibitor | | treatment of bacterial infections | | I | | | | |
1322322 2336805 | | novel class antibacterial agenthepatitis C virus inhibitor | | treatment of bacterial infectionshepatitis C | | I | | | | |
Relenza†2485852 | | neuraminidasehepatitis C virus inhibitor (i.v.) | | treatment of influenzahepatitis C | | I | | | | |
| 1322322 | | polypeptide deformylase inhibitor | | bacterial infections | | II | | | | |
sitamaquine | | 8-aminoquinoline | | treatment of visceral leishmaniasis | | II | | | | N/A |
tafenoquine† | | 8-aminoquinoline | | Plasmodium vivax malaria | | II | | | | |
Relenza† | | neuraminidase inhibitor (i.v.) | | influenza | | III | | | | |
| | | | | | | | | | | |
| | | | | | | | | | |
Neurosciences |
586529† | | CRF1 antagonist | | depression & anxiety | | | | | | |
| 2018682 | | sphingosine-1-phosphate receptor 1 (S1P1)
agonist | | multiple sclerosis | | I | | | | |
618334 | | dopamine D3 antagonist | | drug dependency | | I | | | | |
1014802 | | sodium channel blocker | | bipolar disorder | | I | | | | |
1034702 | | muscarinic acetylcholine agonist | | dementia | | I | | | | |
1144814 | | NK1/NK3 antagonist | | schizophrenia | | I | | | | |
163090 | | 5HT1 antagonist | | depression & anxiety | | II | | | | |
| 239512 | | histamine H3 antagonist | | dementia & schizophrenia | | II | | | | |
561679† | | CRF1 antagonist | | depression & anxiety | | II | | | | |
649868† | | orexin antagonist | | sleep disorders | | II | | | | |
| 742457 | | 5HT6 antagonist | | dementia | | II | | | | |
2402968 (PRO051)† | | antisense oligonucleotide | | Duchenne muscular dystrophy | | II | | | | |
firategrast† | | dual alpha4 integrin antagonist (VLA4) | | multiple sclerosis | | II | | | | |
Horizant (1838262)† | | voltage-gated calcium channel modulator | | migraine prophylaxispost-herpetic neuralgia | | II | | | | |
Horizant (1838262)† | | voltage-gated calcium channel modulator | | neuropathic pain | | II | | N/A | | |
| losmapimod | | p38 kinase inhibitor | | pain (also cardiovascular disease COPD & depression) | | II | | | | |
losmapimod | | p38 kinase inhibitor | | depression (also cardiovascular disease, COPD & pain)COPD) | | II | | | | |
| orvepitant | | NK1 antagonist | | depression & anxiety | | II | | | | |
almorexantIPX066† | | orexin antagonistdopamine precursor + DOPA decarboxylase
inhibitor | | insomniaParkinson’s disease | | III | | | | N/A |
Horizant (1838262)†* | | voltage-gated calcium channel modulator | | restless legs syndrome | | Submitted | | | | CR:Feb10S: Sep08,
Jan09 &
Oct10 |
retigabineTrobalt/Potiga
(retigabine/ezogabine)† | | neuronal potassium channel opener | | epilepsy –- partial seizures | | Submitted | | S:Oct09PO: Jan11 | | S:Oct09CR: Nov10 |
Lamictal XR | | sodium channel inhibitor | | epilepsy – partial generalised tonic-clonic seizures, once-daily | | Approved | | N/A | | A:Jan10 |
Lamictal XR | | sodium channel inhibitor | | epilepsy – partial seizures, once-daily | | Approved | | N/A | | A:May09 |
| |
| | | | | | | | | | | |
Oncology | | | | | | | | | | |
| 2110183 | | AKT protein kinase inhibitor | | cancer | | I | | | | |
2118436 | | BRaf protein kinase inhibitor | | cancer | | I | | | | |
| 2126458 | | Pi3 kinase inhibitor | | cancer | | I | | | | |
| 2141795 | | AKT protein kinase inhibitor | | cancer | | I | | | | |
184072 2256098 | | SIRT1 activatorfocal adhesion kinase inhibitor | | haematologic cancers (also type 2 diabetes)cancer | | III | | | | |
| vestipitant | | NK1 antagonist (i.v.) | | post operative nausea & vomiting | | I | | | | |
1120212† + BKM120 | | mitogen-activated protein kinase inhibitor
(MEK1/2) + Pi3 alpha kinase inhibitor | | cancer | | I | | | | |
1120212† | | MEK1/2 inhibitor | | pancreatic cancer | | II | | | | |
1120212† +2118436 | | MEK1/2 inhibitor + BRaf protein kinase inhibitor | | metastatic melanoma | | II | | | | |
2285921† | | thrombopoietin receptor agonist | | thrombocytopaenia | | II | | | | |
foretinib (1363089)† | | mesenchymal-epithelial transition factor
(C-met) kinase inhibitor | | papillary renal cell carcinoma and other cancers | | II | | | | |
Revolade/Promacta† | | thrombopoietin receptor agonist | | oncology-related thrombocytopaenia | | II | | | | |
Tyverb/Tykerb1120212† | | Her2 and EGFR dual kinaseMEK1/2 inhibitor | | head & neck squamous cell carcinoma (unresectable disease)metastatic melanoma | | IIIII | | | | |
Votrient(pazopanib)2118436 | | multi-kinase angiogenesisBRaf protein kinase inhibitor | | breast cancer, adjuvant therapymetastatic melanoma | | IIIII | | | | |
Votrient (pazopanib) | | multi-kinase angiogenesis inhibitor | | non-small cell lung cancer, first line & adjuvant therapy | | II | | | | |
Votrient (pazopanib) | | multi-kinase angiogenesis inhibitor | | ovarian cancer, maintenance therapy | | III | | | | |
Revolade/Promacta† | | thrombopoietin receptor agonist | | chronic liver disease induced thrombocytopaenia | | III | | | | |
Revolade/Promacta† | | thrombopoietin receptor agonist | | hepatitis C induced thrombocytopaenia | | III | | | | |
Tyverb/Tykerb | | Her2 and EGFR dual kinase inhibitor | | breast cancer, adjuvant therapy | | III | | | | |
Tyverb/Tykerb | | Her2 and EGFR dual kinase inhibitor | | gastric cancer | | III | | | | |
Tyverb/Tykerb | | Her2 and EGFR dual kinase inhibitor | | head & neck squamous cell carcinoma (resectable disease) | | III | | | | |
Votrient (pazopanib) | | multi-kinase angiogenesis inhibitor | | renal cell cancer, adjuvant therapy | | III | | | | |
Votrient | | multi-kinase angiogenesis inhibitor | | sarcoma | | III | | | | |
Votrient (pazopanib) + Tyverb/Tykerb | | multi-kinase angiogenesis inhibitor +
Her2 and EGFR dual kinase inhibitor | | inflammatory breast cancer | | III | | | | |
Tyverb/Tykerb | | Her2 and EGFR dual kinase inhibitor | | | | | | | | |
Avodart | | 5-alpha reductase inhibitor | | reduction in the risk of prostate cancer | | Submitted | | S:Sep09 & Mar10 | | CR: Jan11 |
Duodart (Avodart +Duodart/Jalyn
alpha blocker)
| | 5-alpha reductase inhibitor + alpha blocker | | benign prostatic hyperplasia –- fixed dose combination | | SubmittedApproved | | S:Dec08A: Mar10 | | TA:Jan10A: Jun10 |
Revolade/Promacta† | | thrombopoietin receptor agonist | | idiopathic thrombocytopaenic purpura | | Approved | | PO:Dec09A: Mar10 | | A:Nov08 |
Tyverb/Tykerb | | Her2 and EGFR dual kinase inhibitor | | breast cancer, first line therapy | | Approved | | PO:Feb10A: Jun10 | | A:Jan10 |
Votrient (pazopanib) | | multi-kinase angiogenesis inhibitor | | renal cell cancer | | Approved | | PO:Feb10A: Jun10 | | A:Oct09 |
| | | | | | | | | | |
| | | | | | | | | | | |
Ophthalmology | | | | | | | | | | |
| pazopanib | | multi-kinase angiogenesis inhibitor (oral) | | age-related macular degeneration (also cancer indications) | | I | | | | |
| pazopanib | | multi-kinase angiogenesis inhibitor (eye drops) | | age-related macular degeneration | | II | | | | |
| | | | | | | | | | | |
* See Note 40 to the financial statements, ‘Post balance sheet events’.
GSK Annual Report 20092010
191199
Product development pipeline
| | | | | | | | | | | |
| |
| | | | | | | | | | Achieved Regulatory |
| | | | | | | | | | review milestones |
| Compound | | Type | | Indication | | Phase | | MAA | | NDA/BLA |
| |
| | | | | | | | | | |
| Respiratory & Immuno-inflammation |
| 610677 | | p38 kinase inhibitor (inhaled) | | COPD | | I | | | | |
681323 705498 | | p38 kinase inhibitor (i.v.)transient receptor potential vanilloid
(TRPV1) antagonist (topical) | | acute lung injury & acute
respiratory distress syndromepruritis | | I | | | | |
| 1322888 | | motilin receptor agonist | | delayed gastric emptying | | I | | | | |
| 1325756 | | chemokine receptor (CXCR2) antagonist | | COPD | | I | | | | |
| 1440115 | | urotensin antagonist | | asthma | | I | | | | |
| 2245840 | | SIRT1 activator | | COPD & psoriasis (also type 2 diabetes & sarcopaenia) | | I | | | | |
CCX025†2245840 | | CCR9 antagonistSIRT1 activator | | Crohn’s diseasepsoriasis (also type 2 diabetes & sarcopaenia) | | III | | | | |
| 256066 | | PDE4 inhibitor (inhaled) | | COPD | | II | | | | |
573719 | | muscarinic acetylcholine antagonist | | COPD | | II | | | | |
573719 + 642444† | | muscarinic acetylcholine antagonist +
long-acting beta2 agonist | | COPD | | II | | | | |
| 656933 | | chemokine receptor (CXCR2) antagonist | | cystic fibrosis | | II | | | | |
| 685698 | | glucocorticoid agonist | | asthma | | II | | | | |
| 681323 | | p38 kinase inhibitor (i.v.) | | acute lung injury & acute respiratory distress syndrome | | II | | | | |
| 705498 | | transient receptor potential vanilloid
(TRPV1)
antagonist (intranasal) | | non-allergic rhinitis | | II | | | | |
| 870086 | | novel glucocorticoid agonist (inhaled) | | asthma | | II | | | | |
| 870086 | | novel glucocorticoid agonist (topical) | | atopic dermatitis | | II | | | | |
961081† | | muscarinic antagonist, beta2 agonist | | COPD | | II | | | | |
| 962040 | | motilin receptor agonist | | delayed gastric emptying | | II | | | | |
| 1399686 | | anti-inflammatory macrolide conjugate (oral) | | inflammatory bowel disease | | II | | | | |
1605786 (CCX282)† | | CCR9 antagonist | | Crohn’s disease | | II | | | | |
2190915† | | 5-lipoxygenase-activating protein (FLAP)
inhibitor | | asthma | | II | | | | |
| losmapimod | | p38 kinase inhibitor (oral) | | COPD (also cardiovascular disease
pain & depression)pain) | | II | | | | |
Relovair
(642444† + 685698)
573719 | | long-acting beta2 agonist + glucocorticoid agonist | | asthma | | II | | | | |
Relovair
(642444† + 685698)
| | long-acting beta2 agonist + glucocorticoid agonistmuscarinic acetylcholine antagonist | | COPD | | III | | | | |
642444573719 + vilanterol | | muscarinic acetylcholine antagonist + | | COPD | | III | | | | |
(642444)† | | long-acting beta2 agonist | | | | | | | | |
vilanterol (642444)† | | long-acting beta2 agonist | | COPD | | III | | | | |
1605786 (CCX282)† | | CCR9 antagonist | | Crohn’s disease | | III | | | | |
Relovair | | | | | | | | | | |
(vilanterol† + 685698) | | long-acting beta2 agonist +
glucocorticoid agonist | | asthma | | III | | | | |
Relovair | | | | | | | | | | |
(vilanterol† + 685698) | | long-acting beta2 agonist +
glucocorticoid agonist | | COPD | | III | | | | |
| | | | | | | | | | |
| | | | | | | | | | | |
| Paediatric Vaccines |
Hexavalent combination
vaccine | | conjugated | | Neisseria meningitis C, Haemophilus influenzae type b, diphtheria, tetanus, pertussis and poliomyelitis disease prophylaxis | | I | | | | |
Heptavalent combination
vaccine | | conjugated | | Neisseria meningitis C, Haemophilus influenzae type b, diphtheria, Hepatitis B, tetanus, pertussis and poliomyelitis disease prophylaxis | | II | | | | |
| MMR | | live attenuated | | measles, mumps, rubella prophylaxis | | II (USA) | | A: Oct03 | | |
S. pneumoniae paediatric
next generation | | recombinant – conjugated | | Streptococcus pneumoniae disease
prophylaxis | | II | | | | |
Mosquirix | | recombinant | | malaria prophylaxis (Plasmodium falciparum) | | III | | | | N/A |
Nimenrix (MenACWY-TT) (MenACWY-TT) | | conjugated | | Neisseria meningitis groups A, C, W
& Y disease prophylaxis | | IIISubmitted | | | | |
MenHibrix
(Hib-MenCY-TT) | | conjugated | | Neisseria meningitis groups C & Y & Haemophilus influenzae
type b disease prophylaxis | | Submitted | | N/A | | S:Aug09CR: Jun10 |
Hiberix | | conjugated | | paediatric booster for Haemophilus influenzae type b | | Approved | | A:Nov07 | | A:Aug09 |
Synflorix | | conjugated | | Streptococcus pneumoniae disease prophylaxis in infants & children | | Approved | | A:Mar09 | | N/A |
|
| | | | | | | | | | |
Other Vaccines |
Alzheimer’s disease | | conjugated | | treatment of Alzheimer’s disease | | I | | | | |
Cytomegalovirus | | recombinant | | cytomegalovirus infection prophylaxis | | I | | | | |
HIV | | recombinant | | HIV disease prophylaxis/immunotherapy | | I | | | | |
NTHi-Pneumo | | recombinant | | Streptococcus pneumoniae and Haemophilus influenzae | | I | | | | |
| | | | disease prophylaxis in adults | | | | | | |
Dengue fever | | attenuated tetravalent | | dengue fever prophylaxis | | II | | | | |
Tuberculosis | | recombinant | | tuberculosis prophylaxis | | II | | | | |
Zoster | | recombinant | | Herpes Zoster prevention | | II | | | | |
New generation flu vaccine | | inactivated split – trivalent | | seasonal influenza prophylaxis for the elderly | | III | | | | |
Simplirix | | recombinant | | genital herpes prophylaxis | | III | | | | |
Flu pandemic &
pre-pandemic†
| | H5N1 inactivated split – monovalent (Quebec) | | pandemic influenza prophylaxis | | Submitted | | S:Jul09 | | S:Jun09
(Canada) |
Arepanrix
(Flu pandemic)† | | H1N1 inactivated split adjuvanted – monovalent (Quebec) | | pandemic influenza prophylaxis (emergency use) | | Approved | | PO:Jan10 | | A:Oct09
(Canada) |
Cervarix† | | recombinant | | cervical dysplasia and cancer prophylaxis caused
by HPV 16/18 | | Approved | | A:Sep07 | | A:Oct09 |
Influenza A (H1N1) 2009
monovalent vaccine
(Flu pandemic)†
| | H1N1 inactivated split – monovalent (Quebec) | | pandemic influenza A (H1N1) 2009 prophylaxis
(emergency use) | | Approved | | | | A:Nov09 |
Pandemrix
(Flu pandemic)†
| | H1N1 inactivated split adjuvanted – monovalent (Dresden) | | pandemic influenza prophylaxis | | Approved | | A: Sep09 | | |
|
GSK Annual Report 2009
192
Product development pipeline
| | | | | | | | | | | |
| | | | | | | | | | | |
| Other Vaccines |
Flu pandemic† | | cell-culture based H5N1 vaccine | | pandemic influenza prophylaxis | | I | | | | |
| HIV | | recombinant | | HIV disease prophylaxis | | I | | | | |
| HIV | | recombinant | | HIV disease immunotherapy | | II | | | | |
| Tuberculosis | | recombinant | | tuberculosis prophylaxis | | II | | | | |
| Flu vaccine | | inactivated split – quadrivalent | | seasonal influenza prophylaxis | | III | | | | |
| Zoster | | recombinant | | Herpes Zoster prevention | | III | | | | |
| Flu (pre-) pandemic | | H5N1 inactivated split – monovalent (Quebec) | | pre-pandemic & pandemic influenza prophylaxis | | Submitted | | N/A | | S:Jun09
(Canada) |
Pumarix | | H5N1 inactivated split – monovalent (Quebec) | | pandemic influenza prophylaxis | | Submitted | | PO: Nov10 | | N/A |
| | | | | | | | | | |
GSK Annual Report 2010
200
Product development pipeline
| | | | | | | | | | |
|
| | | | | | | | | | Achieved Regulatory |
| | | | | | | | | | review milestones |
| Compound | | Type | | Indication | | Phase | | MAA | | NDA/BLA |
| |
| | | | | | | | | | |
| Antigen Specific Cancer Immunotherapeutic (ASCI) |
| PRAME | | recombinant | | treatment of metastatic melanoma | | I | | | | |
| PRAME | | recombinant | | treatment of resectable non-small cell lung cancer | | I | | | | |
| NY-ESO-1 | | recombinant | | treatment of metastatic melanoma | | I | | | | |
| WT1 | | recombinant | | treatment of acute myelogenous leukaemia | | II | | | | |
| MAGE-A3 | | recombinant | | treatment of melanoma | | III | | | | |
| MAGE-A3 | | recombinant | | treatment of non-small cell lung cancer | | III | | | | |
| | | | | | | | | | | |
| | | | | | | | | | | |
Dermatology (Stiefel), late stage assets onlyRare Diseases |
Duac low dose2402968† | | clindamycin/benzoyl peroxide gelantisense oligonucleotide | | acne vulgarisDuchenne muscular dystrophy | | III | | | | |
2696273† | | ex-vivo stem cell gene therapy | | adenosine deaminase severe combined immune deficiency (ADA-SCID) | | III | | | | |
migalastat HCl† | | pharmacological chaperone | | Fabry disease | | III | | | | |
| | | | | | | | | | |
| | | | | | | | | | |
| Stiefel (late stage assets only) |
| tazarotene foam | | retinoid foam | | acne vulgaris | | III | | | | |
calcipotrieneDuac low dose | | clindamycin/benzoyl peroxide gel | | acne vulgaris | | Submitted | | | | S: Nov10 |
Sorilux (calcipotriene foam) | | vitamin D3 analog | | mild to moderate plaque psoriasis | | SubmittedApproved | | | | S:Dec09A: Oct10 |
| itraconazole tablets | | oral anti-fungal | | onychomycosis | | SubmittedApproved | | | | S:Mar09A: Apr10 |
Veltin | | antibiotic/retinoid gel | | acne vulgaris | | SubmittedApproved | | | | S:Oct09A: Jul10 |
| | | | | | | | | | |
| | | | | | | | | | | |
| HIV (ViiV Healthcare) |
1265744† | | HIV integrase inhibitor (long-acting formulation) | | HIV infections | | III | | | | |
13495722248761† | | HIV integrase inhibitor | | HIV infections | | II | | | | |
2248761 (IDX899)† | | non-nucleotidenon-nucleoside reverse transcriptase inhibitor | | HIV infections | | II | | | | |
| PF-232798 | | CCR5 antagonist | | HIV infections | | II | | | | |
| UK-453061 | | non-nucleotidenon-nucleoside reverse transcriptase inhibitor | | HIV infections | | II | | | | |
Selzentry/Celsentri | | CCR5 antagonist1349572† | | HIV infection, use in treatment naive patientsintegrase inhibitor | | ApprovedHIV infections | | | | A:Nov09 |
|
Option-based alliances with third parties that include assets in Phase I and Phase II development
| | | | | | III | | | | |
Company1349572† + abacavir
sulphate + lamivudine | | Disease AreaHIV integrase inhibitor + reverse transcriptase
inhibitors (fixed dose combination) | | PhaseHIV infections | | III | | | | |
| | | | | | | | | | | |
Option-based alliances with third parties that include assets in Phase I or later development:
|
Anacor Pharmaceuticals | | anti-bacterial | | I | | | | | | |
| |
ChemoCentryx | | inflammatory disease* | |
| Company | | I & IIDisease Area | | Phase |
| | | | | |
|
Concert PharmaceuticalsCancer Research UK | | HIV (protease inhibitor)cancer | | I | |
| | | | | |
| ChemoCentryx | | inflammatory disease | | I* & II |
| | | | |
| Galapagos | | autoimmune disease | | II* |
| | | | | | |
|
NeuroSearch | | neuroscience (anxiety & pain) | | I | | | | | | |
| |
| OncoMed Pharmaceuticals | | oncology | | II* |
| | | | | | |
| |
| Prosensa Therapeutics | | neuroscience | | I |
| | | | | | |
| |
| Ranbaxy Laboratories | | respiratory | | I | |
| | | | | |
|
| Theravance | | gastrointestinalpain | | I | |
| | | | | |
| Telethon Institute for Gene Therapy | | stem cell gene therapy | | I & II |
| | | | |
| Affiris | | Alzheimer’s disease treatment vaccine | | II |
| | | | |
| Nabi | | nicotine vaccine | | III |
| | | | |
GSK Annual Report 2009
2010
193201
Shareholder information
The Ordinary Shares of the company are listed on the London Stock Exchange and on the New York Stock Exchange (NYSE) in the form of American Depositary Shares (ADS). For details of listed debt and where it is listed refer to Note 32, ‘Net debt’.
Share price
| | | | | | | | | | | | | | | | | | | | |
| Share price | | | | | | | | |
| | | 2009 | | 2008 | | 2007 | | | 2010 | | 2009 | | 2008 | |
| | | £ | | £ | | £ | | | £ | | £ | | £ | |
| At 1st January | | 12.85 | | 12.79 | | 13.44 | | | 13.20 | | 12.85 | | 12.79 | |
| High during the year | | 13.34 | | 13.85 | | 14.93 | | | 13.40 | | 13.34 | | 13.85 | |
| Low during the year | | 9.87 | | 9.95 | | 11.60 | | | 10.95 | | 9.87 | | 9.95 | |
| At 31st December | | 13.20 | | 12.85 | | 12.79 | | | 12.40 | | 13.20 | | 12.85 | |
| Increase/(decrease) | | | 2.7% | | | | 0.5% | | | | (5)% | | | | (6.1% | ) | | | 2.7% | | | | 0.5% | |
| | | | | | - | | | | | | | | |
The table above sets out the middle market closing prices. The company’s share price increaseddecreased by 2.7%6.1% in 2009.2010. This compares with an increase in the FTSE 100 index by 22%9% during the year. The share price on 19th24th February 20102011 was £12.35.£11.78.
Market capitalisation
The market capitalisation, based on shares in issue excluding Treasury shares, of GlaxoSmithKline at 31st December 20092010 was £69£64 billion. At that date GSK was the fifthsixth largest company by market capitalisation on the FTSE index.
SmithKline Beecham plc Floating Rate
Unsecured Loan Stock 1990/2010
The Loan Stock, iswhich was not listed on any exchange, but will bewas redeemed in its entirety at par, i.e. £1 for every £1 of loan stock held, on 1st June 2010.
Loan Stock holders will not be required to surrender their certificate(s) for this compulsory redemption, which will be made automatically at the due time, and a cheque in respect of the redemption value will be posted on 28th May 2010.
Taxation
General information concerning the UK and US tax effects of share ownership is set out on page 202 ‘Taxation information for shareholders’.
Dividends
GlaxoSmithKlineGSK pays dividends quarterly. It continues to increase cash returns to shareholders through its dividend policy. Dividends remain an essential component of total shareholder return and GSK is committed to increasing its dividend over the long-term. Details of the dividends declared, the amount and the payment dates are given in Note 16 to the financial statements, ‘Dividends’.
Dividends per share
The table below sets out the dividends per share in the last five years.
| | | | | |
| | | | | | | |
| Year | | pence | | | pence | |
| | | | |
| 2010 | | | 65 | |
| 2009 | | | 61 | | | 61 | |
| 2008 | | | 57 | | | 57 | |
| 2007 | | | 53 | | | 53 | |
| 2006 | | | 48 | | | 48 | |
| 2005 | | | 44 | | |
| | | | |
Dividends per ADS
The table below sets out the dividends per ADS in US dollars in the last five years, translated into US dollars at applicable exchange rates.
| | | | | |
| | | | | | | |
| Year | | US$ | | | US$ | |
| | | | |
| 2010 | | | 2.04 | |
| 2009 | | | 1.93 | | | 1.93 | |
| 2008 | | | 2.01 | | | 2.01 | |
| 2007 | | | 2.14 | | | 2.14 | |
| 2006 | | | 1.80 | | | 1.80 | |
| 2005 | | | 1.57 | | |
| | | | |
Dividend calendar
| | | | | | | | | | | | |
| Quarter | | Ex-dividend date | | | Record date | | | Payment date | |
| Q4 2010 | | 9th February 2011 | | | 11th February 2011 | | | 7th April 2011 | |
| Q1 2011 | | 4th May 2011 | | | 6th May 2011 | | | 7th July 2011 | |
| Q2 2011 | | 3rd August 2011 | | | 5th August 2011 | | | 6th October 2011 | |
| Q3 2011 | | 2nd November 2011 | | | 4th November 2011 | | | 5th January 2012 | |
| | | | | | | |
Q4 2009 | | 10th February 2010 | | 12th February 2010 | | 8th April 2010 |
Q1 2010 | | 5th May 2010 | | 7th May 2010 | | 8th July 2010 |
Q2 2010 | | 28th July 2010 | | 30th July 2010 | | 7th October 2010 |
Q3 2010 | | 27th October 2010 | | 29th October 2010 | | 6th January 2011 |
| | | | | | | |
Financial reporting calendar
| | | | | |
| |
| Publication | | Date | |
| |
| Results announcements | | | | |
| Quarter 1 | | April 20102011 | |
| Quarter 2 | | July 20102011 | |
| Quarter 3 | | October 20102011 | |
| Preliminary/Quarter 4 | | February 20112012 | |
| |
| Annual Report/Summary | | February/March 20112012 | |
| |
Results announcements
Results announcements are issued to the London Stock Exchange and are available on its news service. Shortly afterwards, they are issued to the media and sent to the US Securities and Exchange Commission and the NYSE.
Financial reports
GSK publishes an Annual Report and for the shareholder not needing the full detail of the Report, a Summary document. The Summary is sent to all shareholders. Shareholders may elect to receive the Annual Report by writing to the registrars. Alternatively shareholders may elect to receive notification by email of the publication of financial reports by registering on www.shareview.co.uk.
Copies of previous financial reports are available from the registrars in the UK and from the GSK Response Center in the USA.
Corporate responsibility report
In late March 2010, GSK will publish its Corporate Responsibility Report covering performance in areas including community investment, ethics and integrity, access to medicines, R&D and environment, health and safety.
GSK Annual Report 2009
2010
194202
Shareholder information
Corporate Responsibility Report
We will publish our 2010 Corporate Responsibilty Report online on 21st March 2011. This will outline GSK’s approach and performance on responsibility areas including access to medicines, research and business ethics, environmental sustainability and community investment.
Nature of trading market
The following tables set out, for the periods indicated, the high and low middle market closing quotations in pence for the shares on the London Stock Exchange, and the high and low last reported sales prices in US dollars for the ADS on the NYSE.
| | | | | | | | | |
| | | Pence per share | |
| | | High | | | Low | |
| |
| Quarter ended 31st March 2010* | | | 1340 | | | | 1196 | |
| February 2010* | | | 1245 | | | | 1196 | |
| January 2010 | | | 1340 | | | | 1217 | |
| December 2009 | | | 1334 | | | | 1280 | |
| November 2009 | | | 1290 | | | | 1219 | |
| October 2009 | | | 1281 | | | | 1219 | |
| September 2009 | | | 1252 | | | | 1176 | |
| Quarter ended 31st December 2009 | | | 1334 | | | | 1219 | |
| Quarter ended 30th September 2009 | | | 1252 | | | | 1063 | |
| Quarter ended 30th June 2009 | | | 1117 | | | | 987 | |
| Quarter ended 31st March 2009 | | | 1305 | | | | 1003 | |
| Quarter ended 31st December 2008 | | | 1285 | | | | 995 | |
| Quarter ended 30th September 2008 | | | 1327 | | | | 1103 | |
| Quarter ended 30th June 2008 | | | 1153 | | | | 1053 | |
| Quarter ended 31st March 2008 | | | 1385 | | | | 1001 | |
| Year ended 31st December 2007 | | | 1493 | | | | 1160 | |
| Year ended 31st December 2006 | | | 1577 | | | | 1326 | |
| Year ended 31st December 2005 | | | 1544 | | | | 1175 | |
| |
| |
| | | US dollars per ADS | |
| | | High | | | Low | |
| |
| Quarter ended 31st March 2010* | | | 42.97 | | | | 37.52 | |
| February 2010* | | | 39.49 | | | | 37.52 | |
| January 2010 | | | 42.97 | | | | 39.01 | |
| December 2009 | | | 42.91 | | | | 41.59 | |
| November 2009 | | | 42.88 | | | | 40.30 | |
| October 2009 | | | 41.91 | | | | 38.72 | |
| September 2009 | | | 39.67 | | | | 38.60 | |
| Quarter ended 31st December 2009 | | | 42.91 | | | | 38.72 | |
| Quarter ended 30th September 2009 | | | 40.03 | | | | 34.36 | |
| Quarter ended 30th June 2009 | | | 36.56 | | | | 29.11 | |
| Quarter ended 31st March 2009 | | | 39.24 | | | | 27.27 | |
| Quarter ended 31st December 2008 | | | 43.39 | | | | 32.02 | |
| Quarter ended 30th September 2008 | | | 49.03 | | | | 42.08 | |
| Quarter ended 30th June 2008 | | | 45.36 | | | | 41.39 | |
| Quarter ended 31st March 2008 | | | 54.36 | | | | 40.85 | |
| Year ended 31st December 2007 | | | 59.35 | | | | 47.87 | |
| Year ended 31st December 2006 | | | 58.38 | | | | 50.15 | |
| Year ended 31st December 2005 | | | 53.53 | | | | 44.48 | |
| |
| | | | | | | | | |
| | |
| | | Pence per share | |
| | | High | | | Low | |
| | |
| Quarter ended 31st March 2011* | | | 1270 | | | | 1128 | |
| February 2011* | | | 1200 | | | | 1128 | |
| January 2011 | | | 1270 | | | | 1129 | |
| December 2010 | | | 1277 | | | | 1231 | |
| November 2010 | | | 1262 | | | | 1212 | |
| October 2010 | | | 1319 | | | | 1221 | |
| September 2010 | | | 1290 | | | | 1249 | |
| Quarter ended 31st December 2010 | | | 1319 | | | | 1212 | |
| Quarter ended 30th September 2010 | | | 1290 | | | | 1095 | |
| Quarter ended 30th June 2010 | | | 1281 | | | | 1119 | |
| Quarter ended 31st March 2010 | | | 1340 | | | | 1196 | |
| Quarter ended 31st December 2009 | | | 1334 | | | | 1219 | |
| Quarter ended 30th September 2009 | | | 1252 | | | | 1063 | |
| Quarter ended 30th June 2009 | | | 1117 | | | | 987 | |
| Quarter ended 31st March 2009 | | | 1305 | | | | 1003 | |
| Year ended 31st December 2008 | | | 1385 | | | | 995 | |
| Year ended 31st December 2007 | | | 1493 | | | | 1160 | |
| Year ended 31st December 2006 | | | 1577 | | | | 1326 | |
| | |
* to 19th February 2010| | | | | | | | | |
| | |
| | | US dollars per ADS | |
| | | High | | | Low | |
| | |
| Quarter ended 31st March 2011* | | | 39.86 | | | | 36.33 | |
| February 2011* | | | 39.15 | | | | 36.98 | |
| January 2011 | | | 39.86 | | | | 36.33 | |
| December 2010 | | | 40.04 | | | | 38.66 | |
| November 2010 | | | 40.85 | | | | 38.28 | |
| October 2010 | | | 41.86 | | | | 39.04 | |
| September 2010 | | | 40.47 | | | | 38.78 | |
| Quarter ended 31st December 2010 | | | 41.86 | | | | 38.28 | |
| Quarter ended 30th September 2010 | | | 40.47 | | | | 33.78 | |
| Quarter ended 30th June 2010 | | | 39.57 | | | | 32.34 | |
| Quarter ended 31st March 2010 | | | 42.97 | | | | 37.03 | |
| Quarter ended 31st December 2009 | | | 42.91 | | | | 38.72 | |
| Quarter ended 30th September 2009 | | | 40.03 | | | | 34.36 | |
| Quarter ended 30th June 2009 | | | 36.56 | | | | 29.11 | |
| Quarter ended 31st March 2009 | | | 39.24 | | | | 27.27 | |
| Year ended 31st December 2008 | | | 54.36 | | | | 32.02 | |
| Year ended 31st December 2007 | | | 59.35 | | | | 47.87 | |
| Year ended 31st December 2006 | | | 58.38 | | | | 50.15 | |
| | |
Taxation
General information concerning the UK and US tax effects of share ownership is set out on page 210 ‘Taxation information for shareholders’.
Annual General Meeting 20102011
The Queen Elizabeth II Conference Centre, 6th May 2010
Broad Sanctuary, Westminster,
London SW1P 3EE
| | | | |
|
| The Queen Elizabeth II Conference Centre, 5th May 2011 | | | | |
| Broad Sanctuary, Westminster, | | | | |
| London SW1P 3EE | | | | |
|
The AGM is the company’s principal forum for communication with private shareholders. In addition to the formal business there will be a presentation by the Chief Executive Officer on the performance of the Group and its future development. There will be opportunity for questions to the Board, and the Chairmen of the Board’s Committees will take questions on matters relating to those committees.
Investors holding shares through a nominee service should arrange with that nominee service to be appointed as a corporate representative or proxy in respect of their shareholding in order to attend and vote at the meeting.
ADR holders wishing to attend the meeting must obtain a proxy from The Bank of New York Mellon which will enable them to attend and vote on the business to be transacted. ADR holders may instruct The Bank of New York Mellon as to the way in which the shares represented by their ADR should be voted by completing and returning the voting card provided by the bank in accordance with the instructions given.
Documents on display
The Memorandum and Articles of Association of the company and other documents referred to in this Annual Report are available for inspection at the Registered Office of the company.
Exchange controls and other limitations
affecting security holders
There are currently no UK laws, decrees or regulations restricting the import or export of capital or affecting the remittance of dividends or other payments to holders of the company’s shares who are non-residents of the UK. There are no limitations relating only to non-residents of the UK under English law or the company’s Memorandum and Articles of Association on the right to be a holder of, and to vote in respect of, the company’s shares.
GSK Annual Report 2009
195
Shareholder information
Duplicate publications
Queries relating to receipt of duplicate copies of GSK’s publications should be addressed to the registrars.
Investor relations
Investor Relationsrelations may be contacted as follows:
UK
980 Great West Road, Brentford, Middlesex TW8 9GS
Tel: +44 (0)20 8047 5000
USA
One Franklin Plaza, PO Box 7929, Philadelphia PA 19101
Tel: 1 888 825 5249 (US toll free)
Tel: +1 215 751 4000 (outside the USA)
GSK Annual Report 2010
203
Shareholder information
Registrar
The company’s registrars are:
Equiniti Limited
Aspect House, Spencer Road, Lancing, West Sussex BN99 6DA
www.shareview.co.uk
Tel: 0871 384 2991 inside(inside the UKUK)
Tel: +44 (0)121 415 7067 outside(outside the UKUK)
Lines are open from 8.30am to 5.30pm, Monday to Friday.
Equiniti also provides the following services:
Nominee dealing account and Individual Savings Account (ISA)
GlaxoSmithKline Corporate Sponsored Nominee
Dividend Reinvestment Plan
| • | | Nominee dealing account and Individual Savings Account (SA) |
|
| • | | GlaxoSmithKline Corporate Sponsored Nominee |
|
| • | | Shareview service |
|
| • | | Share dealing service |
|
| • | | Dividend Reinvestment Plan. |
Share dealing service
Shareholders may trade shares, either held in certificates or in the Corporate Sponsored Nominee by internet or telephone through Shareview Dealing, a share dealing service provided by Equiniti Financial Services Limited. For internet deals log on to www. shareview.co.uk/www.shareview.co.uk/dealing. For telephone deals call 08456 037 037 (inside the UK only).
For the nomineeInvestment Account and ISA service, either www.shareview.co.uk/dealing or call 0845 300 0430. Telephone services are available between 8.00 and 18.00,8.00am to 6.00pm, Monday to Friday (market trading hours 8.00 –16.30)8.00am to 4.30pm).
Glaxo Wellcome and SmithKline Beecham
Corporate PEPs
The Share Centre Limited
Oxford House, Oxford Road, Aylesbury, Bucks HP21 8SZ
Tel: +44 (0)1296 414141
ADR programme administrator
The ADR programme is administered by:
BNY Mellon Shareowner Services
PO Box 358516
Pittsburgh, PA 15252-8516
www.bnymellon.com/shareowner
Tel: 1 877 353 1154 (US toll free)
Tel: +1 201 680 6825 (outside the USA)
email: shrrelations@bnymellon.com
The administrators also provide Global BuyDIRECT, a direct ADS purchase/sale and dividend reinvestment plan for ADR holders.
GSK Response Center
Tel: 1 888 825 5249 (US toll free)
The provision of the details above is not intended to be an invitation or inducement to engage in an investment activity. Advice on share dealing should be obtained from a stockbroker or independent financial adviser.
Analysis of shareholdings at 31st December 2010
| | | | | | | | | | | | | | | | | |
| | | | | | | | | | | |
| | | Number of | | | % of total | | | % of total | | | Number of | |
| | | accounts | | | accounts | | | shares | | | shares | |
| | | | | | | | | | | |
Holding of shares | | | | | | | | | | | | | | | | |
| Up to 1,000 | | | 112,292 | | | | 71 | | | | 1 | | | | 41,170,410 | |
| 1,001 to 5,000 | | | 35,996 | | | | 23 | | | | 1 | | | | 77,156,810 | |
| 5,001 to 100,000 | | | 8,144 | | | | 5 | | | | 2 | | | | 117,679,956 | |
| 100,001 to 1,000,000 | | | 827 | | | | 1 | | | | 5 | | | | 302,361,401 | |
| Over 1,000,000 | | | 411 | | | | – | | | | 91 | | | | 5,132,089,600 | |
| | | | | | | | | | | |
| | | | 157,670 | | | | 100 | | | | 100 | | | | 5,670,458,177 | |
| | | | | | | | | | | |
Held by | | | | | | | | | | | | | | | | |
| Nominee companies | | | 28,100 | | | | 18 | | | | 74 | | | | 4,195,447,676 | |
| Investment and trust companies | | | 39 | | | | – | | | | – | | | | 1,626,510 | |
| Insurance companies | | | 8 | | | | – | | | | – | | | | 4,834 | |
| Individuals and other corporate bodies | | | 129,521 | | | | 82 | | | | 5 | | | | 252,304,068 | |
| BNY (Nominees) Limited | | | 1 | | | | – | | | | 13 | | | | 746,880,931 | |
| Held as Treasury shares by GlaxoSmithKline | | | 1 | | | | – | | | | 8 | | | | 474,194,158 | |
| | | | | | | | | | | |
| | | | 157,670 | | | | 100 | | | | 100 | | | | 5,670,458,177 | |
| | | | | | | | | | | |
The Bank of New York Mellon’s holding held through BNY (Nominees) Limited represents the company’s ADR programme, whereby each ADS represents two Ordinary Shares of 25p nominal value. At 24th February 2011, BNY (Nominees) Limited held 752,137,377 Ordinary Shares representing 14.50% of the issued share capital excluding Treasury shares at that date.
At 24th February 2011, the number of holders of shares in the USA was 1,118 with holdings of 1,314,614 shares, and the number of registered holders of the ADR was 32,203 with holdings of 376,067,688 ADR. Certain of these shares and ADR were held by brokers or other nominees. As a result the number of holders of record or registered holders in the USA is not representative of the number of beneficial holders or of the residence of beneficial holders.
GSK Annual Report 2009
2010
196204
Taxation information for shareholders
A summary of certain UK tax and US federal income tax consequences for certain holders of shares and ADR who are citizens of the UK or the USA is set out below. It is not a complete analysis of all the possible tax consequences of the purchase or ownership of these securities. It is intended only as a general guide. Holders are advised to consult their advisers with respect to the tax consequences of the purchase and ownership of their shares or ADR, and the consequences under state and local tax laws in the USA and the implications of the current UK/US Income Tax convention.
US holders of ADR generally will be treated as the owners of the underlying shares for the purposes of the current USA/UK double taxation conventions relating to income and gains (Income Tax Convention), estate and gift taxes (Estate and Gift Tax Convention) and for the purposes of the US Internal Revenue Code of 1986, as amended (the Code).
UK shareholders
This summary only applies to a UK resident shareholder that holds shares as capital assets.
Taxation of dividends
UK resident individual shareholders will generally be subject to UK income tax on the full amount of dividends paid, grossed up for the amount of a one ninth dividend tax credit. The tax credit may be set against the individual’s income tax liability in respect of the gross dividend, but is not repayable to shareholders with a tax liability of less than the associated tax credit. For the tax year 2010-11 and subsequent tax years, an additional rate of income tax on dividends will beis imposed for taxpayers whose income is above £150,000. UK resident shareholders that are corporation taxpayers should note that dividends paid after 1st July 2009 are generally entitled to exemption from corporation tax under new rules.tax. If shareholders are in any doubt as to their position, they should consult their own professional advisers.
Taxation of capital gains
UK shareholders may be liable for UK tax on gains on the disposal of shares or ADR. For disposals by individuals, a capital gain will be taxed at a flat rate of 18%,and subject to the availability of any exemption or relief such as the annual exempt amount.amount a taxable capital gain accruing on a disposal of shares or ADR will be taxed at 28% if, after all allowable deductions, such shareholder’s taxable income for the tax year exceeds the basic rate income tax limit. In other cases, a taxable capital gain accruing on a disposal of shares or ADR may be taxed at 18% or 28% or at a combination of both rates. Corporation taxpayers may be entitled to an indexation allowance which applies to reduce capital gains to the extent that such gains arise due to inflation. Indexation allowance may reduce a chargeable gain but will not create an allowable loss.
Inheritance tax
Individual shareholders may be liable to inheritance tax on the transfer of shares or ADR. Tax may be charged on the amount by which the value of the shareholder’s estate is reduced as a result of any transfer by way of gift or other disposal at less than full market value.
If such a gift or other disposal were subject to both UK inheritance tax and US estate or gift tax, the Estate and Gift Tax Convention would generally provide for tax paid in the USA to be credited against tax payable in the UK.
Stamp duty
UK stamp duty or stamp duty reserve tax (SDRT) will, subject to certain exemptions, be payable on the purchasetransfer of shares at a rate of 0.5% of the purchase price.consideration for the transfer.
US shareholders
This summary only applies to a shareholder (a citizen or resident of the USA or a domestic corporation or a person that is otherwise
subject to US federal income tax on a net income basis in respect of the shares or ADR) that holds shares or ADR as capital assets, is not resident in the UK for UK tax purposes and does not hold shares for the purposes of a trade, profession or vocation that is carried on in the UK through a branch or agency. The summary also does not address the tax treatment of holders that are subject to special tax rules, such as banks, tax-exempt entities, insurance companies, dealers in securities or currencies, persons that hold shares or ADR as part of an integrated investment (including a ‘straddle’) comprised of a share or ADR and one or more other positions, and persons that own (directly or indirectly) 10% or more of the voting stock of GSK.
Taxation of dividends
The gross amount of dividends received is treated as foreign source dividend income for US tax purposes. It is not eligible for the dividend received deduction allowed to US corporations. Dividends on ADR are payable in US dollars; dividends on shares are payable in Sterling. Dividends paid in pounds Sterling will be included in income in the US dollar amount calculated by reference to the exchange rate on the day the dividends are received by the holder. Subject to certain exceptions for short-term or hedged positions, an individual eligible US holder will be subject to US taxation at a maximum rate of 15% in respect of qualified dividends received before 2011.2013.
Taxation of capital gains
Generally, US holders will not be subject to UK capital gains tax, but will be subject to US tax on capital gains realised on the sale or other disposal of shares or ADR. Such gains will be long-term capital gains (subject to reduced rates of taxation for individual holders) if the shares or ADR were held for more than one year.
Information reporting and backup withholding
Dividends and payments of the proceeds on a sale of shares or ADR, paid within the USA or through certain US-related financial intermediaries are subject to information reporting and may be subject to backup withholding unless the US holder is a corporation or other exempt recipient or provides a taxpayer identification number and certifies that no loss of exemption has occurred. Non-US holders generally are not subject to information reporting or backup withholding, but may be required to provide a certification of their non-US status in connection with payments received. Any amounts withheld will be allowed as a refund or credit against a holder’s US federal income tax liability provided the required information is furnished to the IRS.
Estate and gift taxes
Under the Estate and Gift Tax Convention, a US shareholder is not generally subject to UK inheritance tax.
Stamp duty
UK stamp duty or SDRT will, subject to certain exemptions, be payable on any issue or transfer of shares to the ADR custodian or depository at a rate of 1.5% of their price (if issued), the amount
of any consideration provided (if transferred on sale), or their value (if transferred for no consideration).
No SDRT would be payable on the transfer of, or agreement to transfer an ADR. No UK stamp duty should be payable on the transfer of an ADR provided that any instrument of transfer is executed and remains at all times outside the UK. Any stamp duty on the transfer of an ADR would be payable at a rate of 0.5% of the consideration for the transfer. Any sale of the underlying shares would, subject to certain exceptions, result in liability to UK stamp duty or, as the case may be, SDRT at a rate of 0.5%.
GSK Annual Report 2009
2010
197205
Glossary of terms
| | |
| | | |
| Terms used in the Annual Report | | US equivalent or brief description |
| | | |
| Accelerated capital allowances | | Tax allowance in excess of depreciation arising from the purchase of fixed assets that delay the charging and payment of tax. The US equivalent of tax depreciation. |
| | | |
| | |
| | |
| American Depositary Receipt (ADR) | | Receipt evidencing title to an ADS. Each GlaxoSmithKline ADR represents two Ordinary Shares. |
| | |
| | |
| | | |
| American Depositary Shares (ADS) | | Listed on the New York Stock Exchange; represents two Ordinary Shares. |
| | | |
| | |
| | |
| Basic earnings per share | | Basic income per share. |
| | |
| | |
| | | |
| Called-up share capital | | Ordinary Shares, issued and fully paid. |
| | | |
| | |
| | |
| CER growth | | Growth at constant exchange rates. |
| | |
| | |
| | | |
| Combined Code | | Guidelines required by the Listing Rules of the Financial Services Authority to address the principal aspects of Corporate Governance. |
| | | |
| | |
| | |
| The company | | GlaxoSmithKline plc. |
| | |
| | |
| | | |
| Currency swap | | An exchange of two currencies, coupled with a subsequent re-exchange of those currencies, at agreed exchange rates and dates. |
| | | |
| | |
| | |
| Defined benefit plan | | Pension plan with specific employee benefits, often called ‘final salary scheme’. |
| | |
| | |
| | | |
| Defined contribution plan | | Pension plan with specific contributions and a level of pension dependent upon the growth of the pension fund. |
| | | |
| | |
| | |
| Derivative financial instrument | | A financial instrument that derives its value from the price or rate of some underlying item. |
| | | |
| | |
| | |
| Diluted earnings per share | | Diluted income per share. |
| | |
| | |
| | | |
| Employee Share Ownership Plan Trusts | | Trusts established by the Group to satisfy share-based employee incentive plans. |
| | | |
| | |
| | |
| Finance lease | | Capital lease. |
| | |
| | |
| | | |
| Freehold | | Ownership with absolute rights in perpetuity. |
| | |
| | |
| | | |
| Gearing ratio | | Net debt as a percentage of total equity. |
| | | |
| | |
| | |
| The Group | | GlaxoSmithKline plc and its subsidiary undertakings. |
| | |
| | |
| | | |
| Hedging | | The reduction of risk, normally in relation to foreign currency or interest rate movements, by making off-setting commitments. |
| | |
| | |
| | | |
| Intangible fixed assets | | Assets without physical substance, such as computer software, brands, licences, patents, know-how and marketing rights purchased from outside parties. |
| | | |
Non-equity minority interest | | Preference shares issued by a subsidiary to outside parties. |
| | | |
Preference shares | | Shares issued at varying dividend rates that are treated as outside interests. |
| | | |
| Profit | | Income. |
| | | |
| | |
| | |
| Profit attributable to shareholders | | Net income. |
| | |
| | |
| | | |
| Share capital | | Ordinary Shares, capital stock or common stock issued and fully paid. |
| | | |
| | |
| | |
| Shareholders’ funds | | Shareholders’ equity. |
| | | |
| | |
| | |
| Share option | | Stock option. |
| | |
| | |
| | | |
| Share premium account | | Additional paid-up capital or paid-in surplus (not distributable). |
| | | |
| | |
| | |
| Shares in issue | | The number of shares outstanding. |
| | |
| | |
| | | |
| Subsidiary | | An entity in which GlaxoSmithKline holds a majority shareholding and/or exercises control. |
| | | |
| | |
| | |
| Treasury share | | Treasury stock. |
| | |
| | |
| | | |
| Turnover | | Revenue. |
| | | |
| | |
GSK Annual Report 20092010
198206
Memorandum and Articles of Association of GlaxoSmithKline
The following is a summary of the principal provisions of the company’s Memorandum of Association (the “Memorandum”) and Articles of Association (the “Articles”). Shareholders should not rely on this summary, but should instead refer to the current Memorandum and Articles which are filed with the Registrar of Companies in the UK and can be viewed on the company’s website.UK. The Memorandum containsArticles contain the fundamental provisions of the company’s constitution. The Articles containconstitution, and the rules for the internal management and control of the company.
Memorandum The company has no statement of objects in its Articles of Association
The Memorandum provides that the company’s principal and accordingly its objects are among other things, to beunrestricted in accordance with the holding companyprovisions of Glaxo Wellcome plc and SmithKline Beecham plc, to carry on business as a general commercial company and to carry on any trade or business or activity of any nature which may seem to the Directors to be capable of being conveniently or advantageously carried on.Companies Act 2006.
Articles of Association
(a) Voting
All resolutions put to the vote at general meetings will be decided by poll. On a poll, every shareholder who is present in person or by proxy shall have one vote for every Ordinary Share of which he or she is the holder. In the case of joint holders of a share, the vote of the senior who tenders a vote, whether in person or by proxy, shall be accepted to the exclusion of the votes of the other joint holders, and seniority shall be determined by the order in which the names stand on the register. Unless the Directors otherwise decide, the right to attend a general meeting and voting rights may not be exercised by a shareholder who has not paid to the company all calls and other sums then payable by him or her in respect of his or her Ordinary Shares. The right to attend a general meeting and voting rights may not be exercised by a shareholder who is subject to an order under Section 794 of the Companies Act 2006 because he or she has failed to provide the company with information concerning his or her interests in Ordinary Shares within the prescribed period, as required by Section 793 of the Companies Act 2006.
(b) Transfer of Ordinary Shares
Any shareholder may transfer his or her Ordinary Shares which are in certificated form by an instrument of transfer in any usual form or in any other form which the Directors may approve. Such instrument must be properly signed, stamped or certified and lodged with the company together with the relevant share certificate(s) and such other evidence as the Directors may reasonably require to show the right of the transferor to make the transfer. Every
Any member may transfer oftitle to his or her uncertificated Ordinary Shares which are in uncertificated form must be carried out by means of a relevant system, such as CREST.
The transferor of a share is deemed to remain the holder until the transferee’s name is entered on the register.
The Directors may in their absolute discretion and without giving any reason, decline to register any transfer of any Ordinary Share which is not fully paid.
Registration of a transfer of uncertificated Ordinary Shares may be refused in the circumstances set out in the uncertificated securities rules, and where, in the case of a transfer to joint holders, the number of joint holders to whom the uncertificated Ordinary Share is to be transferred exceeds four.
The Articles contain no other restrictions on the transfer of fully paid certificated Ordinary Shares provided: (i) the instrument of transfer is duly stamped or certified or otherwise shown to the satisfaction of the Directors to be exempt from stamp duty and is accompanied by the relevant share certificate and such other evidence of the right to transfer as the Directors may reasonably require; (ii) the transfer, if to joint transferees, is in favour of not more than four transferees; (ii) the instrument of transfer is in respect of only one class of shares; and (iii) the holder of the Ordinary Shares is not subject to an order under Section 794 of the Companies Act 2006. Notice of refusal to register a transfer must be sent to the transferee within two months of the instrument of transfer being lodged. The Directors may decline to register a transfer of Ordinary Shares by a person holding 0.25 per cent. or more of the existing Ordinary Shares if such person is subject to an order under Section 794 Companies Act 2006, after failure to provide the company with information concerning interests in those Ordinary Shares required to be provided under Section 793 of the Companies Act 2006, unless the transfer is carried out pursuant to an arm’s length sale.
Provisions in the Articles will not apply to uncertificated Ordinary Shares to the extent that they are inconsistent with:
| (i) | | the holding of sharesOrdinary Shares in uncertificated form; |
|
| (ii) | | the transfer of title to Ordinary Shares by means of a system such as CREST; and |
|
| (iii) | | any provisions of the relevant regulations. |
(c) Dividends and distribution of assets on liquidation
The profits of the company which are available for distribution and permitted by law to be distributed and which the company may by ordinary resolution from time to time determine,declare, upon the recommendation of the Directors, to distribute by way of dividend, in respect of any accounting reference period shall be distributed by way of dividend among holders of Ordinary Shares.
If in their opinion the company’s financial position justifies such payments, the Directors may, as far as any applicable legislation allows, pay interim dividends on shares of any class of such amounts and in respect of such periods as they think fit. Except in so far as the rights attaching to, or the terms of issue of, any share otherwise provide, all dividends will be declared, apportioned and paid pro rata according to the amounts paid up on the shares during any portion of the period in respect of which the dividend is paid. As the company has only one class of Ordinary Shares, the holders of such Ordinary Shares will under general law be entitled to participate in any surplus assets in a winding-up in proportion to their shareholdings.
GSK Annual Report 2009
199
Memorandum and Articles of Association of GlaxoSmithKline
(d) Variation of rights and changes in capital
Subject to the provisions of the Companies Act 2006 andany statute (including any orders, regulations or other subordinate legislation made under it) from time to time in force concerning companies in so far as it applies to the terms of issue of the shares concerned,company (the “Companies Acts”), the rights attached to any class of shares may be varied with the written consent of the holders of three-quarters in nominal value of the issued shares of that class (excluding any shares of that class held as treasury shares) or with the sanction of a special resolution passed at a separate meeting of the holders of shares of that class. At every such separate meeting, the provisions of the Articles relating to general meetings shall apply, except the necessary quorum shall be at least two persons holding or representing as proxy at least one-third in nominal value of the issued shares of the relevant class (but provided that at any adjourned meeting any holder of shares of the relevant class present in person or by proxy shall be a quorum).
GSK Annual Report 2010
207
Articles of Association of GlaxoSmithKline
The company may by ordinary resolution increase its share capital, consolidate, or consolidate then sub-divide all, or any of its shares into shares of a larger nominal amount, cancel any shares not taken or agreed to be taken by any person and, subject to the provisions of the Companies Act 2006, sub-divide its shares into shares of a smaller nominal amount. The company may, subject to the provisions of the Companies Act 2006, by special resolution reduce its share capital or any capital redemption reserve, share premium account or other undistributable reserve. The company may also, subject to the provisions of the Companies Act 2006 and the rights of any ofconferred upon the holders of any classOrdinary Shares shall not, unless otherwise expressly provided in the rights attaching to those Ordinary Shares, be deemed to be varied by the creation or issue of further shares purchase its own shares.ranking pari passu with them.
(e) Unclaimed dividends
All dividends or other sums payable on or in respect of any Ordinary Shares which remain unclaimed may be invested or otherwise made use of by the Directors for the benefit of the company until claimed. Unless the Directors decide otherwise, any dividend or other sums payable on or in respect of any Ordinary Shares unclaimed after a period of 12twelve years from the date when a resolution was passeddeclared or became due for payment will be forfeited and revert to the company. The company may stop sending dividend cheques or warrants by post, or employ such other means of payment in respect of any Ordinary Shares, if at least two consecutive payments have remained uncashed or are returned undelivered or if one payment has remained uncashed or is returned undelivered and the company cannot establish a new address for the holder after making reasonable enquiries; however, in either case, the company must resume sending cheques or warrants or employ such other means of payment if the holder or any person entitled to the Ordinary Shares by transmission requests the resumption.
(f) Untraced shareholders
The company may sell any Ordinary Shares in the company after advertising its intention and waiting for three months if the Ordinary Shares have been in issue for at least ten years and during that period at least three dividends have become payable on them and have not been claimed and, so far as any Director is aware, the company has not received any communication from the holder of the Ordinary Shares or any person entitled to them by transmission. Upon any such sale, the company will become indebted to the former holder of the Ordinary Shares or the person entitled to them by transmission for an amount equal to the net proceeds of sale.
(g) Limitations on rights of non-resident or foreign shareholders
There are no limitations imposed by the Articles on the rights of non-resident or foreign shareholders except that there is no requirement for the company to serve notices on shareholders outside the United Kingdom and the United States.States, if no address in the United States or United Kingdom has been provided to the company.
(h) General meetings of shareholders
The Articles rely on the Companies Act 2006 provisions dealing with the calling of general meeting. The company is required by the Companies Act 2006 to hold an annual general meeting each year. General meetings of shareholders may be called as necessary by the Directors and must be called promptly upon receipt of a requisition from shareholders. Under the Companies Act 2006, an annual general meeting must be called by notice of at least twenty one days. A general meeting other than an annual general meeting may be called on not less than 14fourteen clear days’ notice provided a special resolution reducing the notice period to 14fourteen clear days has been passed at the immediately preceding annual general meeting or a general meeting held since that annual general meeting.
(i) Conflicts of interest
The Directors may, subject to the provisions of the Articles, authorise any matter which would otherwise involve a Director breaching his or her duty under the Companies Act 2006Acts to avoid conflicts of interest (each a “Conflict”). A Director seeking authorisation in respect of a Conflict shall declare to the other Directors the nature and extent of his or her Conflict as soon as is reasonably practicable.practicable and shall provide the other Directors with such details of the matter as are necessary to decide how to address the Conflict. The board may resolve to authorise the relevant Director in relation to any matter the subject of a Conflict, save that the relevant Director and any other Director with a similar interest shall not count towards the quorum nor vote on any resolution giving such authority, and, if the other Directors so decide, shall be excluded from any meeting of the Directors while the Conflict is under consideration.
(j) Other Conflicts of Interestinterest
Subject to the provisions of the Companies Act 2006,Acts, and provided the nature and extent of a Director’s interest has been declared to the Directors, a Director is not disqualified by that Office from contracting with the companymay:
| (i) | | be party to, or otherwise interested in, any manner, nor is any contract with the company, or in which the company has a direct or indirect interest, |
|
| (ii) | | hold any other office or place of profit with the company (except that of auditor) in conjunction with his office of director for such period and upon such terms, including remuneration, as the Directors may decide; |
|
| (iii) | | act by himself or through a firm with which he is associated in a professional capacity for the company or any other company in which the company may be interested (otherwise than as auditor); |
|
| (iv) | | be or become a director of, or employed by, or otherwise be interested in any holding company or subsidiary company of the company or any other company in which the company may be interested; and |
|
| (v) | | be or become a director of any other company in which the company does not have an interest and which cannot reasonably be regarded as giving rise to a conflict of interest at the time of his appointment as director of that other company. |
No contract in which he or shea Director is interested shall be liable to be avoided, and any Director who is so interested is not liable to account to the company or its shareholders for any benefit realised by the contract by reason of the Director holding that Officeoffice or of the fiduciary relationship thereby established. However, no Director may vote on, or be counted in the quorum in relation to any resolution of the board relating specifically to his or her own appointment (including remuneration) or the terms of his or her termination of appointment or relating to any contract in which he or she has an interest (subject to certain exceptions).
A Director may (or any firm of which he or she is a partner, employee or shareholder may) act in a professional capacity forSubject to the company (other than as auditor) and be remunerated for so doing. A Director may also hold any other Office with the company (other than auditor) or be or become director or other Officer of, or be otherwise interested in, any holding company or subsidiary of the company or in whichCompanies Acts, the company may be interested and willby ordinary resolution suspend or relax to any extent the provisions relating to directors’ interests or restrictions on voting or ratify any transaction not be liable to account to the company or its shareholders for any benefit receivedduly authorised by him or her.reason of a contravention of such provisions.
GSK Annual Report 20092010
200208
Memorandum and Articles of Association of GlaxoSmithKline
(k) Directors’ remuneration
Each of the Directors will be paid a fee at such rate as may from time to time be determined by the Directors.Directors, but the total fees paid to all of the Directors for acting as Directors (including amounts paid to any Director who acts as chairman or is chairman of, or serves on any committee of the Board of Directors but excluding any amounts paid under any other provision of the Articles) shall not exceed the higher of: (i) £3 million a year; and (ii) any higher amount as the company may by ordinary resolution decide. Such fees may be satisfied in cash or in shares or any other non-cash form. Any Director who is appointed to any executive Office,office, acts as Chairman,chairman, acts as senior independent director, acts as a scientific/medical expert on the board, serves on any committee of the Directors or performs any other services which the Directors consider to extend beyond the ordinary services of a Director shall be entitled to receive such remuneration (whether by way of salary, commission or otherwise) as the Directors may decide. Each Director may be paid reasonable travelling, hotel and other incidental expenses he or she incurs in attending and returning from meetings of the Directors or committees of the Directors, or general meetings of the company, or otherwise incurred in connection with the performance of his or her duties for the company.
(l) Pensions and gratuities for Directors
The Directors or any committee authorised by the Directors may provide benefits by the payment of gratuities, pensions or insurance or in any other allowances or benefitsmanner for any Director or former Director or their relations, connected persons or dependants.dependants, but no benefits (except those provided for by the Articles) may be granted to or in respect of a Director or former Director who has not been employed by or held an executive office or place of profit under the company or any of its subsidiary undertakings or their respective predecessors in business without the approval of an ordinary resolution of the company.
(m) Borrowing powers
Subject to the provisions of the Companies Act 2006, the Directors may exercise all the company’s powers to borrow money; to mortgage or charge all or any of the company’s undertaking, property (present and future), and uncalled capital; to issue debentures and other securities; and to give security either outright or as collateral security for any debt, liability or obligation of the company or of any third party.
(n) Retirement and removal of Directors
A Director is subject to re-election at every annual general meeting of the company if he or she: (i) held Officeoffice at the time of the two previous annual general meetings and did not retire by rotation at either of them; (ii) has held Officeoffice for a continuous period of nine years or more; or (iii) he or she has been appointed by the Directors since the last annual general meeting.
The company may by special resolution remove any Director before the expiration of his or her period of Office.office. No Director is required to retire by reason of his or her age, nor do any special formalities apply to the appointment or re-election of any Director who is over any age limit. No shareholding qualification for Directors shall be required.
(o) Vacation of office
The office of a director shall be vacated if:
| (i) | | he resigns or offers to resign and the board resolves to accept such offer; |
|
| (ii) | | his resignation is requested by all of the other directors and all of the other directors are not less than three in number; |
|
| (iii) | | he is or has been suffering from mental or physical ill health and the board resolves that his office be vacated; |
|
| (iv) | | he is absent without permission of the board from meetings of the board (whether or not an alternate director appointed by him attends) for six consecutive months and the board resolves that his office is vacated; |
|
| (v) | | he becomes bankrupt or compounds with his creditors generally; |
|
| (vi) | | he is prohibited by law from being a director; |
|
| (vii) | | he is removed from office pursuant to the Articles or the Companies Acts. |
(p) Share rights
Subject to any rights attached to existing shares, shares may be issued with such rights and restrictions as the company may by ordinary resolution decide, or, if there is no such resolution or so far as it does not make specific provision, as the board may decide. Such rights and restrictions shall apply as if they were set out in the Articles. Redeemable shares may be issued, subject to any rights attached to existing shares. The board may determine the terms, conditions and manner of redemption of any redeemable share so issued. Such terms and conditions shall apply to the relevant shares as if they were set out in the Articles. Subject to the Articles, any resolution passed by the shareholders and other shareholders’ rights, the Board may decide how to deal with any shares in the company.
GSK Annual Report 2009
2010
201209
Comparison of New York Stock Exchange Corporate Governance
Standards and GlaxoSmithKline plc’s corporate governance practice
On 4th November 2003, the New York Stock Exchange (the “NYSE”) adopted new corporate governance standards. The application of the NYSE’s standards is restricted for foreign companies, recognising that they have to comply with domestic requirements. As a foreign private issuer, GlaxoSmithKline plc (“GlaxoSmithKline” or the “Company”) must comply with the following NYSE standards:
| 1. | | the Company must satisfy the audit committee requirements of the Securities and Exchange Commission (the “SEC”); |
|
| 2. | | the Chief Executive Officer (the “CEO”) must promptly notify the NYSE in writing after any executive Officerofficer of the Company becomes
aware of any non-compliance with any applicable provisions of the NYSE’s corporate governance standards; |
|
| 3. | | the Company must submit an annual affirmation to the NYSE affirming GlaxoSmithKline’s compliance with applicable NYSE corporate governance standards, and submit interim affirmations to the NYSE notifying it of specified changes to the audit committee or a change to
the status of the Company as a foreign private issuer; and |
|
| 4. | | the Company must provide a brief description of any significant differences between its corporate governance practices and those followed by US companies under the NYSE listing standards. |
As a companyCompany listed on the London Stock Exchange, GlaxoSmithKline is required to comply with the UK Listing Authority Listing Rules and to report non-compliance with the UK Corporate Governance Code, which came into effect for the Company from 1st January 2011, formerly the Combined Code on Corporate Governance (the “Combined“UK Corporate Governance Code”).
The table below discloses differences between GlaxoSmithKline’s current domestic corporate governance practices, which are based on the UK Corporate Governance Code that came into effect from 1st January 2011 and which therefore differs in certain respects from GlaxoSmithKline’s practices during 2010, and the NYSE corporate governance standards applicable to US companies.
NYSE
Corporate Governance Standards
Description of differences between GlaxoSmithKline’s governance
practice and the NYSE Corporate Governance Standards
Director Independence
1. | | |
|
| NYSE | | Description of differences between GlaxoSmithKline’s governance |
| Corporate Governance Standards | | practice and the NYSE Corporate Governance Standards |
|
| | |
Director Independence | | |
| | |
1.Listed companies must have a majority of independent directors. | | GlaxoSmithKline complies with the equivalent domestic requirements contained in the UK Corporate Governance Code (formerly the Combined Code). A new edition of the UK Corporate Governance Code, for reporting years beginning on or after 29th June 2010 was issued in June 2010. |
| | |
| | The UK Corporate Governance Code provides that the board of directors of GlaxoSmithKline (the “Board”) and its committees should have the appropriate balance of skills, experience, independence and knowledge of the company to enable them to discharge their respective duties and responsibilities effectively (B.1). The Board should include an appropriate combination of Executive and Non-Executive Directors (and, in particular, independent Non-Executive Directors) such that no individual or small group of individuals can dominate the Board’s decision taking (B.1). At least half the Board, excluding the Chairman, should comprise Non-Executive Directors determined by the Board to be independent (B.1.2). The roles of Chairman and Chief Executive should not be exercised by the same individual. The division of responsibilities between the Chairman and Chief Executive should be clearly established, set down in writing and agreed by the Board (A.2.1). |
| | |
| | The Board considers that Professor Sir Roy Anderson, Dr Burns, Mr Culp, Sir Crispin Davis, Sir Deryck Maughan, Mr James Murdoch, Dr Podolsky, Mr de Swaan and Sir Robert Wilson are “independent” under the UK Corporate Governance Code. |
| | |
| | A majority of the Board members are “independent” Non-Executive Directors and, in accordance with the recommendations of the UK Corporate Governance Code, the Board has appointed one of the “independent” Non-Executive Directors as Senior Independent Director to provide a sounding board for the Chairman and act as an intermediary for other Non-Executive Directors where necessary (A.4.1). |
GlaxoSmithKline complies with the equivalent domestic requirements contained in the Combined Code. The last update to the Combined Code for reporting years beginning on or after 29th June 2008 was issued in June 2008. A report on a review of the Combined Code was issued by the UK Financial Reporting Council (“FRC”) in December 2009, but its effects will only come into force for reporting years commencing on or after 29th June 2010.
The Combined Code requires that the board of directors of GlaxoSmithKline (the “Board”) should include a balance of Executive and Non-Executive Directors (and, in particular, independent Non-Executive Directors) such that no individual or small group of individuals can dominate the Board’s decision taking. At least half the Board, excluding the Chairman, should comprise Non-Executive Directors determined by the Board to be independent. The roles of Chairman and Chief Executive should not be exercised by the same individual. The division of responsibilities between the Chairman and Chief Executive should be clearly established, set down in writing and agreed by the Board.
The Board considers that Professor Sir Roy Anderson, Dr Burns, Mr Culp, Sir Crispin Davis, Sir Deryck Maughan, Mr James Murdoch, Dr Podolsky, Mr de Swaan and Sir Robert Wilson are “independent” under the Combined Code. Sir Ian Prosser and Dr Ronaldo Schmitz, both of whom were considered to be independent, retired from the Board with effect from 20th May 2009. Mr James Murdoch joined the Board with effect from 20th May 2009 as an independent Non-Executive Director.
A majority of the Board members are “independent” Non- Executive Directors and the Board has appointed one of the “independent” Non-Executive Directors as senior independent director, in accordance with the recommendations of the Combined Code.
GSK Annual Report 20092010
202210
Comparison of New York Stock Exchange Corporate Governance Standards and GlaxoSmithKline plc’s
corporate governance practice
NYSE
Corporate Governance Standards
Description of differences between GlaxoSmithKline’s governance
practice and the NYSE Corporate Governance Standards
2. | | |
| NYSE | | Description of differences between GlaxoSmithKline’s governance |
| Corporate Governance Standards | | practice and the NYSE Corporate Governance Standards |
|
| | |
2.In order to tighten the definition of “independent director” for purposes of these standards: |
| (a) | | No director qualifies as “independent” unless the board of directors affirmatively determines that the director has no material relationship with the listed company (either directly or as a partner, shareholder or Officerofficer of an organization that has a relationship with the company). |
| (b) | | In addition, a director is not independent if: |
| (i) | | The director is, or has been within the last three years, an employee of the listed company, or an immediate family member is, or has been within the last three years, an executive Officer,officer, of the listed company. |
| (ii) | | The director has received, or has an immediate family member who has received, during any twelve-month period within the last three years, more than $120,000 in direct compensation from the listed company, other than director and committee fees and pension or other forms of deferred compensation for prior service (provided such compensation is not contingent in any way on continued service). |
| (iii) | | (A) The director is a current partner or employee of a firm that is the listed company’s internal or external auditor; (B) the director has an immediate family member who is a current partner of such a firm; (C) the director has an immediate family member who is a current employee of such a firm and who personally works on the listed company’s audit; or (D) the director or an immediate family member was within the last three years a partner or employee of such a firm and personally worked on the listed company’s audit within that time. |
| (iv) | | The director or an immediate family member is, or has been within the last three years, employed as an executive Officerofficer of another company where any of the listed company’s present executive officers at the same time serves or served on that company’s compensation committee. |
| (v) | | The director is a current employee, or an immediate family member is a current executive Officer,officer, of a company that has made payments to, or received payments from, the listed company for property or services in an amount which, in any of the last three fiscal years, exceeds the greater of $1 million, or 2% of such other company’s consolidated gross revenues.
(For the purposes of these standards “executive officer” is defined to have the meaning specified for the term “officer” in Rule 16a-1(f) under the Securities Exchange Act of 1934, as amended the “Exchange Act”). | | GlaxoSmithKline complies with the corresponding domestic requirements contained in the UK Corporate Governance Code, which sets out the principles for the Company to determine whether a director is “independent”.
The Board is required to determine and state its reasons for the determination of whether directors are independent in character and judgment and whether there are relationships or circumstances which are likely to affect, or could affect, the directors’ judgment. In undertaking this process, the Board is required, amongst other factors, to consider if the director:
(a) has been an employee of GlaxoSmithKline within the last five years;
(b) has, or has had within the last three years, a material business relationship with the Company either directly or as a partner, shareholder, director or senior employee of a body that has such a relationship with the Company;
(c) has received or receives additional remuneration from the Company apart from a director’s fee, participates in the Company’s share option or a performance-related pay scheme, or is a member of the Company’s pension scheme;
(d) has close family ties with any of the Company’s advisers, directors or senior employees;
(e) holds cross-directorships or has significant links with other directors through involvement in other companies or bodies;
(f) represents a significant shareholder; or
(g) has served on the Board for more than nine years from the date of his or her first election (B.1.1).
The Board considers all its Non-Executive Directors to be independent in character and judgment and has concluded that all its Non-Executive Directors are independent in accordance with the UK Corporate Governance Code.
A new requirement introduced by the UK Corporate Governance Code is that all Directors should be subject to annual election by shareholders. GlaxoSmithKline intends to comply with this requirement at its 2011 Annual General Meeting.
The UK Corporate Governance Code also provides that the Board should undertake a formal and rigorous annual evaluation of its own performance and that of its committees and individual Directors (B.6). In addition, the evaluation of the Board should be externally facilitated at least every three years and a statement should be made available of whether an external facilitator has any other connection with the Company (B.6.2).
All Directors should receive an induction on joining the Board (B.4). The Chairman should regularly review and agree with each Director their training and development needs (B.4.2). |
(For the purposes of these standards “executive Officer” is defined to have the meaning specified for the term “Officer” in Rule 16a-1(f) under the Securities Exchange Act of 1934, as amended (the “Exchange Act”)).
GlaxoSmithKline complies with the corresponding domestic requirements contained in the Combined Code, which sets out the principles for the Company to determine whether a director is “independent”.
The Board is required to determine and state its reasons for the determination of whether directors are independent in character and judgment and whether there are relationships or circumstances which are likely to affect, or could affect, the directors’ judgment. In undertaking this process, the Board is required, amongst other factors, to consider if the director:
has been an employee of GlaxoSmithKline within the last five years;
has, or has had within the last three years, a material business relationship with the Company either directly or as a partner, shareholder, director or senior employee of a body that has such a relationship with the Company;
has received or receives additional remuneration from the Company apart from a director’s fee, participates in the Company’s share option or a performance-related pay scheme, or is a member of the Company’s pension scheme;
has close family ties with any of the Company’s advisers, directors or senior employees;
holds cross-directorships or has significant links with other directors through involvement in other companies or bodies;
represents a significant shareholder; or
has served on the Board for more than nine years from the date of his or her first election.
The Board considers all its Non-Executive Directors to be independent in character and judgment and has concluded that all its Non-Executive Directors are independent in accordance with the Combined Code.
GSK Annual Report 20092010
203211
Comparison of New York Stock Exchange Corporate Governance Standards and GlaxoSmithKline plc’s
corporate governance practice
NYSE
Corporate Governance Standards
Description of differences between GlaxoSmithKline’s governance
practice and the NYSE Corporate Governance Standards
3. | | |
|
| NYSE | | Description of differences between GlaxoSmithKline’s governance |
| Corporate Governance Standards | | practice and the NYSE Corporate Governance Standards |
|
| | |
3.To empower non-management directors to serve as a more effective check on management, the non-management directors of each listed company must meet at regularly scheduled executive sessions without management. | | GlaxoSmithKline complies with the equivalent domestic requirements set out in the UK Corporate Governance Code, which requires that the Chairman of GlaxoSmithKline should hold meetings with the Non-Executive Directors without executives present. The Non-Executive Directors, led by the senior independent director, also meet without the Chairman present to appraise the Chairman’s performance (A.4.2). |
GlaxoSmithKline complies with the equivalent domestic requirements set out in the Combined Code, which requires that the Chairman of GlaxoSmithKline should hold meetings with the Non-Executive Directors without executives present. The Non-Executive Directors, led by the senior independent director, also meet without the Chairman present to appraise the Chairman’s performance.
Nominating/corporate governance committee
4. | | |
| | The Chairman promotes a culture of openness and debate by facilitating the effective contribution of Non-Executive Directors (A.3) and, in particular, ensuring constructive relations between Executive and Non-Executive Directors (A.3). In addition, the Chairman is responsible for ensuring that all Directors are made aware of shareholders’ concerns (E.1). |
| | |
| |
(a) | | |
| Nominating/corporate governance committee |
| | |
4.(a) Listed companies must have a nominating/corporate governance committee composed entirely of independent directors. |
| (b) | | The nominating/corporate governance committee must have a written charter that addresses: |
| (i) | | the committee’s purpose and responsibilities – which, at minimum, must be to: identify individuals qualified to become board members, consistent with criteria approved by the board, and to select, or to recommend that the board select, the director nominees for the next annual meeting of shareholders; develop and recommend to the board a set of corporate governance guidelines applicable to the corporation; and oversee the evaluation of the board and management; and |
| (ii) | | an annual performance evaluation of the committee. | | GlaxoSmithKline complies with the corresponding domestic requirements set out in the UK Corporate Governance Code, which requires that GlaxoSmithKline should have a Nominations Committee that is comprised of a majority of independent Non- Executive Directors (B.2.1).
GlaxoSmithKline’s Nominations Committee has written terms of reference in accordance with the UK Corporate Governance Code. The terms of reference are available and explain the Nominations Committee’s role and the authority delegated to it by the Board (B.2.1). The Nominations Committee reviews the structure, size, diversity (including gender diversity), and composition of the Board and appointment of members to the Board and the Corporate Executive Team (the “CET”), and makes recommendations to the Board as appropriate. The Committee also monitors the planning of succession for the Board and Senior Management.
In compliance with the UK Corporate Governance Code, the terms and conditions of appointment of Non-Executive Directors are available for inspection (B.3.2).
The UK Corporate Governance Code requires that a separate section in the Company’s Annual Report describe the work of the Nominations Committee in discharging its duties, including the process it has used in relation to Board appointments (B.2.4).
The Board is responsible for regularly reviewing its corporate governance standards and practices. The Company Secretary oversees corporate governance matters for the Group. The Company Secretary is responsible for advising the Board through the Chairman on all corporate governance matters. Domestic requirements do not mandate that GlaxoSmithKline establish a corporate governance committee |
GSK Annual Report 2010
212
Comparison of New York Stock Exchange Corporate Governance Standards and GlaxoSmithKline complies with the corresponding domestic requirements set out in the Combined Code, which require that GlaxoSmithKline should have a Nominations Committee that is comprised of a majority of independent Non-Executive Directors.
GlaxoSmithKline’s Nominations Committee has written terms of reference in accordance with the Combined Code. The terms of reference are available on the Company’s website and explain the Nominations Committee’s role and the authority delegated to it by the Board. The Nominations Committee reviews the structure, size and composition of the Board and appointment of members to the Board and the Corporate Executive Team (the “CET”), and makes recommendations to the Board as appropriate. The Committee also monitors the planning of succession for the Board and Senior Management.
The Board is responsible for regularly reviewing itsplc’s corporate governance standards and practices. The Company Secretary is also the Group’s Corporate Compliance Officer and oversees corporate governance matters for the Group. The Company Secretary is responsible for advising the Board through the Chairman on all corporate governance matters. Domestic requirements do not mandate that GlaxoSmithKline establish a corporate governance committee.
Management resources and compensation committeepractice
5. | | |
| |
(a)NYSE | | Description of differences between GlaxoSmithKline’s governance |
| Corporate Governance Standards | | practice and the NYSE Corporate Governance Standards |
|
Management resources and compensation committee | | |
| | |
5.(a) Listed companies must have a compensation committee composed entirely of independent directors. |
| (b) | | The compensation committee must have a written charter that addresses: |
| (i) | | the committee’s purpose and responsibilities – which, at minimum, must be to have direct responsibility to: |
| | | review and approve corporate goals and objectives relevant to CEO compensation, evaluate the CEO’s performance in light of those goals and objectives, and, either as a committee or together with the other independent directors (as directed by the board), determine and approve the CEO’s compensation level based on this evaluation; |
| | | make recommendations to the board with respect to non-CEO executive Officerofficer compensation, and incentive-compensation and equity-based plans that are subject to board approval; and |
(C) prepare the disclosure required by item 407(e)(5) or Regulation S-K under the Exchange Act;
(ii) an annual performance evaluation of the compensation committee.
GlaxoSmithKline complies with the equivalent domestic requirements set out in the Combined Code, which requires that GlaxoSmithKline have a Remuneration Committee that is comprised entirely of “independent” Non-Executive Directors (which may include the Company Chairman).
GlaxoSmithKline’s Remuneration Committee has written terms of reference in accordance with the Combined Code. The terms of reference are available on the Company’s website. The Remuneration Committee determines the terms of service and remuneration of the Executive Directors and members of the CET and, with the assistance of external independent advisers, it evaluates and makes recommendations to the Board on overall executive remuneration policy (the Chairman and the CEO are responsible for evaluating and making recommendations to the Board on the remuneration of Non-Executive Directors).
The Combined Code provides that the Remuneration Committee:
(a) | | GlaxoSmithKline complies with the equivalent domestic requirements set out in the UK Corporate Governance Code, which requires that GlaxoSmithKline should have a Remuneration Committee that is comprised of at least three “independent” Non-Executive Directors in addition to the Chairman (D.2.1).
GlaxoSmithKline’s Remuneration Committee has written terms of reference in accordance with the UK Corporate Governance Code (D.2.1). The Remuneration Committee determines the terms of service and remuneration of the Executive Directors and members of the CET and, with the assistance of external independent advisers, it evaluates and makes recommendations to the Board on overall executive remuneration policy (the Chairman and the CEO are responsible for evaluating and making recommendations to the Board on the remuneration of Non-Executive Directors).
The UK Corporate Governance Code provides that the Remuneration Committee:
(a) should consult with the Chairman and/or CEO about their proposals relating to the remuneration of other Executive Directors (D.2) and should delegate responsibility for setting remuneration for all Executive Directors and the Chairman, including pension rights and any compensation payments; |
GSK Annual Report 2009
204
Comparison of New York Stock Exchange Corporate Governance Standards and GlaxoSmithKline plc’s
corporate governance practice
NYSE
Corporate Governance Standards
Description of differences between GlaxoSmithKline’s governance
practice and the NYSE Corporate Governance Standards
| (C) | | prepare the disclosure required by item 407(c) (5) of Regulation S-K under the Exchange Act; |
| (ii) | | an annual performance evaluation of the compensation committee. |
| (b) | | should recommend and monitor the level and structure of remuneration for senior management; and |
management (D.2.2);| (c) | | should consider what compensation commitments (including pension contributions and all other elements) the directors’ terms of appointment would entail in the event of early termination. |
termination (D.1.4.);| (d) | | shareholders should be invitedinvite shareholders specifically to approve all new long-term incentive schemes and significant changes to existing schemes.schemes (D.2.4.);
(e) should judge where to position the Company relative to other companies and should be sensitive to pay and employment conditions elsewhere in the group, especially when determining annual salary increases (D.1); and
(f) should consider whether the Directors should be eligible for annual bonuses and benefits under long-term incentive schemes (Schedule A), bearing in mind that performance-related elements of Executive Directors’ remuneration should be designed to promote the long-term success of the Company (D.1 and D.1.1).
The UK Corporate Governance Code requires that payouts under incentive schemes should be subject to non-financial performance criteria where appropriate and compatible with the Company’s risk policies and systems (Schedule A). In addition, remuneration of Non-Executive Directors should not include performance-related elements (D.1.3). |
At the annual general meeting on 20th May 2009 the shareholdersGSK Annual Report 2010
213
Comparison of New York Stock Exchange Corporate Governance Standards and GlaxoSmithKline approved proposed changes to the remuneration arrangements of the senior executives following a review by the Remuneration Committee to align performance measures to strategy, reflecting the long-term nature of the pharmaceutical industry.
Audit & Risk committeeplc’s corporate governance practice
6. | | |
|
| NYSE | | Description of differences between GlaxoSmithKline’s governance |
| Corporate Governance Standards | | practice and the NYSE Corporate Governance Standards |
|
| | |
Audit & Risk committee | | |
| | |
6.Listed companies must have an audit committee that satisfies the requirements of Rule 10A-3 under the Exchange Act. | | GlaxoSmithKline complies with equivalent domestic requirements set out in the UK Corporate Governance Code, which require that GlaxoSmithKline have an Audit Committee that is comprised entirely of “independent” Non-Executive Directors (C.3.1). The Board should satisfy itself that at least one member of the Audit Committee has recent and relevant financial experience. The Board of Directors approved and adopted new terms of reference and accepted proposals to change the name of the Committee to the Audit & Risk Committee with effect from 10th December 2009; |
| | |
| | The UK Corporate Governance Code provides that the Audit
Committee: |
| | |
| | (a) monitors the integrity of the financial statements of the Company and any formal announcements relating to the Company’s financial performance, reviewing significant financial reporting judgments contained in them (C.3.2); |
| | |
| | (b) review the Company’s internal financial controls and internal control and risk management systems; |
| | |
| | (c) monitor and review the effectiveness of the Company’s internal audit function (C.3.2); |
| | |
| | (d) make recommendations to the Board, for it to put to the shareholders for their approval in general meeting, in relation to the appointment, re-appointment and removal of the external auditor and to approve the remuneration and terms of engagement of the external auditor (C.3.2); |
| | |
| | (e) review and monitor the external auditor’s independence and objectivity and the effectiveness of the audit process, taking into consideration relevant UK professional and regulatory requirements (C.3.2); |
| | |
| | (f) develop and implement policy on the engagement of external auditors to supply non-audit services, taking into account relevant ethical guidance regarding the provision of non-audit services by the external audit firm, and to report to the Board, identifying any matters in respect of which it considers that action or improvement is needed and making recommendations as to the steps to be taken (C.3.2); |
| | |
| | (g) review arrangements by which the staff of the company may, in confidence, raise concerns about possible improprieties in matters of financial reporting or other matters (C.3.4) |
| | |
| | GlaxoSmithKline’s Audit & Risk Committee meets the requirements of the Sarbanes-Oxley Act of 2002 in that: |
| | |
| | • each member of the Audit & Risk Committee is deemed to be “independent” in accordance with the Securities Exchange Act of 1934, as amended, and applicable NYSE and UK requirements; |
| | |
| | • the Audit & Risk Committee, amongst other things, is responsible for recommending the appointment, compensation, maintenance of independence and oversight of the work of any registered public accounting firm engaged for the purpose of preparing or issuing an audit report or performing other audit, review or attest services for the Company, and each such accounting firm must report directly to the Audit & Risk Committee; |
GlaxoSmithKline complies with equivalent domestic requirements set out in the Combined Code, which require that GlaxoSmithKline have an Audit Committee that is comprised entirely of “independent” Non-Executive Directors. The Board of Directors approved and adopted new terms of reference and accepted proposals to change the name of the Committee to the Audit & Risk Committee with effect from 10th December 2009.
GlaxoSmithKline’s Audit & Risk Committee meets the requirements of the Sarbanes-Oxley Act of 2002 in that:
each member of the Audit & Risk Committee is deemed to be “independent” in accordance with the Securities Exchange Act of 1934, as amended, and applicable NYSE and UK requirements;
the Audit & Risk Committee, amongst other things, is responsible for recommending the appointment, compensation, maintenance of independence and oversight of the work of any registered public accounting firm engaged for the purpose of preparing or issuing an audit report or performing other audit, review or attest services for the Company, and each such accounting firm must report directly to the Audit & Risk Committee;
the Audit & Risk Committee has established a procedure for the receipt, retention and treatment of complaints regarding accounting, internal accounting controls or auditing matters, and for the confidential, anonymous submission by employees of concerns regarding questionable accounting or auditing matters;
the Audit & Risk Committee has the authority to engage independent counsel and other advisors as it determines necessary to carry out its duties; and
GlaxoSmithKline must provide appropriate funding for the Audit & Risk Committee.
The Board has determined that Mr de Swaan has the appropriate qualifications and background to be an Audit Committee Financial Expert as defined in rules promulgated by the SEC under the Sarbanes-Oxley Act of 2002.
GSK Annual Report 20092010
205214
Comparison of New York Stock Exchange Corporate Governance Standards and GlaxoSmithKline
plc’s
corporate governance practice
NYSE
Corporate Governance Standards
Description of differences between GlaxoSmithKline’s governance
practice and the NYSE Corporate Governance Standards
7. | | |
| |
(a)NYSE | | Description of differences between GlaxoSmithKline's governance |
| Corporate Governance Standards | | practice and the NYSE Corporate Governance Standards |
|
| | |
| | • the Audit & Risk Committee has established a procedure for the receipt, retention and treatment of complaints regarding accounting, internal accounting controls or auditing matters, and for the confidential, anonymous submission by employees of concerns regarding questionable accounting or auditing matters; |
| | |
| | • the Audit & Risk Committee has the authority to engage independent counsel and other advisors as it determines necessary to carry out its duties; and |
| | |
| | • GlaxoSmithKline must provide appropriate funding for the Audit & Risk Committee. |
| | |
| | The Board has determined that Mr de Swaan has the appropriate qualifications and background to be an “Audit Committee Financial Expert” as defined in rules promulgated by the SEC under the Sarbanes-Oxley Act of 2002. |
| | |
|
| | |
7. | | |
(a) The audit committee must have a minimum of three members. All audit committee members must satisfy the requirements for independence set out in Section 303A.02303 A.02 and, in the absence of an applicable exemption, Rule 10A-3(b)(1) under the Exchange Act. |
| (b) | | The audit committee must have a written charter that addresses: |
| (i) | | the committee’s purpose – which, at minimum, must be to: |
| | | assist board oversight of (1) the integrity of the listed company’s financial statements, (2) the listed company’s compliance with legal and regulatory requirements, (3) the independent auditor’s qualifications and independence, and (4) the performance of the listed company’s internal audit function and independent auditors; and |
| | | prepare the disclosure required by Item 407(d)(3)(i) of Regulation S-K under the Exchange Act; |
| (ii) | | an annual performance evaluation of the audit committee; and |
| (iii) | | the duties and responsibilities of the audit committee – which, at a minimum, must include those set out in Rule 10A-3(b)(2), (3), (4) and (5) of the Exchange Act as well as to: |
| | | at least annually, obtain and review a report by the independent auditor describing: the firm’s internal quality-control procedures; any material issues raised by the most recent internal quality-control review, or peer review, of the firm, or by any inquiry or investigation by governmental or professional authorities, within the preceding five years, respecting one or more independent audits carried out by the firm, and any steps taken to deal with any such issues; and (to assess the auditor’s independence) all relationships between the independent auditor and the listed company; | | GlaxoSmithKline complies with the equivalent domestic requirements set out in the UK Corporate Governance Code, which require that the Audit Committee should be comprised of a minimum of three “independent” Non-Executive Directors.
GlaxoSmithKline’s Audit & Risk Committee has written terms of reference in accordance with the UK Corporate Governance Code (C.3.3). The Committee’s main responsibilities include reviewing the financial reporting process, the system of internal control and overseeing the identification and management of risks, the external and internal process and for monitoring compliance with laws, regulations and ethical codes of practice, including review throughout the year of integrated assurance reports comprising business unit and associated consolidated internal audit reports.
The UK Corporate Governance Code requires that a separate section in the Company’s Annual Report describe the work of the Committee in discharging its duties (C.3.3).
Please see section 6 above for a description of the main role and responsibilities of the Audit & Risk Committee. |
GSK Annual Report 2010
215
Comparison of New York Stock Exchange Corporate Governance Standards and GlaxoSmithKline plc’s corporate governance practice
| | (B) | |
|
| NYSE | | Description of differences between GlaxoSmithKline’s governance |
| Corporate Governance Standards | | practice and the NYSE Corporate Governance Standards |
|
| | |
| | |
(B) meet to review and discuss the listed company’s annual audited financial statements and quarterly financial statements with management and the independent auditor, including reviewing the listed company’s specific disclosures under “Management’s Discussion and Analysis of Financial Condition and Results of Operations”; | | |
GlaxoSmithKline complies with the equivalent domestic requirements set out in the Combined Code, which require that the Audit Committee should be comprised of a minimum of three “independent” Non-Executive Directors.
GlaxoSmithKline’s Audit & Risk Committee has written terms of reference in accordance with the Combined Code. The terms of reference are available on the Company’s website. The Committee’s main responsibilities include reviewing the financial reporting process, the system of internal control and overseeing the identification and management of risks, the Company’s external and internal process for monitoring compliance with laws, regulations and ethical codes of practice, including review throughout the year of integrated assurance reports comprising business unit and associated consolidated internal audit reports.
The Combined Code requires that a separate section in the Company’s Annual Report describe the work of the Committee in discharging its duties.
The Combined Code requires that the main role and responsibilities of the Audit Committee should include:
monitoring the integrity of the financial statements and management discussion and analysis (MD&A) of the Company and any formal announcements relating to the Company’s financial performance, and reviewing significant financial reporting judgments contained in them;
developing and implementing policy on the engagement of the external auditor to supply non-audit services, taking into account relevant ethical guidance regarding the provision of non-audit services by the external audit firm, and reporting to the Board, identifying any matters in respect of which it considers that action or improvement is needed and making recommendations as to the steps to be taken;
reviewing and monitoring the external auditor’s independence and objectivity and the effectiveness of the audit process, taking into consideration the relevant UK professional and regulatory requirements;
making recommendations to the Board for it to put submissions to the Company’s shareholders for their approval at the general meeting in relation to the appointment, re-appointment and removal of the external auditor;
approving the remuneration and terms of engagement of the external auditor;
monitoring and reviewing the effectiveness of the Company’s internal audit function; and
reviewing the Company’s internal financial controls and the system of internal controls.
GSK Annual Report 2009
206
Comparison of New York Stock Exchange Corporate Governance Standards and GlaxoSmithKline plc’s
corporate governance practice
NYSE
Corporate Governance Standards
Description of differences between GlaxoSmithKline’s governance
practice and the NYSE Corporate Governance Standards
| | (C) | |
(C) discuss the listed company’s earnings press releases, as well as financial information and earnings guidance provided to analysts and rating agencies; | | |
| | (D) | |
(D) discuss policies with respect to risk assessment and risk management; | | |
| | (E) | |
(E) meet separately, periodically, with management, with internal auditors (or other personnel responsible for the internal audit function) and with independent auditors; | | |
| | (F) | |
(F) review with the independent auditor any audit problems or difficulties and management’s response; | | |
| | (G) | |
(G) set clear hiring policies for employees or former employees of the independent auditors; and | | |
| | (H) | |
(H) report regularly to the board of directors. |
(d) | | |
| | |
(c) Each listed company must have an internal audit function. |
8. | | |
| | |
|
| | |
8.Shareholders must be given the opportunity to vote on all equity-compensation plans and material revisions thereto, except for employment inducement awards, certain grants, plans and amendments in the context of mergers and acquisitions, and certain specific types of plans. |
GlaxoSmithKline complies with corresponding domestic requirements in the Listing Rules of the UK Listing Authority, which mandate that the Company must seek shareholder approval for employee share schemes. Please see section 5(d) above.
Corporate governance guidelines
9. | | GlaxoSmithKline complies with corresponding domestic requirements in the Listing Rules of the UK Listing Authority, which mandate that the Company must seek shareholder approval for employee share schemes (D.2.4 and Listing Rule 9.4). Please see section 5(d) above. |
| | |
|
| | |
Corporate governance guidelines | | |
| | |
9.Listed companies must adopt and disclose corporate governance guidelines. | | GlaxoSmithKline complies with corresponding domestic requirements in the Listing Rules of the UK Listing Authority and the UK Corporate Governance Code, which require that GlaxoSmithKline include an explanation in its Annual Report of how it complies with the principles of the UK Corporate Governance Code and that it confirm that it complies with the Code’s provisions or, where it does not, provide an explanation of why it does not comply (Listing Rule 9.8.6). In addition, for accounting periods beginning on or after 29th June 2008, issuers are required to make certain mandatory corporate governance statements in the Directors’ Report in accordance with new UK Disclosure and Transparency Rules, DTR 7, which was issued by the UK Financial Services Authority to implement the eighth Company Law Directive; GlaxoSmithKline complies with these requirements in its 2010 Annual Report. |
GlaxoSmithKline complies with corresponding domestic requirements in the Listing Rules of the UK Listing Authority and the Combined Code, which require that GlaxoSmithKline include an explanation in its Annual Report of how it complies with the principles of the Combined Code and that it confirm that it complies with the Code’s provisions or, where it does not, provide an explanation of why it does not comply. In addition, for accounting periods beginning on or after 29th June 2008, issuers are required to make certain mandatory corporate governance statements in the Directors’ Report in accordance with new UK Disclosure and Transparency Rules, DTR 7, which was issued by the UK Financial Services Authority to implement the eighth Company Law Directive. GlaxoSmithKline complies with these requirements in its 2009 Annual Report.
GSK Annual Report 20092010
207216
Comparison of New York Stock Exchange Corporate Governance Standards and GlaxoSmithKline plc’s
corporate governance practice
NYSE
Corporate Governance Standards
Description of differences between GlaxoSmithKline’s governance
practice and the NYSE Corporate Governance Standards
10. | | |
|
| NYSE | | Description of differences between GlaxoSmithKline’s governance |
| Corporate Governance Standards | | practice and the NYSE Corporate Governance Standards |
|
| | |
10.Listed companies must adopt and disclose a code of business conduct and ethics for directors, officers and employees, and promptly disclose any waivers of the code for directors or executive officers. |
GlaxoSmithKline’s Code of Conduct for employees is available on the Company’s website, as is the Code of Ethics for the CEO and CFO and other senior financial officers.
Description of significant differences
11. | | GlaxoSmithKline’s Code of Conduct for all employees, including the CEO, CFO and other senior financial officers, is available. |
| | |
|
| | |
Description of significant differences | | |
| | |
11.Listed foreign private issuers must disclose any significant ways in which their corporate governance practices differ from those followed by domestic companies under NYSE listing standards. |
| | GlaxoSmithKline fulfills this requirement by publishing this document. GlaxoSmithKline fulfils this requirement by including this disclosure on its annual report on Form 20-F. |
| | | |
Listed foreign private issuers are required to provide this disclosure in the English language and in their annual reports filed on Form 20-F. | | |
GlaxoSmithKline fulfills this requirement by publishing this document.
GlaxoSmithKline fulfills this requirement by including this disclosure in its annual report on Form 20-F.
GSK Annual Report 20092010
208217
American Depositary Shares
Fees and charges payable by ADR holders
The Bank of New York Mellon serves as the depositary (the ‘Depositary’“Depositary”) for GlaxoSmithKline plc’s American Depositary Receipt (‘ADR’(“ADR”) programme. Pursuant to the deposit agreement between GSK, the Depositary and owners and holders of ADRADRs (the ‘Deposit Agreement’“Deposit Agreement”), ADR holders may be required to pay various fees to the Depositary, and the Depositary may refuse to provide any service for which a fee is assessed until the applicable fee has been paid. In particular, the Depositary, under the terms of the Deposit Agreement, shall charge a fee of $0.05 or less per ADR (or portion thereof) for (i) the issuance, execution and delivery of ADRs or (ii) the withdrawal of shares underlying the ADRs. In addition, ADR holders may be required under the Deposit Agreement to pay the Depositary (i) any tax, duty, governmental charge or fee or stock transfer or registration fee arising in connection with the foregoing transactions or otherwise, (ii) any expense resulting from the conversion of a foreign currency into U.S. dollars and (iii) the expense of certain communications made, at the request of the ADR holder, by cable, telex or facsimile. The Depositary may (i) withhold dividends or other distributions or sell any or all of the shares underlying the ADRs in order to satisfy any tax or governmental charge and (ii) deduct from any cash distribution any tax payable thereon or the cost of any currency conversion.
Direct and indirect payments by the Depositary
The Depositary reimburses GSK for certain expenses it incurs in connection with the ADR programme, subject to a ceiling agreed between GSK and the Depositary from time to time. The Depositary has also agreed to waive certain standard fees associated with the administration of the programme.
The table below sets forth the amount of such payments received during 2010 and 2011 in respect of the year ended 31 December 2010 and such payments claimed but not yet received in respect of the year ended 31st31 December 20092010 as well as such payments received during 20092010 in respect of the year ended 31st31 December 2008.2009. GSK was also reimbursed £35,100£400,000 by the Depositary in 2010 in respect of amounts to which the Company was contractually entitled, but which it had not previously claimed, in respect of the period 2004 to 2009. This amount was used to offset a portion of GSK’s audit fees for 2010. The portion of this amount relating to 2009 for legal fees claimed with respect to 2007.is not included in the table below.
| | | | | | | | | | | | | | |
| | | | | | | | | | | | | | | | | | | |
| | | Received in respect | | Received in respect | | Claimed in respect of 2009 | | | Received during 2010 | | Received during 2010 and 2011 | | Claimed in respect of 2010 | |
| Direct and indirect payments by the Depositary | | of 2008 | | of 2009 | | but not yet received | | | in respect of 2009 | | in respect of 2010 | | but not yet received | |
| | | | | | | | | | | | | |
| Reimbursement of NYSE listing fees | | – | | | $387,787 | | – | | | – | | | $350,483 | | – | |
| Reimbursement of legal fees claimed in US dollars | | | $162,284 | | – | | | $333,735 | | | | $333,735 | | | $225,000 | | | $200,000 | |
| Reimbursement of legal fees claimed in Sterling | | | £30,661 | | | £34,173 | | | £9,782 | | | £23,268 | | £91,198.25 | | – | |
| Reimbursement of PCAOB fees | | – | | | $161,700 | | – | | | $161,700 | | $177,500 | | – | |
Reimbursement of Annual Report production costs1 | | – | | £10,000 | | | £290,347 | | | £300,437 | | £216,208.94 | | – | |
Reimbursement of Investor Relations expenses2 | | | $232,118 | | | $321,108 | | | $108,078 | | | $294,084 | | $321,306.19 | | $103,477.16 | |
| Distribution of annual general meeting materials | | – | | | $409,114 | | – | | | – | | $427,480.94 | | – | |
| Tabulation of voting instructions cards | | – | | | $40,202 | | – | | | – | | $32,533.90 | | – | |
Reimbursement of other programme-related expenditures
claimed in US dollars | | – | | – | | | $16,050 | | | $16,050 | | $5,852.20 | | $3,030.90 | |
Reimbursement of other programme-related expenditures
claimed in Sterling | | – | | £22,500 | | | £9,780 | | | £32,280 | | – | | £7,099.35 | |
| | | | | | | | | | | | | |
| | |
| 1 | | Annual report production costs include SEC filing fees. |
| |
| 2 | | Investor relations expenses include travel expenses, fees of investor relations consultants, expenses involved in arranging investor relations meetings and telephone expenses. |
GSK Annual Report 20092010
209218
Item 19 Exhibits
Exhibit Index | | | |
| Exhibit No. | | Description |
| | | |
| |
| | | |
1.1 | | Memorandum and Articles of Association of the Registrant as in effect on the date hereof. |
| | | |
| |
| | | |
2.1 | | Deposit Agreement among the Registrant and The Bank of New York, as Depositary, and the holders from time to time of the American Depositary Receipts issued thereunder, including the form of American Depositary Receipt, is incorporated by reference to the Registration Statement on Form F-6 (No. 333-148017) filed with the Commission on December 12, 2007. |
| | | |
| |
| | | |
4.1 | | UK Service Agreement between GlaxoSmithKline Services Unlimited and Julian Heslop is incorporated by reference to Exhibit 4.3 to the Registrant’s Annual Report on Form 20-F filed with the Commission on March 3, 2006. |
| | | |
| |
| | | |
4.2 | | Service Agreement between SmithKline Beecham Corporation and Moncef Slaoui is incorporated by reference to Exhibit 4.4 to the Registrant’s Annual Report on Form 20-F filed with the Commission on February 29, 2008. |
| | | |
| |
| | | |
4.3 | | Amendment to Service Agreement between GlaxoSmithKline LLC (formerly known as SmithKline Beecham Corporation) and Moncef Slaoui dated December 21, 2010. |
| | |
|
| | |
4.4 | | UK Service Agreement between GlaxoSmithKline Services Unlimited and Andrew Witty is incorporated by reference to Exhibit 4.5 to the Registrant’s Annual Report on Form 20-F filed with the Commission on February 29, 2008. |
| | | |
| |
| | | |
4.44.5
| | Amendment to UK Service Agreement between GlaxoSmithKline Services Unlimited and Andrew Witty dated June 18, 2008 is incorporated by reference to Exhibit 4.4 to the Registrant’s Annual Report on Form 20-F filed with the Commission on March 4, 2009. |
| | | |
| |
| | | |
4.54.6
| | Amendment to UK Service Agreement between GlaxoSmithKline Services Unlimited and Andrew Witty dated February 4, 2010.2010 is incorporated by reference to Exhibit 4.5 to the Registrant’s Annual Report on Form 20-F filed with the Commission on March 1,2010. |
| | |
|
| | |
4.7 | | UK Service Agreement between GlaxoSmithKline Services Unlimited and Simon Dingemans dated September 8, 2010 |
| | | |
| |
| | | |
8.1 | | A list of the Registrant’s principal subsidiaries is incorporated by reference to pages 166175 to 168177 of this Annual Report on Form 20-F. |
| | | |
| |
| | | |
12.1 | | Certification Required by Rule 13a-14(a) or 15d-14(a) under the Securities Exchange Act of 1934 – Andrew Witty. |
| | | |
| |
| | | |
12.2 | | Certification Required by Rule 13a-14(a) or 15d-14(a) under the Securities Exchange Act of 1934 – Julian Heslop. |
| | | |
| |
| | | |
13.1 | | Certification Pursuant to Section 906 of the Sarbanes-Oxley Act of 2002 (Subsections (a) and (b) of Section 1350, Chapter 63 of Title 18, United States Code). |
| | | |
| |
| | | |
15.1 | | Consent of PricewaterhouseCoopers LLP. |
GSK Annual Report 2009
210
| | | | |
| | | Cross reference to Form 20-F
| | |
GSK Annual Report 2010
219
History and development of the company
GlaxoSmithKline plc is a public limited company incorporated on 6th December 1999 under English law. Its shares are listed on the London Stock Exchange and the New York Stock Exchange. On 27th December 2000 the company acquired Glaxo Wellcome plc and SmithKline Beecham plc, both English public limited companies, by way of a scheme of arrangement for the merger of the two companies. GSK and its subsidiaries and associates constitute a major global healthcare group engaged in the creation, discovery, development, manufacture and marketing of pharmaceutical and consumer health-related products.
Annual Report and Summary
This report is the Annual Report of GlaxoSmithKline plc for the year ended 31st December 2010, prepared in accordance with United Kingdom requirements. It was approved by the Board of Directors on 1st March 2011 and published on 2nd March 2011.
A summary of the year, intended for the shareholder not needing the full detail of the Annual Report, is produced as a separate document and issued to all shareholders. The summary does not constitute a set of summary financial statements as defined by section 428 of the Companies Act 2006. The Annual Report is issued to shareholders who have elected to receive it.
In this Report ‘GlaxoSmithKline’, the ‘Group’ or ‘GSK’ means GlaxoSmithKline plc and its subsidiaries; the ‘company’ means GlaxoSmithKline plc; ‘GlaxoSmithKline share’ means an Ordinary Share of GlaxoSmithKline plc of 25p; American Depositary Shares (ADS) each represent two GlaxoSmithKline shares.
Brand names
Brand names appearing in italics throughout this report are trademarks either owned by and/or licensed to GlaxoSmithKline or associated companies, with the exception ofBenlysta,a trademark of Human Genome Science,Boniva/Bonviva,a trademark of Roche,Botox, a trademark of Allergan,Levitra, atrademark of Bayer,NicoDerm, atrademark of Elan, Johnson & Johnson, Merrell, Novartis, Sanofi-Aventis or GlaxoSmithKline,Potiga,a trademark of Valeant,Prolia,a trademark of Amgen,Vesicare,a trademark of Astellas Pharmaceuticals in many countries and of Yamanouchi Pharmaceuticals in certain countries andVolibris, atrademark of Gilead, all of which are used in certain countries under licence by the Group.
Exchange rates
The Group operates in many countries and earns revenues and incurs costs in many currencies. The results of the Group, as reported in Sterling, are affected by movements in exchange rates between Sterling and other currencies. Average exchange rates prevailing during the period are used to translate the results and cash flows of overseas subsidiaries, associates and joint ventures into Sterling. Period end rates are used to translate the net assets of those entities.
The currencies that most influence the Group’s results remain the US dollar, the Euro, the Yen and Sterling. Details of the exchange rates used by the Group are given in Note 5 ‘Exchange Rates’ on page 116.
During 2010, average Sterling exchange rates were stronger against the Euro but weaker against the US dollar and the Yen compared with 2009. Year end Sterling exchange rates were also stronger against the Euro but weaker against the US dollar and the Yen.
New Directors
GlaxoSmithKline plc announced on 4th March 2011 that Ms Judy Lewent and Ms Stacey Cartwright have been appointed as Non-Executive Directors and will join the Board of Directors of the company with effect from 1st April 2011. On appointment they will both become members of GSK’s Audit & Risk Committee. Ms Lewent is the former Executive Vice President and Chief Financial Officer of Merck & Co., Inc. and now serves on the boards of three listed Companies and Ms Cartwright is Executive Vice President, Chief Financial Officer of Burberry Group plc.
GSK Annual Report 2010
220
Cross reference to Form 20-F
This table has been provided as a cross reference from the information included in this Annual Report to the requirements of Form 20-F.
| | | | | | |
| Item | | | | Page | |
| |
1 | | Identity of directors, senior management and advisers | | | n/a | |
| |
2 | | Offer statistics and expected timetable | | | n/a | |
| |
3 | | Key information3
| | Key information | | |
| A | | Selected financial data | | | 186-188 | 194-196 |
| D | | Risk factors | | | 43-47 | 53-57 |
| |
4 | | Information on the company | | | | |
| A | | History and development of the company | | | 10,40,145-151 | 155-157,219 |
| B | | Business overview | | | | |
| | | Products | | | 11-14 | 14-17 |
| | | Economy and market | | | 27-30,48 | 20,22-27,34-36 |
| | | Manufacture and supply | | | 14 | 19 |
| | | Marketing and distribution | | | 14,35,154 | 19,40,164 |
| | | Intellectual property | | | 11 | 14-16 |
| | | Competition | | | 11,14 | 14-17 |
| | | Regulation | | | 26 | 18 |
| | | Research and development | | | 15-19 | 10-13,28 |
| | | Environment, health and safetyEnvironmental sustainability | | | 24,25 | 32 |
| | | Corporate responsibilityResponsible business and community investment | | | 21-23 | 29-31 |
| C | | Organisational structure | | | 166-168 | 175-177 |
| D | | Property, plant and equipment | | | 36 | 41 |
| | | Note 6 – Segment information | | | 107-110 | 117-121 |
| | | Note 17 – Property, plant and equipment | | | 118-119 | 130-131 |
| |
4A | | Unresolved staff comments4A
| | Unresolved staff comments | | n/a | |
| |
5 | | Operating and financial review and prospects | | | | |
| A | | Operating results | | |
| | | 2010 and 2009 | | 22-28,34-40 |
| | | 2009 and 2008 | | | 28-35 | |
| | 2008 and 2007 | | | 48-53 | 47-52 |
| B | | Liquidity and capital resources | | | 36-42 | 41-46 |
| C | | Research and development, patents and licenses, etc. | | | 11-19 | 10-17 |
| D | | Trend information | | | 28-35 | 34-40 |
| E | | Off-balance sheet arrangements | | | n/a | |
| F | | Tabular disclosure of contractual obligations | | | 38 | 43 |
| |
6 | | Directors, senior management and employees | | |
| A | | Directors and senior management | | | 54-57 | 58-63 |
| B | | Compensation | | | | |
| | | Remuneration Report | | | 73-90 | 81-101 |
| C | | Board practices | | | | |
| | | Corporate governance | | | 58-72 | 62-80 |
| D | | Employees | | | 20 | 33 |
| | | Note 10 – Employee costs | | | 113 | 125 |
| | | Note 28 – Pensions and post-employment benefits | | 128-136 | 140-148 |
| | | Shareholder informationFinancial record | | | 188 | 196 |
| E | | Share ownership | | | | |
| | | Note 42 – Employee share schemes | | | 161-165 | 171-174 |
| | | Share options | | | 75,78-80 | 91 |
| | | Incentive plans | | | 86,89 | 87-88 |
| | | Directors’ interests | | 96 |
857 | | Major shareholders and related party transactions | | |
| A | | Major shareholders | | 65,69,201 |
| B | | Related party transactions | | |
| | Note 35 – Related party transactions | | 154 |
| |
| | | | | | |
| Item | | | | Page | |
| |
7 | | Major shareholders and related party transactions8
| | | | |
A | | Major shareholders | | | 62,63,177 | |
B | | Related party transactions | | | | |
| | Note 35 – Related party transactions | | | 142 | |
|
8 | | Financial information | | | | |
| A | | Consolidated statements and other financial information | | | | |
| | Financial statements | | See item 18 | |
| | | Dividend policy | | | 3 | 4 |
| | | Note 44 – Legal proceedings | | | 169-176 | 178-185 |
| B | | Significant changes | | | | |
| | | Note 40 – Post balance sheet events | | | 151 | 161 |
| |
9 | | The offer and listing | | | | |
| A | | Offer and listing details | | | | |
| | | Share price listing | | | 193,194 | 201,202 |
| C | | Markets | | | 194 | 202 |
| |
10 | | Additional information10
| | Additional information | | |
| B | | Memorandum and Articles of Association | | | 198-200 | 206-208 |
| C | | Material contracts | | | n/a | |
| D | | Exchange controls | | | 194 | 202 |
| E | | Taxation | | | 196 | 204 |
| H | | Documents on display | | | 194 | 202 |
| |
11 | | Quantitative and qualitative disclosures about market risk | | | | |
| | | Treasury policies | | | 40-42 | 45-46 |
| | | Note 41 – Financial instruments and related disclosures | | | 152-161 | 162-171 |
| |
12 | | Description of securities other than equity securities | | | |
| D | | American Depositary Shares | | 208 | 217 |
| |
13 | | Defaults, dividend arrearages and delinquencies | | | n/a | |
| |
14 | | Material modifications to the rights of security holders and use of proceeds | | | n/a | |
| |
15 | | Controls and procedures15
| | | 65-67,72Controls and procedures | | 71-73,79 |
| |
16 | | [Reserved]16
| | [Reserved] | | |
| |
16A | | Audit Committee financial expert | | | 68 | 75 |
| |
16B | | Code of ethics16B
| | | 69Code of ethics | | 77 |
| |
16C | | Principal accountant fees and services | | | 112 | |
| | | Note 9 – Operating profit | | | | 124 |
| |
16D | | Exemptions from the listing standard for audit committees | | |
| | | | n/a | |
| |
16E | | Purchases of equity securities by the issuer and affiliated purchasers | | | | |
| | | Note 33 – Share capital and share premium account | | | 140 | 152 |
| |
16F | | Change in registrant’s certifying accountant16F
| | Change in registrants’ certifying accountant | | n/a | |
| |
16G | | Corporate governance16G
| | | 201-207Corporate Governance | | 209-216 |
| |
17 | | Financial statements17
| | Financial statements | | n/a | |
| |
18 | | Financial statements18
| | Financial statements | | |
| | | Report of Independent RegisteredRegulated Public Accounting Firm | | | 93 | 103 |
| | | Consolidated income statement | | | 94-95 | 104-105 |
| | | Consolidated statement of comprehensive income | | | 94-95 | 104-105 |
| | | Consolidated balance sheet | | | 96 | 106 |
| | | Consolidated statement of changes in equity | | | 97 | 107 |
| | | Consolidated cash flow statement | | | 98 | 108 |
| | | Notes to the financial statements | | | 99-176 | 109-185 |
| |
19 | | Exhibits | | Footnote (i),209,
218 |
| |
| | |
| Footnote (i) – see the company’s Form 20-F filing with the Securities and Exchange Commission. |
Footnote (i) - see the company’s Form 20-F filing with the Securities and Exchange Commission
GSK Annual Report 20092010

| | | | | | |
| | | | | | |
| | | | | | |
| | | | | | |
| | | |
| | |
| | | | | | |
| | |
| | | | | | |
| | |
| | | | | | |
| | |
| | | | | | |
| | |
| | | | | | |
| | |
| | | | | | |
www.gsk.com
Head Office and Registered Office
GlaxoSmithKline plc | | | | |
| 980 Great West Road | | | |
| Brentford, Middlesex TW8 9GS | | | |
| United Kingdom | | | | |
| Tel: +44 (0)20 8047 5000 | | | | |
| | | | | | |
| Registered number: 3888792 | | | | |
| | | | | | |
| Printed in the UK. The paper used | | | | |
| in the production of this document | | | | |
| is made from 100% post consumer | | | | |
| waste. The pulp is bleached using | | | | |
| a totally chlorine free process. | | | | |
Signature
The registrant hereby certifies that it meets all of the requirements for filing on Form 20-F and that it has duly caused and authorized the undersigned to sign this Annual Report on its behalf.
| | | | | |
| | GlaxoSmithKline plc
|
| | |
March 1, 20104, 2011 | By: | /s/ Julian Heslop | |
| | | Julian Heslop | |
| | | Chief Financial Officer | |
| |