Moreover, if there is a prolonged delay in obtaining the domestic free television programme service licence, we can. Our competitive position varies significantly by service type because each service is characterized by a different market. If we cannot compete effectively in a major market, our business, operating results and financial condition could be adversely affected.
Our new business in the provision of domestic free television programme services may not become profitable in the long term.
If the domestic free television programme service licence is granted, we will incur additional expenditure for programme production before we can generate revenue. In addition, given that the Multimedia Production Business is a new business venture and the industry standards, forincumbent, Television Broadcasts Limited has dominated the following reasons:viewership on domestic free television programme services by a large margin, we may not be able to become profitable in the long term.
The construction and development of a Television and Multimedia Production Centre is subject to a number of risks beyond our control.
Since February 2012, we have started building a Television and Multimedia Production Centre on land granted by Hong Kong Science and Technology Parks Corporation at Tseung Kwan O Industrial Estate. Construction of the Television and Multimedia Production Centre is expected to cost at least HK$800.0 million.
The construction and development of this Centre are subject to a number of risks which are beyond our control, including:
the possibility of construction delay or costs over run due to inclement weather, labor or material shortages, work stoppages market inflation and delayed regulatory approvals;
the possibility of discovering previously undetected defects or problems; and natural disasters, social disorder and other extraordinary events. The occurrence of any of these events could delay the construction and development of the Television and Multimedia Production Centre or increase our costs, which may in turn have a material adverse effect on | |||
The development of our Next Generation NetworkMultimedia Production Business and Distribution Business requires significant capital expenditures, which may not be available on terms satisfactory to us or may impose a burden on our other business activities.
We expect to incur capital expenditures ranging fromof approximately HK$320 million to HK$350700.0 million in 2011, a large2013, majority of which will be spent onfor the continued expansionbuilding of the Television and upgrade of our network.Multimedia Production Centre. While we intend to fund such expenditures by using our currently available cash, as well as cash flow from operations,unutilized banking facilities, we may not have adequate capital to fund our projected capital expenditures. Our ability to fund operating and capital expenditures depends significantly on our ability to generate cash from operations. In fiscal 2010, we generated cash from operating activities of HK$485.3 million. However, we cannot assure you that we will be able to sustain our operations in order to generate sufficient cash flows to meet our future requirements. Our ability to generate cash from operationsif there is subject to general economic, financial, industry, legal and other factors and conditions, many ofany event which are outside our control. In particular, our operations are subject to price and demand volatilitycould cause prolonged delay in the telecommunications industry.
If any ofwe fail to capture viewer preferences, our new services are not successful, our operating resultsbusiness prospects and reputation could be materially and adversely affected.
The success of our self-produced television content primarily depends on our ability to capture viewer preferences, which vary in different demographic groups and regions and could change rapidly. In general, the popularity of television content among viewers is mainly determined by the producer’s ability to originate and source viewer-engaging content, create high-quality scripts and characters that appeal to a broad range of viewers, and cast popular talents and directors. If the viewers’ reaction to our competitorstelevision content is largely different from timeour predicted viewer preferences, the success and popularity of the television content will be at risk. If our television content fails to time. If we do not anticipate these changes and rapidly adopt new and innovative services in response,perform as expected, we may not be able to fully captureestablish a strong reputation in television content production business and our business prospects could be materially and adversely affected.
Our business could be materially and adversely affected by claims of infringement of intellectual property rights.
Monitoring and preventing the opportunitiesunauthorized use of the Group’s intellectual property rights may be difficult, costly and time-consuming. If we are unable to adequately protect our copyrights and other intellectual property rights, these rights may be infringed, our business, financial condition, results of operations and prospects may be materially and adversely affected.
Moreover, third parties may claim that our self-produced television content misappropriates or infringes their intellectual property rights, including those with respect to their previous productions, scripts and characters. Any litigation regarding intellectual property rights could be costly and time-consuming and could divert the attention of our management and key personnel from our business operations. If we are unsuccessful in the market. Developmentdefending any such assertions or claims, our business, financial condition, results of new services, however, exposes us to the following risks:
13
The Multimedia Production Business requires the collaboration of many different work streams and people with different expertise, and hence our ability to emerging consumer trendsattract and demand. We cannot assure you thatretain high-quality production crew and popular talent artistes is a key factor for our success. Loss of producers, other members of our production team or talent artistes could adversely affect our production volume and quality and, as a result, we can generate satisfactory investment returns on any new service.
In addition, we face competition for high-quality production crew and popular talent artistes from other television content production companies and other organizations. Competition for these individuals could require us to offer higher compensation and other benefits in order to attract and retain them, which would increase our operating expenses.
We may needlose investor confidence in the reliability of our financial statements if we fail to improve ourachieve and maintain effective internal controlscontrol over financial reporting, which in turn could harm our business and adversely affect the trading prices of our independent auditors may not be able to attest to their effectiveness.ADRs.
Under the Sarbanes-Oxley Act of 2002, or the “Sarbanes-Oxley Act, adopted rules requiring every public company tomust include a management report on such company’sits internal controls over financial reporting in its annual report, which contains management’s assessment of the effectiveness of the company’s internal controls over financial reporting. Effective from September 21, 2010, the SEC adopted amendments to its rules and forms to conform them to Section 404(c) ofUnder the Sarbanes-Oxley Act, as added by Section 989G of the Dodd-Frank Wall Street Reform and Consumer Protection Act (the “Dodd-Frank Act”). Section 404(c) provides that Section 404(b) of the Sarbanes-Oxley Act shall not apply with respect to any audit report prepared for an issuer that is neither an accelerated filer nor a large accelerated filer. During fiscal 2010, we became an accelerated filer. Therefore, we are also required to have an independent registered public accounting firm to attest to and report on the effectiveness of our internal controls over financial reporting starting from fiscal 2010.
We have evaluated our internal controls surrounding the financial reporting process for the current fiscal period so that management can attest to the effectiveness of these controls, as required by Section 404 of the Sarbanes-Oxley Act of 2002. We have implemented appropriate steps to strengthen the internal controls. However, we may identify conditions that could result in significant deficiencies or material weaknesses in the future.weaknesses. As a result, we could experience a negative reaction in the financial markets and incur additional costs in improving the condition of our internal controls. For a detailed discussion of controls and procedures, see Item 15 “Controls and procedures.”
Notwithstanding our efforts, our management may subsequentlycould conclude that our internal controlscontrol over financial reporting areis not effective. Further, even if our management concludes that our internal controls over financial reporting are effective, our independent registered public accounting firm may conclude that our internal control over financial reporting is not effective. If we do not successfully design and implement changes to our internal controls and management systems, or if we fail to maintain the adequacy of these controls as such standards are modified or amended from time to time, we may not be able to comply with Section 404(a) of the Sarbanes-Oxley Act. This could subject us to regulatory scrutiny and penalties that may result in a loss of public confidence in our management, which could, among other things, adversely affect our customer and vendor confidence, stock price and our ability to raise additional capital and operate our business as projected.
14
Our future success is dependentdepends upon the continued service of our key executives and Talents (All individuals employed by the Group, including directors of the Company are defined as “Talents” hereafter). While we have employment agreements with members of our senior management, we cannot assure you that we will be able to retain these senior management.Talents. If one or moreany of our key personnel were unable or unwilling to continue in their present positions or if they joined a competitor or formed a competing company, or if they shifted their focus away from Hong Kong operations, we may not be able to replace them easily, our business may be significantly disrupted and our financial condition and results of operations may be materially adversely affected.disrupted. Furthermore, as our industry is characterized by high demand and increased competition for Talents, we may need to offer higher compensation and other benefits in order to attract and retain key personnel in the future.personnel. We cannot assure you that we willmight not be able to attract and retain the key personnel that we will need to achieve our business objectives.
15
16
17
We are exposed to a certain amount of foreign exchange risk because our revenues areexpected revenue will be predominantly denominated in Hong Kong dollars, while a majorcertain portion of our operating costs are expected to be denominated in U.S. dollars, Renminbi or other foreign currencies. Our foreign currency-denominated expenses primarily consist of the following:
Although the Hong Kong dollar has been linked to the U.S. dollar since 1983 at the rate of HK$7.80 per US$1.00. We, however, cannot assure you the link will1.00, it may not continue to be maintained in the future.linked. Any depreciation of the Hong Kong dollar against the U.S. dollar, Renminbi or other currencies would increase our operating costs, including our debt servicing costs, make our capital expenditure plans more expensive and adversely affect our profitability.
Our Chairman and Vice Chairman have significant ownership interest in the company. We cannot assure you that our Chairman and Vice Chairman will notThey could engage in any transactions that lead to conflicts of interest resulting from their ownership interestsinterests..
Our Chairman and Vice Chairman each have an indirect ownership interest in theour Company through Top Group International Limited, (“Top Group”), which, as of December 14, 2010,18, 2012, held approximately 44.22%42.00% of the Company’s shares, of which 42.12% and 27.06% was owned by our Chairman and Vice Chairman, respectively. Top Group International Limited is a special purpose vehicle incorporated in the British Virgin Islands. Its board of directors consists of Mr. Wong and Mr. Cheung. Mr. Wong and Mr. Cheung have entered into a voting agreement pursuant to which they agreed to vote the 339,814,284 shares held by Top Group International Limited, the 7,145,28915,236,893 shares held by Mr. Wong individually, and the 42,286,15950,377,763 shares held by Mr. Cheung individually, collectively as a group. We cannot make assurances that ourOur Chairman orand Vice Chairman will notcould take actions that may not be in the best interests of our other shareholders.
Item 4 InformationWe may be classified as a passive foreign investment company, which could result in adverse U.S. federal income tax consequences to U.S. Holders of our American depository shares or ordinary shares.
Based on the Company
Risks relating to our ADSs.
As a foreign private issuer, we are not subject to U.S. proxy rules and are subject to Exchange Act reporting obligations that, to some extent, are more lenient than those of a U.S. issuer.
As a foreign private issuer, we are exempt from certain provisions of the Exchange Act that are applicable to U.S. domestic issuers, including (i) the sections of the Exchange Act regulating the solicitation of proxies, consents or authorizations in respect of a security registered under the Exchange Act, (ii) the sections of the Exchange Act requiring insiders to file public reports of their stock ownership and trading activities and liability for insiders who profit from trades made in a short period of time, and (iii) the rules under the Exchange Act requiring the filing with the SEC of quarterly reports on Form 10-Q containing unaudited financial and other specified information, or current reports on Form 8-K, upon the occurrence of specified significant events. In addition, the executive compensation disclosure requirements to which we are subject under Form 20-F are be less rigorous than those required of U.S. issuers under Form 10-K. Furthermore, foreign private issuers are not required to file their annual report on Form 20-F until 120 days after the end of each fiscal year, while U.S. domestic issuers that are not large accelerated filers or accelerated filers are required to file their annual report on Form 10-K within 90 days after the end of each fiscal year. Foreign private issuers are also exempt from the Regulation FD, aimed at preventing issuers from making selective disclosures of material information.
Holders of ADSs must act through the depositary to exercise their rights as shareholders of our company.
Holders of our ADSs do not have the same rights of our shareholders and may only exercise the voting rights with respect to the underlying ordinary shares in accordance with the provisions of the deposit agreement for the ADSs. When a general meeting is convened, you may not receive sufficient notice to permit you to withdraw your ordinary shares to allow you to cast your vote with respect to any specific matter. In addition, the depositary and its agents may not be able to send voting instructions to you or carry out your voting instructions in a timely manner. We will make all reasonable efforts to cause the depositary to extend voting rights to you in a timely manner, but you might not receive the voting materials in time to ensure that you can instruct the depositary to vote your ADSs. Furthermore, the depositary and its agents will not be responsible for any failure to carry out any instructions to vote, for the manner in which any vote is cast or for the effect of any such vote. As a result, you may not be able to exercise your right to vote and you may lack recourse if your ADSs are not voted as you requested. In addition, in your capacity as an ADS holder, you will not be able to call a shareholders’ meeting.
The depositary for our ADSs will give us a discretionary proxy to vote our ordinary shares underlying your ADSs if you do not vote at shareholders’ meetings, except in limited circumstances, which could adversely affect your interests. Holders of our ordinary shares are not subject to this discretionary proxy.
You may be subject to limitations on transfers of your ADSs.
Your ADSs are transferable on the books of the depositary. However, the depositary may close its transfer books at any time or from time to time when it deems expedient in connection with the performance of its duties. In addition, the depositary may refuse to deliver, transfer or register transfers of ADSs generally when our books or the books of the depositary are closed, or at any time if we or the depositary deems it advisable to do so because of any requirement of law or of any government or governmental body, or under any provision of the deposit agreement, or for any other reason.
Your right to participate in any future rights offerings may be limited, which may cause dilution to your holdings and you may not receive cash dividends or other distributions if it is impractical to make them available to you.
We may from time to time distribute rights to our shareholders, including rights to acquire our securities. However, we cannot make rights available to you in the United States unless we register the rights and the securities to which the rights relate under the Securities Act or an exemption from the registration requirements is available. Also, under the deposit agreement, the depositary will not make rights available to you unless either both the rights and any related securities are registered under the Securities Act, or the distribution of them to ADS holders is exempted from registration under the Securities Act. We are under no obligation to file a registration statement with respect to any such rights or securities or to endeavor to cause such a registration statement to be declared effective. Moreover, we may not be able to establish an exemption from registration under the Securities Act. Accordingly, you may be unable to participate in our rights offerings and may experience dilution in your holdings.
ITEM 4 INFORMATION ON THE COMPANY
| A. | History and development of the Company |
The legal and commercial name of theour Company is City Telecom (H.K.) Limited. The Company wasWe were incorporated on May 19, 1992 under the Hong Kong Companies Ordinance and is a limited liability company. Our registered office is located at Level 39, Tower 1, Metroplaza, No. 223 Hing Fong Road,13th Floor, Trans Asia Centre, No.18 Kin Hong Street, Kwai Chung, New Territories, Hong Kong, telephone (852) 3145-6888. Our agent for U.S. federal securities laws purposes is CT Corporation System, 111 Eighth Avenue, New York, NY 10011.
We began offering international telecommunications services in September 1992. In our early stage of development, we focused on increasing our subscription base1992 and amount of international traffic, and on building the CTI brand name as a low cost provider of international telecommunications services. In addition to our operations in Hong Kong, we also provide international telecommunications and Internet access services in Canada through two telecommunications companies in Canada, City Telecom Inc. and City Telecom (B.C.) Inc. We acquired our interests in these companies in December 1998 as part of our efforts to increase our market share of the telecommunications traffic between Canada and Hong Kong.
In December 2009, we submitted an application to the HKBA to obtain a domestic free television programme service licence in Hong Kong, which is still subject to be granted.
In August 2011, Hong Kong Science and Technology Parks Corporation granted us a parcel of land in Tseung Kwan O Industrial Estate, New Territories to build a Television and Multimedia Production Centre. Expected to be completed in 2014, the Centre will possess a gross floor area of approximately 500,000 square feet and consist of 12 studios, including an 18,000 square feet studio, which is expected to be the largest in Hong Kong and smaller studios of 3,000 square feet each. The networkCentre will become our headquarter.
In March and April 2012, we entered into the Telecom Group Agreement and the Guangzhou Agreement, respectively, and in May 2012, we completed the very substantial disposal transaction of both the FTNS business and the IDD business. Since then, the Multimedia Production Business has become the capability of providing value-added broadband services and content that combine voice, data and images with increased efficiency and flexibility.
Since mid-2011, we embarked a large scale recruitment process in the multimedia industry. From creative directors to post-production professionals, we now have a professional team of more than 500 talents together with about 220 artistes. In April 2012, we started our success has beenproduction, and so far, we have completed shooting for four television drama series with four others in progress (ranging from 10–30 hours per series). Our infotainment and variety programmes cover a spectrum of programmes with no boundary on subjects and locations, ranging from world class productions, such as “Challenge” to execute impossible missions including chasing a hurricane in the United States, climbing into a live volcano in Vanuatu, etc., to programmes introducing domestic local culture, such as “Secret of Food.”
Upon the disposal of the Telecom Business, the news production operation unit remained with the Company and will continue to provide news content to the Telecom Business for their bbTV broadcasting use under a licensing arrangement. Once our abilitybroadcasting start, our news production operation unit will fully support the news programme production.
Apart from the above self-produced programmes, we also purchased popular and high quality contents from Japan, Korea and Mainland China including television drama series and cartoons. To adapt to quickly expandlocal audiences, we maintain a professional dubbing team for the post production process, including dubbing to local language and subtitling. As of August 31, 2012, we had more than 850 episodes of purchased content in our service offerings when changes in regulation or technology have provided us with an opportunity to do so. library.
Some of the key events in our history and development include the following:
In October 2006, our Liu Xiang “Be Ahead of Yourself” marketing campaign won the “Certificate of Excellence” of HKMA/TVB Awards for Marketing Excellence 2006.
18
In February 2007, we launched our “bb50 and bb200” symmetric residential broadband service supported by our special duty unit (“SDU”), personalized customer care service.
In June 2007, we were awarded “Best Retention Strategies” at the Hong Kong HRM Awards 2007.
In July 2007, we were awarded “Integrated Support Team” of the year at the Asia Pacific Customer Service Consortium Customer Relationship Excellence Awards.
In September 2007, we launched “Fibre-To-The-Home” residential broadband service, “FibreHome100”, “FibreHome200” and “FibreHome1000.” At the same time, we upgraded our entry level service broadband Internet access from 10 Mbps to 25 Mbps.
In January 2008, we began to offer our “Dual Mode High Definition Terrestrial TV Receiver and IPTV Set-Top Box” to all of our customers in Hong Kong.
In February 2008, we were awarded contract for the provision of payphone service at the Hong Kong International Airport.
In September 2008, we launched the National Geographic Channel’s first ever interactive channel.
In June 2009, we launched the first online broadband service registration platform in Hong Kong.
In November 2009, we accepted the Innovation in Recruitment award and Champion of HR award at the Hong Kong HRM Awards 2009.
In December 2009, we shattered the one-million mark for fixed telecommunications network services subscriptions.
In December 2009, we submitted an application to the HKBA to obtain a domestic free television programme service licence in Hong Kong.
In March 2010, we launched our “bb100” symmetric broadband and WiFi services at Hong Kong International Airport.
In April 2010, we launched our 1Gbps symmetric residential broadband service at HK$199 per month.
In December 2010, we launched “Music One”, a high definition online music portal.
In February 2012, we commenced construction of the Television and Multimedia Production Centre.
In May 2012, we disposed of our FTNS Business and IDD Business.
On December 5, 2012, we circulated a notice to our shareholders that the proposed change of our name from “City Telecom (H.K.) Limited” to “Hong Kong Television Network Limited” will be considered at our extraordinary general meeting to be held on December 31, 2012.
Principal Activities
Prior to May 2012, we principally engaged in providing residential and corporate fixed telecommunications network and international telecommunications services. We specialize in the residential mass market and small-to-medium corporate and enterprise market segments. The majority of our revenues are derived from business conductedservices in Hong Kong.
| For the year ended August 31, | ||||||||||||
| 2008 | 2009 | 2010 | ||||||||||
| HK$ | HK$ | HK$ | ||||||||||
| (Amounts in thousands) | ||||||||||||
Revenue | ||||||||||||
| FTNS business | 1,011,038 | 1,230,880 | 1,356,098 | |||||||||
| IDD business | 291,943 | 247,359 | 218,589 | |||||||||
| Total operating revenue | 1,302,981 | 1,478,239 | 1,574,687 | |||||||||
19
Based on our current plan, the Multimedia Production Business is expected to generate revenue during 2013 which will comprise advertising fees and licensing fees, assuming the Multimedia Production Business is able to start broadcasting over its free television channels or through alternative means. The Multimedia Production Business generated HK$3.8 million of revenue in fiscal 2012, which mainly represented the licensing fee received from the Telecom Business to broadcast the news content produced by the news production operation unit and the income received from our artiste management functions.
Our strategyvision is to market multiple fixed telecommunications network services by capitalizing onunleash the new in-building blockwiring we have done on a mass scale for our Next Generation Networkcreative potential of drama production in Hong Kong and will focus on growing our market share, increasing our network coverage and introducing new services through our IP platform. to support the nurture of large numbers of writers in the coming years, so as to bring Hong Kong back to the position of Asian drama production hub.
We believe that our success in the Multimedia Production Business will continue to depend on our ability to capitalize on our focus on the residential mass and small-to-medium corporate and enterprise market segments, our leading-edge Next Generation Network, and our first mover advantage in the fixed line telecommunications market, which has a high entry barrier.
Recruitment of top-tier talents in the multimedia industry. Since mid-2011, we have embarked on a large scale recruiting process to acquire top-tier talents in the multimedia industry. From creative directors to post-production professionals, we now have a professional team of more than 500 talents together with about 220 artistes. At present, we have completed shooting for four television drama series and have four other series in progress. These series range from 10 to 30 hours in duration. Our talents are also engaged in the production of news programmes and a wide spectrum of infotainment and variety programmes.
Creative driven production. To encourage variety and quality in our content production, we intend to extend the creative period for television drama series from approximately three months to approximately six months to enable a much larger room for greater creativity and more possibilities.
First-class production facilities. We are committed to investing resources in first-class production facilities. After our groundbreaking ceremony in February 2012, the construction of the Centre reached a milestone in October 2012 when we completed the foundation work. We are now in the tendering stage on superstructural work. Once completed, the Centre will possess gross floor area of approximately 500,000 square feet and consist of 12 studios, including an 18,000 square feet studio which is expected to be the largest in Hong Kong and smaller studios of 3,000 square feet each. Construction work is expected to be completed in 2014. The Centre will be our headquarter. In addition to the Centre, we also invest Hollywood movie grade production equipment. We believe we are the first in the free television platform to use Hollywood grade ARRI cameras for television drama series production in Hong Kong. We also intend to have post-production facilities and technology compatible with 3D, 4k or even 8k super-high standards.
Procurement of high-quality television contents. In addition to programmes produced in-house, we also purchased popular and high quality contents from Japan, Korea and Mainland China, including television drama series and cartoons. To cater to local audience, we maintain a professional team for language dubbing and subtitling post-production. As of August 31, 2012, we had more than 850 episodes of purchased contents in our library. With the assumption that we can start broadcasting in the second half of 2013, we intend to double our 2012 production output on television drama series, infotainment and variety programmes in 2013.
Recent Development
On December 31, 2009, we submitted an application for the domestic free television programme service licenselicence in Hong Kong to the Broadcasting Authority.HKBA. If granted, such licenselicence would allow us to provide free television programme services in Hong Kong. We expectThe HKBA completed the cumulative investment amount to be approximately HK$210 million before we are able to generate positive cash flow from such services. We completed a public offeringassessment of our American depositary shares, or ADSs,application for the domestic free television programme service licence in April 2010accordance with the Broadcasting Ordinance and expectestablished procedures, and submitted its recommendation for the grant of licence to usethe Chief Executive in Council on July 13, 2011. The Chief Executive in Council is still processing the recommendation. As of December 18, 2012, the grant of such licence was still pending.
Aiming to expand its foothold in domestic free television programme services and the Multimedia Production Business, City Telecom is establishing a portionworld-class Television and Multimedia Production Centre on the land granted by Hong Kong Science and Technology Parks Corporation at Tseung Kwan O Industrial Estate. It will produce drama series and a variety of television contents, in order to support the development of the net proceedsGroup’s domestic free television programme services and Multimedia Production Business and the demand and development of this offeringthe Group’s business partners.
The Television and Multimedia Production Centre will have a total estimated gross floor area of approximately 500,000 square feet which will take City Telecom an investment of at least HK$800.0 million. It is expected to fund such services.
We offer our fixed telecommunications network services through our Next Generation Network.commenced construction of the Television and Multimedia Production Centre in February 2012 and in October 2012, we have completed the foundation works for the Centre and has obtained approval from the Buildings Department in Hong Kong. The high capacityconstruction is under the tender process for the superstructural works.
In May 2012, we disposed of our fiber-based backbone has enabled us to offer a suite of services on a single IP network platform. These services include our broadband Internet access, local VoIP, IP-TVFTNS Business and corporate data services. Our strategy is to leverage our broadband subscription base to up-sell our other fixed telecommunications network servicesIDD Business.
Sales and marketing
We hold public events such as local VoIPpress conferences, road shows and IP-TV.
20
| As of August 31, | ||||||||||||
| 2008 | 2009 | 2010 | ||||||||||
| Broadband Internet access | 316,000 | 391,000 | 526,000 | |||||||||
| Local VoIP | 329,000 | 382,000 | 431,000 | |||||||||
| IP-TV | 156,000 | 170,000 | 153,000 | |||||||||
| Total FTNS subscriptions | 801,000 | 943,000 | 1,110,000 | |||||||||
21
22
23
Research and our switching centers in Hong Kong to our subscribers’ premises. All the buildings covered by us are served by our self-owned infrastructure.
24
25
Seasonality
Environmental matters
Since our date of incorporation, we have not violated any environmental laws, ordinances or regulations, and believe that all of our operations comply fully with applicable environmental laws.
Intellectual property rights
We have registered our trademarks with the Trademarks Registry of the Intellectual Property Department in Hong Kong. We have no other material intellectual property.
| C. | Regulatory framework |
The following is a brief summary of the Hong Kong laws and regulations that currently materially affect our business. This section does not purport to be a comprehensive summary of all present and proposed regulations and legislation relating to the industries in which we operate.
Prior to April 1, 2012, the Hong Kong broadcasting industry was regulated by the HKBA. In view of broadband Internet access, local VoIP, IP-TVthe blurring boundaries between telecommunications and internationalbroadcasting industries and following the global trend in converging the two markets, on April 1, 2012, the Communications Authority Ordinance (Cap. 616) came into operation and the HKCA was set up as the unified regulatory body servicing the telecommunications servicesand broadcasting sectors in Hong Kong. The HKBA was dissolved after the transfer of its statutory powers and functions to the HKCA.
We submitted our application for the domestic free television programme service licence in Hong Kong to the HKBA on December 31, 2009 and the application is being processed. Once such licence has been granted, we will be regulated by the HKCA through its executive arm, the Office of the Communications Authority, and our broadcasting operations arewill be subject to the TelecommunicationsBroadcasting Ordinance (Cap. 562), the Broadcasting (Miscellaneous Provisions) Ordinance (Cap. 391) and the Broadcasting Ordinance and their respectiverelated subsidiary legislation, regulations, directions, orders, determinations and codes of practice. The Telecommunications Ordinance providespractice issued by the legislativeHKCA and regulatory framework for the provision of telecommunications services and facilities in Hong Kong.licence conditions. The Broadcasting Ordinance governs the content and scope of television programming and the licensing of television broadcasters.
26
27
28
29
At present, Hong Kong has two licensed domestic free television programme broadcasters, TVBTelevision Broadcasts Limited and ATV,Asia Television Limited, providing free-to-air broadcasting services. In addition, there are also three licensed domestic pay-TV broadcasters, namely Hong Kong Cable Television Limited, PCCW Media Limited and TVB Pay Vision Limited (formerly known as Galaxy Satellite Broadcasting Limited). HKBN provides TV services overCurrently, the Internet underChief Executive in Council is processing applications for domestic free television programme service licence from Fantastic Television Limited, HK Television and Entertainment Company Limited and us. As of December 18, 2012, the Chief Executive in Council had not yet announced its FTNS License, while Star TV continues to provide its services through satellite means under its satellite television uplink and downlink license.
Licensing
It is unlawful to offer any “television programme service” in Hong Kong without a license.an appropriate licence. “Television programme service” is broadly defined to mean the provision of television programmes for transmission by telecommunications that are readily accessible to the general public in or outside Hong Kong or to persons in 2two or more specified premises simultaneously or on demand, whether on a point-to-point or a point-to-multipoint basis.basis (or any combination thereof), having equipment appropriate for receiving that service. The Broadcasting Ordinance exempts certain categories of television programme services from the current licensing regime, including television programme services provided on the service commonly known as the “Internet”. The Broadcasting Ordinance itself, however, does not contain a definition of “Internet”.
Cross media ownership restrictions
As with other television regulatory regimes, there are detailed cross-media ownership restrictions in the Broadcasting Ordinance. The restrictions are only applicable to domestic free and domestic pay television programme service licenses.
The Broadcasting Ordinance essentially provides that a company which is either a “disqualified person” or has a “disqualified person” exercising control over it will not be eligible to be granted a broadcasting licensedomestic free and domestic pay television programme service licence unless it discloseswith the disqualificationprior approval of the Chief Executive in its license application.Council. “Disqualified person” includes, for example, a company which is an existing domestic free or domestic pay television programme licensee; an advertising agent; a sound broadcasting licensee; or a proprietor of newspaper printed or produced in Hong Kong.
Generally, a disqualified person who has complied with the disclosure requirementdisclosed its disqualification in its licence application may apply for a broadcasting license.licence. The Broadcasting Ordinance provides that the Chief Executive in Council may grant a broadcasting licenselicence to a company, including a disqualified person or to a company which has a disqualified person exercising control over it, or to a disqualified person in which another disqualified person exercises control subject to such conditions as the Chief Executive in Council sees fit.
Foreign ownership restrictions
In addition to the cross-media ownership restrictions outlined above, the Broadcasting Ordinance also imposes restrictions on foreign ownership of a holder of a domestic free television programme service license.licence. The restrictions do not prohibit the ownership of any voting shares in a domestic free television programme service licensee but rather take the form of prohibiting the exercise of any voting rights attached to such voting shares.
Upon receiving a domestic free television programme service licence, an unqualified voting controller of our Company will be subject to the voting restrictions as set out in Part 3 of Schedule 1 to the Broadcasting Ordinance. An “unqualified voting controller” under the Broadcasting Ordinance refers to a voting controller who is not a qualified voting controller, and a qualified voting controller refers to a voting controller who satisfies the ordinary resident requirement and who, in the case of an individual, has resided in Hong Kong for a period of no less than seven years or in the case of corporation, whose directors satisfy the Hong Kong residency requirement. According to paragraph 20(1) of Schedule 1 to the Broadcasting Ordinance, no unqualified voting controller may hold, acquire, or exercise or cause or permit to be exercised 2% to 6% or 6% to 10% or more than 10% of the total voting control of a domestic free television programme service licensee without the prior approval of the HKCA. If an unqualified voting controller holds more than 10%, in the aggregate, of the total voting control of a licensee without the prior approval in writing of the HKCA, notwithstanding anything contained in the memorandum or articles of association of the licensee or any provision of the laws of Hong Kong apart from this section, he shall not exercise or cause or permit to be exercised, in relation to any question or matter arising at a general meeting of the licensee, voting rights exceeding, in the aggregate, 10% of the total voting control of the licensee. Paragraph 20(3) of Schedule 1 to the Broadcasting Ordinance provides that the HKCA may, in respect of any unqualified voting controller who is in contravention of such voting restriction, direct such unqualified voting controller in question to cease any such contravening act. If and when the licence is granted to our Company, an unqualified voting controller may need to seek the requisite approval of the HKCA for exercising its voting power in our Company. Our Company shall be required to notify the HKCA of the unqualified voting controller pursuant to the directions of the HKCA and paragraphs 22 and 30 of Schedule 1 to the Broadcasting Ordinance
Competition provisions
Currently, competition provisions governing the broadcasting sector in Hong Kong are set out in the Broadcasting Ordinance, also contains competition provisions, which are aimed at prohibiting a licensee from engaging in “anti-competitive conduct” and a licensee who is in a dominant position from abusing its position. “Anti-competitive conduct” is defined as conduct that has the purpose or effect of preventing, distorting or substantially restricting competition in a television programme service market.
The Broadcasting Ordinance provides that a breach of any of the competition statutory provisions may lead to the relevant contractual provisions in an agreement being regarded as void.
There is no equivalent of a specialized competition appeal board for the television broadcasting industry. A licensee aggrieved by a decision made by the Broadcasting Authority,HKCA, may appeal by way of petition to the Chief Executive in Council.
Hong Kong’s first cross sector competition legislation, the Competition Ordinance, was enacted on June 14, 2012 and will be implemented in phases commencing on January 18, 2013. The Competition Ordinance spans various industries and sectors and, once it comes into full operation, will amend or repeal (as applicable) the competition provisions currently in force in the industry-specific legislation. As at the date hereof, the effective dates of the provisions of the Competition Ordinance that affect the Broadcasting Ordinance have not been gazetted.
Part 8 of Schedule 8 of the Competition Ordinance sets out the detailed amendments to the competition provisions in the Broadcasting Ordinance. Under such amendments, the relevant competition provisions (sections 13 to 16) in the Broadcasting Ordinance are to be repealed and replaced by the conduct rules under Part 2 of the Competition Ordinance.
According to Part 11 of the Competition Ordinance, both the HKCA and the Competition Commission are competent regulators and have concurrent jurisdiction on competition matters relating to telecommunications and broadcasting. The Competition Ordinance also provides a mechanism whereby such telecommunications and broadcasting related competition matters may be transferred between the HKCA and the Competition Commission. It is envisaged that in addition to the various codes and guidelines on competition related matters issued by the HKCA (and formerly the HKBA), new guidelines will be issued by the Competition Commission on the interpretation of the conduct rules. The HKCA and the Competition Commission will enter into a Memorandum of Understanding to provide more clarity on the operation of the competition regime in telecommunications and broadcasting sectors.
Fair Trading
On July 17, 2012, the Trade Descriptions (Unfair Trade Practices) (Amendment) Ordinance 2012 (“Amendment Ordinance”) was enacted to amend the Trade Descriptions Ordinance by prohibiting specified unfair trade practices that may be deployed against customers and strengthen the enforcement mechanism. The Customs and Excise Department is the principal enforcement agency under the Trade Descriptions Ordinance. Under the Amendment Ordinance, the HKCA was conferred with concurrent jurisdiction to enforce the new fair trading sections in relation to the commercial practices of licensees under the Telecommunications Ordinance and the Broadcasting Ordinance that are directly connected with the provision of telecommunications and broadcasting services. The Amendment Ordinance is expected to come into effect by the second quarter of 2013.
The key amendments introduced in the Amendment Ordinance include:
the expansion of the definition of trade descriptions in relation to goods, as well as the extension of the scope to cover services;
30
the creation of new criminal offences on unfair trade practices, namely misleading omissions, aggressive commercial practices, bait advertising, bait-and-switch and wrongly accepting payment;
the introduction of a compliance-based mechanism under which civil enforcement options, namely the acceptance of undertaking from traders and the seeking of injunction from the court where necessary, can be drawn on to promote compliance with the new fair trading sections introduced by the Amendment Ordinance; and
the creation of a new private right of action for damages to facilitate consumer redress.
The Amendment Ordinance also confers the Customs and Excise Department and the HKCA, as enforcement agencies, powers to issue guidelines on relevant fair trading matters. On December 7, 2012, the Customs and Excise Department and the HKCA launched a public consultation on the draft enforcement guidelines “Compliance and Enforcement Policy Statement” and “General Guidelines” (collectively the “Enforcement Guidelines”) concerning the Amendment Ordinance. The draft Enforcement Guidelines set out the manner in which the two enforcement agencies will exercise their powers under the new fair trading sections of the Amendment Ordinance and providing guidance on the operation of the provisions for compliance by traders. The consultation will last for six weeks till January 17, 2013.
In addition to the Broadcasting Ordinance, the Broadcasting (Miscellaneous Provisions) Ordinance and the related subsidiary legislation, regulations, directions, orders and determinations, a television programme service licensee is required to comply with the programterms and conditions of their licence and the codes of practice issued by the HKCA, which set out generic standards with respect to programme, advertising and technical standards applicable to the licensee. The Generic Codes of Practice for Television currently comprises of three sets of standards, i.e. the programme standards, the advertising standards and the advertising standards published bytechnical standards. These codes are reviewed in consultation with the Broadcasting Authority.licensees and the general public. The latest programprogramme standards and the advertising standards were both issued on December 12, 2008.
Non-compliance by licensee
Non-compliance by a licensee with the Broadcasting Ordinance, any subsidiary legislation made pursuant to it, any of the licence conditions or any direction issued by HKCA or any of the code of practice, could result in the revocation or suspension of the relevant licence. The Broadcasting Ordinance contains a set of provisions setting forth the procedural steps which HKCA and the Chief Executive in Council must adhere to prior to revoking or suspending any broadcasting licences.
| D. | Organizational structure |
The following chart sets forth our principal subsidiaries as of December 14, 2010:
31
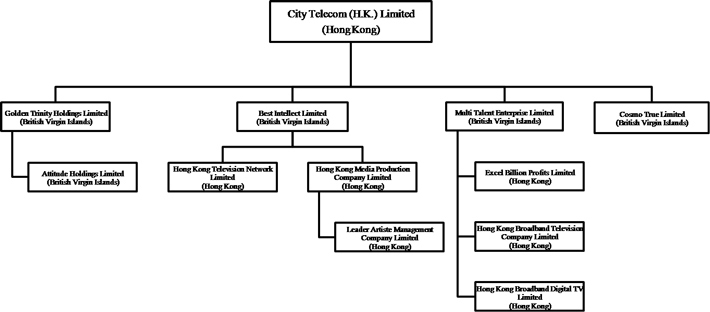
Name | Jurisdiction of incorporation | Percentage of interest held by City Telecom | |||||||||||||
| Direct | |||||||||||||||
Attitude Holdings Limited | British Virgin Islands | — | 100 | % | |||||||||||
Best Intellect Limited | British Virgin Islands | 100 | % | — | |||||||||||
Cosmo True Limited | |||||||||||||||
| British Virgin Islands | 100 | % | — | ||||||||||||
Excel Billion Profits Limited | Hong Kong | — | 100 | % | |||||||||||
Golden Trinity Holdings Limited | British Virgin Islands | 100 | % | — | |||||||||||
Hong Kong Broadband Digital TV Limited | Hong Kong | — | 100 | % | |||||||||||
Hong Kong Broadband Television Company Limited | Hong Kong | — | 100 | % | |||||||||||
Hong Kong Media Production Company Limited | Hong Kong | — | 100 | % | |||||||||||
Hong Kong Television Network Limited | Hong Kong | — | 100 | % | |||||||||||
Leader Artiste Management Company Limited | Hong Kong | — | 100 | % | |||||||||||
Multi Talent Enterprise Limited | British Virgin Islands | 100 | % | — | |||||||||||
| E. | ||
As of August 31, 2010.
To produce high quality drama, we had invested in production equipment underground cablesincluding Hollywood movie grade camera and other necessary components for the constructionpost-production facilities and upgradetechnology. As of our Next Generation Network, and for our VoIP equipment. In order for new subscribers to be able to access our IP-TV services,August 31, 2012, we must install an
32
ITEM 5 OPERATING AND FINANCIAL REVIEW AND PROSPECTS
Prior to May 2012, we principally engaged in providing residential and corporate fixed telecommunications network services in Hong Kong. We offer our customers an integrated suite of broadband Internet access, local VoIP, IP-TVservice and corporate datainternational telecommunications services through our self-owned Next Generation Network. Our network covered 1.77 million residential homes pass as of August 31, 2010, representing approximately 80% of the total households in Hong Kong and is concentrated in Hong Kong’s most densely populated areas, which reducesCanada. We derived our costrevenue from two business segments, the FTNS Business and the IDD Business. In March and April 2012, we entered into the Telecom Group Agreement and the Guangzhou Agreement and in May 2012, we disposed of network deployment per home pass. Asthe entire FTNS Business and IDD Business. Since then, the Multimedia Production Business has become our principal focus. The Multimedia Production Business includes the production, sales and distribution of August 31, 2010, our FTNS business had a subscription baseCantonese television drama series, news programmes and other television programmes. It will also include the offering of approximately 1,110,000 subscriptions. In addition, we offer a variety of international telecommunications services, including direct dial services, international calling cards and mobile call forwardingtelevision programming services in Hong Kong. AsKong, subject to the grant of August 31, 2010,the domestic free television programme service licence by the Chief Executive in Council. The operating results of the disposed Telecom Business and the Multimedia Production Business have been presented, as discontinued operations and continuing operations, respectively, in our IDD business had a subscription base of approximately 2.4 million registered accounts.
Factors affecting our results of continuing operations
Our revenues
Based on our current plan, the Multimedia Production Business is expected to generate revenue during 2013 which will mainly comprise advertising fees and licensing fees, assuming the Multimedia Production Business is able to start broadcasting over its free television channels or through alternative means. In fiscal 2012, our revenue represented the licence fee received from two business segments: our FTNS businessthe Telecom Business for providing news content produced by the news production operation unit and our IDD business. Our FTNS business primarily consists of broadband Internet access, local VoIP, IP-TV and corporate data services, while our IDD business primarily consists of direct dial services, international calling cards and mobile call forwarding services.
Our operating expenses
Our operating expenses consist of networkcost of sales and other operating expenses.
Cost of sales. Cost of sales refers to talent costs and other production costs which are directly attributable to the revenue generated from licensing of programme rights and provision of artiste management services.
Other operating expenses.
|
33
The following discussion and analysis is based on our consolidated financial statements, which have been prepared in accordance with IFRSs for the fiscal years ended August 31, 2008, 2009 and 2010. Our significant accounting policies are more fully described in note 1 to our consolidated financial statements.statements included elsewhere in the annual report.
The preparation of our consolidated financial statements in conformity with IFRSs requires management to make estimates and judgments that affect the reported amounts of assets, liabilities, revenues and expenses and the disclosure of contingent assets and liabilities. We continually evaluate our estimates and judgments including those related to fixed assets, provision for doubtful accounts,intangible assets, programme cost and deferred taxes, USC charges and certain revenue items.taxes. We base our estimates and judgments on historical experience and on various other factors we believe to be reasonable under the circumstances. This forms the basis for making judgments about the carrying values of assets and liabilities that are not readily apparent from other sources. Actual results may differ from these estimates as facts, circumstances and conditions change. The estimates and underlying assumptions are reviewed on an ongoing basis. Changes to accounting estimates are recognized in the period in which the estimate is changed if the change affects only that period or in the period of the change and future periods if the change affects both current and future periods.
As our financial statements are prepared under IFRSs, our accounting policies are necessarily compliant with all aspects of IFRSs. IFRSs are based on a “substance over form” conceptual framework that requires us to look through the legal interpretation of an arrangement or transaction to its underlying purpose and to reflect it in our consolidated financial statements on that basis.
The following are the most significant accounting estimates and judgments we apply in producingpreparing our consolidated financial statements.
34
We estimate the useful lives of fixed assets in order to determine the amount of depreciation expense to be recorded. The useful life of an asset is estimated at the time the asset is acquired based on historical experience, the expected usage, wear and tear of the asset, as well as technical obsolescence arising from changes in the market demands or service output of the asset. Changes in technology or industry conditions may cause the estimated period of use or the value of these assets to change. We perform periodic reviews to confirm the appropriateness of estimated economic useful lives for each class of fixed assets. For the three years ended August 31, 2010,2012, there were no changes in the useful lives of our fixed assets.
Intangible assets
Upon the completion of the disposal of the Telecom Business and as part of the consideration received from the disposal, we were granted the indefeasible right of use of telecommunications capacity of the Telecom Business for a term of 20 years and right to use of the telecommunications services from the Telecom Business for a term of 10 years.
The fair value of these intangible assets as at the completion date of the disposal was determined with reference to comparable market transactions.
Intangible assets acquired by us are stated at cost less accumulated amortization (where the estimated useful life is finite) and impairment losses.
Amortization of intangible assets with finite useful lives is charged to profit or loss on a straight-line basis over the assets’ estimated useful lives.
Both the period and method of amortization are reviewed annually.
Impairment of fixed assets
Under IFRSs, if a triggering event occurs indicating that the carrying amount of an asset may not be recoverable, a new assessment of the carrying amount of that asset is required. Triggering events include significant adverse changes in the market value of an asset, changes in the business or regulatory environment, or certain legal events. The interpretation of such events requires judgment from the management with respect to whether such an event has occurred and whether management feelsconsiders that reassessment of the carrying value of the asset is required. If an event occurs that could affect the carrying value of the asset and management does not identify it as a triggering event and identify the asset as impaired, future operations could be adversely affected if this asset is subsequently written off or sold for less than its carrying value due to sudden downturns in the business environment.
Upon the occurrence of triggering events, the carrying amounts of fixed assets are reviewed to assess whether their recoverable amounts have declined below their carrying amounts. Under IFRSs, the recoverable amount is the greater of its net selling pricefair value less costs of sales and value in use. In assessing value in use, the estimated future cash flows are discounted to their present value using a pre-tax discount rate that reflects current market assessments of time value of money and the risks specific to the assets. Where the asset does not generate cash inflows largely independent of those from other assets, the recoverable amount is determined for the smallest group of assets that generates cash inflows independently (i.e. cash-generating-unit). Where the recoverable amount of fixed and other long-lived assets is less than their carrying value, an impairment loss is recognized to write down the assets to their recoverable amount, which is based on the fair value less costs to sell or value in use.
35
For the three years ended August 31, 2010,2012, no impairment of fixed assets havehas been recognized.
Accounts receivableProgramme costs
Programme costs are stated at cost less amounts expensed and any provision is made against accounts receivableconsidered necessary by management. Programme costs are charged to the extent they are considered to be doubtful. This provision requires judgment regardingprofit or loss over the collectability of certain receivables both as they are incurred and as they age. We assess bad debt provision by type of customers, namely residential, corporate and carrier, based on past experience of recovery of old receivables, the agingshowing or licensing period of the accounts receivable balance and historical write-off experience. Certain receivables may be initially identified as collectible, yet subsequently become uncollectible and result in a subsequent write-off of the related receivableprogramme, with reference to the consolidated statementprojected revenue.
- Self-produced Programmes
Self-produced programmes consist primarily of operations. Changes indrama, infotainment and variety programmes. Cost of self-produced programmes comprises direct production cost and an appropriate proportion of production overheads.
- Purchased Programmes
Purchased programmes consist film rights acquired for showing on the collectabilityGroup’s television channel. Cost of accounts receivable for which provisions are not made could affect our future resultspurchased programme comprises cost of operations.
| For the year ended August 31, | ||||||||||||
| 2008 | 2009 | 2010 | ||||||||||
| HK$ | HK$ | HK$ | ||||||||||
| (Amounts in thousands) | ||||||||||||
| Balance at beginning of the year | 22,392 | 11,944 | 3,160 | |||||||||
| Additions charged to expense | 14,293 | 12,103 | 14,742 | |||||||||
| Write-off | (24,741 | ) | (20,887 | ) | (12,079 | ) | ||||||
| Balance at the end of the year | 11,944 | 3,160 | 5,823 | |||||||||
Deferred taxation
We recognized deferred tax assets for all deductible temporary differences and operating loss carry forwards to the extent it is probable that future taxable profits will be available against which the asset can be utilized. In assessing whether a deferred tax asset is expected to be utilized in the foreseeable future, our management considers all available evidence, including projected future taxable profit by taking into consideration of the effect of our capital expenditures and other plans, such as the existing network capacity, technological changes, future market trends and projected fixed network coverage.
As of August 31, 2008, taking into consideration of the current results of operations, our management assessed that it was probable that sufficient future taxable profits would be generated to utilize the unused tax losses of HK$159.6 million, which resulted in the recognition of deferred tax assets of HK$26.3 million. As at August 31, 2008, 20092011 and 2010,2012, we had not recognized deferred tax assets in respect of unused tax losses of HK$9.5 million, HK$8.28.1 million and HK$8.259.8 million respectively, because it was not probable that future taxable profits could be generated to utilize the tax losses. All tax losses are subject to agreement with local tax authorities. Any changes in the estimate of future operations could change the recognition of our deferred tax assets, which could significantly affect our results of operations.
36
The following table sets forth, for the years indicated, a summary of our results of operations.
| For the year ended August 31, | ||||||||||||||||
| 2008 | 2009 | 2010 | 2010 | |||||||||||||
| HK$ | HK$ | HK$ | US$ | |||||||||||||
| (Amounts in thousands) | ||||||||||||||||
| Revenue | ||||||||||||||||
| FTNS business | 1,011,038 | 1,230,880 | 1,356,098 | 174,348 | ||||||||||||
| IDD business | 291,943 | 247,359 | 218,589 | 28,103 | ||||||||||||
| 1,302,981 | 1,478,239 | 1,574,687 | 202,451 | |||||||||||||
| Network costs | (178,367 | ) | (175,129 | ) | (195,292 | ) | (25,108 | ) | ||||||||
| Other operating expenses | (966,094 | ) | (1,037,964 | ) | (1,105,604 | ) | (142,143 | ) | ||||||||
| Other income, net | 24,989 | 41,540 | 7,989 | 1,028 | ||||||||||||
| Finance costs | (75,137 | ) | (55,127 | ) | (22,235 | ) | (2,859 | ) | ||||||||
| Profit before taxation | 108,372 | 251,559 | 259,545 | 33,369 | ||||||||||||
| Income taxes benefit/(expense) | 16,818 | (38,730 | ) | (42,679 | ) | (5,487 | ) | |||||||||
| Net income | 125,190 | 212,829 | 216,866 | 27,882 | ||||||||||||
| For the year ended August 31, | ||||||||||||||||
| 2010 | 2011 | 2012 | 2012 | |||||||||||||
| HK$ | HK$ | HK$ | US$ | |||||||||||||
| (in thousands) | ||||||||||||||||
Continuing operations(1) | ||||||||||||||||
Revenue | — | — | 3,762 | 485 | ||||||||||||
Cost of sales | — | — | (6,006 | ) | (774 | ) | ||||||||||
Valuation gains on investment properties | — | — | 18,200 | 2,347 | ||||||||||||
Other operating expenses | (21,932 | ) | (23,481 | ) | (104,960 | ) | (13,533 | ) | ||||||||
Other income/(loss), net | (7,696 | ) | 3,456 | 19,920 | 2,568 | |||||||||||
Finance costs, net | (21,289 | ) | (7,303 | ) | (2,455 | ) | (317 | ) | ||||||||
|
|
|
|
|
|
|
| |||||||||
Loss before taxation | (50,917 | ) | (27,328 | ) | (71,539 | ) | (9,224 | ) | ||||||||
Income tax expenses | (5,611 | ) | (4,782 | ) | (2,281 | ) | (294 | ) | ||||||||
|
|
|
|
|
|
|
| |||||||||
Loss from continuing operations | (56,528 | ) | (32,110 | ) | (73,820 | ) | (9,518 | ) | ||||||||
|
|
|
|
|
|
|
| |||||||||
Discontinued operations | ||||||||||||||||
Profit from discontinued operations | 273,394 | 346,025 | 3,771,694 | 486,294 | ||||||||||||
|
|
|
|
|
|
|
| |||||||||
Profit for the year | 216,866 | 313,915 | 3,697,874 | 476,776 | ||||||||||||
|
|
|
|
|
|
|
| |||||||||
Note:
| (1) | Following the disposal of our Telecom Business in May 2012, the Telecom Business was reclassified as discontinued operations for fiscal 2012 and the comparative figures for fiscal 2011 and fiscal 2010 were retrospectively reclassified as discontinued operations. |
Fiscal 20102012 Compared to Fiscal 20092011
Revenues.RevenueRevenues increased by 6.5% to. We commenced our Multimedia Production Business and disposed of our Telecom Business in fiscal 2012. Our revenue from the Multimedia Production Business primarily consists of licensing fees and artiste management fee. We recorded revenue of HK$1,574.73.8 million in fiscal 20102012, primarily reflecting the licensing fee received from the Telecom Business to broadcast the news content produced by the news production operation unit and the income received from our artiste management functions. We had no revenue for fiscal 2011 for the continuing operations relating to our Multimedia Production Business.
Cost of sales. Cost of sales in fiscal 2012 were HK$1,478.26.0 million, primarily consisting of talent costs and other production costs which are directly attributable to the revenue generated from licensing of programme rights and provision of artiste management services. There were no cost of sales in fiscal 2011 for the continuing operations.
Valuation gains on investment properties. Valuation gains on investment properties were HK$18.2 million, consisting of the change in fair value of the investment properties held by us.
Other operating expenses. Our other operating expenses increased to HK$105.0 million in fiscal 2009, reflecting an increase in revenue2012 from our FTNS business, the effects of which were partially offset by a decrease in revenue from our IDD business and the change in the regulatory regime of mobile interconnection charges summarized below. Revenue contribution from our FTNS business increased to 86.1% in fiscal 2010 from 83.3% in fiscal 2009.
37
Set forth below is a table summarizing the details of our other operating expenses in fiscal 20092011 and 2010:
| For the year ended August 31, | ||||||||||||
| 2009 | 2010 | 2010 | ||||||||||
| HK$ | HK$ | US$ | ||||||||||
| (Amounts in thousands) | ||||||||||||
| Talent costs | (302,279 | ) | (301,760 | ) | (38,796 | ) | ||||||
| Advertising and marketing expenses | (299,794 | ) | (372,727 | ) | (47,920 | ) | ||||||
| Depreciation | (206,241 | ) | (199,029 | ) | (25,588 | ) | ||||||
| Others | (229,650 | ) | (232,088 | ) | (29,839 | ) | ||||||
| Other operating expenses | (1,037,964 | ) | (1,105,604 | ) | (142,143 | ) | ||||||
| For the year ended August 31, | ||||||||||||
| 2011 | 2012 | 2012 | ||||||||||
| HK$ | HK$ | US$ | ||||||||||
| (in thousands) | ||||||||||||
Talent costs | 6,837 | 55,971 | 7,216 | |||||||||
Advertising and marketing expenses | — | 214 | 28 | |||||||||
Depreciation | 1,585 | 4,636 | 598 | |||||||||
Others | 15,059 | 44,139 | 5,691 | |||||||||
|
|
|
|
|
| |||||||
Other operating expenses | 23,481 | 104,960 | 13,533 | |||||||||
|
|
|
|
|
| |||||||
Other income, net.net. Other income, net increased to HK$19.9 million in fiscal 2012 from HK$3.5 million in fiscal 2011 mainly due to the increase in interest income from banks arising from term deposits placed with banks after receiving the final consideration from the sale of the Telecom Business.
Finance costs, net. Finance costs, net decreased to HK$8.02.5 million in fiscal 20102012 from HK$41.57.3 million in fiscal 2009.2011. The decrease was mainly contributed byis primarily due to the loss on extinguishmentrepayment of our 10-year senior notes of HK$9.7 millionlong-term bank loans in fiscal 2010 compared to2011. As a result of the gainrepayment, items recorded in 2011, such as interest expenses, amortization of upfront costs on extinguishmentbank borrowings and write-off of our 10-year senior notes of HK$31.4 millionupfront costs on bank borrowings, became nil in fiscal 2009. The effect of which was partially offset by an increase in interest income of HK$10.1 million recognized in relation to mobile interconnection charges in fiscal 2010.
38
Net income.lossFor the foregoing reasons, net income. Net loss increased to HK$216.973.8 million in fiscal 20102012 from HK$212.832.1 million in fiscal 2009. Net margin decreased2011, primarily because we incurred start-up costs while no material revenue was generated by the Multimedia Production Business and other operating expenses had increased as mentioned above.
Discontinued operations. The disposal of Telecom Business was completed on May 30, 2012. The operating results of the disposed Telecom Business up to 13.8% in fiscal 2010 from 14.4% in fiscal 2009. The slight decrease in net margin was primarily duethe disposal date have been presented as discontinued operations on this Form 20-F. For a detailed discussion of discontinued operations, see Item 18: Financial Statements—Notes to a higher cost in acquiring new customers.
Fiscal 20092011 Compared to Fiscal 20082010
Following the disposal of our Telecom Business in May 2012, the Telecom business was retrospectively reclassified as discontinued operations for fiscal 2011 and fiscal 2010. Since all revenue, cost of sales and valuation gains on investment properties for fiscal 2011 and fiscal 2010 were from the Telecom Business, the reclassification had rendered these items nil for our continuing operations in fiscal 2009 from HK$1,303.0 million in2011 and fiscal 2008, reflecting an increase in revenue from our FTNS business, the effects of which were partially offset by a decrease in revenue from our IDD business. Revenue contribution from our FTNS business increased to 83.3% in fiscal 2009 from 77.6% in fiscal 2008.
Other operating expenses.expenses. Other operating expenses increased by 7.4%7.1% to HK$1,038.023.5 million in fiscal 20092011 from HK$966.121.9 million in fiscal 2008 mainly due to the following:
39
| For the year ended August 31, | ||||||||||||
| 2008 | 2009 | 2009 | ||||||||||
| HK$ | HK$ | US$ | ||||||||||
| (Amounts in thousands) | ||||||||||||
| Talent costs | (247,460 | ) | (302,279 | ) | (39,001 | ) | ||||||
| Advertising and marketing expenses | (307,743 | ) | (299,794 | ) | (38,681 | ) | ||||||
| Depreciation | (210,051 | ) | (206,241 | ) | (26,610 | ) | ||||||
| Others | (200,840 | ) | (229,650 | ) | (29,630 | ) | ||||||
| Other operating expenses | (966,094 | ) | (1,037,964 | ) | (133,922 | ) | ||||||
| For the year ended August 31, | ||||||||
| 2010 | 2011 | |||||||
| HK$ | HK$ | |||||||
| (in thousands) | ||||||||
Talent costs | (7,221 | ) | (6,837 | ) | ||||
Depreciation | (1,650 | ) | (1,585 | ) | ||||
Others | (13,061 | ) | (15,059 | ) | ||||
|
|
|
| |||||
Other operating expenses | (21,932 | ) | (23,481 | ) | ||||
|
|
|
| |||||
| • | Talent | ||
| • |
| ||
| • |
|
Other income/loss, net. We recorded other net income net.Other income, net increased toof HK$41.53.5 million in fiscal 2009 from2011, compared to other net loss of HK$25.07.7 million in fiscal 2008.2010. The increaseother net loss was mainly contributed bydue to the gainloss on extinguishment of our 10-year senior notes of HK$31.4 million, the effects of which were partially offset by a decrease in interest income from HK$15.69.7 million in fiscal 2008 to HK$4.8 million in fiscal 2009 as a result of the decrease in our average cash balance in fiscal 2009 mainly due to senior notes buyback actions.
Finance costs.costs. Finance costs decreased by 26.6%65.7% to HK$55.17.3 million in fiscal 20092011 from HK$75.121.3 million in fiscal 2008 as a result2010. The decrease was mainly due to full year impact of the redemptionfinance cost savings through repurchase and cancellation of an aggregate principal amount of US$68.0 millionredemption of our 10-year senior notes from the market in fiscal 2009.
Income tax benefit/(expense).expense. We recorded an income tax expense of HK$38.84.8 million in fiscal 2009,2011, compared to an income tax benefit of HK$16.85.6 million in fiscal 2008. Included in the2010. Our income tax benefit in fiscal 2008 was a tax credit of HK$26.3 million related to theexpense represented non-cash deferred tax assets recognizedexpenses in respect of the tax loss carryforwards of our major operating subsidiary as at August 31, 2008. Based on the results of operations of our major operating subsidiary in recent yearsboth fiscal 2011 and our forecast for future years, we concluded it was probable that the subsidiary would generate sufficient taxable income to utilize the tax loss carryforwards. If such effect was excluded, the income tax expenses increase by HK$29.3 million, which was primarily caused by the increase of our income before taxation.
Net income.loss. For the foregoing reasons, net income increasedloss decreased to HK$212.832.1 million in fiscal 20092011 from HK$125.256.5 million in fiscal 2008. Net margin increased to 14.4% in fiscal 2009 from 9.6% in fiscal 2008. The increase in net margin was primarily due to higher revenue contribution from our FTNS business and the better margin achieved in our IDD business as a result of the phasing out of lower margin customers.
Recent accounting pronouncements
Recently issued and adoptedbut not yet effective accounting pronouncements under IFRSs have been included in note 3231 to our consolidated financial statements.
| B. | Liquidity and capital resources |
We expect cash flow from operating activities to continuecontinued to be in a strong financial position for the year under review, in particular after receiving the final consideration of HK$4,873.6 million from the sale of Telecom Business during the year, which provided us with a net cash inflow of HK$4,655.4 million after netting transaction costs of HK$183.4 million and disposal of cash and cash equivalents of HK$34.8 million. A special dividend of HK$2,022.5 million (i.e. at HK$2.5 per ordinary share) was distributed on June 29, 2012. The remaining cash will be used to fund the continuing development and expansion of our principal sourceMultimedia Production Business. Pending such use of liquidity. the funds, consistent with the overall treasury objectives and policy, the Group will undertake treasury management activities with respect to its surplus cash assets. As and when cash is expected to be required to fund the continuing development and expansion of the Multimedia Production Business, the investments will be realized as appropriate.
As of August 31, 2010,2012, we had total cash at bank and bank balancein hand and term deposits amounting to HK$2,627.1 million, compared to HK$409.0 million as of August 31, 2011, and outstanding borrowings of HK$588.7 million. Our day-to-day operations are also supported by3.3 million, compared to HK$353.81.2 million as of August 31, 2011. This led to an increase of our net cash position to HK$2,623.8 million as of August 31, 2012 from HK$407.8 million as of August 31, 2011. As of August 31, 2012, we had utilized HK$2.0 million banking facilities and revolving loan facility,mainly to provide bank guarantees to utility vendors in lieu of which onlyutility deposits, compared to HK$133.36.9 million was utilized as atof August 31, 2010.
We believe that our current cash and cash equivalents and cash flow from operationsterm deposits on hand will be sufficient to meet our anticipated cash needs, including working capital requirements, capital expenditures, repayment of our indebtedness when fall due and various contractual obligations, for at least the next 12 months. Our cash flows from operations, however, may decrease due to lower customer demand resulting from rapid
40
The following table summarizes our cash flows for each of fiscal 2008, 20092010, 2011 and 2010:
| For the year ended August 31, | ||||||||||||||||
| 2008 | 2009 | 2010 | 2010 | |||||||||||||
| HK$ | HK$ | HK$ | US$ | |||||||||||||
| (Amounts in thousands) | ||||||||||||||||
| Net cash inflow from operating activities | 381,991 | 536,771 | 485,340 | 62,398 | ||||||||||||
| Net cash outflow from investing activities | (147,750 | ) | (176,488 | ) | (306,254 | ) | (39,374 | ) | ||||||||
| Net cash (outflow)/inflow from financing activities | (345,978 | ) | (561,292 | ) | 178,307 | 22,924 | ||||||||||
| (Decrease)/increase in cash and cash equivalents | (111,737 | ) | (201,009 | ) | 357,393 | 45,948 | ||||||||||
| Cash and cash equivalents, at the beginning of year | 532,894 | 421,610 | 221,052 | 28,420 | ||||||||||||
| Effect of foreign exchange rate changes on cash | 453 | 451 | (270 | ) | (35 | ) | ||||||||||
| Cash and cash equivalents, at the end of the year | 421,610 | 221,052 | 578,175 | 74,333 | ||||||||||||
| Analysis of the balances of cash and cash equivalents | ||||||||||||||||
| Cash at bank and in hand | 434,604 | 226,416 | 588,665 | 75,682 | ||||||||||||
| Bank overdrafts — unsecured | (12,994 | ) | (5,364 | ) | (10,490 | ) | (1,349 | ) | ||||||||
| 421,610 | 221,052 | 578,175 | 74,333 | |||||||||||||
| For the year ended August 31, | ||||||||||||||||
| 2010 | 2011 | 2012 | 2012 | |||||||||||||
| HK$ | HK$ | HK$ | US$ | |||||||||||||
| (in thousands) | ||||||||||||||||
Net cash inflow from operating activities | 485,340 | 585,899 | 181,924 | 23,456 | ||||||||||||
Net cash inflow/(outflow) from investing activities | (306,254 | ) | (414,189 | ) | 3,681,791 | 474,703 | ||||||||||
Net cash inflow/(outflow) from financing activities | 178,307 | (343,112 | ) | (2,191,749 | ) | (282,588 | ) | |||||||||
Increase/(decrease) in cash and cash equivalents | 357,393 | (171,402 | ) | 1,671,966 | 215,571 | |||||||||||
Cash and cash equivalents, at the beginning of year | 221,052 | 578,175 | 408,131 | 52,621 | ||||||||||||
Effect of foreign exchange rate changes on cash | (270 | ) | 1,358 | (44 | ) | (6 | ) | |||||||||
Cash and cash equivalents, at the end of the year | 578,175 | 408,131 | 2,080,053 | 268,186 | ||||||||||||
Analysis of the balances of cash and cash equivalents | ||||||||||||||||
Cash at bank and in hand | 588,665 | 408,976 | 2,083,079 | 268,576 | ||||||||||||
Bank overdrafts – unsecured | (10,490 | ) | (845 | ) | (3,026 | ) | (390 | ) | ||||||||
|
|
|
|
|
|
|
| |||||||||
| 578,175 | 408,131 | 2,080,053 | 268,186 | |||||||||||||
|
|
|
|
|
|
|
| |||||||||
Operating activities
Prior to the disposal of the Telecom Business, our principal source of cash was cash generated from our FTNS and IDD business. Net cash inflow from operating activities increased 40.5%20.7% from HK$382.0485.3 million in fiscal 20082010 to HK$536.8585.9 million in fiscal 2009,2011, primarily reflecting the increase in our profit before taxation resulting from the continued expansion of our subscription base. Net cash inflow from operating activities decreased by 9.6%69.0% from HK$536.8585.9 million in fiscal 20092011 to HK$485.3181.9 million in fiscal 2010, which was a reflection of a slight increase2012, primarily reflecting the decrease in our profit before taxation offsetting by our rather higher customer acquisitionas we only recorded nine months of operating results from the discontinued operations resulting from the disposal of Telecom Business and the start up costs for Multimedia Production Business.
Investing activities
Net cash inflow from investing activities in fiscal 2010.
Net cash outflow from investing activities
Net cash outflow from investing activities in fiscal 2010 was HK$306.3 million. The net cash outflow was mainly due to our purchase of fixed assets in the amount of HK$349.1 million.
Financing activities
Net cash outflow from investingfinancing activities in fiscal 20092012 was HK$176.52,191.7 million. The net cash outflow was mainly attributable to the payment of cash dividends of HK$2,257.8 million.
Net cash outflow from financing activities in fiscal 2011 was HK$343.1 million. The net cash outflow was mainly due to our purchaserepayment of fixed assetsour bank loan of HK$289.9 million, the effect of which were partially offset by an decrease in pledged bank deposits of HK$72.3125 million and net proceeds from maturitypayment of investment in debt securitiescash dividends of HK$28.1219.3 million.
Net cash inflow from financing activities in fiscal 2010 was HK$178.3 million. The net cash inflow was mainly due to the proceeds from the offering of new ordinary shares in the amount of HK$396.4 million and the proceeds from new bank loans of HK$163.4 million, which were partially offset by the repurchase and redemption of our 10-year senior notes of HK$172.4 million and dividend paid of HK$158.4 million.
41
As of August 31, 2010,2012, we had an outstanding debt of HK$134.7 million, most of which consisted of our bank loans in the amount of HK$123.6 million stated at amortized cost and were classified as non-current debt.
10-year senior notesBanking facilities
As of August 31, 2009, the 10-year senior notes were stated at the amortized cost of US$21.0 million (HK$162.6 million), compared with the amortized costs of US$87.5 million (HK$683.2 million) as of August 31, 2008.
Capital expenditures
In order to further develop our Next Generation Network and continue to increase the scale of operations of our FTNS business,fiscal 2012, we plan to make a totalspent HK$462.4 million on capital expenditure ranging from approximatelyversus HK$320 million to HK$350449.2 million in fiscal 20112011. Within the amount incurred in fiscal 2012, HK$178.8 million was incurred for the Multimedia Production Business mainly for the construction of the Television and Multimedia Production Centre and for the set-up of production facilities for television drama series and infotainment and variety programmes. The remaining HK$283.6 million was for the disposed Telecom Business.
For the construction of the Centre and the expansion into the Multimedia Production Business pending the grant of licence, our capital expenditure outlook for fiscal 2013 is expected to increasebe about HK$700.0 million, which is expected to be funded by internal resources retained from the coverageconsideration received from the disposal of our Next Generation Network. Our plan is to reach 2.0 million residential homes passthe Telecom Business and 1,800 commercial buildings bybanking facilities within the end of 2011. We expect to finance our budgeted capital expenditures with cash from operating activities, bank loans and capital market transactions.
| C. | Research and development, patents and licences |
We commit considerable resources to our research and development departmentteam in order to continuously improve our services and improve our market position.to better position ourselves in the multimedia market. As of August 31, 2010,2012, after the disposal of the Telecom Business, our research and development teamdepartment in Hong Kong consisted of approximately 2117 Talents experienced in systems design, engineering, telecommunicationsmobile technology, and computer programming. Our research and development departmentteam is primarily responsible for assessing and adapting the technology that we employexpect to deploy in upgradingour domestic free television programme services and expanding our Next Generation Network.content distribution, such as through Internet. To identify and develop new market opportunities theand product advancement, our research and development team assessesevaluates new services offered by telecommunications and Internet companiestechnology under development in the United States and elsewhere and works closely with our production department and marketing department. Our research and development expenditures were approximately HK$9.6 million, HK$10.8 million and HK$11.2 milliondepartment for fiscal 2008, 2009 and 2010, respectively.
42
| D. | Trend information |
| E. | Off-balance sheet arrangements |
We did not enter into any off-balance-sheet arrangements with any entities or individuals.
| F. | Tabular disclosure of contractual obligations |
The following table sets forth information regarding our aggregate payment obligations in future years of the contractual obligations and commercial commitments that we had as of August 31, 2010.
| Payments due by period | ||||||||||||||||||||
| More than | More than | |||||||||||||||||||
| 1 year | 3 years | |||||||||||||||||||
| Within | but within | but within | More than | |||||||||||||||||
| Total | 1 year | 3 years | 5 years | 5 years | ||||||||||||||||
| Contractual obligations | HK$ | HK$ | HK$ | HK$ | HK$ | |||||||||||||||
| (Amounts in thousands) | ||||||||||||||||||||
| Capital expenditure items | 132,340 | 132,340 | — | — | — | |||||||||||||||
| Operating leases | 124,287 | 88,821 | 26,555 | 4,062 | 4,849 | |||||||||||||||
| Long-term bank loan | 133,996 | 1,829 | 4,326 | 127,841 | — | |||||||||||||||
| Obligation under finance leases | 677 | 242 | 243 | 192 | — | |||||||||||||||
| Other current liabilities | 264,904 | 264,904 | — | — | — | |||||||||||||||
| Programming fees (IP-TV) | 73,626 | 25,539 | 41,506 | 6,581 | — | |||||||||||||||
| Total | 729,830 | 513,675 | 72,630 | 138,676 | 4,849 | |||||||||||||||
Contractual obligations | Total HK$ | Within 1 year HK$ | More than 1 year but within 3 years HK$ | More than 3 years but within 5 years HK$ | ||||||||||||
| (in thousands) | ||||||||||||||||
Capital expenditure items | 46,617 | 46,617 | — | — | ||||||||||||
Operating leases | 7,667 | 5,373 | 2,294 | — | ||||||||||||
Obligation under finance leases | 261 | 95 | 166 | — | ||||||||||||
Other current liabilities(1) | 42,709 | 42,709 | — | — | ||||||||||||
Programme fee | 203,282 | 96,613 | 103,229 | 3,440 | ||||||||||||
Total | 300,536 | 191,407 | 105,689 | 3,440 | ||||||||||||
Note:
| (1) | The other current liabilities of HK$ |
| A. | Directors and senior management |
Our board of directors consists of eight directors, three of whom, Mr. Lee Hon Ying, John, Dr. Chan Kin Man and Mr. Peh Jefferson Tun Lu, are independent non-executive directors and one of whom, Dr. Cheng Mo Chi, Moses, is a non-executive director. The remaining four, Mr. Wong Wai Kay, Ricky, Mr. Cheung Chi Kin, Paul, Mr. Yeung Chu Kwong, WilliamMs. To Wai Bing and Mr.Ms. Wong Nga Lai, Ni Quiaque,Alice, are executive directors.
43
| Date | |||||||||
| joined | |||||||||
| City | |||||||||
| Name | Age | Position | Telecom | ||||||
Board of directors: | |||||||||
| WONG Wai Kay, Ricky | 49 | Executive Director and Chairman | 1992 | ||||||
| CHEUNG Chi Kin, Paul | 53 | Executive Director and Vice Chairman | 1992 | ||||||
| YEUNG Chu Kwong, William | 50 | Executive Director and Chief Executive Officer | 2005 | ||||||
| LAI Ni Quiaque | 41 | Executive Director, Chief Financial Officer, Company Secretary and Head of Talent Engagement | 2004 | ||||||
| CHENG Mo Chi, Moses | 60 | Non-Executive Director | 1997 | ||||||
| LEE Hon Ying, John | 64 | Independent Non-Executive Director | 1997 | ||||||
| CHAN Kin Man | 51 | Independent Non-Executive Director | 1997 | ||||||
| PEH Jefferson Tun Lu | 51 | Independent Non-Executive Director | 2004 | ||||||
Senior management: | |||||||||
| �� | |||||||||
| CHONG Kin Chun, John | 48 | Managing Director of Corporate Division | 1996 | ||||||
| LO Sui Lun | 46 | Director of Corporate Affairs Department | 1998 | ||||||
| TAM Ming Chit | 45 | Chief Technology Officer | 2008 | ||||||
| TO Wai Bing | 48 | Managing Director of Business Development | 2007 | ||||||
Name | Age | Position | Date joined City Telecom | |||||||
Board of directors: | ||||||||||
WONG Wai Kay, Ricky | 51 | Executive Director and Chairman | 1992 | |||||||
CHEUNG Chi Kin, Paul | 55 | Executive Director and Vice Chairman | 1992 | |||||||
TO Wai Bing | 50 | Executive Director and Chief Executive Officer | 2007 | |||||||
WONG Nga Lai, Alice | 38 | Executive Director, Chief Financial Officer, Company Secretary | 2003 | |||||||
CHENG Mo Chi, Moses | 62 | Non-Executive Director | 1997 | |||||||
LEE Hon Ying, John | 66 | Independent Non-Executive Director | 1997 | |||||||
CHAN Kin Man | 53 | Independent Non-Executive Director | 1997 | |||||||
PEH Jefferson Tun Lu | 53 | Independent Non-Executive Director | 2004 | |||||||
Executive directors
Mr. WONG Wai Kay, Ricky, aged 49,51, is the co-founder and Chairman of the Group and is also a director of various subsidiaries of the Group. HeMr. Wong is responsible for our overall strategic planning and management. Mr. Wong has over 2527 years’ experience in the telecommunications and computer industries.industries and has substantial experience in corporate management. He had worked at a major US-listed computer company as a marketing representative and was responsible for marketing and distribution of computer products in Hong Kong from 1985 to 1989. He was also a co-founder and director of a company principally engaged in import and distribution of computer systems in Canada prior to co-founding of the Group. Mr. Wong holds a Bachelor’s Degree in Science and a Master of Business Administration Degree (Executive MBA Program) from The Chinese University of Hong Kong. He is a first cousin of Mr. Cheung Chi Kin, Paul, the Vice Chairman of the Group. Currently, Mr. Wong is a member of Zhejiang Committee, Chinese People’s Political Consultative Conference and a member of the Board of Trustees, United College, The Chinese University of Hong Kong and a member of the executive committee of the Digital Solidarity Fund of Hong Kong Council of Social Service.
Mr. CHEUNG Chi Kin, Paul, aged 53,55, is the co-founder and Vice Chairman of the Group and is also a director of various subsidiaries of the Group. Mr. Cheung is responsible for overall strategic planning and management of the Group. Prior to that, Mr. Cheung was appointed as the Chief Executive Officer and was responsible for our day-to-day operations and technological research, development and support activities. Mr. Cheung has more than 2931 years’ experience in the telecommunications and computer industries.industries and has substantial experience in corporate management. He had worked in several companies engaged in application software development and computer consultancy prior to co-founding of the Group. Mr. Cheung graduated with a Diploma of Advanced Programming and System Concepts Design from Herzing Institute, Canada. Mr. Cheung is a first cousin of Mr. Wong Wai Kay, Ricky, the Chairman of the Group.
Ms. TO Wai Bing, aged 50, was appointed as ourthe Executive Director and Chief Executive Officer in November 2008 withof the responsibilitiesGroup on May 30, 2012. Ms. To is also the Chief Operating Officer of Hong Kong Media Production Company Limited, the Chief Executive Officer of Leader Artiste Management Company Limited, as well as a director of abovementioned subsidiaries. Ms. To is responsible for developing corporate strategies and overseeing the operationsMultimedia Production Business of the Group. Before that, Mr. Yeung joined the Group as Chief Operating Officer in October 2005. He was in charge of the Customer Engagement Department overseeing customer relationship management and was also in charge of the Network Development Department. Mr. Yeung has more than 19 years’ experience in the telecommunications industry. Prior to joining the Group, Mr. Yeungthat, Ms. To was the Managing Director of Customers Division in Smartone-Vodafone, the General Manager of Personal Communications and Retail Division in Tricom Telecom Limited, and was also an Inspector of Police in the Hong Kong Police Force. Mr. Yeung holds a Bachelor of Arts Degree from Hong Kong Baptist University, a Master of Business Administration Degree from University of Strathclyde, U.K. and a Master of Science Degree in Electronic Commerce and Internet Computing
44
Ms. WONG Nga Lai, Alice, aged 38, was appointed as the Executive Director, Chief Financial Officer and Company Secretary of the Group on May 30, 2012 and is also a Directordirector of various subsidiaries of the Group. Ms. Wong has over 15 years of experience in financial management and Headaccounting. She is mainly responsible for the Group’s overall finance functions, procurement function as well as investor engagement. Prior to that, Ms. Wong was the Financial Controller of Asia Telecom Research for Credit Suisse and was involved in global fund raisings for a wide range of Asian Telecom carriers such as China Mobile, China Telecom, China Unicom, China Netcom, SK Telecom, PCCW, Telekom Malaysia, etc. Before that, Mr. Lai held positions with Hongkong Telecom and Kleinwort Benson Securities (Asia). Mr. Laithe Group. Ms. Wong holds a Bachelor of Commerce degree from the University of Western Australia and an ExecutiveQueensland, a Master of Business Administration Degreedegree from Kellogg-HKUST. Mr. Laithe Hong Kong University of Science and Technology and a Postgraduate Diploma in Corporate Governance. She is a Fellowqualified member of HKICPA and CPA Australia and is a Member of the Hong Kong Institute of Directors. Mr. LaiCertified Public Accountants (HKICPA) and Association of Chartered Certified Accountants (ACCA). She has also been appointed as a member of the Remuneration CommitteeStudent Affairs Sub-committee of ACCA Hong Kong since 2010. Before joining the Company.
Non-executive director
Dr. CHENG Mo Chi, Moses, aged 60,62, was appointed as thean Independent Non-executive Director of the Group since June 17, June 1997 and has been re-designatedre- designated as a Non-executive Director of the Group with effect from September 30, September 2004. Dr. Cheng hasis also been appointed as a member of the Remuneration Committee of the Company.Company and was appointed as a member of the Nomination Committee of the Company on February 27, 2012. Dr. Cheng is a practicingpractising solicitor and the senior partner of Messrs. P.C. Woo & Co. andDr. Cheng was a member of the Legislative Council of Hong Kong. He is the Founder Chairman of the Hong Kong Institute of Directors of which he is now the Honorary President and Chairman Emeritus and the President of International Association of Practicing Lawyers.Emeritus. Dr. Cheng currently holds directorships in K. Wah International Holdings Limited, China COSCO Holdings Company Limited, China Mobile Limited, China Resources Enterprise, Limited, Towngas China Company Limited, Hong Kong Exchanges and Clearing Limited, Kader Holdings Company Limited, Liu Chong Hing Investment Limited, Guangdong Investment Limited and Tian An China Investments Company Limited, all being public listed companies in Hong Kong. Dr. Cheng is also an independent non-executive director of ARA Asset Management Limited, a company whose shares are listed on the Singapore Exchange Limited.Stock Exchange. His other directorships in public listed companies in the last 3 years include Beijing Capital International AirportHong Kong Exchanges and Clearing Limited and China COSCO Holdings Company Limited, Galaxy Entertainment Group Limited and Shui On Construction and Materials Limited, allboth being public listed companies in Hong Kong, and ARA Asset Management (Fortune) Limited (formerly known as ARA Asset Management (Singapore) Limited), as the manager ofwhich manages Fortune Real Estate Investment Trust, a real estate investment trust listed on both the Singapore Stock Exchange Limited.
Independent non-executive directors
Mr. LEE Hon Ying, John, aged 64,66, is the managing director of Cyber Networks Consultants Company in Hong Kong. He was the Regional Director, Asia Pacific of Northrop Grumman-Canada, Ltd. He was previously the director of network services of Digital Equipment (HK) Limited and prior to that, worked for Cable and Wireless (HK) Limited and Hong Kong Telecom. He is a chartered engineer and a member of Institution of Engineering and Technology, the United Kingdom, the Hong Kong Institution of Engineers and the Hong Kong Computer Society. He received a Master’s Degree in Information System from The Hong Kong Polytechnic University in 1992. In addition, he is the Vice President and Board Member of the Society of St. Vincent de Paul, Council General, which is an international charity body with its head office in Paris, France. He is the Commission member of Catholic Diocese of Hong Kong Diocesan for Hospital Pastoral Care. Mr. Lee has been a Director of the Group since June 1997. Mr. Lee ishas also been appointed as the chairman of the Audit Committee and Remuneration Committee of the Company.
Dr. CHAN Kin Man, aged 51,53, is Director of the Centre for Civil Society Studies, Associate Director of Center for Entrepreneurship and Associate Professor of the Department of Sociology of The Chinese University of Hong Kong. He received a Bachelor of Social Science Degree from The Chinese University of Hong Kong in 1983 and a Doctor of Philosophy Degree from Yale University in the U.S. in 1995. Dr. Chan has been a Director of the Group since June 1997. Dr. Chan has also been appointed as a member of the Audit Committee and Remuneration Committee of the Company.
Mr. PEH Jefferson Tun Lu, aged 51,53, is a Certified Public Accountant of the Hong Kong Institute of Certified Public Accountants and a Certified Practicing Accountant of CPA Australia. Mr. Peh holds a Master Degree in Business from the University of Technology, Sydney. He has over 2830 years of experience in finance, accounting and management from listed and private companies in Hong Kong and Australia. Mr. Peh has been a Director of the Group since September 2004. Mr. Peh has also been appointed as a member of the Audit Committee and Remuneration Committee of the Company.
45
Senior management
The University of Hong Kong. Mr. Chong worked as a general manager overseeing product management and the sales force of a listed telecommunications products company in Hong Kong from 1987 to 1996.
Our directors and senior management receive compensation in the form of salaries, housing allowances, discretionary bonuses, other allowances and benefits in kind, including our contribution to the pension schemes for such individuals. We also granted share options to various directors and members of our senior management. For more information regarding share options granted to directors and members of our senior management, see Item 6 “Directors, senior management and employees — employees—Share ownership” below in this annual report.
Our senior management and Talents are entitled to receive an annual discretionary bonus based on their individual performance and our financial performance during the year in question.
The aggregate amount of salaries or other compensation, housing allowances, other allowances and benefits in kind paid by us to our directors and senior management was approximately HK$46.1186.4 million for fiscal 2010,2012, compared with HK$38.840.6 million for fiscal 2009.2011. The aggregate amount of contribution that we made to the retirement or similar benefits for our directors and members of our senior management was HK$2.72.5 million for fiscal 2010,2012, compared with HK$2.6 million for fiscal 2009.
Except as discussed herein, no other payments have been paid or are payable, in respect of fiscal 2010,2012, by us or any of our subsidiaries to our directors and senior management.
We entered into service agreements with our four executive directors, Messrs.Mr. Wong Wai Kay, Ricky, Mr. Cheung Chi Kin, Paul, Yeung Chu Kwong, WilliamMs. To Wai Bing and Ms. Wong Nga Lai, Ni Quiaque,Alice, respectively. These service agreements include non-competition clauses under which our executive directors agree not to compete with us in accordance with the terms and conditions therein and shall continue to be effective unless and until terminated by either party of the respective service agreements. None of the agreements provide for any benefits or compensation upon termination of employment.
46
We are a “controlled company” within the meaning of Nasdaq Listing Rule 5615(c) and IM-5615-5. More than 50.0% of the voting power for the election of our directors is held by a group consisting of Top Group International Limited, Mr. Wong Wai Kay, Ricky and Mr. Cheung Chi Kin, Paul. Mr. Wong and Mr. Cheung are the controlling shareholders of Top Group International Limited and have entered into a voting agreement pursuant to which they agreed to vote all of the shares held by Top Group International Limited, representing 44.22%43.98% of the voting power, all of the shares held by Mr. Wong individually, representing 0.93%1.88% of the voting power, and all of the shares held by Mr. Cheung individually, representing 5.50%6.23% of the voting power, collectively as a group.
We have elected to rely on the exemption from the majority independent board requirement, as set forth in Nasdaq Listing Rule 5615(b), except for the requirements of subsection (b)(2), which pertain to executive sessions of independent directors, and from the requirement for independent director oversight of executive officer compensation and director nominations, as set forth in Nasdaq Listing Rules 5605(d) and 5605(e).
In accordance with the laws of Hong Kong, the nomination and remuneration of our directors are governed by our Articles of Association. Pursuant to our Articles, of Association, our directors are appointed by our shareholders in the annual general meeting, and our directors’ fees are recommended by the remuneration committee of our board of directors and determined by our shareholders at the annual general meeting.
Audit committee
Our board of directors established an audit committee in March 1999 to ensure the impartial supervision of our accounting and business operations. The audit committee is comprised of three independent non-executive directors, namely, Mr. Lee Hon Ying, John (the Chairman of the audit committee), Dr. Chan Kin Man and Mr. Peh Jefferson Tun Lu. Mr. Peh was appointed to the audit committee on September 1, 2004 and is a “financial expert” within the meaning of, and as required by the U.S. Sarbanes-Oxley Act of 2002.
The audit committee is governed by an audit committee charter, which was adopted by our board of directors at a meeting held in August 2004.2004 and updated in February 2012. It is responsible for the following:
overseeing the accounting and financial reporting process of the Company and the audits of the Company’s consolidated financial statements on behalf of the board of directors; and
the appointment, compensation, retention and oversight of the work of the Company’s independent auditors (including resolution of disagreements between management and the auditors regarding financial reporting) for the purpose of preparing or issuing an audit report or performing other audit, review or attest services for the Company.
As provided in our audit committee charter, the audit committee is required to meet in person or telephonically at least twice a year and has the resources and authority appropriate to discharge its responsibilities as required by law, including the authority to engage independent counsel and other advisors as the audit committee deems necessary to carry out its duties.
The audit committee met four times in fiscal 2010.2012. The major works performed by the committee from September 1, 20092011 to August 31, 20102012 included the following:
Reviewed our consolidated financial statements for the year ended August 31, 2011 and for the six months ended February 29, 2012;
Reviewed the internal audit progress, including procedures required for compliance with the Sarbanes-Oxley Act;
Reviewed the external auditor’s report on the review of our interim financial report for the six months ended February 29, 2012 and our audited consolidated financial statements for the year ended August 31, 2011; and
Pre-approved the audit and non-audit services provided by KPMG, our external auditor.
Remuneration committee
Our board of directors established a remuneration committee in August 2001 to oversee the Company’s remuneration packages for executive directors. Among others, each of our executive directors is entitled to receive an annual discretionary bonus of such amount as determined by the board of directors upon recommendation and approval by the remuneration committee. Mr. Lai Ni Quiaque resigned as the member of the remuneration committee with effect from May 30, 2012. The remuneration committee is comprised of sixfive members with three independent non-executive directors, Mr. Lee Hon Ying, John, Dr. Chan Kin Man and Mr. Peh Jefferson Tun Lu,Lu; the non-executive director, Dr. Cheng Mo Chi, Moses Mr. Lai Ni Quiaque, the executive director, Chief Financial Officer, Company Secretary and HeadMs. Choy Mei Yuk, Mimi, Director of Talent Engagement and our directorManagement. Mr. Lee Hon Ying, John is the chairman of Talent Management.the remuneration committee. The remuneration committee’s objectives are set out as follows:
Establish formal, fair and transparent procedures for developing policy and structure of all remuneration of directors and senior management.
47
Review and consider the Company’s policy for remuneration of directors and senior management;
Determine the remuneration packages of executive directors and senior management; and
The remuneration committee held one meetingtwo meetings during fiscal 2010.2012. The major works performed by the committee from September 1, 20092011 to August 31, 20102012 included the following:
Reviewed and approved the discretionary performance bonus for the senior management; and
Reviewed and approved the remuneration packages for the directors and senior management.
Nomination committee
Our board of directors established a nomination committee in February 2012. The nomination committee comprises four members, namely, Mr. Lee Hon Ying, John, Dr. Chan Kin Man, Mr. Peh Jefferson Tun Lu and Dr. Cheng Mo Chi, Moses. Mr. Peh Jefferson Tun Lu is the chairman of the nomination committee. The nomination committee’s objectives are as follows:
Review the structure, size and composition of the Board and make recommendations on any proposed changes to the Board to implement our corporate strategy;
Identify qualified individuals to become members of the Board and select or make recommendations to the Board on the selection of individuals nominated for directorship;
Assess the independence of independent non-executive Directors; and
Make recommendations to the Board on the appointment or re-appointment of Directors and succession planning for Directors, in particular the Chairman and chief executive.
During the year ended August 31 2012, decisions to consider the appointment of two executive Directors were taken by way of circulated resolutions. In November 2012, the nomination committee held a meeting to discuss and review the re-election of all the retiring Directors at the coming 2012 annual general meeting.
The following table sets forth the number of our Talents by functional area as of August 31, 2010.
| As of August 31, | ||||||||
| 2011 | 2012 | |||||||
Talents | ||||||||
Information technology and engineering | 357 | 43 | ||||||
Sales and marketing, customer service and special duty unit (SDU) | 2,365 | 4 | ||||||
General administration and others | 358 | 99 | ||||||
Creative and production | — | 391 | ||||||
|
|
|
| |||||
Total | 3,080 | 537 | ||||||
|
|
|
| |||||
The following table sets forth the number of our Talents by geographical region as of August 31, 2010.
| As of August 31, | ||||||||
| 2011 | 2012 | |||||||
Talents | ||||||||
Hong Kong | 1,529 | 537 | ||||||
Guangzhou | 1,532 | — | ||||||
Canada | 19 | — | ||||||
|
|
|
| |||||
Total | 3,080 | 537 | ||||||
|
|
|
| |||||
As of August 31, 2008, 20092011 and 2010,2012, we had 3,051, 3,1733,080 and 3,232537 Talents, respectively. The increase in our total number of Talents in fiscal 2010 was mainly due to the expansion in our FTNS business.
The following table sets forth the share ownership of our directors and senior management as of December 14, 2010.
| Number | Percentage | |||||||||||||||
| of shares | of shares | |||||||||||||||
| beneficially | beneficially | Outstanding | ||||||||||||||
| Identity of person | owned | owned(note 3) | share | |||||||||||||
| Title of class | or Group | (note 4) | % | options | ||||||||||||
| Ordinary shares | Wong Wai Kay, Ricky | 389,245,732 (note 1) | 50.66 | 8,091,604 | ||||||||||||
| Ordinary shares | Cheung Chi Kin, Paul | 389,245,732 (note 1) | 50.66 | 8,091,604 | ||||||||||||
| Ordinary shares | Yeung Chu Kwong, William | 2,306,000 | Less than 1.0 | 11,542,956 | ||||||||||||
| Ordinary shares | Lai Ni Quiaque | 12,415,405 | 1.62 | 6,044,791 | ||||||||||||
48
Title of class | Identity of person or Group | Number of shares beneficially owned(3) | Percentage of shares beneficially owned(2) | Outstanding share options | ||||||||||
Ordinary shares | Wong Wai Kay, Ricky | 405,428,940 | (1) | 50.11 | % | 0 | ||||||||
Ordinary shares | Cheung Chi Kin, Paul | 405,428,940 | (1) | 50.11 | % | 0 | ||||||||
Ordinary shares | To Wai Bing | 95,239 | Less than 1.0 | % | 0 | |||||||||
Ordinary shares | Wong Nga Lai, Alice | 50,000 | Less than 1.0 | % | 0 | |||||||||
Notes:
| Number | Percentage | |||||||||||||||
| of shares | of shares | |||||||||||||||
| beneficially | beneficially | Outstanding | ||||||||||||||
| Identity of person | owned | owned(note 3) | share | |||||||||||||
| Title of class | or Group | (note 4) | % | options | ||||||||||||
| Ordinary shares | Chong Kin Chun, John | 2,777,089 | Less than 1.0 | 2,022,900 | ||||||||||||
| Ordinary shares | Lo Sui Lun | Nil | Nil | 1,638,901 | ||||||||||||
| Ordinary shares | Tam Ming Chit | Nil | Nil | 629,665 | ||||||||||||
| Ordinary shares | To Wai Bing | Nil | Nil | 302,239 | ||||||||||||
| (1) | The | |
| (2) | Percentage ownership is based on | |
| (3) | Beneficial ownership is determined in accordance with the rules of the SEC. |
49
| Options | Options | Options | ||||||||||||||||||||||||||||||
| Balance | granted | exercised | cancelled/ | Balance | ||||||||||||||||||||||||||||
| Exercise | as at | during | during | lapsed | as at | |||||||||||||||||||||||||||
| Date of | price | December 15, | the | Exercise | the | during | December 14, | |||||||||||||||||||||||||
| Directors | grant | HK$ | 2009 | period | period | period | the period | 2010 | ||||||||||||||||||||||||
| Mr. Wong Wai Kay, Ricky | January 5, 2005 | 1.5224 | 8,091,604 | — | January 5, 2005 to October 20, 2014 | — | — | 8,091,604 | ||||||||||||||||||||||||
| Mr. Cheung Chi Kin, Paul | January 5, 2005 | 1.5224 | 8,091,604 | — | January 5, 2005 to October 20, 2014 | — | — | 8,091,604 | ||||||||||||||||||||||||
| Mr. Yeung Chu Kwong, William | May 22, 2006 | 0.6523 | 1,018,165 | — | May 22, 2007 to May 21, 2016 | 1,018,000 | — | 165 | ||||||||||||||||||||||||
| February 6, 2008 | 1.7568 | 6,044,791 | — | (note 1) | 502,000 | — | 5,542,791 | |||||||||||||||||||||||||
| February 5, 2010 | 4.2400 | — | 6,000,000 | (note 2) | — | — | 6,000,000 | |||||||||||||||||||||||||
| Mr. Lai Ni Quiaque | May 22, 2006 | 0.6523 | 2,022,899 | — | May 22, 2007 to May 21, 2016 | 2,022,899 | — | — | ||||||||||||||||||||||||
| February 11, 2008 | 1.8660 | 6,044,791 | — | (note 3) | — | — | 6,044,791 | |||||||||||||||||||||||||
Senior management | ||||||||||||||||||||||||||||||||
| Mr. Chong Kin Chun, John | October 21, 2004 | 1.5224 | 2,022,900 | — | January 1, 2005 to October 20, 2014 | — | — | 2,022,900 | ||||||||||||||||||||||||
| Mr. Lo Sui Lun | October 21, 2004 | 1.5224 | 505,726 | — | January 1, 2005 to October 20, 2014 | — | — | 505,726 | ||||||||||||||||||||||||
| May 22, 2006 | 0.6523 | 1,517,175 | — | May 22, 2007 to May 21, 2016 | 384,000 | — | 1,133,175 | |||||||||||||||||||||||||
| Dr. Tam Ming Chit | May 2, 2008 | 1.7866 | 1,007,465 | — | (note 4) | 377,800 | — | 629,665 | ||||||||||||||||||||||||
| Ms. To Wai Bing | February 15, 2008 | 1.7568 | 1,007,465 | — | (note 4) | 705,226 | — | 302,239 | ||||||||||||||||||||||||
Directors | Date of grant | Exercise price HK$ | Balance as of December 13, 2011 | Options granted during the period | Exercise period | Options exercised during the period | Options cancelled/ lapsed during the period | Balance as of December 18, 2012 | ||||||||||||||||||||
Mr. Wong Wai Kay, Ricky | January 5, 2005 | 1.5224 | 8,091,604 | — | January 5, 2005 to October 20, 2014 | (8,091,604 | ) | — | — | |||||||||||||||||||
Mr. Cheung Chi Kin, Paul | January 5, 2005 | 1.5224 | 6,091,604 | — | January 5, 2005 to October 20, 2014 | (6,091,604 | ) | — | — | |||||||||||||||||||
Ms. To Wai Bing | February 15, 2008 | 1.7568 | 302,239 | Note (1) | (302,239 | ) | — | — | ||||||||||||||||||||
Ms. Wong Nga Lai, Alice | October 21, 2004 | 1.5224 | 202,289 | — | January 1, 2005 to October 20, 2014 | (202,289 | ) | — | — | |||||||||||||||||||
May 22, 2006 | 0.6523 | 102,291 | — | May 22, 2007 to May 21, 2016 | (102,291 | ) | — | — | ||||||||||||||||||||
Note:
| (1) | The exercise of the | |
50
All shareholders own ordinary shares and enjoy the same voting rights with respect to each share.
The 2002 Share Option Schemes
We adopted a second share option scheme, which we refer to as the 2002 Share Option Scheme, on December 23, 2002 and terminated the share option scheme adopted on July 12, 1997, which we refer to as the 1997 Share Option Scheme. Upon termination of the 1997 Share Option Scheme, no further options can be granted under the 1997 Share Option Scheme. Options granted under the 1997 Share Option Scheme that are not exercised lapsed automatically on July 12, 2007. Under the terms of the 2002 Share Option Scheme, our board of directors may, in its discretion from time to time, and subject to such conditions as the board may determine, within ten10 years beginning on December 23, 2002, grant any Talent or executive or officer of the Company or any of its subsidiaries (including executive, non-executive and independent non-executive directors of each of the abovementioned companies) and any suppliers or professional advisers who will or have provided services to the Company and/or its subsidiaries to subscribe for our ordinary shares.
The maximum number of ordinary shares which may be issued upon exercise of all options to be granted under our 2002 Share Option Scheme and any of our other share option scheme(s) must not exceed 10% of the ordinary shares in issue as of the date of approval or adoption of the scheme by the shareholders on December 23, 2002. Ordinary shares which would have been issuable pursuant to options which have lapsed in accordance with the terms of such share option schemes will not be counted for the purpose of the 10% limit. Such limit may be refreshed upon approval by shareholders and compliance with all requirements under the Rules Governing the Listing of Securities on The Stock Exchange of Hong Kong Limited, which we refer to as theHKSE Listing Rules. Pursuant thereto, such limit was refreshed with the approval of our shareholders in our annual general meetingmeetings held on December 29, 2004 and December 24, 2007 respectively up to a maximum limit equal to 10% of our total number of issued shares as at December 24, 2007.of the date of the said general meetings. Notwithstanding the foregoing, the number of ordinary shares which may be issued upon exercise of all outstanding options granted and yet to be exercised under our 2002 Share Option Scheme and any of our other share option scheme(s) at any time shall not exceed 30% of the total number of ordinary shares in issue from time to time.
The total number of ordinary shares issued and which may be issued upon exercise in full of the options granted under our 2002 Share Option Scheme and any of our other share option scheme(s) (including exercised, cancelled and outstanding options) to each eligible participant in any 12-month period up to and including the date of grant shall not exceed 1% of the outstanding ordinary shares as atof the date of grant. Any further grant of options in excess of this 1% limit must be approved by shareholders.
The subscription price for an ordinary share payable by a participant upon the exercise of any option granted under the 2002 Share Option Scheme will be determined by the Boardour board of directors in its absolute discretion, except that such price will not be less than the highest of (a) the closing price of the ordinary shares as stated in The Stock Exchange of Hong Kong Limited’sthe HKSE’s daily quotations sheet on the date of grant, which must be a business day; (b) the average of the closing prices of the ordinary shares as stated in The Stock Exchange of Hong Kong Limited’sthe HKSE’s daily quotations sheets for the 5five business days immediately preceding the date of grant; and (c) the nominal value of an ordinary share.
Any grant of options to any of our directors, chief executives or substantial shareholders or any of their respective associates (as defined in the HKSE Listing Rules) is required to be approved by our non-grantee independent non-executive directors. If we propose to grant options to a substantial shareholder or any of its independent non-executive directors, or their respective associates, which will result in the number of ordinary shares issued and to be issued upon exercise of options granted and to be granted under our 2002 Share Option Scheme and any of our other share option scheme(s) (including options exercised, cancelled and outstanding) to such person in the 12-month period up to and including the date of such grant (a) representing in aggregate over 0.1% of the outstanding ordinary shares; and (b) having an aggregate value in excess of HK$5 million, based on the closing price of the ordinary shares at the date of each grant, such further grant of options will be subject to approval by shareholders and all requirements under the HKSE Listing Rules.
A grant of options may not be made after a price sensitive event has occurred or a price sensitive matter has been the subject of a decision until such price sensitive information, including annual and interim results, has been made public.
The period during which an option may be exercised will be determined by our board of directors in its absolute discretion, except that no option may be exercised later than ten10 years from the date of grant. No option may be granted more than ten10 years after December 23, 2002. Subject to our earlier termination, the 2002 Share Option Scheme shall be valid and effective for a period of ten10 years after the date of adoption, that is, until December 23, 2012. In addition and to the extent not already exercised, an option will automatically lapse and not be exercisable upon the occurrence of any of the following events:
| (a) | the expiry date relevant to that option; |
| (b) | one month following the date a grantee ceases to be an eligible participant for any reason other than death or termination of his relationship with us (or the relevant subsidiary, as the case may be) on any of the grounds specified in (g) below; |
51
| (c) | 12 months, or such longer period as |
| (d) | 21 days following the date an effective resolution is passed for our voluntary winding-up; |
| (e) | subject to (d) above, the date of commencement of such winding-up; |
| (f) | the date on which any compromise or arrangement between us and our members or creditors in connection with a scheme for our reconstruction or our amalgamation with any other company or companies becomes effective; |
| (g) | the date on which the grantee ceases to be an eligible participant by reason of the termination of his or her relationship with us or the relevant subsidiary on any one or more of the grounds of serious misconduct or breach, bankruptcy, insolvency, composition with his or her creditors or conviction of any criminal offence involving his or her integrity or honesty or, in the case of a grantee-Talent and if so determined by |
| (h) | 14 days following the date a general offer (which has been made to shareholders by way of take-over offer, share repurchase offer or scheme of arrangement or otherwise in like manner) becomes, or is declared unconstitutional; and |
| (i) | the date on which we cancel the options by reason that the grantee in any way sells, transfers, charges, mortgages, encumbers or creates any interest in favor of any third party over or in relation to any of his or her options or attempt to do so. |
As of December 14, 2010, a total number of 96,247,85718, 2012, no options were granted, 41,108,73237,104,790 options were exercised, 13,902,353893 options were lapsed and 41,236,772no options remain outstanding and unexercised. Total
The 2012 Share Option Scheme
On December 5, 2012, we circulated a notice to our shareholders that the extraordinary general meeting of the Company to be held on December 31, 2012 will consider the adoption of the 2012 Share Option Scheme, the proposed terms of which are set out below.
Under the rules of the 2012 Share Option Scheme, there is no general requirement of any minimum period for which an option must be held before it can be exercised although the Board will be empowered under the 2012 Share Option Scheme to impose at its discretion any such minimum period at the time of grant of any particular option. In addition, the Board will be empowered to determine the exercise price of a Share in respect of any particular option granted under the 2012 Share Option Scheme so that the selected participants are attracted to subscribe the Shares pursuant to the options granted by the Company as incentives and rewards for their contribution or potential contribution to the Group and will further contribute towards the profitability and success of the Group. There is also no general requirement under the 2012 Share Option Scheme for any performance target which a grantee has to achieve before any option can be exercised under the 2012 Share Option Scheme although the Board has the discretion, in order to encourage any grantee to further the interests and objectives of the Company, to require a grantee to achieve certain performance targets specified at the time of grant before any option granted under the 2012 Share Option Scheme can be exercised.
The Company is not required to appoint any trustee for the purpose of administering the 2012 Share Option Scheme. The 2012 Share Option Scheme will be subject to administration of the Board. None of the Directors is or will be a trustee of the 2012 Share Option Scheme or have a direct or indirect interest in any such trustee.
To the best knowledge of the Directors, as at November 30, 2012, the latest practicable date prior to the printing of the notice dated December 5, 2012 (the “Latest Practicable Date”), no Shareholders have a material interest in the 2012 Share Option Scheme different to that of any other Shareholders and accordingly, no Shareholders will have to abstain from voting at the extraordinary general meeting on the resolution approving the adoption of the 2012 Share Option Scheme.
Adoption of the 2012 Share Option Scheme is conditional upon (i) the passing of an ordinary resolution by the Shareholders at the extraordinary general meeting approving the adoption of the 2012 Share Option Scheme; and (ii) the Listing Committee of the HKSE granting the approval for the listing of, and permission to deal in, the Shares or any part thereof falling to be issued and allotted upon exercise of the Options granted under the 2012 Share Option Scheme.
Application will be made to the Listing Committee of the HKSE for the approval of the listing of, and permission to deal in, the Shares representing ten (10) per cent. of the issued share capital of the Company as at the date of the extraordinary general meeting which may fall to be allotted and issued upon the exercise of options to be granted under the 2012 Share Option Scheme.
The Directors consider that it is not appropriate to state the value of all options that can be granted pursuant to the 2012 Share Option Scheme as if they had been granted at the Latest Practicable Date prior to the approval of the 2012 Share Option Scheme given that the variables such as the exercise price, exercise period, interest rate, expected volatility and other relevant variables cannot be available for calculating the value of the options. The Directors believe that any calculation of the value of the options as at the Latest Practicable Date based on a great number of 44,619,336speculative assumptions would not be meaningful and the results thereof may be misleading to the Shareholders in the circumstances.
Subject to the obtaining of the Shareholders’ approval with respect to the adoption of the 2012 Share Option Scheme, pursuant to the HKSE Listing Rules, the total number of Shares which may be issued upon the exercise of all Options to be granted under the 2012 Share Option Scheme and any other share option schemes of the Company must not, in aggregate, exceed ten (10) per cent. of the issued share capital of the Company as at the date of approval of the 2012 Share Option Scheme. The Board shall not grant any Options which would result in the maximum aggregate number of Shares which may be issued upon exercise of all outstanding options are availablegranted but yet to be exercised under the 2012 Share Option Scheme and any other share option schemes adopted by the Company which provide for the grant of options to acquire or subscribe for Shares exceeding, in aggregate, thirty (30) per cent. of the issued share capital of the Company from time to time.
Based on 809,016,643 Shares in issue as at Latest Practicable Date and assuming that there is no change in the issued share capital of December 14, 2010.
| A. | Major shareholders |
The following table sets forth certain information regarding ownership of our ordinary shares as of December 14, 201018, 2012 by all persons who are known to us to own beneficially 5% or more of our ordinary shares.
Title of class | Identity of person or Group | beneficially owned(3) | ||||||||
| Percentages of shares Beneficially owned(1) | ||||||||||
Ordinary shares | Wong Wai Kay, Ricky | 405,428,940 | (2) | 50.11 | % | |||||
Ordinary shares | Cheung Chi Kin, Paul | 405,428,940 | (2) | 50.11 | % | |||||
Ordinary shares | Top Group International Limited | 405,428,940 | (2) | 50.11 | % | |||||
Ordinary shares | Leung Ka Pak | 339,814,284 | (3) | 42.00 | % | |||||
Ordinary shares | Yau Ming Yan, Andrew | 339,814,284 | (3) | 42.00 | % | |||||
Notes:
| (1) | Percentage ownership is based on |
| (2) | The |
52
| Kay, Ricky, our chairman, and Mr. Cheung Chi Kin, Paul, our vice chairman, Top Group International Limited is a special purpose vehicle incorporated in the British Virgin Islands, and its board of directors consists of Mr. Wong and Mr. Cheung. Mr. Wong and Mr. Cheung have entered into a voting agreement pursuant to which they agreed to vote the 339,814,284 shares held by Top Group International Limited, the | ||
| (3) | Mr. Leung Ka Pak and Mr. Yau Ming Yan, Andrew may be deemed to have beneficial ownership in the 339,814,284 shares held by Top Group International Limited. Each of them expressly disclaims any beneficial ownership in such shares except to the extent of their respective pecuniary interest therein. Mr. Leung was a director and the president of all of our subsidiaries in Canada (other than City Telecom (Canada) Inc.) and resigned as a director and president in October 2005. After Mr. Leung’s resignation, Mr. Yau became a director and the president of all of our subsidiaries in Canada (other than City Telecom (Canada) Inc.). He resigned as a director and president in July 2006. | |
| (4) | Beneficial ownership calculation is based solely on a review of Form 2 filing made with the HKSE on June 13, 2011. |
| (5) | Beneficial ownership is determined in accordance with the rules of the SEC. |
As of December 14, 2010,18, 2012, there were 1422 registered holders of 11,046,4406,906,271 American Depositary Shares in the United States, consisting of 28.75%17.07% of our outstanding shares.
All shareholders own ordinary shares and enjoy the same voting rights with respect to each share.
Except as disclosed above, we are not directly or indirectly owned or controlled by any other person, corporation or foreign government.
We are not aware of any arrangement the operation of which may at a subsequent date result in a change of control of City Telecom.
| B. | Related party transactions |
For the period since the beginning of our preceding three financial years up to the date of this document, we were a party to the following related party transactions.
Contracts with our directors and senior management
All of our directors and senior management have employment service agreements with us. Certain of our directors and senior management receive housing allowances, pensions, bonuses and commissions. In addition, some of our directors are also senior management of City Telecom and these persons may also have the ability to make significant business decisions effecting our operations. See Item 6 “Directors and senior management” above of this annual report for details concerning these arrangements.
See pages F-1 — F-64to F-51 following Item 19.
Legal and regulatory proceedings
As of August 31, 2012, there were no legal or regulatory proceeding relatingarbitration proceedings that have had in the recent past, or to Fixed Mobile Interconnection Charges,our knowledge, may have, significant effects on our financial position or FMIC, as described below:
53
Dividends
Unless the relevant provisions of the Hong Kong Companies Ordinance require otherwise, our board of directors may pay such interim dividends as appears to them to be justified by our financial position and pay any dividend payable at a fixed rate at intervals decided upon by our board of directors, whatever our financial position, if the board of directors feels that this payment is justified.
Any dividend not claimed by a shareholder after a period of six years from the date when it was first due to be paid shall be forfeited and shall revert to us. The payment by our board of directors of any unclaimed dividend, interest or other sum payable on or in respect of a share into a separate account shall not make us responsible as a trustee for such sums.
For fiscal 2010,2012, an interim dividend was declared at HK6.5 centsHK$0.15 per ordinary share. The total amount of HK$49,724,827.45119,674,000 was paid as cash dividend on July 25, 2010.
A final dividend of HK13.5 centsHK$0.15 per ordinary share was proposed on November 9, 2010,21, 2012, which will be approvedvoted for approval by shareholders in the annual general meeting to be held on December 21, 2010.31, 2012. The 20102012 final dividend will be paid on or about January 5, 2011.
| A. | Offer and listing details |
Our ordinary shares have been listed under the number “1137” on The Stock Exchange of Hong Kong Limited, or the HKSE since August 4, 1997. Our American depositary shares, each representing 20 ordinary shares, have been listed under the symbol “CTEL” on Nasdaq since November 3, 1999. Our 10-year senior notes were listed under the ISIN codes of US178677AA87 and USY16599AA30 on the Singapore Exchange Securities Trading Limited, or SGX-ST, on January 24, 2005. The 10-year senior notes were subsequently exchanged for registered notes with ISIN code US178677AB60 pursuant to a registration statement under the U.S. Securities Act of 1933 on June 24, 2005.
On December 4, 2009, we repurchased a portion of the 10-year senior notes with a cumulative principal amount of HK$11.6 million (US$1.5 million) from the open market. We paid a total consideration, including accrued interest, of approximately HK$12.1 million (US$1.6 million). On February 1, 2010, we redeemed the then outstanding 10-year senior notes with a cumulative principal amount of HK$153.9 million (US$19.9 million) at the redemption price equal to 104.375% of the principal amount. We paid a total consideration, including accrued interest, of approximately HK$167.6 million (US$21.6 million). As of August 31, 2010, all the 10-year senior notes hashad been repurchased and redeemed.
In April 2010, we offered an aggregate of 4,025,000 ADSs representing 80,500,000 ordinary shares at the offer price of US$13.00 per ADS. The proceeds we received, after deduction of underwriters’ discount but before deduction of offering expenses, amounted to US$49.8 million.
The price of our ordinary shares on the HKSE as of its close of trading on December 14, 201018, 2012 was HK$5.782.390 per share. The table below shows the high and low closing prices of the shares on the HKSE since listing.
| Price | ||||||||
| High | Low | |||||||
| (In HK$) | ||||||||
Annual Date | ||||||||
| 2005 | 1.530 | 0.550 | ||||||
| 2006 | 0.830 | 0.570 | ||||||
| 2007 | 3.670 | 0.830 | ||||||
| 2008 | 2.170 | 0.750 | ||||||
| 2009 | 3.950 | 2.500 | ||||||
54
| Price | ||||||||
| High | Low | |||||||
| (in HK$) | ||||||||
Annual Date | ||||||||
2007 | 3.670 | 0.830 | ||||||
2008 | 2.170 | 0.750 | ||||||
2009 | 3.950 | 0.840 | ||||||
2010 | 6.770 | 3.690 | ||||||
2011 | 6.200 | 3.520 | ||||||
Quarterly Data | ||||||||
2010 | ||||||||
January to March | 6.210 | 3.800 | ||||||
April to June | 6.770 | 4.420 | ||||||
July to September | 5.200 | 3.690 | ||||||
October to December | 6.200 | 4.800 | ||||||
2011 | ||||||||
January to March | 6.200 | 5.350 | ||||||
April to June | 6.080 | 4.410 | ||||||
July to September | 4.850 | 3.520 | ||||||
October to December | 4.340 | 3.520 | ||||||
2012 | ||||||||
January to March | 5.120 | 3.950 | ||||||
April to June | 5.240 | 1.370 | ||||||
July to September | 2.140 | 1.420 | ||||||
October to December (through December 18, 2012) | 2.440 | 1.600 | ||||||
Monthly Data | ||||||||
2012 | ||||||||
June | 4.370 | 1.370 | ||||||
July | 1.760 | 1.420 | ||||||
August | 1.840 | 1.700 | ||||||
September | 2.140 | 1.820 | ||||||
October | 1.920 | 1.600 | ||||||
November | 1.970 | 1.720 | ||||||
December (through December 18, 2012) | 2.440 | 1.900 | ||||||
| Price | ||||||||
| High | Low | |||||||
| (In HK$) | ||||||||
Quarterly Data | ||||||||
2008 | ||||||||
| January to March | 2.170 | 1.620 | ||||||
| April to June | 2.090 | 1.670 | ||||||
| July to September | 1.950 | 1.340 | ||||||
| October to December | 1.360 | 0.750 | ||||||
2009 | ||||||||
| January to March | 1.140 | 0.840 | ||||||
| April to June | 1.780 | 1.100 | ||||||
| July to September | 2.630 | 1.630 | ||||||
| October to December | 3.950 | 2.500 | ||||||
2010 | ||||||||
| January to March | 6.210 | 3.800 | ||||||
| April to June | 6.770 | 4.420 | ||||||
| July to September | 5.200 | 3.690 | ||||||
| October to December (through December 14, 2010) | 6.200 | 4.800 | ||||||
Monthly Data | ||||||||
2010 | ||||||||
| June | 5.280 | 4.420 | ||||||
| July | 4.560 | 3.690 | ||||||
| August | 4.570 | 4.010 | ||||||
| September | 5.200 | 4.720 | ||||||
| October | 5.270 | 4.800 | ||||||
| November | 6.200 | 5.000 | ||||||
| December (through December 14, 2010) | 5.960 | 5.740 | ||||||
| Price | ||||||||
| High | Low | |||||||
| (In US$) | ||||||||
Annual Date | ||||||||
| 2005 | 3.980 | 1.370 | ||||||
| 2006 | 2.009 | 1.380 | ||||||
| 2007 | 10.750 | 2.010 | ||||||
| 2008 | 5.750 | 1.915 | ||||||
| 2009 | 10.300 | 2.000 | ||||||
Quarterly Data | ||||||||
2008 | ||||||||
| January to March | 5.580 | 4.250 | ||||||
| April to June | 5.750 | 4.370 | ||||||
| July to September | 4.910 | 2.950 | ||||||
| October to December | 3.380 | 1.915 | ||||||
55
| Price | ||||||||
| High | Low | |||||||
| (in US$) | ||||||||
Annual Date | ||||||||
2007 | 10.750 | 2.010 | ||||||
2008 | 5.750 | 1.915 | ||||||
2009 | 10.300 | 2.000 | ||||||
2010 | 17.330 | 9.670 | ||||||
2011 | 15.780 | 9.080 | ||||||
Quarterly Data | ||||||||
2010 | ||||||||
January to March | 16.180 | 10.150 | ||||||
April to June | 17.330 | 11.340 | ||||||
July to September | 13.500 | 9.670 | ||||||
October to December | 15.980 | 12.500 | ||||||
2011 | ||||||||
January to March | 15.780 | 13.730 | ||||||
April to June | 15.300 | 11.360 | ||||||
July to September | 12.040 | 9.220 | ||||||
October to December | 11.170 | 9.080 | ||||||
2012 | ||||||||
January to March | 13.480 | 10.100 | ||||||
April to June | 13.340 | 9.740 | ||||||
July to September | 9.960 | 3.910 | ||||||
October to December (through December 18, 2012) | 6.250 | 3.970 | ||||||
Monthly Data | ||||||||
2012 | ||||||||
June | 11.190 | 9.740 | ||||||
July | 9.960 | 3.910 | ||||||
August | 5.050 | 4.430 | ||||||
September | 5.540 | 4.610 | ||||||
October | 4.680 | 3.970 | ||||||
November | 4.990 | 4.220 | ||||||
December (through December 18, 2012) | 6.250 | 4.790 | ||||||
| B. | Plan of distribution |
| Price | ||||||||
| High | Low | |||||||
| (In US$) | ||||||||
2009 | ||||||||
| January to March | 2.870 | 2.000 | ||||||
| April to June | 4.650 | 2.870 | ||||||
| July to September | 7.023 | 4.050 | ||||||
| October to December | 10.300 | 6.610 | ||||||
2010 | ||||||||
| January to March | 16.180 | 10.150 | ||||||
| April to June | 17.330 | 11.340 | ||||||
| July to September | 13.500 | 9.670 | ||||||
| October to December(through December 14, 2010) | 15.980 | 12.500 | ||||||
Monthly Data | ||||||||
2010 | ||||||||
| June | 13.460 | 11.340 | ||||||
| July | 11.850 | 9.6700 | ||||||
| August | 11.980 | 10.200 | ||||||
| September | 13.500 | 12.450 | ||||||
| October | 13.620 | 12.500 | ||||||
| November | 15.980 | 12.770 | ||||||
| December (through December 14, 2010) | 15.650 | 14.480 | ||||||
| B. | Memorandum and Articles of Association |
Described below is a summary of certain provisions of our existing Memorandum and Articles of Association (the “Articles”) and, where relevant, the Hong Kong Companies Ordinance. As this is a summary, it does not contain all the information that may be important to you. You should therefore read our complete Articles if you would like additional information, which were filed with the U.S. Securities and Exchange Commission as an exhibit 1 to the annual report on Form 20-F for fiscal 2005 and is incorporated by reference herein.
56
General
Directors’ interests
A director shall not vote on, or be counted in the quorum in relation to, any resolution of our board of directors in respect of any contract in which the director or any of his associate(s) (within the meaning of the HKSE Listing Rules) has a material interest. This prohibition shall not apply to the following:
| (a) | the giving of any security or indemnity to him or his associates(s) in respect of money lent or obligations incurred or undertaken by him or any of them at the request of or for the benefit of the Company or any of its subsidiaries; |
| (b) | the giving of any security or indemnity to a third party in respect of a debt or obligation of the Company or any of its subsidiaries for which he or his associate(s) has himself/themselves assumed responsibility in whole or in part and whether alone or jointly under a guarantee or indemnity or by the giving of security; |
| (c) | any proposal concerning an offer of shares, debentures or other securities of or by the Company or any other company which the Company may promote or be interested in for subscription or purchase in which offer he or his associate(s) is/are or is/are to be interested as a participant in the underwriting or sub-underwriting thereof; |
| (d) | any proposal concerning any other company in which he or his associate(s) is/are interested only, whether directly or indirectly, as an officer, executive or shareholder or in which he or his associate(s) is/are beneficially interested in shares of that Company, provided that he and any of his associate(s) are not in aggregate beneficially interested in five per cent or more of the issued shares of any class of such Company (or of any third company through which his interest or that of his associate(s) is derived) or of the voting rights; |
| (e) | any proposal or arrangement concerning the benefit of Talents of the Company or its subsidiaries, including the adoption, modification or operation of any Talents’ share scheme or any share incentive or share option scheme under which the director or his associate(s) may benefit; |
| (f) | any proposal or arrangement concerning the benefit of Talents of the Company or its subsidiaries, including the adoption, modification or operation of a pension fund or retirement, death or disability benefits scheme which relates both to directors (or his associate(s)) and Talents of the Company or any of its subsidiaries and does not provide in respect of any director or his associate(s), as such any privilege or advantage not generally accorded to the class of persons to which such scheme or fund relates; and |
| (g) | any contract or arrangement in which he or his associate(s) is/are interested in the same manner as other holders of shares or debentures or other securities of the Company by virtue only of his/their interest in shares or debentures or other securities of the Company. |
Additionally, there is no shareholding qualification required to be a director.
Dividends
In accordance with our Articles, we may by ordinary resolution (being a resolution passed by a majority of those votes cast by the shareholders who attend and vote at a general meeting) from time to time declare dividends, but no dividend shall exceed the amount recommended by our board of directors. Our Articles contain provisions on apportioning dividends according to the amounts paid up on the shares in respect of which dividend is paid under pro rata basis during the period covered by the dividend.
In accordance with our Articles, our board of directors may pay such interim dividends that appear to be justified by our financial position and may also pay any dividend payable at a fixed rate at intervals decided upon by our board of directors, whenever our financial position, in the opinion of our board of directors, justifies the payment.
In respect of any dividend proposed to be paid or declared, our board of directors may further propose and announce prior to or at the same time as the payment or declaration of such dividend either that:
| (a) | such dividend be satisfied in whole or in part in the form of an allotment of shares to the shareholders, credited as being fully paid up, provided that all the shareholders entitled to receive the dividend will also be entitled to choose to receive the dividend (or a part of it) in cash; or |
| (b) | the shareholders entitled to such dividend are entitled to elect to receive an allotment of shares credited as fully paid up instead of the whole or part of the cash dividend our board of directors may decide upon. |
Any general meeting declaring a dividend may, upon the recommendation of our board of directors, by ordinary resolution, direct that the dividend shall be met, wholly or partly, by the distribution of our assets.
57
Liquidation
Subject to the requirements under the Hong Kong Companies Ordinance, in the event of a members’ winding up, the liquidator may, with the sanction of a special resolution of the Company:
| (a) | divide among the shareholders the whole or any part of the assets of the Company and set such value as the liquidator deems fair upon any property to be divided and determine how the division shall be carried out between the shareholders; or |
| (b) | vest the whole or any part of such assets in trustees upon such trusts for the benefit of the contributories as the liquidator shall think fit, but no shareholder shall be compelled to accept any shares or other assets upon which there is any liability. |
Annual and extraordinary general meeting of shareholders
The Hong Kong Companies Ordinance requires our board of directors to hold an annual general meeting of our shareholders once every year and not more than 15 months after our previous annual general meeting. The annual general meeting and any other general meeting of our shareholder held for the passing of a special resolution (being a resolution passed by not less than 75% of those votes cast by the shareholders who attend and vote at a general meeting) should be convened by not less than 21 clear days’ notice in writing. The notice shall specify the place, date and time of meeting and the general nature of the business to be transacted. An annual general meeting may be called by not less than 20 clear business days’ notice if it is agreed by all shareholders entitled to attend and vote at the meeting. The business of the annual general meeting will include:
| (a) | the declaration and sanctioning of dividends; |
| (b) | the consideration and adoption of the accounts, balance sheet and reports of the directors and auditors and other documents required to be attached to the financial statements; |
| (c) | the appointment of directors in place of those retiring (by rotation or otherwise); |
| (d) | the appointment of auditors; and |
| (e) | the fixing of, or the determining of the method of fixing, the remuneration of the directors and of the auditors. |
Our board of directors may convene an extraordinary general meeting (which is any general meeting of the shareholders other than the annual general meeting) whenever it thinks fit and must do so upon the request in writing of shareholders holding not less than one-twentieth of our paid-up capital carrying the right to vote at a general meeting. All extraordinary general meetings (other than those convened for the passing of a special resolution referred to above) should be convened by at not less than 10 clear business days’ notice in writing. Extraordinary general meetings may be called by less than 10 clear business days’ notice by a majority in number of the shareholders having the right to attend and vote at the meeting, being a majority together holding not less than 95% in nominal value of the shares giving that right.
Except as otherwise provided by our Articles, two shareholders present in person or by proxy and entitled to vote shall be a quorum for all purposes. Whilst no business shall be transacted at any general meeting unless a quorum is present when the meeting proceeds to business, the absence of a quorum shall not preclude the choice or appointment of a chairman which shall not be treated as part of the business of the meeting.
The Nasdaq marketplace rules also provide that a foreign private issuer such as ourselvesus may be granted an exemption from such requirements if it follows the practice of its home country.
Restrictions on ownership of shares
There are no restrictions, either pursuant to our Articles or to the laws of Hong Kong, on the rights of non-residents of Hong Kong or foreign persons to hold or exercise voting rights with respect to our ordinary shares.
Voting rights
Any decisions that are made by the shareholders in a general meeting require the passing of either an ordinary or a special resolution at such meeting. The type of resolution required to be passed depends upon the provisions of the Hong Kong Companies Ordinance and our Articles as certain matters may only be decided by the passing of a special resolutions.
58
Pursuant to Rule 13.39(4) of the HKSE Listing Rules which became effective on January 1, 2009, any votes of the Shareholders at a general meeting must be taken by poll.
Any shareholder that is a recognized clearing house within the meaning of the Securities and Futures Ordinance of Hong Kong may authorize such person or persons as it thinks fit to act as its representative (or representatives) at any general meeting or at any separate meeting of any class of shareholders (if relevant). However, if more than one person is authorized, the authorization must specify the number and class of shares in respect of which each person is in fact authorized. The authorized person will be entitled to exercise the same power on behalf of the recognized clearing house as that clearing house (or its nominees) could exercise if it were an individual shareholder of the Company.
Issue of shares
Under the Companies Ordinance, our board of directors may, without the prior approval of the shareholders, offer to issue new shares to existing shareholders in proportion to their current shareholdings. Our board of directors may not issue new shares in any other way without the prior approval of the shareholders. Any such approval given in a general meeting shall continue in force until the earlier of: (1) the conclusion of the next annual general meeting; or (2) the expiration of the period within which the next annual general meeting is required by law to be held; or (3) when revoked or varied by an ordinary resolution of the shareholders in a general meeting. Where such shareholders’ approval is given, subject to the HKSE Listing Rules and any conditions attached to such approval, our unissued shares may be at the disposal of our board of directors, which may offer, allot, grant options over or otherwise dispose of them to such persons, at such times and for such consideration and upon such terms and conditions as the directors may decide.
Subject to the provisions of our Articles, any shareholder may transfer all or any of his shares by an instrument of transfer in the usual or common form or in such other form as our board of directors may accept and may approve. Such instrument may be signed by hand or, if the buyer or seller is a clearing house or its nominee(s), signed by hand or by a machine imprinted signature or by such other manner as our board of directors may approve from time to time.
The instrument of transfer of a share shall be executed by or on behalf of both the buyer and the seller of that share provided that our board of directors may dispense with the signing of the instrument of transfer by the buyer in any case which it thinks fit in its discretion to do so. Except as provided in the paragraph above, our board of directors may also decide, either generally or in any particular case, upon request by either the buyer or seller of shares to accept mechanically signed transfers. The seller shall be deemed to remain the holder of the share until the name of the buyer is entered into our register in respect of that share. All instruments of transfer, when registered, may be retained by us. Nothing in our Articles prevents our board of directors from recognizing a renunciation of the allotment or provisional allotment of any share by the person to whom the shares were to be allotted in favor of some other person.
Our board of directors may in its absolute discretion and without giving any reason, decline to register any transfer of any share which is not a fully paid share.
Our board of directors may also decline to register any transfer unless:
| (a) | the instrument of transfer, duly stamped, is lodged with us accompanied by the certificate for the shares to which it relates and such other evidence as our board of directors may reasonably require to show the right of the seller to make the transfer; |
| (b) | such fee, not more than the maximum amount allowed by |
| (c) | the instrument of transfer is in respect of only one class of share; |
| (d) | in the case of a transfer of a share jointly held by two or more holders, the number of joint holders to whom the share is to be transferred does not exceed four; and |
| (e) | the shares concerned are free of any lien in favor of us. |
If our board of directors declines to register a transfer of any share, it shall, within two months after the date on which the instrument of transfer was lodged, send to the buyer notice of the refusal.
Shareholders
In accordance with our Articles, only persons who are registered in our register of members are recognized by us as shareholders and absolute owners of the shares. The register of members may be closed by our board of directors at such times and for such periods as it may from time to time decide by giving notice by advertisement in a newspaper circulating generally in Hong Kong,accordance with the HKSE Listing Rules, but the register shall be closed in any year for not more than 30 days (excluding Sundays and public holidays) unless extended by ordinary resolution.
59
Variations of Rights of Shares
Subject to the Companies Ordinance, all or any of the rights for the time being attached to any class of shares for the time being issued may from time to time (whether or not the Company is being wound up) be varied with the consent in writing of the holders of not less than three-fourths in nominal value of the issued shares of that class or with the sanction of a special resolution passed at a separate general meeting of the holders of such shares.
| C. | Material contracts |
Other than such contracts as are described in our disclosure in Item 7 “Major shareholders and related party transactions — related party transactions”4 “Information on the Company”, we have not entered into any material contracts outside the ordinary course of our business within the two years preceding the date of this annual report.
| D. | Exchange controls |
The Basic Law of Hong Kong provides that the Hong Kong dollar will remain the legal tender in Hong Kong after July 1, 1997. The Basic Law also provides that no foreign exchange control policies will be applied in Hong Kong and that the Hong Kong dollar will be freely convertible. During the Asia regional economic crisis in 1998, however, the Hong Kong Governmentgovernment intervened on several occasions in the foreign exchange market by purchasing the Hong Kong dollar and selling the U.S. dollar to support the value of the Hong Kong dollar.
There are no restrictions, either pursuant to our Articles, or pursuant to the laws of Hong Kong, on the rights of non-residents of Hong Kong or foreign persons to hold or exercise voting rights with respect to our ordinary shares, or export or import capital.
| E. | Taxation |
The following provides a general outline of the material tax considerations that may be relevant to a decision to own or dispose of our American depositary shares or shares but does not purport to deal with the tax consequences applicable to all categories of investors. Prospective investors should consult their own professional advisers on the Hong Kong, United States and overall tax implications of investing, holding or disposing the American depositary shares or shares under the laws of the countries in which they are liable to taxation. The discussion below is applicable to both U.S. and non-U.S. citizens as an investor.
Hong Kong Taxation
Tax on dividends
No tax is payable in Hong Kong by withholding or otherwise in respect of dividends paid by City Telecom.
Profits tax
No tax is imposed in Hong Kong in respect of gains from the sale of our shares and American depositary shares, unless all the following factors are present:
| (i) | such profits are derived from or arise in Hong Kong; |
| (ii) | such profits are attributable to a trade, profession or business carried on in Hong Kong; and |
| (iii) | the property in question, such as shares and American depositary shares, are not capital assets of that trade, profession or business. |
Taxable profits are subject to Hong Kong profits tax on corporations at the rate of 16.5% and on unincorporated businesses or individuals at the rate of 15%.
Profits from the sales of our shares, which are effected on the Hong Kong Stock Exchange,HKSE, will be considered to be derived from or arising in Hong Kong. Such profits are taxable if the shares are not held as capital assets and the profits are attributable to a business, trade or profession carried out in Hong Kong.
Profits from the sales of our American depositary shares will be considered to be derived from or arising in Hong Kong if the relevant purchase or sales contracts are effected in Hong Kong. In the event that those persons dealing or trading in the American depositary shares are doing so as part of their trade, profession or business that is being carried out in Hong Kong and the shares are not capital assets of such trade of business, then such profits will be subject to Hong Kong profits tax. In any case of an exchange of any American depositary receipts evidencing American depositary shares for certificates representing shares, any profit gained on subsequent disposition of such shares will be the difference between the initial price of American depositary shares and the market value of such shares at the date of disposition.
Stamp duty
The sale and purchase of shares is subject to Hong Kong stamp duty which is payable by both the seller and purchase.the purchaser. Both seller and purchaser must pay stamp duty at a rate of 0.1% each, totaling 0.2%, of the total value of the greater of (i) the consideration paid or (ii) the market value of the shares on the Hong Kong Stock Exchange,HKSE, or otherwise, on the date the contract note for the sale or purchase is executed. If, inWhere one of the caseparties to a transfer of a sale or purchase ofthe shares effected by a person who is not resident in Hong Kong and the stamp duty on either or both of the contract notes is not paid, the transfereeduty not paid will be liable to stampassessed on the instrument of transfer (if any) and pay stamp duty onwill be payable by the instrument in an amount equal to the unpaid duty.transferee. If the instrument is not stamped before or within the time for stamping such instrument, a penalty of up to ten10 times the duty payable may be imposed. In addition, a fixed duty of HK$5.00 is currently payable on any instrument of transfer of shares.
60
Tax treaty
There is currently no reciprocal tax treaty between Hong Kong and the U.S. regarding withholding.
United States Taxation
The following is a summary ofdiscussion describes certain United StatesU.S. federal income tax considerations that are anticipatedconsequences to be material to the purchase, ownership, and dispositionU.S. Holders (as defined below) under present law of an investment in our American depository shares or American depositary shares byordinary shares. This discussion applies only to U.S. Holders that hold the American depository shares or ordinary shares as defined below.capital assets (generally, property held for investment) and that have the U.S. dollar as their functional currency. This summarydiscussion is based on the U.S. Internal Revenue Codetax laws of 1986,the United States as amended (the “Code”), its legislative history, existingof the date of this annual report and proposedon U.S. Treasury regulations published rulings and court decisions, all as in effect onor, in some cases, proposed as of the date hereof. These lawsof this annual report, as well as judicial and administrative interpretations thereof available on or before such date. All of the foregoing authorities are all subject to change, or different interpretation, possibly on a retroactive basis. This summary does not discusswhich change could apply retroactively and could affect the tax consequences described below.
The following discussion neither deals with the tax consequences to any particular investor nor describes all aspects of United States federal income taxation which may be importantthe tax consequences applicable to particular investorspersons in light of their individual investment circumstances, such as investors subject to special tax rules including: partnerships,situations such as:
banks;
certain financial institutions, institutions;
insurance companies, companies;
regulated investment companies, companies;
real estate investment trusts, broker-dealers, trusts;
broker-dealers;
traders that elect to mark to market;
U.S. expatriates;
tax-exempt organizations, and, except as described below, non-U.S. Holders,entities;
persons liable for alternative minimum tax;
persons holding an American depository share or to persons that will hold our shares or American depositary sharesordinary share as part of a straddle, hedge,hedging, conversion or constructive sale transaction for United Statesintegrated transaction;
persons that actually or constructively own 10% or more of the total combined voting power of all classes of our voting stock;
persons who acquired American depository shares or ordinary shares pursuant to the exercise of any employee share option or otherwise as compensation; or
| ��� | partnerships or pass-through entities, or persons holding American depository shares or ordinary shares through such entities. |
INVESTORS ARE URGED TO CONSULT THEIR TAX ADVISORS ABOUT THE APPLICATION OF THE U.S. FEDERAL TAX RULES TO THEIR PARTICULAR CIRCUMSTANCES AS WELL AS THE STATE, LOCAL, NON-U.S. AND OTHER TAX CONSEQUENCES TO THEM OF THE PURCHASE, OWNERSHIP AND DISPOSITION OF AMERICAN DEPOSITORY SHARES OR ORDINARY SHARES.
The discussion below of the U.S. federal income tax purposesconsequences to “U.S. Holders” will apply to you if you are the beneficial owner of our American depository shares or that haveordinary shares and you are, for U.S. federal income tax purposes:
an individual who is a functional currencycitizen or resident of the United States;
a corporation (or other thanentity taxable as a corporation for U.S. federal income tax purposes) created or organized in the United States dollar, all of whom may be subject to tax rules that differ significantly from those summarized below. In addition, this summary does not discuss any foreign, state, or local tax considerations. This summary assumes that investors will hold our shares or American depositary shares as “capital assets” (generally, property held for investment) under the Code.
an estate, the income of which is subject to U.S. federal state, local,income taxation regardless of its source; or
a trust that (1) is subject to the primary supervision of a court within the United States and foreign income and other tax considerationsthe control of the purchase, ownership, and disposition of our sharesone or American depositary shares.
If you are a beneficial owner of shares or American depositary shares that is for United States federal income tax purposes:
61
The U.S. Treasury has expressed concerns that intermediaries in the exchangechain of ownership between the holder of an American depositarydepository share and the issuer of the security underlying the American depository share may be taking actions that are inconsistent with the beneficial ownership of the underlying security (for example, pre-releasing American depository shares to persons that do not have the beneficial ownership of the securities underlying the American depository shares). Accordingly, the creditability of any foreign taxes and the availability of the reduced tax rate for the holders’ proportionate interestany dividends received by certain non-corporate U.S. Holders, including individual U.S. Holders (as discussed below), could be affected by actions taken by intermediaries in the shares. A U.S. Holder’s tax basis inchain of ownership between the withdrawnholders of American depository shares will beand our company if as a result of such actions the sameholders of American depository shares are not properly treated as the tax basis inbeneficial owners of underlying ordinary shares.
Dividends and Other Distributions on the American depositary share surrendered therefore, andDepository Shares or Ordinary Shares
Subject to the holding period inPFIC rules discussed below, the withdrawngross amount of any distributions we make to you with respect to our American depository shares will include the period during which the holder held the surrendered American depositary share.
With respect to certain non-corporate U.S. Holders, including individual U.S. Holders, for taxable years beginning before January 1, 2013, any dividends may be taxed at the lower capital gains rate applicable to “qualified dividend income,” provided (1) the American depositarydepository shares and thereafter as gain from the sale or exchange of a capital asset. Dividends paidordinary shares are readily tradable on an established securities market in Hong Kong dollars will be includible in income in a United States dollar amount based on the United States, dollar(2) we are neither a PFIC nor treated as such with respect to Hong Kong dollar “spot” exchange rate prevailing atyou (as discussed below) for the timetaxable year in which the dividend was paid and the preceding taxable year, and (3) certain holding period requirements are met. Under U.S. Internal Revenue Service authority, American depository shares are considered for purposes of receipt of such dividends by the depositary,clause (1) above to be readily tradable on an established securities market in the case ofUnited States if they are listed on Nasdaq, as are our American depositarydepository shares. However, based on existing guidance, it is not entirely clear whether dividends you receive with respect to the ordinary shares or bywill be taxed as qualified dividend income, because the ordinary shares are not themselves listed on a U.S. Holder, in the case of shares held directly by such U.S. Holder. U.S. Holdersexchange. You should consult their ownyour tax advisors regarding the United States federal income tax treatmentavailability of any foreign currency gain or loss recognized on the subsequent conversion of Hong Kong dollars received as dividends to United States dollars. Dividends received on shares or American depositary shares will not be eligible for the dividends received deduction allowed to corporations.
Any dividends will be treated, for United States federal income tax purposes, as income from non-U.S. sources. Such non-U.S.constitute foreign source income generally will be “passive category income”for foreign tax credit limitation purposes. If the dividends are taxed as qualified dividend income (as discussed above), or in certain cases “general category income”, which is treated separately from other typesthe amount of incomethe dividend taken into account for purposes of computingcalculating the U.S. foreign tax credit. A U.S. Holder may be eligible, subject to a number of complex limitations, to claim a foreign tax credit limitation will in general be limited to the gross amount of the dividend, multiplied by the reduced tax rate applicable to qualified dividend income and divided by the highest tax rate normally applicable to dividends. The limitation on foreign taxes eligible for credit is calculated separately with respect to specific classes of any foreign withholding taxes imposed onincome. For this purpose, dividends received ondistributed by us with respect to our American depository shares or American depositary shares.ordinary shares will generally constitute “passive category income” but could, in the case of certain U.S. Holders, who do not elect to claim a U.S. foreign tax credit for foreign income tax withheld may instead claim a deduction, for United States federal income tax purposes, in respect of such withholdings, but only for a year in which the U.S. Holder elects to do so for all creditable foreign income taxes.
Disposition of American depositary shares. The analysis of the creditability of foreign withholding taxes could be affected by future actions that may be taken by the United States Treasury.
Subject to the PFIC rules discussed below, you will recognize capitaltaxable gain or loss upon theon any sale, exchange or other taxable disposition of sharesan American depository share or American depositary shares in an amountordinary share equal to the difference between the amount realized uponfor the dispositionAmerican depository share or ordinary share and the U.S. Holder’s adjustedyour tax basis in such sharesthe American depository share or American depositary shares, as each is determined in U.S. dollars. Any suchordinary share. The gain or loss generally will be capital gain or loss will be long-term ifloss. If you are a non-corporate U.S. Holder, including an individual U.S. Holder, that has held the sharesAmerican depository share or American depositary shares have been heldordinary share for more than one year, andyou may be eligible for reduced tax rates. The deductibility of capital losses is subject to limitations. Any gain or loss you recognize on a disposition of American depository shares or ordinary shares will generally be United Statestreated as U.S. source gainincome or loss. Certain non-corporate U.S. Holders (including individuals) may qualify for preferential rates of United States federal income taxation in respect of long-term capital gains for taxable years beginning before January 1, 2011. The claim of a deduction in respect of a capital loss for United Statesforeign tax credit limitation purposes.
Passive Foreign Investment Company
Based on the market price of our American depository shares, the value of our assets, and the composition of our income and assets, though not without doubt, we do not believe we were a PFIC for U.S. federal income tax purposes for our taxable year ended August 31, 2012. However, the application of the PFIC rules is subject to uncertainty in several respects, and we cannot assure you that the U.S. Internal Revenue Service will not take a contrary position. A non-U.S. corporation will be a PFIC for U.S. federal income tax purposes for any taxable year if either:
at least 75% of its gross income for such year is passive income, or
at least 50% of the value of its assets (based on an average of the quarterly values of the assets) during such year is attributable to assets that produce passive income or are held for the production of passive income.
For this purpose, we will be treated as owning our proportionate share of the assets and earning our proportionate share of the income of any other corporation in which we own, directly or indirectly, at least 25% (by value) of the stock.
A separate determination must be made after the close of each taxable year as to whether we were a PFIC for that year. Because the value of our assets for purposes of the PFIC test will generally be determined by reference to the market price of our American depository shares and ordinary shares, fluctuations in the market price of our American depository shares and ordinary shares may cause us to become a PFIC. In addition, changes in the composition of our income or assets may cause us to become a PFIC. Furthermore, unless our share value increases and/or we invest a substantial amount of our cash, we may be a PFIC for our current taxable year ending August 31, 2013. If we are a PFIC for any taxable year during which you hold American depository shares or ordinary shares, we generally will continue to be treated as a PFIC with respect to you for all succeeding years during which you hold American depository shares or ordinary shares, unless we cease to be a PFIC and you make a “deemed sale” election with respect to the American depository shares or ordinary shares. If such election is made, you will be deemed to have sold American depository shares or ordinary shares you hold at their fair market value on the last day of the last taxable year in which we qualified as a PFIC, and any gain from such deemed sale would be subject to the consequences described in the following two paragraphs. After the deemed sale election, your American depository shares or ordinary shares with respect to which the deemed sale election was made will not be treated as shares in a PFIC unless we subsequently become a PFIC.
For each taxable year that we are treated as a PFIC with respect to you, you will be subject to special tax rules with respect to any “excess distribution” you receive and any gain you recognize from a sale or other disposition (including a pledge) of the American depository shares or ordinary shares, unless you make a “mark-to-market” election as discussed below. Distributions you receive in a taxable year that are greater than 125% of the average annual distributions you received during the shorter of the three preceding taxable years or your holding period for the American depository shares or ordinary shares will be treated as an excess distribution. Under these special tax rules:
the excess distribution or recognized gain will be allocated ratably over your holding period for the American depository shares or ordinary shares,
the amount allocated to the current taxable year, and any taxable years in your holding period prior to the first taxable year in which we were a PFIC, will be treated as ordinary income, and
the amount allocated to each other taxable year will be subject to the highest tax rate in effect for individuals or corporations, as applicable, for each such year, and the interest charge generally applicable to underpayments of tax will be imposed on the resulting tax attributable to each such year.
The tax liability for amounts allocated to taxable years prior to the year of disposition or excess distribution cannot be offset by any net operating losses for such years, and gains (but not losses) realized on the sale or other disposition of our American depository shares or ordinary shares cannot be treated as capital, even if you hold the American depository shares or ordinary shares as capital assets.
If we are treated as a PFIC with respect to you for any taxable year, to the extent any of our subsidiaries are also PFICs or we make direct or indirect equity investments in other entities that are PFICs, you may be deemed to own shares in such lower-tier PFICs that are directly or indirectly owned by us in that proportion which the value of the American depository shares or ordinary shares you own bears to the value of all of our American depository shares and ordinary shares, and you may be subject to limitations. If a U.S. Holder receives Hong Kong dollars for any such disposition, such U.S. Holder should consult its ownthe adverse tax advisor regarding the United States federal income tax treatment of any foreign currency gain or loss recognized on the subsequent conversion of the Hong Kong dollars to United States dollars.
A U.S. Holder of “marketable stock” (as defined below) in a PFIC may make a mark-to-market election for such stock to elect out of the PFIC rules described above regarding excess distributions and recognized gains. If you make a mark-to-market election for our American depository shares or ordinary shares, you will include in income for each year we are a PFIC an amount equal to the excess, if any, of the fair market value of the American depository shares or ordinary shares as of the close of your taxable year over your adjusted basis in such American depository shares or ordinary shares. You will be allowed a deduction for the excess, if any, of the adjusted basis of the American depository shares or ordinary shares over their fair market value as of the close of the taxable year. However, deductions will be allowable only to the extent of any net mark-to-market gains on the American depository shares or ordinary shares included in your income andfor prior taxable years. Amounts included in your income under a mark-to-market election, as well as gain on the actual sale or other disposition of the American depository shares or ordinary shares, will be treated as ordinary income. Ordinary loss treatment will also apply to the deductible portion of any mark-to-market loss on the American depository shares or ordinary shares, as well as to any loss realized on the actual sale or other disposition of the American depository shares or ordinary shares, to the extent the amount of such loss does not exceed the net mark-to-market gains in respect of your investmentpreviously included for such American depository shares or ordinary shares. Your basis in the ADSs.
The mark-to-market election is available only for “marketable stock,” which is stock that is regularly traded on a qualified exchange or other market, as defined in applicable U.S. Treasury regulations. Our American depository shares are listed on the Nasdaq, which is a qualified exchange or other market for these purposes. Consequently, if the American depository shares continue to be listed on the Nasdaq and are regularly traded, and you are a holder of American depository shares, we expect the mark-to-market election would be available to you if we were to become a PFIC. Because a mark-to-market election cannot be classifiedmade for equity interests in any lower-tier PFICs that we own, a U.S. Holder may continue to be subject to the PFIC rules with respect to its indirect interest in any investments held by us that are treated as an equity interest in a PFIC for any taxable year, a U.S. Holder would be subject to special rules generally intended to reduce or eliminate any benefits from the deferral of United States federal income tax purposes. You should consult your tax advisors as to the availability and desirability of a mark-to-market election, as well as the impact of such election on interests in any lower-tier PFICs.
Alternatively, if a non-U.S. corporation is a PFIC, a holder of shares in that corporation may avoid taxation under the PFIC rules described above regarding excess distributions and recognized gains by making a U.S. Holder could derive from investing“qualified electing fund” election to include in a foreign company that does not distribute allincome its share of its earningsthe corporation’s income on a current basis. InHowever, you may make a qualified electing fund election with respect to your American depository shares or ordinary shares only if we agree to furnish you annually with certain tax information, and we currently do not intend to prepare or provide such event, ainformation.
Unless otherwise provided by the U.S. Treasury, each U.S. Holder of a PFIC is required to file an annual report containing such information as the sharesU.S. Treasury may require. If we are or American depositary sharesbecome a PFIC, you should consult your tax advisor regarding any reporting requirements that may be subjectapply to tax at ordinary income tax rates on (i) any gain recognized on the sales of the shares or American depositary shares and (ii) any “excess distribution” paid on the shares or American depositary shares (generally, a distribution in excess of 125% of the average
62
Information Reporting and Backup Withholding
Any dividend payments with respect to American depositarydepository shares by a Non-U.S. Holder will not give rise to any United States federal income tax consequences unless:
Backup withholding is not an additional income tax, and the amount of anytax. Amounts withheld as backup withholding from a payment to amay be credited against your U.S. Holder will be allowed as credit against the U.S. Holder’s United States federal income tax liability, provided thatand you may obtain a refund of any excess amounts withheld under the backup withholding rules by filing the appropriate returnsclaim for refund with the U.S. Internal Revenue Service and furnishing any required information in a timely manner.
Additional Reporting Requirements
Certain U.S. Holders who are filed.
| H. | Documents on display |
We filed with Securities and Exchange Commission in Washington, D.C. a registration statement on Form F-1 (Registration No. 333-11012) under the Securities Act in connection with our global offering of American depositary shares in November 1999. The registration statement contains exhibits and schedules. For further information with respect to City Telecom and the American depositary shares, please refer to the registration statement and to the exhibits and schedules filed with the registration statement. In addition, whenever a reference is made in this annual report to a contract or other document of City Telecom, you should be aware that such reference is not necessarily complete and that you should refer to the exhibits and schedules that are a part of the registration statement for a copy of the contract or other document.
The Company’s registration statements may be inspected and copied, including exhibits and schedules, and the reports and other information as filed with the Securities and Exchange Commission in accordance with the Securities Exchange Act of 1934 at the public reference facilities maintained by the Securities and Exchange Commission at 100F Street NE, Washington, D.C. 20549. Copies of such material may also be obtained from the Public Reference Section of the Securities and Exchange Commission at 100F Street NE, Washington, D.C. 20549, at prescribed rates. Information may be obtained regarding the Washington D.C. Public Reference Room by calling the Securities
63
Quantitative and qualitative disclosures about market risk have been included in note 2426 to our consolidated financial statements.
| B. | Warrants and rights |
Not applicable.
| C. | Other securities |
Not applicable.
| D. | American depositary shares |
Fees and Expenses
Persons depositing ordinary shares or ADR holders must pay: | For: | |
| US$5.00 (or less) per 100 ADSs (or portion of 100 ADSs) | Issuance of ADSs, including issuances resulting from a distribution of shares or rights or other property | |
| US$5.00 (or less) per 100 ADSs (or portion of 100 ADSs) | • Cancellation of ADSs for the purpose of withdrawal, including if the deposit agreement terminates | |
| US$0.02 (or less) per ADS | • Any cash distribution to our ADR holders | |
| A fee equivalent to the fee that would be payable if securities distributed to our ADR holders had been ordinary shares and the ordinary shares had been deposited for issuance of ADSs | • Distribution of securities distributed to holders of deposited securities which are distributed by the depositary to ADR holders | |
| Registration or transfer fees | • Transfer and registration of ordinary shares on our ordinary share register to or from the name of the depositary or its agent when our ADR holders deposit or withdraw ordinary shares | |
| Expenses of the depositary in converting foreign currency to U.S. dollars | • Whenever the depositary or the custodian receives foreign currency, by way of dividends or other distributions or the net proceeds from the sale of securities, property or rights, and if at the time of the receipt thereof the foreign currency so received can in the judgment of the depositary be converted on a reasonable basis into U.S. dollars and the resulting U.S. dollars transferred to the United States | |
| Expenses of the depositary | • Cable, telex and facsimile transmissions (when expressly provided in the deposit agreement) | |
| Taxes and other governmental charges the depositary or the custodian have to pay on any ADR or ordinary share underlying an ADR, for example, stock transfer taxes, stamp duty or withholding taxes | As necessary | |
| Any charges incurred by the depositary or its agents for servicing the deposited securities | As necessary | |
Payment of Taxes
The ADR holder is required to pay all taxes and other governmental charges that may be payable in respect of any their ADSs, or the shares or other securities underlying their ADSs. The depositary may refuse to effect a transfer of any ADRs or refuse to effect the withdrawal of any securities underlying the ADRs while any such taxes and charges are outstanding. The depositary may deduct the amount of any taxes owed from any payments to our ADR holders. It may also sell deposited securities, by public or private sale, to pay any taxes owed. Our ADR holders will remain liable if the proceeds of the sale are not enough to pay the taxes. If the depositary sells deposited securities, it will, if appropriate, reduce the number of ADSs to reflect the sale and pay to our ADR holders any proceeds, or send to our ADR holders any property, remaining after it has paid the taxes.
Fees and Payments from the Depositary to Us
In fiscal year 2012, the Company did not receive any payment from the depositary.
None.
None.
| A. | Disclosure controls and procedures |
An evaluation was carried out under the supervision and with the participation of our management, including our Chief Executive Officer and Chief Financial Officer, of the effectiveness of our disclosure controls and procedures. As of the end of the period covered by this annual report, based on that evaluation, our Chief Executive Officer and Chief Financial Officer have concluded that our disclosure controls and procedures arewere effective to provide reasonable assurance that information the Company iswas required to disclose in reports that the Company filesfiled or submitssubmitted under the Securities Exchange Act of 1934 iswas recorded, processed, summarized and reported within the time periods specified in SEC rules and forms, and that such information iswas accumulated and communicated to the Company’s management, including the Company’s Chief Executive Officer and Chief Financial Officer, as appropriate, to allow timely decisions regarding required disclosure. In designing and evaluating the disclosure controls and procedures, management recognizes that any controls and procedures, no matter how well designed and operated, can provide only reasonable assurance of achieving the desired control objectives. In addition, the design of disclosure controls and procedures must reflect the fact that there are resource constraints and that management is required to apply its judgment in evaluating the benefits of possible controls and procedures relative to their costs. Subsequent to the date of their evaluation, there have been no significant changes in our internal controls or in other factors that could significantly affect these controls.
| B. | Management’s report on internal control over financial reporting |
Our management is responsible for establishing and maintaining adequate internal control over financial reporting for the Company, as defined in Rules 13a-15(f) under the Securities Exchange Act of 1934, as amended. The Company’s internal control over financial reporting is designed to provide reasonable assurance regarding the reliability of financial reporting and the preparation of consolidated financial statements for external purpose in accordance with generally accepted accounting principles. Under Section 404(a) of the Sarbanes-Oxley Act of 2002, our management is required to include its assessment of the effectiveness of our internal control procedures over financial reporting in our annual report on Form 20-F beginning in the fiscal year ended August 31, 2009. With the assistance of Company’s internal audit department and external consultants, our management organized and conducted a comprehensive assessment of internal control over financial reporting based on the control criteria in COSO framework. Based on this assessment, the Directors believe that, as atof August 31, 2010,2012, the internal control over financial reporting iswas effective.
| C. | Report of Independent Registered Public Accounting Firm |
The Board of Directors and Shareholders of City Telecom (H.K.) Limited:
64
We conducted our audit in accordance with the standards of the Public Company Accounting Oversight Board (United States). Those standards require that we plan and perform the audit to obtain reasonable assurance about whether effective internal control over financial reporting was maintained in all material respects. Our audit included obtaining an understanding of internal control over financial reporting, assessing the risk that a material weakness exists, and testing and evaluating the design and operating effectiveness of internal control based on the assessed risk. Our audit also included performing such other procedures as we considered necessary in the circumstances. We believe that our audit provides a reasonable basis for our opinion.
A company’s internal control over financial reporting is a process designed to provide reasonable assurance regarding the reliability of financial reporting and the preparation of financial statements for external purposes in accordance with generally accepted accounting principles. A company’s internal control over financial reporting includes those policies and procedures that (1) pertain to the maintenance of records that, in reasonable detail, accurately and fairly reflect the transactions and dispositions of the assets of the company; (2) provide reasonable assurance that transactions are recorded as necessary to permit preparation of financial statements in accordance with generally accepted accounting principles, and that receipts and expenditures of the company are being made only in accordance with authorizations of management and directors of the company; and (3) provide reasonable assurance regarding prevention or timely detection of unauthorized acquisition, use, or disposition of the company’s assets that could have a material effect on the financial statements.
Because of its inherent limitations, internal control over financial reporting may not prevent or detect misstatements. Also, projections of any evaluation of effectiveness to future periods are subject to the risk that controls may become inadequate because of changes in conditions, or that the degree of compliance with the policies or procedures may deteriorate.
In our opinion, City Telecom (H.K.) Limited and its subsidiaries maintained, in all material respects, effective internal control over financial reporting as of August 31, 2010,2012, based on criteria established in Internal Control – Control—Integrated Framework issued by the Committee of Sponsoring Organizations of the Treadway Commission.
We also have audited, in accordance with the standards of the Public Company Accounting Oversight Board (United States), the consolidated balance sheets of City Telecom (H.K.) Limited and its subsidiaries as of August 31, 20092012 and 2010,2011, and the related consolidated income statements, consolidated statements of comprehensive income, consolidated statements of changes in equity, and consolidated cash flow statements for each of the years in the three-year period ended August 31, 2010,2012, and our report dated November 9, 2010December 31, 2012 expressed an unqualified opinion on those consolidated financial statements.
/s/ KPMG
Hong Kong, China
December 31, 2012
| D. | ||||
| Changes in internal control over financial reporting | ||||
Upon the completion of the disposal of the Telecom Business, we are principally engaged in the Multimedia Production Business. Except for the changes to our internal controls over financial reporting as a result of the change in our business operations, there were no changes in our internal controls over financial reporting that occurred during the period covered by this annual report that have materially affected, or are reasonably likely to materially affect, our internal controls over financial reporting.
Our board of directors established an audit committee to ensure the impartial supervision of our accounting and business operations. The audit committee is comprised of three independent non-executive directors, namely, Mr. Lee Hon Ying, John, Dr. Chan Kin Man and Mr. Peh Jefferson Tun Lu. Mr. Peh was appointed to the audit committee on September 1, 2004 and is a “financial expert” within the meaning of, and as required by, the U.S. Sarbanes-Oxley Act of 2002.
All of our Talents, officers and directors are bound by our code of business ethics and conduct. We adopted our code of ethics and modified it following the passage of, and to comply with, the U.S. Sarbanes Oxley Act of 2002. Copies of our code of ethics are available for viewing on our website at http://www.ctigroup.com.hk and free of charge upon request made to our company secretary. We have not made any amendment to our code of ethics since our most recently completed fiscal year. We have never granted a waiver for non-compliance with the policies and procedures set forth in the code of ethics for any Talent of our Company or any of our subsidiaries.
65
The following table sets forth the remuneration that we paid to KPMG, our independent auditor in each of our previous two fiscal years.
| 2010 | 2009 | |||||||
| Nature of the service | HK$ million | HK$ million | ||||||
| Audit fees | 2.3 | 2.6 | ||||||
| Audit-related fees | 0.2 | 0.4 | ||||||
| Non-audit services fees | 0.3 | — | ||||||
| Total | 2.8 | 3.0 | ||||||
| 2011 | 2012 | |||||||
| (in millions) | ||||||||
| Nature of the service | HK$ | HK$ | ||||||
Audit fees | 2.3 | 1.4 | ||||||
Audit-related fees | 0.2 | 1.1 | ||||||
|
|
|
| |||||
Total | 2.5 | 2.5 | ||||||
|
|
|
| |||||
Audit fees
Audit fees are the aggregate fees billed by our independent auditors for the annual financial statement audit, subsidiary audits and other procedures required to be performed for the auditors to form an opinion on our consolidated financial statements.
Audit-related fees
Audit-related fees in fiscal 2012 are the aggregate fees billed by our independent auditors for the review of our interim financial statements and the services provided in connection with the disposal of the Telecom Business in May 2012.
Audit-related fees in fiscal 2011 are the aggregate fees billed by our independent auditors for the review of our interim financial statements and review of reports for compliance with telecommunications regulations and debt obligations.
Pre-approval polices
The engagement of KPMG and the services provided pursuant to such engagement were approved by our audit committee in accordance with paragraph (c)(7)(i) of Rule 2-01 of Regulation S-X. The fees for all such services have been pre-approved by our audit committee. Our audit committee has satisfied itself that the provision of the above-stated non-audit services has not impaired the independence of KPMG.
Not applicable.
By way of a general mandate granted to our directors, the maximum aggregate nominal amount of shares that may be purchased pursuant to a mandate corresponds to 10% of the aggregate nominal amount of our issued share capital at the date the mandate was granted. During the year ended August 31, 2010,2012, we had not repurchased any of the ordinary shares on the HKSE.
As our ordinary shares are listed on the HKSE and American depositary shares representing our ordinary shares are listed on the Nasdaq Global Market, we are subject to applicable Hong Kong laws and regulations, including the HKSE Listing Rules, and the Hong Kong Companies Ordinance, as well as applicable U.S. federal securities laws, including the Exchange Act and the Sarbanes-Oxley Act. In addition, we are subject to the corporate governance requirements imposed by Nasdaq to the extent they apply to foreign private issuers. Under Nasdaq Stock Market Rule 5615(a)(3), a foreign private issuer such as us may follow its home country corporate governance practices in lieu of certain of the Nasdaq Stock Market Rules corporate governance requirements. Our current corporate governance practices differ from Nasdaq corporate governance requirements for U.S. companies in certain respects, as summarized below:
Nasdaq Stock Market Rule 5605(b)(1) requires a Nasdaq listed company to have a board of directors consisting of a majority of independent members, In this regard we have elected to adopt the practices of our home country, As a listed company in Hong Kong, we are subject to the requirement under the HKSE Listing Rules that at least three members of our board of directors be independent as determined under the HKSE Listing Rules. In compliance with our home country practices, we currently have three independent
66
Nasdaq Stock Market Rule 5605(b)(2) requires a Nasdaq listed company to schedule regular executive sessions in which non-management directors meet without management participation. In this regard we have elected to adopt the practices of our home country. Under the applicable Hong Kong law, our board of directors is required to meet regularly and at least four times a year and we are required to ensure that there is active participation by a majority of the directors and afford all directors an opportunity to include matters on the agenda. In addition, when a board meeting considers a matter in which a substantial shareholder or a director has a conflict of interest, the independent directors with no material interest in such matter must be present. In compliance with our home country practices, we do not organize exclusive meetings for our independent non-executive directors on a regular basis.
Nasdaq Stock Market Rule 5605(d)(1) requires a Nasdaq listed company to have the compensation of the chief executive officer and the other executive officers be determined, or recommended to the its board of directors for determination, by a compensation committee comprised solely of independent directors. In this regard we have elected to adopt the practices of our home country. Under the HKSE Listing Rules, listed companies are required to establish a remuneration committee with a majority of independent non-executive directors. The compensation of our executive officers is determined by a remuneration committee consisting of six directors, three of whom are independent non-executive directors.
Nasdaq Stock Market Rule 5605(e)(1) requires a Nasdaq listed company to have a nominations committee consisting solely of independent directors to select or recommend for selection director nominees. In this regard we have elected to adopt the practices of our home country and do not have a nominations committee consisting solely of independent directors. Under the HKSE Listing Rules, listed companies are recommended but not required to establish a nomination committee consisting of the independent non-executive directors with majority vote. Our director nominees are selected by or recommended for selection by our board of directors. Our current practice is not inconsistent with our home country practices.
67
We have selectedelected to provide the financial statements and related information specified inpursuant to Item 18.
See pages F-1 to F-64F-51 following Item 19.
| (a) | Exhibit |
| (b) | Exhibit |
| (c) | Exhibit |
68
Audited Consolidated Financial Statements | Pages | |||
| F-1 | ||||
| F-2 | ||||
| F-3 | ||||
| F-4 | ||||
| F-5 | ||||
| F-7 | ||||
| F-8 | ||||
The Board of Directors and Shareholders
City Telecom (H.K.) Limited
We have audited the accompanying consolidated statements of financial positionbalance sheets of City Telecom (H.K.) Limited and its subsidiaries (the “Group”) as of August 31, 20092012 and 2010,2011, and the related consolidated income statements, consolidated statements of comprehensive income, consolidated statements of changes in equity and the consolidated cash flow statements for the each of the years in the three-year period ended August 31, 2010.2012. These consolidated financial statements are the responsibility of the Group’sCity Telecom (H.K.) Limited’s management. Our responsibility is to express an opinion on these consolidated financial statements based on our audits.
We conducted our audits in accordance with the standards of the Public Company Accounting Oversight Board (United States). Those standards require that we plan and perform the audit to obtain reasonable assurance about whether the financial statements are free of material misstatement. An audit includes examining, on a test basis, evidence supporting the amounts and disclosures in the financial statements. An audit also includes assessing the accounting principles used and significant estimates made by management, as well as evaluating the overall financial statement presentation. We believe that our audits provide a reasonable basis for our opinion.
In our opinion, the consolidated financial statements referred to above present fairly, in all material respects, the financial position of City Telecom (H.K.) Limited and its subsidiaries as of August 31, 20092012 and 2010,2011, and the results of their operations and their cash flows for each of the years in the three-year period ended August 31, 2010,2012, in conformity with the International Financial Reporting Standards as issued by the International Accounting Standards Board.
We have also audited, in accordance with the standards of the Public Company Accounting Oversight Board (United States), the City Telecom (H.K.) Limited and its subsidiaries’Limited’s internal control over financial reporting as of August 31, 2010,2012, based on criteria established in Internal Control –- Integrated Framework issued by the Committee of Sponsoring Organizations of the Treadway Commission (COSO), and our report dated November 9, 2010December 31, 2012 expressed an unqualified opinion on the effectiveness of the internal control over financial reporting of City Telecom (H.K.) Limited and its subsidiaries.
F-1
| KPMG |
| Hong Kong, China |
| December 31, 2012 |
Consolidated income statements
(Expressed in Hong Kong dollars)
| For the year ended August 31, | ||||||||||||||||
| 2010 | 2009 | 2008 | ||||||||||||||
| Note | HK$’000 | HK$’000 | HK $’000 | |||||||||||||
Revenue | 2 | 1,574,687 | 1,478,239 | 1,302,981 | ||||||||||||
| Network costs | 3 | (195,292 | ) | (175,129 | ) | (178,367 | ) | |||||||||
| Other operating expenses | 4 | (a) | (1,105,604 | ) | (1,037,964 | ) | (966,094 | ) | ||||||||
| Other income, net | 4 | (b) | 7,989 | 41,540 | 24,989 | |||||||||||
| Finance costs | 4 | (c) | (22,235 | ) | (55,127 | ) | (75,137 | ) | ||||||||
Profit before taxation | 4 | 259,545 | 251,559 | 108,372 | ||||||||||||
| Income tax (expense)/benefit | 5 | (42,679 | ) | (38,730 | ) | 16,818 | ||||||||||
Profit attributable to shareholders | 216,866 | 212,829 | 125,190 | |||||||||||||
Basic earnings per share | 7 | HK30.7 cents | HK32.4 cents | HK19.7 cents | ||||||||||||
Diluted earnings per share | 7 | HK29.4 cents | HK31.8 cents | HK19.0 cents | ||||||||||||
| For the year ended August 31, | ||||||||||||||
| 2012 | 2011 | 2010 | ||||||||||||
| Note | HK$’000 | HK$’000 (restated) | HK$’000 (restated) | |||||||||||
Continuing operations | ||||||||||||||
Turnover | 3 | 3,762 | — | — | ||||||||||
Cost of sales | 4 | (6,006 | ) | — | — | |||||||||
Valuation gains on investment properties | 18,200 | — | — | |||||||||||
Other operating expenses | 5(a) | (104,960 | ) | (23,481 | ) | (21,932 | ) | |||||||
Other income/(loss), net | 5(b) | 19,920 | 3,456 | (7,696 | ) | |||||||||
Finance costs, net | 5(c) | (2,455 | ) | (7,303 | ) | (21,289 | ) | |||||||
|
|
|
|
|
| |||||||||
Loss before taxation | 5 | (71,539 | ) | (27,328 | ) | (50,917 | ) | |||||||
Income tax expense | 6 | (2,281 | ) | (4,782 | ) | (5,611 | ) | |||||||
|
|
|
|
|
| |||||||||
Loss from continuing operations | (73,820 | ) | (32,110 | ) | (56,528 | ) | ||||||||
|
|
|
|
|
| |||||||||
Discontinued operations | ||||||||||||||
Profit from discontinued operations (net of tax) | 2 | 3,771,694 | 346,025 | 273,394 | ||||||||||
|
|
|
|
|
| |||||||||
Profit for the year | 3,697,874 | 313,915 | 216,866 | |||||||||||
|
|
|
|
|
| |||||||||
Attributable to: | ||||||||||||||
Equity shareholders of the Company | ||||||||||||||
- Continuing operations | (71,406 | ) | (32,110 | ) | (56,528 | ) | ||||||||
- Discontinued operations | 3,771,694 | 346,025 | 273,394 | |||||||||||
|
|
|
|
|
| |||||||||
| 3,700,288 | 313,915 | 216,866 | ||||||||||||
|
|
|
|
|
| |||||||||
Non-controlling interest | ||||||||||||||
- Continuing operations | (2,414 | ) | — | — | ||||||||||
- Discontinued operations | — | — | — | |||||||||||
|
|
|
|
|
| |||||||||
| (2,414 | ) | — | — | |||||||||||
|
|
|
|
|
| |||||||||
Profit for the year | 3,697,874 | 313,915 | 216,866 | |||||||||||
|
|
|
|
|
| |||||||||
Basis (loss)/earnings per share | 8 | |||||||||||||
- Continuing and discontinued operations | HK471.9 cents | HK40.8 cents | HK30.7 cents | |||||||||||
- Continuing operations | HK(9.0) cents | HK(4.1) cents | HK(8.0) cents | |||||||||||
- Discontinued operations | HK480.9 cents | HK44.9 cents | HK38.7 cents | |||||||||||
Diluted (loss)/earnings per share | 8 | |||||||||||||
- Continuing and discontinued operations | HK465.1 cents | HK39.6 cents | HK29.4 cents | |||||||||||
- Continuing operations | HK(9.0) cents | HK(4.1) cents | HK(8.0) cents | |||||||||||
- Discontinued operations | HK474.1 cents | HK43.7 cents | HK37.1 cents | |||||||||||
The accompany notes are integral part of these consolidated financial statements.
F-2
Consolidated statementstatements of comprehensive income
(Expressed in Hong Kong dollars)
| For the year ended August 31, | ||||||||||||
| 2010 | 2009 | 2008 | ||||||||||
| HK$’000 | HK$’000 | HK$’000 | ||||||||||
Profit for the year | 216,866 | 212,829 | 125,190 | |||||||||
Other comprehensive income | ||||||||||||
| Exchange differences on translation of financial statements of overseas subsidiaries | (97 | ) | 70 | 1,619 | ||||||||
Total comprehensive income for the year | 216,769 | 212,899 | 126,809 | |||||||||
| For the year ended August 31, | ||||||||||||
| 2012 | 2011 | 2010 | ||||||||||
| HK$’000 | HK$’000 | HK$’000 | ||||||||||
Profit for the year | 3,697,874 | 313,915 | 216,866 | |||||||||
Other comprehensive income | ||||||||||||
Exchange differences on translation of financial statements of subsidiaries outside Hong Kong | (265 | ) | 2,383 | (97 | ) | |||||||
Exchange reserve realized upon disposal of Telecom Business | (4,881 | ) | — | — | ||||||||
|
|
|
|
|
| |||||||
Total comprehensive income for the year | 3,692,728 | 316,298 | 216,769 | |||||||||
|
|
|
|
|
| |||||||
Attributable to: | ||||||||||||
Equity shareholders of the Company | 3,695,142 | 316,298 | 216,769 | |||||||||
Non-controlling interest | (2,414 | ) | — | — | ||||||||
|
|
|
|
|
| |||||||
| 3,692,728 | 316,298 | 216,769 | ||||||||||
|
|
|
|
|
| |||||||
The accompany notes are integral part of these consolidated financial statements.
F-3
Consolidated balance sheets
(Expressed in Hong Kong dollars)
| As at August 31, | ||||||||||||
| 2010 | 2009 | |||||||||||
| Note | HK$’000 | HK$’000 | ||||||||||
Non-current assets | ||||||||||||
| Goodwill | 11 | 1,066 | 1,066 | |||||||||
| Fixed assets | 12 | 1,431,813 | 1,302,380 | |||||||||
| Long term receivable and prepayment | 5,174 | 6,091 | ||||||||||
| Deferred expenditure | 14 | 6,626 | 12,786 | |||||||||
| 1,444,679 | 1,322,323 | |||||||||||
Current assets | ||||||||||||
| Accounts receivable | 15 | 99,729 | 120,192 | |||||||||
| Other receivables, deposits and prepayments | 15 | 89,490 | 69,765 | |||||||||
| Deferred expenditure | 14 | 28,986 | 36,674 | |||||||||
| Pledged bank deposits | 27 | — | 15,038 | |||||||||
| Cash at bank and in hand | 16 | 588,665 | 226,416 | |||||||||
| 806,870 | 468,085 | |||||||||||
Current liabilities | ||||||||||||
| Bank overdrafts — unsecured | 10,490 | 5,364 | ||||||||||
| Accounts payable | 17 | 35,128 | 37,555 | |||||||||
| Other payables and accrued charges | 17 | 195,931 | 206,487 | |||||||||
| Deposits received | 21,822 | 16,385 | ||||||||||
| Deferred service revenue | 18 | 106,798 | 115,070 | |||||||||
| Tax payable | 1,533 | 1,993 | ||||||||||
| Current portion — obligations under finance leases | 22 | 212 | 202 | |||||||||
| 371,914 | 383,056 | |||||||||||
Net current assets | 434,956 | 85,029 | ||||||||||
Total assets less current liabilities | 1,879,635 | 1,407,352 | ||||||||||
Non-current liabilities | ||||||||||||
| Deferred tax liabilities | 20 | 55,843 | 15,709 | |||||||||
| Derivative financial instrument | 21 | 11,293 | — | |||||||||
| Long-term debt and other liabilities | 22 | 123,960 | 163,116 | |||||||||
| 191,096 | 178,825 | |||||||||||
Net assets | 1,688,539 | 1,228,527 | ||||||||||
Capital and reserves | ||||||||||||
| Share capital | 19 | 76,500 | 66,418 | |||||||||
| Reserves | 19 | 1,612,039 | 1,162,109 | |||||||||
Total equity attributable to equity shareholders of the Company | 1,688,539 | 1,228,527 | ||||||||||
| As at August 31, | ||||||||||
| 2012 | 2011 | |||||||||
| Note | HK$’000 | HK$’000 | ||||||||
Non-current assets | ||||||||||
Goodwill | 12 | — | 1,066 | |||||||
Fixed assets | 13 | 477,141 | 1,642,701 | |||||||
Intangible assets | 14 | 311,726 | — | |||||||
Long term receivable and prepayment | 284 | 4,101 | ||||||||
Deferred expenditure | 16 | — | 15,323 | |||||||
|
|
|
| |||||||
| 789,151 | 1,663,191 | |||||||||
|
|
|
| |||||||
Current assets | ||||||||||
Accounts receivable | 17 | 1,311 | 71,999 | |||||||
Other receivables, deposits and prepayments | 17 | 31,581 | 90,984 | |||||||
Programme costs | 87,617 | — | ||||||||
Inventories | 577 | — | ||||||||
Deferred expenditure | 16 | — | 29,312 | |||||||
Term deposits | 18(a) | 544,040 | — | |||||||
Cash at bank and in hand | 18(b) | 2,083,079 | 408,976 | |||||||
|
|
|
| |||||||
| 2,748,205 | 601,271 | |||||||||
|
|
|
| |||||||
Current liabilities | ||||||||||
Bank overdrafts - unsecured | 3,026 | 845 | ||||||||
Accounts payable | 19 | 5,371 | 17,419 | |||||||
Other payables and accrued charges | 19 | 31,118 | 209,585 | |||||||
Deposits received | 2,259 | 26,969 | ||||||||
Current portion - deferred services revenue | 20 | — | 85,895 | |||||||
Tax payable | 935 | 2,281 | ||||||||
Current portion - obligations under finance leases | 24 | 85 | 105 | |||||||
|
|
|
| |||||||
| 42,794 | 343,099 | |||||||||
|
|
|
| |||||||
Net current assets | 2,705,411 | 258,172 | ||||||||
|
|
|
| |||||||
Total assets less current liabilities | 3,494,562 | 1,921,363 | ||||||||
|
|
|
| |||||||
Non-current liabilities | ||||||||||
Deferred tax liabilities | 22 | 1,346 | 111,138 | |||||||
Long-term deferred services revenue | 20 | — | 992 | |||||||
Derivative financial instrument | 23 | 9,663 | 11,564 | |||||||
Obligations under finance leases | 24 | 160 | 288 | |||||||
|
|
|
| |||||||
| 11,169 | 123,982 | |||||||||
|
|
|
| |||||||
Net assets | 3,483,393 | 1,797,381 | ||||||||
|
|
|
| |||||||
Capital and reserves | 21 | |||||||||
Share capital | 80,902 | 77,191 | ||||||||
Reserves | 3,402,491 | 1,720,190 | ||||||||
|
|
|
| |||||||
Total equity | 3,483,393 | 1,797,381 | ||||||||
|
|
|
| |||||||
The accompany notes are integral part of these consolidated financial statements.
F-4
Consolidated statements of changes in equity
(Expressed in Hong Kong dollars)
| Capital | ||||||||||||||||||||||||||||
| Share | Share | Capital | redemption | Retained | Exchange | |||||||||||||||||||||||
| capital | premium | reserve | reserve | profits | reserve | Total | ||||||||||||||||||||||
| HK$’000 | HK$’000 | HK$’000 | HK$’000 | HK$’000 | HK$’000 | HK$’000 | ||||||||||||||||||||||
| At September 1, 2009 | 66,418 | 681,208 | 23,232 | 7 | 454,802 | 2,860 | 1,228,527 | |||||||||||||||||||||
| Total comprehensive income for the year | — | — | — | — | 216,866 | (97 | ) | 216,769 | ||||||||||||||||||||
| Dividend paid in respect of previous year | — | — | — | — | (108,735 | ) | — | (108,735 | ) | |||||||||||||||||||
| Dividend paid in respect of current year | — | — | — | — | (49,725 | ) | — | (49,725 | ) | |||||||||||||||||||
| Shares issued upon exercise of share option | 2,032 | 22,227 | (7,515 | ) | — | — | — | 16,744 | ||||||||||||||||||||
| Equity settled share-based transactions | — | — | 5,347 | — | — | — | 5,347 | |||||||||||||||||||||
| Shares issued upon placement | 8,050 | 371,562 | — | — | — | — | 379,612 | |||||||||||||||||||||
| At August 31, 2010 | 76,500 | 1,074,997 | 21,064 | 7 | 513,208 | 2,763 | 1,688,539 | |||||||||||||||||||||
| Capital | ||||||||||||||||||||||||||||
| Share | Share | Capital | redemption | Retained | Exchange | |||||||||||||||||||||||
| capital | premium | reserve | reserve | profits | reserve | Total | ||||||||||||||||||||||
| HK$’000 | HK$’000 | HK$’000 | HK$’000 | HK$’000 | HK$’000 | HK$’000 | ||||||||||||||||||||||
| At September 1, 2008 | 65,062 | 670,717 | 19,013 | — | 275,025 | 2,790 | 1,032,607 | |||||||||||||||||||||
| Total comprehensive income for the year | — | — | — | — | 212,829 | 70 | 212,899 | |||||||||||||||||||||
| Dividend paid in respect of previous year | — | — | — | — | (3,108 | ) | — | (3,108 | ) | |||||||||||||||||||
| Shares issued in respect of scrip dividend of previous year | 1,221 | 8,685 | — | — | (9,906 | ) | — | — | ||||||||||||||||||||
| Dividend paid in respect of current year | — | — | — | — | (19,904 | ) | — | (19,904 | ) | |||||||||||||||||||
| Shares issued upon exercise of share option | 142 | 1,806 | (549 | ) | — | — | — | 1,399 | ||||||||||||||||||||
| Equity settled share-based transactions | — | — | 4,768 | — | — | — | 4,768 | |||||||||||||||||||||
| Repurchase and cancellation of ordinary shares | (7 | ) | — | — | 7 | (134 | ) | — | (134 | ) | ||||||||||||||||||
| At August 31, 2009 | 66,418 | 681,208 | 23,232 | 7 | 454,802 | 2,860 | 1,228,527 | |||||||||||||||||||||
F-5
| Note | Share capital HK$’000 | Share premium HK$’000 | Capital reserve HK$’000 | Capital redemption reserve HK$’000 | Retained profits HK$’000 | Exchange reserve HK$’000 | Revaluation HK$’000 | Other HK$’000 | Total HK$’000 | Non-controlling HK$’000 | Total equity HK$’000 | |||||||||||||||||||||||||||||||||||
At September 1, 2011 | 77,191 | 1,083,495 | 23,759 | 7 | 607,783 | 5,146 | — | — | 1,797,381 | — | 1,797,381 | |||||||||||||||||||||||||||||||||||
|
|
|
|
|
|
|
|
|
|
|
|
|
|
|
|
|
|
|
|
|
| |||||||||||||||||||||||||
Profit for the year | — | — | — | — | 3,700,288 | — | — | — | 3,700,288 | (2,414 | ) | 3,697,874 | ||||||||||||||||||||||||||||||||||
Other comprehensive income | — | — | — | — | — | (5,146 | ) | — | — | (5,146 | ) | — | (5,146 | ) | ||||||||||||||||||||||||||||||||
|
|
|
|
|
|
|
|
|
|
|
|
|
|
|
|
|
|
|
|
|
| |||||||||||||||||||||||||
Total comprehensive income for the year | — | — | — | — | 3,700,288 | (5,146 | ) | — | — | 3,695,142 | (2,414 | ) | 3,692,728 | |||||||||||||||||||||||||||||||||
Final dividend paid in respect of previous year | 7(b) | — | — | — | — | (115,901 | ) | — | — | — | (115,901 | ) | — | (115,901 | ) | |||||||||||||||||||||||||||||||
Special dividend paid in respect of current year | 7(a) | — | — | — | — | (2,022,542 | ) | — | — | — | (2,022,542 | ) | — | (2,022,542 | ) | |||||||||||||||||||||||||||||||
Interim dividend paid in respect of current year | 7(a) | — | — | — | — | (119,674 | ) | — | — | — | (119,674 | ) | — | (119,674 | ) | |||||||||||||||||||||||||||||||
Shares issued upon exercise of share option | 21(a)(i) | 3,711 | 104,510 | (33,044 | ) | — | — | — | — | — | 75,177 | — | 75,177 | |||||||||||||||||||||||||||||||||
Equity settled share-based transactions | 5(d) | — | — | 10,480 | — | — | — | — | — | 10,480 | — | 10,480 | ||||||||||||||||||||||||||||||||||
Share options lapsed | — | — | (1,195 | ) | — | 1,195 | — | — | — | — | — | — | ||||||||||||||||||||||||||||||||||
Revaluation of investment properties | 13 | — | — | — | — | — | — | 165,156 | — | 165,156 | — | 165,156 | ||||||||||||||||||||||||||||||||||
Contributions from non-controlling interest | — | — | — | — | — | — | — | — | — | 2,450 | 2,450 | |||||||||||||||||||||||||||||||||||
Acquisition of non-controlling interest | — | — | — | — | — | — | — | (1,826 | ) | (1,826 | ) | (36 | ) | (1,862 | ) | |||||||||||||||||||||||||||||||
|
|
|
|
|
|
|
|
|
|
|
|
|
|
|
|
|
|
|
|
|
| |||||||||||||||||||||||||
At August 31, 2012 | 80,902 | 1,188,005 | — | 7 | 2,051,149 | — | 165,156 | (1,826 | ) | 3,483,393 | — | 3,483,393 | ||||||||||||||||||||||||||||||||||
|
|
|
|
|
|
|
|
|
|
|
|
|
|
|
|
|
|
|
|
|
| |||||||||||||||||||||||||
At September 1, 2010 | 76,500 | 1,074,997 | 21,064 | 7 | 513,208 | 2,763 | — | — | 1,688,539 | — | 1,688,539 | |||||||||||||||||||||||||||||||||||
|
|
|
|
|
|
|
|
|
|
|
|
|
|
|
|
|
|
|
|
|
| |||||||||||||||||||||||||
Profit for the year | — | — | — | — | 313,915 | — | — | — | 313,915 | — | 313,915 | |||||||||||||||||||||||||||||||||||
Other comprehensive income | — | — | — | — | — | 2,383 | — | — | 2,383 | — | 2,383 | |||||||||||||||||||||||||||||||||||
|
|
|
|
|
|
|
|
|
|
|
|
|
|
|
|
|
|
|
|
|
| |||||||||||||||||||||||||
Total comprehensive income for the year | — | — | — | — | 313,915 | 2,383 | — | — | 316,298 | — | 316,298 | |||||||||||||||||||||||||||||||||||
Final dividend paid in respect of previous year | 7(b) | — | — | — | — | (103,735 | ) | — | — | — | (103,735 | ) | — | (103,735 | ) | |||||||||||||||||||||||||||||||
Interim dividend paid in respect of current year | 7(a) | — | — | — | — | (115,605 | ) | — | — | — | (115,605 | ) | — | (115,605 | ) | |||||||||||||||||||||||||||||||
Shares issued upon exercise of share option | 21(a)(i) | 691 | 8,498 | (1,957 | ) | — | — | — | — | — | 7,232 | — | 7,232 | |||||||||||||||||||||||||||||||||
Equity settled share-based transactions | 5(d) | — | — | 4,652 | — | — | — | — | — | 4,652 | — | 4,652 | ||||||||||||||||||||||||||||||||||
|
|
|
|
|
|
|
|
|
|
|
|
|
|
|
|
|
|
|
|
|
| |||||||||||||||||||||||||
At August 31, 2011 | 77,191 | 1,083,495 | 23,759 | 7 | 607,783 | 5,146 | — | — | 1,797,381 | — | 1,797,381 | |||||||||||||||||||||||||||||||||||
|
|
|
|
|
|
|
|
|
|
|
|
|
|
|
|
|
|
|
|
|
| |||||||||||||||||||||||||
Consolidated statements of changes in equity (continued)
(Continued)
(Expressed in Hong Kong dollars)
| Share | Share | Capital | Retained | Exchange | ||||||||||||||||||||
| capital | premium | reserve | profits | reserve | Total | |||||||||||||||||||
| HK$’000 | HK$’000 | HK$’000 | HK$’000 | HK$’000 | HK$’000 | |||||||||||||||||||
| At September 1, 2007 | 61,650 | 622,433 | 18,109 | 200,519 | 1,171 | 903,882 | ||||||||||||||||||
| Total comprehensive income for the year | — | — | — | 125,190 | 1,619 | 126,809 | ||||||||||||||||||
| Dividend paid in respect of previous year | — | — | — | (5,915 | ) | — | (5,915 | ) | ||||||||||||||||
| Shares issued in respect of scrip dividend of previous year | 1,123 | 18,044 | — | (19,167 | ) | — | — | |||||||||||||||||
| Dividend paid in respect of current year | — | — | — | (11,371 | ) | — | (11,371 | ) | ||||||||||||||||
| Shares issued in respect of scrip dividend of current year | 884 | 13,347 | — | (14,231 | ) | — | — | |||||||||||||||||
| Shares issued upon exercise of share option | 1,405 | 16,893 | (3,300 | ) | — | — | 14,998 | |||||||||||||||||
| Equity settled share-based transactions | — | — | 4,204 | — | — | 4,204 | ||||||||||||||||||
| At August 31, 2008 | 65,062 | 670,717 | 19,013 | 275,025 | 2,790 | 1,032,607 | ||||||||||||||||||
| Note | Share capital HK$’000 | Share premium HK$’000 | Capital reserve HK$’000 | Capital redemption reserve HK$’000 | Retained profits HK$’000 | Exchange reserve HK$’000 | Revaluation HK$’000 | Other HK$’000 | Total HK$’000 | Non-controlling HK$’000 | Total equity HK$’000 | |||||||||||||||||||||||||||||||||||
At September 1, 2009 | 66,418 | 681,208 | 23,232 | 7 | 454,802 | 2,860 | — | — | 1,228,527 | — | 1,228,527 | |||||||||||||||||||||||||||||||||||
|
|
|
|
|
|
|
|
|
|
|
|
|
|
|
|
|
|
|
|
|
| |||||||||||||||||||||||||
Profit for the year | — | — | — | — | 216,866 | — | — | — | 216,866 | — | 216,866 | |||||||||||||||||||||||||||||||||||
Other comprehensive income | — | — | — | — | — | (97 | ) | — | — | (97 | ) | — | (97 | ) | ||||||||||||||||||||||||||||||||
|
|
|
|
|
|
|
|
|
|
|
|
|
|
|
|
|
|
|
|
|
| |||||||||||||||||||||||||
Total comprehensive income for the year | — | — | — | — | 216,866 | (97 | ) | — | — | 216,769 | — | 216,769 | ||||||||||||||||||||||||||||||||||
Final dividend paid in respect of previous year | 7(b) | — | — | — | — | (108,735 | ) | — | — | — | (108,735 | ) | — | (108,735 | ) | |||||||||||||||||||||||||||||||
Interim dividend paid in respect of current year | 7(a) | — | — | — | — | (49,725 | ) | — | — | — | (49,725 | ) | — | (49,725 | ) | |||||||||||||||||||||||||||||||
Shares issued upon exercise of share option | 2,032 | 22,227 | (7,515 | ) | — | — | — | — | — | 16,744 | — | 16,744 | ||||||||||||||||||||||||||||||||||
Equity settled share-based transactions | 5(d) | — | — | 5,347 | — | — | — | — | — | 5,347 | — | 5,347 | ||||||||||||||||||||||||||||||||||
Shares issued upon placement | 8,050 | 371,562 | — | — | — | — | — | — | 379,612 | — | 379,612 | |||||||||||||||||||||||||||||||||||
|
|
|
|
|
|
|
|
|
|
|
|
|
|
|
|
|
|
|
|
|
| |||||||||||||||||||||||||
At August 31, 2010 | 76,500 | 1,074,997 | 21,064 | 7 | 513,208 | 2,763 | — | — | 1,688,539 | — | 1,688,539 | |||||||||||||||||||||||||||||||||||
|
|
|
|
|
|
|
|
|
|
|
|
|
|
|
|
|
|
|
|
|
| |||||||||||||||||||||||||
The accompany notes are integral part of these consolidated financial statements.
F-6
Consolidated cash flow statements
(Expressed in Hong Kong dollars)
| For the year ended August 31, | ||||||||||||||||
| 2010 | 2009 | 2008 | ||||||||||||||
| Note | HK$’000 | HK$’000 | HK$’000 | |||||||||||||
Net cash inflow from operations | 23 | (a) | 488,353 | 538,503 | 386,241 | |||||||||||
| Hong Kong profits tax (paid)/recovered | (456 | ) | — | 42 | ||||||||||||
| Overseas tax paid | (2,557 | ) | (1,732 | ) | (4,292 | ) | ||||||||||
Net cash inflow from operating activities | 485,340 | 536,771 | 381,991 | |||||||||||||
Investing activities | ||||||||||||||||
| Increase in pledged bank deposits | 15,038 | 72,281 | — | |||||||||||||
| Interest received | 11,372 | 4,869 | 15,596 | |||||||||||||
| Purchases of fixed assets | (349,076 | ) | (289,938 | ) | (189,903 | ) | ||||||||||
| Net proceeds from maturity of investment in debt securities | — | 28,051 | 3,900 | |||||||||||||
| Net proceeds from redemption of long-term bank deposit | — | — | 15,600 | |||||||||||||
| Proceeds from disposal of fixed assets | 16,412 | 8,249 | 7,057 | |||||||||||||
Net cash outflow from investing activities | (306,254 | ) | (176,488 | ) | (147,750 | ) | ||||||||||
Net cash inflow before financing activities | 179,086 | 360,283 | 234,241 | |||||||||||||
Financing activities | ||||||||||||||||
| Repurchase of ordinary shares | — | (134 | ) | — | ||||||||||||
| Proceeds from issuance of new shares | 23 | (b) | 396,356 | 1,399 | 14,998 | |||||||||||
| Proceeds from new bank loans | 163,375 | — | — | |||||||||||||
| Repayment of bank loan | (40,000 | ) | — | — | ||||||||||||
| Repayment of capital element of finance leases | 23 | (b) | (217 | ) | (138 | ) | (834 | ) | ||||||||
| Interest element of finance leases | (42 | ) | (27 | ) | (34 | ) | ||||||||||
| Interest paid on bank loans | (1,166 | ) | — | — | ||||||||||||
| Other borrowing costs paid | (3,260 | ) | (885 | ) | (3,428 | ) | ||||||||||
| Interest paid on 10-year senior notes | (5,881 | ) | (52,670 | ) | (70,010 | ) | ||||||||||
| Repurchase of 10-year senior notes | 23 | (b) | (172,423 | ) | (485,829 | ) | (269,399 | ) | ||||||||
| Dividends paid | (158,435 | ) | (23,008 | ) | (17,271 | ) | ||||||||||
Net cash inflow/(outflow) from financing activities | 178,307 | (561,292 | ) | (345,978 | ) | |||||||||||
Increase/(decrease) in cash and cash equivalent | 357,393 | (201,009 | ) | (111,737 | ) | |||||||||||
Cash and cash equivalent at September 1 | 221,052 | 421,610 | 532,894 | |||||||||||||
Effect of foreign exchange rate changes | (270 | ) | 451 | 453 | ||||||||||||
Cash and cash equivalent at August 31 | 578,175 | 221,052 | 421,610 | |||||||||||||
Analysis of the balances of cash and cash equivalents | ||||||||||||||||
| Cash at bank and in hand | 588,665 | 226,416 | 434,604 | |||||||||||||
| Bank overdrafts — unsecured | (10,490 | ) | (5,364 | ) | (12,994 | ) | ||||||||||
| 578,175 | 221,052 | 421,610 | ||||||||||||||
| For the year ended August 31, | ||||||||||||||
| 2012 | 2011 | 2010 | ||||||||||||
| Note | HK$’000 | HK$’000 | HK$’000 | |||||||||||
Net cash inflow from operations | 25(a) | 184,927 | 588,911 | 488,353 | ||||||||||
Hong Kong profits tax paid | — | — | (456 | ) | ||||||||||
Overseas tax paid | (3,003 | ) | (3,012 | ) | (2,557 | ) | ||||||||
|
|
|
|
|
| |||||||||
Net cash inflow from operating activities | 181,924 | 585,899 | 485,340 | |||||||||||
|
|
|
|
|
| |||||||||
Investing activities | ||||||||||||||
Increase in term deposits | (544,040 | ) | — | — | ||||||||||
Decrease in pledged bank deposits | — | — | 15,038 | |||||||||||
Interest received | 14,282 | 3,059 | 11,372 | |||||||||||
Proceeds from disposal of Telecom Business (net of cash disposed of) | 2(d) | 4,655,367 | — | — | ||||||||||
Purchases of fixed assets | (467,840 | ) | (437,477 | ) | (349,076 | ) | ||||||||
Proceeds from disposal of fixed assets | 24,022 | 20,229 | 16,412 | |||||||||||
|
|
|
|
|
| |||||||||
Net cash inflow/(outflow) from investing activities | 3,681,791 | (414,189 | ) | (306,254 | ) | |||||||||
|
|
|
|
|
| |||||||||
Net cash inflow before financing activities | 3,863,715 | 171,710 | 179,086 | |||||||||||
|
|
|
|
|
| |||||||||
Financing activities | ||||||||||||||
Proceeds from issuance of new shares | 25(b) | 75,177 | 7,232 | 396,356 | ||||||||||
Proceeds from new bank loans | — | — | 163,375 | |||||||||||
Repayment of bank loan | — | (125,000 | ) | (40,000 | ) | |||||||||
Repayment of capital element of finance leases | 25(b) | (99 | ) | (212 | ) | (217 | ) | |||||||
Interest element of finance leases | (19 | ) | (30 | ) | (42 | ) | ||||||||
Interest paid on bank loans | — | (1,152 | ) | (1,166 | ) | |||||||||
Other borrowing costs paid | (7,134 | ) | (4,638 | ) | (3,260 | ) | ||||||||
Interest paid on 10-year senior notes | — | — | (5,881 | ) | ||||||||||
Repurchase of 10-year senior notes | 25(b) | — | — | (172,423 | ) | |||||||||
Acquisition of non-controlling interest | (1,862 | ) | — | — | ||||||||||
Dividends paid | (2,257,812 | ) | (219,312 | ) | (158,435 | ) | ||||||||
|
|
|
|
|
| |||||||||
Net cash (outflow)/inflow from financing activities | (2,191,749 | ) | (343,112 | ) | 178,307 | |||||||||
|
|
|
|
|
| |||||||||
Increase/(decrease) in cash and cash equivalent | 1,671,966 | (171,402 | ) | 357,393 | ||||||||||
Cash and cash equivalent at September 1 | 408,131 | 578,175 | 221,052 | |||||||||||
Effect of foreign exchange rate changes | (44 | ) | 1,358 | (270 | ) | |||||||||
|
|
|
|
|
| |||||||||
Cash and cash equivalent at August 31 | 2,080,053 | 408,131 | 578,175 | |||||||||||
|
|
|
|
|
| |||||||||
Analysis of the balances of cash and cash equivalents | ||||||||||||||
Cash at bank and in hand | 18(b) | 2,083,079 | 408,976 | 588,665 | ||||||||||
Bank overdrafts - unsecured | (3,026 | ) | (845 | ) | (10,490 | ) | ||||||||
|
|
|
|
|
| |||||||||
| 2,080,053 | 408,131 | 578,175 | ||||||||||||
|
|
|
|
|
| |||||||||
The accompany notes are integral part of these consolidated financial statements.
F-7
| 1 | Significant accounting policies |
| (a) | Statement of compliance | |
City Telecom (H.K.) Limited (the “Company”) was incorporated in Hong Kong on May 19, 1992 under the Hong Kong Companies Ordinance. City Telecom (H.K.) Limited and its subsidiaries (collectively referred to as the “Group”) are engaged in the provision of production and distribution and other multimedia related activities.
The accompanying consolidated financial statements have been prepared in accordance with all applicable International Financial Reporting Standards (“IFRSs”) issued by the International Accounting Standards Board (“IASB”), which collective term includes all applicable individual International Financial Reporting Standards, International Accounting Standards (“IASs”) and Interpretations issued by the IASB.
The IASB has issued certain new and revised IFRSs that are first effective or available for early adoption for the current accounting period of the Group.
Note 1(c) provides information on any changes in accounting policies resulting from initial application of those developments to the extent that they are relevant to the Group for the current and prior accounting periods reflected in these financial statements.
The accompanying consolidated financial statements were authorized for issue by the Board of Directors on December 31, 2012.
F-8
| (b) | Basis of preparation of the financial statements |
The measurement basis used in the preparation of the financial statements is the historical cost basis except that investment properties and certain financial assets are stated at their fair values or amortized costs as explained in the accounting policies set out below (see notes 1(g), 1(l), 1(o), 1(t) and 1(u)).
The preparation of financial statements in conformity with IFRSs requires management to make judgments, estimates and assumptions that affect the application of policies and reported amounts of assets, liabilities, income and expenses. The estimates and associated assumptions are based on historical experience and various other factors that are believed to be reasonable under the circumstances, the results of which form the basis of making the judgments about the carrying values of assets and liabilities that are not readily apparent from other sources. Actual results may differ from these estimates.
The estimates and underlying assumptions are reviewed on an ongoing basis. Revisions to accounting estimates are recognized in the period in which the estimate is revised if the revision affects only that period, or in the period of the revision and future periods if the revision affects both current and future periods.
Judgments made by management in the application of IFRSs that have significant effect on the financial statements and major sources of estimation uncertainty are discussed in note 30.
| (c) | Change in accounting policies |
The IASB has issued a number of amendments to IFRSs and one new interpretation that are first effective for the current accounting period of the Group. Of these, the following developments are relevant to the Group’s financial statements:
| • | IAS 24 (revised 2009),Related party disclosures |
Improvements to IFRSs (2010)
The above developments relate primarily to clarification of certain disclosure requirements applicable to the Group’s financial statements. These developments have no material impact on the contents of the Group’s financial statements for the current or comparative periods.
The Group has early adopted the amendments to IAS 12,Income taxes, in respect of the recognition of deferred tax on investment properties carried at fair value under IAS 40,Investment properties. The amendments are effective for annual period beginning on or after January 1, 2012, but as permitted by the amendments, the Group have adopted the amendments for the year ended August 31, 2012.
Other than the early adoption of amendments to IAS 12, the Group has not applied any new standard, amendment or interpretation that is not yet effective for the current accounting period.
Amendments to IAS 12,Income taxes
Under IAS 12 deferred tax is required to be measured with reference to the tax consequences that would follow from the manner in which the entity expects to recover the carrying amount of the asset(s) in question. In this regard, the amendments to IAS 12 introduced a rebuttable presumption that the carrying amount of investment property carried at fair value under IAS 40,Investment property, will be recovered through sale. This presumption is rebutted on a property-by-property basis if the in question is depreciable and is held within a business model whose objective is to consume substantially all of the economic benefits embodied in the investment property over time, rather than through sale.
As a result of adopting the amendments to IAS 12, the Group reviewed its investment property portfolio and concluded that the presumption in the amended IAS 12 that the carrying value of the property will be recovered through sale should be adopted in respect of each of the investment properties located in Hong Kong. Therefore, the deferred tax relating to these properties has been measured on the basis of recovering their carrying amounts entirely through sale. This change in policy has no impact on the financial statements for the year ended August 31, 2011.
Change of accounting policy - Investment properties
Effective from September 1, 2011, the Group has changed its accounting policy with respect to investment properties from the cost model to the fair value model. Any gain or loss arising from a change in fair value or from the retirement or disposal of an investment property is recognized in profit or loss. The Group considers that measurement using the fair value model provides more relevant information about the financial performance of these investment properties given of their increased significance in the Group’s balance sheet.
The financial statements for the year ended August 31, 2011 have not been retrospectively restated due to the immaterial effect resulting from the change in accounting policy.
| (d) | ||
| Subsidiaries and controlled entities |
Subsidiaries are entities controlled by the Group. Control exists when the Group has the power to govern the financial and operating policies of an entity so as to obtain benefits from its activities. In assessing control, potential voting rights that presently are exercisable are taken into account.
| (e) | ||
| Group accounting | ||
| (i) | Consolidation | |
An investment in a subsidiary is consolidated into the consolidated financial statements from the date that control commences until the date that control ceases.
Intra-group balances and transactions and any unrealized profits arising from intra-group transactions are eliminated in full in preparing the consolidated financial statements. Unrealized losses resulting from intra-group transactions are eliminated in the same way as unrealized gains but only to the extent that there is no evidence of impairment.
Non-controlling interests represent the equity in a subsidiary not attributable directly or indirectly to the Company, and in respect of which the Group has not agreed any additional terms with the holders of those interests which would result in the Group as a whole having a contractual obligation in respect of those interests that meets the definition of a financial liability.
Non-controlling interests are presented in the consolidated balance sheets within equity, separately from equity attributable to the equity shareholders of the Company. Non-controlling interests in the results of the Group are presented on the face of the consolidated income statement and the consolidated statement of comprehensive income as an allocation of the total profit or loss and total comprehensive income for the year between non-controlling interests and the equity shareholders of the Company.
Changes in the Group’s interests in a subsidiary that do not result in a loss of control are accounted for as equity transactions, whereby adjustments are made to the amounts of controlling and non-controlling interests within consolidated equity to reflect the change in relative interests and no gain or loss is recognized.
When the Group loses control of a subsidiary, it is accounted for as a disposal of the entire interest in that subsidiary, with a resulting gain or loss being recognized in profit or loss. Any interest retained in that former subsidiary at the date when control is lost is recognized at fair value and this amount is regarded as the fair value on initial recognition of a financial asset or, when appropriate, the cost on initial recognized of an investment in an associate or jointly controlled entity.
In the Company’s balance sheet, an investment in a subsidiary is stated at cost less impairment losses (see note 1(k)), unless the investment is classified as held for sale or included in a disposal group that is classified as held for sale.
| (ii) | Translation of foreign currencies |
Transactions in foreign currencies are translated at exchange rates ruling at the transaction dates. Monetary assets and liabilities denominated in foreign currencies are translated at exchange rates ruling at the balance sheet date. Exchange differences arising in these cases are dealt with in profit or loss.
For consolidation purposes, the balance sheets of subsidiaries denominated in foreign currencies are translated at the rates of exchange ruling at the balance sheet date whilst the income statement is translated at an average rate for the year. Exchange differences are dealt with as a movement in reserves.
The accompanying consolidated financial statements are presented in Hong Kong Dollars, which is the Group’s functional currency. All financial information have been rounded to the nearest thousand.
| (f) | Goodwill |
Goodwill represents the excess of
| (i) | ||
| (ii) | ||
F-9
When (ii) is greater than (i), then this excess is recognized immediately in profit or loss as a gain on a bargain purchase.
Goodwill is stated at cost less accumulated impairment losses. Goodwill arising on a business combination is allocated to each cash-generating unit, or groups of cash-generating units, that is expected to benefit from the synergies of the combination and is tested annually for impairment (see note 1(k)).
On disposal of a cash-generating unit during the year, any attributable amount of purchased goodwill is included in the calculation of the profit or loss on disposal.
| (g) | ||
| Investment property |
Investment properties are land and/or buildings which are owned and held to earn rental income and/or for capital appreciation.
Investment properties are stated at fair value, unless they are still in the course of construction or development at the balance sheet date and their fair value cannot be reliably determined at that time. Any gain or loss arising from a change in fair value or from the retirement or disposal of an investment property is recognized in profit or loss. Rental income from investment properties is accounted for as described in note 1(v)(vi).
| (h) | ||
| Fixed assets | ||
| (i) | ||
Construction in progress was carried at cost, which includes development and construction expenditure incurred and interest and direct costs attributable to the development less any accumulated impairment loss (note 1(k)) as considered necessary by the directors. No depreciation is provided for construction in progress. On completion, the associated costs are transferred to leasehold land and buildings.
| (ii) |
Other fixed assets, comprising buildings, leasehold improvements, broadcasting and production equipment network, computer and office equipment, furniture, fixtures and fittings and motor vehicles, are stated at cost less accumulated depreciation and accumulated impairment losses (note 1(k)).
Depreciation is calculated to write off the cost of items of fixed assets, less their estimated residual value, if any, using the straight-line method over their estimated useful lives as follows:
Buildings situated on leasehold land are depreciated over the shorter of the unexpired term of lease and their estimated useful lives of 50 years
• | Furniture, fixtures and fittings | 4 years | ||||||||||||||||||||||
• Broadcasting and production equipment | 2 - 10 years | |||||||||||||||||||||||
• Telecommunications/network, computer and office equipment | ||||||||||||||||||||||||
| 4 - 20 years | ||||||||||||||||||||||||
• Motor vehicles | 4 years | |||||||||||||||||||||||
Leasehold improvements are depreciated over the shorter of the unexpired term of the leases and their estimated useful lives
Leasehold land classified as held under finance leases is depreciated over the unexpired term of leases
Where the parts of an item of fixed assets have different useful lives, the cost of the item is allocated on a reasonable basis between the parts and each part is depreciated separately. Both the useful life of an asset and its residual value, if any, are reviewed annually.
Major costs incurred in restoring fixed assets to their normal working condition are charged to profit or loss. Major improvements are capitalized and depreciated over their expected useful lives to the Group.
The gain or loss on disposal of a fixed asset is the difference between the net sales proceeds and the carrying amount of the relevant asset, and is recognized in profit or loss on the date of disposal.
| (i) | Intangible assets |
Intangible assets that are acquired by the Group are stated at cost less accumulated amortization (where the estimated useful life is finite) and impairment losses (see note 1(k)).
Amortization of intangible assets with finite useful lives is charged to profit or loss on a straight-line basis over the assets’ estimated useful lives.
- | Indefeasible right of use (“IRU”) of telecommunications capacity | |||||||||||||||||||||||||
- | ||||||||||||||||||||||||||
Right to use of telecommunications services |
F-10
| Assets held under leases | ||
An arrangement, comprising a transaction or a series of transactions, is or contains a lease if the Group determines that the arrangement conveys a right to use a specific asset or assets for an agreed period of time in return for a payment or a series of payments. Such a determination is made based on an evaluation of the substance of the arrangement and is regardless of whether the arrangement takes the legal form of a lease.
| (i) | Classification of assets leased to the Group | |
Assets that are held by Group under leases which transfer to the Group substantially all the risks and rewards of ownership are classified as being held under finance leases. Leases which do not transfer substantially all the risks and rewards of ownership to the Group are classified as operating leases.
Land held for own use under an operating lease for which its fair value cannot be measured separately from the fair value of a building situated thereon at the inception of the lease, is accounted for as being held under a finance lease, unless the building is also clearly held under an operating lease (see note 1(j)(iii)).
| (ii) | Finance leases | |
Where the Group acquires the use of assets under finance leases, the amounts representing the fair value of the leased asset or, if lower, the present value of the minimum lease payments of such assets, are included in fixed assets with the corresponding liabilities, net of finance charges, recorded as obligations under finance leases. Depreciation and impairment losses are accounted for in accordance with the accounting policy as set out in note 1(h) and note 1(k). Finance charges implicit in the lease payments are charged to profit or loss over the period of the leases so as to produce an approximately constant periodic rate of charge on the remaining balance of the obligations for each accounting period.
| (iii) | Operating leases |
Leases where substantially all the risks and rewards of ownership of assets remain with the lessor are accounted for as operating leases. Receipts and payments made under operating leases net of any incentives received by/from the lessor are credited/charged to profit or loss on a straight-line basis over the lease periods.
| (k) | ||
| Impairment of assets | ||
| (i) | Impairment of investments in debt and equity securities and accounts and other receivables | |
Investments in debt and equity securities and other current and non-current receivables that are stated at cost or amortized cost or are classified as available-for-sale securities are reviewed at the end of each balance sheet date to determine whether there is objective evidence of impairment. Objective evidence of impairment includes observable data that comes to the attention of the Group about one or more of the following loss events:
significant financial difficulty of the debtor;
a breach of contract, such as a default or delinquency in interest or principal payments;
it becoming probable that the debtor will enter bankruptcy or other financial reorganization;
significant changes in the technological, market, economic or legal environment that have an adverse effect on the debtor; and
a significant or prolonged decline in the fair value of an investment in an equity instrument below its cost.
If any such evidence exists, any impairment loss is determined and recognized as follows:
For investments in subsidiaries, the impairment loss is measured by comparing the recoverable amount of the investment with its carrying amount in accordance with note 1(k)(ii). The impairment loss is reversed if there has been a favourable change in the estimates used to determine the recoverable amount in accordance with note 1(k)(ii).
For trade and other current receivables and other financial assets carried at amortized cost, the impairment loss is measured as the difference between the asset’s carrying amount and the present value of estimated future cash flows, discounted at the financial asset’s original effective interest rate (i.e. the effective interest rate computed at initial recognition of these assets where the effect of discounting is material). This assessment is made collectively where financial assets carried at amortized cost share similar risk characteristics, such as similar past due status, and have not been individually assessed as impaired. Future cash flows for financial assets which are assessed for impairment collectively are based on historical loss experience for assets with credit risk characteristics similar to the collective group.
If in a subsequent period the amount of an impairment loss decreases and the decrease can be linked objectively to an event occurring after the impairment loss was recognized, the impairment loss is reversed through profit or loss. A reversal of an impairment loss shall not result in the asset’s carrying amount exceeding that would have been determined had no impairment loss been recognized in prior years.
For available-for-sale securities, the cumulative loss that has been recognized in the fair value reserve is classified to profit or loss. The amount of the cumulative loss that is recognized in profit or loss is the difference between the acquisition cost (net of any principal repayment and amortization) and current fair value, less any impairment loss on that asset previously recognized in profit or loss.
Impairment losses recognized in profit or loss in respect of available-for-sale equity securities are not reversed through profit or loss. Any subsequent increase in the fair value of such assets is recognized directly in other comprehensive income.
Impairment losses in respect of available-for-sale debt securities are reversed if the subsequent increase in fair value can be objectively related to an event occurring after the impairment loss was recognized. Reversals of impairment losses in such circumstances are recognized in profit and loss.
Impairment losses are written off against the corresponding assets directly, except for impairment losses recognized in respect of accounts receivable, whose recovery is considered doubtful but not remote. In this case, the impairment losses for doubtful debts are recorded using an allowance account. When the Group is satisfied that recovery is remote, the amount considered irrecoverable is written off against trade debtors and any amounts held in the allowance account relating to that debt are reversed. Subsequent recoveries of amounts previously charged to the allowance account are reversed against the allowance account. Other changes in the allowance account and subsequent recoveries of amounts previously written off directly are recognized in profit or loss.
F-11
| (ii) | Impairment of other assets | |
Internal and external sources of information are reviewed at the end of each balance sheet date to identify indications that the following assets may be impaired or, except in the case of goodwill, an impairment loss previously recognized no longer exists or may have decreased:
fixed assets;
intangible assets; and
goodwill.
If any such indication exists, the asset’s recoverable amount is estimated. In addition, for goodwill, the recoverable amount is estimated annually whether or not there is any indication of impairment.
Calculation of recoverable amount
The recoverable amount of an asset is the greater of its fair value less costs to sell and value in use. In assessing value in use, the estimated future cash flows are discounted to their present value using a pre-tax discount rate that reflects current market assessments of time value of money and the risks specific to the asset. Where an asset does not generate cash inflows largely independent of those from other assets, the recoverable amount is determined for the smallest group of assets that generates cash inflows independently (i.e. a cash-generating unit).
Recognition of impairment losses
An impairment loss is recognized in profit or loss whenever the carrying amount of an asset, or the cash-generating unit to which it belongs, exceeds its recoverable amount. Impairment losses recognized in respect of cash-generating units are allocated first to reduce the carrying amount of any goodwill allocated to the cash-generating unit (or group of units) and then, to reduce the carrying amount of the other assets in the unit (or group of units) on a pro rata basis, except that the carrying value of an asset will not be reduced below its individual fair value less costs to sell, or value in use, if determinable.
Reversals of impairment losses
In respect of assets other than goodwill, an impairment loss is reversed if there has been a favorable change in the estimates used to determine the recoverable amount. An impairment loss in respect of goodwill is not reversed.
A reversal of an impairment loss is limited to the asset’s carrying amount that would have been determined had no impairment loss been recognized in prior years. Reversals of impairment losses are credited to profit or loss in the year in which the reversals are recognized.
| (iii) | Interim financial reporting and impairment |
Under the Rules Governing the Listing of Securities on the Stock Exchange of Hong Kong Limited, the Group is required to prepare an interim financial report in compliance with IAS 34,Interim financial reporting, in respect of the first six months of the financial year. At the end of the interim period, the Group applies the same impairment testing, recognition and reversal criteria as it would at the end of the financial year (see note 1(k)(i) and 1(k)(ii)).
Impairment losses recognized in an interim period in respect of goodwill, available-for-sale equity securities and unquoted equity securities carried at costs are not reversed in a subsequent period. This is the case even if no loss, or a smaller loss, would have been recognized had the impairment been assessed only at the end of the financial year to which the interim period relates. Consequently, if the fair value of an available-for-sale equity security increases in the remainder of the annual period, or in any other period subsequently, the increase is recognized in other comprehensive income and not profit or losses.
| (l) | |||
F-12
| Derivative financial instruments |
Derivative financial instruments are recognized initially at fair value. At each balance sheet date, the fair value is remeasured. The gain or loss on remeasurement to fair value is recognized immediately in profit or loss, except where the derivatives qualify for cash flow hedge accounting or hedge of a net investment in a foreign operation, in which case recognition of any resultant gain or loss depends on the nature of the item being hedged. For the years presented in the consolidated financial statements, none of the Group’s derivative financial instruments qualify as hedges or hedge accounting.
| (m) | Programme costs |
Programme costs are stated at cost less amounts expensed and any provision considered necessary by management. Programme costs are charged to the profit or loss over the showing or licensing period of the programme, with reference to the projected revenue.
Self-produced Programmes
Self-produced programmes consist primarily of drama, infotainment and variety programmes. Cost of self-produced programmes comprises direct production cost and an appropriate proportion of production overheads.
Purchased Programmes
Purchased programmes consist film rights acquired for showing on the Group’s television channel. Cost of purchased programme comprises cost of purchase, cost of conversion and an appropriate proportion of production overheads.
| (n) | ||
| Deferred expenditure | ||
F-13
| Accounts |
Trade and other receivables are initially recognized at fair value and thereafter stated at amortized cost less allowance for impairment of doubtful debts (see note 1(k)(i)), except where the receivables are interest-free loans made to related parties without any fixed repayment terms or the effect of discounting would be immaterial. In such cases, the receivables are stated at cost less impairment of doubtful debts (see note 1(k)(i)).
| (p) | ||
| Cash |
Cash and cash equivalents comprise cash at bank and on hand, demand deposits with banks and other financial institutions, and short-term, highly liquid investments that are readily convertible into known amounts of cash and which are subject to an insignificant risk of changes in value, having been within three months of maturity at acquisition. Bank overdrafts that are repayable on demand and form an integral part of the Group’s cash management are also included as a component of cash and cash equivalents for the purpose of the consolidated cash flow statement.
| (q) | ||
| Financial guarantees issued, provisions and contingent liabilities | ||
| (i) | Financial guarantees issued | |
Financial guarantees are contracts that require the issuer (i.e. the guarantor) to make specified payments to reimburse the beneficiary of the guarantee (the “holder”) for a loss the holder incurs because a specified debtor fails to make payment when due in accordance with the terms of a debt instrument.
Where the Group issues a financial guarantee, the fair value of the guarantee (being the transaction price, unless the fair value can otherwise be reliably estimated) is initially recognized as deferred income within trade and other payables. Where consideration is received or receivable for the issuance of the guarantee, the consideration is recognized in accordance with the Group’s policies applicable to that category of asset. Where no such consideration is received or receivable, an immediate expense is recognized in profit or loss on initial recognition of any deferred income. The amount of the guarantee initially recognized as deferred income is amortized in profit or loss over the term of the guarantee as income from financial guarantees issued. In addition, provisions are recognized in accordance with note 1(q)(ii) if and when (i) it becomes probable that the holder of the guarantee will call upon the Group under the guarantee, and (ii) the amount of that claim on the Group is expected to exceed the amount currently carried in trade and other payables in respect of that guarantee i.e. the amount initially recognized, less accumulated amortization.
| (ii) | Other provisions and contingent liabilities | |
F-14Provisions are recognized for other liabilities of uncertain timing or amount when the Group has a legal or constructive obligation arising as a result of a past event, it is probable that an outflow of economic benefits will be required to settle the obligation and a reliable estimate can be made. Where the time value of money is material, provisions are stated at the present value of the expenditure expected to settle the obligation.
Where it is not probable that an outflow of economic benefits will be required, or the amount cannot be estimated reliably, the obligation is disclosed as a contingent liability, unless the probability of outflow of economic benefits is remote. Possible obligations, whose existence will only be confirmed by the occurrence or non-occurrence of one or more future events are also disclosed as contingent liabilities unless the probability of outflow of economic benefits is remote.
| Talent benefits | ||
| (i) | Leave entitlements | |
Entitlements to annual leave and long service leave are recognized when they accrue to individuals employed by the Group hereinafter (referred to as “Talents”), including directors of the Company. A provision is made for the estimated liability for annual leave and long-service leave as a result of services rendered by Talents up to the balance sheet date. Entitlements to sick leave and maternity or paternity leave are not recognized until the time of leave.
| (ii) | Profit sharing and bonus plans | |
Provisions for profit sharing and bonus plans are recognized when the Group has a present legal or constructive obligation as a result of services rendered by Talents and a reliable estimate of the obligation can be made.
| (iii) | Retirement benefit costs | |
The Group contributes to defined contribution retirement schemes which are available to certain Talents. Contributions to the schemes by the Group are calculated as a percentage of Talents’ basic salaries and charged to profit or loss. The Group’s contributions are reduced by contributions forfeited by those Talents who leave the scheme prior to vesting fully in the contributions.
The assets of the scheme are held in an independently administered fund that is separated from the Group’s assets.
| (iv) | Share-based payments |
The fair value of share options granted to Talents or Directors is recognized as Talent cost with a corresponding increase in capital reserve within equity. The fair value is measured at grant date using the Black-Scholes option pricing model or Monte Carlo model, taking into account the terms and conditions upon which the options were granted. Where the Talents have to meet vesting conditions before becoming unconditionally entitled to the share options, the total estimated fair value of the share options is spread over the vesting period, taking into account the probability that the options will vest.
During the vesting period, the number of share options that is expected to vest is reviewed. Any adjustment to the cumulative fair value recognized in prior years is charged/credited to profit or loss, with a corresponding adjustment to the capital reserve. On vesting date, the amount recognized as an expense is adjusted to reflect the actual number of share options that vest (with a corresponding adjustment to the capital reserve) except where forfeiture is only due to not achieving vesting conditions that relate to the market price of the Company’s shares. The amount related to share options expense is recorded in the capital reserve until either the option is exercised or the option expires.
| (s) | ||
Income tax for the year comprises current tax and movements in deferred tax assets and liabilities. Current tax and movements in deferred tax assets and liabilities are recognized in profit or loss except to the extent that they relate to business combinations, or items recognized in other comprehensive income or directly in equity, in which case the relevant amounts of tax are recognized in other comprehensive income or directly in equity, respectively.
Current tax is the expected tax payable on the taxable income for the year, using tax rates enacted or substantively enacted at the balance sheet date, and any adjustment to tax payable in respect of previous years.
Deferred tax assets and liabilities arise from deductible and taxable temporary differences respectively, being the differences between the carrying amounts of assets and liabilities for financial reporting purposes and their tax bases. Deferred tax assets also arise from unused tax losses and unused tax credits.
Apart from certain limited exceptions, all deferred tax liabilities, and all deferred tax assets to the extent that it is probable that future taxable profits will be available against which the asset can be utilized, are recognized. Future taxable profits that may support the recognition of deferred tax assets arising from deductible temporary differences include those that will arise from the reversal of existing taxable temporary differences, provided those differences relate to the same taxation authority and the same taxable entity, and are expected to reverse either in the same period as the expected reversal of the deductible temporary difference or in periods into which a tax loss arising from the deferred tax asset can be carried back or forward. The same criteria are adopted when determining whether existing taxable temporary differences support the recognition of deferred tax assets arising from unused tax losses and credits, that is, those differences are taken into account if they relate to the same taxation authority and the same taxable entity, and are expected to reverse in a period, or periods, in which the tax loss or credit can be utilized.
The limited exceptions to recognition of deferred tax assets and liabilities are those temporary differences arising from goodwill not deductible for tax purposes, the initial recognition of assets or liabilities that affect neither accounting nor taxable profit (provided they are not part of a business combination), and temporary differences relating to investments in subsidiaries to the extent that, in the case of taxable differences, the Group controls the timing of the reversal and it is probable that the differences will not reverse in the foreseeable future, or in the case of deductible differences, unless it is probable that they will reverse in the future.
Where investment properties are carried at their fair value in accordance with the accounting policy set out in note 1(g), the amount of deferred tax recognized is measured using the tax rates that would apply on sale of those assets at their carrying value at the balance sheet date unless the property is depreciable and is held within a business model whose objective is to consume substantially all of the economic benefits embodied in the property over time, rather than through sale. In all other cases, the amount of deferred tax recognized is measured based on the expected manner of realization or settlement of the carrying amount of the assets and liabilities, using tax rates enacted or substantively enacted at the balance sheet date. Deferred tax assets and liabilities are not discounted.
The carrying amount of a deferred tax asset is reviewed at each balance sheet date and is reduced to the extent that it is no longer probable that sufficient taxable profits will be available to allow the related tax benefit to be utilized. Any such reduction is reversed to the extent that it becomes probable that sufficient taxable profits will be available.
Current tax balances and deferred tax balances, and movements therein, are presented separately from each other and are not offset. Current tax assets are offset against current tax liabilities, and deferred tax assets against deferred tax liabilities, if the Group has the legally enforceable right to set off current tax assets against current tax liabilities and the following additional conditions are met:
in the case of current tax assets and liabilities, the Group intends either to settle on a net basis, or to realize the asset and settle the liability simultaneously; or
F-15
in the case of deferred tax assets and liabilities, if they relate to income taxes levied by the same taxation authority on either:
the same taxable entity; or
| Interest-bearing borrowings |
Interest-bearing borrowings are recognized initially at fair value less attributable transaction costs. Subsequent to initial recognition, the interest-bearing borrowings are stated at amortized cost with the difference between amortized cost and redemption value recognized in profit or loss over the period of borrowings using the effective interest method.
| (u) | ||
| Trade and other payables |
Trade and other payables are initially recognized at fair value. Except for financial guarantee liabilities measured in accordance with note 1(q), trade and other payables are subsequently stated at amortized cost unless the effect of discounting would be immaterial, in which case they are stated at cost.
| (v) | ||
| Revenue recognition | ||
| (i) | Revenue for the provision of international telecommunications and fixed telecommunications network services is recognized, when an arrangement exists, service is rendered, the fee is fixed or determinable, and collectibility is probable. | |
| (ii) | Tariff-free period granted to subscribers of fixed telecommunications network services are recognized in profit or loss | |
| (iii) | Amount received in advance for the provision of fixed telecommunications network services is deferred and included under deferred service revenue, and subsequently recognized as revenue on a straight-line basis over the related service period. | |
| (iv) | Revenue for licensing of programme rights is recognized over the contract period or upon delivery of the programmes concerned in accordance with the terms of the contracts. |
| (v) | Interest income is recognized as it accrues using the effective interest method. |
| (vi) | Rental income receivable under operating leases is recognized in profit or loss in equal installments over the periods covered by the lease |
| (vii) | Artiste management fee income is recognized when the services are rendered. |
| Borrowing costs | ||
F-16
All other borrowing costs are charged to profit or loss in the year in which they are incurred.
| Discontinued operations |
A discontinued operation is a component of the Group’s business, the operations and cash flows of which can be clearly distinguished from the rest of the Group and which represents a separate major line of business. Classification as a discontinued operation occurs upon disposal.
Where an operation is classified as discontinued, a single amount is presented on the face of the income statement, which comprises:
the post-tax profit or loss of the discontinued operation; and
the post-tax gain or loss recognized on the disposal of the assets or disposal group constituting the discontinued operation.
| (y) | ||
| Segment reporting |
Operating segments, and the amounts of each segment item reported in the financial statements, are identified from the financial information provided regularly to the Group’s most senior executive management for the purposes of allocating resources to, and assessing the performance of, the Group’s lines of business.
Geographical information is not presented as the majority of the Group’s revenue is attributed to customers in Hong Kong and the majority of the assets are located in Hong Kong.
| (z) | ||
| Related parties | ||
| (a) |
| (i) | |||
| (ii) | has significant influence over the | ||
| (iii) | |||
| (b) | An entity is related to the Group if any of the following conditions applies: |
| (i) | The entity and the Group are members of the same group (which means that each parent, subsidiary and fellow subsidiary is related to the others). |
| (ii) | One entity is an associate or joint venture of the other entity (or an associate or joint venture of a |
| (iii) | Both entities are joint ventures of the same third party. |
| (iv) | One entity is a joint venture of a third entity and the other entity is an | |
| (v) | |||
| (vi) |
F-17
| (vii) | A person identified in (a)(i) has significant influence over the entity or is a member of the key management personnel of the entity (or of a parent of the entity). |
Close members of the family of a person are those family members who may be expected to influence, or be influenced by, that person in their dealings with the entity.
| 2 | Discontinued operations |
On March 31, 2012, the Group entered into a Sales and Purchase Agreement with a third party (the “Purchaser”) to dispose of the Group’s International Telecommunications Services and Fixed Telecommunications Network Service businesses (the “Telecom Business”) (the “Disposal”). The consideration for the Disposal comprised of cash consideration of HK$4,873,649,000 on a cash-free, debt-free basis. As part and parcel of the Disposal, the Telecom Business grant an intangible asset, including indefeasible right of use (“IRU”) of the telecommunications capacity and right to use of telecommunications services to the Group upon the completion of Disposal. The Disposal was completed on May 30, 2012. The operating results of the disposed Telecom Business up to the disposal date have been presented as discontinued operations in this report.
The presentation of comparative information in respect of the year ended August 31, 2011 and 2010 has been restated to show the discontinued operations separately from continuing operations.
| (a) | The |
| 2010 | 2009 | 2008 | ||||||||||
| HK$’000 | HK$’000 | HK$’000 | ||||||||||
Turnover | ||||||||||||
| International telecommunications services | 218,589 | 247,359 | 291,943 | |||||||||
| Fixed telecommunications network services (note 2(b)) | 1,356,098 | 1,230,880 | 1,011,038 | |||||||||
| 1,574,687 | 1,478,239 | 1,302,981 | ||||||||||
| Telecom Business | ||||||||||||||
| 2012 | 2011 | 2010 | ||||||||||||
| Note | HK$’000 | HK$’000 | HK$’000 | |||||||||||
Turnover | 3 | 1,433,775 | 1,681,458 | 1,574,687 | ||||||||||
Network costs and cost of sales | 4 | (277,028 | ) | (212,315 | ) | (195,292 | ) | |||||||
Other operating expenses | 5(a) | (860,946 | ) | (1,073,683 | ) | (1,083,672 | ) | |||||||
Other income, net | 5(b) | 3,638 | 3,793 | 15,685 | ||||||||||
Finance costs, net | 5(c) | 574 | 944 | (946 | ) | |||||||||
|
|
|
|
|
| |||||||||
Profit before taxation | 300,013 | 400,197 | 310,462 | |||||||||||
Income tax expense | 6 | (48,407 | ) | (54,172 | ) | (37,068 | ) | |||||||
|
|
|
|
|
| |||||||||
Profit after taxation | 251,606 | 346,025 | 273,394 | |||||||||||
Gain on sale of discontinued operations | 2(c) | 3,520,088 | — | — | ||||||||||
|
|
|
|
|
| |||||||||
Profit for the year | 3,771,694 | 346,025 | 273,394 | |||||||||||
|
|
|
|
|
| |||||||||
| Telecom Business | ||||||||||||
| 2012 | 2011 | 2010 | ||||||||||
| HK$’000 | HK$’000 | HK$’000 | ||||||||||
Net cash from operating activities | 414,695 | 747,982 | 550,116 | |||||||||
Net cash from/(used in) investing activities | 4,336,661 | (363,124 | ) | (322,256 | ) | |||||||
Net cash used in financing activities | (211,887 | ) | (379,843 | ) | (180,645 | ) | ||||||
|
|
|
|
|
| |||||||
Net cash inflow from discontinued operations | 4,539,469 | 5,015 | 47,215 | |||||||||
|
|
|
|
|
| |||||||
| (c) | Effect of Disposal on the financial position of the Group: |
| Note | HK$’000 | |||||
Net assets disposed of: | ||||||
Goodwill | 12 | 1,066 | ||||
Fixed assets | 13 | 1,601,528 | ||||
Long term receivable and prepayment | 4,533 | |||||
Deferred expenditure | 16 | 36,978 | ||||
Accounts receivable | 75,481 | |||||
Other receivables, deposits and prepayments | 165,161 | |||||
Cash at bank and in hand | 42,357 | |||||
Bank overdrafts - unsecured | (7,529 | ) | ||||
Accounts payable | (19,221 | ) | ||||
Other payables and accrued charges | (147,364 | ) | ||||
Deposits received | (20,946 | ) | ||||
Tax payable | (1,721 | ) | ||||
Deferred tax liabilities | 22(a) | (157,102 | ) | |||
Deferred services revenue | (81,241 | ) | ||||
Obligations under finance leases | (49 | ) | ||||
|
| |||||
| 1,491,931 | ||||||
|
| |||||
Satisfied by: | ||||||
Cash consideration | (4,873,649 | ) | ||||
Grant of intangible assets including IRU of the telecommunications capacity and right to use of telecommunications services | (316,943 | ) | ||||
Exchange reserve realized upon disposal of Telecom Business | (4,881 | ) | ||||
Transaction costs | 183,454 | |||||
|
| |||||
Gain on sale of discontinued operations | (3,520,088 | ) | ||||
|
| |||||
No provision for Hong Kong Profits Tax has been made for the gain on sale of discontinued operations.
| (d) | Analysis of the net cash inflow in respect of the Disposal: |
Cash consideration | 4,873,649 | |||||
Transaction costs | (183,454 | ) | ||||
Cash and cash equivalents disposed of | (34,828 | ) | ||||
Net cash inflow | 4,655,367 | |||||
| 3 | Turnover and segment information |
Turnover
The Group is principally engaged in the provision of multimedia production and contents distribution business, including but not limited to the offer of free TV programming, multimedia and drama productions, contents distribution and other related services (“Multimedia Business”).
Prior to the Disposal, the Group was also engaged in the provision of international telecommunications services and fixed telecommunications network services to customers in Hong Kong and Canada which have been classified as discontinued operations.
The amount of each significant category of revenue recognized in turnover during the year is as follows:
| 2012 | 2011 | 2010 | ||||||||||
| HK$’000 | HK$’000 | HK$’000 | ||||||||||
Continuing operations: | ||||||||||||
- Licensing of programme rights and provision of artiste management services | 3,762 | — | — | |||||||||
|
|
|
|
|
| |||||||
Discontinued operations: | ||||||||||||
- International telecommunications services | 134,645 | 197,134 | 218,589 | |||||||||
- Fixed telecommunication network services | 1,299,130 | 1,484,324 | 1,356,098 | |||||||||
|
|
|
|
|
| |||||||
| 1,433,775 | 1,681,458 | 1,574,687 | ||||||||||
|
|
|
|
|
| |||||||
| 1,437,537 | 1,681,458 | 1,574,687 | ||||||||||
|
|
|
|
|
| |||||||
Segmental Information
For the years ended August 31, 2011 and 2010, the Group had two reportable business segments - international telecommunications services and fixed telecommunications network services. As a result of the Disposal, the Group now has one reportable business segment - multimedia services and others. The previously reported segment information for the years ended August 31, 2011 and 2010 have been restated to reflect the changes in the composition of the Group’s business segments.
| Continuing operations: | ||||||||
| - | Multimedia services and others | : | provision of multimedia production and distribution and other multimedia related activities | |||||
| Discontinued operations: | ||||||||
| - | International telecommunications | : | provision of international long distance calls services | |||||
| Fixed telecommunications network | : | provision of dial up and broadband Internet access services, | ||||||
The Group’s inter-segment transactions mainly consist of provision of leased lines services and licensing of programme right. These transactions were entered into on similar terms as those contracted with third parties.
| 2012 | ||||||||||||||||||||
| Continuing operations | Discontinued operations | |||||||||||||||||||
Multimedia HK$’000 | International telecommunications services HK$’000 | Fixed telecommunications network services HK$’000 | Elimination HK$’000 | Group HK$’000 | ||||||||||||||||
Turnover | ||||||||||||||||||||
- External sales | 3,762 | 134,645 | 1,299,130 | — | 1,437,537 | |||||||||||||||
- Inter-segment sales | 1,100 | 698 | 10,530 | (12,328 | ) | — | ||||||||||||||
|
|
|
|
|
|
|
|
|
| |||||||||||
| 4,862 | 135,343 | 1,309,660 | (12,328 | ) | 1,437,537 | |||||||||||||||
|
|
|
|
|
|
|
|
|
| |||||||||||
Segment results | (107,204 | ) | 32,555 | 263,246 | 188,597 | |||||||||||||||
|
|
|
|
|
| |||||||||||||||
Other net income, excluding interest income | 6,317 | |||||||||||||||||||
Valuation gains on investment properties | 18,200 | |||||||||||||||||||
Gain on sale of discontinued operations | 3,520,088 | |||||||||||||||||||
Interest income | 17,241 | |||||||||||||||||||
Finance costs, net | (1,881 | ) | ||||||||||||||||||
|
| |||||||||||||||||||
Profit before taxation | 3,748,562 | |||||||||||||||||||
Income tax expense | (50,688 | ) | ||||||||||||||||||
|
| |||||||||||||||||||
Net profit | 3,697,874 | |||||||||||||||||||
|
| |||||||||||||||||||
Multimedia HK$’000 International telecommunications services HK$’000 Fixed telecommunications network services HK$’000 Elimination HK$’000 Group HK$’000 Turnover - External sales - Inter-segment sales Segment results Other net income, excluding interest income Interest income Finance costs, net Profit before taxation Income tax expense Net profit Multimedia HK$’000 International telecommunications services HK$’000 Fixed telecommunications network services HK$’000 Elimination HK$’000 Group HK$’000 Turnover - External sales - Inter-segment sales Segment results Other net income, excluding interest income Interest income Finance costs, net Profit before taxation Income tax expense Net profit 2011 (restated) Continuing
operations Discontinued operations
services
and others — 197,134 1,484,324 — 1,681,458 — 3,814 14,837 (18,651 ) — — 200,948 1,499,161 (18,651 ) 1,681,458 (23,481 ) 89,313 306,147 371,979 3,883 3,366 (6,359 ) 372,869 (58,954 ) 313,915 2010 (restated) Continuing
operations Discontinued operations
services
and others — 218,589 1,356,098 — 1,574,687 — 5,673 16,673 (22,346 ) — — 224,262 1,372,771 (22,346 ) 1,574,687 (21,932 ) 76,105 219,618 273,791 (3,383 ) 11,372 (22,235 ) 259,545 (42,679 ) 216,866
Multimedia HK$’000 International telecommunications services HK$’000 Fixed telecommunications network services HK$’000 Group HK$’000 Segment assets Term deposits Investment properties Segment liabilities Tax payable Deferred tax liabilities Total liabilities Capital expenditure incurred during the year Depreciation for the year Multimedia HK$’000 International telecommunications services HK$’000 Fixed telecommunications network services HK$’000 Group HK$’000 Segment assets Segment liabilities Tax payable Deferred tax liabilities Total liabilities Capital expenditure incurred during the year Depreciation for the year 2012 Continuing
operations Discontinued operations
services and
others 2,755,116 — — 2,755,116 544,040 238,200 3,537,356 51,682 — — 51,682 935 1,346 53,963 178,750 3,665 279,978 462,393 4,636 7,021 174,248 185,905 2011 (restated) Continuing
operations Discontinued operations
services and
others 380,736 53,509 1,830,217 2,264,462 30,764 48,695 274,203 353,662 2,281 111,138 467,081 51,255 1,631 396,310 449,196 1,585 9,914 206,698 218,197
| 4 |
| 2010 | ||||||||||||||||
| International | Fixed | |||||||||||||||
| tele- | tele- | |||||||||||||||
| communications | communications | |||||||||||||||
| services | network services | Elimination | Group | |||||||||||||
| HK$’000 | HK$’000 | HK$’000 | HK$’000 | |||||||||||||
| Turnover | ||||||||||||||||
| - External sales | 218,589 | 1,356,098 | — | 1,574,687 | ||||||||||||
| - Inter-segment sales | 5,673 | 16,673 | (22,346 | ) | — | |||||||||||
| 224,262 | 1,372,771 | (22,346 | ) | 1,574,687 | ||||||||||||
| Segment results | 54,173 | 219,618 | 273,791 | |||||||||||||
| Other income, net | 7,989 | |||||||||||||||
| Finance costs | (22,235 | ) | ||||||||||||||
| Profit before taxation | 259,545 | |||||||||||||||
| Income tax expense | (42,679 | ) | ||||||||||||||
| Net profit | 216,866 | |||||||||||||||
F-18
| 2009 | ||||||||||||||||
| International | Fixed | |||||||||||||||
| tele- | tele- | |||||||||||||||
| communications | communications | |||||||||||||||
| services | network services | Elimination | Group | |||||||||||||
| HK$’000 | HK$’000 | HK$’000 | HK$’000 | |||||||||||||
| Turnover | ||||||||||||||||
| - External sales | 247,359 | 1,230,880 | — | 1,478,239 | ||||||||||||
| - Inter-segment sales | 5,669 | 19,784 | (25,453 | ) | — | |||||||||||
| 253,028 | 1,250,664 | (25,453 | ) | 1,478,239 | ||||||||||||
| Segment results | 61,631 | 203,515 | 265,146 | |||||||||||||
| Other income, net | 41,540 | |||||||||||||||
| Finance costs | (55,127 | ) | ||||||||||||||
| Profit before taxation | 251,559 | |||||||||||||||
| Income tax expense | (38,730 | ) | ||||||||||||||
| Net profit | 212,829 | |||||||||||||||
| 2008 | ||||||||||||||||
| International | Fixed | |||||||||||||||
| tele- | tele- | |||||||||||||||
| communications | communications | |||||||||||||||
| services | network services | Elimination | Group | |||||||||||||
| HK$’000 | HK$’000 | HK$’000 | HK$’000 | |||||||||||||
| Turnover | ||||||||||||||||
| - External sales | 291,943 | 1,011,038 | — | 1,302,981 | ||||||||||||
| - Inter-segment sales | 5,692 | 22,680 | (28,372 | ) | — | |||||||||||
| 297,635 | 1,033,718 | (28,372 | ) | 1,302,981 | ||||||||||||
| Segment results | 63,225 | 95,295 | 158,520 | |||||||||||||
| Other income, net | 24,989 | |||||||||||||||
| Finance costs | (75,137 | ) | ||||||||||||||
| Profit before taxation | 108,372 | |||||||||||||||
| Income tax benefit | 16,818 | |||||||||||||||
| Net profit | 125,190 | |||||||||||||||
F-19
| 2010 | ||||||||||||
| International | Fixed | |||||||||||
| tele- | tele- | |||||||||||
| communications | communications | |||||||||||
| services | network services | Group | ||||||||||
| HK$’000 | HK$’000 | HK$’000 | ||||||||||
| Segment assets | 590,888 | 1,660,661 | 2,551,549 | |||||||||
| Segment liabilities | 92,982 | 289,085 | 382,067 | |||||||||
| Unallocated liabilities | 180,943 | |||||||||||
| Total liabilities | 563,010 | |||||||||||
| Capital expenditure incurred during the year | 5,223 | 339,621 | 344,844 | |||||||||
| Depreciation for the year | 12,637 | 186,392 | 199,029 | |||||||||
| 2009 | ||||||||||||
| International | Fixed | |||||||||||
| tele- | tele- | |||||||||||
| communications | communications | |||||||||||
| services | network services | Group | ||||||||||
| HK$’000 | HK$’000 | HK$’000 | ||||||||||
| Segment assets | 298,412 | 1,491,996 | 1,790,408 | |||||||||
| Segment liabilities | 82,090 | 299,503 | 381,593 | |||||||||
| Unallocated liabilities | 180,288 | |||||||||||
| Total liabilities | 561,881 | |||||||||||
| Capital expenditure incurred during the year | 1,820 | 284,914 | 286,734 | |||||||||
| Depreciation for the year | 15,154 | 191,087 | 206,241 | |||||||||
F-20
F-21
| Network costs | ||
F-22
Cost of sales mainly include talent costs and other production costs which are directly attributable to the revenue generated from licensing of programme rights and provision of artiste management services.
Discontinued operations:
(Loss)/profit before taxation is arrived at after charging/(crediting) the following:
| (a) | Other operating expenses |
| 2010 | 2009 | 2008 | ||||||||||
| HK$’000 | HK$’000 | HK$’000 | ||||||||||
| Advertising and marketing expenses | 372,727 | 299,794 | 307,743 | |||||||||
| Amortization of deferred expenditure (note 14) | 48,621 | 53,160 | 33,777 | |||||||||
| Auditors’ remuneration | 2,910 | 3,455 | 3,687 | |||||||||
| Depreciation of owned fixed assets | 198,323 | 205,624 | 209,464 | |||||||||
| Depreciation of fixed assets held under finance lease | 706 | 617 | 587 | |||||||||
| Operating lease charges in respect of land and buildings | 22,669 | 17,010 | 13,296 | |||||||||
| Operating lease charges in respect of equipment | 39 | 42 | 50 | |||||||||
| Provision for doubtful debts (note 15(b)) | 14,742 | 12,103 | 14,293 | |||||||||
| (Gain)/loss on disposal of fixed assets | (1,375 | ) | 1,016 | 1,431 | ||||||||
| Talent costs (note 4(d)) | 301,760 | 302,279 | 247,460 | |||||||||
| Others | 144,482 | 142,864 | 134,306 | |||||||||
| 1,105,604 | 1,037,964 | 966,094 | ||||||||||
2012 HK$’000 | 2011 HK$’000 | 2010 HK$’000 | ||||||||||
| (restated) | (restated) | |||||||||||
Continuing operations | ||||||||||||
Advertising and marketing expenses | 214 | — | — | |||||||||
Auditors’ remuneration | 1,630 | 1,392 | 1,392 | |||||||||
|
|
|
|
|
| |||||||
Depreciation: | ||||||||||||
- Owned fixed assets | 6,144 | 1,452 | 1,404 | |||||||||
- Held under finance lease | 124 | 133 | 246 | |||||||||
Less: Depreciation capitalized as programme costs | (1,632 | ) | — | — | ||||||||
|
|
|
|
|
| |||||||
| 4,636 | 1,585 | 1,650 | ||||||||||
|
|
|
|
|
| |||||||
Operating lease charges in respect of land and buildings | 2,827 | — | — | |||||||||
Loss/(gain) on disposal of fixed assets | 675 | 382 | (18 | ) | ||||||||
Talent costs (note 5(d)) | 55,971 | 6,837 | 7,221 | |||||||||
Amortization of intangible assets (note 14) | 5,217 | — | — | |||||||||
Others | 33,790 | 13,285 | 11,687 | |||||||||
|
|
|
|
|
| |||||||
| 104,960 | 23,481 | 21,932 | ||||||||||
|
|
|
|
|
| |||||||
Discontinued operations | ||||||||||||
Advertising and marketing expenses | 271,532 | 344,136 | 372,727 | |||||||||
Auditors’ remuneration | 1,071 | 1,385 | 1,518 | |||||||||
|
|
|
|
|
| |||||||
Depreciation: | ||||||||||||
- Owned fixed assets | 181,252 | 216,338 | 196,919 | |||||||||
- Held under finance lease | 17 | 274 | 460 | |||||||||
|
|
|
|
|
| |||||||
| 181,269 | 216,612 | 197,379 | ||||||||||
|
|
|
|
|
| |||||||
Operating lease charges in respect of land and buildings | 26,910 | 28,426 | 22,669 | |||||||||
(Gain)/loss on disposal of fixed assets | (2,674 | ) | 626 | (1,357 | ) | |||||||
Talent costs (note 5(d)) | 233,814 | 304,518 | 294,539 | |||||||||
Amortization of deferred expenditure (note 16) | 29,902 | 37,873 | 48,621 | |||||||||
Others | 119,122 | 140,107 | 147,576 | |||||||||
|
|
|
|
|
| |||||||
| 860,946 | 1,073,683 | 1,083,672 | ||||||||||
|
|
|
|
|
| |||||||
| 965,906 | 1,097,164 | 1,105,604 | ||||||||||
|
|
|
|
|
| |||||||
| (b) | Other |
| 2010 | 2009 | 2008 | ||||||||||
| HK$’000 | HK$’000 | HK$’000 | ||||||||||
| Interest income | (11,372 | ) | (4,869 | ) | (15,596 | ) | ||||||
| Loss/(gain) on extinguishment of 10-year senior notes (note 22(a)) | 9,650 | (31,371 | ) | (2,582 | ) | |||||||
| Net exchange gain | (324 | ) | (3,038 | ) | (1,923 | ) | ||||||
| Others | (5,943 | ) | (2,262 | ) | (4,888 | ) | ||||||
| (7,989 | ) | (41,540 | ) | (24,989 | ) | |||||||
2012 HK$’000 | 2011 HK$’000 | 2010 HK$’000 | ||||||||||
| (restated) | (restated) | |||||||||||
Continuing operations | ||||||||||||
Bank interest income | (16,167 | ) | (2,039 | ) | (1,054 | ) | ||||||
Loss on extinguishment of 10-year senior notes | — | — | 9,650 | |||||||||
Rentals from investment properties | (3,388 | ) | — | — | ||||||||
Net exchange gain | (229 | ) | (1,234 | ) | (598 | ) | ||||||
Others | (136 | ) | (183 | ) | (302 | ) | ||||||
|
|
|
|
|
| |||||||
| (19,920 | ) | (3,456 | ) | 7,696 | ||||||||
|
|
|
|
|
| |||||||
Discontinued operations | ||||||||||||
Interest income | (1,074 | ) | (1,327 | ) | (10,318 | ) | ||||||
Net exchange (gain)/loss | (408 | ) | 239 | 274 | ||||||||
Others | (2,156 | ) | (2,705 | ) | (5,641 | ) | ||||||
|
|
|
|
|
| |||||||
| (3,638 | ) | (3,793 | ) | (15,685 | ) | |||||||
|
|
|
|
|
| |||||||
| (23,558 | ) | (7,249 | ) | (7,989 | ) | |||||||
|
|
|
|
|
| |||||||
| (c) | Finance costs, net |
| 2010 | 2009 | 2008 | ||||||||||
| HK$’000 | HK$’000 | HK$’000 | ||||||||||
| Interest element of finance leases | 42 | 27 | 34 | |||||||||
| Interest on 10-year senior notes | 5,881 | 52,670 | 70,010 | |||||||||
| Amortization of incidental issuance costs | 188 | 1,545 | 1,665 | |||||||||
| Interest on bank borrowings | 1,379 | — | — | |||||||||
| Amortization of upfront costs on bank borrowings | 192 | — | — | |||||||||
| Change in fair value of derivative financial instrument | 11,293 | — | — | |||||||||
| Other borrowing costs | 3,260 | 885 | 3,428 | |||||||||
| 22,235 | 55,127 | 75,137 | ||||||||||
F-23
2012 HK$’000 | 2011 HK$’000 | 2010 HK$’000 | ||||||||||
| (restated) | (restated) | |||||||||||
Continuing operations | ||||||||||||
Interest element of finance leases | 15 | 22 | 34 | |||||||||
Interest on 10-year senior notes | — | — | 5,881 | |||||||||
Amortization of incidental issuance costs | — | — | 188 | |||||||||
Interest on bank borrowings | — | 1,152 | 1,379 | |||||||||
Amortization of upfront costs on long-term bank loan | — | 182 | 192 | |||||||||
Change in fair value of derivative financial instrument | (1,901 | ) | 271 | 11,293 | ||||||||
Write-off of upfront costs upon settlement of long-term bank loan | — | 1,251 | — | |||||||||
Other borrowing costs | 4,341 | 4,425 | 2,322 | |||||||||
|
|
|
|
|
| |||||||
| 2,455 | 7,303 | 21,289 | ||||||||||
|
|
|
|
|
| |||||||
Discontinued operations | ||||||||||||
Interest element of finance leases | 4 | 8 | 8 | |||||||||
Others | (578 | ) | (952 | ) | 938 | |||||||
|
|
|
|
|
| |||||||
| (574 | ) | (944 | ) | 946 | ||||||||
|
|
|
|
|
| |||||||
| 1,881 | 6,359 | 22,235 | ||||||||||
|
|
|
|
|
| |||||||
| (d) | Talent costs |
| 2010 | 2009 | 2008 | ||||||||||
| HK$’000 | HK$’000 | HK$’000 | ||||||||||
| Wages and salaries | 277,883 | 278,905 | 226,097 | |||||||||
| Provision for annual leave | 561 | 613 | 2,642 | |||||||||
| Equity settled share-based transaction | 5,347 | 4,768 | 4,114 | |||||||||
| Retirement benefit costs — defined contribution plans (note 8) | 38,820 | 34,614 | 29,738 | |||||||||
| Less: Talent costs capitalized as fixed assets | (20,851 | ) | (16,621 | ) | (15,131 | ) | ||||||
| 301,760 | 302,279 | 247,460 | ||||||||||
2012 HK$’000 | 2011 HK$’000 | 2010 HK$’000 | ||||||||||||
| (restated) | (restated) | |||||||||||||
Continuing operations | ||||||||||||||
Wages and salaries | 101,483 | 6,404 | 6,772 | |||||||||||
Provision for annual leave | 2,928 | 48 | 69 | |||||||||||
Retirement benefit costs - defined contribution plans (note 9) | 3,993 | 385 | 380 | |||||||||||
|
|
|
|
|
| |||||||||
| 108,404 | 6,837 | 7,221 | ||||||||||||
Less: | Talent costs capitalized as programme costs | (47,140 | ) | — | — | |||||||||
Talent costs included in cost of sales | (5,293 | ) | — | — | ||||||||||
|
|
|
|
|
| |||||||||
Talent costs included in other operating expenses | 55,971 | 6,837 | 7,221 | |||||||||||
|
|
|
|
|
| |||||||||
Discontinued operations |
| |||||||||||||
Wages and salaries | 396,008 | 511,205 | 511,608 | |||||||||||
Provision for annual leave | — | 564 | 492 | |||||||||||
Equity settled share-based transaction | 10,480 | 4,652 | 5,347 | |||||||||||
Retirement benefit costs - defined contribution plans (note 9) | 38,074 | 43,487 | 38,440 | |||||||||||
|
|
|
|
|
| |||||||||
| 444,562 | 559,908 | 555,887 | ||||||||||||
Less: | Talent costs capitalized as fixed assets | (17,671 | ) | (22,206 | ) | (20,851 | ) | |||||||
Talent costs included in network costs and cost of sales | (6,247 | ) | (10,843 | ) | (11,098 | ) | ||||||||
Talent costs included in advertising and marketing expenses | (186,830 | ) | (222,341 | ) | (229,399 | ) | ||||||||
|
|
|
|
|
| |||||||||
Talent costs included in other operating expenses | 233,814 | 304,518 | 294,539 | |||||||||||
|
|
|
|
|
| |||||||||
| 289,785 | 311,355 | 301,760 | ||||||||||||
|
|
|
|
|
| |||||||||
Talent costs include all compensation and benefits paid to and accrued for all individuals employed by the Group, including directors.
| 6 |
| 2010 | 2009 | 2008 | ||||||||||
| HK$’000 | HK$’000 | HK$’000 | ||||||||||
| Realized loss on derivative financial instruments | — | — | 1,039 | |||||||||
| Realized gain on long-term bank deposit | — | — | (1,185 | ) | ||||||||
| Realized and unrealized gain on other financial assets | — | (189 | ) | (3,284 | ) | |||||||
Hong Kong profitsProfits Tax rate is 16.5%. The statutory income tax has been providedrate in the People’s Republic of China (“PRC”) is 25%. CTI Guangzhou Customer Services Co., Ltd., a former wholly owned subsidiary of the Company, being a recognized Advanced Technology Service Enterprise, is subject to income tax at thea reduced rate of 16.5% (2009 and 2008: 16.5%) on15% from calendar years 2010 to 2012. Non-Hong Kong current taxation is mainly related to the estimated assessable profit for the year. Taxation on other jurisdictions has been calculated on the estimated assessable profit for the year at thePRC income tax rates prevailing in the other jurisdictions in which the Group operates.
The amount of income tax (expense)/benefitexpense in the consolidated income statement represents:
| 2010 | 2009 | 2008 | ||||||||||
| HK$’000 | HK$’000 | HK$’000 | ||||||||||
| Current taxation: | ||||||||||||
| Hong Kong | ||||||||||||
| - Provision for the year | — | — | (391 | ) | ||||||||
| - Over-provision in prior years | 40 | — | — | |||||||||
| Non-Hong Kong | ||||||||||||
| - Provision for the year | (2,585 | ) | (1,622 | ) | (1,929 | ) | ||||||
| - Under-provision in prior years | — | — | (2,552 | ) | ||||||||
| Deferred taxation: | ||||||||||||
| - Origination and reversal of temporary differences (note 20) | (40,134 | ) | (37,108 | ) | (4,645 | ) | ||||||
| - Recognition of previously unrecognized tax losses (note 20) | — | — | 26,335 | |||||||||
| Income tax (expense)/benefit | (42,679 | ) | (38,730 | ) | 16,818 | |||||||
F-24
2012 HK$’000 | 2011 HK$’000 | 2010 HK$’000 | ||||||||||
| (restated) | (restated) | |||||||||||
Continuing operations | ||||||||||||
Current taxation | ||||||||||||
Hong Kong | ||||||||||||
- Provision for the year | (935 | ) | — | — | ||||||||
Deferred taxation | ||||||||||||
Origination and reversal of temporary differences | (1,346 | ) | (4,782 | ) | (5,611 | ) | ||||||
|
|
|
|
|
| |||||||
| (2,281 | ) | (4,782 | ) | (5,611 | ) | |||||||
|
|
|
|
|
| |||||||
Discontinued operations | ||||||||||||
Current taxation | ||||||||||||
Hong Kong | ||||||||||||
- Over-provision in prior years | — | — | 40 | |||||||||
Non-Hong Kong | ||||||||||||
- Provision for the year | (2,443 | ) | (3,524 | ) | (2,585 | ) | ||||||
- Under-provision in respect of prior years | — | (135 | ) | — | ||||||||
Deferred taxation | ||||||||||||
Origination and reversal of temporary differences | (45,964 | ) | (50,513 | ) | (34,523 | ) | ||||||
|
|
|
|
|
| |||||||
| (48,407 | ) | (54,172 | ) | (37,068 | ) | |||||||
|
|
|
|
|
| |||||||
| (50,688 | ) | (58,954 | ) | (42,679 | ) | |||||||
|
|
|
|
|
| |||||||
| 2010 | 2009 | 2008 | ||||||||||
| HK$’000 | HK$’000 | HK$’000 | ||||||||||
| Profit before taxation | 259,545 | 251,559 | 108,372 | |||||||||
| Notional tax on profit before taxation, calculated at the prevailing tax rates applicable to profit in the jurisdictions concerned | (43,781 | ) | (42,240 | ) | (18,927 | ) | ||||||
| Effect of non-taxable income | 4,692 | 1,466 | 3,452 | |||||||||
| Effect of (loss)/gain on extinguishment of 10-year senior notes not subject to taxation | (1,592 | ) | 5,176 | 426 | ||||||||
| Effect of non-deductible expenses | (2,367 | ) | (3,648 | ) | (6,353 | ) | ||||||
| Effect of recognition of prior year unrecognized tax losses (note) | — | — | 26,335 | |||||||||
| Over/(under)-provision in prior years | 40 | — | (2,552 | ) | ||||||||
| Effect of utilization of prior year unrecognized tax losses | — | — | 12,013 | |||||||||
| Effect of share based payment | — | — | 2,324 | |||||||||
| Effect of tax losses not recognized | — | — | (74 | ) | ||||||||
| Others | 329 | 516 | 174 | |||||||||
| Income tax (expense)/benefit | (42,679 | ) | (38,730 | ) | 16,818 | |||||||
2012 HK$’000 | 2011 HK$’000 | 2010 HK$’000 | ||||||||||
| (restated) | (restated) | |||||||||||
Profit before taxation | 3,748,562 | 372,869 | 259,545 | |||||||||
|
|
|
|
|
| |||||||
Notional tax on profit before taxation, calculated at the prevailing tax rates applicable to profit in the jurisdiction concerned | (619,401 | ) | (63,606 | ) | (43,781 | ) | ||||||
Effect of non-taxable income | 4,662 | 535 | 4,692 | |||||||||
Effect of (loss)/gain on extinguishment of 10-year senior notes not subject to taxation | — | — | (1,592 | ) | ||||||||
Effect of non-deductible expenses | (3,627 | ) | (4,975 | ) | (2,367 | ) | ||||||
(Under)/over-provision in prior years | — | (135 | ) | 40 | ||||||||
Utilization of tax loss related to prior years | — | 6,872 | — | |||||||||
Effect of unused tax losses not recognized | (9,693 | ) | — | — | ||||||||
Effect of disposal of Telecom Business | 577,383 | — | — | |||||||||
PRC income tax concession | — | 2,406 | — | |||||||||
Others | (12 | ) | (51 | ) | 329 | |||||||
|
|
|
|
|
| |||||||
Income tax expense | (50,688 | ) | (58,954 | ) | (42,679 | ) | ||||||
|
|
|
|
|
| |||||||
Representing by | ||||||||||||
- Continuing operations | (2,281 | ) | (4,782 | ) | (5,611 | ) | ||||||
- Discontinued operations | (48,407 | ) | (54,172 | ) | (37,068 | ) | ||||||
|
|
|
|
|
| |||||||
| (50,688 | ) | (58,954 | ) | (42,679 | ) | |||||||
|
|
|
|
|
| |||||||
| 7 | ||
F-25
| (a) | Dividends payable to equity shareholders of the Company attributable to the year |
| 2010 | 2009 | 2008 | ||||||||||
| HK$’000 | HK$’000 | HK$’000 | ||||||||||
| Interim dividend declared and paid of HK6.5 cents per ordinary share (2009: HK3 cents per ordinary share, 2008: HK4 cents per ordinary share) | 49,725 | 19,904 | 25,602 | |||||||||
| Final dividend proposed after the balance sheet date, of HK13.5 cents per ordinary share (2009: HK16 cents per ordinary share, 2008: HK2 cents per ordinary share) | 103,275 | 106,269 | 13,012 | |||||||||
| 153,000 | 126,173 | 38,614 | ||||||||||
2012 HK$’000 | 2011 HK$’000 | 2010 HK$’000 | ||||||||||
Special dividend declared and paid of HK$2.5 per ordinary share (2011/2010: HK$Nil) | 2,022,542 | — | — | |||||||||
Interim dividend declared and paid of HK15 cents per ordinary share (2011: HK15 cents per ordinary share, 2010: HK6.5 cents per ordinary share) | 119,674 | 115,605 | 49,725 | |||||||||
Final dividend proposed after the balance sheet date, of HK15 cents per ordinary share (2011: HK15 cents per ordinary share, 2010: HK13.5 cents per ordinary share) | 121,352 | 115,787 | 103,275 | |||||||||
|
|
|
|
|
| |||||||
| 2,263,568 | 231,392 | 153,000 | ||||||||||
|
|
|
|
|
| |||||||
The final dividend proposed after the balance sheet date has not been recognized as a liability at the balance sheet date.
| (b) | Dividends attributable to the previous financial year, approved and paid during the year: |
| 2010 | 2009 | 2008 | ||||||||||
| HK$’000 | HK$’000 | HK$’000 | ||||||||||
| Final dividend in respect of the financial year ended August 31, 2009, approved and paid of HK16 cents per ordinary share (2009: HK2 cents per ordinary share in respect of financial year ended August 31, 2008, 2008: | ||||||||||||
| HK4 cents per ordinary share in respect of financial year ended August 31, 2007) | 108,735 | 13,014 | 25,082 | |||||||||
2012 HK$’000 | 2011 HK$’000 | 2010 HK$’000 | ||||||||||
Final dividend in respect of the financial year ended August 31, 2011, approved and paid of HK15 cents per ordinary share (2011: HK13.5 cents per ordinary share in respect of financial year ended August 31, 2010, 2010: HK16 cents per ordinary share in respect of financial year ended August 31, 2009) | 115,901 | 103,735 | 108,735 | |||||||||
|
|
|
|
|
| |||||||
In respect of the Company, excluding shareholders with registered addresses outside Hong Kong, who were entitled to the final dividend in respect offor the financial year ended August 31, 2008. 12,212,142 shares were issued2011, there is a difference of HK$114,000 (2010:HK$460,000) between the final dividend disclosed in the last annual financial statements and the amounts approved and paid during the year ended August 31, 2009which represents dividends attributable to new shares issued upon the shareholdersexercise of share options before the closing date of the Company who had elected to receive all or partregister of their entitlement to dividends in the formmembers.
| 8 | Earnings per share |
2012 HK$’000 | 2011 HK$’000 | 2010 HK$’000 | ||||||||||
Profit attributable to equity shareholders | 3,700,288 | 313,915 | 216,866 | |||||||||
|
|
|
|
|
| |||||||
Weighted average number of scrip.
F-26
2012 Number of shares ’000 | 2011 Number of shares ’000 | 2010 Number of shares ’000 | ||||||||||
Issued ordinary shares at the beginning of the year | 771,912 | 764,997 | 664,180 | |||||||||
Effect of share options exercised | 12,164 | 3,810 | 14,856 | |||||||||
Effect of placement | — | — | 27,569 | |||||||||
|
|
|
|
|
| |||||||
Weighted average number of ordinary shares at the end of the year (basic) | 784,076 | 768,807 | 706,605 | |||||||||
Incremental shares from assumed exercise of share options | 11,511 | 23,992 | 30,011 | |||||||||
Weighted average number of ordinary shares at the end of the year (diluted) | 795,587 | 792,799 | 736,616 | |||||||||
|
|
|
|
|
| |||||||
Basic earnings per share | HK | 471.9 cents | HK | 40.8 cents | HK | 30.7 cents | ||||||
|
|
|
|
|
| |||||||
Diluted earnings per share | HK | 465.1 cents | HK | 39.6 cents | HK | 29.4 cents | ||||||
|
|
|
|
|
| |||||||
| 9 | Retirement benefit costs |
| 2010 | 2009 | 2008 | ||||||||||
| HK$’000 | HK$’000 | HK$’000 | ||||||||||
| Profit attributable to shareholders | 216,866 | 212,829 | 125,190 | |||||||||
| Weighted average number of ordinary shares | ||||||||||||
| 2010 | 2009 | 2008 | ||||||||||
| Number | Number | Number | ||||||||||
| of shares | of shares | of shares | ||||||||||
| ’000 | ’000 | ’000 | ||||||||||
| Issued ordinary shares at the beginning of the year | 664,180 | 650,622 | 616,503 | |||||||||
| Effect of scrip dividend issued | — | 6,256 | 7,353 | |||||||||
| Effect of share options exercised | 14,856 | 329 | 10,159 | |||||||||
| Effect of placement | 27,569 | — | — | |||||||||
| Effect of shares repurchased and cancelled | — | (6 | ) | — | ||||||||
| Weighted average number of ordinary shares at the end of the year (basic) | 706,605 | 657,201 | 634,015 | |||||||||
| Incremental shares from assumed exercise of share options | 30,011 | 11,183 | 23,982 | |||||||||
| Weighted average number of ordinary shares at the end of the year (diluted) | 736,616 | 668,384 | 657,997 | |||||||||
| Basic earnings per share | HK30.7 | cents | HK32.4 | cents | HK19.7 | cents | ||||||
| Diluted earnings per share | HK29.4 | cents | HK31.8 | cents | HK19.0 | cents | ||||||
F-27
A mandatory provident fund scheme (the “MPF Scheme”) has been established under the Hong Kong Mandatory Provident Fund Scheme Ordinance in December 2000. The then existing Talents of the Group in Hong Kong could elect to join the MPF Scheme, while all new Talents joining the Group in Hong Kong from then onwards are required to join the MPF Scheme. Both the Group and the Talents are required to contribute 5% of each individual’s relevant income with a maximum amount of HK$1,000 per month before June 1, 2012, and commenced from June 1, 2012, the maximum amount has been increased to HK$1,250, as a mandatory contribution. Employer’s mandatory contributions are 100% vested in the Talents as soon as they are paid to the MPF Scheme. Senior Talents may also elect to join a Mutual Voluntary Plan (the “Mutual Plan”) in which both the Group and the Talent, on top of the MPF Scheme mandatory contributions, make a voluntary contribution to the extent of contributions that would have been made under the ORSO Scheme.
Pursuant to the relevant regulations in People’s Republic of China (the “PRC”),the PRC, the Group contributes to a defined contribution retirement scheme organized by the local social security bureau for each Talent of the subsidiary in the PRC at the rate of 20% of a standard salary base as determined by the local social security bureau. The Group has no other obligation to make payments in respect of retirement benefits of these Talents.
The retirement schemes for Talents of the Group in other countries follow the local statutory requirements of the respective countries.
The aggregate employer’s contributions, net of forfeited contributions, which have been dealt with in the consolidated income statement during the year are as follows:
| 2010 | 2009 | 2008 | ||||||||||
| HK$’000 | HK$’000 | HK$’000 | ||||||||||
| Gross contributions | 38,820 | 34,614 | 29,738 | |||||||||
2012 HK$’000 | 2011 HK$’000 | 2010 HK$’000 | ||||||||||
Gross contributions | ||||||||||||
- Continuing operations | 3,993 | 385 | 380 | |||||||||
- Discontinued operations | 38,074 | 43,487 | 38,440 | |||||||||
|
|
|
|
|
| |||||||
| 42,067 | 43,872 | 38,820 | ||||||||||
|
|
|
|
|
| |||||||
At August 31, 2010,2012, there was no forfeited contribution available to offset future contributions by the Group to the ORSO Scheme (2009(2011 and 2008: 2010: HK$Nil).
| 10 | Directors’ and senior management’s emoluments |
| (a) | Directors’ remuneration |
The remuneration of each director for the year ended August 31, 20102012 is set out below:
| Employer's | ||||||||||||||||||||||||
| contribution | ||||||||||||||||||||||||
| to defined | ||||||||||||||||||||||||
| Discretionary | Share-based | contribution | ||||||||||||||||||||||
| Fee | Salary | bonuses | payment | scheme | Total | |||||||||||||||||||
| Name of director | HK$’000 | HK$’000 | HK$’000 | HK$’000 | HK$’000 | HK$’000 | ||||||||||||||||||
| Wong Wai Kay, Ricky | — | 6,707 | 1,800 | — | 670 | 9,177 | ||||||||||||||||||
| Cheung Chi Kin, Paul | — | 6,709 | 1,800 | — | 670 | 9,179 | ||||||||||||||||||
| Yeung Chu Kwong, William | — | 8,264 | 2,400 | 2,526 | 456 | 13,646 | ||||||||||||||||||
| Lai Ni Quiaque | — | 2,642 | 750 | 2,455 | 264 | 6,111 | ||||||||||||||||||
| Cheng Mo Chi, Moses | 168 | — | — | — | — | 168 | ||||||||||||||||||
| Lee Hon Ying, John | 185 | — | — | — | — | 185 | ||||||||||||||||||
| Chan Kin Man | 174 | — | — | — | — | 174 | ||||||||||||||||||
| Peh Jefferson Tun Lu | 174 | — | — | — | — | 174 | ||||||||||||||||||
| Total | 701 | 24,322 | 6,750 | 4,981 | 2,060 | 38,814 | ||||||||||||||||||
F-28
| Name of director | Fee HK$’000 | Salary HK$’000 | Discretionary bonuses HK$’000 | Share- payment HK$’000 | Employer’s contribution to defined contribution scheme HK$’000 | Total HK$’000 | ||||||||||||||||||
Wong Wai Kay, Ricky | — | 6,707 | 1,050 | — | 670 | 8,427 | ||||||||||||||||||
Cheung Chi Kin, Paul | — | 6,707 | 1,050 | — | 670 | 8,427 | ||||||||||||||||||
Yeung Chu Kwong, William (note (a)) | — | 7,477 | 66,163 | 8,901 | 342 | 82,883 | ||||||||||||||||||
Lai Ni Quiaque (note (a)) | — | 2,070 | 59,915 | 120 | 207 | 62,312 | ||||||||||||||||||
To Wai Bing (note (b)) | — | 6,199 | 4,200 | — | 192 | 10,591 | ||||||||||||||||||
Wong Nga Lai, Alice (note b)) | — | 1,659 | 1,839 | — | 166 | 3,664 | ||||||||||||||||||
Cheng Mo Chi, Moses | 183 | — | — | — | — | 183 | ||||||||||||||||||
Lee Hon Ying, John | 202 | — | — | — | — | 202 | ||||||||||||||||||
Chan Kin Man | 190 | — | — | — | — | 190 | ||||||||||||||||||
Peh Jefferson Tun Lu | 190 | — | — | — | — | 190 | ||||||||||||||||||
|
|
|
|
|
|
|
|
|
|
|
| |||||||||||||
Total | 765 | 30,819 | 134,217 | 9,021 | 2,247 | 177,069 | ||||||||||||||||||
|
|
|
|
|
|
|
|
|
|
|
| |||||||||||||
Notes:
| (a) |
| (b) | Ms. To Wai Bing and Ms. Wong Nga Lai, Alice were appointed as Executive Directors with effect from May 30, 2012. |
The remuneration of each director for the year ended August 31, 20092011 is set out below:
| Employer’s | ||||||||||||||||||||||||
| contribution | ||||||||||||||||||||||||
| to defined | ||||||||||||||||||||||||
| Discretionary | Share-based | contribution | ||||||||||||||||||||||
| Fee | Salary | bonuses | payment | scheme | Total | |||||||||||||||||||
| Name of director | HK$’000 | HK$’000 | HK$’000 | HK$’000 | HK$’000 | HK$’000 | ||||||||||||||||||
| Wong Wai Kay, Ricky | — | 6,712 | 1,500 | 193 | 670 | 9,075 | ||||||||||||||||||
| Cheung Chi Kin, Paul | — | 6,714 | 1,500 | 193 | 670 | 9,077 | ||||||||||||||||||
| Yeung Chu Kwong, William | — | 7,049 | 1,000 | 1,764 | 456 | 10,269 | ||||||||||||||||||
| Lai Ni Quiaque | — | 2,403 | 550 | 1,141 | 240 | 4,334 | ||||||||||||||||||
| Cheng Mo Chi, Moses | 160 | — | — | — | — | 160 | ||||||||||||||||||
| Lee Hon Ying, John | 176 | — | — | — | — | 176 | ||||||||||||||||||
| Chan Kin Man | 165 | — | — | — | — | 165 | ||||||||||||||||||
| Peh Jefferson Tun Lu | 165 | — | — | — | — | 165 | ||||||||||||||||||
| Total | 666 | 22,878 | 4,550 | 3,291 | 2,036 | 33,421 | ||||||||||||||||||
| Name of director | Fee HK$’000 | Salary HK$’000 | Discretionary bonuses HK$’000 | Share- payment HK$’000 | Employer’s contribution to defined contribution scheme HK$’000 | Total HK$’000 | ||||||||||||||||||
Wong Wai Kay, Ricky | — | 6,704 | 1,000 | — | 670 | 8,374 | ||||||||||||||||||
Cheung Chi Kin, Paul | — | 6,706 | 1,000 | — | 670 | 8,376 | ||||||||||||||||||
Yeung Chu Kwong, William | — | 9,733 | 1,310 | 3,006 | 456 | 14,505 | ||||||||||||||||||
Lai Ni Quiaque | — | 2,762 | 635 | 1,906 | 276 | 5,579 | ||||||||||||||||||
Cheng Mo Chi, Moses | 176 | — | — | — | — | 176 | ||||||||||||||||||
Lee Hon Ying, John | 195 | — | — | — | — | 195 | ||||||||||||||||||
Chan Kin Man | 182 | — | — | — | — | 182 | ||||||||||||||||||
Peh Jefferson Tun Lu | 182 | — | — | — | — | 182 | ||||||||||||||||||
|
|
|
|
|
|
|
|
|
|
|
| |||||||||||||
Total | 735 | 25,905 | 3,945 | 4,912 | 2,072 | 37,569 | ||||||||||||||||||
|
|
|
|
|
|
|
|
|
|
|
| |||||||||||||
No directorDirector waived any emoluments in respect of the years ended August 31, 20092011 and 2010.
The share-based payment represents the expenses determined based on the fair value of share options granted to certain directors under the Company’s share option scheme. Fair value of share options is estimated in accordance with the Group’s significant accounting policies in note 1. The details of the share-based payment are disclosed in note 10.
| (b) | Five highest paid individuals |
The five individuals whose emoluments were the highest in the Group for the year include four (2009:five (2011: four) directors whose emoluments are reflected in the analysis presented above. TheIn 2011, the emoluments payable to the remaining one (2009: one) individual during the year are as follows:
| 2010 | 2009 | |||||||
| HK$’000 | HK$’000 | |||||||
| Basic salaries, other allowances and benefits in kind | 2,492 | 2,515 | ||||||
| Discretionary bonuses | 300 | 150 | ||||||
| Share-based payments | — | 332 | ||||||
| Retirement benefit costs — defined contribution plans | 181 | 106 | ||||||
| 2,973 | 3,103 | |||||||
2011 HK$’000 | ||||
Basic salaries, other allowances and benefits in kind | 2,523 | |||
Discretionary bonuses | 300 | |||
Retirement benefit costs - defined contribution plans | 181 | |||
| 3,004 | ||||
The emoluments fell within the following band:
2011 Number of individual | ||||||||
HK$3,000,001 | 1 | |||||||
F-29
| 11 | Equity settled share-based transactions |
Under the 2002 Share Option Scheme, the Company may grant options to Talents (including executive, non-executive and independent non-executive directors), suppliers and professional advisers to subscribe for shares of the Company. The maximum number of options authorized under the 2002 Share Option Scheme may not, when aggregated with any shares subject to any other executive and Talent share option scheme, exceed 10% of the Company’s issued share capital on the date of adoption. The exercise price of the option is determined by the Company’s board of directors at a price not less than the highest of (a) the par value of a share; (b) the average closing price of the Company’s shares for five trading days preceding the grant date; and (c) the closing price of the Company’s shares on the date of grant. The 2002 Share Option Scheme is valid and effective for a ten year period up to December 22, 2012 subject to earlier termination by the Company by resolution in general meeting or by the board of directors. The period during which the option may be exercised will be determined by the board of directors at its discretion, save that no option may be exercised after more than ten years from the date of grant.
| (a) | The terms and conditions of the options |
Options that existed during the year ended August 31, 20102012 are as follows, whereby all options are settled by physical delivery of shares:
Number of option | Vesting conditions | Exercisable period | ||||||||
2002 Share Option Scheme | ||||||||||
Options granted to directors: | ||||||||||
-October 21, 2004 | 202,289 | Condition 1 | On or prior to October 20, 2014 | |||||||
-January 5, 2005 | 14,183,208 | Condition 1 | On or prior to October 20, 2014 | |||||||
-May 22, 2006 | 102,456 | Condition 1 | On or prior to May 21, 2016 | |||||||
-February 6, 2008 | 5,542,791 | Condition 3 /6 /7 | On or prior to February 5, 2018 | |||||||
-February 11, 2008 | 6,044,791 | Condition 2 /6 /7 | On or prior to February 10, 2018 | |||||||
-February 15, 2008 | 302,239 | Condition 5 | On or prior to December 23, 2012 | |||||||
-February 5, 2010 | 6,000,000 | Condition 4 /7 | On or prior to February 4, 2020 | |||||||
Options granted to Talents excluding Directors: | ||||||||||
-October 21, 2004 | 3,605,682 | Condition 1 | On or prior to October 20, 2014 | |||||||
-May 22, 2006 | 1,122,227 | Condition 1 | On or prior to May 21, 2016 | |||||||
Total share options | 37,105,683 | |||||||||
Options that existed during the year ended August 31, 2011 are as follows, whereby all options are settled by physical delivery of shares:
Number of option | Vesting conditions | Exercisable period | |||||||||||||
2002 Share Option Scheme | |||||||||||||||
Options granted to directors: | |||||||||||||||
-January 5, 2005 | 16,183,208 | Condition 1 | On or prior to October 20, 2014 | ||||||||||||
-May 22, 2006 | Condition 1 | On or prior to May 21, 2016 | |||||||||||||
-February 6, 2008 | Condition 3 /6 | On or prior to February 5, 2018 | |||||||||||||
-February 11, 2008 | 6,044,791 | Condition 2 /6 | On or prior to February 10, 2018 | ||||||||||||
-February 5, 2010 | 6,000,000 | Condition 4 | On or prior to February 4, 2020 | ||||||||||||
Options granted to Talents excluding Directors: | |||||||||||||||
-October 21, 2004 | |||||||||||||||
| Condition 1 | On or prior to October 20, 2014 | ||||||||||||||
-May 22, 2006 | Condition 1 | On or prior to May 21, 2016 | |||||||||||||
-February 15, 2008 | |||||||||||||||
| Condition 5 | On or prior to December 23, 2012 | ||||||||||||||
-May 2, 2008 | Condition 5 /6 | On or prior to May 1, 2018 | |||||||||||||
Total share options | |||||||||||||||
| 44,649,857 | |||||||||||||||
F-30
Condition 1
Options granted are vested in one year or evenly vested over a period of two to three years. Options are awarded without performance conditions and are exercisable provided the participants have remained employed by the end of respective vesting periods.
Vesting of the options is conditional upon the performance of the Company’s shares over the period from the close of trading in Hong Kong on November 22, 2007 to November 21, 2010.
Upon fulfillment of the market conditions, certain options granted vest immediately, while other options affected by the same market conditions vest evenly over a period of three years.
During the year ended August 31, 2010, one of the market conditions in the option agreement has been replaced and the vesting of certain options became conditional upon the Company reaching a non-market performance condition. Upon fulfillment of this non-market performance condition, a portion of the options affected by this condition vest immediately, while other options affected by this condition vest evenly over a period of three years.
Condition 3
Vesting of the options is conditional upon the performance of the participants. Options granted are vested over a period of three to four years from the date of fulfillment of certain key performance indicators.
During the year ended August 31, 2010, one of the performance conditions has been modified.
Condition 4
Vesting of the options is conditional upon the performance of the participants. Options granted are vested immediately from the date of fulfillment of the certain key performance indicators.
Condition 5
Vesting of the options is conditional upon the performance of the participants. Options granted are vested over a period of three to four years from the date of fulfillment of certain key performance indicators.
Condition 6
During the year ended August 31, 2011, one of the clauses in the option agreement has been modified. As a result of this modification, the expiry period of the share option has been extended to 10 years from the grant date of share options. The Group has accounted for the modification in accordance with IFRS 2 “Share-based payment” by measuring the incremental fair value which is the difference between the fair value of the modified share options and that of the original share options, both estimated as at the date of the modification, and recognizing the incremental fair value over the period from the modification date until the date when the modified share options vest. If the modification occurs after vesting date, the incremental fair value granted is recognized immediately. The balance of the original grant-date fair value as at the date of modification continues to be recognized over the remaining original vesting period. The total incremental fair value arisen from this modification amounts to HK$276,000.
Condition 7
During the year ended August 31, 2012 and in connection with the Disposal, certain conditions imposed on the share options were waived and all unvested outstanding share options become vested and exercisable immediately. The unamortized original grant date fair value was fully recognized to profit or loss as share-based payment expenses at the date of modification amounting to HK$8,328,000.
F-31
| (b) | The number and weighted average exercise prices of share options are as follows: |
| 2010 | 2009 | |||||||||||||||
| Weighted | Weighted | |||||||||||||||
| average | average | |||||||||||||||
| exercise | exercise | |||||||||||||||
| price | Number of | price | Number of | |||||||||||||
| HK$ | options | HK$ | options | |||||||||||||
2002 Share Option Scheme | ||||||||||||||||
| Outstanding at the beginning of the year | 1.27 | 58,967,231 | 1.27 | 60,581,214 | ||||||||||||
| Adjustment to number of options for 2008 Final Dividend (note) | — | — | 1.27 | 285,464 | ||||||||||||
| Granted during the year | 4.24 | 6,000,000 | — | — | ||||||||||||
| Exercised during the year | 0.82 | (20,317,374 | ) | 0.99 | (1,416,005 | ) | ||||||||||
| Lapsed during the year | — | — | 1.65 | (483,442 | ) | |||||||||||
| Outstanding at the end of the year | 1.87 | 44,649,857 | 1.27 | 58,967,231 | ||||||||||||
| Exercisable at the end of the year | 1.35 | 25,603,183 | 1.12 | 45,849,756 | ||||||||||||
| 2012 | 2011 | |||||||||||||||
Weighted average exercise price HK$ | Number of options | Weighted average exercise price HK$ | Number of options | |||||||||||||
2002 Share Option Scheme | ||||||||||||||||
Outstanding at the beginning of the year | 2.03 | 37,105,683 | 1.87 | 44,649,857 | ||||||||||||
Exercised during the year | 2.03 | (37,104,790 | ) | 1.05 | (6,914,509 | ) | ||||||||||
Lapsed/ forfeited during the year | 0.65 | (893 | ) | 1.79 | (629,665 | ) | ||||||||||
|
|
|
| |||||||||||||
Outstanding at the end of the year | — | — | 2.03 | 37,105,683 | ||||||||||||
|
|
|
| |||||||||||||
Exercisable at the end of the year | — | — | 1.47 | 19,217,594 | ||||||||||||
|
|
|
| |||||||||||||
The weighted average share price at the date of exercise for the share options exercised during the year was HK$4.42 (2011: HK$5.63).
There is no options outstanding at August 31, 2012. The options outstanding at August 31, 2011 had a weighted average exercise price of HK$2.03 and a weighted average remaining contractual life of 3 years.
| 12 | ||
2012 HK$’000 | 2011 HK$’000 | |||||||
Balance as at the beginning of the year | 1,066 | 1,066 | ||||||
Disposal of Telecom Business | (1,066 | ) | — | |||||
|
|
|
| |||||
Balance as at the end of the year | — | 1,066 | ||||||
|
|
|
| |||||
| 13 |
F-32
Construction in progress | Investment properties | Leasehold land and buildings | Leasehold improvements | Furniture, fixtures and fittings | Telecommunications, computer and office equipment | Motor vehicles | Broadcasting and production equipment | Total | ||||||||||||||||||||||||||||
| HK$’000 | HK$’000 | HK$’000 | HK$’000 | HK$’000 | HK$’000 | HK$’000 | HK$’000 | HK$’000 | ||||||||||||||||||||||||||||
Cost: | ||||||||||||||||||||||||||||||||||||
At September 1, 2011 | 51,111 | — | 97,684 | 121,598 | 21,836 | 3,466,362 | 12,219 | — | 3,770,810 | |||||||||||||||||||||||||||
Additions | 83,686 | — | 2,911 | 31,790 | 2,295 | 283,911 | 4,796 | 53,004 | 462,393 | |||||||||||||||||||||||||||
Disposals | — | — | (16,343 | ) | (8,092 | ) | (8,836 | ) | (321,549 | ) | (6,951 | ) | (2,877 | ) | (364,648 | ) | ||||||||||||||||||||
Disposal of Telecom Business | — | — | (16,425 | ) | (125,516 | ) | (11,378 | ) | (3,378,790 | ) | (4,907 | ) | — | (3,537,016 | ) | |||||||||||||||||||||
Fair value adjustment | — | 18,200 | — | — | — | — | — | — | 18,200 | |||||||||||||||||||||||||||
Exchange adjustments | — | — | — | (118 | ) | (68 | ) | (1,774 | ) | — | — | (1,960 | ) | |||||||||||||||||||||||
Reclassification | — | — | — | — | — | (3,306 | ) | — | 3,306 | — | ||||||||||||||||||||||||||
Transfer to investment properties (note 13(b)) | — | 220,000 | (57,361 | ) | — | — | — | — | — | 162,639 | ||||||||||||||||||||||||||
|
|
|
|
|
|
|
|
|
|
|
|
|
|
|
|
|
| |||||||||||||||||||
At August 31, 2012 | 134,797 | 238,200 | 10,466 | 19,662 | 3,849 | 44,854 | 5,157 | 53,433 | 510,418 | |||||||||||||||||||||||||||
|
|
|
|
|
|
|
|
|
|
|
|
|
|
|
|
|
| |||||||||||||||||||
Representing: | ||||||||||||||||||||||||||||||||||||
Cost | 134,797 | — | 10,466 | 19,662 | 3,849 | 44,854 | 5,157 | 53,433 | 272,218 | |||||||||||||||||||||||||||
Valuation | — | 238,200 | — | — | — | — | — | — | 238,200 | |||||||||||||||||||||||||||
|
|
|
|
|
|
|
|
|
|
|
|
|
|
|
|
|
| |||||||||||||||||||
| 134,797 | 238,200 | 10,466 | 19,662 | 3,849 | 44,854 | 5,157 | 53,433 | 510,418 | ||||||||||||||||||||||||||||
|
|
|
|
|
|
|
|
|
|
|
|
|
|
|
|
|
| |||||||||||||||||||
Accumulated depreciation: | ||||||||||||||||||||||||||||||||||||
At September 1, 2011 | — | — | 18,651 | 91,937 | 19,661 | 1,987,610 | 10,250 | — | 2,128,109 | |||||||||||||||||||||||||||
Charge for the year | — | — | 1,352 | 10,896 | 991 | 170,419 | 1,403 | 2,476 | 187,537 | |||||||||||||||||||||||||||
Disposals | — | — | (16,343 | ) | (7,784 | ) | (8,640 | ) | (300,564 | ) | (6,424 | ) | (2,870 | ) | (342,625 | ) | ||||||||||||||||||||
Disposal of Telecom Business | — | — | (955 | ) | (91,764 | ) | (9,791 | ) | (1,829,916 | ) | (3,062 | ) | — | (1,935,488 | ) | |||||||||||||||||||||
Exchange adjustments | — | — | — | (119 | ) | (59 | ) | (1,561 | ) | — | — | (1,739 | ) | |||||||||||||||||||||||
Reclassification | — | — | — | — | — | (2,870 | ) | — | 2,870 | — | ||||||||||||||||||||||||||
Transfer to investment properties (note (13(b)) | — | — | (2,517 | ) | — | — | — | — | — | (2,517 | ) | |||||||||||||||||||||||||
|
|
|
|
|
|
|
|
|
|
|
|
|
|
|
|
|
| |||||||||||||||||||
At August 31, 2012 | — | — | 188 | 3,166 | 2,162 | 23,118 | 2,167 | 2,476 | 33,277 | |||||||||||||||||||||||||||
|
|
|
|
|
|
|
|
|
|
|
|
|
|
|
|
|
| |||||||||||||||||||
Net book value: | ||||||||||||||||||||||||||||||||||||
At August 31, 2012 | 134,797 | 238,200 | 10,278 | 16,496 | 1,687 | 21,736 | 2,990 | 50,957 | 477,141 | |||||||||||||||||||||||||||
|
|
|
|
|
|
|
|
|
|
|
|
|
|
|
|
|
| |||||||||||||||||||
Cost: | ||||||||||||||||||||||||||||||||||||
At September 1, 2010 | — | 5,197 | 90,911 | 113,286 | 21,191 | 3,130,209 | 12,948 | — | 3,373,742 | |||||||||||||||||||||||||||
Additions | 51,111 | — | 1,576 | 6,851 | 203 | 388,828 | 627 | — | 449,196 | |||||||||||||||||||||||||||
Disposals | — | — | — | — | (42 | ) | (57,268 | ) | (1,356 | ) | — | (58,666 | ) | |||||||||||||||||||||||
Exchange adjustments | — | — | — | 1,461 | 484 | 4,593 | — | — | 6,538 | |||||||||||||||||||||||||||
Transfer of investment property | — | (5,197 | ) | 5,197 | — | — | — | — | — | — | ||||||||||||||||||||||||||
|
|
|
|
|
|
|
|
|
|
|
|
|
|
|
|
|
| |||||||||||||||||||
At August 31, 2011 | 51,111 | — | 97,684 | 121,598 | 21,836 | 3,466,362 | 12,219 | — | 3,770,810 | |||||||||||||||||||||||||||
|
|
|
|
|
|
|
|
|
|
|
|
|
|
|
| �� |
|
| ||||||||||||||||||
Accumulated depreciation: | ||||||||||||||||||||||||||||||||||||
At September 1, 2010 | — | 2,413 | 14,284 | 80,316 | 18,132 | 1,816,942 | 9,842 | — | 1,941,929 | |||||||||||||||||||||||||||
Charge for the year | — | 104 | 1,850 | 10,349 | 1,121 | 203,009 | 1,764 | — | 218,197 | |||||||||||||||||||||||||||
Disposals | — | — | — | — | (42 | ) | (36,098 | ) | (1,356 | ) | — | (37,496 | ) | |||||||||||||||||||||||
Exchange adjustments | — | — | — | 1,272 | 450 | 3,757 | — | — | 5,479 | |||||||||||||||||||||||||||
Transfer of investment property | — | (2,517 | ) | 2,517 | — | — | — | — | — | — | ||||||||||||||||||||||||||
|
|
|
|
|
|
|
|
|
|
|
|
|
|
|
|
|
| |||||||||||||||||||
At August 31, 2011 | — | — | 18,651 | 91,937 | 19,661 | 1,987,610 | 10,250 | — | 2,128,109 | |||||||||||||||||||||||||||
|
|
|
|
|
|
|
|
|
|
|
|
|
|
|
|
|
| |||||||||||||||||||
Net book value: | ||||||||||||||||||||||||||||||||||||
At August 31, 2011 | 51,111 | — | 79,033 | 29,661 | 2,175 | 1,478,752 | 1,969 | — | 1,642,701 | |||||||||||||||||||||||||||
|
|
|
|
|
|
|
|
|
|
|
|
|
|
|
|
|
| |||||||||||||||||||
F-33
| 2010 | 2009 | |||||||
| HK$’000 | HK$’000 | |||||||
| Fixed telecommunications network service segment | 1,066 | 1,066 | ||||||
F-34
| Telecom- | ||||||||||||||||||||||||||||
| munications, | ||||||||||||||||||||||||||||
| Leasehold | Furniture, | computer | ||||||||||||||||||||||||||
| Investment | land and | Leasehold | fixtures | and office | Motor | |||||||||||||||||||||||
| property | buildings | improvements | and fittings | equipment | vehicles | Total | ||||||||||||||||||||||
| HK$’000 | HK$’000 | HK$’000 | HK$’000 | HK$’000 | HK$’000 | HK$’000 | ||||||||||||||||||||||
Cost: | ||||||||||||||||||||||||||||
| At September 1, 2009 | 5,197 | 90,911 | 100,447 | 19,885 | 2,850,444 | 12,773 | 3,079,657 | |||||||||||||||||||||
| Additions | — | — | 12,885 | 1,343 | 330,441 | 175 | 344,844 | |||||||||||||||||||||
| Disposals | — | — | (212 | ) | (109 | ) | (51,906 | ) | — | (52,227 | ) | |||||||||||||||||
| Exchange adjustments | — | — | 166 | 72 | 1,230 | — | 1,468 | |||||||||||||||||||||
| At August 31, 2010 | 5,197 | 90,911 | 113,286 | 21,191 | 3,130,209 | 12,948 | 3,373,742 | |||||||||||||||||||||
Accumulated depreciation: | ||||||||||||||||||||||||||||
| At September 1, 2009 | 2,309 | 12,466 | 69,102 | 17,017 | 1,668,160 | 8,223 | 1,777,277 | |||||||||||||||||||||
| Charge for the year | 104 | 1,818 | 11,270 | 1,166 | 183,052 | 1,619 | 199,029 | |||||||||||||||||||||
| Disposals | — | — | (212 | ) | (109 | ) | (35,344 | ) | — | (35,665 | ) | |||||||||||||||||
| Exchange adjustments | — | — | 156 | 58 | 1,074 | — | 1,288 | |||||||||||||||||||||
| �� | ||||||||||||||||||||||||||||
| At August 31, 2010 | 2,413 | 14,284 | 80,316 | 18,132 | 1,816,942 | 9,842 | 1,941,929 | |||||||||||||||||||||
Net book value: | ||||||||||||||||||||||||||||
| At August 31, 2010 | 2,784 | 76,627 | 32,970 | 3,059 | 1,313,267 | 3,106 | 1,431,813 | |||||||||||||||||||||
Cost: | ||||||||||||||||||||||||||||
| At September 1, 2008 | 5,197 | 84,244 | 84,577 | 19,575 | 2,644,281 | 12,624 | 2,850,498 | |||||||||||||||||||||
| Additions | — | 6,667 | 16,663 | 416 | 262,796 | 192 | 286,734 | |||||||||||||||||||||
| Disposals | — | — | (630 | ) | (30 | ) | (55,118 | ) | (43 | ) | (55,821 | ) | ||||||||||||||||
| Exchange adjustments | — | — | (163 | ) | (76 | ) | (1,515 | ) | — | (1,754 | ) | |||||||||||||||||
| At August 31, 2009 | 5,197 | 90,911 | 100,447 | 19,885 | 2,850,444 | 12,773 | 3,079,657 | |||||||||||||||||||||
Accumulated depreciation: | ||||||||||||||||||||||||||||
| At September 1, 2008 | 2,205 | 10,727 | 61,269 | 15,596 | 1,522,739 | 6,563 | 1,619,099 | |||||||||||||||||||||
| Charge for the year | 104 | 1,739 | 8,286 | 1,508 | 192,925 | 1,679 | 206,241 | |||||||||||||||||||||
| Disposals | — | — | (294 | ) | (29 | ) | (46,214 | ) | (19 | ) | (46,556 | ) | ||||||||||||||||
| Exchange adjustments | — | — | (159 | ) | (58 | ) | (1,290 | ) | — | (1,507 | ) | |||||||||||||||||
| At August 31, 2009 | 2,309 | 12,466 | 69,102 | 17,017 | 1,668,160 | 8,223 | 1,777,277 | |||||||||||||||||||||
Net book value: | ||||||||||||||||||||||||||||
| At August 31, 2009 | 2,888 | 78,445 | 31,345 | 2,868 | 1,182,284 | 4,550 | 1,302,380 | |||||||||||||||||||||
F-35
| (a) | The Group’s total future aggregate lease income receivable under non-cancellable operating lease are as follows: |
| 2010 | 2009 | |||||||
| HK$’000 | HK$’000 | |||||||
| Leases in respect of investment property which are receivable: | ||||||||
| - Within 1 year | 108 | 258 | ||||||
| - After 1 year but within 5 years | — | — | ||||||
| 108 | 258 | |||||||
| Leases in respect of telecommunications facilities and computer equipment which are receivable: | ||||||||
| - Within 1 year | 2,335 | 1,566 | ||||||
| - After 1 year but within 5 years | 607 | 1,071 | ||||||
| 2,942 | 2,637 | |||||||
| 3,050 | 2,895 | |||||||
2012 HK$’000 | 2011 HK$’000 | |||||||
Continuing operations: | ||||||||
Leases in respect of investment properties which are receivable: | ||||||||
- Within 1 year | 13,659 | — | ||||||
- After 1 year but within 5 years | 51,219 | — | ||||||
|
|
|
| |||||
| 64,878 | — | |||||||
|
|
|
| |||||
Discontinued operations: | ||||||||
Leases in respect of telecommunications facilities and computer equipment which are receivable: | ||||||||
- Within 1 year | — | 3,604 | ||||||
- After 1 year but within 5 years | — | 2,653 | ||||||
|
|
|
| |||||
| — | 6,257 | |||||||
|
|
|
| |||||
| 64,878 | 6,257 | |||||||
|
|
|
| |||||
| (b) |
During the year ended August 31, 2011, the lease of the investment property to a third party expired and the property has then been leased to a group entity for self-use. Upon this change in use, the Group transferred the investment property into leasehold land and buildings.
| (c) | All investment properties of the Group were revalued as at August 31, 2012 on an open market value basis calculated by reference to net rental income allowing for reversionary income potential. The valuations were carried out by an independent firm of surveyors, RHL Appraisal Limited, who have among their staff Fellows of the Hong Kong Institute of Surveyors with recent experience in the location and category of property being valued. |
| (d) | The net book value of interests in leasehold land and buildings and investment |
| 2010 | 2009 | |||||||
| HK$’000 | HK$’000 | |||||||
| Leases of between 10 to 50 years | 79,411 | 81,333 | ||||||
| Representing: | ||||||||
| Leasehold land and building carried at cost | 76,627 | 78,445 | ||||||
| Investment property carried at cost less impairment loss | 2,784 | 2,888 | ||||||
| 79,411 | 81,333 | |||||||
2012 HK$’000 | 2011 HK$’000 | |||||||
Leases of between 10 to 50 years | 383,275 | 130,144 | ||||||
|
|
|
| |||||
Representing: | ||||||||
Construction in progress carried at cost | 134,797 | 51,111 | ||||||
Leasehold land and buildings carried at cost | 10,278 | 79,033 | ||||||
Investment properties stated at fair value | 238,200 | — | ||||||
|
|
|
| |||||
| 383,275 | 130,144 | |||||||
|
|
|
| |||||
| In addition to the leasehold land and buildings classified as being held under a finance lease, the Group leases |
At August 31, 2012, the net book value of telecommunications/network, computer and office equipment under finance lease held by the Group amounted to HK$92,000 (2011: HK$267,000).
| (f) | The cost of construction in progress comprises premium paid for the land registered in Hong Kong with a lease term of about 36 years and expenditure incurred on the development of buildings not yet completed at the year-end. |
| (g) | Further particulars of the Group’s properties interest at August 31, 2012 are as follows: |
| Location | Use | Lease term | Attributable interest of the Group | |||||
Office 1, 2 and 3 on 7th Floor, | ||||||||
F-36
| Medium term lease | 100 | % | ||||||
12/F,14/F-16/F & Roof on 17/F, | Leasing for rental income | Medium term lease | 100 | % | ||||
13/F, Trans Asia Centre, | Self-use | Medium term lease | 100 | % | ||||
The whole of 14/F and Lorry Parking Space | ||||||||
| Leasing for rental income | Medium term lease | 100 | % |
| 14 | Intangible assets |
IRU of the tele- HK$’000 | Right to use of HK$’000 | Others HK$’000 | Total HK$’000 | |||||||||||||
Cost: | ||||||||||||||||
At September 1, 2011 | — | — | — | — | ||||||||||||
Additions | 226,700 | 90,243 | 2,450 | 319,393 | ||||||||||||
Written off | — | — | (2,450 | ) | (2,450 | ) | ||||||||||
|
|
|
|
|
|
|
| |||||||||
At August 31, 2012 | 226,700 | 90,243 | — | 316,943 | ||||||||||||
|
|
|
|
|
|
|
| |||||||||
Accumulated amortization: | ||||||||||||||||
At September 1, 2011 | — | — | — | — | ||||||||||||
Amortization for the year | 2,905 | 2,312 | — | 5,217 | ||||||||||||
|
|
|
|
|
|
|
| |||||||||
At August 31, 2012 | 2,905 | 2,312 | — | 5,217 | ||||||||||||
|
|
|
|
|
|
|
| |||||||||
Net book value: | ||||||||||||||||
At August 31, 2012 | 223,795 | 87,931 | — | 311,726 | ||||||||||||
|
|
|
|
|
|
|
| |||||||||
Upon the completion of Disposal and as part of the consideration received from the Disposal, the Group was granted the IRU to use certain capacity of the telecommunications network of the Telecom Business for a term of 20 years and right to use of the telecommunications services from the Telecom Business for a term of 10 years.
The fair value of IRU of telecommunications capacity and right to use of telecommunications services as at the completion date of the Disposal was determined by the Group with reference to comparable market transactions.
| 15 | Principal subsidiaries |
The following is a list of the principal subsidiaries which principally affected the results, assets or liabilities of the Group:
Place of incorporation | Principal activities and place of operations | Particulars of issued share capital | Percentage of interest | |||||||||||||
Attitude Holdings Limited# | British Virgin Islands | Inactive | Ordinary US$1 | 100 | ||||||||||||
Best Intellect Limited | British Virgin Islands | Investment holding in Hong Kong | Ordinary US$1 | *100 | ||||||||||||
Cosmo True Limited | British Virgin Islands | Property investment in Hong Kong | Ordinary US$1 | *100 | ||||||||||||
Excel Billion Profits Limited | 100 | |||||||||||||||
Golden Trinity Holdings Limited# | British Virgin Islands | Investment holding in Hong Kong | Ordinary US$ | *100 | ||||||||||||
Hong Kong Broadband Digital TV Limited | Hong Kong | Inactive | Ordinary HK$10,000 | 100 | ||||||||||||
Hong Kong Broadband Television Company Limited | Hong Kong | Inactive | Ordinary HK$2 | 100 | ||||||||||||
Hong Kong Media Production Company Limited | Hong Kong | Provision of multimedia production and distribution services | Ordinary HK$10,000 | 100 | ||||||||||||
Hong Kong Television Network Limited | Hong Kong | Inactive | Ordinary HK$2 | 100 | ||||||||||||
Leader Artiste Management Company Limited | Hong Kong | Provision of management and agency services to artistes | Ordinary HK$100 | 100 | ||||||||||||
Multi Talent Enterprise Limited | British Virgin Islands | Investment holding in Hong Kong | Ordinary US$1 | *100 | ||||||||||||
F-37
CTI Guangzhou Customer Services Co. Ltd. (translated from the registered name in Chinese) | PRC | Provision of administrative support services in the PRC | Paid in capital of HK$8,000,000 | |||||||
Hong Kong | ||||||||||
Broadband Network Limited (“HKBN”) ^ | Hong Kong | Provision of international telecommunications and fixed telecommunications network services in Hong Kong | Ordinary HK$383,049 | |||||||
| * | Shares held directly by the Company. | |
| # | Subsidiaries not audited by |
| 2010 | 2009 | |||||||
| HK$’000 | HK$’000 | |||||||
| Balance as at the beginning of the year | 49,460 | 56,095 | ||||||
| Additions during the year | 34,773 | 46,525 | ||||||
| Less: amortization charge for the year (note 4(a)) | (48,621 | ) | (53,160 | ) | ||||
| 35,612 | 49,460 | |||||||
| Current portion | (28,986 | ) | (36,674 | ) | ||||
| Balance as at the end of the year | 6,626 | 12,786 | ||||||
| ^ |
F-38
| 2010 | 2009 | |||||||
| HK$’000 | HK$’000 | |||||||
| Accounts receivable | 105,552 | 123,352 | ||||||
| Less: Allowance for doubtful debts | (5,823 | ) | (3,160 | ) | ||||
| 99,729 | 120,192 | |||||||
| Other receivables, deposits and prepayments | 89,490 | 69,765 | ||||||
| 189,219 | 189,957 | |||||||
| 2010 | 2009 | |||||||
| HK$’000 | HK$’000 | |||||||
| Current — 30 days | 41,244 | 32,427 | ||||||
| 31 — 60 days | 9,024 | 13,663 | ||||||
| 61 — 90 days | 5,245 | 3,953 | ||||||
| Over 90 days | 50,039 | 73,309 | ||||||
| 105,552 | 123,352 | |||||||
| 2010 | 2009 | 2008 | ||||||||||
| HK$’000 | HK$’000 | HK$’000 | ||||||||||
| Balance as at the beginning of the year | 3,160 | 11,944 | 22,392 | |||||||||
| Impairment loss recognized | 14,742 | 12,103 | 14,293 | |||||||||
| Uncollectible amounts written off | (12,079 | ) | (20,887 | ) | (24,741 | ) | ||||||
| Balance as at the end of the year | 5,823 | 3,160 | 11,944 | |||||||||
F-39
| Deferred expenditure |
2012 HK$’000 | 2011 HK$’000 | |||||||
Balance as at the beginning of the year | 44,635 | 35,612 | ||||||
Additions during the year | 22,245 | 46,896 | ||||||
Less: amortization charge for the year | (29,902 | ) | (37,873 | ) | ||||
|
|
|
| |||||
| 36,978 | 44,635 | |||||||
Disposal of Telecom Business | (36,978 | ) | — | |||||
Current portion | — | (29,312 | ) | |||||
|
|
|
| |||||
Balance as at the end of the year | — | 15,323 | ||||||
|
|
|
| |||||
Deferred expenditure represents costs incurred by the Telecom Business to acquire subscribers of the services offered by the Telecom Business, which are treated as customer acquisition costs and are amortized over the period of the underlying service subscription agreements.
| 17 | Accounts receivable, other receivables, deposits and prepayments |
| 2012 HK$’000 | 2011 HK$’000 | |||||||
Accounts receivable | 1,311 | 78,529 | ||||||
Less: Allowance for doubtful debts | — | (6,530 | ) | |||||
|
|
|
| |||||
| 1,311 | 71,999 | |||||||
Other receivables, deposits and prepayments | 31,581 | 90,984 | ||||||
|
|
|
| |||||
| 32,892 | 162,983 | |||||||
|
|
|
| |||||
| (a) | Aging analysis |
The aging analysis of accounts receivable, before recognition of impairment losses, is as follows:
| 2012 HK$’000 | 2011 HK$’000 | |||||||
Current - 30 days | 573 | 44,949 | ||||||
31 - 60 days | 565 | 16,417 | ||||||
61 - 90 days | 94 | 6,861 | ||||||
Over 90 days | 79 | 10,302 | ||||||
|
|
|
| |||||
| 1,311 | 78,529 | |||||||
|
|
|
| |||||
The majority of the Group’s accounts receivable are due within 30 days from the date of billings. Customers with receivable that are more than 3 months overdue are requested to settle all outstanding balance before further credit is granted.
| (b) | Impairment of accounts receivable |
Impairment losses in respect of accounts receivable are recorded using an allowance account unless the Group is satisfied that recovery of the amount is remote, in which case the impairment loss is written off against accounts receivable directly (see note 1(k)(i)).
The movement in the allowance for doubtful debts during the year including both specific and collective loss components is as follows:
| 2012 HK$’000 | 2011 HK$’000 | 2010 HK$’000 | ||||||||||
Balance as at the beginning of the year | 6,530 | 5,823 | 3,160 | |||||||||
Impairment loss recognized | 9,707 | 13,636 | 14,742 | |||||||||
Uncollectible amounts written off | (11,707 | ) | (12,929 | ) | (12,079 | ) | ||||||
Disposal of Telecom Business | (4,530 | ) | — | — | ||||||||
|
|
|
|
|
| |||||||
Balance as at the end of the year | — | 6,530 | 5,823 | |||||||||
|
|
|
|
|
| |||||||
| (c) | Accounts receivable that are not impaired | |
| 2010 | 2009 | |||||||
| HK$’000 | HK$’000 | |||||||
| Neither past due nor impaired | 41,244 | 32,427 | ||||||
| 0 — 30 past due | 9,024 | 13,663 | ||||||
| 31 — 60 past due | 5,245 | 3,953 | ||||||
| Over 60 past due | 44,216 | 70,149 | ||||||
| 99,729 | 120,192 | |||||||
The aging analysis of accounts receivable that are neither individually nor collectively considered to be impaired are as follows:
| 2012 | 2011 | |||||||
| HK$’000 | HK$’000 | |||||||
Neither past due nor impaired | 573 | 44,949 | ||||||
0 - 30 past due | 565 | 16,417 | ||||||
31 - 60 past due | 94 | 6,861 | ||||||
Over 60 past due | 79 | 3,772 | ||||||
|
|
|
| |||||
| 1,311 | 71,999 | |||||||
|
|
|
| |||||
Receivables that were neither past due nor impaired relate to a wide range of customers for whom there was no recent history of default.
Other accounts receivable that were past due but not impaired relate to a number of independent customers that have a good track record of payment. Based on past experience, management believes that no impairment allowance is necessary in respect of these balances as there has not been a significant change in credit quality and the balances are still considered fully recoverable. The Group does not hold collateral over these balances.
| (d) | Other receivables, deposits and prepayments | |
Other receivables, deposits and prepayments consist of deposits for purchase of fixed assets, rental deposit, interest receivable, unbilled revenue, prepayment and other receivables. All of the other receivables, except rental deposits and others amounting to HK$1,392,000 (2011: HK$9,026,000), are expected to be recovered within one year.
| 18 | Bank deposits and |
F-40
| 2010 | 2009 | |||||||
| HK$’000 | HK$’000 | |||||||
| Time deposits with banks and other financial institutions | 262,280 | 77,500 | ||||||
| Cash at bank and in hand | 326,385 | 148,916 | ||||||
| Cash at bank and in hand in the balance sheet | 588,665 | 226,416 | ||||||
| 2010 | 2009 | |||||||
| HK$’000 | HK$’000 | |||||||
| Accounts payable | 35,128 | 37,555 | ||||||
| Other payables and accrued charges | 195,931 | 206,487 | ||||||
| 231,059 | 244,042 | |||||||
| (a) | Term deposits |
Term deposits are time deposits with banks with maturity over three months at acquisition.
| (b) | Cash at bank and in hand |
| 2012 | 2011 | |||||||
| HK$’000 | HK$’000 | |||||||
Time deposits with banks within three months of original maturity | — | 263,270 | ||||||
Cash at bank and in hand | 2,083,079 | 145,706 | ||||||
|
|
|
| |||||
Cash at bank and in hand in the balance sheet | 2,083,079 | 408,976 | ||||||
|
|
|
| |||||
| 19 | Accounts payable, other payables and accrued charges |
| 2012 | 2011 | |||||||
| HK$’000 | HK$’000 | |||||||
Accounts payable | 5,371 | 17,419 | ||||||
Other payables and accrued charges | 31,118 | 209,585 | ||||||
|
|
|
| |||||
| 36,489 | 227,004 | |||||||
|
|
|
| |||||
| (a) | The aging analysis of the accounts payable |
| 2010 | 2009 | |||||||
| HK$’000 | HK$’000 | |||||||
| Current — 30 days | 6,838 | 12,621 | ||||||
| 31 — 60 days | 1,982 | 1,778 | ||||||
| 61 — 90 days | 1,647 | 189 | ||||||
| Over 90 days | 24,661 | 22,967 | ||||||
| 35,128 | 37,555 | |||||||
| 2012 | 2011 | |||||||
| HK$’000 | HK$’000 | |||||||
Current - 30 days | 2,920 | 11,719 | ||||||
31 - 60 days | 315 | 245 | ||||||
61 - 90 days | 84 | 733 | ||||||
Over 90 days | 2,052 | 4,722 | ||||||
|
|
|
| |||||
| 5,371 | 17,419 | |||||||
|
|
|
| |||||
| (b) | Other payables and accrued charges | |
Other payables primarily consist of accrual for Talent salaries and bonus, carrier fees and charges, payable for purchase of fixed assets, advertising and promotional expenses as well as interest payable.
| Deferred |
Deferred services revenue primarily includes service fees received from customers in advance for the Group’s fixed telecommunications network services and international telecommunications services. Service fees received in advance is deferred and recognized as revenue on a straight-line basis over the related contract period. The deferred services revenue was disposed as part of the Telecom Business on May 30, 2012.
| 21 |
F-41
| Capital and reserves |
| (a) | Share capital |
| 2010 | 2009 | |||||||||||||||
| No. of | Amount | No. of | Amount | |||||||||||||
| Shares | HK$’000 | shares | HK$’000 | |||||||||||||
Authorized: | ||||||||||||||||
| Ordinary shares of HK$0.10 each | 2,000,000,000 | 200,000 | 2,000,000,000 | 200,000 | ||||||||||||
Issued and fully paid: | ||||||||||||||||
| Ordinary shares of HK$0.10 each | ||||||||||||||||
| At the beginning of the year | 664,179,970 | 66,418 | 650,621,823 | 65,062 | ||||||||||||
| Shares issued in respect of scrip dividend of the previous year (note (i)) | — | — | 12,212,142 | 1,221 | ||||||||||||
| Shares issued upon exercise of share options (note (ii)) | 20,317,374 | 2,032 | 1,416,005 | 142 | ||||||||||||
| Shares issued upon placement (note (iii)) | 80,500,000 | 8,050 | — | — | ||||||||||||
| Repurchase and cancellation of ordinary shares | — | — | (70,000 | ) | (7 | ) | ||||||||||
| At the end of the year | 764,997,344 | 76,500 | 664,179,970 | 66,418 | ||||||||||||
| 2012 | 2011 | |||||||||||||||
No. of Shares | Amount HK$’000 | No. of shares | Amount HK$’000 | |||||||||||||
Authorized: | ||||||||||||||||
Ordinary shares of HK$0.10 each | 2,000,000,000 | 200,000 | 2,000,000,000 | 200,000 | ||||||||||||
|
|
|
|
|
|
|
| |||||||||
Issued and fully paid: | ||||||||||||||||
Ordinary shares of HK$0.10 each | ||||||||||||||||
At the beginning of the year | 771,911,853 | 77,191 | 764,997,344 | 76,500 | ||||||||||||
Shares issued upon exercise of share options (note (i)) | 37,104,790 | 3,711 | 6,914,509 | 691 | ||||||||||||
|
|
|
|
|
|
|
| |||||||||
At the end of the year | 809,016,643 | 80,902 | 771,911,853 | 77,191 | ||||||||||||
|
|
|
|
|
|
|
| |||||||||
The holders of ordinary shares are entitled to receive dividends as declared from time to time and are entitled to one vote per ordinary share at meetings of the Company. All ordinary shares rank equally with regard to the Company’s residual assets.
Notes:
| (i) | |||
| During the year ended August 31, | |||
F-42
| (ii) | The movement of outstanding share options during the year was as follows: |
| Number of | Number of | |||||||||||||||||||||||
| share options | share options | |||||||||||||||||||||||
| Exercise | outstanding at | outstanding | ||||||||||||||||||||||
| price | September 1, | at August 31, | ||||||||||||||||||||||
| Date of grant | per share | 2009 | Granted | Exercised | Lapsed | 2010 | ||||||||||||||||||
| October 21, 2004 | HK$1.5224 | 6,909,527 | — | 2,750,847 | — | 4,158,680 | ||||||||||||||||||
| January 5, 2005 | HK$1.5224 | 16,183,208 | — | — | — | 16,183,208 | ||||||||||||||||||
| May 22, 2006 | HK$0.6523 | 21,592,899 | — | 16,409,456 | — | 5,183,443 | ||||||||||||||||||
| August 3, 2006 | HK$0.7018 | 40,540 | — | 40,540 | — | — | ||||||||||||||||||
| November 22, 2006 | HK$0.7216 | 136,545 | — | 136,545 | — | — | ||||||||||||||||||
| February 6, 2008 | HK$1.7568 | 6,044,791 | — | 502,000 | — | 5,542,791 | ||||||||||||||||||
| February 11, 2008 | HK$1.8660 | 6,044,791 | — | — | — | 6,044,791 | ||||||||||||||||||
| February 15, 2008 | HK$1.7568 | 1,007,465 | — | 402,986 | — | 604,479 | ||||||||||||||||||
| May 2, 2008 | HK$1.7866 | 1,007,465 | — | 75,000 | — | 932,465 | ||||||||||||||||||
| February 5, 2010 | HK$4.2400 | — | 6,000,000 | — | — | 6,000,000 | ||||||||||||||||||
| 58,967,231 | 6,000,000 | 20,317,374 | — | 44,649,857 | ||||||||||||||||||||
| Date of grant | Exercise price per share | Number of share options outstanding at September 1, 2011 | Granted | Exercised | Forfeited | Number of share outstanding at 2012 | ||||||||||||||||||
October 21, 2004 | HK$ | 1.5224 | 3,807,971 | — | (3,807,971 | ) | — | — | ||||||||||||||||
January 5, 2005 | HK$ | 1.5224 | 14,183,208 | — | (14,183,208 | ) | — | — | ||||||||||||||||
May 22, 2006 | HK$ | 0.6523 | 1,224,683 | — | (1,223,792 | ) | (891 | ) | — | |||||||||||||||
February 6, 2008 | HK$ | 1.7568 | 5,542,791 | — | (5,542,790 | ) | (1 | ) | — | |||||||||||||||
February 11, 2008 | HK$ | 1.8660 | 6,044,791 | — | (6,044,790 | ) | (1 | ) | — | |||||||||||||||
February 15, 2008 | HK$ | 1.7568 | 302,239 | — | (302,239 | ) | — | — | ||||||||||||||||
February 5, 2010 | HK$ | 4.2400 | 6,000,000 | — | (6,000,000 | ) | — | — | ||||||||||||||||
|
|
|
|
|
|
|
|
|
| |||||||||||||||
| 37,105,683 | — | (37,104,790 | ) | (893 | ) | — | ||||||||||||||||||
|
|
|
|
|
|
|
|
|
| |||||||||||||||
Each option entitles the holder to subscribe for one ordinary share of HK$0.10 each in the Company at a predetermined exercise price.
| (b) | ||
| Nature and purpose of reserves | ||
| (i) | Share premium | |
The application of the share premium account is governed by Sections 48B of the Hong Kong Companies Ordinance.
| (ii) | Capital reserve | |
The capital reserve comprises the portion of the grant date fair value of unexercised share options granted to Talents of the Group that was recognized in accordance with the accounting policy adopted for share based payment in note 1(r)(iv).
| (iii) | ||
| Exchange reserve | ||
The exchange reserve comprises all foreign exchange differences arising from the translation of the financial statements of operations outside Hong Kong. The reserve is dealt with in accordance with the accounting policies set out in note 1(e)(ii).
F-43
| (c) | Capital management |
The Group’s primary objectives when managing capital are to maintain a reasonable capital structure, safeguard the Group’s ability to continue as a going concern, and to provide returns for shareholders.
The Group manages the amount of capital in proportion to risk, and makes adjustments to its capital structure through the amount of dividend payment to shareholders, issuance of scrip and new shares, taking into account its future financial obligations and commitments.
The Group undertakes treasury management activities with respect to its surplus cash assets and monitors its capital structure to maintain sufficient cash for providing adequate funding for the development of the Group’s Multimedia Business.
Neither the Company nor any of its subsidiaries are currently subject to externally imposed capital requirements.
| 22 | Deferred taxation |
| (a) | Deferred tax assets and liabilities recognized |
| (i) | The | |
| 2010 | 2009 | |||||||
| HK$’000 | HK$’000 | |||||||
| Unsecured | ||||||||
| - 10-year senior notes | — | 162,586 | ||||||
| - Long-term bank loan | 123,567 | — | ||||||
| - Obligations under finance leases | 605 | 732 | ||||||
| Total loans | 124,172 | 163,318 | ||||||
| Less: Cash at bank and in hand | (588,665 | ) | (226,416 | ) | ||||
| Add: Bank overdrafts — unsecured | 10,490 | 5,364 | ||||||
| Net cash | (454,003 | ) | (57,734 | ) | ||||
| Net asset | 1,688,539 | 1,228,527 | ||||||
| Net debt to net asset gearing ratio | — | — | ||||||
| 2010 | 2009 | 2008 | ||||||||||
| HK$’000 | HK$’000 | HK$’000 | ||||||||||
| Balance as at the beginning of the year | (15,709 | ) | 21,398 | (291 | ) | |||||||
| Exchange differences | — | 1 | (1 | ) | ||||||||
| Deferred taxation (charged)/credited to income statement | ||||||||||||
| - relating to the origination and reversal of temporary differences | (40,134 | ) | (37,108 | ) | (4,645 | ) | ||||||
| - relating to the recognition of unrecognized tax losses in prior years | — | — | 26,335 | |||||||||
| Balance as at the end of the year | (55,843 | ) | (15,709 | ) | 21,398 | |||||||
F-44
| 2010 | 2009 | |||||||
| HK$’000 | HK$’000 | |||||||
| After 5 years | 2,553 | 2,455 | ||||||
| No expiry date | 5,689 | 5,699 | ||||||
| 8,242 | 8,154 | |||||||
| Accelerated depreciation allowance | ||||||||||||
| 2010 | 2009 | 2008 | ||||||||||
| HK$’000 | HK$’000 | HK$’000 | ||||||||||
Deferred tax liabilities | ||||||||||||
| At the beginning of the year | (131,766 | ) | (126,447 | ) | (134,910 | ) | ||||||
| Charged to consolidated income statement | (15,027 | ) | (5,326 | ) | 8,463 | |||||||
| Exchange differences | (6 | ) | 7 | — | ||||||||
| At the end of the year | (146,799 | ) | (131,766 | ) | (126,447 | ) | ||||||
| Tax losses | ||||||||||||
| 2010 | 2009 | 2008 | ||||||||||
| HK$’000 | HK$’000 | HK$’000 | ||||||||||
Deferred tax assets | ||||||||||||
| At the beginning of the year | 116,057 | 147,845 | 134,619 | |||||||||
| Charged to consolidated income statement | (25,107 | ) | (31,782 | ) | 13,227 | |||||||
| Exchange differences | 6 | (6 | ) | (1 | ) | |||||||
| At the end of the year | 90,956 | 116,057 | 147,845 | |||||||||
Depreciation allowances in excess of the related depreciation | Tax losses carried forward | Total | ||||||||||
| Deferred tax arising from: | HK$’000 | HK$’000 | HK$’000 | |||||||||
At September 1, 2009 | (131,766 | ) | 116,057 | (15,709 | ) | |||||||
Charged to consolidated income statement | (15,027 | ) | (25,107 | ) | (40,134 | ) | ||||||
Exchange differences | (6 | ) | 6 | — | ||||||||
|
|
|
|
|
| |||||||
At August 31, 2010 | (146,799 | ) | 90,956 | (55,843 | ) | |||||||
|
|
|
|
|
| |||||||
At September 1, 2010 | (146,799 | ) | 90,956 | (55,843 | ) | |||||||
Charged to consolidated income statement | (21,185 | ) | (34,110 | ) | (55,295 | ) | ||||||
Exchange differences | (7 | ) | 7 | — | ||||||||
|
|
|
|
|
| |||||||
At August 31, 2011 | (167,991 | ) | 56,853 | (111,138 | ) | |||||||
|
|
|
|
|
| |||||||
At September 1, 2011 | (167,991 | ) | 56,853 | (111,138 | ) | |||||||
Charged to consolidated income statement | (25,849 | ) | (21,461 | ) | (47,310 | ) | ||||||
Disposal of Telecom Business | 181,737 | (24,635 | ) | 157,102 | ||||||||
|
|
|
|
|
| |||||||
At August 31, 2012 | (12,103 | ) | 10,757 | (1,346 | ) | |||||||
|
|
|
|
|
| |||||||
| (ii) |
| 2010 | 2009 | |||||||
| HK$’000 | HK$’000 | |||||||
| Deferred tax assets | — | — | ||||||
| Deferred tax liabilities | (55,843 | ) | (15,709 | ) | ||||
| (55,843 | ) | (15,709 | ) | |||||
F-45
| The Group | ||||||||
| 2012 | 2011 | |||||||
| HK$’000 | HK$’000 | |||||||
Net deferred tax asset recognized in the balance sheet | — | — | ||||||
Net deferred tax liabilities recognized in the balance sheet | (1,346 | ) | (111,138 | ) | ||||
|
|
|
| |||||
| (1,346 | ) | (111,138 | ) | |||||
|
|
|
| |||||
| Deferred tax assets not recognized |
As at August 31, 2012, the Group did not recognize deferred tax assets in respect of unused tax losses of HK$59,787,000 (2011: HK$8,087,000) as it was not probable that future taxable profits against which the losses could be utilized would be available in the relevant tax jurisdictions.
| The Group | ||||||||
| 2012 | 2011 | |||||||
| HK$’000 | HK$’000 | |||||||
Expiry in 15-20 years | — | 2,412 | ||||||
No expiry date | 59,787 | 5,675 | ||||||
|
|
|
| |||||
| 59,787 | 8,087 | |||||||
|
|
|
| |||||
| (c) | Deferred tax liabilities not recognized |
As at August 31, 2011, the Group has not recognized deferred tax liabilities in respect of the 10% (or 5% if tax treaty relief is available) PRC dividend withholding tax on temporary differences relating to the undistributed profits of its PRC subsidiary amounted to HK$31,550,000, as the Group controls the dividend policy of the subsidiary and it has been determined that it is probable that profits will not be distributed in the foreseeable future.
| 23 | Derivative financial instrument |
| 2012 | 2011 | |||||||
| HK$’000 | HK$’000 | |||||||
Non-current liability | ||||||||
Interest rate swap, at fair value through profit or loss | 9,663 | 11,564 | ||||||
|
|
|
| |||||
As at August 31, 2012 and August 31, 2011, the Group has a 5-year interest rate swap contract with a HK$175,000,000 notional amount to hedge against interest rate risk. Under this arrangement, the Group will pay a fixed rate interest on the notional amount on a quarterly basis, and receive a floating interest rate at HIBOR rate. The contract is recognized initially at fair value and is remeasured at each balance sheet date.
The Interest rate swap does not quality for hedge accounting under IAS 39,Financial instruments: Recognition and measurement , and therefore changes in its fair value is recognized immediately in profit or loss.
| 24 | ||||||||
| Obligations under finance leases | ||||||||
| 2012 | 2011 | |||||||
| HK$’000 | HK$’000 | |||||||
Obligations under finance leases (note (a)) | 245 | 393 | ||||||
Current portion of - obligations under finance leases | (85 | ) | (105 | ) | ||||
|
|
|
| |||||
| 160 | 288 | |||||||
|
|
|
| |||||
At August 31, 2012, the Group’s long-term debt and other liabilities were repayable as follows:
| 2012 | 2011 | |||||||
| HK$’000 | HK$’000 | |||||||
Obligations under finance leases | ||||||||
- Within 1 year | 85 | 105 | ||||||
- After 1 year but within 2 years | 90 | 105 | ||||||
- After 2 years but within 5 years | 70 | 183 | ||||||
|
|
|
| |||||
| 245 | 393 | |||||||
Less: Current portion of obligations under finance leases | (85 | ) | (105 | ) | ||||
|
|
|
| |||||
| 160 | 288 | |||||||
|
|
|
| |||||
Notes:
| 2010 | 2009 | |||||||
| HK$’000 | HK$’000 | |||||||
| 10-year senior notes (note (a)) | — | 162,586 | ||||||
| Long-term bank loan — unsecured (note (b)) | 123,567 | — | ||||||
| Obligations under finance leases (note (c)) | 605 | 732 | ||||||
| 124,172 | 163,318 | |||||||
| Current portion of — obligations under finance leases | (212 | ) | (202 | ) | ||||
| 123,960 | 163,116 | |||||||
| (a) | At August 31, |
| 2010 | 2009 | |||||||
| HK$’000 | HK$’000 | |||||||
| Long-term debt | ||||||||
| - after 2 years but within 5 years | 123,567 | — | ||||||
| - after 5 years | — | 162,586 | ||||||
| Obligations under finance leases | ||||||||
| - Within 1 year | 212 | 202 | ||||||
| - After 1 year but within 2 years | 105 | 197 | ||||||
| - After 2 years but within 5 years | 288 | 263 | ||||||
| - After 5 years | — | 70 | ||||||
| 605 | 732 | |||||||
| Less: Current portion of obligations under finance leases | (212 | ) | (202 | ) | ||||
| 393 | 530 | |||||||
| 123,960 | 163,116 | |||||||
F-46
| 2010 | 2009 | |||||||||||||||||||||||
| Present | Present | |||||||||||||||||||||||
| value | Interest | value | Interest | |||||||||||||||||||||
| of the | expense | Total | of the | expense | Total | |||||||||||||||||||
| minimum | relating to | minimum | minimum | relating to | minimum | |||||||||||||||||||
| lease | future | lease | lease | future | lease | |||||||||||||||||||
| payments | periods | payments | payments | periods | payments | |||||||||||||||||||
| HK$’000 | HK$’000 | HK$’000 | HK$’000 | HK$’000 | HK$’000 | |||||||||||||||||||
| Within 1 year | 212 | 30 | 242 | 202 | 35 | 237 | ||||||||||||||||||
| After 1 year but within 2 years | 105 | 20 | 125 | 197 | 22 | 219 | ||||||||||||||||||
| After 2 years but within 5 years | 288 | 22 | 310 | 263 | 30 | 293 | ||||||||||||||||||
| After 5 years | — | — | — | 70 | 1 | 71 | ||||||||||||||||||
| 393 | 42 | 435 | 530 | 53 | 583 | |||||||||||||||||||
| 605 | 72 | 677 | 732 | 88 | 820 | |||||||||||||||||||
F-47
| 2012 | 2011 | |||||||||||||||||||||||
Present value of the minimum lease payments | Interest expense relating to future periods | Total minimum lease payments | Present value of the minimum lease payments | Interest expense relating to future periods | Total minimum lease payments | |||||||||||||||||||
| HK$’000 | HK$’000 | HK$’000 | HK$’000 | HK$’000 | HK$’000 | |||||||||||||||||||
Within 1 year | 85 | 10 | 95 | 105 | 20 | 125 | ||||||||||||||||||
|
|
|
|
|
|
|
|
|
|
|
| |||||||||||||
After 1 year but within 2 years | 90 | 5 | 95 | 105 | 14 | 119 | ||||||||||||||||||
After 2 years but within 5 years | 70 | 1 | 71 | 183 | 8 | 191 | ||||||||||||||||||
|
|
|
|
|
|
|
|
|
|
|
| |||||||||||||
| 160 | 6 | 166 | 288 | 22 | 310 | |||||||||||||||||||
|
|
|
|
|
|
|
|
|
|
|
| |||||||||||||
| 245 | 16 | 261 | 393 | 42 | 435 | |||||||||||||||||||
|
|
|
|
|
|
|
|
|
|
|
| |||||||||||||
| Notes to the consolidated cash flow statement |
| (a) | Reconciliation of profit before taxation to net cash inflow generated from operations |
| 2010 | 2009 | 2008 | ||||||||||
| HK$’000 | HK$’000 | HK$’000 | ||||||||||
| Profit before taxation | 259,545 | 251,559 | 108,372 | |||||||||
| Depreciation of owned fixed assets | 198,323 | 205,624 | 209,464 | |||||||||
| Depreciation of fixed assets held under finance lease | 706 | 617 | 587 | |||||||||
| Amortization of deferred expenditure | 48,621 | 53,160 | 33,777 | |||||||||
| Interest income | (11,372 | ) | (4,869 | ) | (15,596 | ) | ||||||
| Interest element of finance lease | 42 | 27 | 34 | |||||||||
| (Gain)/loss on disposal of fixed assets | (1,375 | ) | 1,016 | 1,431 | ||||||||
| Realized and unrealized gain on other financial assets | — | (189 | ) | (3,284 | ) | |||||||
| Realized gain on long term bank deposit | — | — | (1,185 | ) | ||||||||
| Realized loss on derivative financial instrument | — | — | 1,039 | |||||||||
| Equity settled share-based transactions | 5,347 | 4,768 | 4,204 | |||||||||
| Loss/(gain) on extinguishment of 10-year senior notes | 9,650 | (31,371 | ) | (2,582 | ) | |||||||
| Change in fair value of derivative financial instruments | 11,293 | — | — | |||||||||
| Interest, amortization and exchange difference on 10-year senior notes | 6,069 | 49,214 | 72,640 | |||||||||
| Interest on other borrowings | 3,260 | 885 | 3,428 | |||||||||
| Amortization of upfront cost on bank loans | 192 | — | — | |||||||||
| Interest expenses on bank loans | 1,379 | — | — | |||||||||
| Net cash inflow before working capital changes | 531,680 | 530,441 | 412,329 | |||||||||
| Decrease/(increase) in long-term receivable and prepayment | 917 | (505 | ) | 1,346 | ||||||||
| Decrease in accounts receivable, other receivables, deposits and prepayments | 738 | 33,052 | 6,914 | |||||||||
| Decrease in inventories | — | — | 477 | |||||||||
| Increase in deferred expenditure | (34,773 | ) | (46,525 | ) | (68,505 | ) | ||||||
| (Decrease)/increase in accounts payable, other payables, accrued charges and deposits received | (1,937 | ) | 17,419 | (12,567 | ) | |||||||
| (Decrease)/increase in deferred service revenue | (8,272 | ) | 4,621 | 46,247 | ||||||||
| Net cash inflow generated from operations | 488,353 | 538,503 | 386,241 | |||||||||
F-48
2012 HK$’000 | 2011 HK$’000 | 2010 HK$’000 | ||||||||||
Profit before taxation | 3,748,562 | 372,869 | 259,545 | |||||||||
Depreciation of owned fixed assets | 187,396 | 217,790 | 198,323 | |||||||||
Depreciation of fixed assets held under finance lease | 141 | 407 | 706 | |||||||||
Depreciation capitalized as programme costs | (1,632 | ) | — | — | ||||||||
Amortization of deferred expenditure | 29,902 | 37,873 | 48,621 | |||||||||
Intangible assets written off | 2,450 | — | — | |||||||||
Interest income | (17,241 | ) | (3,366 | ) | (11,372 | ) | ||||||
Interest element of finance lease | 19 | 30 | 42 | |||||||||
(Gain)/loss on disposal of fixed assets | (1,999 | ) | 1,008 | (1,375 | ) | |||||||
Equity settled share-based transactions | 10,480 | 4,652 | 5,347 | |||||||||
Valuation gains on investment property | (18,200 | ) | — | — | ||||||||
Gain on sale of discontinued operations | (3,520,088 | ) | — | — | ||||||||
Amortization of intangible assets | 5,217 | — | — | |||||||||
Loss on extinguishment of 10-year senior notes | — | — | 9,650 | |||||||||
Change in fair value of derivative financial instrument | (1,901 | ) | 271 | 11,293 | ||||||||
Interest, amortization and exchange difference on 10-year senior notes | — | — | 6,069 | |||||||||
Other borrowings costs | 3,763 | 3,473 | 3,260 | |||||||||
Amortization of upfront cost on long-term bank loan | — | 182 | 192 | |||||||||
Interest expenses on bank borrowings | — | 1,152 | 1,379 | |||||||||
Write-off of upfront costs upon settlement of long-term bank loan | — | 1,251 | — | |||||||||
|
|
|
|
|
| |||||||
Net cash inflow before working capital changes | 426,869 | 637,592 | 531,680 | |||||||||
(Increase)/decrease in long-term receivable and prepayment | (716 | ) | 1,073 | 917 | ||||||||
(Increase)/decrease in accounts receivable, other receivables, deposits and prepayments | (108,169 | ) | 26,543 | 738 | ||||||||
Increase in programme costs | (85,985 | ) | — | — | ||||||||
Increase in deferred expenditure | (22,245 | ) | (46,896 | ) | (34,773 | ) | ||||||
Decrease in accounts payable, other payables, accrued charges and deposits received | (19,181 | ) | (9,490 | ) | (1,937 | ) | ||||||
Decrease in deferred service revenue | (5,646 | ) | (19,911 | ) | (8,272 | ) | ||||||
|
|
|
|
|
| |||||||
Net cash inflow generated from operations | 184,927 | 588,911 | 488,353 | |||||||||
|
|
|
|
|
| |||||||
| (b) | Analysis of |
| Share capital | ||||||||||||
| (including share | Obligations | |||||||||||
| premium and | under finance | 10-year | ||||||||||
| capital reserve) | leases | senior notes | ||||||||||
| HK$’000 | HK$’000 | HK$’000 | ||||||||||
| Balance at September 1, 2007 | 702,192 | 1,210 | 952,593 | |||||||||
| Share issued upon exercise of share options | 14,998 | — | — | |||||||||
| Share issued in respect of scrip dividend | 33,398 | — | — | |||||||||
| Repayment of capital element of finance lease | — | (834 | ) | — | ||||||||
| Repurchase of 10-year senior notes | — | — | (269,399 | ) | ||||||||
| Gain on extinguishment of 10-year senior notes | — | — | (2,582 | ) | ||||||||
| Amortization of incidental issuance costs | — | — | 1,665 | |||||||||
| Equity settled share-based transactions | 4,204 | — | — | |||||||||
| Effect of foreign exchange rate changes | — | — | 965 | |||||||||
| Balance at August 31, 2008 | 754,792 | 376 | 683,242 | |||||||||
| Balance at September 1, 2008 | 754,792 | 376 | 683,242 | |||||||||
| Share issued upon exercise of share options | 1,399 | — | — | |||||||||
| Repurchase and cancellation of ordinary shares | (7 | ) | — | — | ||||||||
| Share issued in respect of scrip dividend | 9,906 | — | — | |||||||||
| Purchase of fixed assets under finance lease | — | 494 | — | |||||||||
| Repayment of capital element of finance lease | — | (138 | ) | — | ||||||||
| Repurchase of 10-year senior notes | — | — | (485,829 | ) | ||||||||
| Gain on extinguishment of 10-year senior notes | — | — | (31,371 | ) | ||||||||
| Amortization of incidental issuance costs | — | — | 1,545 | |||||||||
| Equity settled share-based transactions | 4,768 | — | — | |||||||||
| Effect of foreign exchange rate changes | — | — | (5,001 | ) | ||||||||
| Balance at August 31, 2009 | 770,858 | 732 | 162,586 | |||||||||
| Balance at September 1, 2009 | 770,858 | 732 | 162,586 | |||||||||
| Share issued upon exercise of share options | 16,744 | — | — | |||||||||
| Shares issued upon placement | 379,612 | — | — | |||||||||
| Purchase of fixed assets under finance lease | — | 90 | — | |||||||||
| Repayment of capital element of finance lease | — | (217 | ) | — | ||||||||
| Repurchase and redemption of 10-year senior notes | — | — | (172,423 | ) | ||||||||
| Loss on extinguishment of 10-year senior notes | — | — | 9,650 | |||||||||
| Amortization of incidental issuance costs | — | — | 188 | |||||||||
| Equity settled share-based transactions | 5,347 | — | — | |||||||||
| Effect of foreign exchange rate changes | — | — | (1 | ) | ||||||||
| Balance at August 31, 2010 | 1,172,561 | 605 | — | |||||||||
F-49
Share capital (including share premium and capital reserve) HK$’000 | Obligations under finance leases HK$’000 | 10-year senior notes HK$’000 | Long-term bank loan HK$’000 | |||||||||||||
Balance at September 1, 2009 | 770,858 | 732 | 162,586 | — | ||||||||||||
Share issued upon exercise of share options | 16,744 | — | — | — | ||||||||||||
Share issued upon placement | 379,612 | — | — | — | ||||||||||||
Purchase of fixed assets under finance lease | — | 90 | — | — | ||||||||||||
Repayment of capital element of finance lease | — | (217 | ) | — | — | |||||||||||
Repurchase and redemption of 10-year senior notes | — | — | (172,423 | ) | — | |||||||||||
Loss on extinguishment of 10-year senior notes | — | — | 9,650 | — | ||||||||||||
Amortization of incidental issuance costs | — | — | 188 | — | ||||||||||||
Net proceeds from new bank loan | — | — | — | 123,375 | ||||||||||||
Amortization of upfront costs on long-term bank loan | — | — | — | 192 | ||||||||||||
Equity settled share-based transactions | 5,347 | — | — | — | ||||||||||||
Effect of foreign exchange rate changes | — | — | (1 | ) | — | |||||||||||
|
|
|
|
|
|
|
| |||||||||
Balance at August 31, 2010 | 1,172,561 | 605 | — | 123,567 | ||||||||||||
|
|
|
|
|
|
|
| |||||||||
Balance at September 1, 2010 | 1,172,561 | 605 | — | 123,567 | ||||||||||||
Share issued upon exercise of share options | 7,232 | — | — | — | ||||||||||||
Repayment of capital element of finance lease | — | (212 | ) | — | — | |||||||||||
Repayment of long-term bank loan | — | — | — | (125,000 | ) | |||||||||||
Write-off of upfront costs upon settlement of long-term bank loan | — | — | — | 1,251 | ||||||||||||
Amortization of upfront cost of bank loan | — | — | — | 182 | ||||||||||||
Equity settled share-based transactions | 4,652 | — | — | — | ||||||||||||
|
|
|
|
|
|
|
| |||||||||
Balance at August 31, 2011 | 1,184,445 | 393 | — | — | ||||||||||||
|
|
|
|
|
|
|
| |||||||||
Balance at September 1, 2011 | 1,184,445 | 393 | — | — | ||||||||||||
Share issued upon exercise of share options | 75,177 | — | — | — | ||||||||||||
Repayment of capital element of finance lease | — | (99 | ) | — | — | |||||||||||
Disposal of Telecom Business | — | (49 | ) | — | — | |||||||||||
Equity settled share-based transactions | 10,480 | — | — | — | ||||||||||||
Share options lapsed | (1,195 | ) | — | — | — | |||||||||||
|
|
|
|
|
|
|
| |||||||||
Balance at August 31, 2012 | 1,268,907 | 245 | — | — | ||||||||||||
|
|
|
|
|
|
|
| |||||||||
| Financial instruments |
Exposure to credit, liquidity and interest rate risks arises in the normal course of the Group’s business. These risks are limited by the Group’s financial management policies and practices described below.
| (a) | Credit risk | |
F-50
In respect of trade and other receivables, credit evaluations are performed on all customers requiring credit over a certain amount. These evaluations focus on the customer’s past history of making payments when due and current ability to pay, and take into account information specific to the customer as well as pertaining to the economic environment in which the customer locates. These receivables are due within 30 days from the date of billing. Customers with receivables that are more than 3 months overdue are requested to settle all outstanding balances before any further credit is granted. The Group generally does not obtain collateral from customers.
The Group’s exposure to credit risk is influenced mainly by individual characteristics of each customer. The default risk of the country in which customer locates also has an influence on credit risk but to a lesser extent. Concentrations of credit risk with respect to accounts receivable are limited due to the Group’s customer base being large and unrelated. As such, management does not expect any significant losses of accounts receivable that have not been provided for by way of allowances as disclosed in note 17.
Further quantitative disclosures in respect of the Group’s exposure to credit risk arising from accounts receivable are set out in note 17.
| (b) | Liquidity risk | |
| 2010 | 2009 | |||||||||||||||||||||||||||||||||||||||||||||||
| Total | More than | More than | Total | More than | More than | |||||||||||||||||||||||||||||||||||||||||||
| contractual | Within | 1 year but | 2 years but | contractual | Within | 1 year but | 2 years but | |||||||||||||||||||||||||||||||||||||||||
| Carrying | undiscounted | 1 year or | less than | less than | More than | Carrying | undiscounted | 1 year or | less than | Less than | More than | |||||||||||||||||||||||||||||||||||||
| amount | cash flow | on demand | 2 years | 5 years | 5 years | amount | cash flow | on demand | 2 years | 5 years | 5 years | |||||||||||||||||||||||||||||||||||||
| HK$’000 | HK$’000 | HK$’000 | HK$’000 | HK$’000 | HK$’000 | HK$’000 | HK$’000 | HK$’000 | HK$’000 | HK$’000 | HK$’000 | |||||||||||||||||||||||||||||||||||||
Current liabilities | ||||||||||||||||||||||||||||||||||||||||||||||||
| Bank overdrafts - unsecured | 10,490 | 10,490 | 10,490 | — | — | — | 5,364 | 5,364 | 5,364 | — | — | — | ||||||||||||||||||||||||||||||||||||
| Accounts payable | 35,128 | 35,128 | 35,128 | — | — | — | 37,555 | 37,555 | 37,555 | — | — | — | ||||||||||||||||||||||||||||||||||||
| Other payables and accrued charges | 195,931 | 195,931 | 195,931 | — | — | — | 206,487 | 206,487 | 206,487 | — | — | — | ||||||||||||||||||||||||||||||||||||
| Deposits received | 21,822 | 21,822 | 21,822 | — | — | — | 16,385 | 16,385 | 16,385 | — | — | — | ||||||||||||||||||||||||||||||||||||
| Obligations under finance leases | 212 | 242 | 242 | — | — | — | 202 | 237 | 237 | — | — | — | ||||||||||||||||||||||||||||||||||||
| Tax payable | 1,533 | 1,533 | 1,533 | — | — | — | 1,993 | 1,993 | 1,993 | — | — | — | ||||||||||||||||||||||||||||||||||||
Non-current liabilities | ||||||||||||||||||||||||||||||||||||||||||||||||
| Long-term bank loan | 123,567 | 133,996 | 1,829 | 2,166 | 130,001 | — | — | — | — | — | — | — | ||||||||||||||||||||||||||||||||||||
| Derivative financial instrument | 11,293 | 11,435 | 4,580 | 3,441 | 3,414 | — | — | — | — | — | — | — | ||||||||||||||||||||||||||||||||||||
| 10-year senior notes | — | — | — | — | — | — | 162,586 | 244,117 | 14,489 | 14,489 | 43,467 | 171,672 | ||||||||||||||||||||||||||||||||||||
| Obligations under finance leases | 393 | 435 | — | 125 | 310 | — | 530 | 583 | — | 219 | 293 | 71 | ||||||||||||||||||||||||||||||||||||
| 400,369 | 411,012 | 271,555 | 5,732 | 133,725 | — | 431,102 | 512,721 | 282,510 | 14,708 | 43,760 | 171,743 | |||||||||||||||||||||||||||||||||||||
F-51
The Group determines that there is no significant liquidity risk in view of our adequate funds and unutilized banking facilities.
The following table details the remaining contractual maturities at the balance sheet date of the Group’s financial liabilities, which are based on undiscounted cash flows (including interest) and the earliest date the Group can be required to pay.
| 2012 | 2011 | |||||||||||||||||||||||||||||||||||||||
Carrying amount HK$’000 | Total contractual undiscounted cash flow HK$’000 | Within 1 year or on demand HK$’000 | More than 1 year but less than 2 years HK$’000 | More than 2 years but less than 5 years HK$’000 | Carrying amount HK$’000 | Total contractual undiscounted cash flow HK$’000 | Within 1 year or on demand HK$’000 | More than 1 year but less than 2 years HK$’000 | More than 2 years but Less than 5 years HK$’000 | |||||||||||||||||||||||||||||||
Current liabilities | ||||||||||||||||||||||||||||||||||||||||
Bank overdrafts - unsecured | 3,026 | 3,026 | 3,026 | — | — | 845 | 845 | 845 | — | — | ||||||||||||||||||||||||||||||
Accounts payable | 5,371 | 5,371 | 5,371 | — | — | 17,419 | 17,419 | 17,419 | — | — | ||||||||||||||||||||||||||||||
Other payables and accrued charges | 31,118 | 31,118 | 31,118 | — | — | 209,585 | 209,585 | 209,585 | — | — | ||||||||||||||||||||||||||||||
Deposits received | 2,259 | 2,259 | 2,259 | — | — | 26,969 | 26,969 | 26,969 | — | — | ||||||||||||||||||||||||||||||
Obligations under finance leases | 85 | 95 | 95 | — | — | 105 | 125 | 125 | — | — | ||||||||||||||||||||||||||||||
Non-current liabilities | ||||||||||||||||||||||||||||||||||||||||
Derivative financial instrument | 9,663 | 10,060 | 4,619 | 4,174 | 1,267 | 11,564 | 12,590 | 4,716 | 4,000 | 3,874 | ||||||||||||||||||||||||||||||
Obligations under finance leases | 160 | 166 | — | 95 | 71 | 288 | 310 | — | 119 | 191 | ||||||||||||||||||||||||||||||
|
|
|
|
|
|
|
|
|
|
|
|
|
|
|
|
|
|
|
| |||||||||||||||||||||
| 51,682 | 52,095 | 46,488 | 4,269 | 1,338 | 266,775 | 267,843 | 259,659 | 4,119 | 4,065 | |||||||||||||||||||||||||||||||
|
|
|
|
|
|
|
|
|
|
|
|
|
|
|
|
|
|
|
| |||||||||||||||||||||
| (c) | Interest rate risk | |
| 2010 | 2009 | |||||||||||||||
| Effective | Effective | |||||||||||||||
| interest | interest | |||||||||||||||
| rate | rate | |||||||||||||||
| % | HK$’000 | % | HK$’000 | |||||||||||||
Fixed rate borrowings: | ||||||||||||||||
| 10-year senior notes | — | — | 9.2 | 162,586 | ||||||||||||
| Obligations under finance leases | 5.6 | 605 | 5.6 | 732 | ||||||||||||
| 605 | 163,318 | |||||||||||||||
Floating rate borrowings: | ||||||||||||||||
| Bank overdrafts — unsecured | 5.3 | 10,490 | 5.3 | 5,364 | ||||||||||||
| Long-term bank loan | 1.7 | 123,567 | — | — | ||||||||||||
The Group’s interest-rate risk arose mainly from the 5-year interest rate swap contract with a HK$175,000,000 notional amount as at August 31, 2012 and 2011. The Group will pay a fixed rate interest on the notional amount on a quarterly basis, and receive a floating interest rate at HIBOR rate.
Sensitivity analysis
The Group’s profit attributable to shareholders would increase by approximately HK$1,750,000 (2011: HK$1,750,000) in response to a 100 basis-points increase in market interest rates applicable as at August 31, 2012, with all other variables held constant. The analysis performed including the effect of the Group’s interest rate swap contract as disclosed in note 23 to the financial statements.
F-52
| (d) | Foreign currency risk | |
| 2010 | 2009 | |||||||||||||||||||||||
| United | United | |||||||||||||||||||||||
| States | Japanese | Canadian | States | Japanese | Canadian | |||||||||||||||||||
| Dollars | Yen | Dollars | Dollars | Yen | Dollars | |||||||||||||||||||
| ‘000 | ‘000 | ‘000 | ‘000 | ‘000 | ‘000 | |||||||||||||||||||
| Cash at bank and in hand and pledged bank deposits | 30,443 | 591 | 435 | 11,599 | 696 | 282 | ||||||||||||||||||
| Bank overdrafts — unsecured | (294 | ) | — | — | (161 | ) | — | — | ||||||||||||||||
| Accounts payable | (1,350 | ) | — | — | (3,183 | ) | — | — | ||||||||||||||||
| Other payables and accrued charges | (1,075 | ) | — | — | (390 | ) | — | — | ||||||||||||||||
| 10-year senior notes | — | — | — | (20,979 | ) | — | — | |||||||||||||||||
| Overall net exposure | 27,724 | 591 | 435 | (13,114 | ) | 696 | 282 | |||||||||||||||||
All the Group’s monetary assets and liabilities are primarily denominated in either Hong Kong dollars or United States dollars. Given the exchange rate of the Hong Kong dollar to the U.S. dollar has remained close to the current pegged rate of HKD7.80 = USD1.00 since 1983, management does not expect significant foreign exchange gains or losses between the two currencies. The Group did not have significant foreign currency risk at the balance sheet date.
F-53
| (e) | Fair values | |
Financial instrument carried at fair value
The following table presents the carrying value of financial instrument measured at fair value at the balance sheet date across the three levels of the fair value hierarchy defined in IFRS 7,Financial Instruments: Disclosures , with the fair value of each financial instrument categorized in its entirety based on the lowest level of input that is significant to that fair value measurement. The levels are defined as follows:
Level 1 (highest level): fair values measured using quoted prices (unadjusted) in active markets for identical financial instruments
Level 2: fair values measured using quoted prices in active markets for similar financial instruments, or using valuation techniques in which all significant inputs are directly or indirectly based on observable market data
Level 3 (lowest level): fair values measured using valuation techniques in which any significant input is not based on observable market data
2012
Level 1 HK$’000 | Level 2 HK$’000 | Level 3 HK$’000 | Total HK$’000 | |||||||||||||
Liability | ||||||||||||||||
Derivative financial instrument: | ||||||||||||||||
- Interest rate swap | — | 9,663 | — | 9,663 | ||||||||||||
|
|
|
|
|
|
|
| |||||||||
2011
Level 1 HK$’000 | Level 2 HK$’000 | Level 3 HK$’000 | Total HK$’000 | |||||||||||||
Liability | ||||||||||||||||
Derivative financial instrument: | ||||||||||||||||
- Interest rate swap | — | 11,564 | — | 11,564 | ||||||||||||
|
|
|
|
|
|
|
| |||||||||
| Level 1 | Level 2 | Level 3 | Total | |||||||||||||
| HK$’000 | HK$’000 | HK$’000 | HK$’000 | |||||||||||||
Liability | ||||||||||||||||
| Derivative financial instrument: | ||||||||||||||||
| - Interest rate swap | — | 11,293 | — | 11,293 | ||||||||||||
| 2010 | 2009 | |||||||||||||||
| Carrying | Carrying | |||||||||||||||
| amount | Fair value | amount | Fair value | |||||||||||||
| HK$’000 | HK$’000 | HK$’000 | HK$’000 | |||||||||||||
| The Group | ||||||||||||||||
| 10-year senior notes | — | — | 162,586 | 157,285 | ||||||||||||
| (f) | Estimation of fair values | |
Fair value of financial instruments is estimated as follows:
| (i) | |||
| Trade receivables less impairment provision and account payables are assumed to approximate their fair values. | |||
| (ii) | The fair value of the interest rate swap is determined based on the discounted cash flow technique which takes into account estimated amount that the Group would receive or pay to terminate the swap at the balance sheet date, taking into account current interest rates and the current creditworthiness of the swap counterparties. Where discounted cash flow techniques are used, estimated future cash flows are based on management’s best estimates and the discount rate is a market related rate for a similar instrument at the balance sheet date. |
F-54
| Contingent liabilities |
| 2010 | 2009 | |||||||
| HK$’000 | HK$’000 | |||||||
| Bank guarantees provided to suppliers (notes 27(i) and (ii)) | 2,770 | 2,490 | ||||||
| Bank guarantee in lieu of payment of utility deposits (note 27(iii)) | 5,572 | 5,272 | ||||||
| 8,342 | 7,762 | |||||||
2012 HK$’000 | 2011 HK$’000 | |||||||
Bank guarantees provided to suppliers | — | 1,330 | ||||||
Bank guarantee in lieu of payment of utility deposits | 1,950 | 5,572 | ||||||
|
|
|
| |||||
| 1,950 | 6,902 | |||||||
|
|
|
| |||||
At August 31, 2012, HK$1,950,000 (2011: HK$6,902,000) of the HK$23,260,000 (2011: HK$38,900,000) total banking facility was utilized by the Company and the subsidiaries.
| 28 |
| (a) | Capital commitments |
| 2010 | 2009 | |||||||
| HK$’000 | HK$’000 | |||||||
| Purchase of telecommunications, computer and office equipment - - contracted but not provided for | 132,340 | 150,099 | ||||||
2012 HK$’000 | 2011 HK$’000 | |||||||
Purchase of telecommunications, computer and office equipment | ||||||||
- contracted but not provided for | 4,958 | 141,432 | ||||||
|
|
|
| |||||
Construction of multimedia production and distribution center | ||||||||
- authorized but not contracted for | 827,401 | 600,000 | ||||||
- contracted but not provided for | 41,659 | — | ||||||
|
|
|
| |||||
Others | ||||||||
- contracted but not provided for | — | 5,000 | ||||||
|
|
|
| |||||
| (b) | Commitments under operating leases | |
| 2010 | 2009 | |||||||
| HK$’000 | HK$’000 | |||||||
| Leases in respect of land and buildings which are payable: | ||||||||
| - Within 1 year | 24,873 | 21,387 | ||||||
| - After 1 year but within 5 years | 16,417 | 13,802 | ||||||
| 41,290 | 35,189 | |||||||
| Leases in respect of telecommunications facilities and computer equipment which are payable | ||||||||
| - Within 1 year | 63,948 | 45,321 | ||||||
| - After 1 year but within 5 years | 14,200 | 9,600 | ||||||
| - After 5 years | 4,849 | 6,271 | ||||||
| 82,997 | 61,192 | |||||||
| 124,287 | 96,381 | |||||||
At August 31, 2012 and 2011, the Group has future aggregate minimum lease payments under non-cancellable operating leases as follows:
2012 HK$’000 | 2011 HK$’000 | |||||||
Leases in respect of land and buildings which are payable: | ||||||||
- Within 1 year | 5,373 | 27,679 | ||||||
- After 1 year but within 5 years | 2,294 | 20,642 | ||||||
|
|
|
| |||||
| 7,667 | 48,321 | |||||||
|
|
|
| |||||
Leases in respect of telecommunications facilities and computer equipment which are payable | ||||||||
- Within 1 year | — | 63,300 | ||||||
- After 1 year but within 5 years | — | 17,103 | ||||||
- After 5 years | — | 3,211 | ||||||
|
|
|
| |||||
| — | 83,614 | |||||||
|
|
|
| |||||
| 7,667 | 131,935 | |||||||
|
|
|
| |||||
| (c) | ||
| 2010 | 2009 | |||||||
| HK$’000 | HK$’000 | |||||||
| Program fee in respect of program rights which are payable: | ||||||||
| - Within 1 year | 25,539 | 9,094 | ||||||
| - After 1 year but within 5 years | 48,087 | 6,238 | ||||||
| 73,626 | 15,332 | |||||||
F-55
2012 HK$’000 | 2011 HK$’000 | |||||||
Programme fee in respect of programme rights which are payable: | ||||||||
- Within 1 year | 96,613 | 25,777 | ||||||
- After 1 year but within 5 years | 106,669 | 27,197 | ||||||
|
|
|
| |||||
| 203,282 | 52,974 | |||||||
|
|
|
| |||||
| Material related party transactions |
In addition to the transactions and balances disclosed elsewhere in these financial statements, the Group entered into the following material related party transactions.
Key management personnel remuneration
Remuneration for key management personnel, including amounts paid to the Company’s Directors as disclosed in note 10(a) and certain of the highest paid Talents as disclosed in note 10(b), is as follows:
2012 HK$’000 | 2011 HK$’000 | 2010 HK$’000 | ||||||||||
Short-term Talent benefits | 176,852 | 35,979 | 40,716 | |||||||||
Post-employment benefits | 2,488 | 2,616 | 2,725 | |||||||||
Equity compensation benefits | 9,546 | 4,652 | 5,347 | |||||||||
|
|
|
|
|
| |||||||
| 188,886 | 43,247 | 48,788 | ||||||||||
|
|
|
|
|
| |||||||
| 30 | ||
| 2010 | 2009 | |||||||
| HK$’000 | HK$’000 | |||||||
| Short-term Talent benefits | 40,716 | 34,687 | ||||||
| Post-employment benefits | 2,725 | 2,614 | ||||||
| Equity compensation benefits | 5,347 | 4,071 | ||||||
| 48,788 | 41,372 | |||||||
F-56
| Accounting estimates and judgments |
Key sources of estimation uncertainty
Note 11, 13 and 26 contain information about the assumptions and risk factors relating to fair value of share options, investment property and financial instruments. Other key sources of estimation uncertainty are as follows:
| (a) | ||
If circumstances indicate that the carrying amount of programmes cost may not be fully recovered, provision for programme cost to write down the amount to net realizable values is recognized as an expense in the period the write down occurs.
| (b) | Impairment | |
F-57If circumstances indicate that the carrying value of property, plant and equipment and intangible assets may not be fully recoverable, these assets may be considered impaired, and an impairment loss may be recognized in accordance with IAS 36,Impairment of assets. In assessing whether there is any indication that an asset may be impaired, the Group considers all readily available information from both internal and external source. When there is adverse change in circumstance, additional impairment may be required.
| Possible impact of amendments, new standards and interpretations issued but not yet effective for the year ended August 31, |
Up to the date of issue of these financial statements, the IASB has issued a number of amendments, new standards and interpretations which are not yet effective for the year ended August 31, 2012 and which have not been adopted in these financial statements.
Effective for | ||||||
accounting periods | ||||||
beginning on or after | ||||||
Amendments to IAS 1 | Presentation of financial statements -Presentation of items of other comprehensive income | |||||
| July 1, | ||||||
| 2012 | ||||||
IFRS 10 | ||||||
Consolidated financial statement | January 1, | |||||
| 2013 | ||||||
IFRS 12 | Disclosure of interest in other entities | |||||
| January 1, 2013 | ||||||
F-58
F-59
| City | ||||||||||||||||||||
| Telecom | Non- | |||||||||||||||||||
| (H.K.) | Guarantor | guarantor | Eliminating | Consolidated | ||||||||||||||||
| Limited | subsidiaries | subsidiary | entries | total | ||||||||||||||||
| HK$’000 | HK$’000 | HK$’000 | HK$’000 | HK$’000 | ||||||||||||||||
Non-current assets | ||||||||||||||||||||
| Investments in subsidiaries (note) | 1,258,726 | 228,875 | — | (1,487,601 | ) | — | ||||||||||||||
| Goodwill | — | — | — | 1,066 | 1,066 | |||||||||||||||
| Fixed assets | 74,688 | 1,221,172 | 6,520 | 1,302,380 | ||||||||||||||||
| Long term receivable and prepayment | — | 16,573 | — | (10,482 | ) | 6,091 | ||||||||||||||
| Deferred expenditure | — | 12,786 | — | 12,786 | ||||||||||||||||
| 1,333,414 | 1,479,406 | 6,520 | 1,322,323 | |||||||||||||||||
Current assets | ||||||||||||||||||||
| Accounts receivable | 9,220 | 110,972 | — | 120,192 | ||||||||||||||||
| Other receivables, deposits and prepayments | 3,393 | 67,584 | 2,492 | (3,704 | ) | 69,765 | ||||||||||||||
| Deferred expenditure | — | 36,674 | — | 36,674 | ||||||||||||||||
| Pledged bank deposits | 15,038 | — | — | 15,038 | ||||||||||||||||
| Cash at bank and in hand | 120,315 | 78,665 | 27,436 | 226,416 | ||||||||||||||||
| 147,966 | 293,895 | 29,928 | 468,085 | |||||||||||||||||
Current liabilities | ||||||||||||||||||||
| Bank overdrafts — unsecured | 896 | 4,468 | — | 5,364 | ||||||||||||||||
| Amounts due to subsidiaries/ fellow subsidiaries | 10,830 | 905,460 | 4,427 | (920,717 | ) | — | ||||||||||||||
| Accounts payable | 20,484 | 17,071 | — | 37,555 | ||||||||||||||||
| Other payables and accrued charges | 23,530 | 172,676 | 10,281 | 206,487 | ||||||||||||||||
| Deposits received | 7,886 | 8,499 | — | 16,385 | ||||||||||||||||
| Deferred service revenue | 10,848 | 107,904 | — | (3,682 | ) | 115,070 | ||||||||||||||
| Tax payable | 356 | 496 | 1,141 | 1,993 | ||||||||||||||||
| Current portion — obligation under finance leases | 193 | 9 | — | 202 | ||||||||||||||||
| 75,023 | 1,216,583 | 15,849 | 383,056 | |||||||||||||||||
Net current assets/(liabilities) | 72,943 | (922,688 | ) | 14,079 | 85,029 | |||||||||||||||
F-60
| City | ||||||||||||||||||||
| Telecom | Non- | |||||||||||||||||||
| (H.K.) | Guarantor | guarantor | Eliminating | Consolidated | ||||||||||||||||
| Limited | subsidiaries | subsidiary | entries | total | ||||||||||||||||
| HK$’000 | HK$’000 | HK$’000 | HK$’000 | HK$’000 | ||||||||||||||||
Total assets less current liabilities | 1,406,357 | 556,718 | 20,599 | 1,407,352 | ||||||||||||||||
Non-current liabilities | ||||||||||||||||||||
| Deferred tax liabilities | 7,047 | 8,662 | — | 15,709 | ||||||||||||||||
| Long-term deferred service revenue | 10,535 | — | — | (10,535 | ) | — | ||||||||||||||
| Long-term debt and other liabilities | 163,108 | 8 | — | 163,116 | ||||||||||||||||
| 180,690 | 8,670 | — | 178,825 | |||||||||||||||||
Net assets | 1,225,667 | 548,048 | 20,599 | 1,228,527 | ||||||||||||||||
Capital and reserves | ||||||||||||||||||||
| Share capital | 66,418 | 15,485 | 8,131 | (23,616 | ) | 66,418 | ||||||||||||||
| Reserves | 1,159,249 | 532,563 | 12,468 | (542,171 | ) | 1,162,109 | ||||||||||||||
| Total equity attributable to equity shareholders of the Company | 1,225,667 | 548,048 | 20,599 | 1,228,527 | ||||||||||||||||
IFRS 13 | Fair value measurement | |||||
F-61
| City | ||||||||||||||||||||
| Telecom | Non- | |||||||||||||||||||
| (H.K.) | Guarantor | guarantor | Eliminating | Consolidated | ||||||||||||||||
| Limited | subsidiaries | subsidiary | entries | Total | ||||||||||||||||
| HK$’000 | HK$’000 | HK$’000 | HK$’000 | HK$’000 | ||||||||||||||||
| Revenue | 95,386 | 1,390,697 | 142,603 | (150,447 | ) | 1,478,239 | ||||||||||||||
| Network costs | (29,973 | ) | (177,655 | ) | — | 32,499 | (175,129 | ) | ||||||||||||
| Other operating expenses | (90,557 | ) | (959,960 | ) | (136,750 | ) | 149,303 | (1,037,964 | ) | |||||||||||
| Other income, net | 108,933 | 31,684 | 576 | (99,653 | ) | 41,540 | ||||||||||||||
| Finance costs | (54,241 | ) | (69,017 | ) | — | 68,131 | (55,127 | ) | ||||||||||||
| Share of net profit from subsidiaries (note) | 185,391 | — | — | (185,391 | ) | — | ||||||||||||||
| Profit before taxation | 214,939 | 215,749 | 6,429 | 251,559 | ||||||||||||||||
| Income tax expense | (2,110 | ) | (34,998 | ) | (1,622 | ) | (38,730 | ) | ||||||||||||
| Net profit | 212,829 | 180,751 | 4,807 | 212,829 | ||||||||||||||||
IAS 27 | Separate financial statements (2011) | |||||
| City | ||||||||||||||||||||
| Telecom | Non- | |||||||||||||||||||
| (H.K.) | Guarantor | guarantor | Eliminating | Consolidated | ||||||||||||||||
| Limited | subsidiaries | subsidiary | entries | Total | ||||||||||||||||
| HK$’000 | HK$’000 | HK$’000 | HK$’000 | HK$’000 | ||||||||||||||||
| Revenue | 116,130 | 1,283,296 | 135,374 | (231,819 | ) | 1,302,981 | ||||||||||||||
| Network costs | (28,398 | ) | (184,851 | ) | — | 34,882 | (178,367 | ) | ||||||||||||
| Other operating expenses | (87,551 | ) | (978,990 | ) | (130,481 | ) | 230,928 | (966,094 | ) | |||||||||||
| Other income, net | 93,494 | 37,752 | 1,336 | (107,593 | ) | 24,989 | ||||||||||||||
| Finance costs | (71,702 | ) | (71,753 | ) | — | 68,318 | (75,137 | ) | ||||||||||||
| Share of net profit from subsidiaries (note) | 108,154 | — | — | (108,154 | ) | — | ||||||||||||||
| Profit before taxation | 130,127 | 85,454 | 6,229 | 108,372 | ||||||||||||||||
| Income tax (expense)/benefit | (4,937 | ) | 26,306 | (4,551 | ) | 16,818 | ||||||||||||||
| Net profit | 125,190 | 111,760 | 1,678 | 125,190 | ||||||||||||||||
Amendments to IFRS 7 | Financial instruments:Disclosures -Offsetting financial assets and financial liabilities | |||||
F-62
| City | ||||||||||||||||||||
| Telecom | Non- | |||||||||||||||||||
| (H.K.) | Guarantor | guarantor | Eliminating | Consolidated | ||||||||||||||||
| Limited | subsidiaries | subsidiary | entries | total | ||||||||||||||||
| HK$’000 | HK$’000 | HK$’000 | HK$’000 | HK$’000 | ||||||||||||||||
| Net cash inflow/(outflow) from operating activities | 487,691 | 88,243 | (38,930 | ) | (233 | ) | 536,771 | |||||||||||||
| Net cash inflow/(outflow) from investing activities | 101,605 | (276,843 | ) | (1,250 | ) | (176,488 | ) | |||||||||||||
| Net cash outflow from financing activities | (560,397 | ) | (895 | ) | — | (561,292 | ) | |||||||||||||
| Increase/(decrease) in cash at bank and in hand | 28,899 | (189,495 | ) | (40,180 | ) | (201,009 | ) | |||||||||||||
| Cash at bank in hand at September 1, 2008 | 90,386 | 263,386 | 67,838 | 421,610 | ||||||||||||||||
| Effects of foreign exchange rates changes | 134 | 306 | (222 | ) | 233 | 451 | ||||||||||||||
| Cash at bank and in hand at August 31, 2009 | 119,419 | 74,197 | 27,436 | 221,052 | ||||||||||||||||
| Analysis of the balances of cash and cash equivalent: | ||||||||||||||||||||
| Cash at bank and in hand | 120,315 | 78,665 | 27,436 | 226,416 | ||||||||||||||||
| Bank overdrafts — unsecured | (896 | ) | (4,468 | ) | — | (5,364 | ) | |||||||||||||
| 119,419 | 74,197 | 27,436 | 221,052 | |||||||||||||||||
F-63
Amendments to IAS 32 | Financial instruments:Presentation-Offsetting financial assets and financial liabilities | |||||
IFRS 9 | Financial instruments | January 1, 2015 | ||||
| City | ||||||||||||||||||||
| Telecom | Non- | |||||||||||||||||||
| (H.K.) | Guarantor | guarantor | Eliminating | Consolidated | ||||||||||||||||
| Limited | subsidiaries | subsidiary | entries | total | ||||||||||||||||
| HK$’000 | HK$’000 | HK$’000 | HK$’000 | HK$’000 | ||||||||||||||||
| Net cash inflow from operating activities | 193,028 | 128,939 | 59,866 | 158 | 381,991 | |||||||||||||||
| Net cash inflow/(outflow) from investing activities | 18,775 | (164,222 | ) | (2,303 | ) | (147,750 | ) | |||||||||||||
| Net cash outflow from financing activities | (341,813 | ) | (4,165 | ) | — | (345,978 | ) | |||||||||||||
| (Decrease)/increase in cash at bank and in hand | (130,010 | ) | (39,448 | ) | 57,563 | (111,737 | ) | |||||||||||||
| Cash at bank and in hand at September 1, 2007 | 220,531 | 303,227 | 9,136 | 532,894 | ||||||||||||||||
| Effects of foreign exchange rates changes | (135 | ) | (393 | ) | 1,139 | (158 | ) | 453 | ||||||||||||
| Cash at bank and in hand at August 31, 2008 | 90,386 | 263,386 | 67,838 | 421,610 | ||||||||||||||||
| Analysis of the balances of cash and cash equivalent: | ||||||||||||||||||||
| Cash at bank and in hand | 91,764 | 275,002 | 67,838 | 434,604 | ||||||||||||||||
| Bank overdrafts — unsecured | (1,378 | ) | (11,616 | ) | — | (12,994 | ) | |||||||||||||
| 90,386 | 263,386 | 67,838 | 421,610 | |||||||||||||||||
F-64The Group is in the process of making an assessment of what the impact of these amendments, new standards and new interpretations is expected to be in the period of initial application. So far the Group is not yet in a position to state whether they would have a significant impact on the Group’s results of operations and financial position.
SIGNATURE
| CITY TELECOM (H.K.) LIMITED | ||||||
| By: | ||||||
/s/ | To Wai Bing | |||||
| Name: | To Wai Bing | |||||
| Title: | Chief Executive Officer | |||||
| By: | ||||||
/s/ Wong Nga Lai, Alice | ||||||
| Name: | Wong Nga Lai, Alice | |||||
| Title: | Chief Financial Officer | |||||
Date: December 17, 2010
31, 2012