• | For 50% of the share subscription options granted, the performance condition states that the number of options finally granted is based on the average ROE of the Group. The average ROE is calculated by the Group from the consolidated balance sheet and statement of income of the Group for fiscal years 2011 and 2012. The acquisition rate is equal to zero if the average ROE is less than or equal to 7%, varies on a straight-line basis between 0% and 100% if the average ROE is more than 7% and less than 18%, and is equal to 100% if the average ROE is more than or equal to 18%. For 50% of the share subscription options granted, the performance condition states that the number of options finally granted is based on the average ROACE of the Group. The average ROACE is calculated by the Group from the consolidated balance sheet and statement of income of the Group for fiscal years 2011 and 2012. The acquisition rate is equal to zero if the average ROACE is less than or equal to 6%, varies on a straight-line basis between 0% and 100% if the average ROACE is more than 6% and less than 15%, and is equal to 100% if the average ROACE is more than or equal to 15%. 2010 share subscription option plan: The Board of Directors decided that, provided the presence condition within the Group is satisfied, the number of options finally granted to the Chairman and Chief Executive Officer will be subject to two performance conditions: For 50% of the share subscription options granted, the performance condition states that the number of | | options finally granted is based on the average ROE of the Group. The average ROE is calculated by the Group based on TOTAL’s consolidated balance sheet and statement of income for fiscal years 2010 and 2011. The acquisition rate is equal to zero if the average ROE is less than or equal to 7%, varies on a straight-line basis between 0% and 100% if the average ROE is more than 7% and less than 18%, and is equal to 100% if the average ROE is more than or equal to 18%. | | • | For 50% of the share subscription options granted, the performance condition states that the number of options finally granted is based on the average ROACE of the Group calculated based on TOTAL’s consolidated balance sheet and statement of income for fiscal years 2010 and 2011. The acquisition rate is equal to zero if the average ROACE is less than or equal to 6%, varies on a straight-line basis between 0% and 100% if the average ROACE is more than 6% and less than 15%; and is equal to 100% if the average ROACE is more than or equal to 15%. |
For 50% of the share subscription options granted, the performance condition states that the number of options finally granted is based on the average ROACE of the Group calculated based on TOTAL’s consolidated balance sheet and statement of income for fiscal years 2010 and 2011. The acquisition rate is equal to zero if the average ROACE is less than or equal to 6%, varies on a straight-line basis between 0% and 100% if the average ROACE is more than 6% and less than 15%, and is equal to 100% if the average ROACE is more than or equal to 15%. 2009 share subscription option plan: The Board of Directors decided that, provided the presence condition within the Group is satisfied, the number of options finally granted to the Chief Executive Officer will be subject to two performance conditions: For 50% of the share subscription options granted, the performance condition states that the number of options finally granted is based on the average ROE of the Group as published by TOTAL. The average ROE is calculated based on the Group’s consolidated balance sheet and statement of income for fiscal years 2009 and 2010. The acquisition rate is equal to zero if the average ROE is less than or equal to 7%, varies on a straight-line basis between 0% and 100% if the average ROE is more than 7% and less than 18%, and is equal to 100% if the average ROE is more than or equal to 18%. In addition,For 50% of the share subscription options granted, the performance condition states that the number of options granted is related to the average ROACE of the Group as published by TOTAL. The average ROACE is calculated based on the Group’s consolidated balance sheet and statement of income for fiscal years 2009 and 2010. The acquisition rate is equal to zero if the average ROACE is less than or equal to 6%, varies on a straight-line basis between 0% and 100% if the average ROACE is more than 6% and less than 15%, and is equal to 100% if the average ROACE is more than or equal to 15%. The acquisition rate applicable to the subscription options that were subject to the performance condition of the 2009 Plan was 100%. 2011 performance share plan:The Board of Directors decided that, provided the presence condition within the Group is satisfied, the number of shares finally granted to the Chairman and Chief Executive Officer will be subject to two performance conditions: For 50% of the shares granted, the performance condition states that the number of shares finally granted is based on the average ROE of the Group. The average ROE is calculated by the Group from the consolidated balance sheet and statement of income of the Group for fiscal years 2011 and 2012. The acquisition rate is equal to zero if the average ROE is less than or equal to 7%, varies on a straight-line basis between 0% and 100% if the average ROE is more than 7% and less than 18%, and is equal to 100% if the average ROE is more than or equal to 18%. For 50% of the shares granted, the performance condition states that the number of shares finally granted is based on the average ROACE of the Group. The average ROACE is calculated by the Group from the consolidated balance sheet and statement of income of the Group for fiscal years 2011 and 2012. The acquisition rate is equal to zero if the average ROACE is less than or equal to 6%, varies on a straight-line basis between 0% and 100% if the average ROACE is more than 6% and less than 15%, and is equal to 100% if the average ROACE is more than or equal to 15%. The Chairman and Chief Executive Officer was not awarded any performance shares as part of the plans in the period 2006 to 2010. Grants to employees Share subscription option plans 2011 share subscription option plan: The Board of Directors decided that, provided the presence condition within the Group is satisfied, for each grantee other than the Chairman and Chief Executive Officer, the options will be finally granted to the beneficiary provided that the performance condition is fulfilled. The performance condition states that the number of options finally granted is based on the average of the ROE of the Group. The average ROE is calculated by the Group from the consolidated balance sheet and statement of income of the Group for fiscal years 2011 and 2012. The acquisition rate: is equal to zero if the average ROE is less than or equal to 7%; varies on a straight-line basis between 0% and 100% if the average ROE is more than 7% and less than 18%; and is equal to 100% if the average ROE is more than or equal to 18%. 2010 share subscription option plan and provided that the continued employment condition is satisfied, theplan: The Board of Directors decided that:that, provided the presence condition within the Group was satisfied: for each grantee of up to 3,000 options, other than the Chairman and Chief Executive Officer, the options will be finally granted; for each grantee of more than 3,000 options and less than or equal to 50,000 options (other than the Chairman and Chief Executive Officer): | | • | For each grantee of up to 3,000 options, other than the Chairman and Chief Executive Officer, the options will be finally granted. | • | For each grantee of more than 3,000 options and less than or equal to 50,000 options (other than the Chairman and Chief Executive Officer): |
| | | | | – | | the first 3,000 options and two-thirds of the options in excess of this number will be finally granted to their beneficiary; |
| | – | | the outstanding options, that is one-third of the options in excess of the first 3,000 options, will be granted provided that the performance condition described below is fulfilled.fulfilled; |
for each grantee of more than 50,000 options, other than the Chairman and Chief Executive Officer: | | • | For each grantee of more than 50,000 options, other than the Chairman and Chief Executive Officer: |
| | | | | – | | the first 3,000 options, two-thirds of the options above the first 3,000 options and below the first 50,000 options, and one-third of the options in excess of the first 50,000 options, will be finally granted to their beneficiary; |
| | – | | the remaining options, that is one-third of the options above the first 3,000 options and below the first 50,000 options, and two-thirds of the options in excess of the first 50,000 options, will be finally granted provided that the performance condition is fulfilled. |
This condition states that the number of options finally granted is based on the average Return on Equity (ROE)ROE of the Group. The average ROE is calculated by the Group based on TOTAL’s consolidated balance sheet and statement of income for fiscal years 2010 and 2011. The acquisition rate: is equal to zero if the average ROE is less than or equal to 7%; | | • | is equal to zero if the average ROE is less than or equal to 7%; | • | varies on a straight-line basis between 0% and 100% if the average ROE is more than 7% and less than 18%; and | • | is equal to 100% if the average ROE is more than or equal to 18%. |
varies on a straight-line basis between 0% and 100% if the average ROE is more than 7% and less than 18%; and is equal to 100% if the average ROE is more than or equal to 18%. 2009 share subscription option plan:as part of the 2009 share subscription option plan, theThe Board of Directors decided that, provided that the continued employmentpresence condition is satisfied,within the number of options finally awarded to the Chief Executive Officer will be subject to two performance conditions: | | • | For 50% of the share subscription options granted, the performance condition states that the number of options finally granted is based on the average ROE of the Group as published by TOTAL. The average ROE is calculated based on the Group’s consolidated balance sheet and statement of incomeGroup was met, for fiscal years 2009 and 2010. The acquisition rate is equal to zero if the average ROE is less than or equal to 7%, varies on a straight-line basis between 0% and 100% if the average ROE is more than 7% and less than 18%, and is equal to 100% if the average ROE is more than or equal to 18%. | • | For 50% of the share subscription options granted, the performance condition states that the number of options granted is related to the average ROACE of the Group as published by TOTAL. The average ROACE is calculated based on the Group’s consolidated balance sheet and statement of income for fiscal years 2009 and 2010. The acquisition rate is equal to zero if the average ROACE is less than or equal to 6%, varies on a straight-line basis between 0% and 100% if the average ROACE is more than 6% and less than 15%; and is equal to 100% if the average ROACE is more than or equal to 15%. |
In addition, the Board of Directors decided that, provided that the continued employment condition is satisfied, for
92
each beneficiary, other than the Chief Executive Officer, of more than 25,000 options, one-third of the options granted in excess of this number will be finally granted subject to a performance condition. This condition is based on the average ROE of the Group as published by TOTAL. The average ROE is calculated based on the Group’s consolidated balance sheet and statement of income for fiscal years 2009 and 2010. The acquisition rate: is equal to zero if the average ROE is less than or equal to 7%; | | • | is equal to zero if the average ROE is less than or equal to 7%; | • | varies on a straight-line basis between 0% and 100% if the average ROE is more than 7% and less than 18%; and | • | is equal to 100% if the average ROE is more than or equal to 18%. |
2008 share subscription option plan:as part of the 2008 share subscription option plan, the Board decided that, provided that the continued employment condition is satisfied, for each beneficiary of more than 25,000 options, one-third of7% and less than 18%; and
is equal to 100% if the options granted in excess of this number be subject to a performance condition. This performance condition states that the number of options granted is based on the ROE of the Group. Theaverage ROE is calculated based on the consolidated accounts published by TOTAL and relatedmore than or equal to the fiscal year preceding the final grant. The acquisition rate:18%. | | • | is equal to zero if the ROE is less than or equal to 10%; | • | varies on a straight-line basis between 0% and 80% if the ROE is more than 10% and less than 18%; | • | varies on a straight-line basis between 80% and 100% if the ROE is more than or equal to 18% and less than 30%; and | • | is equal to 100% if the ROE is more than or equal to 30%. |
The acquisition rate applicable to the subscription options that were subject to the performance condition of the 2008 plan2009 Plan was 60%100%. Performance share plans 2011 performance share plan: The Board of Directors decided that, provided that the presence condition within the Group is satisfied, for executives officers(1) other than the Chairman and Chief Executive Officer, the number of shares finally granted will be subject to the performance condition set out below. This condition is based on the average ROE as published by the Group and calculated based on the Group’s consolidated balance sheet and statement of income for fiscal years 2011 and 2012. The acquisition rate: is equal to zero if the average ROE is less than or equal to 7%; varies on a straight-line basis between 0% and 100% if the average ROE is more than 7% and less than 18%; and is equal to 100% if the average ROE is more than or equal to 18%. | (1) | Executive officers, excluding the Chairman and Chief Executive Officer, are employees other than directors. |
Furthermore, the Board of Directors decided that, for each beneficiary (other than the Chairman and Chief Executive Officer and the executive officers) of more than 100 shares, the shares in excess of this number will be finally granted subject to a performance condition. This condition is based on the average ROE as published by the Group and calculated based on the Group’s consolidated balance sheet and statement of income for fiscal years 2011 and 2012. The acquisition rate: is equal to zero if the average ROE is less than or equal to 7%; varies on a straight-line basis between 0% and 100% if the average ROE is more than 7% and less than 18%; and is equal to 100% if the average ROE is more than or equal to 18%. 2010 performance share plan: The Board of Directors decided that, provided that the presence condition within the Group is satisfied, for each beneficiary of more than 100 shares, half of the shares in excess of this number will be finally granted subject to a performance condition. This condition is based on the average ROE calculated by the Group based on TOTAL’s consolidated balance sheet and statement of income for fiscal years 2010 and 2011. The acquisition rate: is equal to zero if the average ROE is less than or equal to 7%; varies on a straight-line basis between 0% and 100% if the average ROE is more than 7% and less than 18%; and is equal to 100% if the average ROE is more than or equal to 18%. 2009 performance share plan: The Board of Directors decided that, provided that the presence condition within the Group is satisfied, for each beneficiary of more than 100 shares, half of the shares in excess of this number will be finally granted subject to a performance condition. This condition is based on the average ROE of the Group as published by TOTAL. The average ROE is calculated based on the Group’s consolidated balance sheet and statement of income for fiscal years 2009 and 2010. The acquisition rate: is equal to zero if the average ROE is less than or equal to 7%; varies on a straight-line basis between 0% and 100% if the average ROE is more than 7% and less than 18%; and is equal to 100% if the average ROE is more than or equal to 18%. Due to the application of the performance condition, the acquisition rate was 100% for the 2009 Plan. In addition, the Board of Directors decided at its meeting of May 21, 2010 to implement a global free share plan intended for the Group’s employees, that is more than 100,000 employees. On June 30, 2010, rights to twenty-five free shares were granted to every employee. The shares are subject to a vesting period of two to four years depending on the case. The shares granted are not subject to any performance condition. They will be issued at the end of the vesting period. SUMMARY OF COMPENSATION, STOCK OPTIONS AND RESTRICTEDPERFORMANCE SHARES
AWARDED TO THE CHAIRMAN AND THE CHIEF EXECUTIVE OFFICER | | | | | | | | | | | For the year ended (€) | | 2010 | | | 2009 | | Thierry Desmarest | | | | | | | | | Chairman of the Board of Directors | | | | | | | | | (until May 21, 2010) | | | | | | | | | | | | | | | | | | | Compensation due for fiscal year(a) | | | 1,604,039 | | | | 1,971,852 | | | Value of options awarded | | | — | | | | — | | | Value of restricted shares awarded | | | — | | | | — | | | | | | | | | | | | Total | | | 1,604,039 | | | | 1,971,852 | | | | | | | | | | | | Christophe de Margerie
Chief Executive Officer | | | | | | | | | (until May 21, 2010) | | | | | | | | | Chairman and Chief Executive Officer | | | | | | | | | (since May 21, 2010) | | | | | | | | | | | | | | | | | | | Compensation due for fiscal year as Chief Executive Officer(a) | | | 1,030,359 | | | | 2,666,991 | | Compensation due for fiscal year as Chairman and Chief Executive Officer(a) | | | 1,977,763 | | | | — | | In-kind benefits(b) | | | 6,908 | | | | 6,780 | | Value of options awarded(c) | | | 1,387,200 | | | | 1,676,000 | | | Value of restricted shares awarded | | | — | | | | — | | | | | | | | | | | | Total | | | 4,402,230 | | | | 4,349,771 | | | | | | | | | | | |
| | | | | | | | | | For the year ended (€) | | 2011 | | | 2010 | | Christophe de Margerie Chairman and Chief Executive Officer (since May 21, 2010) | | | | | | | | | Compensation due for fiscal year as Chairman and Chief Executive Officer(a) | | | 3,030,000 | | | | 3,008,122 | | In-kind benefits(b) | | | 6,991 | | | | 6,908 | | Value of options awarded(c) | | | 702,400 | | | | 1,387,200 | | Value of performance shares awarded(d) | | | 437,440 | | | | — | | Total | | | 4,176,831 | | | | 4,402,230 | |
| (a) | | | (a) | | Compensation detailed in the table “— Compensationfollowing table. For the 2010 fiscal year, Mr. de Margerie received compensation of€1,030,359 as Chief Executive Officer for the period from January 1 to May 21, 2010, and compensation of€1,977,763 as Chairman and the Chief Executive Officer”.Officer for the period from May 22 to December 31, 2010. |
| (b) | | Mr. de Margerie has the use of a company car.car; he receives the health coverage provided for Group employees and is eligible for the life insurance plan open to the Group’s executive officers (see “— Pensions and other commitments”). |
| (c) | | Options awarded in 20102011 are detailed in the table “— Stock“Stock options awarded in 20102011 to the Chairman and the Chief Executive Officer”. The value of options awarded was calculated on the day when they were awarded using the Black-Scholes model based on the assumptions used for the consolidated accounts (see Note 25 to the Consolidated Financial Statement)Statements). |
93
| (d) | The value of performance shares was calculated on the day when they were awarded. |
COMPENSATION OF THE CHAIRMAN AND THE CHIEF EXECUTIVE OFFICEROFFICER’S COMPENSATION
| | | | | | | | | | | | | | | | | | | | | For the year ended 2010 | | | For the year ended 2009 | | | | | Amount
| | | Amount
| | | Amount
| | | Amount
| | | | | due for
| | | paid in
| | | due for
| | | paid in
| | | | | 2010 | | �� | 2010(a) | | | 2009 | | | 2009(a) | | Thierry Desmarest | | | | | | | | | | | | | | | | | Chairman of the Board of Directors | | | | | | | | | | | | | | | | | (until May 21, 2010) | | | | | | | | | | | | | | | | | | | | | | | | | | | | | | | | | | | | Fixed compensation | | | 428,763 | | | | 428,763 | | | | 1,100,000 | | | | 1,100,000 | | Variable compensation(b) | | | 322,644 | | | | 871,852 | | | | 871,852 | | | | 969,430 | | Extraordinary compensation(c) | | | 492,963 | | | | 492,963 | | | | — | | | | — | | Pension benefits(d) | | | 320,341 | | | | 320,341 | | | | — | | | | — | | Directors’ fees(e) | | | 39,328 | | | | 39,328 | | | | — | | | | — | | | In-kind benefits | | | — | | | | — | | | | — | | | | — | | | | | | | | | | | | | | | | | | | | Total | | | 1,604,039 | | | | 2,153,247 | | | | 1,971,852 | | | | 2,069,430 | | | | | | | | | | | | | | | | | | | | | | | | | | | | | | | | | | | | | | | | | For the year ended 2010 | | | For the year ended 2009 | | | | | Amount
| | | Amount
| | | Amount
| | | Amount
| | | | | due for
| | | paid in
| | | due for
| | | paid in
| | | | | 2010 | | | 2010(a) | | | 2009 | | | 2009(a) | | Christophe de Margerie | | | | | | | | | | | | | | | | | Chief Executive Officer | | | | | | | | | | | | | | | | | (until May 21, 2010) | | | | | | | | | | | | | | | | | Chairman and Chief Executive Officer | | | | | | | | | | | | | | | | | (since May 21, 2010) | | | | | | | | | | | | | | | | | | | | | | | | | | | | | | | | | | | | Fixed compensation | | | 1,426,452 | (f) | | | 1,426,452 | (f) | | | 1,310,000 | | | | 1,310,000 | | Variable compensation(g) | | | 1,581,670 | (h) | | | 1,356,991 | | | | 1,356,991 | | | | 1,552,875 | | | Extraordinary compensation | | | — | | | | — | | | | — | | | | — | | | Directors’ fees | | | — | | | | — | | | | — | | | | — | | In-kind benefits(i) | | | 6,908 | | | | 6,908 | | | | 6,780 | | | | 6,780 | | | | | | | | | | | | | | | | | | | | Total | | | 3,015,030 | | | | 2,790,351 | | | | 2,673,771 | | | | 2,869,655 | | | | | | | | | | | | | | | | | | | |
| | | | | | | | | | | | | | | | | | | | For the year ended 2011 | | | For the year ended 2010 | | | For the year ended (€) | | Amount due | | | Amount paid(a) | | | Amount due | | | Amount paid(a) | | Christophe de Margerie Chairman and Chief Executive Officer (since May 21, 2010) | | | | | | | | | | | | | | | | | Fixed compensation | | | 1,500,000 | | | | 1,500,000 | | | | 1,426,452 | (b) | | | 1,426,452 | (b) | Variable compensation(c) | | | 1,530,000 | | | | 1,581 670 | | | | 1,581,670 | (d) | | | 1,356,991 | | Extraordinary compensation | | | — | | | | — | | | | — | | | | — | | Directors’ fees | | | — | | | | — | | | | — | | | | — | | In-kind benefits(e) | | | 6,991 | | | | 6,991 | | | | 6,908 | | | | 6,908 | | Total | | | 3,036,991 | | | | 3,088,661 | | | | 3,015,030 | | | | 2,790,351 | |
| (a) | | | (a) | | Variable portion paid for prior fiscal year. | (b) | | The variable portion for For more detailed information about these criteria, see “— Compensation of the Chairman of the Board is calculated by taking into account the Group’s return on equity during the relevant fiscal year, the Group’s earnings compared to those of the other major international oil companies that are its competitors, as well as the Chairman of the Board’s personal contribution to the Group strategy, corporate governance and performance. The variable portion can reach a maximum amount of 100% of the fixed base salary. The objectives related to personal contribution were considered to be substantially fulfilled in 2010.Chief Executive Officer”. |
(c)(b) | | Retirement benefit received. | (d) | | Retirement benefit received in 2010 under the RECOSUP pension scheme and the defined supplementary pension plan. | (e) | | Directors’ fees received for the directorship after May 21, 2010; Mr. Desmarest did not receive any directors’ fees when serving in the position of Chairman of the Board. | (f) | | Includes a fixed portion of €507,097€507,097 for the period between January 1 and May 21, 2010 and €919,355€919,355 for the period between May 22 and December 31, 2010. |
(g)(c) | | The variable portion for the Chairman and Chief Executive Officer is calculated by taking into account the Group’s return on equity during the relevant fiscal year, the Group’s earnings compared to those of the other major international oil companies that are its competitors as well as the Chairman and Chief Executive Officer’s personal contribution based on operational target criteria. The variable portion can reach a maximum amount of 165% of the fixed base salary. The objectives related to personal contribution were considered to be mostly met in 2010.have been substantially fulfilled. |
(h)(d) | | Including a variable portion of €523,262€523,262 for the period between January 1 to May 21 2010, and €1,058,408€1,058,408 for the period between May 22 and December 31, 2010. |
(i)(e) | | Mr. de Margerie has the use of a company car.car, receives the health coverage provided for Group employees and is eligible for the life insurance plan open to the Group’s executive officers (see “— Pensions and other commitments”). |
94
DIRECTORS’ FEES AND OTHER COMPENSATION RECEIVED BY DIRECTORS Total compensation (including in-kind benefits) paid to each director in the year indicated (Article L.225-102-1 of the French Commercial Code, 1st1st and 2nd2nd paragraphs) | | | | | | | | | | | Gross amount (€) | | 2010 | | | 2009 | | | Christophe de Margerie | | | | (a) | | | | (a) | Thierry Desmarest(b) | | | | (a) | | | | (a) | Patrick Artus(b) | | | 55,000 | | | | 27,656 | | Patricia Barbizet(c) | | | 107,000 | | | | 94,192 | | | Daniel Bouton | | | 55,000 | | | | 60,000 | | Gunnar Brock(d) | | | 39,328 | | | | — | | Claude Clément(d) | | | 127,929 | (e) | | | — | | | Bertrand Collomb | | | 71,000 | | | | 75,000 | | | Paul Desmarais Jr. | | | 45,000 | | | | 48,000 | | | Bertrand Jacquillat | | | 95,000 | | | | 95,000 | | | Anne Lauvergeon | | | 45,000 | | | | 45,000 | | | Peter Levene of Portsoken | | | 79,000 | | | | 69,000 | | | Claude Mandil | | | 55,000 | | | | 55,000 | | | Michel Pébereau | | | 71,000 | | | | 70,000 | | | Thierry de Rudder | | | 142,000 | | | | 116,000 | | Serge Tchuruk(f) | | | 104,639 | (g) | | | 154,379 | (g) |
| | | | | | | | | | Gross amount (€) | | 2011 | | | 2010 | | Christophe de Margerie(a) | | | (b | ) | | | (b | ) | Thierry Desmarest (a)(b) | | | 639,854 | (d) | | | 1,604,039 | (d) | Patrick Artus(c) | | | 65,500 | | | | 55,000 | | Patricia Barbizet(a) | | | 115,500 | | | | 107,000 | | Daniel Bouton | | | 63,500 | | | | 55,000 | | Gunnar Brock(a)(e) | | | 75,500 | | | | 39,328 | | Claude Clément(e) | | | 156,365 | (f) | | | 127,929 | (f) | Marie-Christine Coisne-Roquette(g) | | | 48,460 | | | | — | | Bertrand Collomb | | | 72,500 | | | | 71,000 | | Paul Desmarais Jr. | | | 51,000 | | | | 45,000 | | Bertrand Jacquillat(h) | | | 55,040 | | | | 95,000 | | Barbara Kux(a)(i) | | | 26,770 | | | | — | | Anne Lauvergeon(a) | | | 63,500 | | | | 45,000 | | Peter Levene of Portsoken(j) | | | 19,230 | | | | 79,000 | | Claude Mandil(a) | | | 63,500 | | | | 55,000 | | Michel Pébereau | | | 77,500 | | | | 71,000 | | Thierry de Rudder(a) | | | 138,500 | | | | 142,000 | |
| (a) | Member of the Strategic Committee. |
| (b) | | (a) | | For Mr. Desmarest and the Chairman and Chief Executive Officer, see the summary compensation tables “— Summary“Summary of compensation, stock options and restrictedperformance shares awarded to the Chairman and the Chief Executive Officer” and “— Compensation of the“Chairman and Chief Executive Officer’s compensation”. The Chairman and the Chief Executive Officer”.Officer did not receive any directors’ fees. |
(b)(c) | | Member of the Compensation Committee since May 21, 2010. |
(c)(d) | | Including for 2011, fees received (Chairperson€77,500) and pension benefits received (€562,354), and including for 2010, fees received (€39,328), fixed and variable compensation for his role as Chairman of the Audit Committee since July 28, 2009.Board of Directors up to May 21, 2010 (€751,407), the retirement benefit (€492,963) and pension benefits received (€320,341). |
(d)(e) | | Director since May 21, 2010. |
(e)(f) | | Including for 2011, the directorsdirectors’ fees received, representing €32,328,€58,500, as well as the compensation received from Total Raffinage Marketing (a subsidiary of TOTAL S.A.), representing €95,601 in 2010.€97,865 and including for 2010, directors’ fees received, representing€32,328 as well as the compensation received from Total Raffinage Marketing, representing€95,601. |
(f)(g) | Director and member of the Audit Committee from May 13, 2011. |
| (h) | Director and member of the Audit Committee until May 13, 2011. |
| (i) | Director since May 13, 2011. |
| (j) | Director until May 21, 2010.13, 2011. | (g) | | Including pension payments related to previous employment by the Group, which amounted to €74,379 in 2009 and €74,914 in 2010. |
Over the past two years, the directors currently in office have not received any compensation or in-kind benefits from companies controlled by TOTAL S.A., except for Mr. Clément, who is an employee of Total Raffinage Marketing.Marketing, and Mr. Desmarest, Chairman of the Board of Directors until May 21, 2010. The compensation indicated in the table above (except for that of the Chairman and Chief Executive Officer and Messrs. Desmarest Clément and Tchuruk)Clément) consists solely of directors’ fees (gross amount) paid during the relevant period. None of the directors of TOTAL S.A. have service contracts whichlinking them to TOTAL S.A. or any of its subsidiaries that provide for benefits upon termination of employment.
95
STOCK OPTIONS AWARDED IN 20102011 TO THE CHAIRMAN AND
THE CHIEF EXECUTIVE OFFICER | | | | | | | | | | | | | | | | | | | | | | | | | | | | | | | | | | | | | | | | Number of options
| | | | | | | | | | | | | | | | | | | Value of
| | | awarded during
| | | Exercise
| | | Exercise
| | | Performance
| | | | Date of plan | | | Type of options | | | options (€)(a) | | | fiscal year(b) | | | price (€) | | | period | | | conditions | Thierry Desmarest | | | 2010 Plan | | | | Subscription | | | | — | | | | — | | | | — | | | | — | | | — | Chairman of the Board of Directors | | | 09/14/2010 | | | | options | | | | | | | | | | | | | | | | | | | | (until May 21, 2010) | | | | | | | | | | | | | | | | | | | | | | | | | | | | | | | | | | | | | | | | | | | | | | | | | | | | | | | Total | | | | | | | | | | | — | | | | — | | | | | | | | | | | | | | | | | | | | | | | | | | | | | | | | | | | | | | | | Christophe de Margerie | | | 2010 Plan
09/14/2010 | | | | Subscription
options | | | | 1,387,200 | | | | 240,000 | | | | 38.20 | | | | 09/15/2012
09/14/2018 | | | | Chief Executive Officer
(until May 21, 2010)
Chairman and Chief Executive Officer
(since May 21, 2010) | | | | | | | | | | | | | | | | | | | | | | | | | | For 50% of the options, the condition is based on the average ROE for the Group’s 2010 and 2011 fiscal years. | | | | | | | | | | | | | | | | | | | | | | | | | | | | | | | | | | | | | | | | | | | | | | | | | | | | | | | | For 50% of the options, the condition is based on the average ROACE for the Group’s 2010 and 2011 fiscal years. | | | | | | | | | | | | | | | | | | | | | | | | | | | | | Total | | | | | | | | | | | 1,387,200 | | | | 240,000 | | | | | | | | | | | | | | | | | | | | | | | | | | | | | | | | | | | | | | | |
The stock options awarded to the Chairman and Chief Executive Officer are detailed in the table “TOTAL stock options awarded to Mr. de Margerie, Chairman and Chief Executive Officer of TOTAL S.A.” below. | | | | | | | | | | | | | | | | | | | | | | | | | | | | Date of
Plan | | | Type of
options | | Value of
options
(€)(a) | | | Number of
options
awarded
during
fiscal year(b) | | | Exercise
price | | | Exercise
period | | | Performance
condition | | Christophe de Margerie | |
| 2011 Plan
09/14/2011 |
| | Subscription
options | | | 702,400 | | | | 160,000 | | | | 33.00 | | |
| 09/15/2013-
09/14/2019 |
| | For 50% of the options, the condition is based on the average ROE for the Group’s 2011 and 2012 fiscal years. For 50% of the options, the condition is based on the average ROACE for the Group’s 2011 and 2012 fiscal years. | Chairman and Chief Executive Officer | | | | | | | | | | | | | | | | | Total | | | | | | | | | 702,400 | | | | 160,000 | | | | | | | | | | | |
| (a) | | | (a) | | The value of options awarded was calculated on the day they were awarded using the Black-Scholes model based on the assumptions used for the consolidated accounts (see Note 25 to the Consolidated Financial Statement)Statements). |
| (b) | | As part of the share subscription option plan awarded on September 14, 2010,2011, the Board of Directors decided that, for the Chairman and Chief Executive Officer, the number of share subscription options finally that are likely to be exercised at the end of the two-year vesting period will be subject to performance conditions.conditions being met (see “— Grants to the Chairman and Chief Executive Officer”). |
STOCK OPTIONS EXERCISED IN 20102011 BY THE CHAIRMAN AND
THE CHIEF EXECUTIVE OFFICER | | | | | | | | | | | | | | | | | | | | Number of options
| | | | | | | | Date of plan
| | | exercised during
| | | Exercise
| | | | | (Grant date) | | | fiscal year | | | price (€) | | Thierry Desmarest | | | 2002 Plan | | | | 25,372 | | | | 39.03 | | Chairman of the Board of Directors | | | 07/09/2002 | | | | | | | | | | (until May 21, 2010) | | | | | | | | | | | | | | | | | | | | | | | | | | | Total | | | | | | | 25,372 | | | | | | | | | | | | | | | | | | | | Christophe de Margerie | | | — | | | | — | | | | — | | Chief Executive Officer | | | | | | | | | | | | | (until May 21, 2010) | | | | | | | | | | | | | Chairman and Chief Executive Officer | | | | | | | | | | | | | (since May 21, 2010) | | | | | | | | | | | | | | | | | | | | | | | | | | | Total | | | | | | | — | | | | | | | | | | | | | | | | | | | |
96
The stock options awarded to the Chairman and Chief Executive Officer are detailed in the table “TOTAL stock options awarded to Mr. de Margerie, Chairman and Chief Executive Officer of TOTAL S.A.” below. | | | | | | | | | | | | | | Date of Plan | | Number of options
exercised during
fiscal year | | | Exercise
price (€) | | Christophe de Margerie | | 2003 Plan | | | 113,576 | | | | 32.84 | | Chairman and Chief Executive Officer | | 07/16/2003 | | | | | | | | | Total | | | | | 113,576 | | | | | |
RESTRICTED SHARE GRANTSPERFORMANCE SHARES AWARDED IN 2010 FOR2011 TO THE CHAIRMAN
THE CHIEF EXECUTIVE OFFICER OR ANY DIRECTOR (CONDITIONAL GRANT) AND
| | | | | | | | | | | | | | | | | | | | | | | | | | | | | | Number of shares
| | | | | | | | | | | | | | | | | | | awarded during
| | | Value of
| | | Acquisition
| | | Availability
| | | Performance
| | | | Date of plan | | | fiscal year | | | shares (€) | | | date | | | date | | | condition | Thierry Desmarest | | | 2010 Plan | | | | — | | | | — | | | | — | | | | — | | | — | Chairman of the Board of Directors | | | 09/14/2010 | | | | | | | | | | | | | | | | | | | | (until May 21, 2010) | | | | | | | | | | | | | | | | | | | | | | | | | | | | | | | | | | | | | | | | | | | | | | | Christophe de Margerie | | | 2010 Plan | | | | — | | | | — | | | | — | | | | — | | | — | Chief Executive Officer | | | 09/14/2010 | | | | | | | | | | | | | | | | | | | | (until May 21, 2010) | | | | | | | | | | | | | | | | | | | | | | | Chairman and Chief Executive Officer | | | | | | | | | | | | | | | | | | | | | | | (since May 21, 2010) | | | | | | | | | | | | | | | | | | | | | | | | | | | | | | | | | | | | | | | | | | | | | | | Claude Clément | | | 2010 Plan | | | | 240 | | | | 35.03 | | | | 09/15/2012 | | | | 09/15/2014 | | | | Director representing employee shareholders | | | 09/14/2010 | | | | | | | | | | | | | | | | | | | Condition based on the Group’s average ROE for fiscal years 2010 and 2011(a) | | | | | 2010 Global
Plan | | | | 25 | | | | 32.70 | | | | 07/01/2012 | | | | 07/01/2014 | | | — | | | | | 06/30/2010 | | | | | | | | | | | | | | | | | | | | | | | | | | | | | | | | | | | | | | | | | | | | Total | | | | | | | 265 | | | | | | | | | | | | | | | | | | | | | | | | | | | | | | | | | | | | | | | |
| | | (a)
| | The performance condition applies to half of the shares awarded in excess of 100 shares. |
RESTRICTED SHARES FINALLY AWARDED IN 2010 FOR THE CHAIRMAN, THE CHIEF EXECUTIVE OFFICER OR ANY DIRECTOR
| | | | | | | | | | | | | | | | | | | | | | | | | | Date of
Plan | | | Number of
shares
awarded
during
fiscal year | | | Value of
shares (€)(a) | | | Acquisition
date | | | Availability
date | | | Performance condition | | Christophe de MargerieChairman and Chief Executive Officer | |
| 2011 Plan
09/14/2011 |
| | | 16,000 | | | | 437,440 | | | | 09/15/2013 | | | | 09/15/2015 | | | For 50% of the shares, the condition is based on the average ROE for the Group’s 2011 and 2012 fiscal years. For 50% of the shares, the condition is based on the average ROACE for the Group’s 2011 and 2012 fiscal years. | | Claude ClémentDirector representing employee shareholders | |
| 2011 Plan
09/14/2011 |
| | | 240 | | | | 6,562 | | | | 09/15/2013 | | | | 09/15/2015 | | | Shares in excess of the first 100 shares are subject to a condition based on the average ROE for the Group’s 2011 and 2012 fiscal years. | | Total | | | | | | | 16,240 | | | | | | | | | | | | | | | |
| (a) | The value of performance shares was calculated on the day when they were awarded. |
PERFORMANCE SHARES FINALLY AWARDED IN 2011 FOR THE CHAIRMAN AND CHIEF EXECUTIVE OFFICER OR ANY DIRECTOR | | | | | | | | | | | | | | Date of Plan | | Number of shares finally awarded during
fiscal year | | | Acquisition
condition | | Christophe de Margerie | | 2009 Plan | | | — | | | | — | | Chairman and Chief Executive Officer | | 09/15/2009 | | | | | | | | | Claude Clément | | 2009 Plan | | | | | | | — | | Director representing employee shareholders | | Number of shares
09/15/2009 | | | — | | | | | | | finally awarded during
Total | | | Acquisition
| | | Date of plan | | | fiscal year(a) | | | condition | Thierry Desmarest
| | | 2008 Plan | | | | — | | | — | Chairman of the Board of Directors
| | | 10/09/2008 | | | | | | | | (until May 21, 2010)
| | | | | | | | | | | | | | | | | | | | | | Christophe de Margerie
| | | 2008 Plan | | | | — | | | — | Chief Executive Officer
| | | 10/09/2008 | | | | | | | | (until May 21, 2010)
| | | | | | | | | | | Chairman and Chief Executive Officer
| | | | | | | | | | | (since May 21, 2010)
| | | | | | | | | | | | | | | | | | | | | | Claude Clément
Director representing employee shareholders | | | 2008 Plan
10/09/2008 | | | | 300 | | | Condition based
on the Group’s
ROE for fiscal
year 2009 | | | | | | | | | | | | Total
| | | | | | | 300 | | | | | | | | | | | | | | |
| | | (a) | | Shares finally awarded to the beneficiaries after a2-year vesting period, i.e. on October 10, 2010. | (b) | | The acquisition rate of the shares granted, linked to the performance condition, was 60%. By decision of the Board of Directors at its meeting on September 9, 2008, Mr. Clément was awarded 500 restricted shares on October 9, 2008. Moreover, the transfer of the restricted shares finally awarded will only be permitted after the end of a2-year mandatory holding period, i.e. from October 10, 2012. |
97
TOTAL stock option plansSTOCK OPTION GRANTS The following table gives a breakdown of stock options awarded by category of beneficiaries (executive(main executive officers, senior managersother executive officers and other employees) for the plans in effect during 2010. | | | | | | | | | | | | | | | | | | | | | | | | | | | | Number of
| | | | | | Average number
| | | | | | | Number of
| | | options
| | | | | | of options per
| | | | | | | beneficiaries | | | awarded(a) | | | Percentage | | | beneficiary(a) | | 2002 Plan(b)(d)(e): | | | | | | | | | | | | | | | | | | | Purchase options | | Executive officers(c) | | | 28 | | | | 333,600 | | | | 11.6 | % | | | 11,914 | | | Decision of the Board on July 9, 2002 | | Senior managers | | | 299 | | | | 732,500 | | | | 25.5 | % | | | 2,450 | | | Exercise price: €158.30; discount: 0.0% | | Other employees | | | 3,537 | | | | 1,804,750 | | | | 62.9 | % | | | 510 | | Exercise price as of May 24, 2006: €39.03(a) | | | | | | | | | | | | | | | | | | | | | | Total | | | 3,864 | | | | 2,870,850 | | | | 100 | % | | | 743 | | | | | | | | | | | | | | | | | | | | | | 2003 Plan(b)(d): | | | | | | | | | | | | | | | | | | | Subscription options | | Executive officers(c) | | | 28 | | | | 356,500 | | | | 12.2 | % | | | 12,732 | | | Decision of the Board on July 16, 2003 | | Senior managers | | | 319 | | | | 749,206 | | | | 25.5 | % | | | 2,349 | | | Exercise price: €133.20; discount: 0.0% | | Other employees | | | 3,603 | | | | 1,829,600 | | | | 62.3 | % | | | 508 | | Exercise price as of May 24, 2006: €32.84(a) | | | | | | | | | | | | | | | | | | | | | | Total | | | 3,950 | | | | 2,935,306 | | | | 100 | % | | | 743 | | | | | | | | | | | | | | | | | | | | | | 2004 Plan(d): | | | | | | | | | | | | | | | | | | | Subscription options | | Executive officers(c) | | | 30 | | | | 423,500 | | | | 12.6 | % | | | 14,117 | | | Decision of the Board on July 20, 2004 | | Senior managers | | | 319 | | | | 902,400 | | | | 26.8 | % | | | 2,829 | | | Exercise price: €159.40; discount: 0.0% | | Other employees | | | 3,997 | | | | 2,039,730 | | | | 60.6 | % | | | 510 | | Exercise price as of May 24, 2006: €39.30(a) | | | | | | | | | | | | | | | | | | | | | | Total | | | 4,346 | | | | 3,365,630 | | | | 100 | % | | | 774 | | | | | | | | | | | | | | | | | | | | | | 2005 Plan(d): | | | | | | | | | | | | | | | | | | | Subscription options | | Executive officers(c) | | | 30 | | | | 370,040 | | | | 24.3 | % | | | 12,335 | | | Decision of the Board on July 19, 2005 | | Senior managers | | | 330 | | | | 574,140 | | | | 37.6 | % | | | 1,740 | | | Exercise price: €198.90; discount: 0.0% | | Other employees | | | 2,361 | | | | 581,940 | | | | 38.1 | % | | | 246 | | Exercise price as of May 24, 2006: €49.04(a) | | | | | | | | | | | | | | | | | | | | | | Total | | | 2,721 | | | | 1,526,120 | | | | 100 | % | | | 561 | | | | | | | | | | | | | | | | | | | | | | 2006 Plan(d): | | | | | | | | | | | | | | | | | | | Subscription options | | Executive officers(c) | | | 28 | | | | 1,447,000 | | | | 25.3 | % | | | 51,679 | | | Decision of the Board on July 18, 2006 | | Senior managers | | | 304 | | | | 2,120,640 | | | | 37.0 | % | | | 6,976 | | | Exercise price: €50.60; discount: 0.0% | | Other employees | | | 2,253 | | | | 2,159,600 | | | | 37.7 | % | | | 959 | | | | | Total | | | 2,585 | | | | 5,727,240 | | | | 100 | % | | | 2,216 | | | | | | | | | | | | | | | | | | | | | | 2007 Plan(d)(e): | | | | | | | | | | | | | | | | | | | Subscription options | | Executive officers(c) | | | 27 | | | | 1,329,360 | | | | 22.8 | % | | | 49,236 | | | Decision of the Board on July 17, 2007 | | Senior managers | | | 298 | | | | 2,162,270 | | | | 37.1 | % | | | 7,256 | | | Exercise price: €60.10; discount: 0.0% | | Other employees | | | 2,401 | | | | 2,335,600 | | | | 40.1 | % | | | 973 | | | | | Total | | | 2,726 | | | | 5,827,230 | | | | 100 | % | | | 2,138 | | | | | | | | | | | | | | | | | | | | | | 2008 Plan(d)(e)(f): | | | | | | | | | | | | | | | | | | | Subscription options | | Executive officers(c) | | | 26 | | | | 1,227,500 | | | | 27.6 | % | | | 47,212 | | Awarded on October 9, 2008(g) | | Senior managers | | | 298 | | | | 1,988,420 | | | | 44.7 | % | | | 6,673 | | | Exercise price: €42.90; discount: 0.0% | | Other employees | | | 1,690 | | | | 1,233,890 | | | | 27.7 | % | | | 730 | | | | | Total | | | 2,014 | | | | 4,449,810 | | | | 100 | % | | | 2,209 | | | | | | | | | | | | | | | | | | | | | | 2009 Plan(d)(e): | | | | | | | | | | | | | | | | | | | Subscription options | | Executive officers(c) | | | 26 | | | | 1,201,500 | | | | 27.4 | % | | | 46,211 | | | Decision of the Board on September 15, 2009 | | Senior managers | | | 284 | | | | 1,825,540 | | | | 41.6 | % | | | 6,428 | | | Exercise price: €39.90; discount: 0.0% | | Other employees | | | 1,742 | | | | 1,360,460 | | | | 31.0 | % | | | 781 | | | | | Total | | | 2,052 | | | | 4,387,500 | | | | 100 | % | | | 2,138 | | | | | | | | | | | | | | | | | | | | | | 2010 Plan(d)(e): | | | | | | | | | | | | | | | | | | | Subscription options | | Executive officers(c) | | | 25 | | | | 1,348,100 | | | | 28.2 | % | | | 53,924 | | | Decision of the Board on September 14, 2010 | | Senior managers | | | 282 | | | | 2,047,600 | | | | 42.8 | % | | | 7,261 | | | Exercise price: €38.20; discount: 0.0% | | Other employees | | | 1,790 | | | | 1,392,720 | | | | 29.0 | % | | | 778 | | | | | Total | | | 2,097 | | | | 4,788,420 | | | | 100 | % | | | 2,283 | |
98
| | | | | | | | | | | | | | | | | | | | | | | | Number of
beneficiaries | | | Number
of options
awarded(a) | | | Percentage | | | Average
number of
options per
beneficiary(a) | | 2003 Plan(b)(d):: Subscription options | | Main executive officers(c) | | | 28 | | | | 356,500 | | | | 12.2 | % | | | 12,732 | | Decision of the Board on July 16, 2003 | | Other executive officers | | | 319 | | | | 749,206 | | | | 25.5 | % | | | 2,349 | | Exercise price:€133.20; discount: 0.0% | | Other employees | | | 3,603 | | | | 1,829,600 | | | | 62.3 | % | | | 508 | | Exercise price as of May 24, 2006:€32.84(a) | | Total | | | 3,950 | | | | 2,935,306 | | | | 100 | % | | | 743 | | 2004 Plan(d): Subscription options | | Main executive officers(c) | | | 30 | | | | 423,500 | | | | 12.6 | % | | | 14,117 | | Decision of the Board on July 20, 2004 | | Other executive officers | | | 319 | | | | 902,400 | | | | 26.8 | % | | | 2,829 | | Exercise price:€159.40; discount: 0.0% | | Other employees | | | 3,997 | | | | 2,039,730 | | | | 60.6 | % | | | 510 | | Exercise price as of May 24, 2006:€39.30(a) | | Total | | | 4,346 | | | | 3,365,630 | | | | 100 | % | | | 774 | | 2005 Plan(d): Subscription options | | Main executive officers(c) | | | 30 | | | | 370,040 | | | | 24.3 | % | | | 12,335 | | Decision of the Board on July 19, 2005 | | Other executive officers | | | 330 | | | | 574,140 | | | | 37.6 | % | | | 1,740 | | Exercise price:€198.90; discount: 0.0% | | Other employees | | | 2,361 | | | | 581,940 | | | | 38.1 | % | | | 246 | | Exercise price as of May 24, 2006:€49.04(a) | | Total | | | 2,721 | | | | 1,526,120 | | | | 100 | % | | | 561 | | 2006 Plan(d): Subscription options | | Main executive officers(c) | | | 28 | | | | 1,447,000 | | | | 25.3 | % | | | 51,679 | | Decision of the Board on July 18, 2006 | | Other executive officers | | | 304 | | | | 2,120,640 | | | | 37.0 | % | | | 6,976 | | Exercise price:€50.60; discount: 0.0% | | Other employees | | | 2,253 | | | | 2,159,600 | | | | 37.7 | % | | | 959 | | | | Total | | | 2,585 | | | | 5,727,240 | | | | 100 | % | | | 2,216 | | 2007 Plan(d)(e): Subscription options | | Main executive officers(c) | | | 27 | | | | 1,329,360 | | | | 22.8 | % | | | 49,236 | | Decision of the Board on July 17, 2007 | | Other executive officers | | | 298 | | | | 2,162,270 | | | | 37.1 | % | | | 7,256 | | Exercise price:€60.10; discount: 0.0% | | Other employees | | | 2,401 | | | | 2,335,600 | | | | 40.1 | % | | | 973 | | | | Total | | | 2,726 | | | | 5,827,230 | | | | 100 | % | | | 2,138 | | 2008 Plan(d)(e)(f): Subscription options | | Main executive officers(c) | | | 26 | | | | 1,227,500 | | | | 27.6 | % | | | 47,212 | | | Awarded on October 9, 2008, by decision of the Board of Directors on September 9, 2008 | | Other executive officers Other employees | |
| 298
1,690 |
| |
| 1,988,420
1,233,890 |
| |
| 44.7
27.7 | %
% | |
| 6,673
730 |
| Exercise price:€42.90; discount: 0.0% | | Total | | | 2,014 | | | | 4,449,810 | | | | 100 | % | | | 2,209 | | 2009 Plan(d)(e)(g): Subscription options | | Main executive officers(c) | | | 26 | | | | 1,201,500 | | | | 27.4 | % | | | 46,212 | | Decision of the Board on September 15, 2009 | | Other executive officers | | | 284 | | | | 1,825,540 | | | | 41.6 | % | | | 6,428 | | Exercise price:€39.90; discount: 0.0% | | Other employees | | | 1,742 | | | | 1,360,460 | | | | 31.0 | % | | | 781 | | | | Total | | | 2,052 | | | | 4,387,500 | | | | 100 | % | | | 2,138 | | 2010 Plan(d)(e): Subscription options | | Main executive officers(c) | | | 25 | | | | 1,348,100 | | | | 28.2 | % | | | 53,924 | | Decision of the Board on September 14, 2010 | | Other executive officers | | | 282 | | | | 2,047,600 | | | | 42.8 | % | | | 7,261 | | Exercise price:€38.20; discount: 0.0% | | Other employees | | | 1,790 | | | | 1,392,720 | | | | 29.0 | % | | | 778 | | | | Total | | | 2,097 | | | | 4,788,420 | | | | 100 | % | | | 2,283 | | 2011 Plan(d)(e): Subscription options | | Main executive officers(c) | | | 29 | | | | 846,600 | | | | 55.7 | % | | | 29,193 | | Decision of the Board on September 14, 2011 | | Other executive officers | | | 177 | | | | 672,240 | | | | 44.3 | % | | | 3,798 | | Exercise price:€33.00; discount: 0.0% | | Other employees | | | — | | | | — | | | | — | | | | — | | | | Total | | | 206 | | | | 1,518,840 | | | | 100 | % | | | 7,373 | |
| (a) | | | (a) | | To take into account the spin-off of Arkema, pursuant toArticles 174-9,174-12 and174-13 of DecreeNo. 67-236 of March 23, 1967, effective at that time and as of the provisions in effect on the date of the Shareholders’ Meeting on May 12, 2006, at its meeting of March 14, 2006, the Board of Directors resolved to adjust the rights of holders of TOTAL stock options.options holders. For each plan and each holder, the exercise prices for TOTAL stock options were multiplied by 0.986147 and the number of unexercised stock options was multiplied by 1.014048 (and then rounded up), effective as of May 24, 2006. In addition, to take into account thefour-for-one stock split approved by the Shareholders’ Meeting on May 12, 2006, the exercise price for stock options was divided by four and the number of unexercised stock options was multiplied by four. The presentation in this table of the number of options initially awarded has not been adjusted to reflect thefour-for-one stock split. |
| (b) | | Certain employees of the Elf Aquitaine group in 1998 also benefited in 2000, 2001, 2002 and 2003 from the vesting of Elf Aquitaine options awarded in 1998 subject to performance conditions related to the Elf Aquitaine group from 1998 to 2002. These Elf Aquitaine plans expired on March 31, 2005. |
| (c) | | Members of the Management Committee and the Treasurer as of the date of the Board meeting awarding the options. Mr. Desmarest has no longernot been a member of the Management Committee since February 14, 2007. Mr. Desmarest was awarded 110,000 options under the 2007 planPlan and no option under the 2008 and 2009 plans.options since 2008. |
| (d) | | The options are exercisable, subject to a continued employmentpresence condition, after a2-year vesting period from the date of the Board meeting awarding the options and expire eight years after this date. The underlying shares may not be transferred during the4-year period from the date of the Board meeting awarding the options (except for the 2008 plan)Plan). The continued employmentpresence condition states that the termination of the employment contract will also terminateresult in the grantee’semployee losing the right to exercise the options. |
| (e) | | The4-year transfer restriction period does not apply to employees of non-French subsidiaries as of the date of the grant, who may transfer the underlying shares after a2-year period from the date of the grant. |
| (f) | | For the 2008 plan,Plan, the options acquisition rate, linked to the performance condition, was 60%. | (g) | | Decision of the Board on September 9, 2008. |
99
| (g) | For the 2009 Plan, the options acquisition rate, linked to the performance condition, was 100%. |
TOTAL STOCK OPTIONS AS OF DECEMBER 31, 20102011 | | | | | | | | | | | | | | | | | | | | | | | | | | | | | | | | | | | | | | | | | | | | | 2002 Plan
| | | 2003 Plan
| | | 2004 Plan
| | | 2005 Plan
| | | 2006 Plan
| | | 2007 Plan
| | | 2008 Plan
| | | 2009 Plan
| | | 2010 Plan
| | | | | | | | Purchase
| | | Subscription
| | | Subscription
| | | Subscription
| | | Subscription
| | | Subscription
| | | Subscription
| | | Subscription
| | | Subscription
| | | | | | Type of options | | options | | | options | | | options | | | options | | | options | | | options | | | options | | | options | | | options | | | Total
| | | Date of the Shareholders’ Meeting | | | 05/17/2001 | | | | 05/17/2001 | | | | 05/14/2004 | | | | 05/14/2004 | | | | 05/14/2004 | | | | 05/11/2007 | | | | 05/11/2007 | | | | 05/11/2007 | | | | 05/21/2010 | | | | | | Grant date(a) | | | 07/09/2002 | | | | 07/16/2003 | | | | 07/20/2004 | | | | 07/19/2005 | | | | 07/18/2006 | | | | 07/17/2007 | | | | 10/09/2008 | | | | 09/15/2009 | | | | 09/14/2010 | | | | | | | | | | | | | | | | | | | | | | | | | | | | | | | | | | | | | | | | | | | | | | | | Total number of options awarded, including(b): | | | 11,483,400 | | | | 11,741,224 | | | | 13,462,520 | | | | 6,104,480 | | | | 5,727,240 | | | | 5,937,230 | | | | 4,449,810 | | | | 4,387,500 | | | | 4,788,420 | | | | 68,081,824 | | directors(c) | | | 240,000 | | | | 240,000 | | | | 240,000 | | | | 240,720 | | | | 400,720 | | | | 310,840 | | | | 200,660 | | | | 200,000 | | | | 240,000 | | | | 2,312,940 | | • D. Boeuf | | | n/a | | | | n/a | | | | — | | | | 720 | | | | 720 | | | | 840 | | | | 660 | | | | 0 | | | | n/a | | | | 2,940 | | • T. Desmarest | | | 240,000 | | | | 240,000 | | | | 240,000 | | | | 240,000 | | | | 240,000 | | | | 110,000 | | | | — | | | | — | | | | — | | | | 1,310,000 | | • C. de Margerie | | | n/a | | | | n/a | | | | n/a | | | | n/a | | | | 160,000 | | | | 200,000 | | | | 200,000 | | | | 200,000 | | | | 240,000 | | | | 1,000,000 | | • C. Clément | | | n/a | | | | n/a | | | | n/a | | | | n/a | | | | n/a | | | | n/a | | | | n/a | | | | n/a | | | | — | | | | — | | | | | | | | | | | | | | | | | | | | | | | | | | | | | | | | | | | | | | | | | | | | Additional grant | | | — | | | | — | | | | 24,000 | | | | 134,400 | | | | — | | | | — | | | | — | | | | — | | | | — | | | | 158,400 | | Adjustments related to the
spin-off of Arkema(d) | | | 165,672 | | | | 163,180 | | | | 196,448 | | | | 90,280 | | | | — | | | | — | | | | — | | | | — | | | | — | | | | 615,580 | | | | | | | | | | | | | | | | | | | | | | | | | | | | | | | | | | | | | | | | | | | | | Date as of which the options may be exercised | | | 07/10/2004 | | | | 07/17/2005 | | | | 07/21/2006 | | | | 07/20/2007 | | | | 07/19/2008 | | | | 07/18/2009 | | | | 10/10/2010 | | | | 09/16/2011 | | | | 09/15/2012 | | | | | | | Expiry date | | | 07/09/2010 | | | | 07/16/2011 | | | | 07/20/2012 | | | | 07/19/2013 | | | | 07/18/2014 | | | | 07/17/2015 | | | | 10/09/2016 | | | | 09/15/2017 | | | | 09/14/2018 | | | | | | Exercise price (€)(e) | | | 39.03 | | | | 32.84 | | | | 39.30 | | | | 49.04 | | | | 50.60 | | | | 60.10 | | | | 42.90 | | | | 39.90 | | | | 38.20 | | | | | | | | | | | | | | | | | | | | | | | | | | | | | | | | | | | | | | | | | | | | | | | | Cumulative number of options exercised as of December 31, 2010 | | | 6,878,373 | | | | 6,072,598 | | | | 1,050,178 | | | | 38,497 | | | | 8,620 | | | | — | | | | — | | | | 1,080 | | | | — | | | | | | Cumulative number of options canceled as of December 31, 2010 | | | 4,770,699 | | | | 97,362 | | | | 293,943 | | | | 111,807 | | | | 77,734 | | | | 70,785 | | | | 100,652 | | | | 14,650 | | | | 1,120 | | | | | | | | | | | | | | | | | | | | | | | | | | | | | | | | | | | | | | | | | | | | | | | | | Number of options: | | | | | | | | | | | | | | | | | | | | | | | | | | | | | | | | | | | | | | | | | | • outstanding as of January 1, 2010 | | | 5,935,261 | | | | 6,811,629 | | | | 12,495,709 | | | | 6,185,440 | | | | 5,645,686 | | | | 5,871,665 | | | | 4,441,630 | | | | 4,377,010 | | | | — | | | | 51,764,030 | | | Awarded in 2010 | | | — | | | | — | | | | — | | | | — | | | | — | | | | — | | | | — | | | | — | | | | 4,788,420 | | | | 4,788,420 | | • Canceled in 2010(f)(g) | | | (4,671,989 | ) | | | (1,420 | ) | | | (15,660 | ) | | | (6,584 | ) | | | (4,800 | ) | | | (5,220 | ) | | | (92,472 | ) | | | (4,040 | ) | | | (1,120 | ) | | | (4,803,305 | ) | | • exercised in 2010 | | | (1,263,272 | ) | | | (1,075,765 | ) | | | (141,202 | ) | | | — | | | | — | | | | — | | | | — | | | | (1,080 | ) | | | — | | | | (2,481,319 | ) | outstanding as of December 31, 2010 | | | — | | | | 5,734,444 | | | | 12,338,847 | | | | 6,178,856 | | | | 5,640,886 | | | | 5,866,445 | | | | 4,349,158 | | | | 4,371,890 | | | | 4,787,300 | | | | 49,267,826 | | | | | | | | | | | | | | | | | | | | | | | | | | | | | | | | | | | | | | | | | | | |
| | | | | | | | | | | | | | | | | | | | | | | | | | | | | | | | | | | | | | | | | | | | 2003 Plan | | | 2004 Plan | | | 2005 Plan | | | 2006 Plan | | | 2007 Plan | | | 2008 Plan | | | 2009 Plan | | | 2010 Plan | | | 2011 Plan | | | Total | | | Type of options | | Subscription
options | | | Subscription
options | | | Subscription
options | | | Subscription
options | | | Subscription
options | | | Subscription
options | | | Subscription
options | | | Subscription
options | | | Subscription
options | | | | | Date of the Shareholders’ Meeting | | | 05/17/2001 | | | | 05/14/2004 | | | | 05/14/2004 | | | | 05/14/2004 | | | | 05/11/2007 | | | | 05/11/2007 | | | | 05/11/2007 | | | | 05/21/2010 | | | | 05/21/2010 | | | | | | Grant date(a) | | | 07/16/2003 | | | | 07/20/2004 | | | | 07/19/2005 | | | | 07/18/2006 | | | | 07/17/2007 | | | | 10/09/2008 | | | | 09/15/2009 | | | | 09/14/2010 | | | | 09/14/2011 | | | | | | Total number of options awarded, including(b): | | | 11,741,224 | | | | 13,462,520 | | | | 6,104,480 | | | | 5,727,240 | | | | 5,937,230 | | | | 4,449,810 | | | | 4,387,500 | | | | 4,788,420 | | | | 1,518,840 | | | | 58,117,264 | | Directors(c) | | | 240,000 | | | | 240,000 | | | | 240,720 | | | | 400,720 | | | | 310,840 | | | | 200,660 | | | | 200,000 | | | | 240,000 | | | | 160,000 | | | | 2,232,940 | | — C. de Margerie | | | n/a | | | | n/a | | | | n/a | | | | 160,000 | | | | 200,000 | | | | 200,000 | | | | 200,000 | | | | 240,000 | | | | 160,000 | | | | 1,160,000 | | — C. Clément | | | n/a | | | | n/a | | | | n/a | | | | n/a | | | | n/a | | | | n/a | | | | n/a | | | | — | | | | — | | | | — | | — D. Boeuf | | | n/a | | | | — | | | | 720 | | | | 720 | | | | 840 | | | | 660 | | | | — | | | | n/a | | | | n/a | | | | 2,940 | | — T. Desmarest | | | 240,000 | | | | 240,000 | | | | 240,000 | | | | 240,000 | | | | 110,000 | | | | — | | | | — | | | | — | | | | n/a | | | | 1,070,000 | | Additional grant | | | — | | | | 24,000 | | | | 134,400 | | | | — | | | | — | | | | — | | | | — | | | | — | | | | — | | | | 158,400 | | Adjustments related to the spin-off of Arkema(d) | | | 163,180 | | | | 196,448 | | | | 90,280 | | | | — | | | | — | | | | — | | | | — | | | | — | | | | — | | | | 449,908 | | Date as of which the options may be exercised | | | 07/17/2005 | | | | 07/21/2006 | | | | 07/20/2007 | | | | 07/19/2008 | | | | 07/18/2009 | | | | 10/10/2010 | | | | 09/16/2011 | | | | 09/15/2012 | | | | 09/15/2013 | | | | | | Expiry date | | | 07/16/2011 | | | | 07/20/2012 | | | | 07/19/2013 | | | | 07/18/2014 | | | | 07/17/2015 | | | | 10/09/2016 | | | | 09/15/2017 | | | | 09/14/2018 | | | | 09/14/2019 | | | | | | Exercise price (€)(e) | | | 32.84 | | | | 39.30 | | | | 49.04 | | | | 50.60 | | | | 60.10 | | | | 42.90 | | | | 39.90 | | | | 38.20 | | | | 33.00 | | | | | | Cumulative number of options exercised as of December 31, 2011 | | | 11,068,508 | | | | 1,266,293 | | | | 38,497 | | | | 8,620 | | | | — | | | | 200 | | | | 1,080 | | | | 2,040 | | | | 9,400 | | | | | | Cumulative number of options canceled as of December 31, 2011 | | | 835,896 | | | | 322,151 | | | | 128,127 | | | | 95,114 | | | | 86,865 | | | | 113,912 | | | | 28,740 | | | | 86,337 | | | | 1,000 | | | | | | Number of options: | | | | | | | | | | | | | | | | | | | | | | | | | | | | | | | | | | | | | | | | | — outstanding as of January 1, 2011 | | | 5,734,444 | | | | 12,338,847 | | | | 6,178,856 | | | | 5,640,886 | | | | 5,866,445 | | | | 4,349,158 | | | | 4,371,890 | | | | 4,787,300 | | | | — | | | | 49,267,826 | | — awarded in 2011 | | | — | | | | — | | | | — | | | | — | | | | — | | | | — | | | | — | | | | — | | | | 1,518,840 | | | | 1,518,840 | | — canceled in 2011(f)(g) | | | (738,534 | ) | | | (28,208 | ) | | | (16,320 | ) | | | (17,380 | ) | | | (16,080 | ) | | | (13,260 | ) | | | (14,090 | ) | | | (85,217 | ) | | | (1,000 | ) | | | (930,089 | ) | — exercised in 2011 | | | (4,995,910 | ) | | | (216,115 | ) | | | — | | | | — | | | | — | | | | (200 | ) | | | — | | | | (2,040 | ) | | | (9,400 | ) | | | (5,223,665 | ) | — outstanding as of December 31, 2011 | | | — | | | | 12,094,524 | | | | 6,162,536 | | | | 5,623,506 | | | | 5,850,365 | | | | 4,335,698 | | | | 4,357,800 | | | | 4,700,043 | | | | 1,508,440 | | | | 44,632,912 | |
| (a) | | | (a) | | The grant date is the date of the Board meeting awarding the options, except for the share subscription option plan of October 9, 2008, approved by the Board on September 9, 2008. |
| (b) | | The number of options awarded before May 23, 2006, has been multiplied by four to take into account thefour-for-one stock split approved by the Shareholders’ Meeting on May 12, 2006. |
| (c) | | Options awarded to directors at the time of grant. |
| (d) | | Adjustments approved by the Board onat its meeting on March 14, 2006, pursuant toArticles 174-9,174-12 and174-13 of DecreeNo. 67-236 dated March 23, 1967 in effect at the time of the Board meeting as well as at the time of the Shareholders’ Meeting on May 12, 2006, related to the spin-off of Arkema. These adjustments were made on May 22, 2006 effective as of May 24, 2006. | (e) | | Exercise price as of May 24, 2006. To take into account thefour-for-one stock split that took place on May 18, 2006, the exercise price of stock options from plans then effective has been divided by four. In addition, to take into account the spin-off of Arkema, the exercise price of stock options was multiplied by an adjustment ratio of 0.986147, effective as of May 24, 2006. Exercise prices prior to May 24, 2006, are shown in Note 25 to the Consolidated Financial Statements. | (f) | | Out of the 4,671,989 options canceled in 2010, 4,671,145 options that were not exercised expired due to the expiry of the 2002 purchase option plan on July 9, 2010. | (g) | | Out of the 92,472 options awarded under the 2008 plan that were canceled, 88,532 options were canceled due to the application of the performance condition. The acquisition rate applicable to the subscription options that were subject to the performance condition of the 2008 plan was 60%. |
If all the outstanding stock options as of December 31, 2010, were exercised, the corresponding shares would represent 2.05%(1) of the Company’s potential share capital as of such date.
(1) Out of a total potential share capital of 2,398,908,757 shares.
100
TOTAL STOCK OPTIONS AWARDED TO EXECUTIVE OFFICERS (MANAGEMENT COMMITTEE AND
TREASURER) AS OF DECEMBER 31, 2010
| | | | | | | | | | | | | | | | | | | | | | | | | | | | | | | | | | | | | | | | | | | | | 2002 Plan
| | | 2003 Plan
| | | 2004 Plan
| | | 2005 Plan
| | | 2006 Plan
| | | 2007 Plan
| | | 2008 Plan
| | | 2009 Plan
| | | 2010 Plan
| | | | | | | |
Purchase
| | |
Subscription
| | |
Subscription
| | |
Subscription
| | |
Subscription
| | |
Subscription
| | |
Subscription
| | |
Subscription
| | |
Subscription
| | | | | | Type of options | | options | | | options | | | options | | | options | | | options | | | options | | | options | | | options | | | options | | | Total
| | | Expiry date | | | 07/09/2010 | | | | 07/16/2011 | | | | 07/20/2012 | | | | 07/19/2013 | | | | 07/18/2014 | | | | 07/17/2015 | | | | 10/09/2016 | | | | 09/15/2017 | | | | 09/14/2018 | | | | | | Exercise price (€)(a) | | | 39.03 | | | | 32.84 | | | | 39.30 | | | | 49.04 | | | | 50.60 | | | | 60.10 | | | | 42.90 | | | | 39.90 | | | | 38.20 | | | | | | | | | | | | | | | | | | | | | | | | | | | | | | | | | | | | | | | | | | | | | | | | Options awarded by the Board(b) | | | 560,200 | | | | 635,704 | | | | 796,800 | | | | 689,680 | | | | 823,720 | | | | 1,000,840 | | | | 1,101,200 | | | | 1,169,800 | | | | 1,348,100 | | | | 8,126,044 | | Adjustments related to the spin-off of Arkema(c) | | | 7,568 | | | | 8,120 | | | | 11,248 | | | | 9,608 | | | | — | | | | — | | | | — | | | | — | | | | — | | | | 36,544 | | | | | | | | | | | | | | | | | | | | | | | | | | | | | | | | | | | | | | | | | | | | | Options outstanding as of 01/01/10 | | | 243,232 | | | | 291,337 | | | | 705,048 | | | | 699,416 | | | | 823,720 | | | | 1,000,840 | | | | 1,101,200 | | | | 1,169,800 | | | | — | | | | 6,034,593 | | | Options awarded in 2010 | | | — | | | | — | | | | — | | | | — | | | | — | | | | — | | | | — | | | | — | | | | 1,348,100 | | | | 1,348,100 | | | Options exercised in 2010 | | | (20,600 | ) | | | (25,172 | ) | | | (90,000 | ) | | | — | | | | — | | | | — | | | | — | | | | — | | | | — | | | | (135,772 | ) | Options canceled in 2010(d)(e) | | | (222,632 | ) | | | — | | | | — | | | | — | | | | — | | | | — | | | | (78,399 | ) | | | — | | | | — | | | | (301,031 | ) | | Options outstanding as of 12/31/10 | | | — | | | | 266,165 | | | | 615,048 | | | | 699,416 | | | | 823,720 | | | | 1,000,840 | | | | 1,022,801 | | | | 1,169,800 | | | | 1,348,100 | | | | 6,945,890 | | | | | | | | | | | | | | | | | | | | | | | | | | | | | | | | | | | | | | | | | | | |
| | | (a) | | Exercise price as of May 24, 2006. To take into account thefour-for-one stock split that took place on May 18, 2006, the exercise price of stock options from plans then effective has been divided by four. In addition, to take into account the spin-off of Arkema, the exercise price of stock options was multiplied by an adjustment ratio of 0.986147, effective as of May 24, 2006. Exercise prices prior to May 24, 2006, are shown in Note 25 to the Consolidated Financial Statements. | (b) | | The number of options awarded before May 23, 2006, has been multiplied by four to take into account thefour-for-one stock split approved by the Shareholders’ Meeting on May 12, 2006. | (c) | | Adjustments approved by the Board on its meeting on March 14, 2006 pursuant toArticles 174-9,174-12 and174-13 of DecreeNo. 67-236 dated March 23, 1967provisions in effect at the time of the Board meeting and at the time of the Shareholders’ Meeting on May 12, 2006, related to the spin-off of Arkema. These adjustments were made on May 22, 2006 effective as of May 24, 2006. |
(d)(e) | Exercise price as of May 24, 2006. The exercise prices of TOTAL subscription shares under the plans in force at that date were multiplied by 0.25 to take into account the four-for-one stock split on May 18, 2006. Moreover, following the spin-off of Arkema, the exercise prices of TOTAL stock options under these plans were multiplied by an adjustment factor equal to 0.986147 effective as of May 24, 2006. The exercise prices effective before May 24, 2006 are given in Note 25, points A, B and C to the Consolidated Financial Statements. |
| (f) | Out of the 301,031930,089 options canceled in 2010, 222,6322011, 738,534 options that were not exercised expired due to the expiry of the 2002 purchase2003 subscription option plan on July 9, 2010.16, 2011. |
(e)(g) | | 78,399 options of the 2008 plan were canceled due to the application of the performance condition. The acquisition rate applicable to the subscription options that were subject to the performance condition of the 2008 plan2009 Plan was 60%100%. |
If all the outstanding stock options as of December 31, 2011 were exercised, the corresponding shares would represent 1.85%(1)of the Company’s potential share capital as of such date. | (1) | Out of a total potential share capital of 2,408,400,225 shares. |
TOTAL STOCK OPTIONS AWARDED TO MAIN EXECUTIVE OFFICERS (MANAGEMENT COMMITTEE AND TREASURER) AS OF DECEMBER 31, 2011 | | | | | | | | | | | | | | | | | | | | | | | | | | | | | | | | | | | | | | | | | | | | 2003 Plan | | | 2004 Plan | | | 2005 Plan | | | 2006 Plan | | | 2007 Plan | | | 2008 Plan | | | 2009 Plan | | | 2010 Plan | | | 2011 Plan | | | Total | | | Type of options | | Subscription
options | | | Subscription
options | | | Subscription
options | | | Subscription
options | | | Subscription
options | | | Subscription
options | | | Subscription
options | | | Subscription
options | | | Subscription
options | | | | | Expiry date | | | 07/16/2011 | | | | 07/20/2012 | | | | 07/19/2013 | | | | 07/18/2014 | | | | 07/17/2015 | | | | 10/09/2016 | | | | 09/15/2017 | | | | 09/14/2018 | | | | 09/14/2019 | | | | | | Exercise price (€)(a) | | | 32.84 | | | | 39.30 | | | | 49.04 | | | | 50.60 | | | | 60.10 | | | | 42.90 | | | | 39.90 | | | | 38.20 | | | | 33.00 | | | | | | Options awarded by the Board(b) | | | 680,904 | | | | 848,800 | | | | 711,440 | | | | 851,240 | | | | 1,032,120 | | | | 1,138,300 | | | | 1,215,300 | | | | 1,406,400 | | | | 846,600 | | | | 8,731,104 | | Adjustments related to the spin-off of Arkema(c) | | | 8,988 | | | | 11,992 | | | | 10,048 | | | | — | | | | — | | | | — | | | | — | | | | — | | | | — | | | | 31,028 | | Options outstanding as of January 01, 2011 | | | 277,119 | | | | 757,792 | | | | 721,488 | | | | 851,240 | | | | 1,032,120 | | | | 1,059,901 | | | | 1,215,300 | | | | 1,406,400 | | | | | | | | 7,321,360 | | Options awarded in 2011 | | | — | | | | — | | | | — | | | | — | | | | — | | | | — | | | | — | | | | — | | | | 846,600 | | | | 846,600 | | Options exercised in 2011 | | | (277,119 | ) | | | — | | | | — | | | | — | | | | — | | | | — | | | | — | | | | — | | | | — | | | | (277,119 | ) | Options canceled in 2011 | | | — | | | | — | | | | — | | | | — | | | | — | | | | — | | | | — | | | | (59,000 | ) | | | — | | | | (59,000 | ) | Options outstanding as of December 31, 2011 | | | — | | | | 757,792 | | | | 721,488 | | | | 851,240 | | | | 1,032,120 | | | | 1,059,901 | | | | 1,215,300 | | | | 1,347,400 | | | | 846,600 | | | | 7,831,841 | |
| (a) | Exercise price as of May 24, 2006. The exercise prices of TOTAL subscription shares under the plans in force at that date were multiplied by 0.25 to take into account the four-for-one stock split on May 18, 2006. Moreover, following the spin-off of Arkema, the exercise prices of TOTAL stock options under these plans were multiplied by an adjustment factor equal to 0.986147 effective as of May 24, 2006. The exercise prices effective before May 24, 2006 are given in Note 25, points A, B and C to the Consolidated Financial Statements. |
| (b) | The number of options awarded before May 23, 2006, has been multiplied by four to take into account the four-for-one stock split approved by the Shareholders’ Meeting on May 12, 2006. |
| (c) | Adjustments approved by the Board at its meeting on March 14, 2006, pursuant to the provisions in effect at the time of the Board meeting and of the Shareholders’ Meeting on May 12, 2006, related to the spin-off of Arkema. These adjustments were made on May 22, 2006 effective as of May 24, 2006. |
As part of the 2007, 2008 and 2009 share subscription option plans, the Board of Directors decided that for each beneficiary of more than 25,000 options, one-third of the options awarded in excess of this number be subject to a performance condition. For the 2010 share subscription option plan, beneficiaries of more than 3,000 options are subject to a performance condition for part of the options. options (see “— Grants to the Chairman and Chief Executive Officer”). For the 2011 share subscription option plan, all of the options are subject to a performance condition.In addition, Mr. Clément, the director representing employee shareholders, has not exercised any option in 20102011 and has not been awarded any share subscription options byunder the 2010 plan.
1012011 Plan.
TOTAL STOCK OPTIONS AWARDED TO MR. DESMAREST,
DE MARGERIE, CHAIRMAN OF THE BOARDANDCHIEF EXECUTIVE OFFICER OF TOTAL S.A. UNTIL MAY 21, 2010 | | | | | | | | | | | | | | | | | | | | | | | | | | | | | | | | | | | | | | | | | | | | | 2002 Plan
| | | 2003 Plan
| | | 2004 Plan
| | | 2005 Plan
| | | 2006 Plan
| | | 2007 Plan
| | | 2008 Plan
| | | 2009 Plan
| | | 2010 Plan
| | | | | | | |
Purchase
| | |
Subscription
| | |
Subscription
| | |
Subscription
| | |
Subscription
| | |
Subscription
| | |
Subscription
| | |
Subscription
| | |
Subscription
| | | | | | Type of options | | options | | | options | | | options | | | options | | | options | | | options | | | options | | | options | | | options | | | Total
| | | Expiry date | | | 07/09/2010 | | | | 07/16/2011 | | | | 07/20/2012 | | | | 07/19/2013 | | | | 07/18/2014 | | | | 07/17/2015 | | | | 10/09/2016 | | | | 09/15/2017 | | | | 09/14/2018 | | | | | | Exercise price (€)(a) | | | 39.03 | | | | 32.84 | | | | 39.30 | | | | 49.04 | | | | 50.60 | | | | 60.10 | | | | 42.90 | | | | 39.90 | | | | 38.20 | | | | | | | | | | | | | | | | | | | | | | | | | | | | | | | | | | | | | | | | | | | | | | | | Options awarded by the Board(b) | | | 240,000 | | | | 240,000 | | | | 240,000 | | | | 240,000 | | | | 240,000 | | | | 110,000 | | | | — | | | | — | | | | — | | | | 1,310,000 | | Adjustments related to the spin-off of Arkema(c) | | | 3,372 | | | | 2,476 | | | | 3,372 | | | | 3,372 | | | | — | | | | — | | | | — | | | | — | | | | — | | | | 12,592 | | | | | | | | | | | | | | | | | | | | | | | | | | | | | | | | | | | | | | | | | | | | | Options outstanding as of 01/01/10 | | | 25,372 | | | | — | | | | 243,372 | | | | 243,372 | | | | 240,000 | | | | 110,000 | | | | — | | | | — | | | | — | | | | 862,116 | | | Options awarded in 2010 | | | — | | | | — | | | | — | | | | — | | | | — | | | | — | | | | — | | | | — | | | | — | | | | — | | | Options exercised in 2010 | | | (25,372 | ) | | | — | | | | — | | | | — | | | | — | | | | — | | | | — | | | | — | | | | — | | | | (25,372 | ) | | Options canceled in 2010 | | | — | | | | — | | | | — | | | | — | | | | — | | | | — | | | | — | | | | — | | | | — | | | | — | | | Options outstanding as of 12/31/10 | | | — | | | | — | | | | 243,372 | | | | 243,372 | | | | 240,000 | | | | 110,000 | | | | — | | | | — | | | | — | | | | 836,744 | | | | | | | | | | | | | | | | | | | | | | | | | | | | | | | | | | | | | | | | | | | |
| | | | | | | | | | | | | | | | | | | | | | | | | | | | | | | | | | | | | | | | | | | | 2003 Plan | | | 2004 Plan | | | 2005 Plan | | | 2006 Plan | | | 2007 Plan | | | 2008 Plan | | | 2009 Plan | | | 2010 Plan | | | 2011 Plan | | | Total | | | Type of options | | Subscription
options | | | Subscription
options | | | Subscription
options | | | Subscription
options | | | Subscription
options | | | Subscription
options | | | Subscription
options | | | Subscription
options | | | Subscription
options | | | | | Expiry date | | | 07/16/2011 | | | | 07/20/2012 | | | | 07/19/2013 | | | | 07/18/2014 | | | | 07/17/2015 | | | | 10/09/2016 | | | | 09/15/2017 | | | | 09/14/2018 | | | | 09/14/2019 | | | | | | Exercise price (€)(a) | | | 32.84 | | | | 39.30 | | | | 49.04 | | | | 50.60 | | | | 60.10 | | | | 42.90 | | | | 39.90 | | | | 38.20 | | | | 33.00 | | | | | | Options awarded by the Board(b) | | | 112,000 | | | | 128,000 | | | | 130,000 | | | | 160,000 | | | | 200,000 | | | | 200,000 | | | | 200,000 | | | | 240,000 | | | | 160,000 | | | | 1,530,000 | | Adjustments related to the spin-off of Arkema(c) | | | 1,576 | | | | 1,800 | | | | 1,828 | | | | — | | | | — | | | | — | | | | — | | | | — | | | | — | | | | 5,204 | | Options outstanding as of January 01, 2011 | | | 113,576 | | | | 129,800 | | | | 131,828 | | | | 160,000 | | | | 200,000 | | | | 176,667 | | | | 200,000 | | | | 240,000 | | | | — | | | | 1,351,871 | | Options awarded in 2011 | | | — | | | | — | | | | — | | | | — | | | | — | | | | — | | | | — | | | | — | | | | 160,000 | | | | 160,000 | | Options exercised in 2011 | | | (113,576 | ) | | | — | | | | — | | | | — | | | | — | | | | — | | | | — | | | | — | | | | — | | | | (113,576 | ) | Options canceled in 2011 | | | — | | | | — | | | | — | | | | — | | | | — | | | | — | | | | — | | | | — | | | | — | | | | — | | Options outstanding as of December 31, 2011 | | | — | | | | 129,800 | | | | 131,828 | | | | 160,000 | | | | 200,000 | | | | 176,667 | | | | 200,000 | | | | 240,000 | | | | 160,000 | | | | 1,398,295 | |
| (a) | | | (a) | | Exercise price as of May 24, 2006. ToThe exercise prices of TOTAL subscription shares under the plans in force at that date were multiplied by 0.25 to take into account thefour-for-one stock split that took place on May 18, 2006, the exercise price of stock options from plans then effective has been divided by four. In addition, to take into account2006. Moreover, following the spin-off of Arkema, the exercise priceprices of TOTAL stock options wasunder these plans were multiplied by an adjustment ratio offactor equal to 0.986147 effective as of May 24, 2006. ExerciseThe exercise prices prior toeffective before May 24, 2006 are showngiven in Note 25, points A, B and C to the Consolidated Financial Statements.Statements (chapter 9). |
| (b) | | The number of options awarded before May 23, 2006, has been multiplied by four to take into account thefour-for-one stock split approved by the Shareholders’ Meeting on May 12, 2006. |
| (c) | | Adjustments approved by the Board onat its meeting on March 14, 2006, pursuant toArticles 174-9,174-12 and174-13 of DecreeNo. 67-236 dated March 23, 1967 the provisions in effect at the time of the Board meeting and at the time of the Shareholders’ Meeting on May 12, 2006, related to the spin-off of Arkema. These adjustments were made on May 22, 2006 effective as of May 24, 2006. |
As part of the 2007 to 2011 Plans, the Board has made the grant of these options to the Chairman and Chief Executive Officer subject to performance conditions (see “— Grants to the Chairman and Chief Executive Officer”). For the 2009 Plan, the acquisition rate, linked to the performance conditions, was 100%. As of December 31, 2010,2011, the outstanding options of the Chairman and Chief Executive Officer represented 0.058%(1) of the Company’s potential share capital as of such date. Mr. Desmarest, Chairman of the Board of Directors until May 21, 2010, represented 0.035%(1) ofwas not awarded any share subscription options under the Company’s potential share capital as of such date. (1) Out of a total potential share capital of 2,398,908,757 shares.
102
TOTAL STOCK OPTIONS AWARDED TO MR. DE MARGERIE, CHAIRMAN AND
CHIEF EXECUTIVE OFFICER OF TOTAL S.A.
| | | | | | | | | | | | | | | | | | | | | | | | | | | | | | | | | | | | | | | | | | | | | 2002 Plan
| | | 2003 Plan
| | | 2004 Plan
| | | 2005 Plan
| | | 2006 Plan
| | | 2007 Plan
| | | 2008 Plan
| | | 2009 Plan
| | | 2010 Plan
| | | | | | | |
Purchase
| | |
Subscription
| | |
Subscription
| | |
Subscription
| | |
Subscription
| | |
Subscription
| | |
Subscription
| | |
Subscription
| | |
Subscription
| | | | | | Type of options | | options | | | options | | | options | | | options | | | options | | | options | | | options | | | options | | | options | | | Total
| | | Expiry date | | | 07/09/2010 | | | | 07/16/2011 | | | | 07/20/2012 | | | | 07/19/2013 | | | | 07/18/2014 | | | | 07/17/2015 | | | | 10/09/2016 | | | | 09/15/2017 | | | | 09/14/2018 | | | | | | Exercise price (€)(a) | | | 39.03 | | | | 32.84 | | | | 39.30 | | | | 49.04 | | | | 50.60 | | | | 60.10 | | | | 42.90 | | | | 39.90 | | | | 38.20 | | | | | | | | | | | | | | | | | | | | | | | | | | | | | | | | | | | | | | | | | | | | | | | | Options awarded by the Board(b) | | | 112,000 | | | | 112,000 | | | | 128,000 | | | | 130,000 | | | | 160,000 | | | | 200,000 | | | | 200,000 | | | | 200,000 | | | | 240,000 | | | | 1,482,000 | | Adjustments related to the spin-off of Arkema(c) | | | 1,576 | | | | 1,576 | | | | 1,800 | | | | 1,828 | | | | — | | | | — | | | | — | | | | — | | | | — | | | | 6,780 | | | | | | | | | | | | | | | | | | | | | | | | | | | | | | | | | | | | | | | | | | | | | Options outstanding as of 01/01/10 | | | 113,576 | | | | 113,576 | | | | 129,800 | | | | 131,828 | | | | 160,000 | | | | 200,000 | | | | 200,000 | | | | 200,000 | | | | — | | | | 1,248,780 | | | Options awarded in 2010 | | | | | | | | | | | | | | | | | | | | | | | | | | | | | | | | | | | 240,000 | | | | 240,000 | | | Options exercised in 2010 | | | | | | | | | | | | | | | | | | | | | | | | | | | | | | | | | | | — | | | | — | | Options canceled in 2010(d)(e) | | | (113,576 | ) | | | | | | | | | | | | | | | | | | | | | | | (23,333 | ) | | | | | | | | | | | (136,909 | ) | | Options outstanding as of 12/31/10 | | | — | | | | 113,576 | | | | 129,800 | | | | 131,828 | | | | 160,000 | | | | 200,000 | | | | 176,667 | | | | 200,000 | | | | 240,000 | | | | 1,351,871 | | | | | | | | | | | | | | | | | | | | | | | | | | | | | | | | | | | | | | | | | | | |
| | | (a) | | Exercise price as of May 24, 2006. To take into account thefour-for-one stock split that took place on May 18, 2006, the exercise price of stock options from plans then effective has been divided by four. In addition, to take into account the spin-off of Arkema, the exercise price of stock options was multiplied by an adjustment ratio of 0.986147, effective as of May 24, 2006. Exercise prices prior to May 24, 2006, are shown in Note 25 to the Consolidated Financial Statements. | (b) | | The number of options awarded before May 23, 2006, has been multiplied by four to take into account thefour-for-one stock split approved by the Shareholders’ Meeting on May 12, 2006. | (c) | | Adjustments approved by the Board on its meeting on March 14, 2006 pursuant toArticles 174-9,174-12 and174-13 of DecreeNo. 67-236 dated March 23, 1967 in effect at the time of the Board meeting and at the time of the Shareholders’ Meeting on May 12, 2006, related to the spin-off of Arkema. These adjustments were made on May 22, 2006 effective as of May 24, 2006. | (d) | | 113,576 options that were not exercised expired due to the expiry of the 2002 purchase option plan on July 9, 2010. | (e) | | The acquisition rate applicable to the subscription options that were subject to the performance condition of the 2008 plan was 60%. |
As part of the 2007, 2008, 2009, 2010 and 20102011 plans. In addition, he was not awarded any performance shares under plans in the Board has conditioned the grant of these optionsperiod 2005 to the Chairman and Chief Executive Officer on the satisfaction of performance conditions. For the 2008 plan, the acquisition rate, linked to the performance condition, was 60%.
As of December 31, 2010, the outstanding options of the Chairman and Chief Executive Officer represented 0.056%(1) of the Company’s potential share capital as of such date.
(1) Out of a total potential share capital of 2,398,908,757 shares.
103
| (1) | Out of a total potential share capital of 2,408,400,225 shares. |
STOCK OPTIONS AWARDED TO THE TEN EMPLOYEES (OTHER THAN
DIRECTORS) CORPORATE EXECUTIVE OFFICERS) RECEIVING THE LARGEST AWARDS / AWARDS/STOCK OPTIONS
EXERCISED BY THE TEN EMPLOYEES (OTHER THAN DIRECTORS)
CORPORATE EXECUTIVE OFFICERS) EXERCISING THE LARGEST NUMBER OF OPTIONS | | | | | | | | | | | | | | | | | | | | | Total number of options
| | | | | | | | | | | | | | awarded/ options
| | | | | | | | | | | | | | exercised | | | Exercise price (€)
| | | Grant date(a)
| | | Expiry date
| | | Options awarded in 2010 to the ten employees of TOTAL S.A., or any company in the Group, receiving the largest number of options | | | 742,000 | | | | 38.20 | | | | 09/14/2010 | | | | 09/14/2018 | | | | | | | | | | | | | | | | | | | | | Options exercised in 2010 by the ten employees of | | | 75,858 | | | | 39.03 | | | | 07/09/2002 | | | | 07/09/2010 | | | TOTAL S.A., or any company in the Group, | | | 79,793 | | | | 32.84 | | | | 07/16/2003 | | | | 07/16/2011 | | exercising the largest number of options(b) | | | 24,000 | | | | 39.30 | | | | 07/20/2004 | | | | 07/20/2012 | | | | | | | | | | | | | | | | | | | | | | | | 179,651 | | | | 36.32 | (c) | | | | | | | | |
| | | | | | | | | | | | | | | | | | | | Total number of
options
awarded/exercised | | | Exercise price (€) | | | Grant date(a) | | | Expiry date | | Options awarded in 2011 to the ten employees of TOTAL S.A., or any company in the Group, receiving the largest number of options | | | 430,400 | | | | 33.00 | | | | 09/14/2011 | | | | 09/14/2019 | | Options exercised in 2011 by the ten employees of TOTAL S.A., or any company in the Group, exercising the largest number of options(b) | | | 227,671 | | | | 32.84 | | | | 07/16/2003 | | | | 07/16/2011 | | | | | 9,736 | | | | 39.30 | | | | 07/20/2004 | | | | 07/20/2012 | | | | | 237,407 | | | | 33.10 | (c) | | | | | | | | |
| (a) | | | (a) | | The grant date is the date of the Board meeting awarding the options. |
| (b) | | Exercise price as of May 24, 2006. ToThe exercise prices of TOTAL stock options under the plans in force at that date were multiplied by 0.25 to take into account thefour-for-one stock split that took place on May 18, 2006, the exercise price of stock options from plans then effective has been divided by four. In addition, to take into account2006. Moreover, following the spin-off of Arkema, the exercise priceprices of TOTAL stock options wasunder these plans were multiplied by an adjustment ratio offactor equal to 0.986147 effective as of May 24, 2006. ExerciseThe exercise prices prior toeffective before May 24, 2006 are showngiven in Note 25, points A, B and C to the Consolidated Financial Statements. |
| (c) | | Weighted-average price. |
104
TOTAL restricted share grants GLOBAL FREE AND PERFORMANCE SHARE GRANTSTOTAL SHARE PLANglobal free share plan In addition to the restrictedperformance shares granted, the Board of Directors decided at its meeting on May 21, 2010, to implement a global free share plan intended for all the Group employees, that is, more than 100,000 employees. On June 30, 2010, rights to 25twenty-five free shares were granted to every employee. The shares are subject to a vesting period of two to four years depending on the case. However, theThe shares awardedgranted are not subject to aany performance condition. Following the vesting period, the shares will be issued. BREAKDOWN OF RESTRICTEDBreakdown of TOTAL SHARE GRANTSperformance share grants
The following table gives a breakdown of restrictedTOTAL performance share grants by category of grantee (executivebeneficiary (main executive officers, senior managersother executive officers and other employees). | | | | | | | | | | | | | | | | | | | | | | | | | | | | | | | | | | Average number
| | | | | | | | | | Number of
| | | | | | of restricted
| | | | | | | Number of
| | | restricted shares
| | | | | | shares per
| | | | | | | beneficiaries | | | awarded(a) | | | Percentage | | | beneficiary | | 2005 Plan(b) | | Executive officers(c) | | | 29 | | | | 13,692 | | | | 2.4 | % | | | 472 | | | Decision of the Board on | | Senior managers | | | 330 | | | | 74,512 | | | | 13.1 | % | | | 226 | | | July 19, 2005 | | Other employees(d) | | | 6,956 | | | | 481,926 | | | | 84.5 | % | | | 69 | | | | | Total | | | 7,315 | | | | 570,130 | | | | 100 | % | | | 78 | | | | | | | | | | | | | | | | | | | | | | 2006 Plan(b) | | Executive officers(c) | | | 26 | | | | 49,200 | | | | 2.2 | % | | | 1,892 | | | Decision of the Board on | | Senior managers | | | 304 | | | | 273,832 | | | | 12.0 | % | | | 901 | | | July 18, 2006 | | Other employees(d) | | | 7,509 | | | | 1,952,332 | | | | 85.8 | % | | | 260 | | | | | Total | | | 7,839 | | | | 2,275,364 | | | | 100 | % | | | 290 | | | | | | | | | | | | | | | | | | | | | | 2007 Plan(b) | | Executive officers(c) | | | 26 | | | | 48,928 | | | | 2.1 | % | | | 1,882 | | | Decision of the Board on | | Senior managers | | | 297 | | | | 272,128 | | | | 11.5 | % | | | 916 | | | July 17, 2007 | | Other employees(d) | | | 8,291 | | | | 2,045,309 | | | | 86.4 | % | | | 247 | | | | | Total | | | 8,614 | | | | 2,366,365 | | | | 100 | % | | | 275 | | | | | | | | | | | | | | | | | | | | | | 2008 Plan(b) | | Executive officers(c) | | | 25 | | | | 49,100 | | | | 1.8 | % | | | 1,964 | | | Grant on October 9, | | Senior managers | | | 300 | | | | 348,156 | | | | 12.5 | % | | | 1,161 | | | 2008, by decision of | | Other employees(d) | | | 9,028 | | | | 2,394,712 | | | | 85.8 | % | | | 265 | | | the Board | | | | | | | | | | | | | | | | | | | | on September 9, 2008 | | Total | | | 9,353 | | | | 2,791,968 | | | | 100 | % | | | 299 | | | | | | | | | | | | | | | | | | | | | | | 2009 Plan | | Executive officers(c) | | | 25 | | | | 48,700 | | | | 1.6 | % | | | 1,948 | | | Decision of the Board on | | Senior managers | | | 284 | | | | 329,912 | | | | 11.1 | % | | | 1,162 | | | September 15, 2009 | | Other employees(d) | | | 9,693 | | | | 2,593,406 | | | | 87.3 | % | | | 268 | | | | | Total | | | 10,002 | | | | 2,972,018 | | | | 100 | % | | | 297 | | | | | | | | | | | | | | | | | | | | | | 2010 Plan(e) | | Executive officers(c) | | | 24 | | | | 46,780 | | | | 1.6 | % | | | 1,949 | | | Decision of the Board on | | Senior managers | | | 283 | | | | 343,080 | | | | 11.4 | % | | | 1,212 | | | September 14, 2010 | | Other employees(d) | | | 10,074 | | | | 2,620,151 | | | | 87.0 | % | | | 260 | | | | | Total | | | 10,381 | | | | 3,010,011 | | | | 100 | % | | | 290 | |
| | | | | | | | | | | | | | | | | | | | | | | | Number of
beneficiaries | | | Number
of shares
awarded(a) | | | Percentage | | | Average
number of
shares per
beneficiary | | 2005 Plan(b) | | Main executive officers(c) | | | 29 | | | | 13,692 | | | | 2.4 | % | | | 472 | | Decision of the Board on July 19, 2005 | | Other executive officers | | | 330 | | | | 74,512 | | | | 13.1 | % | | | 226 | | | | Other employees(d) | | | 6,956 | | | | 481,926 | | | | 84.5 | % | | | 69 | | | | Total | | | 7,315 | | | | 570,130 | | | | 100 | % | | | 78 | | | | | | | | 2006 Plan(b) | | Main executive officers(c) | | | 26 | | | | 49,200 | | | | 2.2 | % | | | 1,892 | | Decision of the Board on July 18, 2006 | | Other executive officers | | | 304 | | | | 273,832 | | | | 12.0 | % | | | 901 | | | | Other employees(d) | | | 7,509 | | | | 1,952,332 | | | | 85.8 | % | | | 260 | | | | Total | | | 7,839 | | | | 2,275,364 | | | | 100 | % | | | 290 | | | | | | | | 2007 Plan(b) | | Main executive officers(c) | | | 26 | | | | 48,928 | | | | 2.1 | % | | | 1,882 | | Decision of the Board on July 17, 2007 | | Other executive officers | | | 297 | | | | 272,128 | | | | 11.5 | % | | | 916 | | | | Other employees(d) | | | 8,291 | | | | 2,045,309 | | | | 86.4 | % | | | 247 | | | | Total | | | 8,614 | | | | 2,366,365 | | | | 100 | % | | | 275 | | | | | | | | 2008 Plan(b) | | Main executive officers(c) | | | 25 | | | | 49,100 | | | | 1.8 | % | | | 1,964 | | | Awarded on October 9, 2008, by decision of the Board of Directors on September 9, 2008 | | Other executive officers | | | 300 | | | | 348,156 | | | | 12.5 | % | | | 1,161 | | | | Other employees(d) | | | 9,028 | | | | 2,394,712 | | | | 85.8 | % | | | 265 | | | | Total | | | 9,353 | | | | 2,791,968 | | | | 100 | % | | | 299 | | | | | | | | 2009 Plan(b) | | Main executive officers(c) | | | 25 | | | | 48,700 | | | | 1.6 | % | | | 1,948 | | Decision of the Board on September 15, 2009 | | Other executive officers | | | 284 | | | | 329,912 | | | | 11.1 | % | | | 1,162 | | | | Other employees(d) | | | 9,693 | | | | 2,593,406 | | | | 87.3 | % | | | 268 | | | | Total | | | 10,002 | | | | 2,972,018 | | | | 100 | % | | | 297 | | | | | | | | 2010 Plan(e) | | Main executive officers(c) | | | 24 | | | | 46,780 | | | | 1.6 | % | | | 1,949 | | Decision of the Board on September 14, 2010 | | Other executive officers | | | 283 | | | | 343,080 | | | | 11.4 | % | | | 1,212 | | | | Other employees(d) | | | 10,074 | | | | 2,620,151 | | | | 87.0 | % | | | 260 | | | | Total | | | 10,381 | | | | 3,010,011 | | | | 100 | % | | | 290 | | | | | | | | 2011 Plan | | Main executive officers(c) | | | 29 | | | | 184,900 | | | | 5.1 | % | | | 6,376 | | Decision of the Board on September 14, 2011 | | Other executive officers | | | 274 | | | | 624,000 | | | | 17.1 | % | | | 2,277 | | | | Other employees(d) | | | 9,658 | | | | 2,840,870 | | | | 77.8 | % | | | 294 | | | | Total | | | 9,961 | | | | 3,649,770 | | | | 100 | % | | | 366 | |
| (a) | | | (a) | | The number of restrictedperformance shares awarded shown in this table has not been recalculatedadjusted to take into account thefour-for-one stock split approved by the Shareholders’ Meeting on May 12, 2006. |
| (b) | | For the 2005, 2006, 2007 and 2007 plans,2009 Plans, the acquisition rates of the shares awarded, linked to the performance conditions, were 100%. For the 2008 plan,Plan, the acquisition rate, linked to the performance condition, was 60%. |
| (c) | | Members of the Management Committee and the Treasurer as of the date of the Board meeting granting the restrictedperformance shares. The Chairman of the Board and the Chief Executive Officer were not awarded any restricted shares.performance shares, with the exception of the 2011 Plan. On September 14, 2011, the Board of Directors of TOTAL S.A. decided to grant 16,000 performance shares to Mr. de Margerie. |
| (d) | | Mr. Clément, employee of Total Raffinage Marketing, a subsidiary of TOTAL S.A. and the director of TOTAL S.A. representing employee shareholders, was awarded 320 restrictedperformance shares under the 2005 plan,Plan, 200 restrictedperformance shares under the 2007 plan,Plan, 500 restrictedperformance shares under the 2008 plan andPlan, 240 restrictedperformance shares under the 2010 plan.Plan and 240 performance shares under the 2011 Plan. |
| (e) | | Excluding free shares granted as part of the 2010 global free share plan. |
The grant of these restrictedperformance shares, which were bought back by the Company on the market, will become final after a2-year vesting period. This final grant is subject to continued employmenta presence condition and a performance condition performances.(see “— Stock options and performance share grants policy — General policy”). Moreover, the transfer of the restrictedperformance shares will not be permitted until the end of a2-year mandatory holding period.
105
RESTRICTEDPERFORMANCE SHARE PLANS AS OF DECEMBER 31, 20102011
| | | | | | | | | | | | | | | | | | | | | | | | | | | | | 2005
| | | | | | | | | | | | | | | | | | | | Plan(a) | | | 2006 Plan | | | 2007 Plan | | | 2008 Plan | | | 2009 Plan | | | 2010 Plan | | Date of the Shareholders’ Meeting | | | 05/17/2005 | | | | 05/17/2005 | | | | 05/17/2005 | | | | 05/16/2008 | | | | 05/16/2008 | | | | 05/16/2008 | | Grant date(b) | | | 07/19/2005 | | | | 07/18/2006 | | | | 07/17/2007 | | | | 10/09/2008 | | | | 09/15/2009 | | | | 09/14/2010 | | Closing price on grant date(c) | | | €52.13 | | | | €50.40 | | | | €61.62 | | | | €35.945 | | | | €41.615 | | | | €39.425 | | | Average repurchase price per share paid by the Company | | | €51.62 | | | | €51.91 | | | | €61.49 | | | | €41.63 | | | | €38.54 | | | | €39.11 | | | Total number of restricted shares awarded, including to | | | 2,280,520 | | | | 2,275,364 | | | | 2,366,365 | | | | 2,791,968 | | | | 2,972,018 | | | | 3,010,011 | | • Directors(d) | | | 416 | | | | 416 | | | | 432 | | | | 588 | | | | — | | | | 240 | | • Ten employees with largest grants(e) | | | 20,000 | | | | 20,000 | | | | 20,000 | | | | 20,000 | | | | 20,000 | | | | 20,000 | | | Start of the vesting period: | | | 07/19/2005 | | | | 07/18/2006 | | | | 07/17/2007 | | | | 10/09/2008 | | | | 09/15/2009 | | | | 09/14/2010 | | | Date of final grant, subject to specific condition (end of the vesting period) | | | 07/20/2007 | | | | 07/19/2008 | | | | 07/18/2009 | | | | 10/10/2010 | | | | 09/16/2011 | | | | 09/15/2012 | | | Transfer possible from (end of the mandatory holding period) | | | 07/20/2009 | | | | 07/19/2010 | | | | 07/18/2011 | | | | 10/10/2012 | | | | 09/16/2013 | | | | 09/15/2014 | | | | | | | | | | | | | | | | | | | | | | | | | | | | | Number of restricted shares: | | | | | | | | | | | | | | | | | | | | | | | | | | • Outstanding as of January 1, 2010 | | | — | | | | — | | | | — | | | | 2,762,476 | | | | 2,966,036 | | | | | | | • Awarded in 2010 | | | | | | | | | | | — | | | | | | | | — | | | | 3,010,011 | | • Canceled in 2010(f) | | | 1,024 | (h) | | | 3,034 | (h) | | | 552 | (h) | | | (1,113,462 | ) | | | (9,796 | ) | | | (8,738 | ) | • Finally granted in 2010(g) | | | (1,024 | )(h) | | | (3,034 | )(h) | | | (552 | )(h) | | | (1,649,014 | ) | | | (1,904 | ) | | | (636 | ) | | • Outstanding as of December 31, 2010 | | | — | | | | — | | | | — | | | | — | | | | 2,954,336 | | | | 3,000,637 | | | | | | | | | | | | | | | | | | | | | | | | | | | |
| | | | | | | | | | | | | | | | | | | | | | | | | | | | | | | | 2005 Plan(a) | | | 2006 Plan | | | 2007 Plan | | | 2008 Plan | | | 2009 Plan | | | 2010 Plan | | | 2011 Plan | | Date of the Shareholders’ Meeting | | | 05/17/2005 | | | | 05/17/2005 | | | | 05/17/2005 | | | | 05/16/2008 | | | | 05/16/2008 | | | | 05/16/2008 | | | | 05/13/2011 | | Grant date(b) | | | 07/19/2005 | | | | 07/18/2006 | | | | 07/17/2007 | | | | 10/09/2008 | | | | 09/15/2009 | | | | 09/14/2010 | | | | 09/14/2011 | | Closing price on grant date(c) | | | €52.13 | | | | €50.40 | | | | €61.62 | | | | €35.945 | | | | €41.615 | | | | €39.425 | | | | €32.69 | | Average repurchase price per share paid by the Company | | | €51.62 | | | | €51.91 | | | | €61.49 | | | | €41.63 | | | | €38.54 | | | | €39.11 | | | | €39.58 | | Total number of performance shares awarded, including to | | | 2,280,520 | | | | 2,275,364 | | | | 2,366,365 | | | | 2,791,968 | | | | 2,972,018 | | | | 3,010,011 | | | | 3,649,770 | | —Directors(d) | | | 416 | | | | 416 | | | | 432 | | | | 588 | | | | — | | | | 240 | | | | 16,240 | | —Ten employees with largest grants(e) | | | 20,000 | | | | 20,000 | | | | 20,000 | | | | 20,000 | | | | 20,000 | | | | 20,000 | | | | 91,400 | | Start of the vesting period: | | | 07/19/2005 | | | | 07/18/2006 | | | | 07/17/2007 | | | | 10/09/2008 | | | | 09/15/2009 | | | | 09/14/2010 | | | | 09/14/2011 | | Date of final grant, subject to specific condition (end of the vesting period) | | | 07/20/2007 | | | | 07/19/2008 | | | | 07/18/2009 | | | | 10/10/2010 | | | | 09/16/2011 | | | | 09/15/2012 | | | | 09/15/2013 | | Transfer possible from (end of the mandatory holding period) | | | 07/20/2009 | | | | 07/19/2010 | | | | 07/18/2011 | | | | 10/10/2012 | | | | 09/16/2013 | | | | 09/15/2014 | | | | 09/15/2015 | | Number of performance shares: | | | | | | | | | | | | | | | | | | | | | | | | | | | | | — Outstanding as of January 1, 2011 | | | — | | | | — | | | | — | | | | — | | | | 2,954,336 | | | | 3,000,637 | | | | — | | —Awarded in 2011 | | | — | | | | — | | | | — | | | | | | | | — | | | | — | | | | 3,649,770 | | —Canceled in 2011 | | | 800 | (g) | | | 700 | (g) | | | 792 | (g) | | | 356 | (g) | | | (26,214 | ) | | | (10,750 | ) | | | (19,579 | ) | —Finally granted in 2011(f) | | | (800 | )(g) | | | (700 | )(g) | | | (792 | )(g) | | | (356 | )(g) | | | (2,928,122 | ) | | | (1,836 | ) | | | — | | —Outstanding as of December 31, 2011 | | | — | | | | — | | | | — | | | | — | | | | — | | | | 2,988,051 | | | | 3,630,191 | |
| (a) | | | (a) | | The number of restrictedperformance shares awarded has been multiplied by four to take into account thefour-for-one stock split approved by TOTAL Shareholders’ Meeting on May 12, 2006. |
| (b) | | The grant date is the date of the Board meeting awarding the restrictedperformance share grant, except for the restrictedperformance shares awarded on October 9, 2008, approved by the Board on September 9, 2008. |
| (c) | | To take into account thefour-for-one stock split in May 18, 2006, the closing price for TOTAL shares on July 19, 2005 (€(€208.50) has been divided by four. |
| (d) | | Mr. Desmarest, Chairman of the Board of Directors of TOTAL S.A. until May 21, 2010, was not awarded any restricted shares under the 2005, 2006, 2007, 2008 2009 and 2010 plans. Furthermore, Mr. de Margerie, director of TOTAL S.A. since May 12, 2006, Chief Executive Officer of TOTAL S.A. since February 14,13, 2007 and Chairman and Chief Executive Officer of TOTAL S.A. since May 21, 2010, were not awarded performance shares under the plans approved by the Board of Directors of TOTAL S.A. on July 18, 2006, July 17, 2007, September 9, 2008, September 15, 2009 and September 14, 2010. Furthermore, Mr. Desmarest was not awarded any restrictedperformance shares under the 2006, 2007, 2008, 2009 and 2010 plans.plan approved by the Board of Directors of TOTAL S.A. on July 19, 2005. On September 14, 2011, the Board of Directors of TOTAL S.A. decided to grant 16,000 performance shares to Mr. de Margerie was finally awarded on July 20, 2007, the 2,000 restricted shares he had been awarded under the 2005 plan since he was not a director of TOTAL S.A as of the date of the grant.Margerie. In addition, Mr. Boeuf, director of TOTAL S.A. representing employee shareholders until December 31, 2009, was awarded restrictedperformance shares under the plans approved by the Board of Directors of TOTAL S.A. on July 19, 2005, July 18, 2006, July 17, 2007 and September 9, 2008. Mr. Boeuf was not awarded any restrictedperformance shares under the plan approved by the Board of Directors of TOTAL S.A. on September 15, 2009. |
| Mr. Clément, director of TOTAL S.A. representing employee shareholders since May 21, 2010, was awarded 240 restrictedperformance shares under the plan approved by the Board of Directors of TOTAL S.A. on September 14, 2010.2011. In addition, Mr. Clément was finally awarded 300240 performance shares on October 10, 2010, under the restricted share plan approved by the Board of Directors of TOTAL S.A. on September 9, 2008.14, 2010. |
| (e) | | Employees of TOTAL S.A., or of any Group company, who were not directors of TOTAL S.A. as of the date of grant. |
| (f) | | Out of the 1,113,462 canceled rights to the grant share under the 2008 plan, 1,094,914 entitlement rights were canceled due to the performance condition. The acquisition rate for the 2008 plan was 60%. | (g) | | For the 2009 and 2010 plans,Plan, final grants following the death of the beneficiary. |
(h)(g) | | RestrictedPerformance shares finally awarded for which the entitlement right had been canceled erroneously. |
In case of a final grant of the outstanding restrictedperformance shares as of December 31, 2010,2011, the corresponding shares would represent 0.25%0.27%(1) of the Company’s potential share capital as of such date. (1) Out of a total potential share capital of 2,398,908,757 shares.
106
| (1) | Out of a total potential share capital of 2,408,400,225 shares. |
FOLLOW-UP OF THE GLOBAL FREE SHARE PLAN AS OF DECEMBER 31, 2010 | | | | | | | | | | | | | | | | | 2010 plan
| | | 2010 plan
| | | | | | | | (2+2) | | | (4+0) | | | Total | | Date of the Shareholders’ Meeting | | | 05/16/2008 | | | | 05/16/2008 | | | | | | Grant date(a) | | | 06/30/2010 | | | | 06/30/2010 | | | | | | Final grant date (end of vesting period) | | | 07/01/2012 | | | | 07/01/2014 | | | | | | Transfer possible from | | | 07/01/2014 | | | | 07/01/2014 | | | | | | | | | | | | | | | | | | | | Number of restricted shares awarded | | | | | | | | | | | | | Outstanding as of January 1, 2008 | | | — | | | | — | | | | — | | | Awarded | | | — | | | | — | | | | — | | | Canceled | | | — | | | | — | | | | — | | | Finally granted | | | — | | | | — | | | | — | | Outstanding as of January 1, 2009 | | | — | | | | — | | | | — | | | Awarded | | | — | | | | — | | | | — | | | Canceled | | | — | | | | — | | | | — | | | Finally granted | | | — | | | | — | | | | — | | Outstanding as of January 1, 2010 | | | — | | | | — | | | | — | | | Awarded | | | 1,508,850 | | | | 1,070,650 | | | | 2,579,500 | | | Canceled | | | (125 | ) | | | (75 | ) | | | (200 | ) | Finally granted(c) | | | (75 | ) | | | | | | | (75 | ) | Outstanding as of December 31, 2010 | | | 1,508,650 | | | | 1,070,575 | | | | 2,579,225 | | | | | | | | | | | | | | | |
| | | | | | | | | | | | | | | | 2010 Plan
(2+2)(b) | | | 2010 Plan
(4+0)(c) | | | Total | | Date of the Shareholders’ Meeting | | | 05/16/2008 | | | | 05/16/2008 | | | | | | Grant date(a) | | | 06/30/2010 | | | | 06/30/2010 | | | | | | Final grant date | | | 07/01/2012 | | | | 07/01/2014 | | | | | | Transfer possible from | | | 07/01/2014 | | | | 07/01/2014 | | | | | | Outstanding as of January 1, 2010 | | | | | | | | | | | | | Awarded | | | 1,508,850 | | | | 1,070,650 | | | | 2,579,500 | | Canceled | | | (125 | ) | | | (75 | ) | | | (200 | ) | Finally granted(d) | | | (75 | ) | | | | | | | (75 | ) | Outstanding as of January 1, 2011 | | | 1,508,650 | | | | 1,070,575 | | | | 2,579,225 | | Awarded | | | — | | | | — | | | | — | | Canceled | | | (29,175 | ) | | | (54,625 | ) | | | (83,800 | ) | Finally granted(d) | | | (475 | ) | | | (425 | ) | | | (900 | ) | Outstanding as of December 31, 2011 | | | 1,479,000 | | | | 1,015,525 | | | | 2,494,525 | |
| (a) | | | (a) | | The June 30, 2010 grant was decided by the Board of Directors on May 21, 2010. |
| (b) | Vesting period of two years followed by a holding period of two years. |
| (c) | Vesting period of four years without a holding period. |
| (d) | Final grant following the death or disability of the beneficiary of the shares. |
In case of a final grant of the outstanding shares as of December 31, 2010,2011, the corresponding shares would represent 0.11%0.10%(1) of the Company’s potential share capital as of such date. RESTRICTEDPERFORMANCE SHARE GRANTS TO THE TEN EMPLOYEES (OTHER THAN DIRECTORS)CORPORATE EXECUTIVE OFFICERS) RECEIVING THE LARGEST AMOUNTNUMBER OF GRANTS / RESTRICTED SHARE FINALLY AWARDED TO THE TEN EMPLOYEES (OTHER THAN DIRECTORS) RECEIVING THE LARGEST AMOUNT OFPERFORMANCE SHARES
| | | | | | | | | | | | | | | | | | | | Restricted shareNumber of
performance shares
granted/finally
awarded | | | Grant date | | | | | | grants / SharesDate of
final grant
(end of
vesting
period) | | | End of
mandatory
holding
period | | | End of mandatory
| | | finally awarded | | Grant date
| | Date of final grant
| | holding period
| RestrictedPerformance share grants approved by the Board meeting on September 14, 20102011 to the ten TOTAL S.A. employees (other than directors)corporate executive officers) receiving the largest amountnumber of grantsperformance shares(a) | | | 20,00091,400 | (b) | | | 09/14/20102011 | | | | 09/15/20122013 | | | | 09/15/20142015 | | | | | | | | | | | | | | | | | | | Restricted sharePerformance shares finally awarded in 20102011 following the restrictedperformance share plan approved by the Board meeting on September 9, 2008,15, 2009, to the ten employees (other than directors)corporate executive officers) at the time of such approval receiving the largest amountnumber of performance shares(c)(b) | | | 12,00020,000 | | | | 10/09/200815/2009 | | | | 10/10/201009/16/2011 | | | | 10/10/2012 | | | | | | | | | | | | | | | | | 09/16/2013 | |
| (a) | | | (a) | | Grant approved by the Board on September 14, 2010.2011. Grants of these restrictedperformance shares will become final, subject to a performance condition, after a2-year vesting period i.e.(i.e., on September 15, 2012.2013) (see “— Stock options and performance share grants policy — General policy”). Moreover, the transfer of the restrictedperformance shares will not be permitted until the end of a2-year mandatory holding period i.e.(i.e., on September 15, 2014.2015). |
| (b) | | In addition, as of June 30, 2010, as part of the global free share plan, the ten employees were granted rights to twenty-five free shares. | (c) | | Restricted share plan approved by the Board of Directors on September 9, 2008, and awarded on October 9, 2008. Grants of these restricted shares will becomeThis final grant is subject to a performance condition after a2-year vesting period, i.e. on October 10, 2010.(see “— Stock options and performance share grants policy — General policy”). The acquisition rate of the shares awarded, linked to the performance condition, was 60%100%. Moreover, the transfer of the restrictedperformance shares finally awarded will only be permitted after the end of a2-year mandatory holding period i.e.(i.e., from October 10, 2012.September 16, 2013). |
(1) Out of a total potential share capital of 2,398,908,757 shares.
107
| (1) | Out of a total potential share capital of 2,408,400,225 shares. |
CORPORATE GOVERNANCE For several years, TOTAL has been actively examining corporate governance matters. At its meeting on November 4, 2008, the Board of Directors confirmed its decision to userefer to the Corporate Governance Code for Listed Companies published by the principal French business confederations, theAssociation Française des Entreprises Privées(AFEP) and theMouvement des Entreprises de France (MEDEF) (“AFEP-MEDEF Code”) as its reference for corporate governance matters. The AFEP-MEDEF Code was amended in April 2010 to make recommendations related to the balanced number of men and women sitting in Board and Committees’ meetings. The code recommends that a target of at least 20% of women be reached before April 2013 and at least 40% before April 2016. These requirements were also stipulated in the French law of January 27, 2011 regarding balanced representation of men and women on Boards of Directors and Supervisory Boards and equal opportunity. The law states that the 20% threshold must be attained at the end of the 2014 Shareholders’ Meeting and that the 40% threshold must be attained at the end of the 2017 Shareholders’ Meeting. As of December 31, 2010,2011, the Company’s Board of Directors was comprised of twofour women out of a total of fifteen members (i.e.,13% 26%). At the Shareholders’ Meeting in May 2011,2012, it will be proposed to appoint twoone additional womenwoman to replace two directorsone director whose terms areterm is coming to an end. If the resolutions areresolution is approved by the Shareholders’ Meeting, the percentageproportion of women sitting inon the Board will rise to 26%.be one-third. The Board of Directors will keep examining corporate governance issues to continuekeep diversifying in the years to come. The Company’s corporate governanceAt its meeting on February 8, 2012, the Nominating & Governance Committee examined current practices differ from the recommendations contained in the Company in view of the AFEP-MEDEF Code oncode and concluded that the following limited matters: | | • | The AFEP-MEDEF Code recommends that a director no longer be considered as independent upon the expiry of the term of office during which the length of his service on the board reaches twelve years. The Board has not followed this recommendation with regards to one of its members considering the long-term nature of its investments and operation as well as the experience and authority of which this director is in possession, which reinforce his independence and contribute to the Board’s work. This directorship expired on May 21, 2010. | | • | Company complied with almost all the recommendations. Mr. Thierry Desmarest, chairs the Nominating & Governance Committee since it was created in February 2007. Although Mr. Desmarest chaired the Board of Directors until May 2010, the Board and this Committee considered that Mr. Desmarest chairing the Nominating & Governance Committee would enable this Committee to benefit from his experience and his knowledge of the Company’s businesses, environment and executive teams, which is particularly useful to inform the Committee’s deliberations concerning the appointment of executives and directors. This committee is comprised of a majority of independent directors and the Chairman and the Chief Executive Officer do not attend deliberations concerning their own situation. |
Mr. Desmarest, who was appointed Honorary Chairman of TOTALthe Company and renewed as a director, on May 21, 2010, can still be entrusted with representative missions for the Group.
In compliance with the AFEP-MEDEF Code, the Chairman and Chief Executive Officer does not have any employment contract with the Group, or any companyby decision of the Group.
Board of Directors on May 21, 2010.Since 2004, the Board of Directors has had a Financial Code of Ethics that, in the overall context of the Group’s Code of Conduct, sets forth specific rules for its Chairman, Chief Executive Officer, Chief Financial Officer, Chief Accounting Officer and the financial and accounting officers for its principal activities. The Board has made the Audit Committee responsible for implementing and ensuring compliance with this code. In 2005, the Board approved the procedure for alerting the Audit Committee of complaints or concerns regarding accounting, internal accounting controls or auditing matters. Rules of procedure of the Board of Directors At its meeting on February 13, 2007, the Board of Directors adopted rules of procedure to replace the Directors’ Charter. The Board’s rules of procedure specify the obligations of each director and set forth the mission and working procedures of the Board of Directors. They also define the respective responsibilities and authority of the Chairman and of the Chief Executive Officer. It is reviewed on a regular basis to match the changes in rules and practices related to governance. An unabridged version of these rules of procedure, which were approved by the Board of Directors of TOTAL S.A.(1), is available herein. Mission of the Board of Directors The mission of the Board of Directors is to determine the strategic direction of the Group and supervise the implementation of this vision. With the exception of the powers and authority expressly reserved for shareholders
108
and within the limits of the Company’s legal purpose, the Board may address any issue related to the operation of the Company and take any decision concerning the matters falling within its purview. Within this framework, the Board’s duties and responsibilities include, but are not limited to, the following: | • | | • | appointing the Chairman and the Chief Executive Officer(2) and supervising the handling of their responsibilities; |
defining the Company’s strategic orientation and, more generally, that of the Group; • (1) | definingIn these rules of procedure, TOTAL S.A. is referred to as the Company’s strategic orientation“Company” and, more generally, thatcollectively with all of its direct and indirect subsidiaries, as the Group; | • | approving investments or divestments under study by the Group that concern amounts greater than 3% of shareholders’ equity, whether or not the project is part of the announced strategy; | • | reviewing information on significant events related to the Company’s affairs, in particular for investments or divestments that are greater than 1% of shareholders’ equity; | • | conducting audits and investigations as it may deem appropriate. The Board, with the assistance of the Audit committee where appropriate, ensures that:“Group”. |
| (2) | | The Chairman and Chief Executive Officer, if the Chairman of the Board of Directors is also responsible for the general management of the Company, the Chairman of the Board of Directors and the Chief Executive Officer, if this is not the case, and, where appropriate, any acting Managing Directors, in accordance with the organization adopted by the Board of Directors. |
approving investments or divestments under study by the Group that concern amounts greater than 3% of shareholders’ equity; reviewing information on significant events related to the Company’s affairs, in particular for investments or divestments that are greater than 1% of shareholders’ equity; conducting audits and investigations as it may deem appropriate. The Board, with the assistance of the Audit Committee where appropriate, ensures that: | | – | | the proper definition of authority within the Company has been properly delegated before it is exercised, and that the various entitiesproper exercise of duties and responsibilities by the bodies of the Company respect the authority, duties and responsibilities they have been given;are in place; |
| | – | | no individual is authorized to contract on behalf of the Company or to commit to pay, or to make payments, on behalf of the Company, without proper supervision and control; |
| | – | | the internal control function operates properly and that the statutory auditors are able to conduct their audits under appropriate circumstances; and |
| | – | | the committees it has created duly perform their responsibilities; |
| | • | monitoring the quality of the information provided to the shareholders and the financial markets through the financial statements that it approves and the annual reports, or when major transactions are conducted; | • | convening and setting the agenda for Shareholders’ Meetings; | • | preparing, for each year, a list of the directors it deems to be independent under generally recognized corporate governance criteria; and | • | the Board of Directors is regularly informed, through the Audit Committee, of the Group’s financial position, cash position and obligations. |
monitoring the quality of the information provided to the shareholders and the financial markets through the financial statements that it approves and the annual reports, or when major transactions are conducted; convening and setting the agenda for Shareholders’ Meetings or meetings of bondholders; preparing, for each year, a list of the directors it deems to be independent under generally recognized corporate governance criteria. Directors’ obligations Before accepting a directorship, every candidate receives a copy of TOTAL S.A.’s by-laws and Rulesrules of Procedures.procedure. He ensures that he has broad knowledge of the general and particular commitments related to his duty, especially the laws and regulations governing directorships in French limited liability companies (société anonyme) whose shares are listed in one or several regulated markets. Accepting a directorship involves upholding the RulesDirectors’ ethical rules as described in the Code of ProceduresCorporate Governance to which the Company refers. It also involves upholding the rules of procedure and the Group’s values as described in its Code of Conduct. When directors participate in and vote at Board meetings, they are required to represent the interest of the shareholders and the Company as a whole. Independence of judgment: Directors undertake, under any circumstance, to maintain the independence of their analysis, judgment, decision making and actions as well as not to be unduly influenced, directly or indirectly, by other directors, particular groups of shareholders, creditors, suppliers and, more generally, any third-party. third party.Preparation of each Board’s meeting:Board meeting: Directors undertake to devote the amount of time required to consider the information they are given and otherwise prepare for meetings of the Board and of the committees on which they sit. Directors may request any additional information that they feel is necessary or useful from the Chairman and Chief Executive Officer. Directors, if they consider it necessary, may request training on the Company’s specificities, businesses and activities. activities, and any other training that is of use in the exercise of their duties as Directors.Directors attend all Board meetings and all committees or Shareholders’ Meetings, unless they have previously contacted the Chairman to inform him of scheduling conflicts. Files reviewed at each meeting of the Board as well as the information collected before or during the meetings are confidential. Directors cannot use them for or share them with a third party whatever the reason. Directors take any necessary measures to keep them confidential. Confidentiality and privacy are lifted when such information areis made publicly available by the Company. The Chairman of the Board makes sure that the Company provides the directors with the relevant information, including criticisms, in particular financial statement reports and press releases. releases, and the main press articles about the Company.Duty of loyalty:loyalty: Directors cannot take advantage of histheir office or duties to ensure, for himselfthemselves or a third party, any monetary or non-monetary benefit.
109
They notify the Board of Directors of any potential conflicts of interest with the Company or any other company of the Group. They refrain from participating in the vote relating to the corresponding resolution or even to the debate preceding the vote. Directors must inform the Board of Directors of their entering ininto a transaction that involves directly the Company or any other company of the Group before such transaction is closed. Directors cannot take any responsibility in a personal capacity in companies or businesses that are competing with the Company or any other company of the Group without previously informing the Board. Directors are committed not to seek or accept directly or indirectly from the Company or any other company of the Group benefits that may be considered as compromising their independence. Duty of expression:expression: Directors are committed to clearly expressing their opposition if they deem that a decision made by the Board of Directors is contrary to the Company’s corporate interest and should strive to convince the Board of the relevancy of their position. Company’s securities and stock exchange rules:rules: While in office, directors are required to hold the minimum number of registered shares as set by the Company’s by-laws (i.e., 1,000 shares — with the exception of the director representing employee shareholders for whom the requirements are more flexible). by-laws.Directors refrain from trading any shares and ADRs of TOTAL S.A. and its publicly traded subsidiaries for which they hold non-public information that could impact the securities’ market value. To this purpose, directors act in compliance with the following procedures: | • | | • | any shares and ADRs of TOTAL S.A. and its publicly traded subsidiaries are to be held in registered form, either bearer shares with the Company or its agent (currently BNP-Paribas Securities Services for TOTAL shares and Bank of New-York Mellon for TOTAL ADRs)(1), or administered registered shares with a French broker (or U.S. broker for ADRs) whose contact details are communicated to the Board’s SecretariatSecretary by the director; |
buying on margin or short selling (Paris option market (MONEP), warrants, exchangeable obligations, etc.) those same securities is also prohibited; any transaction on the TOTAL share (or ADR) is strictly prohibited, including hedging transactions, on the day when the Company discloses its periodic earnings (quarterly, interim and annual) as well as the fifteen calendar days preceding such date; and | • | buying on margin or short selling (Paris option market (MONEP), warrants, exchangeable obligations, etc.) those same securities is also prohibited; | • | any transaction of the TOTAL share (or ADR) is strictly prohibited, including hedging transactions, on the day when the Company discloses its periodic earnings (quarterly, interim and annual) as well as the fifteen calendar days preceding such date; and | • | directors make all necessary arrangements to declare to the French Financial Markets Authority (Autorité des marchés financiers) and inform the Board’s secretary, under the form and timeframe provided for by applicable laws, of any transaction on the company’s securities entered into by himself or any other individual with whom he is closely related. |
Workings of the Board of Directors practices The Board of Directors meets at least four times a year and as often as circumstances may require. Before each meeting of the Board, the agenda is sent out to directors and, whenever possible, it is sent together with the documents that are necessary to consider. Directors can delegate their authority to another director at the meetings of the Board, within the limit of one delegation per director per meeting. Whenever authorized by the law, those directors attending the meeting of the Board via video conference (in compliance with the technical requirements set by applicable regulations) are considered present for the calculation of the quorum and majority. The Board allocates directors’ fees to, and may allocate additional directors’ fees to, directors who participate on specialized committees within the total amount established by the Shareholders’ Meeting. The Chairman and the Chief Executive Officer are not awarded directors’ fees for their work on the Board and Committees. The Board of Directors, based on the recommendation of its Chairman, appoints a Secretary. Every member of the Board of Directors can refer to the Secretary and benefit from his assistance. The Secretary is responsible for the working procedures of the Board of Directors. The Board shall review such procedures periodically. The Board conducts, at regular intervals not to exceed three years, an assessment of its practices. Such assessment is carried out possibly under the supervision of an independent director or with the contribution of an outside counsel. In addition, the Board of Directors conducts an annual discussion of its methods. Responsibility and authority of the Chairman The Chairman represents the Board, and, except under exceptional circumstances, is the sole member authorized to act and speak on behalf of the Board.
110
He is responsible for organizing and presiding over the Board’s activities and monitors corporate bodies to ensure that they are functioning effectively and respecting corporate governance principles. He coordinates the activity of the Board and its committees. He sets the agenda for the meeting by including the issues proposed by the Chief Executive Officer. He ensures that directors have in due course clear and appropriate information that areis necessary to carry out their duties. He is responsible, with the Group’s general management, for maintaining relations between the Board and the Company’s shareholders. He monitors the quality of the information disclosed by the Company. In close cooperation with the Group’s general management, he may represent the Group in high levelhigh-level discussions with government authorities and the Group’s important partners, on both a national and international level. | (1) | Currently, BNP Paribas Securities Services for TOTAL shares and Bank of New York for TOTAL ADRs. |
He is regularly informed by the Chief Executive Officer of events and situations that are important for the Group relating to the strategy, organization, monthly financial reporting, major investment and divestment projects and major financial operations. He may request that the Chief Executive Officer or other Company directors, provided the Chief Executive Officer is informed, provide any useful information for the Board or its committees to carry out their duties. He may also work with the statutory auditors to prepare matters before the Board or the Audit Committee. He presents every year in a report to the Shareholders’ Meeting, practices of the Board of Directors and potential limits set by the Board of Directors concerning the powers of the Chief Executive Officer. For this purpose, he receives from the Chief Executive Officer the relevant information. Authority of the Chief Executive Officer The Chief Executive Officer is responsible for the general management of the Company. He chairs the Group’s Executive Committee and Management Committee. Subject to the Company’s corporate governance rules and in particular the Rulesrules of Proceduresprocedure of the Board of Directors, (see above: “the Board of Directors’ mission”), he has the full extent of authority to act on behalf of the Company in all instances, with the exception of actions that are, by law, reserved to the Board of Directors or to Shareholders’ Meetings. meetings.The Chief Executive Officer is responsible for periodic reporting of the Group’s results and outlook to shareholders and the financial community. At each meeting of the Board, the Chief Executive Officer reports the highlights inof the Group’s activity. Committees of the Board of Directors The Board of Directors approved the creation of: | | • | an Audit Committee; | | • | a Nominating & Governance Committee; and | | • | a Compensation Committee. |
a Nominating & Governance Committee; a Compensation Committee; and The missions and composition of these committees are defined in their relevant rules of procedure approved by the Board of Directors. The Committees carry out their duty for and report to the Board of Directors. Each committee reports on its activities to the Board of Directors. The Audit Committee’s role is to assistCommittees of the Board of Directors The Committees of the Board of Directors are: an Audit Committee; a Nominating & Governance Committee; a Compensation Committee; and a Strategic Committee. On April 28, 2011, the Board agreed in principle on the creation of a new Strategic Committee, the composition and rules of which it approved at its meeting on July 28, 2011. This Committee was set up and met for the first time on September 14, 2011. The composition and an unabridged version of the rules of procedures of the Committees of the Board of Directors is available herein. Audit Committee Rules of procedure (unabridged version) The Board of Directors of TOTAL S.A. (hereafter referred to as the “Company” and, collectively with all its direct and indirect subsidiaries, as the “Group”) has approved the following rules of procedure of the Company’s Audit Committee (hereafter, the “Committee”). The members of the Committee are directors of the Company and therefore uphold the rules of procedure of the Board of Directors of TOTAL S.A. Mission:To allow the Board of Directors of TOTAL S.A. to ensure that internal control is effective and that published information available to shareholders and financial markets is reliable, the duties of the Committee include: recommending the appointment of statutory auditors and their compensation, ensuring effectivetheir independence and monitoring their work; establishing the rules for the use of statutory auditors for non-audit services and verifying their implementation; supervising the audit by the statutory auditors of the Company’s statutory financial statements and consolidated financial statements; examining the accounting policies used to prepare the financial statements and examining the Company’s statutory financial statements and consolidated annual, semi-annual, and quarterly financial statements prior to their examination by the Board of Directors, after regularly monitoring the financial situation, cash position and obligations of the Company; supervising the implementation of internal control and oversight overrisk management procedures and their effective application, with the assistance of the internal audit department; supervising procedures for preparing financial reportinginformation; monitoring the implementation and activities of the disclosure committee, including reviewing the conclusions of this committee; reviewing the annual work program of internal and external auditors; receiving information periodically on completed audits and examining annual internal audit reports and other reports (statutory auditors, annual report, etc.); reviewing the choice of appropriate accounting principles and methods; reviewing the Group’s policy for the use of derivative instruments; reviewing, if requested by the Board of Directors, major transactions contemplated by the Group; reviewing significant litigation annually; implementing and monitoring compliance with the financial code of ethics; proposing to the Board of Directors, for implementation, a procedure for complaints or concerns of employees, shareholders and others, related to accounting, internal accounting controls or auditing matters, and monitoring the financial markets.implementation of this procedure; and The Audit Committee’s duties include:
| | • | recommending the appointment of statutory auditors and their compensation, ensuring their independence and monitoring their work; | • | establishing the rules for the use of statutory auditors for non-audit services and verifying their implementation; | • | supervising the audit by the statutory auditors of the Company’s financial statements and consolidated financial statements; | • | examining the accounting policies used to prepare the financial statements, examining the parent company’s annual financial statements and the consolidated annual, semi-annual, and quarterly financial statements prior to their examination by the Board, after regularly monitoring the financial situation, cash position and obligations of the Company; | • | supervising the implementation of internal control and risk management procedures and their effective application, with the assistance of the internal audit department; | • | supervising procedures for preparing financial information; | • | monitoring the implementation and activities of the disclosure committee, including reviewing the conclusions of this committee; |
111reviewing the procedure for booking the Group’s proved reserves.
| | • | reviewing the annual work program of internal and external auditors; | • | receiving information periodically on completed audits and examining annual internal audit reports and other reports (statutory auditors, annual reports, etc.); | • | reviewing the choice of appropriate accounting principles and methods; | • | reviewing the Group’s policy for the use of derivative instruments; | • | reviewing, if requested by the Board, major transactions contemplated by the Group; | • | reviewing significant litigation annually; | • | implementing, and monitoring compliance with, the financial code of ethics; | • | proposing to the Board, for implementation, a procedure for complaints or concerns of employees, shareholders and others, related to accounting, internal accounting controls or auditing matters, and monitoring the implementation of this procedure; and | • | reviewing the procedure for booking the Group’s proved reserves. |
Audit Committee membership and practices
Composition:The Committee is made up of at least three directors designated by the Board of Directors. Members must be independent directors. In selecting the members of the Committee, the Board of Directors pays particular attention to their independence and their financial and accounting qualifications. The Board of Directors appoints one of the members of the Committee to serve as the financial expert on the Committee. Members of the Committee may not be executive officers of the Company or one of its subsidiaries, nor own more than 10% of the Company’s shares, whether directly or indirectly, individually or acting together with another party. Members of the Audit Committee may not receive from the Company and its subsidiaries, whethereither directly or indirectly, any compensation other than: (i) directors’ fees paid for their services as directors or as members of the committee, or, if applicable, as members of another committee of the Company’s Board; and (ii) compensation and pension benefits related to prior employment by the Company, or another Group company, which are not dependent upon future work or activities. The term of office of the members of the Committee coincides with the term of their appointment as director. The term of office as a member of the Committee may be renewed at the same time as the appointment as director. However, the Board of Directors can change the composition of the Committee at any time. | | • | directors’ fees paid for their services as directors or as members of the Audit Committee or, if applicable, another committee of the Board; and | • | compensation and pension benefits related to prior employment by the Company, or another Group company, which are not dependent upon future work or activities. |
Organization of activities:The Committee appoints its own Chairman. The Chairman appoints the Committee secretary, who may be the Chief Financial Officer. Officer of the Company. The Committee deliberates when at least one-half of its members are present. A member of the Committee cannot be represented. The Committee meets at least four times a year to examinereview the consolidated annual and quarterly consolidated financial statements. statements, and at the request of its Chairman, at least one-half of its members, the Chairman of the Board of Directors or the Chief Executive Officer of the Company. The Committee Chairman prepares the schedule of its meetings.The Audit Committee may meet with the Chairman of the Board, the Chief Executive Officer, and, if applicable, any acting Managing Director of the Company and perform inspections and consult with managers of operating or non-operating departments, as may be useful in performing its duties. The Chairman of the committee gives prior notice of such meeting to the Chairman of the Board or, if the latter is not the Chief Executive Officer, to both the Chairman of the Board of Directors and the Chief Executive Officer. In particular, the Committee is authorized to consult with those involved in preparing or auditing the financial statements (Chief Financial Officer and principal Finance Department managers, Audit Department, Legal Department) by asking the Company’s Chief Financial Officer to call them to a meeting.The Committee consults with the statutory auditors. It has the capacity of consulting them without Company representatives attending. If it is informed of a substantial irregularity, it recommends that the Board of Directors take all appropriate action. If it deems it necessary to accomplish its duties, the Committee may request from the Board of Directors the resources to engage external consultants. The proposals made by the Committee to the Board of Directors are adopted by a majority of the members present at the Committee meeting. The Chairman of the Committee casts the deciding vote if an even number of members is present at the meeting. The Committee can adopt proposals intended for the Board of Directors without meeting if all the members of the Committee so agree and sign each proposal. A written summary of Committee meetings is drawn up. Report:The Committee submits written reports to the Board of Directors regarding its work. It periodically evaluates its performance based on these rules of procedure and, if applicable, offers suggestions for improving its performance. Members of the Audit Committee in 2011 In 2010,2011, the Committee’s members were Mrs.Ms. Patricia Barbizet, Mr. Thierry de Rudder and Messrs.Mr. Bertrand Jacquillat, and Thierry de Rudder. until his term as director expired on May 13, 2011. At the Shareholders’ Meeting on May 13, 2011, Ms. Marie-Christine Coisne-Roquette was appointed a member of the Audit Committee to replace Mr. Jacquillat. All of the members of the Committee are independent directors and have recognized experience in the financial and accounting fields, as illustrated in their summary biographies (see “— Directors and Senior Management — Composition of the Board of Directors”). fields.The Committee is chaired by Mrs. PatriciaMs. Barbizet. The Board of Directors, atAt its meeting on July 30, 2009,28, 2011, the Board of Directors decided to appoint Mr. Bertrand JacquillatMs. Barbizet to serve as the Audit Committee financial expert based on a recommendation by the Audit Committee. At its meeting on January 12, 2012, the Board of Directors decided to co-opt Mr. Gérard Lamarche as a director and to nominate him as a member of the Audit Committee in replacement of Mr. de Rudder, who is resigning from his position as a Director. Compensation Committee Rules of procedure (unabridged version) The Board of Directors of TOTAL S.A. (hereafter referred to as the “Company” and, collectively with all its direct and indirect subsidiaries, as the “Group”) has approved the following rules of procedure of the Company’s Compensation Committee (hereafter, the “Committee”). The members of the Committee are directors of the Company and therefore uphold the rules of procedure of the Board of Directors of TOTAL S.A. The Committee is focused on: examining the executive compensation policies implemented by the Group and the compensation of members of the Executive Committee; evaluating the performance and recommending the compensation of each corporate executive officer, and preparing reports which the Company must present in these areas. Duties:The Committee’s duties include: examining the main objectives proposed by the Company’s general management regarding compensation of the Group’s executive officers, including stock option and restricted share grant plans and equity-based plans, and advising on this subject; presenting recommendations and proposals to the Board of Directors concerning: | | • | examining the executive compensation policies implemented by the Group and the compensation of members of the Executive Committee; and | | • | evaluating the performance and recommend the compensation of the Chairman of the Board and of the Chief Executive Officer. |
Its duties include the following:
| | • | examining the criteria and objectives proposed by management for executive compensation and advising on this subject; | | • | presenting recommendations and proposals to the Board concerning: |
| | | | | − – | | compensation, pension and life insurance plans, in-kind benefits and other compensation including(including severance benefits,benefits) for the Chairman and the Chief Executive Officercorporate executive officers of the Company,Company; in particular, the Committee proposes compensation structures that take into account the Company’s strategy, objectives and earnings and market practices, |
| | − – | | stock optionsoption and restricted share grants, particularly grants of registered shares to the Chairman and the Chief Executive Officer; andcorporate executive officers; |
| | • | examining stock option plans, restricted share grants, equity-based plans and pension and insurance plans. |
112examining the compensation of the members of the Executive Committee, including stock option and restricted share grant plans and equity-based plans, pension and insurance plans and in-kind benefits;
preparing and presenting reports in accordance with these rules of procedure;
Compensation Committee membership and practicesexamining, for the parts within its remit, reports to be sent by the Board of Directors or its Chairman to the shareholders; preparing recommendations requested at any time by the Chairman of the Board of Directors or the general management of the Company regarding compensation. Composition:The Committee is made up of at least three directors designated by the Board of Directors. A majority of the members must be independent directors. Members of the Compensation Committee may not receive from the Company and its subsidiaries, either directly or indirectly, any compensation other than: | | • | directors’ fees paid for their services as directors or as members of the committee, or, if applicable, as members of another committee of the Company’s Board; and | • | compensation and pension benefits related to prior employment by the Company which are not dependent upon future work or activities. |
(i) directors’ fees paid for their services as directors or as members of the committee, or, if applicable, as members of another committee of the Company’s Board; (ii) compensation and pension benefits related to prior employment by the Company, or another Group company, which are not dependent upon future work or activities.The term of office of the members of the Committee coincides with the term of their appointment as director. The term of office as a member of the Committee may be renewed at the same time as the appointment as director. However, the Board of Directors can change the composition of the Committee at any time. Organization of activities:The Committee appoints its chairmanChairman and its secretary. The secretary is a Company senior executive. The Committee deliberates when at least one-half of its members are present. A member of the Committee cannot be represented. The Committee meets at least twice a year. It meets on an as-needed basis through notice by its Chairman or by one-half of its members.The Committee invites the Chairman andof the Board or the Chief Executive Officer of the Company, as applicable, to present their recommendations. Neither the Chairman nor the Chief Executive Officer may be present during the Committee’s deliberations regarding his own situation. If the Chairman of the Board is not the Chief Executive Officer of the Company, the Chief Executive Officer may not be present during the Committee’s deliberations regarding the situation of the Chairman of the Board.While maintaining the appropriate level of confidentiality for its discussions, the Committee may request thatfrom the Chief Executive Officer provide it with the assistance ofto be assisted by any senior executive of the Company whose skills and qualifications could facilitate the handling of an agenda item. If it deems it necessary to accomplish its duties, the Committee may request from the Board of Directors the resources to engage external consultants. The proposals made by the Committee to the Board of Directors are adopted by a majority of the members present at the Committee meeting. The Chairman of the Committee casts the deciding vote if an even number of Committee members is present at the meeting. The Committee can adopt proposals intended for the Board of Directors without meeting if all the members of the Committee so agree and sign each proposal. A written summary of Committee meetings is drawn up. Report:The Committee reports on its activities to the Board of Directors. At the request of the Chairman of the Board, the Committee examines all draft reports of the Company regarding compensation of the executive officers or any other issues relevant to its area of expertise. Members of the Compensation Committee in 2011 In 2010,2011, the Committee’s members were Messrs. Patrick Artus, Bertrand Collomb, Michel Pébereau and, until May 21, 2010, Mr. Serge Tchuruk. Messrs. Patrick Artus and Thierry Desmarest were appointed members of this Committee as from May 21, 2010.and Michel Pébereau. Messrs. Artus, Collomb and Pébereau Tchuruk are independent directors. Mr. Michel Pébereau chairs the Committee. At its meeting on February 9, 2012, the Board of Directors decided to change the composition of the Compensation Committee. As of this date, the Committee’s members are Messrs. Patrick Artus, Gunnar Brock, Thierry Desmarest, Claude Mandil and Michel Pébereau. Messrs. Artus, Brock, Mandil and Pébereau are independent directors. Nominating & Governance Committee Rules of procedure (unabridged version) The Board of Directors of TOTAL S.A. (hereafter referred to as the “Company” and, collectively with all its direct and indirect subsidiaries, as the “Group”) has approved the following rules of procedure of the Company’s Nominating and Governance Committee (hereafter, the “Committee”). The members of the Committee are directors of the Company and therefore uphold the rules of procedure of the Board of Directors of TOTAL S.A. The Committee is focused on: recommending to the Board of Directors the persons that are qualified to be appointed as directors, so as to guarantee the scope of coverage of the Directors’ competencies and the diversity of their profiles; recommending to the Board of Directors the persons that are qualified to be appointed as corporate executive officers; preparing the Company’s corporate governance rules and supervising their implementation; and examining any questions referred to it by the Board or the Chairman of the Board, in particular questions related to ethics and situations of conflicting interests. Duties:The Committee’s duties include: presenting recommendations to the Board for its membership and the membership of its committees, and the qualification in terms of independence of each candidate for Directors’ positions on the Board of Directors; proposing annually to the Board of Directors the list of directors who may be considered as “independent directors”; examining, for the parts within its remit, reports to be sent by the Board of Directors or its Chairman to the shareholders; assisting the Board of Directors in the selection and evaluation of the corporate executive officers and examining the preparation of their possible successors, including cases of unforeseeable absence; recommending to the Board of Directors the persons that are qualified to be appointed as directors; recommending to the Board of Directors the persons that are qualified to be appointed as member of a Committee of the Board of Directors; proposing methods for the Board of Directors to evaluate its performance, and in particular preparing means of regular self-assessment of the workings of the Board of Directors, and the possible assessment thereof by an external consultant; | | • | recommending to the Board of Directors the persons that are qualified to be appointed as directors, Chairman or Chief Executive Officer; | • | preparing the Company’s corporate governance rules and supervise their implementation; and | • | examining any questions referred to it by the Board or the Chairman of the Board, in particular questions related to ethics. |
proposing to the Board of Directors the terms and conditions for allocating directors’ fees and the conditions under which expenses incurred by the directors are reimbursed; Itsdeveloping and recommending to the Board of Directors the corporate governance principles applicable to the Company; examining any questions referred to it by the Board or the Chairman of the Board, in particular questions related to ethics and situations of conflicting interests; preparing recommendations requested at any time by the Board of Directors or the general management of the Company regarding appointments or governance. examining the conformity of the Company’s governance practices with the recommendations of the Code of Corporate Governance adopted by the Company; examining changes in the duties includeof the following:Board of Directors. | | • | presenting recommendations to the Board for its membership and the membership of its committees; | • | proposing annually to the Board the list of directors who may be considered as “independent directors” of the Company; | • | assisting the Board in the selection and evaluation of the Chairman of the Board and the Chief Executive Officer and examining the preparation of their possible successors, in cooperation with the Compensation Committee; | • | preparing a list of individuals who might be considered for election as Directors and those who might be named to serve on Board committees; | • | proposing methods for the Board to evaluate its performance; | • | proposing the procedure for allocating directors’ fees; | • | developing and recommending to the Board the corporate governance principles applicable to the Company; and | • | examining ethical issues at the request of the Board or its Chairman. |
Nominating & Governance Committee membership and practices
Composition:The Committee is made up of at least three directors designated by the Board of Directors. A majority of the members must be independent directors. Members of the Nominating & Governance Committee, other than the Chairman of the Board and the Chief Executive Officer,Company’s corporate executive officers, may not receive from the Company and its subsidiaries any compensation other than: | | • | directors’ fees paid for their services as directors or as members of the committee, or, if applicable, as members of another committee of the Company’s Board; and |
113
The term of office of the members of the Committee coincides with the term of their appointment as director. The term of office as a member of the Committee may be renewed at the same time as the appointment as director.However, the Board of Directors can change the composition of the Committee at any time. | | • | compensation and pension benefits related to prior employment by the Company which are not dependent upon future work or activities. |
Organization of activities:The Committee appoints its chairmanChairman and its secretary. The secretary is a Company senior executive. The Committee deliberates when at least one-half of its members are present. A member of the Committee cannot be represented. The Committee meets at least twice a year. It meets on an as-needed basis through notice by its Chairman or by one-half of its members.The Committee may inviteinvites the Chairman of the Board or the Chief Executive Officer of the Company, as applicable, to present recommendations. The corporate executive officers, whether they are members of the Committee or Neither the Chairman nor the Chief Executive Officerinvited to its meetings, may not be present duringat deliberations regarding hisconcerning their own situation. While maintaining the appropriate level of confidentiality for its discussions, the Committee may request thatfrom the Chief Executive Officer provide it with the assistance ofto be assisted by any senior executive of the Company whose skills and qualifications could facilitate the handling of an agenda item. If it deems it necessary to accomplish its duties, the Committee may request from the Board of Directors the resources to engage external consultants. The proposals made by the Committee to the Board of Directors are adopted by a majority of the members present at the Committee meeting. The Chairman of the Committee casts the deciding vote if an even number of Committee members is present at the meeting. The Committee can adopt proposals intended for the Board of Directors without meeting if all the members of the Committee so agree and sign each proposal. A written summary of Committee meetings is drawn up. Report:The Committee reports on its activities to the Board of Directors. Members of the Nominating & Governance Committee in 2011 In 2010,2011, the Committee’s members were Messrs. Bertrand Collomb, Thierry Desmarest and Michel Pébereau and, until May 21, 2010, Mr. Serge Tchuruk.bereau. Messrs. Collomb and Pébereau and Tchuruk are independent directors. The Committee is chaired by Mr. Desmarest. At its meeting on February 9, 2012, the Board of Directors decided to change the composition of the Nominating and Governance Committee. As of this date, the Committee’s members are Messrs. Patrick Artus, Gunnar Brock, Bertrand Collomb, Thierry Desmarest and Claude Mandil. Messrs. Artus, Brock, Collomb and Mandil are independent directors. Strategic Committee Rules of procedure (unabridged version) The members of the Committee are directors of the Company and therefore uphold the rules of procedure of the Board of Directors of TOTAL S.A. Duties:To allow the Board of Directors of TOTAL S.A. to ensure the Group’s development, the Committee’s duties include: examining the overall strategy of the Group proposed by the Company’s general management; examining operations that are of particular strategic importance; reviewing competition and the resulting medium and long-term outlook for the Group. Mr. Thierry DesmarestComposition:The Committee is made up of at least five directors designated by the Board of Directors. Members of the Committee may not receive from the Company and its subsidiaries, either directly or indirectly, any compensation other than: directors’ fees paid for their services as directors or as members of the Committee, or, if applicable, as members of another committee of the Company’s Board; and compensation and pension benefits related to prior employment by the Company, or another Group company, which are not dependent upon future work or activities. The term of office of the members of the Committee coincides with the term of their appointment as director. The term of office as a member of the Committee may be renewed at the same time as the appointment as director. However, the Board of Directors can change the composition of the Committee at any time. Organization of activities:The Chairman of the Board of Directors of the Company chairs the Committee. The Chairman appoints the Committee secretary, who may be the Secretary of the Board of Directors. The Committee deliberates when at least one-half of its members are present. A member of the Committee cannot be represented. The Committee meets at least once a year and at the request of its Chairman, at least one-half of its members, or the Chief Executive Officer of the Company. The Committee Chairman prepares the schedule of its meetings. Directors who are not members of the Committee are free to participate in the Committee’s meetings. This voluntary participation entitles them to the same directors’ fees as those paid to the members of the Committee for attending meetings. The Committee may meet with the Chief Executive Officer, and, if applicable, any acting Managing Director of the Company and consult with managers of operating or non-operating departments, as may be useful in performing its duties. The Chairman of the Committee [, if the latter is not the Chief Executive Officer of the Company,] gives prior notice of such meeting to the Chief Executive Officer. In particular, the Committee is authorized to consult with the Vice President Strategy & Business Intelligence of the Company or the person delegated by the latter, by asking the Company’s Chief Executive Officer to call them to a meeting. If it deems it necessary to accomplish its duties, the Committee may request from the Board of Directors the resources to engage external consultants. A written summary of Committee meetings is drawn up. Report:The Committee submits written reports to the Board of Directors regarding its work. It periodically evaluates its performance based on these rules of procedure and, if applicable, offers suggestions for improving its performance. Members of the Strategic Committee in 2011 In 2011, the Committee’s members were Mmes. Patricia Barbizet, Barbara Kux and Anne Lauvergeon and Messrs. Christophe de Margerie, Thierry Desmarest, Gunnar Brock, Claude Mandil and Thierry de Rudder. At its meeting on January 12, 2012, the Board of Directors decided to co-opt Mr. Gérard Lamarche as a director and to nominate him as a member of the Strategic Committee in replacement of Mr. de Rudder, who resigned from his position as a Director. Mmes. Barbizet, Kux and Lauvergeon and Messrs. Brock, Mandil and Lamarche are independent directors. As a reminder, directors who are not members of the Committee are free to participate in the Committee’s meetings. Mr. Christophe de Margerie chairs the Committee. Board of Directors practices Management form On May 21, 2010, the Board of Directors decided to reunify the positions of Chairman and Chief Executive Officer and appoint the Chief Executive Officer to the duties of Chairman of the Board. This decision was made further to the work done by the Nominating & Governance Committee and in the best interests of the Company, taking into account the advantage of the unified management and the majority of independent directors appointed at the Committees, which ensures balanced authority. The Board of Directors deemed that the unified management form was the most appropriate to the Group’s organization,modus operandi and business, and the specificities of the oil and gas sector. It respects the respective prerogatives of the various Company instances (Shareholders’ meeting, Board of Directors, general management). Moreover, the Company by-laws and the respective rules of procedure of the Board of Directors and the Committees provide the guarantees required to implement best governance practices within a unified management framework. In particular, the by-laws allow the Board to nominate one or two Vice-Chairmen. They also state that the Board of Directors can be summoned by any means, even verbally, or at short notice in the event of an emergency, by the Chairman, a Vice-Chairman, or one third of the members, at any time and whenever the Company so requires. The rules of procedure of the Board of Directors also state that each Director is required to inform the Board of Directors of any conflicts of interest with the Company or with any other company in the Group, and to abstain from voting on the resolution in question, and even to refrain from taking part in the debate preceding the vote. Performance and evaluation At its meeting on February 10, 2011, the Board of Directors discussed its practices and stated it was globally satisfied with such practices. Compliant with the recommendation by the Nominating and Governance Committee, the Board made suggestions for improvement with respect to broadening criteria when benchmarking with other companies, and for a thorough
study of the Group’s opportunities in the energy sector. These proposals were implemented at the meeting of the new Strategic Committee and when the report of the meeting was presented to the Board of Directors. At its meeting of February 9, 2012, the Board of Directors discussed its practices on the basis of a formal evaluation carried out by means of a detailed questionnaire completed by all of the directors. The responses were then submitted for examination by the Nominating & Governance Committee and summarized. It is this summary that was discussed by the Board of Directors. The formal evaluation showed a generally positive opinion of the practices of the Board of Directors and the Committees, which highlighted that the improvements requested by the directors in 2011 had been made. The Board therefore stated that it was globally satisfied with its practices and suggested improvements mainly relating to more in-depth strategic reflection. This has already been put in place with the Strategic Committee, and work in this area will continue for the benefit of the Board of Directors and the Group. EMPLOYEES AND SHARE OWNERSHIP The tables below set forth the number of employees, by division and geographic location, of the Group (fully consolidated subsidiaries) as of the end of the periods indicated: | | | | | | | | | | | | | | | | | | | | | | | | Upstream | | | Downstream | | | Chemicals | | | Corporate | | | Total | | 2011 | | | 23,563 | | | | 29,423 | | | | 41,665 | | | | 1,453 | | | | 96,104 | | 2010 | | | 17,192 | | | | 32,631 | | | | 41,658 | | | | 1,374 | | | | 92,855 | | 2009 | | | 16,628 | | | | 33,760 | | | | 44,667 | | | | 1,332 | | | | 96,387 | |
| | | | | | | | | | | | | | | | | | | | France | | | Rest of Europe | | | Rest of the World | | | Total | | 2011 | | | 35,037 | | | | 22,453 | | | | 38,614 | | | | 96,104 | | 2010 | | | 35,169 | | | | 24,931 | | | | 32,755 | | | | 92,855 | | 2009 | | | 36,407 | | | | 26,299 | | | | 33,681 | | | | 96,387 | |
| | | | | | | | | | | | | | | | | | | | | | | | | Upstream | | | Downstream | | | Chemicals | | | Corporate | | | Total | | 2010 | | | 17,192 | | | | 32,631 | | | | 41,658 | | | | 1,374 | | | | 92,855 | | | 2009 | | | 16,628 | | | | 33,760 | | | | 44,667 | | | | 1,332 | | | | 96,387 | | | 2008 | | | 16,005 | | | | 34,040 | | | | 45,545 | | | | 1,369 | | | | 96,959 | | | | | | | | | | | | | | | | | | | | | | | | | | | | | | | | | | | | | | | | | | | | | | | | | | | | France | | | Rest of Europe | | | Rest of world | | | Total | | 2010 | | | | | | | 35,169 | | | | 24,931 | | | | 32,755 | | | | 92,855 | | | 2009 | | | | | | | 36,407 | | | | 26,299 | | | | 33,681 | | | | 96,387 | | | 2008 | | | | | | | 37,101 | | | | 27,495 | | | | 32,363 | | | | 96,959 | |
TOTAL believes that the relationship between its management and labor unions is, in general, satisfactory. Arrangements for involving employees in the Company’s share capital Pursuant to agreements signed on March 15, 2002, as amended, the Group created a “Total Group Savings Plan” (PEGT), a “Partnership for Voluntary Wage Savings Plan” (PPESV, later becoming PERCO) and a “Complementary Company Savings Plan” (PEC) for employees of the Group’s French companies having adhered to these plans. These plans allow investments in a number of mutual funds including one invested in Company shares (“TOTAL ACTIONNARIAT FRANCE”). A “Shareholder Group Savings Plan” (PEG-A) has also been in place since November 19, 1999 to facilitate capital increases reserved for employees of the Group’s French and foreign subsidiaries covered by these plans.
114
Company savings plans The various Company savings plans (PEGT, PEC) give the employees of French Group Companies belonging to these savings plans access to several collective investment funds (Fondsfonds communs de placement), including a Fundfund invested in shares of the Company (“TOTAL ACTIONNARIAT FRANCE”). The capital increases reserved for employees are conducted under PEG-A through the “TOTAL ACTIONNARIAT FRANCE” fund for employees of the Group’s French subsidiaries and through the “TOTAL ACTIONNARIAT INTERNATIONAL CAPITALISATION” fund for the employees of foreign subsidiaries. In addition, U.S. employees participate in these operations through American Depositary Receipts (ADRs) and Italian employees (as well as German employees starting in 2011) may participate by directly subscribing to new shares at the GroupCaisse Autonomein Belgium. IncentiveProfit-sharing agreements
Performance indicators used underUnder the June 26, 2009 profit-sharing agreements for employees ofconcerning ten Group companies, the amount available for employees profit-sharing is determined, when permitted by local law, link amounts available for profit sharing tobased on the return on equity (ROE) performance (ROE) of the Group as a whole. Group.Employee shareholding The total number of TOTAL shares held by employees as of December 31, 2010,2011, is as follows: | | | | | “TOTAL ACTIONNARIAT FRANCE” | | | 78,607,765 | | “TOTAL ACTIONNARIAT INTERNATIONAL CAPITALISATION” | | | 19,691,590 | | TOTAL ACTIONNARIAT FRANCEELF PRIVATISATION N°1 | | | 73,117,185929,494 | | TOTAL ACTIONNARIAT INTERNATIONAL CAPITALISATION | | | 16,446,122 | | ELF PRIVATISATION No. 1 | | | 977,948 | | Shares held by U.S. employees | | | 705,829454,305 | | Group Caisse Autonome (Belgium) | | | 295,866436,431 | | TOTAL shares from the exercise of the Company’s stock options and held as registered shares within a Company Savings Plan (PEE)(a) | | | 3,185,5103,293,822 | | | | | | | Total shares held by employee shareholder funds | | | 94,728,460 | | | | | 103,413,407 | |
| (a) | | | (a) | | Company savings plans. |
As of December 31, 2010,2011, the employees of the Group held, on the basis of the definition of employee shareholding contained in Article L.225-102 of the French Commercial Code, 94,728,460103,413,407 TOTAL shares, representing 4.03%4.37% of the Company’s share capital and 7.72%8.01% of the voting rights that could be exercised at a Shareholders’ Meeting on that date. Capital increase reserved for Group employees
At the Shareholders’ Meeting held on May 21, 2010, the shareholders delegated to the Board of Directors the authority to increase the share capital of the Company in one or more transactions and within a maximum period of twenty-six months from the date of the meeting, reserving subscriptions for such issuance to the Group employees participating in a company savings plan in accordance with the provisions of Articles L.3332-2 and L.3332-18 and following of the French Labor Code, and Articles L.225-129-2, L.225-129-6 and L.225-138-1 of the French Commercial Code. The number of ordinary shares that are likely to be issued pursuant to this delegation of authority will not exceed 1.5% of the share capital outstanding on the date of the meeting of the Board of Directors at which a decision to proceed with an issuance is made.
Pursuant to this delegation of authority, the Board of Directors decided on October 28, 2010, to proceed with a capital increase of a maximum of 12 million shares reserved for TOTAL employees, bearing dividends as of January 1, 2010. The Board of Directors decided to delegate the authority to set the subscription period to the Chairman and Chief Executive Officer.
The Board of Directors had decided on November 6, 2007, to proceed with a capital increase of a maximum of 12 million shares with a subscription price of €44.40 per share reserved for TOTAL employees, bearing dividends as of January 1, 2007. Subscription was open from March 10, 2008, through March 28, 2008, and 4,870,386 new TOTAL shares were issued in 2008.
On March 14, 2011, the Chairman and Chief Executive Officer decided that the subscription period would be set from March 16 to April 1, 2011, and acknowledged that the subscription price per ordinary share would be set at €34.80.
The management of each of the three collective investment funds mentioned above is controlled by a dedicated supervisory board, two-third of its members representing holders of fund units and one-third representing the Company. This board is responsible for reviewing the collective investment funds’ management report and annual financial statements as well as the financial, administrative and accounting management, exercising voting rights attached to portfolio securities, deciding contribution of securities in case of a public tender offer, deciding mergers, spin-offs or liquidations, and granting its approval prior to changes in the rules and procedures of the collective investment fund in the conditions provided for by the rules and procedures.
115
These rules and procedures also stipulate a simple majority vote for decisions, except for decisions requiring a qualified majority vote of two-third plus one related to a change in a fund’s rules and procedures, its conversion or disposal, and decisions related to contribution of securities of the Elf Privatisation collective investment fund in case of a public tender offer. For employees holding shares outside of the employee collective investment funds mentioned in the table above, voting rights are exercised individually. Capital increase reserved for Group employees At the Shareholders’ Meeting held on May 21, 2010, the shareholders delegated to the Board of Directors the authority to increase the share capital of the Company in one or more transactions and within a maximum period of twenty-six months from the date of the meeting, reserving subscriptions for such issuance to the Group employees participating in a company savings plan in accordance with the provisions of Articles L. 3332-2 and L. 3332-18 and following of the French Labor Code, and Articles L. 225-129-2, L. 225-129-6 and L. 225-138-1 of the French Commercial Code. The number of ordinary shares that are likely to be issued pursuant to this delegation of authority will not exceed 1.5% of the share capital outstanding on the date of the meeting of the Board of Directors at which a decision to proceed with an issuance is made. Pursuant to this delegation of authority, the Board of Directors decided on October 28, 2010 to proceed with a capital increase of a maximum of 12 million shares reserved for TOTAL employees in 2011, bearing dividends as of January 1, 2010. The Board of Directors decided to delegate the authority to set the subscription period to the Chairman and Chief Executive Officer. On March 14, 2011, the Chairman and Chief Executive Officer decided that the subscription period would be set from March 16 to April 1, 2011 and acknowledged that the subscription price per ordinary share would be set at€34.80. The subscription resulted in the issuance in 2011 of 8,902,717 TOTAL shares. Shares held by Directorsthe administration and Executive Officersmanagement bodies As of December 31, 2010,2011, based on information from the members of the Board and the share registrar, the members of the Board and the Group Executive Officers (Management (Management Committee and Treasurer) held a total of less than 0.5% of the share capital: Members of the Board of Directors (including the Chairman and Chief Executive Officer): 317,306 shares; | | • | Members of the Board of Directors (including the Chairman and Chief Executive Officer): 474,450 shares; | • | Chairman and Chief Executive Officer: 85,230 shares and 48,529 shares of the TOTAL ACTIONNARIAT FRANCE collective investment plan; | • | Management Committee (including the Chief Executive Officer) and Treasurer: 572,527 shares. |
Chairman and Chief Executive Officer: 105,556 shares and 53,869 shares of the “TOTAL ACTIONNARIAT FRANCE” collective investment plan; Management Committee (including the Chief Executive Officer) and Treasurer: 572,527 shares. By decision of the Board of Directors: The Chairman and the Chief Executive Officer are required to hold a number of shares of the Company | | • | The Chairman and the Chief Executive Officer are required to hold a number of shares of the Company equal in value to two years of the fixed portion of their annual compensation. | • | Members of the Executive Committee are required to hold a number of shares of the Company equal in value to two years of the fixed portion of their annual compensation. These shares have to be acquired within three years from the appointment to the Executive Committee. |
Members of the Executive Committee are required to hold a number of shares of the Company equal in value to two years of the fixed portion of their annual compensation. These shares have to be acquired within three years from the appointment to the Executive Committee. The number of TOTAL shares to be considered includes: directly held shares, whether or not they are subject to transfer restrictions; and shares in collective investment funds invested in TOTAL shares. | | • | directly held shares, whether or not they are subject to transfer restrictions; and | • | shares in collective investment funds invested in TOTAL shares. |
116
Summary of transactions in the Company’s securities The following table presents transactions, of which the Company has been informed, in the Company’s shares or related financial instruments carried out in 20102011 by the individuals concerned under paragraphs a) through c) of Article L.621-18-2 of the French Monetary and Financial Code. Year 2010
| | | | | | | | | | | | | | | | | | | | | | | | | | | | | | | | | | | | | | | | | | | Exercise
| | | | | | | | | | | | | | | | | | | | of stock
| | | | | | | | Acquisition | | | Subscription | | | Transfer | | | Exchange | | | options | | Thierry Desmarest(a) | | | TOTAL shares | | | — | | | | — | | | | 45,372 | | | | — | | | | 25,372 | | | | | | | | | | | | | | | | | | | | | | | | | | | | | | | Shares in collective investment plans (FCPE), and other related financial instruments(b) | | | — | | | | — | | | | — | | | | — | | | | — | | | | | | | | | | | | | | | | | | | | | | | | | | | Christophe de Margerie(a) | | | TOTAL shares | | | — | | | | — | | | | — | | | | — | | | | — | | | | | | | | | | | | | | | | | | | | | | | | | | | | | | | Shares in collective investment plans (FCPE), and other related financial instruments(b) | | | 4,815.21 | | | | — | | | | — | | | | — | | | | — | | | | | | | | | | | | | | | | | | | | | | | | | | | Michel Bénézit(a) | | | TOTAL shares | | | — | | | | 3,170 | | | | — | | | | — | | | | — | | | | | | | | | | | | | | | | | | | | | | | | | | | | | | | Shares in collective investment plans (FCPE), and other related financial instruments(b) | | | 27.68 | | | | 47.23 | | | | — | | | | — | | | | — | | | | | | | | | | | | | | | | | | | | | | | | | | | François Cornélis(a) | | | TOTAL shares | | | — | | | | — | | | | — | | | | — | | | | — | | | | | | | | | | | | | | | | | | | | | | | | | | | | | | | Shares in collective investment plans (FCPE), and other related financial instruments(b) | | | 1,241.32 | | | | — | | | | — | | | | — | | | | — | | | | | | | | | | | | | | | | | | | | | | | | | | | Yves-Louis Darricarrère(a) | | | TOTAL shares | | | — | | | | — | | | | — | | | | — | | | | — | | | | | | | | | | | | | | | | | | | | | | | | | | | | | | | Shares in collective investment plans (FCPE), and other related financial instruments(b) | | | 4.61 | | | | — | | | | — | | | | — | | | | — | | | | | | | | | | | | | | | | | | | | | | | | | | | Jean-Jacques Guilbaud(a) | | | TOTAL shares | | | — | | | | — | | | | 5,000 | | | | — | | | | 5,000 | | | | | | | | | | | | | | | | | | | | | | | | | | | | | | | Shares in collective investment plans (FCPE), and other related financial instruments(b) | | | 345.33 | | | | 259.48 | | | | 652.79 | | | | — | | | | — | | | | | | | | | | | | | | | | | | | | | | | | | | | Patrick de La Chevardière(a) | | | TOTAL shares | | | — | | | | — | | | | — | | | | — | | | | — | | | | | | | | | | | | | | | | | | | | | | | | | | | | | | | Shares in collective investment plans (FCPE), and other related financial instruments(b) | | | 79.25 | | | | 12.79 | | | | — | | | | — | | | | — | | | | | | | | | | | | | | | | | | | | | | | | | | |
| | | | | | | | | | | | | | | | | | | | | | | | Year 2011 | | | | Acquisition | | | Subscription | | | Transfer | | | Exchange | | | Exercise
of stock
options | | | Christophe de Margerie(a) | | TOTAL shares | | | — | | | | — | | | | 93,250 | | | | — | | | | 113,576 | | | | | Shares in collective investment plans (FCPE), and other related financial instruments(b) | | | 5,340.09 | | | | — | | | | — | | | | — | | | | — | | Michel Bénézit(a) | | TOTAL shares | | | — | | | | — | | | | — | | | | — | | | | | | | | | Shares in collective investment plans (FCPE), and other related financial instruments(b) | | | 626.95 | | | | 13,341.83 | | | | 6,828.94 | | | | — | | | | — | | François Cornélis(a) | | TOTAL shares | | | — | | | | — | | | | 9,000 | | | | — | | | | | | | | | Shares in collective investment plans (FCPE), and other related financial instruments(b) | | | 1,883.86 | | | | 11,440.06 | | | | 5,876.63 | | | | — | | | | — | | | Yves-Louis Darricarrère(a) | | TOTAL shares | | | — | | | | — | | | | 14,412 | | | | — | | | | 6,412 | | | | | Shares in collective investment plans (FCPE), and other related financial instruments(b) | | | 901.20 | | | | 20,088.29 | | | | 10,319.28 | | | | — | | | | | | | Jean-Jacques Guilbaud(a) | | TOTAL shares | | | — | | | | — | | | | 29,163 | | | | — | | | | 29,163 | | | | | Shares in collective investment plans (FCPE), and other related financial instruments(b) | | | 1,008.85 | | | | 14,320.92 | | | | 8,636.03 | | | | — | | | | — | | | Bertrand Jacquillat(a)(c) | | TOTAL shares | | | 300 | | | | — | | | | 33 | | | | — | | | | — | | | | | Shares in collective investment plans (FCPE), and other related financial instruments(b) | | | — | | | | — | | | | — | | | | — | | | | — | | | Patrick de La Chevardière(a) | | TOTAL shares | | | — | | | | — | | | | — | | | | — | | | | — | | | | | Shares in collective investment plans (FCPE), and other related financial instruments(b) | | | 756.08 | | | | 14,998.66 | | | | 7,587.71 | | | | — | | | | — | |
| (a) | | | (a) | | Including the related individuals in the meaning of the provisions of the Article R.621-43-1 of the French Monetary and Financial Code. |
| (b) | | Collective investment funds (FCPE) primarily invested in Company shares. |
117
| (c) | Director and member of the Audit Committee until May 13, 2011. |
ITEM 7. MAJOR SHAREHOLDERS AND RELATED PARTY TRANSACTIONS Holdings of major shareholders The major shareholders of TOTAL as of December 31, 2011, 2010 2009 and 20082009 are set forth in the table below: | | | | | | | | | | | | | | | | | | | | | | | | | | | | | | | | | 2010 | | | 2009 | | | 2008 | | | | | | | | | | | % of
| | | | | | | | | | | | | | | | | % of
| | | % of
| | | theoretical
| | | % of
| | | % of
| | | % of
| | | % of
| | | | | share
| | | voting
| | | voting
| | | share
| | | voting
| | | share
| | | voting
| | | As of December 31, | | capital | | | rights | | | rights(a) | | | capital | | | rights | | | capital | | | rights | | Groupe Bruxelles Lambert(b)(c) | | | 4.0 | | | | 4.0 | | | | 3.7 | | | | 4.0 | | | | 4.0 | | | | 4.0 | | | | 4.0 | | Compagnie Nationale à Portefeuille(b)(c) | | | 1.6 | | | | 1.6 | | | | 1.4 | | | | 1.4 | | | | 1.4 | | | | 1.4 | | | | 1.4 | | Areva(b) | | | 0.0 | | | | 0.0 | | | | 0.0 | | | | 0.0 | | | | 0.0 | | | | 0.3 | | | | 0.6 | | BNP Paribas(b) | | | 0.2 | | | | 0.2 | | | | 0.2 | | | | 0.2 | | | | 0.2 | | | | 0.2 | | | | 0.2 | | | | | | | | | | | | | | | | | | | | | | | | | | | | | | | | Group employees(b)(d) | | | 4.0 | | | | 7.7 | | | | 7.1 | | | | 3.9 | | | | 7.5 | | | | 3.8 | | | | 7.4 | | | | | | | | | | | | | | | | | | | | | | | | | | | | | | | | Other registered shareholders (non-Group) | | | 1.4 | | | | 2.5 | | | | 2.3 | | | | 1.4 | | | | 2.4 | | | | 1.2 | | | | 2.1 | | | | | | | | | | | | | | | | | | | | | | | | | | | | | | | | Treasury shares | | | 4.8 | | | | — | | | | 8.3 | | | | 4.9 | | | | — | | | | 6.0 | | | | — | | of which TOTAL S.A. | | | 0.5 | | | | — | | | | 0.5 | | | | 0.6 | | | | — | | | | 1.8 | | | | — | | of which Total Nucléaire | | | 0.1 | | | | | | | | 0.1 | | | | 0.1 | | | | — | | | | 0.1 | | | | — | | of which subsidiaries of Elf Aquitaine | | | 4.2 | | | | | | | | 7.7 | | | | 4.2 | | | | — | | | | 4.1 | | | | — | | | | | | | | | | | | | | | | | | | | | | | | | | | | | | | | Other bearer shareholders | | | 84.0 | | | | 84.0 | | | | 77.0 | | | | 84.2 | | | | 84.5 | | | | 83.1 | | | | 84.3 | | of which holders of ADS(e) | | | 8.0 | | | | 8.0 | | | | 7.4 | | | | 7.5 | | | | 7.6 | | | | 8.2 | | | | 8.3 | | | | | | | | | | | | | | | | | | | | | | | | | | | | | | | |
| | | | | | | | | | | | | | | | | | | | | | | | | | | | | | | | 2011 | | | 2010 | | | 2009 | | | As of December 31 | | % of
share
capital | | | % of
voting
rights | | | % of
theoretical
voting
rights(a) | | | % of
share
capital | | | % of
voting
rights | | | % of
share
capital | | | % of
voting
rights | | Groupe Bruxelles Lambert(b)(c) | | | 4.0 | | | | 4.0 | | | | 3.7 | | | | 4.0 | | | | 4.0 | | | | 4.0 | | | | 4.0 | | Compagnie Nationale à Portefeuille(b)(c) | | | 1.5 | | | | 1.6 | | | | 1.4 | | | | 1.6 | | | | 1.6 | | | | 1.4 | | | | 1.4 | | BNP Paribas(b) | | | 0.2 | | | | 0.2 | | | | 0.1 | | | | 0.2 | | | | 0.2 | | | | 0.2 | | | | 0.2 | | Group employees(b)(d) | | | 4.4 | | | | 8.0 | | | | 7.4 | | | | 4.0 | | | | 7.7 | | | | 3.9 | | | | 7.5 | | Other registered shareholders (non-Group) | | | 1.7 | | | | 2.8 | | | | 2.6 | | | | 1.4 | | | | 2.5 | | | | 1.4 | | | | 2.4 | | Treasury shares | | | 4.6 | | | | — | | | | 8.1 | | | | 4.8 | | | | — | | | | 4.9 | | | | — | | of which TOTAL S.A. | | | 0.4 | | | | — | | | | 0.4 | | | | 0.5 | | | | — | | | | 0.6 | | | | — | | of which Total Nucléaire | | | 0.1 | | | | — | | | | 0.2 | | | | 0.1 | | | | — | | | | 0.1 | | | | — | | of which subsidiaries of Elf Aquitaine | | | 4.2 | | | | — | | | | 7.6 | | | | 4.2 | | | | — | | | | 4.2 | | | | — | | Other bearer shareholders | | | 83.6 | | | | 83.5 | | | | 76.7 | | | | 84.0 | | | | 84.0 | | | | 84.2 | | | | 84.5 | | of which holders of ADS(e) | | | 8.7 | | | | 8.7 | | | | 8.0 | | | | 8.0 | | | | 8.0 | | | | 7.5 | | | | 7.6 | |
| (a) | | | (a) | | Pursuant toarticle 223-11 of the AMF General Regulation, the number of theoretical voting rights is calculated on the basis of all outstanding shares to which voting rights are attached, including treasury shares that are deprived of voting rights. |
| (b) | | Shareholders with an executive officer (or a representative of employees) or director serving as a director of TOTAL S.A. |
| (c) | | Groupe Bruxelles Lambert is a company controlled jointly by the Desmarais family and Frère-Bourgeois S.A., and for the latter mainly through its direct and indirect interest in Compagnie Nationale à Portefeuille. In addition, Groupe Bruxelles Lambert and Compagnie Nationale à Portefeuille declared their acting in concert. |
| (d) | | Based on the definition of employee shareholding pursuant to Article L.225-102 of the French Commercial Code. |
| (e) | | American Depositary Shares listed on the New York Stock Exchange. |
As of December 31, 2010,2011, the holdings of the major shareholders were calculated based on 2,349,640,9312,363,767,313 shares, representing 2,350,274,5922,368,716,634 voting rights exercisable at Shareholders’ Meetings or 2,563,093,5392,578,602,075 theoretical voting rights(1)including: 9,222,905 voting rights attached to the 9,222,905 TOTAL shares held by TOTAL S.A. that are deprived of voting rights; and 200,662,536 voting rights attached to the 100,331,268 TOTAL shares held by TOTAL S.A. subsidiaries that cannot be exercised at Shareholders’ Meetings. | | • | 200,662,536 voting rights attached to the 100,331,268 TOTAL shares held by TOTAL S.A. subsidiaries that cannot be exercised at Shareholders’ Meetings; and |
| | • | 12,156,411 voting rights attached to the 12,156,411 TOTAL shares held by TOTAL S.A. that are deprived of voting rights. |
For prior years, the holdings of the major shareholders were established on the basis of 2,349,640,931 shares, to which were attached 2,350,274,592 voting rights that could be exercised at the Shareholders’ Meeting, as of December 31, 2010, and of 2,348,422,884 shares to which were attached 2,339,384,550 voting rights that could be exercised at the Shareholders’ Meeting, as of December 31, 2009, and of 2,371,808,074 shares to which were attached 2,339,251,395 voting rights that could be exercised at the Shareholders’ Meeting, as of December 31, 2008.2009. Identification of the holders of bearer shares In accordance with Article 9 of its by-laws, the Company is authorized, to the extent permitted under applicable law, to identify the holders of securities that grant immediate or future voting rights at the Company’s Shareholders’ Meetings. Temporary transfer of securities Pursuant to legal obligations, any legal entity or individual (with the exception of those described in paragraph IV-3° of Article L. 233-7 of the French Commercial Code) holding alone or together a number of shares representing more than 0.5% of the Company’s voting rights pursuant to one or several temporary transfers or similar operations as described by Article L. 225-126 of the French Commercial Code is required to inform the Company and the French Financial Markets Authority of the number of shares temporarily held no later than the third business day preceding the shareholders’ meeting at midnight. | (1) | Pursuant to Article 223-11 of the AMF General Regulation, the number of theoretical voting rights is calculated on the basis of all outstanding shares, including those shares held by the Group that are deprived of voting rights. |
Declarations are to be e-mailed to the Company at: holding.df-shareholdingnotification@total.com. Failing to declare such information, any share bought under any of the above described temporary transfer operations shall be deprived of voting rights at the relevant Shareholders’ Meeting and at any Shareholders’ Meeting that would be held until such shares are transferred again or returned. Legal thresholdsThresholds notifications
In addition to the legal obligation to inform the Company and the French Financial Markets Authority within four business days when thresholds representing 5%, 10%, 15%, 20%, 25%, 30%, 331/3,%, 50%, 662/3,%, 90% or 95% of the share capital or voting rights(2)(1) are crossed (Article L.233-7 of the French Commercial Code), any individual or entity who directly or indirectly acquirescomes to hold a percentage of the share capital, voting rights or rights giving future access to the share capital of the Company which is equal to or greater than 1%, or a multiple of this percentage, is required to notify the Company within 15fifteen days by registered mail with return receipt requested, and declare the number of securities held. (1) Pursuant toArticle 223-11 of the AMF General Regulation, the number of theoretical voting rights is calculated on the basis of all outstanding shares, including those shares held by the Group that are deprived of voting rights.
(2) Pursuant toArticle 223-11 of the AMF General Regulation, the number of voting rights is calculated on the basis of all outstanding shares, including those shares held by the Group that are deprived of voting rights.
118
In case the shares above these thresholds are not declared, any undeclared shares held in excess of the threshold and undeclared may be deprived of voting rights at future Shareholders’ Meetings if, at that meeting, the failure to make a declaration is acknowledged and if one or more shareholders holding collectively at least 3% of the Company’s share capital or voting rights so request at that meeting. All individuals and entities are also required to notify the Company in due form and within the time limits stated above when their direct or indirect holdings fall below each of the aforementioned thresholds. Declarations are to be sent to the Vice President of the Investor Relations department in Paris. Temporary transferLegal threshold notifications in 2011
Société Générale reported that it had passed: on May 6, 2011, above the thresholds of securities Pursuant to legal obligations, any legal entity or individual (with the exception of those described in paragraph 3 of Article L.233-75% of the French Commercial Code) holding alone or together a number of shares representing more than 0.5% ofshare capital and the Company’s voting rights pursuant to one or several temporary transfers or similar operations as described by Article L.225-126of the French Commercial Code is required to inform the Company, and that it held after crossing the French Financial Markets Authoritythresholds 6.86% of the numbershare capital and 6.29% of shares temporarily held no later than the third business days precedingvoting rights of the Shareholders’ Meeting at midnight.Company;
Declarations are to bee-mailed toon May 25, 2011, below the thresholds of 5% of the share capital and the voting rights of the Company, at: holding.df-shareholdingnotification@total.com. Failing to declare such information, any share bought under anyand that it held after crossing the thresholds 4.92% of the above described temporary transfer operations shall be deprivedshare capital and 4.50% of the voting rights atof the relevant Shareholders’ Meeting and at any Shareholders’ Meeting that would be held until such shares are transferred again or returned.Company.
Holdings above the legal thresholds In accordance with Article L.233-13 of the French Commercial Code, only one shareholder, Compagnie Nationale à Portefeuille (CNP) and Groupe Bruxelles Lambert (GBL), acting in concert, holds 5% or more of TOTAL’s share capital at year-end 20102011(1)(2). In addition, two known shareholders held 5% or more of the voting rights exercisable at TOTAL Shareholders’ Meetings at year-end 2010:2011: In the AMF notice No. 209C1156 dated September 2, 2009, CNP and GBL acting in concert declared that they held more than the threshold of 5% of the voting rights of TOTAL as of August 25, 2009 and held 127,149,464 TOTAL shares representing 127,745,604 voting rights,i.e.5.42% of the share capital and 5.0009% of the theoretical voting rights(2)(3) (based on a share capital of 2,347,601,812 shares representing 2,554,431,468 voting rights). To the Company’s knowledge, CNP, jointly with GBL, held, as of December 31, 2010, 5.56%2011, 5.52% of the share capital representing 5.59%5.53% of the voting rights exercisable at Shareholders’ Meetings and 5.12%5.08% of the theoretical voting rights(2)(3). | • | | • | The collective investment fund (fonds commun de placement) “TOTAL ACTIONNARIAT FRANCE”: |
To the Company’s knowledge, the collective investment fund (fonds(fonds commun de placement)placement) “TOTAL ACTIONNARIAT FRANCE” held, as of December 31, 2010, 3.11%2011, 3.33% of the share capital representing 5.94%6.12% of the voting rights exercisable at a Shareholders’ Meeting and 5.44%5.62% of the theoretical voting rights(2)(3). TOTAL is not aware of any agreements among its shareholders. | (1) | Pursuant to Article 223-11 of the AMF General Regulation, the number of voting rights is calculated on the basis of all outstanding shares, including those shares held by the Group that are deprived of voting rights. |
| (2) | AMF notice No. 209C1156 dated September 2, 2009. |
| (3) | Pursuant to Article 223-11 of the AMF General Regulation, the number of theoretical voting rights is calculated on the basis of all outstanding shares, including those shares held by the Group that are deprived of voting rights. |
As of December 31, 2010,2011, the Company held 112,487,679109,554,173 TOTAL shares either directly or through its indirect subsidiaries, which represented 4.79%4.63% of the share capital, as of this date. By law, these shares are also deprived of voting rights. TOTAL shares held directly by the Company (treasury shares) The Company held 12,156,4119,222,905 treasury shares as of December 31, 2010,2011, representing 0.52%0.39% of the share capital, as of that date. TOTAL shares held directly by Group companies As of December 31, 2010,2011, Total Nucléaire, a Group company wholly-owned indirectly by TOTAL held 2,023,672 TOTAL shares. As of December 31, 2010, 2011, Financière Valorgest, Sogapar and Fingestval, indirect subsidiaries of Elf Aquitaine, held respectively 22,203,704, (1) AMF notice No. 207C1811 dated September 2, 2009.
(2) Pursuant toArticle 223-11 of the AMF General Regulation, the number of theoretical voting rights is calculated on the basis of all outstanding shares, including those shares held by the Group that are deprived of voting rights.
119
4,104,000 and 71,999,892 TOTAL shares, representing a total of 98,307,596 TOTAL shares. As of December 31, 2010,2011, the Company held through its indirect subsidiaries, 4.27%4.24% of the share capital. Related Party Transactions The Group’s main transactions with related parties (principally all the investments carried under the equity method) and the balances receivable from and payable to them are shown in Note 24 to the Consolidated Financial Statements. In the ordinary course of its business, TOTAL enters into transactions with various organizations with which certain of its directors or executive officers may be associated, but no such transactions of a material or unusual nature have been entered into during the period commencing on January 1, 2008,2009, and ending on March 24, 2011.23, 2012. ITEM 8. FINANCIAL INFORMATION
Consolidated Statements and other supplemental information See pages F-1 through F-97 andS-1 through S-20F-96 for TOTAL’s Consolidated Financial Statements and pages S-1 through S-19 for other supplemental information. Legal or arbitration proceedings There are no governmental, legal or arbitration proceedings, including any proceeding that the Company is aware of, threatened with or even pending (including the main legal proceedings described hereafter) that could have a material impact on the Group’s financial situation or profitability. While it is not feasible to predict the outcome of the pending claims, proceedings, and investigations described below with certainty, management is of the opinion that their ultimate disposition should not have a material adverse effect on the Company’s financial position, cash flows, or results of operations. Antitrust investigations The principal antitrust proceedings in which the Group’s companies are involved are described below. Chemicals | • | | As part of the spin-off of Arkema(1) in 2006, TOTAL S.A. or certain other Group companies agreed |
| | to grant Arkema a guarantee for potential monetary consequences related to antitrust proceedings arising from events prior to the spin-off. |
This guarantee covers, for a period of ten years from the date of the spin-off, 90% of amounts paid by Arkema related to (i) fines imposed by European authorities or European member-states for competition law violations, (ii) fines imposed by U.S. courts or antitrust authorities for federal antitrust violations or violations of the competition laws of U.S. states, (iii) damages awarded in civil proceedings related to the government proceedings mentioned above, and (iv) certain costs related to these proceedings. The guarantee related to anti-competition violations in Europe applies to amounts above a€176.5 million threshold. On the other hand, the agreements provide that Arkema will indemnify TOTAL S.A. or any Group company for 10% of any amount that TOTAL S.A. or any Group company are required to pay under any of the proceedings covered by this guarantee, in Europe. If one or more individuals or legal entities, acting alone or together, directly or indirectly holds more than one-third of the voting rights of Arkema, or if Arkema transfers more than 50% of its assets (as calculated under the enterprise valuation method, as of the date | (1) | Arkema is used in this section to designate those companies of the Arkema group whose ultimate parent company is Arkema S.A. Arkema became an independent company after being spun-off from TOTAL S.A. in May 2006. |
of the transfer) to a third party or parties acting together, irrespective of the type or number of transfers, this guarantee will become void. In the United States, civil liability lawsuits, for which TOTAL S.A. has been named as the parent company, are closed without significant impact on the Group’s financial position. Grande ParoisseIn Europe, since 2006, the European Commission has fined companies of the Group in its configuration prior to the spin-off an overall amount of€385.47 million, of which Elf Aquitaine and/or TOTAL S.A. were held jointly liable for€280.17 million, Elf Aquitaine being personally fined€23.6 million for deterrence. These fines are entirely settled as of today.
As a result, since the spin-off, the Group has paid the overall amount of€188.07 million(1), corresponding to 90% of the fines overall amount once the threshold provided for by the guarantee is deducted to which an amount of€31.31 million of interest has been added as explained hereinafter. The European Commission imposed these fines following investigations between 2000 and 2004 into commercial practices involving eight products sold by Arkema. Five of these investigations resulted in prosecutions from the European Commission for which Elf Aquitaine has been named as the parent company, and two of these investigations named TOTAL S.A. as the ultimate parent company of the Group. TOTAL S.A. and Elf Aquitaine are contesting their liability based solely on their status as parent companies and appealed for cancellation and reformation of the rulings that are still pending before the relevant EU court of appeals or supreme court of appeals. During the year 2011, four of the proceedings have evolved and are closed as far as Arkema is concerned: | - | | In one of these proceedings, the Court of Justice of the European Union (CJEU) has rejected the action of Arkema while the decisions of the European Commission and of the General Court of the European Union against the parent companies have been squashed. Consequently, this proceeding is definitively closed regarding Arkema as well as the parent companies. |
| - | | In two other proceedings, previous decisions against Arkema and the parent companies have been upheld by the General Court of the European Union. While the parent companies have introduced an appeal before the CJEU, Arkema did not appeal to the CJEU. |
| - | | Finally, in a last proceeding, the General Court has decided to reduce the amount of the fine initially ordered against Arkema while, in parallel, it has rejected the actions of the parent companies that have remained obliged to pay the whole amount of the fine initially ordered by the European Commission. Arkema has accepted this decision while the parent companies have introduced an appeal before the CJEU. |
With the exception of the€31.31 million of interest charged by the European Commission to the parent companies, which has been required to pay in accordance with the decision concerning the last proceeding referred hereinabove, the evolution of the proceedings during the year 2011 did not modify the global amount assumed by the Group in execution of the guarantee. In addition, civil proceedings against Arkema and other groups of companies were initiated in 2009 and 2011, respectively, before the German and Dutch courts by third parties for alleged damages pursuant to two of the above mentioned legal proceedings. TOTAL S.A. was summoned to serve notice of the dispute before the German court. At this point, the probability to have a favorable verdict and the financial impacts of these proceedings are uncertain due to the number of legal difficulties they give rise to, the lack of documented claims and evaluations of the alleged damages. Arkema began implementing compliance procedures in 2001 that are designed to prevent its employees from violating antitrust provisions. However, it is not possible to exclude the possibility that the relevant authorities could commence additional proceedings involving Arkema regarding events prior to the spin-off, as well as Elf Aquitaine and/or TOTAL S.A. based on their status as parent company. Within the framework of all of the legal proceedings described above, a€17 million reserve remains booked in the Group’s consolidated financial statements as of December 31, 2011. | (1) | This amount does not take into account a case that led to Arkema, prior to Arkema’s spin-off from TOTAL, and Elf Aquitaine being fined jointly€45 million and Arkema being fined€13.5 million. |
Downstream Pursuant to a statement of objections received by Total Nederland N.V. and TOTAL S.A. (based on its status as parent company) from the European Commission, Total Nederland N.V. was fined€20.25 million in 2006, for which TOTAL S.A. was held jointly liable for€13.5 million. TOTAL S.A. appealed this decision before the relevant court and this appeal is still pending. In addition, pursuant to a statement of objections received by Total Raffinage Marketing (formerly Total France) and TOTAL S.A. from the European Commission regarding another product line of the Refining & Marketing division, Total Raffinage Marketing was fined€128.2 million in 2008, which has been paid, and for which TOTAL S.A. was held jointly liable based on its status as parent company. TOTAL S.A. also appealed this decision before the relevant court and this appeal is still pending. In addition, civil proceedings against TOTAL S.A and Total Raffinage Marketing and other companies were initiated before U.K and Dutch courts by third parties for alleged damages in connection with the prosecutions brought by the European Commission in this case. At this point, the probability to have a favorable verdict and the financial impacts of these procedures are uncertain due to the number of legal difficulties they gave rise to, the lack of documented claims and evaluations of the alleged damages. Within the framework of the legal proceedings described above, a€30 million reserve is booked in the Group’s consolidated financial statements as of December 31, 2011. Whatever the evolution of the proceedings described above, the Group believes that their outcome should not have a material adverse effect on the Group’s financial situation or consolidated results. Grande Paroisse An explosion occurred at the Grande Paroisse industrial site in the city of Toulouse in France on September 21, 2001. Grande Paroisse, a former subsidiary of Atofina which became a subsidiary of Elf Aquitaine Fertilisants on December 31, 2004, as part of the reorganization of the Chemicals segment, was principally engaged in the production and sale of agricultural fertilizers. The explosion, which involved a stockpile of ammonium nitrate pellets, destroyed a portion of the site and caused the death of thirty-one people, including twenty-one workers at the site, and injured many others. The explosion also caused significant damage to certain property in part of the city of Toulouse. This plant has been closed and individual assistance packages have been provided for employees. The site has been rehabilitated. On December 14, 2006, Grande Paroisse signed, under the supervision of the city of Toulouse, the deed whereby it donated the former site of the AZF plant to the greater agglomeration of Toulouse (CAGT) and theCaisse des dépôts et consignationsand its subsidiary ICADE. Under this deed, TOTAL S.A. guaranteed the site restoration obligations of Grande Paroisse and granted a €10€10 million endowment to the InNaBioSanté research foundation as part of the setting up of a cancer research center at the site by the city of Toulouse. Regarding the cause of the explosion, the hypothesis that the explosion was caused by Grande Paroisse through the accidental mixing of hundreds of kilos of a chlorine compound at a storage site for ammonium nitrate was discredited over the course of the investigation. As a result, proceedings against ten of the eleven Grande Paroisse employees charged during the criminal investigation conducted by the Toulouse Regional Court (Tribunal de grande instance) were dismissed and this dismissal was upheld by the Court of Appeal of Toulouse.on appeal. Nevertheless, the final experts’ report filed on May 11, 2006 continued to focus on the hypothesis of a chemical accident, although this hypothesis was not confirmed during the attempt to reconstruct the accident at the site. After having articulated several hypotheses, the experts no longer maintain that the accident was caused by pouring a large quantity of a chlorine compound over ammonium nitrate. Instead, the experts have retained a scenario where a container of chlorine compound sweepings was poured between a layer of wet ammonium nitrate covering the floor and a quantity of dry agricultural nitrate at a location not far from the principal storage site. This is claimed to have caused an explosion which then spread into the main storage site. Grande Paroisse was investigated based on this new hypothesis in 2006; Grande Paroisse is contesting this explanation, which it believes to be based on elements that are not factually accurate. The Court of Appeal of Toulouse denied allAll the requests for additional investigations that were submitted by Grande Paroisse, the former site manager and various plaintiffs were denied on appeal after the end of the criminal investigation procedure. On July 9, 2007, the investigating judge brought charges against Grande Paroisse and the former plant manager before the criminal chamber of the Court of Appeal of Toulouse. In late 2008, TOTAL S.A. and Mr. Thierry Desmarest were summoned to appear in courtCourt pursuant to a request by a victims association. The trial for this case began on February 23, 2009, and lasted approximately four months.
120
On November 19, 2009, the Toulouse Criminal Court acquitted both the former Plant Manager, and Grande Paroisse due to the lack of reliable evidence for the explosion. The Court also ruled that the summonses against TOTAL S.A. and Mr. Thierry Desmarest, Chairman and CEO at the time of the disaster, were inadmissible. Due to the presumption of civil liability that applied to Grande Paroisse, the Court declared Grande Paroisse civilly liable for the damages caused by the explosion to the victims in its capacity as custodian and operator of the plant. The Prosecutor’s office, together with certain third parties, has appealed the Toulouse Criminal Court verdict. In order to preserve its rights, Grande Paroisse lodged a cross-appeal with respect to civil charges. The appeal proceedings are expected to start before the Court of Appeal of Toulouse was completed on November 3, 2011. March 16, 2012. The decision is expected on September 24, 2012.A compensation mechanism for victims was set up immediately following the explosion. €2.3€2.3 billion werewas paid for the compensation of claims and related expenses amounts. As of December 31, 2010,2011, a €31€21 million reserve was recorded in the Group’s consolidated balance sheet. Antitrust investigationsBuncefield
For the year ended 2010, the Group has not been fined pursuant to a Court ruling. The principal antitrust proceedings in which the Group is involved are described hereafter.
Chemicals segment
| | • | As part of the spin-off of Arkema(1) in 2006, TOTAL S.A. or certain other Group companies agreed to grant Arkema guarantees for potential monetary consequences related to antitrust proceedings arising from events prior to the spin-off. |
| | | These guarantees cover, for a period of ten years, 90% of amounts paid by Arkema related to (i) fines imposed by European authorities or European member-states for competition law violations, (ii) fines imposed by U.S. courts or antitrust authorities for federal antitrust violations or violations of the competition laws of U.S. states, (iii) damages awarded in civil proceedings related to the government proceedings mentioned above, and (iv) certain costs related to these proceedings. The guarantee related to anti-competition violations in Europe applies to amounts above a €176.5 million threshold. On the other hand, the agreements provide that Arkema will indemnify TOTAL S.A. or any Group company for 10% of any amount that TOTAL S.A. or any Group company are required to pay under any of the proceedings covered by these guarantees. |
| | | If one or more individuals or legal entities, acting alone or together, directly or indirectly holds more than one-third of the voting rights of Arkema, or if Arkema transfers more than 50% of its assets (as calculated under the enterprise valuation method, as of the date of the transfer) to a third party or parties acting together, irrespective of the type or number of transfers, these guarantees will become void. |
| | • | In the United States, investigations into certain commercial practices of some subsidiaries of the Arkema group have been closed since 2007; no charges have been brought against Arkema. Civil liability lawsuits, for which TOTAL S.A. has been named as the parent company, are about to be closed and are not expected to have a significant impact on the Group’s financial position. | | • | In Europe, since 2006, the European Commission has fined companies of the Group in its configuration prior to the spin-off an overall amount of €385.47 million, of which Elf Aquitaineand/or TOTAL S.A. and their subsidiaries were held jointly liable for €280.17 million, Elf Aquitaine being personally fined €23.6 million for deterrence. These fines are entirely settled as of today. |
| | | As a result(2), since the spin-off, the Group has paid the overall amount of €188.07 million, corresponding to 90% of the fines overall amount once the threshold provided for by the guarantee is deducted. |
| | | The European Commission imposed these fines following investigations between 2000 and 2004 into commercial practices involving eight products sold by Arkema. Five of these investigations resulted in prosecutions from the European Commission for which Elf Aquitaine has been named as the parent company and two of these investigations named TOTAL S.A. as the ultimate parent company of the Group. |
| | | TOTAL S.A. and Elf Aquitaine are contesting their liability based solely on their status as parent companies and appealed for cancelation and reformation of the rulings that are still pending before the relevant EU court of appeals or supreme court of appeals. |
(1) Arkema is used in this section to designate those companies of the Arkema group whose ultimate parent company is Arkema S.A. Arkema became an independent company after being spun-off from TOTAL S.A. in May 2006.
(2) This amount does not take into account a case that led to Arkema, prior to Arkema’s spin-off from TOTAL, and Elf Aquitaine being fined jointly €45 million and Arkema being fined €13.5 million. This case is referred to in past Registration Documents.
121
| | | Besides, a civil proceeding against Arkema and five groups of companies was initiated before a German regional court by a third party for an alleged damage pursuant to one of the above described legal proceedings. TOTAL S.A. was summoned to serve notice of the dispute before this court. At this point, the probability to have a favorable verdict and the financial impacts of this procedure are uncertain due to the number of legal difficulties it gave rise to, the lack of documented claim and the complex evaluation of the alleged damage. | | | Arkema began implementing compliance procedures in 2001 that are designed to prevent its employees from violating antitrust provisions. However, it is not possible to exclude the possibility that the relevant authorities could commence additional proceedings involving Arkema regarding events prior to the spin-off, as well as Elf Aquitaineand/or TOTAL S.A. based on their status as parent company. | | | Within the framework of the legal proceedings described above, a €17 million reserve is booked in the Group’s consolidated financial statements as of December 31, 2010. |
Downstream segment
| | • | Pursuant to a statement of objections received by Total Nederland N.V. and TOTAL S.A. (based on its status as parent company) from the European Commission, Total Nederland N.V. was fined in 2006 €20.25 million, which has been paid, and for which TOTAL S.A. was held jointly liable for €13.5 million. TOTAL S.A. appealed this decision before the relevant court and this appeal is still pending. |
| | | In addition, pursuant to a statement of objections received by Total Raffinage Marketing (formerly Total France) and TOTAL S.A. from the European Commission regarding another product line of the Refining & Marketing division, Total Raffinage Marketing was fined €128.2 million in 2008, which has been paid, and for which TOTAL S.A. was held jointly liable based on its status as parent company. TOTAL S.A. also appealed this decision that is still pending before the relevant court. |
| | • | Finally, TotalGaz and Total Raffinage Marketing received in July 2009 a statement of objections from the French Antitrust Authority (Autorité de la concurrence française) regarding alleged antitrust practices concerning another product line of the Refining & Marketing division. The case was dismissed by decision of the French antitrust authorities on December 17, 2010. |
Given the discretionary powers granted to the antitrust authorities for determining fines relating to antitrust regulations, it is not currently possible to determine with certainty the outcome of these investigations and proceedings. TOTAL S.A. and Elf Aquitaine are contesting their liability and the method of determining these fines. Although it is not possible to predict the ultimate outcome of these proceedings, the Group believes that they will not have a material adverse effect on its financial situation or consolidated results.
Sinking of the Erika
Following the sinking in December 1999 of the Erika, a tanker that was transporting products belonging to one of the Group companies, theTribunal de grande instanceof Paris convicted TOTAL S.A. of marine pollution pursuant to a judgment issued on January 16, 2008, finding that TOTAL S.A. was negligent in its vetting procedure for vessel selection and ordering TOTAL S.A. to pay a fine of €375,000. The court also ordered compensation to be paid to those affected by the pollution from the Erika up to an aggregate amount of €192 million, declaring TOTAL S.A. jointly and severally liable for such payments together with the Erika’s inspection and classification firm, the Erika’s owner and the Erika’s manager.
TOTAL has appealed the verdict of January 16, 2008. In the meantime, it nevertheless proposed to pay third parties who so requested definitive compensation as determined by the court. Forty-one third parties have been compensated for an aggregate amount of €171.5 million.
By a decision dated March 30, 2010, the Court of Appeal of Paris upheld the lower court verdict pursuant to which TOTAL S.A. was convicted of marine pollution and fined €375,000. TOTAL appealed this decision to the French Supreme Court (Cour de cassation).
However, the Court of Appeal ruled that TOTAL S.A. bears no civil liability according to the applicable international conventions and consequently ruled that TOTAL S.A. be not convicted.
TOTAL S.A. believes that, based on the information currently available, the case should not have a significant impact on the Group’s financial situation or consolidated results.
122
Buncefield
On December 11, 2005, several explosions, followed by a major fire, occurred at an oil storage depot at Buncefield, north of London. This depot was operated by Hertfordshire Oil Storage Limited (HOSL), a company in which TOTAL’s UK subsidiary holds 60% and another oil group holds 40%. The explosion caused injuries, most of which were minor injuries, to a number of people and caused property damage to the depot and the buildings and homes located nearby. The official Independent Investigation Board has indicated that the explosion was caused by the overflow of a tank at the depot. The Board’s final report was released on December 11, 2008. The civil procedure for claims, which had not yet been settled, took place between October and December 2008. The Court’s decision of March 20, 2009, declared TOTAL’s UK subsidiary liable for the accident and solely liable for indemnifying the victims. The subsidiary appealed the decision. The appeal trial took place in January 2010. The Court of Appeals, by a decision handed down on March 4, 2010, confirmed the prior judgment. The Supreme Court of United Kingdom has partially authorized TOTAL’s UK subsidiary to contest the decision. TOTAL’s UK subsidiary finally decided to withdraw from this recourse due to settlement agreements reached in mid-February 2011. The Group carries insurance for damage to its interests in these facilities, business interruption and civil liability claims from third parties. The provision for the civil liability that appears in the Group’s consolidated financial statements as of December 31, 2010,2011, stands at €194€80 million after taking into account the payments previously made. The Group believes that, based on the information currently available, on a reasonable estimate of its liability and on provisions recognized, this accident should not have a significant impact on the Group’s financial situation or consolidated results. In addition, on December 1, 2008, the Health and Safety Executive (HSE) and the Environment Agency (EA) issued a Notice of prosecution against five companies, including TOTAL’s UK subsidiary. By a judgment on July 16, 2010, TOTAL’s UKthe subsidiary was fined £3.6 million.million and paid it. The decision takes into account a number of elements that have mitigated the impact of the charges brought against it. MyanmarSinking of the Erika
UnderFollowing the Belgian “universal jurisdiction” lawssinking in December 1999 of Junethe Erika, a tanker that was transporting products belonging to one of the Group companies, theTribunal de grande instance of Paris convicted TOTAL S.A. of marine pollution pursuant to a judgment issued on January 16, 19932008, finding that TOTAL S.A. was negligent in its vetting procedure for vessel selection, and February 10, 1999,ordering TOTAL S.A. to pay a complaint was filed in Belgium on April 25, 2002, againstfine of€375,000. The Court also ordered compensation to be paid to those affected by the Company, its Chairmanpollution from the Erika up to an aggregate amount of€192 million, declaring TOTAL S.A. jointly and severally liable for such payments together with the Erika’s inspection and classification firm, the Erika’s owner and the former presidentErika’s manager. TOTAL has appealed the verdict of its subsidiary in Myanmar. These laws were repealedJanuary 16, 2008. In the meantime, it nevertheless proposed to pay third parties who so requested definitive compensation as determined by the Belgian lawCourt. Forty-two third parties have been compensated for an aggregate amount of August 5, 2003 on “serious violations of international human rights”, which also provided a procedure for terminating certain proceedings that were underway. In this framework, the BelgianCour de cassationterminated the proceedings against TOTAL in€171.5 million. By a decision dated June 29, 2005. The plaintiffs’ request to withdraw this decision was rejected by theCour de cassationon March 28, 2007. Despite this decision, the Belgian Ministry of Justice asked the Belgian federal prosecutor to request that the investigating judge reopen the case. The Belgian federal prosecutor decided to submit the admissibility of this request to30, 2010, the Court of Appeal of Brussels. In its decisionParis upheld the lower Court verdict pursuant to which TOTAL S.A. was convicted of March 5, 2008,marine pollution and fined€375,000. However, the Court of Appeal confirmedruled that TOTAL S.A. bears no civil liability according to the applicable international conventions and consequently ruled that TOTAL S.A. be not convicted.TOTAL challenged the criminal law-related issues of this decision before the French Supreme Court (Cour de cassation). To facilitate the payment of damages awarded by the Court of Appeal in Paris to third parties against Erika’s controlling and classification firm, the ship-owner and the ship-manager, a global settlement agreement was signed late 2011 between these parties and TOTAL S.A. under the auspices of the IOPC Fund. Under this global settlement agreement, each party agreed to the withdrawal of all civil proceedings initiated against all other parties to the agreement. TOTAL S.A. believes that, based on the information currently available, the case should not have a significant impact on the Group’s financial situation or consolidated results. Blue Rapid and the Russian Olympic Committee — Russian regions and Interneft Blue Rapid, a Panamanian company, and the Russian Olympic Committee filed a claim for damages with the Paris Commercial Court against Elf Aquitaine, alleging a so-called non-completion by a former subsidiary of Elf Aquitaine of a contract related to an exploration and production project in Russia negotiated in the early 1990s. Elf Aquitaine believed this claim to be unfounded and opposed it. On January 12, 2009, the Commercial Court of Paris rejected Blue Rapid’s claim against Elf Aquitaine and found that the Russian Olympic Committee did not have standing in the matter. Blue Rapid and the Russian Olympic Committee appealed this decision. On June 30, 2011, the Court of Appeal of Paris dismissed as inadmissible the claim of Blue Rapid and the Russian Olympic Committee against Elf Aquitaine, notably on the grounds of the contract’s termination. Blue Rapid and the Russian Olympic Committee appealed this decision to the French Supreme Court. In connection with the same facts, and fifteen years after the termination of the proceedingsexploration and production contract, a Russian company, which was held not to be the contracting party to the contract, and two regions of the Russian Federation which were not even parties to the contract, have launched an arbitration procedure against TOTAL, its Chairmanthe aforementioned former subsidiary of Elf Aquitaine that was liquidated in 2005, claiming alleged damages of U.S.$22.4 billion. For the same reasons as those successfully adjudicated by Elf Aquitaine against Blue Rapid and the former president of its subsidiary, based onRussian Olympic Committee, the principle ofres judicata applyingGroup considers this claim to theCour de cassation’s decision of June 29, 2005. The plaintiffs appealed the decision of March 5, 2008. On October 29, 2008, theCour de cassationrejected the plaintiffs’ appeal, thus ending definitively the proceedings. TOTAL has always maintained that the accusations made against the Company and its management arising out of the activities of its subsidiary in Myanmar were without substancebe unfounded as to a matter of factlaw or fact. The Group has lodged a criminal complaint to denounce the fraudulent claim which the Group believes it is a victim of and, as a matter of law.has taken and reserved its rights to take other actions and measures to defend its interests.
In a threatened class action proceeding in the United States, TOTAL, together with approximately 100 other multinational companies, is the subject of accusations by certain South African citizens who alleged that their human rights were violated during the era of apartheid by the army, the police or militias, and who consider that these companies were accomplices in the actions by the South African authorities at the time.
The claims against the companies named in the class action, which were not officially brought against TOTAL, were dismissed by a federal judge in New York. The plaintiffs appealed this dismissal and, after a procedural hearing on November 3, 2008, decided to remove TOTAL from the list of companies against which it was bringing claims.
Iran
In 2003, the United States Securities and Exchange Commission (SEC) followed by the Department of Justice (DoJ) issued a formal order directing an investigation in connection with the pursuit of business in Iran, by certain oil companies including, among others, TOTAL. The inquiry concerns an agreement concluded by the Company with a consultant concerning a gas field in Iran
123
and aims to verify whether certain payments made under this agreement would have benefited Iranian officials in violation of the Foreign Corrupt Practices Act (FCPA) and the Company’s accounting obligations. Investigations are still pending and the Company is cooperating with the SEC and the DoJ. In 2010, the Company opened talks with U.S. authorities, without any acknowledgement of facts, to consider anout-of-court settlement. Generally,out-of-court settlements with U.S. authorities include payment settlement as it is often the case in this kind of finesproceeding. Late in 2011, the SEC and the obligationDoJ proposed to improve internal compliance systems or other measures. TOTAL out-of-court settlements that would close their inquiries, in exchange for TOTAL’s committing to a number of obligations and paying fines. As TOTAL was unable to agree to several substantial elements of the proposal, the Company is continuing discussions with the U.S. authorities. The Company is free not to accept an out-of-court settlement solution, in which case it would be exposed to the risk of prosecution in the United States.In this same case,affair, a parallel judicial inquiry related to TOTAL was initiated in France in 2006. In 2007, the Company’s Chief Executive Officer was placed under formal investigation in relation to this inquiry, as the former President of the Middle East department of the Group’s Exploration & Production division. The Company has not been notified of any significant developments in the proceedings since the formal investigation was launched. At this point, the Company cannot determine when these investigations will terminate, and cannot predict their results, or the outcome of the talks that have been initiated, or the costs of a potentialout-of-court settlement.initiated. Resolving this casethese cases is not expected to have a significant impact on the Group’s financial situation or any impactconsequences on its future planned operations. Libya In June 2011, the SEC issued to certain oil companies — including, among others, TOTAL — a formal request for information related to their operations in Libya. TOTAL is cooperating with this non-public investigation. ItalyOil-for-Food Program
As part of an investigation led by the Prosecutor of the Republic of the Potenza court, Total Italia and certain Group’s employees are the subject of an investigation related to certain calls for tenders that Total Italia made for the preparation and development of the Tempa Rossa oil field. On February 16, 2009, as a preliminary measure before the proceedings go before the court, the preliminary investigation judge of Potenza served notice to Total Italia of a decision that would suspend the concession for this field for one year. Total Italia has appealed the decision by the preliminary investigation judge before the Court of Appeal of Potenza. In a decision dated April 8, 2009, the Court reversed the suspension of the Gorgoglione concession and appointed for one year,i.e.until February 16, 2010, a judicial administrator to supervise the operations related to the development of the concession, allowing the Tempa Rossa project to continue.
The criminal investigation was closed in the first half of 2010. The preliminary hearing judge, who will decide whether the case shall be returned to the Criminal Court to be judged on the merits, held the first hearing on December 6, 2010. The next hearing is scheduled during the first half of 2011.
In 2010, Total Italia’s exploration and production operations were transferred to Total E&P Italia and refining and marketing operations were merged with those of Erg Petroli.
Oil-for-Food Program
Several countries have launched investigations concerning possible violations related to the United Nations (UN)Oil-for-Food program in Iraq. Pursuant to a French criminal investigation, certain current or former Group employees were placed under formal criminal investigation for possible charges as accessories to the misappropriation of corporate assets and as accessories to the corruption of foreign public agents. The Chairman and Chief Executive Officer of the Company, formerly President of the Group’s Exploration & Production division, was also placed under formal investigation in October 2006. In 2007, the criminal investigation was closed and the case was transferred to the Prosecutor’s office. In 2009, the Prosecutor’s office recommended to the investigating judge that the case against the Group’s current and former employees and TOTAL’s Chairman and Chief Executive Officer not be pursued. In early 2010, despite the recommendation of the Prosecutor’s office, a new investigating judge, having taken over the case, decided to indict TOTAL S.A. on bribery charges as well as complicity and influence peddling. The indictment was brought eight years after the beginning of the investigation without any new evidence being added to the affair. introduced.In October 2010, the Prosecutor’s office recommended to the investigating judge that the case against TOTAL S.A., the Group’s current and former employees and TOTAL’s Chairman and Chief Executive Officer not be pursued. However, by ordinance notified in early August 2011, the investigating judge on the matter decided to send the case to trial. The investigating judge’s decision on this matter is pending. hearings are expected in the first quarter of 2013.The Company believes that its activities related to theOil-for-Food program have been in compliance with this program, as organized by the UN in 1996. The Volcker report released by the independent investigating committee set up by the UN had discarded any bribery grievance within the framework of theOil-For-Food program with respect to TOTAL. Italy As part of an investigation led by the Prosecutor of the Republic of the Potenza Court, Total Italia and certain Group’s employees are the subject of an investigation related to certain calls for tenders that Total Italia made for the preparation and development of an oil field. On February 16, 2009, as a preliminary measure before the proceedings go before the Court, the preliminary investigation judge of Potenza served notice to Total Italia Blue Rapid andof a decision that would suspend the Russian Olympic Committee — Russian regions and Interneft
Blue Rapid,concession for this field for one year. Total Italia has appealed the decision by the preliminary investigation judge before the Court of Appeal of Potenza. In a Panamanian company, and the Russian Olympic Committee filed a claim for damages with the Paris Commercial Court against Elf Aquitaine concerning the withdrawal of one of its subsidiaries from an exploration and
124
production project in Russia that was negotiated in the early 1990s. Elf Aquitaine believes this claim to be unfounded. On January 12,decision dated April 8, 2009, the Commercial Court reversed the suspension of Paris rejected Blue Rapid’s claimthe Gorgoglione concession and found thatappointed for one year,i.e.until February 16, 2010, a judicial administrator to supervise the Russian Olympic Committee did not have standingoperations related to the development of the concession, allowing the Tempa Rossa project to continue.The criminal investigation was closed in the matter. This decision has been appealed. The hearings are expected to be held during the first half of 2011. 2010. The preliminary hearing judge, who will decide whether the case shall be returned to the Criminal Court to be judged on the merits, held the first hearing on December 6, 2010. The proceedings before the Judge of the preliminary hearing are still pending.In connection with the same facts, and fifteen years after the termination of this2010, Total Italia’s exploration and production project, a Russian companyoperations were transferred to Total E&P Italia and two regionsrefining and marketing operations were merged with those of the Russian Federation have launched an arbitration procedure against a former subsidiary of Elf Aquitaine that was liquidated in 2005, claiming damages of an unspecified amount at this stage of the procedure. The Group considers this claim to be unfounded. The Group has reserved its rights to take any actionsand/or measures that would be appropriate to defend its interests. Erg Petroli.Dividend policy The Company has paid dividends on its share capital in each year since 1946. Future dividends will depend on the Company’s earnings, financial condition and other factors. The payment and amount of dividends are subject to the recommendation of the Board of Directors and resolution by the Company’s shareholders at the annual shareholders’ meeting. Since 2004,Shareholders’ Meeting.Until the payment of the 2010 dividend, the Company has paid an interim dividend in November and the remainder after the Shareholders’ Meeting held in May of each year. TheConsequently, for 2010, an interim dividend of€1.14 per share and the remainder will still beof€1.14 per share were paid in compliance with this policy. The Board of Directors metrespectively on July 29,November 17, 2010 and approved a 2010 interim dividend of €1.14 per share. The ex-dividend date for the interim dividend on Euronext Paris was November 12, 2010 and the payment date was November 17, 2010.
For 2010, TOTAL plans to continue its dividend policy by proposing a dividend of €2.28 per share at the Shareholders’ Meeting on May 13, 2011, including a remainder of €1.14 per share, with an ex-dividend date on May 23, 2011, and a payment on May 26, 2011. This €2.28 per share dividend is stable compared to the previous year. Over the past five fiscal years, the dividend has increased by an average of 5.1%(1) per year.
On October 28, 2010, the Board of Directors decided to change its interim dividend policy and to adopt a new policy based on quarterly dividend payments.payments, starting in 2011. TOTAL paid three quarterly interim dividends for 2011: The Board of Directors decided on the first quarterly interim dividend on April 28, 2011, with an ex-dividend date on September 19, 2011 and a payment date on September 22, 2011; The Board of Directors decided on the second quarterly interim dividend on July 28, 2011, with an ex-dividend date on December 19, 2011 and a payment date on December 22, 2011; PendingThe Board of Directors decided on the third quarterly interim dividend on October 27, 2011, with an ex-dividend date on March 19, 2012 and a payment date on March 22, 2011. For 2011, TOTAL plans to continue its dividend policy by proposing a dividend of€2.28 per share at the Shareholders’ Meeting on May 11, 2012, including a remainder of€0.57 per share, with an ex-dividend date on June 18, 2012, and a payment on June 21, 2012. This€2.28 per share dividend is stable compared to the previous year. Subject to the applicable legislative and regulatory provisions, and pending the approval by the Board of Directors for the interim dividends and by the shareholders at the Shareholders’ Meeting for the accounts and the final dividend, the ex-date calendar for the interim quarterly dividends and the final dividend for 20112012 should be as follows: September 19, 2011; December 19, 2011; March 19, 2012; and | • | | 1st interim dividend: September 24, 2012; |
| • | | 2nd interim dividend: December 17, 2012; |
| • | | 3rd interim dividend: March 18, 2013; |
remainder: June 18, 2012. 24, 2013. The provisionalex-dividend dates above relate to the TOTAL shares traded on the Euronext Paris. Dividends paid to holders of ADRs will be subject to a charge by the Depositary for any expenses incurred by the Depositary in the conversion of euro to dollars. See “Item 10. Additional Information — Taxation”, for a summary of certain U.S. federal and French tax consequences to holders of shares and ADRs. In February 2011, TOTAL signed an agreement to dispose of its 48.83% interest in CEPSA. The transaction is conditioned on obtaining all requisite approvals.
In early March 2011, the Group also announced the signature of two agreements on principle with the Russian Company Novatek and its major shareholders.
For a further description of significant changes that have occurred since the date of the Company’s Consolidated Financial Statements, see “Item 4. Information on the Company” and “Item 5. Operating and Financial Review and Prospects”, which include descriptions of certain recent 20112012 activities. ITEM 9. THE OFFER AND LISTING
The principal trading market for the shares is the Euronext Paris exchange in France. The shares are also listed on Euronext Brussels and the London Stock Exchange. Offer and listing details Trading on Euronext Paris Official trading of listed securities on Euronext Paris, including the shares, is transacted through French investment service providers that are members of Euronext Paris and takes place continuously on each business day in Paris from 9:00 a.m. to 5:30 p.m. (Paris time), with a fixing of the closing price at 5:35 p.m. Euronext Paris may suspend or resume trading in a security listed on Euronext Paris, if the quoted price of the security exceeds certain price limits defined by the regulations of Euronext Paris. The markets of Euronext Paris settle and transfer ownership three trading days after a transaction (T+3). (1) This increase does not take into account the Arkema share allotment right granted on May 18, 2006.
125
Highly liquid shares, including those of the Company, are eligible for deferred settlement (Service de Règlement Différé— SRD). Payment and delivery for shares under the SRD occurs on the last trading day of each month. Use of the SRD service requires payment of a commission. Under this system, the determination date for settlement on the following month occurs on the fifth trading day prior to the last trading day (inclusive) of each month. In France, the shares are included in the principal index published by Euronext Paris (the “CAC 40 Index”). The CAC 40 Index is derived daily by comparing the total market capitalization of 40 stocks traded on Euronext Paris to the total market capitalization of the stocks that made up the CAC 40 Index on December 31, 1987. Adjustments are made to allow for expansion of the sample due to new issues. The CAC 40 Index indicates trends in the French stock market as a whole and is one of the most widely followed stock price indices in France. In the UK, the shares are listed in both the FTSE Eurotop 100 and FTSEurofirst 300 index. As a result of the creation of Euronext, the shares are included in Euronext 100, the index representing Euronext’s blue chip companies based on market capitalization. The shares are also included in the Dow Jones Stoxx 50 and Dow Jones Euro Stoxx 50, blue chip indices comprised of the fifty most highly capitalized and most actively traded equities throughout Europe and within the European Monetary Union, respectively. Since June 2000, the shares have been included in the Dow Jones Global Titans Index which consists of fifty global companies selected based on market capitalization, book value, assets, revenue and earnings. Pursuant to the vote of the May 12, 2006, shareholders’ meeting approving TOTAL’sfour-for-one stock split, each shareholder received on May 18, 2006, four new TOTAL shares, par value of €2.50 per share, in return for each old share with a par value of €10. The table below sets forth, for the periods indicated, the reported high and low quoted prices in euros for the currently outstanding shares on Euronext Paris. Data prior to May 18, 2006, reported in this table has been adjusted to reflect this stock split by dividing stock prices by four. The May 12, 2006, shareholders’ meeting also approved the spin-off of Arkema and the allocation, as of May 18, 2006, of one Arkema share allocation right for each TOTAL share with a par value of €10, ten allocation rights entitling the holder to one Arkema share. Data prior to May 18, 2006, reported in the third and fourth columns of this table are adjusted in order to consider Arkema’s share allocation right partition. | | | | | | | | | | | | | | | | | | | Price per share (€) | | High | | | Low | | | High adjusted | | | Low adjusted | | | 2006 | | | 58.15 | | | | 46.52 | | | | 57.40 | | | | 46.52 | | | 2007 | | | 63.40 | | | | 48.33 | | | | — | | | | — | | | 2008 | | | 59.50 | | | | 31.52 | | | | — | | | | — | | | 2009 | | | 45.785 | | | | 34.25 | | | | — | | | | — | | | First Quarter | | | 42.465 | | | | 34.25 | | | | — | | | | — | | | Second Quarter | | | 42.455 | | | | 34.72 | | | | — | | | | — | | | Third Quarter | | | 42.45 | | | | 35.75 | | | | — | | | | — | | | Fourth Quarter | | | 45.785 | | | | 39.005 | | | | — | | | | — | | 2010 | | | 46.735 | | | | 35.655 | | | | — | | | | — | | | First Quarter | | | 46.735 | | | | 40.05 | | | | — | | | | — | | | Second Quarter | | | 44.625 | | | | 36.21 | | | | — | | | | — | | | Third Quarter | | | 41.00 | | | | 35.655 | | | | — | | | | — | | | September | | | 39.67 | | | | 36.77 | | | | — | | | | — | | | Fourth Quarter | | | 41.275 | | | | 36.91 | | | | — | | | | — | | | October | | | 39.72 | | | | 37.52 | | | | — | | | | — | | | November | | | 41.275 | | | | 36.91 | | | | — | | | | — | | | December | | | 40.79 | | | | 37.195 | | | | — | | | | — | | 2011 (through February 28) | | | 44.47 | | | | 40.01 | | | | — | | | | — | | | January | | | 43.575 | | | | 40.01 | | | | — | | | | — | | | February | | | 44.47 | | | | 42.325 | | | | — | | | | — | |
| | | | | | | | | | Price per share (€) | | High | | | Low | | 2007 | | | 63.40 | | | | 48.33 | | 2008 | | | 59.50 | | | | 31.52 | | 2009 | | | 45.785 | | | | 34.25 | | 2010 | | | 46.735 | | | | 35.655 | | First Quarter | | | 46.735 | | | | 40.050 | | Second Quarter | | | 44.625 | | | | 36.210 | | Third Quarter | | | 41.000 | | | | 35.655 | | Fourth Quarter | | | 41.275 | | | | 36.910 | | 2011 | | | 44.550 | | | | 29.400 | | First Quarter | | | 44.550 | | | | 39.710 | | Second Quarter | | | 43.730 | | | | 37.305 | | Third Quarter | | | 40.895 | | | | 29.400 | | September | | | 34.820 | | | | 29.400 | | Fourth Quarter | | | 39.810 | | | | 31.730 | | October | | | 39.810 | | | | 31.730 | | November | | | 38.705 | | | | 34.570 | | December | | | 39.605 | | | | 35.940 | | 2012 (through February 29) | | | 42.400 | | | | 38.570 | | January | | | 40.890 | | | | 38.570 | | February | | | 42.400 | | | | 40.225 | |
Trading on the New York Stock Exchange ADSs evidenced by ADRs have been listed on the New York Stock Exchange since October 25, 1991. The Bank of New York Mellon serves as depositary with respect to the ADSs evidenced by ADRs traded on the New York Stock Exchange. One ADS corresponds to one TOTAL share. The table below sets forth, for the periods indicated, the reported high and low prices quoted in dollars for the currently outstanding ADSs evidenced by ADRs on the New York Stock Exchange. After thefour-for-one stock split, which was approved by the shareholders’ meeting on May 12, 2006, and effective on May 18, 2006, and after the split of the ADRs by two on May 23, 2006, one ADR corresponds to one TOTAL share. Data prior to May 23, 2006, reported in this table
126
has been adjusted to take into account this stock split by dividing ADR prices by two. The May 12, 2006, shareholders’ meeting also approved the spin-off of Arkema and the allocation, as from May 18, 2006, of one Arkema share allocation right for each TOTAL share with a par value of €10, ten allocation rights entitling the holder to one Arkema share. Data prior to May 23, 2006, reported in the third and fourth columns of this table has been adjusted in order to reflect Arkema’s share allocation right partition.
| | | | | | | | | | | | | | | | | | | Price Per ADR ($) | | High | | | Low | | | High adjusted | | | Low adjusted | | | | | 2006 | | | 73.46 | | | | 58.06 | | | | 73.46 | | | | 58.06 | | | 2007 | | | 87.34 | | | | 63.89 | | | | — | | | | — | | | 2008 | | | 91.34 | | | | 42.60 | | | | — | | | | — | | | 2009 | | | 65.98 | | | | 42.88 | | | | — | | | | — | | | First Quarter | | | 57.85 | | | | 42.88 | | | | — | | | | — | | | Second Quarter | | | 59.93 | | | | 45.02 | | | | — | | | | — | | | Third Quarter | | | 62.43 | | | | 49.78 | | | | — | | | | — | | | Fourth Quarter | | | 65.98 | | | | 57.05 | | | | — | | | | — | | 2010 | | | 67.52 | | | | 43.07 | | | | — | | | | — | | | First Quarter | | | 67.52 | | | | 54.01 | | | | — | | | | — | | | Second Quarter | | | 60.24 | | | | 43.07 | | | | — | | | | — | | | Third Quarter | | | 54.14 | | | | 44.43 | | | | — | | | | — | | | September | | | 52.46 | | | | 48.15 | | | | — | | | | — | | | Fourth Quarter | | | 58.06 | | | | 48.08 | | | | — | | | | — | | | October | | | 55.50 | | | | 51.20 | | | | — | | | | — | | | November | | | 58.06 | | | | 48.08 | | | | — | | | | — | | | December | | | 53.97 | | | | 49.03 | | | | — | | | | — | | 2011 (through February 28) | | | 61.44 | | | | 52.61 | | | | — | | | | — | | | January | | | 59.84 | | | | 52.61 | | | | — | | | | — | | | February | | | 61.44 | | | | 58.05 | | | | — | | | | — | |
| | | | | | | | | | Price per ADR ($) | | High | | | Low | | 2007 | | | 87.34 | | | | 63.89 | | 2008 | | | 91.34 | | | | 42.60 | | 2009 | | | 65.98 | | | | 42.88 | | 2010 | | | 67.52 | | | | 43.07 | | First Quarter | | | 67.52 | | | | 54.01 | | Second Quarter | | | 60.24 | | | | 43.07 | | Third Quarter | | | 54.14 | | | | 44.43 | | Fourth Quarter | | | 58.06 | | | | 48.08 | | 2011 | | | 64.44 | | | | 40.00 | | First Quarter | | | 62.31 | | | | 52.61 | | Second Quarter | | | 64.44 | | | | 53.04 | | Third Quarter | | | 58.25 | | | | 40.00 | | September | | | 49.79 | | | | 40.00 | | Fourth Quarter | | | 55.93 | | | | 41.85 | | October | | | 55.93 | | | | 41.85 | | November | | | 52.89 | | | | 46.72 | | December | | | 52.46 | | | | 47.00 | | 2012 (through February 29) | | | 57.06 | | | | 48.82 | | January | | | 53.41 | | | | 48.82 | | February | | | 57.06 | | | | 53.01 | |
ITEM 10. ADDITIONAL INFORMATION Memorandum and Articles of Association Register Informationinformation TOTAL S.A. is registered with the Nanterre Trade Register under the registration number 542 051 180. Objects and Purposespurposes The Company’s purpose can be found in Article 3 of its bylaws (statuts). Generally, the Company may engage in all activities relating to: (i) the exploration and extraction of mining deposits and the performance of industrial refining, processing, and trading of these materials, as well as their derivatives and by-products; (ii) the production and distribution of all forms of energy; (iii) the chemicals, rubber and health industries; (iv) the transportation and shipping of hydrocarbons and other products or materials relating to the Company’s business purpose; and (v) all financial, commercial, and industrial operations and operations relating to any fixed or unfixed assets and real estate, acquisitions of interests or holdings in any business or company that may relate to any of the above-mentioned purposes or to any similar or related purposes, of such nature as to promote the Company’s extension or its development. Directors receive attendance fees, the maximum aggregate amount of which, determined by the shareholders acting at a shareholders’ meeting, remains in effect until a new decision is made. The Board of Directors may apportion this amount among its members in whatever way it considers appropriate. In addition, the Board may also grant its Chairman compensation. The number of directors of TOTAL who are acting in their own capacity or as permanent representatives of a legal entity and are over seventy years old may not exceed one-third of the number of directors in office at the end of the fiscal year. If such number is exceeded, the oldest Board member is automatically deemed to have resigned. Directors who are the permanent representative of a legal
127
person may not continue in office beyond their seventieth birthday. Currently, the duties of the Chairman of the Board automatically cease on his sixty-fifth birthday at the latest. At their meeting of May 15, 2009, the shareholders adopted an amendment of the bylaws pertaining to the rules relating to the nomination of the Chairman. The amendment allows the Board, as an exception to the currently applicable sixty-five year age limit, to appoint as Chairman of the Board for a period of up to two years a director who is more than sixty-five years old but less than seventy years old. Each director must own at least 1,000 shares of TOTAL during his or her term of office, except the director representing the employees shareholder who shall hold, either individually or through an investment trust governed byArticle L.214-40 of the Monetary & Financial Code (French (French FCPE), at least one share or a number of stocks in such investment trust amounting to at least one share. Directors are elected for a term of three years. In 2003, TOTAL amended its Articles of Incorporation to provide for the election of one director to represent employee shareholders. This director was appointed for the first time at the shareholders’ meeting held on May 14, 2004. Description of Sharesshares The following is a summary of the material rights of holders of fully paid shares and is based on the bylaws of the Company and French Company Law as codified in Volume II (Livre II) of the French Commercial Code (referred to herein as the “French Company Law”). For more complete information, please read the bylaws of TOTAL S.A., a copy of which has been filed as an exhibit to this Annual Report. The Company may make dividend distributions to its shareholders from net income in each fiscal year, after deduction of the overhead and other social charges, as well as of any amortization of the business assets and of any provisions for commercial and industrial contingencies, as reduced by any loss carried forward from prior years, and less any contributions to reserves or amounts that the shareholders decide to carry forward. These distributions are also subject to the requirements of French Company Law and the Company’s bylaws. Under French Company Law, the Company must allocate 5% of its net profits in each fiscal year to a legal reserve fund until the amount in that fund is equal to 10% of the nominal amount of its share capital. The Company’s bylaws provide that its shareholders may decide to allocate all or a part of any distributable profits among special or general reserves, to carry them forward to the next fiscal year as retained earnings, or to allocate them to the shareholders as dividends. The bylaws provide that the shareholders’ meeting held to approve the financial statements for the financial year may decide to grant an option to each shareholder between payment of the dividend in cash and payment in shares with respect to all or part of the dividend or interim dividends. Under French Company Law, the Company must distribute dividends to its shareholders pro rata, according to their shareholdings. Dividends are payable to holders of outstanding shares on the date fixed by the shareholders’ meeting approving the distribution of dividends or, in the case of interim dividends, on the date fixed by the Company’s Board of Directors at the meeting that approves the distribution of interim dividends. Under French law, dividends not claimed within five years of the date of payment revert to the French State. Each shareholder of the Company is entitled to the number of votes he or she possesses, or for which he or she holds proxies. According to French Company Law, voting rights may not be exercised in respect of fractional shares. According to the Company’s bylaws, each registered share that is fully paid and registered in the name of the same shareholder for a continuous period of at least two years is granted a double voting right after such two-year period. Upon capital increase by capitalization of reserves, profits or premiums on shares, a double voting right is granted to each registered share allocated to a shareholder relating to previously existing shares that already carry double voting rights. The double voting right is automatically canceled when the share is converted into a bearer share or when the share is transferred, unless the transfer is due to inheritance, division of community property between spouses, or a donation during the lifetime of the shareholder to the benefit of a spouse or relatives eligible to inherit.
128
French Company Law limits a shareholder’s right to vote notably in the following circumstances: shares held by the Company or by entities controlled by the Company under certain conditions, which cannot be voted; | | • | shares held by the Company or by entities controlled by the Company under certain conditions, which cannot be voted; | • | shares held by shareholders making a contribution in-kind to the Company, which cannot be voted with respect to resolutions relating to such in-kind contributions; and | • | shares held by interested parties, which cannot be voted with respect to resolutions relating to such shareholders. |
shares held by shareholders making a contribution in-kind to the Company, which cannot be voted with respect to resolutions relating to such in-kind contributions; and shares held by interested parties, which cannot be voted with respect to resolutions relating to such shareholders. Under the Company’s bylaws, the voting rights exercisable by a shareholder, directly, indirectly or by proxy, at any shareholders’ meeting are limited to 10% of the total number of voting rights attached to the shares on the date of such shareholders’ meeting. This 10% limitation may be increased by taking into account double voting rights held directly or indirectly by the shareholder or by proxy, provided that the voting rights exercisable by a shareholder at any shareholders’ meeting may never exceed 20% of the total number of voting rights attached to the shares. According to the Company’s bylaws, these limitations on voting lapse automatically if any individual or entity acting alone or in concert with an individual or entity holds at least two-thirds of the total number of shares as a result of a tender offer for 100% of the shares. In the event the Company is liquidated, its assets remaining after payment of its debts, liquidation expenses and all of its other remaining obligations will first be distributed to repay the nominal value of the shares. After these payments have been made, any surplus will be distributed pro rata among the holders of shares based on the nominal value of their shareholdings. Redemption provisions The Company’s shares are not subject to any redemption provisions. Sinking fund provisions The Company’s shares are not subject to any sinking fund provisions. Future capital calls Shareholders are not liable to the Company for further capital calls on their shares. Preferential subscription rights Holders of shares have preferential rights to subscribe on a pro rata basis for additional shares issued for cash. Shareholders may waive their preferential rights, either individually or, under certain circumstances, as a specifically named group at an extraordinary shareholders’ meeting. During the subscription period relating to a particular offering of shares, shareholders may transfer their preferential subscription rights that they have not previously waived. Under French Company Law, the Company may increase its share capital only with the approval of its shareholders at an extraordinary shareholders’ meeting (or with a delegation of authority from its shareholders). There are two methods to increase share capital: (i) by issuing additional shares, including the creation of a new class of securities and (ii) by increasing the nominal value of existing shares. The Company may issue additional shares for cash or for assets contributed in kind, upon the conversion of debt securities, or other securities giving access to its share capital, that it may have issued, by capitalization of its reserves, profits or issuance premiums or, subject to certain conditions, in satisfaction of its indebtedness. Under French Company Law, the Company may decrease its share capital only with the approval of its shareholders at an extraordinary shareholders’ meeting (or with a delegation of authority from its shareholders). There are two methods to reduce share capital: (i) by reducing the number of shares outstanding, and (ii) by decreasing the nominal value of existing shares. The conditions under which the share capital may be reduced will vary depending upon whether the reduction is attributable to losses. The Company may reduce the number of outstanding shares either by an exchange of shares or by the repurchase and cancellation of its shares. If the reduction is attributable to losses, shares are cancelled through offsetting the Company’s losses. Any decrease must meet the requirements of French Company Law, which states, among other things, that all the holders of shares in each class of shares must be treated equally, unless the affected shareholders otherwise agree. The Company has only one class of shares, par value €2.50€2.50 per share. Shares may be held in either bearer or registered form. Shares traded on Euronext Paris are cleared and settled through Euroclear France. The Company may use any lawful means to identify holders of shares, including a procedure known astitres au porteur identifiableaccording to which Euroclear France will, upon the Company’s request, disclose to the Company the name, nationality, address and number of shares held by each shareholder in bearer form. The information may only be requested by the Company and may not be communicated to third parties.
129
Holding of shares Under French Company Law and since the “dematerialization” of securities, the ownership rights of shareholders are represented by book entries instead of share certificates (other than certificates representing French securities, which are outstanding exclusively outside the territory of France and are not held by French residents). Registered shares are entered into an account maintained by the Company or by a representative that it has nominated, while shares in bearer form must be held in an account maintained by an accredited financial intermediary on the shareholder’s behalf. For all shares in registered form, the Company maintains a share account with Euroclear France which is administered by BNP Paribas Securities Services. In addition, the Company maintains accounts in the name of each registered shareholder either directly or, at a shareholder’s request, through a shareholder’s accredited intermediary, in separate accounts maintained by BNP Paribas Securities Services on behalf of the Company. Each shareholder’s account shows the name and number of shares held and, in the case of shares registered through an accredited financial intermediary, the fact that they are so held. BNP Paribas Securities Services, as a matter of course, issues confirmations to each registered shareholder as to shares registered in a shareholder’s account, but these confirmations do not constitute documents of title. Shares held in bearer form are held and registered on the shareholder’s behalf in an account maintained by an accredited financial intermediary and are credited to an account at Euroclear France maintained by the intermediary. Each accredited financial intermediary maintains a record of shares held through it and will issue certificates of inscription for the shares that it holds. Transfers of shares held in bearer form only may be made through accredited financial intermediaries and Euroclear France. Cancellation of treasury shares After receiving authorization through a shareholders’ meeting, the Board of Directors of the Company may cancel treasury shares owned by the Company in accordance with French Company Law up to a maximum of 10% of the share capital within any period of twenty-four months. Description of TOTAL Share Certificatesshare certificates The TOTAL share certificates are issued by Euroclear France. French law allows Euroclear France to create certificates representing French securities provided that these certificates are intended to be outstanding exclusively outside the territory of France and cannot be held by residents of France. Furthermore, TOTAL share certificates may not be held by a foreign resident in France, either personally or in the form of a bank deposit, but the coupons and rights may be exercised in France. Certificates for TOTAL shares are either in bearer form or registered in a securities trading account. Under Euroclear France regulations applicable to bearer stock certificates, TOTAL share certificates cannot be categorized as secondary securities, such as ADSs, issued by a foreign company to represent TOTAL shares. TOTAL share certificates have the characteristics of a bearer security, meaning they are: negotiable outside France; transmitted by delivery; and | | • | negotiable outside France; | • | transmitted by delivery; and | • | fungible with TOTAL share certificates, which may be converted freely from bearer form to registration in an account. |
fungible with TOTAL share certificates, which may be converted freely from bearer form to registration in an account. All rights attached to TOTAL shares must be exercised directly by the bearer of the TOTAL share certificates.
130
Share capital historyShare Capital History
| | | | | Fiscal 2009 | | | Fiscal 2008
| | July 30, 2009 | | | April 25, 2008 | | Certification of the subscription to 4,870,386 new shares, par value €2.50, as part of the capital increase reserved for Group employees approved by the Board of Directors on November 6, 2007, raising the share capital by €12,175,965, from €5,988,830,242.50 to €6,001,006,207.50. | July 31, 2008 | | Reduction of the share capital from €6,001,006,207.50€5,929,520,185 to €5,926,006,207.50,€5,867,520,185, through the cancelation of 30,000,000 treasury shares, par value €2.50. | January 13, 2009 | | Certification of the issuance of 1,405,591 new shares, par value €2.50 per share, between January 1 and December 31, 2008, raising the share capital by €3,513,977.50 from €5,926,006,207.50 to €5,929,520,185 (of which 1,178,167 new shares issued through the exercise of the Company’s stock options and 227,424 new shares through the exchange of 37,904 shares of Elf Aquitaine stock resulting from the exercise of Elf Aquitaine stock options and eligible for a guaranteed exchange for TOTAL shares). | Fiscal 2009
| | | July 30, 2009 | | Reduction of the share capital from €5,929,520,185 to €5,867,520,185, through the cancelationcancellation of 24,800,000 treasury shares, par value €2.50.€2.50. | | | January 12,1, 2010 | | Certification of the issuance of 1,414,810 new shares, par value €2.50€2.50 per share, between January 1 and December 31, 2009, raising the share capital by €3,537,025€3,537,025 from €5,867,520,185€5,867,520,185 to €5,871,057,210€5,871,057,210 (of which 934,780 new shares issued through the exercise of the Company’s stock options and 480,030 new shares through the exchange of 80,005 shares of Elf Aquitaine stock resulting from the exercise of Elf Aquitaine stock options and eligible for a guaranteed exchange for TOTAL shares). | | | Fiscal 2010 | | | | | January 12, 2011 | | Certification of the issuance of 1,218,047 new shares, par value €2.50,€2.50, through the exercise of the Company’s stock options between January 1 and December 31, 2010, raising the share capital by €3,045,117.50€3,045,117.50 from €5,871,057,210€5,871,057,210 to €5,874,102,327.50.€5,874,102,327.50. | | | Fiscal 2011 | | | | | April 28, 2011 | | Certification of the subscription to 8,902,717 new shares, par value€2.50, as part of the capital increase reserved for Group employees approved by the Board of Directors on October 28, 2010, raising the share capital by€22,256,792.50, from€5,874,102,327.50 to€5,896,359,120. | | | January 12, 2012 | | Certification of the issuance of 5,223,665 new shares, par value€2.50, through the exercise of the Company’s stock options between January 1 and December 31, 2011, raising the share capital by€13,059,162.50 from€5,896,359,120 to€5,909,418,282.50. |
Authorized share capital not issued as of December 31, 2011 The following is a summary of the currently valid delegations and authorizations to increase share capital that have been granted by the Shareholders’ Meeting to the Board of Directors. Seventeenth resolution of the Shareholders’ Meeting held on May 21, 2010 Delegation of authority granted by the Shareholders’ Meeting to the Board of Directors to increase the share capital by issuing common shares or other securities granting immediate or future rights to the Company’s share capital, maintaining shareholders’ pre-emptive subscription rights up to a maximum nominal amount of€2.5 billion,i.e., 1 billion shares (delegation of authority valid for twenty-six months). Furthermore, the maximum nominal amount of the debt securities granting rights to the Company’s share capital that may be issued pursuant to the seventeenth resolution and the eighteenth resolution (mentioned below) may not exceed€10 billion, or their exchange value, on the date of issuance. Eighteenth resolution of the Shareholders’ Meeting held on May 21, 2010 Delegation of authority granted by the Shareholders’ Meeting to the Board of Directors to increase the share capital by issuing common shares or other securities granting immediate or future rights to the Company’s share capital, canceling shareholders’ pre-emptive subscription rights, including the compensation comprised of securities as part of a public exchange offer, provided that they meet the requirements of Article L. 225-148 of the French Commercial Code. This resolution grants the Board of Directors the authority to grant a priority period for shareholders to subscribe to these securities pursuant to the provisions of Article L. 225-135 of the French Commercial Code. The total amount of the capital increases without pre-emptive subscription rights likely to occur immediately or in the future cannot exceed the nominal amount of€850 million,i.e., 340 million shares, par value€2.50 (delegation of authority valid for twenty-six months). The nominal amount of the capital increases is counted against the maximum aggregate nominal amount of€2.5 billion authorized by the seventeenth resolution of the Shareholders’ Meeting held on May 21, 2010. Furthermore, the maximum nominal amount of the debt securities granting rights to the Company’s share capital that may be issued pursuant to the above mentioned seventeenth and eighteenth resolutions may not exceed€10 billion, or their exchange value, on the date of issuance. Nineteenth resolution of the Shareholders’ Meeting held on May 21, 2010 Other IssuesDelegation of power granted by the Shareholders’ Meeting to the Board of Directors to increase the share capital by issuing new ordinary shares or other securities granting immediate or future rights to the Company’s share capital as compensation of in-kind contribution granted to the Company, by an amount not exceeding 10% of the share capital outstanding at the date of the Shareholders’ Meeting on May 21, 2010 (delegation of authority valid for twenty-six months). The nominal amount of the capital increases is counted against the maximum aggregate nominal amount of€850 million authorized by the eighteenth resolution of the Shareholders’ Meeting held on May 21, 2010.
Twentieth resolution of the Shareholders’ Meeting held on May 21, 2010 Delegation of authority to the Board of Directors to complete capital increases reserved for employees participating in the Company Savings Plan (Plan d’épargne d’entreprise), up to a maximum amount equal to 1.5% of the outstanding share capital on the date of the decision of the Board of Directors to proceed with the issue (delegation of authority valid for twenty-six months). It is being specified that the amount of the capital increase is counted against the maximum aggregate nominal amount of€2.5 billion authorized by the seventeenth resolution of the Shareholders’ Meeting held on May 21, 2010. Given that the Board of Directors made use of this delegation of authority on October 28, 2010, under which 8,902,717 new TOTAL shares were issued in 2011, the authorized share capital not issued with respect to capital increases reserved for employees participating in a Company Savings Plan was€66,384,480 as of December 31, 2011, representing 26,553,792 shares. As a result of the use of the delegation authorizing capital increases reserved for employees decided by the Board on October 28, 2010, and given that the Board of Directors did not make use of the delegations of authority granted by the seventeenth, eighteenth and nineteenth resolutions of the Shareholders’ Meeting held on May 21, 2010, the authorized capital not issued was€2.48 billion as of December 31, 2011, representing 991 million shares. Eleventh resolution of the Shareholders’ Meeting held on May 13, 2011 Authority to grant restricted outstanding or new TOTAL shares to employees of the Group and to executive officers up to a maximum of 0.8% of the share capital outstanding on the date of the meeting of the Board of Directors that approves the restricted share grants. In addition, the shares granted to the Company’s executive officers cannot exceed 0.01% of the outstanding share capital on the date of the meeting of the Board of Directors that approves the grants (authorization valid for thirty-eight months). Pursuant to this authorization: 3,700,000 outstanding shares were awarded by the Board of Directors on September 14, 2011, including 16,000 outstanding shares awarded to the Chairman and Chief Executive. As of December 31, 2011, 15,210,138 shares, including 220,376 to the Company’s corporate executive officers could, therefore, still be awarded pursuant to this authorization. Twenty-first resolution of the Shareholders’ Meeting held on May 21, 2010 Authority to grant stock options reserved for TOTAL employees and to executive and officers up to a maximum of 1.5% of the share capital outstanding on the date of the meeting of the Board of Directors that approves the stock option grant. In addition, the options granted to the Company’s corporate executive officers cannot exceed 0.1% of the outstanding share capital on the date of the meeting of the Board of Directors that approves the grants (authorization valid for thirty-eight months). Pursuant to this authorization: 4,925,000 stock options were awarded by the Board of Directors at its meeting on September 14, 2010, including 240,000 stock options to the Chairman and Chief Executive Officer; 1,600,000 stock options were awarded by the Board of Directors at its meeting on September 14, 2011, including 160,000 stock options to the Chairman and Chief Executive Officer. As of December 31, 2011, 28,931,509 stock options, including 1,963,767 to the Company’s corporate executive officers, could still be awarded pursuant to this authorization. Seventeenth resolution of the Shareholders’ Meeting held on May 11, 2007 Authority to cancel shares up to a maximum of 10% of the share capital of the Company existing as of the date of the operation within a twenty-four-month period. This authorization is effective until the Shareholders’ Meeting called to approve the financial statements for the year ending December 31, 2011. The Board did not make use of this delegation of authority during fiscal year 2011. Based on 2,363,767,313 shares outstanding on December 31, 2011, the Company may, up until the conclusion of the Shareholders’ Meeting called to approve the financial statements for the fiscal year ending on December 31, 2011, cancel a maximum of 236,376,731 shares before reaching the cancellation threshold of 10% of share capital canceled during a twenty-four-month period. Other issues Shareholders’ meetings French companies may hold either ordinary or extraordinary shareholders’ meetings. Ordinary shareholders’ meetings are required for matters that are not specifically reserved by law to extraordinary shareholders’ meetings: the election of the members of the Board of Directors, the appointment of statutory auditors, the approval of a management report prepared by the Board of Directors, the approval of the annual financial statements, the declaration of dividends and the issuance of bonds.bonds (if the bylaws so provide). Extraordinary shareholders’ meetings are required for approval of amendments to a company’s bylaws, modification of shareholders’ rights, mergers, increases or decreases in share capital, including a waiver of preferential subscription rights, the creation of a new class of shares, the authorization of the issuance of investment certificates or securities convertible, exchangeable or redeemable into shares and for the sale or transfer of substantially all of a company’s assets. The Company’s Board of Directors is required to convene an annual shareholders’ meeting for approval of the annual financial statements. This meeting must be held within six months of the end of the fiscal year. However, the president of theTribunal de Commerceof Nanterre, the local French commercial court, may grant an extension of this six-month period. The Company may convene other ordinary and extraordinary meetings at any time during the year. Meetings of shareholders may be convened by the Board of Directors or, if it fails to call a meeting, by the Company’s statutory auditors or by a court-appointed agent. A shareholder or group of shareholders holding at least 5% of the share capital, the employee committee or another interested party under certain exceptional circumstances, may request that the court appoint an agent. The notice of meeting must state the agenda for the meeting. French Company Law requires that a preliminary notice of a listed company’s shareholders’ meeting be published in theBulletin des annonces légales obligatoires(“BALO”) at least thirty-five days prior to the meeting (or fifteen days in the event the Company is subject to a tender offer and the Company calls a shareholders’ meeting to approve measures, the implementation of which would be likely to cause such tender offer to fail). The preliminary notice must first be sent to the French Financial Markets Authority (Autorité des marchés financiers) (“AMF”) with an indication of the date it is to be published in the BALO. The preliminary notice must include the agenda of the meeting and the proposed resolutions that will be submitted to a shareholders’ vote. One or more shareholders holding a certain percentage of the Company’s share capital determined on the basis of a formula related to capitalization may propose to add on the shareholders’ meeting’s agenda additional resolutions to be submitted to a shareholders’ voteand/or matters without a shareholders’ vote (points), provided that the text of additional resolutions or matters be received by the Company on at least the twenty-fifth day preceding the meeting (or at least the tenth day in the event the
131
Company is subject to a tender offer and the Company calls a shareholders’ meeting to approve measures which,that, if implemented, would likely cause such tender offer to fail). The demand of the shareholders’ that are eligible to require for the inscription of matters on the meeting agenda has to be duly motivated. French Company Law also requires that the preliminary notice of a listed company’s shareholders’ meeting, as well as the additional resolutionsand/or matters presented by the shareholders under the terms and conditions prescribed under French law, be published on the Company’s Web site during a period starting at the latest on the twenty-first day prior to the meeting (or the fifteenth day in the event the Company is subject to a tender offer and the Company calls a shareholders’ meeting to approve measures which,that, if implemented, would likely cause such tender offer to fail). Notice of a shareholders’ meeting is sent by postal or electronic mail at least fifteen days (or six days in the event of shareholders’ meetings convened in the situation where the Company was subject to a tender offer to approve measures, the implementation of which would be likely to cause such tender offer to fail) before the meeting to all holders of registered shares who have held their shares for more than one month. However, in the case where the original meeting was adjourned because a quorum was not met, this time period is reduced to ten days (or four days in the event of shareholders’ meetings convened in the situation where the Company were subject to a tender offer to approve measures, the implementation of which would be likely to cause such tender offer to fail). Attendance and the exercise of voting rights at both ordinary and extraordinary shareholders’ meetings are subject to certain conditions. Pursuant to French Company Law, participation at shareholders’ meetings is subject to the condition that an entry of registration has been made, for the owner of registered shares, in the records maintained by the Company, or, for the owner of bearer shares, in the records of an authorized intermediary, in each case at 12:00 a.m. (Paris time) on the third trading day preceding the shareholders’ meeting. For the owner of bearer shares, the registration is evidenced by a certificate of participation (attestation de participation) issued by the authorized intermediary. Subject to the above restrictions, all of the Company’s shareholders have the right to participate in the Company’s shareholders’ meetings, either in person or by proxy. Each shareholder may delegate voting authority to another shareholder, the shareholder’s spouse, or the companion with whom the shareholder has registered a civil partnership (PACS). Every shareholder may also delegate voting authority to any other individual or legal entity he or she may choose, provided, among other things, that a written proxy be provided to the Company. Shareholders may vote, either in person, by proxy, or by postal or electronic mail, and each is entitled to as many votes as he or she possesses or as many shares as he or she holds proxies for, subject to the voting rights limitations provided by the Company’s bylaws. If the shareholder is a legal entity, it may be represented by a legal representative. A shareholder may grant a proxy to the Company by returning a blank proxy form. In this last case, the chairman of the shareholders’ meeting may vote the shares in favor of all resolutions proposed or agreed to by the Board of Directors and against all others. The Company will send proxy forms to shareholders upon request. In order to be counted, proxies must be received at least one daythree days prior to the shareholders’ meeting at the Company’s registered office or at another address indicated in the notice convening the meeting.meeting, or by 3:00 p.m. on the day prior to the shareholders’ meeting for electronic proxy forms. Under French Company Law, shares held by the Company or by entities controlled directly or indirectly by the Company are not entitled to voting rights. There is no requirement that a shareholder have a minimum number of shares in order to be able to attend or be represented at shareholders’ meetings. Under French Company Law, a quorum requires the presence, in person or by proxy, including those voting by mail, of shareholders having at least 20% of the shares entitled to vote in the case of (i) an ordinary shareholders’ meeting, (ii) an extraordinary meeting where shareholders are voting on a capital increase by capitalization of reserves, profits or share premium, or (iii) an extraordinary general meeting of shareholders convened in the situation where the Company is subject to a tender offer in order to approve an issuance of warrants allowing the subscription, at preferential conditions, of shares of the Company and the free allotment of such warrants to existing shareholders of the Company, the implementation of which would be likely to cause such tender offer to fail, or 25% of the shares entitled to vote in the case of any other extraordinary shareholders’ meeting. If a quorum is not present at any meeting, the meeting is adjourned. There is no quorum requirement when an ordinary shareholders’ meeting is reconvened, but the reconvened meeting may consider only questions whichthat were on the agenda of the adjourned meeting. When an extraordinary shareholders’ meeting is reconvened, the quorum required is 20% of the shares entitled to vote, except where the reconvened meeting is considering capital increases through capitalization of reserves, profits or share premium.premium or an issuance of warrants allowing the subscription, at preferential conditions, of shares of the Company and the free allotment of such warrants to existing shareholders of the Company, the implementation of which would be likely to cause such tender offer to fail. For these matters, no quorum is required at the reconvened meeting. If a quorum is not present at a reconvened meeting requiring a quorum, then the
132
meeting may be adjourned for a maximum of two months. At an ordinary shareholders’ meeting, approval of any resolution requires the affirmative vote of a simple majority of the votes of the shareholders present or represented by proxy. The approval of any resolution at an extraordinary shareholders’ meeting requires the affirmative vote of a two-thirds majority of the votes cast, except that (i) any resolution to approve a capital increase by capitalization of reserves profits, or share premium, or (ii) any resolution, in the situation where the Company is subject to a tender offer in order to approve an issuance of warrants allowing the subscription, at preferential conditions, of shares of the Company and the free allotment of such warrants to existing shareholders of the Company, the implementation of which would be likely to cause such tender offer to fail, only requires the affirmative vote of a simple majority of the votes cast. Notwithstanding these rules, a unanimous vote is required to increase shareholders’ liabilities. Abstention from voting by those present or represented by proxy is counted as a vote against any resolution submitted to a vote. As set forth in the Company’s bylaws, shareholders’ meetings are held at the Company’s registered office or at any other location specified in the written notice. Requirements for temporary transfer of securities French Company Law provides that any legal entity or individual (with the exception of those described inparagraph IV- 3°of Article L.233-7 of the French Commercial Code) holding alone or in concert a number of shares representing more than 0.5% of the Company’s voting rights as a result of one or several temporary stock transfers or assimilated transactions within the meaning of Article L.225-126 of the French Commercial Code is required to inform the Company and the AMF of the number of the shares that are temporarily possessed no later than the third business day preceding the shareholders’ meeting at midnight. If such declaration is not made, the shares bought under any of the above described temporary stock transfers or assimilated transactions shall be deprived of their voting rights at the relevant shareholders’ meeting and at any shareholders’ meeting that would be held until such shares are transferred again or returned. Ownership of shares by non-French persons There is no limitation on the right of non-resident or foreign shareholders to own securities of the Company, either under French Company Law or under the bylaws of the Company. Requirement for holdings exceeding certain percentages French Company Law provides that any individual or entity, acting alone or in concert with others, that holds, directly or indirectly, more than 5%, 10%, 15%, 20%, 25%, 30%, 331/1/3,%, 50%, 662/2/3,%, 90% or 95% of the outstanding shares or of the voting rights(1) attached to the shares, or that increases or decreases its shareholding or voting rights by any of the above percentages must notify the Company by registered letter, with return receipt, within four business days of crossing that threshold,any of the above-mentioned thresholds, of the number of shares and voting rights it holds. An individual or entity must also notify the AMF, the self-regulatoryself- regulatory organization that has general regulatory authority over the French stock exchanges and whose members include representatives of French stockbrokers, by registered letter, with return receipt, within four trading days of crossing that threshold.any of the above-mentioned thresholds. In addition, every shareholder who, directly or indirectly, acting alone or in concert with others, acquires ownership or control of shares representing 10%, 15%, 20% or 25% of the Company’s share capital must notify the Company and the AMF of its intentions for the six months following such an acquisition. Any shareholder who fails to comply with thesethe above requirements (thresholds and intentions notifications) will have its voting rights in excess of such thresholds suspended for a period of two years from the date such shareholder complies with the notification requirements and may have all or part of its voting rights suspended for up to five years by the commercial court at the request of the Company’s Chairman, any of the Company’s shareholders or the AMF. In addition, every shareholder who, directly or indirectly, acting alone or in concert with others, acquires ownership or control of shares representing 10%, 15%, 20% or 25% of the Company’s share capital must notify the Company and the AMF of its intentions for the six months following such an acquisition. Failure to comply with this notification of intentions will result in the suspension of the voting rights attached to the shares exceeding the applicable threshold held by the shareholder for a period of two years from the date on which the shareholder has cured such default and, upon a decision of the commercial court part or all the shares held by such shareholder may be suspended for up to five years. In addition, the Company’s bylaws provide that any person, whether a natural person or a legal entity, who comes to hold, directly or indirectly, 1% or more, or any multiple of 1%, of the Company’s share capital or voting rights or of securities that may include future voting rights (1) For purposes of shareholding threshold declarations, pursuant toArticle 223-11 of the General Regulation of the AMF, voting rights are calculated on the basis of all outstanding shares, whether or not these shares would have rights to vote at a shareholders’ meeting.
133
or futuregive access to the Company’s share capital or voting rights, must notify the Company by registered letter with return receipt requested, within 15fifteen calendar days of crossing any such threshold. Failure to comply with these notification provisions will result in the suspension of the voting rights attached to the shares exceeding this 1% threshold held by the shareholder if acknowledged at a shareholders’ meeting and if requested at asuch shareholders’ meeting by one or more shareholders together holding shares representing at least 3% of the share capital.
capital or voting rights.Any individual or legal entity whose direct or indirect holding of shares falls below each of the levels mentioned must also notify the Company in the manner and within the time limits set forth above. Subject to certain limited exemptions, any person, or persons acting in concert, owning in excess of 331/1/3% of the share capital or voting rights of the Company must initiate a public tender offer for the balance of the share capital, voting rights and securities giving access to such share capital or voting rights. There have been no material contracts (not entered into in the ordinary course of business) entered into by members of the Group since March 25, 2009.23, 2010. | (1) | For purposes of shareholding threshold declarations, pursuant to Article 223-11 of the General Regulation of the AMF, voting rights are calculated on the basis of all outstanding shares, whether or not these shares would have rights to vote at a shareholders’ meeting. |
Under current French exchange control regulations, no limits exist on the amount of payments that TOTAL may remit to residents of the United States. Laws and regulations concerning foreign exchange controls do require, however, that an accredited intermediary must handle all payments or transfer of funds made by a French resident to a non-resident. This section generally summarizes the material U.S. federal income tax and French tax consequences of owning and disposing of shares and ADSs of TOTAL to U.S. Holders that hold their shares or ADSs as capital assets for tax purposes. A U.S. Holder is a beneficial owner of shares or ADSs that is (i) a citizen or resident of the United States for U.S. federal income tax purposes, (ii) a domestic corporation or other domestic entity treated as a corporation for U.S. federal income tax purposes, (iii) an estate whose income is subject to U.S. federal income tax regardless of its source, or (iv) a trust if a U.S. court can exercise primary supervision over the trust’s administration and one or more U.S. persons are authorized to control all substantial decisions of the trust. This section does not apply to members of special classes of holders subject to special rules, including: | | • | dealers in securities; | • | traders in securities that elect to use amark-to-market method of accounting for their securities holdings; | • | tax-exempt organizations; | • | life insurance companies; | • | persons liable for alternative minimum tax; | • | persons that actually or constructively own 10% or more of the share capital or voting rights in TOTAL; | • | persons that hold the shares or ADSs as part of a straddle or a hedging or conversion transaction; or | • | persons whose functional currency is not the U.S. dollar. |
traders in securities that elect to use a mark-to-market method of accounting for their securities holdings; tax-exempt organizations; life insurance companies; persons liable for alternative minimum tax; persons that actually or constructively own 10% or more of the share capital or voting rights in TOTAL; persons that purchase or sell shares or ADSs as part of a wash sale for U.S. federal income tax purposes; persons that hold the shares or ADSs as part of a straddle or a hedging or conversion transaction; or persons whose functional currency is not the U.S. dollar. If a partnership holds ordinary shares or ADSs, the tax treatment of a partner will generally depend upon the status of the partner and upon the activities of the partnership. Partners of a partnership holding these ordinary shares or ADSs should consult their tax advisors as to the tax consequences of owning or disposing of ordinary shares or ADSs, as applicable. In addition, the discussion of the material French tax consequences is limited to U.S. Holders that (i) are residents of the United States for purposes of the Treaty (as defined below), (ii) do not maintain a permanent establishment or fixed base in France to which the shares or ADSs are attributable and through which the respective U.S. Holders carry on, or have carried on, a business (or, if the holder is an individual, performs or has performed independent personal services), and (iii) are otherwise eligible for the benefits of the Treaty in respect of income and gain from the shares or ADSs. In addition, this section is based in part upon the representations of the Depositary and the assumption that each obligation in the Deposit Agreement and any related agreement will be performed in accordance with its terms. This section is based on the Internal Revenue Code of 1986, as amended, its legislative history, existing and proposed regulations, published rulings and court decisions, and with respect to the description of the material French tax consequences, the laws of the Republic of France and French tax regulations, all as currently in effect, as well as on the Convention Between the United States and the Republic of France for the Avoidance of Double Taxation and the Prevention of Fiscal Evasion with respect to Taxes on Income and Capital dated August 31, 1994 as amended (the “Treaty”). These laws, regulations and the Treaty are subject to change, possibly on a retroactive basis.
134
This discussion is intended only as a descriptive summary and does not purport to be a complete analysis or listing of all potential tax effects of the ownership or disposition of the shares and ADSs and is not intended to substitute competent professional advice. Individual situations of holders of shares and ADSs may vary from the description made below. The following summary does not address the French tax treatment applicable to dividends transferred to so calledso-called “Non Cooperative Countries and Territories” within the meaning of the newSection 238-0 A of the French Tax Code. Holders are urged to consult their own tax advisors regarding the U.S. federal, state and local, and French and other tax consequences of owning and disposing shares or ADSs of TOTAL in their respective circumstances. In particular, a holder is encouraged to confirm with its advisor whether the holder is a U.S. Holder eligible for the benefits of the Treaty with its advisor.Treaty. Taxation of Dividendsdividends The term “dividends” used in the following discussion means dividends within the meaning of applicable income tax treaties, or, where not defined by such treaties, within the meaning of the French domestic tax law as set forth in administrative guidelines dated February 25, 2005(4 (4 J-1-05) (the “Administrative Guidelines”). Dividends paid to non-residents of France are subject to French withholding tax at a rate of 25%30%. This withholding tax is reduced to 19%21% with respect to dividends received as from January 1, 2011,2012 by non-residents of France who are residents of certain States located within the European Economic Area. However, the rate may be reduced pursuant to a tax treaty or similar agreement. Under the Treaty, a U.S. Holder is generally entitled to a reduced rate of French withholding tax of 15% with respect to dividends, provided the ownership of shares or ADSs is not effectively attributable to a permanent establishment or to a fixed base in France and certain other requirements are satisfied. U.S. Holders should consult their own tax advisors in order to determine the effect of the Treaty and the applicable procedures in respect of the Administrative Guidelines, in light of such particular circumstances. The Administrative Guidelines set forth the conditions under which the reduced French withholding tax at the rate of 15% may be available. The immediate application of the reduced 15% rate is available to those U.S. Holders that may benefit from the so-called “simplified procedure” (within the meaning of the Administrative Guidelines). Under the “simplified procedure”, U.S. Holders may claim the immediate application of withholding tax at the rate of 15% on the dividends to be received by them, provided that: | | | (i) | they furnish to the U.S. financial institution managing their securities account a certificate of residence conforming with the model attached to the Administrative Guidelines. The immediate application of the 15% withholding tax will be available only if the certificate of residence is sent to the U.S. financial institution managing their securities account before the dividend payment date. Furthermore, each financial institution managing the U.S. Holders’ securities account must also send to the French paying agent the figure of the total amount of dividends to be received which are eligible to the reduced withholding tax rate before the dividend payment date; |
| | | (ii) | the U.S. financial institution managing the U.S. Holder’s securities account provides to the French paying agent a list of the eligible U.S. Holders and other pieces of information set forth in the Administrative Guidelines. Furthermore, the financial institution managing the U.S. Holders’ securities account should certify that each U.S. Holder is, to the best of its knowledge, a United States resident within the meaning of the Treaty. These documents must be sent as soon as possible, in all cases before the end of the third month computed as from the end of the month of the dividend payment date. |
Where the U.S. Holder’s identity and tax residence are known by the French paying agent, the latter may release such U.S. Holder from furnishing to (i) the financial institution managing its securities account, or (ii) as the case may be, the Internal Revenue Service, the abovementioned certificate of residence, and apply the 15% withholding tax rate to dividends it pays to such U.S. Holder. U.S. Pension Funds and Other Tax-Exempt Entities created and operating in accordance with the provisions of Sections 401 (a)401(a), 403 (b)403(b), 457 or 501 (c) 501(c)(3) of the U.S. Internal Revenue Code (IRC) are subject to the same general filing requirements except that, in addition, they have to supply a certificate issued by the U.S. Internal Revenue Service (“IRS”) or any other document stating that they have been created and are operating in accordance with the provisions of the abovementionedabove-mentioned Code Sections. This certificate must be produced
135
together with the first request of application of the reduced rate, once together with the first request of immediate application of the 15% withholding tax and at French Tax AuthoritiesAuthorities’s specific request. In the same way, regulated companies such as RIC, REIT or REMIC will have to send to the financial institution managing their securities account a certificate from the IRS indicating that they are classified as Regulated Companies (RIC, REIT or REMIC) within the provisions of the relevant sections of the IRC. In principle, this certification must be produced each year and before the dividend payment. For a U.S. Holder that is not entitled to the “simplified” procedure and whose identity and tax residence are not known by the paying agent at the time of the payment, the 25%30% French withholding tax will be levied at the time the dividends are paid. Such U.S. Holder, however, may however, be entitled to a refund of the withholding tax in excess of the 15% rate under the “standard”, as opposed to the “simplified”, procedure, provided that the U.S. Holder furnishes to the French paying agent an application for refund onforms No. 5000-FRand/5000-FR and/or 5001-FR (or any other relevant form to be issued by the French tax authorities), certified by the U.S. financial institution managing the U.S. Holder’s securities account (or, if not, by the competent U.S. tax authorities), before December 31 of the second year following the date of payment of the withholding tax at the 25%30% rate to the French tax authorities, according to the requirements provided by the Administrative Guidelines. Copies offorms No. 5000-FR and 5001-FR (or any other relevant form to be issued by the French tax authorities) as well as the form of the certificate of residence and the U.S. financial institution certification, together with instructions, are available from the U.S. Internal Revenue Service and the FrenchCentre des Impôts des Non-Residentsat 10, rue du Centre, 93463 Noisy le Grand, France. These forms, together with instructions, will also be provided by the Depositary to all U.S. Holders of ADRs registered with the Depositary. The Depositary will use reasonable efforts to follow the procedures established by the French tax authorities for U.S. Holders to benefit from the immediate application of the 15% French withholding tax rate or, as the case may be, to recover the excess 10%15% French withholding tax initially withheld and deducted in respect of dividends distributed to them by TOTAL. To effect such benefit or recovery, the Depositary shall advise such U.S. Holder to return the relevant forms to it, properly completed and executed. Upon receipt of the relevant forms properly completed and executed by such U.S. Holder, the Depositary shall cause them to be filed with the appropriate French tax authorities, and upon receipt of any resulting remittance, the Depositary shall distribute to the U.S. Holder entitled thereto, as soon as practicable, the proceeds thereof in U.S. dollars. The identity and address of the French paying agent are available from TOTAL. For U.S. federal income tax purposes and subject to the passive foreign investment company rules discussed below, the gross amount of any dividend a U.S. Holder must include in gross income equals the amount paid by TOTAL to the extent of the current and accumulated earnings and profits of TOTAL (as determined for U.S. federal income tax purposes). The dividend will be income from foreign sources. Dividends paid to a noncorporatenon-corporate U.S. Holder in taxable years beginning before January 1, 2013, that constitute qualified dividend income will be taxable to the holder at a maximum tax rate of 15%, provided that the shares or ADSs are held for more than 60sixty days during the121-day period beginning 60sixty days before the ex-dividend date and the holder meets other holding period requirements. TOTAL believes that dividends paid by TOTAL with respect to its shares or ADSs will be qualified dividend income. The dividend will not be eligible for the dividends-received deduction allowed to a U.S. corporation under Section 243 of the Code. The dividend is taxable to the U.S. Holder when the holder, in the case of shares, or the Depositary, in the case of ADSs, receives the dividend, actually or constructively. To the extent that an amount received by a U.S. Holder exceeds the allocable share of TOTAL’s current and accumulated earnings and profits, it will be applied first to reduce such holder’s tax basis in shares or ADSs owned by such holder and then, to the extent it exceeds the holder’s tax basis, it will constitute capital gain. The amount of any dividend distribution includible in the income of a U.S. Holder equals the U.S. dollar value of the euro payment made, determined at the spot euro/dollar exchange rate on the date the dividend distribution is includible in the U.S. Holder’s income, regardless of whether the payment is in fact converted into U.S. dollars. Any gain or loss resulting from currency exchange fluctuations during the period from the date the dividend payment is includible in the U.S. Holder’s income to the date the payment is converted into U.S. dollars will generally be treated as ordinary income or loss from sources within the United States and will not be eligible
136
for the special tax rate applicable to qualified dividend income. Subject to certain conditions and limitations, French taxes withheld in accordance with the Treaty will generally be eligible for credit against the U.S. Holder’s U.S. federal income tax liability. The limitation on foreign taxes eligible for credit is calculated separately with respect to specific classes of income. In addition, special rules apply in determining the foreign tax credit limitation with respect to dividends that are subject to the maximum 15% tax rate. To the extent a refund of the tax withheld is available to a U.S. Holder under French law or under the Treaty, the amount of tax withheld that is refundable will not be eligible for credit against such an individual’s United States federal income tax liability. For this purpose, dividends distributed by TOTAL will constitute “passive income”, or, in the case of certain U.S. Holders, “general income”, which are treated separately from one another for purposes of computing the foreign tax credit allowable to the U.S. Holder. Alternatively, a U.S. Holder may claim all foreign taxes paid as an itemized deduction in lieu of claiming a foreign tax credit. Taxation of Dispositiondisposition of Sharesshares In general, a U.S. Holder who is eligible for the benefits of the Treaty will not be subject to French tax on any capital gain from the sale or exchange of the ADSs or redemption of the underlying shares unless those ADSs or shares form part of a business property of a permanent establishment or fixed base that the U.S. Holder has in France. Special rules may apply to individuals who are residents of more than one country. A 3% registration dutytransfer tax assessed on the higher of the purchase price and the fair market value of the shares (subject to a maximum of €5,000 per transfer) applies to certain transfers of shares in French companies. Such transfer tax is equal to: 3% for the portion of the purchase price (or the fair market value, if higher) below€200,000; 0.5% for the portion of the purchase price (or the fair market value, if higher) between€200,000 and€500 million; 0.25% for the portion of the purchase price (or the fair market value, if higher) above€500 million. The dutytransfer tax does not apply to transfers of shares in TOTAL, provided that the transfer is not evidenced by a written agreement, oragreement. Recently enacted legislation applicable as from August 1, 2012, has introduced, under certain conditions, a financial transaction tax on the acquisition of shares of publicly traded companies registered in France having a market capitalization over€1 billion. A list of the companies within the scope of the financial transaction tax will be published in a forthcoming decree. We expect that TOTAL will be included in this list. The financial transaction tax will be due at a rate of 0.1% on the value of the acquired shares. Transactions that are subject to the financial transaction tax are exempt from the above-mentioned transfer tax (which was also modified by the same legislation). U.S. Holders should consult their tax advisors as to the tax consequences of such written agreement is executed outside France. reforms.For U.S. federal income tax purposes and subject to the passive foreign investment company rules discussed below, a U.S. Holder generally will recognize capital gain or loss upon the sale or disposition of shares or ADSs equal to the difference between the U.S. dollar value of the amount realized on the sale or disposition and the holder’s tax basis, determined in U.S. dollars, in the shares or ADSs. The gain or loss generally will be U.S. source gain or loss and will be long-term capital gain or loss if the U.S. Holder’s holding period of the shares or ADSs is more than one year at the time of the disposition. Long-term capital gain of a non-corporate U.S. Holder is generally taxed at preferential rates. The deductibility of capital losses is subject to limitation. Passive Foreign Investment Statusforeign investment status TOTAL believes that the shares or ADSs will not be treated as stock of a passive foreign investment company, or PFIC, for United States federal income tax purposes, but this conclusion is a factual determination that is made annually and thus is subject to change. If TOTAL is treated as a PFIC, unless a U.S. Holder elects to be taxed annually on amark-to-market basis with respect to the shares or ADSs, gain realized on the sale or other disposition of the shares or ADSs would in general not be treated as capital gain. Instead, a U.S. Holder would be treated as if he or she had realized such gain and certain “excess distributions” ratably over the holding period for the shares or ADSs and would be taxed at the highest tax rate in effect for each such year to which the gain was allocated, in addition to which an interest charge in respect of the tax attributable to each such year would apply. With certain exceptions, a U.S. Holder’s shares or ADSs will be treated as stock in a PFIC if TOTAL were a PFIC at any time during his or her holding period in the shares or ADSs. Dividends paid will not be eligible for the special tax rates applicable to qualified dividend income if TOTAL is treated as a PFIC with respect to a U.S. Holder either in the taxable year of the distribution or the preceding taxable year, but instead will be taxable at rates applicable to ordinary income. French Estateestate and Gift Taxesgift taxes In general, a transfer of ADSs or shares by gift or by reason of the death of a U.S. Holder that would otherwise be subject to French gift or inheritance tax, respectively, will not be subject to such French tax by reason of the Convention between the United States of America and the French Republic for the Avoidance of Double Taxation and the Prevention of Fiscal Evasion with Respect to Taxes on Estates, Inheritances and Gifts, dated November 24, 1978 as amended, unless the donor or the transferor is domiciled in France at the time of making the gift, or at the time of his death, or if the ADSs or shares were used in, or held for use in, the conduct of a business through a permanent establishment or a fixed base in France. French Wealth Taxwealth tax The French wealth tax does not apply to a U.S. Holder (i) that is not an individual, or (ii) in the case of individuals
137
who are eligible for the benefits of the Treaty and who own, alone or with related persons, directly or indirectly, TOTAL shares which give right to less than 25% of TOTAL’s earnings. U.S. Statestate and Local Taxeslocal taxes In addition to U.S. federal income tax, U.S. Holders of shares or ADSs may be subject to U.S. state and local taxes with respect to their shares or ADSs. U.S. Holders should consult their own tax advisors. Dividends and Paying Agents After BNP Paribas Securities Services performs centralizing procedures, dividends are paid through the accounts of financial intermediaries participating in Euroclear France’s direct payment procedures. The Bank of New York Mellon acts as paying agent for dividends distributed to ADS holders. TOTAL files annual, periodic, and other reports and information with the Securities and Exchange Commission. You may read and copyinspect any reports, statements or other information TOTAL files with the United States Securities and Exchange Commission (“SEC”) at the SEC’s public reference rooms by calling the SEC for more information at1-800-SEC-0330. All of TOTAL’s SEC filings made after December 31, 2001, are available to the public at the SEC Web site athttp://www.sec.gov and from certain commercial document retrieval services. You may also read and copyinspect any document the Company files with the SEC at the offices of The New York Stock Exchange, 20 Broad Street, New York, New York 10005. ITEM 11. QUANTITATIVE AND QUALITATIVE DISCLOSURES ABOUT MARKET RISK
Please refer to Note 31 to the Consolidated Financial Statements included elsewhere herein for a qualitative and quantitative discussion of the Group’s exposure to market risks. Please also refer to Notes 29 and 30 to the Consolidated Financial Statements included elsewhere herein for details of the different derivatives owned by the Group in these markets. As part of its financing and cash management activities, the Group uses derivative instruments to manage its exposure to changes in interest rates and foreign exchange rates. These instruments are principally interest rate and currency swaps. The Group may also use, on a less frequent basis, futures and options contracts. These operations and their accounting treatment are detailed in Note 1 paragraph M and Notes 20, 28 and 29 to the Consolidated Financial Statements included elsewhere herein. The financial performance of TOTAL is sensitive to a number of factors, the most significant being oil and gas prices, generally expressed in dollars, and exchange rates, in particular that of the dollar versus the euro. Generally, a rise in the price of crude oil has a positive effect on earnings as a result of an increase in revenues from oil and gas production. Conversely, a decline in crude oil prices reduces revenues. The impact of changes in crude oil prices on Downstream and Chemicals operations depends upon the speed at which the prices of finished products adjust to reflect these changes. All of the Group’s activities are, to various degrees, sensitive to fluctuations in the dollar/euro exchange rate. ITEM 12. DESCRIPTION OF SECURITIES OTHER THAN EQUITY SECURITIES American Depositary Receipts fees and charges The Bank of New York Mellon, as a depositary, collects its fees for delivery and surrender of ADSsADRs directly from investors depositing shares or surrendering ADSsADRs for the purpose of withdrawal or from intermediaries acting for them. The depositary collects fees for making distributions to investors by deducting those fees from the amounts distributed or by selling a portion of distributable property to pay the fees. The depositary may generally refuse to provide fee-attracting services until its fees for those services are paid.
138
| | | | Investors must pay: | | | | Investors must pay: | | For: | | | | $5.00 (or less) per 100 ADSs (or portion of 100 ADSs) | | • Issuance of ADSs,ADRs, including issuances resulting from a distribution of shares or rights or other property, stocks splits or merger
• Cancellation of ADSsADRs for the purpose of withdrawal, including if the deposit agreement terminates | | A fee equivalent to the fee that would be payable if securities distributed to the investor had been shares and the shares had been deposited for issuance of ADSs | | • Distribution of securities distributed to holders of deposited securities that are distributed by the depositary to ADS registered holders | | Registration or transfer fees | | • Transfer and registration of shares on the Company’s share register to or from the name of the depositary or its agent when the investor deposits or withdraws shares | | Expenses of the depositary | | • Cable, telex and facsimile transmissions (when expressly provided in the deposit agreement)
• Converting foreign currency to U.S. dollars | | Taxes and other governmental charges the depositary or the custodian have to pay on any ADS or share underlying an ADS, for example, stock transfer taxes, stamp duty or withholding taxes | | • As necessary | Any charges incurred by the depositary or its agents for servicing the deposited securities | | • As necessary |
The depositary has agreed to reimburse expenses (“Reimbursed Expenses”) incurred by the Company for the establishment and maintenance of the ADS program that include, but are not limited to, exchange listing fees, annual meeting expenses, standardout-of-pocket maintenance costs for the ADRs (e.g., the expenses of postage and envelopes for mailing annual and interim financial reports, printing and distributing dividend checks, electronic filing of U.S. Federal tax information, mailing required tax forms, stationery, postage, facsimile, and telephone calls), shareholder identification, investor relations activities or programs in North America, accounting fees (such as external audit fees incurred in connection with the Sarbanes-Oxley Act, the preparation of the Company’sForm 20-F and paid to the FASB and the PCAOB), legal fees and other expenses incurred in connection with the preparation of regulatory filings and other documentation related to ongoing SEC, NYSE and U.S. securities law compliance. In certain instances, the depositary has agreed to provide additional payments to the Company based on certain applicable performance indicators relating to the ADR facility. There are limits on the amount of expenses for which the depositary will reimburse the Company, but the amount of reimbursement available to the Company is not necessarily tied to the amount of fees the depositary collects from investors. From March 16, 20102011 to March 15, 2011,2012, the Company received from the depositary a payment of €3,771,262.29$3,327,796.00 with respect to certain Reimbursed Expenses. The Bank of New-York Mellon has also paid $347,622 on behalf of the Company with respect to continuing annual stock exchange listing fees. ITEM 13. DEFAULTS, DIVIDEND ARREARAGES AND DELINQUENCIES
ITEM 14. MATERIAL MODIFICATIONS TO THE RIGHTS OF
SECURITY HOLDERS AND USE OF PROCEEDS None.
139
None.ITEM 15. CONTROLS AND PROCEDURES Disclosure Controls and Procedures An evaluation was carried out under the supervision and with the participation of the Group’s management, including the Chief Executive Officer and the Chief Financial Officer, of the effectiveness, as of the end of the period covered by this report, of the design and operation of the Group’s disclosure controls and procedures, which are defined as those controls and procedures designed to ensure that information required to be disclosed in reports filed under the U.S. Securities Exchange Act of 1934, as amended, is recorded, summarized and reported within specified time periods. There are inherent limitations to the effectiveness of any system of disclosure controls and procedures, including the possibility of human error and the circumvention or overriding of the controls and procedures. Accordingly, even effective disclosure controls and procedures can provide only reasonable assurance of achieving their control objectives. Based on this evaluation, the Chief Executive Officer and Chief Financial Officer concluded that the design and operation of these disclosure controls and procedures were effective to provide reasonable assurance that information required to be disclosed in the reports that the Company files under the Exchange Act is recorded, processed, summarized and reported, within the time periods specified in the applicable rules and forms, and that it is accumulated and communicated to management, including the Chief Executive Officer and Chief Financial Officer, as appropriate to allow timely decisions regarding required disclosure. Management’s Annual Report on Internal Control Over Financial Reporting The Group’s management is responsible for establishing and maintaining adequate internal control over financial reporting. Because of its inherent limitations, internal control over financial reporting may not prevent or detect misstatements and even when determined to be effective, can only provide reasonable assurance with respect to financial statement preparation and presentation. Also, the effectiveness of an internal control system may change over time. The Group’s management, including the Chief Executive Officer and the Chief Financial Officer, conducted an evaluation of the effectiveness of internal control over financial reporting using the criteria set forth in the Internal Control — Integrated Framework issued by the Committee of Sponsoring Organizations of the Treadway Commission (“COSO”). Based on the results of this evaluation, the Group’s management concluded that its internal control over financial reporting was effective as of December 31, 2010. 2011.The effectiveness of internal control over financial reporting as of December 31, 2010,2011, was audited by KPMG S.A. and Ernst & Young Audit, independent registered public accounting firms, as stated in their report onpage F-2 of this Annual Report. Changes in Internal Control Over Financial Reporting There were no changes in the Group’s internal control over financial reporting that occurred during the period covered by this report that have materially affected, or that were reasonably likely to materially affect, the Group’s internal control over financial reporting. ITEM 16A. AUDIT COMMITTEE FINANCIAL EXPERT
Mr. Bertrand JacquillatMs. Patricia Barbizet is the Audit Committee financial expert. Mr. JacquillatMs. Barbizet is an independent member of the Board of Directors in accordance with the NYSE listing standards applicable to TOTAL, as are the other members of the Audit Committee. ITEM 16B. CODE OF ETHICS
At its meeting on February 18, 2004, the Board of Directors adopted a code of ethics that applies to its Chief Executive Officer, Chief Financial Officer, Chief Accounting Officer and the financial and accounting officers for its principal activities. A copy of this code of ethics is included as an exhibit to this Annual Report.
140
ITEM 16C. PRINCIPAL ACCOUNTANT FEES AND SERVICES During the fiscal years ended December 31, 20102011 and 2009,2010, fees for services provided by Ernst & Young Audit and KPMG were as follows: | | | | | | | | | | | | | | | | | | | | | | | | KPMG
| | | Ernst & Young Audit
| | | | | Year Ended December 31, | | | Year Ended December 31, | | | (M€) | | 2010 | | | 2009 | | | 2010 | | | 2009 | | | | | | | | Audit Fees | | | 15.1 | | | | 16.0 | | | | 15.2 | | | | 17.7 | | Audit-Related Fees(a) | | | 3.6 | | | | 2.9 | | | | 0.7 | | | | 0.8 | | Tax Fees(b) | | | 1.2 | | | | 1.2 | | | | 1.7 | | | | 1.4 | | All Other Fees(c) | | | 0.1 | | | | 0.3 | | | | 0.2 | | | | 0.1 | | | | | | Total | | | 20.0 | | | | 20.4 | | | | 17.8 | | | | 20.0 | | | | | |
| | | | | | | | | | | | | | | | | | | | KPMG Year Ended December 31, | | | Ernst & Young Audit Year Ended December 31, | | | (M€) | | 2011 | | | 2010 | | | 2011 | | | 2010 | | Audit Fees | | | 14.1 | | | | 15.1 | | | | 15.6 | | | | 15.2 | | Audit-Related Fees(a) | | | 3.8 | | | | 3.6 | | | | 1.9 | | | | 0.7 | | Tax Fees(b) | | | 1.6 | | | | 1.2 | | | | 1.4 | | | | 1.7 | | All Other Fees(c) | | | 0.2 | | | | 0.1 | | | | 0.2 | | | | 0.2 | | Total | | | 19.7 | | | | 20.0 | | | | 19.1 | | | | 17.8 | |
| (a) | | | (a) | | Audit-related fees are generally fees billed for services that are closely related to the performance of the audit or review of financial statements. These include due diligence services related to business combinations, attestation services not required by statute or regulation, agreed upon or expanded auditing procedures related to accounting or billing records required to respond to or comply with financial, accounting or regulatory reporting matters, consultations concerning financial accounting and reporting standards, information system reviews, internal control reviews and assistance with internal control reporting requirements. |
| (b) | | Tax fees are fees for services related to international and domestic tax compliance, including the preparation of tax returns and claims for refund, tax planning and tax advice, including assistance with tax audits and tax appeals, and tax services regarding statutory, regulatory or administrative developments and expatriate tax assistance and compliance. |
| (c) | | All other fees are principally for risk management advisory services. |
Audit Committee Pre-Approval Policy The Audit Committee has adopted an Audit and Non-Audit Services Pre-Approval Policy that sets forth the procedures and the conditions pursuant to which services proposed to be performed by the statutory auditors may be pre-approved and that are not prohibited by regulatory or other professional requirements. This policy provides for both pre-approval of certain types of services through the use of an annual budget approved by the Audit Committee for these types of services and special pre-approval of services by the Audit Committee on acase-by-case basis. The Audit Committee reviews on an annual basis the services provided by the statutory auditors. During 2010,2011, no audit-related fees, tax fees or other non-audit fees were approved by the Audit Committee pursuant to thede minimisexception to the pre-approval requirement provided by paragraph (c)(7)(i)(C) ofRule 2-01 ofRegulation S-X. ITEM 16D. EXEMPTIONS FROM THE LISTING STANDARDS FOR AUDIT COMMITTEES None.
141
None.ITEM 16E. PURCHASES OF EQUITY SECURITIES BY THE ISSUER AND AFFILIATED PURCHASERS | | | | | | | | | | | | | | | | | | Period | | Total Number Of Shares Purchased | | | Average Price Paid Per Share (€) | | | Total Number Of Shares Purchased, As Part Of Publicly Announced Plans Or Programs(a) | | | | | | | | | Maximum Number Of Shares That May Yet Be Purchased Under The Plans Or Programs(b) | | | | | | | | | | | | Total Number Of
| | | | | | | | | | | | | Shares Purchased,
| | | Maximum Number
| | | | | | | | | | As Part Of Publicly
| | | Of Shares That May
| | | | Total Number Of
| | | Average Price
| | | Announced
| | | Yet Be Purchased
| | | | Shares
| | | Paid Per
| | | Plans Or
| | | Under The Plans Or
| | Period | | Purchased | | | Share (€) | | | Programs(a) | | | Programs(b) | | | | | January 2010 | | | — | | | | — | | | | — | | | | 119,798,107 | | February 2010 | | | — | | | | — | | | | — | | | | 119,813,214 | | March 2010 | | | — | | | | — | | | | — | | | | 119,911,829 | | April 2010 | | | — | | | | — | | | | — | | | | 120,319,759 | | May 2010 | | | — | | | | — | | | | — | | | | 120,418,644 | | June 2010 | | | — | | | | — | | | | — | | | | 120,724,568 | | July 2010 | | | — | | | | — | | | | — | | | | 120,734,750 | | August 2010 | | | — | | | | — | | | | — | | | | 120,742,346 | | September 2010 | | | — | | | | — | | | | — | | | | 120,675,024 | | October 2010 | | | — | | | | — | | | | — | | | | 122,411,798 | | November 2010 | | | — | | | | — | | | | — | | | | 122,432,721 | | December 2010 | | | — | | | | — | | | | — | | | | 122,476,414 | | January 2011 | | | — | | | | — | | | | — | | | | 122,526,633 | | February 2011 | | | — | | | | — | | | | — | | | | 122,588,776 | |
March 2011 | | | — | | | | — | | | | — | | | | 122,626,999 | | (a)April 2011 | | | — | | | | — | | | | — | | | | 123,539,732 | | May 2011 | | | — | | | | — | | | | — | | | | 123,567,601 | | June 2011 | | | — | | | | — | | | | — | | | | 123,655,175 | | July 2011 | | | — | | | | — | | | | — | | | | 123,891,589 | | August 2011 | | | — | | | | — | | | | — | | | | 123,892,274 | | September 2011 | | | — | | | | — | | | | — | | | | 126,818,649 | | October 2011 | | | — | | | | — | | | | — | | | | 126,819,834 | | November 2011 | | | — | | | | — | | | | — | | | | 126,822,199 | | December 2011 | | | — | | | | — | | | | — | | | | 126,822,558 | | January 2012 | | | — | | | | — | | | | — | | | | 126,824,217 | | February 2012 | | | — | | | | — | | | | — | | | | 126,836,267 | |
| (a) | The shareholders’ meeting of May 21, 2010,13, 2011, cancelled and replaced the previous resolution from the shareholders’ meeting of May 15, 2009,21, 2010, authorizing the Board of Directors to trade in the Company’s own shares on the market for a period of 18 months within the framework of the stock purchase program. The maximum number of shares that may be purchased by virtue of this authorization or under the previous authorization may not exceed 10% of the total number of shares constituting the share capital, this amount being periodically adjusted to take into account operations modifying the share capital after each shareholders’ meeting. Under no circumstances may the total number of shares the Company holds, either directly or indirectly through its subsidiaries, exceed 10% of the share capital. |
| (b) | | Based on 10% of the Company’s share capital, and after deducting the shares held by the Company for cancellation and the shares held by the Company to cover the share purchase option plans for Company employees and restricted share grants for Company employees, as well as after deducting the shares held by the subsidiaries. |
ITEM 16F. CHANGE IN REGISTRANT’S CERTIFYING ACCOUNTANT
142
ITEM 16G. CORPORATE GOVERNANCE Summary of Significant Differences between French Corporate Governance Practices and the NYSE’s Corporate Governance Standards Overview Overview
The following paragraphs provide a brief, general summary of significant differences between the corporate governance standards followed by TOTAL under French law and guidelines, and those required by the listing standards of the New York Stock Exchange (the “NYSE”) for U.S. companies that have common stock listed on the NYSE. The principal sources of corporate governance standards in France are the French Commercial Code (Code de Commerce), the French Financial and Monetary Code (Code monétaire et financier), both as amendedinter aliasince August 2003 by the French Financial Security Act (Loi de sécurité financière) and the various subsequent acts, from time to time, and the regulations and recommendations provided by the French Financial Markets Authority (Autorité desmarchés financiers, AMF), as well as a number of general recommendations and guidelines on corporate governance, most notably the Corporate Governance Code for Listed Companies published in December 2008 (as amended in April 2010) by the principal French business confederations, theAssociation Française des Entreprises Privées(AFEP) and theMouvement des Entreprises de France(MEDEF) (the “AFEP-MEDEF Code”). The AFEP-MEDEF Code includes, among other things, recommendations relating to the role and operation of the board of directors (creation, composition and evaluation of the board of directors and the audit, compensation and nominating committees) and the independence criteria for board members. TheArticles L. 820-1et seq. of the French Financial Security ActCommercial Code prohibits statutory auditors from providing certain non-audit services and defines certain criteria for the independence of statutory auditors. In France, the independence of statutory auditors is also monitored by an independent body, the High Council for Statutory Auditors (Haut Conseil du commissariat aux comptes). Composition of Board of Directors; Independence The NYSE listing standards provide that the board of directors of a U.S. listed company must consist of a majority of independent directors and that certain committees must consist solely of independent directors. A director qualifies as independent only if the board affirmatively determines that the director has no material relationship with the company, either directly or indirectly. In addition, the listing standards enumerate a number of relationships that preclude independence. French law does not contain any independence requirement for the members of the board of directors of a French company, unless the board establishes an audit committee, as described below. Under French law, the functions of board chairman and chief executive officer may be performed by the same person. The AFEP- MEDEF Code recommends, however, that (i) at least half of the members of the board of directors be independent in companies that have a dispersed ownership structure and no controlling shareholder, and (ii) at least a third of the members of the board of directors be independent in companies that have a controlling shareholder. The AFEP-MEDEF Code states that a director is independent when “he or she has no relationship of any nature with the company, its group or the management of either, that may compromise the exercise of his or her freedom of judgment.” The AFEP-MEDEF Code also enumerates specific criteria for determining independence, which are on the whole consistent with the goals of the NYSE’s rules although the specific tests under the two standards may vary on some points. Based on the proposal of TOTAL’s Nominating & Corporate Governance Committee, the Board of Directors of TOTAL at its meeting on February 10, 2011,9, 2012, examined the independence of the Company’s directors as of December 31, 2010,2011, and considered that all of the directors of the Company are independent, with the exceptions of Mr. de Margerie, Chairman and Chief Executive Officer of the Company since May 21, 2010, Mr. Desmarest, Chairman of the Board of Directors until May 21, 2010, and Mr. Clément, director representing employee shareholders. Representation of women on corporate boards The FrenchJournal Officielpublished a statuten°law No. 2011-103 dated January 27, 2011, relating to the representation of women on the boards of certain French companies, including French companies listed on Euronext-Paris. Euronext Paris.New rules provide for legally binding quotas to boost the percentage of women on boards of directors of French listed companies, requiring that women represent: (i) at least 20% within threetwo years (following the first ordinary shareholders’ meeting held after January 1, 2014), and (ii) at least 40% within sixfive years (following the first ordinary shareholders’ meeting held after January 1, 2017). When the board of directors consists of less than nine members, the difference between the number of directors of each gender at the end of the six-yearfive-year period should not be higher than two. Any appointment of a director
143
made in violation of these rules shall be declared null and void and the payment of the directors’ compensation shall be suspended until the board composition complies with the law’s requirements.requirements (the management report shall also indicate the suspension of the directors’ compensation until the board composition complies with the law’s requirements). However, decisions of a board of directors that fails to comply with these quotas may not be declared null and void. Overview.The NYSE listing standards require that a U.S. listed company have an audit committee, a nominating/corporate governance committee and a compensation committee. Each of these committees must consist solely of independent directors and must have a written charter that addresses certain matters specified in the listing standards. With the exception of an audit committee, as described below, French law requires neither the establishment of board committees nor the adoption of written charters. The AFEP-MEDEF Code recommends, however, that the board of directors setsets up, in addition to an audit committee, a nominating committee and a compensation committee, indicating that the nominating and compensation committees may form only one committee. The AFEP-MEDEF Code also recommends that at least two-thirds of the audit committee members and a majority of the members of each of the compensation committee and the nominating committee be independent directors. TOTAL has established an Audit Committee, a Nominating & Corporate Governance Committee and a Compensation Committee, and considers all of the members of these committees to be independent with the exception of Mr. Desmarest, who is a member of the Compensation Committee and chairs the Nominating & Corporate Governance Committee. For the membership of each committee, see “Item 6. Corporate Governance”. Each of these committees has a charter that defines the scope of its activity. Audit committee. The NYSE listing standards contain detailed requirements for the audit committees of U.S. listed companies. Some, but not all, of these requirements also apply tonon-U.S. listed companies, such as TOTAL. French law requires the board of directors of companies listed in France to establish an audit committee (Article L. 823-19 of the French Commercial Code), at least one member of which must be an independent director and must be competent in finance or accounting. Pursuant to French law and the AFEP-MEDEF Code, the audit committee is responsible for, among other things, examining the company’s risk exposure and material off-balance sheet commitments and the scope of consolidation, reviewing the financial statements and ensuring the relevance and consistency of accounting methods used in drawing up the consolidated and corporate accounts, examining the company’s risk exposure and material off-balance sheet commitments and the scope of consolidation, monitoring the process for the preparation of financial information, monitoring the efficiency of internal control procedures and risk management systems, managing the process of selecting statutory auditors, expressing an opinion on the amount of their fees and monitoring compliance with rules designed to ensure auditor independence, regularly interviewing statutory auditors without the executive management being present and calling upon outside experts if necessary. Although the audit committee requirements under French law and recommendations under the AFEP-MEDEF Code are less detailed than those contained in the NYSE listing standards, the NYSE listing standards, French law and the AFEP-MEDEF Code share the goal of establishing a system for overseeing the company’s accounting that is independent from management and that ensures auditor independence. As a result, they address similar topics, and there is some overlap. For the specific tasks performed by the Audit Committee of TOTAL that exceed those required by French law and those recommended by the AFEP-MEDEF Code, see “Item 6. Corporate Governance — Audit Committee”. One structural difference between the legal status of the audit committee of a U.S. listed company and that of a French listed company concerns the degree of the committee’s involvement in managing the relationship between the company and the auditor. French law requires French companies that publish consolidated financial statements, such as TOTAL, to have two co-auditors. While the NYSE listing standards require that the audit committee of a U.S. listed company have direct responsibility for the appointment, compensation, retention, and oversight of the work of the auditor, French law provides that the election of the co-auditors is the sole responsibility of the shareholders’ meeting. In making its decision, the shareholders’ meeting may rely on proposals submitted to it by the board of directors, the decision of the latter being taken upon consultation with the audit committee. The shareholders’ meeting elects the auditors for an audit period of six fiscal years. The auditors may only be dismissed by a court and only on grounds of professional negligence or incapacity to perform their mission.
144
DisclosureDisclosure
The NYSE listing standards require U.S. listed companies to adopt, and post on their websites, a set of corporate governance guidelines. The guidelines must address, among other things: director qualification standards, director responsibilities, director access to management and independent advisers, director compensation, director orientation and continuing education, management succession, and an annual performance evaluation of the board. In addition, the chief executive officer of a U.S. listed company must certify to the NYSE annually that he or she is not aware of any violations by the company of the NYSE’s corporate governance listing standards. French law requires neither the adoption of such guidelines nor the provision of such certification. The AFEP-MEDEF Code recommends, however, that the board of directors of a French listed company perform an annual review of its operation and that a formal evaluation, possibly with the assistance of an outside consultant, be undertaken every three years, which for TOTAL took place endin early 2012 without the assistance of 2009,an outside consultant, and that shareholders be informed each year in the annual report of the evaluations. In addition, the AFEP-MEDEF Code addresses deontology rules that the directors are expected to comply with. Code of business conduct and ethics The NYSE listing standards require each U.S. listed company to adopt, and post on its website, a code of business conduct and ethics for its directors, officers and employees. There is no similar requirement or recommendation under French law. However, under the SEC’s rules and regulations, all companies required to submit periodic reports to the SEC, including TOTAL, must disclose in their annual reports whether they have adopted a code of ethics for their principal executive officer and senior financial officers. In addition, they must file a copy of the code with the SEC, post the text of the code on their website or undertake to provide a copy upon request to any person without charge. There is significant, though not complete, overlap between the code of ethics required by the NYSE listing standards and the code of ethics for senior financial officers required by the SEC’s rules. For a discussion of the code of ethics adopted by TOTAL, see “Item 6. Corporate Governance” and “Item 16B. Code of Ethics”. ITEM 17. FINANCIAL STATEMENTS
ITEM 18. FINANCIAL STATEMENTS The following financial statements, together with the report of Ernst & Young Audit and KPMG S.A. thereon, are held as part of this annual report.
| | | | | | | | Page | | | | | | F-1 | | | | | F-2 | | | | | F-3 | | | | | F-4 | | | | | F-5 | | | | | F-6 | | | | | F-7 | | | | | F-8 | | | | | | | | | | S-1 | |
Schedules have been omitted since they are not required under the applicable instructions or the substance of the required information is shown in the financial statements.
145
ITEM 19. EXHIBITS The following documents are filed as part of this annual report: | | | 1 | | | 1 | | Bylaws (Statuts) of TOTAL S.A. (as amended through December 31, 2010)2011) | 8 | | List of Subsidiaries (see Note 35 to the Consolidated Financial Statements included in this Annual Report) | 11 | | Code of Ethics (incorporated by reference to the Company’s Annual Report on Form 20-F for the year ended December 31, 2005) | 12.1 | | Certification of Chairman and Chief Executive Officer | 12.2 | | Certification of Chief Financial Officer | 13.1 | | Certification of Chairman and Chief Executive Officer | 13.2 | | Certification of Chief Financial Officer | 15 | | Consent of ERNST & YOUNG AUDIT and of KPMG S.A. |
146
SIGNATURE The registrant hereby certifies that it meets all of the requirements for filing onForm 20-F and that it has duly caused and authorized the undersigned to sign this annual report on its behalf. TOTAL S.A.
| | | TOTAL S.A. | | | By: | | /s/ CHRISTOPHEDE MARGERIE | | | Name: Christophe de Margerie | | | Title: Chairman and Chief Executive Officer |
Name: Christophe de Margerie
Title: Chairman and Chief Executive Officer
14726, 2012
REPORT OF INDEPENDENT REGISTERED PUBLIC ACCOUNTING FIRMS
ON THE CONSOLIDATED FINANCIAL STATEMENTS Year ended December 31, 2010 2011The Board of Directors and Shareholders We have audited the accompanying consolidated balance sheets of TOTAL S.A. and subsidiaries (the “Company”) as of December 31, 2011, 2010 2009 and 2008,2009, and the related consolidated statements of income, comprehensive income, cash flows and changes in shareholders’ equity for each of the three years in the period ended December 31, 2010.2011. These consolidated financial statements are the responsibility of the Company’s management. Our responsibility is to express an opinion on these consolidated financial statements based on our audits. We conducted our audits in accordance with the standards of the Public Company Accounting Oversight Board (United States). Those standards require that we plan and perform the audit to obtain reasonable assurance about whether the financial statements are free of material misstatement. An audit includes examining, on a test basis, evidence supporting the amounts and disclosures in the financial statements. An audit also includes assessing the accounting principles used and significant estimates made by management, as well as evaluating the overall financial statement presentation. We believe that our audits provide a reasonable basis for our opinion. In our opinion, the consolidated financial statements referred to above present fairly, in all material respects, the consolidated financial position of the Company as of December 31, 2011, 2010 2009 and 2008,2009, and the consolidated results of its operations and its consolidated cash flows for each of the three years in the period ended December 31, 2010,2011, in conformity with International Financial Reporting Standards as adopted by the European Union and in conformity with International Financial Reporting Standards as issued by the International Accounting Standards Board. As discussed in the Introduction of the Notes to the consolidated financial statements, the Company has changed its accounting policy regarding jointly controlled entities under standard IAS 31 “Interests in Joint Ventures”.
We also have audited, in accordance with the standards of the Public Company Accounting Oversight Board (United States), the Company’s internal control over financial reporting as of December 31, 2010,2011, based on criteria established in Internal Control-Integrated Framework issued by the Committee of Sponsoring Organizations of the Treadway Commission (the COSO criteria) and our report dated March 10, 20117, 2012 expressed an unqualified opinion on the effectiveness of the Company’s internal control over financial reporting. Paris La Défense, March 10, 2011 | | | | | | | KPMG AUDIT
Audit A division of KPMG S.A. | | ERNST & YOUNG Audit | | | | /s/Jay Nirsimloo JAY NIRSIMLOO | | /s/ Pascal Macioce PASCAL MACIOCE | | /s/ Laurent Vitse LAURENT VITSE | | | | | | Jay Nirsimloo
Partner | | Pascal Macioce
Partner | | Laurent Vitse
| | Partner | | Partner | | Partner |
F-1
REPORT OF INDEPENDENT REGISTERED PUBLIC ACCOUNTING FIRMS
ON THE INTERNAL CONTROL OVER FINANCIAL REPORTING Year ended December 31, 2010 2011The Board of Directors and Shareholders We have audited TOTAL S.A. and subsidiaries’ (“the Company”) internal control over financial reporting as of December 31, 2010,2011, based on criteria established in Internal Control —- Integrated Framework issued by the Committee of Sponsoring Organizations of the Treadway Commission (the COSO criteria). The Company’s management is responsible for maintaining effective internal control over financial reporting, and for its assessment of the effectiveness of internal control over financial reporting included in the accompanying management’s annual report on internal control over financial reporting. Our responsibility is to express an opinion on the Company’s internal control over financial reporting based on our audit. We conducted our audit in accordance with the standards of the Public Company Accounting Oversight Board (United States). Those standards require that we plan and perform the audit to obtain reasonable assurance about whether effective internal control over financial reporting was maintained in all material respects. Our audit included obtaining an understanding of internal control over financial reporting, assessing the risk that a material weakness exists, and testing and evaluating the design and operating effectiveness of internal control based on the assessed risk. Our audit also included performing such other procedures as we considered necessary in the circumstances. We believe that our audit provides a reasonable basis for our opinion. A company’s internal control over financial reporting is a process designed to provide reasonable assurance regarding the reliability of financial reporting and the preparation of financial statements for external purposes in accordance with generally accepted accounting principles. A company’s internal control over financial reporting includes those policies and procedures that (1) pertain to the maintenance of records that, in reasonable detail, accurately and fairly reflect the transactions and dispositions of the assets of the company; (2) provide reasonable assurance that transactions are recorded as necessary to permit preparation of financial statements in accordance with generally accepted accounting principles, and that receipts and expenditures of the company are being made only in accordance with authorizations of management and directors of the company; and (3) provide reasonable assurance regarding prevention or timely detection of unauthorized acquisition, use or disposition of the company’s assets that could have a material effect on the financial statements. Because of its inherent limitations, internal control over financial reporting may not prevent or detect misstatements. Also, projections of any evaluation of effectiveness to future periods are subject to the risk that controls may become inadequate because of changes in conditions, or that the degree of compliance with the policies or procedures may deteriorate. In our opinion, the Company maintained, in all material respects, effective internal control over financial reporting as of December 31, 2010,2011, based on the COSO criteria. We also have audited, in accordance with the standards of the Public Company Accounting Oversight Board (United States), the consolidated balance sheets of the Company as of December 31, 2011, 2010 2009 and 20082009 and the related consolidated statements of income, comprehensive income, cash flows and changes in shareholders’ equity for each of the three years in the period ended December 31, 2010,2011, and our report dated March 10, 20117, 2012 expressed an unqualified opinion on those consolidated financial statements. Paris La Défense, March 10, 2011 | | | | | | | KPMG AUDIT
Audit A division of KPMG S.A. | | ERNST & YOUNG Audit | | | | /s/Jay Nirsimloo JAY NIRSIMLOO | | /s/Pascal Macioce PASCAL MACIOCE | | /s/Laurent Vitse LAURENT VITSE | | | | | | Jay Nirsimloo
Partner | | Pascal Macioce
Partner | | Laurent Vitse
| | Partner | | Partner | | Partner |
F-2
CONSOLIDATED STATEMENT OF INCOME | | | | | | | | | | | | | | | | | | | | | | | For the year ended December 31, (M€)(a) | | | | | | | 2010 | | | | 2009 | | | | 2008 | | Sales | | | | (Notes 4 & 5 | ) | | | | 159,269 | | | | | 131,327 | | | | | 179,976 | | | Excise taxes | | | | | | | | | (18,793 | ) | | | | (19,174 | ) | | | | (19,645 | ) | | Revenues from sales | | | | | | | | | 140,476 | | | | | 112,153 | | | | | 160,331 | | | Purchases net of inventory variation | | | | (Note 6 | ) | | | | (93,171 | ) | | | | (71,058 | ) | | | | (111,024 | ) | | Other operating expenses | | | | (Note 6 | ) | | | | (19,135 | ) | | | | (18,591 | ) | | | | (19,101 | ) | | Exploration costs | | | | (Note 6 | ) | | | | (864 | ) | | | | (698 | ) | | | | (764 | ) | Depreciation, depletion and amortization of tangible assets and mineral
interests | | | | | | | | | (8,421 | ) | | | | (6,682 | ) | | | | (5,755 | ) | | Other income | | | | (Note 7 | ) | | | | 1,396 | | | | | 314 | | | | | 369 | | | Other expense | | | | (Note 7 | ) | | | | (900 | ) | | | | (600 | ) | | | | (554 | ) | | Financial interest on debt | | | | | | | | | (465 | ) | | | | (530 | ) | | | | (1,000 | ) | | Financial income from marketable securities & cash equivalents | | | | | | | | | 131 | | | | | 132 | | | | | 473 | | | Cost of net debt | | | | (Note 29 | ) | | | | (334 | ) | | | | (398 | ) | | | | (527 | ) | | Other financial income | | | | (Note 8 | ) | | | | 442 | | | | | 643 | | | | | 728 | | | Other financial expense | | | | (Note 8 | ) | | | | (407 | ) | | | | (345 | ) | | | | (325 | ) | | Equity in income (loss) of affiliates | | | | (Note 12 | ) | | | | 1,953 | | | | | 1,642 | | | | | 1,721 | | | Income taxes | | | | (Note 9 | ) | | | | (10,228 | ) | | | | (7,751 | ) | | | | (14,146 | ) | | | Consolidated net income | | | | | | | | | 10,807 | | | | | 8,629 | | | | | 10,953 | | | | | Group share | | | | | | | | | 10,571 | | | | | 8,447 | | | | | 10,590 | | | Minority interests | | | | | | | | | 236 | | | | | 182 | | | | | 363 | | | | | Earnings per share (€) | | | | | | | | | 4.73 | | | | | 3.79 | | | | | 4.74 | | | Fully-diluted earnings per share (€) | | | | | | | | | 4.71 | | | | | 3.78 | | | | | 4.71 | | | |
| | | | | | | | | | | | | | | | | | For the year ended December 31, (M€)(a) | | | | | 2011 | | | 2010 | | | 2009 | | Sales | | | (Notes 4 & 5 | ) | | | 184,693 | | | | 159,269 | | | | 131,327 | | Excise taxes | | | | | | | (18,143 | ) | | | (18,793 | ) | | | (19,174 | ) | Revenues from sales | | | | | | | 166,550 | | | | 140,476 | | | | 112,153 | | Purchases net of inventory variation | | | (Note 6 | ) | | | (113,892 | ) | | | (93,171 | ) | | | (71,058 | ) | Other operating expenses | | | (Note 6 | ) | | | (19,843 | ) | | | (19,135 | ) | | | (18,591 | ) | Exploration costs | | | (Note 6 | ) | | | (1,019 | ) | | | (864 | ) | | | (698 | ) | Depreciation, depletion and amortization of tangible assets and mineral interests | | | | | | | (7,506 | ) | | | (8,421 | ) | | | (6,682 | ) | Other income | | | (Note 7 | ) | | | 1,946 | | | | 1,396 | | | | 314 | | Other expense | | | (Note 7 | ) | | | (1,247 | ) | | | (900 | ) | | | (600 | ) | Financial interest on debt | | | | | | | (713 | ) | | | (465 | ) | | | (530 | ) | Financial income from marketable securities & cash equivalents | | | | | | | 273 | | | | 131 | | | | 132 | | Cost of net debt | | | (Note 29 | ) | | | (440 | ) | | | (334 | ) | | | (398 | ) | Other financial income | | | (Note 8 | ) | | | 609 | | | | 442 | | | | 643 | | Other financial expense | | | (Note 8 | ) | | | (429 | ) | | | (407 | ) | | | (345 | ) | Equity in income (loss) of affiliates | | | (Note 12 | ) | | | 1,925 | | | | 1,953 | | | | 1,642 | | Income taxes | | | (Note 9 | ) | | | (14,073 | ) | | | (10,228 | ) | | | (7,751 | ) | Consolidated net income | | | | | | | 12,581 | | | | 10,807 | | | | 8,629 | | Group share | | | | | | | 12,276 | | | | 10,571 | | | | 8,447 | | Non-controlling interests | | | | | | | 305 | | | | 236 | | | | 182 | | Earnings per share (€) | | | | | | | 5.46 | | | | 4.73 | | | | 3.79 | | Fully-diluted earnings per share (€) | | | | | | | 5.44 | | | | 4.71 | | | | 3.78 | |
| (a) | | | (a)
| | Except for per share amounts. |
F-3
CONSOLIDATED STATEMENT OF
COMPREHENSIVE INCOME | | | | | | | | | | | | | | | For the year ended December 31, (M€) | | 2010 | | | 2009 | | | 2008 | | Consolidated net income | | | 10,807 | | | | 8,629 | | | | 10,953 | | | | Other comprehensive income | | | | | | | | | | | | | | Currency translation adjustment | | | 2,231 | | | | (244 | ) | | | (722 | ) | | Available for sale financial assets | | | (100 | ) | | | 38 | | | | (254 | ) | | Cash flow hedge | | | (80 | ) | | | 128 | | | | — | | | Share of other comprehensive income of associates, net amount | | | 302 | | | | 234 | | | | 173 | | | Other | | | (7 | ) | | | (5 | ) | | | 1 | | | Tax effect | | | 28 | | | | (38 | ) | | | 30 | | | | | | | | | | | | | | | | Total other comprehensive income (net amount)(note 17) | | | 2,374 | | | | 113 | | | | (772 | ) | | | | | | | | | | | | | | | Comprehensive income | | | 13,181 | | | | 8,742 | | | | 10,181 | | | | | | | | | | | | | | | | | - Group share | | | 12,936 | | | | 8,500 | | | | 9,852 | | | - Minority interests | | | 245 | | | | 242 | | | | 329 | |
F-4
| | | | | | | | | | | | | | For the year ended December 31, (M€) | | 2011 | | | 2010 | | | 2009 | | Consolidated net income | | | 12,581 | | | | 10,807 | | | | 8,629 | | Other comprehensive income | | | | | | | | | | | | | Currency translation adjustment | | | 1,498 | | | | 2,231 | | | | (244 | ) | Available for sale financial assets | | | 337 | | | | (100 | ) | | | 38 | | Cash flow hedge | | | (84 | ) | | | (80 | ) | | | 128 | | Share of other comprehensive income of associates, net amount | | | (15 | ) | | | 302 | | | | 234 | | Other | | | (2 | ) | | | (7 | ) | | | (5 | ) | Tax effect | | | (55 | ) | | | 28 | | | | (38 | ) | Total other comprehensive income (net amount)(note 17) | | | 1,679 | | | | 2,374 | | | | 113 | | Comprehensive income | | | 14,260 | | | | 13,181 | | | | 8,742 | | — Group share | | | 13,911 | | | | 12,936 | | | | 8,500 | | — Non-controlling interests | | | 349 | | | | 245 | | | | 242 | |
CONSOLIDATED BALANCE SHEET | | | | | | | | | | | | | | | | | | | | | | | As of December 31, (M€) | | | | | | | 2010 | | | | 2009 | | | | 2008 | | ASSETS | | | | | | | | | | | | | | | | | | | | | Non-current assets | | | | | | | | | | | | | | | | | | | | | | Intangible assets, net | | | | (Notes 5 & 10 | ) | | | | 8,917 | | | | | 7,514 | | | | | 5,341 | | | Property, plant and equipment, net | | | | (Notes 5 & 11 | ) | | | | 54,964 | | | | | 51,590 | | | | | 46,142 | | | Equity affiliates: investments and loans | | | | (Note 12 | ) | | | | 11,516 | | | | | 13,624 | | | | | 14,668 | | | Other investments | | | | (Note 13 | ) | | | | 4,590 | | | | | 1,162 | | | | | 1,165 | | | Hedging instruments of non-current financial debt | | | | (Note 20 | ) | | | | 1,870 | | | | | 1,025 | | | | | 892 | | | Other non-current assets | | | | (Note 14 | ) | | | | 3,655 | | | | | 3,081 | | | | | 3,044 | | | | Total non-current assets | | | | | | | | | 85,512 | | | | | 77,996 | | | | | 71,252 | | | | Current assets | | | | | | | | | | | | | | | | | | | | | | Inventories, net | | | | (Note 15 | ) | | | | 15,600 | | | | | 13,867 | | | | | 9,621 | | | Accounts receivable, net | | | | (Note 16 | ) | | | | 18,159 | | | | | 15,719 | | | | | 15,287 | | | Other current assets | | | | (Note 16 | ) | | | | 7,483 | | | | | 8,198 | | | | | 9,642 | | | Current financial assets | | | | (Note 20 | ) | | | | 1,205 | | | | | 311 | | | | | 187 | | | Cash and cash equivalents | | | | (Note 27 | ) | | | | 14,489 | | | | | 11,662 | | | | | 12,321 | | | | Total current assets | | | | | | | | | 56,936 | | | | | 49,757 | | | | | 47,058 | | | | Assets classified as held for sale | | | | (Note 34 | ) | | | | 1,270 | | | | | — | | | | | — | | | | Total assets | | | | | | | | | 143,718 | | | | | 127,753 | | | | | 118,310 | | | | LIABILITIES & SHAREHOLDERS’ EQUITY | | | | | | | | | | | | | | | | | | | | | Shareholders’ equity | | | | | | | | | | | | | | | | | | | | | | Common shares | | | | | | | | | 5,874 | | | | | 5,871 | | | | | 5,930 | | | Paid-in surplus and retained earnings | | | | | | | | | 60,538 | | | | | 55,372 | | | | | 52,947 | | | Currency translation adjustment | | | | | | | | | (2,495 | ) | | | | (5,069 | ) | | | | (4,876 | ) | | Treasury shares | | | | | | | | | (3,503 | ) | | | | (3,622 | ) | | | | (5,009 | ) | | | Total shareholders’ equity — Group share | | | | (Note 17 | ) | | | | 60,414 | | | | | 52,552 | | | | | 48,992 | | | | Minority interests | | | | | | | | | 857 | | | | | 987 | | | | | 958 | | | | Total shareholders’ equity | | | | | | | | | 61,271 | | | | | 53,539 | | | | | 49,950 | | | | Non-current liabilities | | | | | | | | | | | | | | | | | | | | | | Deferred income taxes | | | | (Note 9 | ) | | | | 9,947 | | | | | 8,948 | | | | | 7,973 | | | Employee benefits | | | | (Note 18 | ) | | | | 2,171 | | | | | 2,040 | | | | | 2,011 | | | Provisions and other non-current liabilities | | | | (Note 19 | ) | | | | 9,098 | | | | | 9,381 | | | | | 7,858 | | | | Total non-current liabilities | | | | | | | | | 21,216 | | | | | 20,369 | | | | | 17,842 | | | | Non-current financial debt | | | | (Note 20 | ) | | | | 20,783 | | | | | 19,437 | | | | | 16,191 | | | | Current liabilities | | | | | | | | | | | | | | | | | | | | | | Accounts payable | | | | | | | | | 18,450 | | | | | 15,383 | | | | | 14,815 | | | Other creditors and accrued liabilities | | | | (Note 21 | ) | | | | 11,989 | | | | | 11,908 | | | | | 11,632 | | | Current borrowings | | | | (Note 20 | ) | | | | 9,653 | | | | | 6,994 | | | | | 7,722 | | | Other current financial liabilities | | | | (Note 20 | ) | | | | 159 | | | | | 123 | | | | | 158 | | | | Total current liabilities | | | | | | | | | 40,251 | | | | | 34,408 | | | | | 34,327 | | | | Liabilities directly associated with the assets classified as held for sale | | | | (Note 34 | ) | | | | 197 | | | | | — | | | | | — | | | | Total liabilities and shareholders’ equity | | | | | | | | | 143,718 | | | | | 127,753 | | | | | 118,310 | | | |
F-5
| | | | | | | | | | | | | | | | | | As of December 31, (M€) | | | | | 2011 | | | 2010 | | | 2009 | | ASSETS | | | | | | | | | | | | | | | | | Non-current assets | | | | | | | | | | | | | | | | | Intangible assets, net | | | (Notes 5 & 10 | ) | | | 12,413 | | | | 8,917 | | | | 7,514 | | Property, plant and equipment, net | | | (Notes 5 & 11 | ) | | | 64,457 | | | | 54,964 | | | | 51,590 | | Equity affiliates: investments and loans | | | (Note 12 | ) | | | 12,995 | | | | 11,516 | | | | 13,624 | | Other investments | | | (Note 13 | ) | | | 3,674 | | | | 4,590 | | | | 1,162 | | Hedging instruments of non-current financial debt | | | (Note 20 | ) | | | 1,976 | | | | 1,870 | | | | 1,025 | | Other non-current assets | | | (Note 14 | ) | | | 4,871 | | | | 3,655 | | | | 3,081 | | Total non-current assets | | | | | | | 100,386 | | | | 85,512 | | | | 77,996 | | Current assets | | | | | | | | | | | | | | | | | Inventories, net | | | (Note 15 | ) | | | 18,122 | | | | 15,600 | | | | 13,867 | | Accounts receivable, net | | | (Note 16 | ) | | | 20,049 | | | | 18,159 | | | | 15,719 | | Other current assets | | | (Note 16 | ) | | | 10,767 | | | | 7,483 | | | | 8,198 | | Current financial assets | | | (Note 20 | ) | | | 700 | | | | 1,205 | | | | 311 | | Cash and cash equivalents | | | (Note 27 | ) | | | 14,025 | | | | 14,489 | | | | 11,662 | | Total current assets | | | | | | | 63,663 | | | | 56,936 | | | | 49,757 | | Assets classified as held for sale | | | (Note 34 | ) | | | — | | | | 1,270 | | | | — | | Total assets | | | | | | | 164,049 | | | | 143,718 | | | | 127,753 | | LIABILITIES & SHAREHOLDERS’ EQUITY | | | | | | | | | | | | | | | | | Shareholders’ equity | | | | | | | | | | | | | | | | | Common shares | | | | | | | 5,909 | | | | 5,874 | | | | 5,871 | | Paid-in surplus and retained earnings | | | | | | | 66,506 | | | | 60,538 | | | | 55,372 | | Currency translation adjustment | | | | | | | (988 | ) | | | (2,495 | ) | | | (5,069 | ) | Treasury shares | | | | | | | (3,390 | ) | | | (3,503 | ) | | | (3,622 | ) | Total shareholders’ equity — Group share | | | (Note 17 | ) | | | 68,037 | | | | 60,414 | | | | 52,552 | | Non-controlling interests | | | | | | | 1,352 | | | | 857 | | | | 987 | | Total shareholders’ equity | | | | | | | 69,389 | | | | 61,271 | | | | 53,539 | | Non-current liabilities | | | | | | | | | | | | | | | | | Deferred income taxes | | | (Note 9 | ) | | | 12,260 | | | | 9,947 | | | | 8,948 | | Employee benefits | | | (Note 18 | ) | | | 2,232 | | | | 2,171 | | | | 2,040 | | Provisions and other non-current liabilities | | | (Note 19 | ) | | | 10,909 | | | | 9,098 | | | | 9,381 | | Non-current financial debt | | | (Note 20 | ) | | | 22,557 | | | | 20,783 | | | | 19,437 | | Total non-current liabilities | | | | | | | 47,958 | | | | 41,999 | | | | 39,806 | | Current liabilities | | | | | | | | | | | | | | | | | Accounts payable | | | | | | | 22,086 | | | | 18,450 | | | | 15,383 | | Other creditors and accrued liabilities | | | (Note 21 | ) | | | 14,774 | | | | 11,989 | | | | 11,908 | | Current borrowings | | | (Note 20 | ) | | | 9,675 | | | | 9,653 | | | | 6,994 | | Other current financial liabilities | | | (Note 20 | ) | | | 167 | | | | 159 | | | | 123 | | Total current liabilities | | | | | | | 46,702 | | | | 40,251 | | | | 34,408 | | Liabilities directly associated with the assets classified as held for sale | | | (Note 34 | ) | | | — | | | | 197 | | | | — | | Total liabilities and shareholders’ equity | | | | | | | 164,049 | | | | 143,718 | | | | 127,753 | |
CONSOLIDATED STATEMENT OF CASH FLOW | | | | | | | | | | | | | | | For the year ended December 31, (M€) | | 2010 | | | 2009 | | | 2008 | | CASH FLOW FROM OPERATING ACTIVITIES | | | | | | | | | | | | | | Consolidated net income | | | 10,807 | | | | 8,629 | | | | 10,953 | | | Depreciation, depletion and amortization | | | 9,117 | | | | 7,107 | | | | 6,197 | | | Non-current liabilities, valuation allowances, and deferred taxes | | | 527 | | | | 441 | | | | (150 | ) | | Impact of coverage of pension benefit plans | | | (60 | ) | | | — | | | | (505 | ) | | (Gains) losses on disposals of assets | | | (1,046 | ) | | | (200 | ) | | | (257 | ) | | Undistributed affiliates’ equity earnings | | | (470 | ) | | | (378 | ) | | | (311 | ) | | (Increase) decrease in working capital | | | (496 | ) | | | (3,316 | ) | | | 2,571 | | | Other changes, net | | | 114 | | | | 77 | | | | 171 | | | | | | | | | | | | | | | | Cash flow from operating activities | | | 18,493 | | | | 12,360 | | | | 18,669 | | | | | | | | | | | | | | | | CASH FLOW USED IN INVESTING ACTIVITIES | | | | | | | | | | | | | | Intangible assets and property, plant and equipment additions | | | (13,812 | ) | | | (11,849 | ) | | | (11,861 | ) | | Acquisitions of subsidiaries, net of cash acquired | | | (862 | ) | | | (160 | ) | | | (559 | ) | | Investments in equity affiliates and other securities | | | (654 | ) | | | (400 | ) | | | (416 | ) | | Increase in non-current loans | | | (945 | ) | | | (940 | ) | | | (804 | ) | | | | | | | | | | | | | | | Total expenditures | | | (16,273 | ) | | | (13,349 | ) | | | (13,640 | ) | | Proceeds from disposals of intangible assets and property, plant and equipment | | | 1,534 | | | | 138 | | | | 130 | | | Proceeds from disposals of subsidiaries, net of cash sold | | | 310 | | | | — | | | | 88 | | | Proceeds from disposals of non-current investments | | | 1,608 | | | | 2,525 | | | | 1,233 | | | Repayment of non-current loans | | | 864 | | | | 418 | | | | 1,134 | | | | | | | | | | | | | | | | Total divestments | | | 4,316 | | | | 3,081 | | | | 2,585 | | | | | | | | | | | | | | | | Cash flow used in investing activities | | | (11,957 | ) | | | (10,268 | ) | | | (11,055 | ) | | | | | | | | | | | | | | | CASH FLOW USED IN FINANCING ACTIVITIES | | | | | | | | | | | | | | Issuance (repayment) of shares: | | | | | | | | | | | | | | - Parent company shareholders | | | 41 | | | | 41 | | | | 262 | | | - Treasury shares | | | 49 | | | | 22 | | | | (1,189 | ) | | - Minority shareholders | | | — | | | | — | | | | (4 | ) | | Dividends paid: | | | | | | | | | | | | | | - Parent company shareholders | | | (5,098 | ) | | | (5,086 | ) | | | (4,945 | ) | | - Minority shareholders | | | (152 | ) | | | (189 | ) | | | (213 | ) | | Other transactions with minority shareholders | | | (429 | ) | | | — | | | | — | | | Net issuance (repayment) of non-current debt | | | 3,789 | | | | 5,522 | | | | 3,009 | | | Increase (decrease) in current borrowings | | | (731 | ) | | | (3,124 | ) | | | 1,437 | | | Increase (decrease) in current financial assets and liabilities | | | (817 | ) | | | (54 | ) | | | 850 | | | | | | | | | | | | | | | | Cash flow used in financing activities | | | (3,348 | ) | | | (2,868 | ) | | | (793 | ) | | | | | | | | | | | | | | | Net increase (decrease) in cash and cash equivalents | | | 3,188 | | | | (776 | ) | | | 6,821 | | | Effect of exchange rates | | | (361 | ) | | | 117 | | | | (488 | ) | | Cash and cash equivalents at the beginning of the period | | | 11,662 | | | | 12,321 | | | | 5,988 | | | | | | | | | | | | | | | | Cash and cash equivalents at the end of the period | | | 14,489 | | | | 11,662 | | | | 12,321 | | | | | | | | | | | | | | | |
F-6
| | | | | | | | | | | | | | For the year ended December 31, (M€) | | 2011 | | | 2010 | | | 2009 | | CASH FLOW FROM OPERATING ACTIVITIES | | | | | | | | | | | | | Consolidated net income | | | 12,581 | | | | 10,807 | | | | 8,629 | | Depreciation, depletion and amortization | | | 8,628 | | | | 9,117 | | | | 7,107 | | Non-current liabilities, valuation allowances, and deferred taxes | | | 1,665 | | | | 527 | | | | 441 | | Impact of coverage of pension benefit plans | | | — | | | | (60 | ) | | | — | | (Gains) losses on disposals of assets | | | (1,590 | ) | | | (1,046 | ) | | | (200 | ) | Undistributed affiliates’ equity earnings | | | (107 | ) | | | (470 | ) | | | (378 | ) | (Increase) decrease in working capital | | | (1,739 | ) | | | (496 | ) | | | (3,316 | ) | Other changes, net | | | 98 | | | | 114 | | | | 77 | | Cash flow from operating activities | | | 19,536 | | | | 18,493 | | | | 12,360 | | CASH FLOW USED IN INVESTING ACTIVITIES | | | | | | | | | | | | | Intangible assets and property, plant and equipment additions | | | (17,950 | ) | | | (13,812 | ) | | | (11,849 | ) | Acquisitions of subsidiaries, net of cash acquired | | | (854 | ) | | | (862 | ) | | | (160 | ) | Investments in equity affiliates and other securities | | | (4,525 | ) | | | (654 | ) | | | (400 | ) | Increase in non-current loans | | | (1,212 | ) | | | (945 | ) | | | (940 | ) | Total expenditures | | | (24,541 | ) | | | (16,273 | ) | | | (13,349 | ) | Proceeds from disposals of intangible assets and property, plant and equipment | | | 1,439 | | | | 1,534 | | | | 138 | | Proceeds from disposals of subsidiaries, net of cash sold | | | 575 | | | | 310 | | | | — | | Proceeds from disposals of non-current investments | | | 5,691 | | | | 1,608 | | | | 2,525 | | Repayment of non-current loans | | | 873 | | | | 864 | | | | 418 | | Total divestments | | | 8,578 | | | | 4,316 | | | | 3,081 | | Cash flow used in investing activities | | | (15,963 | ) | | | (11,957 | ) | | | (10,268 | ) | CASH FLOW USED IN FINANCING ACTIVITIES | | | | | | | | | | | | | Issuance (repayment) of shares: | | | | | | | | | | | | | — Parent company shareholders | | | 481 | | | | 41 | | | | 41 | | — Treasury shares | | | — | | | | 49 | | | | 22 | | Dividends paid: | | | | | | | | | | | | | — Parent company shareholders | | | (5,140 | ) | | | (5,098 | ) | | | (5,086 | ) | — Non-controlling interests | | | (172 | ) | | | (152 | ) | | | (189 | ) | Other transactions with non-controlling interests | | | (573 | ) | | | (429 | ) | | | — | | Net issuance (repayment) of non-current debt | | | 4,069 | | | | 3,789 | | | | 5,522 | | Increase (decrease) in current borrowings | | | (3,870 | ) | | | (731 | ) | | | (3,124 | ) | Increase (decrease) in current financial assets and liabilities | | | 896 | | | | (817 | ) | | | (54 | ) | Cash flow used in financing activities | | | (4,309 | ) | | | (3,348 | ) | | | (2,868 | ) | Net increase (decrease) in cash and cash equivalents | | | (736 | ) | | | 3,188 | | | | (776 | ) | Effect of exchange rates | | | 272 | | | | (361 | ) | | | 117 | | Cash and cash equivalents at the beginning of the period | | | 14,489 | | | | 11,662 | | | | 12,321 | | Cash and cash equivalents at the end of the period | | | 14,025 | | | | 14,489 | | | | 11,662 | |
CONSOLIDATED STATEMENT OF CHANGES IN SHAREHOLDERS’ EQUITY | | | | | | | | | | | | | | | | | | | | | | | | | | | | | | | | | | | | | | | | | | | | | | | | Paid-in
| | | | | | | | | | | | | | | | | | | | | | | | | | | | | | | | | surplus
| | | | | | | | | | | | | | | | | | | | | | | | | | | | | | | | | and
| | | | Currency
| | | | | | | | | | Shareholders’
| | | | | | | Total
| | | | | Common shares issued | | | retained
| | | | translation
| | | Treasury shares | | | equity-
| | | Minority
| | | | shareholders’
| | (M€) | | | Number | | | | Amount | | | earnings | | | | adjustment | | | Number | | | | Amount | | | Group share | | | interests | | | | equity | As of January 1, 2008 | | | | 2,395,532,097 | | | | 5,989 | | | | 48,797 | | | | (4,396) | | | | (151,421,232 | ) | | | (5,532) | | | 44,858 | | | | 842 | | | | 45,700 | | | | Net income 2008 | | | | — | | | | — | | | | 10,590 | | | | — | | | | — | | | | — | | | 10,590 | | | | 363 | | | | 10,953 | | Other comprehensive income (Note 17) | | | | — | | | | — | | | | (258 | ) | | | (480) | | | | — | | | | — | | | (738) | | | | (34 | ) | | | (772) | | | Comprehensive income | | | | — | | | | — | | | | 10,332 | | | | (480) | | | | — | | | | — | | | 9,852 | | | | 329 | | | | 10,181 | | | | Dividend | | | | — | | | | — | | | | (4,945 | ) | | | — | | | | — | | | | — | | | (4,945) | | | | (213 | ) | | | (5,158) | | Issuance of common shares (Note 17) | | | | 6,275,977 | | | | 16 | | | | 246 | | | | — | | | | — | | | | — | | | 262 | | | | — | | | | 262 | | Purchase of treasury shares | | | | — | | | | — | | | | — | | | | — | | | | (27,600,000 | ) | | | (1,339) | | | (1,339) | | | | — | | | | (1,339) | Sale of treasury shares(a) | | | | — | | | | — | | | | (71 | ) | | | — | | | | 5,939,137 | | | | 221 | | | 150 | | | | — | | | | 150 | | Share-based payments (Note 25) | | | | — | | | | — | | | | 154 | | | | — | | | | | | | | | | | 154 | | | | — | | | | 154 | | Other operations with minority interests | | | | — | | | | — | | | | — | | | | — | | | | | | | | | | | — | | | | — | | | | — | | | Share cancellation(Note 17) | | | | (30,000,000 | ) | | | (75) | | | | (1,566 | ) | | | — | | | | 30,000,000 | | | | 1,641 | | | — | | | | — | | | | — | | | Transactions with shareholders | | | | (23,724,023 | ) | | | (59) | | | | (6,182 | ) | | | — | | | | 8,339,137 | | | | 523 | | | (5,718) | | | | (213 | ) | | | (5,931) | | | As of December 31, 2008 | | | | 2,371,808,074 | | | | 5,930 | | | | 52,947 | | | | (4,876) | | | | (143,082,095 | ) | | | (5,009) | | | 48,992 | | | | 958 | | | | 49,950 | | | | Net income 2009 | | | | — | | | | — | | | | 8,447 | | | | — | | | | — | | | | — | | | 8,447 | | | | 182 | | | | 8,629 | | Other comprehensive income (Note 17) | | | | — | | | | — | | | | 246 | | | | (193) | | | | — | | | | — | | | 53 | | | | 60 | | | | 113 | | | Comprehensive income | | | | — | | | | — | | | | 8,693 | | | | (193) | | | | — | | | | — | | | 8,500 | | | | 242 | | | | 8,742 | | | | Dividend | | | | — | | | | — | | | | (5,086 | ) | | | — | | | | — | | | | — | | | (5,086) | | | | (189 | ) | | | (5,275) | | Issuance of common shares (Note 17) | | | | 1,414,810 | | | | 3 | | | | 38 | | | | — | | | | — | | | | — | | | 41 | | | | — | | | | 41 | | Purchase of treasury shares | | | | — | | | | — | | | | — | | | | — | | | | — | | | | — | | | — | | | | — | | | | — | Sale of treasury shares(a) | | | | — | | | | — | | | | (143 | ) | | | — | | | | 2,874,905 | | | | 165 | | | 22 | | | | — | | | | 22 | | Share-based payments (Note 25) | | | | — | | | | — | | | | 106 | | | | — | | | | — | | | | — | | | 106 | | | | — | | | | 106 | | Other operations with minority interests | | | | — | | | | — | | | | (23 | ) | | | — | | | | — | | | | — | | | (23) | | | | (24 | ) | | | (47) | | | Share cancellation(Note 17) | | | | (24,800,000 | ) | | | (62) | | | | (1,160 | ) | | | — | | | | 24,800,000 | | | | 1,222 | | | — | | | | — | | | | — | | | Transactions with shareholders | | | | (23,385,190 | ) | | | (59) | | | | (6,268 | ) | | | — | | | | 27,674,905 | | | | 1,387 | | | (4,940) | | | | (213 | ) | | | (5,153) | | | As of December 31, 2009 | | | | 2,348,422,884 | | | | 5,871 | | | | 55,372 | | | | (5,069) | | | | (115,407,190 | ) | | | (3,622) | | | 52,552 | | | | 987 | | | | 53,539 | | | | Net income 2010 | | | | — | | | | — | | | | 10,571 | | | | — | | | | — | | | | — | | | 10,571 | | | | 236 | | | | 10,807 | | Other comprehensive income (Note 17) | | | | — | | | | — | | | | (216 | ) | | | 2,581 | | | | — | | | | — | | | 2,365 | | | | 9 | | | | 2,374 | | | Comprehensive income | | | | — | | | | — | | | | 10,355 | | | | 2,581 | | | | — | | | | — | | | 12,936 | | | | 245 | | | | 13,181 | | | | Dividend | | | | — | | | | — | | | | (5,098 | ) | | | — | | | | — | | | | — | | | (5,098) | | | | (152 | ) | | | (5,250) | | Issuance of common shares (Note 17) | | | | 1,218,047 | | | | 3 | | | | 38 | | | | — | | | | — | | | | — | | | 41 | | | | — | | | | 41 | | Purchase of treasury shares | | | | — | | | | — | | | | — | | | | — | | | | — | | | | — | | | — | | | | — | | | | — | Sale of treasury shares(a) | | | | — | | | | — | | | | (70 | ) | | | — | | | | 2,919,511 | | | | 119 | | | 49 | | | | — | | | | 49 | | Share-based payments (Note 25) | | | | — | | | | — | | | | 140 | | | | — | | | | — | | | | — | | | 140 | | | | — | | | | 140 | | Other operations with minority interests | | | | — | | | | — | | | | (199 | ) | | | (7) | | | | — | | | | — | | | (206) | | | | (223 | ) | | | (429) | | | Share cancellation(Note 17) | | | | — | | | | — | | | | — | | | | — | | | | — | | | | — | | | — | | | | — | | | | — | | | Transactions with shareholders | | | | 1,218,047 | | | | 3 | | | | (5,189 | ) | | | (7) | | | | 2,919,511 | | | | 119 | | | (5,074) | | | | (375 | ) | | | (5,449) | | | As of December 31, 2010 | | | | 2,349,640,931 | | | | 5,874 | | | | 60,538 | | | | (2,495) | | | | (112,487,679 | ) | | | (3,503) | | | 60,414 | | | | 857 | | | | 61,271 | | |
| | | | | | | | | | | | | | | | | | | | | | | | | | | | | | | | | | | | | | | | Common shares
issued | | | Paid-in surplus
and retained
earnings | | | Currency
translation
adjustment | | | Treasury shares | | | Shareholders’
equity - Group
share | | | Non-controlling
interests | | | Total
shareholders’
equity | | | (M€) | | Number | | | Amount | | | | | Number | | | Amount | | | | | As of Janurary 1, 2009 | | | 2,371,808,074 | | | | 5,930 | | | | 52,947 | | | | (4,876 | ) | | | (143,082,095 | ) | | | (5,009 | ) | | | 48,992 | | | | 958 | | | | 49,950 | | Net income 2009 | | | — | | | | — | | | | 8,447 | | | | — | | | | — | | | | — | | | | 8,447 | | | | 182 | | | | 8,629 | | Other comprehensive income (Note 17) | | | — | | | | — | | | | 246 | | | | (193 | ) | | | — | | | | — | | | | 53 | | | | 60 | | | | 113 | | Comprehensive income | | | — | | | | — | | | | 8,693 | | | | (193 | ) | | | — | | | | — | | | | 8,500 | | | | 242 | | | | 8,742 | | Dividend | | | — | | | | — | | | | (5,086 | ) | | | — | | | | — | | | | — | | | | (5,086 | ) | | | (189 | ) | | | (5,275 | ) | Issuance of common shares (Note 17) | | | 1,414,810 | | | | 3 | | | | 38 | | | | — | | | | — | | | | — | | | | 41 | | | | — | | | | 41 | | Purchase of treasury shares | | | — | | | | — | | | | — | | | | — | | | | — | | | | — | | | | — | | | | — | | | | — | | Sale of treasury shares(a) | | | — | | | | — | | | | (143 | ) | | | — | | | | 2,874,905 | | | | 165 | | | | 22 | | | | — | | | | 22 | | Share-based payments (Note 25) | | | — | | | | — | | | | 106 | | | | — | | | | — | | | | — | | | | 106 | | | | — | | | | 106 | | Share cancellation (Note 17) | | | (24,800,000 | ) | | | (62 | ) | | | (1,160 | ) | | | — | | | | 24,800,000 | | | | 1,222 | | | | — | | | | — | | | | — | | Other operations with non-controlling interests | | | — | | | | — | | | | (23 | ) | | | — | | | | — | | | | — | | | | (23 | ) | | | (24 | ) | | | (47 | ) | Other items | | | — | | | | — | | | | — | | | | — | | | | — | | | | — | | | | — | | | | — | | | | — | | As of December 31, 2009 | | | 2,348,422,884 | | | | 5,871 | | | | 55,372 | | | | (5,069 | ) | | | (115,407,190 | ) | | | (3,622 | ) | | | 52,552 | | | | 987 | | | | 53,539 | | Net income 2010 | | | — | | | | — | | | | 10,571 | | | | — | | | | — | | | | — | | | | 10,571 | | | | 236 | | | | 10,807 | | Other comprehensive income (Note 17) | | | — | | | | — | | | | (216 | ) | | | 2,581 | | | | — | | | | — | | | | 2,365 | | | | 9 | | | | 2,374 | | Comprehensive income | | | — | | | | — | | | | 10,355 | | | | 2,581 | | | | — | | | | — | | | | 12,936 | | | | 245 | | | | 13,181 | | Dividend | | | — | | | | — | | | | (5,098 | ) | | | — | | | | — | | | | — | | | | (5,098 | ) | | | (152 | ) | | | (5,250 | ) | Issuance of common shares (Note 17) | | | 1,218,047 | | | | 3 | | | | 38 | | | | — | | | | — | | | | — | | | | 41 | | | | — | | | | 41 | | Purchase of treasury shares | | | — | | | | — | | | | — | | | | — | | | | — | | | | — | | | | — | | | | — | | | | — | | Sale of treasury shares(a) | | | — | | | | — | | | | (70 | ) | | | — | | | | 2,919,511 | | | | 119 | | | | 49 | | | | — | | | | 49 | | Share-based payments (Note 25) | | | — | | | | — | | | | 140 | | | | — | | | | — | | | | — | | | | 140 | | | | — | | | | 140 | | Share cancellation (Note 17) | | | — | | | | — | | | | — | | | | — | | | | — | | | | — | | | | — | | | | — | | | | — | | Other operations with non-controlling interests | | | — | | | | — | | | | (199 | ) | | | (7 | ) | | | — | | | | — | | | | (206 | ) | | | (223 | ) | | | (429 | ) | Other items | | | — | | | | — | | | | — | | | | — | | | | — | | | | — | | | | — | | | | — | | | | — | | As of December 31, 2010 | | | 2,349,640,931 | | | | 5,874 | | | | 60,538 | | | | (2,495 | ) | | | (112,487,679 | ) | | | (3,503 | ) | | | 60,414 | | | | 857 | | | | 61,271 | | Net income 2011 | | | — | | | | — | | | | 12,276 | | | | — | | | | — | | | | — | | | | 12,276 | | | | 305 | | | | 12,581 | | Other comprehensive income (Note 17) | | | — | | | | — | | | | 231 | | | | 1,404 | | | | — | | | | — | | | | 1,635 | | | | 44 | | | | 1,679 | | Comprehensive income | | | — | | | | — | | | | 12,507 | | | | 1,404 | | | | — | | | | — | | | | 13,911 | | | | 349 | | | | 14,260 | | Dividend | | | — | | | | — | | | | (6,457 | ) | | | — | | | | — | | | | — | | | | (6,457 | ) | | | (172 | ) | | | (6,629 | ) | Issuance of common shares (Note 17) | | | 14,126,382 | | | | 35 | | | | 446 | | | | — | | | | — | | | | — | | | | 481 | | | | — | | | | 481 | | Purchase of treasury shares | | | — | | | | — | | | | — | | | | — | | | | — | | | | — | | | | — | | | | — | | | | — | | Sale of treasury shares(a) | | | — | | | | — | | | | (113 | ) | | | — | | | | 2,933,506 | | | | 113 | | | | — | | | | — | | | | — | | Share-based payments (Note 25) | | | — | | | | — | | | | 161 | | | | — | | | | — | | | | — | | | | 161 | | | | — | | | | 161 | | Share cancellation (Note 17) | | | — | | | | — | | | | — | | | | — | | | | — | | | | — | | | | — | | | | — | | | | — | | Other operations with non-controlling interests | | | — | | | | — | | | | (553 | ) | | | 103 | | | | — | | | | — | | | | (450 | ) | | | (123 | ) | | | (573 | ) | Other items | | | — | | | | — | | | | (23 | ) | | | — | | | | — | | | | — | | | | (23 | ) | | | 441 | | | | 418 | | As of December 31, 2011 | | | 2,363,767,313 | | | | 5,909 | | | | 66,506 | | | | (988 | ) | | | (109,554,173 | ) | | | (3,390 | ) | | | 68,037 | | | | 1,352 | | | | 69,389 | |
| (a) | | | (a) | | Treasury shares related to the stock option purchase plans and restricted stock grants. |
F-7
TOTAL NOTES TO THE CONSOLIDATED FINANCIAL STATEMENTS
On February 10, 2011,9, 2012, the Board of Directors established and authorized the publication of the Consolidated Financial Statements of TOTAL S.A. for the year ended December 31, 2010,2011, which will be submitted for approval to the shareholders’ meeting to be held on May 13, 2011. The Consolidated Financial Statements of TOTAL S.A. and its subsidiaries (the Group) are presented in Euros and have been prepared on the basis of IFRS (International Financial Reporting Standards) as adopted by the European Union and IFRS as issued by the IASB (International Accounting Standard Board) as of December 31, 2010. 2011.The accounting principles applied in the Consolidated Financial Statements as of December 31, 20102011 were the same as those that were used as of December 31, 20092010 except for amendments and interpretations of IFRS which were mandatory for the periods beginning after January 1, 20102011 (and not early adopted). Their adoption has no material impact on the Consolidated Financial Statements as of December 31, 2010. Among these new standards or interpretations effective for annual periods beginning on or after January 1, 2010, the revised versions of IFRS 3 “Business Combinations” and IAS 27 “Consolidated and Separate Financial Statements” should be noted. These revised standards introduce new provisions regarding the accounting for business combinations. Their application is prospective.
In addition, as of January 1, 2010, jointly-controlled entities are consolidated under the equity method, as provided for in the alternative method of IAS 31 “Interests in Joint Ventures”. Until December 31, 2009, these entities were consolidated under the proportionate consolidation method. This change involves two entities and is not material (see Note 12 to the Consolidated Financial Statements).
2011.The preparation of financial statements in accordance with IFRS requires the management to make estimates and assumptions that affect the reported amounts of assets, liabilities and contingent liabilities at the date of preparation of the financial statements and reported income and expenses for the period. The management reviews these estimates and assumptions on an ongoing basis, by reference to past experience and various other factors considered as reasonable which form the basis for assessing the carrying amount of assets and liabilities. Actual results may differ significantly from these estimates, if different assumptions or circumstances apply. These judgments and estimates relate principally to the application of the successful efforts method for the oil and gas accounting, the valuation of long-lived assets, the provisions for asset retirement obligations and environmental remediation, the pensions and post-retirements benefits and the income tax computation. Furthermore, where the accounting treatment of a specific transaction is not addressed by any accounting standard or interpretation, the management applies its judgment to define and apply accounting policies that will lead to relevant and reliable information, so that the financial statements: give a true and fair view of the Group’s financial position, financial performance and cash flows; reflect the substance of transactions; | | • | give a true and fair view of the Group’s financial position, financial performance and cash flows; | • | reflect the substance of transactions; | • | are neutral; | • | are prepared on a prudent basis; and | • | are complete in all material aspects. |
are prepared on a prudent basis; and are complete in all material aspects. 1)ACCOUNTING POLICIES Pursuant to the accrual basis of accounting followed by the Group, the financial statements reflect the effects of transactions and other events when they occur. Assets and liabilities such as property, plant and equipment and intangible assets are usually measured at amortized cost. Financial assetsAssets and liabilities are usually measured at fair value. value when required by the standards.Accounting policies used by the Group are described below: | A) | | A) | PRINCIPLES OF CONSOLIDATION |
Subsidiaries that are directly controlled by the parent company or indirectly controlled by other consolidated subsidiaries are fully consolidated. Investments in jointly-controlled entities are consolidated under the equity method. The Group accounts for jointly-controlled operations and jointly-controlled assets by recognising its share of assets, liabilities, income and expenses.
F-8
Investments in associates, in which the Group has significant influence, are accounted for by the equity method. Significant influence is presumed when the Group holds, directly or indirectly (e.g. through subsidiaries), 20% or more of the voting rights. Companies in which ownership interest is less than 20%, but over which the Company is deemed to exercise significant influence, are also accounted for by the equity method. All significant intercompany balances, transactions and income are eliminated. | B) | | B) | BUSINESS COMBINATIONS |
Business combinations are accounted for using the acquisition method. This method implies the recognition of the acquired identifiable assets, assumed liabilities and any minority interestnon-controlling interests in the companies acquired by the Group at their fair value. The acquirer shall recognize goodwill at the acquisition date, being the excess of: The consideration transferred, the amount of non-controlling interests and, in business combinations achieved in stages, the fair value at the acquisition date of the investment previously held in the acquired company; Over the fair value at the acquisition date of acquired identifiable assets and assumed liabilities. | | • | The consideration transferred, the amount of minority interest and, in business combinations achieved in stages, the fair value at the acquisition date of the investment previously held in the acquired company | • | Over the fair value at the acquisition date of acquired identifiable assets and assumed liabilities. |
If the consideration transferred is lower than the fair value of acquired identifiable assets and assumed liabilities, an additional analysis is performed on the identification and valuation of the identifiable elements of the assets and liabilities. Any residual badwill is recorded as income. In transactions with minoritynon-controlling interests, the difference between the price paid (received) and the book value of minoritynon-controlling interests acquired (sold) is recognized directly in equity. The analysis of goodwillpurchase price allocation is finalized within one year from the acquisition date. Non-monetary contributions by venturers to a jointly-controlled entity in exchange for an equity interest in the jointly-controlled entity are accounted for by applying guidance provided in SIC 13 “Jointly Controlled Entities — Non-Monetary Contributions by Venturers”. A gain or loss on disposal of the previously held investment is recorded up to the share of the co-venturer in the jointly controlled entity. | C) | | C) | FOREIGN CURRENCY TRANSLATION |
The financial statements of subsidiaries are prepared in the currency that most clearly reflects their business environment. This is referred to as their functional currency. | (i) | | (i) | Monetary transactions |
Transactions denominated in foreign currencies other than the functional currency of the entity are translated at the exchange rate on the transaction date. At each balance sheet date, monetary assets and liabilities are translated at the closing rate and the resulting exchange differences are recognized in “Other income” or “Other expenses”.the statement of income. | (ii) | | (ii) | Translation of financial statements denominated in foreign currencies |
Assets and liabilities of foreign entities are translated into euros on the basis of the exchange rates at the end of the period. The income and cash flow statements are translated using the average exchange rates for the period. Foreign exchange differences resulting from such translations are either recorded in shareholders’ equity under “Currency translation adjustments” (for the Group share) or under “Minority“Non-controlling interests” (for the minority share)share of non-controlling interests) as deemed appropriate. | D) | | D) | SALES AND REVENUES FROM SALES |
Revenues from sales are recognized when the significant risks and rewards of ownership have been passed to the buyer and when the amount is recoverable and can be reasonably measured. Sales figures include excise taxes collected by the Group within the course of its oil distribution operations. Excise taxes are deducted from sales in order to obtain the “Revenues from sales” indicator. Revenues from sales are recognized when the significant risks and rewards of ownership have been passed to the buyer and when the amount is recoverable and can be reasonably measured. Revenues from sales of crude oil, natural gas and coal are recorded upon transfer of title, according to the terms of the sales contracts. Revenues from the production of crude oil and natural gas properties, in which the Group has an interest with other producers, are recognized based on actual volumes sold during the period. Any difference between volumes sold and entitlement volumes, based on the Group net working interest, is recognized as “Crude oil and natural gas inventories” or “Accounts receivable, net”“Other current assets” or “Accounts payable”“Other creditors and accrued liabilities”, as appropriate. Quantities delivered that represent production royalties and taxes, when paid in cash, are included in oil and gas sales, except for the United States and Canada. Certain transactions within the trading activities (contracts involving quantities that are purchased to third parties then resold to third parties) are shown at their net value in sales. Exchanges of crude oil and petroleum products within normal trading activities do not generate any income and therefore these flows are shown at their net value in both the statement of income and the balance sheet. Revenues from services are recognized when the services have been rendered. Revenues from gas transport are recognized when services are rendered. These revenues are based on the quantities transported and measured according to procedures defined in each service contract. Revenues from sales of electricity are recorded upon transfer of ownership, according to the terms of the related contracts.
Revenues from services are recognized when the services have been rendered.
F-9
Shipping revenues and expenses from time-charter activities are recognized on a pro rata basis over a period that commences upon the unloading of the previous voyage and terminates upon the unloading of the current voyage. Shipping revenue recognition starts only when a charter has been agreed to by both the Group and the customer. Oil and gas sales are inclusive of quantities delivered that represent production royalties and taxes, when paid in cash, and outside the United States and Canada.
Certain transactions within the trading activities (contracts involving quantities that are purchased to third parties then resold to third parties) are shown at their net value in sales.
Exchanges of crude oil and petroleum products within normal trading activities do not generate any income and therefore these flows are shown at their net value in both the statement of income and the balance sheet.
| E) | | E) | SHARE-BASED PAYMENTS |
The Group may grant employees stock options, create employee share purchase plans and offer its employees the opportunity to subscribe to reserved capital increases. These employee benefits are recognized as expenses with a corresponding credit to shareholders’ equity. The expense is equal to the fair value of the instruments granted. The fair value of the options is calculated using the Black-Scholes model at the grant date. The expense is recognized on a straight-line basis between the grant date and vesting date. For restricted share plans, the expense is calculated using the market price at the grant date after deducting the expected distribution rate during the vesting period. The cost of employee-reserved capital increases is immediately expensed. A discount reduces the expense in order to account for the nontransferability of the shares awarded to the employees over a period of five years. Income taxes disclosed in the statement of income include the current tax expenses and the deferred tax expenses. The Group uses the liability method whereby deferred income taxes are recorded based on the temporary differences between the carrying amounts of assets and liabilities recorded in the balance sheet and their tax bases, and on carry-forwards of unused tax losses and tax credits. Deferred tax assets and liabilities are measured using the tax rates that have been enacted or substantially enacted at the balance sheet date. The tax rates used depend on the timing of reversals of temporary differences, tax losses and other tax credits. The effect of a change in tax rate is recognized either in the Consolidated Statement of Income or in shareholders’ equity depending on the item it relates to. Deferred tax assets are recognized when future recovery is probable. Asset retirement obligations and finance leases give rise to the recognition of assets and liabilities for accounting purposes as described in paragraph K “Leases” and paragraph Q “Asset retirement obligations” of this Note. Deferred income taxes resulting from temporary differences between the carrying amounts and tax bases of such assets and liabilities are recognized. Deferred tax liabilities resulting from temporary differences between the carrying amounts of equity-method investments and their tax bases are recognized. The deferred tax calculation is based on the expected future tax effect (dividend distribution rate or tax rate on the gain or loss upon disposal of these investments). Earnings per share is calculated by dividing net income (Group share) by the weighted-average number of common shares outstanding during the period, excluding TOTAL shares held by TOTAL S.A. (Treasury shares) and TOTAL shares held by the Group subsidiaries which are deducted from consolidated shareholders’ equity. Diluted earnings per share is calculated by dividing net income (Group share) by the fully-diluted weighted-average number of common shares outstanding during the period. Treasury shares held by the parent company, TOTAL S.A., and TOTAL shares held by the Group subsidiaries are deducted from consolidated shareholders’ equity. These shares are not considered outstanding for purposes of this calculation which also takes into account the dilutive effect of stock options, restricted share grants and capital increases with a subscription period closing after the end of the fiscal year. The weighted-average number of fully-diluted shares is calculated in accordance with the treasury stock method provided for by IAS 33. The proceeds, which would be recovered in the event of an exercise of rights related to dilutive instruments, are presumed to be a share buyback at the average market price over the period. The number of shares thereby obtained leads to a reduction in the total number of shares that would result from the exercise of rights.
F-10
H) OIL AND GAS EXPLORATION AND PRODUCING PROPERTIES AND MINING ACTIVITY The Group applies IFRS 6 “Exploration for and Evaluation of Mineral Resources”. Oil and gas exploration and production properties and assets are accounted for in accordance with the successful efforts method. Geological and geophysical costs, including seismic surveys for exploration purposes are expensed as incurred. Mineral interests are capitalized as intangible assets when acquired. These acquired interests are tested for impairment on a regular basis,property-by-property, based on the results of the exploratory activity and the management’s evaluation. In the event of a discovery, the unproved mineral interests are transferred to proved mineral interests at their net book value as soon as proved reserves are booked. Exploratory wells are tested for impairment on awell-by-well basis and accounted for as follows: Costs of exploratory wells which result in proved reserves are capitalized and then depreciated using the unit-of-production method based on proved developed reserves; Costs of dry exploratory wells and wells that have not found proved reserves are charged to expense; | | • | Costs of exploratory wells which result in proved reserves are capitalized and then depreciated using theunit-of-production method based on proved developed reserves; | • | Costs of dry exploratory wells and wells that have not found proved reserves are charged to expense; | • | Costs of exploratory wells are temporarily capitalized until a determination is made as to whether the well has found proved reserves if both of the following conditions are met: |
| | | | • | The well has found a sufficient quantity of reserves to justify its completion as a producing well, if appropriate, assuming that the required capital expenditures are made; | | • | The Group is making sufficient progress assessing the reserves and the economic and operating viability of the project. This progress is evaluated on the basis of indicators such as whether additional exploratory works are under way or firmly planned (wells, seismic or significant studies), whether costs are being incurred for development studies and whether the Group is waiting for governmental or other third-party authorization of a proposed project, or availability of capacity on an existing transport or processing facility. |
Costs of exploratory wells are temporarily capitalized until a determination is made as to whether the well has found proved reserves if both of the following conditions are met: The well has found a sufficient quantity of reserves to justify its completion as a producing well, if appropriate, assuming that the required capital expenditures are made; The Group is making sufficient progress assessing the reserves and the economic and operating viability of the project. This progress is evaluated on the basis of indicators such as whether additional exploratory works are under way or firmly planned (wells, seismic or significant studies), whether costs are being incurred for development studies and whether the Group is waiting for governmental or other third-party authorization of a proposed project, or availability of capacity on an existing transport or processing facility. Costs of exploratory wells not meeting these conditions are charged to expense. | (ii) | | (ii) | Oil and Gas producing assets |
Development costs incurred for the drilling of development wells and for the construction of production facilities are capitalized, together with borrowing costs incurred during the period of construction and the present value of estimated future costs of asset retirement obligations. The depletion rate is usually equal to the ratio of oil and gas production for the period to proved developed reserves(unit-of-production (unit-of-production method). With respect to production sharing contracts, this computation is based on the portion of production and reserves assigned to the Group taking into account estimates based on the contractual clauses regarding the reimbursement of exploration, development and production costs (cost oil) as well as the sharing of hydrocarbon rights (profit oil). Transportation assets are depreciated using theunit-of-production method based on throughput or by using the straight-line method whichever best reflects the economic life of the asset. Proved mineral interests are depreciated using theunit-of-production method based on proved reserves. | (iii) | | (iii) | Mining activity |
Before an assessment can be made on the existence of resources, exploration costs, including studies and core drilling campaigns as a whole, are expensed. When the assessment concludes that resources exist, the costs engaged subsequently to this assessment are capitalized temporarily while waiting for the field final development decision, if a positive decision is highly probable. Otherwise, these costs are expensed. Once the development decision is taken, the predevelopment costs capitalized temporarily are integrated with the cost of development and depreciated from the start of production at the same pace than development assets. Mining development costs include the initial stripping costs and all costs incurred to access resources, and particularly the costs of: Machinery and mobile equipment which are significantly costly; | | • | Surface infrastructures; | • | Machinery and mobile equipment which are significantly costly; | • | Utilities and off-sites. |
These costs are capitalized and depreciated either on a straight line basis or depleted using the UOP method from the start of production.
F-11
I) GOODWILL AND OTHER INTANGIBLE ASSETS EXCLUDING MINERAL INTERESTS Other intangible assets include goodwill, patents, trademarks, and lease rights. Intangible assets are carried at cost, after deducting any accumulated depreciation and accumulated impairment losses. Guidance for calculating goodwill is presented in Note 1 paragraph B to the Consolidated Financial Statements. Goodwill is not amortized but is tested for impairment annually or as soon as there is any indication of impairment (see Note 1 paragraph L to the Consolidated Financial Statements). In equity affiliates, goodwill is included in the investment book value. Other intangible assets (except goodwill) have a finite useful life and are amortized on a straight-line basis over 3 to 20 years depending on the useful life of the assets. Research costs are charged to expense as incurred. Development expenses are capitalized when the following can be demonstrated: the technical feasibility of the project and the availability of the adequate resources for the completion of the intangible asset; the ability of the asset to generate probable future economic benefits; | | • | the technical feasibility of the project and the availability of the adequate resources for the completion of the intangible asset; | • | the ability of the asset to generate probable future economic benefits; | • | the ability to measure reliably the expenditures attributable to the asset; and | • | the feasibility and intention of the Group to complete the intangible asset and use or sell it. |
the ability to measure reliably the expenditures attributable to the asset; and the feasibility and intention of the Group to complete the intangible asset and use or sell it. Advertising costs are charged to expense as incurred. J) OTHER PROPERTY, PLANT AND EQUIPMENT
| J) | | OTHER PROPERTY, PLANT AND EQUIPMENT |
Other property, plant and equipment are carried at cost, after deducting any accumulated depreciation and accumulated impairment losses. This cost includes borrowing costs directly attributable to the acquisition or production of a qualifying asset incurred until assets are placed in service. Borrowing costs are capitalized as follows: if the project benefits from a specific funding, the capitalization of borrowing costs is based on the borrowing rate; if the project is financed by all the Group’s debt, the capitalization of borrowing costs is based on the weighted average borrowing cost for the period. | | • | if the project benefits from a specific funding, the capitalization of borrowing costs is based on the borrowing rate; | • | if the project is financed by all the Group’s debt, the capitalization of borrowing costs is based on the weighted average borrowing cost for the period. |
Routine maintenance and repairs are charged to expense as incurred. The costs of major turnarounds of refineries and large petrochemical units are capitalized as incurred and depreciated over the period of time between two consecutive major turnarounds. Other property, plant and equipment are depreciated using the straight-line method over their useful lives, which are as follows: | | | | | | | Furniture, office equipment, machinery and tools | | | 3-12 years | | • | | Transportation equipments | | | 5-20 years | | | | Storage tanks and related equipment | | | 10-15 years | | | | Specialized complex installations and pipelines | | | 10-30 years | | | Buildings | | Buildings | | 10-50 years | |
A finance lease transfers substantially all the risks and rewards incidental to ownership from the lessor to the lessee. These contracts are capitalized as assets at fair value or, if lower, at the present value of the minimum lease payments according to the contract. A corresponding financial debt is recognized as a financial liability. These assets are depreciated over the corresponding useful life used by the Group. Leases that are not finance leases as defined above are recorded as operating leases. Certain arrangements do not take the legal form of a lease but convey the right to use an asset or a group of assets in return for fixed payments. Such arrangements are accounted for as leases and are analyzed to determine whether they should be classified as operating leases or as finance leases. | L) | | L) | IMPAIRMENT OF LONG-LIVED ASSETS |
The recoverable amounts of intangible assets and property, plant and equipment are tested for impairment as soon as any indication of impairment exists. This test is performed at least annually for goodwill. The recoverable amount is the higher of the fair value (less costs to sell) or its value in use. Assets are grouped into cash-generating units (or CGUs) and tested. A cash-generating unit is a homogeneous group of assets that generates cash inflows that are largely independent of the cash inflows from other groups of assets. The value in use of a CGU is determined by reference to the discounted expected future cash flows, based upon the management’s expectation of future economic and operating conditions. IfWhen this value is less than the carrying
F-12
amount of the CGU, an impairment loss on property, plant and equipment and mineral interests, or on other intangible assets,is recorded. It is recognized eitherallocated first to goodwill in counterpart of “Other expenses”. These impairment losses are then allocated to “Depreciation, depletion and amortization of tangible assets and mineral interests” for property, plant and equipmentmineral interests and mineral interests” or into “Other expense”, respectively. This impairment loss is first allocated to reduce the carrying amount of any goodwill. expenses” for other intangible assets.Impairment losses recognized in prior periods can be reversed up to the original carrying amount, had the impairment loss not been recognized. Impairment losses recognized for goodwill cannot be reversed. | M) | | M) | FINANCIAL ASSETS AND LIABILITIES |
Financial assets and liabilities are financial loans and receivables, investments in non-consolidated companies, publicly traded equity securities, derivatives instruments and current and non-current financial liabilities. The accounting treatment of these financial assets and liabilities is as follows: | (i) | | (i) | Loans and Receivablesreceivables |
Financial loans and receivables are recognized at amortized cost. They are tested for impairment, by comparing the carrying amount of the assets to estimates of the discounted future recoverable cash flows. These tests are conducted as soon as there is any evidence that their fair value is less than their carrying amount, and at least annually. Any impairment loss is recorded in the statement of income. | (ii) | | (ii) | Other investments |
These assets are classified as financial assets available for sale and therefore measured at their fair value. For listed securities, this fair value is equal to the market price. For unlisted securities, if the fair value is not reliably determinable, securities are recorded at their historical value. Changes in fair value are recorded in shareholders’ equity. If there is any evidence of a significant or long-lasting impairment loss, a loss is recorded in the Statement of Income. This impairment is reversed in the statement of income only when the securities are sold. | (iii) | | (iii) | Derivative instruments |
The Group uses derivative instruments to manage its exposure to risks of changes in interest rates, foreign exchange rates and commodity prices. Changes in fair value of derivative instruments are recognized in the statement of income or in shareholders’ equity and are recognized in the balance sheet in the accounts corresponding to their nature, according to the risk management strategy described in Note 31 to the Consolidated Financial Statements. The derivative instruments used by the Group are the following: Financial instruments used for cash management purposes are part of a hedging strategy of currency and interest rate risks within global limits set by the Group and are considered to be used for transactions (held for trading). Changes in fair value are systematically recorded in the statement of income. The balance sheet value of those instruments is included in “Current financial assets” or “Other current financial liabilities”. When an external long-term financing is set up, specifically to finance subsidiaries, and when this financing involves currency and interest rate derivatives, these instruments are qualified as: | | | | | i. | Fair value hedge of the interest rate risk on the external debt and of the currency risk of the loans to subsidiaries. Changes in fair value of derivatives are recognized in the statement of income as are changes in fair value of underlying financial debts and loans to subsidiaries. |
The fair value of those hedging instruments of long-term financing is included in the assets under “Hedging instruments on non-current financial debt” or in the liabilities under “Non-current financial debt “for the non-current portion. The current portion (less than one year) is accounted for in “Current financial assets” or “Other current financial liabilities”. In case of the anticipated termination of derivative instruments accounted for as fair value hedges, the amount paid or received is recognized in the statement of income and: If this termination is due to an early cancellation of the hedged items, the adjustment previously recorded as revaluation of those hedged items is also recognized in the statement of income; If the hedged items remain in the balance sheet, the adjustment previously recorded as a revaluation of those hedged items is spread over the remaining life of those items. | ii. | Cash flow hedge of the currency risk of the external debt. Changes in fair value are recorded in equity for the effective portion of the hedging and in the statement of income for the ineffective portion of the hedging. Amounts recorded in |
| equity are transferred to the income statement when the hedged transaction affects profit or loss. |
The fair value of those hedging instruments of long-term financing is included in the assets under “Hedging instruments on non-current financial debt” or in the liabilities under “Non-current financial debt” for the non-current portion. The current portion (less than one year) is accounted for in “Current financial assets” or “Other current financial liabilities”. In case of the anticipated termination of derivative instruments accounted for as fair value hedges, the amount paid or received is recognized in the statement of income and:
| | | | • | If this termination is due to an early cancellation of the hedged items, the adjustment previously recorded as revaluation of those hedged items is also recognized in the statement of income; | | | • | If the hedged items remain in the balance sheet, the adjustment previously recorded as a revaluation of those hedged items is spread over the remaining life of those items. |
| | | | ii. | Cash flow hedge of the currency risk of the external debt. Changes in fair value are recorded in equity for the effective portion of the hedging and in the statement of income for the ineffective portion of |
F-13
| | | | | the hedging. Amounts recorded in equity are transferred to the income statement when the hedged transaction affects profit or loss. |
The fair value of those hedging instruments of long-term financing is included in the assets under “Hedging instruments on non-current financial debt” or in the liabilities under “Non-current financial debt” for the non-current portion. The current portion (less than one year) is accounted for in “Current financial assets” or “Other current financial liabilities”.
If the hedging instrument expires, is sold or terminated by anticipation, gains or losses previously recognized in equity remain in equity. Amounts are recycled in the income statement only when the hedged transaction affects profit or loss. | • | | • | Foreign subsidiaries’ equity hedge |
Certain financial instruments hedge against risks related to the equity of foreign subsidiaries whose functional currency is not the euro (mainly the dollar). These instruments qualify as “net investment hedges”. Changes in fair value are recorded in shareholders’ equity. The fair value of these instruments is recorded under “Current financial assets” or “Other current financial liabilities”. | • | | • | Financial instruments related to commodity
contracts |
Financial instruments related to commodity contracts, including crude oil, petroleum products, gas, power and coal purchase/sales contracts within the trading activities, together with the commodity contract derivative instruments such as energy contracts and forward freight agreements, are used to adjust the Group’s exposure to price fluctuations within global trading limits. These instruments are considered, accordingAccording to the industry practice, these instruments are considered as held for trading.trading. Changes in fair value are recorded in the statement of income. The fair value of these instruments is recorded in “Other current assets” or “Other creditors and accrued liabilities” depending on whether they are assets or liabilities. Detailed information about derivatives positions is disclosed in Notes 20, 28, 29, 30 and 31 to the Consolidated Financial Statements. | (iv) | | (iv) | Current and non-current financial liabilities |
Current and non-current financial liabilities (excluding derivatives) are recognized at amortized cost, except those for which a hedge accounting can be applied as described in the previous paragraph. | (v) | | (v) | Fair value of financial instruments |
Fair values are estimated for the majority of the Group’s financial instruments, with the exception of publicly traded equity securities and marketable securities for which the market price is used. Estimated fair values, which are based on principles such as discounting future cash flows to present value, must be weighted by the fact that the value of a financial instrument at a given time may be influenced by the market environment (liquidity especially), and also the fact that subsequent changes in interest rates and exchange rates are not taken into account. As a consequence, the use of different estimates, methodologies and assumptions could have a material effect on the estimated fair value amounts. The methods used are as follows: | • | | • | Financial debts, swaps |
The market value of swaps and of bonds that are hedged by those swaps has been determined on an individual basis by discounting future cash flows with the zero coupon interest rate curves existing at year-end. | • | | • | Financial instruments related to commodity
contracts |
The valuation methodology is to mark to market all open positions for both physical and derivativepaper transactions. The valuations are determined on a daily basis using observable market data based on organized and over the counter (OTC) markets. In particular cases when market data are not directly available, the valuations are derived from observable data such as arbitrages, freight or spreads and market corroboration. For valuation of risks which are the result of a calculation, such as options for example, commonly known models are used to compute the fair value. | • | | • | Other financial instruments |
The fair value of the interest rate swaps and of FRA (Forward Rate Agreement) are calculated by discounting future cash flows on the basis of zero coupon interest rate curves existing at year-end after adjustment for interest accrued but unpaid. Forward exchange contracts and currency swaps are valued on the basis of a comparison of the negociated
F-14
forward rates with the rates in effect on the financial markets at year-end for similar maturities. Exchange options are valued based on the Garman-Kohlhagen model including market quotations at year-end. IFRS 7 “Financial instruments: disclosures”, amended in 2009, introduces a fair value hierarchy for financial instruments and proposes the following three-level classification:classification : level 1: quotations for assets and liabilities (identical to the ones that are being valued) obtained at the valuation date on an active market to which the entity has access; level 2: the entry data are observable data but do not correspond to quotations for identical assets or liabilities; | | | | • | Level 1: quotations for assets and liabilities (identical to the ones that are being valued) obtained at the valuation date on an active market to which the entity has access; | | • | Level 2: the entry data are observable data but do not correspond to quotations for identical assets or liabilities; | | • | Level 3: the entry data are not observable data. For example: these data come from extrapolation. This level applies when there is no market or observable data and the company has to use its own hypotheses to estimate the data that other market players would have used to determine the fair value of the asset. |
level 3: the entry data are not observable data. For example: these data come from extrapolation. This level applies when there is no market or observable data and the company has to use its own hypotheses to estimate the data that other market players would have used to determine the fair value of the asset. Fair value hierarchy is disclosed in Notes 29 and 30 to the Consolidated Financial Statements. | N) | | N) INVENTORIES | INVENTORIES |
Inventories are measured in the Consolidated Financial Statements at the lower of historical cost or market value. Costs for petroleum and petrochemical products are determined according to the FIFO(First-In, (First-In, First-Out) method and other inventories are measured using the weighted-average cost method. Downstream (Refining — Marketing) Petroleum product inventories are mainly comprised of crude oil and refined products. Refined products principally consist of gasoline, kerosene, diesel, fuel oil and heating oil produced by the Group’s refineries. The turnover of petroleum products does not exceed two months on average. Crude oil costs include raw material and receiving costs. Refining costs principally include the crude oil costs, production costs (energy, labor, depreciation of producing assets) and allocation of production overhead (taxes, maintenance, insurance, etc.).Start-up costs and general administrative costs are excluded from the cost price of refined products. Costs of chemical products inventories consist of raw material costs, direct labor costs and an allocation of production overhead.Start-up costs and general administrative costs are excluded from the cost of inventories of chemicals products. O) TREASURY SHARES
Treasury shares of the parent company held by its subsidiaries or itself are deducted from consolidated shareholders’ equity. Gains or losses on sales of treasury shares are excluded from the determination of net income and are recognized in shareholders’ equity. | P) | | P) | PROVISIONS AND OTHER NON-CURRENT LIABILITIES |
Provisions and non-current liabilities are comprised of liabilities for which the amount and the timing are uncertain. They arise from environmental risks, legal and tax risks, litigation and other risks. A provision is recognized when the Group has a present obligation (legal or constructive) as a result of a past event for which it is probable that an outflow of resources will be required and when a reliable estimate can be made regarding the amount of the obligation. The amount of the liability corresponds to the best possible estimate. | Q) | | Q) | ASSET RETIREMENT OBLIGATIONS |
Asset retirement obligations, which result from a legal or constructive obligation, are recognized based on a reasonable estimate in the period in which the obligation arises. The associated asset retirement costs are capitalized as part of the carrying amount of the underlying asset and depreciated over the useful life of this asset. An entity is required to measure changes in the liability for an asset retirement obligation due to the passage of time (accretion) by applying a risk-free discount rate to the amount of the liability. The increase of the provision due to the passage of time is recognized as “Other financial expense”. In accordance with the laws and practices of each country, the Group participates in employee benefit plans offering retirement, death and disability, healthcare and special termination benefits. These plans provide benefits based on various factors such as length of service, salaries, and contributions made to the governmental bodies responsible for the payment of benefits.
F-15
These plans can be either defined contribution or defined benefit pension plans and may be entirely or partially funded with investments made in various non-Group instruments such as mutual funds, insurance contracts, and other instruments. For defined contribution plans, expenses correspond to the contributions paid. Defined benefit obligations are determined according to the Projected Unit Method. Actuarial gains and losses may arise from differences between actuarial valuation and projected commitments (depending on new calculations or assumptions) and between projected and actual return of plan assets. The Group applies the corridor method to amortize its actuarial gains and losses. This method amortizes the net cumulative actuarial gains and losses that exceed 10% of the greater of the present value of the defined benefit obligation and the fair value of plan assets at the opening balance sheet date, over the average expected remaining working lives of the employees participating in the plan. In case of a change in or creation of a plan, the vested portion of the cost of past services is recorded immediately in the statement of income, and the unvested past service cost is amortized over the vesting period. The net periodic pension cost is recognized under “Other operating expenses”. | S) | | S) | CONSOLIDATED STATEMENT OF CASH FLOWS |
The Consolidated Statement of Cash Flows prepared in foreign currencies has been translated into euros using the exchange rate on the transaction date or the average exchange rate for the period. Currency translation differences arising from the translation of monetary assets and liabilities denominated in foreign currency into euros using the closing exchange rates are shown in the Consolidated Statement of Cash Flows under “Effect of exchange rates”. Therefore, the Consolidated Statement of Cash Flows will not agree with the figures derived from the Consolidated Balance Sheet. Cash and cash equivalents Cash and cash equivalents are comprised of cash on hand and highly liquid short-term investments that are easily convertible into known amounts of cash and are subject to insignificant risks of changes in value. Investments with maturity greater than three months and less than twelve months are shown under “Current financial assets”. Changes in current financial assets and liabilities are included in the financing activities section of the Consolidated Statement of Cash Flows. Non-current financial debt Changes in non-current financial debt are presented as the net variation to reflect significant changes mainly related to revolving credit agreements. | T) | | T) | CARBON DIOXIDE EMISSION RIGHTS |
In the absence of a current IFRS standard or interpretation on accounting for emission rights of carbon dioxide, the following principles have beenare applied: Emission rights are managed as a cost of production and as such are recognized in inventories: Emission rights allocated for free are booked in inventories with a nil carrying amount, Purchased emission rights are booked at acquisition cost, Sales or annual restorations of emission rights consist of decreases in inventories recognized based on a weighted average cost, If the carrying amount of inventories at closing date is higher than the market value, an impairment loss is recorded. At each closing, a provision is recorded in order to materialize the obligation of emission rights restoration related to the emissions of the period. This provision is calculated based on estimated emissions of the period, valued at weighted average cost of the inventories at the end of the period. It is reversed when the emission rights are restored. If emission rights to be delivered at the end of the compliance period are higher than emission rights (allocated and purchased) booked in inventories, the shortage is accounted for as a liability at market value. Forward transactions are recognized at their fair market value in the balance sheet. Changes in the fair value of such forward transactions are recognized in the statement of income. | U) | | • | emission rights granted free of charge are accounted for at zero carrying amount; | • | liabilities resulting from potential differences between available quotas and quotas to be delivered at the end of the compliance period are accounted for as liabilities and measured at fair market value; | • | spot market transactions are recognized in income at cost; and | • | forward transactions are recognized at their fair market value on the face of the balance sheet. Changes in the fair value of such forward transactions are recognized in income. |
| | U) | NON-CURRENT ASSETS HELD FOR SALE AND DISCONTINUED OPERATIONS |
Pursuant to IFRS 5 “Non-current assets held for sale and discontinued operations”, assets and liabilities of affiliates that are held for sale are presented separately on the face of the balance sheet. Net income from discontinued operations is presented separately on the face of the statement of income. Therefore, the notes to the Consolidated Financial Statements related to the statement of income only refer to continuing operations. A discontinued operation is a component of the Group for which cash flows are independent. It represents a major line of business or geographical area of operations which has been disposed of or is currently being held for sale. | V) | | V) | ALTERNATIVE IFRS METHODS |
For measuring and recognizing assets and liabilities, the following choices among alternative methods allowable under IFRS have been made: | | • | property, plant and equipment, and intangible assets are measured using historical cost model instead of revaluation model; |
F-16
actuarial gains and losses on pension and other post-employment benefit obligations are recognized according to the corridor method (see Note 1 paragraph R to the Consolidated Financial Statements); jointly-controlled entities are consolidated under the equity method, as provided for in the alternative method of IAS 31 “Interests in joint ventures”. W) NEW ACCOUNTING PRINCIPLES NOT YET IN EFFECT
| | • | actuarial gains and losses on pension and other post-employment benefit obligations are recognized according to the corridor method (see Note 1 paragraph R to the Consolidated Financial Statements); | • | jointly-controlled entities are consolidated under the equity method, as provided for in the alternative method of IAS 31 “Interests in joint ventures”, as from January 1st, 2010. |
| | W) | NEW ACCOUNTING PRINCIPLES NOT YET IN EFFECT |
The standards or interpretations published respectively by the International Accounting Standards Board (IASB) and the International Financial Reporting Interpretations Committee (IFRIC) which were not yet in effect and not adopted by the European Union at December 31, 2010, were2011, are as follows: IFRS 9 “Financial Instruments”
In November 2009, the IASB issued standard IFRS 9 “Financial Instruments” that introduces new requirements for the classification and measurement of financial assets, and included in October 2010 requirements regarding classification and measurement of financial liabilities. This standard shall be completed with texts on impairment and hedge accounting. Under standard IFRS 9, financial assets and liabilities are generally measured either at fair value through profit or loss or at amortised cost if certain conditions are met. The standard isshould be applicable for annual periods starting on or after January 1, 2013.2015. The application of the standard as published in 2010 should not have any material effect on the Group’s consolidated balance sheet, statement of income and shareholder’s equity. RevisedIn May 2011, the IASB issued a package of standards on consolidation : standard IFRS 10 “Consolidated financial statements”, standard IFRS 11 “Joint arrangements”, standard IFRS 12 “Disclosure of interests in other entities”, revised standard IAS 24 “Related Party Disclosures” 27 “Separate financial statements” and revised standard IAS 28 “Investments in associates and joint ventures”. These standards are applicable for annual periods beginning on or after January 1, 2013. The impact of the application of these standards is currently assessed by the Group.In November 2009,June 2011, the IASB issued revised standard IAS 24 “Related Party Disclosures” that clarifies19 “Employee benefits”, which leads in particular to the definitionfull recognition of the net position in respect of employee benefits obligations (liabilities net of assets) in the balance sheet, to the elimination of the corridor approach currently used by the Group and to the obligation to evaluate the expected return on plan assets on a related party and reducesnormative basis (via the disclosure requirements for entities controlled by a government. Thediscount rate used to value the debt). This standard is applicable for annual periods startingbeginning on or after January 1, 2011.2013. The impact of the application of this standard should not have any material impact on information presentedis currently assessed by the Group. In addition, the IASB published in the notes to the Consolidated Financial Statements. IFRIC 19 “Extinguishing Financial Liabilities with Equity Instruments”
In November 2009, the IFRIC issued interpretation IFRIC 19 “Extinguishing Financial Liabilities with Equity Instruments”. The interpretation deals with accounting for debt to equity swaps. It clarifies that equity instruments issued are measured at fairMay 2011 standard IFRS 13 “Fair value and that any difference with the carrying amount of the liability is recognised in profit or loss. The interpretation is effectivemeasurement”, applicable for annual periods startingbeginning on or after January 1, 2013, and in June 2011 revised standard IAS 1 “Presentation of financial statements”, applicable for annual periods beginning on or after July 1, 2010 (i.e. starting January 1, 2011 for the Group).2012. The application of IFRIC 19these standards should not have any material effect on the Group’s consolidated balance sheet, statement of income and shareholder’s equity.
| | 2) | MAIN INDICATORS — INFORMATION BY BUSINESS SEGMENT |
2)MAIN INDICATORS — INFORMATION BY BUSINESS SEGMENT Performance indicators excluding the adjustment items, such as adjusted operating income, adjusted net operating income, and adjusted net income are meant to facilitate the analysis of the financial performance and the comparison of income between periods. The detail of these adjustment items is presented in Note 4 to the Consolidated Financial Statements. Adjustment items include : Due to their unusual nature or particular significance, certain transactions qualified as “special items” are excluded from the business segment figures. In general, special items relate to transactions that are significant, infrequent or unusual. However, in certain instances, transactions such as restructuring costs or assets disposals, which are not considered to be representative of the normal course of business, may be qualified as special items although they may have occurred within prior years or are likely to occur again within the coming years. | (ii) | | (ii) | The inventory valuation effect |
The adjusted results of the Downstream and Chemicals segments are presented according to the replacement cost method. This method is used to assess the segments’ performance and facilitate the comparability of the segments’ performance with those of its competitors. In the replacement cost method, which approximates the LIFO(Last-In, (Last-In, First-Out) method, the variation of inventory values in the statement of income is, depending on the nature of the inventory, determined using either the month-end prices differential between one period and another or the average prices of the period rather than the historical value. The inventory valuation effect is the difference between the results according to the FIFO(First-In, (First-In, First-Out) and the replacement cost.
F-17
| (iii) | Effect of changes in fair value |
As from January 1, 2011, the effect of changes in fair value presented as adjustment item reflects for some transactions differences between internal measure of performance used by TOTAL’s management and the accounting for these transactions under IFRS. IFRS requires that trading inventories be recorded at their fair value using period end spot prices. In order to best reflect the management of economic exposure through derivative transactions, internal indicators used to measure performance include valuations of trading inventories based on forward prices. Furthermore, TOTAL, in its trading activities, enters into storage contracts, which future effects are recorded at fair value in Group’s internal economic performance. IFRS precludes recognition of this fair value effect. (iii) (iv) | Until June 30, 2010, TOTAL’s equity share of adjustment items reconciling “Business net income” to Net income attributable to equity holders of Sanofi-AventisSanofi (see Note 3, paragraph on the sales of Sanofi-AventisSanofi shares and loss of significant influence over Sanofi-Aventis)Sanofi) |
Main indicators:indicators | (i) | | (i) | Operating income (measure used to evaluate operating performance) |
Revenue from sales after deducting cost of goods sold and inventory variations, other operating expenses, exploration expenses and depreciation, depletion, and amortization. Operating income excludes the amortization of intangible assets other than mineral interests, currency translation adjustments and gains or losses on the disposal of assets. | (ii) | | (ii) | Net operating income (measure used to evaluate the return on capital employed) |
Operating income after taking into account the amortization of intangible assets other than mineral interests, currency translation adjustments, gains or losses on the disposal of assets, as well as all other income and expenses related to capital employed (dividends from non-consolidated companies, equity in income of affiliates, capitalized interest expenses), and after income taxes applicable to the above. The only income and expense not included in net operating income but included in net income are interest expenses related to net financial debt, after applicable income taxes (net cost of net debt) and minoritynon-controlling interests. | (iii) | | (iii) | Adjusted income |
Operating income, net operating income, or net income excluding the effect of adjustment items described above. | (iv) | | (iv) | Fully-diluted adjusted earnings per share |
Adjusted net income divided by the fully-diluted weighted-average number of common shares. Non-current assets and working capital, at replacement cost, net of deferred income taxes and non-current liabilities. | (vi) | | (vi) | ROACE (Return on Average Capital Employed) |
Ratio of adjusted net operating income to average capital employed between the beginning and the end of the period. | (vii) | ROE (Return on Equity) |
Ratio of adjusted consolidated net income to average adjusted shareholders’ equity (after distribution) between the beginning and the end of the period. Non-current debt, including current portion, current borrowings, other current financial liabilities less cash and cash equivalents and other current financial assets. | 3) | | 3) | CHANGES IN THE GROUP STRUCTURE, MAIN ACQUISITIONS AND DIVESTMENTS |
During 2011, 2010 2009 and 2008,2009, main changes in the Group structure and main acquisitions and divestments were as follows: 2011 TOTAL finalized in March 2011 the acquisition from Santos of an additional 7.5% interest in Australia’s GLNG project. This increases TOTAL’s overall stake in the project to 27.5%. The acquisition cost amounts to€202 million ($281 million) and mainly corresponds to the value of mineral interests that have been recognized as intangible assets in the consolidated balance sheet for€227 million. In March 2011, Total E&P Canada Ltd., a TOTAL subsidiary, and Suncor Energy Inc. (Suncor) have finalized a strategic oil sands alliance encompassing the Suncor-operated Fort Hills mining project, the TOTAL-operated Joslyn mining project and the Suncor-operated Voyageur upgrader project. All three assets are located in the Athabasca region of the province of Alberta, in Canada. TOTAL acquired 19.2% of Suncor’s interest in the Fort Hills project, increasing TOTAL’s overall interest in the project to 39.2%. Suncor, as operator, holds 40.8%. TOTAL also acquired a 49% stake in the Suncor-operated Voyageur upgrader project. For those two acquisitions, the Group paid€1,937 million (CAD 2,666 million) mainly representing the value of intangible assets for€474 million and the value of tangible assets for€1,550 million. Furthermore, TOTAL sold to Suncor 36.75% interest in the Joslyn project for€612 million (CAD 842 million). The Group, as operator, retains a 38.25% interest in the project. TOTAL finalized in April 2011 the sale of its 75.8% interest in its upstream Cameroonian affiliate Total E&P Cameroun to Perenco, for an amount of€172 million ($247 million), net of cash sold. TOTAL and the Russian company Novatek signed in March 2011 two Memorandums of Cooperation to develop the cooperation between TOTAL on one side, and Novatek and its main shareholders on the other side. This cooperation is developed around the two following axes: In April 2011, TOTAL took a 12.09% shareholding in Novatek for an amount of€2,901 million ($4,108 million). In December 2011, TOTAL finalized the acquisition of an additional 2% interest in Novatek for an amount of€596 million ($796 million), increasing TOTAL’s overall interest in Novatek to 14.09%. TOTAL considers that it has a significant influence especially through its representation on the Board of Directors of Novatek and its participation in the major Yamal LNG project. Therefore, the interest in Novatek has been accounted for by the equity method since the second quarter of 2011. In October 2011, TOTAL finalized the acquisition of a 20% interest in the Yamal LNG project and has become Novatek’s partner in this project. After the all-cash tender of $23.25 per share launched on April 28, 2011 and completed on June 21, 2011, TOTAL has acquired a 60% stake in SunPower Corp., a U.S. company listed on Nasdaq with headquarters in San Jose (California), one of the most established players in the American solar industry. Shares of SunPower Corp. continue to be traded on the Nasdaq. The acquisition cost, whose cash payment occurred on June 21, 2011, amounts to€974 million ($1,394 million). In accordance with revised IFRS 3, TOTAL is currently assessing the fair value of identifiable acquired assets, liabilities and contingent liabilities. Based on available information, provisional fair value of net assets acquired at 100% amounts to $1,512 million. Given the estimated fair value of instruments that are likely to confer rights to non-controlling interests, provisional goodwill amounts to $533 million. This goodwill must be allocated within twelve months from the acquisition date. 2010
Provisional allocation of the acquisition price and the amount of non-controlling interests at the acquisition date are as follows: | | | | | | (M$) | • | Total E&P Canada Ltd.Fair value at the
acquisition date | | | | | Intangible assets | | | 465 | | | | | | Tangible assets | | | 589 | | | | | | Accounts receivable, net | | | 396 | | | | | | Other current assets | | | 223 | | | | | | Other capital employed | | | 292 | | | | | | Net debt | | | (453 | ) | | | | | Net assets of SunPower (100%) as of June 21, 2011 | | | 1,512 | | | | | | Share attributable at 100% to non-controlling interests | | | (76 | ) | | | | | Net assets of SunPower (100%) as of June 21, 2011 to share | | | 1,436 | | | | | | Group share 60% | | | | | | | 861 | | Goodwill | | | | | | | 533 | | Acquisition cost of SunPower’s shares | | | | | | | 1,394 | | Non-controlling interests (40%) | | | | | | | 575 | | Reinclusion of the share attributable at 100% to non-controlling interests | | | | | | | 76 | | Non-controlling interests as of June 21, 2011 | | | | | | | 651 | |
Since the acquisition date, sales and net income Group share (before impairment of goodwill) realized by SunPower amount respectively to $1,447 million and $(56) million. The goodwill arising from the acquisition of SunPower has been impaired in 2011 (see Note 4E to the Consolidated Financial Statements). Acquisition-related costs recognized in the statement of income for the period amount to€9 million. As part of the transaction, various agreements were signed, including a financial guarantee agreement through which TOTAL guarantees up to $1 billion SunPower’s repayments obligations under letters of credit that would be issued during the next five years for the development of solar power plants and large roofs activities. Furthermore, SunPower’s off-balance sheet commitments and contractual obligations are now included in TOTAL’s notes to the Consolidated Financial Statements (see Note 23 to the Consolidated Financial Statements). TOTAL finalized in July 2011 the sale of 10% of its interest in the Colombian pipeline OCENSA. The Group still holds a 5.2% interest in this asset. TOTAL finalized in September 2011 the acquisition of Esso Italiana’s interests respectively in the Gorgoglione concession (25% interest), which contains the Tempa Rossa field, and in two exploration licenses located in the same area (51.7% for each one). The acquisition increases TOTAL’s interest in the operated Tempa Rossa field to 75%. TOTAL finalized in December 2011 the sale to Silex Gas Norway AS, a wholly owned subsidiary of Allianz, of its entire stake in Gassled (6.4%) and related entities for an amount of€477 million (NOK 3.7 billion). Total E&P USA Inc. signed in December 2011 an agreement to enter into a Joint Venture with Chesapeake Exploration L.L.C., a subsidiary of Chesapeake Energy Corporation, and its partner EnerVest Ltd. Under the terms of this agreement, TOTAL acquired a 25% share in Chesapeake’s and EnerVest’s liquids-rich area of the Utica shale play. TOTAL paid to Chesapeake and EnerVest€500 million ($696 million) in cash for the acquisition of these assets. TOTAL will also be committed to pay additional amounts up to $1.63 billion over a maximum period of 7 years in the form of a 60% carry of Chesapeake and EnerVest’s future capital expenditures on drilling and completion of wells within the Joint Venture. Furthermore, TOTAL will also acquire a 25% share in any new acreage which will be acquired by Chesapeake in the liquids-rich area of the Utica shale play. TOTAL and International Petroleum Investment Company (a company wholly-owned by the Government of Abu Dhabi) entered into an agreement on February 15, 2011 for the sale, to International Petroleum Investment Company (IPIC), of the 48.83% equity interest held by TOTAL in the share capital of CEPSA, to be completed within the framework of a public tender | | offer being launched by IPIC for all the CEPSA shares not yet held by IPIC, at a unit purchase price of€28 per CEPSA share. TOTAL subsidiary, signed in July 2010 an agreement with UTS Energy Corporation (UTS)sold to acquire UTS Corporation withIPIC all of its main asset, a 20%equity interest in the Fort Hills mining project in the Athabasca regionCEPSA and received, as of the Canadian provinceJuly 29, 2011, an amount of Alberta.€3,659 million. |
TOTAL finalized in October 2011 the sale of most of its Marketing assets in the United Kingdom, the Channel Islands and the Isle of Man, to Rontec Investments LLP, a consortium led by Snax 24, one of the leading independent forecourt operators in the United Kingdom, for an amount of€424 million (£368 million). TOTAL finalized in July 2011 the sale of its photocure and coatings resins businesses to Arkema for an amount of€520 million, net of cash sold. 2010 Total E&P Canada Ltd., a TOTAL subsidiary, signed in July 2010 an agreement with UTS Energy Corporation (UTS) to acquire UTS Corporation with its main asset, a 20% interest in the Fort Hills mining project in the Athabasca region of the Canadian province of Alberta. Total E&P Canada completed on September 30, 2010 the acquisition of all UTS shares for a cash amount of 3.08 Canadian dollars per share. Taking into account the cash held by UTS and acquired by TOTAL (€(€232 million), the cost of the acquisition for TOTAL amountsamounted to €862€862 million. This amount mainly representsrepresented the value of mineral interests that have been recognized as intangible assets onin the face of the Consolidated Balance Sheetconsolidated balance sheet for €646€646 million and the value of tangible assets that have been recognized onin the faceconsolidated balance sheet for€217 million. TOTAL completed in September 2010 an agreement for the sale to BP and Hess of its interests in the Consolidated Balance SheetValhall (15.72%) and Hod (25%) fields, in the Norwegian North Sea, for €217an amount of€800 million. TOTAL signed in September 2010 an agreement with Santos and Petronas to acquire a 20% interest in the GLNG project in Australia. Upon completion of this transaction finalised in October 2010, the project brought together Santos (45%, operator), Petronas (35%) and TOTAL (20%). | | | | • | TOTAL completed in September 2010 an agreement for the sale to BP and Hess of its interests in the Valhall (15.72%) and Hod (25%) fields, in the Norwegian North Sea, for an amount of €800 million. | | | • | TOTAL signed in September 2010 an agreement with Santos and Petronas to acquire a 20% interest in the GLNG project in Australia. Upon completion of this transaction finalised in October 2010, the project brings together Santos (45%, operator), Petronas (35%) and TOTAL (20%). |
The acquisition cost amountsamounted to €566€566 million and it mainly representsrepresented the value of mineral interests that have been recognized as intangible assets on
F-18
the face of the Consolidated Balance Sheet for €617 million.
In addition, TOTAL announced in December 2010 the signature of an agreement to acquire an additional 7.5% interest in this project (see Note 34project.TOTAL sold in December 2010 its 5% interest in Block 31, located in the Angolan ultra deep offshore, to the Consolidated Financial Statements).company China Sonangol International Holding Limited. | | | | | • | TOTAL sold in December 2010 its 5% interest in Block 31, located in the Angolan ultra deep offshore, to the company China Sonangol International Holding Limited. |
| | | | | • | TOTAL and ERG announced in January 2010 that they have signed an agreement to create a joint venture, named TotalErg, by contribution of the major part of their activities in the refining and marketing business in Italy. TotalErg has been operational since October 1st, 2010. The shareholder pact calls for joint governance as well as operating independence for the new entity. TOTAL’s interest in TotalErg is 49% and is accounted for by the equity method (see Note 12 to the Consolidated Financial Statements). |
TOTAL closed on April 1, 2010 the sale of its consumer specialty chemicals business, Mapa Spontex, to U.S.-based Jarden Corporation for an enterprise value of€335 million. | | | | • | TOTAL closed on April 1, 2010 the sale of its consumer specialty chemicals business, Mapa Spontex, toU.S.-based Jarden Corporation for an enterprise value of €335 million. |
On March 24, 2010, TOTAL S.A. filed a public tender offer followed by a squeeze out with the French Autorité des Marchés Financiers (AMF) in order to buy the 1,468,725 Elf Aquitaine shares that it did not already hold, representing 0.52% of Elf Aquitaine’s share capital and 0.27% of its voting rights, at a price of€305 per share (including the remaining 2009 dividend). On April 13, 2010, the French Autorité des marchés financiers (AMF) issued its clearance decision for this offer. | | | | • | On March 24, 2010, TOTAL S.A. filed a public tender offer followed by a squeeze out with the French Autorité des Marchés Financiers (AMF) in order to buy the 1,468,725 Elf Aquitaine shares that it did not already hold, representing 0.52% of Elf Aquitaine’s share capital and 0.27% of its voting rights, at a price of €305 per share (including the remaining 2009 dividend). On April 13, 2010, the French Autorité des Marchés Financiers (AMF) issued its clearance decision for this offer. |
The public tender offer was open from April 16 to April 29, 2010 inclusive. The Elf Aquitaine shares targeted by the offer which were not tendered to the offer have been transferred to TOTAL S.A. under the squeeze out upon payment to the shareholders equal to the offer price on the first trading day after the offer closing date, i.e. on April 30, 2010. On April 30, 2010, TOTAL S.A. announced that, following the squeeze out, it held 100% of Elf Aquitaine shares, with the transaction amounting to €450€450 million. In application of revised standard IAS 27 “Consolidated and Separate Financial Statements”, effective for annual periods beginning on or after January 1, 2010, transactions with minoritynon-controlling interests are accounted for as equity transactions, i.e. in consolidated shareholder’s equity. As a consequence, following the squeeze out of the Elf Aquitaine shares by TOTAL S.A., the difference between the consideration paid and the book value of minoritynon-controlling interests acquired was recognized directly as a decrease in equity. During 2010, TOTAL progressively sold 1.88% of Sanofi’s share capital, thus reducing its interest to 5.51%. | | | | • | During 2010, TOTAL progressively sold 1.88% of Sanofi-Aventis’ share capital, thus reducing its interest to 5.51%. |
As from July 1, 2010, given its reduced representation on the Board of Directors and the decrease in the percentage of voting rights, TOTAL ceasesceased to have a significant influence over Sanofi-Aventis and no longer consolidatesconsolidated this investment under the equity method. The investment in Sanofi-AventisSanofi is accounted for as a financial asset available for sale in the line “Other investments” of the consolidated balance sheet at its fair value, i.e. at the stock price. Net income as of December 31, 2010 includesincluded a €135€135 million gain relating to this change in the accounting treatment. 2009 In December 2009, TOTAL signed an agreement with Chesapeake Energy Corporation whereby TOTAL acquired a 25% share in Chesapeake’s Barnett shale gas portfolio located in the United States (State of Texas). The acquisition cost of these assets amounted to€1,562 million and it represented the value of mineral interests that have been recognized as intangible assets in the consolidated balance sheet for€1,449 million and the value of tangible assets that have been recognized in the consolidated balance sheet for€113 million. As no cash payment has occurred in 2009, a corresponding debt has been recognized 2009
| | | | | • | In December 2009, TOTAL signed an agreement with Chesapeake Energy Corporation whereby Total acquired a 25% share in Chesapeake’s Barnett shale gas portfolio located in the United States (State of Texas). The acquisition cost of these assets amounted to €1,562 million and it represented the value of mineral interests that have been recognized as intangible assets on the face of the Consolidated Balance Sheet for €1,449 million and the value of tangible assets that have been recognized on the face of the Consolidated Balance Sheet for €113 million. As no cash payment has occurred in 2009, a corresponding debt has been recognized in the |
F-19
| | | | | sections “Provisions and other non-current liabilities” and “Other creditors and accrued liabilities” for €818€818 million and €744€744 million respectively. |
| | | | • | During 2009, TOTAL progressively sold 3.99% of Sanofi-Aventis’ share capital, thus reducing its interest to 7.39%. Sanofi-Aventis is accounted for by the equity method in TOTAL’s Consolidated Financial Statements for the year ended December 31, 2009. |
2008
| | | | • | Pursuant to the tender offer described in the prospectus on May 13, 2008 and renewed by the notices on June 19, July 4 and July 16, 2008, TOTAL acquired 100% of Synenco Energy Inc’s Class A ordinary shares. Synenco’s main asset is a 60% interest in the Northern Lights project in the Athabasca region of the Canadian province of Alberta. |
The acquisition cost, net of cash acquired (€161 million) for all shares amounted to €352 million. This cost essentially represented the value of the company’s mineral interests that have been recognized as intangible assets on the face of the Consolidated Balance Sheet for €221 million.
Synenco Energy Inc. is fully consolidated in TOTAL’s Consolidated Financial Statements. Its contribution toStatements for the consolidated net income for fiscal year 2008 was not material.ended December 31, 2009.
| | | | • | In August 2008, TOTAL acquired the Dutch company Goal Petroleum BV. The acquisition cost amounted to €349 million. This cost essentially represented the value of the company’s mineral interests that have been recognized as intangible assets on the face of the Consolidated Balance Sheet for €292 million. | | | | Goal Petroleum BV is fully consolidated in TOTAL’s Consolidated Financial Statements. Its contribution to the consolidated net income for fiscal year 2008 was not material. | | | • | Pursuant to the agreements signed between the partners in November 2008, the Group’s participation in the Kashagan field decreased from 18.52% to 16.81%. |
| | | | • | During 2008, TOTAL progressively sold 1.68% of Sanofi-Aventis’ share capital, thus reducing its interest to 11.38%. Sanofi-Aventis is accounted for by the equity method in TOTAL’s Consolidated Financial Statements for the year ended December 31, 2008. |
| | 4) | BUSINESS SEGMENT INFORMATION |
4)BUSINESS SEGMENT INFORMATION Financial information by business segment is reported in accordance with the internal reporting system and shows internal segment information that is used to manage and measure the performance of TOTAL. The Group’s activities are conducted through three business segments: the Upstream segment includes the activities of the Exploration & Production division and the Gas & Power division; the Downstream segment includes activities of the Refining & Marketing division and Chemicals.the Trading & Shipping division; and the Chemicals segment includes Base Chemicals and Specialties. | | • | The Upstream segment includes the activities of the Exploration & Production division and the Gas & Power division; | • | The Downstream segment includes activities of the Refining & Marketing division and the Trading & Shipping division; and | • | The Chemicals segment includes Base Chemicals and Specialties. |
The Corporate segment includes the operating and financial activities of the holding companies (including the investment in Sanofi-Aventis)Sanofi). The operational profit and assets are broken down by business segment prior to the consolidation and inter-segment adjustments. Sales prices between business segments approximate market prices. Furthermore, the Group announced in October 2011 a plan of reorganization of its business segments Downstream and Chemicals. The consultation and notification process towards employee representatives is finished and this reorganization became effective as of January 1st, 2012. This plan changed the organization through the creation of: a Refining & Chemicals segment that is a major production hub combining TOTAL’s refining, petrochemicals, fertilizers and specialty chemicals operations. This segment also includes Trading & Shipping activities ;
F-20
a Supply & Marketing segment that is dedicated to the global supply and marketing of petroleum products.
| A) | | A) | INFORMATION BY BUSINESS SEGMENT |
| | | | | | | | | | | | | | | | | | | | | | | | | | For the year ended December 31, 2010
| | | | | | | | | | | | | | | | | | | | (M€) | | Upstream
| | | Downstream
| | | Chemicals
| | | Corporate
| | | Intercompany
| | | Total
| | | Non-Group sales | | | 18,527 | | | | 123,245 | | | | 17,490 | | | | 7 | | | | — | | | | 159,269 | | | Intersegment sales | | | 22,540 | | | | 4,693 | | | | 981 | | | | 186 | | | | (28,400 | ) | | | — | | | Excise taxes | | | — | | | | (18,793 | ) | | | — | | | | — | | | | — | | | | (18,793 | ) | | | | | | | | | | | | | | | | | | | | | | | | | | | Revenues from sales | | | 41,067 | | | | 109,145 | | | | 18,471 | | | | 193 | | | | (28,400 | ) | | | 140,476 | | | | | | | | | | | | | | | | | | | | | | | | | | | | | Operating expenses | | | (18,271 | ) | | | (105,660 | ) | | | (16,974 | ) | | | (665 | ) | | | 28,400 | | | | (113,170 | ) | | Depreciation, depletion and amortization of tangible assets and mineral interests | | | (5,346 | ) | | | (2,503 | ) | | | (533 | ) | | | (39 | ) | | | — | | | | (8,421 | ) | | | | | | | | | | | | | | | | | | | | | | | | | | | Operating income | | | 17,450 | | | | 982 | | | | 964 | | | | (511 | ) | | | — | | | | 18,885 | | | | | | | | | | | | | | | | | | | | | | | | | | | | | Equity in income (loss) of affiliates and other items | | | 1,533 | | | | 141 | | | | 215 | | | | 595 | | | | — | | | | 2,484 | | | Tax on net operating income | | | (10,131 | ) | | | (201 | ) | | | (267 | ) | | | 263 | | | | — | | | | (10,336 | ) | | | | | | | | | | | | | | | | | | | | | | | | | | | Net operating income | | | 8,852 | | | | 922 | | | | 912 | | | | 347 | | | | — | | | | 11,033 | | | | | | | | | | | | | | | | | | | | | | | | | | | | | Net cost of net debt | | | | | | | | | | | | | | | | | | | | | | | (226 | ) | | Minority interests | | | | | | | | | | | | | | | | | | | | | | | (236 | ) | | | | | | | | | | | | | | | | | | | | | | | | | | | Net income | | | | | | | | | | | | | | | | | | | | | | | 10,571 | | | | | | | | | | | | | | | | | | | | | | | | | | | |
| | | | | | | | | | | | | | | | | | | | | | | | | | For the year ended December 31, 2010 (adjustments(a))
| | | | | | | | | | | | | | | | | | | | (M€) | | Upstream
| | | Downstream
| | | Chemicals
| | | Corporate
| | | Intercompany
| | | Total
| | | Non-Group sales | | | | | | | | | | | | | | | | | | | | | | | | | | Intersegment sales | | | | | | | | | | | | | | | | | | | | | | | | | | Excise taxes | | | | | | | | | | | | | | | | | | | | | | | | | | | | | | | | | | | | | | | | | | | | | | | | | | | Revenues from sales | | | | | | | | | | | | | | | | | | | | | | | | | | | | | | | | | | | | | | | | | | | | | | | | | | | | Operating expenses | | | — | | | | 923 | | | | 92 | | | | — | | | | | | | | 1,015 | | | Depreciation, depletion and amortization of tangible assets and mineral interests | | | (203 | ) | | | (1,192 | ) | | | (21 | ) | | | — | | | | | | | | (1,416 | ) | | | | | | | | | | | | | | | | | | | | | | | | | | | Operating income(b) | | | (203 | ) | | | (269 | ) | | | 71 | | | | — | | | | | | | | (401 | ) | | | | | | | | | | | | | | | | | | | | | | | | | | | Equity in income (loss) of affiliates and other items(c) | | | 183 | | | | (126 | ) | | | (16 | ) | | | 227 | | | | | | | | 268 | | | Tax on net operating income | | | 275 | | | | 149 | | | | — | | | | (6 | ) | | | | | | | 418 | | | | | | | | | | | | | | | | | | | | | | | | | | | | Net operating income(b) | | | 255 | | | | (246 | ) | | | 55 | | | | 221 | | | | | | | | 285 | | | | | | | | | | | | | | | | | | | | | | | | | | | | | Net cost of net debt | | | | | | | | | | | | | | | | | | | | | | | — | | | Minority interests | | | | | | | | | | | | | | | | | | | | | | | (2 | ) | | | | | | | | | | | | | | | | | | | | | | | | | | | Net income | | | | | | | | | | | | | | | | | | | | | | | 283 | | | | | | | | | | | | | | | | | | | | | | | | | | | |
| | | | | | | | | | | | | | | | | | | | | | | | | For the year ended December 31, 2011
(M€) | | Upstream | | | Downstream | | | Chemicals | | | Corporate | | | Intercompany | | | Total | | Non-Group sales | | | 23,298 | | | | 141,907 | | | | 19,477 | | | | 11 | | | | — | | | | 184,693 | | Intersegment sales | | | 27,301 | | | | 5,983 | | | | 1,234 | | | | 185 | | | | (34,703 | ) | | | — | | Excise taxes | | | — | | | | (18,143 | ) | | | — | | | | — | | | | — | | | | (18,143 | ) | Revenues from sales | | | 50,599 | | | | 129,747 | | | | 20,711 | | | | 196 | | | | (34,703 | ) | | | 166,550 | | Operating expenses | | | (23,079 | ) | | | (126,145 | ) | | | (19,566 | ) | | | (667 | ) | | | 34,703 | | | | (134,754 | ) | Depreciation, depletion and amortization of tangible assets and mineral interests | | | (5,076 | ) | | | (1,908 | ) | | | (487 | ) | | | (35 | ) | | | — | | | | (7,506 | ) | Operating income | | | 22,444 | | | | 1,694 | | | | 658 | | | | (506 | ) | | | — | | | | 24,290 | | Equity in income (loss) of affiliates and other items | | | 1,596 | | | | 401 | | | | 471 | | | | 336 | | | | — | | | | 2,804 | | Tax on net operating income | | | (13,506 | ) | | | (409 | ) | | | (225 | ) | | | (38 | ) | | | — | | | | (14,178 | ) | Net operating income | | | 10,534 | | | | 1,686 | | | | 904 | | | | (208 | ) | | | — | | | | 12,916 | | Net cost of net debt | | | | | | | | | | | | | | | | | | | | | | | (335 | ) | Non-controlling interests | | | | | | | | | | | | | | | | | | | | | | | (305 | ) | Net income | | | | | | | | | | | | | | | | | | | | | | | 12,276 | |
| | | | | | | | | | | | | | | | | | | | | | | | | For the year ended December 31, 2011
(adjustments(a)) (M€) | | Upstream | | | Downstream | | | Chemicals | | | Corporate | | | Intercompany | | | Total | | Non-Group sales | | | 45 | | | | | | | | | | | | | | | | | | | | 45 | | Intersegment sales | | | | | | | | | | | | | | | | | | | | | | | — | | Excise taxes | | | | | | | | | | | | | | | | | | | | | | | — | | Revenues from sales | | | 45 | | | | | | | | | | | | | | | | | | | | 45 | | Operating expenses | | | — | | | | 1,156 | | | | (33 | ) | | | — | | | | | | | | 1,123 | | Depreciation, depletion and amortization of tangible assets and mineral interests | | | (75 | ) | | | (700 | ) | | | (6 | ) | | | — | | | | | | | | (781 | ) | Operating income(b) | | | (30 | ) | | | 456 | | | | (39 | ) | | | — | | | | — | | | | 387 | | Equity in income (loss) of affiliates and other items | | | 191 | | | | 256 | | | | 209 | | | | 90 | | | | | | | | 746 | | Tax on net operating income | | | (32 | ) | | | (109 | ) | | | (41 | ) | | | (80 | ) | | | | | | | (262 | ) | Net operating income(b) | | | 129 | | | | 603 | | | | 129 | | | | 10 | | | | | | | | 871 | | Net cost of net debt | | | | | | | | | | | | | | | | | | | | | | | — | | Non-controlling interests | | | | | | | | | | | | | | | | | | | | | | | (19 | ) | Net income | | | | | | | | | | | | | | | | | | | | | | | 852 | |
| (a) | Adjustments include special items, inventory valuation effect and, as from January 1st, 2011, the effect of changes in fair value. |
| | | | | | | | | | | | | | | | | | | | | (b) Of which inventory valuation effect | | | (a)Upstream | | | | Downstream | | | | Chemicals | | | | Corporate | | | | | | on operating income | | | — | | | | 1,224 | | | | (9 | ) | | | — | | | | | | on net operating income | | | — | | | | 859 | | | | 10 | | | | — | | | | | |
| | | | | | | | | | | | | | | | | | | | | | | | | For the year ended December 31, 2011
(adjusted) (M€) (a) | | Upstream | | | Downstream | | | Chemicals | | | Corporate | | | Intercompany | | | Total | | Non-Group sales | | | 23,253 | | | | 141,907 | | | | 19,477 | | | | 11 | | | | — | | | | 184,648 | | Intersegment sales | | | 27,301 | | | | 5,983 | | | | 1,234 | | | | 185 | | | | (34,703 | ) | | | — | | Excise taxes | | | — | | | | (18,143 | ) | | | — | | | | — | | | | — | | | | (18,143 | ) | Revenues from sales | | | 50,554 | | | | 129,747 | | | | 20,711 | | | | 196 | | | | (34,703 | ) | | | 166,505 | | Operating expenses | | | (23,079 | ) | | | (127,301 | ) | | | (19,533 | ) | | | (667 | ) | | | 34,703 | | | | (135,877 | ) | Depreciation, depletion and amortization of tangible assets and mineral interests | | | (5,001 | ) | | | (1,208 | ) | | | (481 | ) | | | (35 | ) | | | — | | | | (6,725 | ) | Adjusted operating income | | | 22,474 | | | | 1,238 | | | | 697 | | | | (506 | ) | | | — | | | | 23,903 | | Equity in income (loss) of affiliates and other items | | | 1,405 | | | | 145 | | | | 262 | | | | 246 | | | | — | | | | 2,058 | | Tax on net operating income | | | (13,474 | ) | | | (300 | ) | | | (184 | ) | | | 42 | | | | — | | | | (13,916 | ) | Adjusted net operating income | | | 10,405 | | | | 1,083 | | | | 775 | | | | (218 | ) | | | — | | | | 12,045 | | Net cost of net debt | | | | | | | | | | | | | | | | | | | | | | | (335 | ) | Non-controlling interests | | | | | | | | | | | | | | | | | | | | | | | (286 | ) | Adjusted net income | | | | | | | | | | | | | | | | | | | | | | | 11,424 | | Adjusted fully-diluted earnings per share (€) | | | | | | | | | | | | | | | | | | | | | | | 5.06 | |
| (a) | Except for earnings per share |
| | | | | | | | | | | | | | | | | | | | | | | For the year ended December 31, 2011
(M€) | | Upstream | | | Downstream | | | Chemicals | | | Corporate | | | Intercompany | | Total | | Total expenditures | | | 21,689 | | | | 1,870 | | | | 847 | | | | 135 | | | | | | 24,541 | | Total divestments | | | 2,656 | | | | 3,235 | | | | 1,164 | | | | 1,523 | | | | | | 8,578 | | Cash flow from operating activities | | | 17,054 | | | | 2,165 | | | | 512 | | | | (195 | ) | | | | | 19,536 | | Balance sheet as of December 31, 2011 | | | | | | | | | | | | | | | | | | | | | | | Property, plant and equipment, intangible assets, net | | | 64,069 | | | | 7,918 | | | | 4,638 | | | | 245 | | | | | | 76,870 | | Investments in equity affiliates | | | 8,932 | | | | 699 | | | | 1,118 | | | | — | | | | | | 10,749 | | Loans to equity affiliates and other non-current assets | | | 4,793 | | | | 1,749 | | | | 1,144 | | | | 3,105 | | | | | | 10,791 | | Working capital | | | 1,240 | | | | 9,627 | | | | 2,585 | | | | (1,374 | ) | | | | | 12,078 | | Provisions and other non-current liabilities | | | (20,095 | ) | | | (2,577 | ) | | | (1,593 | ) | | | (1,136 | ) | | | | | (25,401 | ) | Assets and liabilities classified as held for sale | | | — | | | | — | | | | — | | | | — | | | | | | — | | Capital Employed (balance sheet) | | | 58,939 | | | | 17,416 | | | | 7,892 | | | | 840 | | | | | | 85,087 | | Less inventory valuation effect | | | — | | | | (3,615 | ) | | | (419 | ) | | | 13 | | | | | | (4,021 | ) | Capital Employed (Business segment information) | | | 58,939 | | | | 13,801 | | | | 7,473 | | | | 853 | | | | | | 81,066 | | ROACE as a percentage | | | 20% | | | | 7% | | | | 10% | | | | | | | | | | 16% | |
| | | | | | | | | | | | | | | | | | | | | | | | | For the year ended December 31, 2010
(M€) | | Upstream | | | Downstream | | | Chemicals | | | Corporate | | | Intercompany | | | Total | | Non-Group sales | | | 18,527 | | | | 123,245 | | | | 17,490 | | | | 7 | | | | — | | | | 159,269 | | Intersegment sales | | | 22,540 | | | | 4,693 | | | | 981 | | | | 186 | | | | (28,400 | ) | | | — | | Excise taxes | | | — | | | | (18,793 | ) | | | — | | | | — | | | | — | | | | (18,793 | ) | Revenues from sales | | | 41,067 | | | | 109,145 | | | | 18,471 | | | | 193 | | | | (28,400 | ) | | | 140,476 | | Operating expenses | | | (18,271 | ) | | | (105,660 | ) | | | (16,974 | ) | | | (665 | ) | | | 28,400 | | | | (113,170 | ) | Depreciation, depletion and amortization of tangible assets and mineral interests | | | (5,346 | ) | | | (2,503 | ) | | | (533 | ) | | | (39 | ) | | | — | | | | (8,421 | ) | Operating income | | | 17,450 | | | | 982 | | | | 964 | �� | | | (511 | ) | | | — | | | | 18,885 | | Equity in income (loss) of affiliates and other items | | | 1,533 | | | | 141 | | | | 215 | | | | 595 | | | | — | | | | 2,484 | | Tax on net operating income | | | (10,131 | ) | | | (201 | ) | | | (267 | ) | | | 263 | | | | — | | | | (10,336 | ) | Net operating income | | | 8,852 | | | | 922 | | | | 912 | | | | 347 | | | | — | | | | 11,033 | | Net cost of net debt | | | | | | | | | | | | | | | | | | | | | | | (226 | ) | Non-controlling interests | | | | | | | | | | | | | | | | | | | | | | | (236 | ) | Net income | | | | | | | | | | | | | | | | | | | | | | | 10,571 | |
| | | | | | | | | | | | | | | | | | | | | | | For the year ended December 31, 2010
(adjustments(a)) (M€) | | Upstream | | | Downstream | | | Chemicals | | | Corporate | | | Intercompany | | Total | | Non-Group sales | | | | | | | | | | | | | | | | | | | | | | | Intersegment sales | | | | | | | | | | | | | | | | | | | | | | | Excise taxes | | | | | | | | | | | | | | | | | | | | | | | Revenues from sales | | | | | | | | | | | | | | | | | | | | | | | Operating expenses | | | — | | | | 923 | | | | 92 | | | | — | | | | | | 1,015 | | Depreciation, depletion and amortization of tangible assets and mineral interests | | | (203 | ) | | | (1,192 | ) | | | (21 | ) | | | — | | | | | | (1,416 | ) | Operating income(b) | | | (203 | ) | | | (269 | ) | | | 71 | | | | — | | | | | | (401 | ) | Equity in income (loss) of affiliates and other items(c) | | | 183 | | | | (126 | ) | | | (16 | ) | | | 227 | | | | | | 268 | | Tax on net operating income | | | 275 | | | | 149 | | | | — | | | | (6 | ) | | | | | 418 | | Net operating income(b) | | | 255 | | | | (246 | ) | | | 55 | | | | 221 | | | | | | 285 | | Net cost of net debt | | | | | | | | | | | | | | | | | | | | | — | | Non-controlling interests | | | | | | | | | | | | | | | | | | | | | (2 | ) | Net income | | | | | | | | | | | | | | | | | | | | | 283 | |
| | | | | | | | | | | | | | | | | | | | | (a) Adjustments include special items, inventory valuation effect and, until June 30, 2010, equity share of adjustments related to Sanofi-Aventis.Sanofi. |
| | | | | | | | | | | | | | | | | (b) Of which inventory valuation effect | | Upstream | | | Downstream | | | Chemicals | | | Corporate | | | on operating income
| | | —Upstream | | | | 863Downstream | | | | 130Chemicals | | | | —Corporate | | | | | | | | | — | | | | 863 | | | | 130 | | | | — | | | | | | on net operating income | | | — | | | | 640 | | | 640 | 113 | | | | — | | | 113 | | | | — | | (c) Of which equity share of adjustments related to Sanofi-AventisSanofi | | | — | | | | — | | | | — | | | | (81 | ) | | — | | | | (81 | ) |
F-21
| | | | | | | | | | | | | | | | | | | | | | | | | For the year ended December 31, 2010
(adjusted) (M€)(a) | | Upstream | | | Downstream | | | Chemicals | | | Corporate | | | Intercompany | | | Total | | Non-Group sales | | | 18,527 | | | | 123,245 | | | | 17,490 | | | | 7 | | | | — | | | | 159,269 | | Intersegment sales | | | 22,540 | | | | 4,693 | | | | 981 | | | | 186 | | | | (28,400 | ) | | | — | | Excise taxes | | | — | | | | (18,793 | ) | | | — | | | | — | | | | — | | | | (18,793 | ) | Revenues from sales | | | 41,067 | | | | 109,145 | | | | 18,471 | | | | 193 | | | | (28,400 | ) | | | 140,476 | | Operating expenses | | | (18,271 | ) | | | (106,583 | ) | | | (17,066 | ) | | | (665 | ) | | | 28,400 | | | | (114,185 | ) | Depreciation, depletion and amortization of tangible assets and mineral interests | | | (5,143 | ) | | | (1,311 | ) | | | (512 | ) | | | (39 | ) | | | — | | | | (7,005 | ) | Adjusted operating income | | | 17,653 | | | | 1,251 | | | | 893 | | | | (511 | ) | | | — | | | | 19,286 | | Equity in income (loss) of affiliates and other items | | | 1,350 | | | | 267 | | | | 231 | | | | 368 | | | | — | | | | 2,216 | | Tax on net operating income | | | (10,406 | ) | | | (350 | ) | | | (267 | ) | | | 269 | | | | — | | | | (10,754 | ) | Adjusted net operating income | | | 8,597 | | | | 1,168 | | | | 857 | | | | 126 | | | | — | | | | 10,748 | | Net cost of net debt | | | | | | | | | | | | | | | | | | | | | | | (226 | ) | Non-controlling interests | | | | | | | | | | | | | | | | | | | | | | | (234 | ) | Adjusted net income | | | | | | | | | | | | | | | | | | | | | | | 10,288 | | Adjusted fully-diluted earnings per share (€) | | | | | | | | | | | | | | | | | | | | 4.58 | |
| | | | | | | | | | | | | | | | | | | | | | | | | | For the year ended December 31, 2010 (adjusted)
| | | | | | | | | | | | | | | | | | | | (M€)(a) | | Upstream
| | | Downstream
| | | Chemicals
| | | Corporate
| | | Intercompany
| | | Total
| | | Non-Group sales | | | 18,527 | | | | 123,245 | | | | 17,490 | | | | 7 | | | | — | | | | 159,269 | | | Intersegment sales | | | 22,540 | | | | 4,693 | | | | 981 | | | | 186 | | | | (28,400 | ) | | | — | | | Excise taxes | | | — | | | | (18,793 | ) | | | — | | | | — | | | | — | | | | (18,793 | ) | | | | | | | | | | | | | | | | | | | | | | | | | | | Revenues from sales | | | 41,067 | | | | 109,145 | | | | 18,471 | | | | 193 | | | | (28,400 | ) | | | 140,476 | | | | | | | | | | | | | | | | | | | | | | | | | | | | | Operating expenses | | | (18,271 | ) | | | (106,583 | ) | | | (17,066 | ) | | | (665 | ) | | | 28,400 | | | | (114,185 | ) | | Depreciation, depletion and amortization of tangible assets and mineral interests | | | (5,143 | ) | | | (1,311 | ) | | | (512 | ) | | | (39 | ) | | | — | | | | (7,005 | ) | | | | | | | | | | | | | | | | | | | | | | | | | | | Adjusted operating income | | | 17,653 | | | | 1,251 | | | | 893 | | | | (511 | ) | | | — | | | | 19,286 | | | | | | | | | | | | | | | | | | | | | | | | | | | | | Equity in income (loss) of affiliates and other items | | | 1,350 | | | | 267 | | | | 231 | | | | 368 | | | | — | | | | 2,216 | | | Tax on net operating income | | | (10,406 | ) | | | (350 | ) | | | (267 | ) | | | 269 | | | | — | | | | (10,754 | ) | | | | | | | | | | | | | | | | | | | | | | | | | | | Adjusted net operating income | | | 8,597 | | | | 1,168 | | | | 857 | | | | 126 | | | | — | | | | 10,748 | | | | | | | | | | | | | | | | | | | | | | | | | | | | | Net cost of net debt | | | | | | | | | | | | | | | | | | | | | | | (226 | ) | | Minority interests | | | | | | | | | | | | | | | | | | | | | | | (234 | ) | | | | | | | | | | | | | | | | | | | | | | | | | | | Adjusted net income | | | | | | | | | | | | | | | | | | | | | | | 10,288 | | | | | | | | | | | | | | | | | | | | | | | | | | | | Adjusted fully-diluted earnings per share (€) | | | | | | | | | | | | | | | | | | | | | | | 4.58 | | | | | | | | | | | | | | | | | | | | | | | | | | | |
| (a) | | | (a) | | Except for earnings per share |
| | | | | | | | | | | | | | | | | | | | | | | | | | For the year ended December 31, 2010
| | | | | | | | | | | | | | | | | | | | (M€) | | Upstream
| | | Downstream
| | | Chemicals
| | | Corporate
| | | Intercompany
| | | Total
| | | Total expenditures | | | 13,208 | | | | 2,343 | | | | 641 | | | | 81 | | | | | | | | 16,273 | | | Total divestments | | | 2,067 | | | | 499 | | | | 347 | | | | 1,403 | | | | | | | | 4,316 | | | Cash flow from operating activities | | | 15,573 | | | | 1,441 | | | | 934 | | | | 545 | | | | | | | | 18,493 | | | | | | | | | | | | | | | | | | | | | | | | | | | | Balance sheet as of December 31, 2010 | | | | | | | | | | | | | | | | | | | | | | | | | | | | | | | | | | | | | | | | | | | | | | | | | | | | Property, plant and equipment, intangible assets, net | | | 50,565 | | | | 8,675 | | | | 4,388 | | | | 253 | | | | | | | | 63,881 | | | Investments in equity affiliates | | | 5,002 | | | | 2,782 | | | | 1,349 | | | | — | | | | | | | | 9,133 | | | Loans to equity affiliates and other non-current assets | | | 4,184 | | | | 1,366 | | | | 979 | | | | 4,099 | | | | | | | | 10,628 | | | Working capital | | | (363 | ) | | | 9,154 | | | | 2,223 | | | | (211 | ) | | | | | | | 10,803 | | | Provisions and other non-current liabilities | | | (16,076 | ) | | | (2,328 | ) | | | (1,631 | ) | | | (1,181 | ) | | | | | | | (21,216 | ) | | Assets and liabilities classified as held for sale | | | 660 | | | | — | | | | 413 | | | | — | | | | | | | | 1,073 | | | | | | | | | | | | | | | | | | | | | | | | | | | | Capital Employed (balance sheet) | | | 43,972 | | | | 19,649 | | | | 7,721 | | | | 2,960 | | | | | | | | 74,302 | | | Less inventory valuation effect | | | — | | | | (4,088 | ) | | | (409 | ) | | | 1,061 | | | | | | | | (3,436 | ) | | | | | | | | | | | | | | | | | | | | | | | | | | | Capital Employed (Business segment information) | | | 43,972 | | | | 15,561 | | | | 7,312 | | | | 4,021 | | | | | | | | 70,866 | | | | | | | | | | | | | | | | | | | | | | | | | | | | ROACE as a percentage | | | 21% | | | | 8% | | | | 12% | | | | | | | | | | | | 16% | | | | | | | | | | | | | | | | | | | | | | | | | | | |
F-22
| | | | | | | | | | | | | | | | | | | | | | | For the year ended December 31, 2010
(M€) | | Upstream | | | Downstream | | | Chemicals | | | Corporate | | | Intercompany | | Total | | Total expenditures | | | 13,208 | | | | 2,343 | | | | 641 | | | | 81 | | | | | | 16,273 | | Total divestments | | | 2,067 | | | | 499 | | | | 347 | | | | 1,403 | | | | | | 4,316 | | Cash flow from operating activities | | | 15,573 | | | | 1,441 | | | | 934 | | | | 545 | | | | | | 18,493 | | Balance sheet as of December 31, 2010 | | | | | | | | | | | | | | | | | | | | | | | Property, plant and equipment, intangible assets, net | | | 50,565 | | | | 8,675 | | | | 4,388 | | | | 253 | | | | | | 63,881 | | Investments in equity affiliates | | | 5,002 | | | | 2,782 | | | | 1,349 | | | | — | | | | | | 9,133 | | Loans to equity affiliates and other non-current assets | | | 4,184 | | | | 1,366 | | | | 979 | | | | 4,099 | | | | | | 10,628 | | Working capital | | | (363 | ) | | | 9,154 | | | | 2,223 | | | | (211 | ) | | | | | 10,803 | | Provisions and other non-current liabilities | | | (16,076 | ) | | | (2,328 | ) | | | (1,631 | ) | | | (1,181 | ) | | | | | (21,216 | ) | Assets and liabilities classified as held for sale | | | 660 | | | | — | | | | 413 | | | | — | | | | | | 1,073 | | Capital Employed (balance sheet) | | | 43,972 | | | | 19,649 | | | | 7,721 | | | | 2,960 | | | | | | 74,302 | | Less inventory valuation effect | | | — | | | | (4,088 | ) | | | (409 | ) | | | 1,061 | | | | | | (3,436 | ) | Capital Employed (Business segment information) | | | 43,972 | | | | 15,561 | | | | 7,312 | | | | 4,021 | | | | | | 70,866 | | ROACE as a percentage | | | 21% | | | | 8% | | | | 12% | | | | | | | | | | 16% | |
| | | | | | | | | | | | | | | | | | | | | | | | | For the year ended December 31, 2009
(M€) | | Upstream | | | Downstream | | | Chemicals | | | Corporate | | | Intercompany | | | Total | | Non-Group sales | | | 16,072 | | | | 100,518 | | | | 14,726 | | | | 11 | | | | — | | | | 131,327 | | Intersegment sales | | | 15,958 | | | | 3,786 | | | | 735 | | | | 156 | | | | (20,635 | ) | | | — | | Excise taxes | | | — | | | | (19,174 | ) | | | — | | | | — | | | | — | | | | (19,174 | ) | Revenues from sales | | | 32,030 | | | | 85,130 | | | | 15,461 | | | | 167 | | | | (20,635 | ) | | | 112,153 | | Operating expenses | | | (14,752 | ) | | | (81,281 | ) | | | (14,293 | ) | | | (656 | ) | | | 20,635 | | | | (90,347 | ) | Depreciation, depletion and amortization of tangible assets and mineral interests | | | (4,420 | ) | | | (1,612 | ) | | | (615 | ) | | | (35 | ) | | | — | | | | (6,682 | ) | Operating income | | | 12,858 | | | | 2,237 | | | | 553 | | | | (524 | ) | | | — | | | | 15,124 | | Equity in income (loss) of affiliates and other items | | | 846 | | | | 169 | | | | (58 | ) | | | 697 | | | | — | | | | 1,654 | | Tax on net operating income | | | (7,486 | ) | | | (633 | ) | | | (92 | ) | | | 326 | | | | — | | | | (7,885 | ) | Net operating income | | | 6,218 | | | | 1,773 | | | | 403 | | | | 499 | | | | — | | | | 8,893 | | Net cost of net debt | | | | | | | | | | | | | | | | | | | | | | | (264 | ) | Non-controlling interests | | | | | | | | | | | | | | | | | | | | | | | (182 | ) | Net income | | | | | | | | | | | | | | | | | | | | | | | 8,447 | |
| | | | | | | | | | | | | | | | | | | | | | | For the year ended December 31, 2009
(adjustments(a)) (M€) | | Upstream | | | Downstream | | | Chemicals | | | Corporate | | | Intercompany | | Total | | Non-Group sales | | | | | | | | | | | | | | | | | | | | | | | Intersegment sales | | | | | | | | | | | | | | | | | | | | | | | Excise taxes | | | | | | | | | | | | | | | | | | | | | | | Revenues from sales | | | | | | | | | | | | | | | | | | | | | | | Operating expenses | | | (17 | ) | | | 1,558 | | | | 344 | | | | — | | | | | | 1,885 | | Depreciation, depletion and amortization of tangible assets and mineral interests | | | (4 | ) | | | (347 | ) | | | (40 | ) | | | — | | | | | | (391 | ) | Operating income(b) | | | (21 | ) | | | 1,211 | | | | 304 | | | | — | | | | | | 1,494 | | Equity in income (loss) of affiliates and other items(c) | | | (160 | ) | | | 22 | | | | (123 | ) | | | (117 | ) | | | | | (378 | ) | Tax on net operating income | | | 17 | | | | (413 | ) | | | (50 | ) | | | (3 | ) | | | | | (449 | ) | Net operating income(b) | | | (164 | ) | | | 820 | | | | 131 | | | | (120 | ) | | | | | 667 | | Net cost of net debt | | | | | | | | | | | | | | | | | | | | | — | | Non-controlling interests | | | | | | | | | | | | | | | | | | | | | (4 | ) | Net income | | | | | | | | | | | | | | | | | | | | | 663 | |
| | | | | | | | | | | | | | | | | | | | | | | | | | For the year ended December 31, 2009
| | | | | | | | | | | | | | | | | | | | (M€) | | Upstream
| | | Downstream
| | | Chemicals
| | | Corporate
| | | Intercompany
| | | Total
| | | Non-Group sales | | | 16,072 | | | | 100,518 | | | | 14,726 | | | | 11 | | | | — | | | | 131,327 | | | Intersegment sales | | | 15,958 | | | | 3,786 | | | | 735 | | | | 156 | | | | (20,635 | ) | | | — | | | Excise taxes | | | — | | | | (19,174 | ) | | | — | | | | — | | | | — | | | | (19,174 | ) | | | | | | | | | | | | | | | | | | | | | | | | | | | Revenues from sales | | | 32,030 | | | | 85,130 | | | | 15,461 | | | | 167 | | | | (20,635 | ) | | | 112,153 | | | | | | | | | | | | | | | | | | | | | | | | | | | | | Operating expenses | | | (14,752 | ) | | | (81,281 | ) | | | (14,293 | ) | | | (656 | ) | | | 20,635 | | | | (90,347 | ) | | Depreciation, depletion and amortization of tangible assets and mineral interests | | | (4,420 | ) | | | (1,612 | ) | | | (615 | ) | | | (35 | ) | | | — | | | | (6,682 | ) | | | | | | | | | | | | | | | | | | | | | | | | | | | Operating income | | | 12,858 | | | | 2,237 | | | | 553 | | | | (524 | ) | | | — | | | | 15,124 | | | | | | | | | | | | | | | | | | | | | | | | | | | | | Equity in income (loss) of affiliates and other items | | | 846 | | | | 169 | | | | (58 | ) | | | 697 | | | | — | | | | 1,654 | | | Tax on net operating income | | | (7,486 | ) | | | (633 | ) | | | (92 | ) | | | 326 | | | | — | | | | (7,885 | ) | | | | | | | | | | | | | | | | | | | | | | | | | | | Net operating income | | | 6,218 | | | | 1,773 | | | | 403 | | | | 499 | | | | — | | | | 8,893 | | | | | | | | | | | | | | | | | | | | | | | | | | | | | Net cost of net debt | | | | | | | | | | | | | | | | | | | | | | | (264 | ) | | Minority interests | | | | | | | | | | | | | | | | | | | | | | | (182 | ) | | | | | | | | | | | | | | | | | | | | | | | | | | | Net income | | | | | | | | | | | | | | | | | | | | | | | 8,447 | | | | | | | | | | | | | | | | | | | | | | | | | | | |
| | | | | | | | | | | | | | | | | | | | | | | | | | For the year ended December 31, 2009 (adjustments(a))
| | | | | | | | | | | | | | | | | | | | (M€) | | Upstream
| | | Downstream
| | | Chemicals
| | | Corporate
| | | Intercompany
| | | Total
| | | Non-Group sales | | | | | | | | | | | | | | | | | | | | | | | | | | Intersegment sales | | | | | | | | | | | | | | | | | | | | | | | | | | Excise taxes | | | | | | | | | | | | | | | | | | | | | | | | | | | | | | | | | | | | | | | | | | | | | | | | | | | Revenues from sales | | | | | | | | | | | | | | | | | | | | | | | | | | | | | | | | | | | | | | | | | | | | | | | | | | | | Operating expenses | | | (17 | ) | | | 1,558 | | | | 344 | | | | — | | | | | | | | 1,885 | | | Depreciation, depletion and amortization of tangible assets and mineral interests | | | (4 | ) | | | (347 | ) | | | (40 | ) | | | — | | | | | | | | (391 | ) | | | | | | | | | | | | | | | | | | | | | | | | | | | Operating income(b) | | | (21 | ) | | | 1,211 | | | | 304 | | | | — | | | | | | | | 1,494 | | | | | | | | | | | | | | | | | | | | | | | | | | | | Equity in income (loss) of affiliates and other items(c) | | | (160 | ) | | | 22 | | | | (123 | ) | | | (117 | ) | | | | | | | (378 | ) | | Tax on net operating income | | | 17 | | | | (413 | ) | | | (50 | ) | | | (3 | ) | | | | | | | (449 | ) | | | | | | | | | | | | | | | | | | | | | | | | | | | Net operating income(b) | | | (164 | ) | | | 820 | | | | 131 | | | | (120 | ) | | | | | | | 667 | | | | | | | | | | | | | | | | | | | | | | | | | | | | | Net cost of net debt | | | | | | | | | | | | | | | | | | | | | | | — | | | Minority interests | | | | | | | | | | | | | | | | | | | | | | | (4 | ) | | | | | | | | | | | | | | | | | | | | | | | | | | | Net income | | | | | | | | | | | | | | | | | | | | | | | 663 | | | | | | | | | | | | | | | | | | | | | | | | | | | |
| (a) | | | (a) | | Adjustments include special items, inventory valuation effect and equity share of adjustments related to Sanofi-Aventis.Sanofi. |
| | | | | | | | | | | | | | | | | | | | | (b) Of which inventory valuation effect | | Upstream | | | Downstream | | | Chemicals | | | Corporate | | | on operating income
| | | —Upstream | | | | 1,816Downstream | | | | 389Chemicals | | | | —Corporate | | | | | | | | | — | | | | 1,816 | | | | 389 | | | | — | | | | | | on net operating income | | | — | | | | 1,285 | | | 1,285 | 254 | | | | — | | | 254 | | | | — | | (c) Of which equity share of adjustments related to Sanofi-AventisSanofi | | | — | | | | — | | | | — | | | | (300 | ) | | — | | | | (300 | ) |
F-23
| | | | | | | | | | | | | | | | | | | | | | | | | For the year ended December 31, 2009
(adjusted) (M€)(a) | | Upstream | | | Downstream | | | Chemicals | | | Corporate | | | Intercompany | | | Total | | Non-Group sales | | | 16,072 | | | | 100,518 | | | | 14,726 | | | | 11 | | | | — | | | | 131,327 | | Intersegment sales | | | 15,958 | | | | 3,786 | | | | 735 | | | | 156 | | | | (20,635 | ) | | | — | | Excise taxes | | | — | | | | (19,174 | ) | | | — | | | | — | | | | — | | | | (19,174 | ) | Revenues from sales | | | 32,030 | | | | 85,130 | | | | 15,461 | | | | 167 | | | | (20,635 | ) | | | 112,153 | | Operating expenses | | | (14,735 | ) | | | (82,839 | ) | | | (14,637 | ) | | | (656 | ) | | | 20,635 | | | | (92,232 | ) | Depreciation, depletion and amortization of tangible assets and mineral interests | | | (4,416 | ) | | | (1,265 | ) | | | (575 | ) | | | (35 | ) | | | — | | | | (6,291 | ) | Adjusted operating income | | | 12,879 | | | | 1,026 | | | | 249 | | | | (524 | ) | | | — | | | | 13,630 | | Equity in income (loss) of affiliates and other items | | | 1,006 | | | | 147 | | | | 65 | | | | 814 | | | | — | | | | 2,032 | | Tax on net operating income | | | (7,503 | ) | | | (220 | ) | | | (42 | ) | | | 329 | | | | — | | | | (7,436 | ) | Adjusted net operating income | | | 6,382 | | | | 953 | | | | 272 | | | | 619 | | | | — | | | | 8,226 | | Net cost of net debt | | | | | | | | | | | | | | | | | | | | | | | (264 | ) | Non-controlling interests | | | | | | | | | | | | | | | | | | | | | | | (178 | ) | Adjusted net income | | | | | | | | | | | | | | | | | | | | | | | 7,784 | | Adjusted fully-diluted earnings per share (€) | | | | | | | | | | | | | | | | | | | | 3.48 | |
| | | | | | | | | | | | | | | | | | | | | | | | | | For the year ended December 31, 2009
| | | | | | | | | | | | | | | | | | | (adjusted)
| | | | | | | | | | | | | | | | | | | | (M€)(a) | | Upstream
| | | Downstream
| | | Chemicals
| | | Corporate
| | | Intercompany
| | | Total
| | | Non-Group sales | | | 16,072 | | | | 100,518 | | | | 14,726 | | | | 11 | | | | — | | | | 131,327 | | | Intersegment sales | | | 15,958 | | | | 3,786 | | | | 735 | | | | 156 | | | | (20,635 | ) | | | — | | | Excise taxes | | | — | | | | (19,174 | ) | | | — | | | | — | | | | — | | | | (19,174 | ) | | | | | | | | | | | | | | | | | | | | | | | | | | | Revenues from sales | | | 32,030 | | | | 85,130 | | | | 15,461 | | | | 167 | | | | (20,635 | ) | | | 112,153 | | | | | | | | | | | | | | | | | | | | | | | | | | | | | Operating expenses | | | (14,735 | ) | | | (82,839 | ) | | | (14,637 | ) | | | (656 | ) | | | 20,635 | | | | (92,232 | ) | | Depreciation, depletion and amortization of tangible assets and mineral interests | | | (4,416 | ) | | | (1,265 | ) | | | (575 | ) | | | (35 | ) | | | — | | | | (6,291 | ) | | | | | | | | | | | | | | | | | | | | | | | | | | | Adjusted operating income | | | 12,879 | | | | 1,026 | | | | 249 | | | | (524 | ) | | | — | | | | 13,630 | | | | | | | | | | | | | | | | | | | | | | | | | | | | | Equity in income (loss) of affiliates and other items | | | 1,006 | | | | 147 | | | | 65 | | | | 814 | | | | — | | | | 2,032 | | | Tax on net operating income | | | (7,503 | ) | | | (220 | ) | | | (42 | ) | | | 329 | | | | — | | | | (7,436 | ) | | | | | | | | | | | | | | | | | | | | | | | | | | | Adjusted net operating income | | | 6,382 | | | | 953 | | | | 272 | | | | 619 | | | | — | | | | 8,226 | | | | | | | | | | | | | | | | | | | | | | | | | | | | | Net cost of net debt | | | | | | | | | | | | | | | | | | | | | | | (264 | ) | | Minority interests | | | | | | | | | | | | | | | | | | | | | | | (178 | ) | | | | | | | | | | | | | | | | | | | | | | | | | | | Adjusted net income | | | | | | | | | | | | | | | | | | | | | | | 7,784 | | | | | | | | | | | | | | | | | | | | | | | | | | | | Adjusted fully-diluted earnings per share (€) | | | | | | | | | | | | | | | | | | | | | | | 3.48 | | | | | | | | | | | | | | | | | | | | | | | | | | | |
| (a) | | | (a) | | Except for earnings per share |
| | | | | | | | | | | | | | | | | | | | | | | For the year ended December 31, 2009
(M€) | | Upstream | | | Downstream | | | Chemicals | | | Corporate | | | Intercompany | | Total | | Total expenditures | | | 9,855 | | | | 2,771 | | | | 631 | | | | 92 | | | | | | 13,349 | | Total divestments | | | 398 | | | | 133 | | | | 47 | | | | 2,503 | | | | | | 3,081 | | Cash flow from operating activities | | | 10,200 | | | | 1,164 | | | | 1,082 | | | | (86 | ) | | | | | 12,360 | | Balance sheet as of December 31, 2009 | | | | | | | | | | | | | | | | | | | | | | | Property, plant and equipment, intangible assets, net | | | 43,997 | | | | 9,588 | | | | 5,248 | | | | 271 | | | | | | 59,104 | | Investments in equity affiliates | | | 4,260 | | | | 2,110 | | | | 652 | | | | 4,235 | | | | | | 11,257 | | Loans to equity affiliates and other non-current assets | | | 3,844 | | | | 1,369 | | | | 850 | | | | 547 | | | | | | 6,610 | | Working capital | | | 660 | | | | 7,624 | | | | 2,151 | | | | 58 | | | | | | 10,493 | | Provisions and other non-current liabilities | | | (15,364 | ) | | | (2,190 | ) | | | (1,721 | ) | | | (1,094 | ) | | | | | (20,369 | ) | Assets and liabilities classified as held for sale | | | — | | | | — | | | | — | | | | — | | | | | | — | | Capital Employed (balance sheet) | | | 37,397 | | | | 18,501 | | | | 7,180 | | | | 4,017 | | | | | | 67,095 | | Less inventory valuation effect | | | — | | | | (3,202 | ) | | | (282 | ) | | | 840 | | | | | | (2,644 | ) | Capital Employed (Business segment information) | | | 37,397 | | | | 15,299 | | | | 6,898 | | | | 4,857 | | | | | | 64,451 | | ROACE as a percentage | | | 18% | | | | 7% | | | | 4% | | | | | | | | | | 13% | |
The Group evaluates the return on equity as the ratio of adjusted consolidated net income to average adjusted shareholders’ equity between the beginning and the end of | | | | | | | | | | | | | | | | | | | | | | | | | | For the year ended December 31, 2009
| | | | | | | | | | | | | | | | | | | | (M€) | | Upstream
| | | Downstream
| | | Chemicals
| | | Corporate
| | | Intercompany
| | | Total
| | | Total expenditures | | | 9,855 | | | | 2,771 | | | | 631 | | | | 92 | | | | | | | | 13,349 | | | Total divestments | | | 398 | | | | 133 | | | | 47 | | | | 2,503 | | | | | | | | 3,081 | | | Cash flow from operating activities | | | 10,200 | | | | 1,164 | | | | 1,082 | | | | (86 | ) | | | | | | | 12,360 | | | | | | | | | | | | | | | | | | | | | | | | | | | | Balance sheet as of December 31, 2009 | | | | | | | | | | | | | | | | | | | | | | | | | | | | | | | | | | | | | | | | | | | | | | | | | | | | Property, plant and equipment, intangible assets, net | | | 43,997 | | | | 9,588 | | | | 5,248 | | | | 271 | | | | | | | | 59,104 | | | Investments in equity affiliates | | | 4,260 | | | | 2,110 | | | | 652 | | | | 4,235 | | | | | | | | 11,257 | | | Loans to equity affiliates and other non-current assets | | | 3,844 | | | | 1,369 | | | | 850 | | | | 547 | | | | | | | | 6,610 | | | Working capital | | | 660 | | | | 7,624 | | | | 2,151 | | | | 58 | | | | | | | | 10,493 | | | Provisions and other non-current liabilities | | | (15,364 | ) | | | (2,190 | ) | | | (1,721 | ) | | | (1,094 | ) | | | | | | | (20,369 | ) | | Assets and liabilities classified as held for sale | | | — | | | | — | | | | — | | | | — | | | | | | | | — | | | | | | | | | | | | | | | | | | | | | | | | | | | | Capital Employed (balance sheet) | | | 37,397 | | | | 18,501 | | | | 7,180 | | | | 4,017 | | | | | | | | 67,095 | | | Less inventory valuation effect | | | — | | | | (3,202 | ) | | | (282 | ) | | | 840 | | | | | | | | (2,644 | ) | | | | | | | | | | | | | | | | | | | | | | | | | | | | Capital Employed (Business segment information) | | | 37,397 | | | | 15,299 | | | | 6,898 | | | | 4,857 | | | | | | | | 64,451 | | | | | | | | | | | | | | | | | | | | | | | | | | | | ROACE as a percentage | | | 18% | | | | 7% | | | | 4% | | | | | | | | | | | | 13% | | | | | | | | | | | | | | | | | | | | | | | | | | | |
the period. Thus, adjusted shareholders’ equity for the year ended December 31, 2011 is calculated after payment of a dividend of€2.28 per share, subject to approval by the shareholders’ meeting on May 11, 2012. F-24
The ROE is calculated as follows: | | | | | | | | | | | | | | For the year ended December 31, (M€) | | 2011 | | | 2010 | | | 2009 | | Adjusted net income — Group share | | | 11,424 | | | | 10,288 | | | | 7,784 | | Adjusted non-controlling interests | | | 286 | | | | 234 | | | | 178 | | Adjusted consolidated net income | | | 11,710 | | | | 10,522 | | | | 7,962 | | Shareholders’ equity — Group share | | | 68,037 | | | | 60,414 | | | | 52,552 | | Distribution of the income based on existing shares at the closing date | | | (1,255 | ) | | | (2,553 | ) | | | (2,546 | ) | Non-controlling interests | | | 1,352 | | | | 857 | | | | 987 | | Adjusted shareholders’ equity(a) | | | 68,134 | | | | 58,718 | | | | 50,993 | | ROE | | | 18% | | | | 19% | | | | 16% | |
| | | | | | | | | | | | | | | | | | | | | | | | | | For the year ended December 31, 2008
| | | | | | | | | | | | | | | | | | | | (M€) | | Upstream
| | | Downstream
| | | Chemicals
| | | Corporate
| | | Intercompany
| | | Total
| | | Non-Group sales | | | 24,256 | | | | 135,524 | | | | 20,150 | | | | 46 | | | | — | | | | 179,976 | | | Intersegment sales | | | 25,132 | | | | 5,574 | | | | 1,252 | | | | 120 | | | | (32,078 | ) | | | — | | | Excise taxes | | | — | | | | (19,645 | ) | | | — | | | | — | | | | — | | | | (19,645 | ) | | | | | | | | | | | | | | | | | | | | | | | | | | | Revenues from sales | | | 49,388 | | | | 121,453 | | | | 21,402 | | | | 166 | | | | (32,078 | ) | | | 160,331 | | | | | | | | | | | | | | | | | | | | | | | | | | | | | Operating expenses | | | (21,915 | ) | | | (119,425 | ) | | | (20,942 | ) | | | (685 | ) | | | 32,078 | | | | (130,889 | ) | | Depreciation, depletion and amortization of tangible assets and mineral interests | | | (4,005 | ) | | | (1,202 | ) | | | (518 | ) | | | (30 | ) | | | — | | | | (5,755 | ) | | | | | | | | | | | | | | | | | | | | | | | | | | | Operating income | | | 23,468 | | | | 826 | | | | (58 | ) | | | (549 | ) | | | — | | | | 23,687 | | | | | | | | | | | | | | | | | | | | | | | | | | | | | Equity in income (loss) of affiliates and other items | | | 1,541 | | | | (158 | ) | | | (34 | ) | | | 590 | | | | — | | | | 1,939 | | | Tax on net operating income | | | (14,563 | ) | | | (143 | ) | | | 76 | | | | 315 | | | | — | | | | (14,315 | ) | | | | | | | | | | | | | | | | | | | | | | | | | | | Net operating income | | | 10,446 | | | | 525 | | | | (16 | ) | | | 356 | | | | — | | | | 11,311 | | | | | | | | | | | | | | | | | | | | | | | | | | | | | Net cost of net debt | | | | | | | | | | | | | | | | | | | | | | | (358 | ) | | Minority interests | | | | | | | | | | | | | | | | | | | | | | | (363 | ) | | | | | | | | | | | | | | | | | | | | | | | | | | | Net income | | | | | | | | | | | | | | | | | | | | | | | 10,590 | | | | | | | | | | | | | | | | | | | | | | | | | | | |
| | | | | | | | | | | | | | | | | | | | | | | | | | For the year ended December 31, 2008 (adjustments(a))
| | | | | | | | | | | | | | | | | | | | (M€) | | Upstream
| | | Downstream
| | | Chemicals
| | | Corporate
| | | Intercompany
| | | Total
| | | Non-Group sales | | | | | | | | | | | | | | | | | | | | | | | | | | Intersegment sales | | | | | | | | | | | | | | | | | | | | | | | | | | Excise taxes | | | | | | | | | | | | | | | | | | | | | | | | | | | | | | | | | | | | | | | | | | | | | | | | | | | Revenues from sales | | | | | | | | | | | | | | | | | | | | | | | | | | | | | | | | | | | | | | | | | | | | | | | | | | | | Operating expenses | | | — | | | | (2,776 | ) | | | (925 | ) | | | — | | | | | | | | (3,701 | ) | | Depreciation, depletion and amortization of tangible assets and mineral interest | | | (171 | ) | | | — | | | | (6 | ) | | | — | | | | | | | | (177 | ) | | | | | | | | | | | | | | | | | | | | | | | | | | | Operating income(b) | | | (171 | ) | | | (2,776 | ) | | | (931 | ) | | | — | | | | | | | | (3,878 | ) | | | | | | | | | | | | | | | | | | | | | | | | | | | Equity in income (loss) of affiliates and other items(c) | | | (164 | ) | | | (195 | ) | | | (82 | ) | | | (345 | ) | | | | | | | (786 | ) | | Tax on net operating income | | | 57 | | | | 927 | | | | 329 | | | | (2 | ) | | | | | | | 1,311 | | | | | | | | | | | | | | | | | | | | | | | | | | | | Net operating income(b) | | | (278 | ) | | | (2,044 | ) | | | (684 | ) | | | (347 | ) | | | | | | | (3,353 | ) | | | | | | | | | | | | | | | | | | | | | | | | | | | | Net cost of net debt | | | | | | | | | | | | | | | | | | | | | | | — | | | Minority interests | | | | | | | | | | | | | | | | | | | | | | | 23 | | | | | | | | | | | | | | | | | | | | | | | | | | | | Net income | | | | | | | | | | | | | | | | | | | | | | | (3,330 | ) | | | | | | | | | | | | | | | | | | | | | | | | | | |
| (a) | | | (a) | | Adjustments include special items, inventory valuation effect andAdjusted shareholders’ equity shareas of adjustments relatedDecember 31, 2008 amounted to Sanofi-Aventis.€47,410 million. |
| C) | | | | | | | | | | | | | | | | | (b) Of which inventory valuation effect | | Upstream | | | Downstream | | | Chemicals | | | Corporate | | | on operating income
| | | — | | | | (2,776 | ) | | | (727 | ) | | | — | | on net operating income
| | | — | | | | (1,971 | ) | | | (504 | ) | | | — | | (c) Of which equity share of adjustments related to Sanofi-Aventis
| | | — | | | | — | | | | — | | | | (393 | ) |
F-25
| | | | | | | | | | | | | | | | | | | | | | | | | | For the year ended December 31, 2008
| | | | | | | | | | | | | | | | | | | (adjusted)
| | | | | | | | | | | | | | | | | | | | (M€)(a) | | Upstream
| | | Downstream
| | | Chemicals
| | | Corporate
| | | Intercompany
| | | Total
| | | Non-Group sales | | | 24,256 | | | | 135,524 | | | | 20,150 | | | | 46 | | | | — | | | | 179,976 | | | Intersegment sales | | | 25,132 | | | | 5,574 | | | | 1,252 | | | | 120 | | | | (32,078 | ) | | | — | | | Excise taxes | | | — | | | | (19,645 | ) | | | — | | | | — | | | | — | | | | (19,645 | ) | | | | | | | | | | | | | | | | | | | | | | | | | | | Revenues from sales | | | 49,388 | | | | 121,453 | | | | 21,402 | | | | 166 | | | | (32,078 | ) | | | 160,331 | | | | | | | | | | | | | | | | | | | | | | | | | | | | | Operating expenses | | | (21,915 | ) | | | (116,649 | ) | | | (20,017 | ) | | | (685 | ) | | | 32,078 | | | | (127,188 | ) | | Depreciation, depletion and amortization of tangible assets and mineral interests | | | (3,834 | ) | | | (1,202 | ) | | | (512 | ) | | | (30 | ) | | | — | | | | (5,578 | ) | | | | | | | | | | | | | | | | | | | | | | | | | | | Adjusted operating income | | | 23,639 | | | | 3,602 | | | | 873 | | | | (549 | ) | | | — | | | | 27,565 | | | | | | | | | | | | | | | | | | | | | | | | | | | | | Equity in income (loss) of affiliates and other items | | | 1,705 | | | | 37 | | | | 48 | | | | 935 | | | | — | | | | 2,725 | | | Tax on net operating income | | | (14,620 | ) | | | (1,070 | ) | | | (253 | ) | | | 317 | | | | — | | | | (15,626 | ) | | | | | | | | | | | | | | | | | | | | | | | | | | | Adjusted net operating income | | | 10,724 | | | | 2,569 | | | | 668 | | | | 703 | | | | — | | | | 14,664 | | | | | | | | | | | | | | | | | | | | | | | | | | | | | Net cost of net debt | | | | | | | | | | | | | | | | | | | | | | | (358 | ) | | Minority interests | | | | | | | | | | | | | | | | | | | | | | | (386 | ) | | | | | | | | | | | | | | | | | | | | | | | | | | | Adjusted net income | | | | | | | | | | | | | | | | | | | | | | | 13,920 | | | | | | | | | | | | | | | | | | | | | | | | | | | | Adjusted fully-diluted earnings per share (€) | | | | | | | | | | | | | | | | | | | | | | | 6.20 | | | | | | | | | | | | | | | | | | | | | | | | | | | |
| | | (a) | | Except for earnings per share |
| | | | | | | | | | | | | | | | | | | | | | | | | | For the year ended December 31, 2008
| | | | | | | | | | | | | | | | | | | | (M€) | | Upstream
| | | Downstream
| | | Chemicals
| | | Corporate
| | | Intercompany
| | | Total
| | | Total expenditures | | | 10,017 | | | | 2,418 | | | | 1,074 | | | | 131 | | | | | | | | 13,640 | | | Total divestments | | | 1,130 | | | | 216 | | | | 53 | | | | 1,186 | | | | | | | | 2,585 | | | Cash flow from operating activities | | | 13,765 | | | | 3,111 | | | | 920 | | | | 873 | | | | | | | | 18,669 | | | | | | | | | | | | | | | | | | | | | | | | | | | | Balance sheet as of December 31, 2008 | | | | | | | | | | | | | | | | | | | | | | | | | | | | | | | | | | | | | | | | | | | | | | | | | | | | Property, plant and equipment, intangible assets, net | | | 37,090 | | | | 8,823 | | | | 5,323 | | | | 247 | | | | | | | | 51,483 | | | Investments in equity affiliates | | | 3,892 | | | | 1,958 | | | | 677 | | | | 6,134 | | | | | | | | 12,661 | | | Loans to equity affiliates and other non-current assets | | | 3,739 | | | | 1,170 | | | | 762 | | | | 545 | | | | | | | | 6,216 | | | Working capital | | | 570 | | | | 5,317 | | | | 2,348 | | | | (132 | ) | | | | | | | 8,103 | | | Provisions and other non-current liabilities | | | (12,610 | ) | | | (2,191 | ) | | | (1,903 | ) | | | (1,138 | ) | | | | | | | (17,842 | ) | | Assets and liabilities classified as held for sale | | | — | | | | — | | | | — | | | | — | | | | | | | | — | | | | | | | | | | | | | | | | | | | | | | | | | | | | Capital Employed (balance sheet) | | | 32,681 | | | | 15,077 | | | | 7,207 | | | | 5,656 | | | | | | | | 60,621 | | | Less inventory valuation effect | | | — | | | | (1,454 | ) | | | (46 | ) | | | 387 | | | | | | | | (1,113 | ) | | | | | | | | | | | | | | | | | | | | | | | | | | | Capital Employed (Business segment information) | | | 32,681 | | | | 13,623 | | | | 7,161 | | | | 6,043 | | | | | | | | 59,508 | | | | | | | | | | | | | | | | | | | | | | | | | | | | ROACE as a percentage | | | 36% | | | | 20% | | | | 9% | | | | | | | | | | | | 26% | | | | | | | | | | | | | | | | | | | | | | | | | | | |
F-26
| | B) | RECONCILIATION BETWEENOF THE INFORMATION BY BUSINESS SEGMENT INFORMATION AND THEWITH CONSOLIDATED STATEMENT OF INCOMEFINANCIAL STATEMENTS |
The table below presents the impact of adjustment items on the Consolidated Statement of Income: | | | | | | | | | | | | | | | | | | | | | | | Consolidated
| | For the year ended December 31, 2010
| | | | | | | | statement of
| | | (M€) | | Adjusted | | | Adjustments(a) | | | income | | | Sales | | | 159,269 | | | | — | | | | 159,269 | | | Excise taxes | | | (18,793 | ) | | | — | | | | (18,793 | ) | | Revenues from sales | | | 140,476 | | | | — | | | | 140,476 | | | Purchases, net of inventory variation | | | (94,286 | ) | | | 1,115 | | | | (93,171 | ) | | Other operating expenses | | | (19,035 | ) | | | (100 | ) | | | (19,135 | ) | | Exploration costs | | | (864 | ) | | | — | | | | (864 | ) | | Depreciation, depletion and amortization of tangible assets and mineral interests | | | (7,005 | ) | | | (1,416 | ) | | | (8,421 | ) | | Other income | | | 524 | | | | 872 | | | | 1,396 | | | Other expense | | | (346 | ) | | | (554 | ) | | | (900 | ) | | Financial interest on debt | | | (465 | ) | | | — | | | | (465 | ) | | Financial income from marketable securities & cash equivalents | | | 131 | | | | — | | | | 131 | | | Cost of net debt | | | (334 | ) | | | — | | | | (334 | ) | | Other financial income | | | 442 | | | | — | | | | 442 | | | Other financial expense | | | (407 | ) | | | — | | | | (407 | ) | | Equity in income (loss) of affiliates | | | 2,003 | | | | (50 | ) | | | 1,953 | | | Income taxes | | | (10,646 | ) | | | 418 | | | | (10,228 | ) | | | | | | | | | | | | | | | Consolidated net income | | | 10,522 | | | | 285 | | | | 10,807 | | | | | | | | | | | | | | | | | Group share | | | 10,288 | | | | 283 | | | | 10,571 | | | Minority interests | | | 234 | | | | 2 | | | | 236 | | | | | | | | | | | | | | | |
| | | | | | | | | | | | | | For the year ended December 31, 2011 (M€) | | Adjusted | | | Adjustments(a) | | | Consolidated
statement of
income | | Sales | | | 184,648 | | | | 45 | | | | 184,693 | | Excise taxes | | | (18,143 | ) | | | — | | | | (18,143 | ) | Revenues from sales | | | 166,505 | | | | 45 | | | | 166,550 | | Purchases, net of inventory variation | | | (115,107 | ) | | | 1,215 | | | | (113,892 | ) | Other operating expenses | | | (19,751 | ) | | | (92 | ) | | | (19,843 | ) | Exploration costs | | | (1,019 | ) | | | — | | | | (1,019 | ) | Depreciation, depletion and amortization of tangible assets and mineral interests | | | (6,725 | ) | | | (781 | ) | | | (7,506 | ) | Other income | | | 430 | | | | 1,516 | | | | 1,946 | | Other expense | | | (536 | ) | | | (711 | ) | | | (1,247 | ) | Financial interest on debt | | | (713 | ) | | | — | | | | (713 | ) | Financial income from marketable securities & cash equivalents | | | 273 | | | | — | | | | 273 | | Cost of net debt | | | (440 | ) | | | — | | | | (440 | ) | Other financial income | | | 609 | | | | — | | | | 609 | | Other financial expense | | | (429 | ) | | | — | | | | (429 | ) | Equity in income (loss) of affiliates | | | 1,984 | | | | (59 | ) | | | 1,925 | | Income taxes | | | (13,811 | ) | | | (262 | ) | | | (14,073 | ) | Consolidated net income | | | 11,710 | | | | 871 | | | | 12,581 | | Group share | | | 11,424 | | | | 852 | | | | 12,276 | | Non-controlling interests | | | 286 | | | | 19 | | | | 305 | |
| (a) | Adjustments include special items, inventory valuation effect and, as from January 1st, 2011, the effect of changes in fair value. |
| | | | | | | | | | | | | | For the year ended December 31, 2010 (M€) | | Adjusted | | | Adjustments(a) | | | Consolidated
statement of
income | | Sales | | | 159,269 | | | | — | | | | 159,269 | | Excise taxes | | | (18,793 | ) | | | — | | | | (18,793 | ) | Revenues from sales | | | 140,476 | | | | — | | | | 140,476 | | Purchases, net of inventory variation | | | (94,286 | ) | | | 1,115 | | | | (93,171 | ) | Other operating expenses | | | (19,035 | ) | | | (100 | ) | | | (19,135 | ) | Exploration costs | | | (864 | ) | | | — | | | | (864 | ) | Depreciation, depletion and amortization of tangible assets and mineral interests | | | (7,005 | ) | | | (1,416 | ) | | | (8,421 | ) | Other income | | | 524 | | | | 872 | | | | 1,396 | | Other expense | | | (346 | ) | | | (554 | ) | | | (900 | ) | Financial interest on debt | | | (465 | ) | | | — | | | | (465 | ) | Financial income from marketable securities & cash equivalents | | | 131 | | | | — | | | | 131 | | Cost of net debt | | | (334 | ) | | | — | | | | (334 | ) | Other financial income | | | 442 | | | | — | | | | 442 | | Other financial expense | | | (407 | ) | | | — | | | | (407 | ) | Equity in income (loss) of affiliates | | | 2,003 | | | | (50 | ) | | | 1,953 | | Income taxes | | | (10,646 | ) | | | 418 | | | | (10,228 | ) | Consolidated net income | | | 10,522 | | | | 285 | | | | 10,807 | | Group share | | | 10,288 | | | | 283 | | | | 10,571 | | Non-controlling interests | | | 234 | | | | 2 | | | | 236 | |
| (a) | | (a) | | Adjustments include special items, inventory valuation effect and, until June 30, 2010, equity share of adjustments related to Sanofi-Aventis.Sanofi. |
F-27
| | | | | | | | | | | | | | For the year ended December 31, 2009 (M€) | | Adjusted | | | Adjustments(a) | | | Consolidated
statement of
income | | Sales | | | 131,327 | | | | — | | | | 131,327 | | Excise taxes | | | (19,174 | ) | | | — | | | | (19,174 | ) | Revenues from sales | | | 112,153 | | | | — | | | | 112,153 | | Purchases, net of inventory variation | | | (73,263 | ) | | | 2,205 | | | | (71,058 | ) | Other operating expenses | | | (18,271 | ) | | | (320 | ) | | | (18,591 | ) | Exploration costs | | | (698 | ) | | | — | | | | (698 | ) | Depreciation, depletion and amortization of tangible assets and mineral interests | | | (6,291 | ) | | | (391 | ) | | | (6,682 | ) | Other income | | | 131 | | | | 183 | | | | 314 | | Other expense | | | (315 | ) | | | (285 | ) | | | (600 | ) | Financial interest on debt | | | (530 | ) | | | — | | | | (530 | ) | Financial income from marketable securities & cash equivalents | | | 132 | | | | — | | | | 132 | | Cost of net debt | | | (398 | ) | | | — | | | | (398 | ) | Other financial income | | | 643 | | | | — | | | | 643 | | Other financial expense | | | (345 | ) | | | — | | | | (345 | ) | Equity in income (loss) of affiliates | | | 1,918 | | | | (276 | ) | | | 1,642 | | Income taxes | | | (7,302 | ) | | | (449 | ) | | | (7,751 | ) | Consolidated net income | | | 7,962 | | | | 667 | | | | 8,629 | | Group share | | | 7,784 | | | | 663 | | | | 8,447 | | Non-controlling interests | | | 178 | | | | 4 | | | | 182 | |
| | | | | | | | | | | | | | | | | | | | | | | Consolidated
| | For the year ended December 31, 2009
| | | | | | | | statement of
| | | (M€) | | Adjusted | | | Adjustments(a) | | | income | | | Sales | | | 131,327 | | | | — | | | | 131,327 | | | Excise taxes | | | (19,174 | ) | | | — | | | | (19,174 | ) | | Revenues from sales | | | 112,153 | | | | — | | | | 112,153 | | | Purchases, net of inventory variation | | | (73,263 | ) | | | 2,205 | | | | (71,058 | ) | | Other operating expenses | | | (18,271 | ) | | | (320 | ) | | | (18,591 | ) | | Exploration costs | | | (698 | ) | | | — | | | | (698 | ) | | Depreciation, depletion and amortization of tangible assets and mineral interests | | | (6,291 | ) | | | (391 | ) | | | (6,682 | ) | | Other income | | | 131 | | | | 183 | | | | 314 | | | Other expense | | | (315 | ) | | | (285 | ) | | | (600 | ) | | Financial interest on debt | | | (530 | ) | | | — | | | | (530 | ) | | Financial income from marketable securities & cash equivalents | | | 132 | | | | — | | | | 132 | | | Cost of net debt | | | (398 | ) | | | — | | | | (398 | ) | | Other financial income | | | 643 | | | | — | | | | 643 | | | Other financial expense | | | (345 | ) | | | — | | | | (345 | ) | | Equity in income (loss) of affiliates | | | 1,918 | | | | (276 | ) | | | 1,642 | | | Income taxes | | | (7,302 | ) | | | (449 | ) | | | (7,751 | ) | | | | | | | | | | | | | | | Consolidated net income | | | 7,962 | | | | 667 | | | | 8,629 | | | | | | | | | | | | | | | | | Group share | | | 7,784 | | | | 663 | | | | 8,447 | | | Minority interests | | | 178 | | | | 4 | | | | 182 | | | | | | | | | | | | | | | |
| (a) | | | (a) | | Adjustments include special items, inventory valuation effect and equity share of adjustments related to Sanofi-Aventis.Sanofi. |
| | | | | | | | | | | | | | | | | | | | | | | Consolidated
| | For the year ended December 31, 2008
| | | | | | | | statement of
| | | (M€) | | Adjusted | | | Adjustments(a) | | | income | | | Sales | | | 179,976 | | | | — | | | | 179,976 | | | Excise taxes | | | (19,645 | ) | | | — | | | | (19,645 | ) | | Revenues from sales | | | 160,331 | | | | — | | | | 160,331 | | | Purchases, net of inventory variation | | | (107,521 | ) | | | (3,503 | ) | | | (111,024 | ) | | Other operating expenses | | | (18,903 | ) | | | (198 | ) | | | (19,101 | ) | | Exploration costs | | | (764 | ) | | | — | | | | (764 | ) | | Depreciation, depletion and amortization of tangible assets and mineral interests | | | (5,578 | ) | | | (177 | ) | | | (5,755 | ) | | Other income | | | 153 | | | | 216 | | | | 369 | | | Other expense | | | (147 | ) | | | (407 | ) | | | (554 | ) | | Financial interest on debt | | | (1,000 | ) | | | — | | | | (1,000 | ) | | Financial income from marketable securities & cash equivalents | | | 473 | | | | — | | | | 473 | | | Cost of net debt | | | (527 | ) | | | — | | | | (527 | ) | | Other financial income | | | 728 | | | | — | | | | 728 | | | Other financial expense | | | (325 | ) | | | — | | | | (325 | ) | | Equity in income (loss) of affiliates | | | 2,316 | | | | (595 | ) | | | 1,721 | | | Income taxes | | | (15,457 | ) | | | 1,311 | | | | (14,146 | ) | | | | | | | | | | | | | | | Consolidated net income | | | 14,306 | | | | (3,353 | ) | | | 10,953 | | | | | | | | | | | | | | | | | Group share | | | 13,920 | | | | (3,330 | ) | | | 10,590 | | | Minority interests | | | 386 | | | | (23 | ) | | | 363 | | | | | | | | | | | | | | | |
| | | (a) | | Adjustments include special items, inventory valuation effect and equity share of adjustments related to Sanofi-Aventis. |
F-28
| D) | | ADJUSTMENT ITEMS BY BUSINESS SEGMENT |
C) ADJUSTMENT ITEMS BY BUSINESS SEGMENT
The adjustment items for income as per Note 2 to the Consolidated Financial Statements are detailed as follows: Adjustments to operating income
| | | | | | | | | | | | | | | | | | | | | | | For the year ended December 31, 2010 (M€) | | Upstream | | | Downstream | | | Chemicals | | | Corporate | | | Total | | | Inventory valuation effect | | | — | | | | 863 | | | | 130 | | | | — | | | | 993 | | | Restructuring charges | | | — | | | | — | | | | — | | | | — | | | | — | | | Asset impairment charges | | | (203 | ) | | | (1,192 | ) | | | (21 | ) | | | — | | | | (1,416 | ) | | Other items | | | — | | | | 60 | | | | (38 | ) | | | — | | | | 22 | | | | | | | | | | | | | | | | | | | | | | | | Total | | | (203 | ) | | | (269 | ) | | | 71 | | | | — | | | | (401 | ) | | | | | | | | | | | | | | | | | | | | | | |
Adjustments to net income, Group share
| | | | | | | | | | | | | | | | | | | | | | | For the year ended December 31, 2010 (M€) | | Upstream | | | Downstream | | | Chemicals | | | Corporate | | | Total | | | Inventory valuation effect | | | — | | | | 635 | | | | 113 | | | | — | | | | 748 | | | TOTAL’s equity share of adjustments related to Sanofi-Aventis | | | — | | | | — | | | | — | | | | (81 | ) | | | (81 | ) | | Restructuring charges | | | — | | | | (12 | ) | | | (41 | ) | | | — | | | | (53 | ) | | Asset impairment charges | | | (297 | ) | | | (913 | ) | | | (14 | ) | | | — | | | | (1,224 | ) | | Gains (losses) on disposals of assets | | | 589 | | | | 122 | | | | 33 | | | | 302 | | | | 1,046 | | | Other items | | | (37 | ) | | | (83 | ) | | | (33 | ) | | | — | | | | (153 | ) | | | | | | | | | | | | | | | | | | | | | | | Total | | | 255 | | | | (251 | ) | | | 58 | | | | 221 | | | | 283 | | | | | | | | | | | | | | | | | | | | | | | |
Adjustments to operating income
| | | | | | | | | | | | | | | | | | | | | | | For the year ended December 31, 2009 (M€) | | Upstream | | | Downstream | | | Chemicals | | | Corporate | | | Total | | | Inventory valuation effect | | | — | | | | 1,816 | | | | 389 | | | | — | | | | 2,205 | | | Restructuring charges | | | — | | | | — | | | | — | | | | — | | | | — | | | Asset impairment charges | | | (4 | ) | | | (347 | ) | | | (40 | ) | | | — | | | | (391 | ) | | Other items | | | (17 | ) | | | (258 | ) | | | (45 | ) | | | — | | | | (320 | ) | | | | | | | | | | | | | | | | | | | | | | | Total | | | (21 | ) | | | 1,211 | | | | 304 | | | | — | | | | 1,494 | | | | | | | | | | | | | | | | | | | | | | | |
Adjustments to net income, Group share
| | | | | | | | | | | | | | | | | | | | | | | For the year ended December 31, 2009 (M€) | | Upstream | | | Downstream | | | Chemicals | | | Corporate | | | Total | | | Inventory valuation effect | | | — | | | | 1,279 | | | | 254 | | | | — | | | | 1,533 | | | TOTAL’s equity share of adjustments related to Sanofi-Aventis | | | — | | | | — | | | | — | | | | (300 | ) | | | (300 | ) | | Restructuring charges | | | — | | | | (27 | ) | | | (102 | ) | | | — | | | | (129 | ) | | Asset impairment charges | | | (52 | ) | | | (253 | ) | | | (28 | ) | | | — | | | | (333 | ) | | Gains (losses) on disposals of assets | | | — | | | | — | | | | — | | | | 179 | | | | 179 | | | Other items | | | (112 | ) | | | (182 | ) | | | 7 | | | | — | | | | (287 | ) | | | | | | | | | | | | | | | | | | | | | | | Total | | | (164 | ) | | | 817 | | | | 131 | | | | (121 | ) | | | 663 | | | | | | | | | | | | | | | | | | | | | | | |
F-29
| | | | | | | | | | | | | | | | | | | | | Adjustments to operating income
For the year ended December 31, 2011 (M€) | | Upstream | | | Downstream | | | Chemicals | | | Corporate | | | Total | | Inventory valuation effect | | | — | | | | 1,224 | | | | (9 | ) | | | — | | | | 1,215 | | Effect of changes in fair value | | | 45 | | | | — | | | | — | | | | — | | | | 45 | | Restructuring charges | | | — | | | | — | | | | — | | | | — | | | | — | | Asset impairment charges | | | (75 | ) | | | (700 | ) | | | (6 | ) | | | — | | | | (781 | ) | Other items | | | — | | | | (68 | ) | | | (24 | ) | | | — | | | | (92 | ) | Total | | | (30 | ) | | | 456 | | | | (39 | ) | | | — | | | | 387 | |
| | | | | | | | | | | | | | | | | | | | | Adjustments to net income, Group share
For the year ended December 31, 2011 (M€) | | Upstream | | | Downstream | | | Chemicals | | | Corporate | | | Total | | Inventory valuation effect | | | — | | | | 824 | | | | 10 | | | | — | | | | 834 | | Effect of changes in fair value | | | 32 | | | | — | | | | — | | | | — | | | | 32 | | Restructuring charges | | | — | | | | (113 | ) | | | (9 | ) | | | — | | | | (122 | ) | Asset impairment charges | | | (531 | ) | | | (478 | ) | | | (5 | ) | | | — | | | | (1,014 | ) | Gains (losses) on disposals of assets | | | 843 | | | | 412 | | | | 209 | | | | 74 | | | | 1,538 | | Other items | | | (202 | ) | | | (74 | ) | | | (76 | ) | | | (64 | ) | | | (416 | ) | Total | | | 142 | | | | 571 | | | | 129 | | | | 10 | | | | 852 | |
| | | | | | | | | | | | | | | | | | | | | Adjustments to operating income
For the year ended December 31, 2010 (M€) | | Upstream | | | Downstream | | | Chemicals | | | Corporate | | | Total | | Inventory valuation effect | | | — | | | | 863 | | | | 130 | | | | — | | | | 993 | | Restructuring charges | | | — | | | | — | | | | — | | | | — | | | | — | | Asset impairment charges | | | (203 | ) | | | (1,192 | ) | | | (21 | ) | | | — | | | | (1,416 | ) | Other items | | | — | | | | 60 | | | | (38 | ) | | | — | | | | 22 | | Total | | | (203 | ) | | | (269 | ) | | | 71 | | | | — | | | | (401 | ) |
| | | | | | | | | | | | | | | | | | | | | Adjustments to net income, Group share
For the year ended December 31, 2010 (M€) | | Upstream | | | Downstream | | | Chemicals | | | Corporate | | | Total | | Inventory valuation effect | | | — | | | | 635 | | | | 113 | | | | — | | | | 748 | | TOTAL’s equity share of adjustments related to Sanofi | | | — | | | | — | | | | — | | | | (81 | ) | | | (81 | ) | Restructuring charges | | | — | | | | (12 | ) | | | (41 | ) | | | — | | | | (53 | ) | Asset impairment charges | | | (297 | ) | | | (913 | ) | | | (14 | ) | | | — | | | | (1,224 | ) | Gains (losses) on disposals of assets | | | 589 | | | | 122 | | | | 33 | | | | 302 | | | | 1,046 | | Other items | | | (37 | ) | | | (83 | ) | | | (33 | ) | | | — | | | | (153 | ) | Total | | | 255 | | | | (251 | ) | | | 58 | | | | 221 | | | | 283 | |
| | | | | | | | | | | | | | | | | | | | | Adjustments to operating income For the year ended December 31, 2009 (M€) | | Upstream | | | Downstream | | | Chemicals | | | Corporate | | | Total | | Inventory valuation effect | | | — | | | | 1,816 | | | | 389 | | | | — | | | | 2,205 | | Restructuring charges | | | — | | | | — | | | | — | | | | — | | | | — | | Asset impairment charges | | | (4 | ) | | | (347 | ) | | | (40 | ) | | | — | | | | (391 | ) | Other items | | | (17 | ) | | | (258 | ) | | | (45 | ) | | | — | | | | (320 | ) | Total | | | (21 | ) | | | 1,211 | | | | 304 | | | | — | | | | 1,494 | | | | | | | | | Adjustments to net income, Group share For the year ended December 31, 2009 (M€) | | Upstream | | | Downstream | | | Chemicals | | | Corporate | | | Total | | Inventory valuation effect | | | — | | | | 1,279 | | | | 254 | | | | — | | | | 1,533 | | TOTAL’s equity share of adjustments related to Sanofi | | | — | | | | — | | | | — | | | | (300 | ) | | | (300 | ) | Restructuring charges | | | — | | | | (27 | ) | | | (102 | ) | | | — | | | | (129 | ) | Asset impairment charges | | | (52 | ) | | | (253 | ) | | | (28 | ) | | | — | | | | (333 | ) | Gains (losses) on disposals of assets | | | — | | | | — | | | | — | | | | 179 | | | | 179 | | Other items | | | (112 | ) | | | (182 | ) | | | 7 | | | | — | | | | (287 | ) | Total | | | (164 | ) | | | 817 | | | | 131 | | | | (121 | ) | | | 663 | |
Adjustments to operating income
| | | | | | | | | | | | | | | | | | | | | | | For the year ended December 31, 2008 (M€) | | Upstream | | | Downstream | | | Chemicals | | | Corporate | | | Total | | | Inventory valuation effect | | | — | | | | (2,776 | ) | | | (727 | ) | | | — | | | | (3,503 | ) | | Restructuring charges | | | — | | | | — | | | | — | | | | — | | | | — | | | Asset impairment charges | | | (171 | ) | | | — | | | | (6 | ) | | | — | | | | (177 | ) | | Other items | | | — | | | | — | | | | (198 | ) | | | — | | | | (198 | ) | | | | | | | | | | | | | | | | | | | | | | | Total | | | (171 | ) | | | (2,776 | ) | | | (931 | ) | | | — | | | | (3,878 | ) | | | | | | | | | | | | | | | | | | | | | | |
Adjustments to net income, Group share
| | | | | | | | | | | | | | | | | | | | | | | For the year ended December 31, 2008 (M€) | | Upstream | | | Downstream | | | Chemicals | | | Corporate | | | Total | | | Inventory valuation effect | | | — | | | | (1,949 | ) | | | (503 | ) | | | — | | | | (2,452 | ) | TOTAL’s equity share of adjustments related toSanofi-Aventis | | | — | | | | — | | | | — | | | | (393 | ) | | | (393 | ) | | Restructuring charges | | | — | | | | (47 | ) | | | (22 | ) | | | — | | | | (69 | ) | | Asset impairment charges | | | (172 | ) | | | (26 | ) | | | (7 | ) | | | — | | | | (205 | ) | | Gains (losses) on disposals of assets | | | 130 | | | | — | | | | — | | | | 84 | | | | 214 | | | Other items | | | (236 | ) | | | — | | | | (151 | ) | | | (38 | ) | | | (425 | ) | | | | | | | | | | | | | | | | | | | | | | | Total | | | (278 | ) | | | (2,022 | ) | | | (683 | ) | | | (347 | ) | | | (3,330 | ) | | | | | | | | | | | | | | | | | | | | | | |
| E) | | D) | ADDITIONAL INFORMATION ON IMPAIRMENTS |
In the Upstream, Downstream and Chemicals segments, impairments of assets have been recognized for the year ended December 31, 2010,2011, with an impact of €1,416€781 million in operating income and €1,224€1,014 million in net income, Group share. These impairments have been disclosed as adjustments to operating income and adjustments to net income, Group share. These items are identified in paragraph 4C4D above as adjustment items with the heading “Asset impairment charges”. The impairment losses impact certain Cash Generating Units (CGU) for which there were indications of impairment, due mainly to changes in the operating conditions or the economic environment of their specific businesses. The principles applied are the following: the recoverable amount of CGUs has been based on their value in use, as defined in Note 1 paragraph L to the Consolidated Financial Statements “Impairment of long-lived assets”; future cash flows have been determined with the assumptions in the long-term plan of the Group. These assumptions (including future prices of products, supply and demand for products, future production volumes) represent the best estimate by management of the Group of all economic conditions during the remaining life of assets; future cash flows, based on the long-term plan, are prepared over a period consistent with the life of the assets within the CGU. They are prepared post-tax and include specific risks attached to CGU assets. They are discounted using an 8% post-tax discount rate, this rate being a weighted-average capital cost estimated from historical market data. This rate has been applied consistently for the years ending in 2009, 2010 and 2011. SunPower is a CGU acquired in 2011 for which specific assumptions were applied because of its own financing and its listing on Nasdaq. Thus, future cash flows of this CGU have been discounted using a 14% post-tax discount rate, corresponding to the weighted-average capital cost of this CGU. value in use calculated by discounting the above post-tax cash flows using an 8% post-tax discount rate is not materially different from value in use calculated by discounting pre-tax cash flows using a pre-tax discount rate determined by an iterative computation from the post-tax value in use. These pre-tax discount rates are in a range from 10% to 13% in 2011. SunPower’s pre-tax discount rate is 16%. | | • | The recoverable amount of CGUs has been based on their value in use, as defined in Note 1 paragraph L to the Consolidated Financial Statements “Impairment of long-lived assets”; | • | Future cash flows have been determined with the assumptions in the long-term plan of the Group. These assumptions (including future prices of products, supply and demand for products, future production volumes) represent the best estimate by management of the Group of all economic conditions during the remaining life of assets; | • | Future cash flows, based on the long-term plan, are prepared over a period consistent with the life of the assets within the CGU. They are prepared post-tax and include specific risks attached to CGU assets. They are discounted using a 8% post-tax discount rate, this rate being a weighted-average capital cost estimated from historical market data. This rate has been applied consistently for the years ending in 2008, 2009 and 2010; | • | Value in use calculated by discounting the above post-tax cash flows using a 8% post-tax discount rate is not materially different from value in use calculated by discounting pre-tax cash flows using a pre-tax discount rate determined by an iterative computation from the post-tax value in use. These pre-tax discount rates are in a range from 9% to 12% in 2010. |
The CGUs of the Upstream segment affected by these impairments are oil fields, assets in solar energy and investments in associates accounted for by the equity method. For the year ended December 31, 2010,2011, the Group has recognized impairments with an impact of €203€75 million in operating income and €297€531 million in net income, Group share,share. A 10% decrease in hydrocarbons prices would not lead to additional impairment losses. In 2011, impairment losses accounted for mainly including aninclude the impairment of assets relatedthe whole goodwill arising from the acquisition of SunPower for€383 million. Indeed, the stress on public debt markets of some European states during the second half of 2011, successive austerity plans adopted by these states and their impact on financial incentives specific to its projectthe solar industry have greatly worsened the financial situation and forecasts of future cash flows of the solar industry companies, including SunPower. The market capitalization of these companies fell sharply in 2011, thus the share price of SunPower as of December 31, 2011 stood at $6.23 per share, down 73% compared to build an upgrader in Edmonton, the Group giving up this project as part of its agreements with Suncor.
F-30share price at the acquisition date.
The CGUs of the Downstream segment are affiliates or groups of affiliates (or industrial assets) organized mostly by country for the refining activities and by relevant geographical area for the marketing activities. In 2010,For the economic environment of refining activities, remainedthe unfavorable trends observed in 2010 have continued in 2011, with a worldwide context of surplus in refining capacities compared to the demand for petroleum products. This surplus is more and morestill based in Europe wherewith a falling demand, whereas the demand has been decreasing whereas in emerging countries (in Middle(Middle East and Asia) report a strong growth in the consumption growth is strong. Considering the specificities of industrial tools,petroleum products. In this remainingpersistent context of deteriorated margins, had a particularly negative impact on the results of the refining CGUs in France and in the United Kingdom and lead to strong operationalhave suffered substantial operating losses despite the constant efforts made to improve operations. Moreover inThis situation, coupled with less favorable outlooks, led the last few months some operators have announced site closures or triedGroup to dispose of some sites although no material transaction has occurred in 2010. These factors have triggered off the recognition ofrecognize impairments of assets in Europe, especially within the CGUs Refining France and United Kingdom reducing thewith an impact of€700 million in operating income by €1,192and€478 million and thein net income, Group share by €913 million. Sensitivity analysis performed on other European refining CGUs, using different actualization ratesshare. A variation of +5% of projections of gross margin in identical operating conditions would have a positive impact of€676 million in operating income and margins,€443 million in net income, Group share. A variation of (1) % of the discount rate would have not led to additional impairment charge.a positive impact of€335 million in operating income and€219 million in net income, Group share. Inverse variations of projections of gross margin and discount rate would have impacts of respectively €(683) million and€(249) million in operating income and€(448) million and€(164) million in net income, Group share. The CGUs of the Chemicals segment are worldwide business units, including activities or products with common strategic, commercial and industrial characteristics. The different scenarios of sensitivity would not lead to additional impairment losses.For the year ended December 31, 2010, impairments of assets have been recognized in the Upstream, Downstream and Chemicals segments with an impact of€1,416 million in operating income and€1,224 million in net income, Group share. These impairments have been disclosed as adjustments to operating income and adjustments to net income, Group share. For the year ended December 31, 2009, impairments of assets have been recognized in the Upstream, Downstream and Chemicals segments with an impact of €413€413 million in operating income and €382€382 million in net income, Group share. These impairments have been disclosed as adjustments to operating income for €391€391 million and adjustments to net income, Group share for €333€333 million. For the year ended December 31, 2008, impairments of assets have been recognized in the Upstream, Downstream and Chemicals segments with an impact of €216 million in operating income and €244 million in net income, Group share. These impairments have been disclosed as adjustments to operating income for €177 million and adjustments to net income, Group share for €205 million.
For the years ended December 31, 2011, 2010 and 2009, no reversal of impairment has been recognized. For the year ended December 31, 2008, reversals of impairment losses have been recognized in the Upstream segment with an impact of €41 million in operating income and €29 million in net income, Group share. 5)INFORMATION BY GEOGRAPHICAL AREA | | | | | | | | | | | | | | | | | | | | | | | | | | (M€) | | France | | | Rest of
Europe | | | North
America | | | Africa | | | Rest of the
world | | | Total | | For the year ended December 31, 2011 | | | | | | | | | | | | | | | | | | | | | | | | | Non-Group sales | | | 42,626 | | | | 81,453 | | | | 15,917 | | | | 15,077 | | | | 29,620 | | | | 184,693 | | Property, plant and equipment, intangible assets, net | | | 5,637 | | | | 15,576 | | | | 14,518 | | | | 23,546 | | | | 17,593 | | | | 76,870 | | Capital expenditures | | | 1,530 | | | | 3,802 | | | | 5,245 | | | | 5,264 | | | | 8,700 | | | | 24,541 | | For the year ended December 31, 2010 | | | | | | | | | | | | | | | | | | | | | | | | | Non-Group sales | | | 36,820 | | | | 72,636 | | | | 12,432 | | | | 12,561 | | | | 24,820 | | | | 159,269 | | Property, plant and equipment, intangible assets, net | | | 5,666 | | | | 14,568 | | | | 9,584 | | | | 20,166 | | | | 13,897 | | | | 63,881 | | Capital expenditures | | | 1,062 | | | | 2,629 | | | | 3,626 | | | | 4,855 | | | | 4,101 | | | | 16,273 | | For the year ended December 31, 2009 | | | | | | | | | | | | | | | | | | | | | | | | | Non-Group sales | | | 32,437 | | | | 60,140 | | | | 9,515 | | | | 9,808 | | | | 19,427 | | | | 131,327 | | Property, plant and equipment, intangible assets, net | | | 6,973 | | | | 15,218 | | | | 8,112 | | | | 17,312 | | | | 11,489 | | | | 59,104 | | Capital expenditures | | | 1,189 | | | | 2,502 | | | | 1,739 | | | | 4,651 | | | | 3,268 | | | | 13,349 | |
6)OPERATING EXPENSES | | | | | | | | | | | | | | For the year ended December 31, (M€) | | 2011 | | | 2010 | | | 2009 | | Purchases, net of inventory variation(a) | | | (113,892 | )(b) | | | (93,171 | ) | | | (71,058 | ) | Exploration costs | | | (1,019 | ) | | | (864 | ) | | | (698 | ) | Other operating expenses(c) | | | (19,843 | ) | | | (19,135 | ) | | | (18,591 | ) | of which non-current operating liabilities (allowances) reversals | | | 615 | | | | 387 | | | | 515 | | of which current operating liabilities (allowances) reversals | | | (150 | ) | | | (101 | ) | | | (43 | ) | Operating expenses | | | (134,754 | ) | | | (113,170 | ) | | | (90,347 | ) |
| (a) | | 5) | INFORMATION BY GEOGRAPHICAL AREA |
| | | | | | | | | | | | | | | | | | | | | | | | | | | | | | | | Rest of
| | | North
| | | | | | Rest of
| | | | | | (M€) | | France | | | Europe | | | America | | | Africa | | | the world | | | Total | | For the year ended December 31, 2010 | | | | | | | | | | | | | | | | | | | | | | | | | | Non-Group sales | | | 36,820 | | | | 72,636 | | | | 12,432 | | | | 12,561 | | | | 24,820 | | | | 159,269 | | | Property, plant and equipment, intangible assets, net | | | 5,666 | | | | 14,568 | | | | 9,584 | | | | 20,166 | | | | 13,897 | | | | 63,881 | | | Capital expenditures | | | 1,062 | | | | 2,629 | | | | 3,626 | | | | 4,855 | | | | 4,101 | | | | 16,273 | | | | | | | | | | | | | | | | | | | | | | | | | | | | For the year ended December 31, 2009 | | | | | | | | | | | | | | | | | | | | | | | | | | Non-Group sales | | | 32,437 | | | | 60,140 | | | | 9,515 | | | | 9,808 | | | | 19,427 | | | | 131,327 | | | Property, plant and equipment, intangible assets, net | | | 6,973 | | | | 15,218 | | | | 8,112 | | | | 17,312 | | | | 11,489 | | | | 59,104 | | | Capital expenditures | | | 1,189 | | | | 2,502 | | | | 1,739 | | | | 4,651 | | | | 3,268 | | | | 13,349 | | | | | | | | | | | | | | | | | | | | | | | | | | | | For the year ended December 31, 2008 | | | | | | | | | | | | | | | | | | | | | | | | | | Non-Group sales | | | 43,616 | | | | 82,761 | | | | 14,002 | | | | 12,482 | | | | 27,115 | | | | 179,976 | | | Property, plant and equipment, intangible assets, net | | | 7,260 | | | | 13,485 | | | | 5,182 | | | | 15,460 | | | | 10,096 | | | | 51,483 | | | Capital expenditures | | | 1,997 | | | | 2,962 | | | | 1,255 | | | | 4,500 | | | | 2,926 | | | | 13,640 | | | | | | | | | | | | | | | | | | | | | | | | | | | |
F-31
| | | | | | | | | | | | | | | For the year ended December 31, (M€) | | 2010 | | | 2009 | | | 2008 | | Purchases, net of inventory variation(a) | | | (93,171 | ) | | | (71,058 | ) | | | (111,024 | ) | | Exploration costs | | | (864 | ) | | | (698 | ) | | | (764 | ) | Other operating expenses(b) | | | (19,135 | ) | | | (18,591 | ) | | | (19,101 | ) | of which non-current operating liabilities (allowances) reversals | | | 387 | | | | 515 | | | | 459 | | of which current operating liabilities (allowances) reversals | | | (101 | ) | | | (43 | ) | | | (29 | ) | | | | | | | | | | | | | | | Operating expenses | | | (113,170 | ) | | | (90,347 | ) | | | (130,889 | ) | | | | | | | | | | | | | | |
| | | (a) | | Includes taxes paid on oil and gas production in the Upstream segment, namely royalties. |
| (b) | As of December 31, 2011, the Group valued under / over lifting at market value. The impact in operating expenses is€577 million and€103 million in net income, Group share as of December 31, 2011. |
| (c) | Principally composed of production and administrative costs (see in particular the payroll costs as detailed in Note 26 to the Consolidated Financial Statements “Payroll and staff”). |
| 7) | | 7) | OTHER INCOME AND OTHER EXPENSE |
| | | | | | | | | | | | | | | For the year ended December 31, (M€) | | 2010 | | | 2009 | | | 2008 | | | Gains (losses) on disposal of assets | | | 1,117 | | | | 200 | | | | 257 | | | Foreign exchange gains | | | — | | | | — | | | | 112 | | | Other | | | 279 | | | | 114 | | | | — | | | | | | | | | | | | | | | | Other income | | | 1,396 | | | | 314 | | | | 369 | | | | | | | | | | | | | | | | | Foreign exchange losses | | | — | | | | (32 | ) | | | — | | | Amortization of other intangible assets (excl. mineral interests) | | | (267 | ) | | | (142 | ) | | | (162 | ) | | Other | | | (633 | ) | | | (426 | ) | | | (392 | ) | | | | | | | | | | | | | | | Other expense | | | (900 | ) | | | (600 | ) | | | (554 | ) | | | | | | | | | | | | | | |
| | | | | | | | | | | | | For the year ended
December 31, (M€) | | 2011 | | | 2010 | | | 2009 | | Gains (losses) on disposal of assets | | | 1,650 | | | | 1,117 | | | | 200 | | Foreign exchange gains | | | 118 | | | | — | | | | — | | Other | | | 178 | | | | 279 | | | | 114 | | Other income | | | 1,946 | | | | 1,396 | | | | 314 | | Foreign exchange losses | | | — | | | | — | | | | (32 | ) | Amortization of other intangible assets (excl. mineral interests) | | | (592 | ) | | | (267 | ) | | | (142 | ) | Other | | | (655 | ) | | | (633 | ) | | | (426 | ) | Other expense | | | (1,247 | ) | | | (900 | ) | | | (600 | ) |
Other income In 2011, gains and losses on disposal of assets are mainly related to the sale of the interest in CEPSA, to the sale of assets in the Upstream segment (especially the sale of 10% Group’s interest in the Colombian pipeline OCENSA) and to the sale of photocure and coatings resins businesses. These disposals are described in Note 3 to the Consolidated Financial Statements. In 2010, gains and losses on disposal of assets arewere mainly related to sales of assets in the Upstream segment (sale of the interests in the Valhall and Hod fields in Norway and sale of the interest in Block 31 in Angola, see Note 3 to the Consolidated Financial Statements), as well as the change in the accounting treatment and the disposal of shares of Sanofi-AventisSanofi (see Note 3 to the Consolidated Financial Statements). In 2009, gains and losses on disposal of assets were mainly related to the disposal of shares of Sanofi-Aventis. In 2008, gains and losses on disposal of assets were mainly related to sales of assets in the Upstream segment, as well as the disposal of shares of Sanofi-Aventis.
In 2010,2011, the heading “Other” is mainly comprised of €248€243 million of restructuring charges in the Upstream, Downstream and Chemicals segments. In 2010, the heading “Other” was mainly comprised of€248 million of restructuring charges in the Downstream and Chemicals segments. In 2009, the heading “Other” was mainly comprised of €190€190 million of restructuring charges in the Downstream and Chemicals segments. In 2008, the heading “Other” was mainly comprised of:
| 8) | | • | €107 million of restructuring charges in the Upstream, Downstream and Chemicals segments; and | • | €48 million of changes in provisions related to various antitrust investigations as described in Note 32 to the Consolidated Financial Statements “Other risks and contingent liabilities”. |
F-32
| | 8) | OTHER FINANCIAL INCOME AND EXPENSE |
| | | | | | | | | | | | | | | As of December 31, (M€) | | 2010 | | | 2009 | | | 2008 | | | Dividend income on non-consolidated subsidiaries | | | 255 | | | | 210 | | | | 238 | | | Capitalized financial expenses | | | 113 | | | | 117 | | | | 271 | | | Other | | | 74 | | | | 316 | | | | 219 | | Other financial income | | | 442 | | | | 643 | | | | 728 | | | | | | | | | | | | | | | | | Accretion of asset retirement obligations | | | (338 | ) | | | (283 | ) | | | (229 | ) | | Other | | | (69 | ) | | | (62 | ) | | | (96 | ) | | | | | | | | | | | | | | | Other financial expense | | | (407 | ) | | | (345 | ) | | | (325 | ) | | | | | | | | | | | | | | |
| | | | | | | | | | | | | | As of December 31, (M€) | | 2011 | | | 2010 | | | 2009 | | Dividend income on non-consolidated subsidiaries | | | 330 | | | | 255 | | | | 210 | | Capitalized financial expenses | | | 171 | | | | 113 | | | | 117 | | Other | | | 108 | | | | 74 | | | | 316 | | Other financial income | | | 609 | | | | 442 | | | | 643 | | Accretion of asset retirement obligations | | | (344 | ) | | | (338 | ) | | | (283 | ) | Other | | | (85 | ) | | | (69 | ) | | | (62 | ) | Other financial expense | | | (429 | ) | | | (407 | ) | | | (345 | ) |
9)INCOME TAXES Since 1966, the Group hashad been taxed in accordance with the consolidated income tax treatment approved on a three-year renewable basis by the French Ministry of Economy, Finance and Industry. The approval for the period 2008-2010 expired on December 31, 2010 and TOTAL S.A. announced in July 2011 that it took the decision not to proceed with its initial application for the renewal of this approvalagreement. As a consequence, TOTAL S.A. is taxed in accordance with the common tax regime as from 2011. The exit of the consolidated income tax treatment has been requested forno significant impact, neither on the2011-2013 period. It is being reviewed by Group’s financial situation nor on the French Department of Budget, Public Accounts, Civil Service and State Reform. consolidated results.No deferred tax is recognized for the temporary differences between the carrying amounts and tax bases of investments in foreign subsidiaries which are considered to be permanent investments. Undistributed earnings from foreign subsidiaries considered to be reinvested indefinitely amounted to €26,458€27,444 million as of December 31, 2010.2011. The determination of the tax effect relating to such reinvested income is not practicable. In addition, no deferred tax is recognized on unremitted earnings (approximately €21,147€22,585 million) of the Group’s French subsidiaries since the remittance of such earnings would be tax exempt for the subsidiaries in which the Company owns 95% or more of the outstanding shares. Income taxes are detailed as follows: | | | | | | | | | | | | | For the year ended
December 31, (M€) | | 2011 | | | 2010 | | | 2009 | | Current income taxes | | | (12,495 | ) | | | (9,934 | ) | | | (7,213 | ) | Deferred income taxes | | | (1,578 | ) | | | (294 | ) | | | (538 | ) | Total income taxes | | | (14,073 | ) | | | (10,228 | ) | | | (7,751 | ) |
| | | | | | | | | | | | | | | For the year ended December 31, (M€) | | 2010 | | | 2009 | | | 2008 | | | Current income taxes | | | (9,934 | ) | | | (7,213 | ) | | | (14,117 | ) | | Deferred income taxes | | | (294 | ) | | | (538 | ) | | | (29 | ) | | | | | | | | | | | | | | | Total income taxes | | | (10,228 | ) | | | (7,751 | ) | | | (14,146 | ) | | | | | | | | | | | | | | |
Before netting deferred tax assets and liabilities by fiscal entity, the components of deferred tax balances are as follows: | | | | | | | | | | | | | | | As of December 31, (M€) | | 2010 | | | 2009 | | | 2008 | | | Net operating losses and tax carry forwards | | | 1,145 | | | | 1,114 | | | | 1,031 | | | Employee benefits | | | 535 | | | | 517 | | | | 519 | | | Other temporary non-deductible provisions | | | 2,757 | | | | 2,184 | | | | 2,075 | | | | | | | | | | | | | | | | Gross deferred tax assets | | | 4,437 | | | | 3,815 | | | | 3,625 | | | | | | | | | | | | | | | | | Valuation allowance | | | (576 | ) | | | (484 | ) | | | (475 | ) | | | | | | | | | | | | | | | Net deferred tax assets | | | 3,861 | | | | 3,331 | | | | 3,150 | | | | | | | | | | | | | | | | | Excess tax over book depreciation | | | (10,966 | ) | | | (9,791 | ) | | | (8,836 | ) | | Other temporary tax deductions | | | (1,339 | ) | | | (1,179 | ) | | | (1,171 | ) | | | | | | | | | | | | | | | Gross deferred tax liability | | | (12,305 | ) | | | (10,970 | ) | | | (10,007 | ) | | | | | | | | | | | | | | | Net deferred tax liability | | | (8,444 | ) | | | (7,639 | ) | | | (6,857 | ) | | | | | | | | | | | | | | |
F-33
| | | | | | | | | | | | | | As of December 31, (M€) | | 2011 | | | 2010 | | | 2009 | | Net operating losses and tax carry forwards | | | 1,584 | | | | 1,145 | | | | 1,114 | | Employee benefits | | | 621 | | | | 535 | | | | 517 | | Other temporary non-deductible provisions | | | 3,521 | | | | 2,757 | | | | 2,184 | | Gross deferred tax assets | | | 5,726 | | | | 4,437 | | | | 3,815 | | Valuation allowance | | | (667 | ) | | | (576 | ) | | | (484 | ) | Net deferred tax assets | | | 5,059 | | | | 3,861 | | | | 3,331 | | Excess tax over book depreciation | | | (12,831 | ) | | | (10,966 | ) | | | (9,791 | ) | Other temporary tax deductions | | | (2,721 | ) | | | (1,339 | ) | | | (1,179 | ) | Gross deferred tax liability | | | (15,552 | ) | | | (12,305 | ) | | | (10,970 | ) | Net deferred tax liability | | | (10,493 | ) | | | (8,444 | ) | | | (7,639 | ) |
Net operating losses and tax carry forwards only come from foreign subsidiaries. After netting deferred tax assets and liabilities by fiscal entity, deferred taxes are presented on the balance sheet as follows: | | | | | | | | | | | | | | | As of December 31, (M€) | | 2010 | | | 2009 | | | 2008 | | | Deferred tax assets, non-current (note 14) | | | 1,378 | | | | 1,164 | | | | 1,010 | | | Deferred tax assets, current (note 16) | | | 151 | | | | 214 | | | | 206 | | | Deferred tax liabilities, non-current | | | (9,947 | ) | | | (8,948 | ) | | | (7,973 | ) | | Deferred tax liabilities, current | | | (26 | ) | | | (69 | ) | | | (100 | ) | | | | | | | | | | | | | | | Net amount | | | (8,444 | ) | | | (7,639 | ) | | | (6,857 | ) | | | | | | | | | | | | | | |
| | | | | | | | | | | | | | As of December 31, (M€) | | 2011 | | | 2010 | | | 2009 | | Deferred tax assets, non-current(note 14) | | | 1,767 | | | | 1,378 | | | | 1,164 | | Deferred tax assets, current(note 16) | | | — | | | | 151 | | | | 214 | | Deferred tax liabilities, non-current | | | (12,260 | ) | | | (9,947 | ) | | | (8,948 | ) | Deferred tax liabilities, current | | | — | | | | (26 | ) | | | (69 | ) | Net amount | | | (10,493 | ) | | | (8,444 | ) | | | (7,639 | ) |
The net deferred tax variation in the balance sheet is analyzed as follows: | | | | | | | | | | | | | | | As of December 31, (M€) | | 2010 | | | 2009 | | | 2008 | | Opening balance | | | (7,639 | ) | | | (6,857 | ) | | | (7,251 | ) | | Deferred tax on income | | | (294 | ) | | | (538 | ) | | | (29 | ) | Deferred tax on shareholders’ equity(a) | | | 28 | | | | (38 | ) | | | 30 | | | Changes in scope of consolidation | | | (59 | ) | | | (1 | ) | | | (1 | ) | | Currency translation adjustment | | | (480 | ) | | | (205 | ) | | | 394 | | | | | | | | | | | | | | | | Closing balance | | | (8,444 | ) | | | (7,639 | ) | | | (6,857 | ) | | | | | | | | | | | | | | |
| | | | | | | | | | | | | | As of December 31, (M€) | | 2011 | | | 2010 | | | 2009 | | Opening balance | | | (8,444 | ) | | | (7,639 | ) | | | (6,857 | ) | Deferred tax on income | | | (1,578 | ) | | | (294 | ) | | | (538 | ) | Deferred tax on shareholders’ equity(a) | | | (55 | ) | | | 28 | | | | (38 | ) | Changes in scope of consolidation | | | (17 | ) | | | (59 | ) | | | (1 | ) | Currency translation adjustment | | | (399 | ) | | | (480 | ) | | | (205 | ) | Closing balance | | | (10,493 | ) | | | (8,444 | ) | | | (7,639 | ) |
| (a) | | | (a) | | This amount includes mainly current income taxes and deferred taxes for changes in fair value of listed securities classified as financial assets available for sale as well as deferred taxes related to the cash flow hedge (see Note 17 to the Consolidated Financial Statements). |
Reconciliation between provision for income taxes and pre-tax income: | | | | | | | | | | | | | | | For the year ended December 31, (M€) | | 2010 | | | 2009 | | | 2008 | | | Consolidated net income | | | 10,807 | | | | 8,629 | | | | 10,953 | | | Provision for income taxes | | | 10,228 | | | | 7,751 | | | | 14,146 | | Pre-tax income | | | 21,035 | | | | 16,380 | | | | 25,099 | | | French statutory tax rate | | | 34.43% | | | | 34.43% | | | | 34.43% | | | | | | | | | | | | | | | | Theoretical tax charge | | | (7,242 | ) | | | (5,640 | ) | | | (8,642 | ) | | | | | | | | | | | | | | | | Difference between French and foreign income tax rates | | | (4,921 | ) | | | (3,214 | ) | | | (6,326 | ) | | Tax effect of equity in income (loss) of affiliates | | | 672 | | | | 565 | | | | 593 | | | Permanent differences | | | 1,375 | | | | 597 | | | | 315 | | | Adjustments on prior years income taxes | | | (45 | ) | | | (47 | ) | | | 12 | | | Adjustments on deferred tax related to changes in tax rates | | | 2 | | | | (1 | ) | | | (31 | ) | | Changes in valuation allowance of deferred tax assets | | | (65 | ) | | | (6 | ) | | | (63 | ) | | Other | | | (4 | ) | | | (5 | ) | | | (4 | ) | | | | | | | | | | | | | | | Net provision for income taxes | | | (10,228 | ) | | | (7,751 | ) | | | (14,146 | ) | | | | | | | | | | | | | | |
| | | | | | | | | | | | | | For the year ended December 31, (M€) | | 2011 | | | 2010 | | | 2009 | | Consolidated net income | | | 12,581 | | | | 10,807 | | | | 8,629 | | Provision for income taxes | | | 14,073 | | | | 10,228 | | | | 7,751 | | Pre-tax income | | | 26,654 | | | | 21,035 | | | | 16,380 | | French statutory tax rate | | | 36.10% | | | | 34.43% | | | | 34.43% | | Theoretical tax charge | | | (9,622 | ) | | | (7,242 | ) | | | (5,640 | ) | Difference between French and foreign income tax rates | | | (5,740 | ) | | | (4,921 | ) | | | (3,214 | ) | Tax effect of equity in income (loss) of affiliates | | | 695 | | | | 672 | | | | 565 | | Permanent differences | | | 889 | | | | 1,375 | | | | 597 | | Adjustments on prior years income taxes | | | (19 | ) | | | (45 | ) | | | (47 | ) | Adjustments on deferred tax related to changes in tax rates | | | (201 | ) | | | 2 | | | | (1 | ) | Changes in valuation allowance of deferred tax assets | | | (71 | ) | | | (65 | ) | | | (6 | ) | Other | | | (4 | ) | | | (4 | ) | | | (5 | ) | Net provision for income taxes | | | (14,073 | ) | | | (10,228 | ) | | | (7,751 | ) |
The French statutory tax rate includes the standard corporate tax rate (33.33%) and additional applicable taxes that bring the overall tax rate to 36.10% in 2011 (versus 34.43% in 2010 (identical to 2009 and 2008)2009). Permanent differences are mainly due to impairment of goodwill and to dividends from non-consolidated companies as well as the specific taxation rules applicable to certain activities and within the consolidated income tax treatment.
F-34activities.
Net operating losses and tax credit carryforwards Deferred tax assets related to net operating losses and tax carryforwards expire in the following years: | | | | | | | | | | | | | | | | | | | | | | | | | | | As of December 31, (M€) | | 2010 | | | 2009 | | | 2008 | | | | | Basis | | | Tax | | | Basis | | | Tax | | | Basis | | | Tax | | | 2009 | | | — | | | | — | | | | — | | | | — | | | | 233 | | | | 115 | | | 2010 | | | — | | | | — | | | | 258 | | | | 126 | | | | 167 | | | | 79 | | | 2011 | | | 225 | | | | 110 | | | | 170 | | | | 83 | | | | 93 | | | | 42 | | | 2012 | | | 177 | | | | 80 | | | | 121 | | | | 52 | | | | 61 | | | | 19 | | 2013(a) | | | 146 | | | | 59 | | | | 133 | | | | 43 | | | | 1,765 | | | | 587 | | 2014(b) | | | 1,807 | | | | 602 | | | | 1,804 | | | | 599 | | | | — | | | | — | | | 2015 and after | | | 190 | | | | 62 | | | | — | | | | — | | | | — | | | | — | | | Unlimited | | | 774 | | | | 232 | | | | 661 | | | | 211 | | | | 560 | | | | 189 | | | | | | | | | | | | | | | | | | | | | | | | | | | | Total | | | 3,319 | | | | 1,145 | | | | 3,147 | | | | 1,114 | | | | 2,879 | | | | 1,031 | | | | | | | | | | | | | | | | | | | | | | | | | | | |
| | | | | | | | | | | | | | | | | | | | | | | | | | | | 2011 | | | 2010 | | | 2009 | | As of December 31, (M€) | | Basis | | | Tax | | | Basis | | | Tax | | | Basis | | | Tax | | 2010 | | | — | | | | — | | | | — | | | | — | | | | 258 | | | | 126 | | 2011 | | | — | | | | — | | | | 225 | | | | 110 | | | | 170 | | | | 83 | | 2012 | | | 242 | | | | 115 | | | | 177 | | | | 80 | | | | 121 | | | | 52 | | 2013 | | | 171 | | | | 81 | | | | 146 | | | | 59 | | | | 133 | | | | 43 | | 2014(a) | | | 104 | | | | 47 | | | | 1,807 | | | | 602 | | | | 1,804 | | | | 599 | | 2015(b) | | | 8 | | | | 2 | | | | 190 | | | | 62 | | | | — | | | | — | | 2016 and after | | | 2,095 | | | | 688 | | | | — | | | | — | | | | — | | | | — | | Unlimited | | | 2,119 | | | | 651 | | | | 774 | | | | 232 | | | | 661 | | | | 211 | | Total | | | 4,739 | | | | 1,584 | | | | 3,319 | | | | 1,145 | | | | 3,147 | | | | 1,114 | |
| (a) | | | (a)
| | Net operating losses and tax credit carryforwards in 2013 and after for 2008 | (b) | | Net operating losses and tax credit carryforwards in 2014 and after for 20092009. |
| (b) | | 10) Net operating losses and tax credit carryforwards in 2015 and after for 2010.
| INTANGIBLE ASSETS |
| | | | | | | | | | | | | | | | | | | | Amortization
| | | | | | | | | | | and
| | | | | | As of December 31, 2010 (M€) | | Cost | | | impairment | | | Net | | | Goodwill | | | 1,498 | | | | (596 | ) | | | 902 | | | Proved and unproved mineral interests | | | 10,099 | | | | (2,712 | ) | | | 7,387 | | | Other intangible assets | | | 2,803 | | | | (2,175 | ) | | | 628 | | | | | | | | | | | | | | | | Total intangible assets | | | 14,400 | | | | (5,483 | ) | | | 8,917 | | | | | | | | | | | | | | | |
| | | | | | | | | | | | | | | | | | | | Amortization
| | | | | | | | | | | and
| | | | | | As of December 31, 2009 (M€) | | Cost | | | impairment | | | Net | | | Goodwill | | | 1,776 | | | | (614 | ) | | | 1,162 | | | Proved and unproved mineral interests | | | 8,204 | | | | (2,421 | ) | | | 5,783 | | | Other intangible assets | | | 2,712 | | | | (2,143 | ) | | | 569 | | | | | | | | | | | | | | | | Total intangible assets | | | 12,692 | | | | (5,178 | ) | | | 7,514 | | | | | | | | | | | | | | | |
| | | | | | | | | | | | | | | | | | | | Amortization
| | | | | | | | | | | and
| | | | | | As of December 31, 2008 (M€) | | Cost | | | impairment | | | Net | | | Goodwill | | | 1,690 | | | | (616 | ) | | | 1,074 | | | Proved and unproved mineral interests | | | 6,010 | | | | (2,268 | ) | | | 3,742 | | | Other intangible assets | | | 2,519 | | | | (1,994 | ) | | | 525 | | | | | | | | | | | | | | | | Total intangible assets | | | 10,219 | | | | (4,878 | ) | | | 5,341 | | | | | | | | | | | | | | | |
10)INTANGIBLE ASSETS | | | | | | | | | | | | | | As of December 31, 2011 (M€) | | Cost | | | Amortization and
impairment | | | Net | | Goodwill | | | 1,903 | | | | (993 | ) | | | 910 | | Proved and unproved mineral interests | | | 13,719 | | | | (3,181 | ) | | | 10,538 | | Other intangible assets | | | 3,377 | | | | (2,412 | ) | | | 965 | | | Total intangible assets | | 18,999 | | | (6,586) | | | 12,413 | |
| | | | | | | | | | | | | | As of December 31, 2010 (M€) | | Cost | | | Amortization and
impairment | | | Net | | Goodwill | | | 1,498 | | | | (596 | ) | | | 902 | | Proved and unproved mineral interests | | | 10,099 | | | | (2,712 | ) | | | 7,387 | | Other intangible assets | | | 2,803 | | | | (2,175 | ) | | | 628 | | Total intangible assets | | | 14,400 | | | | (5,483 | ) | | | 8,917 | |
| | | | | | | | | | | | | | As of December 31, 2009 (M€) | | Cost | | | Amortization and
impairment | | | Net | | Goodwill | | | 1,776 | | | | (614 | ) | | | 1,162 | | Proved and unproved mineral interests | | | 8,204 | | | | (2,421 | ) | | | 5,783 | | Other intangible assets | | | 2,712 | | | | (2,143 | ) | | | 569 | | Total intangible assets | | | 12,692 | | | | (5,178 | ) | | | 7,514 | |
Changes in net intangible assets are analyzed in the following table: | | | | | | | | | | | | | | | | | | | | | | | | | | | | | | | | | | | | | | | | | | Amortization
| | | Currency
| | | | | | | | | | | Net amount as of
| | | | | | | | | and
| | | translation
| | | | | | Net amount as of
| | | (M€) | | January 1, | | | Acquisitions | | | Disposals | | | impairment | | | adjustment | | | Other | | | December 31, | | 2010 | | | 7,514 | | | | 2,466 | | | | (62 | ) | | | (553 | ) | | | 491 | | | | (939 | ) | | | 8,917 | | | 2009 | | | 5,341 | | | | 629 | | | | (64 | ) | | | (345 | ) | | | 2 | | | | 1,951 | | | | 7,514 | | | 2008 | | | 4,650 | | | | 404 | | | | (3 | ) | | | (259 | ) | | | (93 | ) | | | 642 | | | | 5,341 | | | | | | | | | | | | | | | | | | | | | | | | | | | | | | | |
F-35
| | | | | | | | | | | | | | | | | | | | | | | | | | | | | | (M€) | | Net
amount
as of
January 1, | | | Acquisitions | | | Disposals | | | Amortization
and
impairment | | | Currency
translation
adjustment | | | Other | | | Net amount
as of
December 31, | | 2011 | | | 8,917 | | | | 2,504 | | | | (428 | ) | | | (991 | ) | | | 358 | | | | 2,053 | | | | 12,413 | | 2010 | | | 7,514 | | | | 2,466 | | | | (62 | ) | | | (553 | ) | | | 491 | | | | (939 | ) | | | 8,917 | | 2009 | | | 5,341 | | | | 629 | | | | (64 | ) | | | (345 | ) | | | 2 | | | | 1,951 | | | | 7,514 | |
In 2010,2011, the heading “Other” mainly includes Chesapeake’s Barnett shale mineral interests reclassified into the acquisitions for €(975)€(649) million, the not yet paid part of the acquisition of Chesapeake’s mineral interests in Utica for€1,216 million, the reclassification of Joslyn’s mineral interests sold in 2011 and formerly classified in accordance with IFRS 5 “Non-current assets held for sale and discontinued operations” for€384 million, and€697 million related to the acquisition of SunPower.In 2010, the heading “Other” mainly included Chesapeake’s Barnett shale mineral interests reclassified into the acquisitions for€(975) million and the reclassification of Joslyn’s mineral interests in accordance with IFRS 5 “Non-current assets held for sale and discontinued operations” for €(390)€(390) million, including the currency translation adjustment, (see Note 34 to the Consolidated Financial Statements), partially compensated by the acquisition of UTS for €646€646 million (see Note 3 to the Consolidated Financial Statements). In 2009, the heading “Other” mainly included Chesapeake’s Barnett shale mineral interests for €1,449€1,449 million (see Note 3 to the Consolidated Financial Statements). In 2008, the heading “Other” mainly included the impact of “proved and unproved mineral interests” from Synenco Energy Inc. for €221 million and from Goal Petroleum B.V. for €292 million.
A summary of changes in the carrying amount of goodwill by business segment for the year ended December 31, 20102011 is as follows: | | | | | | | | | | | | | | | | | | | | | | | | | Net goodwill as of
| | | | | | | | | | | | Net goodwill as of
| | | (M€) | | January 1, 2010 | | | Increases | | | Impairments | | | Other | | | December 31, 2010 | | | Upstream | | | 78 | | | | — | | | | — | | | | — | | | | 78 | | | Downstream | | | 202 | | | | 22 | | | | (88 | ) | | | (54 | ) | | | 82 | | | Chemicals | | | 857 | | | | — | | | | — | | | | (140 | ) | | | 717 | | | Corporate | | | 25 | | | | — | | | | — | | | | — | | | | 25 | | | | | | | | | | | | | | | | | | | | | | | | Total | | | 1,162 | | | | 22 | | | | (88 | ) | | | (194 | ) | | | 902 | | | | | | | | | | | | | | | | | | | | | | | |
The heading “Other” mainly corresponds | | | | | | | | | | | | | | | | | | | | | | (M€) | | Net goodwill as of
January 1, 2011 | | | Increases | | | Impairments | | | Other | | | Net goodwill as of
December 31, 2011 | | Upstream | | | 78 | | | | 396 | | | | (383 | ) | | | (2 | ) | | | 89 | | Downstream | | | 82 | | | | — | | | | (1 | ) | | | (12 | ) | | | 69 | | Chemicals | | | 717 | | | | 23 | | | | (4 | ) | | | (9 | ) | | | 727 | | Corporate | | | 25 | | | | — | | | | — | | | | — | | | | 25 | | Total | | | 902 | | | | 419 | | | | (388 | ) | | | (23 | ) | | | 910 | |
In 2011, impairments of goodwill in the Upstream segment amount to€383 million and correspond to the sale of Mapa Spontex and the reclassificationimpairment of the whole goodwill arising from the acquisition of resins businesses subjectSunPower (see Note 4E to a disposal plan in accordance with IFRS 5 “Non-current assets held for sale and discontinued operations”the Consolidated Financial Statements). | | 11) | PROPERTY, PLANT AND EQUIPMENT |
| | | | | | | | | | | | | | | | | | | | Depreciation
| | | | | | | | | | | and
| | | | | | As of December 31, 2010 (M€) | | Cost | | | impairment | | | Net | | Upstream properties | | | | | | | | | | | | | | Proved properties | | | 77,183 | | | | (50,582 | ) | | | 26,601 | | | Unproved properties | | | 347 | | | | (1 | ) | | | 346 | | | Work in progress | | | 14,712 | | | | (37 | ) | | | 14,675 | | | | | | | | | | | | | | | | Subtotal | | | 92,242 | | | | (50,620 | ) | | | 41,622 | | | | | | | | | | | | | | | | Other property, plant and equipment | | | | | | | | | | | | | | Land | | | 1,304 | | | | (393 | ) | | | 911 | | | Machinery, plant and equipment (including transportation equipment) | | | 23,831 | | | | (17,010 | ) | | | 6,821 | | | Buildings | | | 6,029 | | | | (3,758 | ) | | | 2,271 | | | Work in progress | | | 2,350 | | | | (488 | ) | | | 1,862 | | | Other | | | 6,164 | | | | (4,687 | ) | | | 1,477 | | | | | | | | | | | | | | | | Subtotal | | | 39,678 | | | | (26,336 | ) | | | 13,342 | | | | | | | | | | | | | | | | Total property, plant and equipment | | | 131,920 | | | | (76,956 | ) | | | 54,964 | | | | | | | | | | | | | | | |
F-36
11)PROPERTY, PLANT AND EQUIPMENT | | | | | | | | | | | | | | As of December 31, 2011 (M€) | | Cost | | | Depreciation and
impairment | | | Net | | Upstream properties | | | | | | | | | | | | | Proved properties | | | 84,222 | | | | (54,589 | ) | | | 29,633 | | Unproved properties | | | 209 | | | | — | | | | 209 | | Work in progress | | | 21,190 | | | | (15 | ) | | | 21,175 | | Subtotal | | | 105,621 | | | | (54,604 | ) | | | 51,017 | | Other property, plant and equipment | | | | | | | | | | | | | Land | | | 1,346 | | | | (398 | ) | | | 948 | | Machinery, plant and equipment (including transportation equipment) | | | 25,838 | | | | (18,349 | ) | | | 7,489 | | Buildings | | | 6,241 | | | | (4,131 | ) | | | 2,110 | | Work in progress | | | 1,534 | | | | (306 | ) | | | 1,228 | | Other | | | 6,564 | | | | (4,899 | ) | | | 1,665 | | Subtotal | | | 41,523 | | | | (28,083 | ) | | | 13,440 | | Total property, plant and equipment | | | 147,144 | | | | (82,687 | ) | | | 64,457 | |
| | | | | | | | | | | | | | As of December 31, 2010 (M€) | | Cost | | | Depreciation and
impairment | | | Net | | Upstream properties | | | | | | | | | | | | | Proved properties | | | 77,183 | | | | (50,582 | ) | | | 26,601 | | Unproved properties | | | 347 | | | | (1 | ) | | | 346 | | Work in progress | | | 14,712 | | | | (37 | ) | | | 14,675 | | Subtotal | | | 92,242 | | | | (50,620 | ) | | | 41,622 | | Other property, plant and equipment | | | | | | | | | | | | | Land | | | 1,304 | | | | (393 | ) | | | 911 | | Machinery, plant and equipment (including transportation equipment) | | | 23,831 | | | | (17,010 | ) | | | 6,821 | | Buildings | | | 6,029 | | | | (3,758 | ) | | | 2,271 | | Work in progress | | | 2,350 | | | | (488 | ) | | | 1,862 | | Other | | | 6,164 | | | | (4,687 | ) | | | 1,477 | | Subtotal | | | 39,678 | | | | (26,336 | ) | | | 13,342 | | Total property, plant and equipment | | | 131,920 | | | | (76,956 | ) | | | 54,964 | |
| | | | | | | | | | | | | | | | | | | | Depreciation
| | | | | | | | | | | and
| | | | | | As of December 31, 2009 (M€) | | Cost | | | impairment | | | Net | | Upstream properties | | | | | | | | | | | | | | Proved properties | | | 71,082 | | | | (44,718 | ) | | | 26,364 | | | Unproved properties | | | 182 | | | | (1 | ) | | | 181 | | | Work in progress | | | 10,351 | | | | (51 | ) | | | 10,300 | | | | | | | | | | | | | | | | Subtotal | | | 81,615 | | | | (44,770 | ) | | | 36,845 | | | | | | | | | | | | | | | | Other property, plant and equipment | | | | | | | | | | | | | | Land | | | 1,458 | | | | (435 | ) | | | 1,023 | | | Machinery, plant and equipment (including transportation equipment) | | | 22,927 | | | | (15,900 | ) | | | 7,027 | | | Buildings | | | 6,142 | | | | (3,707 | ) | | | 2,435 | | | Work in progress | | | 2,774 | | | | (155 | ) | | | 2,619 | | | Other | | | 6,506 | | | | (4,865 | ) | | | 1,641 | | | | | | | | | | | | | | | | Subtotal | | | 39,807 | | | | (25,062 | ) | | | 14,745 | | | | | | | | | | | | | | | | Total property, plant and equipment | | | 121,422 | | | | (69,832 | ) | | | 51,590 | |
| | | | | | | | | | | | | | | | | | | | Depreciation
| | | | | | | | | | | and
| | | | | | As of December 31, 2008 (M€) | | Cost | | | impairment | | | Net | | Upstream properties | | | | | | | | | | | | | | Proved properties | | | 61,727 | | | | (39,315 | ) | | | 22,412 | | | Unproved properties | | | 106 | | | | (1 | ) | | | 105 | | | Work in progress | | | 9,586 | | | | — | | | | 9,586 | | | | | | | | | | | | | | | | Subtotal | | | 71,419 | | | | (39,316 | ) | | | 32,103 | | | | | | | | | | | | | | | | Other property, plant and equipment | | | | | | | | | | | | | | Land | | | 1,446 | | | | (429 | ) | | | 1,017 | | | Machinery, plant and equipment (including transportation equipment) | | | 21,734 | | | | (14,857 | ) | | | 6,877 | | | Buildings | | | 5,739 | | | | (3,441 | ) | | | 2,298 | | | Work in progress | | | 2,226 | | | | (10 | ) | | | 2,216 | | | Other | | | 6,258 | | | | (4,627 | ) | | | 1,631 | | | | | | | | | | | | | | | | Subtotal | | | 37,403 | | | | (23,364 | ) | | | 14,039 | | | | | | | | | | | | | | | | Total property, plant and equipment | | | 108,822 | | | | (62,680 | ) | | | 46,142 | | | | | | | | | | | | | | | |
| | | | | | | | | | | | | | As of December 31, 2009 (M€) | | Cost | | | Depreciation and
impairment | | | Net | | Upstream properties | | | | | | | | | | | | | Proved properties | | | 71,082 | | | | (44,718 | ) | | | 26,364 | | Unproved properties | | | 182 | | | | (1 | ) | | | 181 | | Work in progress | | | 10,351 | | | | (51 | ) | | | 10,300 | | Subtotal | | | 81,615 | | | | (44,770 | ) | | | 36,845 | | Other property, plant and equipment | | | | | | | | | | | | | Land | | | 1,458 | | | | (435 | ) | | | 1,023 | | Machinery, plant and equipment (including transportation equipment) | | | 22,927 | | | | (15,900 | ) | | | 7,027 | | Buildings | | | 6,142 | | | | (3,707 | ) | | | 2,435 | | Work in progress | | | 2,774 | | | | (155 | ) | | | 2,619 | | Other | | | 6,506 | | | | (4,865 | ) | | | 1,641 | | Subtotal | | | 39,807 | | | | (25,062 | ) | | | 14,745 | | Total property, plant and equipment | | | 121,422 | | | | (69,832 | ) | | | 51,590 | |
Changes in net property, plant and equipment are analyzed in the following table: | | | | | | | | | | | | | | | | | | | | | | | | | | | | | | (M€) | | Net amount as
of January 1, | | | Acquisitions | | | Disposals | | | Depreciation and
impairment | | | Currency
translation
adjustment | | | Other | | | Net amount as of
December 31, | | 2011 | | | 54,964 | | | | 15,443 | | | | (1,489 | ) | | | (7,636 | ) | | | 1,692 | | | | 1,483 | | | | 64,457 | | 2010 | | | 51,590 | | | | 11,346 | | | | (1,269 | ) | | | (8,564 | ) | | | 2,974 | | | | (1,113 | ) | | | 54,964 | | 2009 | | | 46,142 | | | | 11,212 | | | | (65 | ) | | | (6,765 | ) | | | 397 | | | | 669 | | | | 51,590 | |
| | | | | | | | | | | | | | | | | | | | | | | | | | | | | | | | | Net amount
| | | | | | | | | Depreciation
| | | Currency
| | | | | | Net amount
| | | | | as of
| | | | | | | | | and
| | | translation
| | | | | | as of
| | | (M€) | | January 1, | | | Acquisitions | | | Disposals | | | impairment | | | adjustment | | | Other | | | December 31, | | 2010 | | | 51,590 | | | | 11,346 | | | | (1,269 | ) | | | (8,564 | ) | | | 2,974 | | | | (1,113 | ) | | | 54,964 | | | 2009 | | | 46,142 | | | | 11,212 | | | | (65 | ) | | | (6,765 | ) | | | 397 | | | | 669 | | | | 51,590 | | | 2008 | | | 41,467 | | | | 11,442 | | | | (102 | ) | | | (5,941 | ) | | | (1,151 | ) | | | 427 | | | | 46,142 | |
In 2010,2011, the heading “Disposals” mainly includes the impact of sales of assets in the Upstream segment (disposal of the interests in Gassled in Norway and in Joslyn’s field in Canada) and in the Downstream segment (disposal of Marketing assets in the United Kingdom) (see Note 3 to the Consolidated Financial Statements). In 2011, the heading “Depreciation and impairment” includes the impact of impairments of assets recognized for€781 million (see Note 4D to the Consolidated Financial Statements). In 2011, the heading “Other” corresponds to the increase of the asset for sites restitution for an amount of€653 million. It also includes€428 million related to the reclassification of tangible assets of Joslyn and resins businesses sold in 2011 and formerly classified in accordance with IFRS 5 “Non-current assets held for sale and discontinued operations”. In 2010, the heading “Disposals” mainly included the impact of sales of assets in the Upstream segment (sale of the interests in the Valhall and Hod fields in Norway and sale of the interest in Block 31 in Angola, see Note 3 to the Consolidated Financial Statements). In 2010, the heading “Depreciation and impairment” includesincluded the impact of impairments of assets recognized for €1,416€1,416 million (see Note 4C4D to the Consolidated Financial Statements). F-37
In 2010, the heading “Other” mainly correspondscorresponded to the change in the consolidation method of Samsung Total Petrochemicals (see Note 12 to the Consolidated Financial Statements) for €(541)€(541) million and the reclassification for €(537)€(537) million, including the currency translation adjustment, of property, plant and equipment related to Joslyn, Total E&P Cameroun, and resins businesses subject to a disposal project in accordance with IFRS 5 “Non-current assets held for sale and discontinued operations” (see Note 34 to the Consolidated Financial Statements), partially compensated by the acquisition of UTS for €217€217 million (see Note 3 to the Consolidated Financial Statements). In 2009, the heading “Other” mainly included changes in net property, plant and equipment related to asset retirement obligations and Chesapeake’s Barnett shale tangible assets for €113€113 million (see Note 3 to the Consolidated Financial Statements). In 2008, the heading “Other” mainly included changes in net property, plant and equipment related to asset retirement obligations.
Property, plant and equipment presented above include the following amounts for facilities and equipment under finance leases that have been capitalized: | | | | | | | | | | | | | | | | | | | | Depreciation
| | | | | | | | | | | and
| | | | | | As of December 31, 2010 (M€) | | Cost | | | impairment | | | Net | | | Machinery, plant and equipment | | | 480 | | | | (332 | ) | | | 148 | | | Buildings | | | 54 | | | | (24 | ) | | | 30 | | | Other | | | — | | | | — | | | | — | | | | | | | | | | | | | | | | Total | | | 534 | | | | (356 | ) | | | 178 | | | | | | | | | | | | | | | |
| | | | | | | | | | | | | | | | | | | | Depreciation
| | | | | | | | | | | and
| | | | | | As of December 31, 2009 (M€) | | Cost | | | impairment | | | Net | | | Machinery, plant and equipment | | | 548 | | | | (343 | ) | | | 205 | | | Buildings | | | 60 | | | | (30 | ) | | | 30 | | | Other | | | — | | | | — | | | | — | | | | | | | | | | | | | | | | Total | | | 608 | | | | (373 | ) | | | 235 | | | | | | | | | | | | | | | |
| | | | | | | | | | | | | | | | | | | | Depreciation
| | | | | | | | | | | and
| | | | | | As of December 31, 2008 (M€) | | Cost | | | impairment | | | Net | | | Machinery, plant and equipment | | | 558 | | | | (316 | ) | | | 242 | | | Buildings | | | 35 | | | | (28 | ) | | | 7 | | | Other | | | — | | | | — | | | | — | | | | | | | | | | | | | | | | Total | | | 593 | | | | (344 | ) | | | 249 | | | | | | | | | | | | | | | |
| | | | | | | | | | | | | | As of December 31, 2011 (M€) | | Cost | | | Depreciation and
impairment | | | Net | | Machinery, plant and equipment | | | 414 | | | | (284 | ) | | | 130 | | Buildings | | | 54 | | | | (25 | ) | | | 29 | | Other | | | — | | | | — | | | | — | | Total | | | 468 | | | | (309 | ) | | | 159 | | | | | | | As of December 31, 2010 (M€) | | Cost | | | Depreciation and
impairment | | | Net | | Machinery, plant and equipment | | | 480 | | | | (332 | ) | | | 148 | | Buildings | | | 54 | | | | (24 | ) | | | 30 | | Other | | | — | | | | — | | | | — | | Total | | | 534 | | | | (356 | ) | | | 178 | | | | | | | As of December 31, 2009 (M€) | | Cost | | | Depreciation and
impairment | | | Net | | Machinery, plant and equipment | | | 548 | | | | (343 | ) | | | 205 | | Buildings | | | 60 | | | | (30 | ) | | | 30 | | Other | | | — | | | | — | | | | — | | Total | | | 608 | | | | (373 | ) | | | 235 | |
12)EQUITY AFFILIATES: INVESTMENTS AND LOANS | | | | | | | | | | | | | | | | | | | | | | | | | | | | | | | As of December 31, | | Equity value (M€) | | 2011 | | | 2010 | | | 2009 | | | 2011 | | | 2010 | | | 2009 | | | | % owned | | | equity value | | NLNG | | | 15.00 | % | | | 15.00 | % | | | 15.00 | % | | | 953 | | | | 1,108 | | | | 1,136 | | PetroCedeño — EM | | | 30.32 | % | | | 30.32 | % | | | 30.32 | % | | | 1,233 | | | | 1,136 | | | | 874 | | CEPSA (Upstream share)(d) | | | — | | | | 48.83 | % | | | 48.83 | % | | | — | | | | 340 | | | | 385 | | Angola LNG Ltd. | | | 13.60 | % | | | 13.60 | % | | | 13.60 | % | | | 869 | | | | 710 | | | | 490 | | Qatargas | | | 10.00 | % | | | 10.00 | % | | | 10.00 | % | | | 97 | | | | 85 | | | | 83 | | Société du Terminal Méthanier de Fos Cavaou | | | 27.60 | % | | | 28.03 | % | | | 28.79 | % | | | 119 | | | | 125 | | | | 124 | | Dolphin Energy Ltd (Del) Abu Dhabi | | | 24.50 | % | | | 24.50 | % | | | 24.50 | % | | | 208 | | | | 172 | | | | 118 | | Qatar Liquefied Gas Company Limited II (Train B) | | | 16.70 | % | | | 16.70 | % | | | 16.70 | % | | | 209 | | | | 184 | | | | 143 | | Yemen LNG Co | | | 39.62 | % | | | 39.62 | % | | | 39.62 | % | | | 169 | | | | 25 | | | | (15 | ) | Shtokman Development AG | | | 25.00 | % | | | 25.00 | % | | | 25.00 | % | | | 248 | | | | 214 | | | | 162 | | AMYRIS(a) | | | 21.37 | % | | | 22.03 | % | | | — | | | | 79 | | | | 101 | | | | — | | Novatek(e) | | | 14.09 | % | | | — | | | | — | | | | 3,368 | | | | — | | | | — | | Other | | | — | | | | — | | | | — | | | | 803 | | | | 724 | | | | 760 | | Total associates | | | | | | | | | | | | | | | 8,355 | | | | 4,924 | | | | 4,260 | | Yamal LNG(e) | | | 20.01 | % | | | — | | | | — | | | | 495 | | | | — | | | | — | | Ichthys LNG Ltd(e) | | | 24.00 | % | | | — | | | | — | | | | 82 | | | | — | | | | — | | Other | | | — | | | | — | | | | — | | | | — | | | | 78 | | | | — | | Total jointly-controlled entities | | | | | | | | | | | | | | | 577 | | | | 78 | | | | — | | Total Upstream | | | | | | | | | | | | | | | 8,932 | | | | 5,002 | | | | 4,260 | | CEPSA (Downstream share)(d) | | | — | | | | 48.83 | % | | | 48.83 | % | | | — | | | | 2,151 | | | | 1,927 | | Saudi Aramco Total Refining & Petrochemicals (Downstream share) | | | 37.50 | % | | | 37.50 | % | | | 37.50 | % | | | 112 | | | | 47 | | | | 60 | | Other | | | — | | | | — | | | | — | | | | 166 | | | | 159 | | | | 123 | | Total associates | | | | | | | | | | | | | | | 278 | | | | 2,357 | | | | 2,110 | | SARA(c) | | | 50.00 | % | | | 50.00 | % | | | — | | | | 125 | | | | 134 | | | | — | | TotalErg(a) | | | 49.00 | % | | | 49.00 | % | | | — | | | | 296 | | | | 289 | | | | — | | Other | | | — | | | | — | | | | — | | | | — | | | | 2 | | | | — | | Total jointly-controlled entities | | | | | | | | | | | | | | | 421 | | | | 425 | | | | — | | Total Downstream | | | | | | | | | | | | | | | 699 | | | | 2,782 | | | | 2,110 | | CEPSA (Chemicals share)(d) | | | — | | | | 48.83 | % | | | 48.83 | % | | | — | | | | 411 | | | | 396 | | Qatar Petrochemical Company Ltd. | | | 20.00 | % | | | 20.00 | % | | | 20.00 | % | | | 240 | | | | 221 | | | | 205 | | Saudi Aramco Total Refining & Petrochemicals (Chemicals share) | | | 37.50 | % | | | 37.50 | % | | | 37.50 | % | | | 9 | | | | 4 | | | | 5 | | Qatofin Company Limited | | | 36.36 | % | | | 36.36 | % | | | 36.36 | % | | | 136 | | | | 27 | | | | 9 | | Other | | | — | | | | — | | | | — | | | | 27 | | | | 41 | | | | 37 | | Total associates | | | | | | | | | | | | | | | 412 | | | | 704 | | | | 652 | | Samsung Total Petrochemicals(c) | | | 50.00 | % | | | 50.00 | % | | | — | | | | 706 | | | | 645 | | | | — | | Total jointly-controlled entities | | | | | | | | | | | | | | | 706 | | | | 645 | | | | — | | Total Chemicals | | | | | | | | | | | | | | | 1,118 | | | | 1,349 | | | | 652 | | Sanofi(b) | | | — | | | | — | | | | 7.39 | % | | | — | | | | — | | | | 4,235 | | Total associates | | | | | | | | | | | | | | | — | | | | — | | | | 4,235 | | Total jointly-controlled entities | | | | | | | | | | | | | | | — | | | | — | | | | — | | Total Corporate | | | | | | | | | | | | | | | — | | | | — | | | | 4,235 | | Total investments | | | | | | | | | | | | | | | 10,749 | | | | 9,133 | | | | 11,257 | | Loans | | | | | | | | | | | | | | | 2,246 | | | | 2,383 | | | | 2,367 | | Total investments and loans | | | | | | | | | | | | | | | 12,995 | | | | 11,516 | | | | 13,624 | |
| (a) | | 12) | EQUITY AFFILIATES: INVESTMENTS AND LOANS |
As from January 1st, 2010, jointly-controlled entities are consolidated under the equity method, as provided for in the alternative method of IAS 31 “Interests in joint ventures” (see Note 1 “Accounting policies” paragraphs A and V to the Consolidated Financial Statements). Until December 31, 2009, these entities were consolidated using the proportionate method.
F-38
| | | | | | | | | | | | | | | | | | | | | | | | | | | Equity value (M€) | | As of December 31, | | | | | 2010 | | | 2009 | | | 2008 | | | 2010 | | | 2009 | | | 2008 | | | | | % owned | | | equity value | | | NLNG | | | 15.00 | % | | | 15.00 | % | | | 15.00 | % | | | 1,108 | | | | 1,136 | | | | 1,135 | | | PetroCedeño — EM | | | 30.32 | % | | | 30.32 | % | | | 30.32 | % | | | 1,136 | | | | 874 | | | | 760 | | | CEPSA (Upstream share) | | | 48.83 | % | | | 48.83 | % | | | 48.83 | % | | | 340 | | | | 385 | | | | 403 | | | Angola LNG Ltd. | | | 13.60 | % | | | 13.60 | % | | | 13.60 | % | | | 710 | | | | 490 | | | | 326 | | | Qatargas | | | 10.00 | % | | | 10.00 | % | | | 10.00 | % | | | 85 | | | | 83 | | | | 251 | | | Société du Terminal Méthanier de Fos Cavaou | | | 28.03 | % | | | 28.79 | % | | | 30.30 | % | | | 125 | | | | 124 | | | | 114 | | | Dolphin Energy Ltd (Del) Abu Dhabi | | | 24.50 | % | | | 24.50 | % | | | 24.50 | % | | | 172 | | | | 118 | | | | 85 | | | Qatar Liquefied Gas Company Limited II (Train B) | | | 16.70 | % | | | 16.70 | % | | | 16.70 | % | | | 184 | | | | 143 | | | | 82 | | Shtokman Development AG(a) | | | 25.00 | % | | | 25.00 | % | | | 25.00 | % | | | 214 | | | | 162 | | | | 35 | | AMYRIS(b) | | | 22.03 | % | | | — | | | | — | | | | 101 | | | | — | | | | — | | | Other | | | — | | | | — | | | | — | | | | 749 | | | | 745 | | | | 700 | | Total associates | | | | | | | | | | | | | | | 4,924 | | | | 4,260 | | | | 3,891 | | | Other | | | — | | | | — | | | | — | | | | 78 | | | | — | | | | — | | Total jointly-controlled entities | | | | | | | | | | | | | | | 78 | | | | — | | | | — | | | | | | | | | | | | | | | | | | | | | | | | | | | | Total Upstream | | | | | | | | | | | | | | | 5,002 | | | | 4,260 | | | | 3,891 | | | CEPSA (Downstream share) | | | 48.83 | % | | | 48.83 | % | | | 48.83 | % | | | 2,151 | | | | 1,927 | | | | 1,810 | | Saudi Aramco Total Refining & Petrochemicals (Downstream share)(a) | | | 37.50 | % | | | 37.50 | % | | | 37.50 | % | | | 47 | | | | 60 | | | | 75 | | | Wepec | | | 22.41 | % | | | 22.41 | % | | | 22.41 | % | | | — | | | | — | | | | — | | | Other | | | — | | | | — | | | | — | | | | 159 | | | | 123 | | | | 73 | | Total associates | | | | | | | | | | | | | | | 2,357 | | | | 2,110 | | | | 1,958 | | SARA(d) | | | 50.00 | % | | | — | | | | — | | | | 134 | | | | — | | | | — | | TotalErg(b) | | | 49.00 | % | | | — | | | | — | | | | 289 | | | | — | | | | — | | | Other | | | — | | | | — | | | | — | | | | 2 | | | | — | | | | — | | Total jointly-controlled entities | | | | | | | | | | | | | | | 425 | | | | — | | | | — | | | | | | | | | | | | | | | | | | | | | | | | | | | | Total Downstream | | | | | | | | | | | | | | | 2,782 | | | | 2,110 | | | | 1,958 | | | CEPSA (Chemicals share) | | | 48.83 | % | | | 48.83 | % | | | 48.83 | % | | | 411 | | | | 396 | | | | 424 | | | Qatar Petrochemical Company Ltd. | | | 20.00 | % | | | 20.00 | % | | | 20.00 | % | | | 221 | | | | 205 | | | | 192 | | Saudi Aramco Total Refining & Petrochemicals (Chemicals share)(a) | | | 37.50 | % | | | 37.50 | % | | | 37.50 | % | | | 4 | | | | 5 | | | | 6 | | | Other | | | — | | | | — | | | | — | | | | 68 | | | | 46 | | | | 55 | | Total associates | | | | | | | | | | | | | | | 704 | | | | 652 | | | | 677 | | Samsung Total Petrochemicals(d) | | | 50.00 | % | | | — | | | | — | | | | 645 | | | | — | | | | — | | Total jointly-controlled entities | | | | | | | | | | | | | | | 645 | | | | — | | | | — | | | | | | | | | | | | | | | | | | | | | | | | | | | | Total Chemicals | | | | | | | | | | | | | | | 1,349 | | | | 652 | | | | 677 | | Sanofi-Aventis(c) | | | — | | | | 7.39 | % | | | 11.38 | % | | | — | | | | 4,235 | | | | 6,137 | | Total associates | | | | | | | | | | | | | | | — | | | | 4,235 | | | | 6,137 | | Total jointly-controlled entities | | | | | | | | | | | | | | | — | | | | — | | | | — | | | | | | | | | | | | | | | | | | | | | | | | | | | | Total Corporate | | | | | | | | | | | | | | | — | | | | 4,235 | | | | 6,137 | | | | | | | | | | | | | | | | | | | | | | | | | | | | Total investments | | | | | | | | | | | | | | | 9,133 | | | | 11,257 | | | | 12,663 | | | | | | | | | | | | | | | | | | | | | | | | | | | | | Loans | | | | | | | | | | | | | | | 2,383 | | | | 2,367 | | | | 2,005 | | | | | | | | | | | | | | | | | | | | | | | | | | | | Total investments and loans | | | | | | | | | | | | | | | 11,516 | | | | 13,624 | | | | 14,668 | | | | | | | | | | | | | | | | | | | | | | | | | | | |
| | | (a) | | Investment accounted for by the equity method as from 2008. | (b) | | Investment accounted for by the equity method as from 2010. |
| (b) | | | (c)
| | End of the accounting for by the equity method of Sanofi-AventisSanofi as of July 1st,1st, 2010 (see Note 3 to the Consolidated Financial Statements). |
| (c) | | | (d)
| | Change in the consolidation method as of January 1st, 2010. |
F-39
| | | | | | | | | | | | | | | | | | | | | | | | | | | Equity in income (loss) (M€) | | As of December 31, | | | For the year ended December 31, | | | | | 2010 | | | 2009 | | | 2008 | | | 2010 | | | 2009 | | | 2008 | | | | | % owned | | | equity in income (loss) | | | NLNG | | | 15.00 | % | | | 15.00 | % | | | 15.00 | % | | | 207 | | | | 227 | | | | 554 | | | PetroCedeño — EM | | | 30.32 | % | | | 30.32 | % | | | 30.32 | % | | | 195 | | | | 166 | | | | 193 | | | CEPSA (Upstream share) | | | 48.83 | % | | | 48.83 | % | | | 48.83 | % | | | 57 | | | | 23 | | | | 50 | | | Angola LNG Ltd. | | | 13.60 | % | | | 13.60 | % | | | 13.60 | % | | | 8 | | | | 9 | | | | 10 | | | Qatargas | | | 10.00 | % | | | 10.00 | % | | | 10.00 | % | | | 136 | | | | 114 | | | | 126 | | | Société du Terminal Méthanier de Fos Cavaou | | | 28.03 | % | | | 28.79 | % | | | 30.30 | % | | | — | | | | — | | | | (5 | ) | | Dolphin Energy Ltd (Del) Abu Dhabi | | | 24.50 | % | | | 24.50 | % | | | 24.50 | % | | | 121 | | | | 94 | | | | 83 | | | Qatar Liquefied Gas Company Limited II (Train B) | | | 16.70 | % | | | 16.70 | % | | | 16.70 | % | | | 288 | | | | 8 | | | | (11 | ) | Shtokman Development AG(a) | | | 25.00 | % | | | 25.00 | % | | | 25.00 | % | | | (5 | ) | | | 4 | | | | — | | AMYRIS(b) | | | 22.03 | % | | | — | | | | — | | | | (3 | ) | | | | | | | | | | Other | | | — | | | | — | | | | — | | | | 177 | | | | 214 | | | | 178 | | Total associates | | | | | | | | | | | | | | | 1,181 | | | | 859 | | | | 1,178 | | | Other | | | — | | | | — | | | | — | | | | 6 | | | | — | | | | — | | Total jointly-controlled entities | | | | | | | | | | | | | | | 6 | | | | — | | | | — | | | | | | | | | | | | | | | | | | | | | | | | | | | | Total Upstream | | | | | | | | | | | | | | | 1,187 | | | | 859 | | | | 1,178 | | | CEPSA (Downstream share) | | | 48.83 | % | | | 48.83 | % | | | 48.83 | % | | | 172 | | | | 149 | | | | 76 | | Saudi Aramco Total Refining & Petrochemicals (Downstream share)(a) | | | 37.50 | % | | | 37.50 | % | | | 37.50 | % | | | (19 | ) | | | (12 | ) | | | — | | | Wepec | | | 22.41 | % | | | 22.41 | % | | | 22.41 | % | | | 29 | | | | — | | | | (110 | ) | | Other | | | — | | | | — | | | | — | | | | 47 | | | | 81 | | | | (13 | ) | Total associates | | | | | | | | | | | | | | | 229 | | | | 218 | | | | (47 | ) | SARA(d) | | | 50.00 | % | | | — | | | | — | | | | 31 | | | | — | | | | — | | TotalErg(b) | | | 49.00 | % | | | — | | | | — | | | | (11 | ) | | | — | | | | — | | | Other | | | — | | | | — | | | | — | | | | 2 | | | | — | | | | — | | Total jointly-controlled entities | | | | | | | | | | | | | | | 22 | | | | — | | | | — | | | | | | | | | | | | | | | | | | | | | | | | | | | | Total Downstream | | | | | | | | | | | | | | | 251 | | | | 218 | | | | (47 | ) | | CEPSA (Chemicals share) | | | 48.83 | % | | | 48.83 | % | | | 48.83 | % | | | 78 | | | | 10 | | | | 10 | | | Qatar Petrochemical Company Ltd. | | | 20.00 | % | | | 20.00 | % | | | 20.00 | % | | | 84 | | | | 74 | | | | 66 | | Saudi Aramco Total Refining & Petrochemicals (Chemicals share)(a) | | | 37.50 | % | | | 37.50 | % | | | 37.50 | % | | | (1 | ) | | | (1 | ) | | | — | | | Other | | | — | | | | — | | | | — | | | | 41 | | | | (4 | ) | | | (1 | ) | Total associates | | | | | | | | | | | | | | | 202 | | | | 79 | | | | 75 | | Samsung Total Petrochemicals(d) | | | 50.00 | % | | | — | | | | — | | | | 104 | | | | — | | | | — | | Total jointly-controlled entities | | | | | | | | | | | | | | | 104 | | | | — | | | | — | | | | | | | | | | | | | | | | | | | | | | | | | | | | Total Chemicals | | | | | | | | | | | | | | | 306 | | | | 79 | | | | 75 | | Sanofi-Aventis(c) | | | — | | | | 7.39 | % | | | 11.38 | % | | | 209 | | | | 486 | | | | 515 | | Total associates | | | | | | | | | | | | | | | 209 | | | | 486 | | | | 515 | | Total jointly-controlled entities | | | | | | | | | | | | | | | — | | | | — | | | | — | | | | | | | | | | | | | | | | | | | | | | | | | | | | Total Corporate | | | | | | | | | | | | | | | 209 | | | | 486 | | | | 515 | | | | | | | | | | | | | | | | | | | | | | | | | | | | Total investments | | | | | | | | | | | | | | | 1,953 | | | | 1,642 | | | | 1,721 | | | | | | | | | | | | | | | | | | | | | | | | | | | |
| (d) | Sale of CEPSA on July 29th, 2011. |
| (e) | | (a) | | Investment accounted for by the equity method as from 2008.2011. |
| | | | | | | | | | | | | | | | | | | | | | | | | | | | As of December 31, | | | For the year ended December 31, | | | | | 2011 | | | 2010 | | | 2009 | | | 2011 | | | 2010 | | | 2009 | | | Equity in income (loss) (M€) | | % owned | | | Equity in income (loss) | | NLNG | | | 15.00 | % | | | 15.00 | % | | | 15.00 | % | | | 374 | | | | 207 | | | | 227 | | PetroCedeño — EM | | | 30.32 | % | | | 30.32 | % | | | 30.32 | % | | | 55 | | | | 195 | | | | 166 | | CEPSA (Upstream share)(d) | | | — | | | | 48.83 | % | | | 48.83 | % | | | 15 | | | | 57 | | | | 23 | | Angola LNG Ltd. | | | 13.60 | % | | | 13.60 | % | | | 13.60 | % | | | 6 | | | | 8 | | | | 9 | | Qatargas | | | 10.00 | % | | | 10.00 | % | | | 10.00 | % | | | 196 | | | | 136 | | | | 114 | | Société du Terminal Méthanier de Fos Cavaou | | | 27.60 | % | | | 28.03 | % | | | 28.79 | % | | | 13 | | | | — | | | | — | | Dolphin Energy Ltd (Del) Abu Dhabi | | | 24.50 | % | | | 24.50 | % | | | 24.50 | % | | | 131 | | | | 121 | | | | 94 | | Qatar Liquefied Gas Company Limited II (Train B) | | | 16.70 | % | | | 16.70 | % | | | 16.70 | % | | | 446 | | | | 288 | | | | 8 | | Yemen LNG Co | | | 39.62 | % | | | 39.62 | % | | | 39.62 | % | | | 130 | | | | 37 | | | | 34 | | Shtokman Development AG | | | 25.00 | % | | | 25.00 | % | | | 25.00 | % | | | 1 | | | | (5 | ) | | | 4 | | AMYRIS(a) | | | 21.37 | % | | | 22.03 | % | | | — | | | | (23 | ) | | | (3 | ) | | | — | | Novatek(e) | | | 14.09 | % | | | — | | | | — | | | | 24 | | | | — | | | | — | | Other | | | — | | | | — | | | | — | | | | 274 | | | | 140 | | | | 180 | | Total associates | | | | | | | | | | | | | | | 1,642 | | | | 1,181 | | | | 859 | | Yamal LNG(e) | | | 20.01 | % | | | — | | | | — | | | | — | | | | — | | | | — | | Ichthys LNG Ltd(e) | | | 24.00 | % | | | — | | | | — | | | | (7 | ) | | | — | | | | — | | Other | | | — | | | | — | | | | — | | | | (56 | ) | | | 6 | | | | — | | Total jointly-controlled entities | | | | | | | | | | | | | | | (63 | ) | | | 6 | | | | — | | Total Upstream | | | | | | | | | | | | | | | 1,579 | | | | 1,187 | | | | 859 | | CEPSA (Downstream share)(d) | | | — | | | | 48.83 | % | | | 48.83 | % | | | 26 | | | | 172 | | | | 149 | | Saudi Aramco Total Refining & Petrochemicals (Downstream share) | | | 37.50 | % | | | 37.50 | % | | | 37.50 | % | | | (27 | ) | | | (19 | ) | | | (12 | ) | Other | | | — | | | | — | | | | — | | | | 24 | | | | 76 | | | | 81 | | Total associates | | | | | | | | | | | | | | | 23 | | | | 229 | | | | 218 | | SARA(c) | | | 50.00 | % | | | 50.00 | % | | | — | | | | 11 | | | | 31 | | | | — | | TotalErg(a) | | | 49.00 | % | | | 49.00 | % | | | — | | | | 7 | | | | (11 | ) | | | — | | Other | | | — | | | | — | | | | — | | | | 1 | | | | 2 | | | | — | | Total jointly-controlled entities | | | | | | | | | | | | | | | 19 | | | | 22 | | | | — | | Total Downstream | | | | | | | | | | | | | | | 42 | | | | 251 | | | | 218 | | CEPSA (Chemicals share)(d) | | | — | | | | 48.83 | % | | | 48.83 | % | | | 19 | | | | 78 | | | | 10 | | Qatar Petrochemical Company Ltd. | | | 20.00 | % | | | 20.00 | % | | | 20.00 | % | | | 89 | | | | 84 | | | | 74 | | Saudi Aramco Total Refining & Petrochemicals (Chemicals share) | | | 37.50 | % | | | 37.50 | % | | | 37.50 | % | | | (3 | ) | | | (1 | ) | | | (1 | ) | Qatofin Company Limited | | | 36.36 | % | | | 36.36 | % | | | 36.36 | % | | | 98 | | | | 36 | | | | (5 | ) | Other | | | — | | | | — | | | | — | | | | (13 | ) | | | 5 | | | | 1 | | Total associates | | | | | | | | | | | | | | | 190 | | | | 202 | | | | 79 | | Samsung Total Petrochemicals(c) | | | 50.00 | % | | | 50.00 | % | | | — | | | | 114 | | | | 104 | | | | — | | Total jointly-controlled entities | | | | | | | | | | | | | | | 114 | | | | 104 | | | | — | | Total Chemicals | | | | | | | | | | | | | | | 304 | | | | 306 | | | | 79 | | Sanofi(b) | | | — | | | | — | | | | 7.39 | % | | | — | | | | 209 | | | | 486 | | Total associates | | | | | | | | | | | | | | | — | | | | 209 | | | | 486 | | Total jointly-controlled entities | | | | | | | | | | | | | | | — | | | | — | | | | — | | Total Corporate | | | | | | | | | | | | | | | — | | | | 209 | | | | 486 | | Total investments | | | | | | | | | | | | | | | 1,925 | | | | 1,953 | | | | 1,642 | |
(b)(a) | | Investment accounted for by the equity method as from 2010. |
(c)(b) | | End of the accounting for by the equity method of Sanofi-AventisSanofi as of July 1st,1st, 2010 (see Note 3 to the Consolidated Financial Statements). |
(d)(c) | | Change in the consolidation method as of January 1st, 2010. |
| (d) | Sale of CEPSA on July 29th, 2011. |
| (e) | Investment accounted for by the equity method as from 2011. |
The market value of the Group’s share in CEPSANovatek amounts to €2,389€4,034 million as of December 31, 20102011 for an equity value of €2,902€3,368 million. The recoverable amount of CEPSA determined by reference to the value of discounted future cash flows being greater than the equity value, no impairment loss has been accounted for. F-40
In Group share, the main financial items of the equity affiliates are as follows : | | | | | | | | | | | | | | | | | | | | | | | | | | | | | 2010 | | | 2009 | | | 2008 | | | | | | | | Jointly-
| | | | | | Jointly-
| | | | | | Jointly-
| | | | | | | | controlled
| | | | | | controlled
| | | | | | controlled
| | | As of December 31, (M€) | | Associates | | | entities | | | Associates | | | entities | | | Associates | | | entities | | | Assets | | | 19,192 | | | | 2,770 | | | | 22,681 | | | | — | | | | 23,173 | | | | — | | | Shareholders’ equity | | | 7,985 | | | | 1,148 | | | | 11,257 | | | | — | | | | 12,663 | | | | — | | | Liabilities | | | 11,207 | | | | 1,622 | | | | 11,424 | | | | — | | | | 10,510 | | | | — | | | | | | | | | | | | | | | | | | | | | | | | | | | |
| | | | | | | | | | | | | | | | | | | | | | | | | | | | | 2010 | | | 2009 | | | 2008 | | | | | | | | Jointly-
| | | | | | Jointly-
| | | | | | Jointly-
| | | | | | | | controlled
| | | | | | controlled
| | | | | | controlled
| | | For the year ended December 31, (M€) | | Associates | | | entities | | | Associates | | | entities | | | Associates | | | entities | | | Revenues from sales | | | 16,529 | | | | 2,575 | | | | 14,434 | | | | — | | | | 19,982 | | | | — | | | Pre-tax income | | | 2,389 | | | | 166 | | | | 2,168 | | | | — | | | | 2,412 | | | | — | | | Income tax | | | (568 | ) | | | (34 | ) | | | (526 | ) | | | — | | | | (691 | ) | | | — | | | | | | | | | | | | | | | | | | | | | | | | | | | | Net income | | | 1,821 | | | | 132 | | | | 1,642 | | | | | | | | 1,721 | | | | | | | | | | | | | | | | | | | | | | | | | | | | | | | |
follows: | | | | | | | | | | | | | | | | | | | | | | | | | As of December 31, (M€) | | 2011 | | | 2010 | | | 2009 | | | | Associates | | | Jointly-
controlled
entities | | | Associates | | | Jointly-
controlled
entities | | | Associates | | | Jointly-
controlled
entities | | Assets | | | 18,088 | | | | 3,679 | | | | 19,192 | | | | 2,770 | | | | 22,681 | | | | — | | Shareholders’ equity | | | 9,045 | | | | 1,704 | | | | 7,985 | | | | 1,148 | | | | 11,257 | | | | — | | Liabilities | | | 9,043 | | | | 1,975 | | | | 11,207 | | | | 1,622 | | | | 11,424 | | | | — | | | | | | | | | | | | | | | | | | | | | | | | | | | | | | | 2011 | | | 2010 | | | 2009 | | | For the year ended December 31, (M€) | | Associates | | | Jointly-
controlled
entities | | | Associates | | | Jointly-
controlled
entities | | | Associates | | | Jointly-
controlled
entities | | Revenues from sales | | | 9,948 | | | | 5,631 | | | | 16,529 | | | | 2,575 | | | | 14,434 | | | | — | | Pre-tax income | | | 2,449 | | | | 119 | | | | 2,389 | | | | 166 | | | | 2,168 | | | | — | | Income tax | | | (594 | ) | | | (49 | ) | | | (568 | ) | | | (34 | ) | | | (526 | ) | | | — | | Net income | | | 1,855 | | | | 70 | | | | 1,821 | | | | 132 | | | | 1,642 | | | | | |
13)OTHER INVESTMENTS The investments detailed below are classified as “Financial assets available for sale” (see Note 1 paragraph M(ii) to the Consolidated Financial Statements). | | | | | | | | | | | | | | | | | Carrying
| | | Unrealized gain
| | | Balance
| | | As of December 31, 2010 (M€) | | amount | | | (loss) | | | sheet value | | Sanofi-Aventis(a) | | | 3,510 | | | | (56 | ) | | | 3,454 | | Areva(b) | | | 69 | | | | 63 | | | | 132 | | | Arkema | | | — | | | | — | | | | — | | Chicago Mercantile Exchange Group(c) | | | 1 | | | | 9 | | | | 10 | | Olympia Energy Fund — energy investment fund(d) | | | 37 | | | | (3 | ) | | | 34 | | | Other publicly traded equity securities | | | 2 | | | | (1 | ) | | | 1 | | | | | | | | | | | | | | | | Total publicly traded equity securities(e) | | | 3,619 | | | | 12 | | | | 3,631 | | | | | | | | | | | | | | | | | BBPP | | | 60 | | | | — | | | | 60 | | | BTC Limited | | | 141 | | | | — | | | | 141 | | | Other equity securities | | | 758 | | | | — | | | | 758 | | | | | | | | | | | | | | | | Total other equity securities(e) | | | 959 | | | | — | | | | 959 | | | | | | | | | | | | | | | | Other investments | | | 4,578 | | | | 12 | | | | 4,590 | | | | | | | | | | | | | | | |
F-41
| | | | | | | | | | | | | As of December 31, 2011 (M€) | | Carrying
amount | | | Unrealized gain (loss) | | | Balance sheet value | | Sanofi(a) | | | 2,100 | | | | 351 | | | | 2,451 | | Areva(b) | | | 69 | | | | 1 | | | | 70 | | Arkema | | | — | | | | — | | | | — | | Chicago Mercantile Exchange Group | | | 1 | | | | 6 | | | | 7 | | Olympia Energy Fund — energy investment fund | | | 38 | | | | (5 | ) | | | 33 | | Gevo | | | 15 | | | | (3 | ) | | | 12 | | Other publicly traded equity securities | | | 3 | | | | (1 | ) | | | 2 | | Total publicly traded equity securities(c) | | | 2,226 | | | | 349 | | | | 2,575 | | BBPP | | | 62 | | | | — | | | | 62 | | Ocensa(d) | | | 85 | | | | — | | | | 85 | | BTC Limited | | | 132 | | | | — | | | | 132 | | Other equity securities | | | 820 | | | | — | | | | 820 | | Total other equity securities(c) | | | 1,099 | | | | — | | | | 1,099 | | Other investments | | | 3,325 | | | | 349 | | | | 3,674 | | | | | | | | | | | | | | | | As of December 31, 2010 (M€) | | Carrying
amount | | | Unrealized gain (loss) | | | Balance sheet value | | Sanofi(a) | | | 3,510 | | | | (56 | ) | | | 3,454 | | Areva(b) | | | 69 | | | | 63 | | | | 132 | | Arkema | | | — | | | | — | | | | — | | Chicago Mercantile Exchange Group | | | 1 | | | | 9 | | | | 10 | | Olympia Energy Fund — energy investment fund | | | 37 | | | | (3 | ) | | | 34 | | Other publicly traded equity securities | | | 2 | | | | (1 | ) | | | 1 | | Total publicly traded equity securities(c) | | | 3,619 | | | | 12 | | | | 3,631 | | BBPP | | | 60 | | | | — | | | | 60 | | BTC Limited | | | 141 | | | | — | | | | 141 | | Other equity securities | | | 758 | | | | — | | | | 758 | | Total other equity securities(c) | | | 959 | | | | — | | | | 959 | | Other investments | | | 4,578 | | | | 12 | | | | 4,590 | |
| | | | | | | | | | | | | As of December 31, 2009 (M€) | | Carrying
amount | | | Unrealized gain (loss) | | | Balance sheet value | | Areva(b) | | | 69 | | | | 58 | | | | 127 | | Arkema | | | 15 | | | | 47 | | | | 62 | | Chicago Mercantile Exchange Group | | | 1 | | | | 9 | | | | 10 | | Olympia Energy Fund — energy investment fund | | | 35 | | | | (2 | ) | | | 33 | | Other publicly traded equity securities | | | — | | | | — | | | | — | | Total publicly traded equity securities(c) | | | 120 | | | | 112 | | | | 232 | | BBPP | | | 72 | | | | — | | | | 72 | | BTC Limited | | | 144 | | | | — | | | | 144 | | Other equity securities | | | 714 | | | | — | | | | 714 | | Total other equity securities(c) | | | 930 | | | | — | | | | 930 | | Other investments | | | 1,050 | | | | 112 | | | | 1,162 | |
| | | | | | | | | | | | | | | | | Carrying
| | Unrealized gain,
| | Balance
| | As of December 31, 2009 (M€) | | amount | | (loss) | | sheet value | Areva(b) | | | 69 | | | | 58 | | | | 127 | | | Arkema | | | 15 | | | | 47 | | | | 62 | | Chicago Mercantile Exchange Group(c) | | | 1 | | | | 9 | | | | 10 | | Olympia Energy Fund — energy investment fund(d) | | | 35 | | | | (2 | ) | | | 33 | | | Other publicly traded equity securities | | | — | | | | — | | | | — | | | | | | | | | | | | | | | | Total publicly traded equity securities(e) | | | 120 | | | | 112 | | | | 232 | | | | | | | | | | | | | | | | | BBPP | | | 72 | | | | — | | | | 72 | | | BTC Limited | | | 144 | | | | — | | | | 144 | | | Other equity securities | | | 714 | | | | — | | | | 714 | | | | | | | | | | | | | | | | Total other equity securities(e) | | | 930 | | | | — | | | | 930 | | | | | | | | | | | | | | | | Other investments | | | 1,050 | | | | 112 | | | | 1,162 | | | | | | | | | | | | | | | | | | | | | | | | | | | | | | | | | | | Carrying
| | Unrealized gain
| | Balance
| | As of December 31, 2008 (M€) | | amount | | (loss) | | sheet value | | | Areva(b) | | | 69 | | | | 59 | | | | 128 | | | Arkema | | | 16 | | | | 15 | | | | 31 | | Chicago Mercantile Exchange Group(c) | | | 1 | | | | 5 | | | | 6 | | Olympia Energy Fund — energy investment fund(d) | | | 36 | | | | (5 | ) | | | 31 | | | Other publicly traded equity securities | | | — | | | | — | | | | — | | | | | | | | | | | | | | | | Total publicly traded equity securities(e) | | | 122 | | | | 74 | | | | 196 | | | | | | | | | | | | | | | | | BBPP | | | 75 | | | | — | | | | 75 | | | BTC Limited | | | 161 | | | | — | | | | 161 | | | Other equity securities | | | 733 | | | | — | | | | 733 | | | | | | | | | | | | | | | | Total other equity securities(e) | | | 969 | | | | — | | | | 969 | | | | | | | | | | | | | | | | Other investments | | | 1,091 | | | | 74 | | | | 1,165 | | | | | | | | | | | | | | | |
| (a) | | | (a) | | End of the accounting for by the equity method of Sanofi-AventisSanofi as of July 1st, 2010 (see Note 3 to the Consolidated Financial Statements). |
| (b) | | | (b) | | Unrealized gain based on the investment certificate. |
| (c) | | The Nymex Holdings Inc. securities have been traded during the acquisition process running from June 11 to August 22, 2008 through which Chicago Mercantile Exchange Group acquired all the Nymex Holdings Inc. securities. | (d) | | Securities acquired in 2008. | (e) | | Including cumulative impairments of €597€604 million in 2011,€597 million in 2010 €599and€599 million in 2009 and €608 million2009. |
| (d) | End of the accounting for by the equity method of Ocensa in 2008.July 2011 (see Note 3 to the Consolidated Financial Statements). |
F-42
| | | | | | | | | | | | | As of December 31, 2011 (M€) | | Gross value | | | Valuation
allowance | | | Net value | | Deferred income tax assets | | | 1,767 | | | | — | | | | 1,767 | | Loans and advances(a) | | | 2,454 | | | | (399 | ) | | | 2,055 | | Other | | | 1,049 | | | | — | | | | 1,049 | | Total | | | 5,270 | | | | (399 | ) | | | 4,871 | |
| | | | | | | | | | | | | As of December 31, 2010 (M€) | | Gross value | | | Valuation
allowance | | | Net value | | Deferred income tax assets | | | 1,378 | | | | — | | | | 1,378 | | Loans and advances(a) | | | 2,060 | | | | (464 | ) | | | 1,596 | | Other | | | 681 | | | | — | | | | 681 | | Total | | | 4,119 | | | | (464 | ) | | | 3,655 | |
| | | | | | | | | | | | | As of December 31, 2009 (M€) | | Gross value | | | Valuation
allowance | | | Net value | | Deferred income tax assets | | | 1,164 | | | | — | | | | 1,164 | | Loans and advances(a) | | | 1,871 | | | | (587 | ) | | | 1,284 | | Other | | | 633 | | | | — | | | | 633 | | Total | | | 3,668 | | | | (587 | ) | | | 3,081 | |
| (a) | | 14) | OTHER NON-CURRENT ASSETS |
| | | | | | | | | | | | | | | | | Gross
| | | Valuation
| | | Net
| | | As of December 31, 2010 (M€) | | value | | | allowance | | | value | | | Deferred income tax assets | | | 1,378 | | | | — | | | | 1,378 | | Loans and advances(a) | | | 2,060 | | | | (464 | ) | | | 1,596 | | | Other | | | 681 | | | | — | | | | 681 | | | | | | | | | | | | | | | | Total | | | 4,119 | | | | (464 | ) | | | 3,655 | | | | | | | | | | | | | | | |
| | | | | | | | | | | | | | | | | Gross
| | | Valuation
| | | Net
| | | As of December 31, 2009 (M€) | | value | | | allowance | | | value | | | Deferred income tax assets | | | 1,164 | | | | — | | | | 1,164 | | Loans and advances(a) | | | 1,871 | | | | (587 | ) | | | 1,284 | | | Other | | | 633 | | | | — | | | | 633 | | | | | | | | | | | | | | | | Total | | | 3,668 | | | | (587 | ) | | | 3,081 | | | | | | | | | | | | | | | |
| | | | | | | | | | | | | | | | | Gross
| | | Valuation
| | | Net
| | | As of December 31, 2008 (M€) | | value | | | allowance | | | value | | | Deferred income tax assets | | | 1,010 | | | | — | | | | 1,010 | | Loans and advances(a) | | | 1,932 | | | | (529 | ) | | | 1,403 | | | Other | | | 631 | | | | — | | | | 631 | | | | | | | | | | | | | | | | Total | | | 3,573 | | | | (529 | ) | | | 3,044 | | | | | | | | | | | | | | | |
| | | (a) | | Excluding loans to equity affiliates. |
Changes in the valuation allowance on loans and advances are detailed as follows: | | | | | | | | | | | | | | | | | | | | | | | | | | | | | | | | | | Currency
| | | | | | | | Valuation
| | | | | | | | | translation
| | | Valuation
| | | | | allowance as of
| | | | | | | | | adjustment and
| | | allowance as of
| | | For the Year Ended December 31, (M€) | | January 1, | | | Increases | | | Decreases | | | other variations | | | December 31, | | 2010 | | | (587 | ) | | | (33 | ) | | | 220 | | | | (64 | ) | | | (464 | ) | | 2009 | | | (529 | ) | | | (19 | ) | | | 29 | | | | (68 | ) | | | (587 | ) | | 2008 | | | (527 | ) | | | (33 | ) | | | 52 | | | | (21 | ) | | | (529 | ) |
| | | | | | | | | | | | | | | | | Gross
| | | Valuation
| | | Net
| | | As of December 31, 2010 (M€) | | value | | | allowance | | | value | | | Crude oil and natural gas | | | 4,990 | | | | — | | | | 4,990 | | | Refined products | | | 7,794 | | | | (28 | ) | | | 7,766 | | | Chemicals products | | | 1,350 | | | | (99 | ) | | | 1,251 | | | Other inventories | | | 1,911 | | | | (318 | ) | | | 1,593 | | | | | | | | | | | | | | | | Total | | | 16,045 | | | | (445 | ) | | | 15,600 | | | | | | | | | | | | | | | |
F-43
| | | | | | | | | | | | | | | | | | | | | For the year ended December 31, (M€) | | Valuation
allowance as
of January 1, | | | Increases | | | Decreases | | | Currency
translation
adjustment and
other variations | | | Valuation
allowance as of
December 31, | | 2011 | | | (464 | ) | | | (25 | ) | | | 122 | | | | (32 | ) | | | (399 | ) | 2010 | | | (587 | ) | | | (33 | ) | | | 220 | | | | (64 | ) | | | (464 | ) | 2009 | | | (529 | ) | | | (19 | ) | | | 29 | | | | (68 | ) | | | (587 | ) |
15)INVENTORIES | | | | | | | | | | | | | As of December 31, 2011 (M€) | | Gross value | | | Valuation
allowance | | | Net value | | Crude oil and natural gas | | | 4,735 | | | | (24 | ) | | | 4,711 | | Refined products | | | 9,706 | | | | (36 | ) | | | 9,670 | | Chemicals products | | | 1,489 | | | | (103 | ) | | | 1,386 | | Other inventories | | | 2,761 | | | | (406 | ) | | | 2,355 | | Total | | | 18,691 | | | | (569 | ) | | | 18,122 | |
| | | | | | | | | | | | | | | | | Gross
| | | Valuation
| | | Net
| | | As of December 31, 2009 (M€) | | value | | | allowance | | | value | | | Crude oil and natural gas | | | 4,581 | | | | — | | | | 4,581 | | | Refined products | | | 6,647 | | | | (18 | ) | | | 6,629 | | | Chemicals products | | | 1,234 | | | | (113 | ) | | | 1,121 | | | Other inventories | | | 1,822 | | | | (286 | ) | | | 1,536 | | | | | | | | | | | | | | | | Total | | | 14,284 | | | | (417 | ) | | | 13,867 | | | | | | | | | | | | | | | |
| | | | | | | | | | | | | | | | | Gross
| | | Valuation
| | | Net
| | | As of December 31, 2008 (M€) | | value | | | allowance | | | value | | | Crude oil and natural gas | | | 2,772 | | | | (326 | ) | | | 2,446 | | | Refined products | | | 4,954 | | | | (416 | ) | | | 4,538 | | | Chemicals products | | | 1,419 | | | | (105 | ) | | | 1,314 | | | Other inventories | | | 1,591 | | | | (268 | ) | | | 1,323 | | | | | | | | | | | | | | | | Total | | | 10,736 | | | | (1,115 | ) | | | 9,621 | | | | | | | | | | | | | | | |
| | | | | | | | | | | | | | As of December 31, 2010 (M€) | | Gross value | | | Valuation
allowance | | | Net value | | Crude oil and natural gas | | | 4,990 | | | | — | | | | 4,990 | | Refined products | | | 7,794 | | | | (28 | ) | | | 7,766 | | Chemicals products | | | 1,350 | | | | (99 | ) | | | 1,251 | | Other inventories | | | 1,911 | | | | (318 | ) | | | 1,593 | | Total | | | 16,045 | | | | (445 | ) | | | 15,600 | |
| | | | | | | | | | | | | | As of December 31, 2009 (M€) | | Gross value | | | Valuation
allowance | | | Net value | | Crude oil and natural gas | | | 4,581 | | | | — | | | | 4,581 | | Refined products | | | 6,647 | | | | (18 | ) | | | 6,629 | | Chemicals products | | | 1,234 | | | | (113 | ) | | | 1,121 | | Other inventories | | | 1,822 | | | | (286 | ) | | | 1,536 | | Total | | | 14,284 | | | | (417 | ) | | | 13,867 | |
Changes in the valuation allowance on inventories are as follows: | | | | | | | | | | | | | | | | | | | | | | | | | | | Currency
| | | | | | | | | | | | | | translation
| | | Valuation
| | | | | Valuation
| | | | | | adjustment
| | | allowance
| | | | | allowance as of
| | | Increase
| | | and other
| | | as of
| | | For the year ended December 31, (M€) | | January 1, | | | (net) | | | variations | | | December 31, | | 2010 | | | (417 | ) | | | (39 | ) | | | 11 | | | | (445 | ) | | 2009 | | | (1,115 | ) | | | 700 | | | | (2 | ) | | | (417 | ) | | 2008 | | | (325 | ) | | | (740 | ) | | | (50 | ) | | | (1,115 | ) |
| | 16) | ACCOUNTS RECEIVABLE AND OTHER CURRENT ASSETS |
| | | | | | | | | | | | | | | | | Gross
| | | Valuation
| | | Net
| | | As of December 31, 2010 (M€) | | value | | | allowance | | | value | | Accounts receivable | | | 18,635 | | | | (476 | ) | | | 18,159 | | | | | | | | | | | | | | | | | Recoverable taxes | | | 2,227 | | | | — | | | | 2,227 | | | Other operating receivables | | | 4,543 | | | | (136 | ) | | | 4,407 | | | Deferred income tax | | | 151 | | | | — | | | | 151 | | | Prepaid expenses | | | 657 | | | | — | | | | 657 | | | Other current assets | | | 41 | | | | — | | | | 41 | | | | | | | | | | | | | | | | Other current assets | | | 7,619 | | | | (136 | ) | | | 7,483 | | | | | | | | | | | | | | | |
| | | | | | | | | | | | | | | | | Gross
| | | Valuation
| | | Net
| | | As of December 31, 2009 (M€) | | value | | | allowance | | | value | | Accounts receivable | | | 16,187 | | | | (468 | ) | | | 15,719 | | | | | | | | | | | | | | | | | Recoverable taxes | | | 2,156 | | | | — | | | | 2,156 | | | Other operating receivables | | | 5,214 | | | | (69 | ) | | | 5,145 | | | Deferred income tax | | | 214 | | | | — | | | | 214 | | | Prepaid expenses | | | 638 | | | | — | | | | 638 | | | Other current assets | | | 45 | | | | — | | | | 45 | | | | | | | | | | | | | | | | Other current assets | | | 8,267 | | | | (69 | ) | | | 8,198 | | | | | | | | | | | | | | | |
F-44
| | | | | | | | | | | | | | | | | | For the year ended December 31, (M€) | | Valuation
allowance as
of January 1, | | | Increase (net) | | | Currency
translation
adjustment and
other variations | | | Valuation
allowance as of
December 31, | | 2011 | | | (445 | ) | | | (83 | ) | | | (41 | ) | | | (569 | ) | 2010 | | | (417 | ) | | | (39 | ) | | | 11 | | | | (445 | ) | 2009 | | | (1,115 | ) | | | 700 | | | | (2 | ) | | | (417 | ) |
16)ACCOUNTS RECEIVABLE AND OTHER CURRENT ASSETS | | | | | | | | | | | | | | As of December 31, 2011 (M€) | | Gross
value | | | Valuation
allowance | | | Net
value | | Accounts receivable | | | 20,532 | | | | (483 | ) | | | 20,049 | | Recoverable taxes | | | 2,398 | | | | — | | | | 2,398 | | Other operating receivables | | | 7,750 | | | | (283 | ) | | | 7,467 | | Deferred income tax | | | — | | | | — | | | | — | | Prepaid expenses | | | 840 | | | | — | | | | 840 | | Other current assets | | | 62 | | | | — | | | | 62 | | Other current assets | | | 11,050 | | | | (283 | ) | | | 10,767 | |
| | | | | | | | | | | | | | As of December 31, 2010 (M€) | | Gross
value | | | Valuation
allowance | | | Net
value | | Accounts receivable | | | 18,635 | | | | (476 | ) | | | 18,159 | | Recoverable taxes | | | 2,227 | | | | — | | | | 2,227 | | Other operating receivables | | | 4,543 | | | | (136 | ) | | | 4,407 | | Deferred income tax | | | 151 | | | | — | | | | 151 | | Prepaid expenses | | | 657 | | | | — | | | | 657 | | Other current assets | | | 41 | | | | — | | | | 41 | | Other current assets | | | 7,619 | | | | (136 | ) | | | 7,483 | |
| | | | | | | | | | | | | | As of December 31, 2009 (M€) | | Gross
value | | | Valuation
allowance | | | Net
value | | Accounts receivable | | | 16,187 | | | | (468 | ) | | | 15,719 | | Recoverable taxes | | | 2,156 | | | | — | | | | 2,156 | | Other operating receivables | | | 5,214 | | | | (69 | ) | | | 5,145 | | Deferred income tax | | | 214 | | | | — | | | | 214 | | Prepaid expenses | | | 638 | | | | — | | | | 638 | | Other current assets | | | 45 | | | | — | | | | 45 | | Other current assets | | | 8,267 | | | | (69 | ) | | | 8,198 | |
| | | | | | | | | | | | | | | | | Gross
| | | Valuation
| | | Net
| | | As of December 31, 2008 (M€) | | value | | | allowance | | | value | | Accounts receivable | | | 15,747 | | | | (460 | ) | | | 15,287 | | | | | | | | | | | | | | | | | Recoverable taxes | | | 2,510 | | | | — | | | | 2,510 | | | Other operating receivables | | | 6,227 | | | | (19 | ) | | | 6,208 | | | Deferred income tax | | | 206 | | | | — | | | | 206 | | | Prepaid expenses | | | 650 | | | | — | | | | 650 | | | Other current assets | | | 68 | | | | — | | | | 68 | | | | | | | | | | | | | | | | Other current assets | | | 9,661 | | | | (19 | ) | | | 9,642 | | | | | | | | | | | | | | | |
Changes in the valuation allowance on “Accounts receivable” and “Other current assets” are as follows: | | | | | | | | | | | | | | | | | | (M€) | | Valuation
allowance
as of
January 1, | | | Increase
(net) | | | Currency
translation
adjustments
and other
variations | | | Valuation
allowance as of
December 31, | | Accounts receivable | | | | | | | | | | | | | | | | | 2011 | | | (476 | ) | | | 4 | | | | (11 | ) | | | (483 | ) | 2010 | | | (468 | ) | | | (31 | ) | | | 23 | | | | (476 | ) | 2009 | | | (460 | ) | | | (17 | ) | | | 9 | | | | (468 | ) | Other current assets | | | | | | | | | | | | | | | | | 2011 | | | (136 | ) | | | (132 | ) | | | (15 | ) | | | (283 | ) | 2010 | | | (69 | ) | | | (66 | ) | | | (1 | ) | | | (136 | ) | 2009 | | | (19 | ) | | | (14 | ) | | | (36 | ) | | | (69 | ) |
| | | | | | | | | | | | | | | | | | | | | Valuation
| | | | | | Currency translation
| | | Valuation
| | | | | allowance as of
| | | | | | adjustments and
| | | allowance as of
| | | (M€) | | January 1, | | | Increase (net) | | | other variations | | | December 31, | | Accounts receivable | | | | | | | | | | | | | | | | | | | | | | | | | | | | | | | | | | | 2010 | | | (468 | ) | | | (31 | ) | | | 23 | | | | (476 | ) | | 2009 | | | (460 | ) | | | (17 | ) | | | 9 | | | | (468 | ) | | 2008 | | | (482 | ) | | | 9 | | | | 13 | | | | (460 | ) | Other current assets | | | | | | | | | | | | | | | | | | | | | | | | | | | | | | | | | | | 2010 | | | (69 | ) | | | (66 | ) | | | (1 | ) | | | (136 | ) | | 2009 | | | (19 | ) | | | (14 | ) | | | (36 | ) | | | (69 | ) | | 2008 | | | (27 | ) | | | 7 | | | | 1 | | | | (19 | ) |
As of December 31, 2011, the net portion of the overdue receivables includes in “Accounts receivable” and “Other current assets” is€3,556 million, of which€1,857 million has expired for less than 90 days,€365 million has expired between 90 days and 6 months,€746 million has expired between 6 and 12 months and€588 million has expired for more than 12 months. As of December 31, 2010, the net portion of the overdue receivables includedincludes in “Accounts receivable” and “Other current assets” is €3,141€3,141 million, of which €1,885€1,885 million has expired for less than 90 days, €292€292 million has expired between 90 days and 6 months, €299€299 million has expired between 6 and 12 months and €665€665 million has expired for more than 12 months. As of December 31, 2009, the net portion of the overdue receivables included in “Accounts receivable” and “Other current assets” is €3,610€3,610 million, of which €2,116€2,116 million has expired for less than 90 days, €486€486 million has expired between 90 days and 6 months, €246€246 million has expired between 6 and 12 months and €762€762 million has expired for more than 12 months. As of December 31, 2008, the net portion of the overdue receivables included in “Accounts receivable” and “Other current assets” was €3,744 million, of which €2,420 million had expired for less than 90 days, €729 million had expired between 90 days and 6 months, €54 million had expired between 6 and 12 months and €541 million had expired for more than 12 months.
| | 17)SHAREHOLDERS’ EQUITY 17)
| SHAREHOLDERS’ EQUITY |
Number of TotalTOTAL shares The Company’s common shares, par value €2.50,€2.50, as of December 31, 20102011 are the only category of shares. Shares may be held in either bearer or registered form. Double voting rights are granted to holders of shares that are fully-paid and held in the name of the same shareholder for at least two years, with due consideration for the total portion of the share capital represented. Double voting rights are also assigned to restricted shares in the event of an increase in share capital by incorporation of reserves, profits or premiums based on shares already held that are entitled to double voting rights. Pursuant to the Company’s bylaws (Statuts)(Statuts), no shareholder may cast a vote at a shareholders’ meeting, either by himself or through an agent, representing more than 10% of the total voting rights for the Company’s shares. This limit applies to the aggregated amount of voting rights held directly, indirectly or through voting proxies. However, in the case of double voting rights, this limit may be extended to 20%. These restrictions no longer apply if any individual or entity, acting alone or in concert, acquires at least two-thirds of the total share capital of the Company, directly or indirectly, following a public tender offer for all of the Company’s shares. F-45
The authorized share capital amounts to 3,446,401,650 shares as of December 31, 2011 compared to 3,439,391,697 shares as of December 31, 2010 compared toand 3,381,921,458 shares as of December 31, 2009 and 3,413,204,025 as of December 31, 2008.2009. Variation of the share capital | | | | | | | As of January 1, 2009 | | | | | 2,371,808,074 | | Shares issued in connection with: | | Exercise of TOTAL share subscription options | | | 934,780 | | | | Exchange guarantee offered to the beneficiaries of Elf Aquitaine share subscription options | | | 480,030 | | Cancellation of shares(a) | | | | | (24,800,000 | ) | As of January 1, 20082010 | | | | | 2,395,532,0972,348,422,884 | | Shares issued in connection with: | | Exercise of TOTAL share subscription options | | | 1,218,047 | | As of January 1, 2011 | | | | | 2,349,640,931 | | Shares issued in connection with: | | Capital increase reserved for employees | | | 4,870,3868,902,717 | | | | | Exercise of TOTAL share subscription options | | | 1,178,1675,223,665 | | | | Exchange guarantee offered to the beneficiariesAs of
Elf Aquitaine share subscription options | | | 227,424 | | Cancellation of shares December 31, 2011(a)(b)
| | | | | (30,000,0002,363,767,313 | ) | | | | | | | | As of January 1, 2009
| | | | | 2,371,808,074 | | | | | | | | | Shares issued in connection with: | | Exercise of TOTAL share subscription options | | | 934,780 | | | | Exchange guarantee offered to the beneficiaries of
Elf Aquitaine share subscription options | | | 480,030 | | Cancellation of shares(b)
| | | | | (24,800,000 | ) | | | | | | | | As of January 1, 2010
| | | | | 2,348,422,884 | | | | | | | | | Shares issued in connection with: | | Exercise of TOTAL share subscription options | | | 1,218,047 | | | | | | | | | As of December 31, 2010(c)
| | | | | 2,349,640,931 | | | | | | | | |
| (a) | | | (a) | | Decided by the Board of Directors on July 31, 2008. | (b) | | Decided by the Board of Directors on July 30, 2009. |
(c)(b) | | Including 112,487,679109,554,173 treasury shares deducted from consolidated shareholders’ equity. |
The variation of both weighted-average number of shares and weighted-average number of diluted shares respectively used in the calculation of earnings per share and fully-diluted earnings per share is detailed as follows: | | | | | | | | | | | | | | | | | 2010 | | | 2009 | | | 2008 | | Number of shares as of January 1, | | | 2,348,422,884 | | | | 2,371,808,074 | | | | 2,395,532,097 | | | | | | | | | | | | | | | | Number of shares issued during the year (pro rated) | | | | | | | | | | | | | | Exercise of TOTAL share subscription options | | | 412,114 | | | | 221,393 | | | | 742,588 | | | Exercise of TOTAL share purchase options | | | 984,800 | | | | 93,827 | | | | 2,426,827 | | | Exchange guarantee offered to the beneficiaries of Elf Aquitaine share subscription options | | | — | | | | 393,623 | | | | 86,162 | | | TOTAL restricted shares | | | 416,420 | | | | 1,164,389 | | | | 1,112,393 | | Global free TOTAL share plan(a) | | | 15 | | | | — | | | | — | | | Capital increase reserved for employees | | | — | | | | — | | | | 3,246,924 | | | TOTAL shares held by TOTAL S.A. or by its subsidiaries and deducted from shareholders’ equity | | | (115,407,190 | ) | | | (143,082,095 | ) | | | (168,290,440 | ) | | | | | | | | | | | | | | | Weighted-average number of shares | | | 2,234,829,043 | | | | 2,230,599,211 | | | | 2,234,856,551 | | | | | | | | | | | | | | | | Dilutive effect | | | | | | | | | | | | | | TOTAL share subscription and purchase options | | | 1,758,006 | | | | 1,711,961 | | | | 6,784,200 | | | TOTAL restricted shares | | | 6,031,963 | | | | 4,920,599 | | | | 4,172,944 | | Global free TOTAL share plan(a) | | | 1,504,071 | | | | — | | | | — | | | Exchange guarantee offered to the beneficiaries of Elf Aquitaine share subscription options | | | — | | | | 60,428 | | | | 460,935 | | | Capital increase reserved for employees | | | 371,493 | | | | — | | | | 383,912 | | | | | | | | | | | | | | | | Weighted-average number of diluted shares | | | 2,244,494,576 | | | | 2,237,292,199 | | | | 2,246,658,542 | | | | | | | | | | | | | | | |
| | | | | | | | | | | | | | | | 2011 | | | 2010 | | | 2009 | | Number of shares as of January 1, | | | 2,349,640,931 | | | | 2,348,422,884 | | | | 2,371,808,074 | | Number of shares issued during the year (pro rated) | | | | | | | | | | | — | | Exercise of TOTAL share subscription options | | | 3,412,123 | | | | 412,114 | | | | 221,393 | | Exercise of TOTAL share purchase options | | | — | | | | 984,800 | | | | 93,827 | | Exchange guarantee offered to the beneficiaries of Elf Aquitaine share subscription options | | | — | | | | — | | | | 393,623 | | TOTAL performance shares | | | 978,503 | | | | 416,420 | | | | 1,164,389 | | Global free TOTAL share plan(a) | | | 506 | | | | 15 | | | | — | | Capital increase reserved for employees | | | 5,935,145 | | | | — | | | | — | | TOTAL shares held by TOTAL S.A. or by its subsidiaries and deducted from shareholders’ equity | | | (112,487,679 | ) | | | (115,407,190 | ) | | | (143,082,095 | ) | Weighted-average number of shares | | | 2,247,479,529 | | | | 2,234,829,043 | | | | 2,230,599,211 | | Dilutive effect | | | | | | | | | | | — | | TOTAL share subscription and purchase options | | | 470,095 | | | | 1,758,006 | | | | 1,711,961 | | TOTAL performance shares | | | 6,174,808 | | | | 6,031,963 | | | | 4,920,599 | | Global free TOTAL share plan(a) | | | 2,523,233 | | | | 1,504,071 | | | | | | Exchange guarantee offered to the beneficiaries of Elf Aquitaine share subscription options | | | — | | | | — | | | | 60,428 | | Capital increase reserved for employees | | | 303,738 | | | | 371,493 | | | | — | | Weighted-average number of diluted shares | | | 2,256,951,403 | | | | 2,244,494,576 | | | | 2,237,292,199 | |
| (a) | | | (a) | | The Board of Directors approved on May 21, 2010 the implementation and conditions of a global free share plan intended for the Group employees. |
F-46
Capital increase reserved for Group employees Pursuant to the authorization granted by the shareholders’ meeting held on May 11, 2007, the Board of Directors, during its November 6, 2007 meeting, implemented a first capital increase reserved for employees within the limit of 12 million shares, at a price of €44.40 per share, with dividend rights as of January 1, 2007. The subscription period ran from March 10, 2008 to March 28, 2008. 4,870,386 shares were subscribed by employees pursuant to the capital increase.
At the shareholders’ meeting held on May 21, 2010, the shareholders delegated to the Board of Directors the authority to increase the share capital of the Company in one or more transactions and within a maximum period of 26 months from the date of the meeting, by an amount not exceeding 1.5% of the share capital outstanding on the date of the meeting of the Board of Directors at which a decision to proceed with an issuance is made reserving subscriptions for such issuance to the Group employees participating in a company savings plan. It is being specified that the amount of any such capital increase reserved for Group employees is counted against the aggregate maximum nominal amount of share capital increases authorized by the shareholders’ meeting held on May 21, 2010 for issuing new ordinary shares or other securities granting immediate or future access to the Company’s share capital with preferential subscription rights (€2.5 billion in nominal value).
Pursuant to this delegation of authorization, the Board of Directors, during its October 28, 2010 meeting, decided to proceed with a capital increase reserved for employees in 2011 within the limit of 12 million shares with dividend rights as of January 1, 2010 and delegated to the Chairman and CEO all powers to determine the opening and closing of the subscription period and the subscription price.
Share cancellation
Pursuant to the authorization granted by the shareholders’ meeting held on May 11, 2007 authorizing reduction of capital by cancellation of shares held by the Company within the limit of 10% of the outstanding capital every 24 months, the Board of Directors decided on July 30, 2009 to cancel 24,800,000 shares acquired in 2008 at an average price of €49.28 per share.
Treasury shares (TOTAL shares held by TOTAL S.A.)
As of December 31, 2010, TOTAL S.A. held 12,156,411 of its own shares, representing 0.52% of its share capital, detailed as follows:
| | • | 6,012,460 shares allocated to TOTAL restricted shares plans for Group employees; | • | 6,143,951 shares intended to be allocated to new TOTAL share purchase option plans or to new restricted shares plans. |
These shares are deducted from the consolidated shareholders’ equity.
As of December 31, 2009, TOTAL S.A. held 15,075,922 of its own shares, representing 0.64% of its share capital, detailed as follows:
| | • | 6,017,499 shares allocated to covering TOTAL share purchase option plans for Group employees and executive officers; | • | 5,799,400 shares allocated to TOTAL restricted shares plans for Group employees; and | • | 3,259,023 shares intended to be allocated to new TOTAL share purchase option plans or to new restricted shares plans. |
These shares were deducted from the consolidated shareholders’ equity.
As of December 31, 2008, TOTAL S.A. held 42,750,827 of its own shares, representing 1.80% of its share capital, detailed as follows:
| | • | 12,627,522 shares allocated to covering TOTAL share purchase option plans for Group employees; | • | 5,323,305 shares allocated to TOTAL restricted shares plans for Group employees; and | • | 24,800,000 shares purchased for cancellation between January and October 2008 pursuant to the authorization granted by the shareholders’ meetings held on May 11, 2007 and May 16, 2008. The Board of Directors on July 30, 2009 decided to cancel these 24,800,000 shares acquired at an average price of €49.28 per share. |
These shares were deducted from the consolidated shareholders’ equity.
TOTAL shares held by Group subsidiaries
As of December 31, 2010, 2009 and 2008, TOTAL S.A. held indirectly through its subsidiaries 100,331,268 of its own shares, representing 4.27% of its share capital as of December 31, 2010, 4.27% of its share capital as of
F-47
December 31, 2009 and 4.23% of its share capital as of December 31, 2008 detailed as follows:
| | • | 2,023,672 shares held by a consolidated subsidiary, Total Nucléaire, 100% indirectly controlled by TOTAL S.A.; and | • | 98,307,596 shares held by subsidiaries of Elf Aquitaine (Financière Valorgest, Sogapar and Fingestval). |
These shares are deducted from the consolidated shareholders’ equity.
Dividend
TOTAL S.A. paid on June 1, 2010 the balance of the dividend of €1.14 per share for the 2009 fiscal year (the ex-dividend date was May 27, 2010). In addition, TOTAL S.A. paid on November 17, 2010 an interim dividend of €1.14 per share for the fiscal year 2010 (the ex-dividend date was November 12, 2010).
A resolution will be submitted at the shareholders’ meeting on May 13, 2011 to pay a dividend of €2.28 per share for the 2010 fiscal year, i.e. a balance of €1.14 per share to be distributed after deducting the interim dividend of €1.14 already paid.
Paid-in surplus
In accordance with French law, the paid-in surplus corresponds to share premiums of the parent company which can be capitalized or used to offset losses if the legal reserve has reached its minimum required level. The amount of the paid-in surplus may also be distributed subject to taxation unless the unrestricted reserves of the parent company are distributed prior to this item.
As of December 31, 2010, paid-in surplus amounted to €27,208 million (€27,171 million as of December 31, 2009 and €28,284 million as of December 31, 2008).
Reserves
Under French law, 5% of net income must be transferred to the legal reserve until the legal reserve reaches 10% of the nominal value of the share capital. This reserve cannot be distributed to the shareholders other than upon liquidation but can be used to offset losses.
If wholly distributed, the unrestricted reserves of the parent company would be taxed for an approximate amount of €514 million as of December 31, 2010 (€514 million as of December 31, 2009).
Other comprehensive income
Detail of other comprehensive income showing items reclassified from equity to net income is presented in the table below:
| | | | | | | | | | | | | | | | | | | | | | | | | | | For the year ended December 31, (M€) | | 2010 | | | 2009 | | | 2008 | | Currency translation adjustment | | | | | | | 2,231 | | | | | | | | (244 | ) | | | | | | | (722 | ) | | – Unrealized gain/(loss) of the period | | | 2,234 | | | | | | | | (243 | ) | | | | | | | (722 | ) | | | | | | – Less gain/(loss) included in net income | | | 3 | | | | | | | | 1 | | | | | | | | — | | | | | | | | | | | | | | | | | | | | | | | | | | | | | | | | | | | | | | | | | | | | | | | | | | | | | | | | | | Available for sale financial assets | | | | | | | (100 | ) | | | | | | | 38 | | | | | | | | (254 | ) | | – Unrealized gain/(loss) of the period | | | (50 | ) | | | | | | | 38 | | | | | | | | (254 | ) | | | | | | – Less gain/(loss) included in net income | | | 50 | | | | | | | | — | | | | | | | | — | | | | | | Cash flow hedge | | | | | | | (80 | ) | | | | | | | 128 | | | | | | | | — | | | – Unrealized gain/(loss) of the period | | | (195 | ) | | | | | | | 349 | | | | | | | | — | | | | | | | – Less gain/(loss) included in net income | | | (115 | ) | | | | | | | 221 | | | | | | | | — | | | | | | | | | | | | | | | | | | | | | | | | | | | | | | | | | | | | | | | | | | | | | | | | | | | | | | | | | | Share of other comprehensive income of equity affiliates, net amount | | | | | | | 302 | | | | | | | | 234 | | | | | | | | 173 | | | | | | | | | | | | | | | | | | | | | | | | | | | | | | | | | | | | | | | | | | | | | | | | | | | | | | Other | | | | | | | (7 | ) | | | | | | | (5 | ) | | | | | | | 1 | | | – Unrealized gain/(loss) of the period | | | (7 | ) | | | | | | | (5 | ) | | | | | | | 1 | | | | | | | – Less gain/(loss) included in net income | | | — | | | | | | | | — | | | | | | | | — | | | | | | Tax effect | | | | | | | 28 | | | | | | | | (38 | ) | | | | | | | 30 | | | | | | | | | | | | | | | | | | | | | | | | | | | | Total other comprehensive income, net amount | | | | | | | 2,374 | | | | | | | | 113 | | | | | | | | (772 | ) | | | | | | | | | | | | | | | | | | | | | | | | | | |
F-48
Tax effects relating to each component of other comprehensive income are as follows:
| | | | | | | | | | | | | | | | | | | | | | | | | | | | | | | | | | | | | | | | | 2010 | | | 2009 | | | 2008 | | | | | Pre-tax
| | | Tax
| | | Net
| | | Pre-tax
| | | Tax
| | | Net
| | | Pre-tax
| | | Tax
| | | Net
| | | For the year ended December 31, (M€) | | amount | | | effect | | | amount | | | amount | | | effect | | | amount | | | amount | | | effect | | | amount | | | Currency translation adjustment | | | 2,231 | | | | — | | | | 2,231 | | | | (244 | ) | | | — | | | | (244 | ) | | | (722 | ) | | | — | | | | (722 | ) | | Available for sale financial assets | | | (100 | ) | | | 2 | | | | (98 | ) | | | 38 | | | | 4 | | | | 42 | | | | (254 | ) | | | 30 | | | | (224 | ) | | Cash flow hedge | | | (80 | ) | | | 26 | | | | (54 | ) | | | 128 | | | | (42 | ) | | | 86 | | | | — | | | | — | | | | — | | | Share of other comprehensive income of equity affiliates, net amount | | | 302 | | | | — | | | | 302 | | | | 234 | | | | — | | | | 234 | | | | 173 | | | | — | | | | 173 | | | Other | | | (7 | ) | | | — | | | | (7 | ) | | | (5 | ) | | | — | | | | (5 | ) | | | 1 | | | | — | | | | 1 | | | | | | | | | | | | | | | | | | | | | | | | | | | | | | | | | | | | | | | | Total other comprehensive income | | | 2,346 | | | | 28 | | | | 2,374 | | | | 151 | | | | (38 | ) | | | 113 | | | | (802 | ) | | | 30 | | | | (772 | ) | | | | | | | | | | | | | | | | | | | | | | | | | | | | | | | | | | | | | | |
| | 18) | EMPLOYEE BENEFITS OBLIGATIONS |
Liabilities for employee benefits obligations consist of the following:
| | | | | | | | | | | | | | | As of December 31, (M€) | | 2010 | | | 2009 | | | 2008 | | | Pension benefits liabilities | | | 1,268 | | | | 1,236 | | | | 1,187 | | | Other benefits liabilities | | | 605 | | | | 592 | | | | 608 | | | Restructuring reserves (early retirement plans) | | | 298 | | | | 212 | | | | 216 | | | | | | | | | | | | | | | | Total | | | 2,171 | | | | 2,040 | | | | 2,011 | | | | | | | | | | | | | | | |
The Group’s main defined benefit pension plans are located in France, in the United Kingdom, in the United States, in Belgium and in Germany. Their main characteristics are the following:
| | • | The benefits are usually based on the final salary and seniority; | • | They are usually funded (pension fund or insurer); and | • | They are closed to new employees who benefit from defined contribution pension plans. |
The pension benefits include also termination indemnities and early retirement benefits.
The other benefits are the employer contribution to post-employment medical care.
F-49
The fair value of the defined benefit obligation and plan assets in the Consolidated Financial Statements is detailed as follows:
| | | | | | | | | | | | | | | | | | | | | | | | | | | | | Pension benefits | | | Other benefits | | | As of December 31, (M€) | | 2010 | | | 2009 | | | 2008 | | | 2010 | | | 2009 | | | 2008 | | Change in benefit obligation | | | | | | | | | | | | | | | | | | | | | | | | | | Benefit obligation at beginning of year | | | 8,169 | | | | 7,405 | | | | 8,129 | | | | 547 | | | | 544 | | | | 583 | | | Service cost | | | 159 | | | | 134 | | | | 143 | | | | 11 | | | | 10 | | | | 14 | | | Interest cost | | | 441 | | | | 428 | | | | 416 | | | | 29 | | | | 30 | | | | 24 | | | Curtailments | | | (4 | ) | | | (5 | ) | | | (3 | ) | | | (3 | ) | | | (1 | ) | | | — | | | Settlements | | | (60 | ) | | | (3 | ) | | | (5 | ) | | | — | | | | — | | | | (4 | ) | | Special termination benefits | | | — | | | | — | | | | — | | | | 1 | | | | — | | | | — | | | Plan participants’ contributions | | | 11 | | | | 10 | | | | 12 | | | | — | | | | — | | | | — | | | Benefits paid | | | (471 | ) | | | (484 | ) | | | (463 | ) | | | (33 | ) | | | (33 | ) | | | (37 | ) | | Plan amendments | | | 28 | | | | 118 | | | | 12 | | | | 1 | | | | (2 | ) | | | (12 | ) | | Actuarial losses (gains) | | | 330 | | | | 446 | | | | (248 | ) | | | 57 | | | | — | | | | (27 | ) | | Foreign currency translation and other | | | 137 | | | | 120 | | | | (588 | ) | | | 13 | | | | (1 | ) | | | 3 | | | | | | | | | | | | | | | | | | | | | | | | | | | | Benefit obligation at year-end | | | 8,740 | | | | 8,169 | | | | 7,405 | | | | 623 | | | | 547 | | | | 544 | | Change in fair value of plan assets | | | | | | | | | | | | | | | | | | | | | | | | | | Fair value of plan assets at beginning of year | | | (6,286 | ) | | | (5,764 | ) | | | (6,604 | ) | | | — | | | | — | | | | — | | | Expected return on plan assets | | | (396 | ) | | | (343 | ) | | | (402 | ) | | | — | | | | — | | | | — | | | Actuarial losses (gains) | | | (163 | ) | | | (317 | ) | | | 1,099 | | | | — | | | | — | | | | — | | | Settlements | | | 56 | | | | 2 | | | | 2 | | | | — | | | | — | | | | — | | | Plan participants’ contributions | | | (11 | ) | | | (10 | ) | | | (12 | ) | | | — | | | | — | | | | — | | Employer contributions(a) | | | (269 | ) | | | (126 | ) | | | (855 | ) | | | — | | | | — | | | | — | | | Benefits paid | | | 394 | | | | 396 | | | | 375 | | | | — | | | | — | | | | — | | | Foreign currency translation and other | | | (134 | ) | | | (124 | ) | | | 633 | | | | — | | | | — | | | | — | | | | | | | | | | | | | | | | | | | | | | | | | | | | Fair value of plan assets at year-end | | | (6,809 | ) | | | (6,286 | ) | | | (5,764 | ) | | | — | | | | — | | | | — | | | | | | | | | | | | | | | | | | | | | | | | | | | | Unfunded status | | | 1,931 | | | | 1,883 | | | | 1,641 | | | | 623 | | | | 547 | | | | 544 | | | | | | | | | | | | | | | | | | | | | | | | | | | | | Unrecognized prior service cost | | | (105 | ) | | | (153 | ) | | | (48 | ) | | | 10 | | | | 15 | | | | 21 | | | Unrecognized actuarial (losses) gains | | | (1,170 | ) | | | (1,045 | ) | | | (953 | ) | | | (28 | ) | | | 30 | | | | 43 | | | Asset ceiling | | | 9 | | | | 9 | | | | 5 | | | | — | | | | — | | | | — | | | | | | | | | | | | | | | | | | | | | | | | | | | | Net recognized amount | | | 665 | | | | 694 | | | | 645 | | | | 605 | | | | 592 | | | | 608 | | | | | | | | | | | | | | | | | | | | | | | | | | | | | Pension benefits and other benefits liabilities | | | 1,268 | | | | 1,236 | | | | 1,187 | | | | 605 | | | | 592 | | | | 608 | | | Other non-current assets | | | (603 | ) | | | (542 | ) | | | (542 | ) | | | — | | | | — | | | | — | | | | | | | | | | | | | | | | | | | | | | | | | | | |
| | | (a) | | In 2010, the Group covered certain employee pension benefit plans through insurance companies for an amount of €90 million (€757 million in 2008). |
As of December 31, 2010, the fair value of pension benefits and other pension benefits which are entirely or partially funded amounted to €7,727 million and the present value of the unfunded benefits amounted to €1,636 million (against €7,206 million and €1,510 million respectively as of December 31, 2009 and €6,515 million and €1,434 million respectively as of December 31, 2008).
The experience actuarial (gains) losses related to the defined benefit obligation and the fair value of plan assets are as follows:
| | | | | | | | | | | | | | | | | | | For the year ended December 31, (M€) | | 2010 | | | 2009 | | | 2008 | | | 2007 | | | Experience actuarial (gains) losses related to the defined benefit obligation | | | (54 | ) | | | (108 | ) | | | 12 | | | | 80 | | | Experience actuarial (gains) losses related to the fair value of plan assets | | | (163 | ) | | | (317 | ) | | | 1,099 | | | | 140 | | | | | | | | | | | | | | | | | | | |
F-50
| | | | | | | | | | | | | | | | | | | | | | | As of December 31, (M€) | | 2010 | | | 2009 | | | 2008 | | | 2007 | | | 2006 | | Pension benefits | | | | | | | | | | | | | | | | | | | | | | Benefit obligation | | | 8,740 | | | | 8,169 | | | | 7,405 | | | | 8,129 | | | | 8,742 | | | Fair value of plan assets | | | (6,809 | ) | | | (6,286 | ) | | | (5,764 | ) | | | (6,604 | ) | | | (6,401 | ) | | | | | | | | | | | | | | | | | | | | | | | Unfunded status | | | 1,931 | | | | 1,883 | | | | 1,641 | | | | 1,525 | | | | 2,341 | | | | | | | | | | | | | | | | | | | | | | | | Other benefits | | | | | | | | | | | | | | | | | | | | | | Benefits obligation | | | 623 | | | | 547 | | | | 544 | | | | 583 | | | | 648 | | | Fair value of plan assets | | | — | | | | — | | | | — | | | | — | | | | — | | | | | | | | | | | | | | | | | | | | | | | | Unfunded status | | | 623 | | | | 547 | | | | 544 | | | | 583 | | | | 648 | | | | | | | | | | | | | | | | | | | | | | | |
The Group expects to contribute €251 million to its pension plans in 2011.
| | | | | | | | | | | Estimated future payments (M€) | | Pension benefits | | | Other benefits | | | 2011 | | | 487 | | | | 38 | | | 2012 | | | 478 | | | | 38 | | | 2013 | | | 477 | | | | 38 | | | 2014 | | | 477 | | | | 39 | | | 2015 | | | 497 | | | | 40 | | | 2016-2020 | | | 2,628 | | | | 203 | | | | | | | | | | | |
| | | | | | | | | | | | | | Asset allocation
| | Pension benefits | |
As of December 31, | | 2010 | | | 2009 | | | 2008 | | | Equity securities | | | 34 | % | | | 31 | % | | | 25 | % | | Debt securities | | | 60 | % | | | 62 | % | | | 56 | % | | Monetary | | | 3 | % | | | 3 | % | | | 16 | % | | Real estate | | | 3 | % | | | 4 | % | | | 3 | % | | | | | | | | | | | | | | |
The Group’s assumptions of expected returns on assets are built up by asset class and by country based on long-term bond yields and risk premiums.
The discount rate retained corresponds to the rate of prime corporate bonds according to a benchmark per country of different market data on the closing date.
| | | | | | | | | | | | | | | | | | | | | | | | | | Assumptions used to determine benefits obligations
| | Pension benefits | | | Other benefits | |
As of December 31, | | 2010 | | | 2009 | | | 2008 | | | 2010 | | | 2009 | | | 2008 | | | | | | | | | Discount rate (weighted average for all regions) | | | 5.01 | % | | | 5.41 | % | | | 5.93 | % | | | 5.00 | % | | | 5.60 | % | | | 6.00 | % | Of which Euro zone | | | 4.58 | % | | | 5.12 | % | | | 5.72 | % | | | 4.55 | % | | | 5.18 | % | | | 5.74 | % | Of which United States | | | 5.49 | % | | | 6.00 | % | | | 6.23 | % | | | 5.42 | % | | | 5.99 | % | | | 6.21 | % | Of which United Kingdom | | | 5.50 | % | | | 5.50 | % | | | 6.00 | % | | | — | | | | — | | | | 6.00 | % | | Average expected rate of salary increase | | | 4.55 | % | | | 4.50 | % | | | 4.56 | % | | | — | | | | — | | | | — | | | Expected rate of healthcare inflation | | | | | | | | | | | | | | | | | | | | | | | | | | — Initial rate | | | — | | | | — | | | | — | | | | 4.82 | % | | | 4.91 | % | | | 4.88 | % | | — Ultimate rate | | | — | | | | — | | | | — | | | | 3.75 | % | | | 3.79 | % | | | 3.64 | % | | | | | | | | | | | | | | | | | | | | | | | | | | |
F-51
| | | | | | | | | | | | | | | | | | | | | | | | | | Assumptions used to determine the net periodic benefit cost (income)
| | Pension benefits | | | Other benefits | | | For the year ended December 31, | | 2010 | | | 2009 | | | 2008 | | | 2010 | | | 2009 | | | 2008 | | | Discount rate (weighted average for all regions) | | | 5.41 | % | | | 5.93 | % | | | 5.50 | % | | | 5.60 | % | | | 6.00 | % | | | 5.50 | % | Of which Euro zone | | | 5.12 | % | | | 5.72 | % | | | 5.15 | % | | | 5.18 | % | | | 5.74 | % | | | 5.14 | % | Of which United States | | | 6.00 | % | | | 6.23 | % | | | 6.00 | % | | | 5.99 | % | | | 6.21 | % | | | 5.98 | % | Of which United Kingdom | | | 5.50 | % | | | 6.00 | % | | | 5.75 | % | | | — | | | | 6.00 | % | | | 5.75 | % | | Average expected rate of salary increase | | | 4.50 | % | | | 4.56 | % | | | 4.29 | % | | | — | | | | — | | | | — | | | Expected return on plan assets | | | 6.39 | % | | | 6.14 | % | | | 6.60 | % | | | — | | | | — | | | | — | | | Expected rate of healthcare inflation | | | | | | | | | | | | | | | | | | | | | | | | | | — Initial rate | | | — | | | | — | | | | — | | | | 4.91 | % | | | 4.88 | % | | | 5.16 | % | | — Ultimate rate | | | — | | | | — | | | | — | | | | 3.79 | % | | | 3.64 | % | | | 3.64 | % | | | | | | | | | | | | | | | | | | | | | | | | | | |
A 0.5% increase or decrease in discount rates – all other things being equal – would have the following approximate impact:
| | | | | | | | | | | | | 0.5%
| | | 0.5%
| | | (M€) | | increase | | | decrease | | | Benefit obligation as of December 31, 2010 | | | (520 | ) | | | 574 | | | 2011 net periodic benefit cost (income) | | | (19 | ) | | | 52 | | | | | | | | | | | |
A 0.5% increase or decrease in expected return on plan assets rate – all other things being equal – would have an impact of €30 million on 2011 net periodic benefit cost (income).
The components of the net periodic benefit cost (income) in 2010, 2009 and 2008 are:
| | | | | | | | | | | | | | | | | | | | | | | | | | | | | Pension benefits | | | | | | | | | | | | | | | Other benefits | | | For the year ended December 31, (M€) | | 2010 | | | 2009 | | | 2008 | | | 2010 | | | 2009 | | | 2008 | | | Service cost | | | 159 | | | | 134 | | | | 143 | | | | 11 | | | | 10 | | | | 14 | | | Interest cost | | | 441 | | | | 428 | | | | 416 | | | | 29 | | | | 30 | | | | 24 | | | Expected return on plan assets | | | (396 | ) | | | (343 | ) | | | (402 | ) | | | — | | | | — | | | | — | | | Amortization of prior service cost | | | 74 | | | | 13 | | | | 34 | | | | (5 | ) | | | (7 | ) | | | (10 | ) | | Amortization of actuarial losses (gains) | | | 66 | | | | 50 | | | | 22 | | | | (4 | ) | | | (6 | ) | | | (2 | ) | | Asset ceiling | | | (3 | ) | | | 4 | | | | 1 | | | | — | | | | — | | | | — | | | Curtailments | | | (3 | ) | | | (4 | ) | | | (3 | ) | | | (3 | ) | | | (1 | ) | | | — | | | Settlements | | | 7 | | | | (1 | ) | | | (2 | ) | | | — | | | | — | | | | (3 | ) | | Special termination benefits | | | — | | | | — | | | | — | | | | 1 | | | | — | | | | — | | | | | | | | | | | | | | | | | | | | | | | | | | | | Net periodic benefit cost (income) | | | 345 | | | | 281 | | | | 209 | | | | 29 | | | | 26 | | | | 23 | | | | | | | | | | | | | | | | | | | | | | | | | | | |
A positive or negative change of one-percentage-point in the healthcare inflation rate would have the following approximate impact:
| | | | | | | | | | | | | 1% point
| | | 1% point
| | | (M€) | | increase | | | decrease | | | Benefit obligation as of December 31, 2010 | | | 63 | | | | (52 | ) | | 2010 net periodic benefit cost (income) | | | 5 | | | | (4 | ) | | | | | | | | | | |
F-52
| | 19) | PROVISIONS AND OTHER NON-CURRENT LIABILITIES |
| | | | | | | | | | | | | | | As of December 31, (M€) | | 2010 | | | 2009 | | | 2008 | | | Litigations and accrued penalty claims | | | 485 | | | | 423 | | | | 546 | | | Provisions for environmental contingencies | | | 644 | | | | 623 | | | | 558 | | | Asset retirement obligations | | | 5,917 | | | | 5,469 | | | | 4,500 | | | Other non-current provisions | | | 1,116 | | | | 1,331 | | | | 1,804 | | | Other non-current liabilities | | | 936 | | | | 1,535 | | | | 450 | | | | | | | | | | | | | | | | Total | | | 9,098 | | | | 9,381 | | | | 7,858 | | | | | | | | | | | | | | | |
In 2010, litigation reserves mainly include a provision covering risks concerning antitrust investigations related to Arkema amounting to €17 million as of December 31, 2010. Other risks and commitments that give rise to contingent liabilities are described in Note 32 to the Consolidated Financial Statements.
In 2010, other non-current provisions mainly include:
| | • | The contingency reserve related to the Toulouse-AZF plant explosion (civil liability) for €31 million as of December 31, 2010; | • | Provisions related to restructuring activities in the Downstream and Chemicals segments for €261 million as of December 31, 2010; and | • | The contingency reserve related to the Buncefield depot explosion (civil liability) for €194 million as of December 31, 2010. |
In 2010, other non-current liabilities mainly include debts (whose maturity is more than one year) related to fixed assets acquisitions.
In 2009, litigation reserves mainly include a provision covering risks concerning antitrust investigations related to Arkema amounting to €43 million as of December 31, 2009. Other risks and commitments that give rise to contingent liabilities are described in Note 32 to the Consolidated Financial Statements.
In 2009, other non-current provisions mainly include:
| | • | The contingency reserve related to the Toulouse-AZF plant explosion (civil liability) for €40 million as of December 31, 2009; | • | Provisions related to restructuring activities in the Downstream and Chemicals segments for €130 million as of December 31, 2009; and | • | The contingency reserve related to the Buncefield depot explosion (civil liability) for €295 million as of December 31, 2009. |
In 2009, other non-current liabilities mainly include debts (whose maturity is more than one year) related to fixed assets acquisitions. This heading is mainly composed of a €818 million debt related to Chesapeake acquisition (see Note 3 to the Consolidated Financial Statements).
In 2008, litigation reserves mainly included a provision covering risks concerning antitrust investigations related to Arkema amounting to €85 million as of December 31, 2008. Other risks and commitments that give rise to contingent liabilities are described in Note 32 to the Consolidated Financial Statements.
In 2008, other non-current provisions mainly included the contingency reserve related to the Toulouse-AZF plant explosion (civil liability) for €256 million as of December 31, 2008.
Changes in provisions and other non-current liabilities
Changes in provisions and other non-current liabilities are as follows :
| | | | | | | | | | | | | | | | | | | | | | | | | | | | | | | | | | | | | | Currency
| | | | | | | | | | | | | | | | | | | | translation
| | | | | | As of
| | | (M€) | | As of January 1, | | | Allowances | | | Reversals | | | adjustment | | | Other | | | December 31, | | 2010 | | | 9,381 | | | | 1,052 | | | | (971 | ) | | | 497 | | | | (861 | ) | | | 9,098 | | | 2009 | | | 7,858 | | | | 1,254 | | | | (1,413 | ) | | | 202 | | | | 1,480 | | | | 9,381 | | | 2008 | | | 6,843 | | | | 1,424 | | | | (864 | ) | | | (460 | ) | | | 915 | | | | 7,858 | | | | | | | | | | | | | | | | | | | | | | | | | | | |
F-53
Allowances
In 2010, allowances of the period (€1,052 million) mainly include:
| | • | Asset retirement obligations for €338 million (accretion); | • | Environmental contingencies for €88 million in the Downstream and Chemicals segments; | • | The contingency reserve related to the Buncefield depot explosion (civil liability) for €79 million; and | • | Provisions related to restructuring of activities for €226 million. |
In 2009, allowances of the period (€1,254 million) mainly included:
| | • | Asset retirement obligations for €283 million (accretion); | • | Environmental contingencies for €147 million in the Downstream and Chemicals segments; | • | The contingency reserve related to the Buncefield depot explosion (civil liability) for €223 million; and | • | Provisions related to restructuring of activities for €121 million. |
In 2008, allowances of the period (€1,424 million) mainly included:
| | • | Asset retirement obligations for €229 million (accretion); | • | The contingency reserve related to the Toulouse-AZF plant explosion (civil liability) for €140 million; | • | Environmental contingencies for €89 million; | • | An allowance of €48 million for litigation reserves in connection with antitrust investigations, as described in Note 32 to the Consolidated Financial Statements “Other risks and contingent liabilities”; and | • | Provisions related to restructuring of activities for €27 million. |
Reversals
In 2010, reversals of the period (€971 million) mainly relate to the following incurred expenses:
| | • | Provisions for asset retirement obligations for €214 million; | • | €26 million for litigation reserves in connection with antitrust investigations; | • | Environmental contingencies written back for €66 million; | • | The contingency reserve related to the Toulouse-AZF plant explosion (civil liability), written back for €9 million; | • | The contingency reserve related to the Buncefield depot explosion (civil liability), written back for €190 million; and | • | Provisions for restructuring and social plans written back for €60 million. |
In 2009, reversals of the period (€1,413 million) were mainly related to the following incurred expenses:
| | • | Provisions for asset retirement obligations for €191 million; | • | €52 million for litigation reserves in connection with antitrust investigations; | • | Environmental contingencies written back for €86 million; | • | The contingency reserve related to the Toulouse-AZF plant explosion (civil liability), written back for €216 million; | • | The contingency reserve related to the Buncefield depot explosion (civil liability), written back for €375 million; and | • | Provisions for restructuring and social plans written back for €28 million. |
In 2008, reversals of the period (€864 million) were mainly related to the following incurred expenses:
| | • | Provisions for asset retirement obligations for €280 million; | • | €163 million for litigation reserves in connection with antitrust investigations; | • | Environmental contingencies written back for €96 million; | • | The contingency reserve related to the Toulouse-AZF plant explosion (civil liability), written back for €18 million; and | • | Provisions for restructuring and social plans written back for €10 million. |
CHANGES IN THE ASSET RETIREMENT OBLIGATION
Changes in the asset retirement obligation are as follows:
| | | | | | | | | | | | | | | | | | | | | | | | | | | | | | | | | | | | | | | | | | | Revision
| | | | | | Spending on
| | | Currency
| | | | | | | | | | | As of
| | | | | | in
| | | New
| | | existing
| | | translation
| | | | | | As of
| | | (M€) | | January 1, | | | Accretion | | | estimates | | | obligations | | | obligations | | | adjustment | | | Other | | | December 31, | | 2010 | | | 5,469 | | | | 338 | | | | 79 | | | | 175 | | | | (214 | ) | | | 316 | | | | (246 | ) | | | 5,917 | | | 2009 | | | 4,500 | | | | 283 | | | | 447 | | | | 179 | | | | (191 | ) | | | 232 | | | | 19 | | | | 5,469 | | | 2008 | | | 4,206 | | | | 229 | | | | 563 | | | | 188 | | | | (280 | ) | | | (414 | ) | | | 8 | | | | 4,500 | | | | | | | | | | | | | | | | | | | | | | | | | | | | | | | | | | | |
F-54
| | 20) | FINANCIAL DEBT AND RELATED FINANCIAL INSTRUMENTS |
| | A) | NON-CURRENT FINANCIAL DEBT AND RELATED FINANCIAL INSTRUMENTS |
| | | | | | | | | | | | | | As of December 31, 2010 (M€)
| | | | | | | | | |
(Assets)/Liabilities | | Secured | | | Unsecured | | | Total | | | Non-current financial debt | | | 287 | | | | 20,496 | | | | 20,783 | | of which hedging instruments of non-current financial debt (liabilities) | | | — | | | | 178 | | | | 178 | | Hedging instruments of non-current financial debt (assets)(a) | | | — | | | | (1,870 | ) | | | (1,870 | ) | | | | | | | | | | | | | | | Non-current financial debt – net of hedging instruments | | | 287 | | | | 18,626 | | | | 18,913 | | | | | | | | | | | | | | | | | Bonds after fair value hedge | | | — | | | | 15,491 | | | | 15,491 | | | Fixed rate bonds and bonds after cash flow hedge | | | — | | | | 2,836 | | | | 2,836 | | | Bank and other, floating rate | | | 47 | | | | 189 | | | | 236 | | | Bank and other, fixed rate | | | 65 | | | | 110 | | | | 175 | | | Financial lease obligations | | | 175 | | | | — | | | | 175 | | | | | | | | | | | | | | | | Non-current financial debt – net of hedging instruments | | | 287 | | | | 18,626 | | | | 18,913 | | | | | | | | | | | | | | | |
| | | (a) | | See the description of these hedging instruments in Notes 1 paragraph M (iii) “Long-term financing”, 28 and 29 to the Consolidated Financial Statements. |
| | | | | | | | | | | | | | As of December 31, 2009 (M€)
| | | | | | | | | |
(Assets)/Liabilities | | Secured | | | Unsecured | | | Total | | | Non-current financial debt | | | 312 | | | | 19,125 | | | | 19,437 | | of which hedging instruments of non-current financial debt (liabilities) | | | — | | | | 241 | | | | 241 | | Hedging instruments of non-current financial debt (assets)(a) | | | — | | | | (1,025 | ) | | | (1,025 | ) | | | | | | | | | | | | | | | Non-current financial debt – net of hedging instruments | | | 312 | | | | 18,100 | | | | 18,412 | | | | | | | | | | | | | | | | | Bonds after fair value hedge | | | — | | | | 15,884 | | | | 15,884 | | | Fixed rate bonds and bonds after cash flow hedge | | | — | | | | 1,700 | | | | 1,700 | | | Bank and other, floating rate | | | 60 | | | | 379 | | | | 439 | | | Bank and other, fixed rate | | | 50 | | | | 79 | | | | 129 | | | Financial lease obligations | | | 202 | | | | 58 | | | | 260 | | | | | | | | | | | | | | | | Non-current financial debt – net of hedging instruments | | | 312 | | | | 18,100 | | | | 18,412 | | | | | | | | | | | | | | | |
| | | (a) | | See the description of these hedging instruments in Notes 1 paragraph M(iii) “Long-term financing”, 28 and 29 to the Consolidated Financial Statements. |
| | | | | | | | | | | | | | As of December 31, 2008 (M€)
| | | | | | | | | |
(Assets)/Liabilities | | Secured | | | Unsecured | | | Total | | | Non-current financial debt | | | 895 | | | | 15,296 | | | | 16,191 | | of which hedging instruments of non-current financial debt (liabilities) | | | — | | | | 440 | | | | 440 | | Hedging instruments of non-current financial debt (assets)(a) | | | — | | | | (892 | ) | | | (892 | ) | | | | | | | | | | | | | | | Non-current financial debt – net of hedging instruments | | | 895 | | | | 14,404 | | | | 15,299 | | | | | | | | | | | | | | | | | Bonds after fair value hedge | | | — | | | | 13,380 | | | | 13,380 | | | Fixed rate bonds and bonds after cash flow hedge | | | — | | | | 287 | | | | 287 | | | Bank and other, floating rate | | | 553 | | | | 665 | | | | 1,218 | | | Bank and other, fixed rate | | | 140 | | | | 6 | | | | 146 | | | Financial lease obligations | | | 202 | | | | 66 | | | | 268 | | | | | | | | | | | | | | | | Non-current financial debt – net of hedging instruments | | | 895 | | | | 14,404 | | | | 15,299 | | | | | | | | | | | | | | | |
| | | (a) | | See the description of these hedging instruments in Notes 1 paragraph M(iii) “Long-term financing”, 28 and 29 to the Consolidated Financial Statements. |
F-55
Fair value of bonds, as of December 31, 2010, after taking into account currency and interest rates swaps, is detailed as follows:
| | | | | | | | | | | | | | | | | | | | | | | | | | | | | | | | | Fair value after hedging as of | | | | | | | | | | | | | | Year of
| | December 31,
| | | December 31,
| | | December 31,
| | | | | | | | | Initial rate before hedging
| | | Bonds after fair value hedge (M€) | | issue | | 2010 | | | 2009 | | | 2008 | | | Currency | | | Maturity | | | instruments | | | | | | | | | | | | | | | | | | | | | | | | | | | | | | Parent company | | | | | | | | | | | | | | | | | | | | | | | | | | | | | | | | | | | | | | | | | | | | | | | | | | | | | | | Bond | | 1997 | | | — — | | | | — | | | | 124 | | | | FRF | | | | 2009 | | | | 6.200 | % | | | | | | | | | | | | | | | | | | | | | | | | | | | | | | Bond | | 1998 | | | — | | | | — | | | | 119 | | | | FRF | | | | 2009 | | | | 5.125 | % | | | | | | | | | | | | | | | | | | | | | | | | | | | | | | Bond | | 1998 | | | 125 | | | | 116 | | | | 121 | | | | FRF | | | | 2013 | | | | 5.000 | % | | | | | | | | | | | | | | | | | | | | | | | | | | | | | | Bond | | 2000 | | | — | | | | 61 | | | | 63 | | | | EUR | | | | 2010 | | | | 5.650 | % | | | | | | | | | | | | | | | | | | | | | | | | | | | | | | Current portion (less than one year) | | | | | — | | | | (61 | ) | | | (243 | ) | | | | | | | | | | | | | | | | | | | | | | | | | | | | | | | | | | | | | | | | | | | | | | | | | | | | | | | | | | | | | | | | | | | | | Total parent company | | | | | 125 | | | | 116 | | | | 184 | | | | | | | | | | | | | | | | | | | | | | | | | | | | | | | | | | | | | | | | | | | | | | | | | | | | | | | | | | | | | | | | | | | | | | Elf Aquitaine SA | | | | | | | | | | | | | | | | | | | | | | | | | | | | | | | | | | | | | | | | | | | | | | | | | | | | | | | | Bond | | 1999 | | | — | | | | — | | | | 1 003 | | | | EUR | | | | 2009 | | | | 4.500 | % | | | | | | | | | | | | | | | | | | | | | | | | | | | | | | Current portion (less than one year) | | | | | — | | | | — | | | | (1 003 | ) | | | | | | | | | | | | | | | | | | | | | | | | | | | | | | | | | | | | | | | | | | | | | | | | | | | | | | | | | | | | | | | | | | | | | Total Elf Aquitaine SA | | | | | — | | | | — | | | | — | | | | | | | | | | | | | | | | | | | | | | | | | | | | | | | | | | | | | | | | | | | | | | | | | | | | | | | | | | | | | | | | | | | | | | TOTAL CAPITAL(a) | | | | | | | | | | | | | | | | | | | | | | | | | | | | | | | | | | | | | | | | | | | | | | | | | | | | | | | | Bond | | 2002 | | | 15 | | | | 14 | | | | 14 | | | | USD | | | | 2012 | | | | 5.890 | % | | | | | | | | | | | | | | | | | | | | | | | | | | | | | | Bond | | 2003 | | | — | | | | — | | | | 52 | | | | AUD | | | | 2009 | | | | 6.250 | % | | | | | | | | | | | | | | | | | | | | | | | | | | | | | | Bond | | 2003 | | | — | | | | — | | | | 154 | | | | CHF | | | | 2009 | | | | 2.385 | % | | | | | | | | | | | | | | | | | | | | | | | | | | | | | | Bond | | 2003 | | | — | | | | 160 | | | | 166 | | | | CHF | | | | 2010 | | | | 2.385 | % | | | | | | | | | | | | | | | | | | | | | | | | | | | | | | Bond | | 2003 | | | 22 | | | | 21 | | | | 22 | | | | USD | | | | 2013 | | | | 4.500 | % | | | | | | | | | | | | | | | | | | | | | | | | | | | | | | Bond | | 2003-2004 | | | — | | | | — | | | | 395 | | | | USD | | | | 2009 | | | | 3.500 | % | | | | | | | | | | | | | | | | | | | | | | | | | | | | | | Bond | | 2004 | | | — | | | | — | | | | 57 | | | | AUD | | | | 2009 | | | | 6.000 | % | | | | | | | | | | | | | | | | | | | | | | | | | | | | | | Bond | | 2004 | | | — | | | | — | | | | 28 | | | | AUD | | | | 2009 | | | | 6.000 | % | | | | | | | | | | | | | | | | | | | | | | | | | | | | | | Bond | | 2004 | | | — | | | | 53 | | | | 55 | | | | CAD | | | | 2010 | | | | 4.000 | % | | | | | | | | | | | | | | | | | | | | | | | | | | | | | | Bond | | 2004 | | | — | | | | 113 | | | | 117 | | | | CHF | | | | 2010 | | | | 2.385 | % | | | | | | | | | | | | | | | | | | | | | | | | | | | | | | Bond | | 2004 | | | — | | | | 438 | | | | 454 | | | | EUR | | | | 2010 | | | | 3.750 | % | | | | | | | | | | | | | | | | | | | | | | | | | | | | | | Bond | | 2004 | | | — | | | | 322 | | | | 334 | | | | GBP | | | | 2010 | | | | 4.875 | % | | | | | | | | | | | | | | | | | | | | | | | | | | | | | | Bond | | 2004 | | | — | | | | 128 | | | | 132 | | | | GBP | | | | 2010 | | | | 4.875 | % | | | | | | | | | | | | | | | | | | | | | | | | | | | | | | Bond | | 2004 | | | — | | | | 185 | | | | 191 | | | | GBP | | | | 2010 | | | | 4.875 | % | | | | | | | | | | | | | | | | | | | | | | | | | | | | | | Bond | | 2004 | | | 57 | | | | 53 | | | | 55 | | | | AUD | | | | 2011 | | | | 5.750 | % | | | | | | | | | | | | | | | | | | | | | | | | | | | | | | Bond | | 2004 | | | 116 | | | | 107 | | | | 111 | | | | CAD | | | | 2011 | | | | 4.875 | % | | | | | | | | | | | | | | | | | | | | | | | | | | | | | | Bond | | 2004 | | | 235 | | | | 203 | | | | 216 | | | | USD | | | | 2011 | | | | 4.125 | % | | | | | | | | | | | | | | | | | | | | | | | | | | | | | | Bond | | 2004 | | | 75 | | | | 69 | | | | 72 | | | | USD | | | | 2011 | | | | 4.125 | % | | | | | | | | | | | | | | | | | | | | | | | | | | | | | | Bond | | 2004 | | | 125 | | | | 116 | | | | 120 | | | | CHF | | | | 2012 | | | | 2.375 | % | | | | | | | | | | | | | | | | | | | | | | | | | | | | | | Bond | | 2004 | | | 51 | | | | 47 | | | | 49 | | | | NZD | | | | 2014 | | | | 6.750 | % | | | | | | | | | | | | | | | | | | | | | | | | | | | | | | Bond | | 2005 | | | — | | | | — | | | | 36 | | | | USD | | | | 2009 | | | | 3.500 | % | | | | | | | | | | | | | | | | | | | | | | | | | | | | | | Bond | | 2005 | | | 57 | | | | 53 | | | | 55 | | | | AUD | | | | 2011 | | | | 5.750 | % | | | | | | | | | | | | | | | | | | | | | | | | | | | | | | Bond | | 2005 | | | 60 | | | | 56 | | | | 58 | | | | CAD | | | | 2011 | | | | 4.000 | % | | | | | | | | | | | | | | | | | | | | | | | | | | | | | | Bond | | 2005 | | | 120 | | | | 112 | | | | 116 | | | | CHF | | | | 2011 | | | | 1.625 | % | | | | | | | | | | | | | | | | | | | | | | | | | | | | | | Bond | | 2005 | | | 226 | | | | 226 | | | | 226 | | | | CHF | | | | 2011 | | | | 1.625 | % | | | | | | | | | | | | | | | | | | | | | | | | | | | | | | Bond | | 2005 | | | 139 | | | | 144 | | | | 144 | | | | USD | | | | 2011 | | | | 4.125 | % | | | | | | | | | | | | | | | | | | | | | | | | | | | | | | Bond | | 2005 | | | 63 | | | | 63 | | | | 63 | | | | AUD | | | | 2012 | | | | 5.750 | % | | | | | | | | | | | | | | | | | | | | | | | | | | | | | | Bond | | 2005 | | | 194 | | | | 180 | | | | 187 | | | | CHF | | | | 2012 | | | | 2.135 | % | | | | | | | | | | | | | | | | | | | | | | | | | | | | | | Bond | | 2005 | | | 65 | | | | 65 | | | | 65 | | | | CHF | | | | 2012 | | | | 2.135 | % | | | | | | | | | | | | | | | | | | | | | | | | | | | | | | Bond | | 2005 | | | 97 | | | | 97 | | | | 98 | | | | CHF | | | | 2012 | | | | 2.375 | % | | | | | | | | | | | | | | | | | | | | | | | | | | | | | | Bond | | 2005 | | | 391 | | | | 363 | | | | 376 | | | | EUR | | | | 2012 | | | | 3.250 | % | | | | | | | | | | | | | | | | | | | | | | | | | | | | | | Bond | | 2005 | | | 57 | | | | 57 | | | | 57 | | | | NZD | | | | 2012 | | | | 6.500 | % | | | | | | | | | | | | | | | | | | | | | | | | | | | | | | Bond | | 2006 | | | — | | | | 75 | | | | 75 | | | | GBP | | | | 2010 | | | | 4.875 | % | | | | | | | | | | | | | | | | | | | | | | | | | | | | | | Bond | | 2006 | | | — | | | | 50 | | | | 50 | | | | EUR | | | | 2010 | | | | 3.750 | % | | | | | | | | | | | | | | | | | | | | | | | | | | | | | | Bond | | 2006 | | | — | | | | 50 | | | | 50 | | | | EUR | | | | 2010 | | | | 3.750 | % | | | | | | | | | | | | | | | | | | | | | | | | | | | | | | Bond | | 2006 | | | — | | | | 100 | | | | 102 | | | | EUR | | | | 2010 | | | | 3.750 | % | | | | | | | | | | | | | | | | | | | | | | | | | | | | | | Bond | | 2006 | | | 42 | | | | 42 | | | | 42 | | | | EUR | | | | 2011 | | | | EURIBOR 3 months +0.040 | % | | | | | | | | | | | | | | | | | | | | | | | | | | | | | | Bond | | 2006 | | | 300 | | | | 300 | | | | 300 | | | | EUR | | | | 2011 | | | | 3.875 | % | | | | | | | | | | | | | | | | | | | | | | | | | | | | | | Bond | | 2006 | | | 150 | | | | 150 | | | | 150 | | | | EUR | | | | 2011 | | | | 3.875 | % | | | | | | | | | | | | | | | | | | | | | | | | | | | | | | Bond | | 2006 | | | 300 | | | | 300 | | | | 300 | | | | EUR | | | | 2011 | | | | 3.875 | % | | | | | | | | | | | | | | | | | | | | | | | | | | | | | | Bond | | 2006 | | | 120 | | | | 120 | | | | 120 | | | | USD | | | | 2011 | | | | 5.000 | % | | | | | | | | | | | | | | | | | | | | | | | | | | | | | | Bond | | 2006 | | | 300 | | | | 300 | | | | 300 | | | | EUR | | | | 2011 | | | | 3.875 | % | | | | | | | | | | | | | | | | | | | | | | | | | | | | | | Bond | | 2006 | | | 472 | | | | 472 | | | | 473 | | | | USD | | | | 2011 | | | | 5.000 | % |
F-56
| | | | | | | | | | | | | | | | | | | | | | | | | | | | | | | | | Fair value after hedging as of | | | | | | | | | | | | | | Year of
| | December 31,
| | | December 31,
| | | December 31,
| | | | | | | | | Initial rate before hedging
| | | Bonds after fair value hedge (M€) | | issue | | 2010 | | | 2009 | | | 2008 | | | Currency | | | Maturity | | | instruments | | | | | | | | | | | | | | | | | | | | | | | | | | | | | | | Bond | | 2006 | | | 62 | | | | 62 | | | | 62 | | | | AUD | | | | 2012 | | | | 5.625 | % | | | | | | | | | | | | | | | | | | | | | | | | | | | | | | Bond | | 2006 | | | 72 | | | | 72 | | | | 72 | | | | CAD | | | | 2012 | | | | 4.125 | % | | | | | | | | | | | | | | | | | | | | | | | | | | | | | | Bond | | 2006 | | | 100 | | | | 100 | | | | 100 | | | | EUR | | | | 2012 | | | | 3.250 | % | | | | | | | | | | | | | | | | | | | | | | | | | | | | | | Bond | | 2006 | | | 74 | | | | 74 | | | | 74 | | | | GBP | | | | 2012 | | | | 4.625 | % | | | | | | | | | | | | | | | | | | | | | | | | | | | | | | Bond | | 2006 | | | 100 | | | | 100 | | | | 100 | | | | EUR | | | | 2012 | | | | 3.250 | % | | | | | | | | | | | | | | | | | | | | | | | | | | | | | | Bond | | 2006 | | | 125 | | | | 125 | | | | 125 | | | | CHF | | | | 2013 | | | | 2.510 | % | | | | | | | | | | | | | | | | | | | | | | | | | | | | | | Bond | | 2006 | | | 127 | | | | 127 | | | | 127 | | | | CHF | | | | 2014 | | | | 2.635 | % | | | | | | | | | | | | | | | | | | | | | | | | | | | | | | Bond | | 2006 | | | 130 | | | | 130 | | | | 130 | | | | CHF | | | | 2016 | | | | 2.385 | % | | | | | | | | | | | | | | | | | | | | | | | | | | | | | | Bond | | 2006 | | | 65 | | | | 65 | | | | 65 | | | | CHF | | | | 2016 | | | | 2.385 | % | | | | | | | | | | | | | | | | | | | | | | | | | | | | | | Bond | | 2006 | | | 64 | | | | 64 | | | | 64 | | | | CHF | | | | 2016 | | | | 2.385 | % | | | | | | | | | | | | | | | | | | | | | | | | | | | | | | Bond | | 2006 | | | 63 | | | | 63 | | | | 64 | | | | CHF | | | | 2016 | | | | 2.385 | % | | | | | | | | | | | | | | | | | | | | | | | | | | | | | | Bond | | 2006 | | | 129 | | | | 129 | | | | 129 | | | | CHF | | | | 2018 | | | | 3.135 | % | | | | | | | | | | | | | | | | | | | | | | | | | | | | | | Bond | | 2007 | | | — | | | | 60 | | | | 60 | | | | CHF | | | | 2010 | | | | 2.385 | % | | | | | | | | | | | | | | | | | | | | | | | | | | | | | | Bond | | 2007 | | | — | | | | 74 | | | | 74 | | | | GBP | | | | 2010 | | | | 4.875 | % | | | | | | | | | | | | | | | | | | | | | | | | | | | | | | Bond | | 2007 | | | 77 | | | | 77 | | | | 77 | | | | USD | | | | 2011 | | | | 5.000 | % | | | | | | | | | | | | | | | | | | | | | | | | | | | | | | Bond | | 2007 | | | 370 | | | | 370 | | | | 370 | | | | USD | | | | 2012 | | | | 5.000 | % | | | | | | | | | | | | | | | | | | | | | | | | | | | | | | Bond | | 2007 | | | 222 | | | | 222 | | | | 222 | | | | USD | | | | 2012 | | | | 5.000 | % | | | | | | | | | | | | | | | | | | | | | | | | | | | | | | Bond | | 2007 | | | 61 | | | | 61 | | | | 61 | | | | AUD | | | | 2012 | | | | 6.500 | % | | | | | | | | | | | | | | | | | | | | | | | | | | | | | | Bond | | 2007 | | | 72 | | | | 72 | | | | 72 | | | | CAD | | | | 2012 | | | | 4.125 | % | | | | | | | | | | | | | | | | | | | | | | | | | | | | | | Bond | | 2007 | | | 71 | | | | 71 | | | | 71 | | | | GBP | | | | 2012 | | | | 4.625 | % | | | | | | | | | | | | | | | | | | | | | | | | | | | | | | Bond | | 2007 | | | 300 | | | | 300 | | | | 300 | | | | EUR | | | | 2013 | | | | 4.125 | % | | | | | | | | | | | | | | | | | | | | | | | | | | | | | | Bond | | 2007 | | | 73 | | | | 73 | | | | 74 | | | | GBP | | | | 2013 | | | | 5.500 | % | | | | | | | | | | | | | | | | | | | | | | | | | | | | | | Bond | | 2007 | | | 306 | | | | 306 | | | | 306 | | | | GBP | | | | 2013 | | | | 5.500 | % | | | | | | | | | | | | | | | | | | | | | | | | | | | | | | Bond | | 2007 | | | 72 | | | | 72 | | | | 73 | | | | GBP | | | | 2013 | | | | 5.500 | % | | | | | | | | | | | | | | | | | | | | | | | | | | | | | | Bond | | 2007 | | | 248 | | | | 248 | | | | 248 | | | | CHF | | | | 2014 | | | | 2.635 | % | | | | | | | | | | | | | | | | | | | | | | | | | | | | | | Bond | | 2007 | | | 31 | | | | 31 | | | | 31 | | | | JPY | | | | 2014 | | | | 1.505 | % | | | | | | | | | | | | | | | | | | | | | | | | | | | | | | Bond | | 2007 | | | 61 | | | | 61 | | | | 61 | | | | CHF | | | | 2014 | | | | 2.635 | % | | | | | | | | | | | | | | | | | | | | | | | | | | | | | | Bond | | 2007 | | | 49 | | | | 49 | | | | 49 | | | | JPY | | | | 2014 | | | | 1.723 | % | | | | | | | | | | | | | | | | | | | | | | | | | | | | | | Bond | | 2007 | | | 121 | | | | 121 | | | | 121 | | | | CHF | | | | 2015 | | | | 3.125 | % | | | | | | | | | | | | | | | | | | | | | | | | | | | | | | Bond | | 2007 | | | 300 | | | | 300 | | | | 300 | | | | EUR | | | | 2017 | | | | 4.700 | % | | | | | | | | | | | | | | | | | | | | | | | | | | | | | | Bond | | 2007 | | | 76 | | | | 76 | | | | 76 | | | | CHF | | | | 2018 | | | | 3.135 | % | | | | | | | | | | | | | | | | | | | | | | | | | | | | | | Bond | | 2007 | | | 60 | | | | 60 | | | | 60 | | | | CHF | | | | 2018 | | | | 3.135 | % | | | | | | | | | | | | | | | | | | | | | | | | | | | | | | Bond | | 2008 | | | — | | | | 63 | | | | 63 | | | | GBP | | | | 2010 | | | | 4.875 | % | | | | | | | | | | | | | | | | | | | | | | | | | | | | | | Bond | | 2008 | | | — | | | | 66 | | | | 66 | | | | GBP | | | | 2010 | | | | 4.875 | % | | | | | | | | | | | | | | | | | | | | | | | | | | | | | | Bond | | 2008 | | | 92 | | | | 92 | | | | 92 | | | | AUD | | | | 2011 | | | | 7.500 | % | | | | | | | | | | | | | | | | | | | | | | | | | | | | | | Bond | | 2008 | | | 100 | | | | 100 | | | | 100 | | | | EUR | | | | 2011 | | | | 3.875 | % | | | | | | | | | | | | | | | | | | | | | | | | | | | | | | Bond | | 2008 | | | 150 | | | | 150 | | | | 151 | | | | EUR | | | | 2011 | | | | 3.875 | % | | | | | | | | | | | | | | | | | | | | | | | | | | | | | | Bond | | 2008 | | | 50 | | | | 50 | | | | 50 | | | | EUR | | | | 2011 | | | | 3.875 | % | | | | | | | | | | | | | | | | | | | | | | | | | | | | | | Bond | | 2008 | | | 50 | | | | 50 | | | | 50 | | | | EUR | | | | 2011 | | | | 3.875 | % | | | | | | | | | | | | | | | | | | | | | | | | | | | | | | Bond | | 2008 | | | 60 | | | | 60 | | | | 60 | | | | JPY | | | | 2011 | | | | EURIBOR 6 months + 0.018 | % | | | | | | | | | | | | | | | | | | | | | | | | | | | | | | Bond | | 2008 | | | 102 | | | | 102 | | | | 102 | | | | USD | | | | 2011 | | | | 3.750 | % | | | | | | | | | | | | | | | | | | | | | | | | | | | | | | Bond | | 2008 | | | 62 | | | | 62 | | | | 62 | | | | CHF | | | | 2012 | | | | 2.135 | % | | | | | | | | | | | | | | | | | | | | | | | | | | | | | | Bond | | 2008 | | | 124 | | | | 124 | | | | 124 | | | | CHF | | | | 2012 | | | | 3.635 | % | | | | | | | | | | | | | | | | | | | | | | | | | | | | | | Bond | | 2008 | | | 46 | | | | 46 | | | | 46 | | | | CHF | | | | 2012 | | | | 2.385 | % | | | | | | | | | | | | | | | | | | | | | | | | | | | | | | Bond | | 2008 | | | 92 | | | | 92 | | | | 92 | | | | CHF | | | | 2012 | | | | 2.385 | % | | | | | | | | | | | | | | | | | | | | | | | | | | | | | | Bond | | 2008 | | | 64 | | | | 64 | | | | 64 | | | | CHF | | | | 2012 | | | | 2.385 | % | | | | | | | | | | | | | | | | | | | | | | | | | | | | | | Bond | | 2008 | | | 50 | | | | 50 | | | | 50 | | | | EUR | | | | 2012 | | | | 3.250 | % | | | | | | | | | | | | | | | | | | | | | | | | | | | | | | Bond | | 2008 | | | 63 | | | | 63 | | | | 63 | | | | GBP | | | | 2012 | | | | 4.625 | % | | | | | | | | | | | | | | | | | | | | | | | | | | | | | | Bond | | 2008 | | | 63 | | | | 63 | | | | 63 | | | | GBP | | | | 2012 | | | | 4.625 | % | | | | | | | | | | | | | | | | | | | | | | | | | | | | | | Bond | | 2008 | | | 63 | | | | 63 | | | | 64 | | | | GBP | | | | 2012 | | | | 4.625 | % | | | | | | | | | | | | | | | | | | | | | | | | | | | | | | Bond | | 2008 | | | 62 | | | | 62 | | | | 62 | | | | NOK | | | | 2012 | | | | 6.000 | % | | | | | | | | | | | | | | | | | | | | | | | | | | | | | | Bond | | 2008 | | | 69 | | | | 69 | | | | 69 | | | | USD | | | | 2012 | | | | 5.000 | % | | | | | | | | | | | | | | | | | | | | | | | | | | | | | | Bond | | 2008 | | | 60 | | | | 60 | | | | 60 | | | | AUD | | | | 2013 | | | | 7.500 | % | | | | | | | | | | | | | | | | | | | | | | | | | | | | | | Bond | | 2008 | | | 61 | | | | 61 | | | | 61 | | | | AUD | | | | 2013 | | | | 7.500 | % | | | | | | | | | | | | | | | | | | | | | | | | | | | | | | Bond | | 2008 | | | 127 | | | | 127 | | | | 128 | | | | CHF | | | | 2013 | | | | 3.135 | % | | | | | | | | | | | | | | | | | | | | | | | | | | | | | | Bond | | 2008 | | | 62 | | | | 62 | | | | 63 | | | | CHF | | | | 2013 | | | | 3.135 | % | | | | | | | | | | | | | | | | | | | | | | | | | | | | | | Bond | | 2008 | | | 200 | | | | 200 | | | | 200 | | | | EUR | | | | 2013 | | | | 4.125 | % | | | | | | | | | | | | | | | | | | | | | | | | | | | | | | Bond | | 2008 | | | 100 | | | | 100 | | | | 100 | | | | EUR | | | | 2013 | | | | 4.125 | % | | | | | | | | | | | | | | | | | | | | | | | | | | | | | | Bond | | 2008 | | | 1,000 | | | | 1,000 | | | | 1,002 | | | | EUR | | | | 2013 | | | | 4.750 | % | | | | | | | | | | | | | | | | | | | | | | | | | | | | | | Bond | | 2008 | | | 63 | | | | 63 | | | | 63 | | | | GBP | | | | 2013 | | | | 5.500 | % |
F-57
| | | | | | | | | | | | | | | | | | | | | | | | | | | | | | | | | Fair value after hedging as of | | | | | | | | | | | | | | Year of
| | December 31,
| | | December 31,
| | | December 31,
| | | | | | | | | Initial rate before hedging
| | | Bonds after fair value hedge (M€) | | issue | | 2010 | | | 2009 | | | 2008 | | | Currency | | | Maturity | | | instruments | | | | | | | | | | | | | | | | | | | | | | | | | | | | | | | Bond | | 2008 | | | 149 | | | | 149 | | | | 149 | | | | JPY | | | | 2013 | | | | EURIBOR 6 months + 0.008 | % | | | | | | | | | | | | | | | | | | | | | | | | | | | | | | Bond | | 2008 | | | 191 | | | | 191 | | | | 194 | | | | USD | | | | 2013 | | | | 4.000 | % | | | | | | | | | | | | | | | | | | | | | | | | | | | | | | Bond | | 2008 | | | 61 | | | | 61 | | | | 61 | | | | CHF | | | | 2015 | | | | 3.135 | % | | | | | | | | | | | | | | | | | | | | | | | | | | | | | | Bond | | 2008 | | | 62 | | | | 62 | | | | 62 | | | | CHF | | | | 2015 | | | | 3.135 | % | | | | | | | | | | | | | | | | | | | | | | | | | | | | | | Bond | | 2008 | | | 61 | | | | 61 | | | | 62 | | | | CHF | | | | 2015 | | | | 3.135 | % | | | | | | | | | | | | | | | | | | | | | | | | | | | | | | Bond | | 2008 | | | 62 | | | | 62 | | | | 62 | | | | CHF | | | | 2018 | | | | 3.135 | % | | | | | | | | | | | | | | | | | | | | | | | | | | | | | | Bond | | 2009 | | | 56 | | | | 56 | | | | — | | | | AUD | | | | 2013 | | | | 5.500 | % | | | | | | | | | | | | | | | | | | | | | | | | | | | | | | Bond | | 2009 | | | 54 | | | | 54 | | | | — | | | | AUD | | | | 2013 | | | | 5.500 | % | | | | | | | | | | | | | | | | | | | | | | | | | | | | | | Bond | | 2009 | | | 236 | | | | 236 | | | | — | | | | CHF | | | | 2013 | | | | 2.500 | % | | | | | | | | | | | | | | | | | | | | | | | | | | | | | | Bond | | 2009 | | | 77 | | | | 77 | | | | — | | | | USD | | | | 2013 | | | | 4.000 | % | | | | | | | | | | | | | | | | | | | | | | | | | | | | | | Bond | | 2009 | | | 131 | | | | 131 | | | | — | | | | CHF | | | | 2014 | | | | 2.625 | % | | | | | | | | | | | | | | | | | | | | | | | | | | | | | | Bond | | 2009 | | | 997 | | | | 998 | | | | — | | | | EUR | | | | 2014 | | | | 3.500 | % | | | | | | | | | | | | | | | | | | | | | | | | | | | | | | Bond | | 2009 | | | 150 | | | | 150 | | | | — | | | | EUR | | | | 2014 | | | | 3.500 | % | | | | | | | | | | | | | | | | | | | | | | | | | | | | | | Bond | | 2009 | | | 40 | | | | 40 | | | | — | | | | HKD | | | | 2014 | | | | 3.240 | % | | | | | | | | | | | | | | | | | | | | | | | | | | | | | | Bond | | 2009 | | | 103 | | | | 96 | | | | — | | | | AUD | | | | 2015 | | | | 6.000 | % | | | | | | | | | | | | | | | | | | | | | | | | | | | | | | Bond | | 2009 | | | 550 | | | | 550 | | | | — | | | | EUR | | | | 2015 | | | | 3.625 | % | | | | | | | | | | | | | | | | | | | | | | | | | | | | | | Bond | | 2009 | | | 684 | | | | 684 | | | | — | | | | USD | | | | 2015 | | | | 3.125 | % | | | | | | | | | | | | | | | | | | | | | | | | | | | | | | Bond | | 2009 | | | 224 | | | | 208 | | | | — | | | | USD | | | | 2015 | | | | 3.125 | % | | | | | | | | | | | | | | | | | | | | | | | | | | | | | | Bond | | 2009 | | | 99 | | | | 99 | | | | — | | | | CHF | | | | 2016 | | | | 2.385 | % | | | | | | | | | | | | | | | | | | | | | | | | | | | | | | Bond | | 2009 | | | 115 | | | | 115 | | | | — | | | | GBP | | | | 2017 | | | | 4.250 | % | | | | | | | | | | | | | | | | | | | | | | | | | | | | | | Bond | | 2009 | | | 225 | | | | 225 | | | | — | | | | GBP | | | | 2017 | | | | 4.250 | % | | | | | | | | | | | | | | | | | | | | | | | | | | | | | | Bond | | 2009 | | | 448 | | | | 448 | | | | — | | | | EUR | | | | 2019 | | | | 4.875 | % | | | | | | | | | | | | | | | | | | | | | | | | | | | | | | Bond | | 2009 | | | 69 | | | | 69 | | | | — | | | | HKD | | | | 2019 | | | | 4.180 | % | | | | | | | | | | | | | | | | | | | | | | | | | | | | | | Bond | | 2009 | | | 374 | | | | 347 | | | | — | | | | USD | | | | 2021 | | | | 4.250 | % | | | | | | | | | | | | | | | | | | | | | | | | | | | | | | Bond | | 2010 | | | 102 | | | | | | | | | | | | AUD | | | | 2014 | | | | 5.750 | % | | | | | | | | | | | | | | | | | | | | | | | | | | | | | | Bond | | 2010 | | | 108 | | | | | | | | | | | | CAD | | | | 2014 | | | | 2.500 | % | | | | | | | | | | | | | | | | | | | | | | | | | | | | | | Bond | | 2010 | | | 53 | | | | | | | | | | | | NZD | | | | 2014 | | | | 4.750 | % | | | | | | | | | | | | | | | | | | | | | | | | | | | | | | Bond | | 2010 | | | 187 | | | | | | | | | | | | USD | | | | 2015 | | | | 2.875 | % | | | | | | | | | | | | | | | | | | | | | | | | | | | | | | Bond | | 2010 | | | 935 | | | | | | | | | | | | USD | | | | 2015 | | | | 3.000 | % | | | | | | | | | | | | | | | | | | | | | | | | | | | | | | Bond | | 2010 | | | 748 | | | | | | | | | | | | USD | | | | 2016 | | | | 2.300 | % | | | | | | | | | | | | | | | | | | | | | | | | | | | | | | Bond | | 2010 | | | 68 | | | | | | | | | | | | AUD | | | | 2015 | | | | 6.000 | % | | | | | | | | | | | | | | | | | | | | | | | | | | | | | | Bond | | 2010 | | | 69 | | | | | | | | | | | | AUD | | | | 2015 | | | | 6.000 | % | | | | | | | | | | | | | | | | | | | | | | | | | | | | | | Bond | | 2010 | | | 64 | | | | | | | | | | | | AUD | | | | 2015 | | | | 6.000 | % | | | | | | | | | | | | | | | | | | | | | | | | | | | | | | Bond | | 2010 | | | 476 | | | | | | | | | | | | EUR | | | | 2022 | | | | 3.125 | % | | | | | | | | | | | | | | | | | | | | | | | | | | | | | | Current portion (less than one year) | | | | | (3,450 | ) | | | (1,937 | ) | | | (722 | ) | | | | | | | | | | | | | | | | | | | | | | | | | | | | | | | | | | | | | | | | | Total TOTAL CAPITAL | | | | | 15,143 | | | | 15,615 | | | | 13,093 | | | | | | | | | | | | | | | | | | | | | | | | | | | | | | | | | | | | | | | | | | | | | | | | | | | | | | | | | | | | | | | | | | | | | | | Other consolidated subsidiaries | | | | | 223 | | | | 153 | | | | 103 | | | | | | | | | | | | | | | | | | | | | | | | | | | | | | | | | | | | | | | | | | Total bonds after fair value hedge | | | | | 15,491 | | | | 15,884 | | | | 13,380 | | | | | | | | | | | | | | | | | | | Amount after hedging as of | | | | | | | | | | | | | | Year of
| | December 31,
| | | December 31,
| | | December 31,
| | | | | | | | | Initial rate before hedging
| | | Fixed rate bonds and bonds after cash flow hedge (M€) | | issue | | 2010 | | | 2009 | | | 2008 | | | Currency | | | Maturity | | | instruments | | | | | | | | | | | | | | | | | | | | | | | | | | | | | | TOTAL CAPITAL(a) | | | | | | | | | | | | | | | | | | | | | | | | | | | | | | | | | | | | | | | | | | | | | | | | | | | | | | | | Bond | | 2005 | | | 293 | | | | 292 | | | | 287 | | | | GBP | | | | 2012 | | | | 4.625 | % | | | | | | | | | | | | | | | | | | | | | | | | | | | | | | Bond | | 2009 | | | 691 | | | | 602 | | | | — | | | | EUR | | | | 2019 | | | | 4.875 | % | | | | | | | | | | | | | | | | | | | | | | | | | | | | | | Bond | | 2009 | | | 917 | | | | 806 | | | | — | | | | EUR | | | | 2024 | | | | 5.125 | % | | | | | | | | | | | | | | | | | | | | | | | | | | | | | | Bond | | 2010 | | | 935 | | | | | | | | | | | | USD | | | | 2020 | | | | 4.450 | % | | | | | | | | | | | | | | | | | | | | | | | | | | | | | Total fixed rate bonds and bonds after cash flow hedge | | | | | 2,836 | | | | 1,700 | | | | 287 | | | | | | | | | | | | | | | | | | | | | | | | | | | | | | | | | | | | | | | | | |
| | | (a) | | TOTAL CAPITAL is a wholly-owned indirect subsidiary of TOTAL S.A. (with the exception of one share held by each member of its Board of Directors). It acts as a financing vehicle for the Group. Its debt securities are fully and unconditionally guaranteed by TOTAL S.A. as to payment of principal, premium, if any, interest and any other amounts due. |
F-58
Loan repayment schedule (excluding current portion)
| | | | | | | | | | | | | | | | | | | | | | | | | | | of which hedging
| | | | | | | | | | | | | | | | instruments of
| | | Hedging instruments
| | | | | | | | | | | | | non-current
| | | of non-current
| | | Non-current financial
| | | | As of December 31, 2010
| | Non-current
| | | financial debt
| | | financial debt
| | | debt - net of hedging
| | | | | (M€) | | financial debt | | | (liabilities) | | | (assets) | | | instruments | | | % | | 2012 | | | 3,756 | | | | 34 | | | | (401 | ) | | | 3,355 | | | | 18% | | 2013 | | | 4,017 | | | | 76 | | | | (473 | ) | | | 3,544 | | | | 19% | | 2014 | | | 2,508 | | | | 1 | | | | (290 | ) | | | 2,218 | | | | 12% | | 2015 | | | 3,706 | | | | 2 | | | | (302 | ) | | | 3,404 | | | | 18% | | 2016 and beyond | | | 6,796 | | | | 65 | | | | (404 | ) | | | 6,392 | | | | 33% | | | | | | | | | | | | | | | | | | | | | | Total | | | 20,783 | | | | 178 | | | | (1,870 | ) | | | 18,913 | | | | 100% | | | | | | | | | | | | | | | | | | | | | |
| | | | | | | | | | | | | | | | | | | | | | | | | | | of which hedging
| | | | | | | | | | | | | | | | instruments of
| | | Hedging instruments
| | | | | | | | | | | | | non-current
| | | of non-current
| | | Non-current financial
| | | | As of December 31, 2009
| | Non-current
| | | financial debt
| | | financial debt
| | | debt - net of hedging
| | | | | (M€) | | financial debt | | | (liabilities) | | | (assets) | | | instruments | | | % | | 2011 | | | 3,857 | | | | 42 | | | | (199 | ) | | | 3,658 | | | | 20% | | 2012 | | | 3,468 | | | | 48 | | | | (191 | ) | | | 3,277 | | | | 18% | | 2013 | | | 3,781 | | | | 95 | | | | (236 | ) | | | 3,545 | | | | 19% | | 2014 | | | 2,199 | | | | 6 | | | | (90 | ) | | | 2,109 | | | | 11% | | 2015 and beyond | | | 6,132 | | | | 50 | | | | (309 | ) | | | 5,823 | | | | 32% | | | | | | | | | | | | | | | | | | | | | | Total | | | 19,437 | | | | 241 | | | | (1,025 | ) | | | 18,412 | | | | 100% | | | | | | | | | | | | | | | | | | | | | |
| | | | | | | | | | | | | | | | | | | | | | | | | | | of which hedging
| | | | | | | | | | | | | | | | instruments of
| | | Hedging instruments
| | | | | | | | | | | | | non-current
| | | of non-current
| | | Non-current financial
| | | | As of December 31, 2008
| | Non-current
| | | financial debt
| | | financial debt
| | | debt - net of hedging
| | | | | (M€) | | financial debt | | | (liabilities) | | | (assets) | | | instruments | | | % | | 2010 | | | 3,160 | | | | 170 | | | | (168 | ) | | | 2,992 | | | | 20% | | 2011 | | | 3,803 | | | | 24 | | | | (145 | ) | | | 3,658 | | | | 24% | | 2012 | | | 3,503 | | | | 115 | | | | (179 | ) | | | 3,324 | | | | 22% | | 2013 | | | 3,430 | | | | 127 | | | | (198 | ) | | | 3,232 | | | | 21% | | 2014 and beyond | | | 2,295 | | | | 4 | | | | (202 | ) | | | 2,093 | | | | 13% | | | | | | | | | | | | | | | | | | | | | | Total | | | 16,191 | | | | 440 | | | | (892 | ) | | | 15,299 | | | | 100% | | | | | | | | | | | | | | | | | | | | | |
Analysis by currency and interest rate
These analyses take into account interest rate and foreign currency swaps to hedge non-current financial debt.
| | | | | | | | | | | | | | | | | | | | | | | | | | | As of December 31, (M€) | | 2010 | | | % | | | 2009 | | | % | | | 2008 | | | % | | | U.S. Dollar | | | 7,248 | | | | 39% | | | | 3,962 | | | | 21% | | | | 3,990 | | | | 26% | | | Euro | | | 11,417 | | | | 60% | | | | 14,110 | | | | 77% | | | | 10,685 | | | | 70% | | | Other currencies | | | 248 | | | | 1% | | | | 340 | | | | 2% | | | | 624 | | | | 4% | | | | | | | | | | | | | | | | | | | | | | | | | | | | Total | | | 18,913 | | | | 100% | | | | 18,412 | | | | 100% | | | | 15,299 | | | | 100% | | | | | | | | | | | | | | | | | | | | | | | | | | | |
F-59
| | | | | | | | | | | | | | | | | | | | | | | | | | As of December 31,
| | | | | | | | | | | | | | | | | | | | (M€) | | 2010 | | | % | | | 2009 | | | % | | | 2008 | | | % | | | Fixed rate | | | 3,177 | | | | 17% | | | | 2,064 | | | | 11% | | | | 633 | | | | 4% | | | Floating rate | | | 15,736 | | | | 83% | | | | 16,348 | | | | 89% | | | | 14,666 | | | | 96% | | | | | | | | | | | | | | | | | | | | | | | | | | | | Total | | | 18,913 | | | | 100% | | | | 18,412 | | | | 100% | | | | 15,299 | | | | 100% | | | | | | | | | | | | | | | | | | | | | | | | | | | |
| | B) | CURRENT FINANCIAL ASSETS AND LIABILITIES |
Current borrowings consist mainly of commercial papers or treasury bills or draws on bank loans. These instruments bear interest at rates that are close to market rates.
| | | | | | | | | | | | | | As of December 31, (M€)
| | | | | | | | | | | (Assets) / Liabilities | | 2010 | | | 2009 | | | 2008 | | Current financial debt(a) | | | 5,867 | | | | 4,761 | | | | 5,586 | | | Current portion of non-current financial debt | | | 3,786 | | | | 2,233 | | | | 2,136 | | | | | | | | | | | | | | | | Current borrowings(note 28) | | | 9,653 | | | | 6,994 | | | | 7,722 | | | | | | | | | | | | | | | | | Current portion of hedging instruments of debt (liabilities) | | | 12 | | | | 97 | | | | 12 | | | Other current financial instruments (liabilities) | | | 147 | | | | 26 | | | | 146 | | | | | | | | | | | | | | | | Other current financial liabilities(note 28) | | | 159 | | | | 123 | | | | 158 | | | | | | | | | | | | | | | | | Current deposits beyond three months | | | (869 | ) | | | (55 | ) | | | (1 | ) | | Current portion of hedging instruments of debt (assets) | | | (292 | ) | | | (197 | ) | | | (100 | ) | | Other current financial instruments (assets) | | | (44 | ) | | | (59 | ) | | | (86 | ) | | | | | | | | | | | | | | | Current financial assets(note 28) | | | (1,205 | ) | | | (311 | ) | | | (187 | ) | | | | | | | | | | | | | | | Current borrowings and related financial assets and liabilities, net | | | 8,607 | | | | 6,806 | | | | 7,693 | | | | | | | | | | | | | | | |
| | | (a) | | As of December 31, 2010, the current financial debt includes a commercial paper program in Total Capital Canada Ltd. Total Capital Canada Ltd. is a wholly-owned direct subsidiary of TOTAL S.A. It acts as a financing vehicle for the activities of the Group in Canada. Its debt securities are fully and unconditionally guaranteed by TOTAL S.A. as to payment of principal, premium, if any, interest and any other amounts due. |
| | C) | NET-DEBT-TO-EQUITY RATIO |
For its internal and external communication needs, the Group calculates a debt ratio by dividing its net financial debt by equity. Shareholders’ equity as of December 31, 2010 is calculated after distribution of a dividend of €2.28 per share of which €1.14 per share was paid on November 17, 2010.
F-60
The net-debt-to-equity ratio is calculated as follows:
| | | | | | | | | | | | | | As of December 31, (M€)
| | | | | | | | | | | (Assets)/Liabilities | | 2010 | | | 2009 | | | 2008 | | | Current borrowings | | | 9,653 | | | | 6,994 | | | | 7,722 | | | Other current financial liabilities | | | 159 | | | | 123 | | | | 158 | | | Current financial assets | | | (1,205) | | | | (311) | | | | (187) | | | Non-current financial debt | | | 20,783 | | | | 19,437 | | | | 16,191 | | | Hedging instruments on non-current financial debt | | | (1,870) | | | | (1,025) | | | | (892) | | | Cash and cash equivalents | | | (14,489) | | | | (11,662) | | | | (12,321) | | | | | | | | | | | | | | | | Net financial debt | | | 13,031 | | | | 13,556 | | | | 10,671 | | | | | | | | | | | | | | | | | Shareholders’ equity-Group share | | | 60,414 | | | | 52,552 | | | | 48,992 | | | Estimated dividend payable | | | (2,553) | | | | (2,546) | | | | (2,540) | | | Minority interest | | | 857 | | | | 987 | | | | 958 | | | | | | | | | | | | | | | | Total shareholder’s equity | | | 58,718 | | | | 50,993 | | | | 47,410 | | | | | | | | | | | | | | | | Net-debt-to-equity ratio | | | 22.2% | | | | 26.6% | | | | 22.5% | | | | | | | | | | | | | | | |
| | 21) | OTHER CREDITORS AND ACCRUED LIABILITIES |
| | | | | | | | | | | | | | | As of December 31, (M€) | | 2010 | | | 2009 | | | 2008 | | | Accruals and deferred income | | | 184 | | | | 223 | | | | 151 | | | Payable to States (including taxes and duties) | | | 7,235 | | | | 6,024 | | | | 6,256 | | | Payroll | | | 996 | | | | 955 | | | | 928 | | | Other operating liabilities | | | 3,574 | | | | 4,706 | | | | 4,297 | | | | | | | | | | | | | | | | Total | | | 11,989 | | | | 11,908 | | | | 11,632 | | | | | | | | | | | | | | | |
As of December 31, 2009, the heading “Other operating liabilities” mainly included €744 million related to Chesapeake acquisition (see Note 3 to the Consolidated Financial Statements).
The Group leases real estate, retail stations, ships, and other equipments (see Note 11 to the Consolidated Financial Statements).
The future minimum lease payments on operating and finance leases to which the Group is committed are shown as follows:
| | | | | | | | | | | | | Operating
| | | Finance
| | | For the year ended December 31, 2010 (M€) | | leases | | | leases | | | 2011 | | | 582 | | | | 39 | | | 2012 | | | 422 | | | | 39 | | | 2013 | | | 335 | | | | 39 | | | 2014 | | | 274 | | | | 35 | | | 2015 | | | 230 | | | | 35 | | | 2016 and beyond | | | 1,105 | | | | 54 | | | | | | | | | | | | Total minimum payments | | | 2,948 | | | | 241 | | | Less financial expenses | | | — | | | | (43 | ) | | | | | | | | | | | Nominal value of contracts | | | — | | | | 198 | | | Less current portion of finance lease contracts | | | — | | | | (23 | ) | | | | | | | | | | | Outstanding liability of finance lease contracts | | | — | | | | 175 | | | | | | | | | | | |
F-61
| | | | | | | | | | | | | Operating
| | | Finance
| | | For the year ended December 31, 2009 (M€) | | leases | | | leases | | | 2010 | | | 523 | | | | 42 | | | 2011 | | | 377 | | | | 43 | | | 2012 | | | 299 | | | | 42 | | | 2013 | | | 243 | | | | 41 | | | 2014 | | | 203 | | | | 39 | | | 2015 and beyond | | | 894 | | | | 128 | | | | | | | | | | | | Total minimum payments | | | 2,539 | | | | 335 | | | Less financial expenses | | | — | | | | (53 | ) | | | | | | | | | | | Nominal value of contracts | | | — | | | | 282 | | | Less current portion of finance lease contracts | | | — | | | | (22 | ) | | | | | | | | | | | Outstanding liability of finance lease contracts | | | — | | | | 260 | | | | | | | | | | | |
| | | | | | | | | | | | | Operating
| | | Finance
| | | For the year ended December 31, 2008 (M€) | | leases | | | leases | | | 2009 | | | 429 | | | | 47 | | | 2010 | | | 306 | | | | 42 | | | 2011 | | | 243 | | | | 42 | | | 2012 | | | 208 | | | | 42 | | | 2013 | | | 166 | | | | 40 | | | 2014 and beyond | | | 675 | | | | 148 | | | | | | | | | | | | Total minimum payments | | | 2,027 | | | | 361 | | | Less financial expenses | | | — | | | | (70 | ) | | | | | | | | | | | Nominal value of contracts | | | — | | | | 291 | | | Less current portion of finance lease contracts | | | — | | | | (23 | ) | | | | | | | | | | | Outstanding liability of finance lease contracts | | | — | | | | 268 | | | | | | | | | | | |
Net rental expense incurred under operating leases for the year ended December 31, 2010 is €605 million (against €613 million in 2009 and €426 million in 2008).
| | 23) | COMMITMENTS AND CONTINGENCIES |
| | | | | | | | | | | | | | | | | | | | | Maturity and installments | | | | | | | | As of December 31, 2010 | | | | | Less than 1
| | | Between 1
| | | More than 5
| | (M€)
| | Total | | | year | | | and 5 years | | | years | | Non-current debt obligations net of hedging instruments(Note 20) | | | 18,738 | | | | — | | | | 12,392 | | | | 6,346 | | Current portion of non-current debt obligations net of hedging instruments(Note 20) | | | 3,483 | | | | 3,483 | | | | — | | | | — | | Finance lease obligations(Note 22) | | | 198 | | | | 23 | | | | 129 | | | | 46 | | Asset retirement obligations(Note 19) | | | 5,917 | | | | 177 | | | | 872 | | | | 4,868 | | | | | | | | | | | | | | | | | | | | Contractual obligations recorded in the balance sheet | | | 28,336 | | | | 3,683 | | | | 13,393 | | | | 11,260 | | Operating lease obligations(Note 22) | | | 2,948 | | | | 582 | | | | 1,261 | | | | 1,105 | | | Purchase obligations | | | 61,293 | | | | 6,347 | | | | 14,427 | | | | 40,519 | | | | | | | | | | | | | | | | | | | | Contractual obligations not recorded in the balance sheet | | | 64,241 | | | | 6,929 | | | | 15,688 | | | | 41,624 | | | | | | | | | | | | | | | | | | | | Total of contractual obligations | | | 92,577 | | | | 10,612 | | | | 29,081 | | | | 52,884 | | | | | | | | | | | | | | | | | | | | | Guarantees given for excise taxes | | | 1,753 | | | | 1,594 | | | | 71 | | | | 88 | | | Guarantees given against borrowings | | | 5,005 | | | | 1,333 | | | | 493 | | | | 3,179 | | | Indemnities related to sales of businesses | | | 37 | | | | — | | | | 31 | | | | 6 | | | Guarantees of current liabilities | | | 171 | | | | 147 | | | | 19 | | | | 5 | | | Guarantees to customers / suppliers | | | 3,020 | | | | 1,621 | | | | 96 | | | | 1,303 | | | Letters of credit | | | 1,250 | | | | 1,247 | | | | — | | | | 3 | | | Other operating commitments | | | 2,057 | | | | 467 | | | | 220 | | | | 1,370 | | | | | | | | | | | | | | | | | | | | Total of other commitments given | | | 13,293 | | | | 6,409 | | | | 930 | | | | 5,954 | | | | | | | | | | | | | | | | | | | | | Mortgages and liens received | | | 429 | | | | 2 | | | | 114 | | | | 313 | | | Other commitments received | | | 6,387 | | | | 3,878 | | | | 679 | | | | 1,830 | | | | | | | | | | | | | | | | | | | | Total of commitments received | | | 6,816 | | | | 3,880 | | | | 793 | | | | 2,143 | | | | | | | | | | | | | | | | | | | |
F-62
| | | | | | | | | | | | | | | | | | | | | Maturity and installments | | | | | | | | As of December 31, 2009 | | | | | Less than 1
| | | Between 1
| | | More than 5
| | (M€)
| | Total | | | year | | | and 5 years | | | years | | Non-current debt obligations net of hedging instruments(Note 20) | | | 18,152 | | | | — | | | | 12,443 | | | | 5,709 | | Current portion of non-current debt obligations net of hedging instruments(Note 20) | | | 2,111 | | | | 2,111 | | | | — | | | | — | | Finance lease obligations(Note 22) | | | 282 | | | | 22 | | | | 146 | | | | 114 | | Asset retirement obligations(Note 19) | | | 5,469 | | | | 235 | | | | 972 | | | | 4,262 | | | | | | | | | | | | | | | | | | | | Contractual obligations recorded in the balance sheet | | | 26,014 | | | | 2,368 | | | | 13,561 | | | | 10,085 | | Operating lease obligations(Note 22) | | | 2,539 | | | | 523 | | | | 1,122 | | | | 894 | | | Purchase obligations | | | 49,808 | | | | 4,542 | | | | 9,919 | | | | 35,347 | | | | | | | | | | | | | | | | | | | | Contractual obligations not recorded in the balance sheet | | | 52,347 | | | | 5,065 | | | | 11,041 | | | | 36,241 | | | | | | | | | | | | | | | | | | | | Total of contractual obligations | | | 78,361 | | | | 7,433 | | | | 24,602 | | | | 46,326 | | | | | | | | | | | | | | | | | | | | | Guarantees given for excise taxes | | | 1,765 | | | | 1,617 | | | | 69 | | | | 79 | | | Guarantees given against borrowings | | | 2,882 | | | | 1,383 | | | | 709 | | | | 790 | | | Indemnities related to sales of businesses | | | 36 | | | | — | | | | 1 | | | | 35 | | | Guarantees of current liabilities | | | 203 | | | | 160 | | | | 38 | | | | 5 | | | Guarantees to customers / suppliers | | | 2,770 | | | | 1,917 | | | | 70 | | | | 783 | | | Letters of credit | | | 1,499 | | | | 1,485 | | | | 2 | | | | 12 | | | Other operating commitments | | | 765 | | | | 582 | | | | 103 | | | | 80 | | | | | | | | | | | | | | | | | | | | Total of other commitments given | | | 9,920 | | | | 7,144 | | | | 992 | | | | 1,784 | | | | | | | | | | | | | | | | | | | | | Mortgages and liens received | | | 330 | | | | 5 | | | | 106 | | | | 219 | | | Other commitments received | | | 5,637 | | | | 3,187 | | | | 481 | | | | 1,969 | | | | | | | | | | | | | | | | | | | | Total of commitments received | | | 5,967 | | | | 3,192 | | | | 587 | | | | 2,188 | | | | | | | | | | | | | | | | | | | |
F-63
| | | | | | | | | | | | | | | | | | | | | Maturity and installments | | | | | | | | As of December 31, 2008 | | | | | Less than
| | | Between 1
| | | More than
| | (M€)
| | Total | | | 1 year | | | and 5 years | | | 5 years | | Non-current debt obligations net of hedging instruments(Note 20) | | | 15,031 | | | | — | | | | 13,064 | | | | 1,967 | | Current portion of non-current debt obligations net of hedging instruments(Note 20) | | | 2,025 | | | | 2,025 | | | | — | | | | — | | Finance lease obligations(Note 22) | | | 291 | | | | 23 | | | | 142 | | | | 126 | | Asset retirement obligations(Note 19) | | | 4,500 | | | | 154 | | | | 653 | | | | 3,693 | | | | | | | | | | | | | | | | | | | | Contractual obligations recorded in the balance sheet | | | 21,847 | | | | 2,202 | | | | 13,859 | | | | 5,786 | | Operating lease obligations(Note 22) | | | 2,027 | | | | 429 | | | | 923 | | | | 675 | | | Purchase obligations | | | 60,226 | | | | 4,420 | | | | 13,127 | | | | 42,679 | | | | | | | | | | | | | | | | | | | | Contractual obligations not recorded in the balance sheet | | | 62,253 | | | | 4,849 | | | | 14,050 | | | | 43,354 | | | | | | | | | | | | | | | | | | | | Total of contractual obligations | | | 84,100 | | | | 7,051 | | | | 27,909 | | | | 49,140 | | | | | | | | | | | | | | | | | | | | | Guarantees given for excise taxes | | | 1,720 | | | | 1,590 | | | | 58 | | | | 72 | | | Guarantees given against borrowings | | | 2,870 | | | | 1,119 | | | | 519 | | | | 1,232 | | | Indemnities related to sales of businesses | | | 39 | | | | 3 | | | | 1 | | | | 35 | | | Guarantees of current liabilities | | | 315 | | | | 119 | | | | 164 | | | | 32 | | | Guarantees to customers / suppliers | | | 2,866 | | | | 68 | | | | 148 | | | | 2,650 | | | Letters of credit | | | 1,080 | | | | 1,024 | | | | 17 | | | | 39 | | | Other operating commitments | | | 648 | | | | 246 | | | | 132 | | | | 270 | | | | | | | | | | | | | | | | | | | | Total of other commitments given | | | 9,538 | | | | 4,169 | | | | 1,039 | | | | 4,330 | | | | | | | | | | | | | | | | | | | | | Mortgages and liens received | | | 321 | | | | 72 | | | | 110 | | | | 139 | | | Other commitments received | | | 4,218 | | | | 2,440 | | | | 234 | | | | 1,544 | | | | | | | | | | | | | | | | | | | | Total of commitments received | | | 4,539 | | | | 2,512 | | | | 344 | | | | 1,683 | | | | | | | | | | | | | | | | | | | |
| | A. | CONTRACTUAL OBLIGATIONS |
Debt obligations
“Non-current debt obligations” are included in the items “Non-current financial debt” and “Hedging instruments of non-current financial debt” of the Consolidated Balance Sheet. It includes the non-current portion of swaps hedging bonds, and excludes non-current finance lease obligations of €175 million.
The current portion of non-current debt is included in the items “Current borrowings”, “Current financial assets” and “Other current financial liabilities” of the Consolidated Balance Sheet. It includes the current portion of swaps hedging bonds, and excludes the current portion of finance lease obligations of €23 million.
The information regarding contractual obligations linked to indebtedness is presented in Note 20 to the Consolidated Financial Statements.
Lease contracts
The information regarding operating and finance leases is presented in Note 22 to the Consolidated Financial Statements.
Asset retirement obligations
This item represents the discounted present value of Upstream asset retirement obligations, primarily asset removal costs at the completion date. The information regarding contractual obligations linked to asset retirement obligations is presented in Notes 1Q and 19 to the Consolidated Financial Statements.
Purchase obligations
Purchase obligations are obligations under contractual agreements to purchase goods or services, including capital projects. These obligations are enforceable and legally binding on the company and specify all significant terms, including the amount and the timing of the payments.
These obligations mainly include: hydrocarbon unconditional purchase contracts (except where an active, highly-liquid market exists and when the hydrocarbons are expected to be re-sold shortly after purchase), reservation of transport capacities in pipelines, unconditional exploration works and development works in the Upstream segment, and contracts for capital investment projects in the Downstream segment.
F-64
| | B. | OTHER COMMITMENTS GIVEN |
Guarantees given for excise taxes
They consist of guarantees given to other oil and gas companies in order to comply with French tax authorities’ requirements for oil and gas imports in France. A payment would be triggered by a failure of the guaranteed party with respect to the French tax authorities. The default of the guaranteed parties is however considered to be highly remote by the Group.
Guarantees given against borrowings
The Group guarantees bank debt and finance lease obligations of certain non-consolidated subsidiaries and equity affiliates. Maturity dates vary, and guarantees will terminate on paymentand/or cancellation of the obligation. A payment would be triggered by failure of the guaranteed party to fulfill its obligation covered by the guarantee, and no assets are held as collateral for these guarantees. As of December 31, 2010, the maturities of these guarantees are up to 2023.
Guarantees given against borrowings include the guarantee given in 2008 by TOTAL S.A. in connection with the financing of the Yemen LNG project for an amount of €1,335 million. In turn, certain partners involved in this project have given commitments that could, in the case of Total S.A.’s guarantees being called for the maximum amount, reduce the Group’s exposure by up to €427 million, recorded under “Other commitments received”.
In 2010, TOTAL S.A. provided guarantees in connection with the financing of the Jubail project (operated by SAUDI ARAMCO TOTAL Refining and Petrochemical Company (SATORP)) of up to €2,385 million, proportional to TOTAL’s share in the project (37.5%). In addition, TOTAL S.A. provided in 2010 a guarantee in favor of its partner in the Jubail project (Saudi Arabian Oil Company) with respect to Total Refining Saudi Arabia SAS’s obligations under the shareholders agreement with respect to SATORP. As of December 31, 2010, this guarantee is of up to €1,271 million and has been recorded under “Other operating commitments”.
Indemnities related to sales of businesses
In the ordinary course of business, the Group executes contracts involving standard indemnities in oil industry and indemnities specific to transactions such as sales of businesses. These indemnities might include claims against any of the following: environmental, tax and shareholder matters, intellectual property rights, governmental regulations and employment-related matters, dealer, supplier, and other commercial contractual relationships. Performance under these indemnities would generally be triggered by a breach of terms of the contract or by a third party claim. The Group regularly evaluates the probability of having to incur costs associated with these indemnities.
The guarantees related to antitrust investigations granted as part of the agreement relating to the spin-off of Arkema are described in Note 32 to the Consolidated Financial Statements.
Other guarantees given
Non-consolidated subsidiaries
The Group also guarantees the current liabilities of certain non-consolidated subsidiaries. Performance under these guarantees would be triggered by a financial default of the entity.
Operating agreements
As part of normal ongoing business operations and consistent with generally and accepted recognized industry practices, the Group enters into numerous agreements with other parties. These commitments are often entered into for commercial purposes, for regulatory purposes or for other operating agreements.
The main transactions and balances with related parties (principally non-consolidated subsidiaries and equity affiliates) are detailed as follows:
| | | | | | | | | | | | | |
Balance sheet
| | | | | | | | | | | As of December 31, (M€) | | 2010 | | | 2009 | | | 2008 | | | | | | | | | | | | | | | | Receivables | | | | | | | | | | | | | | Debtors and other debtors | | | 432 | | | | 293 | | | | 244 | | | Loans (excl. loans to equity affiliates) | | | 315 | | | | 438 | | | | 354 | | Payables | | | | | | | | | | | | | | Creditors and other creditors | | | 497 | | | | 386 | | | | 136 | | | Debts | | | 28 | | | | 42 | | | | 50 | | | | | | | | | | | | | | | |
| | | | | | | | | | | | | |
Statement of income
| | | | | | | | | | For the year ended December 31,
| | | | | | | | | | | (M€) | | 2010 | | | 2009 | | | 2008 | | | Sales | | | 3,194 | | | | 2,183 | | | | 3,082 | | | Purchases | | | 5,576 | | | | 2,958 | | | | 4,061 | | | Financial expense | | | 69 | | | | 1 | | | | — | | | Financial income | | | 74 | | | | 68 | | | | 114 | |
F-65
Compensation for the administration and management bodies
The aggregate amount paid directly or indirectly by the French and foreign affiliates of the Company as compensation to the executive officers of TOTAL (the members of the Management Committee and the Treasurer) and to the members of the Board of Directors who are employees of the Group, is detailed as follows:
| | | | | | | | | | | | | | | For the year ended December 31, | | | | | | | | | | | (M€) | | 2010 | | | 2009 | | | 2008 | | | Number of people | | | 26 | | | | 27 | | | | 30 | | | | | | | | | | | | | | | | | Direct or indirect compensation | | | 20.8 | | | | 19.4 | | | | 20.4 | | Pension expenses(a) | | | 12.2 | | | | 10.6 | | | | 11.9 | | | Other long-term benefits | | | — | | | | — | | | | — | | | Termination benefits | | | — | | | | — | | | | — | | Share-based payments expense (IFRS 2)(b) | | | 10.0 | | | | 11.2 | | | | 16.6 | | | | | | | | | | | | | | | |
| | | (a) | | The benefits provided for executive officers and certain members of the Board of Directors, employees and former employees of the Group, include severance to be paid on retirement, supplementary pension schemes and insurance plans, which represent €113.8 million provisioned as of December 31, 2010 (against €96.6 million as of December 31, 2009 and €98.0 million as of December 31, 2008). | | (b) | | Share-based payments expense computed for the executive officers and the members of the Board of Directors who are employees of the Group as described in Note 25 paragraph E to the Consolidated Financial Statements and based on the principles of IFRS 2 “Share-based payments” described in Note 1 paragraph E to the Consolidated Financial Statements. |
The compensation allocated to members of the Board of Directors for directors’ fees totaled €0.96 million in 2010 (€0.97 million in 2009 and €0.83 million in 2008).
F-66
A. TOTAL SHARE SUBSCRIPTION OPTION PLANS
| | | | | | | | | | | | | | | | | | | | | | | | | | | | | | | | | | | | | | | | | | | | | | | | | | | | | | | | | | | | | | | | | | | | | | | | | | | Weighted
| | | | | | | | | | | | | | | | | | | | | | | | | | | | | | | | average
| | | | | 2003
| | | 2004
| | | 2005
| | | 2006
| | | 2007
| | | 2008
| | | 2009
| | | 2010
| | | | | | exercise
| | | | | Plan | | | Plan | | | Plan | | | Plan | | | Plan | | | Plan | | | Plan | | | Plan | | | Total | | | price | | | | | | | | | | | | | | | | | | | | | | | | | | | | | | | | | | | | | | | | | | | | | | | | | Date of the shareholders’ meeting | | | 05/17/2001 | | | | 05/14/2004 | | | | 05/14/2004 | | | | 05/14/2004 | | | | 05/11/2007 | | | | 05/11/2007 | | | | 05/11/2007 | | | | 05/21/2010 | | | | | | | | | | | | | | | | | | | | | | | | | | | | | | | | | | | | | | | | | | | | | | | | | | | | Grant Date(a) | | | 07/16/2003 | | | | 07/20/2004 | | | | 07/19/2005 | | | | 07/18/2006 | | | | 07/17/2007 | | | | 10/09/2008 | | | | 09/15/2009 | | | | 09/14/2010 | | | | | | | | | | | | | | | | | | | | | | | | | | | | | | | | | | | | | | | | | | | | | | | | | | | | Exercise price until May 23, 2006 included(b) | | | 33.30 | | | | 39.85 | | | | 49.73 | | | | — | | | | — | | | | — | | | | — | | | | — | | | | | | | | | | | | | | | | | | | | | | | | | | | | | | | | | | | | | | | | | | | | | | | | | | | | Exercise price since May 24, 2006(b) | | | 32.84 | | | | 39.30 | | | | 49.04 | | | | 50.60 | | | | 60.10 | | | | 42.90 | | | | 39.90 | | | | 38.20 | | | | | | | | | | | | | | | | | | | | | | | | | | | | | | | | | | | | | | | | | | | | | | | | | | | | Expiry date | | | 07/16/2011 | | | | 07/20/2012 | | | | 07/19/2013 | | | | 07/18/2014 | | | | 07/17/2015 | | | | 10/09/2016 | | | | 09/15/2017 | | | | 09/14/2018 | | | | | | | | | | | | | | | | | | | | | | | | | | | | | | | | | | | | | | | | | | | | | | | | | | | | | | | | Number of options(c) | | | | | | | | | | | | | | | | | | | | | | | | | | | | | | | | | | | | | | | | | | | | | | | | | | | | | | | | | | | | | | | | | | | | | | | | | | | | | | | | | | | Outstanding as of January 1, 2008 | | | 8,368,378 | | | | 13,197,236 | | | | 6,243,438 | | | | 5,711,060 | | | | 5,920,105 | | | | | | | | | | | | | | | | 39,440,217 | | | | 44.23 | | | | | | | | | | | | | | | | | | | | | | | | | | | | | | | | | | | | | | | | | | | | | Awarded | | | — | | | | — | | | | — | | | | — | | | | — | | | | 4,449,810 | | | | | | | | | | | | 4,449,810 | | | | 42.90 | | | | | | | | | | | | | | | | | | | | | | | | | | | | | | | | | | | | | | | | | | | | | Canceled | | | (25,184 | ) | | | (118,140 | ) | | | (34,032 | ) | | | (53,304 | ) | | | (34,660 | ) | | | (6,000 | ) | | | | | | | | | | | (271,320 | ) | | | 44.88 | | | | | | | | | | | | | | | | | | | | | | | | | | | | | | | | | | | | | | | | | | | | | Exercised | | | (841,846 | ) | | | (311,919 | ) | | | (17,702 | ) | | | (6,700 | ) | | | — | | | | — | | | | | | | | | | | | (1,178,167 | ) | | | 34.89 | | | | | | | | | | | | | | | | | | | | | | | | | | | | | | | | | | | | | | | | | | | | Outstanding as of January 1, 2009 | | | 7,501,348 | | | | 12,767,177 | | | | 6,191,704 | | | | 5,651,056 | | | | 5,885,445 | | | | 4,443,810 | | | | | | | | | | | | 42,440,540 | | | | 44.35 | | | | | | | | | | | | | | | | | | | | | | | | | | | | | | | | | | | | | | | | | | | | | Awarded | | | — | | | | — | | | | — | | | | — | | | | — | | | | — | | | | 4,387,620 | | | | | | | | 4,387,620 | | | | 39.90 | | | | | | | | | | | | | | | | | | | | | | | | | | | | | | | | | | | | | | | | | | | | | Canceled | | | (8,020 | ) | | | (18,387 | ) | | | (6,264 | ) | | | (5,370 | ) | | | (13,780 | ) | | | (2,180 | ) | | | (10,610 | ) | | | | | | | (64,611 | ) | | | 45.04 | | | | | | | | | | | | | | | | | | | | | | | | | | | | | | | | | | | | | | | | | | | | | Exercised | | | (681,699 | ) | | | (253,081 | ) | | | — | | | | — | | | | — | | | | — | | | | — | | | | | | | | (934,780 | ) | | | 34.59 | | | | | | | | | | | | | | | | | | | | | | | | | | | | | | | | | | | | | | | | | | | | Outstanding as of January 1, 2010 | | | 6,811,629 | | | | 12,495,709 | | | | 6,185,440 | | | | 5,645,686 | | | | 5,871,665 | | | | 4,441,630 | | | | 4,377,010 | | | | | | | | 45,828,769 | | | | 44.12 | | | | | | | | | | | | | | | | | | | | | | | | | | | | | | | | | | | | | | | | | | | | | Awarded | | | — | | | | — | | | | — | | | | — | | | | — | | | | — | | | | — | | | | 4,788,420 | | | | 4,788,420 | | | | 38.20 | | | | | | | | | | | | | | | | | | | | | | | | | | | | | | | | | | | | | | | | | | | | Canceled(d) | | | (1,420 | ) | | | (15,660 | ) | | | (6,584 | ) | | | (4,800 | ) | | | (5,220 | ) | | | (92,472 | ) | | | (4,040 | ) | | | (1,120 | ) | | | (131,316 | ) | | | 43.50 | | | | | | | | | | | | | | | | | | | | | | | | | | | | | | | | | | | | | | | | | | | | | Exercised | | | (1,075,765 | ) | | | (141,202 | ) | | | — | | | | — | | | | — | | | | — | | | | (1,080 | ) | | | — | | | | (1,218,047 | ) | | | 33.60 | | | | | | | | | | | | | | | | | | | | | | | | | | | | | | | | | | | | | | | | | | | | Outstanding as of December 31, 2010 | | | 5,734,444 | | | | 12,338,847 | | | | 6,178,856 | | | | 5,640,886 | | | | 5,866,445 | | | | 4,349,158 | | | | 4,371,890 | | | | 4,787,300 | | | | 49,267,826 | | | | 43.80 | | | | | |
| | | (a) | | The grant date is the date of the Board meeting awarding the share subscription options, except for the grant of October 9, 2008, decided by the Board on September 9, 2008. | (b) | | Exercise price in euro. The exercise prices of TOTAL subscription shares of the plans in force at that date were multiplied by 0.25 to take into account thefour-for-one stock split on May 18, 2006. Moreover, following the spin-off of Arkema, the exercise prices of TOTAL subscription shares of these plans were multiplied by an adjustment factor equal to 0.986147 effective as of May 24, 2006. | (c) | | The number of options awarded, outstanding, canceled or exercised before May 23, 2006 included, was multiplied by four to take into account thefour-for-one stock split approved by the shareholders’ meeting on May 12, 2006. | (d) | | Out of 92,472 options awarded under the 2008 Plan that were canceled, 88,532 options were canceled due to the performance condition. The acquisition rate applicable to the subscription options that were subject to the performance condition of the 2008 Plan was 60%. |
Options are exercisable, subject to a continued employment condition, after a2-year period from the date of the Board meeting awarding the options and expire eight years after this date. The underlying shares may not be transferred during four years from the date of grant. For the 2007, 2008, 2009 and 2010 Plans, the four-year transfer restriction period does not apply to employees of non-French subsidiaries as of the date of the grant, who may transfer the underlying shares after a two-year period from the date of the grant.
The continued employment condition states that the termination of the employment contract will result in the employee losing the right to exercise the options.
For the 2010 Plan, the Board of Directors decided that:
| | • | For each grantee of up to 3,000 options, other than the Chairman and Chief Executive Officer, the options will be finally granted to their beneficiary. | • | For each grantee of more than 3,000 options and less or equal to 50,000 options (other than the Chairman and Chief Executive Officer): |
| | | | • | The first 3,000 options and two-thirds above the first 3,000 options will be finally granted to their beneficiary; | | • | The outstanding options, that is one-third of the options above the first 3,000 options, will be finally granted provided that the performance condition described below is fulfilled. |
F-67
| | • | For each grantee of more than 50,000 options, other than the Chairman and Chief Executive Officer: |
| | | | • | The first 3,000 options, two-thirds of the options above the first 3,000 options and below the first 50,000 options, and one-third of the options above the first 50,000 options, will be finally granted to their beneficiary; | | • | The outstanding options, that is one-third of the options above the first 3,000 options and below the first 50,000 options and two-thirds of the options above the first 50,000 options, will be finally granted provided that the performance condition is fulfilled. |
The performance condition states that the number of options finally granted is based on the average of the Return On Equity (ROE) of the Group. The average ROE is calculated by the Group based on TOTAL’s consolidated balance sheet and statement of income for fiscal years 2010 and 2011. The acquisition rate:
| | • | is equal to zero if the average ROE is less than or equal to 7%; | • | varies on straight-line basis between 0% and 100% if the average ROE is more than 7% and less than 18%; and | • | is equal to 100% if the average ROE is more than or equal to 18%. |
In addition, as part of the 2010 plan, the Board of Directors decided that the number of share subscription options finally awarded to the Chairman and Chief Executive Officer will be subject to two performance conditions:
| | • | For 50% of the share subscription options granted, the performance condition states that the number of options finally granted is based on the average ROE of the Group. The average ROE is calculated by the Group based on TOTAL’s consolidated balance sheet and statement of income for fiscal years 2010 and 2011. The acquisition rate is equal to zero if the average ROE is less than or equal to 7%; varies on a straight-line basis between 0% and 100% if the average ROE is more than 7% and less than 18%; and is equal to 100% if the average ROE is more than or equal to 18%. | • | For 50% of the share subscription options granted, the performance condition states that the number of options finally granted is based on the average of the Return On Average Capital Employed (ROACE) of the Group. The average ROACE is calculated by the Group based on TOTAL’s consolidated balance sheet and statement of income for fiscal years 2010 and 2011. The acquisition rate is equal to zero if the average ROACE is less than or equal to 6%; varies on a straight-line basis between 0% and 100% if the average ROACE is more than 6% and less than 15%; and is equal to 100% if the average ROACE is more than or equal to 15%. |
For the 2009 Plan, the Board of Directors decided that for each beneficiary, other than the Chief Executive Officer, of more than 25,000 options, one third of the options granted in excess of this number will be finally granted subject to a performance condition. This condition states that the final number of options finally granted is based on the average ROE of the Group as published by TOTAL. The average ROE is calculated based on the Group’s consolidated balance sheet and statement of income for fiscal years 2009 and 2010. The acquisition rate:
| | • | is equal to zero if the average ROE is less than or equal to 7%; | • | varies on straight-line basis between 0% and 100% if the average ROE is more than 7% and less than 18%; and | • | is equal to 100% if the average ROE is more than or equal to 18%. |
In addition, the Board of Directors decided that, for the Chief Executive Officer, the number of share subscription options finally granted will be subject to two performance conditions:
| | • | For 50% of the share subscription options granted, the performance condition states that the number of options finally granted is based on the average ROE of the Group as published by TOTAL. The average ROE is calculated based on the Group’s consolidated balance sheet and statement of income for fiscal years 2009 and 2010. The acquisition rate is equal to zero if the average ROE is less than or equal to 7%; varies on a straight-line basis between 0% and 100% if the average ROE is more than 7% and less than 18%; and is equal to 100% if the average ROE is more than or equal to 18%. | • | For 50% of the share subscription options granted, the performance condition states that the number of options finally granted is based on the average ROACE of the Group as published by TOTAL. The average ROACE is calculated based on the Group’s consolidated balance sheet and statement of income for fiscal years 2009 and 2010. The acquisition rate is equal to zero if the average ROACE is less than or equal to 6%; varies on a straight-line basis between 0% and 100% if the average ROACE is more than 6% and less than 15%; and is equal to 100% if the average ROACE is more than or equal to 15%. |
F-68
For the 2008 Plan, the Board of Directors decided that for each beneficiary of more than 25,000 options, one third of the options in excess of this number will be finally granted subject to a performance condition. This condition states that the number of subscription options finally granted is based on the ROE of the Group. The ROE is calculated based on the consolidated accounts published by TOTAL for the fiscal year preceding the final grant. The acquisition rate:
| | • | is equal to zero if the ROE is less than or equal to 10%; | • | varies on a straight-line basis between 0% and 80% if the ROE is more than 10% and less than 18%; | • | varies on a straight-line basis between 80% and 100% if the ROE is more than or equal to 18% and less than 30%; and | • | is equal to 100% if the ROE is more than or equal to 30%. |
Due to the application of the performance condition, the acquisition rate was 60% for the 2008 plan.
As a consequence, 88,532 options were canceled.
| | B. | TOTAL SHARE PURCHASE OPTION PLANS |
| | | | | | | | | | | | | | | | | | | | | | | | | | | | | | | | | | | | | Weighted
| | | | | | | | | | | | | | | | | average
| | | | | 2000 Plan(a) | | | 2001 Plan(b) | | | 2002 Plan(c) | | | Total | | | exercise price | | Date of the shareholders’ meeting | | | 05/21/1997 | | | | 05/17/2001 | | | | 05/17/2001 | | | | | | | | | | Grant date(d) | | | 07/11/2000 | | | | 07/10/2001 | | | | 07/09/2002 | | | | | | | | | | Exercise price until May 23, 2006 included(e) | | | 40.68 | | | | 42.05 | | | | 39.58 | | | | | | | | | | Exercise price since May 24, 2006(e) | | | 40.11 | | | | 41.47 | | | | 39.03 | | | | | | | | | | Expiry date | | | 07/11/2008 | | | | 07/10/2009 | | | | 07/09/2010 | | | | | | | | | | | | | | | | | | | | | | | | | | | | | | | | Number of options(f) | | | | | | | | | | | | | | | | | | | | | Outstanding as of January 1, 2008 | | | 3,142,188 | | | | 5,150,258 | | | | 7,063,183 | | | | 15,355,629 | | | | 40.07 | | | Awarded | | | — | | | | — | | | | — | | | | — | | | | — | | | Canceled | | | (480,475 | ) | | | (3,652 | ) | | | (13,392 | ) | | | (497,519 | ) | | | 40.09 | | | Exercised | | | (2,661,713 | ) | | | (455,180 | ) | | | (598,934 | ) | | | (3,715,827 | ) | | | 40.10 | | Outstanding as of January 1, 2009 | | | — | | | | 4,691,426 | | | | 6,450,857 | | | | 11,142,283 | | | | 40.06 | | | Awarded | | | | | | | — | | | | — | | | | — | | | | — | | | Canceled | | | | | | | (4,650,446 | ) | | | (7,920 | ) | | | (4,658,366 | ) | | | 41.47 | | | Exercised | | | | | | | (40,980 | ) | | | (507,676 | ) | | | (548,656 | ) | | | 39.21 | | Outstanding as of January 1, 2010 | | | | | | | — | | | | 5,935,261 | | | | 5,935,261 | | | | 39.03 | | | Awarded | | | | | | | | | | | — | | | | — | | | | — | | Canceled(g) | | | | | | | | | | | (4,671,989 | ) | | | (4,671,989 | ) | | | 39.03 | | | Exercised | | | | | | | | | | | (1,263,272 | ) | | | (1,263,272 | ) | | | 39.03 | | Outstanding as of December 31, 2010 | | | | | | | | | | | — | | | | — | | | | — | | | | | | | | | | | | | | | | | | | | | | | |
| | | (a) | | Options were exercisable, subject to a continued employment condition, after a4-year vesting period from the date of the Board meeting awarding the options and expired eight years after this date. The underlying shares may not be transferred during the5-year period from the date of the grant. This plan expired on July 11, 2008. | (b) | | Options were exercisable, subject to a continued employment condition, after a 3.5-year vesting period from the date of the Board meeting awarding the options and expired eight years after this date. The underlying shares may not be transferred during the4-year period from the date of the grant. This plan expired on July 10, 2009. | (c) | | Options were exercisable, subject to a continued employment condition, after a2-year vesting period from the date of the Board meeting awarding the options and expired eight years after this date. The underlying shares may not be transferred during the4-year period from the date of the grant. This plan expired on July 9, 2010. | (d) | | The grant date is the date of the Board meeting awarding the options. | (e) | | Exercise price in euro. The exercise prices of TOTAL share purchase options of the plans at that date were multiplied by 0.25 to take into account thefour-for-one stock split on May 18, 2006. Moreover, following the spin-off of Arkema, the exercise prices of TOTAL share purchase options of these plans were multiplied by an adjustment factor equal to 0.986147 effective as of May 24, 2006. | (f) | | The number of options awarded, outstanding, canceled or exercised before May 23, 2006 included, was multiplied by four to take into account thefour-for-one stock split approved by the shareholders’ meeting on May 12, 2006. | (g) | | Out of the 4,671,989 options canceled in 2010, 4,671,145 options that were not exercised expired due to the expiry of the 2002 purchase option Plan on July 9, 2010. |
F-69
C. EXCHANGE GUARANTEE GRANTED TO THE HOLDERS OF ELF AQUITAINE SHARE SUBSCRIPTION OPTIONS
Pursuant to the public exchange offer for Elf Aquitaine shares which was made in 1999, the Group made a commitment to guarantee the holders of Elf Aquitaine share subscription options, at the end of the period referred to in Article 163 bis C of the French Tax Code (CGI), and until the end of the period for the exercise of the options, the possibility to exchange their future Elf Aquitaine shares for TOTAL shares, on the basis of the exchange ratio of the offer (nineteen TOTAL shares for thirteen Elf Aquitaine shares).
In order to take into account the spin-off of S.D.A. (Société de Développement Arkema) by Elf Aquitaine, the spin-off of Arkema by TOTAL S.A. and thefour-for-one TOTAL stock split, the Board of Directors of TOTAL S.A., in accordance with the terms of the share exchange undertaking, approved on March 14, 2006 to adjust the exchange ratio described above (see pages 24 and 25 of the “Prospectus for the purpose of listing Arkema shares on Euronext Paris in connection with the allocation of Arkema shares to TOTAL S.A. shareholders”). Following the approval by Elf Aquitaine shareholders’ meeting on May 10, 2006 of the spin-off of S.D.A. by Elf Aquitaine, the approval by TOTAL S.A. shareholders’ meeting on May 12, 2006 of the spin-off of Arkema by TOTAL S.A. and thefour-for-one TOTAL stock split, the exchange ratio was adjusted to six TOTAL shares for one Elf Aquitaine share on May 22, 2006.
This exchange guarantee expired on September 12, 2009, due to the expiry of the Elf Aquitaine share subscription option plan No. 2 of 1999. Subsequently, no Elf Aquitaine shares are covered by the exchange guarantee.
D. TOTAL RESTRICTED SHARE GRANTS
| | | | | | | | | | | | | | | | | | | | | | | | | | | | | | | | | 2005 Plan | | | 2006 Plan | | | 2007 Plan | | | 2008 Plan | | | 2009 Plan | | | 2010 Plan | | | Total | | Date of the shareholders’ meeting | | | 05/17/2005 | | | | 05/17/2005 | | | | 05/17/2005 | | | | 05/16/2008 | | | | 05/16/2008 | | | | 05/16/2008 | | | | | | Grant date(a) | | | 07/19/2005 | | | | 07/18/2006 | | | | 07/17/2007 | | | | 10/09/2008 | | | | 09/15/2009 | | | | 09/14/2010 | | | | | | | | | | | | | | | | | | | | | | | | | | | | | | | | | | | | Final grant date (end of the vesting period) | | | 07/20/2007 | | | | 07/19/2008 | | | | 07/18/2009 | | | | 10/10/2010 | | | | 09/16/2011 | | | | 09/15/2012 | | | | | | Transfer possible from | | | 07/20/2009 | | | | 07/19/2010 | | | | 07/18/2011 | | | | 10/10/2012 | | | | 09/16/2013 | | | | 09/15/2014 | | | | | | | | | | | | | | | | | | | | | | | | | | | | | | | | | | | | Number of restricted shares | | | | | | | | | | | | | | | | | | | | | | | | | | | | | Outstanding as of January 1, 2008 | | | — | | | | 2,263,956 | | | | 2,363,057 | | | | | | | | | | | | | | | | 4,627,013 | | | Awarded | | | — | | | | — | | | | — | | | | 2,791,968 | | | | | | | | | | | | 2,791,968 | | | Canceled | | | 2,840 | | | | (43,822 | ) | | | (29,504 | ) | | | (19,220 | ) | | | | | | | | | | | (89,706 | ) | Finally granted(b)(c) | | | (2,840 | ) | | | (2,220,134 | ) | | | (336 | ) | | | — | | | | | | | | | | | | (2,223,310 | ) | Outstanding as of January 1, 2009 | | | — | | | | — | | | | 2,333,217 | | | | 2,772,748 | | | | | | | | | | | | 5,105,965 | | | Awarded | | | — | | | | — | | | | — | | | | — | | | | 2,972,018 | | | | | | | | 2,972,018 | | | Canceled | | | 1,928 | | | | 2,922 | | | | (12,418 | ) | | | (9,672 | ) | | | (5,982 | ) | | | | | | | (23,222 | ) | Finally granted(b)(c) | | | (1,928 | ) | | | (2,922 | ) | | | (2,320,799 | ) | | | (600 | ) | | | — | | | | | | | | (2,326,249 | ) | Outstanding as of January 1, 2010 | | | — | | | | — | | | | — | | | | 2,762,476 | | | | 2,966,036 | | | | | | | | 5,728,512 | | | Awarded | | | — | | | | — | | | | — | | | | — | | | | — | | | | 3,010,011 | | | | 3,010,011 | | Canceled(d) | | | 1,024 | | | | 3,034 | | | | 552 | | | | (1,113,462 | ) | | | (9,796 | ) | | | (8,738 | ) | | | (1,127,386 | ) | Finally granted(b)(c) | | | (1,024 | ) | | | (3,034 | ) | | | (552 | ) | | | (1,649,014 | ) | | | (1,904 | ) | | | (636 | ) | | | (1,656,164 | ) | Outstanding as of December 31, 2010 | | | — | | | | — | | | | — | | | | — | | | | 2,954,336 | | | | 3,000,637 | | | | 5,954,973 | | | | | | | | | | | | | | | | | | | | | | | | | | | | | | | |
| | | (a) | | The grant date is the date of the Board of Directors meeting that awarded the shares, except for the shares awarded by the Board of Directors at their meeting of September 9, 2008, and granted on October 9, 2008. | (b) | | Restricted shares finally granted following the death of their beneficiaries (2007 Plan for fiscal year 2008, 2008 Plan for fiscal year 2009, 2009 Plan for fiscal year 2010). | (c) | | Including restricted shares finally granted for which the entitlement right had been canceled erroneously. | (d) | | Out of the 1,113,462 canceled rights to the grant share under the 2008 Plan, 1,094,914 entitlement rights were canceled due to the performance condition. The acquisition rate for the 2008 Plan was 60%. |
F-70
The restricted shares, which are bought back by the Company on the market, are finally granted to their beneficiaries after a2-year vesting period from the date of the grant. The final grant is subject to a continued employment condition and a performance condition. Moreover, the transfer of the restricted shares finally granted will not be permitted until the end of a2-year mandatory holding period from the date of the final grant.
The continued employment condition states that the termination of the employment contract during the vesting period will also terminate the grantee’s right to a restricted share grant.
For the 2010 Plan, the Board of Directors decided that, for each beneficiary of more than 100 shares, half of the shares in excess of this number will be finally granted subject to a performance condition. This condition is based on the average ROE calculated by the Group based on TOTAL’s consolidated balance sheet and statement of income for fiscal years 2010 and 2011. The acquisition rate:
| | • | is equal to zero if the average ROE is less than or equal to 7%; | • | varies on a straight-line basis between 0% and 100% if the average ROE is greater than 7% and less than 18%; and | • | is equal to 100% if the average ROE is greater than or equal to 18%. |
For the 2009 Plan, the Board of Directors decided that, for each beneficiary of more than 100 shares, half of the shares in excess of this number will be finally granted subject to a performance condition. This condition states that the number of shares finally granted is based on the average ROE as published by the Group and calculated based on the Group’s consolidated balance sheet and statement of income for fiscal years 2009 and 2010. The acquisition rate:
| | • | is equal to zero if the average ROE is less than or equal to 7%; | • | varies on a straight-line basis between 0% and 100% if the average ROE is greater than 7% and less than 18%; and | • | is equal to 100% if the average ROE is greater than or equal to 18%. |
For the 2008 Plan, the Board of Directors decided that, for each beneficiary, the shares will be finally granted subject to a performance condition. This performance condition states that the number of restricted shares finally granted is based on the ROE of the Group. The ROE is calculated based on the consolidated accounts published by TOTAL for the fiscal year preceding the final grant. This acquisition rate:
| | • | is equal to zero if the ROE is less than or equal to 10%; | • | varies on a straight-line basis between 0% and 80% if the ROE is greater than 10% and less than 18%; | • | varies on a straight-line basis between 80% and 100% if the ROE is greater than or equal to 18% and less than 30%; and | • | is equal to 100% if the ROE is greater than or equal to 30%. |
Due to the application of the performance condition, the acquisition rate was 60% for the 2008 Plan.
As a consequence, entitlement rights to 1,094,914 shares were canceled.
| | E. | GLOBAL FREE TOTAL SHARE PLAN |
The Board of Directors approved at its meeting on May 21, 2010 the implementation and conditions of a global free share plan intended for the Group employees, that is more than 100,000 employees in 124 countries. On June 30, 2010, entitlement rights to 25 free shares were granted to every employee. The final grant is subject to a continued employment condition during the plan’s vesting period. The shares are not subject to any performance condition. 1,508,850 shares were awarded to employees from countries with a 2+2 scheme(2-year vesting period followed by2-year of mandatory holding period) and 1,070,650 shares were awarded to employees in countries with a 4+0 scheme(4-year vesting period and no mandatory holding period), representing a total of 2,579,500 shares. Following the vesting period, the shares awarded will be new shares.
F-71
| | | | | | | | | | | | | | | | | 2010 Plan
| | | 2010 Plan
| | | | | | | | (2+2) | | | (4+0) | | | Total | | Date of the shareholders’ meeting | | | 05/16/2008 | | | | 05/16/2008 | | | | | | Grant date(a) | | | 06/30/2010 | | | | 06/30/2010 | | | | | | Final grant date (end of the vesting period) | | | 07/01/2012 | | | | 07/01/2014 | | | | | | Transfer possible from | | | 07/01/2014 | | | | 07/01/2014 | | | | | | | | | | | | | | | | | | | | Number of free shares | | | | | | | | | | | | | Outstanding as of January 1, 2008 | | | | | | | | | | | | | | Awarded | | | | | | | | | | | | | | Canceled | | | | | | | | | | | | | | Finally granted | | | | | | | | | | | | | Outstanding as of January 1, 2009 | | | | | | | | | | | | | | Awarded | | | | | | | | | | | | | | Canceled | | | | | | | | | | | | | | Finally granted | | | | | | | | | | | | | Outstanding as of January 1, 2010 | | | | | | | | | | | | | | Awarded | | | 1,508,850 | | | | 1,070,650 | | | | 2,579,500 | | | Canceled | | | (125 | ) | | | (75 | ) | | | (200 | ) | Finally granted(b) | | | (75 | ) | | | — | | | | (75 | ) | Outstanding as of December 31, 2010 | | | 1,508,650 | | | | 1,070,575 | | | | 2,579,225 | | | | | | | | | | | | | | | |
| | | (a) | | The June 30, 2010, grant was decided by the Board of Directors on May 21, 2010. | (b) | | Final grant following the death or disability of the beneficiary of the shares. |
| | F. | SHARE-BASED PAYMENT EXPENSE |
Share-based payment expense before tax for the year 2010 amounts to €140 million and can be broken down as follows:
| | • | €31 million for TOTAL share subscription plans; and | • | €109 million for TOTAL restricted shares plans. |
Share-based payment expense before tax for the year 2009 amounts to €106 million and can be broken down as follows:
| | • | €38 million for TOTAL share subscription plans; and | • | €68 million for TOTAL restricted shares plans. |
Share-based payment expense before tax for the year 2008 amounted to €154 million and can be broken down as follows:
| | • | €61 million for TOTAL share subscription plans; | • | €105 million for TOTAL restricted shares plans; and | • | €(12) million for the adjustment to the expense booked in 2007 related to TOTAL capital increase reserved for employees (see Note 17 to the Consolidated Financial Statements). |
The fair value of the options granted in 2010, 2009 and 2008 has been measured according to the Black-Scholes method and based on the following assumptions:
| | | | | | | | | | | | | | | For the year ended December 31, | | 2010 | | | 2009 | | | 2008 | | Risk free interest rate (%)(a) | | | 2.1 | | | | 2.9 | | | | 4.3 | | Expected dividends (%)(b) | | | 5.9 | | | | 4.8 | | | | 8.4 | | Expected volatility (%)(c) | | | 25.0 | | | | 31.0 | | | | 32.7 | | | Vesting period (years) | | | 2 | | | | 2 | | | | 2 | | | Exercise period (years) | | | 8 | | | | 8 | | | | 8 | | | Fair value of the granted options (€ per option) | | | 5.8 | | | | 8.4 | | | | 5.0 | | | | | | | | | | | | | | | |
| | | (a) | | Zero coupon Euro swap rate at 6 years. |
| | | (b) | | The expected dividends are based on the price of TOTAL share derivatives traded on the markets. | (c) | | The expected volatility is based on the implied volatility of TOTAL share options and of share indices options traded on the markets. |
At the shareholders’ meeting held on May 21, 2010, the shareholders delegated to the Board of Directors the authority to increase the share capital of the Company in one or more transactions and within a maximum period of 26 months from the date of the meeting, by an amount not exceeding 1.5% of the share capital outstanding on the date of the meeting of the Board of Directors at which a decision to proceed with an issuance is made reserving subscriptions for such issuance to the Group employees participating in a company savings plan. It is being specified that the amount of any such capital increase reserved for Group employees was counted against the F-72
aggregate maximum nominal amount of share capital increases authorized by the shareholders’ meeting held on May 21, 2010 for issuing new ordinary shares or other securities granting immediate or future access to the Company’s share capital with preferential subscription rights (€(€2.5 billion in nominal value).Pursuant to this delegation of authorization, the Board of Directors, during its October 28, 2010 meeting, decided to proceed with a capital increase reserved for employees in 2011 within the limit of 12 million shares with dividend rights as of January 1, 2010 and delegated to the Chairman and Chief Executive Officer all powers to determine the opening and closing of the subscription period and the subscription price. On March 14, 2011, the Chairman and Chief Executive Officer decided that the subscription period would be set from March 16, 2011 to April 1, 2011 included, and acknowledged that the subscription price per ordinary share would be set at€34.80. With respect to this capital increase, 8,902,717 TOTAL shares were subscribed and created on April 28, 2011. Share cancellation Pursuant to the authorization granted by the shareholders’ meeting held on May 11, 2007 authorizing reduction of capital by cancellation of shares held by the Company within the limit of 10% of the outstanding capital every 24 months, the Board of Directors decided on July 30, 2009 to cancel 24,800,000 shares acquired in 2008 at an average price of€49.28 per share. Treasury shares (TOTAL shares held by TOTAL S.A.) As of December 31, 2011, TOTAL S.A. holds 9,222,905 of its own shares, representing 0.39% of its share capital, detailed as follows: 6,712,528 shares allocated to TOTAL share grant plans for Group employees; 2,510,377 shares intended to be allocated to new TOTAL share purchase option plans or to new share grant plans. These shares are deducted from the consolidated shareholders’ equity. As of December 31, 2010, TOTAL S.A. held 12,156,411 of its own shares, representing 0.52% of its share capital, detailed as follows: 6,012,460 shares allocated to TOTAL share grant plans for Group employees; 6,143,951 shares intended to be allocated to new TOTAL share purchase option plans or to new share grant plans. These shares were deducted from the consolidated shareholders’ equity. As of December 31, 2009, TOTAL S.A. held 15,075,922 of its own shares, representing 0.64% of its share capital, detailed as follows: 6,017,499 shares allocated to covering TOTAL share purchase option plans for Group employees and executive officers; 5,799,400 shares allocated to TOTAL share grant plans for Group employees; and 3,259,023 shares intended to be allocated to new TOTAL share purchase option plans or to new share grant plans. These shares were deducted from the consolidated shareholders’ equity. TOTAL shares held by Group subsidiaries As of December 31, 2011, 2010 and 2009, TOTAL S.A. held indirectly through its subsidiaries 100,331,268 of its own shares, representing 4.24% of its share capital as of December 31, 2011, 4.27% of its share capital as of December 31, 2010 and 4.27% of its share capital as of December 31, 2009 detailed as follows: 2,023,672 shares held by a consolidated subsidiary, Total Nucléaire, 100% indirectly controlled by TOTAL S.A.; and 98,307,596 shares held by subsidiaries of Elf Aquitaine (Financière Valorgest, Sogapar and Fingestval), 100% indirectly controlled by TOTAL S.A. These shares are deducted from the consolidated shareholders’ equity. Dividend TOTAL S.A. paid on May 26, 2011 the balance of the dividend of€1.14 per share for the 2010 fiscal year (the ex-dividend date was May 23, 2011). In addition, TOTAL S.A. paid two quarterly interim dividends for the fiscal year 2011: The first quarterly interim dividend of€0.57 per share for the fiscal year 2011, decided by the Board of Directors on April 28, 2011, was paid on September 22, 2011 (the ex-dividend date was September 19, 2011); The second quarterly interim dividend of€0.57 per share for the fiscal year 2011, decided by the Board of Directors on July 28, 2011, was paid on December 22, 2011 (the ex-dividend date was December 19, 2011). The Board of Directors, during its October 27, 2011 meeting, decided to set the third quarterly interim dividend for the fiscal year 2011 at€0.57 per share. This interim dividend will be paid on March 22, 2012 (the ex-dividend date will be March 19, 2012). A resolution will be submitted at the shareholders’ meeting on May 11, 2012 to pay a dividend of€2.28 per share for the 2011 fiscal year, i.e. a balance of€0.57 per share to be distributed after deducting the three quarterly interim dividends of€0.57 per share that will have already been paid. Paid-in surplus In accordance with French law, the paid-in surplus corresponds to share premiums of the parent company which can be capitalized or used to offset losses if the legal reserve has reached its minimum required level. The amount of the paid-in surplus may also be distributed subject to taxation unless the unrestricted reserves of the parent company are distributed prior to this item. As of December 31, 2011, paid-in surplus amounted to€27,655 million (€27,208 million as of December 31, 2010 and€27,171 million as of December 31, 2009). Reserves Under French law, 5% of net income must be transferred to the legal reserve until the legal reserve reaches 10% of the nominal value of the share capital. This reserve cannot be distributed to the shareholders other than upon liquidation but can be used to offset losses. If wholly distributed, the unrestricted reserves of the parent company would be taxed for an approximate amount of€539 million as of December 31, 2011 (€514 million as of December 31, 2010 and as of December 31, 2009). Other comprehensive income Detail of other comprehensive income showing items reclassified from equity to net income is presented in the table below: | | | | | | | | | | | | | | | | | | | | | | | | | | For the year ended December 31, (M€) | | 2011 | | | 2010 | | | 2009 | | Currency translation adjustment | | | | | | | 1,498 | | | | | | | | 2,231 | | | | | | | | (244 | ) | — Unrealized gain/(loss) of the period | | | 1,435 | | | | | | | | 2,234 | | | | | | | | (243 | ) | | | | | — Less gain/(loss) included in net income | | | (63 | ) | | | | | | | 3 | | | | | | | | 1 | | | | | | Available for sale financial assets | | | | | | | 337 | | | | | | | | (100 | ) | | | | | | | 38 | | — Unrealized gain/(loss) of the period | | | 382 | | | | | | | | (50 | ) | | | | | | | 38 | | | | | | — Less gain/(loss) included in net income | | | 45 | | | | | | | | 50 | | | | | | | | — | | | | | | Cash flow hedge | | | | | | | (84 | ) | | | | | | | (80 | ) | | | | | | | 128 | | — Unrealized gain/(loss) of the period | | | (131 | ) | | | | | | | (195 | ) | | | | | | | 349 | | | | | | — Less gain/(loss) included in net income | | | (47 | ) | | | | | | | (115 | ) | | | | | | | 221 | | | | | | | | | | | | | Share of other comprehensive income of equity affiliates, net amount | | | | | | | (15 | ) | | | | | | | 302 | | | | | | | | 234 | | Other | | | | | | | (2 | ) | | | | | | | (7 | ) | | | | | | | (5 | ) | — Unrealized gain/(loss) of the period | | | (2 | ) | | | | | | | (7 | ) | | | | | | | (5 | ) | | | | | — Less gain/(loss) included in net income | | | — | | | | | | | | — | | | | | | | | — | | | | | | Tax effect | | | | | | | (55 | ) | | | | | | | 28 | | | | | | | | (38 | ) | Total other comprehensive income, net amount | | | | | | | 1,679 | | | | | | | | 2,374 | | | | | | | | 113 | |
Tax effects relating to each component of other comprehensive income are as follows: | | | | | | | | | | | | | | | | | | | | | | | | | | | | | | | | | | | | | | | | 2011 | | | 2010 | | | 2009 | | For the year ended
December 31, (M€) | | Pre-tax
amount | | | Tax
effect | | | Net
amount | | | Pre-tax
amount | | | Tax
effect | | | Net
amount | | | Pre-tax
amount | | | Tax
effect | | | Net
amount | | Currency translation adjustment | | | 1,498 | | | | — | | | | 1,498 | | | | 2,231 | | | | — | | | | 2,231 | | | | (244 | ) | | | — | | | | (244 | ) | Available for sale financial assets | | | 337 | | | | (93 | ) | | | 244 | | | | (100 | ) | | | 2 | | | | (98 | ) | | | 38 | | | | 4 | | | | 42 | | Cash flow hedge | | | (84 | ) | | | 38 | | | | (46 | ) | | | (80 | ) | | | 26 | | | | (54 | ) | | | 128 | | | | (42 | ) | | | 86 | | Share of other comprehensive income of equity affiliates, net amount | | | (15 | ) | | | — | | | | (15 | ) | | | 302 | | | | — | | | | 302 | | | | 234 | | | | — | | | | 234 | | Other | | | (2 | ) | | | — | | | | (2 | ) | | | (7 | ) | | | — | | | | (7 | ) | | | (5 | ) | | | — | | | | (5 | ) | Total other comprehensive income | | | 1,734 | | | | (55 | ) | | | 1,679 | | | | 2,346 | | | | 28 | | | | 2,374 | | | | 151 | | | | (38 | ) | | | 113 | |
18)EMPLOYEE BENEFITS OBLIGATIONS Liabilities for employee benefits obligations consist of the following: | | | | | | | | | | | | | | As of December 31, (M€) | | 2011 | | | 2010 | | | 2009 | | Pension benefits liabilities | | | 1,268 | | | | 1,268 | | | | 1,236 | | Other benefits liabilities | | | 620 | | | | 605 | | | | 592 | | Restructuring reserves (early retirement plans) | | | 344 | | | | 298 | | | | 212 | | Total | | | 2,232 | | | | 2,171 | | | | 2,040 | |
The Group’s main defined benefit pension plans are located in France, in the United Kingdom, in the United States, in Belgium and in Germany. Their main characteristics are the following: The benefits are usually based on the final salary and seniority; They are usually funded (pension fund or insurer); and They are closed to new employees who benefit from defined contribution pension plans. The pension benefits include also termination indemnities and early retirement benefits. The other benefits are the employer contribution to post-employment medical care. The fair value of the defined benefit obligation and plan assets in the Consolidated Financial Statements is detailed as follows: | | | | | | | | | | | | | | | | | | | | | | | | | | | | Pension benefits | | | Other benefits | | | As of December 31, (M€) | | 2011 | | | 2010 | | | 2009 | | | 2011 | | | 2010 | | | 2009 | | Change in benefit obligation | | | | | | | | | | | | | | | | | | | | | | | | | Benefit obligation at beginning of year | | | 8,740 | | | | 8,169 | | | | 7,405 | | | | 623 | | | | 547 | | | | 544 | | Service cost | | | 163 | | | | 159 | | | | 134 | | | | 13 | | | | 11 | | | | 10 | | Interest cost | | | 420 | | | | 441 | | | | 428 | | | | 28 | | | | 29 | | | | 30 | | Curtailments | | | (24 | ) | | | (4 | ) | | | (5 | ) | | | (1 | ) | | | (3 | ) | | | (1 | ) | Settlements | | | (111 | ) | | | (60 | ) | | | (3 | ) | | | — | | | | — | | | | — | | Special termination benefits | | | — | | | | — | | | | — | | | | — | | | | 1 | | | | — | | Plan participants’ contributions | | | 9 | | | | 11 | | | | 10 | | | | — | | | | — | | | | — | | Benefits paid | | | (451 | ) | | | (471 | ) | | | (484 | ) | | | (34 | ) | | | (33 | ) | | | (33 | ) | Plan amendments | | | 33 | | | | 28 | | | | 118 | | | | 4 | | | | 1 | | | | (2 | ) | Actuarial losses (gains) | | | 435 | | | | 330 | | | | 446 | | | | (9 | ) | | | 57 | | | | — | | Foreign currency translation and other | | | 108 | | | | 137 | | | | 120 | | | | 4 | | | | 13 | | | | (1 | ) | Benefit obligation at year-end | | | 9,322 | | | | 8,740 | | | | 8,169 | | | | 628 | | | | 623 | | | | 547 | | Change in fair value of plan assets | | | | | | | | | | | | | | | | | | | | | | | | | Fair value of plan assets at beginning of year | | | (6,809 | ) | | | (6,286 | ) | | | (5,764 | ) | | | — | | | | — | | | | — | | Expected return on plan assets | | | (385 | ) | | | (396 | ) | | | (343 | ) | | | — | | | | — | | | | — | | Actuarial losses (gains) | | | 155 | | | | (163 | ) | | | (317 | ) | | | — | | | | — | | | | — | | Settlements | | | 80 | | | | 56 | | | | 2 | | | | — | | | | — | | | | — | | Plan participants’ contributions | | | (9 | ) | | | (11 | ) | | | (10 | ) | | | — | | | | — | | | | — | | Employer contributions | | | (347 | ) | | | (269 | ) | | | (126 | ) | | | — | | | | — | | | | — | | Benefits paid | | | 386 | | | | 394 | | | | 396 | | | | — | | | | — | | | | — | | Foreign currency translation and other | | | (99 | ) | | | (134 | ) | | | (124 | ) | | | — | | | | — | | | | — | | Fair value of plan assets at year-end | | | (7,028 | ) | | | (6,809 | ) | | | (6,286 | ) | | | — | | | | — | | | | — | | Unfunded status | | | 2,294 | | | | 1,931 | | | | 1,883 | | | | 628 | | | | 623 | | | | 547 | | Unrecognized prior service cost | | | (78 | ) | | | (105 | ) | | | (153 | ) | | | 9 | | | | 10 | | | | 15 | | Unrecognized actuarial (losses) gains | | | (1,713 | ) | | | (1,170 | ) | | | (1,045 | ) | | | (17 | ) | | | (28 | ) | | | 30 | | Asset ceiling | | | 10 | | | | 9 | | | | 9 | | | | — | | | | — | | | | — | | Net recognized amount | | | 513 | | | | 665 | | | | 694 | | | | 620 | | | | 605 | | | | 592 | | Pension benefits and other benefits liabilities | | | 1,268 | | | | 1,268 | | | | 1,236 | | | | 620 | | | | 605 | | | | 592 | | Other non-current assets | | | (755 | ) | | | (603 | ) | | | (542 | ) | | | — | | | | — | | | | — | |
As of December 31, 2011, the fair value of pension benefits and other pension benefits which are entirely or partially funded amounts to€8,277 million and the present value of the unfunded benefits amounts to€1,673 million (against€7,727 million and€1,636 million respectively as of December 31, 2010 and€7,206 million and€1,510 million respectively as of December 31, 2009). The experience actuarial (gains) losses related to the defined benefit obligation and the fair value of plan assets are as follows: | | | | | | | | | | | | | | | | | | | | | | For the year ended December 31, (M€) | | 2011 | | | 2010 | | | 2009 | | | 2008 | | | 2007 | | Experience actuarial (gains) losses related to the defined benefit obligation | | | (58 | ) | | | (54 | ) | | | (108 | ) | | | 12 | | | | 80 | | Experience actuarial (gains) losses related to the fair value of plan assets | | | 155 | | | | (163 | ) | | | (317 | ) | | | 1,099 | | | | 140 | |
| | | | | | | | | | | | | | | | | | | | | | As of December 31, (M€) | | 2011 | | | 2010 | | | 2009 | | | 2008 | | | 2007 | | Pension benefits | | | | | | | | | | | | | | | | | | | | | Benefit obligation | | | 9,322 | | | | 8,740 | | | | 8,169 | | | | 7,405 | | | | 8,129 | | Fair value of plan assets | | | (7,028 | ) | | | (6,809 | ) | | | (6,286 | ) | | | (5,764 | ) | | | (6,604 | ) | Unfunded status | | | 2,294 | | | | 1,931 | | | | 1,883 | | | | 1,641 | | | | 1,525 | | Other benefits | | | | | | | | | | | | | | | | | | | | | Benefits obligation | | | 628 | | | | 623 | | | | 547 | | | | 544 | | | | 583 | | Fair value of plan assets | | | — | | | | — | | | | — | | | | — | | | | — | | Unfunded status | | | 628 | | | | 623 | | | | 547 | | | | 544 | | | | 583 | |
The Group expects to contribute€182 million to its pension plans in 2012. | | | | | | | | | | Estimated future payments (M€) | | Pension benefits | | | Other benefits | | 2012 | | | 479 | | | | 35 | | 2013 | | | 467 | | | | 35 | | 2014 | | | 505 | | | | 35 | | 2015 | | | 511 | | | | 35 | | 2016 | | | 512 | | | | 37 | | 2017-2021 | | | 2,767 | | | | 191 | |
| | | | | | | | | | | | | | Asset allocation | | Pension benefits | | | As of December 31, | | 2011 | | | 2010 | | | 2009 | | Equity securities | | | 29 | % | | | 34 | % | | | 31% | | Debt securities | | | 64 | % | | | 60 | % | | | 62% | | Monetary | | | 4 | % | | | 3 | % | | | 3% | | Real estate | | | 3 | % | | | 3 | % | | | 4% | |
The Group’s assumptions of expected returns on assets are built up by asset class and by country based on long-term bond yields and risk premiums. The discount rate retained corresponds to the rate of prime corporate bonds according to a benchmark per country of different market data on the closing date. | | | | | | | | | | | | | | | | | | | | | | | | | | | Assumptions used to determine benefits
obligations | | | | Pension benefits | | | Other benefits | | | As of December 31, | | | | 2011 | | | 2010 | | | 2009 | | | 2011 | | | 2010 | | | 2009 | | Discount rate (weighted average for all regions) | | | | | 4.61 | % | | | 5.01 | % | | | 5.41 | % | | | 4.70 | % | | | 5.00 | % | | | 5.60% | | | | Of which Euro zone | | | 4.21 | % | | | 4.58 | % | | | 5.12 | % | | | 4.25 | % | | | 4.55 | % | | | 5.18% | | | | Of which United States | | | 5.00 | % | | | 5.49 | % | | | 6.00 | % | | | 4.97 | % | | | 5.42 | % | | | 5.99% | | | | Of which United Kingdom | | | 4.75 | % | | | 5.50 | % | | | 5.50 | % | | | — | | | | — | | | | — | | Average expected rate of salary increase | | | | | 4.69 | % | | | 4.55 | % | | | 4.50 | % | | | — | | | | — | | | | — | | Expected rate of healthcare inflation | | | | | | | | | | | | | | | | | | | | | | | | | | | — initial rate | | | | | — | | | | — | | | | — | | | | 4.82 | % | | | 4.82 | % | | | 4.91% | | — ultimate rate | | | | | — | | | | — | | | | — | | | | 3.77 | % | | | 3.75 | % | | | 3.79% | | | | | | | Assumptions used to determine the net periodic
benefit cost (income) | | | | Pension benefits | | | Other benefits | | | For the year ended December 31, | | | | 2011 | | | 2010 | | | 2009 | | | 2011 | | | 2010 | | | 2009 | | Discount rate (weighted average for all regions) | | | | | 5.01 | % | | | 5.41 | % | | | 5.93 | % | | | 5.00 | % | | | 5.60 | % | | | 6.00% | | | | Of which Euro zone | | | 4.58 | % | | | 5.12 | % | | | 5.72 | % | | | 4.55 | % | | | 5.18 | % | | | 5.74% | | | | Of which United States | | | 5.49 | % | | | 6.00 | % | | | 6.23 | % | | | 5.42 | % | | | 5.99 | % | | | 6.21% | | | | Of which United Kingdom | | | 5.50 | % | | | 5.50 | % | | | 6.00 | % | | | — | | | | — | | | | 6.00% | | Average expected rate of salary increase | | | | | 4.55 | % | | | 4.50 | % | | | 4.56 | % | | | — | | | | — | | | | — | | Expected return on plan assets | | | | | 5.90 | % | | | 6.39 | % | | | 6.14 | % | | | — | | | | — | | | | — | | Expected rate of healthcare inflation | | | | | | | | | | | | | | | | | | | | | | | | | | | — initial rate | | | | | — | | | | — | | | | — | | | | 4.82 | % | | | 4.91 | % | | | 4.88% | | — ultimate rate | | | | | — | | | | — | | | | — | | | | 3.75 | % | | | 3.79 | % | | | 3.64% | |
A 0.5% increase or decrease in discount rates — all other things being equal — would have the following approximate impact: | | | | | | | | | | (M€) | | 0.5% increase | | | 0.5% decrease | | Benefit obligation as of December 31, 2011 | | | (513 | ) | | | 551 | | 2012 net periodic benefit cost (income) | | | (41 | ) | | | 56 | |
A 0.5% increase or decrease in expected return on plan assets rate — all other things being equal — would have an impact of€31 million on 2012 net periodic benefit cost (income). The components of the net periodic benefit cost (income) in 2011, 2010 and 2009 are: | | | | | | | | | | | | | | | | | | | | | | | | | | | | Pension benefits | | | Other benefits | | | For the year ended December 31, (M€) | | 2011 | | | 2010 | | | 2009 | | | 2011 | | | 2010 | | | 2009 | | Service cost | | | 163 | | | | 159 | | | | 134 | | | | 13 | | | | 11 | | | | 10 | | Interest cost | | | 420 | | | | 441 | | | | 428 | | | | 28 | | | | 29 | | | | 30 | | Expected return on plan assets | | | (385 | ) | | | (396 | ) | | | (343 | ) | | | — | | | | — | | | | — | | Amortization of prior service cost | | | 58 | | | | 74 | | | | 13 | | | | 2 | | | | (5 | ) | | | (7 | ) | Amortization of actuarial losses (gains) | | | 46 | | | | 66 | | | | 50 | | | | — | | | | (4 | ) | | | (6 | ) | Asset ceiling | | | 2 | | | | (3 | ) | | | 4 | | | | — | | | | — | | | | — | | Curtailments | | | (22 | ) | | | (3 | ) | | | (4 | ) | | | (1 | ) | | | (3 | ) | | | (1 | ) | Settlements | | | (9 | ) | | | 7 | | | | (1 | ) | | | — | | | | — | | | | — | | Special termination benefits | | | — | | | | — | | | | — | | | | — | | | | 1 | | | | — | | Net periodic benefit cost (income) | | | 273 | | | | 345 | | | | 281 | | | | 42 | | | | 29 | | | | 26 | |
A positive or negative change of one-percentage-point in the healthcare inflation rate would have the following approximate impact: | | | | | | | | | | (M€) | | 1% point
increase | | | 1% point
decrease | | Benefit obligation as of December 31, 2011 | | | 53 | | | | (63 | ) | 2011 net periodic benefit cost (income) | | | 5 | | | | (5 | ) |
19)PROVISIONS AND OTHER NON-CURRENT LIABILITIES | | | | | | | | | | | | | | As of December 31, (M€) | | 2011 | | | 2010 | | | 2009 | | Litigations and accrued penalty claims | | | 572 | | | | 485 | | | | 423 | | Provisions for environmental contingencies | | | 600 | | | | 644 | | | | 623 | | Asset retirement obligations | | | 6,884 | | | | 5,917 | | | | 5,469 | | Other non-current provisions | | | 1,099 | | | | 1,116 | | | | 1,331 | | Other non-current liabilities | | | 1,754 | | | | 936 | | | | 1,535 | | Total | | | 10,909 | | | | 9,098 | | | | 9,381 | |
In 2011, litigation reserves mainly include a provision covering risks concerning antitrust investigations related to Arkema amounting to€17 million as of December 31, 2011. Other risks and commitments that give rise to contingent liabilities are described in Note 32 to the Consolidated Financial Statements. In 2011, other non-current provisions mainly include: The contingency reserve related to the Toulouse-AZF plant explosion (civil liability) for€21 million as of December 31, 2011; Provisions related to restructuring activities in the Downstream and Chemicals segments for€211 million as of December 31, 2011; and The contingency reserve related to the Buncefield depot explosion (civil liability) for€80 million as of December 31, 2011. In 2011, other non-current liabilities mainly include debts (whose maturity is more than one year) related to fixed assets acquisitions. This heading is mainly composed of a€991 million debt related to the acquisition of an interest in the liquids-rich area of the Utica shale play (see Note 3 to the Consolidated Financial Statements). In 2010, litigation reserves mainly included a provision covering risks concerning antitrust investigations related to Arkema amounting to€17 million as of December 31, 2010. Other risks and commitments that give rise to contingent liabilities are described in Note 32 to the Consolidated Financial Statements. In 2010, other non-current provisions mainly included: The contingency reserve related to the Toulouse-AZF plant explosion (civil liability) for€31 million as of December 31, 2010; Provisions related to restructuring activities in the Downstream and Chemicals segments for€261 million as of December 31, 2010; and The contingency reserve related to the Buncefield depot explosion (civil liability) for€194 million as of December 31, 2010. In 2010, other non-current liabilities mainly included debts (whose maturity is more than one year) related to fixed assets acquisitions. In 2009, litigation reserves mainly included a provision covering risks concerning antitrust investigations related to Arkema amounting to€43 million as of December 31, 2009. Other risks and commitments that give rise to contingent liabilities are described in Note 32 to the Consolidated Financial Statements. In 2009, other non-current provisions mainly included: The contingency reserve related to the Toulouse-AZF plant explosion (civil liability) for€40 million as of December 31, 2009; Provisions related to restructuring activities in the Downstream and Chemicals segments for€130 million as of December 31, 2009; and The contingency reserve related to the Buncefield depot explosion (civil liability) for€295 million as of December 31, 2009. In 2009, other non-current liabilities mainly included debts (whose maturity is more than one year) related to fixed assets acquisitions. This heading was mainly composed of a€818 million debt related to Chesapeake acquisition (see Note 3 to the Consolidated Financial Statements). Changes in provisions and other non-current liabilities Changes in provisions and other non-current liabilities are as follows: | | | | | | | | | | | | | | | | | | | | | | | | | | (M€) | | As of
January 1, | | | Allowances | | | Reversals | | | Currency
translation
adjustment | | | Other | | | As of
December 31, | | 2011 | | | 9,098 | | | | 921 | | | | (798 | ) | | | 227 | | | | 1,461 | | | | 10,909 | | 2010 | | | 9,381 | | | | 1,052 | | | | (971 | ) | | | 497 | | | | (861 | ) | | | 9,098 | | 2009 | | | 7,858 | | | | 1,254 | | | | (1,413 | ) | | | 202 | | | | 1,480 | | | | 9,381 | |
Allowances In 2011, allowances of the period (€921 million) mainly include: Asset retirement obligations for€344 million (accretion); Environmental contingencies for€100 million in the Downstream and Chemicals segments ; and Provisions related to restructuring of activities for€79 million. In 2010, allowances of the period (€1,052 million) mainly included: Asset retirement obligations for€338 million (accretion); Environmental contingencies for€88 million in the Downstream and Chemicals segments ; The contingency reserve related to the Buncefield depot explosion (civil liability) for€79 million ; and Provisions related to restructuring of activities for€226 million. In 2009, allowances of the period (€1,254 million) mainly included: Asset retirement obligations for€283 million (accretion); Environmental contingencies for€147 million in the Downstream and Chemicals segments; The contingency reserve related to the Buncefield depot explosion (civil liability) for€223 million; and Provisions related to restructuring of activities for€121 million. Reversals In 2011, reversals of the period (€798 million) are mainly related to the following incurred expenses: Provisions for asset retirement obligations for€189 million; Environmental contingencies written back for€70 million; The contingency reserve related to the Toulouse-AZF plant explosion (civil liability), written back for€10 million; The contingency reserve related to the Buncefield depot explosion (civil liability), written back for€116 million; and Provisions for restructuring and social plans written back for€164 million. In 2010, reversals of the period (€971 million) were mainly related to the following incurred expenses: Provisions for asset retirement obligations for€214 million; €26 million for litigation reserves in connection with antitrust investigations; Environmental contingencies written back for€66 million; The contingency reserve related to the Toulouse-AZF plant explosion (civil liability), written back for€9 million; The contingency reserve related to the Buncefield depot explosion (civil liability), written back for€190 million; and Provisions for restructuring and social plans written back for€60 million. In 2009, reversals of the period (€1,413 million) were mainly related to the following incurred expenses: Provisions for asset retirement obligations for€191 million; €52 million for litigation reserves in connection with antitrust investigations; Environmental contingencies written back for€86 million; The contingency reserve related to the Toulouse-AZF plant explosion (civil liability), written back for€216 million; The contingency reserve related to the Buncefield depot explosion (civil liability), written back for€375 million; and Provisions for restructuring and social plans written back for€28 million. Changes in the asset retirement obligation Changes in the asset retirement obligation are as follows: | | | | | | | | | | | | | | | | | | | | | | | | | | | | | | | | | | (M€) | | As of
January 1, | | | Accretion | | | Revision in
estimates | | | New
obligations | | | Spending
on existing
obligations | | | Currency
translation
adjustment | | | Other | | | As of
December 31, | | 2011 | | | 5,917 | | | | 344 | | | | 330 | | | | 323 | | | | (189 | ) | | | 150 | | | | 9 | | | | 6,884 | | 2010 | | | 5,469 | | | | 338 | | | | 79 | | | | 175 | | | | (214 | ) | | | 316 | | | | (246 | ) | | | 5,917 | | 2009 | | | 4,500 | | | | 283 | | | | 447 | | | | 179 | | | | (191 | ) | | | 232 | | | | 19 | | | | 5,469 | |
20)FINANCIAL DEBT AND RELATED FINANCIAL INSTRUMENTS | A) | | NON-CURRENT FINANCIAL DEBT AND RELATED FINANCIAL INSTRUMENTS |
| | | | | | | | | | | | | As of December 31, 2011 (M€)
(Assets) / Liabilities | | Secured | | | Unsecured | | | Total | | Non-current financial debt | | | 349 | | | | 22,208 | | | | 22,557 | | of which hedging instruments of non-current financial debt (liabilities) | | | — | | | | 146 | | | | 146 | | Hedging instruments of non-current financial debt (assets)(a) | | | — | | | | (1,976 | ) | | | (1,976 | ) | Non-current financial debt — net of hedging instruments | | | 349 | | | | 20,232 | | | | 20,581 | | Bonds after fair value hedge | | | — | | | | 15,148 | | | | 15,148 | | Fixed rate bonds and bonds after cash flow hedge | | | — | | | | 4,424 | | | | 4,424 | | Bank and other, floating rate | | | 129 | | | | 446 | | | | 575 | | Bank and other, fixed rate | | | 76 | | | | 206 | | | | 282 | | Financial lease obligations | | | 144 | | | | 8 | | | | 152 | | Non-current financial debt — net of hedging instruments | | | 349 | | | | 20,232 | | | | 20,581 | |
| (a) | See the description of these hedging instruments in Notes 1 paragraph M(iii) “Long-term financing”, 28 and 29 to the Consolidated Financial Statements. |
| | | | | | | | | | | | | As of December 31, 2010 (M€)
(Assets) / Liabilities | | Secured | | | Unsecured | | | Total | | Non-current financial debt | | | 287 | | | | 20,496 | | | | 20,783 | | of which hedging instruments of non-current financial debt (liabilities) | | | — | | | | 178 | | | | 178 | | Hedging instruments of non-current financial debt (assets)(a) | | | — | | | | (1,870 | ) | | | (1,870 | ) | Non-current financial debt — net of hedging instruments | | | 287 | | | | 18,626 | | | | 18,913 | | Bonds after fair value hedge | | | — | | | | 15,491 | | | | 15,491 | | Fixed rate bonds and bonds after cash flow hedge | | | — | | | | 2,836 | | | | 2,836 | | Bank and other, floating rate | | | 47 | | | | 189 | | | | 236 | | Bank and other, fixed rate | | | 65 | | | | 110 | | | | 175 | | Financial lease obligations | | | 175 | | | | — | | | | 175 | | Non-current financial debt — net of hedging instruments | | | 287 | | | | 18,626 | | | | 18,913 | |
| (a) | See the description of these hedging instruments in Notes 1 paragraph M(iii) “Long-term financing”, 28 and 29 to the Consolidated Financial Statements. |
| | | | | | | | | | | | | As of December 31, 2009 (M€)
(Assets) / Liabilities | | Secured | | | Unsecured | | | Total | | Non-current financial debt | | | 312 | | | | 19,125 | | | | 19,437 | | of which hedging instruments of non-current financial debt (liabilities) | | | — | | | | 241 | | | | 241 | | Hedging instruments of non-current financial debt (assets)(a) | | | — | | | | (1,025 | ) | | | (1,025 | ) | Non-current financial debt — net of hedging instruments | | | 312 | | | | 18,100 | | | | 18,412 | | Bonds after fair value hedge | | | — | | | | 15,884 | | | | 15,884 | | Fixed rate bonds and bonds after cash flow hedge | | | — | | | | 1,700 | | | | 1,700 | | Bank and other, floating rate | | | 60 | | | | 379 | | | | 439 | | Bank and other, fixed rate | | | 50 | | | | 79 | | | | 129 | | Financial lease obligations | | | 202 | | | | 58 | | | | 260 | | Non-current financial debt — net of hedging instruments | | | 312 | | | | 18,100 | | | | 18,412 | |
| (a) | See the description of these hedging instruments in Notes 1 paragraph M(iii) “Long-term financing”, 28 and 29 to the Consolidated Financial Statements. |
Fair value of bonds, as of December 31, 2011, after taking into account currency and interest rates swaps, is detailed as follows: | | | | | | | | | | | | | | | | | | | | | | | | | | | Bonds after fair value
hedge (M€) | | Year of
issue | | | Fair value
after hedging
as of
December 31,
2011 | | | Fair value
after hedging
as of
December 31,
2010 | | | Fair value
after hedging
as of
December 31,
2009 | | | Currency | | | Maturity | | | Initial rate
before
hedging
instruments | Parent company | | | | | | | | | | | | | | | | | | | | | | | | | | | Bond | | | 1998 | | | | 129 | | | | 125 | | | | 116 | | | | FRF | | | | 2013 | | | 5.000% | Bond | | | 2000 | | | | — | | | | — | | | | 61 | | | | EUR | | | | 2010 | | | 5.650% | Current portion (less than one year) | | | | | | | — | | | | — | | | | (61 | ) | | | | | | | | | | | Total parent company | | | | | | | 129 | | | | 125 | | | | 116 | | | | | | | | | | | |
| | | | | | | | | | | | | | | | | | | | | | | | | | | Bonds after fair value
hedge (M€) | | Year of
issue | | | Fair value
after hedging
as of
December 31,
2011 | | | Fair value
after hedging
as of
December 31,
2010 | | | Fair value
after hedging
as of
December 31,
2009 | | | Currency | | | Maturity | | | Initial rate before hedging instruments | TOTAL CAPITAL(a) | | | | | | | | | | | | | | | | | | | | | | | | | | | Bond | | | 2002 | | | | 15 | | | | 15 | | | | 14 | | | | USD | | | | 2012 | | | 5.890% | Bond | | | 2003 | | | | — | | | | — | | | | 160 | | | | CHF | | | | 2010 | | | 2.385% | Bond | | | 2003 | | | | 23 | | | | 22 | | | | 21 | | | | USD | | | | 2013 | | | 4.500% | Bond | | | 2004 | | | | — | | | | — | | | | 53 | | | | CAD | | | | 2010 | | | 4.000% | Bond | | | 2004 | | | | — | | | | — | | | | 113 | | | | CHF | | | | 2010 | | | 2.385% | Bond | | | 2004 | | | | — | | | | — | | | | 438 | | | | EUR | | | | 2010 | | | 3.750% | Bond | | | 2004 | | | | — | | | | — | | | | 322 | | | | GBP | | | | 2010 | | | 4.875% | Bond | | | 2004 | | | | — | | | | — | | | | 128 | | | | GBP | | | | 2010 | | | 4.875% | Bond | | | 2004 | | | | — | | | | — | | | | 185 | | | | GBP | | | | 2010 | | | 4.875% | Bond | | | 2004 | | | | — | | | | 57 | | | | 53 | | | | AUD | | | | 2011 | | | 5.750% | Bond | | | 2004 | | | | — | | | | 116 | | | | 107 | | | | CAD | | | | 2011 | | | 4.875% |
| | | | | | | | | | | | | | | | | | | | | | | | | | | Bonds after fair value
hedge (M€) | | Year of
issue | | | Fair value
after hedging
as of
December 31,
2011 | | | Fair value
after hedging
as of
December 31,
2010 | | | Fair value
after hedging
as of
December 31,
2009 | | | Currency | | | Maturity | | | Initial rate before hedging instruments | Bond | | | 2004 | | | | — | | | | 235 | | | | 203 | | | | USD | | | | 2011 | | | 4.125% | Bond | | | 2004 | | | | — | | | | 75 | | | | 69 | | | | USD | | | | 2011 | | | 4.125% | Bond | | | 2004 | | | | 129 | | | | 125 | | | | 116 | | | | CHF | | | | 2012 | | | 2.375% | Bond | | | 2004 | | | | 52 | | | | 51 | | | | 47 | | | | NZD | | | | 2014 | | | 6.750% | Bond | | | 2005 | | | | — | | | | 57 | | | | 53 | | | | AUD | | | | 2011 | | | 5.750% | Bond | | | 2005 | | | | — | | | | 60 | | | | 56 | | | | CAD | | | | 2011 | | | 4.000% | Bond | | | 2005 | | | | — | | | | 120 | | | | 112 | | | | CHF | | | | 2011 | | | 1.625% | Bond | | | 2005 | | | | — | | | | 226 | | | | 226 | | | | CHF | | | | 2011 | | | 1.625% | Bond | | | 2005 | | | | — | | | | 139 | | | | 144 | | | | USD | | | | 2011 | | | 4.125% | Bond | | | 2005 | | | | 63 | | | | 63 | | | | 63 | | | | AUD | | | | 2012 | | | 5.750% | Bond | | | 2005 | | | | 200 | | | | 194 | | | | 180 | | | | CHF | | | | 2012 | | | 2.135% | Bond | | | 2005 | | | | 65 | | | | 65 | | | | 65 | | | | CHF | | | | 2012 | | | 2.135% | Bond | | | 2005 | | | | 97 | | | | 97 | | | | 97 | | | | CHF | | | | 2012 | | | 2.375% | Bond | | | 2005 | | | | 404 | | | | 391 | | | | 363 | | | | EUR | | | | 2012 | | | 3.250% | Bond | | | 2005 | | | | 57 | | | | 57 | | | | 57 | | | | NZD | | | | 2012 | | | 6.500% | Bond | | | 2006 | | | | — | | | | — | | | | 75 | | | | GBP | | | | 2010 | | | 4.875% | Bond | | | 2006 | | | | — | | | | — | | | | 50 | | | | EUR | | | | 2010 | | | 3.750% | Bond | | | 2006 | | | | — | | | | — | | | | 50 | | | | EUR | | | | 2010 | | | 3.750% | Bond | | | 2006 | | | | — | | | | — | | | | 100 | | | | EUR | | | | 2010 | | | 3.750% | Bond | | | 2006 | | | | — | | | | 42 | | | | 42 | | | | EUR | | | | 2011 | | | EURIBOR
3 months +0.040% | Bond | | | 2006 | | | | — | | | | 300 | | | | 300 | | | | EUR | | | | 2011 | | | 3.875% | Bond | | | 2006 | | | | — | | | | 150 | | | | 150 | | | | EUR | | | | 2011 | | | 3.875% | Bond | | | 2006 | | | | — | | | | 300 | | | | 300 | | | | EUR | | | | 2011 | | | 3.875% | Bond | | | 2006 | | | | — | | | | 120 | | | | 120 | | | | USD | | | | 2011 | | | 5.000% | Bond | | | 2006 | | | | — | | | | 300 | | | | 300 | | | | EUR | | | | 2011 | | | 3.875% | Bond | | | 2006 | | | | — | | | | 472 | | | | 472 | | | | USD | | | | 2011 | | | 5.000% | Bond | | | 2006 | | | | 62 | | | | 62 | | | | 62 | | | | AUD | | | | 2012 | | | 5.625% | Bond | | | 2006 | | | | 72 | | | | 72 | | | | 72 | | | | CAD | | | | 2012 | | | 4.125% | Bond | | | 2006 | | | | 100 | | | | 100 | | | | 100 | | | | EUR | | | | 2012 | | | 3.250% | Bond | | | 2006 | | | | 74 | | | | 74 | | | | 74 | | | | GBP | | | | 2012 | | | 4.625% | Bond | | | 2006 | | | | 100 | | | | 100 | | | | 100 | | | | EUR | | | | 2012 | | | 3.250% | Bond | | | 2006 | | | | 125 | | | | 125 | | | | 125 | | | | CHF | | | | 2013 | | | 2.510% | Bond | | | 2006 | | | | 127 | | | | 127 | | | | 127 | | | | CHF | | | | 2014 | | | 2.635% | Bond | | | 2006 | | | | 130 | | | | 130 | | | | 130 | | | | CHF | | | | 2016 | | | 2.385% | Bond | | | 2006 | | | | 65 | | | | 65 | | | | 65 | | | | CHF | | | | 2016 | | | 2.385% | Bond | | | 2006 | | | | 64 | | | | 64 | | | | 64 | | | | CHF | | | | 2016 | | | 2.385% | Bond | | | 2006 | | | | 63 | | | | 63 | | | | 63 | | | | CHF | | | | 2016 | | | 2.385% | Bond | | | 2006 | | | | 129 | | | | 129 | | | | 129 | | | | CHF | | | | 2018 | | | 3.135% | Bond | | | 2007 | | | | — | | | | — | | | | 60 | | | | CHF | | | | 2010 | | | 2.385% | Bond | | | 2007 | | | | — | | | | — | | | | 74 | | | | GBP | | | | 2010 | | | 4.875% | Bond | | | 2007 | | | | — | | | | 77 | | | | 77 | | | | USD | | | | 2011 | | | 5.000% | Bond | | | 2007 | | | | 370 | | | | 370 | | | | 370 | | | | USD | | | | 2012 | | | 5.000% | Bond | | | 2007 | | | | 222 | | | | 222 | | | | 222 | | | | USD | | | | 2012 | | | 5.000% | Bond | | | 2007 | | | | 61 | | | | 61 | | | | 61 | | | | AUD | | | | 2012 | | | 6.500% | Bond | | | 2007 | | | | 72 | | | | 72 | | | | 72 | | | | CAD | | | | 2012 | | | 4.125% | Bond | | | 2007 | | | | 71 | | | | 71 | | | | 71 | | | | GBP | | | | 2012 | | | 4.625% | Bond | | | 2007 | | | | 300 | | | | 300 | | | | 300 | | | | EUR | | | | 2013 | | | 4.125% | Bond | | | 2007 | | | | 73 | | | | 73 | | | | 73 | | | | GBP | | | | 2013 | | | 5.500% | Bond | | | 2007 | | | | 306 | | | | 306 | | | | 306 | | | | GBP | | | | 2013 | | | 5.500% | Bond | | | 2007 | | | | 72 | | | | 72 | | | | 72 | | | | GBP | | | | 2013 | | | 5.500% | Bond | | | 2007 | | | | 248 | | | | 248 | | | | 248 | | | | CHF | | | | 2014 | | | 2.635% | Bond | | | 2007 | | | | 31 | | | | 31 | | | | 31 | | | | JPY | | | | 2014 | | | 1.505% | Bond | | | 2007 | | | | 61 | | | | 61 | | | | 61 | | | | CHF | | | | 2014 | | | 2.635% | Bond | | | 2007 | | | | 49 | | | | 49 | | | | 49 | | | | JPY | | | | 2014 | | | 1.723% | Bond | | | 2007 | | | | 121 | | | | 121 | | | | 121 | | | | CHF | | | | 2015 | | | 3.125% | Bond | | | 2007 | | | | 300 | | | | 300 | | | | 300 | | | | EUR | | | | 2017 | | | 4.700% | Bond | | | 2007 | | | | 76 | | | | 76 | | | | 76 | | | | CHF | | | | 2018 | | | 3.135% |
| | | December 31, | | | | December 31, | | | | December 31, | | | | December 31, | | | | December 31, | | | | December 31, | | | December 31, | Bonds after fair value
hedge (M€) | | Year of
issue | | | Fair value
after hedging
as of
December 31,
2011 | | | Fair value
after hedging
as of
December 31,
2010 | | | Fair value
after hedging
as of
December 31,
2009 | | | Currency | | | Maturity | | | Initial rate before hedging instruments | Bond | | | 2007 | | | | 60 | | | | 60 | | | | 60 | | | | CHF | | | | 2018 | | | 3.135% | Bond | | | 2008 | | | | — | | | | — | | | | 63 | | | | GBP | | | | 2010 | | | 4.875% | Bond | | | 2008 | | | | — | | | | — | | | | 66 | | | | GBP | | | | 2010 | | | 4.875% | Bond | | | 2008 | | | | — | | | | 92 | | | | 92 | | | | AUD | | | | 2011 | | | 7.500% | Bond | | | 2008 | | | | — | | | | 100 | | | | 100 | | | | EUR | | | | 2011 | | | 3.875% | Bond | | | 2008 | | | | — | | | | 150 | | | | 150 | | | | EUR | | | | 2011 | | | 3.875% | Bond | | | 2008 | | | | — | | | | 50 | | | | 50 | | | | EUR | | | | 2011 | | | 3.875% | Bond | | | 2008 | | | | — | | | | 50 | | | | 50 | | | | EUR | | | | 2011 | | | 3.875% | Bond | | | 2008 | | | | — | | | | 60 | | | | 60 | | | | JPY | | | | 2011 | | | EURIBOR
6 months
+ 0.018% | Bond | | | 2008 | | | | — | | | | 102 | | | | 102 | | | | USD | | | | 2011 | | | 3.750% | Bond | | | 2008 | | | | 62 | | | | 62 | | | | 62 | | | | CHF | | | | 2012 | | | 2.135% | Bond | | | 2008 | | | | 124 | | | | 124 | | | | 124 | | | | CHF | | | | 2012 | | | 3.635% | Bond | | | 2008 | | | | 46 | | | | 46 | | | | 46 | | | | CHF | | | | 2012 | | | 2.385% | Bond | | | 2008 | | | | 92 | | | | 92 | | | | 92 | | | | CHF | | | | 2012 | | | 2.385% | Bond | | | 2008 | | | | 64 | | | | 64 | | | | 64 | | | | CHF | | | | 2012 | | | 2.385% | Bond | | | 2008 | | | | 50 | | | | 50 | | | | 50 | | | | EUR | | | | 2012 | | | 3.250% | Bond | | | 2008 | | | | 63 | | | | 63 | | | | 63 | | | | GBP | | | | 2012 | | | 4.625% | Bond | | | 2008 | | | | 63 | | | | 63 | | | | 63 | | | | GBP | | | | 2012 | | | 4.625% | Bond | | | 2008 | | | | 63 | | | | 63 | | | | 63 | | | | GBP | | | | 2012 | | | 4.625% | Bond | | | 2008 | | | | 62 | | | | 62 | | | | 62 | | | | NOK | | | | 2012 | | | 6.000% | Bond | | | 2008 | | | | 69 | | | | 69 | | | | 69 | | | | USD | | | | 2012 | | | 5.000% | Bond | | | 2008 | | | | 60 | | | | 60 | | | | 60 | | | | AUD | | | | 2013 | | | 7.500% | Bond | | | 2008 | | | | 61 | | | | 61 | | | | 61 | | | | AUD | | | | 2013 | | | 7.500% | Bond | | | 2008 | | | | 128 | | | | 127 | | | | 127 | | | | CHF | | | | 2013 | | | 3.135% | Bond | | | 2008 | | | | 62 | | | | 62 | | | | 62 | | | | CHF | | | | 2013 | | | 3.135% | Bond | | | 2008 | | | | 200 | | | | 200 | | | | 200 | | | | EUR | | | | 2013 | | | 4.125% | Bond | | | 2008 | | | | 100 | | | | 100 | | | | 100 | | | | EUR | | | | 2013 | | | 4.125% | Bond | | | 2008 | | | | 1,000 | | | | 1,000 | | | | 1,000 | | | | EUR | | | | 2013 | | | 4.750% | Bond | | | 2008 | | | | 63 | | | | 63 | | | | 63 | | | | GBP | | | | 2013 | | | 5.500% | Bond | | | 2008 | | | | 149 | | | | 149 | | | | 149 | | | | JPY | | | | 2013 | | | EURIBOR
6 months
+ 0.008% | Bond | | | 2008 | | | | 191 | | | | 191 | | | | 191 | | | | USD | | �� | | 2013 | | | 4.000% | Bond | | | 2008 | | | | 61 | | | | 61 | | | | 61 | | | | CHF | | | | 2015 | | | 3.135% | Bond | | | 2008 | | | | 62 | | | | 62 | | | | 62 | | | | CHF | | | | 2015 | | | 3.135% | Bond | | | 2008 | | | | 61 | | | | 61 | | | | 61 | | | | CHF | | | | 2015 | | | 3.135% | Bond | | | 2008 | | | | 62 | | | | 62 | | | | 62 | | | | CHF | | | | 2018 | | | 3.135% | Bond | | | 2009 | | | | 56 | | | | 56 | | | | 56 | | | | AUD | | | | 2013 | | | 5.500% | Bond | | | 2009 | | | | 54 | | | | 54 | | | | 54 | | | | AUD | | | | 2013 | | | 5.500% | Bond | | | 2009 | | | | 236 | | | | 236 | | | | 236 | | | | CHF | | | | 2013 | | | 2.500% | Bond | | | 2009 | | | | 77 | | | | 77 | | | | 77 | | | | USD | | | | 2013 | | | 4.000% | Bond | | | 2009 | | | | 131 | | | | 131 | | | | 131 | | | | CHF | | | | 2014 | | | 2.625% | Bond | | | 2009 | | | | 998 | | | | 997 | | | | 998 | | | | EUR | | | | 2014 | | | 3.500% | Bond | | | 2009 | | | | 150 | | | | 150 | | | | 150 | | | | EUR | | | | 2014 | | | 3.500% | Bond | | | 2009 | | | | 40 | | | | 40 | | | | 40 | | | | HKD | | | | 2014 | | | 3.240% | Bond | | | 2009 | | | | 107 | | | | 103 | | | | 96 | | | | AUD | | | | 2015 | | | 6.000% | Bond | | | 2009 | | | | 550 | | | | 550 | | | | 550 | | | | EUR | | | | 2015 | | | 3.625% | Bond | | | 2009 | | | | 684 | | | | 684 | | | | 684 | | | | USD | | | | 2015 | | | 3.125% | Bond | | | 2009 | | | | 232 | | | | 224 | | | | 208 | | | | USD | | | | 2015 | | | 3.125% | Bond | | | 2009 | | | | 99 | | | | 99 | | | | 99 | | | | CHF | | | | 2016 | | | 2.385% | Bond | | | 2009 | | | | 115 | | | | 115 | | | | 115 | | | | GBP | | | | 2017 | | | 4.250% | Bond | | | 2009 | | | | 225 | | | | 225 | | | | 225 | | | | GBP | | | | 2017 | | | 4.250% | Bond | | | 2009 | | | | 448 | | | | 448 | | | | 448 | | | | EUR | | | | 2019 | | | 4.875% | Bond | | | 2009 | | | | 69 | | | | 69 | | | | 69 | | | | HKD | | | | 2019 | | | 4.180% | Bond | | | 2009 | | | | — | | | | 374 | | | | 347 | | | | USD | | | | 2021 | | | 4.250% | Bond | | | 2010 | | | | 105 | | | | 102 | | | | — | | | | AUD | | | | 2014 | | | 5.750% |
| | | December 31, | | | | December 31, | | | | December 31, | | | | December 31, | | | | December 31, | | | | December 31, | | | December 31, | Bonds after fair value
hedge (M€) | | Year of
issue | | | Fair value
after hedging
as of
December 31,
2011 | | | Fair value
after hedging
as of
December 31,
2010 | | | Fair value
after hedging
as of
December 31,
2009 | | | Currency | | | Maturity | | | Initial rate before hedging instruments | Bond | | | 2010 | | | | 111 | | | | 108 | | | | — | | | | CAD | | | | 2014 | | | 2.500% | Bond | | | 2010 | | | | 54 | | | | 53 | | | | — | | | | NZD | | | | 2014 | | | 4.750% | Bond | | | 2010 | | | | 193 | | | | 187 | | | | — | | | | USD | | | | 2015 | | | 2.875% | Bond | | | 2010 | | | | 966 | | | | 935 | | | | — | | | | USD | | | | 2015 | | | 3.000% | Bond | | | 2010 | | | | 70 | | | | 68 | | | | — | | | | AUD | | | | 2015 | | | 6.000% | Bond | | | 2010 | | | | 71 | | | | 69 | | | | — | | | | AUD | | | | 2015 | | | 6.000% | Bond | | | 2010 | | | | 64 | | | | 64 | | | | — | | | | AUD | | | | 2015 | | | 6.000% | Bond | | | 2010 | | | | 773 | | | | 748 | | | | — | | | | USD | | | | 2016 | | | 2.300% | Bond | | | 2010 | | | | 491 | | | | 476 | | | | — | | | | EUR | | | | 2022 | | | 3.125% | Bond | | | 2011 | | | | 116 | | | | — | | | | — | | | | USD | | | | 2016 | | | 6.500% | Bond | | | 2011 | | | | 597 | | | | — | | | | — | | | | USD | | | | 2018 | | | 3.875% | Current portion (less than one year) | | | | | | | (2 992 | ) | | | (3 450 | ) | | | (1,937 | ) | | | | | | | | | | | Total TOTAL CAPITAL | | | | | | | 12,617 | | | | 15,143 | | | | 15,615 | | | | | | | | | | | | TOTAL CAPITAL CANADA Ltd.(b) | | | | | | | | | | | | | | | | | | | | | | | | | | | Bond | | | 2011 | | | | 565 | | | | — | | | | — | | | | CAD | | | | 2014 | | | 1.625% | Bond | | | 2011 | | | | 565 | | | | — | | | | — | | | | CAD | | | | 2014 | | | USLIBOR
3 months
+ 0.38 % | Bond | | | 2011 | | | | 75 | | | | — | | | | — | | | | CAD | | | | 2014 | | | 5.750% | Bond | | | 2011 | | | | 738 | | | | — | | | | — | | | | CAD | | | | 2013 | | | USLIBOR
3 months
+ 0.09 % | Bond | | | 2011 | | | | 82 | | | | — | | | | — | | | | CAD | | | | 2016 | | | 4.000% | Bond | | | 2011 | | | | 69 | | | | — | | | | — | | | | CAD | | | | 2016 | | | 3.625% | Current portion (less than one year) | | | | | | | — | | | | — | | | | — | | | | | | | | | | | | Total TOTAL CAPITAL CANADA Ltd | | | | | | | 2,094 | | | | | | | | | | | | | | | | | | | | TOTAL CAPITAL INTERNATIONAL(c) | | | | | | | — | | | | — | | | | — | | | | | | | | | | | | Other consolidated subsidiaries | | | | | | | 308 | | | | 223 | | | | 153 | | | | | | | | | | | | Total bonds after fair value hedge | | | | | | | 15,148 | | | | 15,491 | | | | 15,884 | | | | | | | | | | | |
| | | December 31, | | | | December 31, | | | | December 31, | | | | December 31, | | | | December 31, | | | | December 31, | | | | December 31, | | Bonds after cash flow
hedge and fix rate
bonds
(€ million) | | Year of
issue | | | Amount after
hedging as of
December 31,
2011 | | | Amount after
hedging as of
December 31,
2010 | | | Amount after
hedging as of
December 31,
2009 | | | Currency | | | Maturity | | | Initial rate
before hedging
instruments | | TOTAL CAPITAL(a) | | | | | | | | | | | | | | | | | | | | | | | | | | | | | Bond | | | 2005 | | | | 294 | | | | 293 | | | | 292 | | | | GBP | | | | 2012 | | | | 4.625 | % | Bond | | | 2009 | | | | 744 | | | | 691 | | | | 602 | | | | EUR | | | | 2019 | | | | 4.875 | % | Bond | | | 2009 | | | | 386 | | | | — | | | | — | | | | USD | | | | 2021 | | | | 4.250 | % | Bond | | | 2009 | | | | 1,016 | | | | 917 | | | | 806 | | | | EUR | | | | 2024 | | | | 5.125 | % | Bond | | | 2010 | | | | 966 | | | | 935 | | | | — | | | | USD | | | | 2020 | | | | 4.450 | % | Bond | | | 2011 | | | | 386 | | | | — | | | | — | | | | USD | | | | 2021 | | | | 4.125 | % | Current portion (less than one year) | | | | | | | (294 | ) | | | — | | | | — | | | | | | | | | | | | | | Total TOTAL CAPITAL | | | | | | | 3,498 | | | | 2,836 | | | | 1,700 | | | | | | | | | | | | | | Other consolidated subsidiaries(d) | | | | | | | 926 | | | | — | | | | — | | | | | | | | | | | | | | Total Bonds after cash flow hedge | | | | | | | 4,424 | | | | 2,836 | | | | 1,700 | | | | | | | | | | | | | |
| (a) | TOTAL CAPITAL is a wholly-owned indirect subsidiary of TOTAL S.A. (with the exception of one share held by each member of its Board of Directors). It acts as a financing vehicle for the Group. Its debt securities are fully and unconditionally guaranteed by TOTAL S.A. as to payment of principal, premium, if any, interest and any other amounts due. |
| (b) | TOTAL CAPITAL CANADA Ltd. is a wholly-owned direct subsidiary of TOTAL S.A. It acts as a financing vehicle for the activities of the Group in Canada. Its debt securities are fully and unconditionally guaranteed by TOTAL S.A. as to payment of principal, premium, if any, interest and any other amounts due. |
| (c) | TOTAL CAPITAL INTERNATIONAL is a wholly-owned direct subsidiary of TOTAL S.A. It acts as a financing vehicle for the Group. Its debt securities are fully and unconditionally guaranteed by TOTAL S.A. as to payment of principal, premium, if any, interest and any other amounts due. |
| (d) | This amount includes SunPower’s convertible bonds for an amount of€355 million. |
Loan repayment schedule (excluding current portion) | | | | | | | | | | | | | | | | | | | | | As of December 31, 2011
(M€) | | Non-current financial
debt | | | of which hedging
instruments of
non-current financial
debt (liabilities) | | | Hedging instruments
of non-current
financial debt (assets) | | | Non-current financial
debt - net of hedging
instruments | | | % | | 2013 | | | 5,021 | | | | 80 | | | | (529 | ) | | | 4,492 | | | | 22% | | 2014 | | | 4,020 | | | | 3 | | | | (390 | ) | | | 3,630 | | | | 18% | | 2015 | | | 4,070 | | | | 6 | | | | (456 | ) | | | 3,614 | | | | 18% | | 2016 | | | 1,712 | | | | 9 | | | | (193 | ) | | | 1,519 | | | | 7% | | 2017 and beyond | | | 7,734 | | | | 48 | | | | (408 | ) | | | 7,326 | | | | 35% | | Total | | | 22,557 | | | | 146 | | | | (1,976 | ) | | | 20,581 | | | | 100% | | | | | | | | | As of December 31, 2010
(M€) | | Non-current financial
debt | | | of which hedging
instruments of
non-current financial
debt (liabilities) | | | Hedging instruments
of non-current
financial debt (assets) | | | Non-current financial
debt - net of hedging
instruments | | | % | | 2012 | | | 3,756 | | | | 34 | | | | (401 | ) | | | 3,355 | | | | 18% | | 2013 | | | 4,017 | | | | 76 | | | | (473 | ) | | | 3,544 | | | | 19% | | 2014 | | | 2,508 | | | | 1 | | | | (290 | ) | | | 2,218 | | | | 12% | | 2015 | | | 3,706 | | | | 2 | | | | (302 | ) | | | 3,404 | | | | 18% | | 2016 and beyond | | | 6,796 | | | | 65 | | | | (404 | ) | | | 6,392 | | | | 33% | | Total | | | 20,783 | | | | 178 | | | | (1,870 | ) | | | 18,913 | | | | 100% | | | | | | | | | As of December 31, 2009
(M€) | | Non-current financial
debt | | | of which hedging
instruments of
non-current financial
debt (liabilities) | | | Hedging instruments
of non-current
financial debt (assets) | | | Non-current financial
debt - net of hedging
instruments | | | % | | 2011 | | | 3,857 | | | | 42 | | | | (199 | ) | | | 3,658 | | | | 20% | | 2012 | | | 3,468 | | | | 48 | | | | (191 | ) | | | 3,277 | | | | 18% | | 2013 | | | 3,781 | | | | 95 | | | | (236 | ) | | | 3,545 | | | | 19% | | 2014 | | | 2,199 | | | | 6 | | | | (90 | ) | | | 2,109 | | | | 11% | | 2015 and beyond | | | 6,132 | | | | 50 | | | | (309 | ) | | | 5,823 | | | | 32% | | Total | | | 19,437 | | | | 241 | | | | (1,025 | ) | | | 18,412 | | | | 100% | |
Analysis by currency and interest rate These analyses take into account interest rate and foreign currency swaps to hedge non-current financial debt. | | | | | | | | | | | | | | | | | | | | | | | | | | As of December 31, (M€) | | 2011 | | | % | | | 2010 | | | % | | | 2009 | | | % | | U.S. Dollar | | | 8,645 | | | | 42% | | | | 7,248 | | | | 39% | | | | 3,962 | | | | 21% | | Euro | | | 9,582 | | | | 47% | | | | 11,417 | | | | 60% | | | | 14,110 | | | | 77% | | Other currencies | | | 2,354 | | | | 11% | | | | 248 | | | | 1% | | | | 340 | | | | 2% | | Total | | | 20,581 | | | | 100% | | | | 18,913 | | | | 100% | | | | 18,412 | | | | 100% | |
| | | | | | | | | | | | | | | | | | | | | | | | | | As of December 31, (M€) | | 2011 | | | % | | | 2010 | | | % | | | 2009 | | | % | | Fixed rate | | | 4,854 | | | | 24% | | | | 3,177 | | | | 17% | | | | 2,064 | | | | 11% | | Floating rate | | | 15,727 | | | | 76% | | | | 15,736 | | | | 83% | | | | 16,348 | | | | 89% | | Total | | | 20,581 | | | | 100% | | | | 18,913 | | | | 100% | | | | 18,412 | | | | 100% | |
| B) | | CURRENT FINANCIAL ASSETS AND LIABILITIES |
Current borrowings consist mainly of commercial papers or treasury bills or draws on bank loans. These instruments bear interest at rates that are close to market rates. | | | | | | | | | | | | | | As of December 31, (M€) | | 2011 | | | 2010 | | | 2009 | | (Assets) / Liabilities | | | | | | | | | | | | | Current financial debt(a) | | | 5,819 | | | | 5,867 | | | | 4,761 | | Current portion of non-current financial debt | | | 3,856 | | | | 3,786 | | | | 2,233 | | Current borrowings(note 28) | | | 9,675 | | | | 9,653 | | | | 6,994 | | Current portion of hedging instruments of debt (liabilities) | | | 40 | | | | 12 | | | | 97 | | Other current financial instruments (liabilities) | | | 127 | | | | 147 | | | | 26 | | Other current financial liabilities(note 28) | | | 167 | | | | 159 | | | | 123 | | Current deposits beyond three months | | | (101 | ) | | | (869 | ) | | | (55 | ) | Current portion of hedging instruments of debt (assets) | | | (383 | ) | | | (292 | ) | | | (197 | ) | Other current financial instruments (assets) | | | (216 | ) | | | (44 | ) | | | (59 | ) | Current financial assets(note 28) | | | (700 | ) | | | (1,205 | ) | | | (311 | ) | Current borrowings and related financial assets and liabilities, net | | | 9,142 | | | | 8,607 | | | | 6,806 | |
| (a) | As of December 31, 2011 and as of December 31, 2010, the current financial debt includes a commercial paper program in Total Capital Canada Ltd. Total Capital Canada Ltd. is a wholly-owned direct subsidiary of TOTAL S.A. It acts as a financing vehicle for the activities of the Group in Canada. Its debt securities are fully and unconditionally guaranteed by TOTAL S.A. as to payment of principal, premium, if any, interest and any other amounts due. |
| C) | | NET-DEBT-TO-EQUITY RATIO |
For its internal and external communication needs, the Group calculates a debt ratio by dividing its net financial debt by equity. Adjusted shareholders’ equity for the year ended December 31, 2011 is calculated after payment of a dividend of€2.28 per share, subject to approval by the shareholders’ meeting on May 11, 2012. The net-debt-to-equity ratio is calculated as follows: | | | | | | | | | | | | | | As of December 31, (M€) | | 2011 | | | 2010 | | | 2009 | | (Assets) / Liabilities | | | | | | | | | | | | | Current borrowings | | | 9,675 | | | | 9,653 | | | | 6,994 | | Other current financial liabilities | | | 167 | | | | 159 | | | | 123 | | Current financial assets | | | (700 | ) | | | (1,205 | ) | | | (311 | ) | Non-current financial debt | | | 22,557 | | | | 20,783 | | | | 19,437 | | Hedging instruments on non-current financial debt | | | (1,976 | ) | | | (1,870 | ) | | | (1,025 | ) | Cash and cash equivalents | | | (14,025 | ) | | | (14,489 | ) | | | (11,662 | ) | Net financial debt | | | 15,698 | | | | 13,031 | | | | 13,556 | | Shareholders’ equity — Group share | | | 68,037 | | | | 60,414 | | | | 52,552 | | Distribution of the income based on existing shares at the closing date | | | (1,255 | ) | | | (2,553 | ) | | | (2,546 | ) | Non-controlling interests | | | 1,352 | | | | 857 | | | | 987 | | Adjusted shareholders’ equity | | | 68,134 | | | | 58,718 | | | | 50,993 | | Net-debt-to-equity ratio | | | 23.0% | | | | 22.2% | | | | 26.6% | |
21)OTHER CREDITORS AND ACCRUED LIABILITIES | | | | | | | | | | | | | | As of December 31, (M€) | | 2011 | | | 2010 | | | 2009 | | Accruals and deferred income | | | 231 | | | | 184 | | | | 223 | | Payable to States (including taxes and duties) | | | 8,040 | | | | 7,235 | | | | 6,024 | | Payroll | | | 1,062 | | | | 996 | | | | 955 | | Other operating liabilities | | | 5,441 | | | | 3,574 | | | | 4,706 | | Total | | | 14,774 | | | | 11,989 | | | | 11,908 | |
As of December 31, 2011, the heading “Other operating liabilities” mainly includes the third quarterly interim dividend for the fiscal year 2011 for€1,317 million. This interim dividend will be paid on March 2012. As of December 31, 2009, the heading “Other operating liabilities” mainly included€744 million related to Chesapeake acquisition (see Note 3 to the Consolidated Financial Statements). 22)LEASE CONTRACTS The Group leases real estate, retail stations, ships, and other equipments (see Note 11 to the Consolidated Financial Statements). The future minimum lease payments on operating and finance leases to which the Group is committed are shown as follows: | | | | | | | | | For the year ended December 31,
2011 (M€) | | Operating
leases | | | Finance
leases | | 2012 | | | 762 | | | | 41 | | 2013 | | | 552 | | | | 40 | | 2014 | | | 416 | | | | 37 | | 2015 | | | 335 | | | | 36 | | 2016 | | | 316 | | | | 34 | | 2017 and beyond | | | 940 | | | | 20 | | Total minimum payments | | | 3,321 | | | | 208 | | Less financial expenses | | | — | | | | (31 | ) | Nominal value of contracts | | | — | | | | 177 | | Less current portion of finance lease contracts | | | — | | | | (25 | ) | Outstanding liability of finance lease contracts | | | — | | | | 152 | |
| | | | | | | | | For the year ended December 31,
2010 (M€) | | Operating
leases | | | Finance
leases | | 2011 | | | 582 | | | | 39 | | 2012 | | | 422 | | | | 39 | | 2013 | | | 335 | | | | 39 | |
| | | | | | | | | For the year ended December 31,
2010 (M€) | | Operating
leases | | | Finance
leases | | 2014 | | | 274 | | | | 35 | | 2015 | | | 230 | | | | 35 | | 2016 and beyond | | | 1,105 | | | | 54 | | Total minimum payments | | | 2,948 | | | | 241 | | Less financial expenses | | | — | | | | (43 | ) | Nominal value of contracts | | | — | | | | 198 | | Less current portion of finance lease contracts | | | — | | | | (23 | ) | Outstanding liability of finance lease contracts | | | — | | | | 175 | |
| | | | | | | | | For the year ended December 31,
2009 (M€) | | Operating
leases | | | Finance
leases | | 2010 | | | 523 | | | | 42 | | 2011 | | | 377 | | | | 43 | | 2012 | | | 299 | | | | 42 | | 2013 | | | 243 | | | | 41 | | 2014 | | | 203 | | | | 39 | | 2015 and beyond | | | 894 | | | | 128 | | Total minimum payments | | | 2,539 | | | | 335 | | Less financial expenses | | | — | | | | (53 | ) | Nominal value of contracts | | | — | | | | 282 | | Less current portion of finance lease contracts | | | — | | | | (22 | ) | Outstanding liability of finance lease contracts | | | — | | | | 260 | |
Net rental expense incurred under operating leases for the year ended December 31, 2011 is€645 million (against€605 million in 2010 and€613 million in 2009). 23)COMMITMENTS AND CONTINGENCIES | | | | | | | | | | | | | | | | | | | | Maturity and installments | | As of December 31, 2011 (M€) | | Total | | | Less than
1 year | | | Between 1
and 5 years | | | More than
5 years | | Non-current debt obligations net of hedging instruments(Note 20) | | | 20,429 | | | | — | | | | 13,121 | | | | 7,308 | | Current portion of non-current debt obligations net of hedging instruments(Note 20) | | | 3,488 | | | | 3,488 | | | | — | | | | — | | Finance lease obligations(Note 22) | | | 177 | | | | 25 | | | | 134 | | | | 18 | | Asset retirement obligations(Note 19) | | | 6,884 | | | | 272 | | | | 804 | | | | 5,808 | | Contractual obligations recorded in the balance sheet | | | 30,978 | | | | 3,785 | | | | 14,059 | | | | 13,134 | | Operating lease obligations (Note 22) | | | 3,321 | | | | 762 | | | | 1,619 | | | | 940 | | Purchase obligations | | | 77,353 | | | | 11,049 | | | | 20,534 | | | | 45,770 | | Contractual obligations not recorded in the balance sheet | | | 80,674 | | | | 11,811 | | | | 22,153 | | | | 46,710 | | Total of contractual obligations | | | 111,652 | | | | 15,596 | | | | 36,212 | | | | 59,844 | | Guarantees given for excise taxes | | | 1,765 | | | | 1,594 | | | | 73 | | | | 98 | | Guarantees given against borrowings | | | 4,778 | | | | 3,501 | | | | 323 | | | | 954 | | Indemnities related to sales of businesses | | | 39 | | | | — | | | | 34 | | | | 5 | | Guarantees of current liabilities | | | 376 | | | | 262 | | | | 35 | | | | 79 | | Guarantees to customers / suppliers | | | 3,265 | | | | 1,634 | | | | 57 | | | | 1,574 | | Letters of credit | | | 2,408 | | | | 1,898 | | | | 301 | | | | 209 | | Other operating commitments | | | 2,477 | | | | 433 | | | | 697 | | | | 1,347 | | Total of other commitments given | | | 15,108 | | | | 9,322 | | | | 1,520 | | | | 4,266 | | Mortgages and liens received | | | 408 | | | | 7 | | | | 119 | | | | 282 | | Goods and services sale obligations(a) | | | 62,216 | | | | 4,221 | | | | 17,161 | | | | 40,834 | | Other commitments received | | | 6,740 | | | | 4,415 | | | | 757 | | | | 1,568 | | Total of commitments received | | | 69,364 | | | | 8,643 | | | | 18,037 | | | | 42,684 | |
| (a) | As from December 31, 2011, the Group discloses its goods and services sale obligations. |
| | | | | | | | | | | | | | | | | | | | Maturity and installments | | | As of December 31, 2010 (M€) | | Total | | | Less than
1 year | | | Between 1
and 5 years | | | More than
5 years | | Non-current debt obligations net of hedging instruments(Note 20) | | | 18,738 | | | | — | | | | 12,392 | | | | 6,346 | | Current portion of non-current debt obligations net of hedging instruments(Note 20) | | | 3,483 | | | | 3,483 | | | | — | | | | — | | Finance lease obligations(Note 22) | | | 198 | | | | 23 | | | | 129 | | | | 46 | | Asset retirement obligations(Note 19) | | | 5,917 | | | | 177 | | | | 872 | | | | 4,868 | | Contractual obligations recorded in the balance sheet | | | 28,336 | | | | 3,683 | | | | 13,393 | | | | 11,260 | | Operating lease obligations(Note 22) | | | 2,948 | | | | 582 | | | | 1,261 | | | | 1,105 | | Purchase obligations | | | 61,293 | | | | 6,347 | | | | 14,427 | | | | 40,519 | | Contractual obligations not recorded in the balance sheet | | | 64,241 | | | | 6,929 | | | | 15,688 | | | | 41,624 | | Total of contractual obligations | | | 92,577 | | | | 10,612 | | | | 29,081 | | | | 52,884 | | Guarantees given for excise taxes | | | 1,753 | | | | 1,594 | | | | 71 | | | | 88 | | Guarantees given against borrowings | | | 5,005 | | | | 1,333 | | | | 493 | | | | 3,179 | | Indemnities related to sales of businesses | | | 37 | | | | — | | | | 31 | | | | 6 | | Guarantees of current liabilities | | | 171 | | | | 147 | | | | 19 | | | | 5 | | Guarantees to customers / suppliers | | | 3,020 | | | | 1,621 | | | | 96 | | | | 1,303 | | Letters of credit | | | 1,250 | | | | 1,247 | | | | — | | | | 3 | | Other operating commitments | | | 2,057 | | | | 467 | | | | 220 | | | | 1,370 | | Total of other commitments given | | | 13,293 | | | | 6,409 | | | | 930 | | | | 5,954 | | Mortgages and liens received | | | 429 | | | | 2 | | | | 114 | | | | 313 | | Other commitments received | | | 6,387 | | | | 3,878 | | | | 679 | | | | 1,830 | | Total of commitments received | | | 6,816 | | | | 3,880 | | | | 793 | | | | 2,143 | |
| | | | | | | | | | | | | | | | | | | | Maturity and installments | | | As of December 31,2009 (M€) | | Total | | | Less than
1 year | | | Between 1
and 5 years | | | More than
5 years | | Non-current debt obligations net of hedging instruments(Note 20) | | | 18,152 | | | | — | | | | 12,443 | | | | 5,709 | | Current portion of non-current debt obligations net of hedging instruments(Note 20) | | | 2,111 | | | | 2,111 | | | | — | | | | — | | Finance lease obligations(Note 22) | | | 282 | | | | 22 | | | | 146 | | | | 114 | | Asset retirement obligations(Note 19) | | | 5,469 | | | | 235 | | | | 972 | | | | 4,262 | | Contractual obligations recorded in the balance sheet | | | 26,014 | | | | 2,368 | | | | 13,561 | | | | 10,085 | | Operating lease obligations(Note 22) | | | 2,539 | | | | 523 | | | | 1,122 | | | | 894 | | Purchase obligations | | | 49,808 | | | | 4,542 | | | | 9,919 | | | | 35,347 | | Contractual obligations not recorded in the balance sheet | | | 52,347 | | | | 5,065 | | | | 11,041 | | | | 36,241 | | Total of contractual obligations | | | 78,361 | | | | 7,433 | | | | 24,602 | | | | 46,326 | | Guarantees given for excise taxes | | | 1,765 | | | | 1,617 | | | | 69 | | | | 79 | | Guarantees given against borrowings | | | 2,882 | | | | 1,383 | | | | 709 | | | | 790 | | Indemnities related to sales of businesses | | | 36 | | | | — | | | | 1 | | | | 35 | | Guarantees of current liabilities | | | 203 | | | | 160 | | | | 38 | | | | 5 | | Guarantees to customers / suppliers | | | 2,770 | | | | 1,917 | | | | 70 | | | | 783 | | Letters of credit | | | 1,499 | | | | 1,485 | | | | 2 | | | | 12 | | Other operating commitments | | | 765 | | | | 582 | | | | 103 | | | | 80 | | Total of other commitments given | | | 9,920 | | | | 7,144 | | | | 992 | | | | 1,784 | | Mortgages and liens received | | | 330 | | | | 5 | | | | 106 | | | | 219 | | Other commitments received | | | 5,637 | | | | 3,187 | | | | 481 | | | | 1,969 | | Total of commitments received | | | 5,967 | | | | 3,192 | | | | 587 | | | | 2,188 | |
| A. | | CONTRACTUAL OBLIGATIONS |
Debt obligations “Non-current debt obligations” are included in the items “Non-current financial debt” and “Hedging instruments of non-current financial debt” of the Consolidated Balance Sheet. It includes the non-current portion of swaps hedging bonds, and excludes non-current finance lease obligations of€152 million. The current portion of non-current debt is included in the items “Current borrowings”, “Current financial assets” and “Other current financial liabilities” of the Consolidated Balance Sheet. It includes the current portion of swaps hedging bonds, and excludes the current portion of finance lease obligations of€25 million. The information regarding contractual obligations linked to indebtedness is presented in Note 20 to the Consolidated Financial Statements. Lease contracts The information regarding operating and finance leases is presented in Note 22 to the Consolidated Financial Statements. Asset retirement obligations This item represents the discounted present value of Upstream asset retirement obligations, primarily asset removal costs at the completion date. The information regarding contractual obligations linked to asset retirement obligations is presented in Notes 1Q and 19 to the Consolidated Financial Statements. Purchase obligations Purchase obligations are obligations under contractual agreements to purchase goods or services, including capital projects. These obligations are enforceable and legally binding on the company and specify all significant terms, including the amount and the timing of the payments. These obligations mainly include: hydrocarbon unconditional purchase contracts (except where an active, highly-liquid market exists and when the hydrocarbons are expected to be re-sold shortly after purchase), reservation of transport capacities in pipelines, unconditional exploration works and development works in the Upstream segment, and contracts for capital investment projects in the Downstream segment. | B. | | OTHER COMMITMENTS GIVEN |
Guarantees given for excise taxes They consist of guarantees given to other oil and gas companies in order to comply with French tax authorities’ requirements for oil and gas imports in France. A payment would be triggered by a failure of the guaranteed party with respect to the French tax authorities. The default of the guaranteed parties is however considered to be highly remote by the Group. Guarantees given against borrowings The Group guarantees bank debt and finance lease obligations of certain non-consolidated subsidiaries and equity affiliates. Maturity dates vary, and guarantees will terminate on payment and/or cancellation of the obligation. A payment would be triggered by failure of the guaranteed party to fulfill its obligation covered by the guarantee, and no assets are held as collateral for these guarantees. As of December 31, 2011, the maturities of these guarantees are up to 2023. Guarantees given against borrowings include the guarantee given in 2008 by TOTAL S.A. in connection with the financing of the Yemen LNG project for an amount of€1,208 million. In turn, certain partners involved in this project have given commitments that could, in the case of Total S.A.’s guarantees being called for the maximum amount, reduce the Group’s exposure by up to€404 million, recorded under “Other commitments received”. In 2010, TOTAL S.A. provided guarantees in connection with the financing of the Jubail project (operated by SAUDI ARAMCO TOTAL Refining and Petrochemical Company (SATORP)) of up to€2,463 million, proportional to TOTAL’s share in the project (37.5%). In addition, TOTAL S.A. provided in 2010 a guarantee in favor of its partner in the Jubail project (Saudi Arabian Oil Company) with respect to Total Refining Saudi Arabia SAS’s obligations under the shareholders agreement with respect to SATORP. As of December 31, 2011, this guarantee is of up to€1,095 million and has been recorded under “Other operating commitments”. Indemnities related to sales of businesses In the ordinary course of business, the Group executes contracts involving standard indemnities in oil industry and indemnities specific to transactions such as sales of businesses. These indemnities might include claims against any of the following: environmental, tax and shareholder matters, intellectual property rights, governmental regulations and employment-related matters, dealer, supplier, and other commercial contractual relationships. Performance under these indemnities would generally be triggered by a breach of terms of the contract or by a third party claim. The Group regularly evaluates the probability of having to incur costs associated with these indemnities. The guarantees related to antitrust investigations granted as part of the agreement relating to the spin-off of Arkema are described in Note 32 to the Consolidated Financial Statements. Other guarantees given Non-consolidated subsidiaries The Group also guarantees the current liabilities of certain non-consolidated subsidiaries. Performance under these guarantees would be triggered by a financial default of the entity. Operating agreements As part of normal ongoing business operations and consistent with generally and accepted recognized industry practices, the Group enters into numerous agreements with other parties. These commitments are often entered into for commercial purposes, for regulatory purposes or for other operating agreements. Goods and services sale obligations These amounts represent binding obligations under contractual agreements to sell goods or services, including in particular hydrocarbon unconditional sale contracts (except when an active, highly-liquid market exists and volumes are re-sold shortly after purchase). 24)RELATED PARTIES The main transactions and balances with related parties (principally non-consolidated subsidiaries and equity affiliates) are detailed as follows: | | | | | | | | | | | | | | As of December 31, (M€) | | 2011 | | | 2010 | | | 2009 | | Balance sheet | | | | | | | | | | | | | Receivables | | | | | | | | | | | | | Debtors and other debtors | | | 585 | | | | 432 | | | | 293 | | Loans (excl. loans to equity affiliates) | | | 331 | | | | 315 | | | | 438 | | Payables | | | | | | | | | | | | | Creditors and other creditors | | | 724 | | | | 497 | | | | 386 | | Debts | | | 31 | | | | 28 | | | | 42 | | | | | | | | For the year ended December 31, (M€) | | 2011 | | | 2010 | | | 2009 | | Statement of income | | | | | | | | | | | | | Sales | | | 4,400 | | | | 3,194 | | | | 2,183 | | Purchases | | | 5,508 | | | | 5,576 | | | | 2,958 | | Financial expense | | | — | | | | 69 | | | | 1 | | Financial income | | | 79 | | | | 74 | | | | 68 | |
Compensation for the administration and management bodies The aggregate amount of direct and indirect compensation accounted for by the French and foreign affiliates of the Company for the executive officers of TOTAL (the members of the Management Committee and the Treasurer) and for the members of the Board of Directors who are employees of the Group, is detailed as follows: | | | | | | | | | | | | | | For the year ended December 31, (M€) | | 2011 | | | 2010 | | | 2009 | | Number of people | | | 30 | | | | 26 | | | | 27 | | Direct or indirect compensation received | | | 20.4 | | | | 20.8 | | | | 19.4 | | Pension expenses(a) | | | 9.4 | | | | 12.2 | | | | 10.6 | | Other long-term benefits expenses | | | — | | | | — | | | | — | | Termination benefits expenses | | | 4.8 | | | | — | | | | — | | Share-based payments expense (IFRS 2)(b) | | | 10.2 | | | | 10.0 | | | | 11.2 | |
| (a) | The benefits provided for executive officers and certain members of the Board of Directors, employees and former employees of the Group, include severance to be paid on retirement, supplementary pension schemes and insurance plans, which represent€139.7 million provisioned as of December 31, 2011 (against€113.8 million as of December 31, 2010 and€96.6 million as of December 31, 2009). |
| (b) | Share-based payments expense computed for the executive officers and the members of the Board of Directors who are employees of the Group as described in Note 25 paragraph E to the Consolidated Financial Statements and based on the principles of IFRS 2 “Share-based payments” described in Note 1 paragraph E to the Consolidated Financial Statements. |
The compensation allocated to members of the Board of Directors for directors’ fees totaled€1.07 million in 2011 (€0.96 million in 2010 and€0.97 million in 2009). 25)SHARE-BASED PAYMENTS | A. | | TOTAL SHARE SUBSCRIPTION OPTION PLANS |
| | | | | | | | | | | | | | | | | | | | | | | | | | | | | | | | | | | | | | | | | | | | | | | | 2003 Plan | | | 2004 Plan | | | 2005 Plan | | | 2006 Plan | | | 2007 Plan | | | 2008 Plan | | | 2009 Plan | | | 2010 Plan | | | 2011 Plan | | | Total | | | Weighted
average
exercise
price | | Date of the shareholders’ meeting | | | 05/17/2001 | | | | 05/14/2004 | | | | 05/14/2004 | | | | 05/14/2004 | | | | 05/11/2007 | | | | 05/11/2007 | | | | 05/11/2007 | | | | 05/21/2010 | | | | 05/21/2010 | | | | | | | | | | Date of the award(a) | | | 07/16/2003 | | | | 07/20/2004 | | | | 07/19/2005 | | | | 07/18/2006 | | | | 07/17/2007 | | | | 10/09/2008 | | | | 09/15/2009 | | | | 09/14/2010 | | | | 09/14/2011 | | | | | | | | | | Exercise price until May 23, 2006 included(b) | | | 33.30 | | | | 39.85 | | | | 49.73 | | | | — | | | | — | | | | — | | | | — | | | | — | | | | — | | | | | | | | | | Exercise price since May 24, 2006(b) | | | 32.84 | | | | 39.30 | | | | 49.04 | | | | 50.60 | | | | 60.10 | | | | 42.90 | | | | 39.90 | | | | 38.20 | | | | 33.00 | | | | | | | | | | Expiry date | | | 07/16/2011 | | | | 07/20/2012 | | | | 07/19/2013 | | | | 07/18/2014 | | | | 07/17/2015 | | | | 10/09/2016 | | | | 09/15/2017 | | | | 09/14/2018 | | | | 09/14/2019 | | | | | | | | | | Number of options(c) | | | | | | | | | | | | | | | | | | | | | | | | | | | | | | | | | | | | | | | | | | | | | Existing options as of January 1, 2008 | | | 8,368,378 | | | | 13,197,236 | | | | 6,243,438 | | | | 5,711,060 | | | | 5,920,105 | | | | — | | | | — | | | | — | | | | — | | | | 39,440,217 | | | | 44.23 | | Granted | | | — | | | | — | | | | — | | | | — | | | | — | | | | 4,449,810 | | | | — | | | | ��� | | | | — | | | | 4,449,810 | | | | 42.90 | | Cancelled | | | (25,184 | ) | | | (118,140 | ) | | | (34,032 | ) | | | (53,304 | ) | | | (34,660 | ) | | | (6,000 | ) | | | — | | | | — | | | | — | | | | (271,320 | ) | | | 44.88 | | Exercised | | | (841,846 | ) | | | (311,919 | ) | | | (17,702 | ) | | | (6,700 | ) | | | — | | | | — | | | | — | | | | — | | | | — | | | | (1,178,167 | ) | | | 34.89 | | Existing options as of January 1, 2009 | | | 7,501,348 | | | | 12,767,177 | | | | 6,191,704 | | | | 5,651,056 | | | | 5,885,445 | | | | 4,443,810 | | | | — | | | | — | | | | — | | | | 42,440,540 | | | | 44.35 | | Granted | | | — | | | | — | | | | — | | | | — | | | | — | | | | — | | | | 4,387,620 | | | | — | | | | — | | | | 4,387,620 | | | | 39.90 | | Cancelled | | | (8,020 | ) | | | (18,387 | ) | | | (6,264 | ) | | | (5,370 | ) | | | (13,780 | ) | | | (2,180 | ) | | | (10,610 | ) | | | — | | | | — | | | | (64,611 | ) | | | 45.04 | | Exercised | | | (681,699 | ) | | | (253,081 | ) | | | — | | | | — | | | | — | | | | — | | | | — | | | | — | | | | — | | | | (934,780 | ) | | | 34.59 | | Existing options as of January 1, 2010 | | | 6,811,629 | | | | 12,495,709 | | | | 6,185,440 | | | | 5,645,686 | | | | 5,871,665 | | | | 4,441,630 | | | | 4,377,010 | | | | — | | | | — | | | | 45,828,769 | | | | 44.12 | | Granted | | | — | | | | — | | | | — | | | | — | | | | — | | | | — | | | | — | | | | 4,788,420 | | | | — | | | | 4,788,420 | | | | 38.20 | | Cancelled(d) | | | (1,420 | ) | | | (15,660 | ) | | | (6,584 | ) | | | (4,800 | ) | | | (5,220 | ) | | | (92,472 | ) | | | (4,040 | ) | | | (1,120 | ) | | | — | | | | (131,316 | ) | | | 43.50 | | Exercised | | | (1,075,765 | ) | | | (141,202 | ) | | | — | | | | — | | | | — | | | | — | | | | (1,080 | ) | | | — | | | | — | | | | (1,218,047 | ) | | | 33.60 | | Existing options as of January 1, 2011 | | | 5,734,444 | | | | 12,338,847 | | | | 6,178,856 | | | | 5,640,886 | | | | 5,866,445 | | | | 4,349,158 | | | | 4,371,890 | | | | 4,787,300 | | | | — | | | | 49,267,826 | | | | 43.80 | | Granted | | | — | | | | — | | | | — | | | | — | | | | — | | | | — | | | | — | | | | — | | | | 1,518,840 | | | | 1,518,840 | | | | 33.00 | | Cancelled(e) | | | (738,534 | ) | | | (28,208 | ) | | | (16,320 | ) | | | (17,380 | ) | | | (16,080 | ) | | | (13,260 | ) | | | (14,090 | ) | | | (85,217 | ) | | | (1,000 | ) | | | (930,089 | ) | | | 34.86 | | Exercised | | | (4,995,910 | ) | | | (216,115 | ) | | | — | | | | — | | | | — | | | | (200 | ) | | | — | | | | (2,040 | ) | | | (9,400 | ) | | | (5,223,665 | ) | | | 33.11 | | Existing options as of December 31, 2011 | | | — | | | | 12,094,524 | | | | 6,162,536 | | | | 5,623,506 | | | | 5,850,365 | | | | 4,335,698 | | | | 4,357,800 | | | | 4,700,043 | | | | 1,508,440 | | | | 44,632,912 | | | | 44.87 | |
| (a) | The grant date is the date of the Board meeting awarding the share subscription options, except for the grant of October 9, 2008, decided by the Board on September 9, 2008. |
| (b) | Exercise price in euro. The exercise prices of TOTAL subscription shares of the plans in force at that date were multiplied by 0.25 to take into account the four-for-one stock split on May 18, 2006. Moreover, following the spin-off of Arkema, the exercise prices of TOTAL subscription shares of these plans were multiplied by an adjustment factor equal to 0.986147 effective as of May 24, 2006. |
| (c) | The number of options awarded, outstanding, canceled or exercised before May 23, 2006 included, was multiplied by four to take into account the four-for-one stock split approved by the shareholders’ meeting on May 12, 2006. |
| (d) | Out of 92,472 options awarded under the 2008 Plan that were canceled, 88,532 options were canceled due to the performance condition. The acquisition rate applicable to the subscription options that were subject to the performance condition of the 2008 Plan was 60%. |
| (e) | Out of the 930,089 options canceled in 2011, 738,534 options that were not exercised expired due to the expiry of the 2003 subscription option Plan on July 16, 2011. |
Options are exercisable, subject to a continuous employment condition, after a 2-year period from the date of the Board meeting awarding the options and expire eight years after this date. The underlying shares may not be transferred during four years from the date of grant. For the 2007 to 2011 Plans, the 4-year transfer restriction period does not apply to employees of non-French subsidiaries as of the date of the grant, who may transfer the underlying shares after a 2-year period from the date of the grant. 2011 Plan For the 2011 Plan, the Board of Directors decided that for each grantee other than the Chairman and Chief Executive Officer, the options will be finally granted to their beneficiary provided that the performance condition is fulfilled. The performance condition states that the number of options finally granted is based on the average of the Return On Equity (ROE) of the Group. The average ROE is calculated by the Group from the consolidated balance sheet and statement of income of the Group for fiscal years 2011 and 2012. The acquisition rate: is equal to zero if the average ROE is less than or equal to 7%; varies on straight-line basis between 0% and 100% if the average ROE is more than 7% and less than 18%; and is equal to 100% if the average ROE is more than or equal to 18%. In addition, as part of the 2011 Plan, the Board of Directors decided that the number of share subscription options finally awarded to the Chairman and Chief Executive Officer will be subject to two performance conditions: For 50% of the share subscription options granted, the performance condition states that the number of options finally granted is based on the average ROE of the Group. The average ROE is calculated by the Group from the consolidated balance sheet and statement of income of the Group for fiscal years 2011 and 2012. The acquisition rate is equal to zero if the average ROE is less than or equal to 7%; varies on a straight-line basis between 0% and 100% if the average ROE is more than 7% and less than 18%; and is equal to 100% if the average ROE is more than or equal to 18%. For 50% of the share subscription options granted, the performance condition states that the number of | | options finally granted is based on the average of the Return On Average Capital Employed (ROACE) of the Group. The average ROACE is calculated by the Group from the consolidated balance sheet and statement of income of the Group for fiscal years 2011 and 2012. The acquisition rate is equal to zero if the average ROACE is less than or equal to 6%; varies on a straight-line basis between 0% and 100% if the average ROACE is more than 6% and less than 15%; and is equal to 100% if the average ROACE is more than or equal to 15%. |
2010 Plan For the 2010 Plan, the Board of Directors decided that: For each grantee of up to 3,000 options, other than the Chairman and Chief Executive Officer, the options will be finally granted to their beneficiary. For each grantee of more than 3,000 options and less or equal to 50,000 options (other than the Chairman and Chief Executive Officer): The first 3,000 options and two-thirds above the first 3,000 options will be finally granted to their beneficiary; The outstanding options, that is one-third of the options above the first 3,000 options, will be finally granted provided that the performance condition described below is fulfilled. For each grantee of more than 50,000 options (other than the Chairman and Chief Executive Officer): The first 3,000 options, two-thirds of the options above the first 3,000 options and below the first 50,000 options, and one-third of the options above the first 50,000 options, will be finally granted to their beneficiary; The outstanding options, that is one-third of the options above the first 3,000 options and below the first 50,000 options and two-thirds of the options above the first 50,000 options, will be finally granted provided that the performance condition is fulfilled. The performance condition states that the number of options finally granted is based on the average ROE of the Group. The average ROE is calculated by the Group based on TOTAL’s consolidated balance sheet and statement of income for fiscal years 2010 and 2011. The acquisition rate: is equal to zero if the average ROE is less than or equal to 7%; varies on straight-line basis between 0% and 100% if the average ROE is more than 7% and less than 18%; and is equal to 100% if the average ROE is more than or equal to 18%. In addition, as part of the 2010 Plan, the Board of Directors decided that the number of share subscription options finally awarded to the Chairman and Chief Executive Officer will be subject to two performance conditions: For 50% of the share subscription options granted, the performance condition states that the number of options finally granted is based on the average ROE of the Group. The average ROE is calculated by the Group based on TOTAL’s consolidated balance sheet and statement of income for fiscal years 2010 and 2011. The acquisition rate is equal to zero if the average ROE is less than or equal to 7%; varies on a straight-line basis between 0% and 100% if the average ROE is more than 7% and less than 18%; and is equal to 100% if the average ROE is more than or equal to 18%. For 50% of the share subscription options granted, the performance condition states that the number of options finally granted is based on the average ROACE of the Group. The average ROACE is calculated by the Group based on TOTAL’s consolidated balance sheet and statement of income for fiscal years 2010 and 2011. The acquisition rate is equal to zero if the average ROACE is less than or equal to 6%; varies on a straight-line basis between 0% and 100% if the average ROACE is more than 6% and less than 15%; and is equal to 100% if the average ROACE is more than or equal to 15%. 2009 Plan For the 2009 Plan, the Board of Directors decided that for each beneficiary, other than the Chief Executive Officer, of more than 25,000 options, one third of the options granted in excess of this number will be finally granted subject to a performance condition. This condition states that the final number of options finally granted is based on the average ROE of the Group as published by TOTAL. The average ROE is calculated based on the Group’s consolidated balance sheet and statement of income for fiscal years 2009 and 2010. The acquisition rate: is equal to zero if the average ROE is less than or equal to 7%; varies on straight-line basis between 0% and 100% if the average ROE is more than 7% and less than 18%; and is equal to 100% if the average ROE is more than or equal to 18%. In addition, the Board of Directors decided that, for the Chief Executive Officer, the number of share subscription options finally granted will be subject to two performance conditions: For 50% of the share subscription options granted, the performance condition states that the number of options finally granted is based on the average ROE of the Group as published by TOTAL. The average ROE is calculated based on the Group’s consolidated balance sheet and statement of income for fiscal years 2009 and 2010. The acquisition rate is equal to zero if the average ROE is less than or equal to 7%; varies on a straight-line basis between 0% and 100% if the average ROE is more than 7% and less than 18%; and is equal to 100% if the average ROE is more than or equal to 18%. For 50% of the share subscription options granted, the performance condition states that the number of options finally granted is based on the average ROACE of the Group as published by TOTAL. The average ROACE is calculated based on the Group’s consolidated balance sheet and statement of income for fiscal years 2009 and 2010. The acquisition rate is equal to zero if the average ROACE is less than or equal to 6%; varies on a straight-line basis between 0% and 100% if the average ROACE is more than 6% and less than 15%; and is equal to 100% if the average ROACE is more than or equal to 15%. Due to the application of the performance condition, the acquisition rates were 100% for the 2009 Plan. | B. | | TOTAL SHARE PURCHASE OPTION PLANS |
| | | | | | | | | | | | | | | | | | | | 2001 Plan(a) | | | 2002 Plan(b) | | | Total | | | Weighted
average exercise
price | | Date of the shareholders’ meeting | | | 05/17/2001 | | | | 05/17/2001 | | | | | | | | | | Grant date(c) | | | 07/10/2001 | | | | 07/09/2002 | | | | | | | | | | Exercise price until May 23, 2006 included(d) | | | 42.05 | | | | 39.58 | | | | | | | | | | Exercise price since May 24, 2006(d) | | | 41.47 | | | | 39.03 | | | | | | | | | | Expiry date | | | 07/10/2009 | | | | 07/09/2010 | | | | | | | | | | Number of options(e) | | | | | | | | | | | | | | | | | | | | | | Outstanding as of January 1, 2009 | | | 4,691,426 | | | | 6,450,857 | | | | 11,142,283 | | | | 40.06 | | Awarded | | | — | | | | — | | | | — | | | | — | | Cancelled | | | (4,650,446 | ) | | | (7,920 | ) | | | (4,658,366 | ) | | | 41.47 | | Exercised | | | (40,980 | ) | | | (507,676 | ) | | | (548,656 | ) | | | 39.21 | | Outstanding as of January 1, 2010 | | | — | | | | 5,935,261 | | | | 5,935,261 | | | | 39.03 | | Awarded | | | — | | | | — | | | | — | | | | — | | Cancelled(f) | | | — | | | | (4,671,989 | ) | | | (4,671,989 | ) | | | 39.03 | | Exercised | | | — | | | | (1,263,272 | ) | | | (1,263,272 | ) | | | 39.03 | | Outstanding as of January 1, 2011 | | | — | | | | — | | | | — | | | | — | | Awarded | | | — | | | | — | | | | — | | | | — | | Cancelled | | | — | | | | — | | | | — | | | | — | | Exercised | | | — | | | | — | | | | — | | | | — | | Outstanding as of December 31, 2011 | | | — | | | | — | | | | — | | | | — | |
| (a) | Options were exercisable, subject to a continued employment condition, after a 3.5-year vesting period from the date of the Board meeting awarding the options and expired 8 years after this date. The underlying shares may not be transferred during the 4-year period from the date of the grant. This plan expired on July 10, 2009. |
| (b) | Options were exercisable, subject to a continued employment condition, after a 2-year vesting period from the date of the Board meeting awarding the options and expired 8 years after this date. The underlying shares may not be transferred during the 4-year period from the date of the grant. This plan expired on July 9, 2010. |
| (c) | The grant date is the date of the Board meeting awarding the options. |
| (d) | Exercise price in euro. The exercise prices of TOTAL share purchase options of the plans at that date were multiplied by 0.25 to take into account the four-for-one stock split on May 18, 2006. Moreover, following the spin-off of Arkema, the exercise prices of TOTAL share purchase options of these plans were multiplied by an adjustment factor equal to 0.986147 effective as of May 24, 2006. |
| (e) | The number of options awarded, outstanding, canceled or exercised before May 23, 2006 included, was multiplied by four to take into account the four-for-one stock split approved by the shareholders’ meeting on May 12, 2006. |
| (f) | Out of the 4,671,989 options canceled in 2010, 4,671,145 options that were not exercised expired due to the expiry of the 2002 purchase option Plan on July 9, 2010. |
| C. | | EXCHANGE GUARANTEE GRANTED TO THE HOLDERS OF ELF AQUITAINE SHARE SUBSCRIPTION OPTIONS |
Pursuant to the public exchange offer for Elf Aquitaine shares which was made in 1999, the Group made a commitment to guarantee the holders of Elf Aquitaine share subscription options, at the end of the period referred to in Article 163 bis C of the French Tax Code (CGI), and until the end of the period for the exercise of the options, the possibility to exchange their future Elf Aquitaine shares for TOTAL shares, on the basis of the exchange ratio of the offer (nineteen TOTAL shares for thirteen Elf Aquitaine shares). In order to take into account the spin-off of S.D.A. (Société de Développement Arkema) by Elf Aquitaine, the spin-off of Arkema by TOTAL S.A. and the four-for-one TOTAL stock split, the Board of Directors of TOTAL S.A., in accordance with the terms of the share exchange undertaking, approved on March 14, 2006 to adjust the exchange ratio described above (see pages 24 and 25 of the “Prospectus for the purpose of listing Arkema shares on Euronext Paris in connection with the allocation of Arkema shares to TOTAL S.A. shareholders”). Following the approval by Elf Aquitaine shareholders’ meeting on May 10, 2006 of the spin-off of S.D.A. by Elf Aquitaine, the approval by TOTAL S.A. shareholders’ meeting on May 12, 2006 of the spin-off of Arkema by TOTAL S.A. and the four-for-one TOTAL stock split, the exchange ratio was adjusted to six TOTAL shares for one Elf Aquitaine share on May 22, 2006. This exchange guarantee expired on September 12, 2009, due to the expiry of the Elf Aquitaine share subscription option plan No. 2 of 1999. Subsequently, no Elf Aquitaine shares are covered by the exchange guarantee. | D. | | TOTAL PERFORMANCE SHARE GRANTS |
| | | | | | | | | | | | | | | | | | | | | | | | | | | | | | | | | | | | 2005 Plan | | | 2006 Plan | | | 2007 Plan | | | 2008 Plan | | | 2009 Plan | | | 2010 Plan | | | 2011 Plan | | | Total | | Date of the shareholders’ meeting | | | 05/17/2005 | | | | 05/17/2005 | | | | 05/17/2005 | | | | 05/16/2008 | | | | 05/16/2008 | | | | 05/16/2008 | | | | 05/13/2011 | | | | | | Grant date(a) | | | 07/19/2005 | | | | 07/18/2006 | | | | 07/17/2007 | | | | 10/09/2008 | | | | 09/15/2009 | | | | 09/14/2010 | | | | 09/14/2011 | | | | | | Final grant date (end of the vesting period) | | | 07/20/2007 | | | | 07/19/2008 | | | | 07/18/2009 | | | | 10/10/2010 | | | | 09/16/2011 | | | | 09/15/2012 | | | | 09/15/2013 | | | | | | Transfer possible from | | | 07/20/2009 | | | | 07/19/2010 | | | | 07/18/2011 | | | | 10/10/2012 | | | | 09/16/2013 | | | | 09/15/2014 | | | | 09/15/2015 | | | | | | Number of performance shares | | | | | | | | | | | | | | | | | | | | | | | | | | | | | | | | | | | | | | | | | | Outstanding as of January 1, 2009 | | | — | | | | — | | | | 2,333,217 | | | | 2,772,748 | | | | | | | | | | | | | | | | 5,105,965 | | Awarded | | | — | | | | — | | | | — | | | | — | | | | 2,972,018 | | | | | | | | | | | | 2,972,018 | | Canceled | | | 1,928 | | | | 2,922 | | | | (12,418 | ) | | | (9,672 | ) | | | (5,982 | ) | | | | | | | | | | | (23,222 | ) | Finally granted(b)(c) | | | (1,928 | ) | | | (2,922 | ) | | | (2,320,799 | ) | | | (600 | ) | | | — | | | | | | | | | | | | (2,326,249 | ) | Outstanding as of January 1, 2010 | | | — | | | | — | | | | — | | | | 2,762,476 | | | | 2,966,036 | | | | | | | | | | | | 5,728,512 | | Awarded | | | — | | | | — | | | | — | | | | — | | | | — | | | | 3,010,011 | | | | | | | | 3,010,011 | | Canceled(d) | | | 1,024 | | | | 3,034 | | | | 552 | | | | (1,113,462 | ) | | | (9,796 | ) | | | (8,738 | ) | | | | | | | (1,127,386 | ) | Finally granted(b)(c) | | | (1,024 | ) | | | (3,034 | ) | | | (552 | ) | | | (1,649,014 | ) | | | (1,904 | ) | | | (636 | ) | | | | | | | (1,656,164 | ) | Outstanding as of January 1, 2011 | | | — | | | | — | | | | — | | | | — | | | | 2,954,336 | | | | 3,000,637 | | | | | | | | 5,954,973 | | Awarded | | | — | | | | — | | | | — | | | | — | | | | — | | | | — | | | | 3,649,770 | | | | 3,649,770 | | Canceled | | | 800 | | | | 700 | | | | 792 | | | | 356 | | | | (26,214 | ) | | | (10,750 | ) | | | (19,579 | ) | | | (53,895 | ) | Finally granted(b)(c)(e) | | | (800 | ) | | | (700 | ) | | | (792 | ) | | | (356 | ) | | | (2,928,122 | ) | | | (1,836 | ) | | | — | | | | (2,932,606 | ) | Outstanding as of December 31, 2011 | | | — | | | | — | | | | — | | | | — | | | | — | | | | 2,988,051 | | | | 3,630,191 | | | | 6,618,242 | |
| (a) | The grant date is the date of the Board of Directors meeting that awarded the shares, except for the shares awarded by the Board of Directors at their meeting of September 9, 2008, and granted on October 9, 2008. |
| (b) | Performance shares finally granted following the death of their beneficiaries. |
| (c) | Including performance shares finally granted for which the entitlement right had been canceled erroneously. |
| (d) | Out of the 1,113,462 canceled rights to the grant share under the 2008 Plan, 1,094,914 entitlement rights were canceled due to the performance condition. The acquisition rate for the 2008 Plan was 60%. |
| (e) | The acquisition rate for the 2009 Plan was 100%. |
The performance shares, which are bought back by the Company on the market, are finally granted to their beneficiaries after a 2-year vesting period from the date of the grant. The final grant is subject to a continued employment condition and a performance condition. Moreover, the transfer of the performance shares finally granted will not be permitted until the end of a 2-year mandatory holding period from the date of the final grant. 2011 Plan For the 2011 Plan, the Board of Directors decided that, for each senior executive (other than the Chairman and Chief Executive Officer), the shares will be finally granted subject to a performance condition. This condition is based on the average ROE as published by the Group and calculated based on the Group’s consolidated balance sheet and statement of income for fiscal years 2011 and 2012. The acquisition rate: is equal to zero if the average ROE is less than or equal to 7%; varies on a straight-line basis between 0% and 100% if the average ROE is greater than 7% and less than 18%; and is equal to 100% if the average ROE is greater than or equal to 18%. The Board of Directors decided also that, for each for each beneficiary (other than the Chairman and Chief Executive Officer and the senior executives) of more than 100 shares, the shares in excess of this number will be finally granted subject to the performance condition mentioned before. In addition, as part of the 2011 plan, the Board of Directors decided that the number of performance share finally granted to the Chairman and Chief Executive Officer will be subject to two performance conditions: For 50% of the share granted, the performance condition states that the number of shares finally granted is based on the average ROE of the Group. The average ROE is calculated by the Group from the consolidated balance sheet and statement of income of the Group for fiscal years 2011 and 2012. The acquisition rate is equal to zero if the average ROE is less than or equal to 7%; varies on a straight-line basis between 0% and 100% if the average ROE is more than 7% and less than 18%; and is equal to 100% if the average ROE is more than or equal to 18%. For 50% of the share granted, the performance condition states that the number of shares finally | | granted is based on the average ROACE of the Group. The average ROACE is calculated by the Group from the consolidated balance sheet and statement of income of the Group for fiscal years 2011 and 2012. The acquisition rate is equal to zero if the average ROACE is less than or equal to 6%; varies on a straight-line basis between 0% and 100% if the average ROACE is more than 6% and less than 15%; and is equal to 100% if the average ROACE is more than or equal to 15%. |
2010 Plan For the 2010 Plan, the Board of Directors decided that, for each beneficiary of more than 100 shares, half of the shares in excess of this number will be finally granted subject to a performance condition. This condition is based on the average ROE calculated by the Group based on TOTAL’s consolidated balance sheet and statement of income for fiscal years 2010 and 2011. The acquisition rate: is equal to zero if the average ROE is less than or equal to 7%; varies on a straight-line basis between 0% and 100% if the average ROE is greater than 7% and less than 18%; and is equal to 100% if the average ROE is greater than or equal to 18%. 2009 Plan For the 2009 Plan, the Board of Directors decided that, for each beneficiary of more than 100 shares, half of the shares in excess of this number will be finally granted subject to a performance condition. This condition states that the number of shares finally granted is based on the average ROE as published by the Group and calculated based on the Group’s consolidated balance sheet and statement of income for fiscal years 2009 and 2010. The acquisition rate: is equal to zero if the average ROE is less than or equal to 7%; varies on a straight-line basis between 0% and 100% if the average ROE is greater than 7% and less than 18%; and is equal to 100% if the average ROE is greater than or equal to 18%. Due to the application of the performance condition, the acquisition rate was 100% for the 2009 Plan. | E. | | GLOBAL FREE TOTAL SHARE PLAN |
The Board of Directors approved at its meeting on May 21, 2010 the implementation and conditions of a global free share plan intended for the Group employees. On June 30, 2010, entitlement rights to 25 free shares were granted to every employee. The final grant is subject to a continued employment condition during the plan’s vesting period. The shares are not subject to any performance condition. Following the vesting period, the shares awarded will be new shares. | | | | | | | | | | | | | | | | 2010 Plan
(2+2) | | | 2010 Plan
(4+0) | | | Total | | Date of the shareholders’ meeting | | | 05/16/2008 | | | | 05/16/2008 | | | | | | Date of the award(a) | | | 06/30/2010 | | | | 06/30/2010 | | | | | | Date of the final award | | | 07/01/2012 | | | | 07/01/2014 | | | | | | Transfer authorized as from | | | 07/01/2014 | | | | 07/01/2014 | | | | | | Number of free shares | | | | | | | | | | | | | | | | | Outstanding as of January 1, 2010 | | | | | | | | | | | | | Notified | | | 1,508,850 | | | | 1,070,650 | | | | 2,579,500 | | Cancelled | | | (125 | ) | | | (75 | ) | | | (200 | ) | Finally granted(b) | | | (75 | ) | | | — | | | | (75 | ) | Outstanding as of January 1, 2011 | | | 1,508,650 | | | | 1,070,575 | | | | 2,579,225 | | Notified | | | — | | | | — | | | | — | | Cancelled | | | (29,175 | ) | | | (54,625 | ) | | | (83,800 | ) | Finally granted(b) | | | (475 | ) | | | (425 | ) | | | (900 | ) | Outstanding as of December 31, 2011 | | | 1,479,000 | | | | 1,015,525 | | | | 2,494,525 | |
| (a) | The June 30, 2010, grant was decided by the Board of Directors on May 21, 2010. |
| (b) | Final grant following the death or disability of the beneficiary of the shares. |
SunPower has three stock incentive plans: the 1996 Stock Plan (“1996 Plan”), the Second Amended and Restated 2005 SunPower Corporation Stock Incentive Plan (“2005 Plan”) and the PowerLight Corporation Common Stock Option and Common Stock Purchase Plan (“PowerLight Plan”). The PowerLight Plan was assumed by SunPower by way of the acquisition of PowerLight in fiscal 2007. Under the terms of all three plans, SunPower may issue incentive or non-statutory stock options or stock purchase rights to directors, employees and consultants to purchase common stock. The 2005 Plan was adopted by SunPower’s Board of Directors in August 2005, and was approved by shareholders in November 2005. The 2005 Plan replaced the 1996 Plan and allows not only for the grant of options, but also for the grant of stock appreciation rights, restricted stock grants, restricted stock units and other equity rights. The 2005 Plan also allows for tax withholding obligations related to stock option exercises or restricted stock awards to be satisfied through the retention of shares otherwise released upon vesting. The PowerLight Plan was adopted by PowerLight’s Board of Directors in October 2000. In May 2008, SunPower’s stockholders approved an automatic annual increase available for grant under the 2005 Plan, beginning in fiscal 2009. The automatic annual increase is equal to the lower of three percent of the outstanding shares of all classes of SunPower’s common stock measured on the last day of the immediately preceding fiscal quarter, 6.0 million shares, or such other number of shares as determined by SunPower’s Board of Directors. As of January 1, 2012, approximately 3.3 million shares were available for grant under the 2005 Plan. No new awards are being granted under the 1996 Plan or the PowerLight Plan. Incentive stock options may be granted at no less than the fair value of the common stock on the date of grant. Non-statutory stock options and stock purchase rights may be granted at no less than 85% of the fair value of the common stock at the date of grant. The options and rights become exercisable when and as determined by SunPower’s Board of Directors, although these terms generally do not exceed ten years for stock options. Under the 1996 and 2005 Plans, the options typically vest over five years with a one-year cliff and monthly vesting thereafter. Under the PowerLight Plan, the options typically vest over five years with yearly cliff vesting. Under the 2005 Plan, the restricted stock grants and restricted stock units typically vest in three equal installments annually over three years. The majority of shares issued are net of the minimum statutory withholding requirements that SunPower pays on behalf of its employees. During the six months ended January 1, 2012 SunPower withheld 221,262 shares to satisfy the employees’ tax obligations. SunPower pays such withholding requirements in cash to the appropriate taxing authorities. Shares withheld are treated as common stock repurchases for accounting and disclosure purposes and reduce the number of shares outstanding upon vesting. The following table summarizes SunPower’s stock option activities: | | | | | | | | | | | | | | | | | | | | Outstanding Stock Options | | | | Shares
(in thousands) | | | Weighted-Average
Exercise Price
Per Share
(in dollars) | | | Weighted-Average
Remaining
Contractual Term
(in years) | | | Aggregate
Intrinsic Value
(in thousands
dollars) | | Outstanding as of July 3, 2011 | | | 519 | | | | 25.39 | | | | | | | | | | Exercised | | | (29 | ) | | | 3.93 | | | | | | | | | | Forfeited | | | (6 | ) | | | 31.29 | | | | | | | | | | | | | | | | | | | | | | | Outstanding as of January 1, 2012 | | | 484 | | | | 26.62 | | | | 4.71 | | | | 480 | | | | | | | | | | | | | | | Exercisable as of January 1, 2012 | | | 441 | | | | 24.52 | | | | 4.53 | | | | 480 | | Expected to vest after January 1, 2012 | | | 40 | | | | 48.08 | | | | 6.64 | | | | — | |
The intrinsic value of options exercised in the six months ended January 1, 2012 was $0.3 million. There were no stock options granted in the six months ended January 1, 2012. The aggregate intrinsic value in the preceding table represents the total pre-tax intrinsic value, based on SunPower’s closing stock price of $6.23 at December 30, 2011, which would have been received by the option holders had all option holders exercised their options as of that date. The total number of in-the-money options exercisable was 0.1 million shares as of January 1, 2012. The following table summarizes SunPower’s non-vested stock options and restricted stock activities thereafter: | | | | | | | | | | | | | | | | | | | | Stock Options | | | Restricted Stock Awards and Units | | | | Shares
(in thousands) | | | Weighted-Average
Exercise Price
Per Share
(in dollars) | | | Shares
(in thousands) | | | Weighted-Average
Grant Date Fair
Value Per Share
(in dollars)(1) | | Outstanding as of July 3, 2011 | | | 67 | | | | 41.34 | | | | 7,198 | | | | 16.03 | | Granted | | | — | | | | — | | | | 2,336 | | | | 6.91 | | Vested(2) | | | (19 | ) | | | 28.73 | | | | (691 | ) | | | 18.96 | | Forfeited | | | (5 | ) | | | 31.29 | | | | (1,473 | ) | | | 14.10 | | Outstanding as of December 31, 2011 | | | 43 | | | | 48.33 | | | | 7,370 | | | | 13.25 | |
| (1) | The Company estimates the fair value of the restricted stock unit awards as the stock price on the grant date. |
| (2) | Restricted stock awards and units vested include shares withheld on behalf of employees to satisfy the minimum statutory tax withholding requirements. |
| G. | | SHARE-BASED PAYMENT EXPENSE |
Share-based payment expense before tax for the year 2011 amounts to€178 million and is broken down as follows: €27 million for TOTAL share subscription plans; €134 million for TOTAL restricted shares plans; and €17 million for SunPower plans. Share-based payment expense before tax for the year 2010 amounted to€140 million and was broken down as follows: €31 million for TOTAL share subscription plans; and €109 million for TOTAL restricted shares plans. Share-based payment expense before tax for the year 2009 amounted to€106 million and was broken down as follows: €38 million for TOTAL share subscription plans; and €68 million for TOTAL restricted shares plans. The fair value of the options granted in 2011, 2010 and 2009 has been measured according to the Black-Scholes method and based on the following assumptions: | | | | | | | | | | | | | | For the year ended December 31, | | 2011 | | | 2010 | | | 2009 | | Risk free interest rate (%)(a) | | | 2.0 | | | | 2.1 | | | | 2.9 | | Expected dividends (%)(b) | | | 5.6 | | | | 5.9 | | | | 4.8 | | Expected volatility (%)(c) | | | 27.5 | | | | 25.0 | | | | 31.0 | | Vesting period (years) | | | 2 | | | | 2 | | | | 2 | | Exercice period (years) | | | 8 | | | | 8 | | | | 8 | | Fair value of the granted options
(€ per option) | | | 4.4 | | | | 5.8 | | | | 8.4 | |
| (a) | Zero coupon Euro swap rate at 6 years. |
| (b) | The expected dividends are based on the price of TOTAL share derivatives traded on the markets. |
| (c) | The expected volatility is based on the implied volatility of TOTAL share options and of share indices options traded on the markets. |
At the shareholders’ meeting held on May 21, 2010, the shareholders delegated to the Board of Directors the authority to increase the share capital of the Company in one or more transactions and within a maximum period of 26 months from the date of the meeting, by an amount not exceeding 1.5% of the share capital outstanding on the date of the meeting of the Board of Directors at which a decision to proceed with an issuance is made reserving subscriptions for such issuance to the Group employees participating in a company savings plan. It is being specified that the amount of any such capital increase reserved for Group employees was counted against the aggregate maximum nominal amount of share capital increases authorized by the shareholders’ meeting held on May 21, 2010 for issuing new ordinary shares or other securities granting immediate or future access to the Company’s share capital with preferential subscription rights (€2.5 billion in nominal value). Pursuant to this delegation of authorization, the Board of Directors, during its October 28, 2010 meeting, implemented a capital increase reserved for employees within the limit of 12 million shares, with dividend rights as of the January 1, 2010 and delegated all power to the Chairman and CEOChief Executive Officer to determine the opening and closing of subscription period and the subscription price. On March 14, 2011, the Chairman and Chief Executive Officer decided that the subscription period would be set from March 16, 2011 to April 1, 2011 and acknowledged that the subscription price per ordinary share would be set at€34.80. During this capital increase, 8,902,717 TOTAL shares were subscribed and created on April 28, 2011. The cost of capital increases reserved for employees is reduced to take into account the non-transferability of the shares that could be subscribed by the employees over a period of five years. The valuation method of non-transferability of the shares is based on a strategy cost in two steps consisting, first, in a five years forward sale of the non-transferable shares, and second, in purchasing the same number of shares in cash with a loan financing reimbursable “in fine”. During the year 2011, the main assumptions used for the valuation of the cost of capital increase reserved for employees were the following: | | | | | 26) For the year ended December 31, | | PAYROLL AND STAFF2011 | | Date of the Board of Directors meeting that decided the issue | | | October 28, 2010 | | Subscription price (€) | | | 34.80 | | Share price at the reference date (€)(a) | | | 41.60 | | Number of shares (in millions) | | | 8.90 | | Risk free interest rate (%)(b) | | | 2.82 | | Employees loan financing rate (%)(c) | | | 7.23 | | Non transferability cost (% of the reference’s share price) | | | 17.6 | |
| | | | | | | | | | | | | | | For the year ended December 31, (M€) | | 2010 | | | 2009 | | | 2008 | | Personnel expenses | | | | | | | | | | | | | | Wages and salaries (including social charges) | | | 6,246 | | | | 6,177 | | | | 6,014 | | Group employees | | | | | | | | | | | | | France | | | | | | | | | | | | | • Management | | | 10,852 | | | | 10,906 | | | | 10,688 | | • Other | | | 24,317 | | | | 25,501 | | | | 26,413 | | International | | | | | | | | | | | | | • Management | | | 15,146 | | | | 15,243 | | | | 14,709 | | • Other | | | 42,540 | | | | 44,737 | | | | 45,149 | | | | | | | | | | | | | | | | Total | | | 92,855 | | | | 96,387 | | | | 96,959 | | | | | | | | | | | | | | | |
| (a) | Share price at the date which the Chairman and Chief Executive Officer decided the subscription period. |
| (b) | Zero coupon Euro swap rate at 5 years. |
| (c) | The employees loan financing rate is based on a 5-year consumer’s credit rate. |
Due to the fact that the non-transferability cost is higher than the discount, no cost has been accounted to the fiscal year 2011. 26)PAYROLL AND STAFF | | | | | | | | | | | | | For the year ended
December 31, | | 2011 | | | 2010 | | | 2009 | | Personnel expenses (M€) | | | | | | | | | | | | | Wages and salaries (including social charges) | | | 6,579 | | | | 6,246 | | | | 6,177 | | Group employees | | | | | | | | | | | | | France | | | | | | | | | | | | | • Management | | | 11,123 | | | | 10,852 | | | | 10,906 | | • Other | | | 23,914 | | | | 24,317 | | | | 25,501 | | International | | | | | | | | | | | | | • Management | | | 15,713 | | | | 15,146 | | | | 15,243 | | • Other | | | 45,354 | | | | 42,540 | | | | 44,737 | | Total | | | 96,104 | | | | 92,855 | | | | 96,387 | |
The number of employees includes only employees of fully consolidated subsidiaries. The decreaseincrease in the number of employees between December 31, 20092011 and December 31, 2010 is mainly explained by the acquisition of SunPower, partially compensated by the sale of the consumer specialty chemicals business Mapa Spontexphotocure and coatings resins businesses (see Note 3 to the Consolidated Financial Statements). 27)STATEMENT OF CASH FLOWS | A) | | 27) | STATEMENT OF CASH FLOWSFLOW FROM OPERATING ACTIVITIES |
| | A) | Cash flow from operating activities |
The following table gives additional information on cash paid or received in the cash flow from operating activities: | | | | | | | | | | | | | | For the year ended December 31, (M€) | | 2010 | | | 2009 | | | 2008 | | | Interests paid | | | (470 | ) | | | (678 | ) | | | (958 | ) | | Interests received | | | 132 | | | | 148 | | | | 505 | | | Income tax paid | | | (6,990 | ) | | | (6,202 | ) | | | (10,631 | ) | | Dividends received | | | 1,722 | | | | 1,456 | | | | 1,590 | | | | | | | | | | | | | | | |
| | | | | | | | | | | | | For the year ended
December 31, (M€) | | 2011 | | | 2010 | | | 2009 | | Interests paid | | | (679 | ) | | | (470 | ) | | | (678 | ) | Interests received | | | 277 | | | | 132 | | | | 148 | | Income tax paid(a) | | | (12,061 | ) | | | (8,848 | ) | | | (7,027 | ) | Dividends received | | | 2,133 | | | | 1,722 | | | | 1,456 | |
| (a) | These amounts include taxes paid in kind under production-sharing contracts in the exploration-production. |
Changes in working capital are detailed as follows: | | | | | | | | | | | | | | | For the year ended December 31, (M€) | | 2010 | | | 2009 | | | 2008 | | | Inventories | | | (1,896 | ) | | | (4,217 | ) | | | 4,020 | | | Accounts receivable | | | (2,712 | ) | | | (344 | ) | | | 3,222 | | | Other current assets | | | 911 | | | | 1,505 | | | | (982 | ) | | Accounts payable | | | 2,482 | | | | 571 | | | | (3,056 | ) | | Other creditors and accrued liabilities | | | 719 | | | | (831 | ) | | | (633 | ) | | | | | | | | | | | | | | | Net amount | | | (496 | ) | | | (3,316 | ) | | | 2,571 | | | | | | | | | | | | | | | |
| | | | | | | | | | | | | For the year ended
December 31, (M€) | | 2011 | | | 2010 | | | 2009 | | Inventories | | | (1,845 | ) | | | (1,896 | ) | | | (4,217 | ) | Accounts receivable | | | (1,287 | ) | | | (2,712 | ) | | | (344 | ) | Other current assets | | | (2,409 | ) | | | 911 | | | | 1,505 | | Accounts payable | | | 2,646 | | | | 2,482 | | | | 571 | | Other creditors and accrued liabilities | | | 1,156 | | | | 719 | | | | (831 | ) | Net amount | | | (1,739 | ) | | | (496 | ) | | | (3,316 | ) |
| B) | | B) | Cash flow used in financing activities |
Changes in non-current financial debt are detailed in the following table under a net value due to the high number of multiple drawings: | | | | | | | | | | | | | | | For the year ended December 31, (M€) | | 2010 | | | 2009 | | | 2008 | | | Issuance of non-current debt | | | 3,995 | | | | 6,309 | | | | 5,513 | | | Repayment of non-current debt | | | (206 | ) | | | (787 | ) | | | (2,504 | ) | | | | | | | | | | | | | | | Net amount | | | 3,789 | | | | 5,522 | | | | 3,009 | | | | | | | | | | | | | | | |
| | | | | | | | | | | | | For the year ended
December 31, (M€) | | 2011 | | | 2010 | | | 2009 | | Issuance of non-current debt | | | 4,234 | | | | 3,995 | | | | 6,309 | | Repayment of non-current debt | | | (165 | ) | | | (206 | ) | | | (787 | ) | Net amount | | | 4,069 | | | | 3,789 | | | | 5,522 | |
| C) | | C) | Cash and cash equivalents |
Cash and cash equivalents are detailed as follows: | | | | | | | | | | | | | | | For the year ended December 31, (M€) | | 2010 | | | 2009 | | | 2008 | | | Cash | | | 4,679 | | | | 2,448 | | | | 1,836 | | | Cash equivalents | | | 9,810 | | | | 9,214 | | | | 10,485 | | | | | | | | | | | | | | | | Total | | | 14,489 | | | | 11,662 | | | | 12,321 | | | | | | | | | | | | | | | |
| | | | | | | | | | | | | For the year ended
December 31, (M€) | | 2011 | | | 2010 | | | 2009 | | Cash | | | 4,715 | | | | 4,679 | | | | 2,448 | | Cash equivalents | | | 9,310 | | | | 9,810 | | | | 9,214 | | Total | | | 14,025 | | | | 14,489 | | | | 11,662 | |
Cash equivalents are mainly composed of deposits less than three months deposited in government institutions or deposit banks selected in accordance with strict criteria.
F-73
| | 28) | FINANCIAL ASSETS AND LIABILITIES ANALYSIS PER INSTRUMENTS CLASS AND STRATEGY |
28)FINANCIAL ASSETS AND LIABILITIES ANALYSIS PER INSTRUMENTS CLASS AND STRATEGY The financial assets and liabilities disclosed on the face ofin the balance sheet are detailed as follows: | | | | | | | | | | | | | | | | | | | | | | | | | | | | | | | | | | | | | | | | | | | | | | | | Other financial
| | | | | | Fair
| | | | | Financial instruments related to financing and trading activities | | | instruments | | | Total | | | value | | | | | | | | | | | As of December 31, 2010 | | Amortized
| | | Fair
| | | | | | | | | | | (M€)
| | cost | | | value | | | | | | | | | | | Assets /
| | | | | Available
| | | Held for
| | | | | | Hedging of
| | | Cash
| | | Net investment
| | | | | | | | | | | | (Liabilities) | | | | | for sale(a) | | | trading | | | Financial debt(b) | | | financial debt | | | flow hedge | | | hedge and other | | | | | | | | | | | | Equity affiliates: | | | | | | | | | | | | | | | | | | | | | | | | | | | | | | | | | | | | | | | | | | loans | | | 2,383 | | | | | | | | | | | | | | | | | | | | | | | | | | | | | | | | 2,383 | | | | 2,383 | | | Other investments | | | | | | | 4,590 | | | | | | | | | | | | | | | | | | | | | | | | | | | | 4,590 | | | | 4,590 | | | Hedging instruments of non-current financial debt | | | | | | | | | | | | | | | | | | | 1,814 | | | | 56 | | | | | | | | | | | | 1,870 | | | | 1,870 | | | Other non-current assets | | | 1,596 | | | | | | | | | | | | | | | | | | | | | | | | | | | | | | | | 1,596 | | | | 1,596 | | | Accounts receivable, net | | | | | | | | | | | | | | | | | | | | | | | | | | | | | | | 18,159 | | | | 18,159 | | | | 18,159 | | | Other operating receivables | | | | | | | | | | | 499 | | | | | | | | | | | | | | | | | | | | 3,908 | | | | 4,407 | | | | 4,407 | | | Current financial assets | | | 869 | | | | | | | | 38 | | | | | | | | 292 | | | | | | | | 6 | | | | | | | | 1,205 | | | | 1,205 | | | Cash and cash equivalents | | | | | | | | | | | | | | | | | | | | | | | | | | | | | | | 14,489 | | | | 14,489 | | | | 14,489 | | | | | | | | | | | | | | | | | | | | | | | | | | | | | | | | | | | | | | | | | | | | Total financial assets | | | 4,848 | | | | 4,590 | | | | 537 | | | | — | | | | 2,106 | | | | 56 | | | | 6 | | | | 36,556 | | | | 48,699 | | | | 48,699 | | | | | | | | | | | | | | | | | | | | | | | | | | | | | | | | | | | | | | | | | | | | Total non-financial assets | | | | | | | | | | | | | | | | | | | | | | | | | | | | | | | | | | | 95,019 | | | | | | | | | | | | | | | | | | | | | | | | | | | | | | | | | | | | | | | | | | | | | | | | Total assets | | | | | | | | | | | | | | | | | | | | | | | | | | | | | | | | | | | 143,718 | | | | | | | | | | | | | | | | | | | | | | | | | | | | | | | | | | | | | | | | | | | | | | | | | | | | | | | | | | | | | | | | | | | | | | | | | | | | | | | | | | | | | | | | | | | Non-current financial | | | (3,186 | ) | | | | | | | | | | | (17,419 | ) | | | (178 | ) | | | | | | | | | | | | | | | (20,783 | ) | | | (21,172 | ) | | debt | | | | | | | | | | | | | | | | | | | | | | | | | | | | | | | | | | | | | | | | | | Accounts payable | | | | | | | | | | | | | | | | | | | | | | | | | | | | | | | (18,450 | ) | | | (18,450 | ) | | | (18,450 | ) | | Other operating | | | | | | | | | | | (559 | ) | | | | | | | | | | | | | | | | | | | (3,015 | ) | | | (3,574 | ) | | | (3,574 | ) | | liabilities | | | | | | | | | | | | | | | | | | | | | | | | | | | | | | | | | | | | | | | | | | Current borrowings | | | (5,916 | ) | | | | | | | | | | | (3,737 | ) | | | | | | | | | | | | | | | | | | | (9,653 | ) | | | (9,653 | ) | | Other current financial liabilities | | | | | | | | | | | (147 | ) | | | | | | | (12 | ) | | | | | | | — | | | | | | | | (159 | ) | | | (159 | ) | | | | | | | | | | | | | | | | | | | | | | | | | | | | | | | | | | | | | | | | | | | Total financial liabilities | | | (9,102 | ) | | | | | | | (706 | ) | | | (21,156 | ) | | | (190 | ) | | | — | | | | — | | | | (21,465 | ) | | | (52,619 | ) | | | (53,008 | ) | | | | | | | | | | | | | | | | | | | | | | | | | | | | | | | | | | | | | | | | | | | Total non-financial liabilities | | | | | | | | | | | | | | | | | | | | | | | | | | | | | | | | | | | (91,099 | ) | | | | | | | | | | | | | | | | | | | | | | | | | | | | | | | | | | | | | | | | | | | | | | | Total liabilities | | | | | | | | | | | | | | | | | | | | | | | | | | | | | | | | | | | (143,718 | ) | | | | |
| | | | | | | | | | | | | | | | | | | | | | | | | | | | | | | | | | | | | | | | | | | | Financial instruments related to financing and trading activities | | | Other financial
instruments | | | Total | | | Fair
value | | | | | Amortized
cost | | | Fair value | | | | | | | | | | | | As of December 31, 2011 (M€) Assets / (Liabilities) | | | | | Available
for sale(a) | | | Held for
trading | | | Financial
debt(b) | | | Hedging of
financial debt | | | Cash flow
hedge | | | Net investment
hedge and other | | | | | | | | | | | Equity affiliates: loans | | | 2,246 | | | | | | | | | | | | | | | | | | | | | | | | | | | | | | | | 2,246 | | | | 2,246 | | Other investments | | | | | | | 3,674 | | | | | | | | | | | | | | | | | | | | | | | | | | | | 3,674 | | | | 3,674 | | Hedging instruments of non-current financial debt | | | | | | | | | | | | | | | | | | | 1,971 | | | | 5 | | | | | | | | | | | | 1,976 | | | | 1,976 | | Other non-current assets | | | 2,055 | | | | | | | | | | | | | | | | | | | | | | | | | | | | | | | | 2,055 | | | | 2,055 | | Accounts receivable, net | | | | | | | | | | | | | | | | | | | | | | | | | | | | | | | 20,049 | | | | 20,049 | | | | 20,049 | | Other operating receivables | | | | | | | | | | | 1,074 | | | | | | | | | | | | | | | | | | | | 6,393 | | | | 7,467 | | | | 7,467 | | Current financial assets | | | 146 | | | | | | | | 159 | | | | | | | | 383 | | | | 12 | | | | — | | | | | | | | 700 | | | | 700 | | Cash and cash equivalents | | | | | | | | | | | | | | | | | | | | | | | | | | | | | | | 14,025 | | | | 14,025 | | | | 14,025 | | Total financial assets | | | 4,447 | | | | 3,674 | | | | 1,233 | | | | — | | | | 2,354 | | | | 17 | | | | — | | | | 40,467 | | | | 52,192 | | | | 52,192 | | Total non-financial assets | | | | | | | | | | | | | | | | | | | | | | | | | | | | | | | | | | | 111,857 | | | | | | Total assets | | | | | | | | | | | | | | | | | | | | | | | | | | | | | | | | | | | 164,049 | | | | | | Non-current financial debt | | | (4,858 | ) | | | | | | | | | | | (17,551 | ) | | | (97 | ) | | | (49 | ) | | | | | | | (2 | ) | | | (22,557 | ) | | | (23,247 | ) | Accounts payable | | | | | | | | | | | | | | | | | | | | | | | | | | | | | | | (22,086 | ) | | | (22,086 | ) | | | (22,086 | ) | Other operating liabilities | | | | | | | | | | | (606 | ) | | | | | | | | | | | | | | | | | | | (4,835 | ) | | | (5,441 | ) | | | (5,441 | ) | Current borrowings | | | (6,158 | ) | | | | | | | | | | | (3,517 | ) | | | | | | | | | | | | | | | | | | | (9,675 | ) | | | (9,675 | ) | Other current financial liabilities | | | | | | | | | | | (87 | ) | | | | | | | (40 | ) | | | (14 | ) | | | (26 | ) | | | | | | | (167 | ) | | | (167 | ) | Total financial liabilities | | | (11,016 | ) | | | — | | | | (693 | ) | | | (21,068 | ) | | | (137 | ) | | | (63 | ) | | | (26 | ) | | | (26,923 | ) | | | (59,926 | ) | | | (60,616 | ) | Total non-financial liabilities | | | | | | | | | | | | | | | | | | | | | | | | | | | | | | | | | | | (104,123 | ) | | | | | Total liabilities | | | | | | | | | | | | | | | | | | | | | | | | | | | | | | | | | | | (164,049 | ) | | | | |
| (a) | | | (a) | | Financial assets available for sale are measured at their fair value except for unlisted securities (see Note 1 paragraph M(ii) and Note 13 to the Consolidated Financial Statements). |
| (b) | | The financial debt is adjusted to the hedged risks value (currency and interest rate) as part of hedge accounting (see Note 1 paragraph M(iii) to the Consolidated Financial Statements). |
F-74
| | | | | | | | | | | | | | | | | | | | | | | | | | | | | | | | | | | | | | | | | | | | Financial instruments related to financing and trading activities | | | Other financial
instruments | | | Total | | | Fair
value | | | | | Amortized
cost | | | | | | Fair value | | | | | | | | | | | | | | | | | | As of December 31, 2010 (M€) Assets / (Liabilities) | | | | | Available
for sale(a) | | | Held for
trading | | | Financial
debt(b) | | | Hedging of
financial debt | | | Cash flow
hedge | | | Net investment
hedge and other | | | | | | | | | | | Equity affiliates: loans | | | 2,383 | | | | | | | | | | | | | | | | | | | | | | | | | | | | | | | | 2,383 | | | | 2,383 | | Other investments | | | | | | | 4,590 | | | | | | | | | | | | | | | | | | | | | | | | | | | | 4,590 | | | | 4,590 | | Hedging instruments of non-current financial debt | | | | | | | | | | | | | | | | | | | 1,814 | | | | 56 | | | | | | | | | | | | 1,870 | | | | 1,870 | | Other non-current assets | | | 1,596 | | | | | | | | | | | | | | | | | | | | | | | | | | | | | | | | 1,596 | | | | 1,596 | | Accounts receivable, net | | | | | | | | | | | | | | | | | | | | | | | | | | | | | | | 18,159 | | | | 18,159 | | | | 18,159 | | Other operating receivables | | | | | | | | | | | 499 | | | | | | | | | | | | | | | | | | | | 3,908 | | | | 4,407 | | | | 4,407 | | Current financial assets | | | 869 | | | | | | | | 38 | | | | | | | | 292 | | | | | | | | 6 | | | | | | | | 1,205 | | | | 1,205 | | Cash and cash equivalents | | | | | | | | | | | | | | | | | | | | | | | | | | | | | | | 14,489 | | | | 14,489 | | | | 14,489 | | Total financial assets | | | 4,848 | | | | 4,590 | | | | 537 | | | | — | | | | 2,106 | | | | 56 | | | | 6 | | | | 36,556 | | | | 48,699 | | | | 48,699 | | Total non-financial assets | | | | | | | | | | | | | | | | | | | | | | | | | | | | | | | | | | | 95,019 | | | | | | Total assets | | | | | | | | | | | | | | | | | | | | | | | | | | | | | | | | | | | 143,718 | | | | | | Non-current financial debt | | | (3,186 | ) | | | | | | | | | | | (17,419 | ) | | | (178 | ) | | | | | | | | | | | | | | | (20,783 | ) | | | (21,172 | ) | Accounts payable | | | | | | | | | | | | | | | | | | | | | | | | | | | | | | | (18,450 | ) | | | (18,450 | ) | | | (18,450 | ) | Other operating liabilities | | | | | | | | | | | (559 | ) | | | | | | | | | | | | | | | | | | | (3,015 | ) | | | (3,574 | ) | | | (3,574 | ) | Current borrowings | | | (5,916 | ) | | | | | | | | | | | (3,737 | ) | | | | | | | | | | | | | | | | | | | (9,653 | ) | | | (9,653 | ) | Other current financial liabilities | | | | | | | | | | | (147 | ) | | | | | | | (12 | ) | | | | | | | — | | | | | | | | (159 | ) | | | (159 | ) | Total financial liabilities | | | (9,102 | ) | | | | | | | (706 | ) | | | (21,156 | ) | | | (190 | ) | | | — | | | | — | | | | (21,465 | ) | | | (52,619 | ) | | | (53,008 | ) | Total non-financial liabilities | | | | | | | | | | | | | | | | | | | | | | | | | | | | | | | | | | | (91,099 | ) | | | | | Total liabilities | | | | | | | | | | | | | | | | | | | | | | | | | | | | | | | | | | | (143,718 | ) | | | | |
| | | | | | | | | | | | | | | | | | | | | | | | | | | | | | | | | | | | | | | | | | | | | | | | Other financial
| | | | | | Fair
| | | | | Financial instruments related to financing and trading activities | | | instruments | | | Total | | | value | | | | | | | | | | | As of December 31, 2009 | | Amortized
| | | Fair
| | | | | | | | | | | (M€)
| | cost | | | value | | | | | | | | | | | Assets /
| | | | | Available
| | | Held for
| | | | | | Hedging of
| | | Cash
| | | Net investment
| | | | | | | | | | | | (Liabilities) | | | | | for sale(a) | | | trading | | | Financial debt(b) | | | financial debt | | | flow hedge | | | hedge and other | | | | | | | | | | | | Equity affiliates: | | | | | | | | | | | | | | | | | | | | | | | | | | | | | | | | | | | | | | | | | | loans | | | 2,367 | | | | | | | | | | | | | | | | | | | | | | | | | | | | | | | | 2,367 | | | | 2,367 | | | Other investments | | | | | | | 1,162 | | | | | | | | | | | | | | | | | | | | | | | | | | | | 1,162 | | | | 1,162 | | | Hedging instruments of non-current financial debt | | | | | | | | | | | | | | | | | | | 889 | | | | 136 | | | | | | | | | | | | 1,025 | | | | 1,025 | | | Other non-current assets | | | 1,284 | | | | | | | | | | | | | | | | | | | | | | | | | | | | | | | | 1,284 | | | | 1,284 | | | Accounts receivable, net | | | | | | | | | | | | | | | | | | | | | | | | | | | | | | | 15,719 | | | | 15,719 | | | | 15,719 | | | Other operating receivables | | | | | | | | | | | 1,029 | | | | | | | | | | | | | | | | | | | | 4,116 | | | | 5,145 | | | | 5,145 | | | Current financial assets | | | 55 | | | | | | | | 53 | | | | | | | | 197 | | | | | | | | 6 | | | | | | | | 311 | | | | 311 | | | Cash and cash equivalents | | | | | | | | | | | | | | | | | | | | | | | | | | | | | | | 11,662 | | | | 11,662 | | | | 11,662 | | | | | | | | | | | | | | | | | | | | | | | | | | | | | | | | | | | | | | | | | | | | Total financial assets | | | 3,706 | | | | 1,162 | | | | 1,082 | | | | — | | | | 1,086 | | | | 136 | | | | 6 | | | | 31,497 | | | | 38,675 | | | | 38,675 | | | | | | | | | | | | | | | | | | | | | | | | | | | | | | | | | | | | | | | | | | | | Total non-financial assets | | | | | | | | | | | | | | | | | | | | | | | | | | | | | | | | | | | 89,078 | | | | | | | | | | | | | | | | | | | | | | | | | | | | | | | | | | | | | | | | | | | | | | | | Total assets | | | | | | | | | | | | | | | | | | | | | | | | | | | | | | | | | | | 127,753 | | | | | | | | | | | | | | | | | | | | | | | | | | | | | | | | | | | | | | | | | | | | | | | | | Non-current financial debt | | | (2,089 | ) | | | | | | | | | | | (17,107 | ) | | | (241 | ) | | | | | | | | | | | | | | | (19,437 | ) | | | (19,905 | ) | | Accounts payable | | | | | | | | | | | | | | | | | | | | | | | | | | | | | | | (15,383 | ) | | | (15,383 | ) | | | (15,383 | ) | | Other operating liabilities | | | | | | | | | | | (923 | ) | | | | | | | | | | | | | | | | | | | (3,783 | ) | | | (4,706 | ) | | | (4,706 | ) | | Current borrowings | | | (4,849 | ) | | | | | | | | | | | (2,145 | ) | | | | | | | | | | | | | | | | | | | (6,994 | ) | | | (6,994 | ) | | Other current financial liabilities | | | | | | | | | | | (25 | ) | | | | | | | (97 | ) | | | | | | | (1 | ) | | | | | | | (123 | ) | | | (123 | ) | | | | | | | | | | | | | | | | | | | | | | | | | | | | | | | | | | | | | | | | | | | Total financial liabilities | | | (6,938 | ) | | | | | | | (948 | ) | | | (19,252 | ) | | | (338 | ) | | | — | | | | (1 | ) | | | (19,166 | ) | | | (46,643 | ) | | | (47,111 | ) | | | | | | | | | | | | | | | | | | | | | | | | | | | | | | | | | | | | | | | | | | | Total non-financial liabilities | | | | | | | | | | | | | | | | | | | | | | | | | | | | | | | | | | | (81,110 | ) | | | | | | | | | | | | | | | | | | | | | | | | | | | | | | | | | | | | | | | | | | | | | | | Total liabilities | | | | | | | | | | | | | | | | | | | | | | | | | | | | | | | | | | | (127,753 | ) | | | | | | | | | | | | | | | | | | | | | | | | | | | | | | | | | | | | | | | | | | | | | | |
| (a) | | | (a) | | Financial assets available for sale are measured at their fair value except for unlisted securities (see Note 1 paragraph M(ii) and Note 13 to the Consolidated Financial Statements). |
| (b) | | The financial debt is adjusted to the hedged risks value (currency and interest rate) as part of hedge accounting (see Note 1 paragraph M(iii) to the Consolidated Financial Statements). |
F-75
| | | | | | | | | | | | | | | | | | | | | | | | | | | | | | | | | | | | | | | | | | | | Financial instruments related to financing and trading activities | | | Other financial
instruments | | | Total | | | Fair
value | | | | | Amortized
cost | | | | | | Fair value | | | | | | | | | | | | | | | | | | As of December 31, 2009 (M€) Assets / (Liabilities) | | | | | Available
for sale(a) | | | Held for
trading | | | Financial
debt(b) | | | Hedging of
financial debt | | | Cash flow
hedge | | | Net investment
hedge and other | | | | | | | | | | | Equity affiliates: loans | | | 2,367 | | | | | | | | | | | | | | | | | | | | | | | | | | | | | | | | 2,367 | | | | 2,367 | | Other investments | | | | | | | 1,162 | | | | | | | | | | | | | | | | | | | | | | | | | | | | 1,162 | | | | 1,162 | | Hedging instruments of non-current financial debt | | | | | | | | | | | | | | | | | | | 889 | | | | 136 | | | | | | | | | | | | 1,025 | | | | 1,025 | | Other non-current assets | | | 1,284 | | | | | | | | | | | | | | | | | | | | | | | | | | | | | | | | 1,284 | | | | 1,284 | | Accounts receivable, net | | | | | | | | | | | | | | | | | | | | | | | | | | | | | | | 15,719 | | | | 15,719 | | | | 15,719 | | Other operating receivables | | | | | | | | | | | 1,029 | | | | | | | | | | | | | | | | | | | | 4,116 | | | | 5,145 | | | | 5,145 | | Current financial assets | | | 55 | | | | | | | | 53 | | | | | | | | 197 | | | | | | | | 6 | | | | | | | | 311 | | | | 311 | | Cash and cash equivalents | | | | | | | | | | | | | | | | | | | | | | | | | | | | | | | 11,662 | | | | 11,662 | | | | 11,662 | | Total financial assets | | | 3,706 | | | | 1,162 | | | | 1,082 | | | | — | | | | 1,086 | | | | 136 | | | | 6 | | | | 31,497 | | | | 38,675 | | | | 38,675 | | Total non-financial assets | | | | | | | | | | | | | | | | | | | | | | | | | | | | | | | | | | | 89,078 | | | | | | Total assets | | | | | | | | | | | | | | | | | | | | | | | | | | | | | | | | | | | 127,753 | | | | | | Non-current financial debt | | | (2,089 | ) | | | | | | | | | | | (17,107 | ) | | | (241 | ) | | | | | | | | | | | | | | | (19,437 | ) | | | (19,905 | ) | Accounts payable | | | | | | | | | | | | | | | | | | | | | | | | | | | | | | | (15,383 | ) | | | (15,383 | ) | | | (15,383 | ) | Other operating liabilities | | | | | | | | | | | (923 | ) | | | | | | | | | | | | | | | | | | | (3,783 | ) | | | (4,706 | ) | | | (4,706 | ) | Current borrowings | | | (4,849 | ) | | | | | | | | | | | (2,145 | ) | | | | | | | | | | | | | | | | | | | (6,994 | ) | | | (6,994 | ) | Other current financial liabilities | | | | | | | | | | | (25 | ) | | | | | | | (97 | ) | | | | | | | (1 | ) | | | | | | | (123 | ) | | | (123 | ) | Total financial liabilities | | | (6,938 | ) | | | | | | | (948 | ) | | | (19,252 | ) | | | (338 | ) | | | — | | | | (1 | ) | | | (19,166 | ) | | | (46,643 | ) | | | (47,111 | ) | Total non-financial liabilities | | | | | | | | | | | | | | | | | | | | | | | | | | | | | | | | | | | (81,110 | ) | | | | | Total liabilities | | | | | | | | | | | | | | | | | | | | | | | | | | | | | | | | | | | (127,753 | ) | | | | |
| | | | | | | | | | | | | | | | | | | | | | | | | | | | | | | | | | | | | | | | | | | | | | | | Other financial
| | | | | | Fair
| | | | | Financial instruments related to financing and trading activities | | | instruments | | | Total | | | value | | | | | | | | | | | As of December 31, 2008 | | Amortized
| | | Fair
| | | | | | | | | | | (M€)
| | cost | | | value | | | | | | | | | | | Assets /
| | | | | Available
| | | Held for
| | | | | | Hedging of
| | | | | | Net investment
| | | | | | | | | | | | (Liabilities) | | | | | for sale(a) | | | trading | | | Financial debt(b) | | | financial debt | | | Cash flow hedge | | | hedge and other | | | | | | | | | | | | Equity affiliates: | | | | | | | | | | | | | | | | | | | | | | | | | | | | | | | | | | | | | | | | | | loans | | | 2,005 | | | | | | | | | | | | | | | | | | | | | | | | | | | | | | | | 2,005 | | | | 2,005 | | | Other investments | | | | | | | 1,165 | | | | | | | | | | | | | | | | | | | | | | | | | | | | 1,165 | | | | 1,165 | | | Hedging instruments of non-current financial debt | | | | | | | | | | | | | | | | | | | 892 | | | | | | | | | | | | | | | | 892 | | | | 892 | | | Other non-current assets | | | 1,403 | | | | | | | | | | | | | | | | | | | | | | | | | | | | | | | | 1,403 | | | | 1,403 | | | Accounts receivable, net | | | | | | | | | | | — | | | | | | | | | | | | | | | | | | | | 15,287 | | | | 15,287 | | | | 15,287 | | | Other operating receivables | | | | | | | | | | | 1,664 | | | | | | | | | | | | | | | | | | | | 4,544 | | | | 6,208 | | | | 6,208 | | | Current financial assets | | | 1 | | | | | | | | 86 | | | | | | | | 100 | | | | | | | | — | | | | | | | | 187 | | | | 187 | | | Cash and cash | | | | | | | | | | | | | | | | | | | | | | | | | | | | | | | 12,321 | | | | 12,321 | | | | 12,321 | | | equivalents | | | | | | | | | | | | | | | | | | | | | | | | | | | | | | | | | | | | | | | | | | | | | | | | | | | | | | | | | | | | | | | | | | | | | | | | | | | | | | | | | | | Total financial assets | | | 3,409 | | | | 1,165 | | | | 1,750 | | | | — | | | | 992 | | | | — | | | | — | | | | 32,152 | | | | 39,468 | | | | 39,468 | | | | | | | | | | | | | | | | | | | | | | | | | | | | | | | | | | | | | | | | | | | | Total non-financial assets | | | | | | | | | | | | | | | | | | | | | | | | | | | | | | | | | | | 78,842 | | | | | | | | | | | | | | | | | | | | | | | | | | | | | | | | | | | | | | | | | | | | | | | | Total assets | | | | | | | | | | | | | | | | | | | | | | | | | | | | | | | | | | | 118,310 | | | | | | | | | | | | | | | | | | | | | | | | | | | | | | | | | | | | | | | | | | | | | | | | | Non-current financial debt | | | (701 | ) | | | | | | | | | | | (15,050 | ) | | | (440 | ) | | | | | | | | | | | | | | | (16,191 | ) | | | (16,191 | ) | | Accounts payable | | | | | | | | | | | — | | | | | | | | | | | | | | | | | | | | (14,815 | ) | | | (14,815 | ) | | | (14,815 | ) | | Other operating liabilities | | | | | | | | | | | (1,033 | ) | | | | | | | | | | | | | | | | | | | (3,264 | ) | | | (4,297 | ) | | | (4,297 | ) | | Current borrowings | | | (5,721 | ) | | | | | | | | | | | (2,001 | ) | | | | | | | | | | | | | | | | | | | (7,722 | ) | | | (7,722 | ) | | Other current financial liabilities | | | | | | | | | | | (146 | ) | | | | | | | (12 | ) | | | | | | | | | | | | | | | (158 | ) | | | (158 | ) | | | | | | | | | | | | | | | | | | | | | | | | | | | | | | | | | | | | | | | | | | | Total financial liabilities | | | (6,422 | ) | | | | | | | (1,179 | ) | | | (17,051 | ) | | | (452 | ) | | | — | | | | — | | | | (18,079 | ) | | | (43,183 | ) | | | (43,183 | ) | | | | | | | | | | | | | | | | | | | | | | | | | | | | | | | | | | | | | | | | | | | Total non-financial liabilities | | | | | | | | | | | | | | | | | | | | | | | | | | | | | | | | | | | (75,127 | ) | | | | | | | | | | | | | | | | | | | | | | | | | | | | | | | | | | | | | | | | | | | | | | | Total liabilities | | | | | | | | | | | | | | | | | | | | | | | | | | | | | | | | | | | (118,310 | ) | | | | | | | | | | | | | | | | | | | | | | | | | | | | | | | | | | | | | | | | | | | | | | |
| (a) | | | (a) | | Financial assets available for sale are measured at their fair value except for unlisted securities (see Note 1 paragraph M(ii) and Note 13 to the Consolidated Financial Statements). |
| (b) | | | (b) | | The financial debt is adjusted to the hedged risks value (currency and interest rate) as part of hedge accounting (see Note 1 paragraph M(iii) to the Consolidated Financial Statements). |
F-76
29)FAIR VALUE OF FINANCIAL INSTRUMENTS (EXCLUDING COMMODITY CONTRACTS) | A) | | 29) | FAIR VALUE OF FINANCIAL INSTRUMENTS (EXCLUDING COMMODITY CONTRACTS) |
| | A) | IMPACT ON THE STATEMENT OF INCOME PER NATURE OF FINANCIAL INSTRUMENTS |
Operating assets and liabilities The impact on the statement of income is detailed as follows: | | | | | | | | | | | | | | | For the year ended December 31, | | | | | | | | | | | (M€) | | 2010 | | | 2009 | | | 2008 | | | Assets available for sale (investments): | | | | | | | | | | | | | | — Dividend income on non-consolidated subsidiaries | | | 255 | | | | 210 | | | | 238 | | | — Gains (losses) on disposal of assets | | | 60 | | | | 6 | | | | 15 | | | — Other | | | (17 | ) | | | (18 | ) | | | (15 | ) | | Loans and receivables | | | 90 | | | | 41 | | | | 100 | | | | | | | | | | | | | | | | Impact on net operating income | | | 388 | | | | 239 | | | | 338 | | | | | | | | | | | | | | | |
| | | | | | | | | | | | | For the year ended December 31,
(M€) | | 2011 | | | 2010 | | | 2009 | | Assets available for sale (investments): | | | | | | | | | | | | | — dividend income on non-consolidated subsidiaries | | | 330 | | | | 255 | | | | 210 | | — gains (losses) on disposal of assets | | | 103 | | | | 60 | | | | 6 | | — other | | | (29 | ) | | | (17 | ) | | | (18 | ) | Loans and receivables | | | (34 | ) | | | 90 | | | | 41 | | Impact on net operating income | | | 370 | | | | 388 | | | | 239 | |
The impact in the statement of income mainly includes: Dividends and gains or losses on disposal of other investments classified as “Other investments”; Financial gains and depreciation on loans related to equity affiliates, non-consolidated companies and on receivables reported in “Loans and receivables”. | | • | Dividends and gains or losses on disposal of other investments classified as “Other investments”; | • | Financial gains and depreciation on loans related to equity affiliates, non-consolidated companies and on receivables reported in “Loans and receivables”. |
Assets and liabilities from financing activities The impact on the statement of income of financing assets and liabilities is detailed as follows: | | | | | | | | | | | | | | | For the year ended December 31, | | | | | | | | | | | (M€) | | 2010 | | | 2009 | | | 2008 | | | Loans and receivables | | | 133 | | | | 158 | | | | 547 | | | Financing liabilities and associated hedging instruments | | | (469 | ) | | | (563 | ) | | | (996 | ) | | Fair value hedge (ineffective portion) | | | 4 | | | | 33 | | | | (4 | ) | | Assets and liabilities held for trading | | | (2 | ) | | | (26 | ) | | | (74 | ) | | | | | | | | | | | | | | | Impact on the cost of net debt | | | (334 | ) | | | (398 | ) | | | (527 | ) | | | | | | | | | | | | | | |
| | | | | | | | | | | | | For the year ended December 31,
(M€) | | 2011 | | | 2010 | | | 2009 | | Loans and receivables | | | 271 | | | | 133 | | | | 158 | | Financing liabilities and associated hedging instruments | | | (730 | ) | | | (469 | ) | | | (563 | ) | Fair value hedge (ineffective portion) | | | 17 | | | | 4 | | | | 33 | | Assets and liabilities held for trading | | | 2 | | | | (2 | ) | | | (26 | ) | Impact on the cost of net debt | | | (440 | ) | | | (334 | ) | | | (398 | ) |
The impact on the statement of income mainly includes: Financial income on cash, cash equivalents, and current financial assets (notably current deposits | | • | Financial income on cash, cash equivalents, and current financial assets (notably current deposits beyond three months) classified as “Loans and receivables”; | • | Financial expense of long term subsidiaries financing, associated hedging instruments (excluding ineffective portion of the hedge detailed below) and financial expense of short term financing classified as “Financing liabilities and associated hedging instruments”; | • | Ineffective portion of bond hedging; and | • | Financial income, financial expense and fair value of derivative instruments used for cash management purposes classified as “Assets and liabilities held for trading”. |
Financial expense of long term subsidiaries financing, associated hedging instruments (excluding ineffective portion of the hedge detailed below) and financial expense of short term financing classified as “Financing liabilities and associated hedging instruments”; Ineffective portion of bond hedging; and Financial income, financial expense and fair value of derivative instruments used for cash management purposes classified as “Assets and liabilities held for trading”. Financial derivative instruments used for cash management purposes (interest rate and foreign exchange) are considered to be held for trading. Based on practical documentation issues, the Group did not elect to set up hedge accounting for such instruments. The impact on income of the derivatives is offset by the impact of loans and current liabilities they are related to. Therefore these transactions taken as a whole do not have a significant impact on the Consolidated Financial Statements. | B) | | B) | IMPACT OF THE HEDGING STRATEGIES |
The impact on the statement of income of the bond hedging instruments which is recorded in the item “Financial interest on debt” in the Consolidated Statement of Income is detailed as follows: | | | | | | | | | | | | | | | For the year ended December 31, | | | | | | | | | | | (M€) | | 2010 | | | 2009 | | | 2008 | | | Revaluation at market value of | | | | | | | | | | | | | | bonds | | | (1,164 | ) | | | (183 | ) | | | (66 | ) | | Swap hedging of bonds | | | 1,168 | | | | 216 | | | | 62 | | | | | | | | | | | | | | | | Ineffective portion of the fair value hedge | | | 4 | | | | 33 | | | | (4 | ) | | | | | | | | | | | | | | |
| | | | | | | | | | | | | For the year ended December 31,
(M€) | | 2011 | | | 2010 | | | 2009 | | Revaluation at market value of bonds | | | (301 | ) | | | (1,164 | ) | | | (183 | ) | Swap hedging of bonds | | | 318 | | | | 1,168 | | | | 216 | | Ineffective portion of the fair value hedge | | | 17 | | | | 4 | | | | 33 | |
The ineffective portion is not representative of the Group’s performance considering the Group’s objective to hold swaps to maturity. The current portion of the swaps valuation is not subject to active management.
F-77
Net investment hedge These instruments are recorded directly in shareholders’ equity under “Currency translation adjustments”. The variations of the period are detailed in the table below: | | | | | | | | | | | | | | | | | | | For the year ended December 31, (M€) | | As of January 1, | | | Variations | | | Disposals | | | As of December 31, | | 2010 | | | 25 | | | | (268 | ) | | | — | | | | (243 | ) | | 2009 | | | 124 | | | | (99 | ) | | | — | | | | 25 | | | 2008 | | | 29 | | | | 95 | | | | — | | | | 124 | | | | | | | | | | | | | | | | | | | |
| | | | | | | | | | | | | | | | | | For the year ended December 31, (M€) | | As of January 1, | | | Variations | | | Disposals | | | As of December 31, | | 2011 | | | (243 | ) | | | 139 | | | | — | | | | (104 | ) | 2010 | | | 25 | | | | (268 | ) | | | — | | | | (243 | ) | 2009 | | | 124 | | | | (99 | ) | | | — | | | | 25 | |
As of December 31, 2010,2011, the fair value of the open instruments amounts to €6€(26) million compared to €5€6 million in 20092010 and zero€5 million in 2008. The impact on the statement of income and on equity of the bond hedging instruments qualified as cash flow hedges is detailed as follows: | | | | | | | | | | | | | | | For The year ended December 31, (M€) | | 2010 | | | 2009 | | | 2008 | | | Profit (Loss) recorded in equity during the period | | | (80 | ) | | | 128 | | | | — | | | Recycled amount from equity to the income statement during the period | | | (115 | ) | | | 221 | | | | — | | | | | | | | | | | | | | | |
| | | | | | | | | | | | | | For the year ended December 31, (M€) | | 2011 | | | 2010 | | | 2009 | | Profit (Loss) recorded in equity during the period | | | (84 | ) | | | (80 | ) | | | 128 | | Recycled amount from equity to the income statement during the period | | | (47 | ) | | | (115 | ) | | | 221 | |
As of December 31, 2011, 2010 and 2009, the ineffective portion of these financial instruments is equal to zero.
F-78
| C) | | C) | MATURITY OF DERIVATIVE INSTRUMENTS |
The maturity of the notional amounts of derivative instruments, excluding the commodity contracts, is detailed in the following table: | | | | | | | | | | | | | | | | | | | | | | | | | | | | | | | | | | | As of December 31, 2010 (M€) | | | | | Notional value(a) | | | | | | | | | | | | | | | | | | | | | | | | | | 2016
| | | | | Fair
| | | | | | | | | | | | | | | | | | | | | and
| | | ASSETS/(LIABILITIES) | | value | | | Total | | | 2011 | | | 2012 | | | 2013 | | | 2014 | | | 2015 | | | after | | Fair value hedge | | | | | | | | | | | | | | | | | | | | | | | | | | | | | | | | | | Swaps hedging fixed-rates bonds (liabilities) | | | (178 | ) | | | 2,244 | | | | | | | | | | | | | | | | | | | | | | | | | | | Swaps hedging fixed-rates bonds (assets) | | | 1,814 | | | | 13,939 | | | | | | | | | | | | | | | | | | | | | | | | | | | | | | | | | | | | | | | | | | | | | | | | | | | | | | | | | | | | Total swaps hedging fixed-rates bonds (assets and liabilities) | | | 1,636 | | | | 16,183 | | | | | | | | 2,967 | | | | 3,461 | | | | 2,421 | | | | 3,328 | | | | 4,006 | | | Swaps hedging fixed-rates bonds (current portion) (liabilities) | | | (12 | ) | | | 592 | | | | | | | | | | | | | | | | | | | | | | | | | | | Swaps hedging fixed-rates bonds (current portion) (assets) | | | 292 | | | | 2,815 | | | | | | | | | | | | | | | | | | | | | | | | | | | | | | | | | | | | | | | | | | | | | | | | | | | | | | | | | | | | Total swaps hedging fixed-rates bonds (current portion) (assets and liabilities) | | | 280 | | | | 3,407 | | | | 3,407 | | | | | | | | | | | | | | | | | | | | | | Cash flow hedge | | | | | | | | | | | | | | | | | | | | | | | | | | | | | | | | | | Swaps hedging fixed-rates bonds (liabilities) | | | — | | | | — | | | | | | | | | | | | | | | | | | | | | | | | | | | Swaps hedging fixed-rates bonds (assets) | | | 56 | | | | 1,957 | | | | | | | | | | | | | | | | | | | | | | | | | | | | | | | | | | | | | | | | | | | | | | | | | | | | | | | | | | | | Total swaps hedging fixed-rates bonds (assets and liabilities) | | | 56 | | | | 1,957 | | | | | | | | 295 | | | | | | | | | | | | | | | | 1,662 | | | Swaps hedging fixed-rates bonds (current portion) (liabilities) | | | | | | | | | | | | | | | | | | | | | | | | | | | | | | | | | | Swaps hedging fixed-rates bonds (current portion) (assets) | | | | | | | | | | | | | | | | | | | | | | | | | | | | | | | | | | | | | | | | | | | | | | | | | | | | | | | | | | | | | | | | | | | Total swaps hedging fixed-rates bonds (current portion) (assets and liabilities) | | | — | | | | — | | | | — | | | | | | | | | | | | | | | | | | | | | | Net investment hedge | | | | | | | | | | | | | | | | | | | | | | | | | | | | | | | | | | Currency swaps and forward exchange contracts (assets) | | | 6 | | | | 381 | | | | | | | | | | | | | | | | | | | | | | | | | | | Currency swaps and forward exchange contracts (liabilities) | | | — | �� | | | — | | | | | | | | | | | | | | | | | | | | | | | | | | | | | | | | | | | | | | | | | | | | | | | | | | | | | | | | | | | | Total swaps hedging net investments | | | 6 | | | | 381 | | | | 381 | | | | | | | | | | | | | | | | | | | | | | Held for trading | | | | | | | | | | | | | | | | | | | | | | | | | | | | | | | | | | Other interest rate swaps (assets) | | | 1 | | | | 6,463 | | | | | | | | | | | | | | | | | | | | | | | | | | | Other interest rate swaps (liabilities) | | | (3 | ) | | | 11,395 | | | | | | | | | | | | | | | | | | | | | | | | | | | | | | | | | | | | | | | | | | | | | | | | | | | | | | | | | | | | Total other interest rate swaps (assets and liabilities) | | | (2 | ) | | | 17,858 | | | | 17,667 | | | | 189 | | | | — | | | | — | | | | 2 | | | | — | | | Currency swaps and forward exchange contracts (assets) | | | 37 | | | | 1,532 | | | | | | | | | | | | | | | | | | | | | | | | | | | Currency swaps and forward exchange contracts (liabilities) | | | (144 | ) | | | 6,757 | | | | | | | | | | | | | | | | | | | | | | | | | | | | | | | | | | | | | | | | | | | | | | | | | | | | | | | | | | | | Total currency swaps and forward exchange contracts (assets and liabilities) | | | (107 | ) | | | 8,289 | | | | 8,102 | | | | — | | | | 25 | | | | 49 | | | | 31 | | | | 82 | | | | | | | | | | | | | | | | | | | | | | | | | | | | | | | | | | | |
| | | | | | | | | | | | | | | | | | | | | | | | | | | | | | | | | As of December 31, 2011 (M€) Assets / (Liabilities) | | Fair
value | | | Notional value(a) | | | | | Total | | | 2012 | | | 2013 | | | 2014 | | | 2015 | | | 2016 | | | 2017
and
after | | Fair value hedge | | | | | | | | | | | | | | | | | | | | | | | | | | | | | | | | | Swaps hedging fixed-rates bonds (liabilities) | | | (97 | ) | | | 1,478 | | | | | | | | | | | | | | | | | | | | | | | | | | Swaps hedging fixed-rates bonds (assets) | | | 1,971 | | | | 15,653 | | | | | | | | | | | | | | | | | | | | | | | | | | Total swaps hedging fixed-rates bonds (assets and liabilities) | | | 1,874 | | | | 17,131 | | | | | | | | 4,204 | | | | 4,215 | | | | 3,380 | | | | 1,661 | | | | 3,671 | | Swaps hedging fixed-rates bonds (current portion) (liabilities) | | | (40 | ) | | | 642 | | | | | | | | | | | | | | | | | | | | | | | | | | Swaps hedging fixed-rates bonds (current portion) (assets) | | | 383 | | | | 2,349 | | | | | | | | | | | | | | | | | | | | | | | | | | Total swaps hedging fixed-rates bonds (current portion) (assets and liabilities) | | | 343 | | | | 2,991 | | | | 2,991 | | | | | | | | | | | | | | | | | | | | | | Cash flow hedge | | | | | | | | | | | | | | | | | | | | | | | | | | | | | | | | | Swaps hedging fixed-rates bonds (liabilities) | | | (49 | ) | | | 967 | | | | | | | | | | | | | | | | | | | | | | | | | | Swaps hedging fixed-rates bonds (assets) | | | 5 | | | | 749 | | | | | | | | | | | | | | | | | | | | | | | | | | Total swaps hedging fixed-rates bonds (assets and liabilities) | | | (44 | ) | | | 1,716 | | | | | | | | — | | | | — | | | | — | | | | — | | | | 1,716 | | Swaps hedging fixed-rates bonds (current portion) (liabilities) | | | (14 | ) | | | 582 | | | | | | | | | | | | | | | | | | | | | | | | | | Swaps hedging fixed-rates bonds (current portion) (assets) | | | 12 | | | | 908 | | | | | | | | | | | | | | | | | | | | | | | | | | Total swaps hedging fixed-rates bonds (current portion) (assets and liabilities) | | | (2 | ) | | | 1,490 | | | | 1,490 | | | | | | | | | | | | | | | | | | | | | | Net investment hedge | | | | | | | | | | | | | | | | | | | | | | | | | | | | | | | | | Currency swaps and forward exchange contracts (assets) | | | — | | | | — | | | | | | | | | | | | | | | | | | | | | | | | | | Currency swaps and forward exchange contracts (liabilities) | | | (26 | ) | | | 881 | | | | | | | | | | | | | | | | | | | | | | | | | | Total swaps hedging net investments | | | (26 | ) | | | 881 | | | | 881 | | | | | | | | | | | | | | | | | | | | | | Held for trading | | | | | | | | | | | | | | | | | | | | | | | | | | | | | | | | | Other interest rate swaps (assets) | | | 1 | | | | 3,605 | | | | | | | | | | | | | | | | | | | | | | | | | | Other interest rate swaps (liabilities) | | | (2 | ) | | | 14,679 | | | | | | | | | | | | | | | | | | | | | | | | | | Total other interest rate swaps (assets and liabilities) | | | (1 | ) | | | 18,284 | | | | 18,284 | | | | — | | | | — | | | | — | | | | — | | | | — | | Currency swaps and forward exchange contracts (assets) | | | 158 | | | | 6,984 | | | | | | | | | | | | | | | | | | | | | | | | | | Currency swaps and forward exchange contracts (liabilities) | | | (85 | ) | | | 4,453 | | | | | | | | | | | | | | | | | | | | | | | | | | Total currency swaps and forward exchange contracts (assets and liabilities) | | | 73 | | | | 11,437 | | | | 11,176 | | | | 80 | | | | 58 | | | | 36 | | | | 31 | | | | 56 | |
| (a) | | | (a) | | These amounts set the levels of notional commitment and are not indicative of a contingent gain or loss. |
F-79
| | | | | | | | | | | | | | | | | | | | | | | | | | | | | | | | | As of December 31, 2010 (M€) Assets / (Liabilities) | | | | | Notional value(a) | | | | Fair
value | | | Total | | | 2011 | | | 2012 | | | 2013 | | | 2014 | | | 2015 | | | 2016
and
after | | Fair value hedge | | | | | | | | | | | | | | | | | | | | | | | | | | | | | | | | | Swaps hedging fixed-rates bonds (liabilities) | | | (178 | ) | | | 2,244 | | | | | | | | | | | | | | | | | | | | | | | | | | Swaps hedging fixed-rates bonds (assets) | | | 1,814 | | | | 13,939 | | | | | | | | | | | | | | | | | | | | | | | | | | Total swaps hedging fixed-rates bonds (assets and liabilities) | | | 1,636 | | | | 16,183 | | | | | | | | 2,967 | | | | 3,461 | | | | 2,421 | | | | 3,328 | | | | 4,006 | | Swaps hedging fixed-rates bonds (current portion) (liabilities) | | | (12 | ) | | | 592 | | | | | | | | | | | | | | | | | | | | | | | | | | Swaps hedging fixed-rates bonds (current portion) (assets) | | | 292 | | | | 2,815 | | | | | | | | | | | | | | | | | | | | | | | | | | Total swaps hedging fixed-rates bonds (current portion) (assets and liabilities) | | | 280 | | | | 3,407 | | | | 3,407 | | | | | | | | | | | | | | | | | | | | | | Cash flow hedge | | | | | | | | | | | | | | | | | | | | | | | | | | | | | | | | | Swaps hedging fixed-rates bonds (liabilities) | | | — | | | | — | | | | | | | | | | | | | | | | | | | | | | | | | | Swaps hedging fixed-rates bonds (assets) | | | 56 | | | | 1,957 | | | | | | | | | | | | | | | | | | | | | | | | | | Total swaps hedging fixed-rates bonds (assets and liabilities) | | | 56 | | | | 1,957 | | | | | | | | 295 | | | | | | | | | | | | | | | | 1,662 | | Swaps hedging fixed-rates bonds (current portion) (liabilities) | | | | | | | | | | | | | | | | | | | | | | | | | | | | | | | | | Swaps hedging fixed-rates bonds (current portion) (assets) | | | | | | | | | | | | | | | | | | | | | | | | | | | | | | | | | Total swaps hedging fixed-rates bonds (current portion) (assets and liabilities) | | | — | | | | — | | | | — | | | | | | | | | | | | | | | | | | | | | | Net investment hedge | | | | | | | | | | | | | | | | | | | | | | | | | | | | | | | | | Currency swaps and forward exchange contracts (assets) | | | 6 | | | | 381 | | | | | | | | | | | | | | | | | | | | | | | | | | Currency swaps and forward exchange contracts (liabilities) | | | — | | | | — | | | | | | | | | | | | | | | | | | | | | | | | | | Total swaps hedging net investments | | | 6 | | | | 381 | | | | 381 | | | | | | | | | | | | | | | | | | | | | | Held for trading | | | | | | | | | | | | | | | | | | | | | | | | | | | | | | | | | Other interest rate swaps (assets) | | | 1 | | | | 6,463 | | | | | | | | | | | | | | | | | | | | | | | | | | Other interest rate swaps (liabilities) | | | (3 | ) | | | 11,395 | | | | | | | | | | | | | | | | | | | | | | | | | | Total other interest rate swaps (assets and liabilities) | | | (2 | ) | | | 17,858 | | | | 17,667 | | | | 189 | | | | — | | | | — | | | | 2 | | | | — | | Currency swaps and forward exchange contracts (assets) | | | 37 | | | | 1,532 | | | | | | | | | | | | | | | | | | | | | | | | | | Currency swaps and forward exchange contracts (liabilities) | | | (144 | ) | | | 6,757 | | | | | | | | | | | | | | | | | | | | | | | | | | Total currency swaps and forward exchange contracts (assets and liabilities) | | | (107 | ) | | | 8,289 | | | | 8,102 | | | | — | | | | 25 | | | | 49 | | | | 31 | | | | 82 | |
| | | | | | | | | | | | | | | | | | | | | | | | | | | | | | | | | | | As of December 31, 2009 (M€) | | | | | Notional value(a) | | | | | | | | | | | | | | | | | | | | | | | | | | 2015
| | | | | Fair
| | | | | | | | | | | | | | | | | | | | | and
| | | ASSETS/(LIABILITIES) | | value | | | Total | | | 2010 | | | 2011 | | | 2012 | | | 2013 | | | 2014 | | | after | | Fair value hedge | | | | | | | | | | | | | | | | | | | | | | | | | | | | | | | | | | Swaps hedging fixed-rates bonds (liabilities) | | | (241 | ) | | | 4,615 | | | | | | | | | | | | | | | | | | | | | | | | | | | Swaps hedging fixed-rates bonds (assets) | | | 889 | | | | 11,076 | | | | | | | | | | | | | | | | | | | | | | | | | | | | | | | | | | | | | | | | | | | | | | | | | | | | | | | | | | | | Total swaps hedging fixed-rates bonds (assets and liabilities) | | | 648 | | | | 15,691 | | | | — | | | | 3,345 | | | | 2,914 | | | | 3,450 | | | | 1,884 | | | | 4,098 | | | Swaps hedging fixed-rates bonds (current portion) (liabilities) | | | (97 | ) | | | 912 | | | | | | | | | | | | | | | | | | | | | | | | | | | Swaps hedging fixed-rates bonds (current portion) (assets) | | | 197 | | | | 1,084 | | | | | | | | | | | | | | | | | | | | | | | | | | | | | | | | | | | | | | | | | | | | | | | | | | | | | | | | | | | | Total swaps hedging fixed-rates bonds (current portion) (assets and liabilities) | | | 100 | | | | 1,996 | | | | 1,996 | | | | | | | | | | | | | | | | | | | | | | Cash flow hedge | | | | | | | | | | | | | | | | | | | | | | | | | | | | | | | | | | Swaps hedging fixed-rates bonds (liabilities) Swaps hedging fixed-rates bonds (assets) | | | 136 | | | | 1,837 | | | | | | | | | | | | 295 | | | | | | | | | | | | 1,542 | | | | | | | | | | | | | | | | | | | | | | | | | | | | | | | | | | | | Total swaps hedging fixed-rates bonds (assets and liabilities) | | | 136 | | | | 1,837 | | | | | | | | | | | | 295 | | | | | | | | | | | | 1,542 | | | Swaps hedging fixed-rates bonds (current portion) (liabilities) Swaps hedging fixed-rates bonds (current portion) (assets) | | | | | | | | | | | | | | | | | | | | | | | | | | | | | | | | | | | | | | | | | | | | | | | | | | | | | | | | | | | | | | | | | | | Total swaps hedging fixed-rates bonds (current portion) (assets and liabilities) | | | | | | | | | | | | | | | | | | | | | | | | | | | | | | | | | Net investment hedge | | | | | | | | | | | | | | | | | | | | | | | | | | | | | | | | | | Currency swaps and forward exchange contracts (assets) | | | 6 | | | | 701 | | | | | | | | | | | | | | | | | | | | | | | | | | | Currency swaps and forward exchange contracts (liabilities) | | | (1 | ) | | | 224 | | | | | | | | | | | | | | | | | | | | | | | | | | | | | | | | | | | | | | | | | | | | | | | | | | | | | | | | | | | | Total swaps hedging net investments | | | 5 | | | | 925 | | | | 925 | | | | | | | | | | | | | | | | | | | | | | Held for trading | | | | | | | | | | | | | | | | | | | | | | | | | | | | | | | | | | Other interest rate swaps (assets) | | | | | | | 1,459 | | | | | | | | | | | | | | | | | | | | | | | | | | | Other interest rate swaps (liabilities) | | | (1 | ) | | | 10,865 | | | | | | | | | | | | | | | | | | | | | | | | | | | | | | | | | | | | | | | | | | | | | | | | | | | | | | | | | | | | Total other interest rate swaps (assets and liabilities) | | | (1 | ) | | | 12,324 | | | | 12,208 | | | | 114 | | | | | | | | | | | | | | | | 2 | | | Currency swaps and forward exchange contracts (assets) | | | 53 | | | | 4,017 | | | | | | | | | | | | | | | | | | | | | | | | | | | Currency swaps and forward exchange contracts (liabilities) | | | (24 | ) | | | 3,456 | | | | | | | | | | | | | | | | | | | | | | | | | | | | | | | | | | | | | | | | | | | | | | | | | | | | | | | | | | | | Total currency swaps and forward exchange contracts (assets and liabilities) | | | 29 | | | | 7,473 | | | | 7,224 | | | | | | | | 52 | | | | 50 | | | | 47 | | | | 100 | | | | | | | | | | | | | | | | | | | | | | | | | | | | | | | | | | | |
| (a) | | | (a) | | These amounts set the levels of notional commitment and are not indicative of a contingent gain or loss. |
F-80
| | | | | | | | | | | | | | | | | | | | | | | | | | | | | | | | | As of December 31, 2009 (M€) Assets / (Liabilities) | | | | | Notional value(a) | | | | Fair
value | | | Total | | | 2010 | | | 2011 | | | 2012 | | | 2013 | | | 2014 | | | 2015
and
after | | Fair value hedge | | | | | | | | | | | | | | | | | | | | | | | | | | | | | | | | | Swaps hedging fixed-rates bonds (liabilities) | | | (241 | ) | | | 4,615 | | | | | | | | | | | | | | | | | | | | | | | | | | Swaps hedging fixed-rates bonds (assets) | | | 889 | | | | 11,076 | | | | | | | | | | | | | | | | | | | | | | | | | | Total swaps hedging fixed-rates bonds (assets and liabilities) | | | 648 | | | | 15,691 | | | | — | | | | 3,345 | | | | 2,914 | | | | 3,450 | | | | 1,884 | | | | 4,098 | | Swaps hedging fixed-rates bonds (current portion) (liabilities) | | | (97 | ) | | | 912 | | | | | | | | | | | | | | | | | | | | | | | | | | Swaps hedging fixed-rates bonds (current portion) (assets) | | | 197 | | | | 1,084 | | | | | | | | | | | | | | | | | | | | | | | | | | Total swaps hedging fixed-rates bonds (current portion) (assets and liabilities) | | | 100 | | | | 1,996 | | | | 1,996 | | | | | | | | | | | | | | | | | | | | | | Cash flow hedge | | | | | | | | | | | | | | | | | | | | | | | | | | | | | | | | | Swaps hedging fixed-rates bonds (liabilities) | | | | | | | | | | | | | | | | | | | | | | | | | | | | | | | | | Swaps hedging fixed-rates bonds (assets) | | | 136 | | | | 1,837 | | | | | | | | | | | | 295 | | | | | | | | | | | | 1,542 | | Total swaps hedging fixed-rates bonds (assets and liabilities) | | | 136 | | | | 1,837 | | | | | | | | | | | | 295 | | | | | | | | | | | | 1,542 | | Swaps hedging fixed-rates bonds (current portion) (liabilities) | | | | | | | | | | | | | | | | | | | | | | | | | | | | | | | | | Swaps hedging fixed-rates bonds (current portion) (assets) | | | | | | | | | | | | | | | | | | | | | | | | | | | | | | | | | Total swaps hedging fixed-rates bonds (current portion) (assets and liabilities) | | | | | | | | | | | | | | | | | | | | | | | | | | | | | | | | | Net investment hedge | | | | | | | | | | | | | | | | | | | | | | | | | | | | | | | | | Currency swaps and forward exchange contracts (assets) | | | 6 | | | | 701 | | | | | | | | | | | | | | | | | | | | | | | | | | Currency swaps and forward exchange contracts (liabilities) | | | (1 | ) | | | 224 | | | | | | | | | | | | | | | | | | | | | | | | | | Total swaps hedging net investments | | | 5 | | | | 925 | | | | 925 | | | | | | | | | | | | | | | | | | | | | | Held for trading | | | | | | | | | | | | | | | | | | | | | | | | | | | | | | | | | Other interest rate swaps (assets) | | | | | | | 1,459 | | | | | | | | | | | | | | | | | | | | | | | | | | Other interest rate swaps (liabilities) | | | (1 | ) | | | 10,865 | | | | | | | | | | | | | | | | | | | | | | | | | | Total other interest rate swaps (assets and liabilities) | | | (1 | ) | | | 12,324 | | | | 12,208 | | | | 114 | | | | | | | | | | | | | | | | 2 | | Currency swaps and forward exchange contracts (assets) | | | 53 | | | | 4,017 | | | | | | | | | | | | | | | | | | | | | | | | | | Currency swaps and forward exchange contracts (liabilities) | | | (24 | ) | | | 3,456 | | | | | | | | | | | | | | | | | | | | | | | | | | Total currency swaps and forward exchange contracts (assets and liabilities) | | | 29 | | | | 7,473 | | | | 7,224 | | | | | | | | 52 | | | | 50 | | | | 47 | | | | 100 | |
| | | | | | | | | | | | | | | | | | | | | | | | | | | | | | | | | | | As of December 31, 2008 (M€) | | | | | Notional value(a) | | | | | | | | | | | | | | | | | | | | | | | | | | 2014
| | | | | Fair
| | | | | | | | | | | | | | | | | | | | | and
| | | ASSETS/(LIABILITIES) | | value | | | Total | | | 2009 | | | 2010 | | | 2011 | | | 2012 | | | 2013 | | | after | | Fair value hedge | | | | | | | | | | | | | | | | | | | | | | | | | | | | | | | | | | Swaps hedging fixed-rates bonds (liabilities) | | | (440 | ) | | | 9,309 | | | | | | | | | | | | | | | | | | | | | | | | | | | Swaps hedging fixed-rates bonds (assets) | | | 892 | | | | 4,195 | | | | | | | | | | | | | | | | | | | | | | | | | | | | | | | | | | | | | | | | | | | | | | | | | | | | | | | | | | | | Total swaps hedging fixed-rates bonds (assets and liabilities) | | | 452 | | | | 13,504 | | | | — | | | | 2,048 | | | | 3,373 | | | | 3,233 | | | | 3,032 | | | | 1,818 | | | Swaps hedging fixed-rates bonds (current portion) (liabilities) | | | (12 | ) | | | 92 | | | | | | | | | | | | | | | | | | | | | | | | | | | Swaps hedging fixed-rates bonds (current portion) (assets) | | | 100 | | | | 1,871 | | | | | | | | | | | | | | | | | | | | | | | | | | | | | | | | | | | | | | | | | | | | | | | | | | | | | | | | | | | | Total swaps hedging fixed-rates bonds (current portion) (assets and liabilities) | | | 88 | | | | 1,963 | | | | 1,963 | | | | | | | | | | | | | | | | | | | | | | Net investment hedge | | | | | | | | | | | | | | | | | | | | | | | | | | | | | | | | | | | | | | | | | | | | | | | | | | | | | | | | | | | | | | | | | | | | Currency swaps and forward exchange contracts (liabilities) | | | — | | | | 1,347 | | | | 1,347 | | | | | | | | | | | | | | | | | | | | | | Held for trading | | | | | | | | | | | | | | | | | | | | | | | | | | | | | | | | | | Other interest rate swaps (assets) | | | — | | | | 2,853 | | | | | | | | | | | | | | | | | | | | | | | | | | | Other interest rate swaps (liabilities) | | | (4 | ) | | | 5,712 | | | | | | | | | | | | | | | | | | | | | | | | | | | | | | | | | | | | | | | | | | | | | | | | | | | | | | | | | | | | Total other interest rate swaps (assets and liabilities) | | | (4 | ) | | | 8,565 | | | | 8,559 | | | | 4 | | | | | | | | | | | | | | | | 2 | | | Currency swaps and forward exchange contracts (assets) | | | 86 | | | | 5,458 | | | | | | | | | | | | | | | | | | | | | | | | | | | Currency swaps and forward exchange contracts (liabilities) | | | (142 | ) | | | 2,167 | | | | | | | | | | | | | | | | | | | | | | | | | | | | | | | | | | | | | | | | | | | | | | | | | | | | | | | | | | | | Total currency swaps and forward exchange contracts (assets and liabilities) | | | (56 | ) | | | 7,625 | | | | 6,595 | | | | 483 | | | | 114 | | | | 67 | | | | 76 | | | | 290 | | | | | | | | | | | | | | | | | | | | | | | | | | | | | | | | | | | |
| (a) | | | (a) | | These amounts set the levels of notional commitment and are not indicative of a contingent gain or loss. |
| D) | | D) | FAIR VALUE HIERARCHY |
The fair value hierarchy for financial instruments excluding commodity contracts is as follows: | | | | | | | | | | | | | | | | | | | | | Quoted prices in
| | | | | | | | | | | | | | active markets
| | | | | | Prices based on
| | | | | | | | for identical
| | | Prices based on
| | | non observable
| | | | | | | | assets
| | | observable data
| | | data
| | | | | | As of December 31, 2010 (M€) | | (level 1) | | | (level 2) | | | (level 3) | | | Total | | | Fair value hedge instruments | | | — | | | | 1,916 | | | | — | | | | 1,916 | | | Cash flow hedge instruments | | | — | | | | 56 | | | | — | | | | 56 | | | Net investment hedge instruments | | | — | | | | 6 | | | | — | | | | 6 | | | Assets and liabilities held for trading | | | — | | | | (109 | ) | | | — | | | | (109 | ) | | Assets available for sale | | | 3,631 | | | | — | | | | — | | | | 3,631 | | | | | | | | | | | | | | | | | | | | Total | | | 3,631 | | | | 1,869 | | | | — | | | | 5,500 | | | | | | | | | | | | | | | | | | | |
F-81
| | | | | | | | | | | | | | | | | | As of December 31, 2011 (M€) | | Quoted prices in
active markets
for identical
assets
(level 1) | | | Prices based on
observable data
(level 2) | | | Prices based on non-
observable data
(level 3) | | | Total | | Fair value hedge instruments | | | — | | | | 2,217 | | | | — | | | | 2,217 | | Cash flow hedge instruments | | | — | | | | (46 | ) | | | — | | | | (46 | ) | Net investment hedge instruments | | | — | | | | (26 | ) | | | — | | | | (26 | ) | Assets and liabilities held for trading | | | — | | | | 72 | | | | — | | | | 72 | | Assets available for sale | | | 2,575 | | | | — | | | | — | | | | 2,575 | | Total | | | 2,575 | | | | 2,217 | | | | — | | | | 4,792 | |
| | | | | | | | | | | | | | | | | | As of December 31, 2010 (M€) | | Quoted prices in
active markets
for identical
assets
(level 1) | | | Prices based on
observable data
(level 2) | | | Prices based on
non-observable
data
(level 3) | | | Total | | Fair value hedge instruments | | | — | | | | 1,916 | | | | — | | | | 1,916 | | Cash flow hedge instruments | | | — | | | | 56 | | | | — | | | | 56 | | Net investment hedge instruments | | | — | | | | 6 | | | | — | | | | 6 | | Assets and liabilities held for trading | | | — | | | | (109 | ) | | | — | | | | (109 | ) | Assets available for sale | | | 3,631 | | | | — | | | | — | | | | 3,631 | | Total | | | 3,631 | | | | 1,869 | | | | — | | | | 5,500 | |
| | | | | | | | | | | | | | | | | | As of December 31, 2009 (M€) | | Quoted prices in
active markets
for identical
assets
(level 1) | | | Prices based on
observable data
(level 2) | | | Prices based on
non-observable
data
(level 3) | | | Total | | Fair value hedge instruments | | | — | | | | 748 | | | | — | | | | 748 | | Cash flow hedge instruments | | | — | | | | 136 | | | | — | | | | 136 | | Net investment hedge instruments | | | — | | | | 5 | | | | — | | | | 5 | | Assets and liabilities held for trading | | | — | | | | 28 | | | | — | | | | 28 | | Assets available for sale | | | 232 | | | | — | | | | — | | | | 232 | | Total | | | 232 | | | | 917 | | | | — | | | | 1,149 | |
| | | | | | | | | | | | | | | | | | | | | Quoted prices in
| | | | | | | | | | | | | | active markets
| | | | | | Prices based on
| | | | | | | | for identical
| | | Prices based on
| | | non observable
| | | | | | | | assets
| | | observable data
| | | data
| | | | | | As of December 31, 2009 (M€) | | (level 1) | | | (level 2) | | | (level 3) | | | Total | | | Fair value hedge instruments | | | — | | | | 748 | | | | — | | | | 748 | | | Cash flow hedge instruments | | | — | | | | 136 | | | | — | | | | 136 | | | Net investment hedge instruments | | | — | | | | 5 | | | | — | | | | 5 | | | Assets and liabilities held for trading | | | — | | | | 28 | | | | — | | | | 28 | | | Assets available for sale | | | 232 | | | | — | | | | — | | | | 232 | | | | | | | | | | | | | | | | | | | | Total | | | 232 | | | | 917 | | | | — | | | | 1,149 | | | | | | | | | | | | | | | | | | | |
The description of each fair value level is presented in Note 1 paragraph M(v) to the Consolidated Financial Statements. | | 30) | FINANCIAL INSTRUMENTS RELATED TO COMMODITY CONTRACTS |
30)FINANCIAL INSTRUMENTS RELATED TO COMMODITY CONTRACTS Financial instruments related to oil, gas and power activities as well as related currency derivatives are recorded at fair value under “Other current assets” or “Other creditors and accrued liabilities” depending on whether they are assets or liabilities. | | | | | | | | | | | As of December 31, 2010 (M€) | | | | | | | | | | Carrying
| | | Fair
| | | Assets/(Liabilities) | | amount | | | value(b) | | Crude oil, petroleum products and freight rates activities | | | | | | | | | | Petroleum products and crude oil swaps | | | (2 | ) | | | (2 | ) | | Freight rate swaps | | | — | | | | — | | Forwards(a) | | | 5 | | | | 5 | | | Options | | | 51 | | | | 51 | | | Futures | | | (12 | ) | | | (12 | ) | | Options on futures | | | (4 | ) | | | (4 | ) | | | | | | | | | | | Total crude oil, petroleum products and freight rates | | | 38 | | | | 38 | | | | | | | | | | | | Gas & Power activities | | | | | | | | | | Swaps | | | (1 | ) | | | (1 | ) | Forwards(a) | | | (102 | ) | | | (102 | ) | | Options | | | 5 | | | | 5 | | | Futures | | | — | | | | — | | | | | | | | | | | | Total Gas & Power | | | (98 | ) | | | (98 | ) | | | | | | | | | | | Total | | | (60 | ) | | | (60 | ) | | | | | | | | | | | | Total of fair value non recognized in the balance sheet | | | | | | | — | | | | | | | | | | | |
| | | | | | | | | | As of December 31, 2011 (M€) | | | | | | | Assets / (Liabilities) | | Carrying amount | | | Fair value(b) | | Crude oil, petroleum products and freight rates activities | | | | | | | | | Petroleum products and crude oil swaps | | | 3 | | | | 3 | | Freight rate swaps | | | — | | | | — | | Forwards(a) | | | (16 | ) | | | (16 | ) | Options | | | (4 | ) | | | (4 | ) | Futures | | | (14 | ) | | | (14 | ) | Options on futures | | | (6 | ) | | | (6 | ) | Total crude oil, petroleum products and freight rates | | | (37 | ) | | | (37 | ) | Gas & Power activities | | | | | | | | | Swaps | | | 57 | | | | 57 | | Forwards(a) | | | 452 | | | | 452 | | Options | | | (3 | ) | | | (3 | ) | Futures | | | — | | | | — | | Total Gas & Power | | | 506 | | | | 506 | | Total | | | 469 | | | | 469 | | Total of fair value non-recognized in the balance sheet | | | | | | | — | |
| (a) | | | (a) | | Forwards: contracts resulting in physical delivery are accounted for as derivative commodity contracts and included in the amounts shown. |
| (b) | | When the fair value of derivatives listed on an organized exchange market (futures, options on futures and swaps) is offset with the margin call received or paid on the face ofin the balance sheet, this fair value is set to zero. |
F-82
| | | | | | | | | As of December 31, 2010 (M€) Assets / (Liabilities) | | Carrying amount | | | Fair value(b) | | Crude oil, petroleum products and freight rates activities | | | | | | | | | Petroleum products and crude oil swaps | | | (2 | ) | | | (2 | ) | Freight rate swaps | | | — | | | | — | | Forwards(a) | | | 5 | | | | 5 | | Options | | | 51 | | | | 51 | | Futures | | | (12 | ) | | | (12 | ) | Options on futures | | | (4 | ) | | | (4 | ) | Total crude oil, petroleum products and freight rates | | | 38 | | | | 38 | | Gas & Power activities | | | | | | | | | Swaps | | | (1 | ) | | | (1 | ) | Forwards(a) | | | (102 | ) | | | (102 | ) | Options | | | 5 | | | | 5 | | Futures | | | — | | | | — | | Total Gas & Power | | | (98 | ) | | | (98 | ) | Total | | | (60 | ) | | | (60 | ) | Total of fair value non-recognized in the balance sheet | | | | | | | — | |
| | | | | | | | | | | As of December 31, 2009 (M€) | | | | | | | | | | Carrying
| | | Fair
| | | ASSETS/(LIABILITIES) | | amount | | | value(b) | | Crude oil, petroleum products and freight rates activities | | | | | | | | | | Petroleum products and crude oil swaps | | | (29 | ) | | | (29 | ) | | Freight rate swaps | | | — | | | | — | | Forwards(a) | | | (9 | ) | | | (9 | ) | | Options | | | 21 | | | | 21 | | | Futures | | | (17 | ) | | | (17 | ) | | Options on futures | | | 6 | | | | 6 | | | | | | | | | | | | Total crude oil, petroleum products and freight rates | | | (28 | ) | | | (28 | ) | | | | | | | | | | | Gas & Power activities | | | | | | | | | | Swaps | | | 52 | | | | 52 | | Forwards(a) | | | 78 | | | | 78 | | | Options | | | 4 | | | | 4 | | | Futures | | | — | | | | — | | | | | | | | | | | | Total Gas & Power | | | 134 | | | | 134 | | | | | | | | | | | | Total | | | 106 | | | | 106 | | | | | | | | | | | | | Total of fair value non recognized in the balance sheet | | | | | | | — | | | | | | | | | | | |
| (a) | | | (a) | | Forwards: contracts resulting in physical delivery are accounted for as derivative commodity contracts and included in the amounts shown. |
| (b) | | When the fair value of derivatives listed on an organized exchange market (futures, options on futures and swaps) is offset with the margin call received or paid on the face ofin the balance sheet, this fair value is set to zero. |
| | | | | | | | | | | As of December 31, 2008 (M€) | | | | | | | | | | Carrying
| | | Fair
| | | ASSETS/(LIABILITIES) | | amount | | | value(b) | | Crude oil, petroleum products and freight rates activities | | | | | | | | | | Petroleum products and crude oil swaps | | | 141 | | | | 141 | | | Freight rate swaps | | | 8 | | | | 8 | | Forwards(a) | | | (120 | ) | | | (120 | ) | | Options | | | — | | | | — | | | Futures | | | 17 | | | | 17 | | | Options on futures | | | (7 | ) | | | (7 | ) | | | | | | | | | | | Total crude oil, petroleum products and freight rates | | | 39 | | | | 39 | | | | | | | | | | | | Gas & Power activities | | | | | | | | | | Swaps | | | (48 | ) | | | (48 | ) | Forwards(a) | | | 659 | | | | 659 | | | Options | | | — | | | | — | | | Futures | | | (19 | ) | | | (19 | ) | | | | | | | | | | | Total Gas & Power | | | 592 | | | | 592 | | | | | | | | | | | | Total | | | 631 | | | | 631 | | | | | | | | | | | | | Total of fair value non recognized in the balance sheet | | | | | | | — | | | | | | | | | | | |
| | | | | | | | | As of December 31, 2009 (M€) Assets / (Liabilities) | | Carrying amount | | | Fair value(b) | | Crude oil, petroleum products and freight rates activities | | | | | | | | | Petroleum products and crude oil swaps | | | (29 | ) | | | (29 | ) | Freight rate swaps | | | — | | | | — | | Forwards(a) | | | (9 | ) | | | (9 | ) | Options | | | 21 | | | | 21 | | Futures | | | (17 | ) | | | (17 | ) | Options on futures | | | 6 | | | | 6 | | Total crude oil, petroleum products and freight rates | | | (28 | ) | | | (28 | ) | Gas & Power activities | | | | | | | | | Swaps | | | 52 | | | | 52 | | Forwards(a) | | | 78 | | | | 78 | | Options | | | 4 | | | | 4 | | Futures | | | — | | | | — | | Total Gas & Power | | | 134 | | | | 134 | | Total | | | 106 | | | | 106 | | Total of fair value non-recognized in the balance sheet | | | | | | | — | |
| (a) | | | (a) | | Forwards: contracts resulting in physical delivery are accounted for as derivative commodity contracts and included in the amounts shown. |
| (b) | | When the fair value of derivatives listed on an organized exchange market (futures, options on futures and swaps) is offset with the margin call received or paid on the face ofin the balance sheet, this fair value is set to zero. |
Most commitments on crude oil and refined products have a short term maturity (less than one year). The maturity of most Gas & Power energy derivatives is less than three years forward. F-83
The changes in fair value of financial instruments related to commodity contracts are detailed as follows: | | | | | | | | | | | | | | | | | | | | | | | | | Fair value as
| | | Impact on
| | | Settled
| | | | | | Fair value as
| | | For the year ended December 31, (M€) | | of January 1, | | | income | | | contracts | | | Other | | | of December 31, | | Crude oil, petroleum products and freight rates activities | 2010 | | | (28 | ) | | | 1,556 | | | | (1,488 | ) | | | (2 | ) | | | 38 | | | 2009 | | | 39 | | | | 1,713 | | | | (1,779 | ) | | | (1 | ) | | | (28 | ) | | 2008 | | | 18 | | | | 1,734 | | | | (1,715 | ) | | | 2 | | | | 39 | | | | | | | | | | | | | | | | | | | | | | | | | | | | | | | | | | | | | | | | | | | | | | Gas & Power activities | | | | | | | | | | | | | | | | | | | | | 2010 | | | 134 | | | | 410 | | | | (648 | ) | | | 6 | | | | (98 | ) | | 2009 | | | 592 | | | | 327 | | | | (824 | ) | | | 39 | | | | 134 | | | 2008 | | | 232 | | | | 787 | | | | (310 | ) | | | (117 | ) | | | 592 | | | | | | | | | | | | | | | | | | | | | | | |
| | | | | | | | | | | | | | | | | | | | | | For the year ended December 31, (M€) | | Fair value as of January 1, | | | Impact on income | | | Settled contracts | | | Other | | | Fair value as of December 31, | | Crude oil, petroleum products and freight rates activities | | | | | | | | | �� | | | | | | | | | | | | 2011 | | | 38 | | | | 1,572 | | | | (1,648 | ) | | | 1 | | | | (37 | ) | 2010 | | | (28 | ) | | | 1,556 | | | | (1,488 | ) | | | (2 | ) | | | 38 | | 2009 | | | 39 | | | | 1,713 | | | | (1,779 | ) | | | (1 | ) | | | (28 | ) | Gas & Power activities | | | | | | | | | | | | | | | | | | | | | 2011 | | | (98 | ) | | | 899 | | | | (295 | ) | | | 0 | | | | 506 | | 2010 | | | 134 | | | | 410 | | | | (648 | ) | | | 6 | | | | (98 | ) | 2009 | | | 592 | | | | 327 | | | | (824 | ) | | | 39 | | | | 134 | |
The fair value hierarchy for financial instruments related to commodity contracts is as follows: | | | | | | | | | | | | | | | | | | | | | Quoted prices
| | | Prices based
| | | Prices based
| | | | | | | | in active
| | | on
| | | on non
| | | | | | | | markets for
| | | observable
| | | observable
| | | | | | | | identical assets
| | | data
| | | data
| | | | | | As of December 31, 2010 (M€) | | (level 1) | | | (level 2) | | | (level 3) | | | Total | | | Crude oil, petroleum products and freight rates activities | | | (10 | ) | | | 48 | | | | — | | | | 38 | | | Gas & Power activities | | | 50 | | | | (148 | ) | | | — | | | | (98 | ) | | | | | | | | | | | | | | | | | | | Total | | | 40 | | | | (100 | ) | | | — | | | | (60 | ) | | | | | | | | | | | | | | | | | | |
| | | | | | | | | | | | | | | | | | | | | Quoted prices
| | | Prices based
| | | Prices based
| | | | | | | | in active
| | | on
| | | on non
| | | | | | | | markets for
| | | observable
| | | observable
| | | | | | | | identical assets
| | | data
| | | data
| | | | | | As of December 31, 2009 (M€) | | (level 1) | | | (level 2) | | | (level 3) | | | Total | | | Crude oil, petroleum products and freight rates activities | | | (45 | ) | | | 17 | | | | — | | | | (28 | ) | | Gas & Power activities | | | 140 | | | | (6 | ) | | | — | | | | 134 | | | | | | | | | | | | | | | | | | | | Total | | | 95 | | | | 11 | | | | — | | | | 106 | | | | | | | | | | | | | | | | | | | |
| | | | | | | | | | | | | | | | | | As of December 31, 2011 (M€) | | Quoted prices in active markets for identical assets (level 1) | | | Prices based on observable data (level 2) | | | Prices based on non-observable data (level 3) | | | Total | | Crude oil, petroleum products and freight rates activities | | | (38 | ) | | | 1 | | | | — | | | | (37 | ) | Gas & Power activities | | | (44 | ) | | | 550 | | | | — | | | | 506 | | Total | | | (82 | ) | | | 551 | | | | — | | | | 469 | |
| | | | | | | | | | | | | | | | | | As of December 31, 2010 (M€) | | Quoted prices in active markets for
identical assets (level 1) | | | Prices based on observable data (level 2) | | | Prices based on non-observable
data (level 3) | | | Total | | Crude oil, petroleum products and freight rates activities | | | (10 | ) | | | 48 | | | | — | | | | 38 | | Gas & Power activities | | | 50 | | | | (148 | ) | | | — | | | | (98 | ) | Total | | | 40 | | | | (100 | ) | | | — | | | | (60 | ) |
| | | | | | | | | | | | | | | | | | As of December 31, 2009 (M€) | | Quoted prices in active markets for identical assets (level 1) | | | Prices based on observable data (level 2) | | | Prices based on non-observable data (level 3) | | | Total | | Crude oil, petroleum products and freight rates activities | | | (45 | ) | | | 17 | | | | — | | | | (28 | ) | Gas & Power activities | | | 140 | | | | (6 | ) | | | — | | | | 134 | | Total | | | 95 | | | | 11 | | | | — | | | | 106 | |
The description of each fair value level is presented in Note 1 paragraph M(v) to the Consolidated Financial Statements. | | 31)FINANCIAL RISKS MANAGEMENT 31)
| MARKET RISKS |
Oil and gas market related risks Due to the nature of its business, the Group has significant oil and gas trading activities as part of itsday-to-day operations in order to optimize revenues from its oil and gas production and to obtain favorable pricing to supply its refineries. In its international oil trading business, the Group follows a policy of not selling its future production. However, in connection with this trading business, the Group, like most other oil companies, uses energy derivative instruments to adjust its exposure to price fluctuations of crude oil, refined products, natural gas, power and coal. The Group also uses freight rate derivative contracts in its shipping business to adjust its exposure to freight-rate fluctuations. To hedge against this risk, the Group uses various instruments such as futures, forwards, swaps and options on organised markets orover-the-counter markets. The list of the different derivatives held by the Group in these markets is detailed in Note 30 to the Consolidated Financial Statements. The Trading & Shipping division measures its market risk exposure,i.e. potential loss in fair values, on its crude oil, refined products and freight rates trading activities using avalue-at-risk technique. This technique is based on an historical model and makes an assessment of the market risk arising from possible future changes in market values over a24-hour period. The calculation of the range of potential changes in fair values takes into account a snapshot of theend-of-day exposures and the set of historical price movements for the last 400 business days for all instruments and maturities in the global trading activities. Options are systematically reevaluated using appropriate models. The potential movement in fair values corresponds to a 97.5%value-at-risk type confidence level. This means that
F-84
the Group’s portfolio result is likely to exceed thevalue-at-risk loss measure once over 40 business days if the portfolio exposures were left unchanged. Trading & Shipping :value-at-risk with a 97.5% probability | | | | | | | | | | | | | | | | | | | As of December 31, | | | | | | | | | | | Year
| | | (M€) | | High | | | Low | | | Average | | | end | | 2010 | | | 23.1 | | | | 3.4 | | | | 8.9 | | | | 3.8 | | | 2009 | | | 18.8 | | | | 5.8 | | | | 10.2 | | | | 7.6 | | | 2008 | | | 13.5 | | | | 2.8 | | | | 6.9 | | | | 11.8 | | | | | | | | | | | | | | | | | | | |
| | | | | | | | | | | | | | | | | As of December 31,
(M€) | | High | | | Low | | | Average | | | Year end | | 2011 | | | 10.6 | | | | 3.7 | | | | 6.1 | | | | 6.3 | | 2010 | | | 23.1 | | | | 3.4 | | | | 8.9 | | | | 3.8 | | 2009 | | | 18.8 | | | | 5.8 | | | | 10.2 | | | | 7.6 | |
As part of its gas, power and coal trading activity, the Group also uses derivative instruments such as futures, forwards, swaps and options in both organised andover-the-counter markets. In general, the transactions are settled at maturity date through physical delivery. The Gas & Power division measures its market risk exposure,i.e.potential loss in fair values, on its trading business using avalue-at-risk technique. This technique is based on an historical model and makes an assessment of the market risk arising from possible future changes in market values over aone-day period. The calculation of the range of potential changes in fair values takes into account a snapshot of theend-of-day exposures and the set of historical price movements for the past two years for all instruments and maturities in the global trading business. Gas & Power trading :value-at-risk with a 97.5% probability | | | | | | | | | | | | | | | | | | | As of December 31, | | | | | | | | | | | Year
| | | (M€) | | High | | | Low | | | Average | | | end | | 2010 | | | 13.9 | | | | 2.7 | | | | 6.8 | | | | 10.0 | | | 2009 | | | 9.8 | | | | 1.9 | | | | 5.0 | | | | 4.8 | | | 2008 | | | 16.3 | | | | 1.3 | | | | 5.0 | | | | 1.4 | | | | | | | | | | | | | | | | | | | |
| | | | | | | | | | | | | | | | | As of December 31,
(M€) | | High | | | Low | | | Average | | | Year end | | 2011 | | | 21.0 | | | | 12.7 | | | | 16.0 | | | | 17.6 | | 2010 | | | 13.9 | | | | 2.7 | | | | 6.8 | | | | 10.0 | | 2009 | | | 9.8 | | | | 1.9 | | | | 5.0 | | | | 4.8 | |
The Group has implemented strict policies and procedures to manage and monitor these market risks. These are based on the splittingseparation of supervisory functions from operationalcontrol and front-office functions and on an integrated information system that enables real-time monitoring of trading activities. Limits on trading positions are approved by the Group’s Executive Committee and are monitored daily. To increase flexibility and encourage liquidity, hedging operations are performed with numerous independent operators, including other oil companies, major energy producers or consumers and financial institutions. The Group has established counterparty limits and monitors outstanding amounts with each counterparty on an ongoing basis. Financial markets related risks As part of its financing and cash management activities, the Group uses derivative instruments to manage its exposure to changes in interest rates and foreign exchange rates. These instruments are principally interest rate and currency swaps. The Group may also use, on a less frequent basis, futures and options contracts. These operations and their accounting treatment are detailed in Notes 1 paragraph M, 20, 28 and 29 to the Consolidated Financial Statements. Risks relative to cash management operations and to interest rate and foreign exchange financial instruments are managed according to rules set by the Group’s senior management, which provide for regular pooling of available cash balances, open positions and management of the financial instruments by the Treasury Department. Excess cash of the Group is deposited mainly in government institutions, or deposit banks, or major companies through deposits, reverse repurchase agreements and purchase of commercial paper. Liquidity positions and the management of financial instruments are centralized by the Treasury Department, where they are managed by a team specialized in foreign exchange and interest rate market transactions. The Cash Monitoring-Management Unit within the Treasury Department monitors limits and positions per bank on a daily basis and reports results.results of the Front Office. This unit also preparesmarked-to-market valuations of used financial instruments and, when necessary, performs sensitivity analysis. The Group has established standards for market transactions under which bank counterparties must be approved in advance, based on an assessment of the counterparty’s financial soundness (multi-criteria analysis including a review of market prices and of the Credit Default Swap (CDS), its ratings with Standard & Poor’s and Moody’s, which must be of high quality, and its overall financial condition). An overall authorized credit limit is set for each bank and is allotted among the subsidiaries and the Group’s central treasury entities according to their needs. To reduce the market values risk on its commitments, in particular for swaps set as part of bonds issuance, the Treasury Department also developed a system of margin call that is gradually implemented with significant counterparties. The Group seeks to minimize the currency exposure of each entity to its functional currency (primarily the euro, the dollar, the Canadian dollar, the pound sterling and the Norwegian krone).
F-85
For currency exposure generated by commercial activity, the hedging of revenues and costs in foreign currencies is typically performed using currency operations on the spot market and, in some cases, on the forward market. The Group rarely hedges future cash flows, although it may use options to do so. With respect to currency exposure linked to non-current assets booked in a currency other than the euro, the Group has a policy of reducing the related currency exposure by financing these assets in the same currency. Net short-term currency exposure is periodically monitored against limits set by the Group’s senior management. The non-current debt described in Note 20 to the Consolidated Financial Statements is generally raised by the corporate treasury entities either directly in dollars, in euros or euros,in Canadian dollars, or in other currencies which are then exchanged for dollars or euros through swaps issues to appropriately match general corporate needs. The proceeds from these debt issuances are loaned to affiliates whose accounts are kept in dollars, in Canadian dollars or in euros. Thus, the net sensitivity of these positions to currency exposure is not significant. The Group’s short-term currency swaps, the notional value of which appears in Note 29 to the Consolidated Financial Statements, are used to attempt to optimize the centralized cash management of the Group. Thus, the sensitivity to currency fluctuations which may be induced is likewise considered negligible. Short-term interest rate exposure and cash Cash balances, which are primarily composed of euros and dollars, are managed according to the guidelines established by the Group’s senior management (maintain an adequate level of liquidity, optimize revenue from investments considering existing interest rate yield curves, and minimize the cost of borrowing) over a less than twelve-month horizon and on the basis of a daily interest rate benchmark, primarily through short-term interest rate swaps and short-term currency swaps, without modifying currency exposure. Interest rate risk on non-current debt The Group’s policy consists of incurring non-current debt primarily at a floating rate, or, if the opportunity arises at the time of an issuance, at a fixed rate. Debt is incurred in dollars, in euros or in eurosCanadian dollars according to general corporate needs. Long-term interest rate and currency swaps may be used to hedge bonds at their issuance in order to create a variable or fixed rate synthetic debt. In order to partially modify the interest rate structure of the long-term debt, TOTAL may also enter into long-term interest rate swaps.
F-86
Sensitivity analysis on interest rate and foreign exchange risk The tables below present the potential impact of an increase or decrease of 10 basis points on the interest rate yield curves for each of the currencies on the fair value of the current financial instruments as of December 31, 2011, 2010 2009 and 2008. | | | | | | | | | | | | | | | | | | ASSETS/(LIABILITIES)
| | | | | | | | Change in fair value due to a
| | | (M€) | | Carrying
| | | Estimated
| | | change in interest rate by | | | As of December 31, 2010 | | amount | | | fair value | | | + 10 basis points | | | - 10 basis points | | | Bonds (non-current portion, before swaps) | | | (20,019 | ) | | | (20,408 | ) | | | 86 | | | | (84 | ) | Swaps hedging fixed-rates bonds (liabilities) | | | (178 | ) | | | (178 | ) | | | | | | | | | Swaps hedging fixed-rates bonds (assets) | | | 1,870 | | | | 1,870 | | | | | | | | | | | Total swaps hedging fixed-rates bonds (assets and liabilities) | | | 1,692 | | | | 1,692 | | | | (59 | ) | | | 59 | | | Current portion of non-current debt after swap (excluding capital lease obligations) | | | 3,483 | | | | 3,483 | | | | 4 | | | | (4 | ) | | Other interest rates swaps | | | (2 | ) | | | (2 | ) | | | 3 | | | | (3 | ) | | Currency swaps and forward exchange contracts | | | (101 | ) | | | (101 | ) | | | — | | | | — | | | | | | | | | | | | | | | | | | | | As of December 31, 2009 | | | | | | | | | | | | | | | | | | | | | | | | | | | | | | | | | | | | Bonds (non-current portion, before swaps) | | | (18,368 | ) | | | (18,836 | ) | | | 75 | | | | (75 | ) | Swaps hedging fixed-rates bonds (liabilities) | | | (241 | ) | | | (241 | ) | | | | | | | | | Swaps hedging fixed-rates bonds (assets) | | | 1,025 | | | | 1,025 | | | | | | | | | | | Total swaps hedging fixed-rates bonds (assets and liabilities) | | | 784 | | | | 784 | | | | (57 | ) | | | 57 | | | Current portion of non-current debt after swap (excluding capital lease obligations) | | | (2,111 | ) | | | (2,111 | ) | | | 3 | | | | (3 | ) | | Other interest rates swaps | | | (1 | ) | | | (1 | ) | | | 1 | | | | (1 | ) | | Currency swaps and forward exchange contracts | | | 34 | | | | 34 | | | | — | | | | — | | | | | | | | | | | | | | | | | | | | As of December 31, 2008 | | | | | | | | | | | | | | | | | | | | | | | | | | | | | | | | | | | | Bonds (non-current portion, before swaps) | | | (14,119 | ) | | | (14,119 | ) | | | 47 | | | | (43 | ) | Swaps hedging fixed-rates bonds (liabilities) | | | (440 | ) | | | (440 | ) | | | | | | | | | Swaps hedging fixed-rates bonds (assets) | | | 892 | | | | 892 | | | | | | | | | | | Total swaps hedging fixed-rates bonds (assets and liabilities) | | | 452 | | | | 452 | | | | (44 | ) | | | 44 | | | Current portion of non-current debt after swap (excluding capital lease obligations) | | | (2,025 | ) | | | (2,025 | ) | | | 3 | | | | (3 | ) | | Other interest rates swaps | | | (4 | ) | | | (4 | ) | | | 1 | | | | (1 | ) | | Currency swaps and forward exchange contracts | | | (56 | ) | | | (56 | ) | | | — | | | | — | |
2009. | | | | | | | | | | | | | | | | | | | | | | | | | | Change in fair
value due to a change
in interest rate by | | Assets / (Liabilities) (M€) | |
| Carrying
amount |
| |
| Estimated
fair value |
| |
| + 10 basis
points |
| |
| - 10 basis
points |
| As of December 31, 2011 | | | | | | | | | | | | | | | | | Bonds (non-current portion, before swaps) | | | (21,402 | ) | | | (22,092 | ) | | | 83 | | | | (83 | ) | Swaps hedging fixed-rates bonds (liabilities) | | | (146 | ) | | | (146 | ) | | | | | | | | | Swaps hedging fixed-rates bonds (assets) | | | 1,976 | | | | 1,976 | | | | | | | | | | Total swaps hedging fixed-rates bonds (assets and liabilities) | | | 1,830 | | | | 1,830 | | | | (49 | ) | | | 49 | | Current portion of non-current debt after swap (excluding capital lease obligations) | | | 3,488 | | | | 3,488 | | | | 3 | | | | (3 | ) | Other interest rates swaps | | | (1 | ) | | | (1 | ) | | | 3 | | | | (3 | ) | Currency swaps and forward exchange contracts | | | 47 | | | | 47 | | | | — | | | | — | | As of December 31, 2010 | | | | | | | | | | | | | | | | | Bonds (non-current portion, before swaps) | | | (20,019 | ) | | | (20,408 | ) | | | 86 | | | | (84 | ) | Swaps hedging fixed-rates bonds (liabilities) | | | (178 | ) | | | (178 | ) | | | | | | | | | Swaps hedging fixed-rates bonds (assets) | | | 1,870 | | | | 1,870 | | | | | | | | | | Total swaps hedging fixed-rates bonds (assets and liabilities) | | | 1,692 | | | | 1,692 | | | | (59 | ) | | | 59 | | Current portion of non-current debt after swap (excluding capital lease obligations) | | | 3,483 | | | | 3,483 | | | | 4 | | | | (4 | ) | Other interest rates swaps | | | (2 | ) | | | (2 | ) | | | 3 | | | | (3 | ) | Currency swaps and forward exchange contracts | | | (101 | ) | | | (101 | ) | | | — | | | | — | | As of December 31, 2009 | | | | | | | | | | | | | | | | | Bonds (non-current portion, before swaps) | | | (18,368 | ) | | | (18,836 | ) | | | 75 | | | | (75 | ) | Swaps hedging fixed-rates bonds (liabilities) | | | (241 | ) | | | (241 | ) | | | | | | | | | Swaps hedging fixed-rates bonds (assets) | | | 1,025 | | | | 1,025 | | | | | | | | | | Total swaps hedging fixed-rates bonds (assets and liabilities) | | | 784 | | | | 784 | | | | (57 | ) | | | 57 | | Current portion of non-current debt after swap (excluding capital lease obligations) | | | (2,111 | ) | | | (2,111 | ) | | | 3 | | | | (3 | ) | Other interest rates swaps | | | (1 | ) | | | (1 | ) | | | 1 | | | | (1 | ) | Currency swaps and forward exchange contracts | | | 34 | | | | 34 | | | | — | | | | — | |
The impact of changes in interest rates on the cost of net debt before tax is as follows: | | | | | | | | | | | | | | | For The year ended December 31, (M€) | | 2010 | | | 2009 | | | 2008 | | | Cost of net debt | | | (334 | ) | | | (398 | ) | | | (527 | ) | | Interest rate translation of : | | | | | | | | | | | | | | + 10 basis points | | | (11 | ) | | | (11 | ) | | | (11 | ) | | - 10 basis points | | | 11 | | | | 11 | | | | 11 | | | + 100 basis points | | | (107 | ) | | | (108 | ) | | | (113 | ) | | - 100 basis points | | | 107 | | | | 108 | | | | 113 | | | | | | | | | | | | | | | |
| | | | | | | | | | | | | | For the year ended December 31, (M€) | | 2011 | | | 2010 | | | 2009 | | Cost of net debt | | | (440 | ) | | | (334 | ) | | | (398 | ) | Interest rate translation of : | | | | | | | | | | | | | + 10 basis points | | | (10 | ) | | | (11 | ) | | | (11 | ) | - 10 basis points | | | 10 | | | | 11 | | | | 11 | | + 100 basis points | | | (103 | ) | | | (107 | ) | | | (108 | ) | - 100 basis points | | | 103 | | | | 107 | | | | 108 | |
As a result of the policy for the management of currency exposure previously described, the Group’s sensitivity to currency exposure is primarily influenced by the net equity of the subsidiaries whose functional currency is the dollar and, to a lesser extent, the pound sterling, the Norwegian krone and the Norwegian krone.
F-87
This sensitivity is reflected in the historical evolution of the currency translation adjustment recorded in the statement of changes in shareholders’ equity which, in the course of the last three fiscal years, is essentially related to the fluctuation of dollar and pound sterling and is set forth in the table below: | | | | | | | | | | | | | Euro / Dollar
| | Euro / Pound sterling
| | | | exchange rates | | exchange rates | As of December 31, 2010 | | | 1.34 | | | | 0.86 | | | As of December 31, 2009 | | | 1.44 | | | | 0.89 | | | As of December 31, 2008 | | | 1.39 | | | | 0.95 | | | | | | | | | | | |
| | | | | | | | | | | | | | | | | | | | | | | | | | | | | | | | | | | | | Other
| | | | | | | | | | | | | | | | | currencies
| | | | | | | | | | | | | | Pound
| | | and equity
| | | As of December 31, 2010 (M€) | | Total | | | Euro | | | Dollar | | | sterling | | | affiliates(a) | | | Shareholders’ equity at historical exchange rate | | | 62,909 | | | | 32,894 | | | | 22,242 | | | | 4,997 | | | | 2,776 | | | Currency translation adjustment before net investment hedge | | | (2,501 | ) | | | — | | | | (1,237 | ) | | | (1,274 | ) | | | 10 | | | Net investment hedge — open instruments | | | 6 | | | | — | | | | 6 | | | | — | | | | — | | | Shareholders’ equity at exchange rate as of December 31, 2010 | | | 60,414 | | | | 32,894 | | | | 21,011 | | | | 3,723 | | | | 2,786 | | | | | | | | | | | | | | | | | | | | | | | |
| | | | | | | | | | | | | | | | | | | | | | | | | | | | | | | | | | | | | Other
| | | | | | | | | | | | | | | | | currencies
| | | | | | | | | | | | | | Pound
| | | and equity
| | | As of December 31, 2009 (M€) | | Total | | | Euro | | | Dollar | | | sterling | | | affiliates | | | Shareholders’ equity at historical exchange rate | | | 57,621 | | | | 27,717 | | | | 18,671 | | | | 5,201 | | | | 6,032 | | | Currency translation adjustment before net investment hedge | | | (5,074 | ) | | | — | | | | (3,027 | ) | | | (1,465 | ) | | | (582 | ) | | Net investment hedge — open instruments | | | 5 | | | | — | | | | 6 | | | | (1 | ) | | | — | | | Shareholders’ equity at exchange rate as of December 31, 2009 | | | 52,552 | | | | 27,717 | | | | 15,650 | | | | 3,735 | | | | 5,450 | | | | | | | | | | | | | | | | | | | | | | | |
| | | | | | | | | | | | | | | | | | | | | | | | | | | | | | | | | | | | | Other
| | | | | | | | | | | | | | | | | currencies
| | | | | | | | | | | | | | Pound
| | | and equity
| | | As of December 31, 2008 (M€) | | Total | | | Euro | | | Dollar | | | sterling | | | affiliates | | | Shareholders’ equity at historical exchange rate | | | 53,868 | | | | 25,084 | | | | 15,429 | | | | 5,587 | | | | 7,768 | | | Currency translation adjustment before net investment hedge | | | (4,876 | ) | | | — | | | | (2,191 | ) | | | (1,769 | ) | | | (916 | ) | | Net investment hedge — open instruments | | | — | | | | — | | | | — | | | | — | | | | — | | | Shareholders’ equity at exchange rate as of December 31, 2008 | | | 48,992 | | | | 25,084 | | | | 13,238 | | | | 3,818 | | | | 6,852 | | | | | | | | | | | | | | | | | | | | | | | |
| | | | | | | | | | | | Euro / Dollar
exchange rates | | | Euro / Pound sterling
exchange rates | | As of December 31, 2011 | | | 1.29 | | | | 0.84 | | As of December 31, 2010 | | | 1.34 | | | | 0.86 | | As of December 31, 2009 | | | 1.44 | | | | 0.89 | |
| | | | | | | | | | | | | | | | | | | | | | As of December 31, 2011 (M€) | | Total | | | Euro | | | Dollar | | | Pound
sterling | | | Other currencies and
equity affiliates(a) | | Shareholders’ equity at historical exchange rate | | | 69,025 | | | | 41,396 | | | | 21,728 | | | | 4,713 | | | | 1,188 | | Currency translation adjustment before net investment hedge | | | (962 | ) | | | | | | | 127 | | | | (923 | ) | | | (166 | ) | Net investment hedge — open instruments | | | (26 | ) | | | | | | | (25 | ) | | | (1 | ) | | | — | | Shareholders’ equity at exchange rate as of December 31, 2011 | | | 68,037 | | | | 41,396 | | | | 21,830 | | | | 3,789 | | | | 1,022 | | | | | | | | | | As of December 31, 2010 (M€) | | Total | | | Euro | | | Dollar | | | Pound
sterling | | | Other currencies and
equity affiliates(a) | | Shareholders’ equity at historical exchange rate | | | 62,909 | | | | 32,894 | | | | 22,242 | | | | 4,997 | | | | 2,776 | | Currency translation adjustment before net investment hedge | | | (2,501 | ) | | | — | | | | (1,237 | ) | | | (1,274 | ) | | | 10 | | Net investment hedge — open instruments | | | 6 | | | | — | | | | 6 | | | | — | | | | — | | Shareholders’ equity at exchange rate as of December 31, 2010 | | | 60,414 | | | | 32,894 | | | | 21,011 | | | | 3,723 | | | | 2,786 | | | | | | | | | As of December 31, 2009 (M€) | | Total | | | Euro | | | Dollar | | | Pound
sterling | | | Other currencies and
equity affiliates | | Shareholders’ equity at historical exchange rate | | | 57,621 | | | | 27,717 | | | | 18,671 | | | | 5,201 | | | | 6,032 | | Currency translation adjustment before net investment hedge | | | (5,074 | ) | | | — | | | | (3,027 | ) | | | (1,465 | ) | | | (582 | ) | Net investment hedge — open instruments | | | 5 | | | | — | | | | 6 | | | | (1 | ) | | | — | | Shareholders’ equity at exchange rate as of December 31, 2009 | | | 52,552 | | | | 27,717 | | | | 15,650 | | | | 3,735 | | | | 5,450 | |
| (a) | | | (a) | | The decrease in the heading “Other currencies and equity affiliates” is mainly explained by the change in the consolidation method of Sanofi-AventisSanofi (see Note 3 to the Consolidated Financial Statements). The contribution to the shareholders’ equity of this investment is now reclassified into the heading for the Eurozone. |
As a result of this policy, the impact of currency exchange rate fluctuations on consolidated income, as illustrated in Note 7 to the Consolidated Financial Statements, has not been significant over the last three years despite the considerable fluctuation of the dollar (nil(gain of€118 million in 2011, nil result in 2010, loss of €32€32 million in 2009, gain of €112 million in 2008)2009). The Group holds interests in a number of publicly-traded companies (see Notes 12 and 13 to the Consolidated Financial Statements). The market value of these holdings fluctuates due to various factors, including stock market trends, valuations of the sectors in which the companies operate, and the economic and financial condition of each individual company. TOTAL S.A. has confirmed lines of credit granted by international banks, which are calculated to allow it to manage its short-term liquidity needs as required. As of December 31, 2010,2011, these lines of credit amounted to $9,592$10,139 million, of which $9,581$10,096 million was unused. The agreements for the lines of credit granted to TOTAL S.A. do not contain conditions related to the Company’s financial ratios, to its financial ratings from specialized agencies, or to the occurrence of events that could have a material adverse effect on its financial position. As of December 31, 2010,2011, the aggregate amount of the principal confirmed lines of credit
F-88
granted by international banks to Group companies, including TOTAL S.A., was $10,395$11,447 million, of which $10,383$11,154 million was unused. The lines of credit granted to Group companies other than TOTAL S.A. are not intended to finance the Group’s general needs; they are intended to finance either the general needs of the borrowing subsidiary or a specific project. The following tables show the maturity of the financial assets and liabilities of the Group as of December 31, 2011, 2010 2009 and 20082009 (see Note 20 to the Consolidated Financial Statements). | | | | | | | | | | | | | | | | | | | | | | | | | | | | | | As of December 31, 2010 (M€)
| | Less than
| | | | | | | | | | | | | | | More than
| | | | | | ASSETS/(LIABILITIES) | | one year | | | 1-2 years | | | 2-3 years | | | 3-4 years | | | 4-5 years | | | 5 years | | | Total | | | Non-current financial debt (notional value excluding interests) | | | | | | | (3,355 | ) | | | (3,544 | ) | | | (2,218 | ) | | | (3,404 | ) | | | (6,392 | ) | | | (18,913 | ) | | Current borrowings | | | (9,653 | ) | | | | | | | | | | | | | | | | | | | | | | | (9,653 | ) | | Other current financial liabilities | | | (159 | ) | | | | | | | | | | | | | | | | | | | | | | | (159 | ) | | Current financial assets | | | 1,205 | | | | | | | | | | | | | | | | | | | | | | | | 1,205 | | | Cash and cash equivalents | | | 14,489 | | | | | | | | | | | | | | | | | | | | | | | | 14,489 | | | | | | | | | | | | | | | | | | | | | | | | | | | | | | | | Net amount before financial expense | | | 5,882 | | | | (3,355 | ) | | | (3,544 | ) | | | (2,218 | ) | | | (3,404 | ) | | | (6,392 | ) | | | (13,031 | ) | | Financial expense on non-current financial debt | | | (843 | ) | | | (729 | ) | | | (605 | ) | | | (450 | ) | | | (358 | ) | | | (1,195 | ) | | | (4,180 | ) | | Interest differential on swaps | | | 461 | | | | 334 | | | | 153 | | | | 33 | | | | 2 | | | | (78 | ) | | | 905 | | | | | | | | | | | | | | | | | | | | | | | | | | | | | | | | Net amount | | | 5,500 | | | | (3,750 | ) | | | (3,996 | ) | | | (2,635 | ) | | | (3,760 | ) | | | (7,665 | ) | | | (16,306 | ) | | | | | | | | | | | | | | | | | | | | | | | | | | | | | | |
| | | | | | | | | | | | | | | | | | | | | | | | | | | | | | As of December 31, 2009 (M€)
| | Less than
| | | | | | | | | | | | | | | More than
| | | | | | ASSETS/(LIABILITIES) | | one year | | | 1-2 years | | | 2-3 years | | | 3-4 years | | | 4-5 years | | | 5 years | | | Total | | | Non-current financial debt (notional value excluding interests) | | | | | | | (3,658 | ) | | | (3,277 | ) | | | (3,545 | ) | | | (2,109 | ) | | | (5,823 | ) | | | (18,412 | ) | | Current borrowings | | | (6,994 | ) | | | | | | | | | | | | | | | | | | | | | | | (6,994 | ) | | Other current financial liabilities | | | (123 | ) | | | | | | | | | | | | | | | | | | | | | | | (123 | ) | | Current financial assets | | | 311 | | | | | | | | | | | | | | | | | | | | | | | | 311 | | | Cash and cash equivalents | | | 11,662 | | | | | | | | | | | | | | | | | | | | | | | | 11,662 | | | | | | | | | | | | | | | | | | | | | | | | | | | | | | | | Net amount before financial expense | | | 4,856 | | | | (3,658 | ) | | | (3,277 | ) | | | (3,545 | ) | | | (2,109 | ) | | | (5,823 | ) | | | (13,556 | ) | | Financial expense on non-current financial debt | | | (768 | ) | | | (697 | ) | | | (561 | ) | | | (448 | ) | | | (301 | ) | | | (1,112 | ) | | | (3,887 | ) | | Interest differential on swaps | | | 447 | | | | 233 | | | | 100 | | | | 25 | | | | (16 | ) | | | (55 | ) | | | 734 | | | | | | | | | | | | | | | | | | | | | | | | | | | | | | | | Net amount | | | 4,535 | | | | (4,122 | ) | | | (3,738 | ) | | | (3,968 | ) | | | (2,426 | ) | | | (6,990 | ) | | | (16,709 | ) | | | | | | | | | | | | | | | | | | | | | | | | | | | | | | |
| | | | | | | | | | | | | | | | | | | | | | | | | | | | | | As of December 31, 2008 (M€)
| | Less than
| | | | | | | | | | | | | | | More than
| | | | | | ASSETS/(LIABILITIES) | | one year | | | 1-2 years | | | 2-3 years | | | 3-4 years | | | 4-5 years | | | 5 years | | | Total | | | Non-current financial debt (notional value excluding interests) | | | | | | | (2,992 | ) | | | (3,658 | ) | | | (3,324 | ) | | | (3,232 | ) | | | (2,093 | ) | | | (15,299 | ) | | Current borrowings | | | (7,722 | ) | | | | | | | | | | | | | | | | | | | | | | | (7,722 | ) | | Other current financial liabilities | | | (158 | ) | | | | | | | | | | | | | | | | | | | | | | | (158 | ) | | Current financial assets | | | 187 | | | | | | | | | | | | | | | | | | | | | | | | 187 | | | Cash and cash equivalents | | | 12,321 | | | | | | | | | | | | | | | | | | | | | | | | 12,321 | | | | | | | | | | | | | | | | | | | | | | | | | | | | | | | | Net amount before financial expense | | | 4,628 | | | | (2,992 | ) | | | (3,658 | ) | | | (3,324 | ) | | | (3,232 | ) | | | (2,093 | ) | | | (10,671 | ) | | Financial expense on non-current financial debt | | | (554 | ) | | | (512 | ) | | | (431 | ) | | | (299 | ) | | | (189 | ) | | | (174 | ) | | | (2,159 | ) | | Interest differential on swaps | | | 118 | | | | 211 | | | | 100 | | | | 62 | | | | 37 | | | | (7 | ) | | | 521 | | | | | | | | | | | | | | | | | | | | | | | | | | | | | | | | Net amount | | | 4,192 | | | | (3,293 | ) | | | (3,989 | ) | | | (3,561 | ) | | | (3,384 | ) | | | (2,274 | ) | | | (12,309 | ) | | | | | | | | | | | | | | | | | | | | | | | | | | | | | | |
F-89
| | | | | | | | | | | | | | | | | | | | | | | | | | | | | As of December 31, 2011 (M€)
Assets/(Liabilities) | | Less than
one year | | | 1-2 years | | | 2-3 years | | | 3-4 years | | | 4-5 years | | | More than
5 years | | | Total | | Non-current financial debt (notional value excluding interests) | | | | | | | (4,492 | ) | | | (3,630 | ) | | | (3,614 | ) | | | (1,519 | ) | | | (7,326 | ) | | | (20,581 | ) | Current borrowings | | | (9,675 | ) | | | | | | | | | | | | | | | | | | | | | | | (9,675 | ) | Other current financial liabilities | | | (167 | ) | | | | | | | | | | | | | | | | | | | | | | | (167 | ) | Current financial assets | | | 700 | | | | | | | | | | | | | | | | | | | | | | | | 700 | | Cash and cash equivalents | | | 14,025 | | | | | | | | | | | | | | | | | | | | | | | | 14,025 | | Net amount before financial expense | | | 4,883 | | | | (4,492 | ) | | | (3,630 | ) | | | (3,614 | ) | | | (1,519 | ) | | | (7,326 | ) | | | (15,698 | ) | Financial expense on non-current financial debt | | | (785 | ) | | | (691 | ) | | | (521 | ) | | | (417 | ) | | | (302 | ) | | | (1,075 | ) | | | (3,791 | ) | Interest differential on swaps | | | 320 | | | | 331 | | | | 221 | | | | 120 | | | | 55 | | | | 44 | | | | 1,091 | | Net amount | | | 4,418 | | | | (4,852 | ) | | | (3,930 | ) | | | (3,911 | ) | | | (1,766 | ) | | | (8,357 | ) | | | (18,398 | ) | | | | | | | | | | | | | | | | | | | | | | | | | | | | | | | | | | | | | | | As of December 31, 2010
(M€) Assets/(Liabilities) | | Less than
one year | | | 1-2 years | | | 2-3 years | | | 3-4 years | | | 4-5 years | | | More than
5 years | | | Total | | Non-current financial debt (notional value excluding interests) | | | | | | | (3,355 | ) | | | (3,544 | ) | | | (2,218 | ) | | | (3,404 | ) | | | (6,392 | ) | | | (18,913 | ) | Current borrowings | | | (9,653 | ) | | | | | | | | | | | | | | | | | | | | | | | (9,653 | ) | Other current financial liabilities | | | (159 | ) | | | | | | | | | | | | | | | | | | | | | | | (159 | ) | Current financial assets | | | 1,205 | | | | | | | | | | | | | | | | | | | | | | | | 1,205 | | Cash and cash equivalents | | | 14,489 | | | | | | | | | | | | | | | | | | | | | | | | 14,489 | | Net amount before financial expense | | | 5,882 | | | | (3,355 | ) | | | (3,544 | ) | | | (2,218 | ) | | | (3,404 | ) | | | (6,392 | ) | | | (13,031 | ) | Financial expense on non-current financial debt | | | (843 | ) | | | (729 | ) | | | (605 | ) | | | (450 | ) | | | (358 | ) | | | (1,195 | ) | | | (4,180 | ) | Interest differential on swaps | | | 461 | | | | 334 | | | | 153 | | | | 33 | | | | 2 | | | | (78 | ) | | | 905 | | Net amount | | | 5,500 | | | | (3,750 | ) | | | (3,996 | ) | | | (2,635 | ) | | | (3,760 | ) | | | (7,665 | ) | | | (16,306 | ) | | | | | | | | | | | | | | | | | | | | | | | | | | | | | | | | | | | | | | | As of December 31, 2009
(M€) Assets/(Liabilities) | | Less than
one year | | | 1-2 years | | | 2-3 years | | | 3-4 years | | | 4-5 years | | | More than
5 years | | | Total | | Non-current financial debt (notional value excluding interests) | | | | | | | (3,658 | ) | | | (3,277 | ) | | | (3,545 | ) | | | (2,109 | ) | | | (5,823 | ) | | | (18,412 | ) | Current borrowings | | | (6,994 | ) | | | | | | | | | | | | | | | | | | | | | | | (6,994 | ) | Other current financial liabilities | | | (123 | ) | | | | | | | | | | | | | | | | | | | | | | | (123 | ) | Current financial assets | | | 311 | | | | | | | | | | | | | | | | | | | | | | | | 311 | | Cash and cash equivalents | | | 11,662 | | | | | | | | | | | | | | | | | | | | | | | | 11,662 | | Net amount before financial expense | | | 4,856 | | | | (3,658 | ) | | | (3,277 | ) | | | (3,545 | ) | | | (2,109 | ) | | | (5,823 | ) | | | (13,556 | ) | Financial expense on non-current financial debt | | | (768 | ) | | | (697 | ) | | | (561 | ) | | | (448 | ) | | | (301 | ) | | | (1,112 | ) | | | (3,887 | ) | Interest differential on swaps | | | 447 | | | | 233 | | | | 100 | | | | 25 | | | | (16 | ) | | | (55 | ) | | | 734 | | Net amount | | | 4,535 | | | | (4,122 | ) | | | (3,738 | ) | | | (3,968 | ) | | | (2,426 | ) | | | (6,990 | ) | | | (16,709 | ) |
In addition, the Group guarantees bank debt and finance lease obligations of certain non-consolidated companies and equity affiliates. A payment would be triggered by failure of the guaranteed party to fulfill its obligation covered by the guarantee, and no assets are held as collateral for these guarantees. Maturity dates and amounts are set forth in Note 23 to the Consolidated Financial Statements (“Guarantees given against borrowings”). The Group also guarantees the current liabilities of certain non-consolidated companies. Performance under these guarantees would be triggered by a financial default of these entities. Maturity dates and amounts are set forth in Note 23 to the Consolidated Financial Statements (“Guarantees of current liabilities”). The following table sets forth financial assets and liabilities related to operating activities as of December 31, 2011, 2010 2009 and 20082009 (see Note 28 to the Consolidated Financial Statements). | | | | | | | | | | | | | | As of December 31
| | | | | | | | | | (M€)
| | | | | | | | | | | ASSETS/(LIABILITIES) | | 2010 | | | 2009 | | | 2008 | | | Accounts payable | | | (18,450 | ) | | | (15,383 | ) | | | (14,815 | ) | | Other operating liabilities | | | (3,574 | ) | | | (4,706 | ) | | | (4,297 | ) | including financial instruments related to commodity contracts | | | (559 | ) | | | (923 | ) | | | (1,033 | ) | | Accounts receivable, net | | | 18,159 | | | | 15,719 | | | | 15,287 | | | Other operating receivables | | | 4,407 | | | | 5,145 | | | | 6,208 | | including financial instruments related to commodity contracts | | | 499 | | | | 1,029 | | | | 1,664 | | | | | | | | | | | | | | | | Total | | | 542 | | | | 775 | | | | 2,383 | | | | | | | | | | | | | | | |
| | | | | | | | | | | | | As of December 31 (M€)
Assets/(Liabilities) | | 2011 | | | 2010 | | | 2009 | | Accounts payable | | | (22,086 | ) | | | (18,450 | ) | | | (15,383 | ) | Other operating liabilities | | | (5,441 | ) | | | (3,574 | ) | | | (4,706 | ) | including financial instruments related to commodity contracts | | | (606 | ) | | | (559 | ) | | | (923 | ) | Accounts receivable, net | | | 20,049 | | | | 18,159 | | | | 15,719 | | Other operating receivables | | | 7,467 | | | | 4,407 | | | | 5,145 | | including financial instruments related to commodity contracts | | | 1,074 | | | | 499 | | | | 1,029 | | Total | | | (11 | ) | | | 542 | | | | 775 | |
These financial assets and liabilities mainly have a maturity date below one year. Credit risk is defined as the risk of the counterparty to a contract failing to perform or pay the amounts due. The Group is exposed to credit risks in its operating and financing activities. The Group’s maximum exposure to credit risk is partially related to financial assets recorded on its balance sheet, including energy derivative instruments that have a positive market value. The following table presents the Group’s maximum credit risk exposure: | | | | | | | | | | | | | | As of December 31
| | | | | | | | | | (M€)
| | | | | | | | | | | ASSETS/(LIABILITIES) | | 2010 | | | 2009 | | | 2008 | | Loans to equity affiliates(Note 12) | | | 2,383 | | | | 2,367 | | | | 2,005 | | Loans and advances(Note 14) | | | 1,596 | | | | 1,284 | | | | 1,403 | | Hedging instruments of non-current financial debt(Note 20) | | | 1,870 | | | | 1,025 | | | | 892 | | Accounts receivable(Note 16) | | | 18,159 | | | | 15,719 | | | | 15,287 | | | Other operating receivables (Note 16) | | | 4,407 | | | | 5,145 | | | | 6,208 | | Current financial assets(Note 20) | | | 1,205 | | | | 311 | | | | 187 | | Cash and cash equivalents(Note 27) | | | 14,489 | | | | 11,662 | | | | 12,321 | | | | | | | | | | | | | | | | Total | | | 44,109 | | | | 37,513 | | | | 38,303 | | | | | | | | | | | | | | | |
| | | | | | | | | | | | | As of December 31, (M€) Assets/
(Liabilities) | | 2011 | | | 2010 | | | 2009 | | Loans to equity affiliates(Note 12) | | | 2,246 | | | | 2,383 | | | | 2,367 | | Loans and advances(Note 14) | | | 2,055 | | | | 1,596 | | | | 1,284 | | Hedging instruments of non-current financial debt(Note 20) | | | 1,976 | | | | 1,870 | | | | 1,025 | | Accounts receivable(Note 16) | | | 20,049 | | | | 18,159 | | | | 15,719 | | Other operating receivables (Note 16) | | | 7,467 | | | | 4,407 | | | | 5,145 | | Current financial assets(Note 20) | | | 700 | | | | 1,205 | | | | 311 | | Cash and cash equivalents (Note 27) | | | 14,025 | | | | 14,489 | | | | 11,662 | | Total | | | 48,518 | | | | 44,109 | | | | 37,513 | |
The valuation allowance on loans and advances and on accounts receivable and other operating receivables is detailed respectively in Notes 14 and 16 to the Consolidated Financial Statements. As part of its credit risk management related to operating and financing activities, the Group has developed margin call contracts with certain counterparties. As of December 31, 2010,2011, the net amount received as part of these margin calls was €1,560€1,682 million (against €693€1,560 million as of December 31, 2010 and€693 million as of December 31, 2009). Credit risk is managed by the Group’s business segments as follows:
| | | | - | Exploration & Production |
Risks arising under contracts with government authorities or other oil companies or under long-term supply contracts necessary for the development of projects are evaluated during the project approval process. The long-term aspect of these contracts and the high-quality of the other parties lead to a low level of credit risk. Risks related to commercial operations, other than those described above (which are, in practice, directly monitored by subsidiaries), are subject to procedures for establishing and reviewing credit. Customer receivables are subject to provisions on acase-by-case basis, based on prior history and management’s assessment of the facts and circumstances.
F-90
The Gas & Power division deals with counterparties in the energy, industrial and financial sectors throughout the world. Financial institutions providing credit risk coverage are highly rated international bank and insurance groups. Potential counterparties are subject to credit assessment and approval before concluding transactions and are thereafter subject to regular review, including re-appraisal and approval of the limits previously granted. The creditworthiness of counterparties is assessed based on an analysis of quantitative and qualitative data regarding financial standing and business risks, together with the review of any relevant third party and market information, such as data published by rating agencies. On this basis, credit limits are defined for each potential counterparty and, where appropriate, transactions are subject to specific authorisations. Credit exposure, which is essentially an economic exposure or an expected future physical exposure, is permanently monitored and subject to sensitivity measures. Credit risk is mitigated by the systematic use of industry standard contractual frameworks that permit netting, enable requiring added security in case of adverse change in the counterparty risk, and allow for termination of the contract upon occurrence of certain events of default. | | | | | - | Refining & MarketingDownstream Segment |
Internal procedures for the Refining & Marketing division include rules on credit risk that describe the basis of internal control in this domain, including the separation of authority between commercial and financial operations. Credit policies are defined at the local level, complemented by the implementation of procedures to monitor customer risk (credit committees at the subsidiary level, the creation of credit limits for corporate customers, portfolio guarantees, etc.). Each entity also implements monitoring of its outstanding receivables. Risks related to credit may be mitigated or limited by subscription of credit insurance and/or requiring security or guarantees. Bad debts are provisioned on acase-by-case basis at a rate determined by management based on an assessment of the facts and circumstances.risk of credit loss. Trading & Shipping deals with commercial counterparties and financial institutions located throughout the world. Counterparties to physical and derivative transactions are primarily entities involved in the oil and gas industry or in the trading of energy commodities, or financial institutions. Credit risk coverage is concluded with financial institutions, international banks and insurance groups selected in accordance with strict criteria. The Trading & Shipping division has a strict policy of internal delegation of authority governing establishment of country and counterparty credit limits and approval of specific transactions. Credit exposures contracted under these limits and approvals are monitored on a daily basis. Potential counterparties are subject to credit assessment and approval prior to any transaction being concluded and all active counterparties are subject to regular reviews, including re-appraisal and approval of granted limits. The creditworthiness of counterparties is assessed based on an analysis of quantitative and qualitative data regarding financial standing and business risks, together with the review of any relevant third party and market information, such as ratings published by Standard & Poor’s, Moody’s Investors Service and other agencies. Contractual arrangements are structured so as to maximize the risk mitigation benefits of netting between transactions wherever possible and additional protective terms providing for the provision of security in the event of financial deterioration and the termination of transactions on the occurrence of defined default events are used to the greatest permitted extent. Credit risks in excess of approved levels are secured by means of letters of credit and other guarantees, cash deposits and insurance arrangements. In respect of derivative transactions, risks are secured by margin call contracts wherever possible. Credit risk in the Chemicals segment is primarily related to commercial receivables. Each division implements procedures for managing and provisioning credit risk that differ based on the size of the subsidiary and the market in which it operates. The principal elements of these procedures are: implementation of credit limits with different authorization procedures for possible credit overruns; use of insurance policies or specific guarantees (letters of credit); regular monitoring and assessment of overdue accounts (aging balance), including collection procedures; and provisioning of bad debts on a customer-by-customer basis, according to payment delays and local payment practices (provisions may also be calculated based on statistics). | 32) | | | | | • | Implementation of credit limits with different authorization procedures for possible credit overruns; | | • | Use of insurance policies or specific guarantees (letters of credit); | | • | Regular monitoring and assessment of overdue accounts (aging balance), including collection procedures; and |
F-91
| | | | • | Provisioning of bad debts on acustomer-by-customer basis, according to payment delays and local payment practices (provisions may also be calculated based on statistics). |
| | 32) | OTHER RISKS AND CONTINGENT LIABILITIES |
TOTAL is not currently aware of any exceptional event, dispute, risks or contingent liabilities that could have a material impact on the assets and liabilities, results, financial position or operations of the Group. The contingent commitments and contractual obligations are detailed in note 23 to the consolidated financial statement. ANTITRUST INVESTIGATIONS For the year ended 2010, the Group has not been fined pursuant to a Court ruling. The principal antitrust proceedings in which the Group isGroup’s companies are involved are described thereafter.hereafter. | • | | • | As part of the spin-off of Arkema(1)(1) in 2006, TOTAL S.A. or certain other Group companies agreed to grant Arkema guaranteesa guarantee for potential monetary consequences related to antitrust proceedings arising from events prior to the spin-off. |
| | | | | These guarantees cover, for a period of ten years, 90% of amounts paid by Arkema related to (i) fines imposed by European authorities or European member-states for competition law violations, (ii) fines imposed by U.S. courts or antitrust authorities for federal antitrust violations or violations of the competition laws of U.S. states, (iii) damages awarded in civil proceedings related to the government proceedings mentioned above, and (iv) certain costs related to these proceedings. The guarantee related to anti-competition violations in Europe applies to amounts above a €176.5 million threshold. On the other hand, the agreements provide that Arkema will indemnify TOTAL S.A. or any Group company for 10% of any amount that TOTAL S.A. or any Group company are required to pay under any of the proceedings covered by these guarantees. |
This guarantee covers, for a period of ten years from the date of the spin-off, 90% of amounts paid by Arkema related to (i) fines imposed by European authorities or European member-states for competition law violations, (ii) fines imposed by U.S. courts or antitrust authorities for federal antitrust violations or violations of the competition laws of U.S. states, (iii) damages awarded in civil proceedings related to the government proceedings mentioned above, and (iv) certain costs related to these proceedings. The guarantee related to anti-competition violations in Europe applies to amounts above a€176.5 million threshold. On the other hand, the agreements provide that Arkema will indemnify TOTAL S.A. or any Group company for 10% of any amount that TOTAL S.A. or any Group company are required to pay under any of the proceedings covered by this guarantee, in Europe. If one or more individuals or legal entities, acting alone or together, directly or indirectly holds more than one-third of the voting rights of Arkema, or if Arkema transfers more than 50% of its assets (as calculated under the enterprise valuation method, as of the date of the transfer) to a third party or parties acting together, irrespective of the type or number of transfers, these guaranteesthis guarantee will become void. In the United States, civil liability lawsuits, for which TOTAL S.A. has been named as the parent company, are closed without significant impact on the Group’s financial position. | | • | In the United States, investigations into certain commercial practices of some subsidiaries of the Arkema group have been closed since 2007; no charges have been brought against Arkema. Civil liability lawsuits, for which TOTAL S.A. has been named as the parent company, are about to be closed and are not expected to have a significant impact on the Group’s financial position. | • | In Europe, since May 2006, the European Commission has fined companies of the Group in its configuration prior to the spin-off an overall amount of €385.47In Europe, since 2006, the European Commission has fined companies of the Group in its configuration prior to the spin-off an overall amount of€385.47 million, of which Elf Aquitaine and/or TOTAL S.A. were held jointly liable for€280.17 million, Elf Aquitaine being personally fined€23.6 million for deterrence. These fines are entirely settled as of today. and/or TOTAL S.A. and their subsidiaries were held jointly liable for €280.17 million, Elf Aquitaine being personally fined €23.6 million for deterrence. These fines are entirely settled as of today.
|
As a result,(2) since the spin-off, the Group has paid the overall amount of €188.07€188.07 million(2), corresponding to 90% of the fines overall amount once the threshold provided for by the guarantee is deducted. deducted to which an amount of€31.31 million of interest has been added as explained hereinafter.The European Commission imposed these fines following investigations between 2000 and 2004 into commercial practices involving eight products sold by Arkema. Five of these investigations resulted in prosecutions from the European Commission for which Elf Aquitaine has been named as the parent company, and two of these investigations named TOTAL S.A. as the ultimate parent company of the Group. TOTAL S.A. and Elf Aquitaine are contesting their liability based solely on their status as parent companies and appealed for cancellation and reformation of the rulings that are still pending before the relevant EU court of appeals or supreme court of appeals. During the year 2011, four of the proceedings have evolved and are closed as far as Arkema is concerned: | – | | In one of these proceedings, the Court of Justice of the European Union (CJEU) has rejected the action of Arkema while the decisions of the European Commission and of the General Court of the European Union against the parent companies have been squashed. Consequently, this proceeding is definitively closed regarding Arkema as well as the parent companies. |
| – | | In two other proceedings, previous decisions against Arkema and the parent companies have been upheld by the General Court of the European Union. While the parent companies have introduced an appeal before the CJEU, Arkema did not appeal to the CJEU. |
| – | | Finally, in a last proceeding, the General Court has decided to reduce the amount of the fine initially ordered against Arkema while, in parallel, it has rejected the actions of the parent companies that have remained obliged to pay the whole amount of the fine initially ordered by the European Commission. Arkema has accepted this decision while the parent companies have introduced an appeal before the CJEU. |
F-90 | (1) | Arkema is used in this section to designate those companies of the Arkema group whose ultimate parent company is Arkema S.A. Arkema became an independent company after being spun-off from TOTAL S.A. in May 2006. |
| (2) | This amount does not take into account a case that led to Arkema, prior to Arkema’s spin-off from TOTAL, and Elf Aquitaine being fined jointly€45 million and Arkema being fined€13.5 million. |
Besides, aWith the exception of the€31.31 million of interest charged by the European Commission to the parent companies, which has been required to pay in accordance with the decision concerning the last proceeding referred hereinabove, the evolution of the proceedings during the year 2011 did not modify the global amount assumed by the Group in execution of the guarantee. In addition, civil proceedingproceedings against Arkema and fiveother groups of companies waswere initiated in 2009 and 2011, respectively, before a German regional courtand Dutch courts by a third partyparties for an alleged damagedamages pursuant to onetwo of the above describedmentioned legal proceedings. TOTAL S.A. was summoned to serve notice of the dispute before thisthe German court. At this point, the probability to have a favorable verdict and the financial impacts of this procedurethese proceedings are uncertain due to the number of legal difficulties it gavethey give rise to, the (1) Arkema is used in this section to designate those companies of the Arkema group whose ultimate parent company is Arkema S.A. Arkema became an independent company after being spun-off from TOTAL S.A. in May 2006.
(2) This amount does not take into account a case that led to Arkema, prior to Arkema’s spin-off from TOTAL, and Elf Aquitaine being fined jointly €45 million and Arkema being fined €13.5 million. This case is referred to in past Registration Documents.
F-92
lack of documented claimclaims and the complex evaluationevaluations of the alleged damage. damages.Arkema began implementing compliance procedures in 2001 that are designed to prevent its employees from violating antitrust provisions. However, it is not possible to exclude the possibility that the relevant authorities could commence additional proceedings involving Arkema regarding events prior to the spin-off, as well as Elf Aquitaineand/or TOTAL S.A. based on their status as parent company. Within the framework of all of the legal proceedings described above, a €17€17 million reserve isremains booked in the Group’s consolidated financial statements as of December 31, 2010. 2011.Downstream segment Pursuant to a statement of objections received by Total Nederland N.V. and TOTAL S.A. (based on its status as parent company) from the European Commission, Total Nederland N.V. was fined€20.25 million in 2006, for which TOTAL S.A. was held jointly liable for€13.5 million. TOTAL S.A. appealed this decision before the relevant court and this appeal is still pending. | | • | Pursuant to a statement of objections received by Total Nederland N.V. and TOTAL S.A. (based on its status as parent company) from the European Commission, Total Nederland N.V. was fined in 2006 €20.25 million, which has been paid, and for which TOTAL S.A. was held jointly liable for €13.5 million. TOTAL S.A. appealed this decision before the relevant court and this appeal is still pending. |
In addition, pursuant to a statement of objections received by Total Raffinage Marketing (formerly Total France) and TOTAL S.A. from the European Commission regarding another product line of the Refining & Marketing division, Total Raffinage Marketing was fined €128.2€128.2 million in 2008, which has been paid, and for which TOTAL S.A. was held jointly liable based on its status as parent company. TOTAL S.A. also appealed this decision before the relevant court and this appeal is still pending. | | • | Finally, TotalGaz and Total Raffinage Marketing received a statement of objections from the French Antitrust Authority (Autorité de la concurrence française) regarding alleged antitrust practices concerning another product line of the Refining & Marketing division. The case was dismissed by decision of the French antitrust authorities on December 17, 2010. |
GivenIn addition, civil proceedings against TOTAL S.A and Total Raffinage Marketing and other companies were initiated before U.K and Dutch courts by third parties for alleged damages in connection with the discretionary powers grantedprosecutions brought by the European Commission in this case. At this point, the probability to have a favorable verdict and the financial impacts of these procedures are uncertain due to the antitrust authorities for determining fines relatingnumber of legal difficulties they gave rise to, antitrust regulations, itthe lack of documented claims and evaluations of the alleged damages. Within the framework of the legal proceedings described above, a€30 million reserve is not currently possible to determine with certaintybooked in the outcomeGroup’s consolidated financial statements as of these investigations and proceedings. TOTAL S.A. and Elf Aquitaine are contesting their liability andDecember 31, 2011. Whatever the methodevolution of determining these fines. Although it is not possible to predict the ultimate outcome of these proceedings described above, the Group believes that they willtheir outcome should not have a material adverse effect on itsthe Group’s financial situation or consolidated results. GRANDE PAROISSE An explosion occurred at the Grande Paroisse industrial site in the city of Toulouse in France on September 21, 2001. Grande Paroisse, a former subsidiary of Atofina which became a subsidiary of Elf Aquitaine Fertilisants on December 31, 2004, as part of the reorganization of the Chemicals segment, was principally engaged in the production and sale of agricultural fertilizers. The explosion, which involved a stockpile of ammonium nitrate pellets, destroyed a portion of the site and caused the death of thirty-one people, including twenty-one workers at the site, and injured many others. The explosion also caused significant damage to certain property in part of the city of Toulouse. This plant has been closed and individual assistance packages have been provided for employees. The site has been rehabilitated. On December 14, 2006, Grande Paroisse signed, under the supervision of the city of Toulouse, the deed whereby it donated the former site of the AZF plant to the greater agglomeration of Toulouse (CAGT) and theCaisse des dépôts et consignations and its subsidiary ICADE. Under this deed, TOTAL S.A. guaranteed the site restoration obligations of Grande Paroisse and granted a€10 million endowment to the InNaBioSanté research foundation as part of the setting up of a cancer research center at the site by the city of Toulouse. Regarding the cause of the explosion, the hypothesis that the explosion was caused by Grande Paroisse through the accidental mixing of hundreds of kilos of a chlorine compound at a storage site for ammonium nitrate was BUNCEFIELDdiscredited over the course of the investigation. As a result, proceedings against ten of the eleven Grande Paroisse employees charged during the criminal investigation conducted by the Toulouse Regional Court (Tribunal de grande instance) were dismissed and this dismissal was upheld on appeal. Nevertheless, the final experts’ report filed on May 11, 2006 continued to focus on the hypothesis of a chemical accident, although this hypothesis was not confirmed during the attempt to reconstruct the accident at the site. After having articulated several hypotheses, the experts no longer maintain that the accident was caused by pouring a large quantity of a chlorine compound over ammonium nitrate. Instead, the experts have retained a scenario where a container of chlorine compound sweepings was poured between a layer of wet ammonium nitrate covering the floor and a quantity of dry agricultural nitrate at a location not far from the principal storage site. This is claimed to have caused an explosion which then spread into the main storage site. Grande Paroisse was investigated based on this new hypothesis in 2006; Grande Paroisse is contesting this explanation, which it believes to be based on elements that are not factually accurate. All the requests for additional investigations that were submitted by Grande Paroisse, the former site manager and various plaintiffs were denied on appeal after the end of the criminal investigation procedure. On July 9, 2007, the investigating judge brought charges against Grande Paroisse and the former plant manager before the criminal chamber of the Court of Appeal of Toulouse. In late 2008, TOTAL S.A. and Mr. Thierry Desmarest were summoned to appear in Court pursuant to a request by a victims association. The trial for this case began on February 23, 2009, and lasted approximately four months. On November 19, 2009, the Toulouse Criminal Court acquitted both the former Plant Manager, and Grande Paroisse due to the lack of reliable evidence for the explosion. The Court also ruled that the summonses against TOTAL S.A. and Mr. Thierry Desmarest, Chairman and CEO at the time of the disaster, were inadmissible. Due to the presumption of civil liability that applied to Grande Paroisse, the Court declared Grande Paroisse civilly liable for the damages caused by the explosion to the victims in its capacity as custodian and operator of the plant. The Prosecutor’s office, together with certain third parties, has appealed the Toulouse Criminal Court verdict. In order to preserve its rights, Grande Paroisse lodged a cross-appeal with respect to civil charges. The appeal proceedings before the Court of Appeal of Toulouse started on November 3, 2011. A compensation mechanism for victims was set up immediately following the explosion.€2.3 billion was paid for the compensation of claims and related expenses amounts. As of December 31, 2011, a€21 million reserve was recorded in the Group’s consolidated balance sheet. BUNCEFIELD On December 11, 2005, several explosions, followed by a major fire, occurred at an oil storage depot at Buncefield, north of London. This depot was operated by Hertfordshire Oil Storage Limited (HOSL), a company in which TOTAL’s UK subsidiary holds 60% and another oil group holds 40%. The explosion caused injuries, most of which were minor injuries, to a number of people and caused property damage to the depot and the buildings and homes located nearby. The official Independent Investigation Board has indicated that the explosion was caused by the overflow of a tank at the depot. The Board’s final report was released on December 11, 2008. The civil procedure for claims, which had not yet been settled, took place between October and December 2008. The Court’s decision of March 20, 2009, declared TOTAL’s UK subsidiary liable for the accident and solely liable for indemnifying the victims. The subsidiary appealed the decision. The appeal trial took place in January 2010. The Court of Appeals, by a decision handed down on March 4, 2010, confirmed the prior judgment. The Supreme Court of United Kingdom has partially authorized TOTAL’s UK subsidiary to contest the decision. The hearings before the Supreme Court are expectedTOTAL’s UK subsidiary finally decided to be held during the first half ofwithdraw from this recourse due to settlement agreements reached in mid-February 2011. The Group carries insurance for damage to its interests in these facilities, business interruption and civil liability claims from third parties. The provision for the civil liability that appears in the Group’s consolidated financial statements as of December 31, 2010,2011, stands at €194€80 million after taking into account the payments previously made. The Group believes that, based on the information currently available, on a reasonable estimate of its liability and on provisions recognized, this accident should not have a significant impact on the Group’s financial situation or consolidated results. In addition, on December 1, 2008, the Health and Safety Executive (HSE) and the Environment Agency (EA) issued a Notice of prosecution against five companies, including TOTAL’s UK subsidiary. By a judgment on July 16, 2010, TOTAL’s UKthe subsidiary was fined £3.6 million.million and paid it. The decision takes into account a number of elements that have mitigated the impact of the charges brought against it.
F-93
Following the sinking in December 1999 of the Erika, a tanker that was transporting products belonging to one of the Group companies, theTribunal de grande instanceof Paris convicted TOTAL S.A. of marine pollution pursuant to a judgment issued on January 16, 2008, finding that TOTAL S.A. was negligent in its vetting procedure for vessel selection, and ordering TOTAL S.A. to pay a fine of €375,000.€375,000. The courtCourt also ordered compensation to be paid to those affected by the pollution from the Erika up to an aggregate amount of €192€192 million, declaring TOTAL S.A. jointly and severally liable for such payments together with the Erika’s inspection and classification firm, the Erika’s owner and the Erika’s manager. TOTAL has appealed the verdict of January 16, 2008. In the meantime, it nevertheless proposed to pay third parties who so requested definitive compensation as determined by the court. Forty-oneCourt. Forty-two third parties have been compensated for an aggregate amount of €171.5€171.5 million. By a decision dated March 30, 2010, the Court of Appeal of Paris upheld the lower courtCourt verdict pursuant to which TOTAL S.A. was convicted of marine pollution and fined €375,000.€375,000. TOTAL appealed this decision to the French Supreme Court (Cour de cassation). However, the Court of Appeal ruled that TOTAL S.A. bears no civil liability according to the applicable international conventions and consequently ruled that TOTAL S.A. be not convicted. To facilitate the payment of damages awarded by the Court of Appeal in Paris to third parties against Erika’s controlling and classification firm, the ship-owner and the ship-manager, a global settlement agreement was signed late 2011 between these parties and TOTAL S.A. under the auspices of the IOPC Fund. Under this global settlement agreement, each party agreed to the withdrawal of all civil proceedings initiated against all other parties to the agreement. TOTAL S.A. believes that, based on the information currently available, the case should not have a significant impact on the Group’s financial situation or consolidated results. BLUE RAPID AND THE RUSSIAN OLYMPIC COMMITTEE –— RUSSIAN REGIONS AND INTERNEFT Blue Rapid, a Panamanian company, and the Russian Olympic Committee filed a claim for damages with the Paris Commercial Court against Elf Aquitaine, concerning the withdrawalalleging a so-called non-completion by a former subsidiary of oneElf Aquitaine of its subsidiaries froma contract related to an exploration and production project in Russia that was negotiated in the early 1990s. Elf Aquitaine believesbelieved this claim to be unfounded.unfounded and opposed it. On January 12, 2009, the Commercial Court of Paris rejected Blue Rapid’s claim against Elf Aquitaine and found that the Russian Olympic Committee did not have standing in the matter. ThisBlue Rapid and the Russian Olympic Committee appealed this decision. On June 30, 2011, the Court of Appeal of Paris dismissed as inadmissible the claim of Blue Rapid and the Russian Olympic Committee against Elf Aquitaine, notably on the grounds of the contract’s termination. Blue Rapid and the Russian Olympic Committee appealed this decision has been appealed. The hearings should be held duringto the first half of 2011. French Supreme Court.In connection with the same facts, and fifteen years after the termination of thisthe exploration and production project,contract, a Russian company, which was held not to be the contracting party to the contract, and two regions of the Russian Federation which were not even parties to the contract, have launched an arbitration procedure against athe aforementioned former subsidiary of Elf Aquitaine that was liquidated in 2005, claiming alleged damages of an unspecified amount at this stage ofU.S.$ 22.4 billion. For the procedure. Thesame reasons as those successfully adjudicated by Elf Aquitaine against Blue Rapid and the Russian Olympic Committee, the Group considers this claim to be unfounded.unfounded as to a matter of law or fact. The Group has lodged a criminal complaint to denounce the fraudulent claim which the Group believes it is a victim of and, has taken and reserved its rights to take anyother actionsand/or and measures that would be appropriate to defend its interests. In 2003, the United States Securities and Exchange Commission (SEC) followed by the Department of Justice (DoJ) issued a formal order directing an investigation in connection with the pursuit of business in Iran, by certain oil companies including, among others, TOTAL. The inquiry concerns an agreement concluded by the Company with a consultant concerning a gas field in Iran and aims to verify whether certain payments made under this agreement would have benefited Iranian officials in violation of the Foreign Corrupt Practices Act (FCPA) and the Company’s accounting obligations. Investigations are still pending and the Company is cooperating with the SEC and the DoJ. In 2010, the Company opened talks with U.S. authorities, without any acknowledgement of facts, to consider anout-of-court settlement. Generally,out-of-court settlements with U.S. authorities include payment settlement as it is often the case in this kind of finesproceeding. Late in 2011, the SEC and the obligationDoJ proposed to improve internal compliance systems or other measures.TOTAL out-of-court settlements that would close their inquiries, in exchange for TOTAL’s committing to a number of obligations and paying fines. As TOTAL was unable to agree to several substantial elements of the proposal, the Company is continuing discussions with the U.S. authorities. The Company is free not to accept an out-of-court settlement solution, in which case it would be exposed to the risk of prosecution in the United States. In this same case,affair, a parallel judicial inquiry related to TOTAL was initiated in France in 2006. In 2007, the Company’s Chief Executive Officer was placed under formal investigation in relation to this inquiry, as the former President of the Middle East department of the Group’s Exploration & Production division. The Company has not been notified of any significant developments in the proceedings since the formal investigation was launched. At this point, the Company cannot determine when these investigations will terminate, and cannot predict their results, or the outcome of the talks that have been initiated, or the costs of a potentialout-of-court settlement.initiated. Resolving this casethese cases is not expected to have a significant impact on the Group’s financial situation or any impactconsequences on its future planned operations. OIL-FOR-FOOD PROGRAM Several countries have launched investigations concerning possible violations related to the United Nations (UN) Oil-for-Food program in Iraq. Pursuant to a French criminal investigation, certain current or former Group employees were placed under formal criminal investigation for possible charges as accessories to the misappropriation of corporate assets and as accessories to the corruption of foreign public agents. The Chairman and Chief Executive Officer of the Company, formerly President of the Group’s Exploration & Production division, was also placed under formal investigation in October 2006. In 2007, the criminal investigation was closed and the case was transferred to the Prosecutor’s office. In 2009, the Prosecutor’s office recommended to the investigating judge that the case against the Group’s current and former employees and TOTAL’s Chairman and Chief Executive Officer not be pursued. In early 2010, despite the recommendation of the Prosecutor’s office, a new investigating judge, having taken over the case, decided to indict TOTAL S.A. on bribery charges as well as complicity and influence peddling. The indictment was brought eight years after the beginning of the investigation without any new evidence being introduced. In October 2010, the Prosecutor’s office recommended to the investigating judge that the case against TOTAL S.A., the Group’s current and former employees and TOTAL’s Chairman and Chief Executive Officer not be pursued. However, by ordinance notified in early August 2011, the investigating judge on the matter decided to send the case to trial. The Company believes that its activities related to the Oil-for-Food program have been in compliance with this program, as organized by the UN in 1996. The Volcker report released by the independent investigating committee set up by the UN had discarded any bribery grievance within the framework of the Oil-For-Food program with respect to TOTAL. ITALY As part of an investigation led by the Prosecutor of the Republic of the Potenza Court, Total Italia and certain Group’s employees are the subject of an investigation related to certain calls for tenders that Total Italia made for the preparation and development of an oil field. On February 16, 2009, as a preliminary measure before the proceedings go before the Court, the preliminary investigation judge of Potenza served notice to Total Italia of a decision that would suspend the concession for this field for one year. Total Italia has appealed the decision by the preliminary investigation judge before the Court of Appeal of Potenza. In a decision dated April 8, 2009, the Court reversed the suspension of the concession and appointed for one year,i.e.until February 16, 2010, a judicial administrator to supervise the operations related to the development of the concession, allowing the Tempa Rossa project to continue. The criminal investigation was closed in the first half of 2010. The preliminary hearing judge, who will decide whether the case shall be returned to the Criminal Court to be judged on the merits, held the first hearing on December 6, 2010. The proceedings before the Judge of the preliminary hearing are still pending. In 2010, Total Italia’s exploration and production operations were transferred to Total E&P Italia and refining and marketing operations were merged with those of Erg Petroli. LIBYA During the financial year 2011, the Group’s activities were affected by the security context in Libya, and the Group’s production was gradually shut down as from the end of February. The Group’s production started up again at the end of September 2011 on the offshore Al Jurf field located in zones 15, 16 & 32 (ex C137) at the level existing before the events, and has gradually restarted since October 2011 in onshore zones 129, 130 and 131. The restart of the Group’s production on the other onshore zones is expected to occur progressively in 2012. | | In June 2011, the United States Securities and Exchange Commission (SEC) issued to certain oil companies — including, among others, TOTAL — a formal request for information related to their operations in Libya. TOTAL is cooperating with this non public investigation. YEMEN During the financial year 2011, the Group’s activities were not significantly impacted by the security context in Yemen, but the Group nevertheless reorganized locally to minimize the risks to its personnel. In addition, on October 15, 2011, the gas pipeline supplying Yemen LNG was sabotaged, and then repaired with no delay, enabling LNG production to resume as from October 26, 2011. SYRIA In May 2011, the European Union adopted measures with criminal and financial penalties that prohibit the supply of certain equipment to Syria, as well as certain financial and asset transactions with respect to a list of named individuals and entities. These measures apply to European persons and to entities constituted under the laws of a EU Member State. In September 2011, the EU adopted further measures, including, notably, a prohibition on the purchase, import or transportation from Syria of crude oil and petroleum products. Since early September 2011, the Group ceased to purchase hydrocarbons from Syria. On December 1, 2011, the EU extended sanctions against, among others, three state-owned Syrian oil firms, including General Petroleum Corporation, the Group’s co-contracting partner in PSA 1988 (Deir Es Zor license) and the Tabiyeh contract. Since early December 2011, TOTAL has ceased its activities that contribute to oil and gas production in Syria. 33)OTHER INFORMATION 33)
| OTHER INFORMATION |
| | A) | RESEARCH AND DEVELOPMENT COSTS |
Research and development costs incurred by the Group in 20102011 amounted to €715€776 million (€(€715 million in 2010 and€650 million in 2009
F-94
and €612 million in 2008)2009), corresponding to 0.4% of the sales.
The staff dedicated in 20102011 to these research and development activities are estimated at 4,0873,946 people (4,016(4,087 in 20092010 and 4,2854,016 in 2008)2009). | 34) | | B) | CARBON DIOXIDE EMISSION RIGHTS |
The principles governing the accounting for emission rights are presented in Note 1 paragraph T to the Consolidated Financial Statements.
As of December 31, 2010, given the emission rights granted in the National Allocations Plans (NAPs), the position of the Group’s industrial facilities that are covered by the European Union Emissions Trading System (EU ETS) is getting longer. This long position is expected to be confirmed at the end of the 2008 — 2012 period.
| | 34) | CHANGES IN PROGRESS IN THE GROUP STRUCTURE |
TOTAL signed in March 2011 agreements for the acquisition in Uganda of a one-third interest in Blocks 1, 2 and 3A held by Tullow Oil plc for $1,467 million (amount as of January 1, 2010, to which will add costs of interim period). Following this acquisition, TOTAL would become an equal partner with Tullow and CNOOC in the blocks, each with a one-third interest and each being an operator of one of the blocks. Subject to the decision of the Authorities, TOTAL would be the operator of Block 1. TOTAL announced in February 2012 the signature of an agreement with Sinochem to sell its interests in the Cusiana field and in OAM and ODC pipelines. This transaction is subject to approval by the relevant authorities. | | | | • | TOTAL finalized in November 2010 an agreement in principle with Perenco, an independent exploration and production French company, to sell its 75.8% equity in its upstream Cameroonian affiliate Total E&P Cameroun. This agreement is subject to the Cameroonian Authorities’ approval. |
As of December 31, 2010, assets and liabilities of the affiliate Total E&P Cameroun have been classified respectively assections “Assets classified as held for sale” on the face of the Consolidated Balance Sheet for €183 million and as “Liabilities directly associated with the assets classified as held for sale” onincluded the face of the Consolidated Balance Sheet for €137 million. The concerned assets and liabilities mainly include tangible assets for €109 millionof Total E&P Cameroun, of Joslyn and provisionsof photocure and other non-current liabilities for €74 million. | | | | • | In addition to the agreement signed during September 2010 (see Note 3 to the Consolidated Financial Statements), TOTAL signed in December 2010 an agreement to acquire an additional 7.5% interest in Australia’s GLNG project from Santos for an amount of $281 million. This will increase Total’s overall stake in the project to 27.5%. |
At the same time, South Korea’s Kogas has signed an agreement to join the project with a 15% stake. Once both transactions, which are subject to the approval of Australia’s Foreign Investment Review Board, have been finalized, interests in the project will be: Santos (30%, operator), Petronas (27.5%), TOTAL (27.5%) and Kogas (15%).
| | | | • | Total E&P Canada Ltd., a TOTAL subsidiary, and Suncor Energy Inc. (Suncor) have signed in December 2010 several agreements to form a strategic oil sands alliance encompassing the Suncor-operated Fort Hills mining project, the TOTAL-operated Joslyn mining project and the Suncor-operated Voyageur upgrader project. All three assets are located in the Athabasca region of the province of Alberta, in Canada. Under the alliance, the companies will pool their combined interests in these projects, with the respective operator holding 51% and the other partner 49%. |
The agreements comprise four significant and related transactions:
| | | | • | TOTAL is acquiring 19.2% of Suncor’s interest in the Fort Hills project. Taking into account the acquisition of UTS, finalized in September 2010, TOTAL will have an overall 39.2% interest in Fort Hills. Suncor, as operator, will hold 40.8%; | | | • | Suncor is acquiring 36.75% of TOTAL’s interest in the Joslyn project. TOTAL, as operator, will retain a 38.25% interest in the project; | | | • | TOTAL is also acquiring a 49% stake in the Suncor-operated Voyageur upgrader project; | | | • | As a result of the terms of these transactions and the related net balancing of the portfolio, in particular to contribute to the past costs of the Voyageur project, TOTAL will pay Suncor CAD 1,751 million, with a value date of January 1st, 2011. |
The implementation of the agreements is subject to securing the necessary regulatory approvals from the Government of Canada and certain other approvals.
As a result of the agreements, TOTAL will no longer proceed with the planned construction of an upgrader in Edmonton.coatings resins businesses.
F-95
As of December 31, 2010, the share of assets and liabilities of the Joslyn mining project covered by the agreements has been classified respectively as “Assets classified as held for sale” on the face of the Consolidated Balance Sheet for €622 million and as “Liabilities directly associated with the assets classified as held for sale” on the face of the Consolidated Balance Sheet for €8 million. The concerned assets include mineral interests for €390 million and tangible assets for €232 million. | | | | • | TOTAL has announced in December 2010 a plan to sell its photocure and coatings resins businesses to Arkema for a €550 million enterprise value. The divestment is subject to the applicable legally required consultation and notification processes for employee representatives at TOTAL and Arkema and to the approval of the anti-trust authorities in the countries concerned. It could take place in the first half of 2011. |
As of December 31, 2010, assets and liabilities of the photocure and coatings resins businesses have been classified respectively as “Assets classified as held for sale” on the face of the Consolidated Balance Sheet for €465 million and as “Liabilities directly associated with the assets classified as held for sale” on the face of the Consolidated Balance Sheet for €52 million. The concerned assets mainly include a goodwill for €63 million, tangible assets for €196 million and inventories for €138 million.
As of December 31, 2010, 6872011, 870 entities are consolidated of which 596783 are fully consolidated, and 9187 are accounted for under the equity method (identified with the letter E). This simplified organizational chart shows the main consolidated entities. For each of them, the Group interest is mentioned between brackets. This chart of legal detentions is not exhaustive and does not reflect neither the operational structure nor the relative economic size of the Group entities and the business segments.
F-96
TOTAL
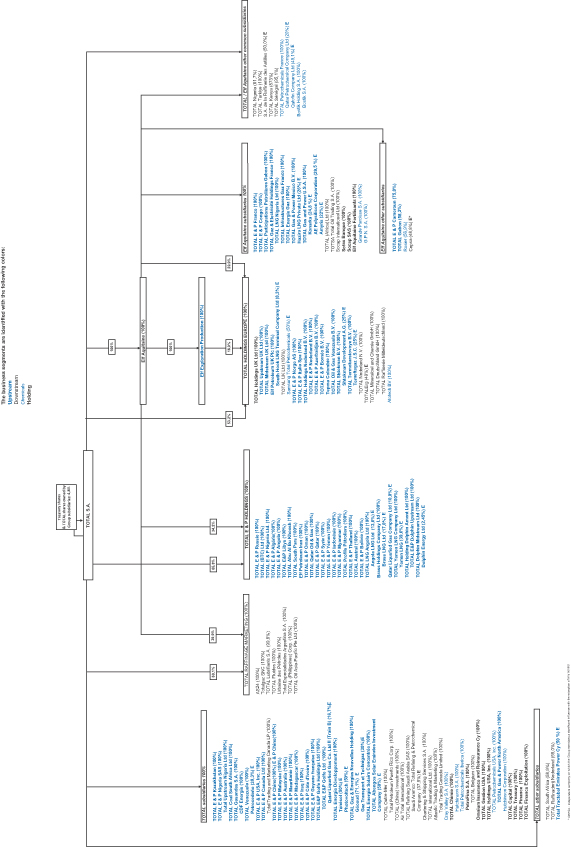
TOTAL SUPPLEMENTAL OIL AND GAS INFORMATION (Unaudited) As from 2009, the amendments to the Securities and Exchange Commission (SEC)Rule 4-10 ofRegulation S-X set forth in the “Modernization of Oil and Gas Reporting” release (SEC Release n°33-8995) and the Financial Accounting Standard Board (FASB) Accounting Standards Update regarding Extractive Activities — OilActivities-Oil and Gas (ASC 932) change a number of reserves estimation and disclosure requirements. As a reminder, in terms of reserves estimation, the main changes are: the use of an average price instead of a single year-end price; the use of new reliable technologies to assess proved reserves; and the inclusion, under certain conditions, ofnon-traditional sources as oil and gas producing activities. The revised rules form the basis of the 2011, 2010 and 2009 year-end estimation of proved reserves. The main impact of the application of the revised rules was related to, for 2009, the use of new reliable technologies and, for 2010, the booking of proved reserves on an oil sands mining project. Preparation of reserves estimates The estimation of reserves is an ongoing process which is done within affiliates by experienced geoscientists, engineers and economists under the supervision of each affiliate’s General Management. Persons involved in reserves evaluation are trained to follow SEC-compliant internal guidelines and policies regarding criteria that must be met before reserves can be considered as proved. The technical validation process relies on a ReservoirTechnical Reserves Committee that is responsible for approving proved reserves changes above a certain threshold and technical evaluations of reserves associated with any investment decision that requires approval from the Exploration & Production Executive Committee. The Chairman of the ReservoirTechnical Reserves Committee is appointed by the PresidentSenior Management of Exploration & Production and its members represent expertise in reservoir engineering, production geology, production geophysics, drilling, and pre-development projects. development studies.An internal control process related to reserves estimation is well established within TOTAL and involves the following elements: A central Reserve Entity whose responsibility is to consolidate, document and archive the Group’s reserves; to ensure coherence of evaluations worldwide; to maintain the Corporate Reserves Guidelines Standards in line with SEC guidelines and policies; to deliver training on reserves | | • | A central Reserve Entity whose responsibility is: to consolidate, document and archive the Group’s reserves; to ensure the coherence of evaluations worldwide; to maintain the Corporate Reserves Guidelines Standards in line with SEC guidelines and policies; to deliver training on reserves evaluation and classification; and to conduct periodically in-depth technical review of reserves for each affiliate. | | • | An annual review of affiliates reserves is conducted by an internal group of specialists selected for their expertise in geosciences and engineering or their knowledge of the affiliate. All members of this group chaired by the Geoscience Reserve Manager and composed of at least three Reservoir Committee members are knowledgeable in the SEC guidelines for proved reserves evaluation. Their responsibility is to provide an independent review of reserves changes proposed by affiliates and ensure that reserves are estimated using appropriate standards and procedures. | | • | At the end of the annual review carried out by the Geoscience Division, an SEC Reserves Committee chaired by the Exploration & Production Finance Senior Vice President and comprised of the Geoscience, Strategy and Legal Senior Vice Presidents, or their representatives, as well as the Chairman of the Reservoir Committee and the Geoscience Reserves Manager, approves the SEC reserve booking proposals as regards to criteria that are not dependent upon reservoir and geoscience techniques. The results of the annual review and the proposals for including revisions or additions of SEC Proved Reserves are presented to the Exploration & Production Executive Committee for approval before final validation by the Group Executive Management. |
An annual review of affiliates reserves conducted by an internal group of specialists selected for their expertise in geosciences and engineering or their knowledge of the affiliate. All members of this group chaired by the Reserves Vice-president and composed of at least three Technical Reserves Committee members are knowledgeable in the SEC guidelines for proved reserves evaluation. Their responsibility is to provide an independent review of reserves changes proposed by affiliates and ensure that reserves are estimated using appropriate standards and procedures. At the end of the annual review carried out by the Development Division, an SEC Reserves Committee chaired by the Exploration & Production Finance Senior Vice President and comprised of the Development, Exploration, Strategy and Legal Senior Vice Presidents, or their representatives, as well as the Chairman of the Technical Reserves Committee and the Reserves Vice-President, approves the SEC reserve booking proposals regarding criteria that are not dependent upon reservoir and geosciences techniques. The results of the annual review and the proposals for including revisions or additions of SEC Proved Reserves are presented to the Exploration & Production Executive Committee for approval before final validation by the Group Executive Management. The reserves evaluation and control process is audited periodically by the Group’s internal auditors who verify the effectiveness of the reserves evaluation process and control procedures. The Geosciences Reserves Manager (GRM)Vice-President (RVP) is the technical person responsible for preparing the reserves estimates for the Group. The GRMAppointed by the President of Exploration & Production, the RVP supervises the Reserve Entity, chairs the annual review of reserves, and is a member of the ReservoirTechnical Reserves Committee and the SEC Reserves Committee. The GRMRVP has over twenty-fivethirty years of experience in the oil & gas industry. He previously held several management positions in the Group in reservoir engineering and geosciences, and has more than tenfifteen years of experience in the field of reserves evaluation and control process. He holds an engineering degree fromÉcole Institut National des Sciences Appliquées, Lyon, France, and a petroleum engineering degree from Ecole Nationale Supérieure de Géologiedu Pétrole et des Moteurs (IFP School), Nancy, France, and a Ph.D in rock physics from Stanford University, California, USA.France. He is a past member and past chairman of the Society of
S-1
Petroleum Engineering Oil and Gas Reserves Committee and a member of the UNECE (United Nations Economic Commission for Europe) Expert Group on Resource Classification. Proved developed reserves At the end of 2011, proved developed reserves of oil and gas were 6,046 Mboe and represented 53% of the proved reserves. At the end of 2010, proved developed reserves of oil and gas were 5,708 Mboe and represented 53% of the proved reserves. At year-endthe end of 2009, proved developed reserves of oil and gas were 5,835 Mboe and represented 56% of proved reserves. At the end of 2008, proved developed reserves were 5,243 Mboe and represented 50% of proved reserves. Over the past three years, the level of proved developed reserves has remained above 5.25.7 Bboe and over 50%53% of proved reserves, illustrating TOTAL’s ability to consistently transfer proved undeveloped reserves into developed status. Proved undeveloped reserves As of December 31, 2010,2011, TOTAL’s combined proved undeveloped reserves of oil and gas were 4,9875,377 Mboe as compared to 4,6484,987 Mboe at the end of 2009.2010. The net increase of 339390 Mboe of proved undeveloped reserves is due to the addition of 291+639 Mboe of undeveloped reserves related to extensions and discoveries, a net increase of +401 Mboe due to acquisitions/divestitures, the revision of +183-168 Mboe of previous estimates a net increase of +416 Mboe due to acquisitions/divestitures(partly resulting from negative price effects), and the conversiontransfer of −551482 Mboe offrom proved undeveloped reserves intoto proved developed reserves. In 2010,2011, the capital expendedcosts incurred to develop proved undeveloped reserves (PUDs) was €6.7€10.2 billion, which represents 81%84% of 20102011 development costs incurred, and was related to projects located for the most part in Angola, Australia, Canada, Kazakhstan, Angola,Nigeria, Norway, Nigeria, Indonesia, United Kingdom Thailand and the United States. Russia.Approximately 60%57% of the Group’s proved undeveloped reserves are associated with producing fieldsprojects and are located for the most part in Angola, Canada, Nigeria, the United Arab Emirates, VenezuelaNorway, and Norway.Venezuela. These reserves are expected to be developed over time as part of initial field development plans or additional development phases. The timing to bring these proved reserves into production will depend upon several factors including reservoir performance, surface facilities or plant capacity constraints and contractual limitations on production level. The remaining proved undeveloped reserves correspond to undeveloped fields or assets for which a development has been sanctioned or is in progress. The Group’s portfolio of projects includes a few large scale and complex developments for which it anticipates that it may take more than five years from the time of recording proved reserves to the start of production. These specific projects represent approximately 30%26% of the Group’s proved undeveloped reserves and include the development of a giant field in Kazakhstan, deep offshore developments in Angola, Nigeria and the United Kingdom and development of oil sands in Canada. These projects are highly complex to develop due to a combination of factors that include, among others, the nature of the reservoir rock and fluid properties, challenging operating environments and the size of the projects. In addition, some of these projects are generally designed and optimized for a given production capacity that controls the pace at which the field is developed and the wells are drilled. At productionstart-up, only a portion of the proved reserves are developed in order to deliver sufficient production potential to meet capacity constraints and contractual obligations. The remaining PUDsPUD’s associated with the complete development plan will therefore remain undeveloped for more than five years following project approval and booking. Under these specific circumstances, the Group believes that it is justified to report as proved reserves the level of reserves used in connection with the approved project, despite the fact that some of these PUDs may remain undeveloped for more than five years. In addition, TOTAL has demonstrated in recent years the Group’s ability to successfully develop and bring into production similar large scale and complex projects, including the development of deep-offshore fields in Angola, Nigeria, the Republic of Congo, HP/HT fields in the United Kingdom, heavy oil projects in Venezuela and LNG projects in Qatar, Yemen, Nigeria and Indonesia. Information shown in the following tables is presented in accordance with the FASB’s ASC 932 and the requirements of the SECRegulation S-K (Items 1200 to 1208). The tables provided below are presented by the following geographic areas: Europe, Africa, the Americas, Middle East and Asia (including CIS). Certain previously reported amounts for 2008 have been reclassified to conform to the current presentation adopted since 2009.
S-2
ESTIMATED PROVED RESERVES OF OIL, BITUMEN AND GAS RESERVES The following tables present, for oil, bitumen and gas reserves, an estimate of the Group’s oil, bitumen and gas quantities by geographic areas as of December 31, 2011, 2010 2009 and 2008.2009. Quantities shown concern proved developed and undeveloped reserves together with changes in quantities for 2011, 2010 2009 and 2008. 2009.The definitions used for proved, proved developed and proved undeveloped oil and gas reserves are in accordance with the revisedRule 4-10 of SECRegulation S-X. All references in the following tables to reserves or production are to the Group’s entire share of such reserves or production. TOTAL’s worldwide proved reserves include the proved reserves of its consolidated subsidiaries as well as its proportionate share of the proved reserves of equity affiliates and of two companies accounted for by the cost method.
S-3affiliates.
Changes in oil, bitumen and gas reserves | | | | | | | | | | | | | | | | | | | | | | | | | | | Proved developed and undeveloped reserves | | Consolidated subsidiaries | | | | | | | | | | | | | | Middle
| | | | | | | | | (in million barrels of oil equivalent) | | Europe | | | Africa | | | Americas | | | East | | | Asia | | | Total | | Balance as of December 31, 2007 | | | 1,900 | | | | 3,516 | | | | 737 | | | | 474 | | | | 1,224 | | | | 7,851 | | | | | | | | | | | | | | | | | | | | | | | | | | | | | Revisions of previous estimates | | | 41 | | | | 374 | | | | 50 | | | | 106 | | | | 144 | | | | 715 | | | Extensions, discoveries and other | | | 82 | | | | 110 | | | | — | | | | — | | | | 19 | | | | 211 | | | Acquisitions of reserves in place | | | 17 | | | | — | | | | — | | | | — | | | | — | | | | 17 | | | Sales of reserves in place | | | — | | | | (74 | ) | | | — | | | | — | | | | (46 | ) | | | (120 | ) | | Production for the year | | | (225 | ) | | | (280 | ) | | | (55 | ) | | | (50 | ) | | | (99 | ) | | | (709 | ) | | | | | | | | | | | | | | | | | | | | | | | | | | | Balance as of December 31, 2008 | | | 1,815 | | | | 3,646 | | | | 732 | | | | 530 | | | | 1,242 | | | | 7,965 | | | | | | | | | | | | | | | | | | | | | | | | | | | | | Revisions of previous estimates | | | 46 | | | | 76 | | | | 14 | | | | (7 | ) | | | 25 | | | | 154 | | | Extensions, discoveries and other | | | 18 | | | | 53 | | | | 284 | | | | 76 | | | | — | | | | 431 | | | Acquisitions of reserves in place | | | 12 | | | | — | | | | 130 | | | | — | | | | — | | | | 142 | | | Sales of reserves in place | | | (2 | ) | | | (43 | ) | | | (14 | ) | | | — | | | | — | | | | (59 | ) | | Production for the year | | | (224 | ) | | | (266 | ) | | | (56 | ) | | | (55 | ) | | | (101 | ) | | | (702 | ) | | | | | | | | | | | | | | | | | | | | | | | | | | | Balance as of December 31, 2009 | | | 1,665 | | | | 3,466 | | | | 1,090 | | | | 544 | | | | 1,166 | | | | 7,931 | | | | | | | | | | | | | | | | | | | | | | | | | | | | | Revisions of previous estimates | | | 92 | | | | 200 | | | | 82 | | | | (10 | ) | | | 1 | | | | 365 | | | Extensions, discoveries and other | | | 182 | | | | — | | | | 18 | | | | 96 | | | | 30 | | | | 326 | | | Acquisitions of reserves in place | | | 23 | | | | — | | | | 425 | | | | — | | | | 9 | | | | 457 | | | Sales of reserves in place | | | (45 | ) | | | (26 | ) | | | (5 | ) | | | — | | | | (8 | ) | | | (84 | ) | | Production for the year | | | (211 | ) | | | (269 | ) | | | (70 | ) | | | (56 | ) | | | (99 | ) | | | (705 | ) | | | | | | | | | | | | | | | | | | | | | | | | | | | Balance as of December 31, 2010 | | | 1,706 | | | | 3,371 | | | | 1,540 | | | | 574 | | | | 1,099 | | | | 8,290 | | | | | | | | | | | | | | | | | | | | | | | | | | | | Minority interest in proved developed and undeveloped reserves as of | | | | | | | | | | | | | | | | | | December 31, 2008 | | | 27 | | | | 100 | | | | — | | | | — | | | | — | | | | 127 | | | December 31, 2009 | | | 26 | | | | 98 | | | | — | | | | — | | | | — | | | | 124 | | December 31, 2010 | | | 26 | | | | 100 | | | | — | | | | — | | | | — | | | | 126 | |
| | | | | | | | | | | | | | | | | | | | | | | | | | | Proved developed and undeveloped reserves | | Equity & non-consolidated affiliates | | | | | | | | | | | | | | Middle
| | | | | | | | | (in million barrels of oil equivalent) | | Europe | | | Africa | | | Americas | | | East | | | Asia | | | Total | | Balance as of December 31, 2007 | | | — | | | | 69 | | | | 554 | | | | 1,975 | | | | — | | | | 2,598 | | | | | | | | | | | | | | | | | | | | | | | | | | | | | Revisions of previous estimates | | | — | | | | 22 | | | | — | | | | (2 | ) | | | — | | | | 20 | | | Extensions, discoveries and other | | | — | | | | 14 | | | | — | | | | 3 | | | | — | | | | 17 | | | Acquisitions of reserves in place | | | — | | | | — | | | | 6 | | | | — | | | | — | | | | 6 | | | Sales of reserves in place | | | — | | | | — | | | | — | | | | — | | | | — | | | | — | | | Production for the year | | | — | | | | (7 | ) | | | (33 | ) | | | (108 | ) | | | — | | | | (148 | ) | | | | | | | | | | | | | | | | | | | | | | | | | | | Balance as of December 31, 2008 | | | — | | | | 98 | | | | 527 | | | | 1,868 | | | | — | | | | 2,493 | | | | | | | | | | | | | | | | | | | | | | | | | | | | | Revisions of previous estimates | | | — | | | | 10 | | | | (7 | ) | | | 51 | | | | — | | | | 54 | | | Extensions, discoveries and other | | | — | | | | — | | | | — | | | | 136 | | | | — | | | | 136 | | | Acquisitions of reserves in place | | | — | | | | — | | | | — | | | | — | | | | — | | | | — | | | Sales of reserves in place | | | — | | | | — | | | | — | | | | — | | | | — | | | | — | | | Production for the year | | | — | | | | (8 | ) | | | (18 | ) | | | (105 | ) | | | — | | | | (131 | ) | | | | | | | | | | | | | | | | | | | | | | | | | | | Balance as of December 31, 2009 | | | — | | | | 100 | | | | 502 | | | | 1,950 | | | | — | | | | 2,552 | | | | | | | | | | | | | | | | | | | | | | | | | | | | | Revisions of previous estimates | | | — | | | | 14 | | | | 4 | | | | (2 | ) | | | — | | | | 16 | | | Extensions, discoveries and other | | | — | | | | — | | | | — | | | | — | | | | — | | | | — | | | Acquisitions of reserves in place | | | — | | | | — | | | | — | | | | — | | | | — | | | | — | | | Sales of reserves in place | | | — | | | | — | | | | — | | | | — | | | | — | | | | — | | | Production for the year | | | — | | | | (7 | ) | | | (20 | ) | | | (136 | ) | | | — | | | | (163 | ) | | | | | | | | | | | | | | | | | | | | | | | | | | | Balance as of December 31, 2010 | | | — | | | | 107 | | | | 486 | | | | 1,812 | | | | — | | | | 2,405 | | | | | | | | | | | | | | | | | | | | | | | | | | | |
S-4
| | | | | | | | | | | | | | | | | | | | | | | | | | Proved developed and undeveloped reserves | | Consolidated subsidiaries | | (in million barrels of oil equivalent) | | Europe | | | Africa | | | Americas | | | Middle
East | | | Asia | | | Total | | Balance as of December 31, 2008 | | | 1,815 | | | | 3,646 | | | | 732 | | | | 530 | | | | 1,242 | | | | 7,965 | | Revisions of previous estimates | | | 46 | | | | 76 | | | | 14 | | | | (7 | ) | | | 25 | | | | 154 | | Extensions, discoveries and other | | | 18 | | | | 53 | | | | 284 | | | | 76 | | | | — | | | | 431 | | Acquisitions of reserves in place | | | 12 | | | | — | | | | 130 | | | | — | | | | — | | | | 142 | | Sales of reserves in place | | | (2 | ) | | | (43 | ) | | | (14 | ) | | | — | | | | — | | | | (59 | ) | Production for the year | | | (224 | ) | | | (266 | ) | | | (56 | ) | | | (55 | ) | | | (101 | ) | | | (702 | ) | Balance as of December 31, 2009 | | | 1,665 | | | | 3,466 | | | | 1,090 | | | | 544 | | | | 1,166 | | | | 7,931 | | Revisions of previous estimates | | | 92 | | | | 200 | | | | 82 | | | | (10 | ) | | | 1 | | | | 365 | | Extensions, discoveries and other | | | 182 | | | | — | | | | 18 | | | | 96 | | | | 30 | | | | 326 | | Acquisitions of reserves in place | | | 23 | | | | — | | | | 425 | | | | — | | | | 9 | | | | 457 | | Sales of reserves in place | | | (45 | ) | | | (26 | ) | | | (5 | ) | | | — | | | | (8 | ) | | | (84 | ) | Production for the year | | | (211 | ) | | | (269 | ) | | | (70 | ) | | | (56 | ) | | | (99 | ) | | | (705 | ) | Balance as of December 31, 2010 | | | 1,706 | | | | 3,371 | | | | 1,540 | | | | 574 | | | | 1,099 | | | | 8,290 | | Revisions of previous estimates | | | 117 | | | | (61 | ) | | | (36 | ) | | | (68 | ) | | | (19 | ) | | | (67 | ) | Extensions, discoveries and other | | | 57 | | | | 6 | | | | — | | | | — | | | | 588 | | | | 651 | | Acquisitions of reserves in place | | | 44 | | | | — | | | | 309 | | | | — | | | | 2 | | | | 355 | | Sales of reserves in place | | | — | | | | (65 | ) | | | — | | | | — | | | | — | | | | (65 | ) | Production for the year | | | (187 | ) | | | (237 | ) | | | (75 | ) | | | (56 | ) | | | (93 | ) | | | (648 | ) | Balance as of December 31, 2011 | | | 1,737 | | | | 3,014 | | | | 1,738 | | | | 450 | | | | 1,577 | | | | 8,516 | | | | | | | Minority interest in proved developed and undeveloped reserves as of | | | | | | | | | | | | | | | | | | December 31, 2009 | | | 26 | | | | 98 | | | | — | | | | — | | | | — | | | | 124 | | December 31, 2010 | | | 26 | | | | 100 | | | | — | | | | — | | | | — | | | | 126 | | December 31, 2011 | | | — | | | | 98 | | | | — | | | | — | | | | — | | | | 98 | | | | | Proved developed and undeveloped reserves | | Equity affiliates | | (in million barrels of oil equivalent) | | Europe | | | Africa | | | Americas | | | Middle
East | | | Asia | | | Total | | Balance as of December 31, 2008 | | | — | | | | 98 | | | | 527 | | | | 1,868 | | | | — | | | | 2,493 | | Revisions of previous estimates | | | — | | | | 10 | | | | (7 | ) | | | 51 | | | | — | | | | 54 | | Extensions, discoveries and other | | | — | | | | — | | | | — | | | | 136 | | | | — | | | | 136 | | Acquisitions of reserves in place | | | — | | | | — | | | | — | | | | — | | | | — | | | | — | | Sales of reserves in place | | | — | | | | — | | | | — | | | | — | | | | — | | | | — | | Production for the year | | | — | | | | (8 | ) | | | (18 | ) | | | (105 | ) | | | — | | | | (131 | ) | Balance as of December 31, 2009 | | | — | | | | 100 | | | | 502 | | | | 1,950 | | | | — | | | | 2,552 | | Revisions of previous estimates | | | — | | | | 14 | | | | 4 | | | | (2 | ) | | | — | | | | 16 | | Extensions, discoveries and other | | | — | | | | — | | | | — | | | | — | | | | — | | | | — | | Acquisitions of reserves in place | | | — | | | | — | | | | — | | | | — | | | | — | | | | — | | Sales of reserves in place | | | — | | | | — | | | | — | | | | — | | | | — | | | | — | | Production for the year | | | — | | | | (7 | ) | | | (20 | ) | | | (136 | ) | | | — | | | | (163 | ) | Balance as of December 31, 2010 | | | — | | | | 107 | | | | 486 | | | | 1,812 | | | | — | | | | 2,405 | | Revisions of previous estimates | | | — | | | | (1 | ) | | | (8 | ) | | | (20 | ) | | | — | | | | (29 | ) | Extensions, discoveries and other | | | — | | | | — | | | | — | | | | — | | | | — | | | | — | | Acquisitions of reserves in place | | | — | | | | — | | | | — | | | | — | | | | 779 | | | | 779 | | Sales of reserves in place | | | — | | | | (24 | ) | | | (4 | ) | | | (11 | ) | | | — | | | | (39 | ) | Production for the year | | | — | | | | (4 | ) | | | (18 | ) | | | (152 | ) | | | (35 | ) | | | (209 | ) | Balance as of December 31, 2011 | | | — | | | | 78 | | | | 456 | | | | 1,629 | | | | 744 | | | | 2,907 | |
| | | | | | | | | | | | | | | | | | | | | | | | | | | | | | Consolidated subsidiaries and equity affiliates | | (in million barrels of oil equivalent) | | Europe | | | Africa | | | Americas | | | Middle
East | | | Asia | | | Total | | As of December 31, 2009 | | | | | | | | | | | | | | | | | | | | | | | | | Proved developed and undeveloped reserves | | | 1,665 | | | | 3,566 | | | | 1,592 | | | | 2,494 | | | | 1,166 | | | | 10,483 | | Consolidated subsidiaries | | | 1,665 | | | | 3,466 | | | | 1,090 | | | | 544 | | | | 1,166 | | | | 7,931 | | Equity affiliates | | | — | | | | 100 | | | | 502 | | | | 1,950 | | | | — | | | | 2,552 | | Proved developed reserves | | | 1,096 | | | | 1,775 | | | | 631 | | | | 1,918 | | | | 415 | | | | 5,835 | | Consolidated subsidiaries | | | 1,096 | | | | 1,745 | | | | 503 | | | | 482 | | | | 415 | | | | 4,241 | | Equity affiliates | | | — | | | | 30 | | | | 128 | | | | 1,436 | | | | — | | | | 1,594 | | Proved undeveloped reserves | | | 569 | | | | 1,791 | | | | 961 | | | | 576 | | | | 751 | | | | 4,648 | | Consolidated subsidiaries | | | 569 | | | | 1,721 | | | | 587 | | | | 62 | | | | 751 | | | | 3,690 | | Equity affiliates | | | — | | | | 70 | | | | 374 | | | | 514 | | | | — | | | | 958 | | As of December 31, 2010 | | | | | | | | | | | | | | | | | | | | | | | | | Proved developed and undeveloped reserves | | | 1,706 | | | | 3,478 | | | | 2,026 | | | | 2,386 | | | | 1,099 | | | | 10,695 | | Consolidated subsidiaries | | | 1,706 | | | | 3,371 | | | | 1,540 | | | | 574 | | | | 1,099 | | | | 8,290 | | Equity affiliates | | | — | | | | 107 | | | | 486 | | | | 1,812 | | | | — | | | | 2,405 | | Proved developed reserves | | | 962 | | | | 1,692 | | | | 638 | | | | 2,055 | | | | 361 | | | | 5,708 | | Consolidated subsidiaries | | | 962 | | | | 1,666 | | | | 505 | | | | 427 | | | | 361 | | | | 3,921 | | Equity affiliates | | | — | | | | 26 | | | | 133 | | | | 1,628 | | | | — | | | | 1,787 | | Proved undeveloped reserves | | | 744 | | | | 1,786 | | | | 1,388 | | | | 331 | | | | 738 | | | | 4,987 | | Consolidated subsidiaries | | | 744 | | | | 1,705 | | | | 1,035 | | | | 147 | | | | 738 | | | | 4,369 | | Equity affiliates | | | — | | | | 81 | | | | 353 | | | | 184 | | | | — | | | | 618 | | As of December 31, 2011 | | | | | | | | | | | | | | | | | | | | | | | | | Proved developed and undeveloped reserves | | | 1,737 | | | | 3,092 | | | | 2,194 | | | | 2,079 | | | | 2,321 | | | | 11,423 | | Consolidated subsidiaries | | | 1,737 | | | | 3,014 | | | | 1,738 | | | | 450 | | | | 1,577 | | | | 8,516 | | Equity affiliates | | | — | | | | 78 | | | | 456 | | | | 1,629 | | | | 744 | | | | 2,907 | | Proved developed reserves | | | 894 | | | | 1,660 | | | | 647 | | | | 1,869 | | | | 976 | | | | 6,046 | | Consolidated subsidiaries | | | 894 | | | | 1,639 | | | | 524 | | | | 371 | | | | 321 | | | | 3,749 | | Equity affiliates | | | — | | | | 21 | | | | 123 | | | | 1,498 | | | | 655 | | | | 2,297 | | Proved undeveloped reserves | | | 843 | | | | 1,432 | | | | 1,547 | | | | 210 | | | | 1,345 | | | | 5,377 | | Consolidated subsidiaries | | | 843 | | | | 1,375 | | | | 1,214 | | | | 79 | | | | 1,256 | | | | 4,767 | | Equity affiliates | | | — | | | | 57 | | | | 333 | | | | 131 | | | | 89 | | | | 610 | |
| | | | | | | | | | | | | | | | | | | | | | | | | | | | | Consolidated subsidiaries and equity & non-consolidated affiliates | | | | | | | | | | | | | | Middle
| | | | | | | | | (in million barrels of oil equivalent) | | Europe | | | Africa | | | Americas | | | East | | | Asia | | | Total | | As of December 31, 2008 | | | | | | | | | | | | | | | | | | | | | | | | | Proved developed and undeveloped reserves | | | 1,815 | | | | 3,744 | | | | 1,259 | | | | 2,398 | | | | 1,242 | | | | 10,458 | | | Consolidated subsidiaries | | | 1,815 | | | | 3,646 | | | | 732 | | | | 530 | | | | 1,242 | | | | 7,965 | | | Equity and non-consolidated affiliates | | | — | | | | 98 | | | | 527 | | | | 1,868 | | | | — | | | | 2,493 | | | | | | | | | | | | | | | | | | | | | | | | | | | | Proved developed reserves | | | 1,252 | | | | 1,801 | | | | 515 | | | | 1,194 | | | | 481 | | | | 5,243 | | | Consolidated subsidiaries | | | 1,252 | | | | 1,754 | | | | 381 | | | | 504 | | | | 481 | | | | 4,372 | | | Equity and non-consolidated affiliates | | | — | | | | 47 | | | | 134 | | | | 690 | | | | — | | | | 871 | | | | | | | | | | | | | | | | | | | | | | | | | | | | Proved undeveloped reserves | | | 563 | | | | 1,943 | | | | 744 | | | | 1,204 | | | | 761 | | | | 5,215 | | | Consolidated subsidiaries | | | 563 | | | | 1,892 | | | | 351 | | | | 26 | | | | 761 | | | | 3,593 | | | Equity and non-consolidated affiliates | | | — | | | | 51 | | | | 393 | | | | 1,178 | | | | — | | | | 1,622 | | | | | | | | | | | | | | | | | | | | | | | | | | | | As of December 31, 2009 | | | | | | | | | | | | | | | | | | | | | | | | | Proved developed and undeveloped reserves | | | 1,665 | | | | 3,566 | | | | 1,592 | | | | 2,494 | | | | 1,166 | | | | 10,483 | | | Consolidated subsidiaries | | | 1,665 | | | | 3,466 | | | | 1,090 | | | | 544 | | | | 1,166 | | | | 7,931 | | | Equity and non-consolidated affiliates | | | — | | | | 100 | | | | 502 | | | | 1,950 | | | | — | | | | 2,552 | | | | | | | | | | | | | | | | | | | | | | | | | | | | Proved developed reserves | | | 1,096 | | | | 1,775 | | | | 631 | | | | 1,918 | | | | 415 | | | | 5,835 | | | Consolidated subsidiaries | | | 1,096 | | | | 1,745 | | | | 503 | | | | 482 | | | | 415 | | | | 4,241 | | | Equity and non-consolidated affiliates | | | — | | | | 30 | | | | 128 | | | | 1,436 | | | | — | | | | 1,594 | | | | | | | | | | | | | | | | | | | | | | | | | | | | Proved undeveloped reserves | | | 569 | | | | 1,791 | | | | 961 | | | | 576 | | | | 751 | | | | 4,648 | | | Consolidated subsidiaries | | | 569 | | | | 1,721 | | | | 587 | | | | 62 | | | | 751 | | | | 3,690 | | | Equity and non-consolidated affiliates | | | — | | | | 70 | | | | 374 | | | | 514 | | | | — | | | | 958 | | | | | | | | | | | | | | | | | | | | | | | | | | | | As of December 31, 2010 | | | | | | | | | | | | | | | | | | | | | | | | | Proved developed and undeveloped reserves | | | 1,706 | | | | 3,478 | | | | 2,026 | | | | 2,386 | | | | 1,099 | | | | 10,695 | | | Consolidated subsidiaries | | | 1,706 | | | | 3,371 | | | | 1,540 | | | | 574 | | | | 1,099 | | | | 8,290 | | | Equity and non-consolidated affiliates | | | — | | | | 107 | | | | 486 | | | | 1,812 | | | | — | | | | 2,405 | | | | | | | | | | | | | | | | | | | | | | | | | | | | Proved developed reserves | | | 962 | | | | 1,692 | | | | 638 | | | | 2,055 | | | | 361 | | | | 5,708 | | | Consolidated subsidiaries | | | 962 | | | | 1,666 | | | | 505 | | | | 427 | | | | 361 | | | | 3,921 | | | Equity and non-consolidated affiliates | | | — | | | | 26 | | | | 133 | | | | 1,628 | | | | — | | | | 1,787 | | | | | | | | | | | | | | | | | | | | | | | | | | | | Proved undeveloped reserves | | | 744 | | | | 1,786 | | | | 1,388 | | | | 331 | | | | 738 | | | | 4,987 | | | Consolidated subsidiaries | | | 744 | | | | 1,705 | | | | 1,035 | | | | 147 | | | | 738 | | | | 4,369 | | | Equity and non-consolidated affiliates | | | — | | | | 81 | | | | 353 | | | | 184 | | | | — | | | | 618 | | | | | | | | | | | | | | | | | | | | | | | | | | | |
S-5
Changes in oil reserves The oil reserves for the years prior to 2009 include crude oil, natural gas liquids (condensates, LPG) and bitumen reserves. Bitumen reserves as from 2009 are shown separately. | | | | | | | | | | | | | | | | | | | | | | | | | | | Proved developed and undeveloped reserves | | Consolidated subsidiaries | | | | | | | | | | | | | | Middle
| | | | | | | | | (in million barrels) | | Europe | | | Africa | | | Americas | | | East | | | Asia | | | Total | | Balance as of December 31, 2007 | | | 880 | | | | 2,498 | | | | 285 | | | | 203 | | | | 530 | | | | 4,396 | | | | | | | | | | | | | | | | | | | | | | | | | | | | | Revisions of previous estimates | | | 15 | | | | 297 | | | | (17 | ) | | | 54 | | | | 64 | | | | 413 | | | Extensions, discoveries and other | | | 12 | | | | 107 | | | | — | | | | — | | | | 3 | | | | 122 | | | Acquisitions of reserves in place | | | 2 | | | | — | | | | — | | | | — | | | | — | | | | 2 | | | Sales of reserves in place | | | — | | | | (74 | ) | | | — | | | | — | | | | (43 | ) | | | (117 | ) | | Production for the year | | | (111 | ) | | | (231 | ) | | | (16 | ) | | | (32 | ) | | | (16 | ) | | | (406 | ) | | | | | | | | | | | | | | | | | | | | | | | | | | | Balance as of December 31, 2008 | | | 798 | | | | 2,597 | | | | 252 | | | | 225 | | | | 538 | | | | 4,410 | | | | | | | | | | | | | | | | | | | | | | | | | | | | | Revisions of previous estimates | | | 34 | | | | 92 | | | | (170 | ) | | | (4 | ) | | | 51 | | | | 3 | | | Extensions, discoveries and other | | | 8 | | | | 38 | | | | 22 | | | | 1 | | | | — | | | | 69 | | | Acquisitions of reserves in place | | | 1 | | | | — | | | | — | | | | — | | | | — | | | | 1 | | | Sales of reserves in place | | | — | | | | (44 | ) | | | (1 | ) | | | — | | | | — | | | | (45 | ) | | Production for the year | | | (108 | ) | | | (223 | ) | | | (15 | ) | | | (34 | ) | | | (17 | ) | | | (397 | ) | | | | | | | | | | | | | | | | | | | | | | | | | | | Balance as of December 31, 2009 | | | 733 | | | | 2,460 | | | | 88 | | | | 188 | | | | 572 | | | | 4,041 | | | | | | | | | | | | | | | | | | | | | | | | | | | | | Revisions of previous estimates | | | 46 | | | | 131 | | | | 7 | | | | (2 | ) | | | — | | | | 182 | | | Extensions, discoveries and other | | | 146 | | | | — | | | | 2 | | | | 82 | | | | 4 | | | | 234 | | | Acquisitions of reserves in place | | | 2 | | | | — | | | | — | | | | — | | | | — | | | | 2 | | | Sales of reserves in place | | | (37 | ) | | | (23 | ) | | | (2 | ) | | | — | | | | (7 | ) | | | (69 | ) | | Production for the year | | | (98 | ) | | | (218 | ) | | | (16 | ) | | | (29 | ) | | | (15 | ) | | | (376 | ) | | | | | | | | | | | | | | | | | | | | | | | | | | | Balance as of December 31, 2010 | | | 792 | | | | 2,350 | | | | 79 | | | | 239 | | | | 554 | | | | 4,014 | | | | | | | | | | | | | | | | | | | | | | | | | | | | Minority interest in proved developed and undeveloped reserves as of | | | | | | | | | | | | | | | | | | December 31, 2008 | | | 12 | | | | 89 | | | | — | | | | — | | | | — | | | | 101 | | | December 31, 2009 | | | 12 | | | | 88 | | | | — | | | | — | | | | — | | | | 100 | | | December 31, 2010 | | | 11 | | | | 89 | | | | — | | | | — | | | | — | | | | 100 | |
| | | | | | | | | | | | | | | | | | | | | | | | | | | Proved developed and undeveloped reserves | | Equity & non-consolidated affiliates | | | | | | | | | | | | | | Middle
| | | | | | | | | (in million barrels) | | Europe | | | Africa | | | Americas | | | East | | | Asia | | | Total | | Balance as of December 31, 2007 | | | — | | | | 43 | | | | 533 | | | | 806 | | | | — | | | | 1,382 | | | Revisions of previous estimates | | | — | | | | 22 | | | | 1 | | | | (2 | ) | | | — | | | | 21 | | | Extensions, discoveries and other | | | — | | | | — | | | | — | | | | 3 | | | | — | | | | 3 | | | Acquisitions of reserves in place | | | — | | | | — | | | | 6 | | | | — | | | | — | | | | 6 | | | Sales of reserves in place | | | — | | | | — | | | | — | | | | — | | | | — | | | | — | | | Production for the year | | | — | | | | (7 | ) | | | (32 | ) | | | (88 | ) | | | — | | | | (127 | ) | | | | | | | | | | | | | | | | | | | | | | | | | | | Balance as of December 31, 2008 | | | — | | | | 58 | | | | 508 | | | | 719 | | | | — | | | | 1,285 | | | | | | | | | | | | | | | | | | | | | | | | | | | | | Revisions of previous estimates | | | — | | | | (14 | ) | | | (5 | ) | | | (15 | ) | | | — | | | | (34 | ) | | Extensions, discoveries and other | | | — | | | | — | | | | — | | | | 136 | | | | — | | | | 136 | | | Acquisitions of reserves in place | | | — | | | | — | | | | — | | | | — | | | | — | | | | — | | | Sales of reserves in place | | | — | | | | — | | | | — | | | | — | | | | — | | | | — | | | Production for the year | | | — | | | | (7 | ) | | | (18 | ) | | | (79 | ) | | | — | | | | (104 | ) | | | | | | | | | | | | | | | | | | | | | | | | | | | Balance as of December 31, 2009 | | | — | | | | 37 | | | | 485 | | | | 761 | | | | — | | | | 1,283 | | | | | | | | | | | | | | | | | | | | | | | | | | | | | Revisions of previous estimates | | | — | | | | 4 | | | | 4 | | | | 3 | | | | — | | | | 11 | | | Extensions, discoveries and other | | | — | | | | — | | | | — | | | | — | | | | — | | | | — | | | Acquisitions of reserves in place | | | — | | | | — | | | | — | | | | — | | | | — | | | | — | | | Sales of reserves in place | | | — | | | | — | | | | — | | | | — | | | | — | | | | — | | | Production for the year | | | — | | | | (7 | ) | | | (19 | ) | | | (84 | ) | | | — | | | | (110 | ) | | | | | | | | | | | | | | | | | | | | | | | | | | | Balance as of December 31, 2010 | | | — | | | | 34 | | | | 470 | | | | 680 | | | | — | | | | 1,184 | | | | | | | | | | | | | | | | | | | | | | | | | | | |
S-6
| | | | | | | | | | | | | | | | | | | | | | | | | | Proved developed and undeveloped reserves | | Consolidated subsidiaries | | | | | Europe | | | Africa | | | Americas | | | Middle
East | | | Asia | | | Total | | (in million barrels) | | | | | | | Balance as of December 31, 2008 | | | 798 | | | | 2,597 | | | | 252 | | | | 225 | | | | 538 | | | | 4,410 | | Revisions of previous estimates | | | 34 | | | | 92 | | | | (170 | ) | | | (4 | ) | | | 51 | | | | 3 | | Extensions, discoveries and other | | | 8 | | | | 38 | | | | 22 | | | | 1 | | | | — | | | | 69 | | Acquisitions of reserves in place | | | 1 | | | | — | | | | — | | | | — | | | | — | | | | 1 | | Sales of reserves in place | | | — | | | | (44 | ) | | | (1 | ) | | | — | | | | — | | | | (45 | ) | Production for the year | | | (108 | ) | | | (223 | ) | | | (15 | ) | | | (34 | ) | | | (17 | ) | | | (397 | ) | Balance as of December 31, 2009 | | | 733 | | | | 2,460 | | | | 88 | | | | 188 | | | | 572 | | | | 4,041 | | Revisions of previous estimates | | | 46 | | | | 131 | | | | 7 | | | | (2 | ) | | | — | | | | 182 | | Extensions, discoveries and other | | | 146 | | | | — | | | | 2 | | | | 82 | | | | 4 | | | | 234 | | Acquisitions of reserves in place | | | 2 | | | | — | | | | — | | | | — | | | | — | | | | 2 | | Sales of reserves in place | | | (37 | ) | | | (23 | ) | | | (2 | ) | | | — | | | | (7 | ) | | | (69 | ) | Production for the year | | | (98 | ) | | | (218 | ) | | | (16 | ) | | | (29 | ) | | | (15 | ) | | | (376 | ) | Balance as of December 31, 2010 | | | 792 | | | | 2,350 | | | | 79 | | | | 239 | | | | 554 | | | | 4,014 | | Revisions of previous estimates | | | 49 | | | | (19 | ) | | | 9 | | | | (33 | ) | | | (24 | ) | | | (18 | ) | Extensions, discoveries and other | | | 17 | | | | 6 | | | | — | | | | — | | | | 58 | | | | 81 | | Acquisitions of reserves in place | | | 42 | | | | — | | | | — | | | | — | | | | — | | | | 42 | | Sales of reserves in place | | | — | | | | (57 | ) | | | — | | | | — | | | | — | | | | (57 | ) | Production for the year | | | (88 | ) | | | (185 | ) | | | (15 | ) | | | (25 | ) | | | (15 | ) | | | (328 | ) | Balance as of December 31, 2011 | | | 812 | | | | 2,095 | | | | 73 | | | | 181 | | | | 573 | | | | 3,734 | | | | | | | | | Minority interest in proved developed and undeveloped reserves as of | | | | | | | | | | | | | | | | | | | | | | | | | December 31, 2009 | | | 12 | | | | 88 | | | | — | | | | — | | | | — | | | | 100 | | December 31, 2010 | | | 11 | | | | 89 | | | | — | | | | — | | | | — | | | | 100 | | December 31, 2011 | | | — | | | | 88 | | | | — | | | | — | | | | — | | | | 88 | | | | | Proved developed and undeveloped reserves | | Equity affiliates | | | | | Europe | | | Africa | | | Americas | | | Middle
East | | | Asia | | | Total | | (in million barrels) | | | | | | | Balance as of December 31, 2008 | | | — | | | | 58 | | | | 508 | | | | 719 | | | | — | | | | 1,285 | | Revisions of previous estimates | | | — | | | | (14 | ) | | | (5 | ) | | | (15 | ) | | | — | | | | (34 | ) | Extensions, discoveries and other | | | — | | | | — | | | | — | | | | 136 | | | | — | | | | 136 | | Acquisitions of reserves in place | | | — | | | | — | | | | — | | | | — | | | | — | | | | — | | Sales of reserves in place | | | — | | | | — | | | | — | | | | — | | | | — | | | | — | | Production for the year | | | — | | | | (7 | ) | | | (18 | ) | | | (79 | ) | | | — | | | | (104 | ) | Balance as of December 31, 2009 | | | — | | | | 37 | | | | 485 | | | | 761 | | | | — | | | | 1,283 | | Revisions of previous estimates | | | — | | | | 4 | | | | 4 | | | | 3 | | | | — | | | | 11 | | Extensions, discoveries and other | | | — | | | | — | | | | — | | | | — | | | | — | | | | — | | Acquisitions of reserves in place | | | — | | | | — | | | | — | | | | — | | | | — | | | | — | | Sales of reserves in place | | | — | | | | — | | | | — | | | | — | | | | — | | | | — | | Production for the year | | | — | | | | (7 | ) | | | (19 | ) | | | (84 | ) | | | — | | | | (110 | ) | Balance as of December 31, 2010 | | | — | | | | 34 | | | | 470 | | | | 680 | | | | — | | | | 1,184 | | Revisions of previous estimates | | | — | | | | 2 | | | | (6 | ) | | | (12 | ) | | | — | | | | (16 | ) | Extensions, discoveries and other | | | — | | | | — | | | | — | | | | — | | | | — | | | | — | | Acquisitions of reserves in place | | | — | | | | — | | | | — | | | | — | | | | 51 | | | | 51 | | Sales of reserves in place | | | — | | | | (22 | ) | | | (4 | ) | | | (12 | ) | | | — | | | | (38 | ) | Production for the year | | | — | | | | (4 | ) | | | (17 | ) | | | (91 | ) | | | (3 | ) | | | (115 | ) | Balance as of December 31, 2011 | | | — | | | | 10 | | | | 443 | | | | 565 | | | | 48 | | | | 1,066 | |
| | | | | | | | | | | | | | | | | | | | | | | | | | | | | | Consolidated subsidiaries and equity affiliates | | | | | Europe | | | Africa | | | Americas | | | Middle
East | | | Asia | | | Total | | (in million barrels) | | | | | | | As of December 31, 2009 | | | | | | | | | | | | | | | | | | | | | | | | | Proved developed and undeveloped reserves | | | 733 | | | | 2,497 | | | | 573 | | | | 949 | | | | 572 | | | | 5,324 | | Consolidated subsidiaries | | | 733 | | | | 2,460 | | | | 88 | | | | 188 | | | | 572 | | | | 4,041 | | Equity affiliates | | | — | | | | 37 | | | | 485 | | | | 761 | | | | — | | | | 1,283 | | Proved developed reserves | | | 457 | | | | 1,331 | | | | 187 | | | | 728 | | | | 65 | | | | 2,768 | | Consolidated subsidiaries | | | 457 | | | | 1,303 | | | | 66 | | | | 174 | | | | 65 | | | | 2,065 | | Equity affiliates | | | — | | | | 28 | | | | 121 | | | | 554 | | | | — | | | | 703 | | Proved undeveloped reserves | | | 276 | | | | 1,166 | | | | 386 | | | | 221 | | | | 507 | | | | 2,556 | | Consolidated subsidiaries | | | 276 | | | | 1,157 | | | | 22 | | | | 14 | | | | 507 | | | | 1,976 | | Equity affiliates | | | — | | | | 9 | | | | 364 | | | | 207 | | | | — | | | | 580 | | As of December 31, 2010 | | | | | | | | | | | | | | | | | | | | | | | | | Proved developed and undeveloped reserves | | | 792 | | | | 2,384 | | | | 549 | | | | 919 | | | | 554 | | | | 5,198 | | Consolidated subsidiaries | | | 792 | | | | 2,350 | | | | 79 | | | | 239 | | | | 554 | | | | 4,014 | | Equity affiliates | | | — | | | | 34 | | | | 470 | | | | 680 | | | | — | | | | 1,184 | | Proved developed reserves | | | 394 | | | | 1,250 | | | | 180 | | | | 662 | | | | 58 | | | | 2,544 | | Consolidated subsidiaries | | | 394 | | | | 1,226 | | | | 53 | | | | 151 | | | | 58 | | | | 1,882 | | Equity affiliates | | | — | | | | 24 | | | | 127 | | | | 511 | | | | — | | | | 662 | | Proved undeveloped reserves | | | 398 | | | | 1,134 | | | | 369 | | | | 257 | | | | 496 | | | | 2,654 | | Consolidated subsidiaries | | | 398 | | | | 1,124 | | | | 26 | | | | 88 | | | | 496 | | | | 2,132 | | Equity affiliates | | | — | | | | 10 | | | | 343 | | | | 169 | | | | — | | | | 522 | | As of December 31, 2011 | | | | | | | | | | | | | | | | | | | | | | | | | Proved developed and undeveloped reserves | | | 812 | | | | 2,105 | | | | 516 | | | | 746 | | | | 621 | | | | 4,800 | | Consolidated subsidiaries | | | 812 | | | | 2,095 | | | | 73 | | | | 181 | | | | 573 | | | | 3,734 | | Equity affiliates | | | — | | | | 10 | | | | 443 | | | | 565 | | | | 48 | | | | 1,066 | | Proved developed reserves | | | 351 | | | | 1,206 | | | | 165 | | | | 565 | | | | 91 | | | | 2,378 | | Consolidated subsidiaries | | | 351 | | | | 1,202 | | | | 48 | | | | 116 | | | | 50 | | | | 1,767 | | Equity affiliates | | | — | | | | 4 | | | | 117 | | | | 449 | | | | 41 | | | | 611 | | Proved undeveloped reserves | | | 461 | | | | 899 | | | | 351 | | | | 181 | | | | 530 | | | | 2,422 | | Consolidated subsidiaries | | | 461 | | | | 893 | | | | 25 | | | | 65 | | | | 523 | | | | 1,967 | | Equity affiliates | | | — | | | | 6 | | | | 326 | | | | 116 | | | | 7 | | | | 455 | |
| | | | | | | | | | | | | | | | | | | | | | | | | | | | | Consolidated subsidiaries and equity & non-consolidated affiliates | | | | | | | | | | | | | | Middle
| | | | | | | | | (in million barrels) | | Europe | | | Africa | | | Americas | | | East | | | Asia | | | Total | | As of December 31, 2008 | | | | | | | | | | | | | | | | | | | | | | | | | Proved developed and undeveloped reserves | | | 798 | | | | 2,655 | | | | 760 | | | | 944 | | | | 538 | | | | 5,695 | | | Consolidated subsidiaries | | | 798 | | | | 2,597 | | | | 252 | | | | 225 | | | | 538 | | | | 4,410 | | | Equity and non-consolidated affiliates | | | — | | | | 58 | | | | 508 | | | | 719 | | | | — | | | | 1,285 | | | | | | | | | | | | | | | | | | | | | | | | | | | | Proved developed reserves | | | 516 | | | | 1,357 | | | | 183 | | | | 681 | | | | 65 | | | | 2,802 | | | Consolidated subsidiaries | | | 516 | | | | 1,313 | | | | 56 | | | | 201 | | | | 65 | | | | 2,151 | | | Equity and non-consolidated affiliates | | | — | | | | 44 | | | | 127 | | | | 480 | | | | — | | | | 651 | | | | | | | | | | | | | | | | | | | | | | | | | | | | Proved undeveloped reserves | | | 282 | | | | 1,298 | | | | 577 | | | | 263 | | | | 473 | | | | 2,893 | | | Consolidated subsidiaries | | | 282 | | | | 1,284 | | | | 196 | | | | 24 | | | | 473 | | | | 2,259 | | | Equity and non-consolidated affiliates | | | — | | | | 14 | | | | 381 | | | | 239 | | | | — | | | | 634 | | | | | | | | | | | | | | | | | | | | | | | | | | | | As of December 31, 2009 | | | | | | | | | | | | | | | | | | | | | | | | | Proved developed and undeveloped reserves | | | 733 | | | | 2,497 | | | | 573 | | | | 949 | | | | 572 | | | | 5,324 | | | Consolidated subsidiaries | | | 733 | | | | 2,460 | | | | 88 | | | | 188 | | | | 572 | | | | 4,041 | | | Equity and non-consolidated affiliates | | | — | | | | 37 | | | | 485 | | | | 761 | | | | — | | | | 1,283 | | | | | | | | | | | | | | | | | | | | | | | | | | | | Proved developed reserves | | | 457 | | | | 1,331 | | | | 187 | | | | 728 | | | | 65 | | | | 2,768 | | | Consolidated subsidiaries | | | 457 | | | | 1,303 | | | | 66 | | | | 174 | | | | 65 | | | | 2,065 | | | Equity and non-consolidated affiliates | | | — | | | | 28 | | | | 121 | | | | 554 | | | | — | | | | 703 | | | | | | | | | | | | | | | | | | | | | | | | | | | | Proved undeveloped reserves | | | 276 | | | | 1,166 | | | | 386 | | | | 221 | | | | 507 | | | | 2,556 | | | Consolidated subsidiaries | | | 276 | | | | 1,157 | | | | 22 | | | | 14 | | | | 507 | | | | 1,976 | | | Equity and non-consolidated affiliates | | | — | | | | 9 | | | | 364 | | | | 207 | | | | — | | | | 580 | | | | | | | | | | | | | | | | | | | | | | | | | | | | As of December 31, 2010 | | | | | | | | | | | | | | | | | | | | | | | | | Proved developed and undeveloped reserves | | | 792 | | | | 2,384 | | | | 549 | | | | 919 | | | | 554 | | | | 5,198 | | | Consolidated subsidiaries | | | 792 | | | | 2,350 | | | | 79 | | | | 239 | | | | 554 | | | | 4,014 | | | Equity and non-consolidated affiliates | | | — | | | | 34 | | | | 470 | | | | 680 | | | | — | | | | 1,184 | | | | | | | | | | | | | | | | | | | | | | | | | | | | Proved developed reserves | | | 394 | | | | 1,250 | | | | 180 | | | | 662 | | | | 58 | | | | 2,544 | | | Consolidated subsidiaries | | | 394 | | | | 1,226 | | | | 53 | | | | 151 | | | | 58 | | | | 1,882 | | | Equity and non-consolidated affiliates | | | — | | | | 24 | | | | 127 | | | | 511 | | | | — | | | | 662 | | | | | | | | | | | | | | | | | | | | | | | | | | | | Proved undeveloped reserves | | | 398 | | | | 1,134 | | | | 369 | | | | 257 | | | | 496 | | | | 2,654 | | | Consolidated subsidiaries | | | 398 | | | | 1,124 | | | | 26 | | | | 88 | | | | 496 | | | | 2,132 | | | Equity and non-consolidated affiliates | | | — | | | | 10 | | | | 343 | | | | 169 | | | | — | | | | 522 | | | | | | | | | | | | | | | | | | | | | | | | | | | |
S-7
Changes in bitumen reserves Bitumen reserves as of December 31, 2008 and before are included in oil reserves presented in the table “Changes in oil reserves”. | | | | | | | | | | | | | | | | | | | | | | | | | | | Proved developed and undeveloped reserves | | Consolidated subsidiaries | | | | | | | | | | | | | | Middle
| | | | | | | | | (in million barrels) | | Europe | | | Africa | | | Americas | | | East | | | Asia | | | Total | | Balance as of December 31, 2008 | | | — | | | | — | | | | — | | | | — | | | | — | | | | — | | | | | | | | | | | | | | | | | | | | | | | | | | | | | Revisions of previous estimates | | | — | | | | — | | | | 176 | | | | — | | | | — | | | | 176 | | | Extensions, discoveries and other | | | — | | | | — | | | | 192 | | | | — | | | | — | | | | 192 | | | Acquisitions of reserves in place | | | — | | | | — | | | | — | | | | — | | | | — | | | | — | | | Sales of reserves in place | | | — | | | | — | | | | — | | | | — | | | | — | | | | — | | | Production for the year | | | — | | | | — | | | | (3 | ) | | | — | | | | — | | | | (3 | ) | | | | | | | | | | | | | | | | | | | | | | | | | | | Balance as of December 31, 2009 | | | — | | | | — | | | | 365 | | | | — | | | | — | | | | 365 | | | | | | | | | | | | | | | | | | | | | | | | | | | | | Revisions of previous estimates | | | — | | | | — | | | | 3 | | | | — | | | | — | | | | 3 | | | Extensions, discoveries and other | | | — | | | | — | | | | — | | | | — | | | | — | | | | — | | | Acquisitions of reserves in place | | | — | | | | — | | | | 425 | | | | — | | | | — | | | | 425 | | | Sales of reserves in place | | | — | | | | — | | | | — | | | | — | | | | — | | | | — | | | Production for the year | | | — | | | | — | | | | (4 | ) | | | — | | | | — | | | | (4 | ) | | | | | | | | | | | | | | | | | | | | | | | | | | | Balance as of December 31, 2010 | | | — | | | | — | | | | 789 | | | | — | | | | — | | | | 789 | | | | | | | | | | | | | | | | | | | | | | | | | | | | Proved developed reserves as of | | | | | | | | | | | | | | | | | | | | | | | | | | December 31, 2009 | | | — | | | | — | | | | 19 | | | | — | | | | — | | | | 19 | | | | | | | | | | | | | | | | | | | | | | | | | | | | December 31, 2010 | | | — | | | | — | | | | 18 | | | | — | | | | — | | | | 18 | | | | | | | | | | | | | | | | | | | | | | | | | | | | Proved undeveloped reserves as of | | | | | | | | | | | | | | | | | | | | | | | | | | December 31, 2009 | | | — | | | | — | | | | 346 | | | | — | | | | — | | | | 346 | | | | | | | | | | | | | | | | | | | | | | | | | | | | December 31, 2010 | | | — | | | | — | | | | 771 | | | | — | | | | — | | | | 771 | | | | | | | | | | | | | | | | | | | | | | | | | | | |
| | | | | | | | | | | | | | | | | | | | | | | | | | Proved developed and undeveloped reserves | | Consolidated subsidiaries | | (in million barrels) | | Europe | | | Africa | | | Americas | | | Middle
East | | | Asia | | | Total | | Balance as of December 31, 2008 | | | — | | | | — | | | | — | | | | — | | | | — | | | | — | | Revisions of previous estimates | | | — | | | | — | | | | 176 | | | | — | | | | — | | | | 176 | | Extensions, discoveries and other | | | — | | | | — | | | | 192 | | | | — | | | | — | | | | 192 | | Acquisitions of reserves in place | | | — | | | | — | | | | — | | | | — | | | | — | | | | — | | Sales of reserves in place | | | — | | | | — | | | | — | | | | — | | | | — | | | | — | | Production for the year | | | — | | | | — | | | | (3 | ) | | | — | | | | — | | | | (3 | ) | Balance as of December 31, 2009 | | | — | | | | — | | | | 365 | | | | — | | | | — | | | | 365 | | Revisions of previous estimates | | | — | | | | — | | | | 3 | | | | — | | | | — | | | | 3 | | Extensions, discoveries and other | | | — | | | | — | | | | — | | | | — | | | | — | | | | — | | Acquisitions of reserves in place | | | — | | | | — | | | | 425 | | | | — | | | | — | | | | 425 | | Sales of reserves in place | | | — | | | | — | | | | — | | | | — | | | | — | | | | — | | Production for the year | | | — | | | | — | | | | (4 | ) | | | — | | | | — | | | | (4 | ) | Balance as of December 31, 2010 | | | — | | | | — | | | | 789 | | | | — | | | | — | | | | 789 | | Revisions of previous estimates | | | — | | | | — | | | | (109 | ) | | | — | | | | — | | | | (109 | ) | Extensions, discoveries and other | | | — | | | | — | | | | — | | | | — | | | | — | | | | — | | Acquisitions of reserves in place | | | — | | | | — | | | | 308 | | | | — | | | | — | | | | 308 | | Sales of reserves in place | | | — | | | | — | | | | — | | | | — | | | | — | | | | — | | Production for the year | | | — | | | | — | | | | (4 | ) | | | — | | | | — | | | | (4 | ) | Balance as of December 31, 2011 | | | — | | | | — | | | | 984 | | | | — | | | | — | | | | 984 | | | | | | | | | Proved developed reserves as of | | | | | | | | | | | | | | | | | | | | | | | | | December 31, 2009 | | | — | | | | — | | | | 19 | | | | — | | | | — | | | | 19 | | December 31, 2010 | | | — | | | | — | | | | 18 | | | | — | | | | — | | | | 18 | | December 31, 2011 | | | — | | | | — | | | | 21 | | | | — | | | | — | | | | 21 | | | | | | | | | Proved undeveloped reserves as of | | | | | | | | | | | | | | | | | | | | | | | | | December 31, 2009 | | | — | | | | — | | | | 346 | | | | — | | | | — | | | | 346 | | December 31, 2010 | | | — | | | | — | | | | 771 | | | | — | | | | — | | | | 771 | | December 31, 2011 | | | — | | | | — | | | | 963 | | | | — | | | | — | | | | 963 | |
There are no bitumen reserves for equity and non-consolidated affiliates. There are no minority interests for bitumen reserves.
S-8
Changes in gas reserves | | | | | | | | | | | | | | | | | | | | | | | | | | | Proved developed and undeveloped reserves | | Consolidated subsidiaries | | | | | | | | | | | | | | Middle
| | | | | | | | | (in billion cubic feet) | | Europe | | | Africa | | | Americas | | | East | | | Asia | | | Total | | Balance as of December 31, 2007 | | | 5,531 | | | | 5,371 | | | | 2,564 | | | | 1,572 | | | | 4,045 | | | | 19,083 | | | | | | | | | | | | | | | | | | | | | | | | | | | | | Revisions of previous estimates | | | 145 | | | | 381 | | | | 366 | | | | 300 | | | | 458 | | | | 1,650 | | | Extensions, discoveries and other | | | 377 | | | | 17 | | | | — | | | | — | | | | 90 | | | | 484 | | | Acquisitions of reserves in place | | | 76 | | | | — | | | | — | | | | — | | | | — | | | | 76 | | | Sales of reserves in place | | | — | | | | — | | | | — | | | | — | | | | (15 | ) | | | (15 | ) | | Production for the year | | | (622 | ) | | | (240 | ) | | | (216 | ) | | | (103 | ) | | | (480 | ) | | | (1,661 | ) | | | | | | | | | | | | | | | | | | | | | | | | | | | Balance as of December 31, 2008 | | | 5,507 | | | | 5,529 | | | | 2,714 | | | | 1,769 | | | | 4,098 | | | | 19,617 | | | | | | | | | | | | | | | | | | | | | | | | | | | | | Revisions of previous estimates | | | 73 | | | | (127 | ) | | | 25 | | | | (18 | ) | | | (165 | ) | | | (212 | ) | | Extensions, discoveries and other | | | 55 | | | | 61 | | | | 382 | | | | 399 | | | | — | | | | 897 | | | Acquisitions of reserves in place | | | 58 | | | | — | | | | 752 | | | | — | | | | — | | | | 810 | | | Sales of reserves in place | | | (13 | ) | | | — | | | | (64 | ) | | | — | | | | — | | | | (77 | ) | | Production for the year | | | (633 | ) | | | (217 | ) | | | (212 | ) | | | (122 | ) | | | (467 | ) | | | (1,651 | ) | | | | | | | | | | | | | | | | | | | | | | | | | | | Balance as of December 31, 2009 | | | 5,047 | | | | 5,246 | | | | 3,597 | | | | 2,028 | | | | 3,466 | | | | 19,384 | | | | | | | | | | | | | | | | | | | | | | | | | | | | | Revisions of previous estimates | | | 271 | | | | 346 | | | | 415 | | | | (80 | ) | | | 15 | | | | 967 | | | Extensions, discoveries and other | | | 193 | | | | — | | | | 88 | | | | 70 | | | | 138 | | | | 489 | | | Acquisitions of reserves in place | | | 111 | | | | — | | | | — | | | | — | | | | 51 | | | | 162 | | | Sales of reserves in place | | | (43 | ) | | | (20 | ) | | | (16 | ) | | | — | | | | (4 | ) | | | (83 | ) | | Production for the year | | | (617 | ) | | | (258 | ) | | | (278 | ) | | | (151 | ) | | | (472 | ) | | | (1,776 | ) | | | | | | | | | | | | | | | | | | | | | | | | | | | Balance as of December 31, 2010 | | | 4,962 | | | | 5,314 | | | | 3,806 | | | | 1,867 | | | | 3,194 | | | | 19,143 | | | | | | | | | | | | | | | | | | | | | | | | | | | | Minority interest in proved developed and undeveloped reserves as of | | December 31, 2008 | | | 75 | | | | 64 | | | | — | | | | — | | | | — | | | | 139 | | | December 31, 2009 | | | 73 | | | | 60 | | | | — | | | | — | | | | — | | | | 133 | | | | | | | | | | | | | | | | | | | | | | | | | | | | December 31, 2010 | | | 83 | | | | 67 | | | | — | | | | — | | | | — | | | | 150 | | | | | | | | | | | | | | | | | | | | | | | | | | | |
S-9
| | | | | | | | | | | | | | | | | | | | | | | | | | Proved developed and undeveloped reserves | | Consolidated subsidiaries | | (in billion cubic feet) | | Europe | | | Africa | | | Americas | | | Middle
East | | | Asia | | | Total | | Balance as of December 31, 2008 | | | 5,507 | | | | 5,529 | | | | 2,714 | | | | 1,769 | | | | 4,098 | | | | 19,617 | | Revisions of previous estimates | | | 73 | | | | (127 | ) | | | 25 | | | | (18 | ) | | | (165 | ) | | | (212 | ) | Extensions, discoveries and other | | | 55 | | | | 61 | | | | 382 | | | | 399 | | | | — | | | | 897 | | Acquisitions of reserves in place | | | 58 | | | | — | | | | 752 | | | | — | | | | — | | | | 810 | | Sales of reserves in place | | | (13 | ) | | | — | | | | (64 | ) | | | — | | | | — | | | | (77 | ) | Production for the year | | | (633 | ) | | | (217 | ) | | | (212 | ) | | | (122 | ) | | | (467 | ) | | | (1,651 | ) | Balance as of December 31, 2009 | | | 5,047 | | | | 5,246 | | | | 3,597 | | | | 2,028 | | | | 3,466 | | | | 19,384 | | Revisions of previous estimates | | | 271 | | | | 346 | | | | 415 | | | | (80 | ) | | | 15 | | | | 967 | | Extensions, discoveries and other | | | 193 | | | | — | | | | 88 | | | | 70 | | | | 138 | | | | 489 | | Acquisitions of reserves in place | | | 111 | | | | — | | | | — | | | | — | | | | 51 | | | | 162 | | Sales of reserves in place | | | (43 | ) | | | (20 | ) | | | (16 | ) | | | — | | | | (4 | ) | | | (83 | ) | Production for the year | | | (617 | ) | | | (258 | ) | | | (278 | ) | | | (151 | ) | | | (472 | ) | | | (1,776 | ) | Balance as of December 31, 2010 | | | 4,962 | | | | 5,314 | | | | 3,806 | | | | 1,867 | | | | 3,194 | | | | 19,143 | | Revisions of previous estimates | | | 358 | | | | (216 | ) | | | 367 | | | | (180 | ) | | | 1 | | | | 330 | | Extensions, discoveries and other | | | 211 | | | | — | | | | — | | | | — | | | | 2,824 | | | | 3,035 | | Acquisitions of reserves in place | | | 11 | | | | — | | | | 7 | | | | — | | | | 13 | | | | 31 | | Sales of reserves in place | | | — | | | | (46 | ) | | | — | | | | — | | | | — | | | | (46 | ) | Production for the year | | | (528 | ) | | | (259 | ) | | | (317 | ) | | | (169 | ) | | | (445 | ) | | | (1,718 | ) | Balance as of December 31, 2011 | | | 5,014 | | | | 4,793 | | | | 3,863 | | | | 1,518 | | | | 5,587 | | | | 20,775 | | | Minority interest in proved developed and undeveloped reserves as of | | December 31, 2009 | | | 73 | | | | 60 | | | | — | | | | — | | | | — | | | | 133 | | December 31, 2010 | | | 83 | | | | 67 | | | | — | | | | — | | | | — | | | | 150 | | December 31, 2011 | | | — | | | | 62 | | | | — | | | | — | | | | — | | | | 62 | | | | | Proved developed and undeveloped reserves | | Equity affiliates | | (in billion cubic feet) | | Europe | | | Africa | | | Americas | | | Middle
East | | | Asia | | | Total | | Balance as of December 31, 2008 | | | — | | | | 215 | | | | 110 | | | | 6,276 | | | | — | | | | 6,601 | | Revisions of previous estimates | | | — | | | | 127 | | | | (13 | ) | | | 363 | | | | — | | | | 477 | | Extensions, discoveries and other | | | — | | | | — | | | | — | | | | — | | | | — | | | | — | | Acquisitions of reserves in place | | | — | | | | — | | | | — | | | | — | | | | — | | | | — | | Sales of reserves in place | | | — | | | | — | | | | — | | | | — | | | | — | | | | — | | Production for the year | | | — | | | | (1 | ) | | | (2 | ) | | | (141 | ) | | | — | | | | (144 | ) | Balance as of December 31, 2009 | | | — | | | | 341 | | | | 95 | | | | 6,498 | | | | — | | | | 6,934 | | Revisions of previous estimates | | | — | | | | 50 | | | | (2 | ) | | | (52 | ) | | | — | | | | (4 | ) | Extensions, discoveries and other | | | — | | | | — | | | | — | | | | — | | | | — | | | | — | | Acquisitions of reserves in place | | | — | | | | — | | | | — | | | | — | | | | — | | | | — | | Sales of reserves in place | | | — | | | | — | | | | — | | | | — | | | | — | | | | — | | Production for the year | | | — | | | | (1 | ) | | | (2 | ) | | | (282 | ) | | | — | | | | (285 | ) | Balance as of December 31, 2010 | | | — | | | | 390 | | | | 91 | | | | 6,164 | | | | — | | | | 6,645 | | Revisions of previous estimates | | | — | | | | (16 | ) | | | (10 | ) | | | (31 | ) | | | — | | | | (57 | ) | Extensions, discoveries and other | | | — | | | | — | | | | — | | | | — | | | | — | | | | — | | Acquisitions of reserves in place | | | — | | | | — | | | | — | | | | — | | | | 3,865 | | | | 3,865 | | Sales of reserves in place | | | — | | | | (10 | ) | | | — | | | | — | | | | — | | | | (10 | ) | Production for the year | | | — | | | | (1 | ) | | | (2 | ) | | | (331 | ) | | | (167 | ) | | | (501 | ) | Balance as of December 31, 2011 | | | — | | | | 363 | | | | 79 | | | | 5,802 | | | | 3,698 | | | | 9,942 | |
| | | | | | | | | | | | | | | | | | | | | | | | | | | | Consolidated subsidiaries and equity affiliates | | (in billion cubic feet) | | Europe | | | Africa | | | Americas | | | Middle
East | | | Asia | | | Total | | As of December 31, 2009 | | | | | | | | | | | | | | | | | | | | | | | | | Proved developed and undeveloped reserves | | | 5,047 | | | | 5,587 | | | | 3,692 | | | | 8,526 | | | | 3,466 | | | | 26,318 | | Consolidated subsidiaries | | | 5,047 | | | | 5,246 | | | | 3,597 | | | | 2,028 | | | | 3,466 | | | | 19,384 | | Equity affiliates | | | — | | | | 341 | | | | 95 | | | | 6,498 | | | | — | | | | 6,934 | | Proved developed reserves | | | 3,463 | | | | 2,272 | | | | 2,388 | | | | 6,606 | | | | 2,059 | | | | 16,788 | | Consolidated subsidiaries | | | 3,463 | | | | 2,261 | | | | 2,343 | | | | 1,773 | | | | 2,059 | | | | 11,899 | | Equity affiliates | | | — | | | | 11 | | | | 45 | | | | 4,833 | | | | — | | | | 4,889 | | Proved undeveloped reserves | | | 1,584 | | | | 3,315 | | | | 1,304 | | | | 1,920 | | | | 1,407 | | | | 9,530 | | Consolidated subsidiaries | | | 1,584 | | | | 2,985 | | | | 1,254 | | | | 255 | | | | 1,407 | | | | 7,485 | | Equity affiliates | | | — | | | | 330 | | | | 50 | | | | 1,665 | | | | — | | | | 2,045 | | As of December 31, 2010 | | | | | | | | | | | | | | | | | | | | | | | | | Proved developed and undeveloped reserves | | | 4,962 | | | | 5,704 | | | | 3,897 | | | | 8,031 | | | | 3,194 | | | | 25,788 | | Consolidated subsidiaries | | | 4,962 | | | | 5,314 | | | | 3,806 | | | | 1,867 | | | | 3,194 | | | | 19,143 | | Equity affiliates | | | — | | | | 390 | | | | 91 | | | | 6,164 | | | | — | | | | 6,645 | | Proved developed reserves | | | 3,089 | | | | 2,240 | | | | 2,474 | | | | 7,649 | | | | 1,790 | | | | 17,242 | | Consolidated subsidiaries | | | 3,089 | | | | 2,229 | | | | 2,439 | | | | 1,578 | | | | 1,790 | | | | 11,125 | | Equity affiliates | | | — | | | | 11 | | | | 35 | | | | 6,071 | | | | — | | | | 6,117 | | Proved undeveloped reserves | | | 1,873 | | | | 3,464 | | | | 1,423 | | | | 382 | | | | 1,404 | | | | 8,546 | | Consolidated subsidiaries | | | 1,873 | | | | 3,085 | | | | 1,367 | | | | 289 | | | | 1,404 | | | | 8,018 | | Equity affiliates | | | — | | | | 379 | | | | 56 | | | | 93 | | | | — | | | | 528 | | As of December 31, 2011 | | | | | | | | | | | | | | | | | | | | | | | | | Proved developed and undeveloped reserves | | | 5,014 | | | | 5,156 | | | | 3,942 | | | | 7,320 | | | | 9,285 | | | | 30,717 | | Consolidated subsidiaries | | | 5,014 | | | | 4,793 | | | | 3,863 | | | | 1,518 | | | | 5,587 | | | | 20,775 | | Equity affiliates | | | — | | | | 363 | | | | 79 | | | | 5,802 | | | | 3,698 | | | | 9,942 | | Proved developed reserves | | | 2,943 | | | | 2,308 | | | | 2,600 | | | | 7,170 | | | | 4,854 | | | | 19,875 | | Consolidated subsidiaries | | | 2,943 | | | | 2,216 | | | | 2,567 | | | | 1,450 | | | | 1,594 | | | | 10,770 | | Equity affiliates | | | — | | | | 92 | | | | 33 | | | | 5,720 | | | | 3,260 | | | | 9,105 | | Proved undeveloped reserves | | | 2,071 | | | | 2,848 | | | | 1,342 | | | | 150 | | | | 4,431 | | | | 10,842 | | Consolidated subsidiaries | | | 2,071 | | | | 2,577 | | | | 1,296 | | | | 68 | | | | 3,993 | | | | 10,005 | | Equity affiliates | | | — | | | | 271 | | | | 46 | | | | 82 | | | | 438 | | | | 837 | |
| | | | | | | | | | | | | | | | | | | | | | | | | | | Proved developed and undeveloped reserves | | Equity & non-consolidated affiliates | | | | | | | | | | | | | | Middle
| | | | | | | | | (in billion cubic feet) | | Europe | | | Africa | | | Americas | | | East | | | Asia | | | Total | | Balance as of December 31, 2007 | | | — | | | | 140 | | | | 125 | | | | 6,382 | | | | — | | | | 6,647 | | | | | | | | | | | | | | | | | | | | | | | | | | | | | Revisions of previous estimates | | | — | | | | — | | | | (13 | ) | | | — | | | | — | | | | (13 | ) | | Extensions, discoveries and other | | | — | | | | 76 | | | | — | | | | — | | | | — | | | | 76 | | | Acquisitions of reserves in place | | | — | | | | — | | | | — | | | | — | | | | — | | | | — | | | Sales of reserves in place | | | — | | | | — | | | | — | | | | — | | | | — | | | | — | | | Production for the year | | | — | | | | (1 | ) | | | (2 | ) | | | (106 | ) | | | — | | | | (109 | ) | | | | | | | | | | | | | | | | | | | | | | | | | | | Balance as of December 31, 2008 | | | — | | | | 215 | | | | 110 | | | | 6,276 | | | | — | | | | 6,601 | | | | | | | | | | | | | | | | | | | | | | | | | | | | | Revisions of previous estimates | | | — | | | | 127 | | | | (13 | ) | | | 363 | | | | — | | | | 477 | | | Extensions, discoveries and other | | | — | | | | — | | | | — | | | | — | | | | — | | | | — | | | Acquisitions of reserves in place | | | — | | | | — | | | | — | | | | — | | | | — | | | | — | | | Sales of reserves in place | | | — | | | | — | | | | — | | | | — | | | | — | | | | — | | | Production for the year | | | — | | | | (1 | ) | | | (2 | ) | | | (141 | ) | | | — | | | | (144 | ) | | | | | | | | | | | | | | | | | | | | | | | | | | | Balance as of December 31, 2009 | | | — | | | | 341 | | | | 95 | | | | 6,498 | | | | — | | | | 6,934 | | | | | | | | | | | | | | | | | | | | | | | | | | | | | Revisions of previous estimates | | | — | | | | 50 | | | | (2 | ) | | | (52 | ) | | | — | | | | (4 | ) | | Extensions, discoveries and other | | | — | | | | — | | | | — | | | | — | | | | — | | | | — | | | Acquisitions of reserves in place | | | — | | | | — | | | | — | | | | — | | | | — | | | | — | | | Sales of reserves in place | | | — | | | | — | | | | — | | | | — | | | | — | | | | — | | | Production for the year | | | — | | | | (1 | ) | | | (2 | ) | | | (282 | ) | | | — | | | | (285 | ) | | | | | | | | | | | | | | | | | | | | | | | | | | | Balance as of December 31, 2010 | | | — | | | | 390 | | | | 91 | | | | 6,164 | | | | — | | | | 6,645 | | | | | | | | | | | | | | | | | | | | | | | | | | | |
S-10
| | | | | | | | | | | | | | | | | | | | | | | | | | | | | Consolidated subsidiaries and equity & non-consolidated affiliates | | | (in billion cubic feet) | | Europe | | | Africa | | | Americas | | | Middle East | | | Asia | | | Total | | As of December 31, 2008 | | | | | | | | | | | | | | | | | | | | | | | | | Proved developed and undeveloped reserves | | | 5,507 | | | | 5,744 | | | | 2,824 | | | | 8,045 | | | | 4,098 | | | | 26,218 | | | Consolidated subsidiaries | | | 5,507 | | | | 5,529 | | | | 2,714 | | | | 1,769 | | | | 4,098 | | | | 19,617 | | | Equity and non-consolidated affiliates | | | — | | | | 215 | | | | 110 | | | | 6,276 | | | | — | | | | 6,601 | | | | | | | | | | | | | | | | | | | | | | | | | | | | Proved developed reserves | | | 3,989 | | | | 2,292 | | | | 1,849 | | | | 2,893 | | | | 2,440 | | | | 13,463 | | | Consolidated subsidiaries | | | 3,989 | | | | 2,280 | | | | 1,807 | | | | 1,766 | | | | 2,440 | | | | 12,282 | | | Equity and non-consolidated affiliates | | | — | | | | 12 | | | | 42 | | | | 1,127 | | | | — | | | | 1,181 | | | | | | | | | | | | | | | | | | | | | | | | | | | | Proved undeveloped reserves | | | 1,518 | | | | 3,452 | | | | 975 | | | | 5,152 | | | | 1,658 | | | | 12,755 | | | Consolidated subsidiaries | | | 1,518 | | | | 3,249 | | | | 907 | | | | 3 | | | | 1,658 | | | | 7,335 | | | Equity and non-consolidated affiliates | | | — | | | | 203 | | | | 68 | | | | 5,149 | | | | — | | | | 5,420 | | | | | | | | | | | | | | | | | | | | | | | | | | | | As of December 31, 2009 | | | | | | | | | | | | | | | | | | | | | | | | | Proved developed and undeveloped reserves | | | 5,047 | | | | 5,587 | | | | 3,692 | | | | 8,526 | | | | 3,466 | | | | 26,318 | | | Consolidated subsidiaries | | | 5,047 | | | | 5,246 | | | | 3,597 | | | | 2,028 | | | | 3,466 | | | | 19,384 | | | Equity and non-consolidated affiliates | | | — | | | | 341 | | | | 95 | | | | 6,498 | | | | — | | | | 6,934 | | | | | | | | | | | | | | | | | | | | | | | | | | | | Proved developed reserves | | | 3,463 | | | | 2,272 | | | | 2,388 | | | | 6,606 | | | | 2,059 | | | | 16,788 | | | Consolidated subsidiaries | | | 3,463 | | | | 2,261 | | | | 2,343 | | | | 1,773 | | | | 2,059 | | | | 11,899 | | | Equity and non-consolidated affiliates | | | — | | | | 11 | | | | 45 | | | | 4,833 | | | | — | | | | 4,889 | | | | | | | | | | | | | | | | | | | | | | | | | | | | Proved undeveloped reserves | | | 1,584 | | | | 3,315 | | | | 1,304 | | | | 1,920 | | | | 1,407 | | | | 9,530 | | | Consolidated subsidiaries | | | 1,584 | | | | 2,985 | | | | 1,254 | | | | 255 | | | | 1,407 | | | | 7,485 | | | Equity and non-consolidated affiliates | | | — | | | | 330 | | | | 50 | | | | 1,665 | | | | — | | | | 2,045 | | | | | | | | | | | | | | | | | | | | | | | | | | | | As of December 31, 2010 | | | | | | | | | | | | | | | | | | | | | | | | | Proved developed and undeveloped reserves | | | 4,962 | | | | 5,704 | | | | 3,897 | | | | 8,031 | | | | 3,194 | | | | 25,788 | | | Consolidated subsidiaries | | | 4,962 | | | | 5,314 | | | | 3,806 | | | | 1,867 | | | | 3,194 | | | | 19,143 | | | Equity and non-consolidated affiliates | | | — | | | | 390 | | | | 91 | | | | 6,164 | | | | — | | | | 6,645 | | | | | | | | | | | | | | | | | | | | | | | | | | | | Proved developed reserves | | | 3,089 | | | | 2,240 | | | | 2,474 | | | | 7,649 | | | | 1,790 | | | | 17,242 | | | Consolidated subsidiaries | | | 3,089 | | | | 2,229 | | | | 2,439 | | | | 1,578 | | | | 1,790 | | | | 11,125 | | | Equity and non-consolidated affiliates | | | — | | | | 11 | | | | 35 | | | �� | 6,071 | | | | — | | | | 6,117 | | | | | | | | | | | | | | | | | | | | | | | | | | | | Proved undeveloped reserves | | | 1,873 | | | | 3,464 | | | | 1,423 | | | | 382 | | | | 1,404 | | | | 8,546 | | | Consolidated subsidiaries | | | 1,873 | | | | 3,085 | | | | 1,367 | | | | 289 | | | | 1,404 | | | | 8,018 | | | Equity and non-consolidated affiliates | | | — | | | | 379 | | | | 56 | | | | 93 | | | | — | | | | 528 | | | | | | | | | | | | | | | | | | | | | | | | | | | |
S-11
RESULTS OF OPERATIONS FOR OIL AND GAS PRODUCING ACTIVITIES The following tables do not include revenues and expenses related to oil and gas transportation activities and LNG liquefaction and transportation activities. | | | | | | | | | | | | | | | | | | | | | | | | | | | | | Consolidated subsidiaries | | | | | | | | | | | | | | Middle
| | | | | | | | | (in million euros) | | Europe | | | Africa | | | Americas | | | East | | | Asia | | | Total | | 2008 | | | | | | | | | | | | | | | | | | | | | | | | | | Non-Group sales | | | 4,521 | | | | 2,930 | | | | 707 | | | | 1,558 | | | | 2,819 | | | | 12,535 | | | Group sales | | | 6,310 | | | | 11,425 | | | | 360 | | | | 409 | | | | 626 | | | | 19,130 | | Total Revenues | | | 10,831 | | | | 14,355 | | | | 1,067 | | | | 1,967 | | | | 3,445 | | | | 31,665 | | | Production costs | | | (1,280 | ) | | | (1,055 | ) | | | (213 | ) | | | (249 | ) | | | (263 | ) | | | (3,060 | ) | | Exploration expenses | | | (185 | ) | | | (209 | ) | | | (130 | ) | | | (4 | ) | | | (236 | ) | | | (764 | ) | | Depreciation, depletion and amortization and valuation allowances | | | (1,266 | ) | | | (1,195 | ) | | | (318 | ) | | | (364 | ) | | | (471 | ) | | | (3,614 | ) | Other expenses(a) | | | (260 | ) | | | (1,214 | ) | | | (225 | ) | | | (357 | ) | | | (60 | ) | | | (2,116 | ) | Pre-tax income from producing activities | | | 7,840 | | | | 10,682 | | | | 181 | | | | 993 | | | | 2,415 | | | | 22,111 | | | Income tax | | | (5,376 | ) | | | (7,160 | ) | | | (109 | ) | | | (481 | ) | | | (1,212 | ) | | | (14,338 | ) | Results of oil and gas producing activities | | | 2,464 | | | | 3,522 | | | | 72 | | | | 512 | | | | 1,203 | | | | 7,773 | | | | | | | | | | | | | | | | | | | | | | | | | | | | 2009 | | | | | | | | | | | | | | | | | | | | | | | | | | Non-Group sales | | | 2,499 | | | | 1,994 | | | | 583 | | | | 859 | | | | 1,926 | | | | 7,861 | | | Group sales | | | 4,728 | | | | 7,423 | | | | 310 | | | | 556 | | | | 597 | | | | 13,614 | | Total Revenues | | | 7,227 | | | | 9,417 | | | | 893 | | | | 1,415 | | | | 2,523 | | | | 21,475 | | | Production costs | | | (1,155 | ) | | | (1,122 | ) | | | (193 | ) | | | (204 | ) | | | (243 | ) | | | (2,917 | ) | | Exploration expenses | | | (160 | ) | | | (265 | ) | | | (121 | ) | | | (81 | ) | | | (70 | ) | | | (697 | ) | | Depreciation, depletion and amortization and valuation allowances | | | (1,489 | ) | | | (1,471 | ) | | | (262 | ) | | | (314 | ) | | | (613 | ) | | | (4,149 | ) | Other expenses(a) | | | (261 | ) | | | (895 | ) | | | (181 | ) | | | (170 | ) | | | (56 | ) | | | (1,563 | ) | Pre-tax income from producing activities | | | 4,162 | | | | 5,664 | | | | 136 | | | | 646 | | | | 1,541 | | | | 12,149 | | | Income tax | | | (2,948 | ) | | | (3,427 | ) | | | (103 | ) | | | (309 | ) | | | (747 | ) | | | (7,534 | ) | Results of oil and gas producing activities | | | 1,214 | | | | 2,237 | | | | 33 | | | | 337 | | | | 794 | | | | 4,615 | | | | | | | | | | | | | | | | | | | | | | | | | | | | 2010 | | | | | | | | | | | | | | | | | | | | | | | | | | Non-Group sales | | | 2,839 | | | | 2,639 | | | | 628 | | | | 1,038 | | | | 2,540 | | | | 9,684 | | | Group sales | | | 5,599 | | | | 9,894 | | | | 540 | | | | 644 | | | | 683 | | | | 17,360 | | | | | | | | | | | | | | | | | | | | | | | | | | | | Total Revenues | | | 8,438 | | | | 12,533 | | | | 1,168 | | | | 1,682 | | | | 3,223 | | | | 27,044 | | | | | | | | | | | | | | | | | | | | | | | | | | | | | Production costs | | | (1,281 | ) | | | (1,187 | ) | | | (222 | ) | | | (259 | ) | | | (279 | ) | | | (3,228 | ) | | Exploration expenses | | | (266 | ) | | | (275 | ) | | | (216 | ) | | | (8 | ) | | | (99 | ) | | | (864 | ) | | Depreciation, depletion and amortization and valuation allowances | | | (1,404 | ) | | | (1,848 | ) | | | (368 | ) | | | (264 | ) | | | (830 | ) | | | (4,714 | ) | Other expenses(a) | | | (299 | ) | | | (1,014 | ) | | | (218 | ) | | | (241 | ) | | | (72 | ) | | | (1,844 | ) | | | | | | | | | | | | | | | | | | | | | | | | | | | Pre-tax income from producing activities | | | 5,188 | | | | 8,209 | | | | 144 | | | | 910 | | | | 1,943 | | | | 16,394 | | | | | | | | | | | | | | | | | | | | | | | | | | | | | Income tax | | | (3,237 | ) | | | (5,068 | ) | | | (83 | ) | | | (402 | ) | | | (950 | ) | | | (9,740 | ) | | | | | | | | | | | | | | | | | | | | | | | | | | | Results of oil and gas producing activities | | | 1,951 | | | | 3,141 | | | | 61 | | | | 508 | | | | 993 | | | | 6,654 | | | | | | | | | | | | | | | | | | | | | | | | | | | |
| | | | | | | | | | | | | | | | | | | | | | | | | | | | Consolidated subsidiaries | | (M€) | | Europe | | | Africa | | | Americas | | | Middle
East | | | Asia | | | Total | | 2009 | | | | | | | | | | | | | | | | | | | | | | | | | Non-Group sales | | | 2,499 | | | | 1,994 | | | | 583 | | | | 859 | | | | 1,926 | | | | 7,861 | | | Group sales | | | 4,728 | | | | 7,423 | | | | 310 | | | | 556 | | | | 597 | | | | 13,614 | | Total Revenues | | | 7,227 | | | | 9,417 | | | | 893 | | | | 1,415 | | | | 2,523 | | | | 21,475 | | Production costs | | | (1,155 | ) | | | (1,122 | ) | | | (193 | ) | | | (204 | ) | | | (243 | ) | | | (2,917 | ) | Exploration expenses | | | (160 | ) | | | (265 | ) | | | (121 | ) | | | (81 | ) | | | (70 | ) | | | (697 | ) | Depreciation, depletion and amortization and valuation allowances | | | (1,489 | ) | | | (1,471 | ) | | | (262 | ) | | | (314 | ) | | | (613 | ) | | | (4,149 | ) | Other expenses(a) | | | (261 | ) | | | (895 | ) | | | (181 | ) | | | (170 | ) | | | (56 | ) | | | (1,563 | ) | Pre-tax income from producing activities | | | 4,162 | | | | 5,664 | | | | 136 | | | | 646 | | | | 1,541 | | | | 12,149 | | Income tax | | | (2,948 | ) | | | (3,427 | ) | | | (103 | ) | | | (309 | ) | | | (747 | ) | | | (7,534 | ) | Results of oil and gas producing activities | | | 1,214 | | | | 2,237 | | | | 33 | | | | 337 | | | | 794 | | | | 4,615 | | 2010 | | | | | | | | | | | | | | | | | | | | | | | | | | Non-Group sales | | | 2,839 | | | | 2,639 | | | | 628 | | | | 1,038 | | | | 2,540 | | | | 9,684 | | | Group sales | | | 5,599 | | | | 9,894 | | | | 540 | | | | 644 | | | | 683 | | | | 17,360 | | Total Revenues | | | 8,438 | | | | 12,533 | | | | 1,168 | | | | 1,682 | | | | 3,223 | | | | 27,044 | | Production costs | | | (1,281 | ) | | | (1,187 | ) | | | (222 | ) | | | (259 | ) | | | (279 | ) | | | (3,228 | ) | Exploration expenses | | | (266 | ) | | | (275 | ) | | | (216 | ) | | | (8 | ) | | | (99 | ) | | | (864 | ) | Depreciation, depletion and amortization and valuation allowances | | | (1,404 | ) | | | (1,848 | ) | | | (368 | ) | | | (264 | ) | | | (830 | ) | | | (4,714 | ) | Other expenses(a) | | | (299 | ) | | | (1,014 | ) | | | (218 | ) | | | (241 | ) | | | (72 | ) | | | (1,844 | ) | Pre-tax income from producing activities | | | 5,188 | | | | 8,209 | | | | 144 | | | | 910 | | | | 1,943 | | | | 16,394 | | Income tax | | | (3,237 | ) | | | (5,068 | ) | | | (83 | ) | | | (402 | ) | | | (950 | ) | | | (9,740 | ) | Results of oil and gas producing activities | | | 1,951 | | | | 3,141 | | | | 61 | | | | 508 | | | | 993 | | | | 6,654 | | 2011 | | | | | | | | | | | | | | | | | | | | | | | | | | Non-Group sales | | | 3,116 | | | | 3,188 | | | | 776 | | | | 1,159 | | | | 3,201 | | | | 11,440 | | | Group sales | | | 7,057 | | | | 11,365 | | | | 764 | | | | 737 | | | | 712 | | | | 20,635 | | Total Revenues | | | 10,173 | | | | 14,553 | | | | 1,540 | | | | 1,896 | | | | 3,913 | | | | 32,075 | | Production costs | | | (1,235 | ) | | | (1,179 | ) | | | (250 | ) | | | (286 | ) | | | (304 | ) | | | (3,254 | ) | Exploration expenses | | | (343 | ) | | | (323 | ) | | | (48 | ) | | | (11 | ) | | | (294 | ) | | | (1,019 | ) | Depreciation, depletion and amortization and valuation allowances | | | (1,336 | ) | | | (1,845 | ) | | | (352 | ) | | | (278 | ) | | | (791 | ) | | | (4,602 | ) | Other expenses(a) | | | (307 | ) | | | (1,181 | ) | | | (274 | ) | | | (276 | ) | | | (95 | ) | | | (2,133 | ) | Pre-tax income from producing activities | | | 6,952 | | | | 10,025 | | | | 616 | | | | 1,045 | | | | 2,429 | | | | 21,067 | | Income tax | | | (5,059 | ) | | | (6,484 | ) | | | (293 | ) | | | (465 | ) | | | (1,302 | ) | | | (13,603 | ) | Results of oil and gas producing activities | | | 1,893 | | | | 3,541 | | | | 323 | | | | 580 | | | | 1,127 | | | | 7,464 | |
| (a) | | | (a) | | Included production taxes and accretion expense as provided for by IAS 37 (€223(€271 million in 2008, €2712009,€326 million in 20092010 and €326€338 million in 2010)2011). |
S-12
| | | | | | | | | | | | | | | | | | | | | | | | | | | | Equity affiliates | | (M€) | | Europe | | | Africa | | | Americas | | | Middle
East | | | Asia | | | Total | | 2009 | | | | | | | | | | | | | | | | | | | | | | | | | Non-Group sales | | | — | | | | 203 | | | | 528 | | | | 231 | | | | — | | | | 962 | | | Group sales | | | — | | | | — | | | | — | | | | 3,382 | | | | — | | | | 3,382 | | Total Revenues | | | — | | | | 203 | | | | 528 | | | | 3,613 | | | | — | | | | 4,344 | | Production costs | | | — | | | | (31 | ) | | | (41 | ) | | | (271 | ) | | | — | | | | (343 | ) | Exploration expenses | | | — | | | | — | | | | (17 | ) | | | — | | | | — | | | | (17 | ) | Depreciation, depletion and amortization and valuation allowances | | | — | | | | (42 | ) | | | (73 | ) | | | (247 | ) | | | — | | | | (362 | ) | Other expenses | | | — | | | | (9 | ) | | | (205 | ) | | | (2,800 | ) | | | — | | | | (3,014 | ) | Pre-tax income from producing activities | | | — | | | | 121 | | | | 192 | | | | 295 | | | | — | | | | 608 | | Income tax | | | — | | | | (93 | ) | | | (74 | ) | | | (101 | ) | | | — | | | | (268 | ) | Results of oil and gas producing activities | | | — | | | | 28 | | | | 118 | | | | 194 | | | | — | | | | 340 | | 2010 | | | | | | | | | | | | | | | | | | | | | | | | | | Non-Group sales | | | — | | | | 148 | | | | 120 | | | | 596 | | | | — | | | | 864 | | Group sales | | | — | | | | 3 | | | | 565 | | | | 4,646 | | | | — | | | | 5,214 | | Total Revenues | | | — | | | | 151 | | | | 685 | | | | 5,242 | | | | — | | | | 6,078 | | Production costs | | | — | | | | (44 | ) | | | (53 | ) | | | (195 | ) | | | (1 | ) | | | (293 | ) | Exploration expenses | | | — | | | | (7 | ) | | | (23 | ) | | | — | | | | — | | | | (30 | ) | Depreciation, depletion and amortization and valuation allowances | | | — | | | | (44 | ) | | | (89 | ) | | | (259 | ) | | | — | | | | (392 | ) | Other expenses | | | — | | | | — | | | | (268 | ) | | | (4,034 | ) | | | — | | | | (4,302 | ) | Pre-tax income from producing activities | | | — | | | | 56 | | | | 252 | | | | 754 | | | | (1 | ) | | | 1,061 | | Income tax | | | — | | | | — | | | | (44 | ) | | | (142 | ) | | | — | | | | (186 | ) | Results of oil and gas producing activities | | | — | | | | 56 | | | | 208 | | | | 612 | | | | (1 | ) | | | 875 | | 2011 | | | | | | | | | | | | | | | | | | | | | | | | | Non-Group sales | | | — | | | | 26 | | | | 15 | | | | 1,080 | | | | 256 | | | | 1,377 | | Group sales | | | — | | | | — | | | | 831 | | | | 6,804 | | | | — | | | | 7,635 | | Total Revenues | | | — | | | | 26 | | | | 846 | | | | 7,884 | | | | 256 | | | | 9,012 | | Production costs | | | — | | | | (7 | ) | | | (48 | ) | | | (250 | ) | | | (28 | ) | | | (333 | ) | Exploration expenses | | | — | | | | — | | | | — | | | | — | | | | (4 | ) | | | (4 | ) | Depreciation, depletion and amortization and valuation allowances | | | — | | | | (7 | ) | | | (44 | ) | | | (225 | ) | | | (109 | ) | | | (385 | ) | Other expenses | | | — | | | | — | | | | (550 | ) | | | (6,101 | ) | | | (36 | ) | | | (6,687 | ) | Pre-tax income from producing activities | | | — | | | | 12 | | | | 204 | | | | 1,308 | | | | 79 | | | | 1,603 | | Income tax | | | — | | | | — | | | | (95 | ) | | | (285 | ) | | | (34 | ) | | | (414 | ) | Results of oil and gas producing activities | | | — | | | | 12 | | | | 109 | | | | 1,023 | | | | 45 | | | | 1,189 | |
COST INCURRED | | | | | | | | | | | | | | | | | | | | | | | | | | | | | Equity affiliates | | | | | | | | | | | | | | Middle
| | | | | | | | | (in million euros) | | Europe | | | Africa | | | Americas | | | East | | | Asia | | | Total | | Group’s share of results of oil and gas producing activities | | | | | | | | | | | | | | | | | | | | | | | | | | 2008 | | | — | | | | 49 | | | | 245 | | | | 287 | | | | — | | | | 581 | | | | | | | | | | | | | | | | | | | | | | | | | | | | 2009 | | | | | | | | | | | | | | | | | | | | | | | | | | | | | | | | | | | | | | | | | | | | | | | | | | | | Non-Group sales | | | — | | | | 203 | | | | 528 | | | | 231 | | | | — | | | | 962 | | | Group sales | | | — | | | | — | | | | — | | | | 3,382 | | | | — | | | | 3,382 | | Total Revenues | | | — | | | | 203 | | | | 528 | | | | 3,613 | | | | — | | | | 4,344 | | | Production costs | | | — | | | | (31 | ) | | | (41 | ) | | | (271 | ) | | | — | | | | (343 | ) | | Exploration expenses | | | — | | | | — | | | | (17 | ) | | | — | | | | — | | | | (17 | ) | | Depreciation, depletion and amortization and valuation allowances | | | — | | | | (42 | ) | | | (73 | ) | | | (247 | ) | | | — | | | | (362 | ) | | Other expenses | | | — | | | | (9 | ) | | | (205 | ) | | | (2,800 | ) | | | — | | | | (3,014 | ) | Pre-tax income from producing activities | | | — | | | | 121 | | | | 192 | | | | 295 | | | | — | | | | 608 | | | Income tax | | | — | | | | (93 | ) | | | (74 | ) | | | (101 | ) | | | — | | | | (268 | ) | Results of oil and gas producing activities | | | — | | | | 28 | | | | 118 | | | | 194 | | | | — | | | | 340 | | | | | | | | | | | | | | | | | | | | | | | | | | | | 2010 | | | | | | | | | | | | | | | | | | | | | | | | | | | | | | | | | | | | | | | | | | | | | | | | | | | | Non-Group sales | | | — | | | | 148 | | | | 120 | | | | 596 | | | | — | | | | 864 | | | Group sales | | | — | | | | 3 | | | | 565 | | | | 4,646 | | | | — | | | | 5,214 | | | | | | | | | | | | | | | | | | | | | | | | | | | | Total Revenues | | | — | | | | 151 | | | | 685 | | | | 5,242 | | | | — | | | | 6,078 | | | | | | | | | | | | | | | | | | | | | | | | | | | | | Production costs | | | — | | | | (44 | ) | | | (53 | ) | | | (195 | ) | | | (1 | ) | | | (293 | ) | | Exploration expenses | | | — | | | | (7 | ) | | | (23 | ) | | | — | | | | — | | | | (30 | ) | | Depreciation, depletion and amortization and valuation allowances | | | — | | | | (44 | ) | | | (89 | ) | | | (259 | ) | | | — | | | | (392 | ) | | Other expenses | | | — | | | | — | | | | (268 | ) | | | (4,034 | ) | | | — | | | | (4,302 | ) | | | | | | | | | | | | | | | | | | | | | | | | | | | Pre-tax income from producing activities | | | — | | | | 56 | | | | 252 | | | | 754 | | | | (1 | ) | | | 1,061 | | | | | | | | | | | | | | | | | | | | | | | | | | | | | Income tax | | | — | | | | — | | | | (44 | ) | | | (142 | ) | | | — | | | | (186 | ) | | | | | | | | | | | | | | | | | | | | | | | | | | | Results of oil and gas producing activities | | | — | | | | 56 | | | | 208 | | | | 612 | | | | (1 | ) | | | 875 | | | | | | | | | | | | | | | | | | | | | | | | | | | |
S-13
COSTS INCURRED IN OIL AND GAS PROPERTY ACQUISITION, EXPLORATION AND DEVELOPMENT
The following tables set forth the costs incurred in the Group’s oil and gas property acquisition, exploration and development activities, including both capitalized and expensed amounts. They do not include costs incurred related to oil and gas transportation and LNG liquefaction and transportation activities. | | | | | | | | | | | | | | | | | | | | | | | | | | | | | Consolidated subsidiaries | | | | | | | | | | | | | | Middle
| | | | | | | | | (in million euros) | | Europe | | | Africa | | | Americas | | | East | | | Asia | | | Total | | 2008 | | | | | | | | | | | | | | | | | | | | | | | | | | Proved property acquisition | | | 269 | | | | 78 | | | | — | | | | 8 | | | | 18 | | | | 373 | | | Unproved property acquisition | | | 24 | | | | 143 | | | | 22 | | | | 5 | | | | 3 | | | | 197 | | | Exploration costs | | | 228 | | | | 493 | | | | 155 | | | | 11 | | | | 312 | | | | 1,199 | | Development costs(a) | | | 2,035 | | | | 3,121 | | | | 408 | | | | 281 | | | | 1,596 | | | | 7,441 | | Total cost incurred | | | 2,556 | | | | 3,835 | | | | 585 | | | | 305 | | | | 1,929 | | | | 9,210 | | 2009 | | | | | | | | | | | | | | | | | | | | | | | | | | Proved property acquisition | | | 71 | | | | 45 | | | | 1,551 | | | | 105 | | | | — | | | | 1,772 | | | Unproved property acquisition | | | 26 | | | | 8 | | | | 403 | | | | — | | | | 21 | | | | 458 | | | Exploration costs | | | 284 | | | | 475 | | | | 222 | | | | 87 | | | | 123 | | | | 1,191 | | Development costs(a) | | | 1,658 | | | | 3,288 | | | | 618 | | | | 250 | | | | 1,852 | | | | 7,666 | | Total cost incurred | | | 2,039 | | | | 3,816 | | | | 2,794 | | | | 442 | | | | 1,996 | | | | 11,087 | | 2010 | | | | | | | | | | | | | | | | | | | | | | | | | | Proved property acquisition | | | 162 | | | | 137 | | | | 26 | | | | 139 | | | | 21 | | | | 485 | | | Unproved property acquisition | | | 5 | | | | 124 | | | | 1,186 | | | | 8 | | | | 619 | | | | 1,942 | | | Exploration costs | | | 361 | | | | 407 | | | | 276 | | | | 17 | | | | 250 | | | | 1,311 | | Development costs(a) | | | 1,565 | | | | 3,105 | | | | 718 | | | | 247 | | | | 2,007 | | | | 7,642 | | | | | | | | | | | | | | | | | | | | | | | | | | | | Total cost incurred | | | 2,093 | | | | 3,773 | | | | 2,206 | | | | 411 | | | | 2,897 | | | | 11,380 | | | | | | | | | | | | | | | | | | | | | | | | | | | |
| | | | | | | | | | | | | | | | | | | | | | | | | | | Group’s share of costs of property acquisition, exploration and development | | Equity affiliates | | | | | | | | | | | | | | Middle
| | | | | | | | | (in million euros) | | Europe | | | Africa | | | Americas | | | East | | | Asia | | | Total | | 2008 | | | — | | | | 360 | | | | 85 | | | | 527 | | | | — | | | | 972 | | | | | | | | | | | | | | | | | | | | | | | | | | | | 2009 | | | | | | | | | | | | | | | | | | | | | | | | | | Proved property acquisition | | | — | | | | — | | | | — | | | | — | | | | — | | | | — | | | Unproved property acquisition | | | — | | | | — | | | | — | | | | — | | | | — | | | | — | | | Exploration costs | | | — | | | | — | | | | 22 | | | | 3 | | | | — | | | | 25 | | Development costs(a) | | | — | | | | 28 | | | | 93 | | | | 293 | | | | 23 | | | | 437 | | Total cost incurred | | | — | | | | 28 | | | | 115 | | | | 296 | | | | 23 | | | | 462 | | 2010 | | | | | | | | | | | | | | | | | | | | | | | | | | Proved property acquisition | | | — | | | | — | | | | — | | | | — | | | | — | | | | — | | | Unproved property acquisition | | | — | | | | — | | | | — | | | | — | | | | — | | | | — | | | Exploration costs | | | — | | | | 4 | | | | 30 | | | | 4 | | | | — | | | | 38 | | Development costs(a) | | | — | | | | 20 | | | | 99 | | | | 476 | | | | 73 | | | | 668 | | | | | | | | | | | | | | | | | | | | | | | | | | | | Total cost incurred | | | — | | | | 24 | | | | 129 | | | | 480 | | | | 73 | | | | 706 | | | | | | | | | | | | | | | | | | | | | | | | | | | |
| | | | | | | | | | | | | | | | | | | | | | | | | | | | Consolidated subsidiaries | | (M€) | | Europe | | | Africa | | | Americas | | | Middle
East | | | Asia | | | Total | | 2009 | | | | | | | | | | | | | | | | | | | | | | | | | Proved property acquisition | | | 71 | | | | 45 | | | | 1,551 | | | | 105 | | | | — | | | | 1,772 | | Unproved property acquisition | | | 26 | | | | 8 | | | | 403 | | | | — | | | | 21 | | | | 458 | | Exploration costs | | | 284 | | | | 475 | | | | 222 | | | | 87 | | | | 123 | | | | 1,191 | | Development costs(a) | | | 1,658 | | | | 3,288 | | | | 618 | | | | 250 | | | | 1,852 | | | | 7,666 | | Total cost incurred | | | 2,039 | | | | 3,816 | | | | 2,794 | | | | 442 | | | | 1,996 | | | | 11,087 | | 2010 | | | | | | | | | | | | | | | | | | | | | | | | | Proved property acquisition | | | 162 | | | | 137 | | | | 26 | | | | 139 | | | | 21 | | | | 485 | | Unproved property acquisition | | | 5 | | | | 124 | | | | 1,186 | | | | 8 | | | | 619 | | | | 1,942 | | Exploration costs | | | 361 | | | | 407 | | | | 276 | | | | 17 | | | | 250 | | | | 1,311 | | Development costs(a) | | | 1,565 | | | | 3,105 | | | | 718 | | | | 247 | | | | 2,007 | | | | 7,642 | | Total cost incurred | | | 2,093 | | | | 3,773 | | | | 2,206 | | | | 411 | | | | 2,897 | | | | 11,380 | | 2011 | | | | | | | | | | | | | | | | | | | | | | | | | Proved property acquisition | | | 298 | | | | 10 | | | | 413 | | | | 2 | | | | 251 | | | | 974 | | Unproved property acquisition | | | 1 | | | | 397 | | | | 1,692 | | | | 3 | | | | 14 | | | | 2,107 | | Exploration costs | | | 505 | | | | 384 | | | | 239 | | | | 17 | | | | 417 | | | | 1,562 | | Development costs(a) | | | 2,352 | | | | 3,895 | | | | 1,329 | | | | 329 | | | | 2,823 | | | | 10,728 | | Total cost incurred | | | 3,156 | | | | 4,686 | | | | 3,673 | | | | 351 | | | | 3,505 | | | | 15,371 | |
| | | | | | | | | | | | | | | | | | | | | | | | | | | | Equity affiliates | | (M€) | | Europe | | | Africa | | | Americas | | | Middle
East | | | Asia | | | Total | | 2009 | | | | | | | | | | | | | | | | | | | | | | | | | Proved property acquisition | | | — | | | | — | | | | — | | | | — | | | | — | | | | — | | Unproved property acquisition | | | — | | | | — | | | | — | | | | — | | | | — | | | | — | | Exploration costs | | | — | | | | — | | | | 22 | | | | 3 | | | | — | | | | 25 | | Development costs(a) | | | — | | | | 28 | | | | 93 | | | | 293 | | | | 23 | | | | 437 | | Total cost incurred | | | — | | | | 28 | | | | 115 | | | | 296 | | | | 23 | | | | 462 | | 2010 | | | | | | | | | | | | | | | | | | | | | | | | | Proved property acquisition | | | — | | | | — | | | | — | | | | — | | | | — | | | | — | | Unproved property acquisition | | | — | | | | — | | | | — | | | | — | | | | — | | | | — | | Exploration costs | | | — | | | | 4 | | | | 30 | | | | 4 | | | | — | | | | 38 | | Development costs(a) | | | — | | | | 20 | | | | 99 | | | | 476 | | | | 73 | | | | 668 | | Total cost incurred | | | — | | | | 24 | | | | 129 | | | | 480 | | | | 73 | | | | 706 | | 2011 | | | | | | | | | | | | | | | | | | | | | | | | | Proved property acquisition | | | — | | | | — | | | | — | | | | — | | | | 2,691 | | | | 2,691 | | Unproved property acquisition | | | — | | | | — | | | | — | | | | — | | | | 1,116 | | | | 1,116 | | Exploration costs | | | — | | | | — | | | | 2 | | | | — | | | | — | | | | 2 | �� | Development costs(a) | | | — | | | | 2 | | | | 106 | | | | 314 | | | | 939 | | | | 1,361 | | Total cost incurred | | | — | | | | 2 | | | | 108 | | | | 314 | | | | 4,746 | | | | 5,170 | |
| (a) | | | (a) | | Including asset retirement costs capitalized during the year and any gains or losses recognized upon settlement of asset retirement obligation during the year. |
S-14
CAPITALIZED COSTS RELATED TO OIL AND GAS PRODUCING ACTIVITIES The following tables do not include capitalized costs related to oil and gas transportation and LNG liquefaction and transportation activities. | | | | | | | | | | | | | | | | | | | | | | | | | | | | | Consolidated subsidiaries | | | | | | | | | | | | | | Middle
| | | | | | | | | (in million euros) | | Europe | | | Africa | | | Americas | | | East | | | Asia | | | Total | | As of December 31, 2008 | | | | | | | | | | | | | | | | | | | | | | | | | | Proved properties | | | 26,030 | | | | 25,136 | | | | 4,508 | | | | 4,824 | | | | 8,836 | | | | 69,334 | | | Unproved properties | | | 132 | | | | 1,145 | | | | 204 | | | | 25 | | | | 410 | | | | 1,916 | | Total capitalized costs | | | 26,162 | | | | 26,281 | | | | 4,712 | | | | 4,849 | | | | 9,246 | | | | 71,250 | | | Accumulated depreciation, depletion and amortization | | | (18,382 | ) | | | (12,339 | ) | | | (2,051 | ) | | | (3,420 | ) | | | (2,598 | ) | | | (38,790 | ) | Net capitalized costs | | | 7,780 | | | | 13,942 | | | | 2,661 | | | | 1,429 | | | | 6,648 | | | | 32,460 | | | | | | | | | | | | | | | | | | | | | | | | | | | | As of December 31, 2009 | | | | | | | | | | | | | | | | | | | | | | | | | | Proved properties | | | 30,613 | | | | 27,557 | | | | 7,123 | | | | 5,148 | | | | 10,102 | | | | 80,543 | | | Unproved properties | | | 337 | | | | 1,138 | | | | 839 | | | | 30 | | | | 555 | | | | 2,899 | | Total capitalized costs | | | 30,950 | | | | 28,695 | | | | 7,962 | | | | 5,178 | | | | 10,657 | | | | 83,442 | | | Accumulated depreciation, depletion and amortization | | | (21,870 | ) | | | (13,510 | ) | | | (2,214 | ) | | | (3,325 | ) | | | (3,085 | ) | | | (44,004 | ) | Net capitalized costs | | | 9,080 | | | | 15,185 | | | | 5,748 | | | | 1,853 | | | | 7,572 | | | | 39,438 | | | | | | | | | | | | | | | | | | | | | | | | | | | | As of December 31, 2010 | | | | | | | | | | | | | | | | | | | | | | | | | | Proved properties | | | 31,735 | | | | 32,494 | | | | 7,588 | | | | 5,715 | | | | 12,750 | | | | 90,282 | | | Unproved properties | | | 402 | | | | 1,458 | | | | 2,142 | | | | 49 | | | | 1,433 | | | | 5,484 | | Total capitalized costs | | | 32,137 | | | | 33,952 | | | | 9,730 | | | | 5,764 | | | | 14,183 | | | | 95,766 | | | Accumulated depreciation, depletion and amortization | | | (23,006 | ) | | | (16,716 | ) | | | (2,302 | ) | | | (3,849 | ) | | | (4,092 | ) | | | (49,965 | ) | | | | | | | | | | | | | | | | | | | | | | | | | | | Net capitalized costs | | | 9,131 | | | | 17,236 | | | | 7,428 | | | | 1,915 | | | | 10,091 | | | | 45,801 | | | | | | | | | | | | | | | | | | | | | | | | | | | |
| | | | | | | | | | | | | | | | | | | | | | | | | | | Group’s share of net capitalized costs | | Equity affiliates | | | | | | | | | | | | | | Middle
| | | | | | | | | (in million euros) | | Europe | | | Africa | | | Americas | | | East | | | Asia | | | Total | | | As of December 31, 2008 | | | — | | | | 403 | | | | 288 | | | | 638 | | | | — | | | | 1,329 | | | | | | | | | | | | | | | | | | | | | | | | | | | | As of December 31, 2009 | | | | | | | | | | | | | | | | | | | | | | | | | | Proved properties | | | — | | | | 610 | | | | 726 | | | | 2,404 | | | | — | | | | 3,740 | | | Unproved properties | | | — | | | | — | | | | 135 | | | | — | | | | 62 | | | | 197 | | Total capitalized costs | | | — | | | | 610 | | | | 861 | | | | 2,404 | | | | 62 | | | | 3,937 | | | Accumulated depreciation, depletion and amortization | | | — | | | | (387 | ) | | | (171 | ) | | | (1,723 | ) | | | — | | | | (2,281 | ) | Net capitalized costs | | | — | | | | 223 | | | | 690 | | | | 681 | | | | 62 | | | | 1,656 | | | | | | | | | | | | | | | | | | | | | | | | | | | | As of December 31, 2010 | | | | | | | | | | | | | | | | | | | | | | | | | | Proved properties | | | — | | | | 639 | | | | 887 | | | | 3,110 | | | | — | | | | 4,636 | | | Unproved properties | | | — | | | | 25 | | | | 168 | | | | — | | | | 138 | | | | 331 | | Total capitalized costs | | | — | | | | 664 | | | | 1,055 | | | | 3,110 | | | | 138 | | | | 4,967 | | | Accumulated depreciation, depletion and amortization | | | — | | | | (462 | ) | | | (307 | ) | | | (2,029 | ) | | | — | | | | (2,798 | ) | | | | | | | | | | | | | | | | | | | | | | | | | | | Net capitalized costs | | | — | | | | 202 | | | | 748 | | | | 1,081 | | | | 138 | | | | 2,169 | | | | | | | | | | | | | | | | | | | | | | | | | | | |
S-15
| | | | | | | | | | | | | | | | | | | | | | | | | | | | Consolidated subsidiaries | | (M€) | | Europe | | | Africa | | | Americas | | | Middle
East | | | Asia | | | Total | | | As of December 31, 2009 | | | | | | | | | | | | | | | | | | | | | | | | | Proved properties | | | 30,613 | | | | 27,557 | | | | 7,123 | | | | 5,148 | | | | 10,102 | | | | 80,543 | | Unproved properties | | | 337 | | | | 1,138 | | | | 839 | | | | 30 | | | | 555 | | | | 2,899 | | Total capitalized costs | | | 30,950 | | | | 28,695 | | | | 7,962 | | | | 5,178 | | | | 10,657 | | | | 83,442 | | Accumulated depreciation, depletion and amortization | | | (21,870 | ) | | | (13,510 | ) | | | (2,214 | ) | | | (3,325 | ) | | | (3,085 | ) | | | (44,004 | ) | Net capitalized costs | | | 9,080 | | | | 15,185 | | | | 5,748 | | | | 1,853 | | | | 7,572 | | | | 39,438 | | As of December 31, 2010 | | | | | | | | | | | | | | | | | | | | | | | | | Proved properties | | | 31,735 | | | | 32,494 | | | | 7,588 | | | | 5,715 | | | | 12,750 | | | | 90,282 | | Unproved properties | | | 402 | | | | 1,458 | | | | 2,142 | | | | 49 | | | | 1,433 | | | | 5,484 | | Total capitalized costs | | | 32,137 | | | | 33,952 | | | | 9,730 | | | | 5,764 | | | | 14,183 | | | | 95,766 | | Accumulated depreciation, depletion and amortization | | | (23,006 | ) | | | (16,716 | ) | | | (2,302 | ) | | | (3,849 | ) | | | (4,092 | ) | | | (49,965 | ) | Net capitalized costs | | | 9,131 | | | | 17,236 | | | | 7,428 | | | | 1,915 | | | | 10,091 | | | | 45,801 | | As of December 31, 2011 | | | | | | | | | | | | | | | | | | | | | | | | | Proved properties | | | 34,308 | | | | 37,032 | | | | 8,812 | | | | 6,229 | | | | 17,079 | | | | 103,460 | | Unproved properties | | | 460 | | | | 1,962 | | | | 4,179 | | | | 62 | | | | 911 | | | | 7,574 | | Total capitalized costs | | | 34,768 | | | | 38,994 | | | | 12,991 | | | | 6,291 | | | | 17,990 | | | | 111,034 | | Accumulated depreciation, depletion and amortization | | | (24,047 | ) | | | (18,642 | ) | | | (2,294 | ) | | | (4,274 | ) | | | (5,066 | ) | | | (54,323 | ) | Net capitalized costs | | | 10,721 | | | | 20,352 | | | | 10,697 | | | | 2,017 | | | | 12,924 | | | | 56,711 | |
| | | | | | | | | | | | | | | | | | | | | | | | | | | | Equity affiliates | | (M€) | | Europe | | | Africa | | | Americas | | | Middle
East | | | Asia | | | Total | | As of December 31, 2009 | | | | | | | | | | | | | | | | | | | | | | | | | Proved properties | | | — | | | | 610 | | | | 726 | | | | 2,404 | | | | — | | | | 3,740 | | Unproved properties | | | — | | | | — | | | | 135 | | | | — | | | | 62 | | | | 197 | | Total capitalized costs | | | — | | | | 610 | | | | 861 | | | | 2,404 | | | | 62 | | | | 3,937 | | Accumulated depreciation, depletion and amortization | | | — | | | | (387 | ) | | | (171 | ) | | | (1,723 | ) | | | — | | | | (2,281 | ) | Net capitalized costs | | | — | | | | 223 | | | | 690 | | | | 681 | | | | 62 | | | | 1,656 | | As of December 31, 2010 | | | | | | | | | | | | | | | | | | | | | | | | | Proved properties | | | — | | | | 639 | | | | 887 | | | | 3,110 | | | | — | | | | 4,636 | | Unproved properties | | | — | | | | 25 | | | | 168 | | | | — | | | | 138 | | | | 331 | | Total capitalized costs | | | — | | | | 664 | | | | 1,055 | | | | 3,110 | | | | 138 | | | | 4,967 | | Accumulated depreciation, depletion and amortization | | | — | | | | (462 | ) | | | (307 | ) | | | (2,029 | ) | | | — | | | | (2,798 | ) | Net capitalized costs | | | — | | | | 202 | | | | 748 | | | | 1,081 | | | | 138 | | | | 2,169 | | As of December 31, 2011 | | | | | | | | | | | | | | | | | | | | | | | | | Proved properties | | | — | | | | — | | | | 731 | | | | 3,496 | | | | 3,973 | | | | 8,200 | | Unproved properties | | | — | | | | — | | | | — | | | | — | | | | 1,146 | | | | 1,146 | | Total capitalized costs | | | — | | | | — | | | | 731 | | | | 3,496 | | | | 5,119 | | | | 9,346 | | Accumulated depreciation, depletion and amortization | | | — | | | | — | | | | (96 | ) | | | (2,337 | ) | | | (213 | ) | | | (2,646 | ) | Net capitalized costs | | | — | | | | — | | | | 635 | | | | 1,159 | | | | 4,906 | | | | 6,700 | |
STANDARDIZED MEASURE OF
DISCOUNTED FUTURE NET CASH FLOWS (EXCLUDING TRANSPORTATION) The standardized measure of discounted future net cash flows relating to proved oil and gas reserve quantities was developed as follows: estimates of proved reserves and the corresponding production profiles are based on existing technical and economic conditions; the estimated future cash flows are determined based on prices used in estimating the Group’s proved oil and gas reserves; the future cash flows incorporate estimated production costs (including production taxes), future development costs and asset retirement costs. All cost estimates are based on year-end technical and economic conditions; future income taxes are computed by applying the year-end statutory tax rate to future net cash flows after consideration of permanent differences and future income tax credits; and | | • | Estimates of proved reserves and the corresponding production profiles are based on existing technical and economic conditions; | | • | The estimated future cash flows are determined based on prices used in estimating the Group’s proved oil and gas reserves; | | • | The future cash flows incorporate estimated production costs (including production taxes), future development costs and asset retirement costs. All cost estimates are based on year-end technical and economic conditions; | | • | Future income taxes are computed by applying the year-end statutory tax rate to future net cash flows after consideration of permanent differences and future income tax credits; and | | • | Future net cash flows are discounted at a standard discount rate of 10 percent. |
future net cash flows are discounted at a standard discount rate of 10%. These principles applied are those required by ASC 932 and do not reflect the expectations of real revenues from these reserves, nor their present value; hence, they do not constitute criteria for investment decisions. An estimate of the fair value of reserves should also take into account, among other things, the recovery of reserves not presently classified as proved, anticipated future changes in prices and costs and a discount factor more representative of the time value of money and the risks inherent in reserves estimates.
S-16
| | | | | | | | | | | | | | | | | | | | | | | | | | | | | Consolidated subsidiaries | | | | | | | | | | | | | | Middle
| | | | | | | | | (in million euros) | | Europe | | | Africa | | | Americas | | | East | | | Asia | | | Total | | As of December 31, 2008 | | | | | | | | | | | | | | | | | | | | | | | | | | Future cash inflows | | | 42,749 | | | | 67,761 | | | | 7,963 | | | | 7,047 | | | | 19,745 | | | | 145,265 | | | Future production costs | | | (8,593 | ) | | | (15,372 | ) | | | (4,040 | ) | | | (1,942 | ) | | | (5,224 | ) | | | (35,171 | ) | | Future development costs | | | (10,423 | ) | | | (21,594 | ) | | | (1,863 | ) | | | (733 | ) | | | (7,497 | ) | | | (42,110 | ) | | Future income taxes | | | (15,651 | ) | | | (14,571 | ) | | | (367 | ) | | | (1,577 | ) | | | (2,545 | ) | | | (34,711 | ) | | | | | | | | | | | | | | | | | | | | | | | | | | | Future net cash flows, after income taxes | | | 8,082 | | | | 16,224 | | | | 1,693 | | | | 2,795 | | | | 4,479 | | | | 33,273 | | | Discount at 10% | | | (3,645 | ) | | | (8,144 | ) | | | (715 | ) | | | (1,333 | ) | | | (3,450 | ) | | | (17,287 | ) | | | | | | | | | | | | | | | | | | | | | | | | | | | Standardized measure of discounted future net cash flows | | | 4,437 | | | | 8,080 | | | | 978 | | | | 1,462 | | | | 1,029 | | | | 15,986 | | | | | | | | | | | | | | | | | | | | | | | | | | | | As of December 31, 2009 | | | | | | | | | | | | | | | | | | | | | | | | | | Future cash inflows | | | 50,580 | | | | 107,679 | | | | 18,804 | | | | 9,013 | | | | 32,004 | | | | 218,080 | | | Future production costs | | | (11,373 | ) | | | (23,253 | ) | | | (8,286 | ) | | | (2,831 | ) | | | (6,996 | ) | | | (52,739 | ) | | Future development costs | | | (12,795 | ) | | | (21,375 | ) | | | (5,728 | ) | | | (698 | ) | | | (6,572 | ) | | | (47,168 | ) | | Future income taxes | | | (17,126 | ) | | | (36,286 | ) | | | (1,293 | ) | | | (2,041 | ) | | | (5,325 | ) | | | (62,071 | ) | | | | | | | | | | | | | | | | | | | | | | | | | | | Future net cash flows, after income taxes | | | 9,286 | | | | 26,765 | | | | 3,497 | | | | 3,443 | | | | 13,111 | | | | 56,102 | | | Discount at 10% | | | (3,939 | ) | | | (13,882 | ) | | | (2,696 | ) | | | (1,558 | ) | | | (8,225 | ) | | | (30,300 | ) | | | | | | | | | | | | | | | | | | | | | | | | | | | Standardized measure of discounted future net cash flows | | | 5,347 | | | | 12,883 | | | | 801 | | | | 1,885 | | | | 4,886 | | | | 25,802 | | | | | | | | | | | | | | | | | | | | | | | | | | | | As of December 31, 2010 | | | | | | | | | | | | | | | | | | | | | | | | | | Future cash inflows | | | 65,644 | | | | 142,085 | | | | 42,378 | | | | 14,777 | | | | 41,075 | | | | 305,959 | | | Future production costs | | | (16,143 | ) | | | (29,479 | ) | | | (19,477 | ) | | | (4,110 | ) | | | (6,476 | ) | | | (75,685 | ) | | Future development costs | | | (18,744 | ) | | | (25,587 | ) | | | (8,317 | ) | | | (3,788 | ) | | | (8,334 | ) | | | (64,770 | ) | | Future income taxes | | | (20,571 | ) | | | (51,390 | ) | | | (3,217 | ) | | | (2,541 | ) | | | (7,281 | ) | | | (85,000 | ) | | | | | | | | | | | | | | | | | | | | | | | | | | | Future net cash flows, after income taxes | | | 10,186 | | | | 35,629 | | | | 11,367 | | | | 4,338 | | | | 18,984 | | | | 80,504 | | | Discount at 10% | | | (5,182 | ) | | | (16,722 | ) | | | (8,667 | ) | | | (2,106 | ) | | | (11,794 | ) | | | (44,471 | ) | | | | | | | | | | | | | | | | | | | | | | | | | | | Standardized measure of discounted future net cash flows | | | 5,004 | | | | 18,907 | | | | 2,700 | | | | 2,232 | | | | 7,190 | | | | 36,033 | | | | | | | | | | | | | | | | | | | | | | | | | | | | Minority interests in future net cash flows as of | | | | | | | | | | | | | | | | | | | | | | | | | December 31, 2008 | | | 217 | | | | (50 | ) | | | — | | | | — | | | | — | | | | 167 | | | December 31, 2009 | | | 212 | | | | 60 | | | | — | | | | — | | | | — | | | | 272 | | | | | | | | | | | | | | | | | | | | | | | | | | | | As of December 31, 2010 | | | 273 | | | | 344 | | | | — | | | | — | | | | — | | | | 617 | | | | | | | | | | | | | | | | | | | | | | | | | | | |
S-17
| | | | | | | | | | | | | | | | | | | | | | | | | | | | Consolidated subsidiaries | | (M€) | | Europe | | | Africa | | | Americas | | | Middle
East | | | Asia | | | Total | | As of December 31, 2009 | | | | | | | | | | | | | | | | | | | | | | | | | Future cash inflows | | | 50,580 | | | | 107,679 | | | | 18,804 | | | | 9,013 | | | | 32,004 | | | | 218,080 | | Future production costs | | | (11,373 | ) | | | (23,253 | ) | | | (8,286 | ) | | | (2,831 | ) | | | (6,996 | ) | | | (52,739 | ) | Future development costs | | | (12,795 | ) | | | (21,375 | ) | | | (5,728 | ) | | | (698 | ) | | | (6,572 | ) | | | (47,168 | ) | Future income taxes | | | (17,126 | ) | | | (36,286 | ) | | | (1,293 | ) | | | (2,041 | ) | | | (5,325 | ) | | | (62,071 | ) | Future net cash flows, after income taxes | | | 9,286 | | | | 26,765 | | | | 3,497 | | | | 3,443 | | | | 13,111 | | | | 56,102 | | Discount at 10% | | | (3,939 | ) | | | (13,882 | ) | | | (2,696 | ) | | | (1,558 | ) | | | (8,225 | ) | | | (30,300 | ) | Standardized measure of discounted future net cash flows | | | 5,347 | | | | 12,883 | | | | 801 | | | | 1,885 | | | | 4,886 | | | | 25,802 | | As of December 31, 2010 | | | | | | | | | | | | | | | | | | | | | | | | | Future cash inflows | | | 65,644 | | | | 142,085 | | | | 42,378 | | | | 14,777 | | | | 41,075 | | | | 305,959 | | Future production costs | | | (16,143 | ) | | | (29,479 | ) | | | (19,477 | ) | | | (4,110 | ) | | | (6,476 | ) | | | (75,685 | ) | Future development costs | | | (18,744 | ) | | | (25,587 | ) | | | (8,317 | ) | | | (3,788 | ) | | | (8,334 | ) | | | (64,770 | ) | Future income taxes | | | (20,571 | ) | | | (51,390 | ) | | | (3,217 | ) | | | (2,541 | ) | | | (7,281 | ) | | | (85,000 | ) | Future net cash flows, after income taxes | | | 10,186 | | | | 35,629 | | | | 11,367 | | | | 4,338 | | | | 18,984 | | | | 80,504 | | Discount at 10% | | | (5,182 | ) | | | (16,722 | ) | | | (8,667 | ) | | | (2,106 | ) | | | (11,794 | ) | | | (44,471 | ) | Standardized measure of discounted future net cash flows | | | 5,004 | | | | 18,907 | | | | 2,700 | | | | 2,232 | | | | 7,190 | | | | 36,033 | | As of December 31, 2011 | | | | | | | | | | | | | | | | | | | | | | | | | Future cash inflows | | | 85,919 | | | | 167,367 | | | | 53,578 | | | | 14,297 | | | | 67,868 | | | | 389,029 | | Future production costs | | | (18,787 | ) | | | (31,741 | ) | | | (22,713 | ) | | | (3,962 | ) | | | (12,646 | ) | | | (89,849 | ) | Future development costs | | | (21,631 | ) | | | (22,776 | ) | | | (11,548 | ) | | | (3,110 | ) | | | (11,044 | ) | | | (70,109 | ) | Future income taxes | | | (28,075 | ) | | | (71,049 | ) | | | (4,361 | ) | | | (2,794 | ) | | | (12,963 | ) | | | (119,242 | ) | Future net cash flows, after income taxes | | | 17,426 | | | | 41,801 | | | | 14,956 | | | | 4,431 | | | | 31,215 | | | | 109,829 | | Discount at 10% | | | (9,426 | ) | | | (17,789 | ) | | | (12,298 | ) | | | (2,186 | ) | | | (20,717 | ) | | | (62,416 | ) | Standardized measure of discounted future net cash flows | | | 8,000 | | | | 24,012 | | | | 2,658 | | | | 2,245 | | | | 10,498 | | | | 47,413 | | | | | | | | | Minority interests in future net cash flows as of | | | | | | | | | | | | | | | | | | | | | | | | | December 31, 2009 | | | 212 | | | | 60 | | | | — | | | | — | | | | — | | | | 272 | | December 31, 2010 | | | 273 | | | | 344 | | | | — | | | | — | | | | — | | | | 617 | | December 31, 2011 | | | — | | | | 558 | | | | — | | | | — | | | | — | | | | 558 | | | | | | | Equity affiliates | | (M€) | | Europe | | | Africa | | | Americas | | | Middle
East | | | Asia | | | Total | | As of December 31, 2009 | | | | | | | | | | | | | | | | | | | | | | | | | Future cash inflows | | | — | | | | 1,432 | | | | 16,750 | | | | 48,486 | | | | — | | | | 66,668 | | Future production costs | | | — | | | | (624 | ) | | | (6,993 | ) | | | (30,739 | ) | | | — | | | | (38,356 | ) | Future development costs | | | — | | | | (26 | ) | | | (1,924 | ) | | | (3,891 | ) | | | — | | | | (5,841 | ) | Future income taxes | | | — | | | | (245 | ) | | | (3,650 | ) | | | (1,843 | ) | | | — | | | | (5,738 | ) | Future net cash flows, after income taxes | | | — | | | | 537 | | | | 4,183 | | | | 12,013 | | | | — | | | | 16,733 | | Discount at 10% | | | — | | | | (239 | ) | | | (2,816 | ) | | | (6,383 | ) | | | — | | | | (9,438 | ) | Standardized measure of discounted future net cash flows | | | — | | | | 298 | | | | 1,367 | | | | 5,630 | | | | — | | | | 7,295 | | As of December 31, 2010 | | | | | | | | | | | | | | | | | | | | | | | | | Future cash inflows | | | — | | | | 1,814 | | | | 22,293 | | | | 59,472 | | | | — | | | | 83,579 | | Future production costs | | | — | | | | (765 | ) | | | (8,666 | ) | | | (40,085 | ) | | | — | | | | (49,516 | ) | Future development costs | | | — | | | | (26 | ) | | | (2,020 | ) | | | (3,006 | ) | | | — | | | | (5,052 | ) | Future income taxes | | | — | | | | (349 | ) | | | (5,503 | ) | | | (2,390 | ) | | | — | | | | (8,242 | ) | Future net cash flows, after income taxes | | | — | | | | 674 | | | | 6,104 | | | | 13,991 | | | | — | | | | 20,769 | | Discount at 10% | | | — | | | | (203 | ) | | | (3,946 | ) | | | (7,386 | ) | | | — | | | | (11,535 | ) | Standardized measure of discounted future net cash flows | | | — | | | | 471 | | | | 2,158 | | | | 6,605 | | | | — | | | | 9,234 | | As of December 31, 2011 | | | | | | | | | | | | | | | | | | | | | | | | | Future cash inflows | | | — | | | | 210 | | | | 29,887 | | | | 64,977 | | | | 7,116 | | | | 102,190 | | Future production costs | | | — | | | | (95 | ) | | | (17,393 | ) | | | (39,800 | ) | | | (2,683 | ) | | | (59,971 | ) | Future development costs | | | — | | | | — | | | | (1,838 | ) | | | (2,809 | ) | | | (1,297 | ) | | | (5,944 | ) | Future income taxes | | | — | | | | (29 | ) | | | (5,152 | ) | | | (3,942 | ) | | | (2,280 | ) | | | (11,403 | ) | Future net cash flows, after income taxes | | | — | | | | 86 | | | | 5,504 | | | | 18,426 | | | | 856 | | | | 24,872 | | Discount at 10% | | | — | | | | (36 | ) | | | (3,652 | ) | | | (9,757 | ) | | | (196 | ) | | | (13,641 | ) | Standardized measure of discounted future net cash flows | | | — | | | | 50 | | | | 1,852 | | | | 8,669 | | | | 660 | | | | 11,231 | |
| | | | | | | | | | | | | | | | | | | | | | | | | | | | | Equity affiliates | | | | | | | | | | | | | | Middle
| | | | | | | | | (in million euros) | | Europe | | | Africa | | | Americas | | | East | | | Asia | | | Total | | Group’s share of future net cash flows | | | | | | | | | | | | | | | | | | | | | | | | | | As of December 31, 2008 | | | — | | | | 418 | | | | 608 | | | | 4,275 | | | | — | | | | 5,301 | | | | | | | | | | | | | | | | | | | | | | | | | | | | As of December 31, 2009 | | | | | | | | | | | | | | | | | | | | | | | | | | Future cash inflows | | | — | | | | 1,432 | | | | 16,750 | | | | 48,486 | | | | — | | | | 66,668 | | | Future production costs | | | — | | | | (624 | ) | | | (6,993 | ) | | | (30,739 | ) | | | — | | | | (38,356 | ) | | Future development costs | | | — | | | | (26 | ) | | | (1,924 | ) | | | (3,891 | ) | | | — | | | | (5,841 | ) | | Future income taxes | | | — | | | | (245 | ) | | | (3,650 | ) | | | (1,843 | ) | | | — | | | | (5,738 | ) | | | | | | | | | | | | | | | | | | | | | | | | | | | Future net cash flows, after income taxes | | | — | | | | 537 | | | | 4,183 | | | | 12,013 | | | | — | | | | 16,733 | | | Discount at 10% | | | — | | | | (239 | ) | | | (2,816 | ) | | | (6,383 | ) | | | — | | | | (9,438 | ) | | | | | | | | | | | | | | | | | | | | | | | | | | | Standardized measure of discounted future net cash flows | | | — | | | | 298 | | | | 1,367 | | | | 5,630 | | | | — | | | | 7,295 | | | | | | | | | | | | | | | | | | | | | | | | | | | | As of December 31, 2010 | | | | | | | | | | | | | | | | | | | | | | | | | | Future cash inflows | | | — | | | | 1,814 | | | | 22,293 | | | | 59,472 | | | | — | | | | 83,579 | | | Future production costs | | | — | | | | (765 | ) | | | (8,666 | ) | | | (40,085 | ) | | | — | | | | (49,516 | ) | | Future development costs | | | — | | | | (26 | ) | | | (2,020 | ) | | | (3,006 | ) | | | — | | | | (5,052 | ) | | Future income taxes | | | — | | | | (349 | ) | | | (5,503 | ) | | | (2,390 | ) | | | — | | | | (8,242 | ) | | | | | | | | | | | | | | | | | | | | | | | | | | | Future net cash flows, after income taxes | | | — | | | | 674 | | | | 6,104 | | | | 13,991 | | | | — | | | | 20,769 | | | Discount at 10% | | | — | | | | (203 | ) | | | (3,946 | ) | | | (7,386 | ) | | | — | | | | (11,535 | ) | | | | | | | | | | | | | | | | | | | | | | | | | | | Standardized measure of discounted future net cash flows | | | — | | | | 471 | | | | 2,158 | | | | 6,605 | | | | — | | | | 9,234 | | | | | | | | | | | | | | | | | | | | | | | | | | | |
S-18
CHANGES IN THE STANDARDIZED MEASURE OF DISCOUNTEDFUTURE NET CASH FLOWS | | | | | | | | | | | | | | | (in million euros) | | 2010 | | | 2009 | | | 2008 | | Consolidated subsidiaries | | | | | | | | | | | | | Beginning of year | | | 25,802 | | | | 15,986 | | | | 48,464 | | | Sales and transfers, net of production costs | | | (22,297 | ) | | | (17,266 | ) | | | (26,109 | ) | | Net change in sales and transfer prices and in production costs and other expenses | | | 30,390 | | | | 35,738 | | | | (81,358 | ) | | Extensions, discoveries and improved recovery | | | 716 | | | | (267 | ) | | | 556 | | | Changes in estimated future development costs | | | (7,245 | ) | | | (4,847 | ) | | | (2,227 | ) | | Previously estimated development costs incurred during the year | | | 7,896 | | | | 7,552 | | | | 6,960 | | | Revisions of previous quantity estimates | | | 5,523 | | | | 164 | | | | 2,693 | | | Accretion of discount | | | 2,580 | | | | 1,599 | | | | 4,846 | | | Net change in income taxes | | | (6,773 | ) | | | (12,455 | ) | | | 63,611 | | | Purchases of reserves in place | | | 442 | | | | 230 | | | | 50 | | | Sales of reserves in place | | | (1,001 | ) | | | (632 | ) | | | (1,500 | ) | | | | | | | | | | | | | | | End of year | | | 36,033 | | | | 25,802 | | | | 15,986 | | | | | | | | | | | | | | | |
| | | | | | | | | | | (in million euros) | | 2010 | | | 2009 | | Equity affiliates | | | | | | | | | Beginning of year | | | 7,295 | | | | 5,301 | | | Sales and transfers, net of production costs | | | (1,583 | ) | | | (987 | ) | | Net change in sales and transfer prices and in production costs and other expenses | | | 2,366 | | | | 2,789 | | | Extensions, discoveries and improved recovery | | | — | | | | 407 | | | Changes in estimated future development costs | | | 195 | | | | (88 | ) | | Previously estimated development costs incurred during the year | | | 651 | | | | 854 | | | Revisions of previous quantity estimates | | | 308 | | | | (790 | ) | | Accretion of discount | | | 730 | | | | 530 | | | Net change in income taxes | | | (728 | ) | | | (721 | ) | | Purchases of reserves in place | | | — | | | | — | | | Sales of reserves in place | | | — | | | | — | | | | | | | | | | | | End of year | | | 9,234 | | | | 7,295 | | | | | | | | | | | |
| | | | | | | | | | | | | | | | Consolidated subsidiaries | | (M€) | | 2009 | | | 2010 | | | 2011 | | Beginning of year | | | 15,986 | | | | 25,802 | | | | 36,033 | | Sales and transfers, net of production costs | | | (17,266 | ) | | | (22,297 | ) | | | (27,026 | ) | Net change in sales and transfer prices and in production costs and other expenses | | | 35,738 | | | | 30,390 | | | | 44,315 | | Extensions, discoveries and improved recovery | | | (267 | ) | | | 716 | | | | 1,680 | | Changes in estimated future development costs | | | (4,847 | ) | | | (7,245 | ) | | | (4,798 | ) | Previously estimated development costs incurred during the year | | | 7,552 | | | | 7,896 | | | | 9,519 | | Revisions of previous quantity estimates | | | 164 | | | | 5,523 | | | | 1,288 | | Accretion of discount | | | 1,599 | | | | 2,580 | | | | 3,603 | | Net change in income taxes | | | (12,455 | ) | | | (6,773 | ) | | | (16,925 | ) | Purchases of reserves in place | | | 230 | | | | 442 | | | | 885 | | Sales of reserves in place | | | (632 | ) | | | (1,001 | ) | | | (1,161 | ) | End of year | | | 25,802 | | | | 36,033 | | | | 47,413 | | | | | | | Equity affiliates | | (M€) | | 2009 | | | 2010 | | | 2011 | | Beginning of year | | | 5,301 | | | | 7,295 | | | | 9,234 | | Sales and transfers, net of production costs | | | (987 | ) | | | (1,583 | ) | | | (1,991 | ) | Net change in sales and transfer prices and in production costs and other expenses | | | 2,789 | | | | 2,366 | | | | 3,715 | | Extensions, discoveries and improved recovery | | | 407 | | | | — | | | | — | | Changes in estimated future development costs | | | (88 | ) | | | 195 | | | | (383 | ) | Previously estimated development costs incurred during the year | | | 854 | | | | 651 | | | | 635 | | Revisions of previous quantity estimates | | | (790 | ) | | | 308 | | | | (749 | ) | Accretion of discount | | | 530 | | | | 730 | | | | 923 | | Net change in income taxes | | | (721 | ) | | | (728 | ) | | | (1,341 | ) | Purchases of reserves in place | | | — | | | | — | | | | 1,812 | | Sales of reserves in place | | | — | | | | — | | | | (624 | ) | End of year | | | 7,295 | | | | 9,234 | | | | 11,231 | |
OTHER INFORMATION Net gas production, production prices and production costs | | | | | | | | | | | | | | | | | | | | | | | | | | | | | Consolidated subsidiaries | | | | | | | | | | | | | | Middle
| | | | | | | | | | | Europe | | | Africa | | | Americas | | | East | | | Asia | | | Total | | 2009 | | | | | | | | | | | | | | | | | | | | | | | | | Natural gas production available for sale (Mcf/d)(a) | | | 1,643 | | | | 480 | | | | 545 | | | | 297 | | | | 1,224 | | | | 4,189 | | Production prices(b) | | | | | | | | | | | | | | | | | | | | | | | | | | Oil (€/b) | | | 40.76 | | | | 40.77 | | | | 36.22 | | | | 39.94 | | | | 37.66 | | | | 40.38 | | | Bitumen (€/b) | | | — | | | | — | | | | 23.17 | | | | — | | | | — | | | | 23.17 | | | Natural gas (€/kcf) | | | 4.81 | | | | 1.33 | | | | 1.56 | | | | 0.72 | | | | 4.47 | | | | 3.70 | | Production costs per unit of production (€/boe)(c)(d) | | | | | | | | | | | | | | | | | | | | | | | | | | Total liquids and natural gas | | | 5.30 | | | | 4.35 | | | | 3.59 | | | | 3.86 | | | | 2.52 | | | | 4.30 | | | Bitumen | | | — | | | | — | | | | 25.45 | | | | — | | | | — | | | | 25.45 | | | | | | | | | | | | | | | | | | | | | | | | | | | |
S-19
| | | | | | | | | | | | | | | | | | | | | | | | | | | | Consolidated subsidiaries | | | | Europe | | | Africa | | | Americas | | | Middle
East | | | Asia | | | Total | | | 2009 | | | | | | | | | | | | | | | | | | | | | | | | | Natural gas production available for sale (Mcf/d)(a) | | | 1,643 | | | | 480 | | | | 545 | | | | 297 | | | | 1,224 | | | | 4,189 | | Production prices(b) | | | | | | | | | | | | | | | | | | | | | | | | | Oil (€/b) | | | 40.76 | | | | 40.77 | | | | 36.22 | | | | 39.94 | | | | 37.66 | | | | 40.38 | | Bitumen (€/b) | | | — | | | | — | | | | 23.17 | | | | — | | | | — | | | | 23.17 | | Natural gas (€/kcf) | | | 4.81 | | | | 1.33 | | | | 1.56 | | | | 0.72 | | | | 4.47 | | | | 3.70 | | Production costs per unit of production (€/boe)(c) | | | | | | | | | | | | | | | | | | | | | | | | | Total liquids and natural gas | | | 5.30 | | | | 4.35 | | | | 3.59 | | | | 3.86 | | | | 2.52 | | | | 4.30 | | Bitumen | | | — | | | | — | | | | 25.45 | | | | — | | | | — | | | | 25.45 | | | | | | | Equity affiliates | | | | Europe | | | Africa | | | Americas | | | Middle
East | | | Asia | | | Total | | | 2009 | | | | | | | | | | | | | | | | | | | | | | | | | Natural gas production available for sale (Mcf/d)(a) | | | — | | | | — | | | | — | | | | 268 | | | | — | | | | 268 | | Production prices(b) | | | | | | | | | | | | | | | | | | | | | | | | | Oil (€/b) | | | — | | | | 42.98 | | | | 33.14 | | | | 43.98 | | | | — | | | | 42.18 | | Bitumen (€/b) | | | — | | | | — | | | | — | | | | — | | | | — | | | | — | | Natural gas (€/kcf) | | | — | | | | — | | | | — | | | | 3.53 | | | | — | | | | 3.53 | | Production costs per unit of production (€/boe)(c) | | | | | | | | | | | | | | | | | | | | | | | | | Total liquids and natural gas | | | — | | | | 4.21 | | | | 2.24 | | | | 2.81 | | | | — | | | | 2.81 | | Bitumen | | | — | | | | — | | | | — | | | | — | | | | — | | | | — | | | | | | | Consolidated subsidiaries | | | | Europe | | | Africa | | | Americas | | | Middle
East | | | Asia | | | Total | | 2010 | | | | | | | | | | | | | | | | | | | | | | | | | Natural gas production available for sale (Mcf/d)(a) | | | 1,603 | | | | 608 | | | | 732 | | | | 375 | | | | 1,234 | | | | 4,552 | | Production prices(b) | | | | | | | | | | | | | | | | | | | | | | | | | Oil (€/b) | | | 55.70 | | | | 56.18 | | | | 45.28 | | | | 55.83 | | | | 52.33 | | | | 55.39 | | Bitumen (€/b) | | | — | | | | — | | | | 33.19 | | | | — | | | | — | | | | 33.19 | | Natural gas (€/kcf) | | | 5.17 | | | | 1.55 | | | | 1.83 | | | | 0.63 | | | | 5.67 | | | | 3.94 | | Production costs per unit of production (€/boe)(c) | | | | | | | | | | | | | | | | | | | | | | | | | Total liquids and natural gas | | | 6.23 | | | | 4.53 | | | | 3.29 | | | | 4.82 | | | | 2.93 | | | | 4.72 | | Bitumen | | | — | | | | — | | | | 17.49 | | | | — | | | | — | | | | 17.49 | | | | | | | Equity affiliates | | | | Europe | | | Africa | | | Americas | | | Middle
East | | | Asia | | | Total | | 2010 | | | | | | | | | | | | | | | | | | | | | | | | | Natural gas production available for sale (Mcf/d)(a) | | | — | | | | — | | | | — | | | | 650 | | | | — | | | | 650 | | Production prices(b) | | | | | | | | | | | | | | | | | | | | | | | | | Oil (€/b) | | | — | | | | 53.96 | | | | 43.81 | | | | 57.03 | | | | — | | | | 54.95 | | Bitumen (€/b) | | | — | | | | — | | | | — | | | | — | | | | — | | | | — | | Natural gas (€/kcf) | | | — | | | | — | | | | — | | | | 2.30 | | | | — | | | | 2.30 | | Production costs per unit of production (€/boe)(c) | | | | | | | | | | | | | | | | | | | | | | | | | Total liquids and natural gas | | | — | | | | 6.31 | | | | 2.76 | | | | 1.54 | | | | — | | | | 1.91 | | Bitumen | | | — | | | | — | | | | — | | | | — | | | | — | | | | — | |
| | | | | | | | | | | | | | | | | | | | | | | | | | | | Consolidated subsidiaries | | | | | Europe | | | Africa | | | Americas | | | Middle
East | | | Asia | | | Total | | 2011 | | | | | | | | | | | | | | | | | | | | | | | | | Natural gas production available for sale (Mcf/d)(a) | | | 1,350 | | | | 607 | | | | 839 | | | | 424 | | | | 1,162 | | | | 4,382 | | Production prices(b) | | | | | | | | | | | | | | | | | | | | | | | | | Oil (€/b) | | | 74.24 | | | | 74.72 | | | | 55.13 | | | | 73.73 | | | | 68.76 | | | | 73.34 | | Bitumen (€/b) | | | — | | | | — | | | | 31.36 | | | | — | | | | — | | | | 31.36 | | Natural gas (€/kcf) | | | 6.58 | | | | 1.81 | | | | 2.06 | | | | 0.54 | | | | 7.45 | | | | 4.72 | | Production costs per unit of production (€/boe)(c) | | | | | | | | | | | | | | | | | | | | | | | | | Total liquids and natural gas | | | 6.86 | | | | 5.14 | | | | 3.41 | | | | 5.36 | | | | 3.40 | | | | 5.20 | | Bitumen | | | — | | | | — | | | | 20.70 | | | | — | | | | — | | | | 20.70 | | | | | | | Equity affiliates | | | | | Europe | | | Africa | | | Americas | | | Middle
East | | | Asia | | | Total | | 2011 | | | | | | | | | | | | | | | | | | | | | | | | | Natural gas production available for sale (Mcf/d)(a) | | | — | | | | — | | | | — | | | | 891 | | | | 457 | | | | 1,348 | | Production prices(b) | | | | | | | | | | | | | | | | | | | | | | | | | Oil (€/b) | | | — | | | | 66.21 | | | | 61.15 | | | | 77.07 | | | | 30.75 | | | | 73.61 | | Bitumen (€/b) | | | — | | | | — | | | | — | | | | — | | | | — | | | | — | | Natural gas (€/kcf) | | | — | | | | — | | | | — | | | | 1.29 | | | | 0.95 | | | | 1.23 | | Production costs per unit of production (€/boe)(c) | | | | | | | | | | | | | | | | | | | | | | | | | Total liquids and natural gas | | | — | | | | 1.99 | | | | 2.75 | | | | 1.66 | | | | 0.79 | | | | 1.61 | | Bitumen | | | — | | | | — | | | | — | | | | — | | | | — | | | | — | |
| | | | | | | | | | | | | | | | | | | | | | | | | | | | | Equity affiliates | | | | | | | | | | | | | | Middle
| | | | | | | | | | | Europe | | | Africa | | | Americas | | | East | | | Asia | | | Total | | 2009 | | | | | | | | | | | | | | | | | | | | | | | | | Natural gas production available for sale (Mcf/d)(a) | | | — | | | | — | | | | — | | | | 268 | | | | — | | | | 268 | | Production prices(b) | | | | | | | | | | | | | | | | | | | | | | | | | | Oil (€/b) | | | — | | | | 42.98 | | | | 33.14 | | | | 43.98 | | | | — | | | | 42.18 | | | Bitumen (€/b) | | | — | | | | — | | | | — | | | | | | | | — | | | | — | | | Natural gas (€/kcf) | | | — | | | | — | | | | — | | | | 3.53 | | | | — | | | | 3.53 | | Production costs per unit of production (€/boe)(c) | | | | | | | | | | | | | | | | | | | | | | | | | | Total liquids and natural gas | | | — | | | | 4.21 | | | | 2.24 | | | | 2.81 | | | | — | | | | 2.81 | | | Bitumen | | | — | | | | — | | | | — | | | | — | | | | — | | | | — | | | | | | | | | | | | | | | | | | | | | | | | | | | |
| | | | | | | | | | | | | | | | | | | | | | | | | | | | | Consolidated subsidiaries | | | | | | | | | | | | | | Middle
| | | | | | | | | | | Europe | | | Africa | | | Americas | | | East | | | Asia | | | Total | | 2010 | | | | | | | | | | | | | | | | | | | | | | | | | Natural gas production available for sale (Mcf/d)(a) | | | 1,603 | | | | 608 | | | | 732 | | | | 375 | | | | 1,234 | | | | 4,552 | | Production prices(b) | | | | | | | | | | | | | | | | | | | | | | | | | | Oil (€/b) | | | 55.70 | | | | 56.18 | | | | 45.28 | | | | 55.83 | | | | 52.33 | | | | 55.39 | | | Bitumen (€/b) | | | — | | | | — | | | | 33.19 | | | | — | | | | — | | | | 33.19 | | | Natural gas (€/kcf) | | | 5.17 | | | | 1.55 | | | | 1.83 | | | | 0.63 | | | | 5.67 | | | | 3.94 | | Production costs per unit of production (€/boe)(c) | | | | | | | | | | | | | | | | | | | | | | | | | | Total liquids and natural gas | | | 6.23 | | | | 4.53 | | | | 3.29 | | | | 4.82 | | | | 2.93 | | | | 4.72 | | | Bitumen | | | — | | | | — | | | | 17.49 | | | | — | | | | — | | | | 17.49 | | | | | | | | | | | | | | | | | | | | | | | | | | | |
| | | | | | | | | | | | | | | | | | | | | | | | | | | | | Equity affiliates | | | | | | | | | | | | | | Middle
| | | | | | | | | | | Europe | | | Africa | | | Americas | | | East | | | Asia | | | Total | | 2010 | | | | | | | | | | | | | | | | | | | | | | | | | Natural gas production available for sale (Mcf/d)(a) | | | — | | | | — | | | | — | | | | 650 | | | | — | | | | 650 | | Production prices(b) | | | | | | | | | | | | | | | | | | | | | | | | | | Oil (€/b) | | | — | | | | 53.96 | | | | 43.81 | | | | 57.03 | | | | — | | | | 54.95 | | | Bitumen (€/b) | | | — | | | | — | | | | — | | | | — | | | | — | | | | — | | | Natural gas (€/kcf) | | | — | | | | — | | | | — | | | | 2.30 | | | | — | | | | 2.30 | | Production costs per unit of production (€/boe)(c) | | | | | | | | | | | | | | | | | | | | | | | | | | Total liquids and natural gas | | | — | | | | 6.31 | | | | 2.76 | | | | 1.54 | | | | — | | | | 1.91 | | | Bitumen | | | — | | | | — | | | | — | | | | — | | | | — | | | | — | | | | | | | | | | | | | | | | | | | | | | | | | | | |
| (a) | | | (a) | | The reported volumes are different from those shown in the reserves table due to gas consumed in operations. |
| (b) | | The volumes used for calculation of the average sales prices are the ones sold from the Group’s own production. |
| (c) | | The volumes of liquids used for this computation are shown in the proved reserves tables of this report. The reported volumes for natural gas are different from those shown in the reserves table due to gas consumed in operations. | (d) | | Production costs previously reported for consolidated subsidiaries have been restated. |
S-20
S-19 |