The Group is exposed to inherent risks in relation to changing technology and systems
The Group is reliant upon certain technologies, systems and systems (including IT systems)platforms for the running of its business, particularly those which are highly integrated with business operational processes. DisruptionSome of these are dependent upon the products and services of third-party technology providers. The failure of any such third-party provider to those technologies provide products and/or systemsperform services could materially adversely affectimpact the efficiency of the business, notwithstanding business continuity or disaster recovery processes. Group’s business.
The Group may also have to make substantial additional investments in new technologies or systems to remain competitive. Failing to keep pace with developments in technologies or systems may put the Group at a competitive disadvantage. The technologies or systems that the Group chooses may not be commercially successful or the technology or system strategy employed may not be sufficiently aligned with the needs of the business or responsive to changes in business strategy. As a result, the Group could adversely affect guest experiences, lose customers, fail to attract new customers, or incur substantial costs or face other losses.
The Group is reliant on the reputation of its brands and the protection of its intellectual property rights
Any event that materially damages the reputation of one or more of the Group’s existing or new brands and/or fails to sustain the appeal of the Group’s existing or new brands to its customers may have an adverse impact on the value of that brand and subsequent revenues from that brand or business.
In particular, where the Group is unable to enforce adherence to its safety or operating and quality standards, or the significant regulations applicable to hotel operations, pursuant to its franchise and management contracts, there may be further adverse impact upon brand reputation or customer perception and therefore the value of the Group’s brands.
In addition, the value of the Group’s brands is influenced by a number of other factors, some of which may be outside the Group’s control, including commoditization (whereby price and/or quality becomes relatively more important than brand identifications due, in part, to the increased prevalence of travel comparison websites and online travel agents), consumer preference and perception, or other factors affecting consumers’ willingness to purchase goods and services provided by the Group.
Given the importance of brand recognition to the Group’s business, the protection of its intellectual property poses a risk due to the variability and change of controls, laws and effectiveness of enforcement globally. Any widespread infringement, misappropriation or weakening of the control environment could materially harm the value of the Group’s brands and its ability to develop the business.
The Group is reliant upon its proprietary reservations system and is exposed to the risk of failures in the system and increased competition in reservations infrastructure
The value of the Group’s brands is partly derived from the ability to drive reservations through its proprietary HolidexPlus reservations system, a central repository of the Group’s hotel room inventories linked electronically to multiple sales channels including the Group’s own websites, call centers and hotels, third party intermediaries and travel agents.
Lack of resilience and operational availability and/or the failure of a third-party technology provider could lead to prolonged service disruption and may result in significant business interruption, impact the guest booking experience and subsequently impact on revenues. Lack of investment in these systems may also result in reduced capability, stability and ability to compete. Additionally, failure to maintain an appropriate technology strategy and select the right technology partners could erode the Group’s long-term competitiveness.
The Group is exposed to the risks related to information security and data privacy
The Group is increasingly dependent upon the availability, integrity and confidentiality of information including but not limited to, guest and employee credit card, financial and personal data, business performance, financial reporting and commercial development. This information is sometimes held in different formats such as digital, paper, voice and video and could be stored in many places including facilities managed by third-party service providers.
The threats towards the Group’s information are dynamic including cyber attacks, fraudulent use, loss or misuse by employees and breaches of the Group’s vendors’ security arrangements amongst others. The legal and regulatory environment and requirements set out by the payment card industry surrounding information security and data privacy across the many jurisdictions in which the Group operates are constantly evolving. If the Group fails to appropriately protect information and ensure relevant controls are in place to enable the release of information through the appropriate channels in a timely and accurate manner, system performance, guest experiences and the reputation of the Group may be adversely affected. This can lead to revenue losses, fines, penalties and other additional costs, including legal fees.
The Group is exposed to a variety of risks associated with safety, security and crisis management
There is a constant need to protect the safety and security of our guests, employees and assets against natural and man-made threats. These include but are not limited to exceptional events such as extreme weather, civil or political unrest, violence and terrorism, serious and organized crime, fraud, employee dishonesty, cyber crime, fire and day-to-day accidents, incidents and petty crime which impact the guest or employee experience, could cause loss of life, sickness or injury and result in compensation claims, fines from regulatory bodies, litigation and impact reputation. Serious incidents or a combination of events could escalate into a crisis which if managed poorly could further expose the Group and its brands to significant adverse reputational damage.
The Group requires the right people, skills and capability to manage growth and change
In order to remain competitive, the Group must employ the right people. This includes hiring and retaining highly skilled employees with particular expertise or leadership capability. The implementation of the Group’s strategic business plans could be undermined by failure to build resilient corporate culture, failure to recruit or retain key personnel, unexpected loss of key senior employees, failures in the Group’s succession planning and incentive plans, or a failure to invest in the development of key skills.
Some of the markets in which the Group operates are experiencing economic growth and the Group must compete against other companies inside and outside the hospitality industry for suitably qualified or experienced employees. Some emerging markets may not have the required local expertise to operate a hotel industry supply and demand cycle
may not be able to attract the right talent. Failure to attract and retain employees may threaten the success of the Group’s operations in these markets. Additionally, unless skills are supported by a sufficient infrastructure to enable knowledge and skills to be passed on, the Group risks losing accumulated knowledge if key employees leave the Group.The Group is required to comply with existing and changing regulations across numerous countries, territories and jurisdictions
Governmental regulations affect countless aspects of the Group’s business ranging from corporate governance, health and safety, environmental, bribery and corruption, employment law and diversity, disability access, relationships, data privacy and information protection, financial, accounting and tax.
Regulatory changes may require significant changes in the way the business operates and may inhibit the strategy including the markets the Group operates in, brand protection, and use or transmittal of customer data. If the Group fails to comply with existing or changing regulations, the Group may be subject to fines, prosecution, loss of license to operate or reputation damage.
The Group is exposed to the risk of litigation
Certain companies in the Group are the subject of various claims and proceedings. The ultimate outcome of these matters is subject to many uncertainties, including future operating results ofevents and uncertainties inherent in litigation.
In addition, the Group could be adversely affected by industry overcapacity (by numberat risk of rooms) and weak demand due,litigation from many parties, including but not limited to, guests, customers, joint venture partners, suppliers, employees, regulatory authorities, franchisees and/or the owners of hotels it manages. Claims filed in part, to the cyclical natureUS may include requests for punitive damages as well as compensatory damages. Unfavorable outcomes of claims or proceedings could have a material impact on the hotel industry, or other differences between planning assumptions and actual operating conditions. Reductions in room rates and occupancy levels would adversely impact theGroup’s results of Group operations.
The Groupoperations, cash flow and/or financial position. Exposure to significant litigation or fines may experience a lackalso affect the reputation of selected development opportunities
While the Group is operating in 100 countries and territories, if the availability of suitable development sites becomes limited for the Group and its prospective hotel owners, for example, due to saturation or changing geo-political circumstances, this could adversely affect the Group’s future growth pipeline.
brands.The Group is exposed to risks related to corporate responsibility
The reputation of the Group and the value of its brands are influenced by a wide variety of factors, including the perception of key stakeholders andstakeholder groups such as the communities in which the Group operates. The social and environmental impacts of business are under increasing scrutiny, and the Group is exposed to the risk of damage to its reputation if it fails to demonstrate sufficiently responsible practices, ethical behavior, or fails to comply with relevant regulatory requirements in a number of areas such as fraud, bribery and corruption, safety and security, sustainability and responsible tourism, environmental management, equality, diversity and human rights, and support for local communities.
requirements.The Group is exposed to a variety of risks associated with its financial stability and ability to borrow and satisfy debt covenants
While the riskstrategy of litigation
the Group is to extend the hotel network through activities that do not involve significant amounts of its own capital, the Group does require capital to fund some development opportunities and to maintain and improve owned hotels. The Group
could be at riskis reliant upon having financial strength and access to borrowing facilities to meet these expected capital requirements. The majority of
litigation from many parties, including guests, customers, joint venture partners, suppliers, employees, regulatory authorities, franchiseesand/orthe
owners of hotels managed by it. Claims filedGroup’s borrowing facilities are only available if the financial covenants in the
USfacilities are complied with. Non-compliance with covenants could result in the lenders demanding repayment of the funds advanced. If the Group’s financial performance does not meet market expectations, it may
include requestsnot be able to refinance existing facilities on terms considered favorable.The Group is exposed to funding risks in relation to the defined benefits under its pension plans
The Group is required by law to maintain a minimum funding level in relation to its ongoing obligation to provide current and future pensions for punitive damages as well as compensatory damages. Exposuremembers of its UK pension plans who are entitled to litigation or fines imposeddefined benefits. The contributions payable by regulatory authorities may also affect the reputationGroup must be set with a view to making prudent provision for the benefits accruing under the plans of the Group.
In particular, the trustees of the Group’s UK defined benefit plan may demand increases to the contribution rates relating to the funding of this plan, which would oblige relevant employers of the Group to contribute extra amounts. The trustees must consult the plan’s actuary and principal employer before exercising this power.
In practice, contribution rates are agreed between the Group and the trustees on actuarial advice, and are set for three-year terms. The funding implications of the last actuarial review are disclosed in the Notes to the Consolidated Financial Statements on pages F-30 to F-35.
The Group may face difficulties insuring its business
Historically, the Group has maintained insurance at levels determined to be appropriate in light of the cost of cover and the risk profiles of the business in which it operates. However, forces beyond the Group’s control, including market forces, may limit the scope of coverage the Group can obtain and the Group’s ability to obtain coverage at reasonable rates. Other forces beyond the Group’s control, such as terrorist attacks or natural disasters may be uninsurable or simply too expensive to insure. Inadequate or insufficient insurance could expose the Group to large claims or could result in the loss of capital invested in properties, as well as the anticipated future revenue from properties, and could leave the Group responsible for guarantees, debt or other financial obligations related to such properties.
12
The Group’s pipeline ensures sustainable development in new and emerging markets that best suit the Company’s strengths and anticipate the future needs of customers. The Group has committed development teams ensuring a sizeable pipeline in developing markets: during 2010 the Group opened 7,253 rooms in Greater China, representing 20% of all new rooms opened by it across the globe during 2010.
The Group’s pipeline is the largest branded hotel pipeline in the world, representing 18% of all hotels under development, including those that are independent or unaffiliated.
Winning with our scale and expertise
The major benefit the Group brings to guests who stay in the Group’s portfolio of hotels, and owners who invest with us, is our system to help guests book and stay with us, and then maintain the relationship with them after they leave. This includes having hotels in key locations, great brands with consumer appeal, efficient reservations systems, global web presence, our loyalty rewards schemes, along with other elements. Together, these form the largest such ‘system’ in the industry and are the engine of our business, delivering, on average, 68% of total rooms revenue in 2010.
With continued focus on the success of this global system, we have developed“best-in-class” marketing and technology to support our hotels and drive incremental revenues.
Our focus on key geographical markets where we operate a large number of hotels, such as the US, UK, China, Middle East and Germany, means we can run hotels and our operating system with greater efficiencies, delivering more to the consumer at a lower cost.
The size of the global hotel market is estimated by the Group to be close to 20include 21.5 million rooms. Competitors in the market include other branded hotel companies, both large and small, international and domestic, and independently owned hotels.
IHG remains the largest branded hotel company, with our share currently at approximately 10% of the branded rooms (SmithSmith Travel Research), and a presence in 100 countries and territories. Leading research (Smith Travel Research)Research calculates that there are 6.67.3 million branded hotel rooms, with the remainder a combination of independent hotels, guesthouses and other types of lodging.
Although The Group believes that it holds the largest share of branded rooms, currently
less than halfapproximately 9% of
allbranded supply, distributed across nearly 100 countries and territories around the world. In 2012 the Group opened 33,922 new rooms worldwide (226 new hotels), resulting in an increase in the number of open Group hotel rooms
are branded,to 675,982 (4,602 hotels) at December 31, 2012, up 2.7% from 2011, taking into account the
benefitsremoval of
being parthotels which left the Group’s system.The benefits of a brand, such as the greater security and performance of a global reservation system, loyalty programs and international networks, are recognized byclear to many owners and the growthGroup is well-positioned to win the business of branded rooms has exceededowners seeking to grow with a hotel brand. Additionally, the growth of unbranded rooms over the past 10 years. Raising finance is still an issue globally,Group and branded hotels are perceived as offering greater security through global reservations systems, loyalty schemes, and international networks. Brandedother large hotel companies such ashave the Group, are attractive to independent hotel owners and are therefore gaining market share at the expensecompetitive advantage of the unbranded portion of the industry. The Group is well positioned to benefit from this trend.
Hotel owners are increasingly recognising the benefits of franchising or managing with the Group, which can offer a
global portfolio of brands
tothat suit the different real estate
or market opportunities an owner may
have.To ensure the Group’s strategy continues to be sustainable in the changing business environment and suitable for the Group’s capabilities, the Group closely monitors markets across the globe and follows key industry and business metrics such as RevPAR, average daily rate, demand, GDP and guest satisfaction.
The Group’s strategy
With a portfolio of preferred Brands in the most attractive markets, the Group’s talented People are focused on delivering Great Hotels Guests Love and executing a clear set of priorities to achieve its Vision of becoming one of the great companies in the world.
Delivering the elements of the Group’s strategy
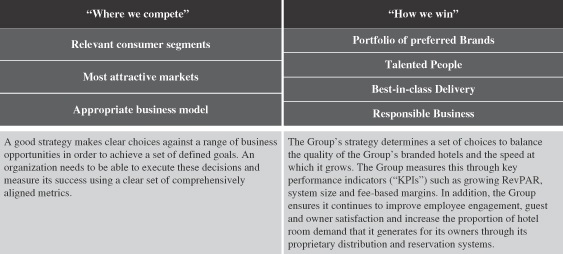
“Where we compete”
Competing in relevant consumer segments
The hotel industry is usually segmented according to price point and IHG is focused on the three segments that generate over 90% of branded hotels revenue, namely midscale (broadly three star), upscale (mostly four star) and luxury (five star). However, to build preferred Brands, the Group believes it needs to advance its understanding of its guests and their needs to ensure its brands remain contemporary and relevant.
The Group has therefore completed a fundamental occasion-based needs segmentation analysis to understand why guests book hotels — looking at who they are, the occasion they are traveling for and their needs when traveling. Many guests no longer have togethera single purpose for their hotel stay — for example, business trips turn into family holidays, and the Group needs to meet these demands, focusing more on the needs of its guests, to deliver loyalty and brand preference. The Group used this analysis to develop the brand proposition for its two new brands, HUALUXE Hotels & Resorts and EVEN Hotels, and it continues to work on this needs-based segmentation to help inform its view of the hotel market and its brand strategies going forward.
Competing in the most attractive markets
The Group’s strategy is to build preferred Brands with effective revenue delivery through global reservations channels. Furthermore, hotel ownership is increasingly being separatedscale positions in the most attractive markets globally. Concentrating growth in the largest markets means the Group and owners can operate more efficiently and benefit from hotel operations, encouraging hotel owners to use third parties,enhanced revenues and reduced costs. The Group’s key markets include large developed markets such as the US, UK and Germany, as well as emerging markets like China and India.
The US is the largest market for branded hotels, with 3.38 million rooms, accounting for 69% of all US rooms available. The segment in the US with the greatest share is midscale, with 1.38 million branded hotel rooms, and the Group’s Holiday Inn brand family, comprising Holiday Inn, Holiday Inn Express, Holiday Inn Club Vacations and Holiday Inn Resort, is the largest brand in this segment.
In China, the Group sees the greatest opportunity for growth of any single country and its strategy has been to enter the market early, to develop its relationships with key local third-party owners and grow its presence rapidly. In a country with 659,000 branded hotel rooms, the Group is the largest international hotel company with
over 61,000 rooms across its brands and more than 50,000 in the planning phase or under construction. This rapid pace of openings for the Group has been in anticipation of increasing demand for hotels, driven by a large, emerging middle class and growing domestic and international travel.
The Group is also focused on developing in other high priority markets. It seeks to develop its portfolio of brands in those markets which will be sources of strong hotel demand in the future. The Group has continued to build its position in these markets in the last year. For example, the Group increased the distribution of its core brands in India, building on its leadership position of Holiday Inn. In Russia and the Commonwealth of Independent States (“CIS”), there are opportunities for new construction and conversions as well as strong demand for branded hotels. The Group continues to adapt its business model by market, choosing partnerships and joint ventures where appropriate.
Outside the largest markets, the Group focuses on building presence in key gateway cities where its brands can generate revenue premiums from high business and leisure demand.
During 2012, the Group opened 33,922 rooms in 26 countries and territories, and signed a further 53,812 rooms into its development pipeline (hotels in planning and under construction but not yet opened) across 33 countries and territories. As part of its ongoing commitment to maintaining the quality of its brands, the Group removed 16,288 rooms during the year. As at December 31, 2012, the Group had the second largest pipeline in the industry, with 169,030 rooms in 1,053 hotels across 60 countries and territories. This represents a market share of 12% of all hotels under development, including those that are independent or unaffiliated with a brand.
Competing with an appropriate business model
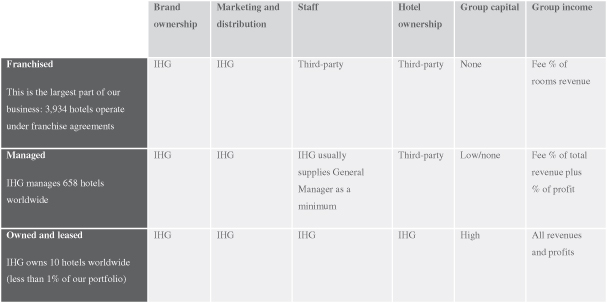
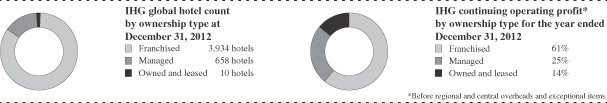
As can be seen in the diagrams above and below, the Group’s business model is focused on franchising and managing hotels, rather than owning them, enabling it to grow at an accelerated pace with limited capital investment. This allows the Group to manage their hotels.
focus on building strong, preferred Brands based on relevant consumer needs, leaving asset management and real estate to its local third-party owners with the necessary expertise. With this “asset-light” approach, the Group also benefits from the reduced volatility of fee-based income streams, as compared with the ownership of assets. It allows the Group to focus on building strong delivery systems such as its branded hotel websites and call centers, creating greater returns for owners.A key characteristic of the franchised and managed business model is that it is highly cash generative, with a high return on capital employed. This business model enables the Group to focus on growing its fee revenues (Group revenue excluding owned and leased hotels, managed leases (being properties structured for legal reasons
as operating leases but with the same characteristics as management contracts) and significant liquidated damages) and fee-based margins (operating profit as a percentage of revenue, excluding revenue and operating profit from owned and leased hotels, managed leases and significant liquidated damages).
As at December 31, 2012, 86% of the Group’s operating profit (before regional and central overheads and exceptional items) wasderived from franchised and managed operations. In some situations, the Group supports its brands by using its capital to build or support the funding of flagship assets in high-demand locations in order to drive growth. The Group plans to recycle capital by selling these assets when the time is right and to reinvest elsewhere in the business and across its portfolio.
On November 6, 2012, the Group announced that the InterContinental London Park Lane would be the next hotel considered for sale and that discussions regarding the disposal of the InterContinental New York Barclay were progressing and would be opened to a wider group of prospective buyers. On February 19, 2013, the Company announced that the disposal process for InterContinental London Park Lane had commenced, and was continuing for InterContinental New York Barclay.
The Group continues to invest for growth, strengthening both its existing brands and launching new ones.
“How we win”
Winning with oura portfolio of preferred Brands
The Group aims to build a portfolio of brands that are bigger, better, and stronger:
Bigger means the Group has prioritized its growth strategy to build brand scale and leverage this scale through greater operational efficiency.
Better means a focus on continuous improvement in how the Group develops and delivers its brands to ensure guest needs are met with a consistent, high-quality experience.
Stronger means a focus on driving brand preference among guests, owners, investors and employees.
As part of the Group’s commitment to deliver against its brand strategy, in 2012, the Group launched two unique new brands to the market, which complement its overall portfolio of brands.
Further information on the Group’s portfolio can be found on page 27.
Winning with talented People
The Group believes that its preferred Brands are brought to life by its talented and passionate People. Therefore to deliver on its brand promise, the Group must attract, retain and develop the very best talent in the industry to service its guests and bring its Brands to life.
The Group directly employed an average of 7,981 people worldwide in the year ended December 31, 2012, whose costs were borne by the Group. When the whole of the Group’s estate is taken into account (including staff working in the franchised and values
managed hotels) over 350,000 people worked globally across all the Group’s brands as at December 31, 2012.The four pillars of the Group’s People strategy are:
Our Vision can only be realized if we have collaborativeDeveloping a BrandHearted culture: The Group’s brands are brought to life by its talented and engaged employees, deliveringpassionate People and it has focused on developing and improving its tools, to make it easy for its People to deliver the right experiencebrand promise. In 2012, the Group launched a new brand framework focused on transforming its brand standards and looked at how it manages projects - all part of developing a BrandHearted culture.
Making IHG a great place to our guests through shared valueswork: The Group believes in treating people as individuals and living our brands. We have extensive on-boarding, communication, development and recognition programs, aligned under our employment brand,celebrating achievements. The Group calls this “Room to be yourself”, providing the right environment for our people and this commitment is brought to life by four key promises. The Group continues to be successful.recognized around the globe as an employer of choice.
20
Delivering world-class People Tools to our owners: By partnering with the hotel human resources community, the Group has developed a set of award-winning “People Tools” that not only help increase employee retention and guest satisfaction but also drive efficiencies and increase revenue for the Group’s owners.
Building a strong leadership team: To grow its business sustainably and responsibly, the Group needs a strong BrandHearted leadership team. Therefore, it has created a “Leadership Framework”, which clearly defines what great leadership looks like to help develop the Group’s leaders of tomorrow.
Being the hotel company for the London 2012 Olympic and Paralympic Villages was a groundbreaking opportunity for the Group, giving its People in London 2012 the opportunity to benefit from new skills and experiences.
Winning with best-in-class DeliveryDuring 2012, the Group remained focused on attracting guests (room nights) to its hotels and its portfolio of brands. The Group leverages its size and scale to drive demand to its hotels, executing a multi-channel strategy that enables guests to search and book in the most appropriate mode for them, either over the phone, by computer or via an application on a mobile device. The Group maximizes the demand it delivers through these channels through advanced techniques that manage revenue per booking, drive customer loyalty and maximize owner returns. The Group’s channels and loyalty program, Priority Club Rewards, are the engine of the Group’s business.
Our people dictate our culture,The Group’s channelsAs part of its multi-channel strategy, the Group aims to increase revenue and bookings using its direct channels. During 2012, revenue generated through the Group’s websites increased to $3.4 billion whilst its global call centers answered more than 23 million inbound contacts and drove more than $1.9 billion in revenue for its hotels.
Mobile communications are also having profound effects on the hotel industry and the Group is aligned around great values which are consistently broughthas been quick to life through a set of five behaviors, the “Winning Ways”:
| | |
| • | Do the right thing; |
|
| • | Show we care; |
|
| • | Aim Higher; |
|
| • | Celebrate difference; and |
|
| • | Work better together. |
Business relationshipsadapt to these new channels with others
significant growth in revenue generated thorough its branded mobile applications, across all major platforms, rising from $2.4 million in 2009 to more than $330 million in 2012.The Group maintains effective relationships across all aspectsis also a founding member of roomkey.com, which was launched in 2012 as the first industry-owned hotel search engine, providing another innovative channel to increase guest nights to its brands.
Social media has also changed the way in which the Group communicates with guests and with its stakeholders in general. The Group’s new “Guest Ratings and Review” tool, which launched on its websites in 2012 enables guests to share their thoughts about their hotel experiences so that future guests can take this into account during the booking process.
Priority Club Rewards
Priority Club Rewards was the hotel industry’s first loyalty program and is the largest of its operations. kind in the world with 71.4 million members at the end of 2012, an increase of 13% during the year. In 2012, it won Premier Traveler magazine’s inaugural award for Best Hotel Loyalty Program and Global Traveler magazine’s award for Best Hotel Rewards Program for the eighth consecutive year.
The Group’s operations are not dependent upon any single customer, supplier or hotel owner dueGroup also leverages sales and marketing expertise in order to support its multi-channel strategy. The System Fund (the “Fund”) is a $1.2 billion fund of cash assessments and contributions, collected by the extent of its brands, market segments and geographical coverage. For example,Group from hotels within the Group’s largest third-party hotel owner controls just 3%system, and proceeds from the sale of the Group’s total room count.
Priority Club Rewards points. The Group continued to enhance and streamline its procurement processes during 2010, and with the implementation of initiatives to combat waste and enhance relationships with suppliers,System Fund is managed by the Group is striving to ensure best-practice is employed throughout the Group. With a focus on ensuring high-quality goods and services are sourced at competitive prices, the Group strives to ensure enhanced value for the Group, our hotel owners and shareholders.
IHG is proud of its strong and important relationship with the IAHI, the Owners’ Association for ownersbenefit of hotels in the Group’s
sevensystem with the objective of driving revenues for the hotels. It is therefore used to pay for marketing, the Priority Club Rewards loyalty program and the global reservation system.As a result of the power of its revenue delivery systems the Group has built strong relationships with its owners. These relationships are founded on the ability to deliver high returns to owners using premium revenue generating products. The Group meets with the IHG Owners Association (the organization that represents owners of hotels operating under the Group’s brands across the world. IHG meets with the IAHI, in large and small groups,world) on a regular basis and works together to support and facilitate the continued development of the Group’s brands and systems. During 2010,
Winning with Responsible Business practices
With over 4,600 hotels in nearly 100 countries and territories around the combined workworld, the Group’s commitment to being a Responsible Business is central to its Vision of being one of the great companies of the world. The Group understands how important it is to champion and protect the trusted reputation of the Group and IAHI implemented several enhancementsits brands and this is embedded in its culture. The Group believes that being a responsible business is necessary to the Group’s system.
Examples of such enhancements include:
Holiday Inn relaunch — the near completionenable it to stay ahead of the $1 billion global relaunchcompetition and grow, creating value for all of its shareholders and stakeholders in the Holiday Inn brand family;
InnSupply — improving purchasing efficiencieslong term. Amongst other things, it offers the Group a huge opportunity to innovate, create employment, empower people to perform at their best and streamlining the procurement processes across both organizations;
Way of Sales — developing“best-in-class” practicesfeel good about what they do, and drive value for the sales operations of both organizations, having identified critical roles for generating revenues;
Celebrate Service week — giving recognition and thanks to the many thousands of front-line employees, and emphasizing engagement through the Group’s brands; and
People Tools — enhancing the recruitment, hiring, training and retention practices across both organizations, with specific focus on reflecting the individual qualities ofbusiness. That’s why Responsible Business underpins each brand. These tools are supplied to all hotels: managed, franchised and owned and leased.
Many jurisdictions and countries regulate the offering of franchise agreements and recent trends indicate an increase in the number of countries adopting franchise legislation. As a significant percentage of the Group’s
revenue is derived from franchise fees,three strategic corporate priorities of preferred Brands, talented People and best-in-class Delivery, which work together to determine “How We Win” to create Great Hotels Guests Love.Governance and leadership
The Group’s Chairman, the Board and its committees (Audit Committee, Corporate Responsibility Committee, Nomination Committee and Remuneration Committee) provide strong leadership and promote a responsible business culture by maintaining high standards in corporate governance, corporate responsibility and internal control and risk management.
Brands
Trusted brands deliver a superior and consistent brand experience and to achieve this, the Group requiresaclear brand framework. Brand standards are the foundations of a clear brand framework for all the Group’s continuedhotels and its compliance teams ensure that its hotels deliver in accordance with franchise legislationthese. The Group’s brand safety standards assist hotels in providing a safe and secure environment for its guests and employees. The Group’s corporate responsibility programs have also been designed so that they can be implemented throughout the Group’s hotel brands and corporate offices in any region.
People
At the core of being a Responsible Business is important toensuring that the successful deploymentactions of all of the Group’s strategy.
21
DeliveryHaving in place an effective system of internal controls and risk management is essential to being a Responsible Business. The Group’s tools, processes and procedures ensure a business based on a solid foundation with a commitment to doing the right thing for the benefit of all its stakeholders.
“Measuring our successsuccess”
We measure our success in terms of shareholder value, as well as throughThe Group has a holistic set of strategic priorities. These form ourcarefully selected key performance indicators (KPIs)(“KPIs”) to ensure a consistent approach to runningmonitor its success in achieving its strategy. These are organized around the business. These KPIs consistelements of “Wherethe Group’s strategy:
“Where we compete”, includingfocusing on relevant consumer segments, the most attractive markets and the appropriate business model, key target marketsmodel; and consumer segments; and “How
“How we win”, including financial returns, our people,focusing on corporate priorities of preferred Brands, talented People, best-in-class Delivery and Responsible Business.
In particular, the guest experienceGroup uses the following measures to monitor performance:
fee revenues and responsible business.fee-based margins;
system contribution — the proportion of business delivered to Group hotels by its dedicated IHG booking channels;
Responsible Business practices.
These KPIs are used to measure the progress of the Group to deliver Great Hotels Guests Love and achieve its Vision of becoming one of the great companies of the world.
The Group’s performance against these KPIs over the 2010-2012 period is summarized below:
“Where we competecompete”
| | | | | | |
| Strategic priorities | | KPIs | | Current status and 2012 development | | 2013 priorities |
| | Key performance
| | Current statusMost attractive markets and
| | |
Strategic priorities
| | indicators (KPIs)
| | 2010 developments
| | 2011 priorities
|
|
| appropriate business model To accelerate profitable growth of ourits core business in the largestits most attractive markets where presence and scale really count using the right business model to drive its fee revenue and also in key global gateway cities. Seek opportunities to leverage our scale in new business areas.income streams. | | • Sustained system size growth; and
• deal signings focused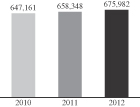
Net rooms supply 
Growth in scale markets and key gateway cities.fee revenue1 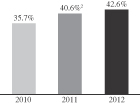
Fee-based margins | | • System size maintained at 647,161grown to 675,982 rooms;
• over 90% of deals signed in4,602 hotels opened globally; • built scale markets and key gateway cities;
• re-entry into Hawaii with a Holiday Inn Resort;
• opening our second Hotel Indigo in London, and our first in Asia Pacific, on the Bund in Shanghai;
• 17 signings of Hotel Indigo brand to 50 hotels globally; and Staybridge Suites outside • fee-based margins of North America; and
• 259 hotels opened globally.42.6%, up two percentage points on 2011, a particularly strong result. | | • Continue international roll-out of Staybridge Suites and Hotel Indigo;
• accelerateAccelerate growth strategies in quality locations in agreed scale markets; and
• continue to leverage scale and build upon improved strategic position during the economic downturn.scale. |
22
| 2 | One percentage point growth on an underlying basis. |
“How we winwin” — Delivering Great Hotels Guests Love
| | | | | | |
| Strategic priorities | | KPIs | | Current status and 2012 development | | 2013 priorities |
Strategic priorities
Financial returns
To generate higher returns forPreferred Brands Operate a portfolio of preferred, locally-relevant brands attractive to both owners and guests that have clear market positions and differentiation in the Groupeyes of the guest. | | 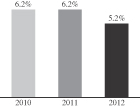
Global RevPAR growth/(decline) Comparable hotels, constant $ | | •Clarified the brand propositions for Holiday Inn and Holiday Inn Express and celebrated the Holiday Inn 60th anniversary; •continued the repositioning of Crowne Plaza; •achieved two new brand launches in two geographies; and •achieved strong brand successes in Greater China, particularly through the growth of HUALUXE Hotels & Resorts with 15 signings for the brand and improved the strength of Crowne Plaza through brand preference and awareness. | | •Invest to build long-term brand preference for the Holiday Inn brand family; •continue the repositioning of the Crowne Plaza brand; •support growth of its new brands: EVEN Hotels in the US and HUALUXE Hotels & Resorts in Greater China; and •continue to deliver a consistent brand experience and increased revenue share, improved operating efficiency and growing margins.
Our people
Creatingguest satisfaction through its needs-based segmentation analysis. |
Talented People Create hotels that are well run, with brands brought to life by people who are proud of the work they do.
Guest experience
To operate | | 
Employee engagement scores Average of two Employee Engagement surveys per year | | •New brand management training launched for General Managers; •all of its corporate offices and more than 4,000 Group hotels participated in Celebrate Service week, its global employee recognition event; •created a portfolionew Mandarin recruitment site and launched career pages on social networking platforms in China to continue its aim to be employer of brands attractivechoice; and •industry-leading suite of People Tools now embedded in its franchised and managed hotel estate. | | •Empower its frontline teams with the tools and training to bothconsistently deliver great guest experiences that build brand preference, advocacy and repeat business; •continue to strengthen its talent pipeline and succession planning to meet its growth ambitions; •instill a winning culture through strong leadership and performance management; and •build on its strong employer brand to make the Group a magnet for talent. |
| | | | | | |
| Strategic priorities | | KPIs | | Current status and 2012 development | | 2013 priorities |
Best-in-class Delivery Generate higher returns for owners and guests that have clear market positionsthe Group through increased revenue share, improved operating efficiency and differentiationgrowing margins. | | 
Total gross revenue Actual $billion | | •Launched strategic industry partnership in roomkey.com; •71.4 million Priority Club Rewards members — 8.4 million new members enrolled in 2012, up 13% on 2011; and •global Group sales force with 17,600 sales professionals. | | •Continue to strengthen the eyesGroup’s system of delivering profitable demand to hotels; •put in place the guest.
required technology infrastructure to enable growth; and •continue to increase business from its loyalty program, Priority Club Rewards. |
Responsible business
To takeBusiness Take a proactive stance and seek creative solutions through innovationon environmental sustainability and collaboration on environment and community issues, and to drive increasedsustainable communities in a way that drives shared value for the Group, owners, guests and the communities where we operate.in which IHG operates. | |  
Hotels signed-up to Green Engage Hotels, cumulative 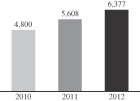
Participants benefiting from the IHG Academy | | Current status and 2010 developments
• Further procurement efficiencies made;
• enhanced Customer Relationship Management with new technology and campaign management tools to involve non-Priority Club Rewards (PCR) members; and
• enhanced communications with PCR loyalty program members with refreshed loyalty systems.
• Launched and cascaded our Vision to become one2,219 of the world’s great companies;
• developed management tools to deliver a branded guest experience;
• further emphasis on our cultureGroup’s hotels enrolled in Green Engage by end of learning and development with industry recognition;
2012; • “Celebrate Service” week — a global event to recognize our people,11.7% energy savings in partnership with the IAHI ownership community; and
• managing employee engagement.
• Global pilots to identify opportunities to create branded hallmarks with guest appeal;
• near completion of the Holiday Inn relaunch; and
• grew our industry-leading loyalty program PCR, to 56 million members, contributing $6.5 billion of global system rooms revenue.
• “Green Engage” developed (patent pending); rolled out to over 1,000 hotels by December 31, 2010;
• collaborated with the University of Oxford’s Department of Plant Sciences to understand better how hotel design and development impacts the environment; and
• Corporate Responsibility approach defined and agreed. | | 2011 priorities
• Capitalize on recovery of group and meetings business;
• strengthen global sales force effectiveness;
• optimize revenues from third party and Group websites;
• ensure the Group’s industry leading system of delivering demand and revenue to hotels retains competitive advantage; and
• strengthen loyalty program, with enhanced member offer.
• Cascade of branded management tools to whole hotel estate, including our franchised hotels;
• ongoing partnership with IAHI ownership community for people events;
• continued focus on developing skills to deliver our Vision and branding capability; and
• opportunities for employees and communities to be involved with Olympics partnership.
• Leverage strong position of Holiday Inn relaunch with roll-out of global marketing initiatives;
• ensure growth plans of each brand aligns fully with corporate Vision;
• focus on strength of Priority Club Rewards and visibly enhance offering to its members in hotels and across global reservations channels; and
• increase the Group’s business from Priority Club Rewards members.
• Continue to roll out “Green Engage” to our owned and managed hotels,estate by end of 2012 (on a per available room night basis);•industry standard for measuring carbon was launched in 2012 and expand into the franchised estateincluded in all regions;
• work with stakeholders, such as Harvard University, to educate decision-makers onGreen Engage via the Group’s economic impacts;new carbon calculator; •over 150 IHG Academy programs by the end of 2012; and
•fan base of the “IHG Planet CR” Facebook page expanded to over 20,000 by the end of 2012. | | •Work to ensure all Group hotels that are enrolled in Green Engage effectively use the tool for the greatest impact; •continue to embed our community strategy, including establishingdrive awareness and engagement around the “IHG Academy”IHG Shelter in a Storm Programme; •continue to expand the IHG Academy program throughout the world; and •focus on driving awareness of the Group’s approach to corporate responsibility across internal and activating our strategic partner in providing disaster recovery.external stakeholder groups using a variety of channels, to maximize employee pride, and reinforce the Group’s reputation as a Responsible Business. |
23
Segmental Resultsresults by Activityactivity
The following table shows the Group’s continuing revenue and operating profit before exceptional operating items by activity and the percentage contribution of each activity, for the years ended December 31, 2010, 20092012, 2011 and 2008.
| | | | | | | | | | | | | |
| | | Year ended December 31, |
| | | 2010 | | 2009 | | 2008 |
| | | ($ million) |
| |
Revenue(1) | | | | | | | | | | | | |
| Americas | | | | | | | | | | | | |
| Franchised | | | 465 | | | | 437 | | | | 495 | |
| Managed | | | 119 | | | | 110 | | | | 168 | |
| Owned and leased | | | 223 | | | | 225 | | | | 300 | |
| | | | | | | | | | | | | |
| | | | 807 | | | | 772 | | | | 963 | |
| | | | | | | | | | | | | |
| EMEA | | | | | | | | | | | | |
| Franchised | | | 81 | | | | 83 | | | | 110 | |
| Managed | | | 130 | | | | 119 | | | | 168 | |
| Owned and leased | | | 203 | | | | 195 | | | | 240 | |
| | | | | | | | | | | | | |
| | | | 414 | | | | 397 | | | | 518 | |
| | | | | | | | | | | | | |
| Asia Pacific | | | | | | | | | | | | |
| Franchised | | | 12 | | | | 11 | | | | 18 | |
| Managed | | | 155 | | | | 105 | | | | 113 | |
| Owned and leased | | | 136 | | | | 129 | | | | 159 | |
| | | | | | | | | | | | | |
| | | | 303 | | | | 245 | | | | 290 | |
| | | | | | | | | | | | | |
Central(2) | | | 104 | | | | 124 | | | | 126 | |
| | | | | | | | | | | | | |
| Total | | | 1,628 | | | | 1,538 | | | | 1,897 | |
| | | | | | | | | | | | | |
Operating profit before exceptional operating items(1)(3) | | | | | | | | | | | | |
| Americas | | | | | | | | | | | | |
| Franchised | | | 392 | | | | 364 | | | | 426 | |
| Managed | | | 21 | | | | (40 | ) | | | 51 | |
| Owned and leased | | | 13 | | | | 11 | | | | 55 | |
| Regional overheads | | | (57 | ) | | | (47 | ) | | | (67 | ) |
| | | | | | | | | | | | | |
| | | | 369 | | | | 288 | | | | 465 | |
| | | | | | | | | | | | | |
| EMEA | | | | | | | | | | | | |
| Franchised | | | 59 | | | | 60 | | | | 75 | |
| Managed | | | 62 | | | | 65 | | | | 95 | |
| Owned and leased | | | 40 | | | | 33 | | | | 45 | |
| Regional overheads | | | (36 | ) | | | (31 | ) | | | (44 | ) |
| | | | | | | | | | | | | |
| | | | 125 | | | | 127 | | | | 171 | |
| | | | | | | | | | | | | |
| Asia Pacific | | | | | | | | | | | | |
| Franchised | | | 7 | | | | 5 | | | | 8 | |
| Managed | | | 73 | | | | 44 | | | | 55 | |
| Owned and leased | | | 35 | | | | 30 | | | | 43 | |
| Regional overheads | | | (26 | ) | | | (27 | ) | | | (38 | ) |
| | | | | | | | | | | | | |
| | | | 89 | | | | 52 | | | | 68 | |
| | | | | | | | | | | | | |
Central(2) | | | (139 | ) | | | (104 | ) | | | (155 | ) |
| | | | | | | | | | | | | |
| Total | | | 444 | | | | 363 | | | | 549 | |
| | | | | | | | | | | | | |
Footnotes on page 25.
24
| | | | | | | | | | | | |
| | | Year ended December 31, | |
| | | 2012 | | | 2011 | | | 2010 | |
| | | ($ million) | |
Revenue(1) | | | | | | | | | | | | |
Americas | | | | | | | | | | | | |
Franchised | | | 541 | | | | 502 | | | | 465 | |
Managed | | | 97 | | | | 124 | | | | 119 | |
Owned and leased | | | 199 | | | | 204 | | | | 223 | |
| | | | | | | | | | | | |
| | | 837 | | | | 830 | | | | 807 | |
| | | | | | | | | | | | |
Europe | | | | | | | | | | | | |
Franchised | | | 91 | | | | 86 | | | | 76 | |
Managed | | | 147 | | | | 118 | | | | 70 | |
Owned and leased | | | 198 | | | | 201 | | | | 180 | |
| | | | | | | | | | | | |
| | | 436 | | | | 405 | | | | 326 | |
| | | | | | | | | | | | |
AMEA | | | | | | | | | | | | |
Franchised | | | 18 | | | | 19 | | | | 15 | |
Managed | | | 152 | | | | 151 | | | | 155 | |
Owned and leased | | | 48 | | | | 46 | | | | 43 | |
| | | | | | | | | | | | |
| | | 218 | | | | 216 | | | | 213 | |
| | | | | | | | | | | | |
Greater China | | | | | | | | | | | | |
Franchised | | | 3 | | | | 2 | | | | 2 | |
Managed | | | 89 | | | | 77 | | | | 60 | |
Owned and leased | | | 138 | | | | 126 | | | | 116 | |
| | | | | | | | | | | | |
| | | 230 | | | | 205 | | | | 178 | |
| | | | | | | | | | | | |
Central(2) | | | 114 | | | | 112 | | | | 104 | |
| | | | | | | | | | | | |
Total | | | 1,835 | | | | 1,768 | | | | 1,628 | |
| | | | | | | | | | | | |
Operating profit before exceptional operating items(1)(3) | | | | | | | | | | | | |
Americas | | | | | | | | | | | | |
Franchised | | | 466 | | | | 431 | | | | 392 | |
Managed | | | 48 | | | | 52 | | | | 21 | |
Owned and leased | | | 24 | | | | 17 | | | | 13 | |
Regional overheads | | | (52 | ) | | | (49 | ) | | | (57 | ) |
| | | | | | | | | | | | |
| | | 486 | | | | 451 | | | | 369 | |
| | | | | | | | | | | | |
Europe | | | | | | | | | | | | |
Franchised | | | 65 | | | | 65 | | | | 55 | |
Managed | | | 32 | | | | 26 | | | | 17 | |
Owned and leased | | | 50 | | | | 49 | | | | 38 | |
Regional overheads | | | (32 | ) | | | (36 | ) | | | (32 | ) |
| | | | | | | | | | | | |
| | | 115 | | | | 104 | | | | 78 | |
| | | | | | | | | | | | |
AMEA | | | | | | | | | | | | |
Franchised | | | 12 | | | | 12 | | | | 8 | |
Managed | | | 90 | | | | 87 | | | | 88 | |
Owned and leased | | | 6 | | | | 5 | | | | 4 | |
Regional overheads | | | (20 | ) | | | (20 | ) | | | (18 | ) |
| | | | | | | | | | | | |
| | | 88 | | | | 84 | | | | 82 | |
| | | | | | | | | | | | |
| | | | | | | | | | | | | |
| | | Year ended December 31, |
| | | 2010 | | 2009 | | 2008 |
| | | (%) |
| |
| Revenue | | | | | | | | | | | | |
| Americas | | | | | | | | | | | | |
| Franchised | | | 28.6 | | | | 28.4 | | | | 26.1 | |
| Managed | | | 7.3 | | | | 7.2 | | | | 8.9 | |
| Owned and leased | | | 13.7 | | | | 14.6 | | | | 15.8 | |
| | | | | | | | | | | | | |
| | | | 49.6 | | | | 50.2 | | | | 50.8 | |
| | | | | | | | | | | | | |
| EMEA | | | | | | | | | | | | |
| Franchised | | | 5.0 | | | | 5.4 | | | | 5.8 | |
| Managed | | | 8.0 | | | | 7.7 | | | | 8.9 | |
| Owned and leased | | | 12.4 | | | | 12.7 | | | | 12.6 | |
| | | | | | | | | | | | | |
| | | | 25.4 | | | | 25.8 | | | | 27.3 | |
| | | | | | | | | | | | | |
| Asia Pacific | | | | | | | | | | | | |
| Franchised | | | 0.7 | | | | 0.7 | | | | 0.9 | |
| Managed | | | 9.5 | | | | 6.8 | | | | 6.0 | |
| Owned and leased | | | 8.4 | | | | 8.4 | | | | 8.4 | |
| | | | | | | | | | | | | |
| | | | 18.6 | | | | 15.9 | | | | 15.3 | |
| | | | | | | | | | | | | |
| Central | | | 6.4 | | | | 8.1 | | | | 6.6 | |
| | | | | | | | | | | | | |
| Total | | | 100.0 | | | | 100.0 | | | | 100.0 | |
| | | | | | | | | | | | | |
| Operating profit before exceptional operating items | | | | | | | | | | | | |
| Americas | | | | | | | | | | | | |
| Franchised | | | 88.3 | | | | 100.2 | | | | 77.6 | |
| Managed | | | 4.7 | | | | (11.0 | ) | | | 9.3 | |
| Owned and leased | | | 2.9 | | | | 3.0 | | | | 10.0 | |
| Regional overheads | | | (12.8 | ) | | | (12.9 | ) | | | (12.2 | ) |
| | | | | | | | | | | | | |
| | | | 83.1 | | | | 79.3 | | | | 84.7 | |
| | | | | | | | | | | | | |
| EMEA | | | | | | | | | | | | |
| Franchised | | | 13.3 | | | | 16.5 | | | | 13.6 | |
| Managed | | | 14.0 | | | | 17.9 | | | | 17.3 | |
| Owned and leased | | | 9.0 | | | | 9.1 | | | | 8.2 | |
| Regional overheads | | | (8.1 | ) | | | (8.5 | ) | | | (8.0 | ) |
| | | | | | | | | | | | | |
| | | | 28.2 | | | | 35.0 | | | | 31.1 | |
| | | | | | | | | | | | | |
| Asia Pacific | | | | | | | | | | | | |
| Franchised | | | 1.6 | | | | 1.4 | | | | 1.5 | |
| Managed | | | 16.4 | | | | 12.1 | | | | 10.0 | |
| Owned and leased | | | 7.9 | | | | 8.2 | | | | 7.8 | |
| Regional overheads | | | (5.9 | ) | | | (7.4 | ) | | | (6.9 | ) |
| | | | | | | | | | | | | |
| | | | 20.0 | | | | 14.3 | | | | 12.4 | |
| | | | | | | | | | | | | |
| Central | | | (31.3 | ) | | | (28.6 | ) | | | (28.2 | ) |
| | | | | | | | | | | | | |
| Total | | | 100.0 | | | | 100.0 | | | | 100.0 | |
| | | | | | | | | | | | | |
| | | | | | | | | | | | |
| | | Year ended December 31, | |
| | | 2012 | | | 2011 | | | 2010 | |
| | | ($ million) | |
Greater China | | | | | | | | | | | | |
Franchised | | | 4 | | | | 3 | | | | 3 | |
Managed | | | 51 | | | | 43 | | | | 30 | |
Owned and leased | | | 45 | | | | 37 | | | | 33 | |
Regional overheads | | | (19 | ) | | | (16 | ) | | | (12 | ) |
| | | | | | | | | | | | |
| | | 81 | | | | 67 | | | | 54 | |
| | | | | | | | | | | | |
Central(2) | | | (156 | ) | | | (147 | ) | | | (139 | ) |
| | | | | | | | | | | | |
Total | | | 614 | | | | 559 | | | | 444 | |
| | | | | | | | | | | | |
| | | | | | | | | | | | |
| | | Year ended December 31, | |
| | | 2012 | | | 2011 | | | 2010 | |
| | | (%) | |
Revenue | | | | |
Americas | | | | | | | | | | | | |
Franchised | | �� | 29.5 | | | | 28.4 | | | | 28.6 | |
Managed | | | 5.3 | | | | 7.0 | | | | 7.3 | |
Owned and leased | | | 10.8 | | | | 11.6 | | | | 13.7 | |
| | | | | | | | | | | | |
| | | 45.6 | | | | 47.0 | | | | 49.6 | |
| | | | | | | | | | | | |
Europe | | | | | | | | | | | | |
Franchised | | | 5.0 | | | | 4.9 | | | | 4.7 | |
Managed | | | 8.0 | | | | 6.7 | | | | 4.3 | |
Owned and leased | | | 10.8 | | | | 11.3 | | | | 11.0 | |
| | | | | | | | | | | | |
| | | 23.8 | | | | 22.9 | | | | 20.0 | |
| | | | | | | | | | | | |
AMEA | | | | | | | | | | | | |
Franchised | | | 1.0 | | | | 1.1 | | | | 0.9 | |
Managed | | | 8.3 | | | | 8.5 | | | | 9.5 | |
Owned and leased | | | 2.6 | | | | 2.6 | | | | 2.7 | |
| | | | | | | | | | | | |
| | | 11.9 | | | | 12.2 | | | | 13.1 | |
| | | | | | | | | | | | |
Greater China | | | | | | | | | | | | |
Franchised | | | 0.2 | | | | 0.1 | | | | 0.1 | |
Managed | | | 4.8 | | | | 4.4 | | | | 3.7 | |
Owned and leased | | | 7.5 | | | | 7.1 | | | | 7.1 | |
| | | | | | | | | | | | |
| | | 12.5 | | | | 11.6 | | | | 10.9 | |
| | | | | | | | | | | | |
Central | | | 6.2 | | | | 6.3 | | | | 6.4 | |
| | | | | | | | | | | | |
Total | | | 100.0 | | | | 100.0 | | | | 100.0 | |
| | | | | | | | | | | | |
| | | | | | | | | | | | |
| | | Year ended December 31, | |
| | | 2012 | | | 2011 | | | 2010 | |
| | | (%) | |
Operating profit before exceptional operating items | | | | | | | | | | | | |
Americas | | | | | | | | | | | | |
Franchised | | | 75.9 | | | | 77.1 | | | | 88.3 | |
Managed | | | 7.8 | | | | 9.3 | | | | 4.7 | |
Owned and leased | | | 3.9 | | | | 3.0 | | | | 2.9 | |
Regional overheads | | | (8.4 | ) | | | (8.7 | ) | | | (12.8 | ) |
| | | | | | | | | | | | |
| | | 79.2 | | | | 80.7 | | | | 83.1 | |
| | | | | | | | | | | | |
Europe | | | | | | | | | | | | |
Franchised | | | 10.6 | | | | 11.6 | | | | 12.4 | |
Managed | | | 5.2 | | | | 4.6 | | | | 3.8 | |
Owned and leased | | | 8.1 | | | | 8.8 | | | | 8.6 | |
Regional overheads | | | (5.2 | ) | | | (6.4 | ) | | | (7.2 | ) |
| | | | | | | | | | | | |
| | | 18.7 | | | | 18.6 | | | | 17.6 | |
| | | | | | | | | | | | |
AMEA | | | | | | | | | | | | |
Franchised | | | 2.0 | | | | 2.1 | | | | 1.8 | |
Managed | | | 14.6 | | | | 15.6 | | | | 19.8 | |
Owned and leased | | | 1.0 | | | | 0.9 | | | | 0.9 | |
Regional overheads | | | (3.3 | ) | | | (3.6 | ) | | | (4.0 | ) |
| | | | | | | | | | | | |
| | | 14.3 | | | | 15.0 | | | | 18.5 | |
| | | | | | | | | | | | |
Greater China | | | | | | | | | | | | |
Franchised | | | 0.7 | | | | 0.5 | | | | 0.7 | |
Managed | | | 8.3 | | | | 7.7 | | | | 6.7 | |
Owned and leased | | | 7.3 | | | | 6.6 | | | | 7.4 | |
Regional overheads | | | (3.1 | ) | | | (2.8 | ) | | | (2.7 | ) |
| | | | | | | | | | | | |
| | | 13.2 | | | | 12.0 | | | | 12.1 | |
| | | | | | | | | | | | |
Central | | | (25.4 | ) | | | (26.3 | ) | | | (31.3 | ) |
| | | | | | | | | | | | |
Total | | | 100.0 | | | | 100.0 | | | | 100.0 | |
| | | | | | | | | | | | |
| (1) | | The results of operations have been translated into US dollars at the average rates of exchange for the year. In the case of sterling, the translation rate $1 = £0.65 (2009£0.63 (2011 $1 = £0.64, 2008£0.62, 2010 $1 = £0.55)£0.65). In the case of the euro, the translation rate is $1 = €0.76 (2009€0.78 (2011 $1 = €0.72, 20082010 $1 = €0.68)€0.76). |
|
| (2) | | Central revenue primarily relates to Holidex (the Group’s proprietary reservation system)technology fee income. Central operating profit includes central revenue less costs related to global functions. |
|
| (3) | | Operating profit before exceptional operating items does not include exceptional operating items for all periods presented. Exceptional operating items (charge unless otherwise noted) by region were theThe Americas $8 million (2009 $301 million, 2008 $99 million); EMEA credit of $3$23 million (2009 $22(2011 credit of $35 million, 2008 $212010 $8 million); Asia Pacific $2Europe $4 million (2009 $7(2011 $39 million, 2008 $22010 $5 million); AMEA $5 million (2011 credit of $26 million, 2010 credit of $6 million); Greater China $nil (2011 $nil, 2010 $nil); and Central $nil (2009 $43$18 million 2008 $10 million)(2011 credit of $35 million, 2010 $nil). |
25
Global System
In addition to management or franchise fees, hotels within the Group’s system pay cash assessments and contributions which are collected by the Group for specific use within the System Fund (the “Fund”).Fund. The Fund also receives proceeds from the sale of Priority Club Rewards points. The Fund is managed for the benefit of hotels in the system with the objective of driving revenues for the hotels. The Fund is used to pay for marketing, the Priority Club Rewards loyalty program and the global reservations system.
Priority Club Rewards:The Group’s worldwide loyalty scheme, Priority Club Rewards, is the largest of its kind in the hotel industry. Members enjoy a variety of privileges and rewards as they stay at the Group’s hotels around the world. The global system room revenue generated from Priority Club Rewards members during 20102012 was $6.6$7.2 billion. Priority Club Rewards membership reached 5671 million customers as at December 31, 2010,2012, compared to 4863 million as at December 31, 2009.
2011.Central Reservations System Technology:The Group operatesowns the HolidexPlus reservations system. The HolidexPlus system receives reservations requests entered on terminals located at most of the Group’s reservations centers, as well as from global distribution systems operated by a number of major corporations and travel agents. Where local hotel systems allow, the HolidexPlus system immediately confirms reservations or indicates alternative accommodation available within the Group’s network. Confirmations are transmitted electronically to the hotel for which the reservation is made.
During 2012, the Group entered into a five-year technology outsourcing agreement with International Business Machines Corporation (“IBM”), pursuant to which IBM operates and maintains the infrastructure of the HolidexPlus system.Reservations Call Centers:The Group operates 10 reservations call centers around the world which enable it to sell in local languages in many countries and offer a high qualityhigh-quality service to customers.
Internet:The Group introduced electronic hotel reservations in 1995. The Internetinternet is an important communications, branding and distribution channel for hotel sales. The Group is a founding member of roomkey.com, which was launched in 2012 as the first industry-owned online hotel search engine.
During 2010, 24% (24%2012 the Group’s leading mobile booking platforms realized $330 million in 2009) of global system room revenue booked via the Internet through various branded websites, such as www.intercontinental.com and www.holidayinn.com, as well as certified third parties.
revenues, up from $2.4 million in 2009.The Group has established standards for working with third-party intermediaries — online travel distributors — who sell or re-sell the Group’s branded hotel rooms via their Internetinternet sites. Under the standards, certified distributors are required to respect the Group’s trademarks, ensure reservations are guaranteed through an automated and common confirmation process, and clearly present fees to customers.
During 2010, global system room revenue booked through the Group’s global systems (which includes Priority Club Rewards members, central reservations and call centers, global distribution systems and the Internet) was 68% (68% in 2009).
Sales and Marketingmarketing
The Group targets its sales and marketing expenditure in each region on driving revenue and brand awareness or, in the case of sales investments, targeting segments such as corporate accounts, travel agencies and meeting organizers. The majority of the Group’s sales and marketing expenditure is funded by contractual fees paid by most hotels in the system.
26
Global Brands
The Group offers hotel brands that appeal to guests with different needs and tastes. This requires a portfolio of large global brands, growing alongside innovative new brands to meet the unique experiences our guests desire.
The hotel industry is usually split into segments based upon price point and consumer expectations. The Group is focused on the three segments that together generate over 90% of branded hotel revenues: midscale (broadly 3 star hotels), upscale (mostly 4 star), and luxury (5 star).
| | | | | | | | | |
| | | At December 31, 2010 |
Brands | | Room numbers | | Hotels |
| |
| InterContinental Hotels & Resorts | | | 58,429 | | | | 171 | |
| Crowne Plaza Hotels & Resorts | | | 106,155 | | | | 388 | |
Holiday Inn Hotels & Resorts(1) | | | 230,117 | | | | 1,247 | |
| Holiday Inn Express | | | 191,228 | | | | 2,075 | |
| Staybridge Suites | | | 20,762 | | | | 188 | |
| Candlewood Suites | | | 28,253 | | | | 288 | |
| Hotel Indigo | | | 4,548 | | | | 38 | |
| Other | | | 7,669 | | | | 42 | |
| | | | | | | | | |
| Total | | | 647,161 | | | | 4,437 | |
| | | | | | | | | |
The Group operates the following brands:
| | | | | | | | |
| | | At December 31, 2012 | |
| | | Room numbers | | | Hotels | |
InterContinental Hotels & Resorts | | | 57,314 | | | | 170 | |
Crowne Plaza Hotels & Resorts | | | 108,307 | | | | 392 | |
Holiday Inn Hotels & Resorts(1) | | | 231,488 | | | | 1,247 | |
Holiday Inn Express | | | 205,631 | | | | 2,192 | |
Staybridge Suites | | | 20,696 | | | | 189 | |
Candlewood Suites | | | 28,675 | | | | 299 | |
Hotel Indigo | | | 5,661 | | | | 50 | |
Other | | | 18,210 | | | | 63 | |
| | | | | | | | |
Total | | | 675,982 | | | | 4,602 | |
| | | | | | | | |
| | |
| (1) | | IncludesIncluded Holiday Inn Club Vacations (2,892(3,701 rooms, 610 hotels) and Holiday Inn Resort properties (8,806 rooms, 37 hotels). |
InterContinental Hotels & Resorts
| | | | | | | | | | | | | |
| | | Americas | | EMEA | | Asia Pacific |
| |
Average room rate $(1) | | | 158.54 | | | | 232.90 | | | | 174.76 | |
Room numbers(2) | | | 19,120 | | | | 20,111 | | | | 19,198 | |
| | | | | | | | | | | | | | | | |
| | | Americas | | | Europe | | | AMEA | | | Greater China | |
Average room rate $(1) | | | 181.58 | | | | 251.80 | | | | 214.01 | | | | 171.37 | |
Room numbers(2) | | | 17,756 | | | | 9,394 | | | | 20,791 | | | | 9,373 | |
| | |
| (1) | | For the year ended December 31, 2010;2012; quoted at constant US$US dollar exchange rate. Average room rate is for comparable InterContinental hotels. |
|
| (2) | | At December 31, 2010.2012. |
InterContinental Hotels & Resorts (“InterContinental”) is the Group’s 5-starluxury brand located in majorkey cities in overand resort destinations across more than 60 countries worldwide. With over 60 years’years of experience, the brand’s understanding of high quality, understated service andtalented people supported by outstanding facilities coupled with a genuine interest in our guestshelp the Group to differentiate it in a competitive segment.segment by understanding that well-traveled and affluent people want to be connected to what is special about a hotel and its destination. The philosophy of the brandbrand’s ethos is to enable every guestempower guests to maximize the enjoyment ofshare their stay — specializing in engaging guests with the destination by sharing local knowledge to create authenticenjoy great experiences that enrich our guests’ lives and help them broaden their outlook.
lives.InterContinental hotels are principally managed by the Group. At December 31, 2010,2012, there were 171170 InterContinental hotels which represented 9%8% of the Group’s total hotel rooms. During 2010, nine2012, six InterContinental hotels were added to the portfolio, while fourfive hotels were removed.
27
Crowne Plaza Hotels & Resorts
| | | | | | | | | | | | | |
| | | Americas | | EMEA | | Asia Pacific |
| |
Average room rate $(1) | | | 101.94 | | | | 140.39 | | | | 105.16 | |
Room numbers(2) | | | 57,073 | | | | 22,941 | | | | 26,141 | |
| | | | | | | | | | | | | | | | |
| | | Americas | | | Europe | | | AMEA | | | Greater China | |
Average room rate $(1) | | | 110.3 | | | | 134.26 | | | | 142.22 | | | | 100.55 | |
Room numbers(2) | | | 48,730 | | | | 19,566 | | | | 18,559 | | | | 21,452 | |
| | |
| (1) | | For the year ended December 31, 2010;2012; quoted at constant US$US dollar exchange rate. Average room rate is for comparable Crowne Plaza hotels. |
|
| (2) | | At December 31, 2010.2012. |
Crowne Plaza Hotels & Resorts (“Crowne Plaza”), is the Group’s upscale brand and is currently the world’s fourth largest full-service hotel brand in the upscale, 4 star segment, specializesupper segments. The brand continues to appeal to business travelers, providing facilities and services that cater to these types of travelers. The Group continues to progress the multi-year Crowne Plaza repositioning program. As part of the Group’s commitment to strengthen the brand, quality audits have been carried out at almost all Crowne Plaza hotels in offeringstate-of-the-art businessThe Americas and meeting facilities that provide productive, successfulEurope and energizing experiencesthe Group has been actively managing the estate in order to guests who believe travel is fun and rewarding.
drive brand consistency.The majority of Crowne Plaza hotels are operated under franchise agreements in the US and Europe, and managed in other markets by the Group. In China, Crowne Plaza is the largest international upscale brand. At December 31, 2010,2012, there were 388392 Crowne Plaza hotels which represented 16% of the Group’s total hotel rooms. During 2010, 292012, 21 Crowne Plaza hotels were added to the portfolio, while seven16 hotels were removed.
The Holiday Inn Family of Brands
The Holiday Inn brand family, of brandswhich comprises Holiday Inn, Holiday Inn Club Vacations, Holiday Inn Resort and Holiday Inn Express, is the world’s largest midscale hotel brand family by number of rooms andat December 31, 2012. It is the largest brand in the Group’s most significant operation. Focused aroundportfolio predominantly operating under franchise agreements in The Americas and Europe and management agreements elsewhere.
Holiday Inn is for the contemporary traveler looking for innovative comfort in a relaxed atmosphere,relaxing hotel environment. Holiday Inn aims to provide guests familiarity, convenience and reliability while supporting and meeting all guest needs. As official hotel provider to the brands are designed to support both business travellersLondon 2012 Olympic and families. During 2010,Paralympic Games, the Group opened the Holiday Inn London, Stratford City. In 2012, the brand family neared completioncelebrated its 60th birthday and opened the largest Holiday Inn to date — the stunning Holiday Inn Macao Cotai Central, China with 1,224 rooms.
Holiday Inn Club Vacations, the Group’s timeshare business in North America, provides guests with all the benefits of a $1 billion refresh, updating their image by upgrading facilities, service and amenities, ensuringvacation home with none of the brands continue to remain competitive within their midscale markets. The hassle.
Holiday Inn family wasResort is our Holiday Inn brand family’s resort proposition, with 37 properties currently in the first internationalportfolio, for guests who work hard but also want to lead a balanced life.
Holiday Inn Express is a brand for the traveler looking for efficiency. The brand offers a straightforward, uncomplicated guest experience providing the things a guest needs, and is delivered in a way that is stimulating and engaging. One of the world’s fastest growing hotel chainbrands, it is geared to open in China in 1984the smart business or private traveler who appreciates value without compromising on comfort and the first hotel chain to launch a direct bookings website in 1995.
style.Holiday Inn Hotels & Resorts
| | | | | | | | | | | | | |
| | | Americas | | EMEA | | Asia Pacific |
| |
Average room rate $(1) | | | 95.12 | | | | 115.51 | | | | 88.57 | |
Room numbers(2)(3) | | | 147,575 | | | | 52,945 | | | | 29,597 | |
| | | | | | | | | | | | | | | | |
| | | Americas | | | Europe | | | AMEA | | | Greater China | |
Average room rate $(1) | | | 102.02 | | | | 112.36 | | | | 121.68 | | | | 82.21 | |
Room numbers(2)(4) | | | 146,661 | (3) | | | 46,610 | | | | 17,440 | | | | 20,777 | |
| | |
| (1) | | For the year ended December 31, 2010;2012; quoted at constant US$US dollar exchange rate. Average room rate is for comparable Holiday Inn hotels. |
|
| (2) | | At December 31, 2010.2012. |
|
| (3) | | The Americas total includes Holiday Inn Club Vacations (2,892(3,701 rooms). |
| (4) | Includes Holiday Inn Resorts properties — Americas 4,240 rooms, Europe 362 rooms, AMEA 3,311 rooms and Greater China 893 rooms. |
Holiday Inn Hotels & Resorts (including Holiday Inn Club Vacations)Vacations and Holiday Inn Resort) (“Holiday Inn”) are predominantly operated under franchise agreements. At December 31, 2010,2012, there were 1,247 Holiday Inn hotels which represented 36%34% of the Group’s total hotel rooms, of which 64%63% were located in theThe Americas. During 2010, 532012, 48 Holiday Inn hotels were added to the portfolio, while 13141 hotels were removed.
| | | | | | | | | | | | | |
| | | Americas | | EMEA | | Asia Pacific |
| |
Average room rate $(1) | | | 95.55 | | | | 95.18 | | | | 45.70 | |
Room numbers(2) | | | 159,867 | | | | 23,706 | | | | 7,655 | |
| | | | | | | | | | | | | | | | |
| | | Americas | | | Europe | | | AMEA | | | Greater China | |
Average room rate $(1) | | | 102.12 | | | | 93.04 | | | | 76.15 | | | | 49.88 | |
Room numbers(2) | | | 168,398 | | | | 24,903 | | | | 2,877 | | | | 9,453 | |
| | |
| (1) | | For the year ended December 31, 2010;2012; quoted at constant US$US dollar exchange rate. Average room rate is for comparable Holiday Inn Express hotels. |
|
| (2) | | At December 31, 2010.2012. |
Holiday Inn Express hotels are almost entirely operated under franchise agreements. At December 31, 2010,2012, there were 2,0752,192 Holiday Inn Express hotels worldwide which represented 30% of the Group’s total hotel rooms, of which 84%82% were located in theThe Americas. During 2010, 1222012, 114 new Holiday Inn Express hotels were added to the portfolio, while 11636 hotels were removed.
28
Staybridge Suites
| | | | | | | | | |
| | | Americas | | EMEA |
| |
Average room rate $(1) | | | 94.16 | | | | 112.18 | |
Room numbers(2) | | | 20,014 | | | | 748 | |
| | | | | | | | | | | | |
| | | Americas | | | Europe | | | AMEA | |
Average room rate $(1) | | | 104.11 | | | | 110.30 | | | | 140.02 | |
Room numbers(2) | | | 19,787 | | | | 605 | | | | 304 | |
| | |
| (1) | | For the year ended December 31, 2010;2012; quoted at constant US$US dollar exchange rate. Average room rate is for comparable Staybridge Suites hotels. |
|
| (2) | | At December 31, 2010.2012. |
Staybridge Suites is the Group’s upscale extended stay brand for guests on longer trips, offering studios and suites complete with full kitchens and separate sleeping and work areas in a sociable, family-like atmosphere. It was the fastest upper-tier extended stay brand to reach the 50-hotel and 100-hotel milestones, and was ranked highest in the prestigious J.D. Power and Associates’ 2009 North America Hotel Guest Satisfaction Index Study for extended stay hotels. In 2008 Staybridge Suites opened its first EMEA hotelplayed a significant role in LiverpoolIHG’s partnership with the London 2012 Olympic and has since opened properties in Cairo, Abu Dhabi and Newcastle.
Paralympic Games by opening the Staybridge Suites London-Stratford City property.The Staybridge Suites brand is principally operated under management contracts and franchise agreements. At December 31, 20102012 there were 188189 Staybridge Suites hotels, which represented 3% of the Group’s total hotel rooms, of which 96% (183 hotels) were located in theThe Americas. During 2010, seven2012, 11 hotels were added to the portfolio, and one hotel was removed.
removed and 17 Staybridge Suites hotels under the Group’s management were renovated as part of a renovation program by the owner, Hospitality Properties Trust.Candlewood Suites
| | | | |
| | | Americas |
| |
| | | 62.3072.68 | |
| | | 28,25328,675 | |
| | |
| (1) | | For the year ended December 31, 2010;2012; quoted at constant US$US dollar exchange rate. Average room rate is for comparable Candlewood Suites hotels. |
|
| (2) | | At December 31, 2010.2012. |
Candlewood Suites is the Group’s North American-focused midscale extended stay brand that gives itsprovides guests all the essentials they need forwith a home-like stay at great value. Shortly after being acquired by IHG in 2003, Candlewood Suites won J.D. Power’s awardA trust system has always prevailed for highest extended stay guest satisfaction in North America in 2004 whilst also ranking first inthis brand — the Market Metrix Hospitality Index survey“Candlewood Cupboard” which is a convenient place for customer satisfaction. Candlewood Suites continuesthe Group’s guests to leadstock up on essentials and treats on an honor system and the way in midscale extended stay lodging, with the most properties under development.
newly launched “Lending Locker” enables guests to borrow kitchen apparatus, such as coffee grinders.The Candlewood Suites brand is operated under management contracts and franchise agreements. At December 31, 2010,2012, there were 288299 Candlewood Suites hotels, which represented 4% of the Group’s total rooms, all of which were located in theThe Americas. During 2010, 352012, a net 14 hotels were added to the portfolio and one hotel was removed.
59 Candlewood Suites hotels under management by the Group were renovated by the owner, Hospitality Properties Trust, as part of the Group’s commitment to deliver a great brand for guests.Hotel Indigo
| | | | | | | | | | | | | |
| | | Americas | | EMEA | | Asia Pacific |
| |
Average room rate $(1) | | | 104.36 | | | | 204.65 | | | | — | |
Room numbers(2) | | | 4,254 | | | | 110 | | | | 184 | |
| | | | | | | | | | | | |
| | | Americas | | | Europe | | | Greater China | |
Average room rate $(1) | | | 125.74 | | | | 224.60 | | | | 183.13 | |
Room numbers(2) | | | 4,307 | | | | 949 | | | | 405 | |
| | |
| (1) | | For the year ended December 31, 2010;2012; quoted at constant US$US dollar exchange rate. Average room rate is for comparable Hotel Indigo hotels. |
|
| (2) | | At December 31, 2010.2012. |
Hotel Indigo is the Group’s boutique brand, and youngestthe world’s first global boutique hotel brand launched in 2004, and focusesfocused on a guest that appreciatesguests who appreciate art and design and that is seeking affordable luxury.who want to experience something different. Hotel Indigo provides guests with the refreshing design and intimate service experience synonymous with a boutique alonghotel, aligned with the consistency, reliability, and accessibility of a branded hotel. Each hotel is unique and reflects its local neighborhood with local murals and images, a vibrant color palette and locally sourced and seasonal menu items.
neighbourhood story.The Hotel Indigo brand is principally operated under franchise agreements. At December 31, 2010,2012, there were 3850 Hotel Indigo hotels, 3537 located in theThe Americas. During 2010, five2012, 13 hotels were added to the portfolio, and notwo hotels were removed.
29
EVEN HotelsEVEN Hotels was launched in February 2012, following extensive customer research, in order to create a brand that meets a traveler’s holistic wellness needs. EVEN is aimed at business and leisure travelers who are looking for a wellness experience in a hotel stay at a mainstream price point. The Group is investing up to $150 million in establishing the brand, owning and managing the first hotels to ensure the brand achieves its potential and market share growth in the US. During 2012, the Group signed the first EVEN hotel, in the heart of midtown Manhattan, New York.
HUALUXE Hotels & ResortsHUALUXE was officially launched in March 2012 and is the first international upscale hotel brand designed specifically for Chinese guests, to take advantage of both the supply and demand side opportunities the Group sees in China. The brand is tailored to address the specific needs of domestic Chinese guests focusing on the unique aspects of Chinese etiquette, the importance of rejuvenation, status recognition and local customs and heritage. It will enable the Group to expand in China’s key gateway cities but will also drive growth in its
secondary cities where a specifically Chinese offer is appealing. The brand could open in key global gateway cities in the future as outbound travelers from China are forecasted to reach 100 million in the next 10-15 years. During 2012, the Group signed 15 hotels for the brand.
Geographical Analysis
Although it has worldwide hotel operations, the Group is most dependent on theThe Americas for operating profit, reflecting the structure of the branded global hotel market. The Americas region generated 63% of the Group’s operating profit before central overheads and exceptional operating items during 2010.
2012.The geographical analysis, split by number of rooms and operating profit, is set out in the table below.
| | | | | | | | | | | | | |
| | | Americas | | EMEA | | Asia Pacific |
| | | (% of total) |
| |
Room numbers(1) | | | 68 | | | | 19 | | | | 13 | |
Regional operating profit (before central overheads and exceptional operating items)(2) | | | 63 | | | | 22 | | | | 15 | |
| | | | | | | | | | | | | | | | |
| | | Americas | | | Europe | | | AMEA | | | Greater China | |
| | | (% of total) | |
Room numbers(1) | | | 67 | | | | 15 | | | | 9 | | | | 9 | |
Regional operating profit (before central overheads and exceptional operating items)(2) | | | 63 | | | | 15 | | | | 11 | | | | 11 | |
| | |
| (1) | | At December 31, 2010.2012. |
|
| (2) | | For the year ended December 31, 2010.2012. |
In theThe Americas, the largest proportion of rooms is operated under the franchise business model (89%(91% of rooms in the Americas operate under this model) primarily in the midscale segment (Holiday Inn and Holiday Inn Express). Similarly, in the upscale segment, Crowne Plaza is predominantly franchised, whereas the majority of the InterContinental branded hotels are operated under franchise and management agreements. With 3,4583,555 hotels (439,375(449,617 rooms), theThe Americas represented 68%67% of the Group’s room count and 63% of the Group’s operating profit before central overheads and exceptional operating items during the year ended December 31, 2010.2012. The key profit producing region is the United States, although the Group is also represented in each of Latin America, Canada, Mexico and the Caribbean.
In EMEA,Europe, the largest proportion of rooms is operated under the franchise business model primarily in the midscale segment (Holiday Inn and Holiday Inn Express). Similarly, in the upscale segment, Crowne Plaza is predominantly franchised whereas the majority of the InterContinental branded hotels are operated under management agreements. Comprising 694628 hotels (120,852(102,027 rooms) at the end of 2010, EMEA2012, Europe represented 22%15% of the Group’s room count and 15% of the Group’s operating profit before central overheads and exceptional operating items during the year ended December 31, 2010.2012. Profits are primarily generated from hotels in the United Kingdom and Continental European gateway cities and the Middle East portfolio.
In Asia Pacific, the largest proportionAMEA, almost 82% of rooms are operated under the managed business model. The majority of hotels are in the midscale and upscale segments. Comprising 285232 hotels (86,934(62,737 rooms) at December 31, 2010, Asia Pacific represents 15%2012, AMEA represented 9% of the Group’s room count and 11% of the Group’s operating profit before central overheads and exceptional operating items during the year ended December 31, 2010.2012.
Greater China
In Greater China, almost 96% of rooms are operated under the managed business model. The Chinese tourism market continues to grow, withmajority of hotels are in the country forecast to become onemidscale and upscale segments. Comprising 187 hotels (61,601 rooms) at December 31, 2012, Greater China represented 9% of the world’s biggest tourist destinations within 10 years.Group’s room count and 11% of the Group’s operating profit before central overheads and exceptional operating items during the year ended December 31, 2012. At December 31, 20102012 there were 160 hotels (50,916 rooms) in the Group had 145 hotels in Greater China and a further 147 hotels in development.
30pipeline.
The following table shows information concerning the geographical locations and ownership of the Group’s hotels as at December 31, 2010.
| | | | | | | | | | | | | | | | | | | | | | | | | | | | | | | | | |
| | | Franchised | | Managed | | Owned and leased | | Total |
| | | Hotels | | Rooms | | Hotels | | Rooms | | Hotels | | Rooms | | Hotels | | Rooms |
| |
Americas | | | | | | | | | | | | | | | | | | | | | | | | | | | | | | | | |
| InterContinental | | | 27 | | | | 7,616 | | | | 26 | | | | 10,015 | | | | 3 | | | | 1,489 | | | | 56 | | | | 19,120 | |
| Crowne Plaza | | | 191 | | | | 50,761 | | | | 18 | | | | 6,312 | | | | — | | | | — | | | | 209 | | | | 57,073 | |
Holiday Inn(1) | | | 787 | | | | 137,691 | | | | 28 | | | | 8,825 | | | | 3 | | | | 1,059 | | | | 818 | | | | 147,575 | |
| Holiday Inn Express | | | 1,846 | | | | 159,615 | | | | 1 | | | | 252 | | | | — | | | | — | | | | 1,847 | | | | 159,867 | |
| Staybridge Suites | | | 137 | | | | 14,280 | | | | 44 | | | | 5,501 | | | | 2 | | | | 233 | | | | 183 | | | | 20,014 | |
| Candlewood Suites | | | 211 | | | | 18,934 | | | | 77 | | | | 9,319 | | | | — | | | | — | | | | 288 | | | | 28,253 | |
| Hotel Indigo | | | 31 | | | | 3,639 | | | | 3 | | | | 405 | | | | 1 | | | | 210 | | | | 35 | | | | 4,254 | |
| Other | | | — | | | | — | | | | 22 | | | | 3,219 | | | | — | | | | — | | | | 22 | | | | 3,219 | |
| | | | | | | | | | | | | | | | | | | | | | | | | | | | | | | | | |
| Total | | | 3,230 | | | | 392,536 | | | | 219 | | | | 43,848 | | | | 9 | | | | 2,991 | | | | 3,458 | | | | 439,375 | |
| | | | | | | | | | | | | | | | | | | | | | | | | | | | | | | | | |
EMEA | | | | | | | | | | | | | | | | | | | | | | | | | | | | | | | | |
| InterContinental | | | 10 | | | | 2,278 | | | | 51 | | | | 16,540 | | | | 3 | | | | 1,293 | | | | 64 | | | | 20,111 | |
| Crowne Plaza | | | 71 | | | | 15,888 | | | | 27 | | | | 7,053 | | | | — | | | | — | | | | 98 | | | | 22,941 | |
| Holiday Inn | | | 245 | | | | 38,250 | | | | 80 | | | | 14,695 | | | | — | | | | — | | | | 325 | | | | 52,945 | |
| Holiday Inn Express | | | 194 | | | | 23,241 | | | | 3 | | | | 312 | | | | 1 | | | | 153 | | | | 198 | | | | 23,706 | |
| Staybridge Suites | | | 1 | | | | 183 | | | | 4 | | | | 565 | | | | — | | | | — | | | | 5 | | | | 748 | |
| Hotel Indigo | | | 2 | | | | 110 | | | | — | | | | — | | | | — | | | | — | | | | 2 | | | | 110 | |
| Other | | | — | | | | — | | | | 2 | | | | 291 | | | | — | | | | — | | | | 2 | | | | 291 | |
| | | | | | | | | | | | | | | | | | | | | | | | | | | | | | | | | |
| Total | | | 523 | | | | 79,950 | | | | 167 | | | | 39,456 | | | | 4 | | | | 1,446 | | | | 694 | | | | 120,852 | |
| | | | | | | | | | | | | | | | | | | | | | | | | | | | | | | | | |
Asia Pacific | | | | | | | | | | | | | | | | | | | | | | | | | | | | | | | | |
| InterContinental | | | 6 | | | | 1,814 | | | | 44 | | | | 16,889 | | | | 1 | | | | 495 | | | | 51 | | | | 19,198 | |
| Crowne Plaza | | | 3 | | | | 482 | | | | 78 | | | | 25,659 | | | | — | | | | — | | | | 81 | | | | 26,141 | |
| Holiday Inn | | | 9 | | | | 1,826 | | | | 94 | | | | 27,573 | | | | 1 | | | | 198 | | | | 104 | | | | 29,597 | |
| Holiday Inn Express | | | 1 | | | | 138 | | | | 29 | | | | 7,517 | | | | — | | | | — | | | | 30 | | | | 7,655 | |
| Hotel Indigo | | | — | | | | — | | | | 1 | | | | 184 | | | | — | | | | — | | | | 1 | | | | 184 | |
| Other | | | 11 | | | | 2,574 | | | | 7 | | | | 1,585 | | | | — | | | | — | | | | 18 | | | | 4,159 | |
| | | | | | | | | | | | | | | | | | | | | | | | | | | | | | | | | |
| Total | | | 30 | | | | 6,834 | | | | 253 | | | | 79,407 | | | | 2 | | | | 693 | | | | 285 | | | | 86,934 | |
| | | | | | | | | | | | | | | | | | | | | | | | | | | | | | | | | |
Total | | | | | | | | | | | | | | | | | | | | | | | | | | | | | | | | |
| InterContinental | | | 43 | | | | 11,708 | | | | 121 | | | | 43,444 | | | | 7 | | | | 3,277 | | | | 171 | | | | 58,429 | |
| Crowne Plaza | | | 265 | | | | 67,131 | | | | 123 | | | | 39,024 | | | | — | | | | — | | | | 388 | | | | 106,155 | |
Holiday Inn(1) | | | 1,041 | | | | 177,767 | | | | 202 | | | | 51,093 | | | | 4 | | | | 1,257 | | | | 1,247 | | | | 230,117 | |
| Holiday Inn Express | | | 2,041 | | | | 182,994 | | | | 33 | | | | 8,081 | | | | 1 | | | | 153 | | | | 2,075 | | | | 191,228 | |
| Staybridge Suites | | | 138 | | | | 14,463 | | | | 48 | | | | 6,066 | | | | 2 | | | | 233 | | | | 188 | | | | 20,762 | |
| Candlewood Suites | | | 211 | | | | 18,934 | | | | 77 | | | | 9,319 | | | | — | | | | — | | | | 288 | | | | 28,253 | |
| Hotel Indigo | | | 33 | | | | 3,749 | | | | 4 | | | | 589 | | | | 1 | | | | 210 | | | | 38 | | | | 4,548 | |
| Other | | | 11 | | | | 2,574 | | | | 31 | | | | 5,095 | | | | — | | | | — | | | | 42 | | | | 7,669 | |
| | | | | | | | | | | | | | | | | | | | | | | | | | | | | | | | | |
| Total | | | 3,783 | | | | 479,320 | | | | 639 | | | | 162,711 | | | | 15 | | | | 5,130 | | | | 4,437 | | | | 647,161 | |
| | | | | | | | | | | | | | | | | | | | | | | | | | | | | | | | | |
| | | | | | | | | | | | | | | | | | | | | | | | | | | | | | | | |
| | | Franchised | | | Managed | | | Owned and leased | | | Total | |
| | | Hotels | | | Rooms | | | Hotels | | | Rooms | | | Hotels | | | Rooms | | | Hotels | | | Rooms | |
Americas | | | | | | | | | | | | | | | | | | | | | | | | | | | | | | | | |
InterContinental | | | 28 | | | | 7,737 | | | | 22 | | | | 8,529 | | | | 3 | | | | 1,490 | | | | 53 | | | | 17,756 | |
Crowne Plaza | | | 172 | | | | 45,243 | | | | 11 | | | | 3,487 | | | | — | | | | — | | | | 183 | | | | 48,730 | |
Holiday Inn(1)(2) | | | 792 | | | | 137,956 | | | | 26 | | | | 8,010 | | | | 2 | | | | 695 | | | | 820 | | | | 146,661 | |
Holiday Inn Express | | | 1,930 | | | | 168,146 | | | | 1 | | | | 252 | | | | — | | | | — | | | | 1,931 | | | | 168,398 | |
Staybridge Suites | | | 157 | | | | 16,572 | | | | 26 | | | | 3,215 | | | | — | | | | — | | | | 183 | | | | 19,787 | |
Candlewood Suites | | | 238 | | | | 21,124 | | | | 61 | | | | 7,551 | | | | — | | | | — | | | | 299 | | | | 28,675 | |
Hotel Indigo | | | 34 | | | | 3,792 | | | | 3 | | | | 515 | | | | — | | | | — | | | | 37 | | | | 4,307 | |
Other | | | 3 | | | | 7,279 | | | | 46 | | | | 8,024 | | | | — | | | | — | | | | 49 | | | | 15,303 | |
| | | | | | | | | | | | | | | | | | | | | | | | | | | | | | | | |
Total | | | 3,354 | | | | 407,849 | | | | 196 | | | | 39,583 | | | | 5 | | | | 2,185 | | | | 3,555 | | | | 449,617 | |
| | | | | | | | | | | | | | | | | | | | | | | | | | | | | | | | |
Europe | | | | | | | | | | | | | | | | | | | | | | | | | | | | | | | | |
InterContinental | | | 8 | | | | 1,912 | | | | 20 | | | | 6,565 | | | | 2 | | | | 917 | | | | 30 | | | | 9,394 | |
Crowne Plaza | | | 72 | | | | 16,640 | | | | 12 | | | | 2,926 | | | | — | | | | — | | | | 84 | | | | 19,566 | |
Holiday Inn(2) | | | 224 | | | | 35,136 | | | | 64 | | | | 11,474 | | | | — | | | | — | | | | 288 | | | | 46,610 | |
Holiday Inn Express | | | 210 | | | | 24,657 | | | | 2 | | | | 246 | | | | — | | | | — | | | | 212 | | | | 24,903 | |
Staybridge Suites | | | 4 | | | | 605 | | | | — | | | | — | | | | — | | | | — | | | | 4 | | | | 605 | |
Hotel Indigo | | | 10 | | | | 949 | | | | — | | | | — | | | | — | | | | — | | | | 10 | | | | 949 | |
| | | | | | | | | | | | | | | | | | | | | | | | | | | | | | | | |
Total | | | 528 | | | | 79,899 | | | | 98 | | | | 21,211 | | | | 2 | | | | 917 | | | | 628 | | | | 102,027 | |
| | | | | | | | | | | | | | | | | | | | | | | | | | | | | | | | |
AMEA | | | | | | | | | | | | | | | | | | | | | | | | | | | | | | | | |
InterContinental | | | 6 | | | | 1,956 | | | | 58 | | | | 18,455 | | | | 1 | | | | 380 | | | | 65 | | | | 20,791 | |
Crowne Plaza | | | 7 | | | | 1,399 | | | | 58 | | | | 17,160 | | | | — | | | | — | | | | 65 | | | | 18,559 | |
Holiday Inn(2) | | | 20 | | | | 3,950 | | | | 54 | | | | 13,283 | | | | 1 | | | | 207 | | | | 75 | | | | 17,440 | |
Holiday Inn Express | | | 9 | | | | 2,127 | | | | 3 | | | | 750 | | | | — | | | | — | | | | 12 | | | | 2,877 | |
Staybridge Suites | | | — | | | | — | | | | 2 | | | | 304 | | | | — | | | | — | | | | 2 | | | | 304 | |
Other | | | 6 | | | | 1,428 | | | | 7 | | | | 1,338 | | | | — | | | | — | | | | 13 | | | | 2,766 | |
| | | | | | | | | | | | | | | | | | | | | | | | | | | | | | | | |
Total | | | 48 | | | | 10,860 | | | | 182 | | | | 51,290 | | | | 2 | | | | 587 | | | | 232 | | | | 62,737 | |
| | | | | | | | | | | | | | | | | | | | | | | | | | | | | | | | |
Greater China | | | | | | | | | | | | | | | | | | | | | | | | | | | | | | | | |
InterContinental | | | 1 | | | | 570 | | | | 20 | | | | 8,300 | | | | 1 | | | | 503 | | | | 22 | | | | 9,373 | |
Crowne Plaza | | | — | | | | — | | | | 60 | | | | 21,452 | | | | — | | | | — | | | | 60 | | | | 21,452 | |
Holiday Inn(2) | | | 2 | | | | 1,476 | | | | 62 | | | | 19,301 | | | | — | | | | — | | | | 64 | | | | 20,777 | |
Holiday Inn Express | | | 1 | | | | 138 | | | | 36 | | | | 9,315 | | | | — | | | | — | | | | 37 | | | | 9,453 | |
Hotel Indigo | | | — | | | | — | | | | 3 | | | | 405 | | | | — | | | | — | | | | 3 | | | | 405 | |
Other | | | — | | | | — | | | | 1 | | | | 141 | | | | — | | | | — | | | | 1 | | | | 141 | |
| | | | | | | | | | | | | | | | | | | | | | | | | | | | | | | | |
Total | | | 4 | | | | 2,184 | | | | 182 | | | | 58,914 | | | | 1 | | | | 503 | | | | 187 | | | | 61,601 | |
| | | | | | | | | | | | | | | | | | | | | | | | | | | | | | | | |
Total | | | | | | | | | | | | | | | | | | | | | | | | | | | | | | | | |
InterContinental | | | 43 | | | | 12,175 | | | | 120 | | | | 41,849 | | | | 7 | | | | 3,290 | | | | 170 | | | | 57,314 | |
Crowne Plaza | | | 251 | | | | 63,282 | | | | 141 | | | | 45,025 | | | | — | | | | — | | | | 392 | | | | 108,307 | |
Holiday Inn(1)(2) | | | 1,038 | | | | 178,518 | | | | 206 | | | | 52,068 | | | | 3 | | | | 902 | | | | 1,247 | | | | 231,488 | |
Holiday Inn Express | | | 2,150 | | | | 195,068 | | | | 42 | | | | 10,563 | | | | — | | | | — | | | | 2,192 | | | | 205,631 | |
Staybridge Suites | | | 161 | | | | 17,177 | | | | 28 | | | | 3,519 | | | | — | | | | — | | | | 189 | | | | 20,696 | |
Candlewood Suites | | | 238 | | | | 21,124 | | | | 61 | | | | 7,551 | | | | — | | | | — | | | | 299 | | | | 28,675 | |
Hotel Indigo | | | 44 | | | | 4,741 | | | | 6 | | | | 920 | | | | — | | | | — | | | | 50 | | | | 5,661 | |
Other | | | 9 | | | | 8,707 | | | | 54 | | | | 9,503 | | | | — | | | | — | | | | 63 | | | | 18,210 | |
| | | | | | | | | | | | | | | | | | | | | | | | | | | | | | | | |
Total | | | 3,934 | | | | 500,792 | | | | 658 | | | | 170,998 | | | | 10 | | | | 4,192 | | | | 4,602 | | | | 675,982 | |
| | | | | | | | | | | | | | | | | | | | | | | | | | | | | | | | |
| | |
| (1) | | IncludesIncluded Holiday Inn Club Vacations (6(10 hotels, 2,8923,701 rooms) within franchised.. |
| (2) | Included Holiday Inn Resort properties (Americas 17 hotels, 4,240 rooms; Europe 3 hotels, 362 rooms; AMEA 14 hotels, 3,311 rooms and Greater China 3 hotels, 893 rooms). |
Room Count and Pipeline
During 2010,2012, the Group’s global system (the number of hotels and rooms which are franchised, managed, owned or leased by the Group) remained in line with 2009 at 4,437Group increased by 122 hotels (647,161(17,634 rooms).
Openings of 259226 hotels (35,744(33,922 rooms) were driven in particular, by continued expansion in the US, and China and offsetparticularly within the removal of 260 hotels (35,262 rooms).
In Asia Pacific, demand for upscale brands (InterContinental, Crowne Plaza and Hotel Indigo) contributed 65% of total room openings in the region.
31
The Holiday Inn brand family relaunch is substantially complete with 2,956which opened more than 11,000 rooms over 2012, and Greater China. The level of removals fell from 198 hotels (89%(33,078 rooms) in 2011 to 104 hotels (16,288 rooms) in 2012, as anticipated following the completion of the total Holiday Inn brand family) open under the updated signage and brand standards at December 31, 2010. During 2010, the removal of non-brand-conforming hotels contributed to the total removal of 247 Holiday Inn and Holiday Inn Express hotels (30,892 rooms).
relaunch.At the end of 2010,2012, the pipeline totaled 1,2751,053 hotels (204,859(169,030 rooms). The Group’s pipeline represents hotels and rooms where a contract has been signed and the appropriate fees paid.
Signings of 319 hotels (55,598 rooms) represent an increase in rooms signed from 2009 levels. Demonstrating the The continued
global demand for
the Group’s brands
globally,is demonstrated by over 50% of
pipeline rooms being outside of The Americas region, including 30% in Greater China.Excluding 25 hotels (4,796 rooms) signed as part of the rooms pipeline is now outsideUS government’s Privatization of Army Lodgings initiative in 2011, signings increased from 331 hotels (50,628 rooms) to 356 hotels (53,812 rooms). Signings during 2012 included 15 hotels for the Americas region. There were 25 hotel signings (3,025 rooms)HUALUXE brand, as well as the first signing for Hotel Indigo as it gains real momentum in Europe and Asia Pacific where, together, 12 hotels (1,456 rooms) were signed. The Group also entered into an InterContinental Alliance relationship with the Las Vegas Sands Corp. to bring the 6,874 all-suite Venetian and Palazzo Resorts into the Group’s system in 2011.
EVEN brand.During 2010,2012, the opening of 35,74433,922 rooms contributed to a net pipeline decline of 5,50411,454 rooms. Terminations fromActive management out of the pipeline in 2010 totaled 25,358of deals that have become dormant or no longer viable contributed to a reduction of 31,344 rooms, representing a decrease of 21% compared with 2009. Terminations occur for a number of reasons such as the withdrawal of financing and changes in local market conditions.
11.8% over 2011.There are no assurances that all of the hotels in the pipeline will open. The construction, conversion and development of hotels is dependent upon a number of factors, including meeting brand standards, obtaining the necessary permits relating to construction and operation, the cost of constructing, converting and equipping such hotels and the ability to obtain suitable financing at acceptable interest rates. The supply of capital for hotel development in the United States and major economies may not continue at previous levels and consequently the pipeline could decrease.
The Americas hotel and room count in 2010 decreasedthe year increased by 2182 hotels (5,979(7,419 rooms) to 3,4583,555 hotels (439,375(449,617 rooms). Openings of 194148 hotels (20,980(16,618 rooms) included key openings of the InterContinental New York Times Square and the first Staybridge Suites in New York, taking IHG’s room count in New York city to 6,570. The113 Holiday Inn brand family generatedhotels (12,566 rooms), representing more than 70% of openings for the region. Six Hotel Indigo openings (639 rooms) helped the brand reach the 50 property milestone globally by the end of 1372012. 22 hotels (13,446(1,927 rooms) opened as Staybridge Suites hotels and Candlewood Suites hotels, the Group’s extended stay brands, Staybridge Suites and Candlewood Suites, achieved openings of 41brands. 66 hotels (3,862 rooms). Removals of 215 hotels (26,959(9,199 rooms) were mainlyremoved from Holiday Inn and Holiday Inn Express hotels.
the system in 2012, compared to 153 hotels (24,284 rooms) in 2011.The Americas pipeline totaled 890670 hotels (102,509(72,573 rooms) as at December 31, 2010. Overall signings2012. Signings of 30,223 rooms were flat on 2009 as slow real estate and construction activity continued into 2010. Notable signings226 hotels (25,536 rooms) included the InterContinental Alliance established with the Las Vegas Sands Corp., and the re-entry to the Hawaii market with173 hotels (18,866 rooms) in the Holiday Inn Beachcomber Resortbrand family, as well as the first signing for the EVEN brand, a flagship property in Waikiki Beach.
EMEA
During 2010, EMEA hotel and room countthe heart of midtown Manhattan, New York. The pipeline decreased by one hotel (a net increase of 556105 hotels (11,877 rooms) compared to 694 hotels (120,852 rooms). Activity included openings of 33 hotels (5,767 rooms) and removals of 34 hotels (5,211 rooms). The net decrease of seven Holiday Inn and Holiday Inn Express hotels comprised 25 openings and 32 removals.
The pipeline in EMEA increased by one hotel (a net decrease of 26 rooms) to 153 hotels (31,435 rooms). There were 9,303 room signings in 2010, with continued demand for the Group’s brands in the UK and Germany. Demand was particularly strong in the midscale segment which represented 61% of room signings. There were eight signings for the Group’s lifestyle brand, Hotel Indigo, including four in the UK and entry into new markets in Lisbon, Madrid and Berlin. There were also six Crowne Plaza signings including the strategic markets of Istanbul, St Petersburg and Amsterdam.
Asia PacificDuring 2012, Europe hotel and room count increased by 2116 hotels (5,905(2,142 rooms) to 285628 hotels (86,934(102,027 rooms). Openings of 3239 hotels (8,997(5,477 rooms) included 31 hotels in the Holiday Inn brand family (4,233 rooms). Hotel Indigo continued to build momentum in the region, with five hotel openings, doubling the system size in Europe for the brand. 23 hotels (3,335 rooms) were partially offsetremoved from the system in 2012.
The Europe pipeline totaled 91 hotels (15,184 rooms) as at December 31, 2012. Signings of 48 hotels (7,023 rooms) increased from 2011 levels and included 35 hotels (5,489 rooms) in the Holiday Inn brand family, including the first two Holiday Inn Express hotels in Russia. Seven Hotel Indigo hotels (572 rooms) were signed, including three more hotels in the UK and firsts for the brand in France, Spain and Israel. 16 hotels (3,044 rooms) were removed from the pipeline in 2012. The pipeline decreased by the removal of 11 hotels (3,092 rooms). The growth
32
was driven by 24 hotel openings in 17 cities across Greater China (7,253 rooms), seven hotels
(1,477(1,498 rooms)
more thancompared to 2011.AMEA
The AMEA hotel and room count in 2009. This included key hotel openings in Shanghai of the InterContinental at the Expo site and the Hotel Indigo on the Bund, the first opening for this brand in Asia Pacific. Across the region 65% of rooms opened were in upscale brands (InterContinental, Crowne Plaza and Hotel Indigo).
The pipeline in Asia Pacificyear increased by 19four hotels (5,741(1,654 rooms) to 232 hotels (70,915(62,737 rooms). Pipeline growth was evenly balanced betweenThe level of openings increased from 10 hotels (2,907 rooms) in 2011 to 16 hotels (4,243 rooms) in 2012. These included four hotels for the Greater China market (nine hotels, 3,128 rooms) and Asia Australasia (10 hotels, 2,613 rooms)InterContinental brand, including six hotel signingsthe 197-room InterContinental Danang Sun Peninsula Resort in India taking its total pipeline to 10,073 rooms.
AcrossVietnam, as well as the
region there were 18first Holiday Inn Express
signings, more than doublehotels in Bahrain, India and Thailand. Six Crowne Plaza hotels (1,777 rooms) were opened in 2012, including resort locations in Thailand and Jordan. 12 hotels (2,589 rooms) were removed from the
number for this brandsystem in
2009, indicating the potential for midscale growth2012.The AMEA pipeline totaled 132 hotels (30,357 rooms) as at December 31, 2012. Signings of 36 hotels (7,866 rooms) included 24 hotels (4,657 rooms) in the region. In Vietnam two new Holiday Inn resortsbrand family. In addition, six InterContinental hotels (1,728 rooms) were signed, including resort locations in Thailand and Australia. 10 hotels (2,850 rooms) were removed from the pipeline in 2012, compared to 32 hotels (8,243 rooms) in 2011. The pipeline increased by 10 hotels (773 rooms) compared to 2011.
Greater China
The Greater China hotel and room count in the prime beachfront locationsyear increased by 20 hotels (6,419 rooms) to 187 hotels (61,601 rooms). Openings of Cam Ranh Bay23 hotels (7,584 rooms) included the Holiday Inn Macao Cotai Central (1,224 rooms), the largest Holiday Inn in the world. Eight Crowne Plaza hotels (2,996 rooms) and Phu Quoc. Theretwo Hotel Indigo hotels (224 rooms) were alsoopened in 2012.
The Greater China pipeline totaled 160 hotels (50,916 rooms) as at December 31, 2012. Signings of 46 hotels (13,387 rooms) increased from 38 hotels (12,112 rooms) in 2011 and included 15 hotels for the newly launched HUALUXE brand, together with 12 Crowne Plaza signings, includinghotels (4,527 rooms). 12 hotels (4,655 rooms) were removed from the Crowne Plaza Lumpini Parkpipeline in Bangkok.
| | | | | | | | | | | | | | | | | | | | | | | | | |
| | | Hotels | | Rooms |
| | | | | | | Change
| | | | | | Change
|
Global hotel and room count at December 31, | | 2010 | | 2009 | | over 2009 | | 2010 | | 2009 | | over 2009 |
| |
| Analyzed by brand | | | | | | | | | | | | | | | | | | | | | | | | |
| InterContinental | | | 171 | | | | 166 | | | | 5 | | | | 58,429 | | | | 56,121 | | | | 2,308 | |
| Crowne Plaza | | | 388 | | | | 366 | | | | 22 | | | | 106,155 | | | | 100,994 | | | | 5,161 | |
Holiday Inn(1) | | | 1,247 | | | | 1,325 | | | | (78 | ) | | | 230,117 | | | | 243,460 | | | | (13,343 | ) |
| Holiday Inn Express | | | 2,075 | | | | 2,069 | | | | 6 | | | | 191,228 | | | | 188,007 | | | | 3,221 | |
| Staybridge Suites | | | 188 | | | | 182 | | | | 6 | | | | 20,762 | | | | 19,885 | | | | 877 | |
| Candlewood Suites | | | 288 | | | | 254 | | | | 34 | | | | 28,253 | | | | 25,283 | | | | 2,970 | |
| Hotel Indigo | | | 38 | | | | 33 | | | | 5 | | | | 4,548 | | | | 4,030 | | | | 518 | |
| Other | | | 42 | | | | 43 | | | | (1 | ) | | | 7,669 | | | | 8,899 | | | | (1,230 | ) |
| | | | | | | | | | | | | | | | | | | | | | | | | |
| Total | | | 4,437 | | | | 4,438 | | | | (1 | ) | | | 647,161 | | | | 646,679 | | | | 482 | |
| | | | | | | | | | | | | | | | | | | | | | | | | |
| Analyzed by ownership type | | | | | | | | | | | | | | | | | | | | | | | | |
Franchised(1) | | | 3,783 | | | | 3,799 | | | | (16 | ) | | | 479,320 | | | | 483,541 | | | | (4,221 | ) |
| Managed | | | 639 | | | | 622 | | | | 17 | | | | 162,711 | | | | 157,287 | | | | 5,424 | |
| Owned and leased | | | 15 | | | | 17 | | | | (2 | ) | | | 5,130 | | | | 5,851 | | | | (721 | ) |
| | | | | | | | | | | | | | | | | | | | | | | | | |
| Total | | | 4,437 | | | | 4,438 | | | | (1 | ) | | | 647,161 | | | | 646,679 | | | | 482 | |
| | | | | | | | | | | | | | | | | | | | | | | | | |
| | | | | | | | | | | | | | | | | | | | | | | | |
| | | Hotels | | | Rooms | |
| Global hotel and room count at December 31, | | 2012 | | | 2011 | | | Change
over 2011 | | | 2012 | | | 2011 | | | Change
over 2011 | |
Analyzed by brand: | | | | | | | | | | | | | | | | | | | | | | | | |
InterContinental | | | 170 | | | | 169 | | | | 1 | | | | 57,314 | | | | 57,598 | | | | (284 | ) |
Crowne Plaza | | | 392 | | | | 387 | | | | 5 | | | | 108,307 | | | | 105,104 | | | | 3,203 | |
Holiday Inn(1) | | | 1,247 | | | | 1,240 | | | | 7 | | | | 231,488 | | | | 228,256 | | | | 3,232 | |
Holiday Inn Express | | | 2,192 | | | | 2,114 | | | | 78 | | | | 205,631 | | | | 196,666 | | | | 8,965 | |
Staybridge Suites | | | 189 | | | | 179 | | | | 10 | | | | 20,696 | | | | 19,567 | | | | 1,129 | |
Candlewood Suites | | | 299 | | | | 285 | | | | 14 | | | | 28,675 | | | | 27,500 | | | | 1,175 | |
Hotel Indigo | | | 50 | | | | 39 | | | | 11 | | | | 5,661 | | | | 4,564 | | | | 1,097 | |
Other | | | 63 | | | | 67 | | | | (4 | ) | | | 18,210 | | | | 19,093 | | | | (883 | ) |
| | | | | | | | | | | | | | | | | | | | | | | | |
Total | | | 4,602 | | | | 4,480 | | | | 122 | | | | 675,982 | | | | 658,348 | | | | 17,634 | |
| | | | | | | | | | | | | | | | | | | | | | | | |
Analyzed by ownership type: | | | | | | | | | | | | | | | | | | | | | | | | |
Franchised | | | 3,934 | | | | 3,832 | | | | 102 | | | | 500,792 | | | | 489,071 | | | | 11,721 | |
Managed | | | 658 | | | | 637 | | | | 21 | | | | 170,998 | | | | 164,993 | | | | 6,005 | |
Owned and leased | | | 10 | | | | 11 | | | | (1 | ) | | | 4,192 | | | | 4,284 | | | | (92 | ) |
| | | | | | | | | | | | | | | | | | | | | | | | |
Total | | | 4,602 | | | | 4,480 | | | | 122 | | | | 675,982 | | | | 658,348 | | | | 17,634 | |
| | | | | | | | | | | | | | | | | | | | | | | | |
| | |
| (1) | | IncludesIncluded Holiday Inn Club Vacations (6(2012: 10 hotels, 2,8923,701 rooms; 2011: 7 hotels, 2,928 rooms) and Holiday Inn Resort properties (2012: 37 hotels, 8,806 rooms; 2011: 32 hotels, 7,809 rooms). |
| | | | | | | | | | | | | | | | | | | | | | | | |
| | | Hotels | | | Rooms | |
| Global pipeline at December 31, | | 2012 | | | 2011 | | | Change
over 2011 | | | 2012 | | | 2011 | | | Change
over 2011 | |
Analyzed by brand: | | | | | | | | | | | | | | | | | | | | | | | | |
InterContinental | | | 48 | | | | 51 | | | | (3 | ) | | | 15,713 | | | | 17,623 | | | | (1,910 | ) |
Crowne Plaza | | | 98 | | | | 108 | | | | (10 | ) | | | 31,183 | | | | 34,643 | | | | (3,460 | ) |
Holiday Inn(1) | | | 243 | | | | 267 | | | | (24 | ) | | | 44,988 | | | | 50,750 | | | | (5,762 | ) |
Holiday Inn Express | | | 452 | | | | 470 | | | | (18 | ) | | | 51,760 | | | | 52,201 | | | | (441 | ) |
Staybridge Suites | | | 71 | | | | 95 | | | | (24 | ) | | | 7,544 | | | | 10,026 | | | | (2,482 | ) |
Candlewood Suites | | | 78 | | | | 94 | | | | (16 | ) | | | 6,742 | | | | 8,062 | | | | (1,320 | ) |
Hotel Indigo | | | 47 | | | | 59 | | | | (12 | ) | | | 5,869 | | | | 7,179 | | | | (1,310 | ) |
HUALUXE | | | 15 | | | | — | | | | 15 | | | | 4,904 | | | | — | | | | 4,904 | |
EVEN | | | 1 | | | | — | | | | 1 | | | | 230 | | | | — | | | | 230 | |
Other | | | — | | | | — | | | | — | | | | 97 | | | | — | | | | 97 | |
| | | | | | | | | | | | | | | | | | | | | | | | |
Total | | | 1,053 | | | | 1,144 | | | | (91 | ) | | | 169,030 | | | | 180,484 | | | | (11,454 | ) |
| | | | | | | | | | | | | | | | | | | | | | | | |
Analyzed by ownership type: | | | | | | | | | | | | | | | | | | | | | | | | |
Franchised | | | 744 | | | | 853 | | | | (109 | ) | | | 82,901 | | | | 96,513 | | | | (13,612 | ) |
Managed | | | 309 | | | | 291 | | | | 18 | | | | 86,129 | | | | 83,971 | | | | 2,158 | |
| | | | | | | | | | | | | | | | | | | | | | | | |
Total | | | 1,053 | | | | 1,144 | | | | (91 | ) | | | 169,030 | | | | 180,484 | | | | (11,454 | ) |
| | | | | | | | | | | | | | | | | | | | | | | | |
| (1) | Included Holiday Inn Club Vacations (nil in 2012; 2011 1 hotel, 658 rooms) and Holiday Inn Resort properties (12 hotels, 2,390 rooms in both 2010 and 2009)2012; 2011 15 hotels, 3,037 rooms). |
33
| | | | | | | | | | | | | | | | | | | | | | | | | |
| | | Hotels | | Rooms |
| | | | | | | Change
| | | | | | Change
|
Global pipeline at December 31, | | 2010 | | 2009 | | over 2009 | | 2010 | | 2009 | | over 2009 |
| |
| Analyzed by brand | | | | | | | | | | | | | | | | | | | | | | | | |
| InterContinental | | | 60 | | | | 63 | | | | (3 | ) | | | 19,374 | | | | 20,173 | | | | (799 | ) |
| Crowne Plaza | | | 123 | | | | 129 | | | | (6 | ) | | | 38,994 | | | | 38,555 | | | | 439 | |
| Holiday Inn | | | 313 | | | | 338 | | | | (25 | ) | | | 57,505 | | | | 59,008 | | | | (1,503 | ) |
| Holiday Inn Express | | | 494 | | | | 563 | | | | (69 | ) | | | 53,219 | | | | 57,756 | | | | (4,537 | ) |
| Staybridge Suites | | | 101 | | | | 123 | | | | (22 | ) | | | 10,760 | | | | 13,360 | | | | (2,600 | ) |
| Candlewood Suites | | | 120 | | | | 169 | | | | (49 | ) | | | 10,506 | | | | 14,851 | | | | (4,345 | ) |
| Hotel Indigo | �� | | 62 | | | | 53 | | | | 9 | | | | 7,627 | | | | 6,660 | | | | 967 | |
| Other | | | 2 | | | | — | | | | 2 | | | | 6,874 | | | | — | | | | 6,874 | |
| | | | | | | | | | | | | | | | | | | | | | | | | |
| Total | | | 1,275 | | | | 1,438 | | | | (163 | ) | | | 204,859 | | | | 210,363 | | | | (5,504 | ) |
| | | | | | | | | | | | | | | | | | | | | | | | | |
| Analyzed by ownership type | | | | | | | | | | | | | | | | | | | | | | | | |
| Franchised | | | 970 | | | | 1,158 | | | | (188 | ) | | | 113,940 | | | | 126,386 | | | | (12,446 | ) |
| Managed | | | 305 | | | | 280 | | | | 25 | | | | 90,919 | | | | 83,977 | | | | 6,942 | |
| | | | | | | | | | | | | | | | | | | | | | | | | |
| Total | | | 1,275 | | | | 1,438 | | | | (163 | ) | | | 204,859 | | | | 210,363 | | | | (5,504 | ) |
| | | | | | | | | | | | | | | | | | | | | | | | | |
Seasonality
Although the performance of individual hotels and geographic markets might be highly seasonal due to a variety of factors such as the tourist trade and local economic conditions, the geographical spread of the Group’s hotels in nearly 100 countries and territories and the relative stability of the income stream from franchising and management activities, diminishes, to some extent, the effect of seasonality on the results of the Group.
The Group’s hotels compete with a wide range of facilities offering various types of lodging options and related services to the public. The competition includes several large and moderate sized hotel chains offering upper, mid and lower priced accommodation and also includes independent hotels in each of these market segments, particularly outside of North America where the lodging industry is much more fragmented. Major hotel chains which compete with the Group include Marriott International, Inc., Starwood Hotels & Resorts Worldwide, Inc., Choice Hotels International, Inc., Best Western International, Inc., Hilton Hotels Corporation, Wyndham Worldwide Corporation, Four Seasons Hotels Inc. and Accor S.A. The Group also competes with non-hotel options, such as timeshare offerings and cruises.
The following tables present RevPAR statistics for the year ended December 31, 20102012 and a comparison to 2009.2011. RevPAR is a meaningful indicator of performance because it measuresperiod-over-period change in rooms revenue for comparable hotels. RevPAR is calculated by dividing rooms revenue for comparable hotels by room nights available to guests for the period.
Franchised, managed, owned and leased statistics are for comparable hotels, and include only those hotels in the Group’s system atbetween January 1, 2011 and December 31, 20102012, therefore excluding new hotels, hotels closed for major refurbishment and franchised, managed, owned or leased by the Group since January 1, 2009.
34
The comparison with 20092011 is at constant US$US dollar exchange rates.
| | | | | | | | | | | | | | | | | | | | | | | | | |
| | | Franchised | | Managed | | Owned and leased |
| | | | | Change vs
| | | | Change vs
| | | | Change vs
|
| | | 2010 | | 2009 | | 2010 | | 2009 | | 2010 | | 2009 |
| |
Americas | | | | | | | | | | | | | | | | | | | | | | | | |
| InterContinental | | | | | | | | | | | | | | | | | | | | | | | | |
| Occupancy | | | 58.5 | % | | | 3.3 | %pts | | | 68.7 | % | | | 4.7 | %pts | | | 79.4 | % | | | 0.4 | %pts |
| Average daily rate | | $ | 124.05 | | | | (0.3 | )% | | $ | 170.14 | | | | 2.7 | % | | $ | 223.15 | | | | 8.1 | % |
| RevPAR | | $ | 72.54 | | | | 5.7 | % | | $ | 116.93 | | | | 10.2 | % | | $ | 177.22 | | | | 8.7 | % |
| Crowne Plaza | | | | | | | | | | | | | | | | | | | | | | | | |
| Occupancy | | | 58.3 | % | | | 3.3 | %pts | | | 70.7 | % | | | 3.4 | %pts | | | — | | | | — | |
| Average daily rate | | $ | 97.79 | | | | (1.5 | )% | | $ | 125.36 | | | | 1.2 | % | | | — | | | | — | |
| RevPAR | | $ | 57.04 | | | | 4.5 | % | | $ | 88.63 | | | | 6.2 | % | | | — | | | | — | |
| Holiday Inn | | | | | | | | | | | | | | | | | | | | | | | | |
| Occupancy | | | 58.1 | % | | | 2.8 | %pts | | | 68.9 | % | | | 4.0 | %pts | | | 72.5 | % | | | 1.5 | %pts |
| Average daily rate | | $ | 94.10 | | | | (0.9 | )% | | $ | 106.74 | | | | 0.9 | % | | $ | 106.24 | | | | (2.1 | )% |
| RevPAR | | $ | 54.64 | | | | 4.1 | % | | $ | 73.56 | | | | 7.1 | % | | $ | 76.98 | | | | (0.1 | )% |
| Holiday Inn Express | | | | | | | | | | | | | | | | | | | | | | | | |
| Occupancy | | | 61.8 | % | | | 3.0 | %pts | | | 80.3 | % | | | 5.2 | %pts | | | — | | | | — | |
| Average daily rate | | $ | 95.45 | | | | (0.7 | )% | | $ | 133.96 | | | | 2.4 | % | | | — | | | | — | |
| RevPAR | | $ | 58.95 | | | | 4.4 | % | | $ | 107.59 | | | | 9.5 | % | | | — | | | | — | |
| Staybridge Suites | | | | | | | | | | | | | | | | | | | | | | | | |
| Occupancy | | | 70.4 | % | | | 6.7 | %pts | | | 75.3 | % | | | 6.9 | %pts | | | 76.7 | % | | | 8.5 | %pts |
| Average daily rate | | $ | 92.17 | | | | (2.8 | )% | | $ | 98.16 | | | | (3.5 | )% | | $ | 89.10 | | | | (5.9 | )% |
| RevPAR | | $ | 64.91 | | | | 7.4 | % | | $ | 73.96 | | | | 6.3 | % | | $ | 68.38 | | | | 5.9 | % |
| Candlewood Suites | | | | | | | | | | | | | | | | | | | | | | | | |
| Occupancy | | | 67.1 | % | | | 5.2 | %pts | | | 71.9 | % | | | 8.7 | %pts | | | — | | | | — | |
| Average daily rate | | $ | 66.92 | | | | (5.0 | )% | | $ | 57.13 | | | | (8.8 | )% | | | — | | | | — | |
| RevPAR | | $ | 44.88 | | | | 3.0 | % | | $ | 41.10 | | | | 3.7 | % | | | — | | | | — | |
| Hotel Indigo | | | | | | | | | | | | | | | | | | | | | | | | |
| Occupancy | | | 59.0 | % | | | 6.7 | %pts | | | 62.7 | % | | | 3.3 | %pts | | | — | | | | — | |
| Average daily rate | | $ | 102.99 | | | | (0.7 | )% | | $ | 111.17 | | | | 2.6 | % | | | — | | | | — | |
| RevPAR | | $ | 60.76 | | | | 12.0 | % | | $ | 69.65 | | | | 8.4 | % | | | — | | | | — | |
35
| | | | | | | | | | | | | | | | | | | | | | | | |
| | | Franchised | | | Managed | | | Owned and leased | |
| | | 2012 | | | Change vs
2011 | | | 2012 | | | Change vs
2011 | | | 2012 | | | Change vs
2011 | |
Americas | | | | | | | | | | | | | | | | | | | | | | | | |
InterContinental | | | | | | | | | | | | | | | | | | | | | | | | |
Occupancy | | | 63.5 | % | | | 2.6 | %pts | | | 75.1 | % | | | 3.2 | %pts | | | 81.4 | % | | | 0.1 | %pts |
Average daily rate | | | 127.55 | | | | 2.9 | % | | | 205.58 | | | | 5.7 | % | | | 261.26 | | | | 7.3 | % |
RevPAR | | | 81.00 | | | | 7.4 | % | | | 154.32 | | | | 10.5 | % | | | 212.68 | | | | 7.4 | % |
Crowne Plaza | | | | | | | | | | | | | | | | | | | | | | | | |
Occupancy | | | 61.9 | % | | | 0.9 | %pts | | | 71.6 | % | | | (3.6 | )%pts | | | — | | | | — | |
Average daily rate | | | 109.57 | | | | 3.9 | % | | | 117.95 | | | | 9.1 | % | | | — | | | | — | |
RevPAR | | | 67.88 | | | | 5.4 | % | | | 84.40 | | | | 3.8 | % | | | — | | | | — | |
Holiday Inn | | | | | | | | | | | | | | | | | | | | | | | | |
Occupancy | | | 62.4 | % | | | 1.6 | %pts | | | 72.4 | % | | | 0.3 | %pts | | | 69.4 | % | | | (5.1 | )%pts |
Average daily rate | | | 100.30 | | | | 3.2 | % | | | 125.03 | | | | 9.2 | % | | | 107.76 | | | | 0.2 | % |
RevPAR | | | 62.56 | | | | 5.9 | % | | | 90.57 | | | | 9.6 | % | | | 74.78 | | | | (6.7 | )% |
Holiday Inn Express | | | | | | | | | | | | | | | | | | | | | | | | |
Occupancy | | | 65.6 | % | | | 1.5 | %pts | | | 84.7 | % | | | 2.7 | %pts | | | — | | | | — | |
Average daily rate | | | 101.97 | | | | 3.6 | % | | | 172.29 | | | | 12.0 | % | | | — | | | | — | |
RevPAR | | | 66.92 | | | | 6.1 | % | | | 145.95 | | | | 15.8 | % | | | — | | | | — | |
Staybridge Suites | | | | | | | | | | | | | | | | | | | | | | | | |
Occupancy | | | 74.6 | % | | | 1.5 | %pts | | | 71.7 | % | | | (6.1 | )%pts | | | — | | | | — | |
Average daily rate | | | 101.60 | | | | 3.9 | % | | | 116.41 | | | | 6.7 | % | | | — | | | | — | |
RevPAR | | | 75.81 | | | | 6.0 | % | | | 83.49 | | | | (1.7 | )% | | | — | | | | — | |
Candlewood Suites | | | | | | | | | | | | | | | | | | | | | | | | |
Occupancy | | | 70.5 | % | | | 1.3 | %pts | | | 66.7 | % | | | (8.1 | )%pts | | | — | | | | — | |
Average daily rate | | | 74.26 | | | | 4.0 | % | | | 68.53 | | | | 11.3 | % | | | — | | | | — | |
RevPAR | | | 52.33 | | | | 6.0 | % | | | 45.68 | | | | (0.8 | )% | | | — | | | | — | |
Hotel Indigo | | | | | | | | | | | | | | | | | | | | | | | | |
Occupancy | | | 68.7 | % | | | 3.7 | %pts | | | 72.8 | % | | | 6.9 | %pts | | | — | | | | — | |
Average daily rate | | | 123.03 | | | | 3.0 | % | | | 140.33 | | | | 7.5 | % | | | — | | | | — | |
RevPAR | | | 84.51 | | | | 8.8 | % | | | 102.22 | | | | 18.6 | % | | | — | | | | — | |
Other | | | — | | | | | | | | | | | | | | | | | | | | | |
Occupancy | | | — | | | | — | | | | 89.2 | % | | | 8.4 | %pts | | | — | | | | — | |
Average daily rate | | | — | | | | — | | | | 97.61 | | | | (0.9 | )% | | | — | | | | — | |
RevPAR | | | — | | | | — | | | | 87.03 | | | | 9.5 | % | | | — | | | | — | |
| | | | | | | | | | | | | | | | | | | | | | | | |
| | | Franchised | | | Managed | | | Owned and leased | |
| | | 2012 | | | Change vs
2011 | | | 2012 | | | Change vs
2011 | | | 2012 | | | Change vs
2011 | |
Europe | | | | | | | | | | | | | | | | | | | | | | | | |
InterContinental | | | | | | | | | | | | | | | | | | | | | | | | |
Occupancy | | | 60.0 | % | | | (0.6 | )%pts | | | 65.8 | % | | | (1.5 | )%pts | | | 83.5 | % | | | 2.4 | %pts |
Average daily rate | | | 248.42 | | | | 0.9 | % | | | 195.75 | | | | 0.6 | % | | | 452.50 | | | | 2.2 | % |
RevPAR | | | 149.08 | | | | (0.2 | )% | | | 128.79 | | | | (1.7 | )% | | | 377.66 | | | | 5.2 | % |
Crowne Plaza | | | | | | | | | | | | | | | | | | | | | | | | |
Occupancy | | | 68.5 | % | | | 0.3 | %pts | | | 77.5 | % | | | 1.6 | %pts | | | — | | | | — | |
Average daily rate | | | 131.81 | | | | 0.9 | % | | | 147.25 | | | | 0.4 | % | | | — | | | | — | |
RevPAR | | | 90.24 | | | | 1.3 | % | | | 114.04 | | | | 2.6 | % | | | — | | | | — | |
Holiday Inn | | | | | | | | | | | | | | | | | | | | | | | | |
Occupancy | | | 65.4 | % | | | 0.0 | %pts | | | 75.8 | % | | | 1.4 | %pts | | | — | | | | — | |
Average daily rate | | | 112.78 | | | | 1.8 | % | | | 111.37 | | | | 0.2 | % | | | — | | | | — | |
RevPAR | | | 73.77 | | | | 1.8 | % | | | 84.40 | | | | 2.0 | % | | | — | | | | — | |
Holiday Inn Express | | | | | | | | | | | | | | | | | | | | | | | | |
Occupancy | | | 70.4 | % | | | 0.5 | %pts | | | 45.7 | % | | | 0.3 | %pts | | | — | | | | — | |
Average daily rate | | | 93.13 | | | | 1.8 | % | | | 68.46 | | | | (7.2 | )% | | | — | | | | — | |
RevPAR | | | 65.56 | | | | 2.6 | % | | | 31.31 | | | | (6.6 | )% | | | — | | | | — | |
Staybridge Suites | | | | | | | | | | | | | | | | | | | | | | | | |
Occupancy | | | 78.5 | % | | | 4.7 | %pts | | | — | | | | — | | | | — | | | | — | |
Average daily rate | | | 110.30 | | | | (3.1 | )% | | | — | | | | — | | | | — | | | | — | |
RevPAR | | | 86.58 | | | | 3.0 | % | | | — | | | | — | | | | — | | | | — | |
Hotel Indigo | | | | | | | | | | | | | | | | | | | | | | | | |
Occupancy | | | 92.4 | % | | | 0.2 | % | | | — | | | | — | | | | — | | | | — | |
Average daily rate | | | 224.60 | | | | 4.1 | % | | | — | | | | — | | | | — | | | | — | |
RevPAR | | | 207.56 | | | | 4.2 | % | | | — | | | | — | | | | — | | | | — | |
| | | | | | | | | | | | | | | | | | | | | | | | |
| | | Franchised | | | Managed | | | Owned and leased | |
| | | 2012 | | | Change vs
2011 | | | 2012 | | | Change vs
2011 | | | 2012 | | | Change vs
2011 | |
AMEA | | | | | | | | | | | | | | | | | | | | | | | | |
InterContinental | | | | | | | | | | | | | | | | | | | | | | | | |
Occupancy | | | 70.9 | % | | | (2.8 | )%pts | | | 66.8 | % | | | 3.0 | %pts | | | 66.2 | % | | | (5.3 | )%pts |
Average daily rate | | | 221.50 | | | | 8.4 | % | | | 214.87 | | | | 1.1 | % | | | 136.82 | | | | (2.8 | )% |
RevPAR | | | 157.05 | | | | 4.2 | % | | | 143.59 | | | | 5.9 | % | | | 90.54 | | | | (10.0 | )% |
Crowne Plaza | | | | | | | | | | | | | | | | | | | | | | | | |
Occupancy | | | 70.3 | % | | | 0.4 | %pts | | | 72.2 | % | | | 3.1 | %pts | | | — | | | | — | |
Average daily rate | | | 131.19 | | | | 2.3 | % | | | 143.00 | | | | (1.1 | )% | | | — | | | | — | |
RevPAR | | | 92.17 | | | | 2.9 | % | | | 103.31 | | | | 3.3 | % | | | — | | | | — | |
Holiday Inn | | | | | | | | | | | | | | | | | | | | | | | | |
Occupancy | | | 69.5 | % | | | 2.3 | %pts | | | 73.3 | % | | | 2.3 | %pts | | | 78.6 | % | | | (8.6 | )%pts |
Average daily rate | | | 123.23 | | | | 6.7 | % | | | 120.46 | | | | 0.9 | % | | | 162.69 | | | | 2.7 | % |
RevPAR | | | 85.65 | | | | 10.3 | % | | | 88.23 | | | | 4.3 | % | | | 127.96 | | | | (7.3 | )% |
Holiday Inn Express | | | | | | | | | | | | | | | | | | | | | | | | |
Occupancy | | | 61.7 | % | | | 2.8 | %pts | | | — | | | | — | | | | — | | | | — | |
Average daily rate | | | 76.15 | | | | 14.2 | % | | | — | | | | — | | | | — | | | | — | |
RevPAR | | | 46.98 | | | | 19.7 | % | | | — | | | | — | | | | — | | | | — | |
Staybridge Suites | | | | | | | | | | | | | | | | | | | | | | | | |
Occupancy | | | — | | | | — | | | | 82.2 | % | | | 2.7 | %pts | | | — | | | | — | |
Average daily rate | | | — | | | | — | | | | 140.02 | | | | (1.8 | )% | | | — | | | | — | |
RevPAR | | | — | | | | — | | | | 115.04 | | | | 1.6 | % | | | — | | | | — | |
Other | | | | | | | | | | | | | | | | | | | | | | | | |
Occupancy | | | 72.8 | % | | | 0.1 | %pts | | | 66.9 | % | | | 5.6 | %pts | | | — | | | | — | |
Average daily rate | | | 133.59 | | | | 1.8 | % | | | 97.84 | | | | (2.5 | )% | | | — | | | | — | |
RevPAR | | | 97.3 | | | | 2.0 | % | | | 65.48 | | | | 6.4 | % | | | — | | | | — | |
| | | | | | | | | | | | | | | | | | | | | | | | | |
| | | Franchised | | Managed | | Owned and leased |
| | | | | Change vs
| | | | Change vs
| | | | Change vs
|
| | | 2010 | | 2009 | | 2010 | | 2009 | | 2010 | | 2009 |
| |
EMEA | | | | | | | | | | | | | | | | | | | | | | | | |
| InterContinental | | | | | | | | | | | | | | | | | | | | | | | | |
| Occupancy | | | 57.3 | % | | | 1.0 | %pts | | | 65.8 | % | | | 4.3 | %pts | | | 76.5 | % | | | 2.9 | %pts |
| Average daily rate | | $ | 283.71 | | | | 0.5 | % | | $ | 210.41 | | | | (1.9 | )% | | $ | 359.89 | | | | 7.1 | % |
| RevPAR | | $ | 162.68 | | | | 2.3 | % | | $ | 138.55 | | | | 4.9 | % | | $ | 275.43 | | | | 11.4 | % |
| Crowne Plaza | | | | | | | | | | | | | | | | | | | | | | | | |
| Occupancy | | | 66.9 | % | | | 4.7 | %pts | | | 75.6 | % | | | 2.7 | %pts | | | — | | | | — | |
| Average daily rate | | $ | 135.32 | | | | (0.8 | )% | | $ | 156.14 | | | �� | (4.7 | )% | | | — | | | | — | |
| RevPAR | | $ | 90.48 | | | | 6.7 | % | | $ | 118.03 | | | | (1.2 | )% | | | — | | | | — | |
| Holiday Inn | | | | | | | | | | | | | | | | | | | | | | | | |
| Occupancy | | | 64.7 | % | | | 4.4 | %pts | | | 71.6 | % | | | 1.3 | %pts | | | — | | | | — | |
| Average daily rate | | $ | 117.37 | | | | 2.2 | % | | $ | 111.30 | | | | 0.9 | % | | | — | | | | — | |
| RevPAR | | $ | 75.99 | | | | 9.6 | % | | $ | 79.73 | | | | 2.7 | % | | | — | | | | — | |
| Holiday Inn Express | | | | | | | | | | | | | | | | | | | | | | | | |
| Occupancy | | | 69.8 | % | | | 3.0 | %pts | | | 50.8 | % | | | 4.1 | %pts | | | 70.2 | % | | | 9.7 | %pts |
| Average daily rate | | $ | 95.23 | | | | 1.3 | % | | $ | 75.33 | | | | (9.8 | )% | | $ | 110.30 | | | | 11.7 | % |
| RevPAR | | $ | 66.43 | | | | 5.9 | % | | $ | 38.26 | | | | (2.0 | )% | | $ | 77.49 | | | | 29.5 | % |
| Staybridge Suites | | | | | | | | | | | | | | | | | | | | | | | | |
| Occupancy | | | — | | | | — | | | | 74.3 | % | | | 7.7 | %pts | | | — | | | | — | |
| Average daily rate | | | — | | | | — | | | $ | 112.18 | | | | (3.1 | )% | | | — | | | | — | |
| RevPAR | | | — | | | | — | | | $ | 83.39 | | | | 8.0 | % | | | — | | | | — | |
| Hotel Indigo | | | | | | | | | | | | | | | | | | | | | | | | |
| Occupancy | | | 93.4 | % | | | 7.4 | %pts | | | — | | | | — | | | | — | | | | — | |
| Average daily rate | | $ | 204.65 | | | | 2.2 | % | | | — | | | | — | | | | — | | | | — | |
| RevPAR | | $ | 191.16 | | | | 11.1 | % | | | — | | | | — | | | | — | | | | — | |
| | | | | | | | | | | | | | | | | | | | | | | | | |
| | | Franchised | | Managed | | Owned and leased |
| | | | | Change vs
| | | | Change vs
| | | | Change vs
|
| | | 2010 | | 2009 | | 2010 | | 2009 | | 2010 | | 2009 |
| |
Asia Pacific | | | | | | | | | | | | | | | | | | | | | | | | |
| InterContinental | | | | | | | | | | | | | | | | | | | | | | | | |
| Occupancy | | | 69.7 | % | | | 1.2 | %pts | | | 66.9 | % | | | 6.1 | %pts | | | 71.1 | % | | | 5.9 | %pts |
| Average daily rate | | $ | 181.67 | | | | 9.6 | % | | $ | 165.41 | | | | 1.9 | % | | $ | 358.55 | | | | 5.7 | % |
| RevPAR | | $ | 126.65 | | | | 11.5 | % | | $ | 110.59 | | | | 12.2 | % | | $ | 254.97 | | | | 15.3 | % |
| Crowne Plaza | | | | | | | | | | | | | | | | | | | | | | | | |
| Occupancy | | | 59.0 | % | | | 2.5 | %pts | | | 67.7 | % | | | 6.8 | %pts | | | — | | | | — | |
| Average daily rate | | $ | 125.74 | | | | (0.5 | )% | | $ | 104.93 | | | | 1.6 | % | | | — | | | | — | |
| RevPAR | | $ | 74.21 | | | | 4.0 | % | | $ | 71.05 | | | | 12.9 | % | | | — | | | | — | |
| Holiday Inn | | | | | | | | | | | | | | | | | | | | | | | | |
| Occupancy | | | 74.7 | % | | | 2.6 | %pts | | | 67.3 | % | | | 5.5 | %pts | | | 90.1 | % | | | 5.4 | %pts |
| Average daily rate | | $ | 84.20 | | | | (1.3 | )% | | $ | 88.51 | | | | 5.2 | % | | $ | 129.34 | | | | (0.5 | )% |
| RevPAR | | $ | 62.86 | | | | 2.2 | % | | $ | 59.57 | | | | 14.5 | % | | $ | 116.52 | | | | 5.8 | % |
| Holiday Inn Express | | | | | | | | | | | | | | | | | | | | | | | | |
| Occupancy | | | 61.3 | % | | | (2.4 | )%pts | | | 66.2 | % | | | 9.5 | %pts | | | — | | | | — | |
| Average daily rate | | $ | 47.79 | | | | (6.4 | )% | | $ | 45.61 | | | | 13.7 | % | | | — | | | | — | |
| RevPAR | | $ | 29.27 | | | | (9.9 | )% | | $ | 30.20 | | | | 32.6 | % | | | — | | | | — | |
| Other | | | | | | | | | | | | | | | | | | | | | | | | |
| Occupancy | | | 70.3 | % | | | 4.7 | %pts | | | 77.0 | % | | | 2.4 | %pts | | | — | | | | — | |
| Average daily rate | | $ | 108.52 | | | | (6.2 | )% | | $ | 92.30 | | | | (6.5 | )% | | | — | | | | — | |
| RevPAR | | $ | 76.31 | | | | 0.5 | % | | $ | 71.03 | | | | (3.5 | )% | | | — | | | | — | |
| | | | | | | | | | | | | | | | | | | | | | | | |
| | | Franchised | | | Managed | | | Owned and leased | |
| | | 2012 | | | Change vs
2011 | | | 2012 | | | Change vs
2011 | | | 2012 | | | Change vs
2011 | |
Greater China | | | | | | | | | | | | | | | | | | | | | | | | |
InterContinental | | | | | | | | | | | | | | | | | | | | | | | | |
Occupancy | | | 82.3 | % | | | (1.1 | )%pts | | | 59.5 | % | | | 4.0 | %pts | | | 77.8 | % | | | 2.8 | %pts |
Average daily rate | | | 239.27 | | | | 4.8 | % | | | 144.18 | | | | 2.1 | % | | | 395.30 | | | | 2.9 | % |
RevPAR | | | 196.85 | | | | 3.5 | % | | | 85.76 | | | | 9.5 | % | | | 307.62 | | | | 6.7 | % |
Crowne Plaza | | | | | | | | | | | | | | | | | | | | | | | | |
Occupancy | | | — | | | | — | | | | 57.3 | % | | | (0.8 | )%pts | | | — | | | | — | |
Average daily rate | | | — | | | | — | | | | 100.55 | | | | 3.3 | % | | | — | | | | — | |
RevPAR | | | — | | | | — | | | | 57.58 | | | | 1.9 | % | | | — | | | | — | |
Holiday Inn | | | | | | | | | | | | | | | | | | | | | | | | |
Occupancy | | | 81.0 | % | | | 3.3 | %pts | | | 63.0 | % | | | 0.2 | %pts | | | — | | | | — | |
Average daily rate | | | 47.93 | | | | (7.2 | )% | | | 82.95 | | | | 3.7 | % | | | — | | | | — | |
RevPAR | | | 38.84 | | | | (3.2 | )% | | | 52.29 | | | | 4.1 | % | | | — | | | | — | |
Holiday Inn Express | | | | | | | | | | | | | | | | | | | | | | | | |
Occupancy | | | 79.1 | % | | | 3.1 | %pts | | | 71.7 | % | | | 5.2 | %pts | | | — | | | | — | |
Average daily rate | | | 33.86 | | | | (5.4 | )% | | | 50.22 | | | | 4.8 | % | | | — | | | | — | |
RevPAR | | | 26.79 | | | | (1.5 | )% | | | 36.01 | | | | 13.1 | % | | | — | | | | — | |
Hotel Indigo | | | | | | | | | | | | | | | | | | | | | | | | |
Occupancy | | | — | | | | — | | | | 54.7 | % | | | 16.4 | %pts | | | — | | | | — | |
Average daily rate | | | — | | | | — | | | | 183.13 | | | | 2.3 | % | | | — | | | | — | |
RevPAR | | | — | | | | — | | | | 100.08 | | | | 46.0 | % | | | — | | | | — | |
36
Regulation
Both in the United Kingdom and internationally, the Group’s hotel operations are subject to regulation, including health and safety, zoning and similar land use laws as well as regulations that influence or determine wages, prices, interest rates, construction procedures and costs.
TRADEMARKS
Group companies own a substantial number of service brands upon which it is dependent and the Group believes that its significant trademarks are protected in all material respects in the markets in which its brands currently operate.
ORGANIZATIONAL STRUCTURE
Principal operating subsidiary undertakings
InterContinental Hotels Group PLC was the beneficial owner of all of the equity share capital, either itself or through subsidiary undertakings, of the following companies during the year. The companies listed below include those which principally affect the amount of profit and assets of the Group.
Six Continents Limited(a)(
a)Hotel Inter-Continental London Limited(a)(
a)Six Continents Hotels, Inc.(b)(
b)Inter-Continental Hotels Corporation(b)(
b)111 East 48th Street Holdings, LLC(b)(
b)InterContinental Hotels Group Resources, Inc.(b)(
b)InterContinental Hong Kong Limited(c)
Société Nouvelle du Grand Hotel SA(d)
| | |
| (a) | | Incorporated in Great Britain and registered in England and Wales. |
|
| (b) | | Incorporated in the United States. |
|
| (c) | | Incorporated in Hong Kong. |
|
| (d) | | Incorporated in France. |
37
PROPERTY, PLANT AND EQUIPMENT
Group companies own and lease properties throughout the world, principally hotels but also offices. The table below analyzes the net book value of the Group’s property, plant and equipment at December 31, 2010. Approximately 45%2012.
| | | | | | | | | | | | | | | | | | | | |
Net book value at December 31, 2012 | | Americas | | | Europe | | | AMEA | | | Greater
China | | | Total | |
| | | ($ million) | |
Land and buildings. | | | 300 | | | | 274 | | | | 11 | | | | 264 | | | | 849 | |
Fixtures, fittings and equipment | | | 50 | | | | 77 | | | | 25 | | | | 55 | | | | 207 | |
| | | | | | | | | | | | | | | | | | | | |
| | | 350 | | | | 351 | | | | 36 | | | | 319 | | | | 1,056 | |
| | | | | | | | | | | | | | | | | | | | |
In addition, there were two hotels, the InterContinental New York Barclay and the InterContinental London Park Lane, with a total net book value of $524 million that were classified as held for sale at December 31, 2012.
Including assets classified as held for sale, approximately 40% of hotel properties by value were directly owned, with 50%55% held under leases having a term of 50 years or longer.
| | | | | | | | | | | | | | | | | |
Net book value at December 31, 2010 | | Americas | | EMEA | | Asia Pacific | | Total |
| | | ($ million) |
| |
| Land and buildings | | | 495 | | | | 523 | | | | 317 | | | | 1,335 | |
| Fixtures, fittings and equipment | | | 119 | | | | 146 | | | | 90 | | | | 355 | |
| | | | | | | | | | | | | | | | | |
| | | | 614 | | | | 669 | | | | 407 | | | | 1,690 | |
| | | | | | | | | | | | | | | | | |
Approximately 85%Including assets classified as held for sale, approximately 90% of the net book value relates to the top five owned and leased hotels (in terms of value) of a total of 1510 hotels, including $183$187 million relating to assets held under finance leases.
There were no assets classified as held for sale at December 31, 2010. Subsequent to December 31, 2010, four hotels, including the InterContinental Barclay in New York, met the “held for sale” criteria of IFRS 5 “Non-current Assets Held for Sale and Discontinued Operations.” Three of the properties are located in North America and one in Australia, and all are expected to be sold within the next 12 months. The fair value less estimated costs to sell for each property exceeds its net book value.
Contracts placed for expenditure on property, plant and equipment not included in the Consolidated Financial Statements at December 31, 20102012 amounted to $10$66 million.
Charges over one hotel totaling $85$89 million exist as security provided to the Group’s pension plans.
ENVIRONMENT
With over 4,400 hotels globally and almost 1,300 in the pipeline, the Group has an opportunity to makeAs a positive difference in the communities in which it operates.
As suchleading hotel company, the Group is committed to:
| | |
| • | Implementing sound environmental practices in the design, development and operation of its hotels; |
|
| • | Encouraging the development and integration of sustainable technologies; |
|
| • | Endeavoring to reduce its use of energy, water and re-use and recycle the resources consumed by its business wherever practical; |
|
| • | Engaging its customers, colleagues, hotel owners, suppliers and contractors in its efforts to protect the environment; |
|
| • | Providing the training and resources required to meet its objectives; |
|
| • | Monitoring, recording and benchmarking its environmental performance on a regular basis; |
|
| • | Making business decisions taking into account these commitments; and |
|
| • | Communicating its policies, practices and programs to all its stakeholders. |
Corporate responsibility (“CR”)in a particularly strong position to help make tourism increasingly responsible. That is
central to the waywhy for the Group,
does business. Acting responsibly createsResponsible Business underpins all of the Group’s strategic priorities. The Group aims to harness the role hotels play in society in order to create shared value for its
brands whilebusiness, its guests, the environment and the communities where it operates, whether that is conserving and protecting resources, helping
its hotelslocal people build skills and improve their employability or providing refuge when disaster strikes. Corporate responsibility is an essential element of doing business responsibly.The Group’s corporate responsibility ambition is to manage costs, drive revenuetransform hospitality for more sustainable communities and be prepared for the future.better lives. It also keeps the Group in tune with the thinking of its stakeholders, and supports its missionworks to champion and protect the Group’s trusted reputation, which in turn reinforces trust in the Group’s brands, builds competitive advantage and strengthens its corporate reputation.
The Group is focused on developing betterfind innovative ways to
design, build and run
hotels that can fulfill the Group’s brand promises, tackle the environmental and social challenges it faces and create shared value for the Group and its
hotels. stakeholders.The Group’s strategy is based on innovation and collaboration.
38
| | |
| • | Innovation— the Group develops innovative concepts and technologies, and works closely with its partners to find creative solutions to the challenges it faces. |
|
| • | Collaboration— the Group’s stakeholders play a key role in helping it identify and tackle its priorities. Stakeholders include guests and corporate clients, hotel owners and franchise holders, local communities, employees, shareholders, suppliers, academic institutions, non-government organizations, governments and industry-specific institutions. |
The Group’s innovation and collaborationGroup focuses its corporate responsibility activities
are focused on thein two areas that make
most sense to its business and where it believes it can make
the most difference
— the environment and the local community.Environmental sustainability — the Group drives environmental sustainability through its online environmental management platform Green Engage; and
Sustainable communities — the Group creates local economic opportunity, particularly through the IHG Academy, and it provides shelter when disaster strikes through the IHG Shelter in its communities. The Group’s CR strategy focuses on two main pillars:
| | |
| • | Environment — reduce energy use in the Group’s owned and managed estate by between 6% and 10% over three years(2010-2012) via the use of Green Engage; and |
|
| • | Communities— generate local economic opportunities, particularly through the ‘‘IHG Academy’’, and provide support through disaster relief. |
a Storm Programme.Environmental sustainability
The Group chooses not simplyis committed to mitigatedesigning, building and operating more environmentally sustainable hotels, something it believes is essential to being a Responsible Business and delivering Great Hotels Guests Love. Through Green Engage, the Group’s online environmental management platform, it provides its greenhouse gas emissions through the purchase of voluntary carbon offsets. hotel owners with a roadmap to develop and operate more sustainable hotels.
Green Engage
The Group believes that as a global organization with operations in many markets, its biggest contribution towards cutting greenhouse gas emissions will come from delivering real emission cuts — through innovating new and better ways to design, build and run its hotels — not through offsetting.
The Group’s key programs include;
| | |
| • | Green Engage— Green Engage is the Group’s innovative online sustainability management system, which launched in 2009 and, which defines the Group’s vision of a sustainable hotel. Green Engage is designed to help hotels reduce energy costs, with hotels achieving energy savings of up to 25%. The system, which has recently received a LEED (Leadership in Energy and Environmental Design) endorsement, allows hotels to track, measure and report on their energy, water and waste, and recommends actions that will cut energy bills without compromising the guest experience. The Group is the world’s first hotel company to be awarded LEED endorsement for an existing hotel program, further cementing its place as an industry leader in sustainability. |
|
| • | ‘‘IHG Academy’’ — The ‘‘IHG Academy’’ is a public/private partnership with education providers and community organizations that helps the Group create local economic opportunities. |
|
| • | The Innovation Hotel— The Group’s online ‘‘innovation hotel’’ takes visitors on a tour of the model hotel of the future, pointing out practical solutions and technology that can make its hotels greener and more efficient. |
Over 1,000environmental impact of the Group’s hotels
are registeredis managed through every stage of the hotel lifecycle by Green Engage. Green Engage tracks the use of energy, carbon and the management of waste in the Group’s properties along with the associated costs. An important feature in Green Engage is Green Solutions — over 200 actions a property can implement to
usereduce its environmental impact. Green Engage can help hotels become up to 25% more energy efficient, so it makes both environmental and financial sense.In 2012, the Group continued to invest in Green Engage, adding new features such as the carbon calculator, energy and water benchmarks and multi-unit reporting. As at December 31, 2012, 2,219 of the Group’s hotels were enrolled in Green Engage and 2,000 individuals are registered as users.its user base has since grown to over 2,260 hotels. The Group’s aim is to have its entire global system using itestate tracking, managing and reporting its environmental impact over time.
Sustainable communities
The Group’s scale gives it a real opportunity to improve and transform the lives of local people in the communities where the Group operates. Its community strategy, which sets out how it can seek to create local economic opportunity, is critical to achieving economic success and delivering Great Hotels Guests Love. In 20112012 the Group continued to increase the focus on the community, successfully expanding both the IHG Academy program and the IHG Shelter in a Storm Programme.
IHG Academy
The IHG Academy is a collaboration between individual Group hotels or corporate offices and local education providers and/or community organizations providing local people with the opportunity to develop skills and improve their employment prospects in one of the world’s largest hotel companies.
Within a consistent framework, each IHG Academy is tailored to meet the needs of local communities as well as hotels around the world.
Currently the Group has over 150 IHG Academy programs in 37 countries around the world and its vision is to have as many Group hotels as possible participating in an IHG Academy. The Group’s ability to build skills and raise aspirations across hundreds of communities continues to show the Group’s commitment to this program.
IHG Shelter in a Storm Programme
Through the IHG Shelter in a Storm Programme, the Group’s hotels receive guidance on when and how best to respond when natural or man-made disasters occur. The Group’s global partnership with CARE allows it to draw on expertise in humanitarian assistance and helps it find appropriate partners in the area when disaster strikes, directing help to where it is needed.
The IHG Shelter Fund, a pool of funds from the fundraising efforts of the Group’s hotels and corporate offices, is a key element of the IHG Shelter in a Storm Programme, enabling the Group to respond quickly when disaster strikes, instead of waiting to raise funds after the event.
In 2012, $545,000 was raised for the IHG Shelter in a Storm Programme and the fund was put into action to support 10 disasters in six countries, including responding to severe flooding and a cyclone in Fiji, Superstorm Sandy on the US East Coast, flooding in Manila and the UK, wildfires in Colorado and Hurricane Isaac on the US Gulf Coast.
In 2013, the Group will launch version 2.0 of Green Engage based on feedback from existing users. The new version retains allcontinue to enhance environmental sustainability, create local economic opportunity and to engage stakeholders to champion the featurescorporate responsibility agenda and benefits ofprotect the original but is easier to use with better benchmarking.
| |
| ITEM 4A. | UNRESOLVED STAFF COMMENTS |
| |
| ITEM 5. | OPERATING AND FINANCIAL REVIEW AND PROSPECTS |
Business and Overviewoverview
The Group is an international hotel business which owns a portfolio of established and diverse hotel brands, including InterContinental Hotels & Resorts, Crowne Plaza Hotels & Resorts, Holiday Inn Hotels & Resorts (including Holiday Inn Club Vacations), Holiday Inn Express, Staybridge Suites, Candlewood Suites and Hotel Indigo. At December 31, 2010,2012, the Group had 4,4374,602 franchised, managed, owned and leased hotels and 647,161
39
675,982 guest rooms in nearly 100 countries and territories around the world. The Group also manages the hotel loyalty program, Priority Club Rewards.
Rewards (the Group announced on March 26, 2013 that it will be enhancing and renaming the Priority Club Rewards program as “IHG Rewards Club” from July 2013).In the first quarter 2012, the Group launched two new brands. EVEN Hotels is aimed at business and leisure travelers who are looking for a wellness experience in a hotel stay at a mainstream price point. HUALUXE Hotels & Resorts is the first international upscale hotel brand designed specifically for Chinese guests, to take advantage of both the supply and demand side opportunities the Group sees in China.
The Group’s revenue and earnings are derived from hotel operations, which include franchise and other fees paid under franchise agreements, management and other fees paid under management contracts, where the Group operates third-parties’ hotels, and operation of the Group’s owned hotels.
Operational Performanceperformance
Revenue increased by 5.9%3.8% to $1,628$1,835 million and operating profit before exceptional items increased by 22.3%9.8% to $444$614 million during the year12 months ended December 31, 2010.
2012.Fee revenue, which is Group revenue excluding revenue from owned and leased hotels, significant liquidated damages received in 2012 and 2011 and properties that are structured for legal reasons as operating leases, but with the same characteristics as management contracts, increased by 6.8% when translated at constant currency (applying 2011 exchange rates).
The 20102012 results reflect a return tocontinued RevPAR growth in a recovering global market,each of the regions, with an overall RevPAR increase of 6.2% led by occupancy. 2010 fourth quarter comparable RevPAR increased 8.0% compared to the same quarter in 2009,5.2%, including a 2.4%3.2% increase in average daily rate. During 2010, average daily rateThe results also benefited from overall system size growth of 2.7% year-on-year to 675,982 rooms. Group RevPAR growth remained robust for the InterContinentalyear, reflecting favorable supply and Holiday Inn brandsdemand dynamics in the US over 2012, although trading was also adversely affected by the impact of Eurozone uncertainty as well as industry-wide challenges in Greater China in the latter part of the year related to the political leadership change.
Operating profit improved in each of the regions. RevPAR growth of 6.1% in The Americas helped drive an operating profit increase of $42 million (9.5%), after excluding the benefit of a $3 million liquidated damages receipt in 2012 and a $10 million liquidated damages receipt in 2011. Operating profit in Europe increased by 1.3%$11 million (10.6%), with RevPAR growth of 1.7%. Operating profit in AMEA increased by $13 million (17.3%), after adjusting for a $6 million liquidated damages receipt in 2011 and 0.5% respectively.
The $1 billion roll-out of the
Holiday Inn brand family relaunch is substantially complete. By December 31, 2010, 2,956 hotels were converted globally under the relaunch program, representing 89% of all Holiday Inn hotels. The required improvement in quality standards contributed to the removaldisposal of a
totalhotel asset and partnership interest that contributed $3 million in profits in 2011, reflecting RevPAR growth of
35,262 rooms from4.9%. Strong operating profit growth of $14 million in Greater China reflected an 11.6% increase in system size as well as 5.4% RevPAR growth.Operating profit margin was 42.6%, up 2.0 percentage points on 2011 (a particularly strong result which the Group’s global system during 2010. In spiteGroup anticipates will revert back to move normal levels of this necessary reduction, the closing global room count was 647,161 rooms,growth in line with 2009 levels.
2013), after adjusting for owned and leased hotels, The Americas and Europe managed leases and significant liquidated damages received in 2012 and 2011.The performance of the Group is evaluated primarily on a regional basis. The regional operations are split by business model: franchise agreement, management contract, and owned and leased operations. All three income types are affected by occupancy and room rates achieved by hotels, the ability to manage costs and the change in the number of available rooms through acquisition, development and disposition. Results are also impacted by economic conditions and capacity. The Group’s segmental results are shown before exceptional operating items, interest expense, interest income and income taxes.
CRITICAL ACCOUNTING POLICIES
The preparation of the financial statementsFinancial Statements requires management to make estimates and assumptions that affect the reported amounts of assets and liabilities, the disclosure of contingent assets and liabilities at the date of the financial statementsFinancial Statements and the reported amounts of revenues and costs and expense during the reporting period. On an ongoing basis, management evaluates its estimates and judgments, including those relating to revenue recognition, bad debts, investments, property, plant and equipment, goodwill and intangible assets, income taxes, guest program liability, self insurance claims payable, restructuring costs, retirement benefits and contingencies and litigation.
Management bases its estimates and judgments on historical experience and on other factors that are believed to be reasonable under the circumstances, the results of which form the basis for making judgments about the carrying value of assets and liabilities that are not readily available from other sources. Actual results may differ from these estimates under different assumptions and conditions.
The Group’s critical accounting policies are set out below.
Revenue is the gross inflow of economic benefits received and receivable by the Group on its own account where those inflows result in increases in equity.
Revenue is derived from the following sources: franchise fees; management fees; owned and leased properties and other revenues which are ancillary to the Group’s operations, including technology fee income.
Generally, revenue represents sales (excluding VAT and similar taxes) of goods and services, net of discounts, provided in the normal course of business and recognized when services have been rendered. The following is a description of the composition of revenues of the Group.
40
Franchise fees — received in connection with the license of the Group’s brand names, usually under long-term contracts with the hotel owner. The Group charges franchise royalty fees as a percentage of room revenue. Revenue is recognized when earned and realized or realizable under the terms of the agreement.
contract.Management fees — earned from hotels managed by the Group, usually under long-term contracts with the hotel owner. Management fees include a base fee, which is generally a percentage of hotel revenue, and an incentive fee, which is generally based on the hotel’s profitability or cash flows. Revenue is recognized when earned and realized or realizable under the terms of the contract.
Owned and leased — primarily derived from hotel operations, including the rental of rooms and food and beverage sales from owned and leased hotels operated under the Group’s brand names. Revenue is recognized when rooms are occupied and food and beverages are sold.
In addition to management or franchise fees, hotels within the IHGGroup’s system pay cash assessments and contributions which are collected for specific use within the System Fund (the “Fund”).Fund. The Fund also receives proceeds from the sale of Priority Club Rewards points. The Group exerts significant influence over the operation of the Fund, however, the Fund is managed for the benefit of hotels in the system with the objective of driving revenues for the hotels. The Fund is used to pay for marketing, the Priority Club Rewards loyalty program and the global reservations system. The Fund is planned to operate at breakeven with any short-term timing surplus or deficit carried in the Consolidated statement of financial position within working capital. As all Fund income is designated for specific purposes and does not result in a profit or loss for the Group, the revenue recognition criteria as outlined in the accounting policy above are not met and therefore the income and expenses of the Fund are not included in the Consolidated income statement. Financial information relating to the Fund is included in Note 31 of Notes to the Consolidated Financial Statements.
Goodwill, intangible assets, and property, plant and equipment
Goodwill arising on acquisitions priorCapitalized goodwill is not amortized but is subject to October 1, 1998 was eliminated against equity. From October 1, 1998 to December 31, 2003, acquired goodwill was capitalized and amortized over a period not exceeding 20 years. Since January 1, 2004, goodwill continued to be capitalized but amortization ceased as at that date, replaced by an impairment review on an annual basis or more frequently if there are indicators of impairment. The annual review is performed in the fourth quarter. Goodwill is allocated to cash-generating units for impairment testing purposes.
Intangible assets and property, plant and equipment are capitalized and amortized over their expected useful lives, and reviewed for impairment when events or circumstances indicate that the carrying value may not be recoverable. Assets that do not generate independent cash flows are combined into cash-generating units.
The impairment testing of individual assets or cash-generating units requires an assessment of the recoverable amount of the asset or cash-generating unit. If the carrying value of the asset or cash-generating unit exceeds its estimated recoverable amount, the asset or cash-generating unit is written down to its recoverable amount. Recoverable amount is the greater of fair value less cost to sell and value in use. Value in use is assessed based on estimated future cash flows discounted to their present value using a pre-tax discount rate that is based on the Group’s weighted average cost of capital adjusted to reflect the risks specific to the business model and territory of the cash-generating unit or asset being tested. The outcome of such an assessment is subjective, and the result sensitive to the assumed future cashflows to be generated by the cash-generating units or assets and discount rates applied in calculating the value in use. Any impairment arising is charged to the income statement.
With the exception of goodwill, impairment charges are reversed when there is a subsequent recovery in the recoverable amount of the asset arising from an increase in its service potential, either from use or from sale.Following the full impairment of Americas managed goodwill in 2009, the remaining balance of goodwill of $92$93 million at December 31, 2010,2012, relates to Asia Australasia franchised and managed operations. Given the substantial valuation headroom relating to this goodwill, management believe that the carrying value of the cash-generating unit would only exceed its recoverable amount in the event of highly unlikely changes in the key assumptions.
During 2010,2012, a previously recorded impairment charge relating to a North American hotel was reversed in full following a re-assessment of its recoverable amount, based on the Group recognized totalmarket value of the hotel as determined by an independent professional property valuer. There were no impairment charges of $7 million across two asset categories as follows:
| | |
| • | Property, plant and equipment — $6 million in respect of one hotel in the Americas; and |
|
| • | Other financial assets — $1 million in respect of two equity investments in North America. |
41
The hotel impairment charge was measured by reference to value in use calculations using a pre-tax discount rate of 11.8%. Following the impairment charge, the hotel had a net book value of $4 million at December 31, 2010.
The equity investments were impaired following significant and prolonged declines in their fair value below cost. Following the impairment charges, the combined investments had a net book value of $5 million.
Income taxes
The Group provides for deferred tax in accordance with IAS 12 “Income Taxes” in respect of temporary differences between the tax base and carrying value of assets and liabilities including accelerated capital allowances, unrelieved tax losses, unremitted profits from overseas where the Group does not control remittance, gains rolled over into replacement assets, gains on previously revalued properties and other short-term temporary differences. Deferred tax assets are recognized to the extent that it is regarded as probable that the deductible temporary differences can be realized. The Group estimates deferred tax assets and liabilities based on current tax laws and rates, and in certain cases, business plans, including management’s expectations regarding the manner and timing of recovery of the related assets. Changes in these estimates may affect the amount of deferred tax liabilities or the valuation of deferred tax assets.
Provisions for tax contingencies require judgments on the expected outcome of tax exposures and ongoing tax audit discussions which may be subject to significant uncertainty, and therefore the actual results may vary from expectations resulting in adjustments to contingencies, the valuation of deferred tax assets and cash tax settlements.
During 2010,2012, an exceptional provision releasescredit of $7$141 million were made in relationarose, representing the recognition of $104 million of deferred tax assets, principally relating to pre-existing overseas tax losses, whose value has become more certain as a result of a change of law and the resolution of prior period tax matters, which have been settled or in respecttogether with the associated release of which the relevant statutory limitation period has expired.
$37 million of tax contingencies.Loyalty program
The hotel loyalty program, Priority Club Rewards enables members to earn points, funded through hotel assessments, during each qualifying stay and redeem the points at a later date for free accommodation or other benefits. The future redemption liability is included in trade and other payables and is estimated using eventual redemption rates determined by actuarial methods and points values. Actuarial gains and losses on the future redemption liability are borne by the System Fund and any resulting changes in the liability would correspondingly adjust the amount of short-term timing differences held in the Group statement of financial position. The future redemption liability amounted to $531$623 million at December 31, 2010.
2012.Pensions and other post-employment benefit plans
Accounting for pensions and other post-employment benefit plans requires the Group to make assumptions including, but not limited to, future asset returns, discount rates, rates of inflation, life expectancies and health care costs. The use of different assumptions could have a material effect on the accounting values of the relevant assets and liabilities which could result in a material change to the cost of such liabilities as recognized in the income statement over time. These assumptions are subject to periodic review. A sensitivity analysis to changes in various assumptions is included in Note 3 of Notes to the Consolidated Financial Statements.
OPERATING RESULTS
Accounting Principlesprinciples
The following discussion and analysis is based on the Consolidated Financial Statements of the Group, which are prepared in accordance with IFRS.
For the year ended December 31, 20102012 the results include exceptional items totaling a net chargecredit of $138 million (2011 $96 million credit, 2010 $4 million (2009 $80 million, 2008 $85 million)charge). For comparability of the periods presented, some performance indicators in this Operating and financial review and prospects discussion have been calculated after eliminating these exceptional items. Such indicators are prefixed with “adjusted”. An analysis of exceptional items is included in Note 5 of Notes to the Consolidated Financial Statements.
42
| | | | | | | | | | | | |
| | | Year ended December 31, | |
| | | 2012 | | | 2011 | | | 2010 | |
| | | ($ million) | |
Total revenue | | | 1,835 | | | | 1,768 | | | | 1,628 | |
| | | | | | | | | | | | |
Operating profit before exceptional operating items | | | 614 | | | | 559 | | | | 444 | |
Exceptional operating items | | | (4 | ) | | | 57 | | | | (7 | ) |
| | | | | | | | | | | | |
Operating profit | | | 610 | | | | 616 | | | | 437 | |
Net financial expenses | | | (54 | ) | | | (62 | ) | | | (62 | ) |
| | | | | | | | | | | | |
Profit before tax | | | 556 | | | | 554 | | | | 375 | |
Tax. | | | (11 | ) | | | (81 | ) | | | (97 | ) |
| | | | | | | | | | | | |
Profit after tax | | | 545 | | | | 473 | | | | 278 | |
Gain on disposal of assets, net of tax | | | — | | | | — | | | | 2 | |
| | | | | | | | | | | | |
Profit for the year | | | 545 | | | | 473 | | | | 280 | |
| | | | | | | | | | | | |
Earnings per ordinary share: | | | | | | | | | | | | |
Basic | | | 189.5 | ¢ | | | 163.7 | ¢ | | | 97.2 | ¢ |
Adjusted | | | 141.5 | ¢ | | | 130.4 | ¢ | | | 98.6 | ¢ |
| | | |
Average US dollar to sterling exchange rate | | $ | 1:£0.63 | | | $ | 1:£0.62 | | | $ | 1:£0.65 | |
| | | | | | | | | | | | | |
| | | Year ended December 31, |
| | | 2010 | | 2009 | | 2008 |
| | | ($ million) |
| |
| Total revenue | | | 1,628 | | | | 1,538 | | | | 1,897 | |
| | | | | | | | | | | | | |
| Operating profit before exceptional operating items | | | 444 | | | | 363 | | | | 549 | |
| | | | | | | | | | | | | |
| Exceptional operating items | | | (7 | ) | | | (373 | ) | | | (132 | ) |
| | | | | | | | | | | | | |
| Operating profit/(loss) | | | 437 | | | | (10 | ) | | | 417 | |
| Net financial expenses | | | (62 | ) | | | (54 | ) | | | (101 | ) |
| | | | | | | | | | | | | |
| Profit/(loss) before tax | | | 375 | | | | (64 | ) | | | 316 | |
| Tax | | | (97 | ) | | | 272 | | | | (59 | ) |
| | | | | | | | | | | | | |
| Profit after tax | | | 278 | | | | 208 | | | | 257 | |
| Gain on disposal of assets, net of tax | | | 2 | | | | 6 | | | | 5 | |
| | | | | | | | | | | | | |
| Profit for the year | | | 280 | | | | 214 | | | | 262 | |
| | | | | | | | | | | | | |
| Earnings per ordinary share: | | | | | | | | | | | | |
| Basic | | | 97.2¢ | | | | 74.7¢ | | | | 91.3¢ | |
| Adjusted | | | 98.6¢ | | | | 102.8¢ | | | | 120.9¢ | |
Year ended December 20102012 compared with year ended December 20092011
Revenue increased by 5.9%3.8% to $1,628$1,835 million and operating profit before exceptional items increased by 22.3%9.8% to $444$614 million during the year12 months ended December 31, 2010.
In 2010, the InterContinental Buckhead, Atlanta and the Holiday Inn Lexington were sold for $105 million and $5 million, respectively, with proceeds used to reduce net debt. These disposals resulted in a reduction in owned and leased revenue and operating profit of $19 million and $4 million, respectively, compared to 2009.
The average US dollar exchange rate to sterling strengthened during 2010 (2010 $1=£0.65, 2009 $1=£0.64). Translated at constant currency, applying 2009 exchange rates, revenue increased by 6.0% and operating profit increased by 22.3%.
2012.Exceptional operating items
Exceptional operating items totaled a net loss of $7$4 million. Exceptional gains included a $23 million consistedimpairment reversal and the release of a litigation provision of $22 million, an impairment charge of $7 million, severance costs of $4 million and costs of $9 million liability no longer required relating to complete the Holiday Inn brand family relaunch offset by gains2003 demerger of $35the Group from Six Continents PLC. Exceptional charges included $16 million from the reorganization of the Group’s support functions together with a restructuring in the AMEA region, $2 million loss on disposal of assets, includingan interest in a $27hotel and $18 million profit on the salewrite-off of the InterContinental Buckhead, Atlanta.
Compared with the previous year, exceptional operating items in 2010 were significantly lower as 2009 was impacted by difficult trading which resulted in exceptional operating costs of $373 million, primarily due to the recognition of impairment charges, an onerous contract provision and the cost of office closures.
software.Exceptional operating items are treated as exceptional by reason of their size or nature and are excluded from the calculation of adjusted earnings per ordinary share in order to provide a more meaningful comparison of performance.
Net financial expenses increased fromdecreased by $8 million to $54 million in 2009primarily due to $62 million in 2010, as the effect of the £250 million 6% bond offset lower netaverage debt levels and low interest rates. Average net debt levels in 2010 were lower than 2009 primarily as a result of improved trading, the disposal of the InterContinental Buckhead, Atlanta and a continuing focus on cash management.
43
Financing costs included $2 million (2009 $2(2011 $1 million) of interest costs associated with Priority Club Rewards where interest is charged on the accumulated balance of cash received in advance of the redemption points awarded. Financing costs in 20102012 also included $18$19 million (2009(2011 $18 million) in respect of the InterContinental Boston finance lease.
The effective rate of tax on the combinedoperating profit, from continuing and discontinued operations, excluding the impact of exceptional items, was 26% (2009 5%27% (2011 24%). The rate was particularly low in 2009 due toExcluding the impact of prior year items relative to a lower level of profit than in 2010. By excluding the impact of prior year items, which are included wholly within continuing operations, the equivalent tax rate would be 35% (2009 42%30% (2011 36%). This rate is higher than the average UK statutory rate of 28%24.5% due mainly to certain overseas profits (particularly in the US) being subject to statutory rates higher than the UK statutory rate, unrelieved foreign taxes and disallowable expenses.
Taxation within exceptional items totaled a credit of $1$142 million (2009 $287(2011 $39 million) in respect of continuing operations.. This represented, primarily, the recognition of $104 million of deferred tax assets whose value has become more certain as a result of a change in law and the resolution of prior period tax matters, together with the associated release of exceptional provisions relating$37 million of provisions. In 2011 this related to a revision of the estimated tax matters which were settled during 2010, or in respectimpacts of which the statutory limitation period had expired, together with tax relief on exceptional costs, tax arising on disposals and also tax relating to an internal reorganization completed in 2010.
Net tax paid in 20102012 totaled $68$122 million (2009 $2(2011 $90 million) including $4$3 million paid (2009(2011 $1 million) in respect of disposals. Tax paid represents an effective rate of 22% (2011 16%) on total profits and is lower than the current periodeffective income statement tax charge,rate of 27% primarily due to the impact of deferred taxes (including the realization of assets such as tax losses), the receipt of refunds in respect of prior years together withand provisions for tax for which no payment of tax washas currently been made.
Detailed information concerning the Group’s tax position can be found in Notes 7 and 25 of Notes to the Consolidated Financial Statements.
The Group pursues a tax strategy that is consistent with its business strategy and its overall business conduct principles. This strategy seeks to ensure full compliance with all tax filing, payment and reporting obligations on the basis of communicative and transparent relationships with tax authorities. Policies and procedures related to tax risk management are subject to regular review and update and are approved by the Board.
Tax liabilities or refunds may differ from those anticipated, in particular as a result of changes in tax law, changes in the interpretation of tax law, or clarification of uncertainties in the application of tax law. Procedures to minimize risk include the preparation of thorough tax risk assessments for all transactions carrying tax risk and, where appropriate, material tax uncertainties are discussed and resolved with tax authorities in advance.
The Group’s contribution to the jurisdictions in which it operates includes a significant contribution in the form of taxes borne and collected, including taxes on its revenues and profits and in respect of the employment its business generates.
The Group earns approximately 60% of its revenues in the form of franchise, management or similar fees, with almost 90% of the Group’s branded hotels being franchised. In jurisdictions in which the Group does franchise business, the prevailing tax law will generally provide for the Group to be taxed in the form of local withholding taxes based on a percentage of fees rather than based on profits. Costs to support the franchise business are normally incurred regionally or globally and therefore profits for an individual franchise jurisdiction cannot be separately determined.
Earnings per ordinary share
Basic earnings per ordinary share in 20102012 was 97.2 cents,189.5¢, compared with 74.7 cents163.7¢ in 2009.2011. Adjusted earnings per ordinary share was 98.6 cents,141.5¢, against 102.8 cents130.4¢ in 2009.
2011.Highlights for the year ended December 31, 20102012
The following is a discussion of the year ended December 31, 20102012 compared with the year ended December 31, 2009.
| | | | | | | | | | | | | |
| | | Year ended
| | Year ended
| | |
| | | December 31,
| | December 31,
| | |
| | | 2010 | | 2009 | | Change |
| | | ($ million) | | % |
| |
| Revenue | | | | | | | | | | | | |
| Americas | | | 807 | | | | 772 | | | | 4.5 | |
| EMEA | | | 414 | | | | 397 | | | | 4.3 | |
| Asia Pacific | | | 303 | | | | 245 | | | | 23.7 | |
| Central | | | 104 | | | | 124 | | | | (16.1 | ) |
| | | | | | | | | | | | | |
| Total | | | 1,628 | | | | 1,538 | | | | 5.9 | |
| | | | | | | | | | | | | |
Operating profit before exceptional operating items(1) | | | | | | | | | | | | |
| Americas | | | 369 | | | | 288 | | | | 28.1 | |
| EMEA | | | 125 | | | | 127 | | | | (1.6 | ) |
| Asia Pacific | | | 89 | | | | 52 | | | | 71.2 | |
| Central | | | (139 | ) | | | (104 | ) | | | (33.7 | ) |
| | | | | | | | | | | | | |
| Total | | | 444 | | | | 363 | | | | 22.3 | |
| | | | | | | | | | | | | |
Group results
| | | | | | | | | | | | |
| | | Year ended
December 31,
2012 | | | Year ended
December 31,
2011 | | | Change | |
| | | ($ million) | | | % | |
Revenue | | | | | | | | | | | | |
Americas | | | 837 | | | | 830 | | | | 0.8 | |
Europe | | | 436 | | | | 405 | | | | 7.7 | |
AMEA. | | | 218 | | | | 216 | | | | 0.9 | |
Greater China | | | 230 | | | | 205 | | | | 12.2 | |
Central | | | 114 | | | | 112 | | | | 1.8 | |
| | | | | | | | | | | | |
Total | | | 1,835 | | | | 1,768 | | | | 3.8 | |
| | | | | | | | | | | | |
Operating profit before exceptional operating items(1) | | | | | | | | | | | | |
Americas | | | 486 | | | | 451 | | | | 7.8 | |
Europe | | | 115 | | | | 104 | | | | 10.6 | |
AMEA. | | | 88 | | | | 84 | | | | 4.8 | |
Greater China | | | 81 | | | | 67 | | | | 20.9 | |
Central | | | (156 | ) | | | (147 | ) | | | (6.1 | ) |
| | | | | | | | | | | | |
Total | | | 614 | | | | 559 | | | | 9.8 | |
| | | | | | | | | | | | |
| | |
| (1) | | Operating profit before exceptional operating items does not include exceptional operating items for all periods presented. Exceptional operating items (charge unless otherwise noted) by region were Americas $8 million (2009 $301 million); EMEA credit of $3$23 million (2009 $22(2011 credit of $35 million); Asia Pacific $2Europe $4 million (2009 $7(2011 $39 million); AMEA $5 million (2011 credit of $26 million); Greater China $nil (2011 $nil); and Central $nil (2009 $43credit of $18 million (2011 credit of $35 million). |
44
Revenue increased by 5.9%3.8% to $1,628$1,835 million and operating profit before exceptional items increased by 22.3%9.8% to $444$614 million during the year12 months ended December 31, 2010.
The 2010 results reflect a return to RevPAR growth in a recovering global market, with an overall RevPAR increase of 6.2% led by occupancy. 2010 fourth quarter comparable RevPAR increased 8.0% compared to the same quarter in 2009, including a 2.4% increase in average daily rate. During 2010, average daily rate for the InterContinental and Holiday Inn brands increased by 1.3% and 0.5% respectively.
The $1 billion roll-out of the Holiday Inn brand family relaunch2012.Fee revenue, which is substantially complete. By December 31, 2010, 2,956 hotels were converted globally under the relaunch program, representing 89% of all Holiday Inn hotels. The required improvement in quality standards contributed to the removal of a total of 35,262 roomsGroup revenue excluding revenue from the Group’s global system during 2010. In spite of this necessary reduction, the Group’s closing global room count was 647,161 rooms, in line with 2009 levels.
The ongoing focus on efficiency across the Group largely sustained underlying cost reductions achieved in 2009. Regional and central overheads increased by $49 million, from $209 million in 2009 to $258 million in 2010, driven by incremental performance based incentive costs of $47 million and charges of $4 million relating to a self-insured healthcare benefit plan.
Primarily as a result of these actions taken across the Group to improve efficiencies, operating profit margin was 35.7%, up 1.1 percentage points on 2009, after adjusting for owned and leased hotels, Americas managed leases, significant liquidated damages received in 2009, an onerous contract provision established in 20092012 and non-payment of performance based incentive costs in 2009.
In 2010 the InterContinental Buckhead, Atlanta2011 and the Holiday Inn Lexington were sold for $105 million and $5 million respectively, with proceeds used to reduce net debt. These disposals resulted in a reduction in owned and leased revenue and operating profit of $19 million and $4 million, respectively, compared to 2009.
Americas
Americas Results
| | | | | | | | | | | | | |
| | | Year ended
| | Year ended
| | |
| | | December 31,
| | December 31,
| | |
| | | 2010 | | 2009 | | Change |
| | | ($ million) | | % |
| |
| Revenue | | | | | | | | | | | | |
| Franchised | | | 465 | | | | 437 | | | | 6.4 | |
| Managed | | | 119 | | | | 110 | | | | 8.2 | |
| Owned and leased | | | 223 | | | | 225 | | | | (0.9 | ) |
| | | | | | | | | | | | | |
| Total | | | 807 | | | | 772 | | | | 4.5 | |
| | | | | | | �� | | | | | | |
| Operating profit before exceptional operating items | | | | | | | | | | | | |
| Franchised | | | 392 | | | | 364 | | | | 7.7 | |
| Managed | | | 21 | | | | (40 | ) | | | 152.5 | |
| Owned and leased | | | 13 | | | | 11 | | | | 18.2 | |
| | | | | | | | | | | | | |
| | | | 426 | | | | 335 | | | | 27.2 | |
| Regional overheads | | | (57 | ) | | | (47 | ) | | | (21.3 | ) |
| | | | | | | | | | | | | |
| Total | | | 369 | | | | 288 | | | | 28.1 | |
| | | | | | | | | | | | | |
Revenue and operating profit before exceptional items increased by $35 million to $807 million (4.5%) and $81 million to $369 million (28.1%) respectively.
Franchised revenue increased by $28 million to $465 million (6.4%) and operating profit by $28 million to $392 million (7.7%) compared to 2009. Royalties growth was driven by RevPAR gains across all brands and by a 4.5% RevPAR increase in total. While franchised hotel and room count at December 31, 2010 was lower than at
45
December 31, 2009, the weighting of removals towards the end of 2010 meant that daily rooms available actually increased in 2010 from 2009 levels, further boosting royalty growth. Non royalty revenues and profits remained flat on 2009, as real estate financing for new activity remained constrained.
Managed revenue increased by $9 million to $119 million (8.2%) in line with the RevPAR growth of 7.5%. Operating profit increased by $61 million to $21 million from a $40 million loss in 2009. The loss in 2009 included a charge for priority guarantee shortfalls relating to a portfolio of hotels. A provision for onerous contracts was established on December 31, 2009 and further payments made during 2010 were charged against this provision. Excluding the effect of the provision, managed operating profit increased by $3 million, driven by RevPAR growth of 23.3% in Latin America.
Results from managed operations included revenues of $71 million (2009 $71 million) and operating profit of $1 million (2009 nil) from properties that are structured for legal reasons as operating leases, but with the same characteristics as management contracts.
Owned and leased revenue declined by $2 million to $223 million (0.9%) and operating profitcontracts, increased by
$2 million to $13 million (18.2%)6.8% when translated at constant currency (applying 2011 exchange rates).
Improving trading conditions led to aThe 2012 results reflect continued RevPAR growth in each of the regions, with an overall RevPAR increase of 6.4%5.2%, including an 8.1%a 3.2% increase atin average daily rate. The results also benefited from system size growth of 2.7% year-on-year to 675,982 rooms. Group RevPAR growth remained robust for the InterContinental New York Barclay. The disposal ofyear, reflecting favorable supply and demand dynamics in the InterContinental Buckhead, Atlanta in July 2010 and its subsequent conversion to a management contract resulted in reductions of $15 million in revenue and $4 million in operating profit when compared to 2009. The Holiday Inn LexingtonUS over 2012, although trading was also sold in March 2010, which led to a $4 million reduction in revenue and no reduction in operating profit compared to 2009. Excludingaffected by the impact of these two disposals, ownedEurozone uncertainty as well as industry-wide challenges in Greater China in the latter part of the year related to the political leadership change.
Operating profit improved in each of the regions. RevPAR growth of 6.1% in The Americas helped drive an operating profit increase of $42 million (9.5%), after excluding the benefit of a $3 million liquidated damages receipt in 2012 and leased revenuea $10 million liquidated damages receipt in 2011. Operating profit in Europe increased by $17$11 million (9.0%(10.6%), with RevPAR growth of 1.7%. Operating profit in AMEA increased by $13 million (17.3%), after adjusting for a $6 million liquidated damages receipt in 2011 and the disposal of a hotel asset and partnership interest that contributed $3 million in profits in 2011, reflecting RevPAR growth of 4.9%. Strong operating profit by $6 million (150.0%) compared to 2009.
Regional overheads increased by $10 million (21.3%) from $47growth of $14 million in 2009 to $57 millionGreater China reflected an 11.6% increase in 2010. The increase was attributable primarily to performance based incentives and $4 million from increased claims in a self-insured healthcare benefit plan.
EMEA
EMEA Results
| | | | | | | | | | | | | |
| | | Year ended
| | Year ended
| | |
| | | December 31,
| | December 31,
| | |
| | | 2010 | | 2009 | | Change |
| | | ($ million) | | % |
| |
| Revenue | | | | | | | | | | | | |
| Franchised | | | 81 | | | | 83 | | | | (2.4 | ) |
| Managed | | | 130 | | | | 119 | | | | 9.2 | |
| Owned and leased | | | 203 | | | | 195 | | | | 4.1 | |
| | | | | | | | | | | | | |
| Total | | | 414 | | | | 397 | | | | 4.3 | |
| | | | | | | | | | | | | |
| Operating profit before exceptional operating items | | | | | | | | | | | | |
| Franchised | | | 59 | | | | 60 | | | | (1.7 | ) |
| Managed | | | 62 | | | | 65 | | | | (4.6 | ) |
| Owned and leased | | | 40 | | | | 33 | | | | 21.2 | |
| | | | | | | | | | | | | |
| | | | 161 | | | | 158 | | | | 1.9 | |
| Regional overheads | | | (36 | ) | | | (31 | ) | | | (16.1 | ) |
| | | | | | | | | | | | | |
| Total | | | 125 | | | | 127 | | | | (1.6 | ) |
| | | | | | | | | | | | | |
Revenue increased by $17 million to $414 million (4.3%) and operating profit before exceptional items decreased by $2 million to $125 million (1.6%) compared to 2009. system size as well as 5.4% RevPAR growth.At constant currency, revenuecentral overheads increased by $30from $147 million (7.6%)in 2011 to $158 million in 2012 ($156 million at actual currency), reflecting investment in infrastructure and capabilities to support the growth of the business.
Americas
| | | | | | | | | | | | |
| | | Year ended
December 31,
2012 | | | Year ended
December 31,
2011 | | | Change | |
| | | ($ million) | | | % | |
Revenue | | | | | | | | | | | | |
Franchised | | | 541 | | | | 502 | | | | 7.8 | |
Managed | | | 97 | | | | 124 | | | | (21.8 | ) |
Owned and leased | | | 199 | | | | 204 | | | | (2.5 | ) |
| | | | | | | | | | | | |
Total | | | 837 | | | | 830 | | | | 0.8 | |
| | | | | | | | | | | | |
Operating profit before exceptional operating items | | | | | | | | | | | | |
Franchised | | | 466 | | | | 431 | | | | 8.1 | |
Managed | | | 48 | | | | 52 | | | | (7.7 | ) |
Owned and leased | | | 24 | | | | 17 | | | | 41.2 | |
| | | | | | | | | | | | |
| | | 538 | | | | 500 | | | | 7.6 | |
Regional overheads | | | (52 | ) | | | (49 | ) | | | (6.1 | ) |
| | | | | | | | | | | | |
Total | | | 486 | | | | 451 | | | | 7.8 | |
| | | | | | | | | | | | |
Revenue and operating profit before exceptional items increased by $3$7 million (2.4%(0.8%). Excluding $3 to $837 million and by $35 million (7.8%) to $486 million respectively. RevPAR increased 6.1%, with 4.1% growth in average daily rate. US RevPAR was up 6.3% in 2012 despite uncertainty regarding the presidential election and the “fiscal cliff” in the latter part of liquidated damages received in 2009,the year.
Franchised revenue at constant currency increased by 8.4% and operating$39 million (7.8%) to $541 million. Royalties growth of 8.7% was driven by RevPAR growth of 6.0%, including 6.1% for Holiday Inn Express, together with system size growth of 2.3%. Operating profit increased by 4.8%.
46
FranchisedManaged revenue
decreased by $27 million (21.8%) to $97 million and operating profit decreased by
$2$4 million
(7.7%) to
$81 million (2.4%) and $1 million to $59 million (1.7%) respectively compared to 2009. At constant currency, revenue increased by 1.2%$48 million. Revenue and operating profit
increased by 1.7% respectively.included $34 million (2011 $59 million) and $nil (2011 $1 million) respectively from managed leases. Excluding
properties operated under this arrangement, as well as the
impactbenefit of
$3m ina $3 million liquidated damages
receivedreceipt in
2009,2012 and a $10 million liquidated damages receipt in 2011, revenue and operating profit
at constant currency increasedgrew by
5.0%$5m (9.1%) and
7.0%$4 million (9.8%) respectively.
The underlying increaseGrowth was driven by a RevPAR increase of
7.6%. Revenues associated with new signings, relicensing7.3%, including 9.6% for Holiday Inn.Owned and terminations decreased comparedleased revenue declined by $5 million (2.5%) to 2009 as real estate activity remained slow.
EMEA managed$199 million and operating profit grew by $7 million (41.2%) to $24 million. Excluding the impact of disposals, revenue increased by $11$4 million to $130 million (9.2%) and operating profit decreased by $3 million to $62 million (4.6%) compared to 2009. At constant currency, revenue increased by 10.9% while operating profit declined by 3.1%. Positive RevPAR growth in key European cities and markets, including growth of 14.8% in the Group’s managed properties in Germany, was offset by unfavorable trading across much of the Middle East where RevPAR declined overall by 0.7%. At the year end, a provision of $3 million was made for future estimated cash outflows relating to guarantee obligations for one hotel.
In the owned and leased estate, revenue increased by $8 million to $203 million (4.1%(2.1%) and operating profit increased by $7$8 million to $40 million (21.2%(50.0%), or at constant currency,. The increase in revenue and operating profit increasedwas driven by 8.2% and 27.3% respectively. RevPAR increase of 11.9% benefited from average daily rate growth of 6.5% across the year. The InterContinental London Park Lane and InterContinental Paris Le Grand delivered strongyear-on-year RevPAR growth of 15.0%6.3%, offset by the impact of the partial closure of an owned hotel in the Caribbean. The operating profit increase of $7 million included a $1 million year-on-year benefit from lower depreciation recorded for the InterContinental New York Barclay since the hotel was categorized as held for sale in the first quarter of 2011, after which no depreciation was charged, and 11.5% respectively. Margins improveda $3 million year-on-year benefit relating to one off reorganization costs at one hotel in both these hotels as the focus remained on cost control.
Regional overheads increased by $5 million to $36 million (16.1%) compared to 2009, mainly attributable to performance based incentive costs.
Asia Pacific Results
| | | | | | | | | | | | | |
| | | Year ended
| | Year ended
| | |
| | | December 31,
| | December 31,
| | |
| | | 2010 | | 2009 | | Change |
| | | ($ million) | | % |
| |
| Revenue | | | | | | | | | | | | |
| Franchised | | | 12 | | | | 11 | | | | 9.1 | |
| Managed | | | 155 | | | | 105 | | | | 47.6 | |
| Owned and leased | | | 136 | | | | 129 | | | | 5.4 | |
| | | | | | | | | | | | | |
| Total | | | 303 | | | | 245 | | | | 23.7 | |
| | | | | | | | | | | | | |
| Operating profit before exceptional operating items | | | | | | | | | | | | |
| Franchised | | | 7 | | | | 5 | | | | 40.0 | |
| Managed | | | 73 | | | | 44 | | | | 65.9 | |
| Owned and leased | | | 35 | | | | 30 | | | | 16.7 | |
| | | | | | | | | | | | | |
| | | | 115 | | | | 79 | | | | 45.6 | |
| Regional overheads | | | (26 | ) | | | (27 | ) | | | 3.7 | |
| | | | | | | | | | | | | |
| Total | | | 89 | | | | 52 | | | | 71.2 | |
| | | | | | | | | | | | | |
Asia Pacific revenue | | | | | | | | | | | | |
| | | Year ended
December 31,
2012 | | | Year ended
December 31,
2011 | | | Change | |
| | | ($ million) | | | % | |
Revenue | | | | | | | | | | | | |
Franchised | | | 91 | | | | 86 | | | | 5.8 | |
Managed | | | 147 | | | | 118 | | | | 24.6 | |
Owned and leased | | | 198 | | | | 201 | | | | (1.5 | ) |
| | | | | | | | | | | | |
Total | | | 436 | | | | 405 | | | | 7.7 | |
| | | | | | | | | | | | |
Operating profit before exceptional operating items | | | | | | | | | | | | |
Franchised | | | 65 | | | | 65 | | | | — | |
Managed | | | 32 | | | | 26 | | | | 23.1 | |
Owned and leased | | | 50 | | | | 49 | | | | 2.0 | |
| | | | | | | | | | | | |
| | | 147 | | | | 140 | | | | 5.0 | |
Regional overheads | | | (32 | ) | | | (36 | ) | | | 11.1 | |
| | | | | | | | | | | | |
Total | | | 115 | | | | 104 | | | | 10.6 | |
| | | | | | | | | | | | |
Revenue and operating profit before exceptional items increased by $58$31 million (7.7%) to $303$436 million (23.7%) and by $37$11 million (10.6%) to $89$115 million (71.2%) respectively compared to 2009.
Continued strong economicrespectively. RevPAR increased by 1.7%, with 1.2% growth in the region was given a further boost by the World Expo held in Shanghai from May to October 2010. Resulting RevPAR growth in key Chinese cities was exceptional, with increases of 55.9% and 29.9% in Shanghai and Beijing respectively.
average daily rate despite challenging economic conditions across Europe.Franchised revenue increased by $5 million (5.8%) to $91 million, whilst operating profit was flat at $65 million. At constant currency, revenue increased by $8 million (9.3%) and operating profit increased by $3 million (4.6%). Growth was mainly driven by an increase in royalties of 2.7% (7.5% at constant currency) reflecting RevPAR growth of 1.8%, together with system size growth of 4.0%.
Managed revenue increased by $29 million to $147 million (24.6%) and operating profit increased by $6 million (23.1%) to $32 million. Revenue and operating profit included $80 million (2011 $46 million) and $2 million (2011 $nil) respectively from managed leases. Excluding properties operated under this arrangement and on a constant currency basis, revenue decreased by $1 million (1.4%) reflecting a 4.3% decrease in system size partially offset by RevPAR growth of 1.0%. On the same basis, operating profit grew by $5 million (19.2%).
In the owned and leased estate, revenue decreased by $3 million (1.5%) to $198 million and operating profit increased by $1 million (2.0%) to $50 million. At constant currency and excluding the impact of disposals, revenue increased by $10 million (5.1%) and operating profit increased by $4 million (8.3%). The InterContinental London Park Lane and the InterContinental Paris Le Grand delivered year-on-year RevPAR growth of 8.0% and 2.5% respectively.
AMEA
| | | | | | | | | | | | |
| | | Year ended
December 31,
2012 | | | Year ended
December 31,
2011 | | | Change | |
| | | ($ million) | | | % | |
Revenue | | | | | | | | | | | | |
Franchised | | | 18 | | | | 19 | | | | (5.3 | ) |
Managed | | | 152 | | | | 151 | | | | 0.7 | |
Owned and leased | | | 48 | | | | 46 | | | | 4.3 | |
| | | | | | | | | | | | |
Total | | | 218 | | | | 216 | | | | 0.9 | |
| | | | | | | | | | | | |
Operating profit before exceptional operating items | | | | | | | | | | | | |
Franchised | | | 12 | | | | 12 | | | | — | |
Managed | | | 90 | | | | 87 | | | | 3.4 | |
Owned and leased | | | 6 | | | | 5 | | | | 20.0 | |
| | | | | | | | | | | | |
| | | 108 | | | | 104 | | | | 3.8 | |
Regional overheads | | | (20 | ) | | | (20 | ) | | | — | |
| | | | | | | | | | | | |
Total | | | 88 | | | | 84 | | | | 4.8 | |
| | | | | | | | | | | | |
Revenue and operating profit before exceptional items increased by $2 million (0.9%) to $218 million and by $4 million (4.8%) to $88 million respectively. RevPAR increased 4.9%, with 1.2% growth in average daily rate, with robust trading in Southeast Asia and Japan, partly offset by continuing uncertainty impacting some markets in the Middle East.
On both a constant and actual currency basis, franchised revenue decreased by $1 million (5.3%) to $18 million and operating profit was flat at $12 million.
Managed revenue and operating profit increased by $1 million (9.1%(0.7%) to $152 million and by $3 million (3.4%) to $90 million respectively. At constant currency, excluding the benefit of a $6 million liquidated damages receipt in 2011 and after adjusting for the disposal of a hotel asset and partnership interest in Australia, which contributed $3 million to operating profit in 2011, revenue and operating profit increased by $7 million (4.8%) and $11 million (14.1%) respectively. RevPAR growth was 4.6% and although year-end system size was 7.1% higher than at the end of 2011, due to the phasing of openings towards the end of the year, rooms available during the year grew by only 2.2%. Operating profit in 2012 benefited from a $1 million increase in profit from an associate and $2 million lower year-on-year bad debt expense.
In the owned and leased estate, revenue and operating profit increased by $2 million (4.3%) to $7$48 million (40.0%and by $1 million (20.0%).
47 to $6 million respectively.
Greater China
| | | | | | | | | | | | |
| | | Year ended
December 31,
2012 | | | Year ended
December 31,
2011 | | | Change | |
| | | ($ million) | | | % | |
Revenue | | | | | | | | | | | | |
Franchised | | | 3 | | | | 2 | | | | 50.0 | |
Managed | | | 89 | | | | 77 | | | | 15.6 | |
Owned and leased | | | 138 | | | | 126 | | | | 9.5 | |
| | | | | | | | | | | | |
Total | | | 230 | | | | 205 | | | | 12.2 | |
| | | | | | | | | | | | |
Operating profit before exceptional operating items | | | | | | | | | | | | |
Franchised | | | 4 | | | | 3 | | | | 33.3 | |
Managed | | | 51 | | | | 43 | | | | 18.6 | |
Owned and leased | | | 45 | | | | 37 | | | | 21.6 | |
| | | | | | | | | | | | |
| | | 100 | | | | 83 | | | | 20.5 | |
Regional overheads | | | (19 | ) | | | (16 | ) | | | (18.8 | ) |
| | | | | | | | | | | | |
Total | | | 81 | | | | 67 | | | | 20.9 | |
| | | | | | | | | | | | |
Revenue and operating profit before exceptional items increased by $25 million (12.2%) to $230 million and by $14 million (20.9%) to $81 million respectively. RevPAR increased 5.4% with 3.1% growth in average daily rate.
Franchised revenue increased by $1 million (50.0%) to $3 million and operating profit by $1 million (33.3%) to $4 million, boosted by the opening of the 1,224-room Holiday Inn Macao Cotai Central.Managed revenue increased by $50$12 million (15.6%) to $155$89 million (47.6%) and operating profit increased by $29$8 million (18.6%) to $73 million (65.9%) compared to 2009. In addition to strong comparable$51 million. RevPAR performance, there was a positive contribution from recently opened hotels, with a 9% room increasegrowth of 5.6% reflected continued economic growth in the sizeregion, although the whole industry was affected in the latter part of the Asia Pacificyear by the 10-year political leadership change and the Diaoyu/Senkaku islands territorial dispute. There was also continued significant system size growth for the managed estate during 2010in the region (9.7% rooms growth in 2012 following a 10% increase14.2% rooms growth in 2009,2011).
Owned and a $4 million operating profit increase due to the collection of old or previously provided for debts.
In the owned and leased
estate, revenue increased by
$7$12 million
(9.5%) to
$136$138 million
(5.4%) and operating profit
increased by
$5$8 million
(21.6%) to
$35 million (16.7%). These results were driven by$45m, with RevPAR growth of 6.7% at the InterContinental Hong
Kong, where RevPARKong.Regional costs increased 15.3% during 2010.
Regional overheads decreased by $1$3 million (18.8%) to $26$19 million (3.7%), with an increasereflecting increased investment in performance-based incentive costs offset byoperations and infrastructure in the effect of the 2009 restructuring.
| | | | | | | | | | | | | |
| | | Year ended
| | Year ended
| | |
| | | December 31,
| | December 31,
| | |
| | | 2010 | | 2009 | | Change |
| | | ($ million) | | % |
| |
| Revenue | | | 104 | | | | 124 | | | | (16.1 | ) |
| Gross central costs | | | (243 | ) | | | (228 | ) | | | (6.6 | ) |
| | | | | | | | | | | | | |
| Net central costs | | | (139 | ) | | | (104 | ) | | | (33.7 | ) |
| | | | | | | | | | | | | |
| | | | | | | | | | | | | |
During 2010, net | | | | | | | | | | | | |
| | | Year ended
December 31,
2012 | | | Year ended
December 31,
2011 | | | Change | |
| | | ($ million) | | | % | |
Revenue | | | 114 | | | | 112 | | | | 1.8 | |
Gross central costs | | | (270 | ) | | | (259 | ) | | | (4.2 | ) |
| | | | | | | | | | | | |
Net central costs | | | (156 | ) | | | (147 | ) | | | (6.1 | ) |
| | | | | | | | | | | | |
Net central costs increased by $35$9 million from $104$147 million in 2011 to $139$156 million (33.7%(6.1%). The increase was primarily driven by an increase in performance based incentive costs where no payments were made on some plans in 2009.2012. At constant currency, net central costs increased by $36$11 million (34.6%(7.5%) compared. The movement was driven by investment in infrastructure and capabilities to 2009.
support the growth of the business. Central revenue mainly comprised technology fee income.System Fund
| | | | | | | | | | | | | |
| | | Year ended
| | Year ended
| | |
| | | December 31,
| | December 31,
| | |
| | | 2010 | | 2009 | | Change |
| | | ($ million) | | % |
| |
| Assessment fees and contributions received from hotels | | | 944 | | | | 875 | | | | 7.9 | |
| Proceeds from sale of Priority Club Rewards points | | | 106 | | | | 133 | | | | (20.3 | ) |
| | | | | | | | | | | | | |
| | | | 1,050 | | | | 1,008 | | | | 4.2 | |
| | | | | | | | | | | | | |
| | | | | | | | | | | | |
| | | Year ended
December 31,
2012 | | | Year ended
December 31,
2011 | | | Change | |
| | | ($ million) | | | % | |
Assessment fees and contributions received from hotels | | | 1,106 | | | | 1,025 | | | | 7.9 | |
Proceeds from sale of Priority Club Rewards points | | | 144 | | | | 128 | | | | 12.5 | |
| | | | | | | | | | | | |
| | | 1,250 | | | | 1,153 | | | | 8.4 | |
| | | | | | | | | | | | |
In the year endedto December 31, 2010, System2012, Fund income increased by 4.2%8.4% to $1.1 billion$1,250 million primarily as a result of growth in hotel room revenues and marketing programs. Salerevenues. The increase in proceeds from the sale of Priority Club Rewards points declined by 20.3% due tomainly reflects the impactstrong performance of a special promotional program in 2009.
co-brand credit card schemes.In addition to management or franchise fees, hotels within the Group’s system pay cash assessments and contributions which are collected by the Group for specific use within the Fund. The Fund also receives proceeds from the sale of Priority Club Rewards points. The Fund is managed for the benefit of hotels in the system with the objective of driving revenues for the hotels.
The Fund is used to pay for marketing, the Priority Club Rewards loyalty program and the global reservation system. The operation of the Fund does not result in a profit or loss for the Group and consequently the revenues and expenses of the Fund are not included in the Group Income Statement.
Consolidated income statement.Highlights for the year ended December 31, 20092011
The following is a discussion of the year ended December 31, 20092011 compared with the year ended December 31, 2008.
2010, restated where appropriate to reflect the change in the Group’s geographical segments following an internal reorganization during 2011.Group results
Revenue decreasedincreased by 18.9%8.6% to $1,538$1,768 million and operating profit before exceptional items decreasedincreased by 33.9%25.9% to $363$559 million during the year12 months ended December 31, 2009.2011.
The 2011 results reflect continued RevPAR growth, with an overall RevPAR increase of 6.2%, including a 2.5% increase in average daily rate. The results reflectalso benefit from overall system size growth of 1.7% year-on-year to 658,348 rooms. RevPAR growth remained strong throughout the challenging global
48
economic environment faced byyear across the Group
throughout 2009. Group RevPAR fell 14.7% during the year, with declinesalthough there was some deterioration in
both occupancy and rate. However, stabilizing occupancy levelsEurope in the fourth quarter
indicated a slight rebound in tradingreflecting macroeconomic conditions
which resulted in a RevPAR decline of 10.9% compared to the fourth quarter in 2008. Furthermore, the Group continued to achieve organic growth during the year, increasing its net room count by 4.3% or 26,828 rooms. The Group also made significant progress in the
roll-outregion.Operating profit improved in each of the Holiday Inn brand family relaunch,regions. RevPAR growth of 7.5% and 4.7% in The Americas and Europe respectively helped to drive operating profit increases of $82 million and $26 million in these regions. Operating profit in AMEA rose by $2 million despite an estimated adverse impact of the events of the Arab Spring and the natural disasters in Japan and New Zealand of $11 million. Continued strong economic growth in Greater China led to operating profit growth of $13 million as RevPAR grew by 10.7% and system size increased by 13.7%.
At constant currency, central overheads increased from $139 million in 2010 to $143 million in 2011 ($147 million at actual currency), driven by increased investment to support growth in the business, offsetting non-recurring bonus costs.
As a result of growth in the business, together with 1,697strong cost control, operating profit margin was 40.6%, up 4.9 percentage points on 2010, after adjusting for owned and leased hotels, converted globally at December 31, 2009.
In the year, the Group tookThe Americas and Europe managed leases and significant liquidated damages received in 2011. This growth approximates to one percentage point after adjusting for a number of actions to improve efficiency and reduce costs which led to a reduction in regional and central overheads of $95 million, from $304 million in 2008 to $209 million in 2009, including a $23 million favorable movement in foreign exchange.
one-off benefits.Americas
Revenue and operating profit before exceptional items decreasedincreased by 19.8%$23 million (2.9%) to $772$830 million and 38.1%by $82 million (22.2%) to $288$451 million respectively comparedrespectively.
Franchised revenue increased by $37 million (8.0%) to 2008. Excluding$502 million. Royalties growth of 8.5% was driven by RevPAR gains across the receiptestate of significant liquidated damages of $137.2%, including 7.9% for Holiday Inn Express, and was further boosted by continued improvement in the royalty rate achieved. Operating profit increased by $39 million in 2008,(9.9%) to $431 million also benefiting from lower bad debt experience.
Managed revenue increased by $5 million (4.2%) to $124 million and operating profit declinedincreased by 18.7% and 36.3% respectively.
The region experienced challenging trading conditions throughout the year leading$31 million (147.6%) to RevPAR, revenue and profit declines across all ownership types. Despite RevPAR declines, the region’s US comparable hotels demonstrated outperformance relative to the US market.
Franchised revenue$52 million. Revenue and operating profit decreased by 11.7% to $437included $59 million and 14.6% to $364 million respectively, compared to 2008. This decrease was predominantly driven by a fall in royalty revenues as a consequence of a RevPAR decline of 14.3%. Revenues also included the impact of a decline in real estate activity leading to lower fees associated with activities such as the signing of new hotels and conversions. An increase in overall room supply partially offset the decline in revenue and profit.
Managed revenues decreased by 34.5% to $110 million during the year or, by 29.0% excluding the impact of $13 million in liquidated damages received in 2008. All brands were impacted by the economic downturn which resulted in RevPAR declines of 17.8%. Operating profit declined by $91 million ($78 million excluding liquidated damages) resulting in a loss of $40 million. The loss was due to the RevPAR driven revenue declines, the Group funding owner’s priority return shortfalls on a number of hotels managed by one owner and certain guarantee payments. At 2009 year end, an exceptional charge of $91 million was recognized comprising the write off of a deposit related to the priority return contracts and the total estimated net cash outflows to this owner under the guarantee. Therefore, future payments to this owner will be charged against the provision and will not impact operating results. The managed results also included the impact of provisions recognized following the devaluation of the Venezuelan currency and the potential impact of asset nationalization.
Results from managed operations include revenues of(2010 $71 million (2008 $88 million) and operating profit of $nil (2008 $6$1 million (2010 $1 million) respectively from properties that are structured, for legal reasons, as operating leases but with the same characteristics as management contracts.
Excluding properties operated under this arrangement, as well as the benefit of a $10 million liquidated damages receipt in 2011 and a $10 million year-on-year benefit from the conclusion of a specific guarantee negotiation relating to one hotel, revenue grew by $7 million. Growth was driven by a RevPAR increase of 8.8% across the estate. Although year-end system size was 6.0% lower than at the end of 2010, due to the phasing of removals towards the end of the year, rooms available during the year actually grew by 4.5%. Operating profit grew by $11 million on the same basis, also benefiting from increased joint venture distributions.Owned and leased revenue declined by 25.0% to $225$19 million (8.5%) and operating profit decreasedgrew by 80.0%$4 million (30.8%) to $11$17 million. Underlying tradingIn the first half of the year, Staybridge Suites Denver Cherry Creek was drivensold and converted to a franchise contract, whilst Holiday Inn Atlanta Gwinnett Place and Hotel Indigo San Diego were sold and converted to management contracts. Excluding the year-on-year impact of these and prior year disposals, owned and leased revenue grew by $8 million (4.2%) and operating profit by $7 million (77.8%) reflecting RevPAR declines,growth of 10.3%, including the InterContinental brand with a decline of 28.2%. Trading11.2% at the InterContinental New York Barclay, in particular, was severely impacted by the collapse of the financial markets. Results also included the impact of the sale of the Holiday Inn Jamaica, sold in August 2008, which led toBarclay. Operating profit for 2011 includes a reduction in revenue and operating profit of $16$4 million and $2 million respectively when compared to 2008.
As a result of the declining real estate marketyear-on-year benefit from lower depreciation recorded for the InterContinental Buckhead, Atlanta and Staybridge Suites Denver Cherry Creek no longer metNew York Barclay since the criteria for designationhotel was categorized as held for sale assets and consequentlyin the resultsfirst quarter of these hotels are2011, subsequent to which no longer categorized as discontinued operations and comparative figures have been re-presented accordingly.
depreciation was charged. Operating profit growth was, however, adversely impacted by $3 million of one off reorganization costs relating to one hotel in 2011.Regional overheads declined 29.9% during the year, from $67decreased by $8 million (14.0%) to $47 million. The favorable movement was driven by increased efficiencies and the impact$49 million, mainly reflecting a year-on-year reduction of an organizational restructuring undertaken to further align the regional structure with the requirements of the Group’s owners and hotels.
49
EuropeEMEA
Revenue and operating profit before exceptional items
decreasedincreased by
23.4%$79 million (24.2%) to
$397$405 million and
25.7%by $26 million (33.3%) to
$127$104 million respectively.
Franchised revenue increased by $10 million (13.2%) to $86 million and operating profit by $10 million (18.2%) to $65 million. At constant currency, revenue increased by 7.9% and operating profit increased by 12.7%. Growth was mainly driven by royalties growth of 11.4% (5.9% at constant currency) reflecting RevPAR growth of 4.0%, together with an increase in system size. Revenues associated with new signings, relicensing and terminations increased by $2 million.
Managed revenue increased by $48 million to $118 million (68.6%) and operating profit increased by $9 million to $26 million (52.9%). At constant currency, revenue increased by 61.4% whilst operating profit increased by 47.1%. During the year, two properties were converted from management contracts to an operating lease structure with the same characteristics as management contracts. Revenues recorded under the operating lease structure were $46 million in 2011 (2010 $nil), with operating profits of $nil (2010 $nil). Excluding the impact of properties under the operating lease structure and on a constant currency basis, operating profit increased by $8 million (47.1%) reflecting RevPAR growth of 5.5%, together with the year-on-year benefit of a $3 million charge in 2010 with regard to guarantee obligations for one hotel. On the same basis, revenue fell slightly as a result of a minor change in the allocation of income to the managed estate.
In the owned and leased estate, revenue increased by $21 million (11.7%) to $201 million and operating profit increased by $11 million (28.9%), or at a constant currency by 6.7% and 21.1% respectively. During the year, the Group exited from the lease for Holiday Inn Express Essen, with a minor impact on revenue and operating profit. RevPAR growth of 10.9% benefitted from average daily rate growth of 10.3% across the year. The InterContinental London Park Lane and the InterContinental Paris Le Grand delivered strong year-on-year RevPAR growth of 7.3% and 14.5% respectively.
AMEA
Revenue and operating profit before exceptional items increased by $3 million (1.4%) to $216 million and by $2 million (2.4%) to $84 million respectively. The region’s results were adversely impacted by the political instability throughout 2011 in the Middle East, together with the natural disasters in Japan and New Zealand.
Franchised revenue increased by $4 million (26.7%) to $19 million and operating profit by $4 million (50.0%) to $12 million. At constant currency, revenue increased by 20.0% and operating profit increased by 37.5%, which includes four properties which were converted from management contracts to franchise arrangements during the year. RevPAR in the franchised estate grew by 1.7%. Excluding Egypt, Bahrain and Japan, RevPAR grew by 4.4%.
Managed revenue decreased by 16.8%$4 million (2.6%) to $151 million and 22.8%, respectively.operating profit decreased by $1 million (1.1%) to $87 million. At constant currency, revenue decreased by 7.7% and operating profit by 5.7%. The region received significantevents of the Arab Spring together with the natural disasters in Japan and New Zealand had an estimated adverse impact of $11 million on the results, whilst there was a further $4 million adverse impact due to changes to certain management contract terms. Results did, however, benefit from a liquidated damages totaling $16receipt of $6 million in 2008during the year. RevPAR grew by 0.6% compared to 2010 and by 5.7% excluding Egypt, Bahrain and Japan.
In the owned and leased estate, revenue increased by $3 million in 2009. Excluding these receipts, revenue declined(7.0%) to $46 million and operating profit increased by 21.5%$1 million (25.0%), or at a constant currency by 9.3% and 25.0% respectively.
Greater China
Revenue and operating profit before exceptional items declinedincreased by 20.0%, and at constant currency by 14.7% and 16.8%, respectively.
During the year, RevPAR declines were experienced across the region, with declines in key markets ranging from 9.8% in the UK$27 million (15.2%) to 17.8% in Continental Europe.
Franchised revenue and operating profit decreased by 24.5% to $83 million and 20.0% to $60 million, respectively, or at constant currency by 18.2% and 13.3%, respectively. Excluding the impact of $3 million in liquidated damages received in 2009 and $7 million received in 2008, revenue and operating profit declined by 22.3% and 16.2% respectively, or at constant currency by 15.5% and 8.8% respectively. The decline was principally driven by RevPAR declines across Continental Europe and the UK, partly offset by a 6% increase in room count.
EMEA managed revenue and operating profit decreased by 29.2% to $119$205 million and by
31.6%$13 million (24.1%) to
$65$67 million
respectively, or at constant currencyrespectively.Managed revenue increased by 25.0% and 29.5%, respectively. Excluding the impact of $9$17 million in liquidated damages received in 2008, revenue and operating profit declined by 25.2% and 24.4%, respectively, or at constant currency by 20.8% and 22.1%, respectively. The results were driven by managed RevPAR declines of 14.9%.
Owned and leased revenue decreased by 18.8%(28.3%) to $195$77 million and operating profit decreasedincreased by 26.7%$13 million (43.3%) to $33 million, or at$43 million. At constant currency, revenue increased by 10.4% and 17.8% respectively. The InterContinental Paris Le Grand, in particular, was adversely impacted by the economic downturn as both business and leisure travel declined in Paris. However, trading at the InterContinental London Park Lane was more resilient, with RevPAR down just 1.7% during the year.
Regional overheads decreased by 29.5% to $31 million due to improved efficiencies and cost savings, as well as a favorable movement in foreign exchange of $6 million.
Asia Pacific
Asia Pacific revenue26.7% and operating profit before exceptional items decreasedincreased by 15.5%43.3%. Continued strong economic growth in the region helped to $245 million and 23.5% to $52 million, respectively.drive RevPAR growth of 10.3%. Excluding the receipt of $4 million in significant liquidated damages in 2008, revenue and operating profit declinedShanghai, where RevPAR growth was tempered by 14.3% and 18.8% respectively. Despite RevPAR declines of 13.5%, the region’s brands demonstrated outperformance relativestrong comparatives due to the market.
Franchised revenuesWorld EXPO held in May to October 2010, comparable RevPAR grew by 17.4%. There was also continued significant system size growth for the managed estate in the region (14.2% rooms growth in 2011 and
operating profit decreased by 38.9% to $11 million12.6% in 2010).On both a constant and by 37.5% to $5 million, respectively. Excluding the impact of $4 million liquidated damages received in 2008,actual currency basis, owned and leased revenue decreased by 21.4% and profit increased by $1$10 million or 25.0%. The decline in revenue was driven by lower RevPARs and the loss of royalties following the removal of six hotels (1,067 rooms) which did not meet IHG’s brand and quality standards.
Managed revenue decreased by 7.1%(8.6%) to $105$126 million and operating profit decreasedincreased by 20.0%$4 million (12.1%) to $44$37 million. RevPAR across the Greater China managed estate declined 15.6%, primarily due to room oversupply in key Chinese cities, such as Beijing and trading upside in 2008 from the Olympic Games.
Owned and leased revenue decreased by 18.9% to $129 million and operating profit decreased by 30.2% to $30 million. These results were driven by theThe InterContinental Hong Kong
wheredrove RevPAR
declined 22.2% duringgrowth of 13.4%.Regional costs increased by $4 million to $16 million (33.3%), reflecting increased investment in operations and infrastructure in the year.
Regional overheads decreased by 28.9%region to $27 million, due tosupport the impactgrowth of regional restructuring and lower marketing costs associated with the ANA joint venture in Japan.
During 2009,2011, net central costs decreasedincreased by 32.9%$8 million from $155$139 million to $104 million. The significant reduction was driven by management actions to increase efficiencies and implement cost-saving measures across
50
the Group. Relative to 2008, the 2009$147 million (5.8%). At constant currency, net central costs also benefited from a $16increased by $4 million favorable(2.9%). The movement was primarily driven by increased investment to support growth in foreign exchange whilst the 2008 results included the receipt of a favorable $3 million insurance settlement.
business. Central revenue mainly comprised technology fee income.System Fund
In the year endedto December 31, 2009, System2011, Fund income increased by 1.8%9.8% to $1.01$1.2 billion primarily as a result of the growth in system sizehotel room revenues and marketing programs.
LIQUIDITY AND CAPITAL RESOURCES
Sources of Liquidityliquidity
The Group is primarily financed by a $1.6$1.07 billion syndicated bank facility which expires in May 2013November 2016 (the “Syndicated Facility”) and, £250 million of public bonds which are repayable on December 9, 2016.2016 and £400 million of public bonds which are repayable on November 28, 2022. The $1.07 billion Syndicated Facility was undrawn at the year end. The £400 million 3.875% bonds, which were issued during the year under the Group’s £750 million Medium Term Notes program, extend the maturity profile and diversify the sources of the Group’s debt. Short-term borrowing requirements are met from drawings under bilateral bank facilities. Additional funding is provided by the99-year finance lease (of which 93 years remain) on the InterContinental Boston.
In the Group’s opinion, the available facilities are sufficient for the Group’s present liquidity requirements.The £250 million public bonds were issued on December 9, 2009 at a coupon of 6% and were initially priced at 99.465% of face value and are unsecured. Interest is payable annually on December 9, in each year commencing December 9, 2010 to the maturity date. Currency swaps were transacted at the same time the bonds were issued in order to swap itsthe proceeds and interest flows into US dollars.
The reasons for issuing the£400 million public bonds were issued on November 28, 2012 at a coupon of 3.875% and were initially priced at 98.787% of face value and are unsecured. Interest is payable annually on November 28, in each year commencing November 28, 2013 to diversify the Group’s funding sources and extend the duration of a portion of its borrowings.
maturity date.At December 31, 2010, total2012, gross borrowings were $794$1,258 million, including the finance lease creditorobligation of $206$212 million. The currency denomination of the borrowings was $303$212 million of US dollar denominated borrowings, $385$1,041 million of sterling denominated borrowings $100and $5 million of euroNew Zealand dollar denominated borrowings and $6 million of borrowings denominated in other currencies, mainly Hong Kong dollars.borrowings. The impact of the currency swaps traded in December 2009 is to convert the$415 million of these sterling denominated borrowings above into US dollar denominated borrowings.
Atborrowings; the fair value of the currency swaps disclosed as a component of net debt was a liability of $11 million at December 31, 2010, total committed bank facilities amounted to $1,605 million of which $1,400 million were unutilized. Uncommitted facilities totaled $53 million. In the Group’s opinion, the available facilities are sufficient for the Group’s present requirements.
2012.The Group held cash and short-term deposits at December 31, 20102012 amounting to $78$195 million. Credit risk is minimized by operating a policy that generally restricts the investment of surplus cash to counterparties with an A credit rating or better or those providing adequate security. Limits are also set on the amounts invested with individual counterparties. Notwithstanding that counterparties must have an A credit rating or better, during periods of significant financial market turmoil, counterparty exposure limits are significantly reduced and counterparty credit exposure reviews are broadened to include the relative placing of credit default swap pricings. Most of the Group’s surplus funds are held in the United Kingdom or United States and there are no material fundsalthough $7 million (2011 $2 million) is held in a country where repatriation is restricted as a result of foreign exchange regulations.
Net debt of $1,074 million at December 31, 2012, comprised the gross borrowings of $1,258 million and the currency swap fair value of $11 million less cash and short-term deposits of $195 million.
The Syndicated Facility contains two financial covenants: interest cover and net debt divided by earnings before interest, tax, depreciation and amortization (“EBITDA”). Net debt is calculated as total borrowings less cash and cash equivalents. The Group is in compliance with all of the financial covenants in its loan documents, none of which is expected to present a material restriction on funding in the near future.
Further details of exchange and interest rate risk and financial instruments are disclosed in “Item 11. Quantitative and qualitative disclosures about market risk”.
Cash From Operating Activitiesfrom operating activities
Net cash from operating activities totaled $462$472 million for the year ended December 31, 2010 (2009 $4322012 (2011 $479 million).
after the payment of additional UK pension scheme contributions which were $57 million higher than in 2011.Cash flow from operating activities is the principal source of cash used to fund the ongoing operating expenses, interest payments, maintenance capital expenditure and normal dividend payments of the Group. The Group believes that
51
the requirements of its existing business and future investment can be met from cash generated internally, disposition of assets and external finance expected to be available to it.
Cash From Investing Activities
Net cash inflows from investing activities
Net cash outflows due to investing activities totaled $36$128 million (2009 $114(2011 $38 million) comprising capital expenditure of $133 million outflow) comprising(2011 $194 million) including investment in the technology infrastructure of $70 million (2011 $46 million), less proceeds (net of tax paid) from the disposal of hotels and investments of $131$5 million (2009 $34 million) and capital expenditure of $95 million (2009 $148(2011 $156 million). Proceeds in 2010 included $105 million from2011 mainly relate to the sale of the InterContinental Buckhead, Atlanta. Capital expenditure in 2009 included $65 million for the acquisitiondisposals of the Hotel Indigo San Diego.
Cash UsedDiego, Staybridge Suites Cherry Creek, Holiday Inn Atlanta-Gwinnett Place and a hotel asset and partnership interest in Financing Activities
Net cash used in financing activities totaled $447 million (2009 $362 million), including a reduction in gross borrowings of $292 million (2009 $249 million). Returns to shareholders, comprising dividend payments, totaled $121 million (2009 $118 million). The share repurchase program was suspended in 2008.
Overall net debt decreased during the year by $349 million to $743 million at December 31, 2010.
Australia.The Group had committed contractual capital expenditure of $14$81 million at December 31, 2010 (2009 $92012 (2011 $14 million).
, reflecting its commitment to invest in the growth of the Group’s brands.Off-Balance Sheet ArrangementsCash used in financing activities
Net cash used in financing activities totaled $329 million (2011 $334 million), after the payment of shareholder returns of $786 million (2011 $148 million), including a $505 million special dividend and $107 million of share buybacks. Net borrowings increased by $533 million (2011 decreased by $119 million) largely due to the issue of new long-term bonds. $84 million (2011 $75 million) was spent on share purchases in order to fulfill share incentive awards.
Overall net debt increased during the year by $536 million to $1,074 million at December 31, 2012.
Off-balance sheet arrangements
At December 31, 2010,2012, the Group had no off-balance sheet arrangements that have or are reasonably likely to have a current or future effect on the Group’s financial condition, changes in financial condition, revenues or expenses, results of operations, liquidity, capital expenditures or capital resources that is material to investors.
Contractual Obligationsobligations
The Group had the following contractual obligations outstanding as of December 31, 2010:
| | | | | | | | | | | | | | | | | | | | | |
| | | Total amounts
| | Less than
| | | | | | After
|
| | | committed | | 1 year | | 1-3 Years | | 3-5 years | | 5 years |
| | | ($ million) |
| |
Long-term debt(i)(ii) | | | 621 | | | | 1 | | | | 205 | | | | — | | | | 415 | |
Interest payable(ii) | | | 166 | | | | 32 | | | | 56 | | | | 52 | | | | 26 | |
Finance lease obligations(iii) | | | 3,428 | | | | 16 | | | | 32 | | | | 32 | | | | 3,348 | |
| Operating lease obligations | | | 505 | | | | 50 | | | | 76 | | | | 56 | | | | 323 | |
Agreed pension scheme contributions(iv) | | | 152 | | | | 41 | | | | 17 | | | | — | | | | 94 | |
| Capital contracts placed | | | 14 | | | | 14 | | | | — | | | | — | | | | — | |
| | | | | | | | | | | | | | | | | | | | | |
| | | | 4,886 | | | | 154 | | | | 386 | | | | 140 | | | | 4,206 | |
| | | | | | | | | | | | | | | | | | | | | |
| | | | | | | | | | | | | | | | | | | | |
| | | Total amounts
committed | | | Less than
1 year | | | 1-3 years | | | 3-5 years | | | After
5 years | |
| | | ($ million) | |
Long-term debt obligations(i)(ii) | | | 1,067 | | | | — | | | | 5 | | | | 415 | | | | 647 | |
Interest payable(ii) | | | 354 | | | | 51 | | | | 102 | | | | 76 | | | | 125 | |
Finance lease obligations(iii) | | | 3,396 | | | | 16 | | | | 32 | | | | 32 | | | | 3,316 | |
Operating lease obligations | | | 387 | | | | 47 | | | | 59 | | | | 44 | | | | 237 | |
Agreed pension scheme contributions(iv) | | | 87 | | | | 62 | | | | 25 | | | | — | | | | — | |
Capital contracts placed | | | 81 | | | | 81 | | | | — | | | | — | | | | — | |
| | | | | | | | | | | | | | | | | | | | |
| | | 5,372 | | | | 257 | | | | 223 | | | | 567 | | | | 4,325 | |
| | | | | | | | | | | | | | | | | | | | |
| | |
| (i) | | Repayment period classified according to the related facility maturity date. |
|
| (ii) | | Including the impact of derivatives. |
|
| (iii) | | Represents the minimum lease payments related to the99-year lease (of which 93 years remain) on the InterContinental Boston. Payments under the lease step up at regular intervals over the lease term. |
|
| (iv) | | Primarily relates to the recovery plan agreed with trustees of the InterContinental Hotels UK Pension Plan (see below). |
In addition, the Group has committed to invest up to $60 million in two joint venture arrangements of which $37 million had been spent at December 31, 2012.
In limited cases, the Group may provide performance guarantees to third-party hotel owners to secure management contracts. Forecast payments of $32$6 million have been provided for in the financial statementsFinancial Statements and the maximum unprovided exposure under such guarantees was $90is $50 million at December 31, 2010.
2012.As of December 31, 2010,2012, the Group had outstanding letters of credit of $54$38 million mainly relating to self insurance programs.
52
The Group may occasionally guarantee loans made to facilitate third-party ownership of hotels in which the Group has an equity interest and also a management contract. As of December 31, 2010,2012, there were no such guarantees in place.
The Group has given warranties in respect of the disposal of certain of its former subsidiaries and hotels. It is the view of the Directors that, other than to the extent that liabilities have been provided for in the Consolidated Financial Statements, such warranties are not expected to result in material financial loss to the Group.
Pension Plan Commitmentsplan commitments
The Group operates the following material defined benefitsbenefit plans: the InterContinental Hotels UK Pension Plan and, in the United States, the InterContinental Hotels Pension Plan and the InterContinental Hotels non-qualified plans.
On an IAS 19 “Employee Benefits” basis, the InterContinental Hotels UK Pension Plan had a deficitsurplus of $34$97 million at December 31, 2010, including2012, net of the tax that would be deducted at source in respect of a refund of surplus taking into account amounts payable under funding commitments. The defined benefitsbenefit section of this Planplan is closed to new members.members and will close to future accrual for current members with effect from July 1, 2013. In addition, there are unfunded UK pension arrangements for certain members affected by the lifetime allowance;or annual allowances which will also close to future accrual with effect from July 1, 2013; at December 31, 2010,2012, these arrangements had an IAS 19 deficit of $55$62 million. In 2011, the Group expects to make regular contributions to the UK pension plan of £5 million.
The most recent actuarial valuation of the InterContinental Hotels UK Pension Plan was carried out as ofat March 31, 20092012 and showed a deficit of £129£132 million on a funding basis. Under the recovery plan agreed with the trustees, the Group aims to eliminate this deficit by March 2017July 31, 2014 principally through additional Company contributions of up to £100 million and projected investment returns. The agreed£130 million. In respect of these additional Company contributions, comprise three annual payments of £10 million; £10 million was paid in August 2010July 2012, £45 million was paid in October 2012, £30 million is due for payment in July 2013, £15 million is due for payment in July 2014 and two further payments£30 million will be paid into a funding trust on release of £10 million are duea trustee charge over a hotel asset. The amount in the funding trust may be available for release to the plan on or before July 31, 2011 and 2012, together with further payments related2014 to the disposal of hotels (7.5% of net sales proceeds) and growth in the Group’s EBITDA above specified targets. If required in 2017,extent that a top-up payment will be made to bring the total additional contributions up to £100 million.funding deficit remains at that time. The InterContinental Hotels UK Pension Planplan is formally valued every three years, or earlier with the agreement of the Company and trustees, and future valuations could lead to changes in the amounts payable beyond March 2012. In 2011,by the Group expects to make additional contributions of £14 million under these arrangements with further amounts payable if there are any hotel disposals.
Company.The US-based plans are closed to new members and pensionable service no longer accrues for current employee members. On an IAS 19 basis, at December 31, 20102012 the plans had a combined deficit of $82$98 million. In 2011,2013, the Group expects to make contributions to these plans of $10 million.
The Group is exposed to the funding risks in relation to the defined benefit sections of the InterContinental Hotels UK Pension Plan and the US-based InterContinental Hotels Pension Plan, as explained in “Item 3. Key information — Risk factors”.
| |
| ITEM 6. | DIRECTORS, SENIOR MANAGEMENT AND EMPLOYEES |
DIRECTORS AND SENIOR MANAGEMENT
Overall strategic direction of the Group is provided by the Board of directors,Directors, comprising executiveExecutive and non-executive directors,Non-Executive Directors, and by members of the executive committee.
53Executive Committee.
The directorsDirectors and officers of InterContinental Hotels Group PLC at March 25, 201121, 2013 were:
Directors
| | | | | | | | | | | |
| | | | | Initially
| | Date of next
|
| | | | | appointed to
| | reappointment
|
Name | | Title | | the Board | | by shareholders(1) |
| |
| James Abrahamson | | Director | | | 2010 | | | | 2011 | |
Graham Allan(2) | | Director | | | 2010 | | | | 2011 | |
| Andrew Cosslett | | Director and Chief Executive | | | 2005 | | | | 2011 | |
David Kappler(2) | | Director and Senior Independent Director | | | 2004 | | | | 2011 | |
| Kirk Kinsell | | Director | | | 2010 | | | | 2011 | |
Ralph Kugler(2) | | Director | | | 2003 | | | | 2011 | |
Jennifer Laing(2) | | Director | | | 2005 | | | | 2011 | |
Jonathan Linen(2) | | Director | | | 2005 | | | | 2011 | |
| Richard Solomons | | Director and Chief Financial Officer | | | 2003 | | | | 2011 | |
| David Webster | | Director and Chairman | | | 2003 | | | | 2011 | |
Ying Yeh(2) | | Director | | | 2007 | | | | 2011 | |
| | | | | | | | | | |
| Directors | | Title | | Initially
appointed to
the Board | | | Date of next
reappointment
by shareholders | |
Patrick Cescau | | Director and Chairman | | | 2013 | | | | 2013 | |
David Kappler(1) | | Director and Senior Independent Director | | | 2004 | | | | 2013 | |
Kirk Kinsell | | Director | | | 2010 | | | | 2013 | |
Jennifer Laing(1) | | Director | | | 2005 | | | | 2013 | |
Jonathan Linen(1) | | Director | | | 2005 | | | | 2013 | |
Luke Mayhew(1) | | Director | | | 2011 | | | | 2013 | |
Dale Morrison(1) | | Director | | | 2011 | | | | 2013 | |
Tracy Robbins | | Director | | | 2011 | | | | 2013 | |
Tom Singer | | Director and Chief Financial Officer | | | 2011 | | | | 2013 | |
Richard Solomons | | Director and Chief Executive | | | 2003 | | | | 2013 | |
Ying Yeh(1) | | Director | | | 2007 | | | | 2013 | |
| | |
| (1) | | The new UK Corporate Governance Code recommends that all Directors of FTSE 350 companies submit themselves for election or re-election (as appropriate) by shareholders every year. Although IHG is not obliged to follow this recommendation until its Annual General Meeting in 2012, the Board has decided to submit the appointment of all its Directors for shareholder approval in 2011. Therefore, all Directors will retire and offer themselves for election or re-election at the next Annual General Meeting. |
|
(2) | | Non-executive independent director. |
Officers
| | | | | | |
| Officers | | Title | | Initially appointed
to position | |
Keith Barr* | | Chief Executive, Greater China | | | 2011 | |
Angela Brav | | Chief Executive, Europe | | | 2011 | |
Larry Light* | | Chief Brands Officer | | | 2012 | Initially appointed
|
Name
| | Title
| | to position |
| |
Tom ConophyEric Pearson | | Executive Vice President and Chief Information Officer | | | 20062012 | |
Tracy RobbinsJan Smits | | Chief Executive, Vice President, Human Resources & Group Operations SupportAsia, Middle East and Africa | | | 20052011 | |
Tom Seddon | | Executive Vice President and Chief Marketing Officer | | | 2007 | |
George Turner | | Executive Vice President, General Counsel and Company Secretary | | | 2009 | |
On March 16, 2011 the Company announced that Andrew Cosslett will step down as Chief Executive on June 30, 2011, and will be succeeded by Richard Solomons. A Director since 2003 and currently Chief Financial Officer and Head of Commercial Development, Richard Solomons will start in his new position as Chief Executive on July 1, 2011.
| * | In April 2013 Kenneth MacPherson will join the Group as Chief Executive, Greater China. With effect from June 1, 2013 Keith Barr will be appointed to the newly created position of Chief Commercial Officer, responsible for brands, sales, marketing and distribution. During the transition Larry Light will continue in his role as Chief Brands Officer. Following the transition Larry will stay on as a senior IHG advisor. |
Former Directors and Officers
Graham Allan served as a Director until June 2012. David Webster Non-Executiveserved as a Director and Chairman
Appointed Deputy Chairman and Senior Independent Director of InterContinental Hotels Group PLC
onuntil December 2012.Directors and Officers
Patrick Cescau, Non-Executive Chairman
Appointed to the separation of Six Continents PLC in April 2003. Appointed Non-Executive Chairman onBoard: January 1, 2004. Also Non-Executive2013
Skills and Experience: From 2005 to 2008, Patrick was Group Chief Executive of Unilever Group, having previously been Chairman of Makinson Cowell Limited,Unilever PLC, Vice-Chairman of Unilever NV and Foods Director, following a capital markets advisory firm,progressive career with the Company, which began in France in 1973. Prior to being appointed to the Board of Unilever NV in 1999, as Finance Director, he was Chairman of a number of the Company’s major operating companies and divisions, including in the USA, Indonesia and Portugal.
Board Contribution: Patrick has held board positions for more than 12 years in leading global businesses and brings extensive international experience in brands, consumer products, as well as finance. As Chairman, Patrick is responsible for leading the Board and ensuring it operates in an effective manner and promoting constructive relations with shareholders. Patrick is Chairman of the Nomination Committee.
Other Appointments: Currently a Non-Executive Director of Amadeus IT Holding SA,International Consolidated Airlines Group S.A. and the Senior Independent Director and Non-Executive Director of Tesco PLC. Patrick is also a transaction processing and technology solutions company for the travel and tourism industry, a membertrustee of the Appeals CommitteeLeverhulme Trust and Chairman of the Panel on TakeoversSt Jude India Children’s Charity. He was formerly a Senior Independent Director and MergersNon-Executive Director of Pearson PLC and a Director of Temple Bar Investment Trust PLC. Formerly Chairman of Safeway plcat INSEAD.
Richard Solomons, Chief Executive
Appointed to the Board: February 10, 2003
Skills and a Non-Executive Director of Reed Elsevier PLC. Chairman of the Nomination Committee. Age 66.
54
Andrew Cosslett, Chief Executive
Appointed Chief Executive in February 2005, joining the Group from Cadbury Schweppes plc where he was most recently President, Europe, Middle East & Africa. During his career at Cadbury Schweppes he held a variety of senior regional managementExperience: A chartered accountant and
marketing roles in the UK and Asia Pacific. Also has over 11 years’ experience in brand marketing with Unilever. Aa member of the Executive Committee of the World Travel & Tourism
CouncilCouncil. From 2003 to 2011 Richard was Chief Financial Officer and Head of Commercial Development. Since joining the Group in 1992 he has held a variety of senior financial and operational roles, including Chief Operating Officer of The Americas Hotels division and Finance Director of the Hotels business prior to the separation of Six Continents PLC in April 2003. He became Chief Executive in July 2011.Board Contribution: Richard has extensive experience in finance and is responsible for the executive management of the Group and ensuring the implementation of Board strategy and policy.
Tom Singer, Chief Financial Officer
Appointed to the Board: September 26, 2011
Skills and Experience:Prior to joining the Group, Tom was Group Finance Director and a main board member of Bupa, a global healthcare provider. Previously Group Finance Director and Chief Operating Officer at William Hill PLC and Finance Director at Moss Bros Group PLC.
Board Contribution: Tom has extensive financial experience obtained from UK and international finance roles. He is responsible, together with the President’s CommitteeBoard, for overseeing the financial operations of the CBI. Andrew Cosslett will step down as Chief Executive on June 30, 2011. Age 55.
James Abrahamson, President, The Americas
Appointed a Director in August 2010. Has over 32 years’ experience in hotel operations, branding, developmentGroup and franchise relations. Joined the Group as an Executive Committee member with responsibility for the Americas region in January 2009 from Global Hyatt Corporation, where he served as Head of Development, The Americas. Previously Senior Vice President, Hilton Hotels Corporation for 12 years. Responsible for the business development and performance of all the hotel brands and properties in the Americas’ region. Age 55.
setting its financial strategy.Kirk Kinsell, President, EMEAThe Americas
Appointed a Director into the Board: August 1, 2010 retaining his responsibility for the EMEA region, which he had held as an Executive Committee member since September 2007. Has over 28
Skills and Experience:Kirk has 30 years’ experience in the hospitality industry, including senior franchise positions with Holiday Inn Corporation and ITT Sheraton, prior to joiningSheraton. He joined the Group in 2002 as Senior Vice President, Chief Development Officer for theThe Americas region. ResponsibleHe became an Executive Committee member in September 2007 and was previously President, Europe, Middle East and Africa until June 2011.
Board Contribution: Kirk has vast experience in the hospitality industry and is responsible for the business development and performance of all the hotel brands and properties in The Americas region.
Tracy Robbins, Executive Vice President, Human Resources and Group Operations Support
Appointed to the EMEA region. Age 56.
Richard Solomons, Chief Financial OfficerBoard: August 9, 2011Skills and Head of Commercial Development
Qualified as a chartered accountantExperience: Tracy has over 27 years’ experience in
1985, followed by seven yearshuman resources roles in
investment banking, based in London and New York. Joinedservice industries. She joined the Group in
1992December 2005 from Compass Group PLC, a world-leading food service company, where she was Group Human Resources Leadership & Development Director. Previously Group Human Resources Director for Forte Hotels Group. She also spent seven years at Tesco PLC as a Retail Human Resources Manager where she implemented a culture change and
held a varietyrestructuring strategy across 150 stores.Board Contribution:Tracy has many years of senior finance and operational roles. Appointed Finance Director of the Hotels business in October 2002 in anticipation of the separation of Six Continents PLC in April 2003. Responsible for corporate and regional finance, Group financial control, strategy, investor relations, tax, treasury, commercial development and procurement. Richard Solomons will be appointed Chief Executive on July 1, 2011. Age 49.
Graham Allan, Non-Executive Director
Appointed a Director in January 2010. Became Chief Executive Officer of Yum! Restaurants International, a subsidiary of Yum! Brands, Inc., in 2010 after serving as President since 2003. Previously Executive Vice President and Chief Operating Officer of Yum! Restaurants International in Europe. Has over 19 years’ experience in brandhuman resources and is responsible for global talent management, marketing, franchisingleadership development, employee reward strategy and retail development. Age 55.
implementation, organizational capability and operations support.David Kappler, Senior Independent Non-Executive Director
Appointed to the Board: June 21, 2004
Skills and Experience: David is a Director and Senior Independent Director in June 2004. A Non-Executive Directorfellow of Shire plc. A qualified accountant and formerlythe Chartered Institute of Management Accountants. Formerly Chief Financial Officer of Cadbury Schweppes plc and Non-Executive Chairman of Premier Foods plc. AlsoHe also served as a Non-Executive Director of Camelot Group plc and HMV Group plc. A member of the Trilantic Europe Advisory Council.
Board Contribution: David brings over 35 years’ knowledge and experience in financial reporting, risk management and internal financial controls. As Chairman of the Audit Committee. Age 64.
Ralph Kugler, Non-Executive Director
Appointed a DirectorCommittee he is responsible for leading the Committee to ensure internal controls and risk management systems are in
April 2003. Alsoplace. David is Chairman of
Byotrol plc, a hygiene technology company,the Audit Committee.Other Appointments: David is a Non-Executive Director of Discovery Group Holdings Ltd,Shire plc, a PR services company, Board Adviser at Mars, Incorporated,member of the global consumer business, a Non-Executive DirectorEurope Advisory Council of Spotless Holding SAS, a consumer products business,Trilantic Capital Partners and Senior Advisor to 3i plc. Previously Director on the boards of Unilever PLC and Unilever N.V. until May 2008 with his last role as Global President, Unilever Home and Personal Care. Chairman of the Remuneration Committee. Age 55.
55
Jennifer Laing, Independent Non-Executive Director
Appointed a Director into the Board: August 2005. Was25, 2005
Skills and Experience: Jennifer was Associate Dean, External Relations at London Business School, until 2007. A Fellowfellow of the Marketing Society and of the Institute of Practitioners in Advertising, she has over 30 years’ experience in advertising including 16 years with Saatchi & Saatchi. Also
Board Contribution: Jennifer has over 30 years’ experience in marketing and advertising and is Chairman of the Corporate Responsibility Committee, responsible for the Corporate Responsibility objectives and strategy. Jennifer is Chairman of the Corporate Responsibility Committee.
Other Appointments: Currently a Non-Executive Director of Hudson Highland GroupGlobal, Inc., a US human resources company. Chairman of the Corporate Responsibility Committee. Age 64.
company and Premier Foods plc, a branded food producer.Jonathan Linen, Independent Non-Executive Director
Appointed a Director into the Board: December 2005. Was1, 2005
Skills and Experience: Jonathan was formerly Vice Chairman of the American Express Company, having held a range of senior positions throughout his career of over 35 years with American Express. A
Board Contribution: Jonathan has over 25 years’ experience working in the financial and branded sectors and is a member of the Remuneration Committee.
Other Appointments: Currently a Non-Executive Director of Yum! Brands, Inc. and of Modern Bank, N.A., a US private banking company. AlsoJonathan also serves on a number of US Councilscouncils and advisory boards. Age 67.
Luke Mayhew, Independent Non-Executive Director
Appointed to the Board: July 1, 2011
Skills and Experience: Luke is currently a Non-Executive Director of Brambles Limited, a global provider of supply chain and information management solutions. Previously he served for 12 years on the Board of John Lewis Partnership, including as Managing Director of the Department Store Division. Luke also spent five years at British Airways PLC and seven years at Thomas Cook Group PLC in senior positions. He was also a Non-Executive Director of WH Smith PLC and Chairman of Pets at Home Group Limited.
Board Contribution: Luke has over 30 years’ experience in senior roles in the branded sector and is Remuneration Committee chairman at Brambles Limited and has been since 2006. As Chairman of the IHG Remuneration Committee he is responsible for setting the remuneration policy. Luke is Chairman of the Remuneration Committee.
Other Appointments: Currently a Non-Executive Director of Brambles Limited.
Dale Morrison, Independent Non-Executive Director
Appointed to the Board: June 1, 2011
Skills and Experience: A founding partner of TriPointe Capital Partners, a private equity firm. Dale was previously President and Chief Executive Officer of McCain Foods Limited and President and Chief Executive Officer of Campbell Soup Company.
Board Contribution: Dale has over 10 years’ experience in sales and marketing positions, and over 25 years’ experience in general management, having held senior positions in the branded foods sector.
Other Appointments: Currently a Non-Executive Director of International Flavors & Fragrances Inc., a producer of flavors and fragrances, and Chairman of Findus Group Limited, a frozen food company.
Ying Yeh, Independent Non-Executive Director
Appointed a Director into the Board: December 2007.1, 2007
Skills and Experience: Ying was formerly Vice President and Chairman, Greater China Region, Nalco Company a water treatment and process improvement company. Previously Chairman and President, North Asia Region, President, Business Development, Asia Pacific Region and Vice President, Eastman Kodak Company. Also a Non-Executive Director of AB Volvo. Was,She was, for 15 years, a diplomat with the US Foreign Service in Hong Kong and Beijing until 1997. Age 62.
Board Contribution: Ying has over 20 years’ experience gained from working in senior positions in global organizations across a broad range of sectors.
Other Appointments: Currently a Non-Executive Director of AB Volvo, a transportation related products and services company, ABB Ltd, a global leader in power and automation technologies and Samsonite International S.A., a travel luggage company.
Other members of the Executive Committee
In addition to the Executive Directors on the Board, the Executive Committee comprises:
Keith Barr, Chief Executive, Greater China
Joined the Group: 2000
Skills and Experience: Keith has over 20 years’ experience in the hospitality industry. He has held senior appointments including Vice President of Sales and Revenue Management, Vice President of Operations and Chief Operating Officer, Australia, New Zealand and South Pacific. He was appointed Managing Director, Greater China in June 2009 and became Chief Executive, Greater China in April 2011.
Key responsibilities: These include business development and performance of all the hotel brands and properties in the Greater China region.
Angela Brav, Chief Executive, Europe
Joined the Group: 1988
Skills and Experience: Angela has over 24 years’ experience in the hospitality industry, including hotel operations, franchise relations and technology solutions. She has held various senior roles in the Group’s US and European businesses prior to becoming Chief Operating Officer, North America. She was appointed Chief Executive, Europe in August 2011.
Key responsibilities: These include business development and performance of all the hotel brands and properties in Europe.
Tom Conophy,Larry Light, Chief Brands Officer
Joined the Group: 2012
Skills and Experience: Larry is one of the world’s leading brand consultants and was formerly Chief Marketing Officer for McDonald’s. Larry has held previous executive roles in media, marketing and advertising for BBDO Worldwide and Ted Bates Advertising and has made many academic contributions on branding principles and methods.
Key responsibilities:These include building on the Group’s strategy of developing and nurturing a powerful portfolio of preferred brands.
Eric Pearson, Executive Vice President and Chief Information Officer
HasJoined the Group: 1997
Skills and Experience: Eric has a background in engineering and technology and started his career at IHG over 30 years’ experience15 years ago. Since then he has held various senior positions in the IT industry, including managementfield of emerging technologies and development of new technology solutions within the travel and hospitality business. Joined the Group in February 2006 from Starwood Hotels & Resorts International where heglobal e-commerce. Eric most recently held the position of Executive Vice President & Chief Technology Officer. ResponsibleMarketing Officer for The Americas region.
Key responsibilities: These include global technology, including IT systems and information management, throughout the Group. Age 50.
Tracy Robbins,Jan Smits, Chief Executive, Vice President, Human Resources & Group Operations SupportAsia, Middle East and Africa
Has over 25Joined the Group:2002
Skills and Experience: Jan has 31 years’ experience in line and HR roles in service industries. Joined the Group in December 2005 from Compass Group PLC, a world leading food service company, where she was Group Human Resources Leadership & Development Director. Previously Group HR Director for Forte Hotels Group. Has global responsibility for talent management, leadership development, reward strategy, organizational capability and operations support. Age 47.
Tom Seddon, Executive Vice President and Chief Marketing Officer
Has over 18 years’ experience in sales and marketinghospitality industry. He held various senior positions in the
hospitality industry, includingAsia and Australasia region. He became Managing Director, Asia Australasia in June 2009. Following the amalgamation of our Middle East and Africa region with
IHG’s predecessor parent companies from 1994 to 2004. Rejoinedour Asia Australasia region, he became Chief Executive, Asia, Middle East and Africa in August 2011.Key responsibilities: These include business development and performance of all the Grouphotel brands and properties in November 2007, from restaurant business SUBWAY® where he was responsible for worldwide salesAsia, Middle East and marketing activities. Has responsibility for worldwide brand management, reservations,Africa.
e-commerce, global sales, relationship and distribution marketing and loyalty programs. Age 42.
George Turner, Executive Vice President, General Counsel and Company Secretary
Solicitor,Joined the Group: 2008
Skills and Experience: George is a solicitor and qualified to private practice in 1995. AfterPrior to joining the Group, George spent 12 years with Imperial Chemical Industries PLC where he was most recentlyheld a number of key positions including Deputy Company Secretary, he joined the Group in September 2008. AppointedSecretary. He was appointed Executive Vice President, General Counsel and Company Secretary in January 2009. Responsible for
Key responsibilities:These include corporate governance, risk management, insurance, data privacy,regulatory, internal audit, company secretariat, legal, and corporate responsibility &and public affairs. Age 40.
56
Steven Sickel, who has been an interim member of the Executive Committee, will return to his full-time role leading Distribution Relationship Marketing in June 2013.There are no family relationships between any of the persons named above.
There are no arrangements or understandings with major shareholders, customers, suppliers or others, pursuant to which any person named above was selected as a director or member of senior management.
COMPENSATION
In fiscal 2010,2012, the aggregate compensation (including pension contributions, bonus and awards under the long term incentive plans) of the directorsDirectors and officers of the Company was $23.6$30.0 million. The aggregate amount set aside or accrued by the Company in fiscal 20102012 to provide pension retirement or similar benefits for those individuals was $0.6$0.8 million. An amount of $9.4$8.6 million was charged in fiscal 20102012 in respect of bonuses payable to them under performance related cash bonus schemes and long term incentive plans.
Note 3 of Notes to the Consolidated Financial Statements sets out the individualaggregate compensation of the directors.Directors. The following are details of the Company’s principal share schemes, in which the directorsDirectors of the Company participated during the period.
The IHGGroup’s Annual Bonus Plan (ABP)(“ABP”), sets out the terms under which annual performance-related bonuses are awarded, and enables eligible employees, including Executive Directors, to receive all or part of their bonus in the form of shares together with, in certain cases, a matching award of free shares up to half the deferred amount.shares. The bonus and any matchingdeferred shares awarded are released on the third anniversary of the award date. The bonuses in 2007 were eligible for matching shares, all of which were released on the third anniversary of the award date. In 2007, participants could defer uprelation to 100% of the total annual bonus, with the deferred amount being accounted for as a share-based payment. Under the terms of the 2008, 2009 and 2010 plans2012, a fixed percentage of the bonus iswas awarded in the form of shares with no voluntary deferral and no matching shares.
The awards in all Awards of deferred shares under the plansABP are conditional on the participants remaining in the employment of a participating company or leaving for a qualifying reason as set out in the plan rules. Participation in the ABP is at the discretion of the Remuneration Committee. The number of shares is calculated by dividing a specific percentage of the participant’s annual performance-related bonus by the middle market quoted prices on the three consecutive dealing days immediately preceding the date of grant. A number of executives participated in the plan during the year, however, noand conditional rights over 340,924 (2011 528,213) shares were awarded to participants.
The Long Term Incentive Plan (LTIP)(“LTIP”) allows Executive Directors and eligible employees to receive share awards, subject to the satisfactionachievement of performance conditions, set by the Remuneration Committee, which are normally measured over a three yearthree-year period. Awards are normally made annually and, except in exceptional circumstances, will not exceed three times salary for Executive Directors and four times salary in the case of other eligible employees. During 2010,2012, conditional rights over 2,602,7732,698,714 (2011 3,257,364) shares were awarded to employees under the plan. The plan provides for the grant of ‘nil“nil cost options’options” to participants as an alternative to conditional share awards.
Executive Share Option Plan
For options granted, the option price is not less than the market value of an ordinary share, or the nominal value if higher. The market value is the quoted price on the business day preceding the date of grant, or the average of the middle market quoted prices on the three consecutive dealing days immediately preceding the date of grant. A performance condition has to be met before options can be exercised. The performance condition is set by the Remuneration Committee. The plan was not operated during 20102012 and no options were granted in the year under the plan. The latest date that any options currently outstanding may be exercised is April 4, 2015.
Options and Ordinary Sharesordinary shares held by Directors
Details of the directors’Directors’ interests in the Company’s shares are set out on page 6266 and pages F-46F-47 to F-48.
57
BOARD PRACTICES
Contracts of Serviceservice
The Remuneration Committee’s policy is for Executive Directors to have rolling contracts with a notice period of 12 months. Richard Solomons, Tom Singer, Kirk Kinsell and Tracy Robbins have service agreements with a notice period of 12 months. All new appointments are intended towill have12-month notice periods. However,periods, unless, on occasion,an exceptional basis to complete an external recruitment successfully, a longer initial notice period reducing to 12 months may be used.
Andrew Cosslett, James Abrahamson, Kirk Kinsell and Richard Solomonsis used, in accordance with the UK Corporate Governance Code.Non-Executive Directors have service agreements with a notice periodletters of 12 months.
appointment. Patrick Cescau was appointed as Non-Executive Chairman on January 1, 2013 following the retirement of David Webster on December 31, 2012. David Webster’s appointment as Non-executive Chairman, effective from January 1, 2004, iswas subject to six months’ notice.
Non-executive director, Ralph Kugler signed a letter of Patrick Cescau’s appointment
as Non-Executive Chairman, effective from
the listing of IHG in April 2003. This was renewed, effective from completion of the capital reorganization of the Company and the listing of new IHG shares on June 27, 2005. January 1, 2013, is subject to 12 months’ notice.David Kappler signed a letter of appointment effective from his date of original appointment to the Board on June 21, 2004. This was also renewed, effective from June 27, 2005. Jennifer Laing and Jonathan Linen signed letters of appointment effective from their appointment dates, respectively August 25, 2005 and December 1, 2005. Ying Yeh signed a letter of appointment effective from her appointment date of December 1, 2007. Graham AllanDale Morrison signed a letter of appointment effective from his appointment date of JanuaryJune 1, 2010.
2011. Luke Mayhew signed a letter of appointment effective from his appointment date of July 1, 2011.Directors’ Contractscontracts
| | | | | | | | |
Directors | | Contract
effective date | | | Unexpired term/
notice period | |
Richard Solomons | | | July 1, 2011 | | | | | | | | |
| | Contract
| | |
| | effective
| | Unexpired term/
|
Directors
| | date | | notice period |
|
Andrew Cosslett | | | February 3, 2005 | | | | 312 months | |
James AbrahamsonKirk Kinsell | | | August 1, 2010 | | | | 12 months | |
Kirk KinsellTracy Robbins | | | August 1, 20109, 2011 | | | | 12 months | |
Richard SolomonsTom Singer | | | April 15, 2003September 26, 2011 | | | | 12 months | |
Each of Andrew Cosslett and Richard Solomons signed a letter of appointment, effective from completion of the capital reorganization of the Company and the listing of new IHG shares on June 27, 2005. The terms of each appointment were as set out in each executive director’s original service agreement.
On March 16, 2011 the Company announced that Andrew Cosslett will step down as Chief Executive on June 30, 2011, and will be succeeded by Richard Solomons.
Richard Solomons signed a contract on March 16, 2011 relating to his employment as Chief Executive, effective from July 1, 2011.
See Note 3 of the Notes to the Consolidated Financial Statements for details of directors’Directors’ service contracts.
Payments on Terminationtermination
No provisions for compensation for termination following change of control, ornor for liquidated damages of any kind, are included in the current directors’Directors’ contracts. In the event of any early termination of an executive director’sExecutive Director’s contract the policy is to seek to minimize any liability.
Upon retirement, and under certain other specified circumstances on termination of histheir employment, a directorDirector will become eligible to receive benefit from histheir participation in a Company pension plan. See Note 3 of Notes to the Consolidated Financial Statements for details of directors’Directors’ pension entitlements at December 31, 2010.
Each Committee of the Board has written terms of reference which are approved by the Board and which are subject to review eachevery year.
58
Executive Committee
The Executive Committee is chaired by These are available on the
Chief Executive. It consistsCompany’s websitewww.ihgplc.com/investors under corporate governance/committees or from the Company Secretary’s office upon request. During the year, the terms of reference of all of the
executive directorsCommittees of the Board were reviewed against the latest best practice guidance and the
most senior executives fromUK Corporate Governance Code (“Code”). As a result, some minor amendments in respect of the
GroupCode were made to update the Audit and
usually meets monthly. Remuneration Committee’s terms of reference.Executive Committee
Its role is to consider and manage a range of important strategic and business issues facing the Group. ItAmongst many other things it is responsible for monitoring the performance of the business. It is authorized to approve capital and revenue investment within levels agreed by the Board. It reviews
Governance: The Committee is chaired by the Chief Executive and usually meets monthly. Members of the Committee comprise the Executive Directors and the most senior executives from the Group. The Committee recommends to the Board the most significant investment proposals.
decisions which require its approval.Audit Committee
The Audit Committee is chaired by David Kappler who has significant recent and relevant financial experience and is the Committee’s financial expert.experience. During 2010,2012, the other Committee members were Graham Allan Ralph Kugler(until his retirement on June 15, 2012), Jennifer Laing and Jennifer Laing.Dale Morrison. All Audit Committee members are independent.
The Audit Committee’s principalkey responsibilities are to:
| | |
| • | review the Group’s public statements on internal control, risk management and corporate governance compliance prior to their consideration by the Board; |
|
| • | review the Group’s processes for detecting and addressing fraud, misconduct and control weaknesses and to consider the response to any such occurrence, including overseeing the process enabling the anonymous submission of concerns; |
|
| • | to review the integrity of the Company’s internal financial controls, internal controls and risk management systems, as well as review reports from management, internal audit and external audit concerning the effectiveness of internal control, financial reporting and risk management processes; |
|
| • | review with management and the external auditor any financial statements required under UK or US legislation before submission to the Board; |
|
| • | establish, review and maintain the role and effectiveness of the internal audit function, including overseeing the appointment of the Head of Global Internal Audit; |
|
| • | assume responsibility for the appointment, compensation, resignation, dismissal and the overseeing of the external auditor, including review of the external audit, its cost and effectiveness; |
|
| • | pre-approve non-audit work to be carried out by the external auditor and the fees to be paid for that work, along with the monitoring of the external auditor’s independence; and |
|
| • | oversee the Group’s Code of Ethics and Business Conduct and associated procedures for monitoring adherence. |
The Audit Committee discharges its responsibilities through a series of Committee meetings during the year at which detailed reports are presented for review. The Audit Committee commissions reports, either from external advisers, the Head of Global Internal Audit or Group management, after consideration(“GIA”) and the external auditors (Ernst & Young LLP (“E&Y”));
to review the Group’s processes for detecting and addressing fraud, misconduct and control weaknesses and consider the response to any such occurrence, including overseeing the whistleblowing process;
to review and maintain the role and effectiveness of the major risks internal audit function;
to oversee the Group or in response Group’s relations with our external auditors and make recommendations on their appointment, reappointment, removal and independence;
to developing issues. The Chief Financial Officer attends its meetings as dopre-approve the external auditorauditor’s non-audit work and associated fees; and
to oversee the HeadGroup’s Code of Global Internal Audit, both of whom haveEthics and Business Conduct and associated procedures for monitoring adherence.
The Committee was in place throughout 2012. The Committee had the opportunity to meet privately with the Audit Committee,internal and external auditors on at least four occasions in the absenceyear without the presence of management.
The Board is satisfied that David Kappler has recent and relevant financial experience as a qualified accountant and former Chief Financial Officer of Cadbury Schweppes plc. At the invitation of the Committee, the Chief Executive, Chief Financial Officer, Head of GIA and external auditors attend meetings.
E&Y have been the Group’s independent external auditors since 2003. To ensure the auditor’s independence is safeguarded, lead audit partners rotate every five years. In 2011 the lead audit partner was rotated. The Committee reviews the relationship the Group management, athas with E&Y annually and for the conclusionyear ended December 31, 2012, the Committee was satisfied with the independence, objectivity and effectiveness of each meeting.
Allthe relationship with E&Y as the external auditors.A key factor that may impair the external auditors’ independence is a lack of control over the volume of non-audit services. To address this issue all proposals for non-audit work are subject to pre-approved limits and additionally there is a prohibition on the provisionundertaking of certain services. The Committee is aware of, and sensitive to, investor body guidelines on non-audit services byfees.
The Head of GIA is responsible for reporting and ensuring findings of internal audit work are brought to the external auditor are pre-approved byattention of local management and the Audit Committee or its delegated member,as appropriate. During 2012 GIA operated in all the overriding consideration being to ensure that the provision of non-audit services does not impact the external auditor’s independence and objectivity.
Group’s principal regions.Remuneration Committee
The Remuneration Committee, chaired by Ralph Kugler,Luke Mayhew, also comprises the following independent Non-Executive directors:Directors: David Kappler, Jonathan Linen and Ying Yeh. The Remuneration Committee agrees, on behalf of the Board, all aspects of the remuneration of the Executive Directors and the Executive Committee members, and agrees the strategy, direction and policy for the remuneration of other senior executives who have a significant influence over the Company’s ability to meet its strategic objectives.
The Nomination Committee comprises the Chairman of the Board and all the Non-Executive Directors. It is chaired by the Chairman of the Board except when matters relating to this position are to be discussed, in which case
59
| |
| ITEM 7. | MAJOR SHAREHOLDERS AND RELATED PARTY TRANSACTIONS |
MAJOR SHAREHOLDERS
As far as is known to management, IHG is not directly or indirectly owned or controlled by another corporation or by any government. As at the dates shown, the Company had been notified, in accordance with the Disclosure and Transparency Rules of the UK Financial Services Authority, of the following significant holdings of voting rights in its ordinary shares:
| | | | | | | | | | | | | | | | | | | | | | | | | |
| | | March 25, 2011 | | March 19, 2010 | | March 23, 2009 |
| | | Number of
| | Percent
| | Number of
| | Percent
| | Number of
| | Percent
|
Identity of person or group | | shares/ADSs | | of class | | shares/ADSs | | of class | | shares/ADSs | | of class |
| |
| Ellerman Corporation Limited | | | N/A | | | | N/A | | | | 29,921,742 | | | | 10.39 | % | | | 29,921,742 | | | | 10.48 | % |
| Southeastern Asset Management, Inc. | | | N/A | | | | N/A | | | | 14,860,671 | | | | 5.16 | % | | | N/A | | | | N/A | |
| FIL Limited (Fidelity International) | | | N/A | | | | N/A | | | | 14,687,743 | | | | 5.10 | % | | | N/A | | | | N/A | |
| Cedar Rock Capital Limited | | | 14,923,417 | | | | 5.15 | % | | | 14,923,417 | | | | 5.18 | % | | | 14,923,417 | | | | 5.23 | % |
| JP Morgan Asset Management Holdings Inc. | | | 14,592,363 | | | | 5.03 | % | | | N/A | | | | N/A | | | | N/A | | | | N/A | |
| Blackrock, Inc. | | | 14,505,612 | | | | 5.00 | % | | | 14,434,598 | | | | 5.01 | % | | | N/A | | | | N/A | |
| Capital Research and Management Company | | | 14,495,664 | | | | 5.00 | % | | | N/A | | | | N/A | | | | N/A | | | | N/A | |
| Legal & General Group Plc | | | N/A | | | | N/A | % | | | 11,336,113 | | | | 3.94 | % | | | 11,416,590 | | | | 4.00 | % |
| Lloyds Banking Group plc | | | N/A | | | | N/A | | | | 13,619,563 | | | | 4.73 | % | | | 13,619,563 | | | | 4.77 | % |
| | | | | | | | | | | | | | | | | | | | | | | | |
| | | March 21, 2013* | | | March 21, 2012 | | | March 25, 2011 | |
Identity of person or group | | Number of
shares/ADSs | | | Percent
of class | | | Number of
shares/ADSs | | | Percent
of class | | | Number of
shares/ADSs | | | Percent
of class | |
Southeastern Asset Management, Inc. | | | N/A | | | | N/A | | | | 38,519,075 | | | | 13.23 | % | | | N/A | | | | N/A | |
FIL Limited (Fidelity International) | | | N/A | | | | N/A | | | | 13,850,157 | | | | 4.76 | % | | | N/A | | | | N/A | |
Cedar Rock Capital Limited | | | 14,923,417 | | | | 5.56 | % | | | 14,923,417 | | | | 5.13 | % | | | 14,923,417 | | | | 5.13 | % |
JP Morgan Asset Management
Holdings Inc. | | | N/A | | | | N/A | | | | N/A | | | | N/A | | | | 14,592,363 | | | | 5.01 | % |
Blackrock, Inc. | | | 14,505,612 | | | | 5.40 | % | | | 14,505,612 | | | | 4.98 | % | | | 14,505,612 | | | | 4.98 | % |
Capital Research and Management Company. | | | N/A | | | | N/A | | | | 14,495,664 | | | | 4.98 | % | | | 14,495,664 | | | | 4.98 | % |
Legal & General Group Plc | | | 11,336,113 | | | | 4.22 | % | | | 11,336,113 | | | | 3.89 | % | | | N/A | | | | N/A | |
Lloyds Banking Group plc | | | N/A | | | | N/A | | | | 13,619,563 | | | | 4.68 | % | | | N/A | | | | N/A | |
| * | The figures do not reflect the share consolidation on a 14 for 15 basis or the $0.5 billion share buyback program announced on August 7, 2012. |
The Company’s major shareholders do not have different voting rights from other shareholders of the Company. The Company does not know of any arrangements the operation of which may result in a change in its control.
As of March 25, 2011, 15,035,66921, 2013, 16,715,367 ADSs equivalent to 15,035,66916,715,367 ordinary shares, or approximately 5.18%6.23% of the total ordinary shares in issue, were outstanding and were held by 1,024787 holders. Since certain ordinary shares are registered in the names of nominees, the number of shareholders of record may not be representative of the number of beneficial owners.
As of March 25, 2011,21, 2013, there were a total of 54,07449,290 record holders of ordinary shares, of whom 353328 had registered addresses in the United States and held a total of 1,540,7961,353,107 ordinary shares (0.53%(0.50% of the total issued).
RELATED PARTY TRANSACTIONS
TheOther than those disclosed in Note 30 of Notes to the Consolidated Financial Statements, the Company has not entered into any related party transactions or loans for the period beginning January 1, 20102012 up to March 25, 2011.
| |
| ITEM 8. | FINANCIAL INFORMATION |
CONSOLIDATED STATEMENTS AND OTHER FINANCIAL INFORMATION
See “Item 18. Financial Statements”.
Legal Proceedingsproceedings
Group companies have extensive operations in the United Kingdom, as well as internationally, and are involved in a number of legal claims and arbitration proceedings incidental to those operations. It is the Company’s view that such proceedings, either individually or in the aggregate, have not in the recent past and are not likely to have a significant effect on the Group’s financial position or profitability.
Notwithstanding the above, Holiday Hospitality Franchising, Inc.,the Company notes the matters set out below. Litigation is inherently unpredictable and as at March 26, 2013, the outcome of these matters cannot be reasonably determined.
1. On April 20, 2012, the owner of a former hotel in China filed an arbitration petition with the China International Economic Trade Arbitration Committee against a Group company, is defendingHoliday Inns (China) Limited (‘‘HICL’’) seeking compensation for losses relating to the alleged mismanagement of the hotel. HICL subsequently filed a lawsuit filed by Hotel Associates, Inc., a former franchisee, regarding an unfavorable ruling on appeal on February 23, 2011.counterclaim. The final outcomeGroup intends to defend against this claim vigorously and pursue its counterclaim. As at March 26, 2013, it is not possible to determine whether any loss is probable or to estimate the amount of any loss.
2. On July 31, 2012, the UK’s Office of Fair Trading (the ‘‘OFT’’) issued a Statement of Objections alleging that the Company (together with Booking.com B.V. and Expedia, Inc.) infringed competition law in relation to the online supply of room only hotel accommodation by online travel agents.
The Company is cooperating fully with the investigation. The OFT has not yet known, however,reached a litigation provision for $22 milliondecision as to whether competition law has been reflectedbreached.
3. On August 10, 2012, the former owner of a hotel in China filed an arbitration notice with the
63