UNITED STATES SECURITIES AND EXCHANGE COMMISSION
WASHINGTON, D.C. 20549
________________
Form 20-F
| |
* | REGISTRATION STATEMENT PURSUANT TO SECTION 12(b) OR (g) OF THE SECURITIES EXCHANGE ACT OF 1934 |
| OR |
R | ANNUAL REPORT PURSUANT TO SECTION 13 OR 15(d) OF THE SECURITIES EXCHANGE ACT OF 1934 For the fiscal year ended December 31, 2013 2016 |
* | TRANSITION REPORT PURSUANT TO SECTION 13 OR 15(d) OF THE SECURITIES EXCHANGE ACT OF 1934 |
| OR |
* | SHELL COMPANY REPORT PURSUANT TO SECTION 13 OR 15(d) OF THE SECURITIES EXCHANGE ACT OF 1934 |
Date of event requiring this shell company report
Commission file number 1-14406
________________
Perusahaan Perseroan (Persero)
PT Telekomunikasi Indonesia Tbk.Tbk
(Exact name of Registrant as specified in its charter)
Telecommunications Indonesia
(a state-owned public limited liability company)
(Translation of Registrant’s name into English)
________________
Republic of Indonesia
(Jurisdiction of incorporation or organization)
Jl. Japati No. 1, Bandung 40133, Indonesia
(Address of principal executive offices)
Investor Relations Unit
GrhaGrahaMerah Putih, Jl. Gatot Subroto No. 52, 5th Floor, Jakarta 12710, Indonesia
(62) (22) 452-7101
(62) (21) 521-5109
(Name, Telephone, E-mail and/or Facsimile number and Address of Company Contact Person)
________________
Securities registered or to be registered pursuant to Section 12(b) of the Act.
|
Title of Each class | | Name of each exchange on which registered |
American Depositary Shares representing Series B Shares, par value 50 Rupiah per share | | New York Stock Exchange |
Series B Shares, par value 50 Rupiah per share | | New York Stock Exchange* |
|
Securities registered or to be registered pursuant to Section 12(g) of the Act. None |
Securities for which there is a reporting obligation pursuant to Section 15(d) of the Act. None |
Indicate the number of outstanding shares of each of the issuer’s classes of capital or common stock as of the close of the period covered by the Annual Report: |
Series A Dwiwarna Share, par value 50 Rupiah per share | 1 |
Series B Shares, par value 50 Rupiah per share | 97,100,853,599100,799,996,399
|
| | | |
Indicate by check mark if the registrant is a well-known seasoned issuer, as defined in Rule 405 of the Securities Act. Yes [x]RNo [ ] ¨ |
If this report is an annual or transition report, indicate by check mark if the registrant is not required to file reports pursuant to Section 13 or 15(d) of the Securities Exchange Act of 1934. Yes [ ]¨No [x]R |
Indicate by check mark whether the registrant (1) has filed all reports required to be filed by Section 13 or 15(d) of the Securities Exchange Act of 1934 during the preceding 12 months (or for such shorter period that the Registrant was required to file such reports) and (2) has been subject to such filing requirements for the past 90 days. Yes [x]R No [ ]¨ |
Indicate by check mark whether the registrant has submitted electronically and posted on its corporate Web site, if any, every Interactive Data File required to be submitted and posted pursuant to Rule 405 of Regulation S-T during the preceding 12 months (or for such shorter period that the registrant was required to submit and post such files). Yes [ ]¨No [x]R |
Indicate by check mark whether the registrant is a large accelerated filer, an accelerated filer, or a non-accelerated filer. See definition of “accelerated filer and large accelerated filer” in Rule 12b-2 of the Exchange Act. (Check one): |
Large accelerated filer [x]R | Accelerated filer [ ]¨ | Non-accelerated filer [ ]¨ |
Indicate by check markcheckmark which basis of accounting the registrant has used to prepare the financial statements included in this filing: U.S. GAAP [ ]¨International Financial Reporting Standards as issued by the International Accounting Standards Board [x]ROther [ ]¨ If “Other” has been checked in response to the previous question, indicate by checkmark which financial statement item the registrant has elected to follow. Item 17 [ ]¨Item 18 [ ]¨ |
If this is an Annual Report, indicate by check mark whether the registrant is a shell company (as defined in Rule 12b-2 of the Exchange Act). Yes [ ]¨No [x]R |
| |
| |
* | The Series B Shares were registered in connection with the registration of American Depositary Shares (“ADSs”). The Series B Shares are not listed for trading on the New York Stock Exchange. |
|
| | | | | | | | |
SIGNATURES
Pursuant to the requirements of the Securities Exchange Act of 1934, the registrant has duly caused this report to be signed on behalf by the undersigned, thereunto duly authorized.
Date April 1, 2014
| Perusahaan Perseroan (Persero)
PTTelekomunikasi Indonesia Tbk
-----------------------------------------------------
(Registrant)
By: /s/ Honesti Basyir
----------------------------------------------------
(Signature)
Honesti Basyir
Chief of Financial Officer
|
2013 Annual Report
on Form 20-F
TABLE OF CONTENTS
PART I
PART II
PART III
DEFINITIONS
Table of Content
DEFINITIONS
3G
The generic term for third generation mobile telecommunications technology. 3G offers high speed connections to cellular phones and other mobile devices, enabling video conference and other applications requiring broadband connectivity to the internet.
3.5G
A grouping of disparate mobile telephony and data technologies designed to provide better performance than 3G systems, as an interim step towards deployment of full 4G4G/LTE capability.
4G/LTE
A fourth generation super fast internet network technology based on IP that makes the process of data transfer much faster andmorestable.
Adjusted EBITDA
Adjusted EBITDA is defined as earningsWe calculate AdjustedEBITDA by calculating operating profit before interest, tax, depreciation and amortization.amortization, loss on foreign exchange, other income and other expenses. Adjusted EBITDA and other related ratios in this Annual Report serve as additional indicators on our performance and liquidity, which is a non-GAAP financial measure.
ADS
American Depositary Share (also known as an American Depositary Receipt, or an “ADR”), a certificate traded on a USU.S. securities market (such as the New York Stock Exchange) representing a number of foreign shares. Each of our ADS represents 200100 shares of our Series B shares.common stock.
ADSL
Asymmetric Digital Subscriber Line, a type of digital subscriber line technology, a data communications technology that enables faster data transmission over copper telephone lines than a conventional voice band modem can provide.
APMK
Alat Pembayaran Menggunakan Kartu or card-based payment instruments, a payment instrument in the form of credit cards, Automated Teller Machine (“ATM”) and/or debit cards.
ARPU
Average Revenue per User, a measure used primarily by telecommunications and networking companies which states how much money we make from the average user. It is defined as the total revenue from specified services divided by the number of consumers for those services.
Backbone
The main telecommunications network consisting of transmission and switching facilities connecting several network access nodes. The transmission links between nodes and switching facilities include microwave, submarine cable, satellite, optical fiber optic and other transmission technology.
Bandwidth
The capacity of a communication link.
Table of Content
Bapepam-LK
Badan Pengawas Pasar Modal dan Lembaga Keuangan, or the Indonesian Capital Market and Financial Institution SurpervisorySupervisory Agency, the predecessor to the OJK.
Broadband
A signaling method that includes or handles a relatively wide range (or band) of frequencies.
BSC
Base Station Controller, an equipment responsible for radio resource allocation to mobile station, frequency administration and handover between BTSs controlled by the BSC.
BSS
Base Station Subsystem, the section of a cellular telephone network responsible for handling traffic and signaling between a mobile phone and the network switching subsystem. A BSS is composed of two parts: the BTS and the BSC.
BTS
Base Transceiver Station, equipment that transmits and receives radio telephony signals to and from other telecommunication systems.
BWA
Broadband Wireless Access, a technology that provides high speed wireless internet access or computer networking access over a wide area.
1
Table of Content
CDMA
Code Division Multiple Access, atransmission technology where each transmission is sent over multiple frequencies and a unique code is assigned to each data or voice transmission, allowing multiple users to share the same frequency spectrum.
Common stock
Our Series B shares having a par value of Rp50 per share.
CPE
Customer Premises Equipment, any handset, receiver, set-top box or other equipment used by the consumer of wireless, fixed line or broadband services, which is the property of the network operator and located on the customer premises.
DCS
Digital Communication System, a mobile cellular system using GSM technology operating in the 1800 MHz frequency band.1.8 GHz frequency.
Defined Benefit Pension Planor DBPP
A type of pension plan in which an employer promises a specified monthly benefit on retirement that is predetermined by a formula based on the employee’s earnings history, tenure of service and age, rather than depending on investment returns. It is considered ‘defined’ in the sense that the formula for computing the employer’s contribution is known in advance.
Defined Contribution Pension Planor DCPP
A type of retirement plan in which the amount of the employer’s annual contribution is specified. Individual accounts are set up for participants and benefits are based on the amounts credited to these accounts (through employer contributions and, if applicable, employee contributions) plus any investment earnings on the money in the account. Only employer contributions to the account are guaranteed, not the future benefits. In defined contribution plans, future benefits fluctuate on the basis of investment earnings.
Dial-Up
Access to the internet using fixed telephone lines or mobile phone.
DLD
Domestic Long Distance, a long distance call service designed for customers who live in different areas but still within one country. These areas normally have different area codes.
Down link
Radio signal frequency emitted by the satellite to earth station.
DSL
Digital Subscriber Line, a technology that allows combinationsTable of services including voice, data and one way full motion video to be delivered over existing copper feeder distribution and subscriber lines.Content
DTH
Direct-to-Home satellite broadcasting, the distribution of television signals from high-powered geostationary satellites to small dish antennas and satellite receivers in homes across the country.
Dual BandDwiwarna Share
The capabilitySeries A Dwiwarna Share having a par value of a mobile cellular networkRp50 per share. The Dwiwarna Share is held by the Government and mobile cellular handsetsprovides for special voting rights and veto rights over certain matters related to operate across two frequency bands, for example GSM 900our corporate governance. For more information, see Item 7 "Major Shareholders and GSM 1800.
e-Business
Electronic Business solutions, including electronic payment services, internet data centersRelated Party Transactions — Major Shareholders — Relationship with the Government and content and application solutions.Refer to “New Economy Business (“NEB”) and Strategic Business Opportunities Portfolio” under Business Overview.Government Agencies".
e-Commerce
Electronic Commerce, the buying and selling of products or services over electronic systems such as the internet and other computer networks.
e-Money
Electronic Money, money or script that is only exchanged electronically.
e-Payment
Also known as electronic funds transfer, the electronic exchange or transfer of money from one account to another, either within a single financial institution or across multiple institutions, through computer-based systems.
2
Table of Content
E1 Link
The backbone transmission unit which operates over two separate sets of wires, usually twisted pair cable. E1 link data rate is 2,048 Mbps (full duplex), which is divided into 32 timeslots.
Earth Station
The antenna and associated equipment used to receive or transmit telecommunication signals via satellite.
EDGE
Enhanced Data rates for GSM Evolution, a digital mobile phone technology that allows improved data transmission rates as a backward-compatible extension of GSM.
Edutainment
Education and Entertainment.entertainment.
EVDOFiber Optic
Cables using optical fiber and laser technology through which modulating light beams representing data are transmitted through thin filaments of glass.
Evolution Data Optimize, a standard high speed 3G wireless broadband for CDMA.
Fixed Line
Fixed wireline and fixed wireless.
Fixed Wireless
The local wireless transmission link using a cellular, microwave, or radio technology to connect customers at a fixed location to the local telephone exchange.
Fixed Wireline
A fixed wire or cable path linking a subscriber at a fixed location to a local exchange, usually with an individual phone number.
FTTx
FTTFiber toH
FiberToTheHome, the “x”, a generic term for any broadband network architecture that uses optical fiber to replace all or part of the usual metal local loop used for last mile telecommunication. The generic term originated as a generalization of several configurationsimplementation of fiber deployment suchoptic network that reaches up to customer point or known as fiber to the home, fiber to the node or fiber to the building.customer premise.
Table of Content
Gateway
Aperipheral that bridges a packet based network (IP) and a circuit based network (PSTN).
Gb
Gigabyte, a unit of information used, for example, to quantify computer memory or storage capacity.
Gbps
Gigabyte per second, the average number of bits, characters, or blocks per unit time passing between equipment in a data transmission system. This is typically measured in multiples of the unit bit per second or byte per second.
GHz
Gigahertz. The hertz (symbol Hz), is the international standard unit of frequency defined as the number of cycles per second of a periodic phenomenon.
GMS
General Meeting of Shareholders, which may be an Annual General Meetingannual general meeting of Shareholdersshareholders (“AGMS”) or an Extraordinary General Meetingextraordinary general meeting of Shareholdersshareholders (“EGMS”).
GPON
Gigabyte-Passive Optical Network, the most widely deployed type of passive optical network system that bring opticalbrings fiber optic cabling and signals all or most of the way to end users.
GPRS
General Packet Radio Service, a data packet switching technology that allows information to be sent and received across a mobile network and only utilizes the network when there is data to be sent.
GSM
Global System for Mobile Telecommunication, a European standard for digital cellular telephone.
3
Table of Content
homepassHomepass
A connection with access to fixed line voice, IPTV and broadband services.
HSPA+
Evolved High Speed Packet Access is defined in the Third Generation Partnership Project Release 7. It introduces a simpler IP-centric architecture for the mobile network bypassing most of the legacy equipment. HSPA+ boosts peak data rates to 42 Mbit/s on the downlink and 22 Mbit/s on the uplink.
IDD
International Direct Dialing, a service that allows a subscriber to make an international call without the assistance or intervention of an operator from any telephone terminal.
IME
Information, Media and Edutainment.
IMT-2000
International Mobile Telecommunications-2000, a body of specifications provided by the International Telecommunication Union. Application services include wide area wireless voice telephone, mobile internet access, video calls and mobile TV, all in a mobile environment.
IMS
IP multimedia subsystem, a service which combines wireless and fixed line technologies for voice and data communications.
Table of Content
Installed Lines
Complete lines fully built-out to the distribution point and ready to be connected to subscribers.
Intelligent Network
A service-independent telecommunications network where the logic functions are taken out of the switch and placed in computer nodes distributed throughout the network. This provides the means to develop and control services more efficiently allowing new or advanced telephony services to be introduced quickly.
Interconnection
The physical linking of a carrier’s network with equipment or facilities not belonging to that network.
Internet of Things
Infrastructure which interconnects physical and virtual things using interoperable information and communication technologies.
IP
Internet Protocol, the method or protocol by which data is sent from one computer to another on the internet.
IP Core
A block of logic data that is used in making a field programmable gate arrayor application-specific integrated circuitfor a product.
IP DSLAM
Internet Protocol-Digital Subscriber Line Access Multiplexer, a network device located near the customer’s location that allows telephone lines to make faster connections to the internet by connecting multiple customer Digital Subscriber Lines (DSLs) to a high-speed internet backbone line using multiplexing techniques.
IP VPN
A data communication service using IP Multi Protocol Label Switching (“MPLS”) and based on any to any connection. This service is connected to the data security systems, L2TP and IPSec. The speed depends on the customer’s needs and ranges from 64 Kbps to 2 Mbps.
IPTV
Internet Protocol Television, a system through which television services are delivered using the Internet Protocol suite over a packet-switched network such as the internet, instead of being delivered through traditional terrestrial, satellite signal, and cable television formats.
ISDN
Integrated Services Digital Network, a network that provides end-to-end digital connectivity and allows simultaneous transmission of voice, data and video and provides high speed internet connectivity.
ISP
Internet Services Provider,an organization that provides access to the internet.
KbpsKSO
Kilobyte per second, Kerjasama Operasi,a measureform of speedjoint operation agreement that includes build, operate and transfer, which arrangement was previously used by Telkom, in which the consortium partners invest and operate facilities owned by Telkom in regional divisions. The consortium partners are owned by international operators and national private companies or Telkom.
KPPU
Komisi Pengawasan Persaingan Usaha, or Commission for digital signal transmission expressed in thousandsthe Supervision of bits per second.Business Competition.
4
Table of Content
Lambda
Lambda indicates the wavelength of any wave, especially in physics, electronics engineering and mathematics.
Leased Line
A dedicated telecommunications transmissions line linking one fixed point to another, rented from an operator for exclusive uses.
Local Exchange Capacity
The aggregate number of lines at a local exchange connected and available for connection to outside plant.
LTE
Long Term Evolution technology, a standard for high-speed wireless data communication for mobile phones and data terminals.
Mbps
MegabyteMegabytes per second, a measure of speed for digital signal transmission expressed in millions of bits per second.
Metro Ethernet
Bridge or relationship between locations that are apart geographically, this network connects LAN customers at several different locations.
Table of Content
MHz
Megahertz, a unit of measure of frequency equal to one million cycles per second.
Mobile Broadband
The marketing term for wireless internet access through a portable modem, mobile phone, USB Wireless Modem or other mobile devices.
MoCI
The Ministry of Communication and Information,Informatics of the Republic of Indonesia, to which regulatory responsibility over telecommunications was transferred from the Ministry of Communication and Information (“MoC”) in February 2005.
MSANMSOE
Multi Service Access Networks, representKementerian Badan Usaha Milik Negara, or the third generationMinistry of optical access network technology and are single platforms capableState-Owned Enterprises of supporting traditional, widely deployed, access technologies and services as well as emerging ones, while simultaneously providing a gateway to a NGN core. MSAN will enable us to provide triple play services that distribute high speed internet access, voice packet services and IPTV services simultaneously through the same infrastructure.Republic of Indonesia.
Network Access Point
A public network exchange facility where ISPs connected with one another in peering arrangements.
NGN
Next Generation Network a
A general term that refers to a packet-based network able to provide services, including telecommunication services, and able to make use of multiple broadband and quality of service enabled transport technologies, and in which service-related functions are independent from underlying transport related technologies. A NGNNext Generation Network is intended to be able to, with one network, transport various services (voice, data, and various media such as video) by encapsulating these into packets, similar to how such packetpackets are transmitted on the internet. NGNsNext Generation Networks are commonly built around the Internet Protocol.
Node B
A BTS for a 3G W-CDMA/UMTS network.
OBCE
Operational, Business and Customer support system and Enterprise relations management, which is part of our strategic initiatives.
OJK
Otoritas Jasa Keuangan, or the Indonesian Financial Services Authority, the successor of Bapepam-LK, is an independent institution with authority to regulate and supervise financial services activities in the banking sector, capital market sector as well as non-bank financial industry sector.
OLOOver The Top
Other Licensed Operators, i.e. operators other than our Company.
5
Table of Content
Optical Fiber
Cables using optical fiber and laser technology through which modulating light beams representing data are transmitted through thin filaments of glass.
Outside Plant
The equipment and facilitiesA generic term commonly used to connect subscriber premisesrefer to the local exchange.delivery of audio, video and other media over the internet without the involvement of a multiple-system operator in the control or distribution of the content.
Pay TV
Pay Television, premium television, or premium channels, subscription-based television services, usually provided by both analog and digital cable and satellite, but also increasingly via digital terrestrial and internet television.
PDN
Packet Data Network, a digital communications network which breaks a group data to be transmitted into segments called packets, which are then routed independently.
PKLN
Tim Pinjaman Komersial Luar Negeri, or Foreign Commercial Loan Coordinating Team, an inter-agency team of the Government charged with, among others, considering requests of Indonesian State-Owned EnterprisesSOEs such as us for consent to obtain foreign commercial loans.
POWL
Public Offering Without Listing.
Table of Content
Point of presence
An access point, location or facility that connects to and helps other devices establish a connection with the internet, which may consist of a router, switches, servers and other data communication devices. We operate two layers of points of presence, namely main and primary points of presence. A “main point of presence” is the transport backbone that aggregates national traffic. A “primary point of presence” is the aggregate regional transport backbone which has the capability of creating services.
Premium SMS
PremiumShort Message Service, a text messaging service component of phone, web, or mobile communication systems, using standardized communications protocols that allow the exchange of short text messages between fixed line or mobile phone devices.
PSTN
Public Switched Telephone Network, a telephone network operated and maintained by us and the KSO Unitsunits for us and on our behalf.
Pulse
The unit in the calculation of telephone charge.
Radio Frequency Spectrum
The part of the electromagnetic spectrum corresponding to radio frequencies, i.e. frequencies lower than around 300 GHz (or, equivalently, wavelengths longer than about 1 mm).
RIO
Reference Interconnection Offer, a regulatory term covering all facilities, including interconnection tariffs, technical facilities and administrative issues offered by one telecommunications operator to other telecommunications operator for interconnection access.
RMJ
Regional Metro Junction, an inter-city cable network installation service in one regional (region/province).
Roaming
A general term referring to the extension of connectivity service in a location that is different from the home location where the service was registered.
RUIM card
Removable User Identity Module, a smart card designed to be inserted into a fixed wireless telephone that uniquely identifies a CDMA network subscription and that contains subscriber-related data such as phone numbers, service details and memory for storing messages.
Satellite Transponder
Radio relay equipment embedded in a satellite that receives signals from earth and amplifies and transmits the signal back to the earth.
SCCS
Submarine Communications Cable System, a cable laid on the sea bed between land-based stations to carry telecommunication signals across stretches of ocean.
SME
Small and Medium Enterprise.
6
Table of Content
SDP
Service Delivery Platform, a set of components that provide a service delivery architecture (such as service creation, session control and protocols) for a type of service.
SIM card
Subscriber Identity Module, a “smart” card designed to be inserted into cellular phone that uniquely identifies a GSM network subscription and contains subscriber-related data such as phone numbers, service details and memory for storing messages.
SME
Small and Medium Enterprise.
SMS
Short Messaging Service, a technology allowing the exchange of text messages between mobile phones and between fixed wireless phones.
SOE
State-Owned Enterprise, a Government-owned corporation, state-owned company, state-owned entity, state enterprise, publicly owned corporation, Government business enterprise, or parastatal, a legal entity created by a Government to undertake commercial activities on behalf of an owner Government.
Softswitch
A central device in a telephone network that connects calls from one phone line to another, entirely by means of software running on a computer system. This work was formerly carried out by hardware, with physical switchboards to route the calls.
STM-1
Synchronous Transport Module level-1, the SDH ITU-T fiber optic network transmission standard with a bit rate of 155.52 Mbps. The other standards are STM-4, STM-16 and STM-64.
Switch
A mechanical, electrical or electronic device that opens or closes circuits, completes or breaks an electrical path, or selects paths or circuits, used to route traffic in a telecommunications network.
Terra Router
Terra Router or terabit router on the theory allows the network capacity on a scale of terabits (1 terabit = 1 million gigabits).
TIMES
Telecommunication, Information, Media, Edutainment and Service.
TITOTPE
Trade-In, Trade-Off,a conversion scheme to replace copper with optical cable. Refer to “Development and Modernization of Broadband Access through the TITO Scheme” under Network Development.
Trunk Exchange
A switch that hasnormalized way to refer to transponder bandwidth, which means how many transponders would be used if the function of connecting one telephony switch to another telephony switch, which can either be a local or a trunk switch.same total bandwidths used only 36 MHz transponder (1 TPE = 36 MHz).
UMTS
Universal Mobile Telephone System, one of the 3G mobile systems being developed within the ITU’sInternational Telecommunication Union’s IMT-2000 framework.
USO
Universal Service Obligation, the service obligation imposed by the Government on all telecommunications services providers for the purpose of providing public services in Indonesia.
VoIP
Voice over Internet Protocol, a means of sending voice information using the IP.
VPN
Virtual Private Network, a secure private network connection, built on top of publicly-accessible infrastructure, such as the internet or the public telephone network. VPNs typically employ some combination of encryption, digital certificates, strong user authentication and access control to secure the traffic they carry. These provide connectivity to many machines behind a gateway or firewall.
7
Table of Content
VSAT
Very Small Aperture Terminal, a relatively small antenna, typically 1.5 to 3.0 meters in diameter, placed in the user’s premises and used for two-way communications by satellite.
Wi-MAX
Worldwide Interoperability for Microwave Access, a telecommunications technology that provides wireless transmission of data using a variety of transmission modes, from point-to-point links to portable internet access.
Wireless Access Network
Any type of computer network that is not connected by cables of any kind. It is a method by which homes, telecommunications networks and enterprise (business) installations avoid the costly process of introducing cables into a building, or as a connection between various equipment locations.
Wireless Broadband
Technology that provides high speed wireless internet access or computer networking access over a wide area.
8
Table of Content
CERTAIN DEFINITIONS, CONVENTIONS AND GENERAL INFORMATION
Unless the context otherwise requires, references in this Form 20-F to the “Company”, “Telkom”, “we”, “us”, and “our” are to Perusahaan Perseroan (Persero) PT Telekomunikasi Indonesia Tbk.Tbk and its consolidated subsidiaries. All references to “Indonesia” are references to the Republic of Indonesia. All references to the “Government” herein are references to the Government of the Republic of Indonesia. References to the “United States” or “US” are to the United States of America. References to the “United Kingdom” or the “UK” are to the United Kingdom of Great Britain and Northern Ireland. References to “Rupiah”"Rupiah", “Indonesian Rupiah” or “Rp” are to the lawful currency of Indonesia. References to “US“U.S. Dollar” or “US$” are to the lawful currency of the United States. Certain figures (including percentages) have been rounded for convenience, and therefore indicated and actual sums, quotients, percentages and ratios may differ.
Our consolidated financial statements as ofJanuary 1, 2012 (Restated),of December 31, 2012 (Restated) andDecember 31,20132015 and 2016 and for the years ended December 31, 2011 (Restated), 2012(Restated)2014, 2015 and 20132016 included in this Form 20-F (the “Consolidated Financial Statements”) have been prepared in accordance with International Financial Reporting Standards (“IFRS”) as issued by the International Accounting Standards Board (“IASB”).
On December 31, 2013, theThe financial statements of nine12 of our subsidiaries werehave been consolidated into the Consolidated Financial Statements for 2013.Statements. The nine12 companies are PT Telekomunikasi Indonesia International (“TII”, a wholly-owned subsidiary), PT Dayamitra Telekomunikasi (“Dayamitra”, a wholly-owned subsidiary), PT Pramindo Ikat Nusantara (“PINs”, a wholly-owned subsidiary), PT Telekomunikasi Selular (“Telkomsel”, in which we own a 65% stake), PT Dayamitra Telekomunikasi (“Mitratel”, in which we own a 100%), PT Multimedia Nusantara (“Metra”TelkomMetra”, in which we own a wholly-owned subsidiary)100%), PT Telekomunikasi Indonesia International (“Telin”, in which we own a 100%), PT PINS Indonesia (“PINS”, previously named PT Pramindo Ikat Nusantara, in which we own a 100%), PT Graha Sarana Duta (“GSD”Telkom Property”, in which we own a 99.99% stake), PT Telkom Akses (“Telkom Akses”, in which we own a wholly-owned subsidiary)100%), PT Patra Telekomunikasi Indonesia (“Patrakom”, in which we own a wholly-owned subsidiary) and 100%), PT Infrastruktur Telekomunikasi Indonesia (“Telkominfra”, in which we own a 100%),PT Napsindo Primatel Internasional (“Napsindo”, in which we own a 60% stake), PT Metranet (“Metranet” in which we own a100%), and PT Jalin Pembayaran Nusantara (“Jalin”, in which we own a100%). See Note 1d to our Consolidated Financial Statements.
Solely for the convenience of the reader, certain Indonesian Rupiah amounts have been translatedconverted into USU.S. Dollars at specified rates. Unless otherwise indicated, USthe U.S. Dollars equivalent information for amounts in Indonesian Rupiah is translatedare converted at the Reuters Rate for December 31, 2013December30, 2016 at 04.00 PM Jakarta time, using the average of the market buy and sell rates of Rp12,170 towhich was Rp13,473to US$1.00. The averageexchange rate of Indonesian Rupiah for U.S. Dollars on December30, 2016 was Rp13,436to US$1.00 based on the market buymiddle exchange which is calculated based on the Bank Indonesia buying and sale on March 20, 2014 was Rp11,445 to US$1.00.selling rate. The Federal Reserve Bank of New York does not certify for customs purposes a noon buying rate for cable transfers in Indonesian Rupiah. No representation is made that the Indonesian Rupiah or USU.S. Dollar amounts shown herein could have been or could be converted into USU.S. Dollar or Indonesian Rupiah, as the case may be, at any particular rate or at all. See Item 3 “Key Information –— Selected Financial Data –— Exchange Controls” for further information regarding rates of exchange between the Indonesian Rupiah and the USU.S. Dollar.
FORWARD-LOOKING STATEMENTS
This Form 20-F contains “forward-looking statements” as defined in Section 27A of the USU.S. Securities Act of 1933, as amended (“Securities Act”) and Section 21E of the USU.S. Securities Exchange Act of 1934, as amended (“Exchange Act”), within the meaning of the Private Securities Litigation Reform Act of 1995, including statements regarding our expectations and projections for our future operating performance and business prospects. The words “believe”, “expect”, “anticipate”, “estimate”, “project” and similar words identify forward-looking statements. In addition, all statements other than statements of historical facts included in this Form 20-F are forward-looking statements. Although we believe that the expectations reflected in the forward-looking statements herein are reasonable, we can give no assurance that such expectations will prove to be correct. These forward-looking statements are subject to a number of risks and uncertainties, including changes in the economic, social and political environments in Indonesia. This Form 20-F discloses, under Item 3 “Key Information –— Risk Factors” and elsewhere, important factors that could cause actual results to differ materially from our expectations.expectations.
9
Table of Content
PART I
ITEM 1.IDENTITY1. IDENTITY OF DIRECTORS, SENIOR MANAGEMENT AND ADVISERSADVISORS
Not applicable.
ITEM 2.OFFER2. OFFER STATISTICS AND EXPECTED TIMETABLE
Not applicable.
ITEM 3.KEY3.KEY INFORMATION
A.SELECTED FINANCIAL DATA
The following tables present our selected consolidated financial information and operating statistics as of the dates and for each of the periods indicated. The selected financial information as of and for the years ended December 31, 2010, 2011, 2012, 2013, 2014, 2015 and 20132016 presented below is based upon our audited Consolidated Financial Statementsconsolidated financial statements prepared in conformity with IFRS as issued by the IASB. The selected financial information as of and for the years ended December 31, 2010, 2011, 2012, 2013, 2014, 2015 and 20132016 should be read in conjunction with, and is qualified in its entirety by reference to, our audited Consolidated Financial Statements, including the notes thereto, and the other information include elsewhere in this Form 20-F and in our previous Form 20-F filed with the SEC on April 1,2013. In 2013, we adopted IAS 19Employee Benefits(Revised 2011) on a retrospective basis and the 2011 and 2012 consolidated financial statements have been restated. Moreover, in 2013, our shareholders approved the stock split with a ratio of 1:5, accordingly the historical per share information has been retrospectively adjusted. The selected financial information as of and for the years ended December 31, 2009 is based upon our audited Consolidated Financial Statements prepared in conformity with Indonesian Financial Accounting Standards (“IFAS”), with a reconciliation to US GAAP. The selected financial information as of and for the years ended December 31, 2009 should be read in conjunction with, and is qualified in its entirety by reference to, our audited Consolidated Financial Statements, including the notes thereto, and the other information included elsewhere in our previous Form 20-F filed with the SEC on April 8, 2010. Therefore, financial information for 2010, 2011, 2012 and 2013 are not comparable with financial information for 2009 and are presented separately.
April1,2016.
The Public Accountant Firm (“KAP”) Purwantono, Sungkoro & Surja (formerly Purwantono, Suherman & SurjaSurja) (a member firm of Ernst & Young Global Limited) ("Purwantono, Sungkoro & Surja") audited our Consolidated Financial Statements prepared as of and for the years ended December 31, 2012, 2013, 2014, 2015 and 2013, while, our Consolidated Financial Statements as of and for the years ended December 31, 2009, 2010 and 2011 were audited by KAP Tanudiredja, Wibisana & Rekan, a member firm of the PwC global network (“PwC”).
2016.
KEY CONSOLIDATED STATEMENTS OFPROFIT OR LOSS AND OTHERCOMPREHENSIVE INCOME DATA | | KEY CONSOLIDATED STATEMENTS OFPROFIT OR LOSS AND OTHERCOMPREHENSIVE INCOME DATA | |
IFRS | |
| |
| |
| |
| |
| |
| |
| | Years Ended December 31, | | Years Ended December 31, | |
| | 2010 | | 2011 (Restated) | | 2012 (Restated) | | 2013 | | 2013 | | 2012 | | 2013 | | 2014 | | 2015 | | 2016 | |
| | (Rp billion) | | (Rp billion) | | (Rp billion) | | (Rp billion) | | (US$ million) | | (Rp billion) | | (Rp billion) | | (Rp billion) | | (Rp billion) | | (Rp billion) | | (US$ million) | |
| | except for per share and per ADS amount | | | except for per share and per ADS amount | |
Key Consolidated Statements of Comprehensive Income Data | | | | | | | | | | | | |
IFRS | | | | | | | | | | | | |
Revenues | | 68,529 | | 71,238 | | 77,127 | | 82,967 | | 6,817 | | 77,127 | | 82,967 | | 89,696 | | 102,470 | | 116,333 | | 8,635 | |
Expenses(1) | | 46,337 | | 49,880 | | 54,200 | | 57,850 | | 4,753 | | 54,200 | | 57,850 | | 61,617 | | 71,603 | | 77,824 | | 5,776 | |
Adjusted EBITDA | | 37,334 | | 36,857 | | 39,971 | | 43,532 | | 3,577 | | 39,574 | | 41,680 | | 45,684 | | 51,404 | | 59,498 | | 4,416 | |
Operating Profit | | 22,754 | | 22,034 | | 25,497 | | 27,727 | | 2,278 | | 25,497 | | 27,727 | | 29,172 | | 32,369 | | 39,172 | | 2,908 | |
Profit before Income Tax | | 21,264 | | 20,982 | | 24,027 | | 27,030 | | 2,221 | | 24,027 | | 27,030 | | 28,579 | | 31,293 | | 38,166 | | 2,833 | |
Net Income Tax Expense | | (5,512 | ) | (5,437 | ) | (5,886 | ) | (6,900 | ) | (567 | ) | (5,886 | ) | (6,900 | ) | (7,341 | ) | (8,023 | ) | (9,017 | ) | (669 | ) |
Profit for the Year | | 15,752 | | 15,545 | | 18,141 | | 20,130 | | 1,654 | | 18,141 | | 20,130 | | 21,238 | | 23,270 | | 29,149 | | 2,164 | |
Attributable to owners of the parent company | | 11,427 | | 11,043 | | 12,621 | | 14,046 | | 1,154 | | 12,621 | | 14,046 | | 14,437 | | 15,451 | | 19,333 | | 1,435 | |
Attributable to non-controlling interests | | 4,325 | | 4,502 | | 5,520 | | 6,084 | | 500 | | 5,520 | | 6,084 | | 6,801 | | 7,819 | | 9,816 | | 729 | |
Other Comprehensive Income (Expenses) - Net | | (553 | ) | (1,928 | ) | (2,540 | ) | 5,115 | | 420 | | (2,540 | ) | 5,115 | | 810 | | 493 | | (2,099 | ) | (156 | ) |
Net Comprehensive Income for the Year | | 15,199 | | 13,617 | | 15,601 | | 25,245 | | 2,074 | | 15,601 | | 25,245 | | 22,048 | | 23,763 | | 27,050 | | 2,008 | |
Attributable to owners of the parent company | | 10,911 | | 9,183 | | 10,056 | | 19,018 | | 1,562 | | 10,056 | | 19,018 | | 15,291 | | 16,003 | | 17,312 | | 1,285 | |
Attributable to non-controlling interests | | 4,288 | | 4,434 | | 5,545 | | 6,227 | | 512 | | 5,545 | | 6,227 | | 6,757 | | 7,760 | | 9,738 | | 723 | |
Weighted average number of shares outstanding (in millions after stock split) | | 96,011 | | 96,359 | | 97,696 | | 98,177 | | 98,638 | | - | |
10
Table of Content
| Years Ended December 31, | |
| 2012 | | 2013 | | 2014 | | 2015 | | 2016 | |
| (Rp billion) | | (Rp billion) | | (Rp billion) | | (Rp billion) | | (Rp billion) | | (US$ million) | |
| except for per share and per ADS amount | |
Basic and Diluted Earnings per Share (in full amount) | | | | | | | | | | | | |
Profit per share(2) | 131.45 | | 145.77 | | 147.78 | | 157.38 | | 195.99 | | 0.01 | |
Profit per ADS (100 shares of common stock per ADS) | 13,145.40 | | 14,576.79 | | 14,778.00 | | 15,738.00 | | 19,599.85 | | 1.45 | |
Dividend relating to the period (accrual basis, in full amount) | | | | | | | | | | | | |
Dividends declared per share | 87.24 | | 102.40 | | 89.46 | | 94.63 | | 19.38 | | 0.00 | |
Dividends declared per ADS | 8,724 | | 10,240 | | 8,946 | | 9,463 | | 1,938 | | 0.14 | |
Dividend paid in the period (cash basis, in full amount)(3) | | | | | | | | | | | | |
Dividends declared per share | 74.29 | | 87.24 | | 102.40 | | 89.46 | | 94.63 | | 0.01 | |
Dividends declared per ADS | 7,429 | | 8,724 | | 10,240 | | 8,946 | | 9,463 | | 0.70 | |
(1) Expenses are calculated as the sum of the following expenses: operations, maintenance and telecommunication service, depreciation and amortization, personnel, interconnection, general and administrative, marketing, loss on foreign exchange - net, share of profit (loss) of associated companies and other expenses. | |
(2) Using IFAS results, our profit for the year attributable to owners of the parent company would be Rp12,850 billion, Rp14,205 billion, Rp14,471 billion, Rp15,489 billion and Rp19,352 billion for 2012, 2013, 2014, 2015 and 2016, and our net income per share would be Rp133.84, Rp147.42, Rp148.13, Rp157.77 and Rp196.19 for 2012, 2013, 2014, 2015 and 2016. We distribute dividends based on profit attributable to owners of the parent company and net income per share determined in reliance on IFAS. | |
(3) In 2012, we paid a cash dividend for 2011 of Rp74.29 per share. In 2013, we paid a cash dividend for 2012 of Rp87.24 per share. In 2014, we paid a cash dividend for 2013 of Rp102.40 per share, in 2015, we paid a cash dividend for 2014 of Rp89.46 per share and in 2016, we paid a cash dividend for 2015 of Rp94.63 per share. | |
| | Years Ended December 31, | |
| | 2010 | | 2011 (Restated) | | 2012 (Restated) | | 2013 | | 2013 | |
| | (Rp billion) | | (Rp billion) | | (Rp billion) | | (Rp billion) | | (US$ million) | |
| | except for per share and per ADS amount | | |
Weighted average number of shares outstanding (in millions) | | 98,345 | | 97,959 | | 96,011 | | 96,359 | | - | |
Basic and Diluted Earnings per Share (in full amount) | | | | | | | | | | | |
Net incomeper share(2) | | 116.19 | | 112.73 | | 131.45 | | 145.77 | | 0.01 | |
Net income per ADS (200 Series B shares per ADS) | | 23,238.00 | | 22,546.00 | | 26,290.80 | | 29,153.58 | | 2.40 | |
Dividend relating to the period (accrual basis, in full amount) | | | | | | | | | | | |
Dividends declared per share | | 64.52 | | 74.21 | | 87.24 | | - | | - | |
Dividends declared per ADS | | 12,903.60 | | 14,842.17 | | 17,447.53 | | - | | - | |
Dividend paid in the period (cash basis, in full amount)(3) | | | | | | | | | | | |
Dividends declared per share | | 55.09 | | 61.71 | | 74.29 | | 87.24 | | 0.01 | |
Dividends declared per ADS | | 11,017.83 | | 12,342.57 | | 14,858.69 | | 17,447.53 | | 1.43 | |
RECONCILIATION OF OPERATING PROFIT TO ADJUSTED EBITDA | |
| Years Ended December 31, | |
| 2012 | | 2013 | | 2014 | | 2015 | | 2016 | |
| (Rp billion) | | (Rp billion) | | (Rp billion) | | (Rp billion) | | (Rp billion) | | (US$ million) | |
Operating Profit | 25,497 | | 27,727 | | 29,172 | | 32,369 | | 39,172 | | 2,908 | |
Add: | | | | | | | | | | | | |
Depreciation and amortization | 14,474 | | 15,805 | | 17,178 | | 18,572 | | 18,556 | | 1,377 | |
Loss on foreign exchange - net | 189 | | 249 | | 14 | | 46 | | 52 | | 4 | |
Other income | (2,559 | ) | (2,581 | ) | (1,076 | ) | (1,500 | ) | (751 | ) | (56 | ) |
Other expenses | 1,973 | | 480 | | 396 | | 1,917 | | 2,469 | | 183 | |
Adjusted EBITDA(1) | 39,574 | | 41,680 | | 45,684 | | 51,404 | | 59,498 | | 4,416 | |
(1) We calculate adjusted EBITDA by calculating operating profit before interest, tax, depreciation and amortization, loss on foreign exchange - net, other income and other expenses. Adjusted EBITDA and other related ratios in this Annual Report serve as additional indicators on our performance and liquidity, which is a non-GAAP financial measure. Adjusted EBITDA is presented because our management believes that it is widely used by investors in their analysis of our performance and can assist them in their comparison of our performance with those of other companies in the telecommunications, information and media sector. We also present adjusted EBITDA because it is used by some investors as a way to measure a company’s ability to incur and service debt, make capital expenditures and meet working capital requirements. Companies in the telecommunications, information and media sector have historically reported adjusted EBITDA as a supplement to financial measures in accordance with IFRS or U.S. GAAP. Adjusted EBITDA should not be considered as an alternative to net income as an indicator of our performance, nor should adjusted EBITDA be considered an alternative to cash flows from operating activities as a measure of liquidity or as an alternative to any other measure determined in accordance with IFRS. Unlike net income, adjusted EBITDA does not include depreciation and amortization or financing costs and, therefore, does not reflect current or future capital expenditures or the cost of capital. We compensate for these limitations by using adjusted EBITDA as only one of several comparative tools, together with IFRS-based measurements, to assist in the evaluation of operating performance. Such IFRS-based measurements include profit before income tax, profit for the year, cash flows from operations and cash flow data. We have significant uses of cash flows, including capital expenditures, interest payments, debt principal repayments, taxes and other non-recurring charges, which are not reflected in adjusted EBITDA. Our calculation of adjusted EBITDA may be different from the calculation methods used by other companies and, therefore, comparability may be limited. | |
(1)Expenses are calculated as the sum of the following expenses: operation, maintenance and telecommunication services, depreciation and amortization, personnel, interconnection, marketing, general and administrative, loss (gain) on foreign exchange, share of loss of associated companies and other expenses.
(2)Using IFAS results, our profit attributable to owners of the parent company would be Rp11,537 billion, Rp10,965 billion, Rp12,850 billion and Rp14,205 for 2010, 2011, 2012 and 2013, and our net income per share would be Rp117.31, Rp111.93, Rp133.84 and Rp147.42 for 2010, 2011, 2012 and 2013. We distribute dividends based on profit attributable to owners of the parent company and net income per share determined in reliance on IFAS.
(3)In 2010, we paid a cash dividend for 2009 of Rp55.09 per share and interim cash dividend 2010 of Rp5.35 per share. In 2011, we paid a cash dividend for 2010 of Rp61.71 per share. In 2012, we paid a cash dividend for 2011 of Rp74.29 per share. In 2013, we paid a cash dividend for 2012 of Rp87.24 per share.
| | Years Ended December 31, | |
| | 2010 | | 2011 (Restated) | | 2012 (Restated) | | 2013 | | 2013 | |
| | (Rp billion) | | (Rp billion) | | (Rp billion) | | (Rp billion) | | (US$ million) | |
Reconciliation of Operating Profit to Adjusted EBITDA | | | | | | | | | | | |
Operating Profit | | 22,754 | | 22,034 | | 25,497 | | 27,727 | | 2,278 | |
Add: | | | | | | | | | | | |
Depreciation and Amortization | | 14,580 | | 14,823 | | 14,474 | | 15,805 | | 1,299 | |
Adjusted EBITDA(1) | | 37,334 | | 36,857 | | 39,971 | | 43,532 | | 3,577 | |
(1)Adjusted EBITDA is defined as earnings before interest, tax, depreciation and amortization. Adjusted EBITDA and other related ratios in this Annual Report serve as additional indicators on our performance and liquidity, which is a non-GAAP financial measure. Adjusted EBITDA is presented because our management believes that it is widely used by investors in their analysis of our performance and can assist them in their comparison of our performance with those of other companies in the telecommunications, information and media sector. We also present adjusted EBITDA because it is used by some investors as a way to measure a company’s ability to incur and service debt, make capital expenditures and meet working capital requirements. Companies in the telecommunications, information and media sector have historically reported adjusted EBITDA as a supplement to financial measures in accordance with IFRS or US GAAP. Adjusted EBITDA should not be considered as an alternative to net income as an indicator of our performance, nor should adjusted EBITDA be considered an alternative to cash flows from operating activities as a measure of liquidity or as an alternative to any other measure determined in accordance with IFRS. Unlike net income, adjusted EBITDA does not include depreciation and amortization or financing costs and, therefore, does not reflect current or future capital expenditures or the cost of capital. We compensate for these limitations by using adjusted EBITDA as only one of several comparative tools, together with IFRS-based measurements, to assist in the evaluation of operating performance. Such IFRS-based measurements include profit before income tax, profit for the year, cash flows from operations and cash flow data. We have significant uses of cash flows, including capital expenditures, interest payments, debt principal repayments, taxes and other non-recurring charges, which are not reflected in adjusted EBITDA. Our calculation of adjusted EBITDA may be different from the calculation methods used by other companies and, therefore, comparability may be limited.
11
Table of Content
| | As of December 31, | |
| | 2010 | | 2011 (Restated) | | 2012 (Restated) | | 2013 | | 2013 | |
| | (Rp billion) | | (Rp billion) | | (Rp billion) | | (Rp billion) | | (US$ million) | |
| | except for shares | |
Key Consolidated Statements of Financial Position Data | | | | | | | | | | | |
IFRS | | | | | | | | | | | |
Cash and cash equivalents | | 9,120 | | 9,634 | | 13,118 | | 14,696 | | 1,207 | |
Trade and other receivables | | 4,534 | | 5,393 | | 5,409 | | 6,421 | | 527 | |
Advances and prepaid expenses | | 3,441 | | 3,294 | | 3,721 | | 3,937 | | 324 | |
Total Current Assets | | 18,830 | | 21,401 | | 27,973 | | 33,075 | | 2,718 | |
Property and equipment | | 75,624 | | 74,638 | | 76,908 | | 86,599 | | 7,116 | |
Intangible assets | | 1,786 | | 1,791 | | 1,443 | | 1,508 | | 124 | |
Total Non-current Assets | | 82,242 | | 80,965 | | 82,238 | | 94,721 | | 7,783 | |
Total Assets | | 101,072 | | 102,366 | | 110,211 | | 127,796 | | 10,501 | |
Trade and other payables | | 7,787 | | 8,355 | | 7,457 | | 11,988 | | 985 | |
Current income tax liabilities | | 736 | | 729 | | 1,280 | | 942 | | 77 | |
Accrued expenses | | 3,409 | | 4,790 | | 6,163 | | 5,264 | | 432 | |
Unearned income | | 2,681 | | 2,821 | | 2,729 | | 3,490 | | 287 | |
Short-term loans and other borrowings | | 5,360 | | 4,913 | | 5,658 | | 5,525 | | 454 | |
Total Current Liabilities | | 20,473 | | 22,189 | | 24,108 | | 28,437 | | 2,336 | |
Deferred tax liabilities | | 4,047 | | 3,159 | | 2,252 | | 2,908 | | 239 | |
Pension benefit and other post-employment benefit obligations | | 2,805 | | 5,372 | | 8,184 | | 4,258 | | 350 | |
Long-term loans and other borrowings | | 16,655 | | 12,958 | | 13,617 | | 14,731 | | 1,210 | |
Total Non-current Liabilities | | 24,061 | | 22,018 | | 24,734 | | 22,705 | | 1,866 | |
Total Liabilities | | 44,534 | | 44,207 | | 48,842 | | 51,142 | | 4,202 | |
Capital stock(1) | | 5,040 | | 5,040 | | 5,040 | | 5,040 | | 414 | |
Net Equity Attributable to Owners of the Parent Company | | 44,627 | | 44,844 | | 46,055 | | 59,753 | | 4,910 | |
Non-controlling interests | | 11,911 | | 13,315 | | 15,314 | | 16,901 | | 1,389 | |
Total Equity (Net Assets) | | 56,538 | | 58,159 | | 61,369 | | 76,654 | | 6,299 | |
Net Debt | | 12,895 | | 8,237 | | 6,157 | | 5,560 | | 457 | |
Net Working Capital | | (1,643 | ) | (788 | ) | 3,865 | | 4,638 | | 382 | |
Issued and fully paid shares (in shares) | | 100,799,996,400 | | 100,799,996,400 | | 100,799,996,400 | | 100,799,996,400 | | 100,799,996,400 | |
| KEY CONSOLIDATED STATEMENTS OF FINANCIAL POSITION DATA | |
| IFRS | | | | | | | | | | | |
|
| As of December 31, | |
|
| 2012 | | 2013 | | 2014 | | 2015 | | 2016 | |
|
| (Rp billion) | | (Rp billion) | | (Rp billion) | | (Rp billion) | | (Rp billion) | | (US$ million) | |
|
| except for per share | |
| Cash and cash equivalents | 13,118 | | 14,696 | | 17,672 | | 28,117 | | 29,767 | | 2,210 | |
| Trade and other receivables | 5,409 | | 7,018 | | 7,380 | | 7,872 | | 7,900 | | 586 | |
| Advances and prepaid expenses | 3,721 | | 3,937 | | 4,733 | | 5,839 | | 5,246 | | 390 | |
| Total Current Assets | 27,973 | | 33,672 | | 34,294 | | 47,912 | | 47,701 | | 3,541 | |
| Property and equipment | 76,908 | | 86,599 | | 94,602 | | 103,455 | | 114,230 | | 8,479 | |
| Intangible assets | 1,443 | | 1,508 | | 2,463 | | 3,056 | | 3,089 | | 229 | |
| Total Non-Current Assets | 82,238 | | 94,721 | | 107,321 | | 118,016 | | 131,642 | | 9,771 | |
| Total Assets | 110,211 | | 128,393 | | 141,615 | | 165,928 | | 179,343 | | 13,312 | |
| Trade and other payables | 7,457 | | 12,585 | | 12,476 | | 14,284 | | 13,690 | | 1,016 | |
| Current income tax liabilities | 1,280 | | 942 | | 1,501 | | 1,802 | | 1,236 | | 92 | |
| Accrued expenses | 6,163 | | 5,264 | | 5,211 | | 8,247 | | 11,283 | | 837 | |
| Unearned income | 2,729 | | 3,490 | | 3,963 | | 4,360 | | 5,563 | | 413 | |
| Short-term loans and current maturities of long-term borrowings | 5,658 | | 5,525 | | 7,709 | | 4,444 | | 5,432 | | 403 | |
| Total Current Liabilities | 24,108 | | 29,034 | | 32,318 | | 35,413 | | 39,762 | | 2,951 | |
| Deferred tax liabilities | 2,252 | | 2,908 | | 2,703 | | 2,110 | | 745 | | 55 | |
| Pension benefit and other post-employment benefit obligations | 8,184 | | 4,258 | | 4,115 | | 4,171 | | 6,126 | | 455 | |
| Long-term loans and other borrowings | 13,617 | | 14,731 | | 15,743 | | 30,168 | | 26,367 | | 1,957 | |
| Total Non-current Liabilities | 24,734 | | 22,705 | | 23,365 | | 37,332 | | 34,305 | | 2,547 | |
| Total Liabilities | 48,842 | | 51,739 | | 55,683 | | 72,745 | | 74,067 | | 5,498 | |
| Capital stock(1) | 5,040 | | 5,040 | | 5,040 | | 5,040 | | 5,040 | | 374 | |
| Net Equity Attributable to Owners of the Parent Company | 46,055 | | 59,753 | | 67,646 | | 74,934 | | 84,163 | | 6,247 | |
| Non-controlling interests | 15,314 | | 16,901 | | 18,286 | | 18,249 | | 21,113 | | 1,567 | |
| Total Equity (Net Assets) | 61,369 | | 76,654 | | 85,932 | | 93,183 | | 105,276 | | 7,814 | |
| Net Debt | 6,157 | | 5,560 | | 5,780 | | 6,495 | | 2,032 | | 150 | |
| Net Working Capital | 3,865 | | 4,638 | | 1,976 | | 12,499 | | 7,939 | | 590 | |
| Issued and fully paid shares (in shares) | 100,799,996,400 | | 100,799,996,400 | | 100,799,996,400 | | 100,799,996,400 | | 100,799,996,400 | | - | |
| (1) As of December 31, 2016, our issued and paid-up capital consists of one Dwiwarna Shareand 100,799,996,399 shares of common stock each from an authorized capital stock comprising one Dwiwarna Share and 399,999,999,999 shares of common stock. | |
| |
(1)As of December 31, 2013, our issued and paid-up capital consists of one Series A Dwiwarna share having a par value of Rp50 (the “Dwiwarna Share”) and 100,799,996,399 Series B shares having a par value of Rp50 per share (“common stock”) each from an authorized capital stock comprising one Series A Dwiwarna share and 399,999,999,999 Series B shares.
|
| As of and Years Ended
December 31,
|
|
2009*
|
|
| (Rp billion)
|
|
Consolidated Income Statement Data
|
|
|
|
Indonesian GAAP
|
|
|
|
Operating Revenues
|
| 67,678
|
|
Operating Expenses
| |
| |
Depreciation and amortization
| | 13,975
| |
Personnel
| | 8,371
| |
Operations, maintenance and telecommunication services
| | 14,549
| |
General and administrative
| | 2,806
| |
Interconnection
| | 2,929
| |
Marketing
| | 2,260
| |
Total Operating Expenses
|
| 44,890
|
|
12
Table of Content
|
| As of and Years Ended
December 31,
|
|
2009*
|
|
| (Rp billion)
|
|
Operating Income
|
| 22,788
|
|
Other Income (Expenses)
| |
| |
Interest income
| | 462
| |
Equity in net (loss) income of associated companies
| | (30
| )
|
Interestexpense
| | (2,096
| )
|
Gain(loss) on foreign exchange - net
| | 973
| |
Others - net
| | 350
| |
Other expenses - net
| | (341
| )
|
IncomeBefore Tax
|
| 22,447
|
|
Income Tax (Expense) Benefit
|
| (6,404
| )
|
Income Before Minority Interest in Net Income of Consolidated Subsidiaries
|
| 16,043
|
|
Minority interest in net income of consolidated subsidiaries, net
| | (4,644
| )
|
NetIncome
|
| 11,399
|
|
Weighted average number of shares outstanding (in millions)
| | 19,669
| |
Basic and Diluted Earnings per Share (in full amount)
| |
| |
Net income per share
| | 579.52
| |
Net income per ADS
| | 23,180.80
| |
US GAAP(1)
| |
| |
Net income
|
| 12,092
|
|
Operating revenues
|
| 67,677
|
|
Basic and Diluted Earnings per Share (in full amount)
| |
| |
Net income per share
| | 614.78
| |
Net income per ADS
| | 24,591.25
| |
Dividend relating to the period (accrual basis, in full amount)
| |
| |
Dividends declared per share
| | 288.06
| |
Dividends declared per ADS
| | 11,522.40
| |
Dividend paid in the period (cash basis, in full amount)(2)
| |
| |
Dividends declared per share
| | 323.59
| |
Dividends declared per ADS
| | 12,943.60
| |
Consolidated Balance Sheet Data
| |
| |
Indonesian GAAP
| |
| |
Current assets
| | 16,095
| |
Non-current assets
| | 81,836
| |
Total assets
|
| 97,931
|
|
Current liabilities(3)
| | 26,892
| |
Non-current liabilities
| | 21,544
| |
Total liabilities
|
| 48,436
|
|
Minority interest
| | 10,933
| |
Capital stock
| | 5,040
| |
Total stockholders’ equity
|
| 38,562
|
|
Total liabilities and stockholders’ equity
|
| 97,931
|
|
US GAAP(1)
| |
| |
Current assets
| | 18,381
| |
Non-current assets
| | 83,100
| |
Total assets
|
| 101,481
|
|
Current liabilities
| | 26,931
| |
Non-current liabilities
| | 22,522
| |
Total liabilities
|
| 49,453
|
|
Non-controlling interest in net assets of subsidiaries
| | 11,067
| |
Total stockholders’ equity
|
| 40,961
|
|
Total liabilities and stockholders’ equity
|
| 101,481
|
|
(1)US GAAP amounts reflect adjustments resulting from differences in the accounting treatment of voluntary termination benefits, foreign exchange differences capitalized on assets under construction, interest capitalized on assets under construction, revenue-sharing arrangements, employees benefits, equity in net loss (income) of associated companies, amortization of land rights, revenue recognition, amortization of goodwill, finance leases, acquisition of Dayamitra, asset retirement obligations, deferred taxes, available-for-sale securities, amendment and restatement of JOS in Regional Division VII and non-controlling interests.
(2)In 2009, we paid a cash dividend for 2008 of Rp296.94 per share and interim cash dividend 2009 of Rp26.65 per share.
(3)Includes current maturities of long-term debt.
13
Table of Content
Exchange Controls
Exchange Rate Information
The following table shows the exchange rate of Indonesian Rupiah to USU.S. Dollar based on the middle exchange rate which is calculated based on the Bank Indonesia buying and selling rates for the periods indicated.
| | at Period End | | Average | | Low | | High | |
Calendar Year | | (Rp Per US$1) | |
2009(1) | | 9,400 | | 10,356 | | 11,980 | | 9,400 | |
2010(1) | | 8,991 | | 9,078 | | 9,365 | | 8,924 | |
2011(1) | | 9,068 | | 8,773 | | 9,170 | | 8,508 | |
2012(1) | | 9,670 | | 9,419 | | 9,670 | | 9,000 | |
2013 | | 12,189 | | 11,597 | | 12,270 | | 10,922 | |
September(2) | | 11,613 | | 11,346 | | 11,613 | | 10,922 | |
October(2) | | 11,234 | | 11,367 | | 11,593 | | 11,018 | |
November(2) | | 11,977 | | 11,613 | | 11,977 | | 11,354 | |
December(2) | | 12,189 | | 12,087 | | 12,270 | | 11,830 | |
2014 | | 11,634 | | 12,057 | | 12,267 | | 11,620 | |
January(2) | | 12,226 | | 12,180 | | 12,267 | | 12,047 | |
February(2) | | 11,634 | | 11,935 | | 12,251 | | 11,620 | |
Source: Bank Indonesia
(1)Determined based upon the last day middle exchange rate of each month announced by Bank Indonesia applicable for the period.
(2)Determined based upon the daily middle exchange rate announced by Bank Indonesia during the applicable period.Calendar Year | at Period End(1) |
| Average(2) |
| Low(2) |
| High(2) |
|
| (Rp Per US$1) |
|
2012 | 9,670 | | 9,380 | | 9,707 | | 8,892 | |
2013 | 12,189 | | 10,451 | | 12,270 | | 9,634 | |
2014 | 12,440 | | 11,878 | | 12,900 | | 11,271 | |
2015 | 13,795 | | 13,392 | | 14,728 | | 12,444 | |
2016 | 13,436 | | 13,307 | | 13,946 | | 12,926 | |
September | 12,998 | | 13,118 | | 13,269 | | 12,926 | |
October | 13,051 | | 13,017 | | 13,054 | | 12,969 | |
November | 13,563 | | 13,311 | | 13,570 | | 13,036 | |
December | 13,436 | | 13,418 | | 13,582 | | 13,285 | |
2017 | 13,335 | | 13,350 | | 13,485 | | 13,280 | |
January | 13,343 | | 13,359 | | 13,485 | | 13,288 | |
February | 13,280 | | 13,337 | | 13,374 | | 13,280 | |
March(throughMarch 22) | 13,335 | | 13,354 | | 13,393 | | 13,308 | |
Source: Bank Indonesia | | |
| |
| |
| |
(1) Determined based upon the middle exchange rate announced by Bank Indonesia applicable on the last day for the period. | |
(2) Determined based upon the daily middle exchange rate announced by Bank Indonesia during the applicable period. | |
Under the current exchange rate system, the exchange rate of theRupiahthe Indonesian Rupiah is determined by the market, reflecting the interaction of supply and demand in the market. However, Bank Indonesia may take measures to maintain a stable exchange rate. For the year 2013,2016, the average rate of the Rupiah to the USU.S. Dollar was Rp11,597,Rp13,307, with the lowest and highest rates being Rp12,270Rp13,946 and Rp10,922,Rp12,926, respectively.
The exchange rates used for translationconversion of monetary assets and liabilities denominated in foreign currencies are the buybid and selloffer rates published by Reuters in 2011, 20122014, 2015 and 2013.2016. The Reuters buybid and selloffer rates, applied respectively to monetary assets and liabilities, were Rp9,060Rp12,380 and Rp9,075Rp12,390 toUS$1.00 as of December 31, 2014, Rp13,780 and Rp13,790 to US$1.00 as of December 31, 2011, Rp9,6302015 and Rp9,645 to US$1.00 as of December28, 2012Rp13,470 and Rp12,160 and Rp12,180Rp13,475 to US$1.00 as of December 31, 2013.2016.
The Consolidated Financial Statements are stated in Rupiah. The translationsconversion of Rupiah amounts into US DollarU.S. Dollars are included solely for the convenience of the readers and have been made using the average of the market buybid and selloffer rates of Rp12,170Rp13,473 to US$1.00 published by Reuters on December 31, 2013.December30,2016.
On March 20, 2014,OnMarch 22, 2017, the Reuters bid and askoffer rates were Rp11,440Rp13,330 and Rp11,450Rp13,333 to US$1.00.
Foreign Exchange Controls
Indonesia operates a liberal foreign exchange system that permits the free flow of foreign exchange. Capital transactions, including remittances of capital, profits, dividends and interest, are free of exchange controls. A number of regulations, however, have an impact on the exchange system. For example, only banks are authorized to deal in foreign exchange and execute exchange transactions related to the import and export of goods. In addition, Indonesian banks (including branches of foreign banks in Indonesia) are required to report to Bank Indonesia any fund transfers exceeding US$10,000. As a State-Owned Company, and basedBased on the decree of the Head of the PKLN, we are required to obtain an approval from the PKLN prior to acquiring foreign commercial loans and mustloans. We are also required to submit periodical reports to PKLN during the term of the loans.
Table of Content
B.CAPITALIZATION ANDINDEBTEDNESS
Not applicable.
C.REASON FOR THE OFFER AND USE OF PROCEEDS
Not applicable.
14
Table of Content
D. RISK FACTORS
A.Risks RelatedtRisks Related too Indonesia
1.PoliticalaPolitical andnd Social Risks
Current political and social events in Indonesia may adversely affect our business
Since 1998, Indonesia has experienced a process of democratic change, resulting in political and social events that have highlighted the unpredictable nature of Indonesia’s changing political landscape. In 1999, Indonesia conducted its first free elections for parliamentrepresentatives in parliament. In 2004, 2009 and president.2014, elections were held in Indonesia to elect the President, Vice-President and representatives in parliament.Indonesia also has many political parties, without any one party holding a clear majority. Due to these factors, Indonesia has, from time to time, experienced political instability, as well as general social and civil unrest. For example, since 2000, thousands of Indonesians have participated in demonstrations in Jakarta and other Indonesian cities both for and against former President Abdurahmanpresidents Abdurrahman Wahid, former President Megawati Soekarnoputri and Susilo Bambang Yudhoyono and current President Susilo Bambang YudhoyonoJoko Widodo as well as in response to specific issues, including fuel subsidy reductions, privatization of state assets, anti-corruption measures, decentralization and provincial autonomy, and the American-led military campaigns in Afghanistan and Iraq. Although these demonstrations were generally peaceful, some turned violent.
President Joko Widodo won the Indonesian presidential elections which took place in 2014, and was sworn in as President on October 20, 2014. Although the 2014 elections were conducted in a peaceful manner, President Joko Widodo's governing coalition doesnothold a majority of seats in parliament. Between November 2016 and February 2017, significant demonstrations took place in central Jakarta against the governor of Jakarta. These demonstrations occurred during the closely fought Jakarta gubernatorial elections which took place in February 2017 and will be re-contested in April 2017. Each of the foregoing events, as well as political campaigns in Indonesia generally, may be indicative of the degree of political and social division in Indonesia.
Indonesia is facing a couple of critical political eventsannounced in 2014, namely the legislative election scheduled for April 9,November 2014, and implemented with effect from January 1, 2015, a fixed diesel subsidy of Rp1,000 per liter and scrapped the electiongasoline subsidy. Although the implementation did not result in any significant violence or political instability, the announcement and implementation also coincided with a period where crude oil prices had dropped very significantlyfrom 2014. Currently, the Government reviews and adjusts the price for Presidentfuel on monthly basis and Vice President scheduled for July 9, 2014. Political tensions are expected to increase during bothimplements the legislative and the presidential elections. President Susilo Bambang Yudhoyono is required to step down after having served two terms, thus the presidential election will likely be hotly contested, with an uncertain outcome.
Increased political tensions may cause social and civil disturbances and conflicts to increase. Social conflicts, in particular, may escalateadjusted fuel price in the lead-up period to the 2014 legislativefollowing month. There can be no assurance that future increases in crude oil and presidential election. The dynamics offuel prices will not result in political maneuvering to win the sympathy of different groups of the public may trigger friction at the grass-root level.
and social instability.
Separatist movements and clashes between religious and ethnic groups have also resulted in social and civil unrest in parts of Indonesia, such as Aceh in the past and in Papua currently, where there have been clashes between supporters of those separatist movements and the Indonesian military, including continued activity in Papua, by separatist rebels that has led to violent incidents. There have also been inter-ethnic conflict,conflicts, for example in Kalimantan, as well as inter-religious conflict such as in Maluku and Poso.
Labor issues have also come to the fore in Indonesia. In 2003, the Government enacted a new labor law that gave employees greater protections. Occasional efforts to reduce these protections have prompted an upsurge in public protests as workers responded to policies that they deemed unfavorable.
There can be no assurance that social and civil disturbances will not occur in the future and on a wider scale, or that any such disturbances will not, directly or indirectly, materially and adversely affect our business, financial condition, results of operations and prospects.
Table of Content
Terrorist activities in Indonesia could destabilize Indonesia, which would adversely affect our business, financial condition and results of operations, and the market price of our securities
There have been a number of terrorist incidents in Indonesia, including the May 2005 bombing in Central Sulawesi, the Bali bombings in October 2002 and October 2005 and the bombings at the JW Marriot and Ritz Carlton hotels in Jakarta in July 2009. 2009,which resulted in deaths and injuries.On January 14, 2016, several coordinated bombings and gun shootings occurred in Jalan Thamrin, a main thoroughfare in Jakarta, resulting in a number of deaths and injuries.
Although the Government has successfully countered some terrorist activities in recent years and arrested several of those suspected of being involved in these incidents, terrorist incidents may continue and, if serious or widespread, might have a material adverse effect on investment and confidence in, and the performance of, the Indonesian economy and may also have a material adverse effect on our business, financial condition, results of operations and prospects and the market price of our securities.
15
Table of Content
2.Macro Economic Risks
Negative changes in global, regional or Indonesian economic activity could adversely affect our business
Changes in the Indonesian, regional and global economies can affect our performance. Two significant events in the past that impacted Indonesia’s economy were the Asian economic crisis of 1997 and the global economic crisis which started in 2008. The 1997 crisis was characterized in Indonesia by, among others, currency depreciation, a significant decline in real gross domestic product, high interest rates, social unrest and extraordinary political developments, whiledevelopments. While the global economic crisis that arose from the subprime mortgage crisis in the UStheUnited Statesdid not affect Indonesia's economy as severely as in 1997, it still put Indonesia’s economy under pressure, although not as severely as in 1997.pressure. The global financial markets have also experienced volatility as a result of expectations relating to monetary and interest rate policies of the downgrade of US sovereign debt in 2012 andUnited States, concerns over the debt crisis in the Eurozone.Eurozone,and concerns over China's economic health. Uncertainty over the outcome of the Eurozone governments’ financial support programs and worries about sovereign finances generally are ongoing. If the crisis becomes protracted, or extends to Asia and Indonesia, we can provide no assurance that it will not have a material and adverse effect on Indonesia’s economic growth and consequently on our business.
Adverse economic conditions could result in less business activity, less disposable income available for consumers to spend and reduced consumer purchasing power, which may reduce demand for communication services, including our services, which in turn would have an adverse effect on our business, financial condition, results of operations and prospects. There is no assurance that there will not be a recurrence of economic instability in future, or that, should it occur, it will not have an impact on the performance of our business.
Fluctuations in the value of theIndonesian Rupiah may materially and adversely affect us
Our functional currency is the Rupiah.theIndonesianRupiah. One of the most important effects of theimportantimpactsthe Asian economic crisis that affectedcrisishad on Indonesia was the depreciation and volatility in the value of the Indonesian Rupiah as measured against other currencies, such as the USU.S. Dollar.The Indonesian Rupiahcontinues to experience significant volatility.From 20092012 to 2013,2016, the Indonesian Rupiah per USU.S. Dollar exchange rate ranged from ahigh of Rp8,508Rp8,892 per USU.S. Dollar to alow of Rp12,270 per USRp14,728per U.S. Dollar. As a result, we recordedforeign exchangelosses of Rp210Rp14 billionin 2011, Rp189billionin 20122014, Rp46 billionin 2015, and Rp249Rp52 billion in 2013. The Rupiahdepreciated significantly in 2013.2016. As of December 31, 2013,2016, the Indonesian Rupiah per USU.S. Dollar exchange rate stood at Rp12,170Rp13,436 per USU.S. Dollar, compared toRp9,637.5toRp13,795 per USU.S. Dollar as of December 31, 2012.
2015.
To the extent that the Indonesian Rupiah depreciates further from the exchange rate as of December 2013,2016, our USU.S. Dollar-denominated obligations under our accounts payable and procurements payable, as well as payments for foreign currency-denominated loans payable and bonds payable, would increase in Indonesian Rupiah terms. A depreciation of the Rupiah would also increase the Rupiah cost of our capital expenditures as most of our capital expenditures are priced in or with reference to foreign currencies, mainly USU.S. Dollars and Euros, while a substantialmajority of our revenues are in Rupiah. Such depreciation of the Indonesian Rupiah would result in losses on foreign exchange translation, significantly affect our total expenses and net income, and reduce the USU.S. Dollar amounts of dividends received by holders of our ADSs. We can give no assurancesassurance that we will be able to control or manage our exchange rate risk successfully in the future or that we will not be adversely affected by our exposure to exchange rate risk.
Table of Content
In addition, while the Indonesian Rupiah has generally been freely convertible and transferable, from time bytimeto time, Bank Indonesia has intervened in the currency exchange markets in furtherance of its policies, either by selling Indonesian Rupiah or by using its foreign currency reserves to purchase Indonesian Rupiah. We can give no assurancesassurance that the current floating exchange rate policy of Bank Indonesia will not be modified or that the Government will take additional action to stabilize, maintain or increase the Indonesian Rupiah’s value, or that any of these actions, if taken, will be successful. Modification of the current floating exchange rate policy could result in significantly higher domestic interest rates, liquidity shortages, capital or exchange controls, or the withholding of additional financial assistance by multinational lenders. This could result in a reduction of economic activity, an economic recession, loan defaults or declining subscriber usage of our services, and as a result, we may also face difficulties in funding our capital expenditures and in implementing our business strategy. Any of the foregoing consequences could have a material adverse effect on our business, financial condition, results of operations and prospects.
16
Table of Content
Downgrades of credit ratings of the GovernmentGovernment or Indonesian companies could adversely affect our business
As of the date of this Annual Report, Indonesia’s sovereign foreign currency long-term debt iswas rated “Baa3” by Moody’s, (upgraded from “Ba1” on January 18, 2012), “BB+” by Standard & Poor’s (upgraded from “bb” on April 8, 2011) and “BBB”“BBB-” by Fitch Ratings (upgraded from “BB+” on December 15, 2011).Ratings. Indonesia's short-term foreign currency debt is rated “B1/NP” by Moody’s, “B” by Standard & Poor’s and “B”“F3” by Fitch Ratings. On January 18, 2012, Moody’s upgraded Indonesia’s long-term debt rating to investment grade status.
We can give no assurancesassurance that Moody’s, Standard & Poor’s or Fitch Ratings will not change or downgrade the credit ratings of Indonesia. Any such downgrade could have an adverse impact on liquidity in the Indonesian financial markets, the ability of the Government and Indonesian companies, including us, to raise additional financing, and the interest rates and other commercial terms at which such additional financing is available. Interest rates on our floating rate Rupiah-denominated debt would also likely increase. Such events could have material adverse effects on our business, financial condition, results of operations, and prospects.
prospects and/or the market price of our securities.
3.Disaster Risks
Indonesia is vulnerable to natural disasters and events beyond our control, which could adversely affect our business and operating results
Many parts of Indonesia, including areas where we operate, are prone to natural disasters such as floods, lightning strikes, typhoons, earthquakes, tsunamis, volcanic eruptions, fires, droughts, power outages and other events beyond our control. The Indonesian archipelago is one of the most volcanically active regions in the world as it is located in the convergence zone of three major lithospheric plates. It is subject to significant seismic activity that can lead to destructive earthquakes, tsunamis or tidal waves. Flash floods and more widespread flooding also occur regularly during the rainy season from November to April. Cities, especially Jakarta, are frequently subject to severe localized flooding which can result in major disruption and, occasionally, fatalities. Landslides regularly occur in rural areas during the wet season. From time to time, natural disasters have killed, affected or displaced large numbers of people and damaged our equipment. These events in the past, and may in the future, disrupt our business activities, cause damage to equipment, and adversely affect our financial performance and profit.
In recent years, several natural disasters have occurred in Indonesia (in addition to the Asian tsunami in 2004), including tsunamis in Pangandaran in West Java in 2006 and 2010, an earthquake in Yogyakarta in Central Java in 2006, a hot mud eruption and subsequent flooding in Sidoarjo in East Java in 2006 and separate earthquakes in Papua, West Java, Sulawesi and Sumatra in 2009.
OnFor example, on September 2, 2009, an earthquake in West Java caused damage to our assets. On September 30, 2009, an earthquake in West Sumatra disrupted the provision of telecommunications services in several locations. Although our Crisis Management Team in cooperation with our employeeslocations and partners was able to restore services quickly, the earthquake caused severe damage to our assets. There were a number of earthquakes detected in 2010 through 2013, although none of them presented significant risks to our business in general.
Flash floods and more widespread flooding occur regularly during the rainy season from November to April. Cities, especially Jakarta, are frequently subject to severe localized flooding which can result in major disruption, and occasionally fatalities. Jakarta experienced significant floods in February 2007 as did in Solo in Central Java in January. In January 2009, torrential rain caused a dam to burst outside Jakarta, flooding hundreds of homes in a densely populated neighborhood, resulting in the death of approximately 100 people. Landslides regularly occur in rural areas during the wet season.
There are numerous volcanoes in Indonesia, any of which can erupt without warning. In October and November 2010, Mount Merapi in Central Java erupted several times, killing an estimated 140 persons, displacing several hundred thousand others in a 20 km radius, causing billions of dollars of property damage and disrupting air travel. Since April 2008, Mount Soputan in North Sulawesi, Mount Egon in Flores Island, Nusa Tenggara, Mount Ibu in North Maluku and Anak Krakatau in the Sunda Strait have shown significant increased volcanic activity. Mount Sinabung, 60 km (40 miles) southwest of Sumatra's main city Medan, erupted on August 29, 2013 after lying dormant for 400 years, and erupted again in November 2013. Ash and acrid smoke from the volcano blanketed villages and crops.
In 2010, our submarine cables forming part of our backbone suffered damage due to a tsunami in West Sumatra and an earthquake in Sumbawa. These were repaired.
17
Table of Content
Although we have implemented a Business Continuity Plan (“BCP”)abusinesscontinuityplan and a Disaster Recovery Plan (“DRP”), andadisasterrecoveryplan,which we test these regularly, and we have insured certain of our assets to protect from any losses attributable to natural disasters or other phenomena beyond our control, there is no assurance that the insurance coverage will be sufficient to cover the potential losses, that the premium payable for these insurance policies upon renewal will not increase substantially in the future, or that natural disasters would not significantly disrupt our operations.
There are no assurancesWe cannot assure you that future geological or meteorological occurrencesnatural disasters will not have a significant impact on Indonesian andus, or Indonesia or its economy. A significant earthquake, other geological disturbance or weather-related natural disaster in any of Indonesia’s more populated cities and financial centers could severely disrupt the Indonesian economy and undermine investor confidence, thereby materially and adversely affecting our business, financial condition, results of operations and prospects.
Table of Content
Our operations may be adversely affected by an outbreak of an infectious disease, such as avian influenza, Influenza InfluenzaA(H1N1) virus or other epidemics
An outbreak of an infectious disease such as avian influenza, Influenza A (H1N1) virus or a similar epidemic, or the measures taken by the Governmentsgovernments of affected countries, including Indonesia, against such an outbreak, could severely disrupt the Indonesian and other economieseconomy and undermine investor confidence, thereby materially and adversely affecting our financial condition or results of operations and the market value of itsour securities. Moreover, our operations could be materially disrupted if our employees remained at home and away from our principal places of business for extended period of time, which would have a material and adverse effect on our financial condition or results of operations and the market value of itsour securities.
4.Other Risks
Indonesian Corporate Disclosure Standards differ in significant respects from those applicable in other countries, including the United States
As an IDX, NYSE and LSE listed company, we are subject to regulatory and exchange corporate governance and reporting requirements in multiple jurisdictions. There may be less publicly available information about Indonesian public companies, including us, than is regularly disclosed by public companies in countries with more mature securities markets. As a result, investors may not have access to the same level and type of disclosure as that available in other countries, and comparisons with other companies in other countries may not be possible in all respects.
Our financial results are reported herein in conformity with IFRS, however, we report our financial results to OJK (as the successor to Bapepam-LK)OJK in conformity with IFAS, which differs in certain significant respects from IFRS, and we distribute dividends based on profit for the year attributable to owners of the parent company and net income per share determined in reliance on IFAS
In accordance with the regulations of the OJK and the IDX,theIndonesia Stock Exchange ("IDX"), we are required to report our financial results to OJKtotheOJK in conformity with IFAS. We have provided to the OJK our financialfinancials result for the financial year ended December 31, 2013, on March6, 2014,2016, onMarch 6, 2017, which we furnished to the SEC on a Form 6-K dated March 19, 2014,datedMarch 8, 2017, which contains our audited Consolidated Financial Statements as of December 31, 2013 and for the year then ended December 31, 2016 and prepared in conformity with IFAS. IFAS differs in certain significant respects from IFRS and, as a result, there are differences between our financial results as reported under IFAS and IFRS, including profit for the year attributable to owners of the parent company and net income per share. We distribute dividends based on profit for the year attributable to owners of the parent company and net income per share determined in reliance on IFAS.
Using IFAS results,Based onIFAS financial statements, our profit for the year attributable to owners of the parent company would be Rp12,850Rp15,489 billion and Rp14,205for2015and Rp19,352 billion for 2012 and 2013,2016 and our net income per share would be Rp133.84Rp157.77for2015 and Rp147.42Rp196.19 for 2012 and 2013.2016. Dividends declared per share were Rp87.24Rp94.63for 2015. The dividend for 2012. The dividends declared per share for the year 2013 will2016will be decided at the 20142017 AGMS, scheduled for April 2014.forApril 21, 2017.
18
Table of Content
We are incorporatedwere established in Indonesia and it may not be possible for investors to effect service of process or enforce judgments, on us within the United States or to enforce judgments of a foreign court against us in Indonesia
We are a state-owned limited liability company incorporatedcompanyestablished in Indonesia, operating within the framework of Indonesian laws relating to Indonesianlawsgoverning companies with limited liability, and all of our significant assets are located in Indonesia. In addition, ourall ofour Commissioners and our Directors reside in Indonesia and a substantial portion of the assets of such persons are located outside the United States. As a result, it may be difficult for investors to effect service of process, or enforce judgments on us or such persons within the US,United States, or to enforce against us or such persons in the US,United States, judgments obtained in USUnited States courts.
We have been advised by Hadiputranto, Hadinoto & Partners, our Indonesian legal advisor, that judgments of USofUnited States courts, including judgments predicated upon the civil liability provisions of the UStheUnited States federal securities laws or the securities laws of any state within the US,theUnited States, are not enforceable in Indonesian courts, although such judgments could be admissible as non-conclusive evidence in a proceeding on the underlying claim in an Indonesian court. They have also advised that there is doubt as to whether Indonesian courts will enter judgments in original actions brought in Indonesian courts predicated solely upon the civil liability provisions of the UStheUnited States federal securities laws or the securities laws of any state within the US.theUnited States. As a result, the claimant would be required to pursue claims against us or such persons in Indonesian courts.
Our controlling shareholder’s interest may differ from those of our other shareholders
The Government has a controlling stake of53.1%of 52.09% of our issued and outstanding shares of common stock and the ability to determine the outcome of all actions requiring the approval of the shareholders.ofourshareholders. The Government also holds our one Series A Dwiwarna share,DwiwarnaShare, which has special voting rights and veto rights over certain matters, including the election and removal of our Directors and Commissioners. ItCommissioners.The Government may also use its powers as majorityasamajority shareholder or under the Dwiwarna shareShare to cause us to issue new shares, amend our Articles of Association or bring about actions to merge or dissolve us, increase or decrease our authorized capital or reduce our issued capital, or veto any of these actions. One or more of these may result in the delisting of our securities from certain exchanges. Further, throughexchanges.In addition, the MoCI, the Government exercises regulatory power overGovernmentregulates the Indonesian telecommunications industry.industry through the MoCI.
Table of Content
As of December 31, 2013,2016, the Government had a 14.3%14.29% equity stake in PT Indosat Tbk.Tbk ("Indosat"), which competecompetes with us in cellular services and fixed IDD telecommunications services, and competeswith Telkomselin cellular services.Theservices. The Government's stake includes the Series A Dwiwarna sharein Indosat alsoincludesa dwiwarnashare which has special voting rights and veto rights over certain strategic matters under Indosat's Articles of Association,Indosat'sarticles ofassociation, including decisions on dissolution, liquidation and bankruptcy, and also permits the Government to nominate one Directoronedirector to its Board of Directorsitsboard ofdirectors and one Commissioneronecommissioner to its Board of Commissioners. Thereitsboard ofcommissioners.As a result, there may thus be instances where the Government’s interests will conflict with ours. There is no assurance that the Government will not direct opportunities to Indosat or favor Indosat or any other telecommunication operator when exercising regulatory powerpowers over the Indonesian telecommunications industry. If the Government were to give priority to Indosat’s business overtothe businessof Indosat or any other telecommunication operatorover ours, or to expand its stake in Indosat or acquire a stake in any other telecommunication operator, our business, financial condition, and results of operations and prospects could be materially and adversely affected.
Forward-looking statements may not be accurate
This Annual Report incorporates forward-looking statements that include announcements regarding our current goals and projections of our operational performance and future business prospects. The words “believe”, “expect”, “anticipate”, “estimate”, “project” and similar words identify forward-looking statements. In addition, all statements, other than statements that contain historical facts, are forward-looking statements. While we believe that the expectations contained in these statements are reasonable, we cannot give an assurance that they will be realized. These forward-looking statements are subjected to a number of risks and uncertainties, including changes in the economic, social and political situation in Indonesia and other risks described inthis section "Risk Factors". All forward-looking statements, written or verbal, made by us or by persons on behalf of us are deemed to be subject to those risks.
B.Risks Related toto Our Business
1.Operational Risks
A material failure in the continuing operations of our network, certain key systems, gateways to our network or the networks of other network operators could adversely affect our business, financial condition, results of operations and prospects
We depend to a significant degree on the uninterrupted operation of our network to provide our services. For example, we depend on access to our fixed wireline network (“PSTN”) for the operation of our fixed line network and the termination and origination of cellular telephone calls to and from fixed line telephones, and a significant portion of our cellular and international long-distancelong distance call traffic is routed through the PSTN. We also depend on access to an internet and broadband network and a cellular network. Our integrated network includes a copper access network, fiber optic access network, BTSs, switching equipment, optical and radio transmission equipment, an IP core network, satellitesatellites and application servers.
19
Table of Content
In addition, we also rely on interconnection to the networks of other telecommunications operators to carry calls and data from our subscribers to the subscribers of operators both within Indonesia and overseas. We also depend on certain technologically sophisticated management information systems and other systems, such as our customer billing system, to enable us to conduct our operations. Our network, including our information systems, IT and infrastructure and the networks of other operators with whom our subscribers are interconnected, are vulnerable to damage or interruptions in operation from a variety of sources including earthquake, fire, flood, power loss, equipment failure, network software flaws, transmission cable disruption or similar events.
Although we have a comprehensive BCPimplemented abusinesscontinuityplan and DRP adisasterrecoveryplan,which we test and strive to improve,regularly, we cannot guarantee that the implementation of such plans will be completely or partially successful should any portion of networkofournetwork be severely damaged or interrupted. Any failure that results in an interruption of our operations or of the provision of any service, whether from operational disruption, natural disaster or otherwise, could adversely affect our business, financial condition, results of operations and prospects.
Table of Content
We may, in the future, be required to share our network infrastructure and capacity with our competitors
In November 2016, the Government announced its intention to amend certain regulations, as a result of which we may, in the future, be required to share our network infrastructure and capacity with our competitors. In particular, the draft revision to Government Regulation No.52/2000 on Telecommunications ("Draft Revision to GR No.52/2000") contemplates providing the Government with the authority to require telecommunication operators such as our Company to share network capacity with other telecommunication operators in Indonesia if there is available capacity. Draft Revision to GRNo.52/2000 may also require telecommunication operators such as our Company to share proprietary network transmission equipment when the Government deems this to be necessary in order to maintain market competition and network efficiency and sustainability.
In addition, the draft revision to Government Regulation No.53/2000 on the Utilization of Radio Frequency Spectrum and Satellite Orbit ("Draft Revision to GR No.53/2000") may be interpreted to require telecommunication operators such as our Company to share network with other telecommunication operators and service providers.
If these draft regulations are enacted by the Government in their current form, we would be required to share our network infrastructure and capacity with our competitors. This may allow our competitors to expand without significant capital expenditure outlay in areas where we currently operate. In addition, we cannot assure you that we will have sufficient network capacity to maintain our current business, product offerings and quality of service due to the additional traffic that we would need to service as a result of our competitors' access to our network. Our ability to service any increase in traffic within our network may consequently be limited, which may adversely affect our ability to increase our revenues through the expansion of our services.
Neither the Draft Revision to GR No.52/2000 nor the Draft Revision to GR No.53/2000 provide the details of the terms under which we may be required to share our network infrastructure and capacity with our competitors. We cannot assure you that the Government will adopt terms which we consider to be commercially reasonable. For example, we cannot assure you that any subsequent implementing regulations will allow us to charge competitors who lease our network capacity with fees at rates which we consider to be commercially acceptable.
If the Draft Revision to GR No.52/2000 and the Draft Revision to GR No.53/2000 are adopted, and the terms under which such proposed regulations are implemented are not commercially reasonable, it could have a material adverse effect on our business, financial condition, results of operations and prospects.
Our networks face both potential physical and cyber security threats, such as theft, vandalism and acts intended to disrupt our operations, which could adversely affect our operating results
Our networks and equipment, particularly our wireline access network, face both potential physical and cyber security threats. Physical threats include theft and vandalism of our equipment and organized attacks against key infrastructure intended to disrupt operations. In addition, telecommunications companies worldwide face increasing cyber security threats as businesses become increasingly dependent on telecommunications and computer networks and adopt cloud computing technologies. Cyber security threats include gaining unauthorized access to our systems or inserting computer viruses or malicious software in our systems to misappropriate consumer data and other sensitive information, corrupt our data or disrupt our operations. Unauthorized access may also be gained through traditional means such as the theft of laptop computers, portable data devices and mobiledevicesormobile phones and intelligence gathering on employees with access.
access to our systems.
Although we have not experienced any material successful cyber attacks to date that have affected our operations, our network and our website are frequently targeted by cyber attacks. A successful cyber attack may lead us to incur substantial costs to repair damagedamaged or restore data, implement substantial organizational changes and training to prevent future similar attacks and lost revenues and litigation costs due to misused sensitive information, and cause substantial reputational damage. We take preventive and remedial measures with respect to our systems, including enhanced cooperation with the police, particularly in areas prone to criminal activity and regular upgrades of our data security measures. However, there is no assurance that our physical and cyber security measures will be successful. Damage to our network, equipment or data and the need to repair such damage resulting from a physical or cyber attack may materially and adversely affect our business, financial condition and operating results. Our networks face potential security threats, such as theft or vandalism, which could adversely affect our operating results.
Table of Content
We face a number of risks relating to our internet-related services
In addition to cyber security threats, because we provide connections to the internet and host websites for customers and develop internet content and applications, we may be perceived as being associated with the content carried over our network or displayed on websites that we host. In addition, the content carried over our network or the websites that we host may contain materials or information which may be illegal, defamatory or infringe on third party copyrights. We cannot and do not screen all of this content and may face litigation claims due to a perceived association with thissuch content. These types of claims can be costly to defend, divert management resources and attention, and may damage our reputation.
A revenue leakage might occur due to internal weaknesses or external factors and if this happenedrisk were to materialize, it could have an adverse effect on our operating results
A revenue leakage is a generic risk for all telecommunications operators. We may face revenue leakage problems, or problems with collecting all the revenues to which we may be entitled, due to the possibility of weaknesses at the transactional level,delay in transaction processing, dishonest customers or other factors.
We have taken some preventive measures against thetakencertainpreventive measuresto mitigatethe possibility of revenue leakage by increasing control functions in all of our existing business process,processes, implementing revenue assurance methods, employing adequate policies and procedures as well as implementing information systems applications to minimize revenue leakages. Nonetheless, there is no assurance that in the future there will be no significant revenue leakages or that any such leakages will not have a material adverse affect on our operating results.
20
Table of Content
New technologies may adversely affect our ability to remain competitive
The telecommunications industry is characterized by rapid and significant changes in technology. We may face increasing competition due to technologies currently under development or which may be developed in the future. Future development or application of new or alternative technologies, services or standards could require significant changes to our business model, the development of new products, the provision of additional services and substantial new investments by us. New products and services may be expensive to develop and may result in the introduction of additional competitors into the marketplace. We cannot accurately predict how emerging and future technological changes will affect our operations or the competitiveness of our services. Furthermore, we cannot guarantee that we will be able to effectively integrate new technologies into our existing business model.
As part of ourcontinuingIn particular, the rapid development of ourTIMESnew technologies, new services and products, and new business wecontinue toseek to develop businesses through which wemodels has resulted in distinctions between local, long distance, wireless, cable and internet communication services being lessened and has brought new competitors into the telecommunications market.One of the main challenges faced by the telecommunications industry in Indonesia is the increasing use of Over The Top services that has become a substitute for voice and SMS services, in line with the growing number of smartphone users. This has happened not only in Indonesia, but also provide content to our telecommunications subscribers. We do not yet have substantial experience as a content provider therefore we cannot assure you that we will be able to effectively manage the growth of this business.
in developed countries where smartphone penetration is high.
We cannot assure you that our technologies will not become obsolete, or be subjected to competition from new technologies in the future, or that we will be able to acquire new technologies necessary to compete in changed circumstances on commercially acceptable terms. Our failure to react to rapid technological changes could adversely affect our business, financial condition, results of operations and prospects.
Our satellites have limited operational life they may be damaged or destroyed during in-orbit operation or suffer launch delays or failures. The loss or reduced performance of our satellites, whether caused by equipment failure or its license being revoked, may adversely affect our financial condition, results of operations and ability to provide certain services
OurWe operate three satellites, namely Telkom-1, Telkom-2 and Telkom-2Telkom-3S. All of the satellites that we operate have a limited operational lives, with their estimated operational life currently estimated to endending approximately in 20152021, 2020 and 2020, respectively. A2033, respectively.A number of factors affect the operational lives of satellites, including the quality of their construction, the durability of their systems, subsystems and component parts, on-board fuel reserves, accuracy of their launch into orbit, exposure to micrometeorite storms, or other natural events in space, collision with orbital debris, or the manner in which the satellite is monitored and operated. We currently use satellite transponder capacity on our satellites in connection with many aspects of our business, including direct leasing of such capacity and routing for our international long-distancelong distance and cellular services.
Table of Content
Moreover, International Telecommunication Union (“ITU”) regulations specify that a designated satellite slotsatelliteorbitalslot has been allocated for Indonesia and the Government has the right to determine which party is licensed to use such slot. While we currently hold a license to use the designated satellite slot,satelliteorbitalslot, in the eventeventany of our Telkom-1 and Telkom-2 satellites experience technical problems or failure, the Government may determine that we have failed to optimize the existing slot under our license, which may result in the Government withdrawing our license. We cannot assure you that we will be able to maintain use of the designated satellite slotsatelliteorbitalslot in a manner deemed satisfactory by the Government.
In anticipation of the growth in demand for satellite services and to support our business strategy with regard to providing TIMETIMES services, we signed a contract in 2009 for the procurement of the Telkom-3 Satellite System.Telkom-3satellite. However, due to a launch failure in August 2012, the Telkom-3 satellite ended up in an unusable orbit. Although we had fully insured the cost of the satellite, the loss of the Telkom-3 satellite will requireorbit, which led us to lease transponder capacity fromdevelop the Telkom-3S satellite which was launched in February 2017 and is currently undergoing in-orbit performance tests.We have entered into a third-party provider to fulfill our commitments to our satellite operations customers, with likely lower margins than we would have received from the use of Telkom-3 had it been successfully launched. We are currently in the initial phasescontract for the procurement oftheTelkom-4 satellite, which is currently planned for launchin the third quarter of 2018 as a replacement satellite, the Telkom-3S,which is currentlyplanned for launch in 2016.AlthoughfortheTelkom-1 satellite.Although the Telkom-1 satellite may still be operational for several years after the end of its currently estimated operational lifespanlife in 2015,2021, if there is any delay in the development and launch ofthe Telkom-3S,Telkom-4 satellite, or if the operational life of the Telkom-1 satellite ends before theTelkom-3S is successfullytheTelkom-4 satellite issuccessfully launched, or damage or failure renders our existing satellites unfit for use, we would need to lease additional transponder capacity from a third party, which would likely increase our costs of operations. Failure to lease adequate satellite capacity from a third-partythird party provider may also result in service interruptions and/or a cessation of our satellite operations. The termination of our satellite business could increase expenses associated with our provision of other telecommunications services, particularly in the eastern parts of Indonesia which currently rely largely on satellite coverage for telecommunications services and could adversely affect our business, financial condition and results of operations.
21
Table of Content
2.Financial Risks
We are exposed to interest rate risk
Our debt includes bank borrowings toborrowingsusedto finance our operations. Where appropriate, we seek to minimize our interest rate risk exposure by entering into interest rate swap contracts to swap floating interest rates for fixed interest rates over the duration of certain of borrowings. However, our hedging policy may not adequately cover our exposure to interest rate fluctuations and this may result in a large interest expense and an adverse effect on our business, financial condition and results of operations.
Changes in the economic situation in the United States, including improvement or expectations of improvement in the U.S. economy,theUnited Stateseconomy, may also have an impact on Southeast Asia and Indonesia. Expectations of the United States Federal Reserve tapering its bond buying program on an improving economy resulted in, among other things, the weakening of equity and bond markets around the world and a number of Asian currencies, including the Rupiah, since May 2013. In part, in an effort to support the Rupiah,particularly around May and in June 2013, Bank Indonesia began raising its benchmark reference rate from a record low of 5.75% which was set in February 2012. The benchmark reference rate has since risen fourrosesix times between June 2013 and November 2013 by an aggregate of 1,175 basis points2014 to 7.5%. The increase of Bank7.75% before decreasing to 7.50% in February 2015, 7.25% in January 2016, 7.00% in February 2016,6.75% in March 2016 and 6.50% in June 2016.The increases oftheBank Indonesia benchmark reference rate wasin 2013 and 2014 were followed by increases in the JIBOR and BankJakarta Interbank Offered Rate (“JIBOR”) andtheBank Indonesia Certificate (“SBI”) interest rates.It is uncertain howrates, and in 2016, decreases oftheBank Indonesia benchmark reference rate were followed by the global markets and the Rupiah may be affected as the United Stated Federal Reserve continues the tapering of its bond buying program.ThereJIBOR andtheSBI interestrate. There can be no assurance that any of the Bank Indonesia benchmark reference rate, JIBOR or SBI ratetheJIBOR ortheSBIinterestrates will not continue to rise again in the future.
We may not be able to successfully manage our foreign currency exchange risk
Changes in exchange rates have affected and may continue to affect our financial condition and results of operations. Most of our debt obligations are denominated in Indonesian Rupiah and a majority of our capital expenditures are denominated in USU.S. Dollars. Most of our revenues are denominated in Indonesian Rupiah and a portion is denominated in USU.S. Dollars (for example, from international services). We may also incur additional long-term indebtedness in currencies other than the Indonesian Rupiah, including the USU.S. Dollars, to finance further capital expenditures.
Overall, ourThe exchange rate of Indonesian Rupiah to the U.S. Dollar has been highly volatile in the past. Although we have a financial risk management program aims to minimize losses on the financial assets and financial liabilities arising from fluctuation of foreign currency exchange rates. We have a written policy for foreign currency risk management which mainly coversuses time deposits placements and hedging to cover foreign currency risk exposure for periods ranging from three up3 to twelve months.
The exchange rate of Rupiah weakened relative to the US Dollar in 2013, and in the future,12 months, we can give no assurance that we will be able to manage our exchange rate risk successfully or that our business, financial condition or results of operations will not be adversely affected by our exposure to exchange rate risk.
Table Of Content
We may be unable to fund the capital expenditures needed for us to remain competitive in the telecommunications industry in Indonesia
The delivery of telecommunications services is capital intensive. In order to be competitive, we must continually expand, modernize and update our telecommunications infrastructure technology, which involves substantial capital investment. For the years ended December 31, 2011, 20122014, 2015 and 2013,2016, our actual consolidated capital expenditures totaled Rp14,603Rp24,661 billion, Rp17,272Rp26,401 billion and Rp24,898Rp29,199 billion (US$2,0462,167 million), respectively. Our ability to fund capital expenditures in the future will depend on our future operating performance, which is subject to prevailing economic conditions, levels of interest rates and financial, business and other factors, many of which are beyond our control, and upon our ability to obtain additional external financing. We cannot assure you that additional financing will be available to us on commercially acceptable terms, or at all. In addition, we can only incur additional financing in compliance with the terms of our debt agreements. Accordingly, we cannot assure you that we will have sufficient capital resources to improve or expand our telecommunications infrastructure technology or update our other technologytechnologies to the extent necessary to remain competitive in the Indonesian telecommunications market. Our failure to do so could have a material adverse effect on our business, financial condition, results of operations and prospects.
22
Table of Content
3.Legal and Compliance Risks
If we are found liable for price fixing by the Indonesian Anti-Monopoly Committee and for class action allegations,anti-competitive practices, we may be subjectsubjected to substantial liability which could leadhave an adverse effect on our reputation, business, financial condition, results of operations and prospects
We are subject to a decrease in our revenuelaws and affect our business, reputationregulations relating to anti-competitive practices and profitabilityanti-monopoly.
On June 17, 2008, theCommission for the SupervisionLaw No.5 of 1999 on Prohibition of Monopolistic Practice and Unfair Business Competition ("KPPU"(the “Competition Law”) determined thatprohibits agreements and activities which amount to unfair business competition and an abuse of a dominant market position. Pursuant to the Competition Law, the KPPU was established as Indonesia’s antitrust regulator with the authority to enforce the provisions of the Competition Law.
In 2016, our Company, Telkomsel PT XL Axiata Tbk. (“XL”), PT Bakrie Telecom Tbk. (“Bakrie Telecom”), PT Mobile-8 Telecom Tbk. (“Mobile-8”) and PT Smart Telecom (“Smart Telecom”) had jointly breached Article 5 offive other local operators were found to have violated the Competition Law No.5/1999.forprice-fixing practices related to SMS services. We and Telkomsel appealedwere ordered to pay fines in the KPPU’s rulingamount of Rp18 billion and Rp25 billion, respectively.We cannot assure you that any new or existing governmental regulators will not, in the future, find our business practices to have an anti-competitive effect, nor can we assure you that we will not be found to have violated the Bandung District Courtrelevant laws and regulations relating to anti-competition and anti-monopoly in the South Jakarta District Court, respectively. On April 12, 2011, the Supreme Court ordered a consolidation of the appealsfuture.If we are found to have violated anylaws and appointed the Central Jakarta District Courtregulations relating to handle the appeals.Neither anti-competition and anti-monopoly,we nor Telkomsel has received any notification from the court with respect to the resolution of this case. See Item 8 “Financial Information – Consolidated Statements and Other Financial Information – Material Litigation”. If the District Court issues a verdict against our Company and/or Telkomsel, we couldmay be subjected to the paymentsubstantial liability such as payments of a fine,fines, the amount of which will be subject to the discretion of the District Court,courts, which could have ana material adverse effect on our reputation,business, reputationfinancial condition, results of operations and profitability.
Class action lawsuits were filed against Telkomsel and Indosat during 2007 and 2008 in the District Court of Bekasi, the Central Jakarta District Court and the Tangerang District Court, relating to Temasek Holdings (Private) Limited’s prior cross ownership of shares in Telkomsel and Indosat, alleging price fixing of telecommunications services. The plaintiffs withdrew the lawsuit filed with the District Court of Bekasi. On January 27, 2010, the court dismissed the class action filed with the Central Jakarta District Court on the basis that the plaintiffs did not establish their legal standing and that two members of the plaintiff class did not qualify as class representatives. On May 24, 2010, the court dismissed the class action filed with the Tangerang District Court on the basis that the plaintiffs failed to establish their legal standing as class representatives.
There can be no assurance that other subscribers, people, or partners will not file similar cases in the future. If a District Court in any new class action suit, issues a verdict in favor of such plaintiff, it could have an adverse effect on our business, reputation and profitability.
prospectsForward-looking statements may not be accurate.
This Annual Report incorporates forward-looking statements that include announcements regarding our current goals and projections of our operational performance and future business prospects. The words “believe”, “expect”, “anticipate”, “estimate”, “project” and similar words identify forward-looking statements. In addition, all statements, other than statements that contain historical facts, are forward-looking statements. While we believe that the expectations contained in these statements are reasonable, we cannot give an assurance that they will be realized. These forward-looking statements are subjected to a number of risks and uncertainties, including changes in the economic, social and political situation in Indonesia and other risks described in "Risk Factors". All forward-looking statements, written or verbal, made by us or by persons on behalf of us are deemed to be subject to those risks.
4.Regulation Risks
We operate in a legal and regulatory environment that is undergoing significant change. These changes may result in increased competition, which may result in reduced margins and operating revenue, among other things. These changes may also directly reduce our margins or reduce the costs of our competitors. These adverse changes resulting from regulation may have a material adverse effect on usus.
Reformation in IndonesianReform ofIndonesian telecommunications regulationregulations initiated by the Government in 1999has,1999 have, to a certain extent, resulted in the industry’s liberalization, including removal of barriers to entry and the promotion of competition. However, in recent years, the volume and complexity of regulatory changes has created an environment of considerable regulatory uncertainty. In addition, as the legal and regulatory environment of the Indonesian telecommunications sector continuescontinue to change, competitors, potentially with greater resources than us, may enter the Indonesian telecommunications sector and compete with us in providing telecommunications services. Furthermore, it is impossible to anticipate the regulatory policies that will be applied to new technologies.
We derive substantial revenue from interconnection services because we have the largest network in Indonesia and our competitors must pay tariffs to connect to our network. As regulated by the MoCI,although SMSinterconnection rates as a result of ITRB No.60/BRTI/III/2014 and No.125/BRTI/IV/2014 increasedfrom Rp23 to Rp24, effective April 2014, through December 31, 2015, SMS interconnection rates have decreasedbeen decreasing in recent years. The currentyears and may decrease again in the future. As a result, ourrevenue from interconnection servicesmay decrease in the future if SMS interconnection rates, effective in 2011, reduced ratesas regulated by an average of 1.5%the MoCI, continue to 3.0% compared to the previous rates effective in 2008. SeeItem 4 “Information on the Company – Distribution and Marketing Strategy – Legal Basis and Regulation – Interconnection”.
23
Table of Content
The termination of Telkomsel’s premium SMS services from October 2011 as a result of MoCI Regulation No.1/PER/M.KOMINFO/01/2009 resulted in a substantial reduction in our revenues from these services.These serviceshave been resumed by Telkomsel from August 6, 2013 as allowed underMoCI Regulation No.21 yearof2013 dated July 26, 2013, regarding the Operation of Content Provider Services on Mobile Cellular Network and Local Fixed Wireless Network with Limited Mobility, which replaced MoCI Regulation No.1/PER/M.KOMINFO/01/2009. However,pursuant to the new decree, premium SMS service providers are required to meet stricter requirements that are more difficult to comply with. Accordingly we do not expect revenues from premium SMS services to return to levels seen prior to October 2011.
In the future, the Government may announce or implement other regulatory changes which may adversely affect our business or our existing licenses. We cannot assure you that we will be able to compete successfully with other domestic andor foreign telecommunications operators, that regulatory changes will not disproportionately reduce our competitors’ costs or disproportionately reduce our revenues, or that regulatory changes, amendments or interpretations of current or future laws and regulations promulgated by the Government will not have a material adverse effect on our business and operating results.
The entry of additional Indonesian telecommunications operators as providers of international direct dialing services could adversely affect our international telecommunications services operating margins, market share and results of operations
We obtained a license and entered the international long-distance service market in 2004, and acquired a significant market share for IDD services by the end of 2006. Indosat, one of our primary competitors, entered this market prior to us and continues to maintain a substantial market share for IDD services. Bakrie Telecom was awarded an IDD license in 2009 to provide international long distance service using the “009” access code.There is a possibility that other operators will be granted IDD licenses in the future. The operations of incumbents and the entrance of new operators into the international long-distance market, including the VoIP services provided by such operators, continue to pose a significant competitive threat to us. We cannot assure you that such adverse effects will not continue or that such increased competition will not continue to erode our market share or adversely affect our fixed telecommunications services operating margins and results of operations.
We face risks related to the opening of new long distance access codes
In an attempt to liberalize DLD services, the Government issued regulations assigning each provider of DLD services a three-digit access code to be dialed by customers making DLD calls. In 2005, the MoCI announced that three-digit access codes for DLD calls will be implemented gradually within five years and that it would assign us the “017” DLD access code for five major cities, including Jakarta, and allow us to progressively extend it to all other area codes. Indosat was assigned “011” as its DLD access code. We were required to open DLD access codes in all remaining areas on September 27, 2011, by which date our network was ready to be opened up to the three-digit DLD access codes in all coded areas throughout Indonesia.
However, we believe that the cost for operators who have not upgraded their network infrastructure to open their networks to the three-digit access codes to do so is significant. To date, neither of the OLOs have made a request to us to connect their networks to enable their DLD access codes to be accessible, other than with respect to Balikpapan, and as such, we believe that except with respect to Balikpapan, none of the DLD access codes for any of the licensed operators are usable by customers of other operators. However, if they do so in the future, the implementation of any new DLD access codes can potentially increase competition by offering our subscribers more options for DLD services. In addition, the opening of new DLD access codes is expected to result in increased competition and less cooperation among industry incumbents, which may result in reduced margins and revenues, among other things, all of which may have a material adverse effect on us.
New regulationsRegulations for the configuration of BTS towers may delay the set up of new BTS towers or changes in the placement of existing towers, and may erode our leadership position by requiring us to share our towers with our competitors
In 2008 and 2009, the Government issued regulations relating to the construction, utilization and sharing of BTS towers. Pursuant to the regulations, the construction of BTS towers requires permits from the local government. The local government has a right to determine the placementlocation of the towers the location in which the towers can be constructed, and also to determine athe license fees to build tower infrastructure. These regulations also obligate us to allow other telecommunication operators to lease space and utilize our telecommunications towers without any discrimination.
24
Table of Content
These regulations may adversely affect us in the allocation, development or expansion plan of our new BTS towers as setting up of our new towers will become more complicated. They may also adversely affect our existing BTS towers if local governments requiredrequire any changes in the placement of the existing towers.
The requirement that we shareIn addition, these regulations require us to allow other telecommunication operators to lease space on and utilize our cellular (Telkomsel)telecommunications towers in a manner that provides equal opportunity to and our fixed wireless (Telkom Flexi) towers may also disadvantage us by requiring that we allowwithout any discrimination among such other telecommunication operators. This allows our competitors to expand their networks by leasing space on and utilizing our telecommunications towers without having to expend capital expenditures to build their own telecommunications towers. As a result, our competitors may be able to expand their network quickly and grow their business quickly, particularly in urban areas where new space for additional towers may be difficult to obtain.
Effective 2011,In order to operate our telecommunications towers, Indonesian regulations allow local Governmentsgovernments to impose fees which are permitteddetermined on a cost basis subject to assess feesa formula provided by the Ministry of up to 2.0%Finance and the location of the tax assessed value oftelecommunications towers. AlthoughMost local governments have yet to begin to impose such fees and we docannot assure you that such fees will not expectbe material in the future. In addition, we cannot assure you that there will be no material difference in the amount of fees that we would be liable to pay to the relevant local governments. If these feesrisks were to be material in 2013, there can be no assurance that they will not be substantial in the future.
materialize, it could have an adverse effect on our operating results.
5.Risks Related to Ourour Fixed and Cellular Telecommunication Business
We may further lose wireline telephone subscribers and revenues derived from our wireline voice services may continue to decline, which may materially adversely affect our results of operations, financial condition and prospects
Revenues derived from our wireline voice services continued to declinehave declined during the past several years mainly due to the increasing popularity of mobile voice services and other alternative means of communication, such as VoIP.communication. Tariffs for mobile services have declined in recent years which has further accelerated substitution of mobile for wireline voice services. While the number of our fixed wireline subscribers increased by 4.0% at the end of 20126.0%in2015 and by 4.5% at the end of 2013,3.8% in 2016, revenues from our wireline voice services decreased by 8.2%3.2% in 2012 and by 8.3%2015and2.2% in 2013.2016. The percentage of revenues derived from our wireline voice services out of our total revenues continued to decrease from 12.2%revenueswas7.5% in 2012 to 10.4%2015and 6.5% in 2013.2016.
WeSince the beginning of 2015, we have been takingtaken various measures in ordersteps to stabilize our revenues from wireline voice services byseeking tomigrate subscribers to IndiHome,a service which bundlesbroadband internet, fixed wireline phone and interactive TV services. However, we cannot assure you that we will be successful in mitigating the adverse impact of the substitution of mobile voice services and other alternative means of communication for wireline voice services or in reducing the rate of decline in our revenues generated from wireline voice services. Migration from wireline voice services to mobile services and other alternative means of communication may further intensify in the future, which may affect the financial performance of our wireline voice services and thus materially and adversely affect our results of operations, financial condition and prospects as a whole.
Our fixed wireless business is in decline and this decline is likely to continue
Due to competition and the increasing popularity of mobile cellular platforms, our fixed wireless revenues and ARPU has been declining in recent years.
While fixed wireless tariffs historically were generally lower than GSM mobile cellular tariffs, in part due to regulatory changes in December 2010 in how right-of-use fees are calculated, tariff differences between fixed wireless services and GSM mobile cellular services are now generally negligible. In addition, there is limited frequency bandwidth of 5 MHz available for our fixed wireless platform, and the GSM platform is generally able to make more efficient use of frequency bandwidth. As a result, in 2013, we did not further develop our fixed wireless network (other than optimize existing BTSs for our fixed wireless network), and did not conduct any new product launches or promotional campaigns activities for this service. We do not plan to further develop our fixed wireless network in any significant way in the future.
As a result of above factors, and as we also undertook an exercise to remove inactive Telkom Flexi subscribers in late 2013 so that they are no longer recorded on our system as connections in service, the number of our fixed wireless connections in service declined sharply in 2013, from approximately 14.2 million as of December 31, 2011 and 17.9 million as of December 31, 2012 to 6.8 million as of December 31, 2013.
Our fixed wireless business has also seen lower average tariffs due to intense competition from the cellular market which has led to declining ARPU for Telkom Flexi, with blended monthly prepaid and postpaid ARPU decreasing from approximately Rp9,500 in 2011 to Rp8,700 in 2012 and Rp8,400 in 2013. As a result of the above factors, revenue from our fixed wireless revenue has declined, from Rp1,342 billion as of December 31, 2011 to Rp1,225 billion as of December 31, 2012 and Rp1,051 billion as of December 31, 2013. We expect that this declining trend will continue.
25
Table of Content
We plan to undertake a strategy to migrate our fixed wireless customers to our mobile cellular platform by offering promotional packages. However, we cannot assure you that we will be successful in this migration, as competition from other mobile cellular providers is intense. If we are not able to successfully migrate our fixed wireless users to our mobile cellular platform as and when they decide to migrate to another platform, it may adversely affect our results of operations, financial condition and prospects as a whole.
Our data and internet services are facing increasing competition, and we may experience declining margins and/or market share from such services as such competition intensifies
Our data and internet services are facing increaseincreased competition from other data and internet operators as well asoperatorsincludingas mobile operators.
Wireless broadband access operators that received licenses in 2009 for Wi-Max technology began to establish their businesses in the fourth quarter of 2010 (for instance First Media) and in 2012 (Berca). In 2013, the regulator has permitted the Wi-Max operators to deploy theLongTermEvolution (“LTE”) technology. This will adversely affect our market share and revenues from our Speedy broadband service. The number of mobile broadband mobile subscribers have increased with the Blackberry’s popularity. The increasing usetheincreasing popularity of mobile broadband services alsosmart phones in Indonesia, which adversely affects our market share and revenues from our fixed line data and internet services.
Table of Content
In addition,with theincreasing popularity of smart phones in Indonesia, we expect that 4G LTE services will increasingly become an intense area of competition for data and internet services, as well as cellular services.In 2014, the Government issued licenses for 4G/LTE services on the900 MHz frequency for cellular operators and in 2015 issued a policyto refarmthe 1800 MHzfrequencyfor4G/LTE services. Our4G/LTE services covered 169 citiesin Indonesiaas of December 31,2016. However,as of such date,anumberof our cellular competitorsprovide4G/LTE coverage in more cities than us.Furthermore,in 2013, the regulator permitted Wi-Max operators to deploy4G/LTE technologywhich have further intensified competition in the broadband internet space. Currently,PTFirst Media Tbk (“First Media”), which is part of the Lippo Group, provides Wi-Max 4G/LTE services in the Greater Jakarta area.
We have been taking various measures in order to mitigate the impact of intense competition in our data and internet businesses. However, we cannot assure you that we will be successful in mitigating such adverse impact. Competition may further intensify in the future, which may affect the financial performance of our data and internet services and thus materially and adversely affect our results of operations, financial condition and prospects as a whole.
6.Competition Risks Related to Our Cellular Business (Telkomsel)
Competition from existing cellular service providers and new market entrants may adversely affect our cellular services business
The Indonesian cellular services business is highly competitive. Competition among cellular services providers in Indonesia is based on various factors, including pricing, network quality and coverage, the range of services, features offered and customer service. Ourservice.With theincreasing popularity of smart phones in Indonesia, we believe that data network quality and coverage, including 4G/LTE coverage, will increasingly become an intense area of competition.Our cellular services business, operated through our majority-owned subsidiary, Telkomsel, competes primarily againstprimarilywith Indosat and XL.XL Axiata. Several other smaller GSM and CDMA operators also provide cellular services in Indonesia, including PT Hutchison CP TelecommunicationsHutchison3 Indonesia (“Hutchison”), which is part of the Hutchison Asia Telecom Group and operates under the "3" or "Tri" brand, and PT Natrindo Telepon Seluler (“Natrindo” or “AXIS”Smartfren Telecom Tbk ("Smartfren Telecom"), Smart Telecom and Bakrie Telecom.which is part of the Sinar Mas Group. In addition to current cellular service providers, the MoCI may license additional cellular service providers in the future, and such new entrants may compete with us.
In March 2010, Smart Telecom and Mobile-8 announced the signing of a cooperation agreement to use the same logo and brand under the brand name "Smartfren".On January 18, 2011, Mobile-8 acquired a significant number of shares in Smart Telecom, and on April 12, 2011 PT Mobile-8 Telecom Tbk. changed its name to PT Smartfren Telecom Tbk.In subsequent developments, XL has plans forXLAxiatacompleted the acquisition of Natrindo (Axis).On September 29, 2013, XL-Axiata has signed a CSPA withmajority interest inand merged withPT Axis for the acquisition of Axis’ shareholders.The strategic acquisition will positionTelekom in 2014, which resulted in XL as the second largest operator while alsoAxiata acquiring additional frequency allocations toprovide4G/LTEservices as well as acquiring the customers of PT Axis Telekom.
Additional consolidation among cellular services providersmay occur which may be driven by competitive factors as well as efforts to facilitate the roadmap to LTE (4G) technology. Further operator consolidation is likely in order to ensure that each operator can remain competitive, reduce operationaloperating costs and also to“rebalance”obtainwiderspectrum allocation.In addition, we believe that it is the broadband mobile frequency spectrum that require wider frequency bandwidth. Thepolicy of the MoCI also supports operatorto support industry consolidation as it has been reluctant in recent years to issueby not issuing additional or new licenses forforcellular services providers.
If Telkomsel's competitors are able to acquire wider spectrum allocation, this may allow them to improve the quality of their cellular players.
While operatorservices as well as to expand the amount of traffic that they can service through their network, which may allow them to expand their services and increase revenues. In addition, the consolidation of Telkomsel's competitors may leadallow them to improved conditions inexpand the geographic coverage of their integrated network infrastructure. As a result, consolidation among cellular telecommunication industry, it alsoservices providers may present challenges for Telkomsel in maintaining its market position.position and could adversely affect our results of operations, financial condition andprospects.
Cellular network congestion and limited spectrum availability could limit our cellular subscriber growth and cause reductions in our cellular service quality
We expect to continue to offer promotional plans to attract subscribers and increase usage of our network by our cellular subscribers. We also expect to continue to promote our data services and fixed broadband services. While we believe that we currently have sufficient spectrum allocation to support our current business, we will need to acquire additional spectrum allocation to accommodate future growth in subscribers and traffic. As a result, we may experience increased network congestion, which may affect our network performance and damage our reputation with our subscribers. The Government occasionally conducts auctions for unused spectrum allocation. Recently, the MoCI has announced plans to hold a limited auction of unused radio frequency spectrum in the 2100 MHz and 2300 MHz frequencies by the middle of 2017. We cannot assure you that we will be succesful in acquiring any additional spectrum allocation whether in current or future auctions.
26
Table of Content
Moreover, the recent increase of smartphone applications that rely on data services has resulted in the significant amount of data traffic and cellular network congestion. To support such additional demands on our network, we may be required to make significant capital expenditures to improve our network coverage.Such additional capital expenditures, together with the possible degradation of our cellular services, couldmaterially andadversely affect our competitive position, results of operations, financial condition andprospects.
7.Risks Related to Development of New Businesses
We may not succeed in our efforts to develop new businesses
We believe that efforts to develop new businesses other than ourthe telecommunication businessbusinesssuch as consumer digital and enterprise digital businesses, as well as international expansion are necessary to ensure continuing business growth. We plan to undertake these activities through our subsidiaries, Metra and TII. Risks related to new business development include competition from established players, suitability of business model,competition from disruptive new technologies or business models,the need to acquire new expertisein the new areas of operation, and risks related to online media (such as risks relating towhich include intellectual property, consumer protection and confidentiality of customer data).
data.
Focusing on international expansionis one of our strategic business intiatives.initiatives. In particular,we have already started expansion into seven countries,a number of jurisdictions in telecommunications or data related areas, namely Singapore, Hong Kong-Macau,Kong,Macau, Timor Leste, Australia, Myanmar, Malaysia, Taiwan, and United States of Americathrough our subsidiary, TII.Expandingand Saudi Arabia. Expanding our operations internationally exposes us to a number of risks associated with operating in new jurisdictionsforjurisdictions,for example, our international operations could be adversely affected by political or social instability and unrest, by regulatory changes, such as an increase in taxes applicable to ouroperations, macroeconomic instability, limitations on or controls on the foreign exchange trade, competition from local operators, difference in consumer preferencespreference and a lack of expertise in the local markets in which we will be operation.operate. Any of these factors could cause our expected returns from our expansion to be limited and could have a material and adverse effect on our business, results of operations and financial condition.
ITEM 4.INFORMATION4. INFORMATION ON THE COMPANY
A.HISTORY AND DEVELOPMENT OF THE COMPANY
Profile of Telkom Indonesia
We arecontinue to seek to innovate and develop synergies among all of our products, services and solutions. Our long-term vision, which was revised inSeptember 2016to reflect our aspirations to be a limited liability company incorporated under the laws of Indonesia and domiciled in Bandung. We trade under the legal name “Perusahaan Perseroan (Persero) PT Telekomunikasi Indonesia Tbk” and with the commercial name “Telkom”. We were converted from a state agency to a State-Owned Enterprise on September 24, 1991 and obtained status as a legal entity on November 19, 1991 for an indefinite period of time. Our registered office is located at Jl. Japati No.1, Bandung 40133, Indonesia, and our telephone number is +(62) (21) 521 5109. Our agent for service of processmore significant player in the United States with respectdigital space, is to “Be the King of Digital in the Region”. Our mission is to “Lead Indonesian Digital Innovation and Globalization”.
In order to achieve such vision and mission, we are currently undergoing a comprehensive transformation in five aspects of our ADSs is Puglisi & Associate at 850 Library Avenue, Suite 204, Newark, DE, 19711. Our corporate website may be accessed at www.telkom.co.id. business: human resources transformation, business transformation, structural transformation, cultural transformation, and infrastructure and system transformation.
Company Name | : | Perusahaan Perseroan (Persero) PT Telekomunikasi Indonesia Tbk | |
Abbreviated Name | : | PT Telkom Indonesia (Persero) Tbk | |
Commercial Name | : | Telkom | |
Line of Business | : | Telecommunications and network services | |
Tax Identification Number | : | 01.000.013.1-093.000 | |
Certificate of Company Registration | : | 101116407740 | |
Business License | : | 510/3-0689/2013/7985-BPPT | |
Domicile | : | Bandung, West Java | |
Address | : | Jl. Japati No. 1, Bandung 40133, Indonesia | |
Telephone | : | +62-22-4521404 | |
Facsimile | : | +62-22-7206757 | |
Call Center | : | +62-21-147 | |
Website | : | www.telkom.co.id The information found on our corporate website does not form part of this Form 20-F and is not incorporated by reference herein | |
E-mail | : | corporate_comm@telkom.co.id; investor@telkom.co.id | |
Rating | : | “idAAA” by Pefindo for 2013, 2014,2015 and 2016 | |
Date of Legal Establishment | : | November 19, 1991 | |
Table of this Form 20-F and is not incorporated by reference herein.Content
Legal Basis of Establishment | : | Based on Government Regulation No. 25 of 1991, the status of our Company was converted into a state-owned limited liability corporation ("Persero"), based on the Notarial Deed of Imas Fatimah, S.H. No.128 dated September 24, 1991, as approved by the Ministry of Justice of the Republic of Indonesia by virtue of Decision Letter No. C2-6870.HT.01.01.Th.1991 dated November 19, 1991 and as announced in the State Gazette of the Republic of Indonesia No. 5 dated January 17, 1992, Supplement to the State Gazette No.210 | |
Ownership | : | -Government of the Republic of Indonesia –52.09% -Public– 47.91% | - |
Listing on Stock Exchanges | : | Our shares of common stock were listed on the IDX and the New York Stock Exchange ("NYSE") on November 14, 1995 | |
Stock Codes | : | -“TLKM” on the “IDX” -“TLK” on the “NYSE” | - |
Authorized Capital | : | 1 Dwiwarna Share and 399,999,999,999 shares of common stock | |
Issued and Fully Paid Capital | : | 1 Dwiwarna Share and 100,799,996,399 shares of common stock | |
Offices | : | -1 Head Office -7 Telkom Regional Offices and59 Telecommunication Areas | - |
Service Centers | : | -566 Plasa Telkom outlets -7 International GraPARI centers across Saudi Arabia, Singapore,Hong Kong, Macau, Taiwan andMalaysia -416 GraPARI centers (including those managed by third parties) -487 GraPARI mobile Units | - |
Other Information | : | -Public Accountant KAP Purwantono, Sungkoro & Surja (a member firm of Ernst & Young Global Limited) Indonesia Stock Exchange Building, Tower 2, 7th Floor,Jl. Jend. Sudirman Kav. 52-53,Jakarta 12190, Indonesia -Securities Administration Bureau PT Datindo Entrycom Wisma Sudirman,Jl. Jend. Sudirman Kav. 34-35,Jakarta 10220, Indonesia -Trustee PT Bank CIMB Niaga Tbk Graha Niaga,20th Floor,Jl. Jend. Sudirman Kav. 58, Jakarta 12190, Indonesia PT Bank Permata Tbk Gedung WTC II, 28th Floor,Jl. Jend Sudirman Kav. 29-31, Jakarta 12920, Indonesia -Custodian PT Kustodian Sentral Efek Indonesia Indonesia Stock Exchange Building, Tower 1, 5th Floor,Jl. Jend. Sudirman Kav. 52-53,Jakarta 12190, Indonesia -Rating Agency PT Pemeringkat Efek Indonesia Panin Tower Senayan City, 17th Floor,Jl. Asia Afrika Lot. 19, Jakarta 10270 -ADR Depositary The Bank of New York Mellon Corporation 101 Barclay Street,NY, USA– 10286 -Authorized Agent for Service of Process in the United States Puglisi and Associates 850 Library Ave # 204, Newark, DE 19711,USA | - |
Employee Union | : | The Telkom Employees Union (Serikat Karyawan Telkom or "SEKAR") | |
Information about the legislation under which we operate is provided elsewhere in this Form 20-F. Aand a description, including the amount invested, of our principal capital expenditures and divestitures (including interests in other companies), since the beginning of our last three financial years, and information concerning our principal capital expenditures is contained elsewhere in this Form 20-F.
A description of our principal capital expenditures and divestitures, since the beginning of the last three financial years to the date of this Annual Report is set forth in Item 5 “Operating and Financial Review and Prospects – Liquidity – Capital Expenditures”. Information concerning our principal capital expenditures and divestitures currently in progress is also described in Item 5 “Operating and Financial Review and Prospects – Liquidity – Capital Expenditures”.
We are a State-Owned Enterprise that operates in the telecommunications and network services sector in Indonesia. Our history and certain information required by Item 4 of Form 20-F is as follows:
History of Telkom
1856-1882
On October 23, 1856, the Dutch colonial government deployed the first electromagnetic telegraph in Indonesia, connecting Batavia (Jakarta) with Buitenzorg (Bogor).
1906-1965
The Dutch colonial government established a government agency to operate post and telecommunications services in Indonesia. In 1965, the post and telecommunications services were separated and brought under the control of two state companies, PN Pos and Giro and PN Telekomunikasi.
1974
PN Telekomunikasi was split into two divisions, PT Industri Telekomunikasi Indonesia (“PT INTI”), which manufactured telecommunications equipment, and Perusahaan Umum Telekomunikasi (“Perumtel”), which supplied domestic and international telecommunication services.
27
Table of Content
Telkom Indonesia Milestones
19801856-1884
TheOn October 23, 1856, the DutchColonialGovernment deployed the first electromagnetic telegraph service operation in Indonesia, which connected Jakarta (Batavia) and Bogor (Buitenzorg). We consider this event to be part of the beginning of Telkom’s history and have thus adopted October 23 as the anniversary of our “founding”.
In 1884, the DutchColonialGovernment established a private entity, "Post en Telegraafdienst" to provide postal and telegraph services.
1906-1965
In 1906, the Dutch Colonial Government established a government agency named Jawatan Pos, Telegrap dan Telepon (Post, Telegraph en Telephone Dienst) to assume control over postal services and telecommunications in Indonesia. In 1961, its status was changed to newly-established state-owned company, Perusahaan Negara Pos dan Telekomunikasi ("PN Postel"). In 1965, the Government separated postal and telecommunications services by dividing PN Postel into Perusahaan Negara Pos dan Giro and Perusahaan Negara Telekomunikasi ("PN Telekomunikasi").
1974
PN Telekomunikasi was turned into Perusahaan Umum Telekomunikasi Indonesia ("Perumtel"), which provided domestic and international telecommunication business was taken over by Indosat.
telecommunications services, and subsequently spun-off PT Industri Telekomunikasi Indonesia, which manufactured telecommunications equipment, into an independent company.
1991
Perumtel becamewas transformed into a state-owned limited liability company and renamed Perusahaan Perseroan (Persero) PT Telekomunikasi Indonesia or Telkom, andunder Government Regulation No.25 of 1991. Our business operations were organizedthen divided into twelve regional units (“Witel”). These12 telecommunication regions, which were later reorganized in 1995 into seven regional divisions:Regional Divisions, namely Regional Division I Sumatra, Regional Division II Jakarta and Surrounding Area,the surrounding areas, Regional Division III West Java, Regional Division IV Central Java and DI Yogyakarta, Regional Division V East Java, Regional Division VI Kalimantan, and Regional Division VII Eastern Indonesia.
1995
We held our Initial Public OfferingOn May 26, 1995, we and Indosat established Telkomsel. Wethenconductedour initial public offering on November 14, 1995, with our shares listed on the Jakarta Stock Exchange and the Surabaya Stock Exchange (which have since merged to become the IDX). Our shares were also listed on the NYSE and the LSE in the form of ADSs, and were publicly offered without listing on the Tokyo Stock Exchange. On May 26, 1995, we established Telkomsel, our cellular business subsidiary.
1999
TheLaw No.36 of 1999 on Telecommunications Law (Law No. 36/1999)(the "Telecommunications Law"), which went into effectbecame effective in September 2000, facilitatedwas enacted to allow the entry of new players, intensifying themarket participants in order to foster competition in the telecommunications industry. industry.
We launched the Telkom-1 satellite.
2001
We and Indosat eliminated joint ownership and cross-ownership in certain companies as part of the restructuring of the telecommunications industry in Indonesia. We acquired Indosat’s 35% shareholdingsIndosat's 35.0% shareholding in Telkomsel, making us the majority shareholder with a stake ofincreasing our shareholding to 77.7%. Indosat then took overWe divested our 22.5% shareholding in PT Satelit Palapa Indonesia, or Satelindo, and 37.7% shareshareholding in PT Aplikanusa Lintasarta.Lintasarta Aplikanusa. At the same time, we lost our exclusive right to berights as the sole operator of fixed line telephone operatorservices in Indonesia.
Table of Content
2002
We divested 12.7% ofa 12.72% shareholding in Telkomsel toSingapore Telecom Mobile Pte Ltd (“SingTel Mobile”), and decreasing our sharesshareholding in Telkomsel to Singapore Telecom Mobile Pte Ltd. (“SingTel Mobile”)65.0%.
2004
We launched ouran international direct dialdialing service for fixed line service.
lines with the access codeof007.
2005
TheWe launched the Telkom-2 Satellite was launched to replace all satellite transmission services previously provided by the Palapa B-4 satellite. This brought our total number of satellites launched to eight, including the Palapa A-1 satellite.
2009
We underwent a transformation from an infocom toinformation telecommunication company tobecome a TIMETelecommunication, Information, Media and Edutainment ("TIME") company. TheOur new Telkomimage was introduced to the public with thea new corporate logo and tagline, “thethe slogan of "the world in your hand”hand".
2010
TheWe completed the JaKaLaDeMa submarine and fiber optic cable project linkingin April 2010 which connected Java, Kalimantan, Sulawesi, Denpasar and Mataram was successfully completed in April 2010.
Mataram.
2011
We commenced the reformreformation of our telecommunications infrastructure through the completion ofthe Telkom Nusantara Super Highway project, which unites the Indonesian archipelago from Sumatra to Papua, andas well as the True Broadband Access project which will enableto provide internet access with a capacity of 20 Mbps to 100 Mbps to customers all over Indonesia to have broadband access to the internet.
throughout Indonesia.
2012
We sought to achieve widespreadincreased broadband penetration throughout Indonesia through the implementation of the Indonesia Wi-Fi program towards the development of Indonesia Wi-Fi as part of our “Indonesia Digital Network.
Network” (IDN) program. We sought to improve business value creation by reconfiguringreconfigured our business portfoliosportfolio from TIME to TIMES (Telecommunications,(Telecommunication, Information, Media, Edutainment &and Services).
Establishment of Telkom Corporate University to develop a globally competitive human capital (“from competence to commerce”).
increase business value creation.
20132014
Wecommenced operationsinsevencountries, namelyHong Kong-Macau, Timor Leste, Australia, Myanmar, Malaysia,Taiwan andUnited StatesWe becamethe first operator in Indonesia to commercially launch 4G/LTEservices in December 2014.
2015
We launchedIndiHome,which bundles in all-in-one packages services consisting primarily of America. broadband internet, fixed wireline phone and interactive TV services.
2016
We completed the construction of our new headquarters in Jakarta which we designed as a “smart office” with open office layout and smart building features in order to provide an inspiring working environment for our employees.
2017
We launched the Telkom-3S satellite, which is currently undergoing in-orbit performance tests, to replace the Telkom-2 satellite.
28
Table of Content
B. BUSINESSOVERVIEW
VISION AND MISSION
Our vision and mission is stated in our long-term plans,which were approved by the Board of Commissioners onSeptember 23, 2016.
Vision: Be the King of Digital in the Region
Mission: Lead Indonesian Digital Innovation and Globalization
Pursuant to the long-term plans established by our Board of Commissioners, we arecurrently transforming our Company to become a digital telecommunications company to meet our vision of becoming the "King of Digital in the Region", with a view to becoming one of the ten largest telecommunications companies by market capitalization acrossSoutheast Asia, East Asia, South Asia, Australia and New Zealand. Through such development, we aimto lead digital innovation in Indonesia and to lead Indonesia towards globalization.
In order to realize such vision, we aim to continue to digitize every part of our business by implementing a digital culture across our business processes. Implementation of a digital culture involves the elimination of manual processes in order to adapt to developments in digital business and the creation of a strong digital platform for our products and services. We also aim to improve customer experienceand to implement business processes which facilitate faster product development, delivery and time-to-market, as well as efficient allocation of resources.
Corporate Strategy
Our corporate strategy comprises the following:
1.Directional Strategy
Our Directional Strategy is a competitive growth strategy to support and increase the market capitalization of our shares. In a dynamic industrial environment, we seek to realize competitive growth by delivering added value in the products and services that we offer to our customers, leveraging the scale of our businesses in order to realize synergies and focusing on creating digital ecosystems for our products and services.
2.Portfolio Strategy
Our Portfolio Strategy is our strategy for the development of our digital TIMES portfolio in order to synergistically provide seamless services focused on providing value to our customers.
3.Parenting Strategy
In order to generate effective business growth, we aim to continue to exercise strategic control over our subsidiaries, which we organize into customer facing units and functional units,in order to streamline processes across our business units.For more information about our parenting strategy, see “— C. Organizational Structure”.
Business PortfolioPortfolios
We organize our business under our digital TIMES portfolio in order to focus on creating customer value. Beginning January 1, 2016, we reorganized our 15 previous portfolios (consisting of nine product portfolios and six customer portfolios), into six product portfolios, each of which is discussed in detail below. Our six revised product portfolios are a State-Owned Enterprisecategorized under three lines of business, namely "Telecommunications Business", "Information Business" and currently the largest telecommunication service"Media and network provider in Indonesia. We serve millionsEdutainment Business".
Table of customers throughout Indonesia with a complete range of telecommunications services that include fixedwireline and fixed wireless telephone connections, cellularservices, network and interconnectionContent
Our "Telecommunications Business” operates four product portfolios, namely:
·mobile portfolio, which comprises mobile broadband services as well as internetmobile legacy services including mobile voice and data communicationSMS;
·fixedportfolio, which comprises fixedvoice and fixedbroadbandservices;
·wholesale and internationalportfolio, which comprises wholesale telecommunication services, which include our interconnection business, and ourinternationalbusiness; and
·networkinfrastructureportfolio, which comprises ournetwork services, satellite operations, infrastructure and tower operations.
Our “Information Business” operates our enterprise digital portfolio. Our enterprise digital portfolio comprises information and communications technology platform services and smart enabler platform services. We also provide services in information,
Our “Media and Edutainment Business” operates our consumer digital portfolio. Our consumer digital portfolio primarily comprises media and edutainment including cloud-basedservices that we offer to consumers such as mobile-based digital life services, e-Commerce services and server-based managedIPTV services.
Historically, the largest share of our revenue has been derived from services e-Paymentrelated to our telecommunications businesses. Our business has not experienced significant seasonality.
The following is a brief overview of our six product portfolios.
A. Telecommunications Business
1.MobilePortfolio
Our mobile portfolio comprises mobile voice, SMS and IT enabler services, Pay TV, as well as e-Commerce and other portal services. We posted revenues of Rp77,127 billion and Rp82,967 billion, respectively, for the years ended December 31, 2012 and 2013.
Fixed line telephone services include local, direct long-distance (“DLD”), and international callvalue-added services, as well as other telecommunications and supporting services. Fixed wirelessmobile broadband. Weprovide mobile andcellularcommunications services include local and direct long-distance CDMA-based telephone connections, andother telecommunication services. Cellular services comprise cellulars telecommunication service. Our telecommunications-related business may experience certain seasonal effects.Cellular tend to increase around the Ramadhan lunar month and the culmination of theEid festivity, as well as during the December holiday season, while fixed line communications from homes and offices and fixed wireless communications may decrease when there are fewer working days in the period or a greater number of subscribers are on vacation. In 2013,except for OLOs who use our interconnection services and Telkomsel’s employee cooperative (“Kisel”), none of our customers accounted for more than 1% of our total revenues.
A substantial majority of our revenue has and continues to come from telecommunications-related services, including data and internet services. As a company that provides TIMES, we continue to encourage innovations in sectors other than telecommunications, and capture synergies among all of our products, services and solutions ranging from our legacy business to thenew economy business (“NEB”). Our business portfolio is grouped into the following lines of business:
A.Telecommunications Business
Our telecommunications business portfolio includes (i) fixed wireline services, (ii) fixed wireless services, (iii) cellular services, (iv) broadband and internet services, (v) network services, (vi) interconnection services, and (vii) ancillary services.
1.Fixed Wireline Services
Our fixed wireline services include plain old telephone services (“POTS”), value-added services (“VAS”), Intelligent Network(“IN”)services and session initiation protocol(“SIP”)services. IN services are IP-based network services that are connected to our exchange systems and telecommunications network.SIP services are IP multimedia subsystem (“IMS”) services which combines wireless and fixed line technologies for voice and data communications.
We succeeded in improving the performance of our fixed wireline business line through the implementation of a “More for Less” program in 2013, where, through bundling, subscribersare able to get deeper discounts withgreater telephone usagesuch as unlimited talk time usingtheir homephone. Other features of our “More for Less” program, such as,unlimited broadband access with variousbandwidth options and television channelsoffered as part ofprogram packages, helped promote our fixed wireline business as these products are offered to customers are part of a bundle with our fixed wireline services.
2.Fixed Wireless Services
Ourfixed wireless business, which uses limited mobility CDMA technology, is managed by our Wireless Broadband Division under the trademarks "Telkom Flexi" or "Flexi". In 2013, we optimized existing BTSs for our fixed wireless network, but did otherwise further develop our fixed wireless network or conduct any new product launches or promotional campaigns activities for this serviceas we have initiated a migration strategy whereby we are encouraging our fixed wireless customers to enter into plans operated by Telkomsel. As we undertook an exercise to remove inactive Telkom Flexi subscribers in late 2013 so that they are no longer recorded on our system as connections in service, the number of our fixed wireless connections in service declined sharply in 2013, from approximately 14.2 million as of December 31, 2011 and 17.9 million as of December 31, 2012 to 6.8 million as of December 31, 2013.
3.Cellular Services
Weprovidecellularcommunications services using GSM technology throughoursubsidiary, Telkomsel. CellularTelkomsel.Mobile services(excludingincluding mobile data services) remained the largest contributor to our consolidated revenues in 2013.We have two primary types ofcellularproducts and2016.
Our postpaid mobile services, postpaid services represented by“kartuHalo” andwhich comprised 2.4% of our cellular subscribers as of December 31, 2016, are marketed underthebrand kartuHalo. Our prepaid services, representedwhich comprised 97.6% of ourcellular subscribers as of December 31, 2016, are marketed under the brandssimPATI, Kartu As and Loop.
·kartuHalois a postpaid mobile telecommunications service targeted at the premium, professional and corporate market segments. kartuHalo offersseveral package options for our customers, including the HaloFit My Plan and HaloFit Hybrid package options. Package offers vary based on price and data allowance, among other factors.
·simPATIis a prepaidservice that targets the needs of the middle class market segment to provide a high quality telecommunication service, through the purchase of starter packs and top-up vouchers.Telkomsel offerssimPATI Discovery,simPATIEntertainmentandsimPATIGigamax which provide various mobile package options from time to time. Telkomsel provides traffic generated bysimPATIand subscribers priority of access to its network over traffic generated by Kartu As.As subscribers.
·Kartu Asis a prepaid service targeting thelower middle class market segment,andoffers a more affordable price compared tosimPATI.
·Loop is a prepaid service targeting the youth segment through the provision of attractive data package options.
Our total cellular subscriber base increased13.9%, or21.3 million subscribers, from 152.6 million subscribers (comprising 3.5 million postpaid subscribers and 149.1 million prepaid subscribers) as of December 31, 2015 to173.9 million subscribers (comprising4.2 million postpaid subscribers and169.7 million prepaid subscribers), as of December 31, 2016. The increase in our total cellular subscriber base was primarily driven by an increase in Loop subscribers a result of our promotion of mobile package options which target the youth segment.
29
Table of Content
In 2013, withOur mobile broadband services for all of our customers are marketed under the increasing demand for data services from customers, Telkomsel added various data services to its range of productsFlash brand name and services to complement itslegacy invoice and SMS. In order to accelerate the adoption of 3G mobile devices, Telkomsel also intensified collaboration with device principals and distributors of local and global brands of mobile devicesare supported by introducing affordable 3G mobile device bundled packages.
–kartuHalo is a postpaid mobile communications service.LTE/HSDPA/3G/EDGE/GPRS technology. As of December 31, 2013, kartuHalo had 2.5million2016, wehad 60.0 million Telkomsel Flash subscribers, up from 2.1comparedto43.8 million subscribers as of December 31, 2012.2015, an increase of37.1%, or16.2 million subscribers. This increase in subscribers was primarily a result of our successful promotion of mobile package options which offered lower tariffs that incentivized our customers to migrate from the pay-as-you-use usage model.
–We continued to expand our 4G/LTE network in 2016. We continually analyze the market for potential expansion of our 4G/LTE network. We only commit to expand or add capacity to our network in geographies where our analysis indicates there is sufficient demand to support the service. In 2016, we continued to deploy 4G/LTE services in more cities and had 19.0 million 4G/LTE subscribers and 4G/LTE services covering 169 cities in Indonesia with 6,362 units of BTS as of December 31, 2016.
simPATI2. Fixedis a prepaidservicethat can be purchased at any cellular shop in the form of starter packsPortfolio
Our fixed portfolio comprises fixed voice and top up vouchers.
–Kartu Asis a prepaid service that bills customers based on seconds of talk time. Kartu As targets the young customer segment.
fixed broadband services.
In 2013,2016, we introducedcontinued to actively promote our “more for less” program, which aims to provide customers with more relevant benefits at a number of marketing programs for cellular services to promote sales and enhance awareness of Telkomsel's brands. For example, kartuHalo. We believe Telkomsel’s promotional programs have succeeded strengthening our mobile cellular business in Indonesia.lower price through bundling services. Our mobile cellular base increased from 125.1 million subscribers at the end of 2012 to 131.5 million by the end of 2013, an increase of 5.1% or 6.4 million subscribers.
4.Broadband and Internet Services
Weprovide a range of products and services in data communication andinternetservices as described below:
-Broadband internet, our primary non-cellular based broadband internet service, using ADSL and fiber optic technology,bundling program is offeredmarketed under the commercial name “Speedy”.IndiHome, which bundles in all-in-one packages consisting primarily of broadband internet, fixed wireline phone and interactive TV services at a competitive price.
In addition, we continued to add value-added services and features to our IndiHome product in 2016 in order to increase its attractiveness to potential customers. For instance, we began to offer customers increased internet speed and unlimited calls to cellular telephones at a fixed price. We also offer wifi.id services to our IndiHome customers, an add-on service which allows such customers to enjoy unlimited internet access at all Indonesia Wi-Fi access points in Indonesia. We also provide a prepaidan application to manage accounts and bundle discounts with other add-on services.
As of December 31, 2016, we had 10.7 million subscribers on our fixed wireline network and 4.3 million fixed broadband subscribers.
3. Wholesale and International Portfolioon-demand, “pay
Our wholesale and international portfolio (which we previously referred to as you use” broadband internet service using Speedy or Wi-Fi access under the commercial name of “Speedy Instan”.We also offer a triple play package combining broadband internet (Speedy), telephone servicesand content (UseeTV,home monitoringinterconnection and music-Melon)under the commercial name “Indihome”.
-Cellular datacommunication,Telkomsel providesinternetinternational portfolio) includes wholesale telecommunications services and mobile data communications services through its mobile cellular network. This serviceour international business which is provided through Blackberry and other smartphone packages, wireless modems and dongles and non-package data services, primarily under the commercial name "Flash".
-SMS servicesare provided to mobile and fixed wireless telephone subscribers.
-“TelkomNet instan” isour dial-up internetaccessservice.
-Wi-Fi/hotspot is a wireless access solution forintranetand mobileinternetdata services in a particular area by utilizingourand other ISP’s payment facilities, or in bulk using Customer Premises Equipment-based Wi-Fi technology. In 2012,welaunched“Indonesia Wi-Fi”or @wifi.id to meet the need for Wi-Fi basedinternetservice at public places such as airports, shopping malls, hospitals, universities/schools, cafes, and other public places. Our “Indonesia Wi-Fi” service has a minimum speed of 10 Mbps to accommodate offloading, retail and other uses.
-“FlexiNet” is our internetaccess service that usestheTelkom Flexi fixedwirelessnetwork. Our “Flexi Hotspot”service provides customers who wish to enjoy high speed internet access through a wireless internet connection that is supported byour hotspot infrastructure. These services can be easily accessed from any device that has Wi-FicapabilitybytheFlexiNet Unlimited or Flexi Mobile Broadband username and the password in eachhotspot.
-VPNis a virtual private networkservice that uses the internet for secure connection to remote sites.
-“Astinet” provides high quality internet access using a default internet gateway and public IP address for a dedicated, fixed communication line 24 hours a day.
-VoIP.We provide affordable international call servicesconducted through our premium VoIP service package “Telkom Global-01017”subsidiary Telin.
Wholesale telecommunications services compriseprimarilyinterconnection services, as well as “Telkom Save” for regular international calls. Bothnetwork services, can be accessed by dialing a special prefix for international calls. To provide theseWi-Fi, value-added services, we cooperate with 79 international wholesale carriers that can support our IDD call services worldwide, to deliver VoIP traffic.
-ISDN PRA is a digital network to facilitate multimedia telecommunications services, using wider bandwidth as well as inter-terminal digital systems to accommodate high-speed, high-qualityhubbing, data center and high-capacity voice,content platform, data and video communications through a single channel. We also provide ISDN-based internet, access.
-DINAccess is a wireless communications service with dedicated access to provide LANand solutions.Weearn revenue from interconnection services and multimedia services at a speed adjustable to customer needs.
-Global Datacom is a data communications service that lets corporate customers connect their headquarters with branch offices or clients across the globe. We work with global partners through TII, our subsidiary, in providing these services.
30
Table of Content
-Metro Link is a Metro-network-based connectivity services that accommodates point-to-point, point-to-multipoint and multipoint-to-multipoint communications.
-Metro I-netis a high capacity data network solution based on IP (Internet Protocol) or ethernet that provides flexibility, ease of use and effectiveness as well as quality assurance for corporate and SME customers.
-Port Wholesaleprovides wholesale rental of port remote access servers to internet service providers, content service providers and corporate customers for subsequent sale to their customers.
-Value-added service Datacom provides additional facilities that offer added value to data communications customers.
5.Network Services
Wedirectly managethe provision of network servicesto customers comprising ofour business partners,commercial businesses and OLOs.Ournetwork services include satellite transponder leasing, satellite broadcasting, VSAT, audio distribution, as well as satellite-based and terrestrial-based leased lines.Ournetwork services customersmay enter into short-term dealsfor several minutes ofbroadcastingto longer-term agreements forone to five year periods.
6.Interconnection Services
Wealso earn revenue from other telecommunications operatorsthat utilize ourextensive networkournetwork infrastructure in Indonesia, both for calls that endthatterminate at or transit viaournetwork.Similarly,we also pay interconnection fees to other telecommunications operators whenwe usetheir networks to connect a call fromourcustomers.Interconnection services that we provide to other telecommunications operators comprise domestic and international interconnection services. In 2013, we increased our efforts to optimize the capability of Telkom Group throughexploiting synergies among Telkom, Telkomsel and TII with respect to interconnection services.
7.Ancillary Services
We have exclusive agreements with some investors underrevenuesharingarrangementsto expand fixed line phone services, public card phones (including their maintenance), data andinternet networks, and ancillary facilities related to telecommunications.
See Note 37in the Consolidated Financial Statements of the Company for further details about these revenue sharing arrangements.
We also operate other supporting and ancillary businesses, which include the leasehave limited operations and/or supplyinterests in a number of BTS to other cellular operatorsjurisdictions outside Indonesia in telecommunications and data related areas. Our international operations comprise operations in the provision of various support facilities. We manage our telecommunications tower business through our subsidiary, Dayamitra.
following jurisdictions:
B.· New Economy Business (“NEB”Singapore,through Telekomunikasi Indonesia International Pte. Ltd.("TelinSingapore") and Strategic Business Opportunities Portfolio
NEB and Strategic Business Opportunities are a part ofour IME portfolio.We have designated our subsidiary,Metra,, where we operate as a sub-holding company that focuses onour IME business development.
Our information business portfolio includes:
1.IT Outsourcing orManaged Applicationwhich provides cloud-based and server-based management services and IT consulting services.facility-based operatorandasa telecommunication provider;
2.· e-Payment/PaymentHong Kong,through Telekomunikasi Indonesia International Ltd.("TelinHong Kong"), where we provide mobile virtual network operator ("MVNO") services,,including the following: operate a GraPARI center and provide wholesale voice, wholesale data and retail mobile services;
-· Billing paymentTimor Leste,through Telekomunikasi Indonesia International S.A. ("Telin Timor Leste"), a service that allows customers to make payments to service or goods providers such as PLN, Telkom, PDAM, KAI,where we provide fixed telephone connection, cellular voice and others through collecting agents that include banks, cooperatives, BPR, convenience stores,broadband internet services, corporate solutions, and others. wholesale voice and data services;
-· Remittance is money transfer serviceAustralia,through Telekomunikasi Indonesia International Pty. Ltd. ("TelkomAustralia"), where neither the money sender nor the recipient need a bank account to complete a transfer, as transfers can be accomplished usingonlya mobile device.
-e-Money provides services to customers who wish tomanage money electronically through certain media (mobile, prepaid card, or a virtual account that can be accessed via the Internet) for use in electronic transactions.
-e-Vouchers or Telkom Voucher is a single voucher issued by us that can be used to purchase or recharge any of our services, such as for Kartu As,simPATI, Flexi Trendy, and Speedy Hotspot.
3.IT enabler servicesincludewe provide business process outsourcing, information technology outsourcing and knowledge process outsourcing, which consist of:IT services;
-Network centric value added services,comprising IT-based value-added services for data and phone, security services, and server and storage services for connectivity customers.
-Integration services, comprising integration services for network and hardware associated with CPE, integration services for applications and software, and integration services for computer hardware.
31
Table of Content
OurMedia·Macau,through TelkomMacau Limited, where we provide MVNO services and Edutainment business portfolio includes the following :
1.Television broadcast services comprising the following
-Pay TVbysatellite, a pay TV service broadcasted over satellite links offering premium-grade contents in news, sports, entertainment, and others.retail mobile services;
-· IPTV, an Internet Protocol-based television ("IPTV") under the commercial name”UseeTV Cable”. The service is delivered using the Speedy broadband access network, and offers”pause and rewind”features for contents such asvideo-on-demand programming, FTA TV,premium TV,internet radio and TV on demand, which allows playback of program content from the last seven days.Taiwan,through TelkomTaiwan Limited, where we provide MVNO services andretail mobileservices;
-· OTT TV (Over the Top TV)Malaysia,through Telekomunikasi Indonesia International Sdn. Bhd. ("TelinMalaysia"), aninternet TV service under the commercial name”UseeTV”where we have a minority interest in a joint venture that can be accessed from Telkom'sinternet network, offering free content such asvideo-on-demand programming,live TV,internet radio, and some pay video programming. Similar to UseeTV Cable, the OTT TV is also capable of allowing play back of program content from the lastthree days.provides MVNO services;
2.· United States,through Telekomunikasi Indonesia International Inc. ("Telkom USA"), where we undertake businesses relating to telecommunications products, telecommunication services, information technology, information technology products and information technology services and maintain points of presence;
·Myanmar,throughabranch office, where we provide IP transit services;and
·Saudi Arabia, through a branch office, where we provide MVNO services (under theAdvertising SimPATI Saudi brand name, which is a commercial serviceco-branded productthat we offer with a local operator)and operate aGraPARI center in Mecca to cater to Indonesian pilgrims.
4. NetworkInfrastructure Portfolio
Our network infrastructure portfolio includesnetwork services,satellite operations, infrastructure and tower operations.
Satellite
Our satellite operations consist primarily of leasing satellite transponder capacity to broadcasters and operators of VSAT, cellular and IDD services and ISPs, as well as providing earth station satellite up-link and down-link services for domestic and international users.We manage our satellite business through our subsidiaries,TelkomMetra and Patrakom. For more information see“— Network Infrastructure and Development —National Network— Transmission Network — Satellite”.
Tower
We lease out space to other operators to place their telecommunications equipment on these towers, for which we receive a fee. As of December 31, 2016, we had approximately 25,700 towers, comprised of approximately 8,700 towers owned by Mitratel and approximately 17,000towers owned by Telkomsel, which was larger than the promotionnumber of products or servicestowers that were owned by each of anyPT Tower Bersama Infrastructure Tbk (“Tower Bersama”), PT Sarana Menara Nusantara Tbk (“Protelindo”) and PT Solusi Tunas Pratama Tbk, which are our principal competitors in the towers business.Weaim toconsistently expand our tower business, as we believethisis a strategic business inthe telecommunicationsindustry and intend to increase our tower rental revenues from third party that are presented in digital or print media, such as radio, television, internet, newspapers, brochures/leaflets and billboards.telecommunications providers.
3.Portal BServices .facilitatescontent aggregationInformation Business
5.Enterprise Digital Portfolio
Ourenterprise digital portfolio comprises information and distribution. In addition tocommunications technology platform services and smart enabler platform services.
Information and Communications Technology Platform Services
We provide information and communications technology platform services, which comprise the following services:
·enterprise connectivity, including fixed voice, fixed broadband and data communication services (comprising IP VPN, leased channel, ethernet services and managed network services);
·IT services, including system integration, IT outsourcing, premises integration and professional services;
Table of Content
·data centerand cloudservices, which includeenterprise data center, collocation, hosting,disaster recovery centerand content distribution networks, and cloud services, which include infrastructure-as-a-service, software-as-a-service and unified communications-as-a-service;
·business process outsourcing services; and
·devices and hardware sales and payments related toourproductsservices, under which we sell CPE hardware and provide certain services conducted throughoure-Commerce portal,ourportal e-Storeincluding support services and on-device portalIT security services.
Smart Enabler Platform Services
We also provide smart enabler platform services, also accommodate the salein order to promote innovation, integrate industry ecosystems and distribution of content or applicationsfoster change in consumer behavior in Indonesia. Our smart enabler platform services comprise services relating to:
·tourism, such as games,theIndonesia Tourism Exchangeplatform whichprovides digital solutions forandfacilitates theconnectionof various businesses in the tourism industry;
·payment, which offers bill payment, online payment gateway, e-Money and direct carrier billing;
·digital advertising, including digital out-of-home, mobile advertising, digital agency, media hub and analytics solutions;
·big data and data analytics, which offers a platform service to generate insights for targeted digital advertising and better understand the customer; and
·other smart enablers, including Internet of Things platform and network connectivity services.
As of December 31, 2016, we provided a totalbandwidth of 1,750,617 Mbps to our broadband customers and 764,397 Mbps to our data communication services customers.
C. Media and Edutainment Business
6. ConsumerDigital Portfolio
Our consumer digital portfolio primarily comprises media and edutainment services that we offer to consumers such as mobile-based digital life services, e-Commerce services and IPTV services. We also operate a venture capital fund through our subsidiary, PT Metra Digital Investama, which is also known as MDI Ventures.
We offer IPTV services includingTV-on-demand and video-on-demand that we provide as part of our IndiHome services. Our e-Commerce services comprise blanja.com, an online marketplace that facilitates consumer-to-consumer and business-to-consumer sales.
Our mobile-based digitallifeservices representa group of digital businesses, aimed to provide consumers with digital services. Our mobile-based digital life services consist of:
·digitallifestyle, which focuses on providing a mobile entertainment experience for customers by targeting different segments and leveraging Telkomsel’s trusted billing system to facilitate transactions. It offers applications news, sports news, educational content,for music ring back tones, SMS contentand others,(LangitMusik, MusicMax and Ring Back Tone), video (VideoMax) and games;
·digital payment (mobile financial services), which is focused on creating a digital financial ecosystem by offering digital payment solutions. TCASH is an electronic money service provided by Telkomsel, which provides a digital solutionthat enables Telkomsel consumers to perform banking activities in a safe, easy and simple manner. Activities such as paying bills, transferring funds, and making online and offline retail payments, can be downloaded directlybycustomerdone easily on our customers’ smartphones and/or feature phones;
Table of Content
·digital advertising and analytics are part of Telkomsel’s digital business offering, and consist of digital advertising business and mobile device orinternet users. Content or applications can be obtained either at a certain priceorfreebanking solutions. The digital advertising business provides digital advertising media solutions for marketers. Mobile banking solutions provides mobile functions for the banking industry, such as banking SMS anduser menu browserservices; and
·enterprise digital services (previously named machine-to-machine business),which are focused on providing Internet of charge.Things solutions to customers.
Network Infrastructure and Development
The vision of our network infrastructure and development program is to “Be the Driver” of our overarching corporate vision, which is to “Be the King of Digital in the Region”.
The mission of our network infrastructure and development program is to develop and maintain an agile and resilient network and IT infrastructure in order to support our digital services innovation.
In line with our vision and mission, we classify our network infrastructure into two categories, namely: (i) our national network infrastructure, to support our Indonesia Digital Network program, which we discuss in greater detail below and (ii) our international network infrastructure, to support our international expansion program.
National Network
We believe infrastructure development and the provision of connectivity are crucial aspects in our vision to become the “King of Digital”. We continue to pursue development of our network infrastructure to offer a more efficient and cost-competitiveaspart of the Government’s Master Plan for the Acceleration and Expansion of Indonesia's Economic Development (“MP3EI”)cost-competitive services, in line with the Government’s Indonesia Broadband Plan which lays out its aspirations to accelerate and expand broadband penetration in Indonesia.In addition, we aim to continue to develop and improve our transformation intonetwork infrastructure with a TIMES provider underview to developing a high-quality, efficient and competitive infrastructure in terms of costs for delivery of services.
As a result, we plan tocontinue toactualize digitization in Indonesia through our Indonesia Digital Network programwhich comprises three components, namely id-Convergence ("IDN"id-Con") program which began in 2012, id-Access and is also intended to support the establishment of a National Broadband Network To transform our infrastructure into a high quality, efficient and cost competitive infrastructure to deliver our TIMES services,we have been developing and improving our network infrastructure towards what we previously called the Telkom One networkwhich isintended to be a jointly developed network used by our various units in the Telkom Group. id-Ring.
OurIDNprogramOurIndonesia Digital Networkprogram involves thefollowing three program developments:
1. id-Convergence (“id-Con”):id-Con: represents our aim to realize the convergence of thenode servicevarious elements of our network infrastructure into aan integrated multi-service and multi-screenintegrated NGN. multi-device Next Generation Network. id-Con is a strategic initiative that focuses on providing a platform for the design, development and delivery of TIMES services and solutions. In order to develop such platform and ensure the reliability and scalability of our TIMES services and solutions, we intend to continue utilizing our data center facilities, and our cloud management platform. In addition, we are focused on securing the integrity of our platforms. We aim to continue designing and developing industry-specific smart enabler platforms for certain industries in Indonesia, such as the transportation, healthcare and public sectors.
2. id-Ring:development of ourtransportid-Access: is our strategy to increase nationwide fixed and mobile broadband access penetration. We are focused on expanding our fiber optic network and modernizing our current access network infrastructure into an IP-based andoptical backbone network. in order to realize cost efficiencies. Under this program, we intend to continue replacing copper cable network with fiber optic cables and terminating legacy node service networks. We intend to continue laying out fiber optic cables which can be integrated with the BTS network of Telkomsel as well as the network infrastructure of other operators, which could provide us with opportunities to expand our sources of revenue. In addition, we intend to continue improving the cross-operability of our and Telkomsel's broadband networks.
3. id-Access:development of ourcustomer accessid-Ring: represents our aim to develop a resilient nationwide fiber optic backbone and establishing our domestic network infrastructure into ahigh speedbroadband access throughfiberas a hub for international broadband traffic. In order to implement this strategy, we are developing the Indonesia Global Gateway cable system, which we intend to complete in 2018, in order to leverage Indonesia's strategic geographic location and provide an alternative direct broadband connection between Europe, Asia and America. In addition, we are actively developing a nationwide infrastructure network with a fiber optic and Wi-Fi networks.backbone.
A.Table of ContentFixed Line Network and Transmission
1.Fixed Wireline Network
As of December 31, 2013,2016, we managed 9.410.7 million fixed wireline (fixed voice) connections. Our network and infrastructureIDNmaster plan aims tomodernize our legacy network tobroadband access infrastructure network.
The following table showssets forth data related to our fixed wireline network from 2009 to 2013:
as of the dates indicated.
Operating Statistics | | As of and for the year ended December 31, | | As of December 31, | |
| 2009 | | 2010 | | 2011 | | 2012 | | 2013 | | 2012 | | 2013 | | 2014 | | 2015 | | 2016 | |
Exchange capacity | | 11,094,063 | | 11,237,229 | | 12,180,214 | | 13,908,003 | | 13,918,369 | | 13,908,003 | | 13,918,369 | | 13,946,801 | | 14,946,076 | | 15,738,803 | |
Installed lines | | 10,013,565 | | 10,510,048 | | 11,005,208 | | 11,109,156 | | 10,650,652 | | 11,109,156 | | 10,650,652 | | 10,341,807 | | 14,946,076 | | 15,738,803 | |
Lines in service(1)(2) | | 8,376,793 | | 8,302,818 | | 8,688,526 | | 9,034,010 | | 9,350,806 | | 9,034,010 | | 9,350,806 | | 9,698,255 | | 10,276,887 | | 10,663,000 | |
Subscriber lines | | 8,038,294 | | 7,980,337 | | 8,323,175 | | 8,672,332 | | 9,080,236 | | |
Public telephones | | 338,499 | | 322,481 | | 278,505 | | 273,929 | | 270,570 | | |
Leased lines in service(2) | | 4,273 | | 3,988 | | 3,662 | | 3,342 | | 2,864 | | |
Fixed wireline subscriber pulse production (millions minutes)(3) | | 54,186 | (4) | 9,403 | | 8,054 | | 6,770 | | 5,773 | | |
(1)Exchange capacity and installed linessince December 31, 2015 includes capacity and lines from TDM-based, softswitch and IMS technologies. | | (1)Exchange capacity and installed linessince December 31, 2015 includes capacity and lines from TDM-based, softswitch and IMS technologies. | |
(2)Lines in service are subscriber lines and public telephone lines, including the lines in service that we operate under revenue-sharing arrangements. | | (2)Lines in service are subscriber lines and public telephone lines, including the lines in service that we operate under revenue-sharing arrangements. | |
(1)Lines in service are subscriber lines and public telephone lines, including the lines in service that we operate under revenue-sharing arrangements.
(2)Excludes leased lines for our network and multimedia businesses.
(3)Consists of pulses generated by local and domestic long distance calls, excluding calls from public pay phones and cellular phones.
(4)In millions of pulsefor year2009.
32
Table of Content
2. Fixed Wireless Network
Our infrastructure consists of mobile switching centers (“MSC”) that are connected to every other trunk exchange. Each MSC is connected to a base station sub system (“BSS”), which consists of a base station controller (“BSC”) and a base transceiver station (“BTS”). These, in turn, connect the customers’ handheld devices and fixed wireless terminals toWe terminated our fixed wireless network. The number ofbusiness in May 2015 however, our previous subscribers were able to use their old telephone numbers until December 2015. We migrated over 1.3 million fixed wireless connections in service was 6.8million as of December 31, 2013.subscribers to Telkomsel under our migration program.
3.Transmission Network
Throughout 2013,wecontinued toprimarily focus onthe development ofour broadband network, which serves as the backbone for our network infrastructure as a whole. Our backbone telecommunications network consists of transmission networks, remote switching facilities and core routers, which connect a numberofaccess nodes. The transmission links between nodes and switching facilities comprisea terrestrial transmission network,in particular fiber optic, microwave and submarine cable networks, as well as satellite transmission networks and other transmissiontechnologies.
The following table shows our transmission capacity as of December 31, 2012 and 2013:
| | Capacity (number of Transmission medium circuits) | |
Transmission Network | | E1 | | STM-1 | | STM-4 | | STM-16 | | STM-64 | | STM-256 | |
As of December 31, | | | | | | | | | | | | | |
2012 | | 131,546 | | 720 | | 92 | | 55 | | 260 | | 3 | |
2013 | | 131,303 | | 736 | | 100 | | 58 | | 337 | | 3 | |
Note: The backbone transmission unit uses E1, STM1 (equivalent to 63 E1), STM4 (equivalent to 4 STM1), STM16 (equivalent to 4 STM4), STM64 (equivalent to 4 STM16), and STM256 (equivalent to 4 STM64). STM or Synchronous Transfer Mode is the unit typically used in backbone transmission networks. Facilitating broadband services requires high capacity transmission networks using nxSTM-1 units. E1 units are used to support legacy services.
We operate the Telkom-1 and Telkom-2 satellites as well as 205 earth stations, including one satellite master control station. The Telkom-1 satellite has 36 transponders, including 12 extended C-band transponders and 24 standard C-band transponders, while the Telkom-2 satellite has 24 standard C-band transponders.
In addition toour Telkom-1 and Telkom-2satellites, we also lease transponder capacity for 30 TPE (transponder equivalent, @36 MHz), comprising9 TPE from the JSAT-5A (132 BT) satellite, 10 TPE from the Etuelsat 172A (172 BT) satellite, 8 TPE from the Chinasat-10 (110 BT) satellite, and 3 TPE from the Intelsat-8 (169 BT) satellite.
The Telkom-3 satellite, launched in August 2012, failed to reach its usable orbit.We had insurance coverage for the procurement costs of Telkom-3 satellite.We will lease additional satellite transponder capacity from third parties, ifrequiredto fulfill internal operational needsand to accomodate the needs of customers.We are currently in the initial phases for the procurement of a replacement satellite, the Telkom-3S,which is currentlyplanned for launch in 2016.
B.Cellular Network
Our cellular services, which are operated by our subsidiary, Telkomsel, have the most extensive network coverage of any cellular operatorsoperator in Indonesia. Telkomsel currently operates on the GSM/DCS, GPRS, EDGE, 3.5G and 3.5G4G/LTE networks. The GSM/DCS network consists of 7.5of15 MHz of bandwidthspectrum allocation on the the800/900 MHz frequency (which includes 7.5 Mhz of spectrum allocation that was reallocated to Telkomsel in connection with the termination of our fixed wireless business)and 22.5 MHz of bandwidthcontiguous spectrum allocation on the 1800 MHz1.8 GHz frequency. Telkomsel’s 3G network uses 1015 MHz of bandwidthcontiguous spectrum allocation on the 2.1 GHz frequency. Telkomsel tendered for and obtained a further 5 MHzThe range of bandwidthcellular services on the 2.1 GHz frequencyGSM network provided by Telkomsel extends to all cities and districts in 2013,Indonesia. In December 2014, Telkomsel became the first operator in Indonesia to commercially launch 4G/LTE services. In 2016, Telkomsel added 25,744 units of BTS (including 4,601 units of 4G/LTE BTS), and as of December 31, 2016, Telkomsel’s digital network was supported by129,033 units of BTS (including 6,362 units of 4G/LTE BTS). In 2016,Telkomseladded an additional 19,193 units of 3G BTS, bringing the total to 72,327 units of 3G BTS as of December 31, 2016.
Data and Internet Network
In 2016, we continued to improve the quality of our data network by installing additional capacity and coverage. As of December 31, 2016, we provided broadband accessusing fiber optics to 16.4 million home pass. As of December 31, 2016, our metro ethernet network expanded to 126,284 Gbps, which it beganis able to use from October 2013, bringing its total bandwidth allocation on its 3G networkprovide broadband services throughout Indonesia. The metro ethernet is also used as the main link for IndiHome broadband services, softswitches and IT multimedia subsystems related to 15 MHz on the 2.1 GHz frequency.
voice services, video services, enterprise VPN services and GPON broadband services related to mobile backhaul and corporate business solutions.
As of December 31, 2013, Telkomsel’s digital network was supported by 69,864 BTS2016, we have extended the capacity of our internet gateway to reach an installed capacity of1,100 Gbps. This ensures the adequacy of the internet gateway capacity in anticipation of the expected growth for both fixed and mobile broadband traffic. In 2016, we also operated content distribution networks with an overall networkaggregate capacity capableof1,590 Gbps in collaboration with Akamai, Google, Yahoo, Conversant and Edgecast.
As of facilitatingDecember 31, 2016, we maintained six main points of presence in Batam (at Batam Center and Bukit Dangas), Jakarta (at Jatinegara andCikupa)and Surabaya (at Rungkut and Kebalen). We are currently developing two main points of presence in Manado (at Manado Centrum and Manado Paniki) which we expect to be completed by the communication needsend of 131.5million customers.
C.Data and Internet Network
To ensure a high level2019. In addition, we maintained 40 primary points of reliability,we have built hierarchical and dual homing IP/MPLS-basedinternet and data networks.Our IP backbone network isnow capable of serving all ofpresence in31 cities in Indonesia and as of December 31, 2013 covered2016 and expect to complete the development of PoP locations withprimaryfour primary points of presence in four additional cities in 2017.
Throughout 2016, we continued to expand the scope of Indonesia’s Wi-Fi services by deploying additionalNetworkAccessPoints either through internal development programs and secondary PoP which consistedvarious forms of 22 terra router nodes, 6 core router nodesand128 PErouter nodes.
cooperation with third parties. As of December 31, 2016, a total of 362,200 Network Access Points had been installed.
33
Table of Content
Data Center
We also operate anethernet carrier metro service as anaggregator for broadband access traffic connecting to IPbackbone. As of December 31, 2013,813Metro Ethernet nodeswere2016, we operated data centers with an aggregate capacity of approximately 25,700 square meter at facilities located in useSingapore and various sites in Indonesia. With the capabilities of this network, we are able to supportour 163.9Gbpsprovide integrated data storage solutions to companies in Indonesia and Singapore.
Transmission Network
In 2016,we focused on the development of our broadband network, which serves as the backbone for our entire network infrastructure. Our backbone telecommunication network consists of transmission networks, switching facilities and core routers, which connect multiple access services.nodes. The transmission links between nodes and switching facilities comprisea terrestrial transmission network,in particularfiber optic, microwave and submarine cable systems, as well as satellite transmission networks and other transmissiontechnologies.
Communications Cable System
We provide fixed line-based broadband internet access using ADSL technology under the brand “Speedy”.Our transmission network had19 backbone rings withan aggregate capacity of74,240 Gbpsas of December 31, 2016. As of December 31, 2013,2016, we hadoperate a fiber optic backbone totaling 85,770 km, which covers provinces from Aceh to Papua, including the Sulawesi-Maluku-Papua Cable System that we completed in 2017.
To increaseourtraffic capacity and broadband services in 34 cities in eastern Indonesia, wecompleted the construction of a backbonering,known as the Sulawesi-Maluku-Papua Cable System that connects these cities thathave previouslybeen served by satellite transmission.TheSulawesi-Maluku-Papua Cable System was developed in two segments, with the first segment being 4,300 km long, serving 21 district capitals and connecting Kendari, Manado, Ternate, Ambon, Sorong,Fakfak, Makasar and Maumere, and the second segment being 3,155 km long, serving 13 district capitals and connecting Jayapura,Sarmi, Biak, Manokwari,Sorong,Fakfak,Timika and Merauke. We completed the first segment in 2015 and the second segment in the first quarter of 2017.
In addition, we intend to leverage Indonesia's strategic geographic location and provide an alternative direct broadband connection between Europe, Asia and America by developing the Indonesia Global Gateway cable system. The Indonesia Global Gateway cable system is intended to connect two major submarine cable systems, namely the South East Asia-Middle East-Western Europe 5 (SEA-ME-WE 5) and, when completed, the Southeast Asia-United States (SEA-US) submarine cable systems. In addition, the Indonesia Global Gateway cable system is planned to connect 12 major cities within Indonesia, including Batam, Jakarta, Surabaya and Manado, spanning a length of 5,700 km. We expect this cable system to increase our domestic traffic capacity and broadband services. In 2016, we completed the construction of all landing stations and support facilities related to this project. We expect to complete the construction of this cable system in the middle of 2018.
Satellites
We operatethreesatellites, namely Telkom-1, Telkom-2 and Telkom-3S.
The Telkom-1 satellite operates at orbital slot 108 E. Ithas a capacity of 36 transponders(which is equivalent to an aggregate of 36.00 TPE)consisting of : (i) 24standard C-band transponders;and(ii)12 extended C-band transponders, with coverage over Indonesia. We obtained an assessment from Lockheed Martin Corporationthat estimated that the operational lifespan of the Telkom-1 satellite would be through 2021.
The Telkom-2 satellite currently operates at orbital slot 118 E but we plan to relocate it to orbital slot 157 E when the Telkom-3S satellite completes its in-orbit performance tests. We expect to operate the Telkom-2 satellite at such orbital slot for its remaining estimated operational life which we expect to end approximately in 2020.TheTelkom-2 satellite has a capacity of 24standard C-band transponders (which is equivalent to an aggregate of 24.00 TPE) with coverage over Indonesia and South Asia.We plan to continue operating the Telkom-2 satellite with coverage over Indonesia and South Asia after we complete relocating its orbital slot.
Table of Content
The Telkom-3S satellite was launched in February 2017 and is currently undergoing in-orbit performance tests which we expect to be completed by April 2017. At the completion of such in-orbit performance tests, we plan to locate to the Telkom-3S satellite at orbital slot 118 E to replace the Telkom-2 satellite and transfer all of the Telkom-2 satellite's transmission services to the Telkom-3S satellite. The Telkom-3S satellite has a capacity of 42 transponders (which is equivalent to an aggregate of 49.00 TPE) consisting of: (i) 24 standard C-band transponders; (ii)8 extended C-band transponders; and (iii) 10 Ku-band transponders, which would have coverage over Indonesia.
In addition, we have entered into a contract for the procurement oftheTelkom-4 satellite, which is currently planned for launchin the third quarter of 2018 as a replacement fortheTelkom-1 satellite.The Telkom-4 satellite is planned to operate at orbital slot 108 E with coverage over Indonesia andSouth Asia. It is currently being constructed and designed to have a capacity of 60 transponders (which is equivalent to an aggregate of 60.00 TPE) which would consist of: (i) 24 standard C-band transponders which would have coverage over Indonesia; (ii) 24 standard C-band transponders which would have coverage over South Asia; and (iii) 12 extended C-band transponders, which would have coverage over Indonesia.
All of oursatellites are controlled fromamain control station in Cibinong, Bogor inWest Java. To ensure the continuity of services, weoperate abackup control station in Banjarmasin, South Kalimantan.
We also leased a25.79TPE (transponder equivalent to 36 MHz) from the following satellites: JSAT-5A (132 E) in the amount of 6.28 TPE, Eutelsat 172 A (172E) in the amount of6.39 TPE, Chinasat-10 (110E) in the amount of2.12 TPE, Intelsat-8 (169E) in the amount of3.86 TPE, KTSAT (75E) in the amount of2.00 TPE, ABS-2 (75E) in the amount of 1.14 TPE,Chinasat-11 (98 E) in the amount of0.36 TPE and APSTAR-6 (134 E) in the amount of 3.64 TPE. We expect that our requirement to lease transponders from third party satellites to decrease after we complete the transfer of the Telkom-2 satellite's transmission services to the Telkom-3S satellite.
We are also currently exploring various alternatives to cooperate with other operators to provide capacity for 8.2 million homepassand were serving 3.0 million Speedyregistered subscribers,us, including cooperation through long-term leases, joint development of a satellite in an increaseorbital slot covering Indonesia and acquisition of 28.7% comparedsatellites in the orbit.
International Networks
We plan to 2.3 millionregisteredsubscribersascontinue with the development of December 31, 2012.
Our wireless broadbandour international network infrastructure consists ofwirelessaccess gateways that are connected towirelessaccess connections, which areto support our international expansion strategy and vision to be the “King of Digital in turn connected to our access points. Using a variety of wireless broadband terminals such as laptop computers and other handheld personal devices, end users link to these access points to use ourbroadband Wi-Fiservices. As of December 31, 2013,we had75,250 access points.
Oursubsidiary,Telkomsel, also provides mobile cellular broadband service under thecommercial name “Flash”as well as a dedicated BlackBerry service. AsofDecember 31, 2013, Flash had 17.3 million subscribers, a 56.5% increase compared to 11.0 million registered subscribersas ofDecember 31, 2012.As of December 31, 2013, we had 7.6 million subscribers to our BlackBerry service, a 31.1% increase from 5.8 million subscribers as of December 31, 2012.
D.International Networks
Wethe Region".We operate international gateways in Batam, Jakarta and Surabaya to route outgoing and incoming calls on our IDD service (“007”). Our international network is supported by
We currently own or have interests in global submarine communications cable systems (“SCCS”) includinginfrastructure that connects the Dumai-Malaka Cable System,continents of Europe, Asia and the Thailand-Indonesia-Singapore (“TIS”)America through submarine cable system as well as by indefeasible rights of use, and satellite capacity. To consolidate our international network and expand domestic broadband services, our subsidiary, TII, entered into the Asia America Gateway cable consortium in April 2007 to developconsortiums for the Batam-Singapore Cable System (BSCS), Dumai-Malacca Cable System (DMCS), Asia-America Gateway (AAG), Singapore-Japan Cable System (SJC), theSouth East Asia-Middle East-Western Europe 5 (SEA-ME-WE 5) submarine cablesystem, which connects Batam with Singaporewascompletedin December2016, and wasthe Southeast Asia-United States (SEA-US)submarine cablesystem which we expect to be completed in the firstfourth quarter of 2014. Through TII, we plan in the long-term to enhance international telecommunication access to regions in eastern Indonesia, diversify our services and capture business opportunities in South Asia, the Middle East and Europe.
Furthermore, we have entered into international telecommunications service agreements with a number of overseas operators to facilitate international call interconnections. Moreover, since we do not have agreements with telecommunications operators in all our IDD destinations, we have signed agreements with SingTel, Telekom Malaysia, Verizon, Belgacom, NTT, TIS, France Telecom and other telecommunications operators under which such operators act as hubs and route international calls to certain parts of the world. As of December 31,2013, we had agreements with79 international telecommunication service operators in26 countries. We have focused on entering into more international telecommunications service agreements with other telecommunication operators to provide direct interconnections services in the top20 most popular calling destinations for IDD outgoing traffic. In addition to connect with the20 top countries for IDD outgoing calls, we are also connected to several telecommunications operators in various other countries.
2017.
To support theour international services for both voice and data, TIITelin operates 29 points of presence in various parts of the world, including in Asia (Singapore,(four points of presence in Jakarta, three points of presence in Singapore, two points of presence in each of Batam and Hong Kong, Malaysia, Japan, South Koreaone point of presence in each of Dili, Dubai, Dumai, Kuala Lumpur, Seoul, Surabaya, Tokyo and Timor Leste)Yangon), Europe (United Kingdom, Germany(one point of presence in each of Amsterdam, Frankfurt, London and Netherland)Marseilles) and the USA (LosUnited States (two points of presence in Los Angeles, CA and one point of presence in each of Ashburn,VA,New York, Palo Alto, CA and San Jose, and New York)CA).
CUSTOMER SERVICEGeographic Distribution of Revenues
International expansion has become a necessity for us to be able to maintain a high and sustainable growth rate. We provide a numberare developing and expanding our business outside of value-added services which allowour customersIndonesia to conveniently access a wide range ofourproductsbroaden and services.
A.Personal Customer Segment
In order to facilitatediversify our individual customers' access tomarket. The following table sets forth the distribution of our products and services, we operate a network of Plasa Telkom and GraPARI outlets, andcontactcenters and also provide services through our websites and on-line applications.
1.Plasa Telkom & GraPARI
Plasa Telkom is a walk-in customer service point at which customers can access information on a range of products and services, including billing, payment, account suspension, promotional deals andsubmitcomplaints.Asof December 31, 2013, we maintained 572 outletPlasa TelkominIndonesia and we opened an overseas Plasa Telkom in Hong Kong. As of December 31, 2013Telkomsel’s had 408customer serviceoutletsconsisting of 86 GraPARI and 322 GeraiHalo. We also have 268 unit mobile customer service points underrevenues by geographic markets for the nameMobile GraPARI.
34
Table of Content
| Years Ended December 31, | | |
| 2014 | | 2015 | | 2016 | | |
| (Rp billion) | | (Rp billion) | | (Rp billion) | | (US$ million) | | |
External Revenues | | | | | | | | | |
Indonesia | 87,896 | | 100,456 | | 114,093 | | 8,469 | | |
Foreign Countries | 1,800 | | 2,014 | | 2,240 | | 166 | | |
Total | 89,696 | | 102,470 | | 116,333 | | 8,635 | | |
Overview of Telecommunication Services Rates
Under Law No.36of1999 and Government Regulation No.52of2000, tariffs for operating telecommunications network and/or services are determined by providers based on the tariff type, structure and with respect to the price cap formula set by the Government.
a. Fixed line telephone tariffs
Under MoCI Regulation No.15/PER/M.KOMINFO/4/2008, the tariff structure for basic telephony services connected through fixed line network is comprised of the following:
·activation fee;
·monthly subscription charges;
·usage charges; and
·additional facilities fee.
b. Mobile cellular telephone tariffs
On April 7, 2008, the MoCI issued Regulation No.09/PER/M.KOMINFO/04/2008, (on mechanism to determine tariffs of telecommunication services connected through mobile cellular network) ("MoCI Regulation No.9/2008") which provides guidelines to determine cellular tariffs with a formula consisting of network element cost and retail services activity cost. Under MoCI Regulation No.9/2008, cellular tariffs for the operation of telecommunication services connected through mobile cellular network consist of the following:
·basic telephony services tariff;
·roaming tariff; and
·multimedia servicestariff,
with the following traffic structure:
·activation fee;
·monthly subscription charges;
·usage charges; and
·additional facilities fee.
Table of Content
c. Interconnection tariffs
Based on letter No.118/KOMINFO/DJPPI/PI.02.04/01/2014 of the Director General of Post and Informatics of the MoCI ("DGPI"), the DGPI required our Company and Telkomsel to submit Reference Interconnection Offer (“RIO”) proposals to the Indonesian Telecommunication Regulatory Body (“ITRB”) for evaluation on an annual basis.Subsequently,theITRB in its letters No.60/BRTI/III/2014 and No.125/BRTI/IV/2014 approvedour Company’s and Telkomsel's RIO revisions and approved an SMS interconnection tariff at Rp24 per SMS.
2.d. Network lease tariffs
Through MoCI Regulation No.03/PER/M.KOMINFO/1/2007 (on network lease) ("MoCI Regulation No.03/2007"), the Government regulated the form, type, tariff structure and tariff formula for services related to network leases. Pursuant to MoCI Regulation No.03/2007, the Director General of Post and Telecommunication issued Decree No.115 of 2008 in conformity with the Company’s proposal.
e. Contact CenterTariffs for other services
Ourcontact centersThe tariffs for satellite lease, telephony services, and other multimedia are call centers thatallowcustomers tomake enquiries regardingdetermined by the service provider by taking into account the expenditures and market price. The Government only determines the tariff formula for basic telephony services. There is no stipulation for the tariff of other services.
Marketing, Sales and Distribution
We have implemented a comprehensive marketing and promotional strategy to bolster our brand and to boost sales, including through marketing communication activities and product and service distribution channel development. To increase sales, we also use above and below the line marketing channels to promote our services to certain parties and communities. We also continue to place advertisement in printed and electronic media and implement marketing methods such as point of sales broadcasting as well as promotion and sponsorship events.
We adjust our marketing and promotional strategy and customer service in accordance with the characteristics of our businesses, products and services billing,aswell as customer preferences. The following provides a description of our marketing and promotional offers and submit complaintsstrategies by dialing "147" from any phone line. We operate 24-hour contact center facilities in Medan, Jakarta and Surabaya.each customer facing unit.
Mobile Customer Facing Unit
For cellular subscribers, Telkomsel operates24-hour call centers under the brand “Caroline”our mobile customer facing unit, which is the abbreviationresponsible for our mobile portfolio, we focus our marketing efforts to encourage customers who currently only utilize mobile voice and SMS services to commence utilizing mobile broadband services. For instance, in 2016, we continued to offer device bundling programs under which we sell 3G-capable and 4G/LTE-capable devices which we bundle with data package options. We also continued our promotion of “Customer CareOnline”. Caroline isaccessible through various access numbers, somemobile package options in order to encourage existing mobile broadband services customers to increase their use of which are available 24-hours and some of which are toll-free.
3.Web-in
Web-in isan online facility forto our customers,wherecustomers can access products and services independently through our websitethrough the“MyTelkom” menu. Available services include e-Billing registrations, collective bill registrations, and complaints.
Our cellular customers can access on-line services through Telkomsel website on“MyTelkomsel”menu thatlaunched in 2013. Through “MyTelkomsel”,our customer may purchase service packages for Flashinternet, telephone, SMS, MMS, andinternational roamingconduct phone credit transfers, purchase flash gifts and monitorinternet quota usage.The customers can download the application for use on Android and BlackBerry.
B.Corporate Customers
We categorize our corporate customers intobusiness, enterprise, wholesale and international groups based on a numbers of criteria such as contribution to our revenues, our customers' geographic scope of operations and the type and range of products and services procured from us. As part of our strategy to providestreamlinedcustomer service, we operate account management teams to manage our relationships with our corporate clientswho are supported by the Telkom Solution House, SME Centers and Contact Centers, as described below.
1.Account Management
Our Business Service Division caters to business customers, which include micro customers, SMEs, local governments, cooperatives and rural credit banks. Our Business Service Division accounts managers and representatives managers manage customers directly by conducting site visits and telephonically. We categorize business customers into three groups based on our customer’s line of business, namely public and general services,construction and manufacturing services, and trading and business services.In addition, we also manage customers through community management, value added resellers, marketingand salesusing web-based technology,continued to focus on promoting data package options which target the youth segment which we market under our Loop brand. Our efforts to increase our subscribers and tele-account management.
ARPU include providing digital lifestyle and digital payment services which we provide as mobile-based digital life services.
Our Enterprise Service Division serveslargeenterprise customers including State-Owned Enterprises, national corporationsIn 2016, we continued to introduce new products and multinational corporations. Our Enterprise Service Division account managers and representativesprimarily manage relationships by conducting visitsmobile package options to appeal to our clients' offices. We categorize enterprisevarious groups of customers. For example, we introducedsimPATI Gigamax, a mobile package option which offers large internet quota and bonuses for accessing high definition streamed videos. In 2016, we also introducedKartu As Puas Internetan, a mobile package option which offers weekly and monthly data package options and a data package for accessing Facebook and Over The Top instant messaging applications.
Consumer Customer Facing Unit
For our consumer customer facing unit, which is responsible for our fixed portfolio, we market our IndiHome services based on the “more for less” framework, whereby customers intothirteen groups based onourcustomers’ lineget more benefits with less cost compared to the cost of business, namelybank management services, education management services, energy & resources services, financial management services, government management services, hospitality & business services, healthcare & welfare services, logistic & transport services, manufacturing & agribusiness services, media & communication services, military & police services, property & constructionthe individual services. In addition, we continued to add value-added services and trading & distribution services.
Our Wholesale Service Division catersfeatures to wholesaleour IndiHome products in 2016 in order to increase its attractiveness to potential customers. For instance, we began to offer customers increased internet speed and unlimited calls to cellular telephones at a fixed price. We also offer wifi.id services to our IndiHome customers, an add-on service which are categorized into the following carrier service groups:
–Groupcarrier service 1: handling OLO Telkomsel,PTHutchison CP Telecommunication (“Hutchison”), AXIS, PT Sampoerna Telekomunikasiallows such customers to enjoy unlimited internet access at all Indonesia andPTPasifik Satelit Nusantara.
–Groupcarrier service 2: handling OLO Indosat, XL-Axiata, Bakrie Telecom, Smart Telecom, Batam Bintan Telecom andPT Indonesia Comnets Plus (“ICON+”).
–Groupcarrier service 3: handling operators within the business scope of ISP, VoIP, closed user group, call center and satellite provider.
Our subsidiary, TII, caters to international carriers who provide TIMES portfolio overseas. The priority of provision of the servicesisdeterminedWi-Fi access points in line with the opportunity in every countries where TII operates. We operate account management teamswhich are headquartered in Jakarta, in Singapore, Hong Kong and Timor Leste.Beginning in 2013, TII commencedoperating telecommunication services inHong Kong-Macau, Timor Leste,Australia, Myanmar, Malaysia, TaiwanandThe United States of America.
35
Table of Content
Enterprise Customer Facing Unit
For ourenterprise customer facing unit, whichis responsible for our enterprise digital portfolio, we implement a "go to market" strategy under the Smart Connected Society program, which comprises: (i) a smart government initiative, under which we aim to become the Government's strategic information and communications technology ("ICT") partner by tailoring solutions that support the Government's ICT programs; (ii) an enterprise connected ecosystem initiative, under which we market end-to-end digital ICT solutions to our enterprise customers which address their specific as well as industry-wide needs and (iii) the SME digital society initiative, under which we market basic ICT solutions in bundled packages to SMEs in Indonesia.
2.Wholesale and International Customer Facing Unit
For our wholesale and international customer facing unit, which is responsible for our wholesale and international portfolio as well as our network infrastructure portfolio, we focused on implementing: (i) smart pricing, which is our strategy to tailor prices to particular types of customers and with the aim ofmaintaining interconnection traffic; and (ii) improving customer services in order to maintain strong relationships with our customers.
Digital ServiceTelkom Solution Houses and SME Centers Customer Facing Unit
We offer specialFor our digital service customer facing unit, which is responsible for our consumer digital portfolio,we implement a"Go To Market"strategywhich focuses on strengthening and improving digital innovation,including by:
·creating digital services towithuniquefeatures, such asdigital music, video, gaming, e-commerce and travel;
·designingdigital business models which we specifically tailor for each of our corporate customerscustomers;
·providing customer experience innovation throughadigital theme park, experience center and digital experiences atouroutlets;
·leveraging ourassets and inventory toobtainincreasinginsight intodigitalservices and customer experience; and
·growingthe portfolio ofourdigital business through our Telkom Solution Houses locatedinvestment in Jakarta, Denpasar and Surabaya. We also operate SME Centersdigital startups in Jakarta, Surabaya, Bandung, Palembang, Balikpapan and Makassar.Our SME Centers functionareasorder to be a community and business center.
3.part ofIndonesia'sdigital ecosystem.Contact Center
We provide a 24-hourcontactnumber “500250” for business customers and a 24-hour toll-free number “08001Telkom” (“08001835566”) forenterprisecustomers.
Service Level Guarantee ProgramDistribution Channels
We offer service level guarantees, which guarantee a specified minimum level of service to customers in terms of product quality and customer handling.
For individual customers, the program is availablefor fixed line, Flexias well as data and internet subscribers. The service level guarantee is applicable to customersapplying for new connections,a changein type of service,resolution of service disruption,resumption of disconnected serviceand complaints over customer billing. Under this program, we will provide non-cash compensation such as free subscriptions for a limited period, if we fail to meettheminimum standard.
For the corporate customer segment, the service level guarantee is provided under a contract agreed between us and the relevant customers. We offer service level guarantees to OLOs and certain wholesale customers who use our SL Digital, IP Transit and Metro-E products. Our guarantee covers the availability of our services and the time taken to install and repair the equipment we provide. We divide service levels guarantees for such customers into five classes of service (Bronze, Silver, Gold, Platinum and Diamond) which represent different levels of price, products and services offered and technical parameters guarantee.
Customer Satisfactionand Loyalty
We routinely engage independent market analysts to conduct surveys and market research on our customers' levels of satisfaction and loyalty. In 2013, we achieved the following levels of the Customer Satisfaction Index (“CSI”) and Customer Loyalty Index (“CLI”) using the “top two boxes” and “top three boxes with seven scales” methods, whereby survey participants are asked to rate their satisfaction and loyalty on a scale from one to five (or seven). CSI and CLI ratings are based on the percentage of participants which have provided the top two ratings out of five or top three ratings out of seven. Our CSI and CLI ratings are as follows:
–personal customer segment:80.16% in CSI and67.64% in CLI.
–business customer segment:91.23% in CSI and87.27% in CLI.
–enterprise customer segment:94.28% in CSI and97.26% in CLI.
DISTRIBUTION AND MARKETING STRATEGY
The following are theour primary distribution marketing channels for our products and services:
1.§ Plasa Telkom Outlets and GraPARIandGraPARICentersare outlets that functionoutletsthatfunction as walk-in customer service points, where customerswherecustomers have access to the full range ofTelkom andTelkomsel’s respectiveproducts and services, including billing, payment, subscription cancellation,promotionandcomplaint handling. As of December 31, 2016, wemanaged 566 Plasa Telkom andTelkomsel’s respective productsoutletsand 84 GraPARI centers in Indonesia and services.Customers can also access GeraiHalo outlets,seven internationalGraPARI centers (in Saudi Arabia, Singapore, Hong Kong, Macau, Taiwan and Malaysia), and had an additional332GraPARIcentersin Indonesia which arewere managed by third parties and provideparty business partners.Several of our GraPARI centers operate on a more limited range24-hour basis. As of cellular services. December 31, 2016, we also operated487GraPARI mobileunitswhich are sales points located in vehicles which can travel to reach customers across the country.
2.· ContactCentersAuthorized dealers and retail outletshandle enquiries regarding our are distribution outlets for Telkomsel products servicessuch as starter packs, prepaid SIM cards and customer transactions. Our contact/call centers currently do not handle payments. Ourcontact centers alsotop-up vouchers. We operate our customer care(telecaring)an extensive network of authorized dealers and telemarketing programs. retail outlets across Indonesia. These dealers are non-exclusive, and they receive a discount on all of the products they receive.
3.· Partnership Stores are extensions of our distribution channels, in cooperation with a variety of third-partythird party marketing outlets such as computer or electronic stores, banks through their ATM networks and others.
4.· Feet onTheStreetContact centersare sales agentscall centers that conduct direct marketingsupport our customers’ ability to access certain of our products particularly forourSpeedy products, through door-to-door sales, open table discussions, exhibitions, product demonstrations, andothersimilar activities.
5.Authorized dealers and retail outlets are sales and distribution outlets for a variety of telecommunication products such as Speedy Instan cards,Flexi subscription cards, starter packs, prepaid SIM cards and top-up vouchers. These dealers are non-exclusive, and they receive a discount on all of the products they receive.Retail outlets also include outlets jointly operated by us, Telkomsel and PT Pos Indonesia, as well as other outlets such as banks.
6.Account Management Teamswhomanage relationships with our individual, business, and corporate customers.
7.Telkom Solution Housesare places where an enterprise customer can obtain information on a variety of TIMES solutions, products and services, including making billing enquiries, submitting complaints and the latest technology.At these Telkom Solution Houses, we providefree live demonstrations (such as Speedy, Hotspot, PDN, IP-Phone), live demonstrations for commercialproducts(such as video conference), enterprise consultationaccessing certain promotions and ecosystem business solutions for customized TIMES for corporations,service features. We operate 24-hour contact center facilities in Jakarta,Bogor, Surabaya and simulated demonstrations (such as e-Payment & VPN over GSM and Flexi). Semarang.
36
Table of Content
8.· SME CenterAccount Management Teams are teams that manage relationships and account portfolios of large enterprises, Government agencies and medium-scale businesses.
·Saless Specialistsfunction is a team with a deep productand technicalknowledge in order to provide appropriate and effective recommendations of solutions to corporate customerswho worktogether withourAccountManagers.
·Tele Account Management is a teamthat supports our SME customers and prospective business customers through inbound and outbound calls for pre-sales, sales and other customer service requirements.
·Channel Partners serve as resellers that conducts sales and marketing activities to our enterprise customers to seek their specific requirements.
·Digital Touch Points are web and mobile application-based services which we provide to our IndiHome subscribers and corporate customers.We operateMy IndiHome,a communication center supported with advanced office facilities, a community center whereself-care mobile application-based service for IndiHome customers, that allows customers to register new subscriptions, manage payments and billing, report and monitor network problems, access video-on-demand services and manage customer reward programs. In addition,we operatewww.telkomsolution.com to promote the products and services that we offer under ourenterprise digital portfolio, andwww.smartbisnis.co.id to promote ourproducts and services to SME customers.
·Websites,we operatewww.telkom.co.id and www.telkomsel.com, which enable our customers can interact, and a commerce center especially for e-Commerce solutions.
9.Ourwebsite which providescustomerswith information on the entire rangeto access certain of our products and services. Available services multimedia as well as telephony, through the official companywebsites at www.telkom.co.idinclude e-Billing, registration, collective billing registration and www.telkomsel.com. submission of complaints.
·Social Media,we use social media, primarily Facebook, Instagram and Twitter, to enable customers to interact with us regarding our products and services.
Marketing StrategyLicensing
To provide national telecommunications services, we have a number of product and service licenses that are consistent with applicable laws, regulations or decrees.
Marketing communicationsOur license to provide IPTV services is in the process of undergoing periodic evaluation by the Government. We have secured new licenses that have been adjusted as required, which are as follows:
Cellular
Telkomsel holds licenses to operate a nationwide mobile cellular telephone network using 15 MHz of spectrum allocation in the800/900 MHzfrequency (which includes 7.5 Mhzofspectrum allocationwhich was reallocated to Telkomsel in connection with the termination of our fixed wireless business), 22.5 MHz ofspectrum allocationin the 1.8GHz frequency and distribution channels are important in ensuring that our product/service offerings are directed at and reach15 MHz ofspectrum allocationin the right customer segment.2.1GHz frequency. The licenses do not have a set expiry date, but will be evaluated every five years. In addition, Telkomsel holds permits and licenses from and registrations with certain regional governments and/or governmental agencies, primarily in connection with its operations in such regions, the properties it owns and/or the construction and use ofits BTSs.
In connection with the termination of our fixed wireless business and transfer of such business to marketing using traditional (offline) media such as advertisement placementTelkomsel, in television, print media, newspaper, and radio as well as during local events, we have also begun to intensify product marketingSeptember 2014, the MoCI, through Decision Letter No.934 of 2014, approved the digital (online) media within various digital communities as well as building popularity in social networks.
Plasa Telkom and GraPARI outlets are our direct distribution channels. In addition to its function as a direct channelreallocation of the 800 MHz frequency previously used for our product distribution,these outlets also handles after-sales service for our customers,fixed wireless business to Telkomsel. Telkomsel completed the takeover in October 2016.
The MoCI has announced plans to hold a limited auction of unused radio frequency spectrum in the 2100 MHz and disseminates information on programs, promotions2300 MHz frequencies by the middle of 2017.
Fixed Network and products to customers and end users. This distribution channel enables us to monitor and improve service quality, complaint handling performance, and customer satisfaction level in general. As of December 31, 2013, we operated572 Plasa Telkom and 86GraPARI outlets through Indonesia.
In the distribution of Telkom Flexi and Speedy Instan card (SPIN Card)and mobile cellularproducts, we engageapartnership of best-performing dealers, giving each of these partners a designated and exclusive sales area ("cluster") to manage. As of December 31, 2013, wehave partnerships with 53 official dealers that manage more than 83,000 retail outlets in 96 clusters. In addition,we also have partnership arrangements with seven national retail partners and 17national banking partners.Basic Telephony Services
For kartuHalo, Telkomsel focuses on corporateWe have the following licenses to operate local fixed network, fixed domestic long distance network, fixed international call and professional customers with high usage volumes. Marketing for this segment is undertaken by special corporate account teams, which are also responsible for maintaining long-term relations with our customers through efforts to provide solutions suitable to the needs of the corporate customers.
fixed closed network:
The·simPATI and Kartu As products are designedMoCI Decree No.839of2016(onlicense to appeal towards a much wider target segment and particularly to younger customers. Telkomsel uses above and below the line marketing channels to promote its brands, including campaigns aimed at schools and special interest groups, placing print advertisements, billing insertions, point-of-sale presentations, and events promotion and sponsorship.operate fixed domestic long distance network);
In keeping with changes in consumer behavior and lifestyle trends, we consistently develop sales partnerships on a national scale with number of partners. These comprise of sales ofbundled products through sales outlets owned by the respective partner, such as Samsung and Intel, among others.
As part of our strategy to promoteinternet technology to the broader public and to improve customer knowledge about broadbandinternet products and application, we have engaged in an initiative to develop Broadband Learning Centers ("BLCs"). At our BLCs, we provide facilities including air conditioned rooms, personal computers withinternet connections, blackboards, educational materials, and teachers and other speakers fromour internal as well as in cooperation with other institutions. The BLCs program primarily targets non-internet users, as well as communities that are interested indeepening their knowledgeon internet and information technology topics, such as students and collegues. In addition tofacilitate events, the BLCs facilities can alsobeused by communitiesfor events related toeducation andinformation technology development. As of December 31, 2013, we operate a total of 218 BLCs in various locations throughout Indonesia.
Telecommunications Industry in Indonesia
Indonesia's telecommunication industry has shown rapid growth ever since the transformation of the telecommunication sector from monopoly to competitive, enacted by the Government through Law No.36 Year 1999 on Telecommunication. This growth is moreover further accelerated by advances in communication technology using radio frequencies, as alternative telecommunication means to communication through cable networks and satellite.
Compared to the growth of fixed wireline telephony for many decades that eventually stagnated at only around 9.4 million lines, the telecommunication teledensity in Indonesia has since experienced a very significant jump in less than 20 years to more than 310 million lines, drivenprimarilyby the growth ofcellular telephony, as well asfixed wireless telephony. The cellular telephony business also continues to grow through a variety of innovations as well as constant adaptation to changes in market demands and consumer preferences. While the growth in voice and Short Messaging Service (“SMS”) has showed signs of declining in recent years, there was at the same time a marked strengthening in the growth of data communication and mobile internet access services.
37
Table of Content
·MoCI Decree No.844of2016(on license to operate fixed closed network)("MoCI Decree No.844/2016");
There·MoCI Decree No.846of2016(on license to operate fixed international network) ("MoCI Decree No.846/2016"); and
·MoCI Decree No.948of2016(on license to operate circuit switched based local fixed line network).
These licenses do not have a set expiry date, but will be evaluated every five years.
International Calls
We have a license to operate a fixed network to provide international call services pursuant toMoCI Decree No.846/2016.
We have a license to operate a fixed closed network pursuant toMoCI Decree No.844/2016. This license allows us to lease installed fixed closed network to, among others, telecommunication network and service operators, and to provide an international telecommunication transmission facility through a SCCS directly to Indonesia for overseas telecommunication operators.
According to MoCI Regulation No.16/PER/M.KOMINFO/9/2005 (on the provision of international telecommunications transmission facilities through SCCS) ("MoCI Regulation No.16/2005"), overseas telecommunications operators wishing to provide international telecommunications facilities through the SCCS directly to Indonesia are required to set up a partnership with a fixed network of international call services or closed fixed network provider. In line with MoCI Regulation No.16/2005, the international telecommunication transmission facilities provided through SCCS are served by us on the basis of landing rights attached to our license to operate fixed network of international call services. We have also secured landing rights based on the landing right Letter No.006-OS/DJPT.6/HLS/3/2010 from the MoCI.
Directorate General of Post and Telecommunication of the MoCI (“DGPT”) Decree No.93 of 2016 (on limited fixed network license) granted our subsidiary, Telin, a license to operate a fixed closed line network which enables Telin to provide international infrastructure services. Separately, Telin secured landing rights in Indonesia from the DGPT to provide international telecommunications transmission facilities through SCCS.
The foregoing licenses do not have a set expiry date, but they will be evaluated every five years.
VoIP
We are licensed to provide internet telephony services for public utilization for commercial use as provided under DGPI Decree No.127 of 2016 (on internet telephony services for public utilization). Telkomsel is also licensed to provide public VoIP services based on DGPT Decree No.65 of 2015 (internet telephony services for public utilization). These licenses do not have a set expiry date, but they will be evaluated every five years.
ISP
We are licensed as an ISP under MoCI Decree No.2176 of 2016 (on internet access services). Telkomsel is also licensed to provide multimedia internet access services with nation-wide coverage under DGPI Decree No.19 of 2016 (on internet access services). These licenses do not have a set expiry date, but tthey will be evaluated every five years.
Internet Interconnection Service
We hold a license to provide internet interconnection services pursuant to DGPI Decree No.331/KEP/M.KOMINFO/09/2013 (on internet interconnection service (network access point)). This license does not have a set expiry date, but it will be evaluated every five years.
Data Communication System (“SISKOMDAT”)
We have a license to provide data communication system services pursuant to DGPI Decree No.191 of 2016 (on data communication system services). This license does not have a set expiry date, but it will be evaluated every five years.
Table of Content
Payment Method Using e-Money
Following the implementation of Bank Indonesia Regulation No.11/11/PBI/2009, as amended by PBI No.14/2/PBI/2012, and Circular Letter of Bank Indonesia No.11/10/DASP, which was last amended by Circular Letter of Bank Indonesia No.18/33/DKSP (on the usage of card-based payment instruments (“APMK”)) and Bank Indonesia Regulation No.11/12/PBI/2009, as amended by Bank Indonesia Regulation No.18/17/PBI/2016 on e-Money, Bank Indonesia has redefined the meaning of “principal” and “acquirer” in operating APMK and e-Money business. In light of these regulations, Bank Indonesia confirmed our status as an issuer of e-Money based on letter of Directorate of Accounting and Payment System of Bank Indonesia No.11/13/DASP. We operate our e-Money business under the brand names “T-cash”. With the issuance of Bank Indonesia Circular Letter No.9/9/DASP, Telkomsel is also permitted to conduct APMK activities, with the launch of TelkomselTunai prepaid card.
These permits do not havea set expiry date or a period of adjustment as long as: (i)we and Telkomsel continue to conduct the relevant businesses andwe do not violate any applicable regulation; and(ii) the Government does not amend or revoke such permits.
Remittance Service
We and Telkomsel have licenses to operate as money transfer services providers pursuant to Bank Indonesia letters No.11/23/Bd/8 of 2009 and No.12/48/DASP/13 of 2009.These permits do not havea set expiry date or a period of adjustment as long: (i) aswe and Telkomsel continue to conduct the relevant businesses, (ii) we do not violate any applicable regulation and (iii) the Government does not amend or revoke such permits.
IPTV
On April 27, 2011, we and PT Indonusa Telemedia, formerly known as TelkomVision (“Indonusa”) as a consortium obtained a license to operate IPTV services through MoCI Decree No.MCIT.160/KEP/M.KOMINFO/04/2011 of 2011. Our license to provide IPTV services is undergoing periodic evaluation by the Government.
Construction Services Business License (“IUJK”)
In 2015, we renewed our Level 5 IUJK which permits us to conduct disaster recovery system construction services, which is currently valid until June 2018.
Content Provider Services
Wehaveapplied fora contentproviderservices license which is expected tocomplete in 2017.
Trademarks, Copyrights, Industrial Designs and Patents
We constantly seek to develop product and service innovations in line with a dynamic business portfolio. To provide both protection for and recognition of creativity and innovation, we have registered a number of factors or conditions that point to good growth prospects for Indonesia's telecommunication industry, including:
1.Indonesia's demographics,intellectual property rights, including trademarks, copyrights, and patents with the fourth largest populationDirectorate General of Intellectual Property Rights at the Ministry of Law and Human Rights.
The intellectual property rights we have registered include: (i) trademarks for our products and services, corporate logo and name; (ii) copyrights on our corporate name and logo, product and service logos, computer programs, research and songs; and (iii) patents on technological inventions in the worldform of telecommunications products, systems and methods.
Telecommunications Industry in Indonesia
The Indonesian economy recorded a healthy growth of 5.0% in 2016 according to theIndonesian CentralBureau ofStatistics.The telecommunications and information industry in Indonesia also recorded a healthy growth of 8.9% in 2016 according to theIndonesian CentralBureau ofStatistics. This demonstrates that the need for telecommunication and access to information is increasing and has become a basic need of Indonesian society and that people are continuing to increase telecommunication spending driven by an increase in purchasing power.
Table of Content
The telecommunications industry, especially the mobile segment, is generally characterized by a relatively healthy competitive situation with a rational pricing strategy. It is a combination of industry players who are more focused on service and network quality and the positive result of industry consolidation that occurred in the past.
The penetration of SIM cards in the cellular industry in Indonesia is quite high, at well over 100%, making continued growth in penetration increasingly limited. By subscriber numbers, the three largest cellular operators in Indonesia are Telkomsel, Indosat and XL Axiata, which collectively accounted for more than 80% of the market share based on the estimated number of total subscribers as of December 31, 2016. As of December 31, 2016, Telkomsel remained the largest cellular provider in Indonesia, with approximately 173.9 million cellular subscribers and a fast growing middle class segment,market share of approximately 48% based on the estimated number of total subscribers.
The shifting trend from legacy services (such as voice and SMS) to data services continues to advance, driven by cheaper prices of smartphones as well as Indonesia's economythe rapidly growing youth segment. Data traffic has grown significantly, while SMS service traffic has decreased. We expect that has shown stable and respectable growth in recent years, are expected to drive further demands for telecommunication and data services.
2.While internetthis trend will continue, given that smartphone penetration in the countryIndonesia is still relatively low comparedwith relatively low data consumption by smartphone users, and that the growth of the telecommunications industry will be driven by the growth of data services.
One of the main challenges faced by the industry is the increasing use of Over The Top services that has become a substitute for voice and SMS services, in line with the growing number of smartphone users. This has happened not only in Indonesia, but also in developed countries where smartphone penetration is high.
The demand for fixed broadband services in Indonesia continued to peer countriesincrease in 2016, especially in the region, peoplelarge cities, marked by an increase in total broadband subscribers. The Indonesian public appreciates the importance of high-quality internet connectivity to houses as evidenced by the level of investment made by the Government and private enterprises for the development of fiber optic networks. Currently, the penetration of fixed broadband services in Indonesia is becoming increasingly exposed, andare increasinglyadopting global trendsrelatively lower than in digital lifestyle,some neighboring countries such as shown especiallySingapore and Malaysia. Therefore, we expect that the fixed broadband segment will continue to grow in the markedfuture, in line with the expected growth of the middle class in Indonesia.
Data consumption in the mobile segment continued to increase, and it is expected that the consumption level per user will continue to grow from the current average data consumption per user. Such growth in data consumption will require significant capital expenditure in order to provide the necessary increase in capacity and coverage to accommodate such growth. The level of smartphone usageARPU in Indonesia is also relatively low compared to the global or Asia Pacific average.
The increasing penetration of smartphones and data consumption has fueled the growth of digital content and applications. With better mobile data connectivity, people have begun consuming a variety of digital content and application services beyond social media, such as e-Commerce, digital payment, digital advertising, games and video streaming, and it has also led to a variety of innovative applications such as ridesharing, delivery and marketplace applications. We expect for this trend to continue in the future.
For the fixed broadband segment, we and PT Link Net Tbk, which is affiliated with more affordable pricesthe Lippo Group and operates under the "LinkNet" brand, have a significant market share. Within the telecommunication tower business, we had approximately 25,700 towers, comprising approximately 8,700 towers owned by Mitratel and approximately 17,000towers owned by Telkomsel as of December 31, 2016, which was larger than the number of towers that were owned by each of Tower Bersama, Protelindo and PT Solusi Tunas Pratama Tbk.
Under the Indonesia Broadband Plan 2014-2019, which was implemented through Presidential Decree No.96 of 2014, the Government intends to facilitate an increase in access to fixed broadband infrastructure in Indonesia. Access to fixed broadband infrastructure in urban areas (with capacity of at least 20 Mbps) is targeted to reach 71% of households and 30% of the urban population, while access to mobile broadband infrastructure (with capacity of at least 1 Mbps) is targeted to reach the entireurbanpopulation by 2019. For rural areas, access to fixed broadband infrastructure (with capacity of at least 10 Mbps) is targeted to reach 49% of households and 6% of the rural population, while access to mobile broadband infrastructure (with capacity of at least 1 Mbps) is targeted to reach 52% of theruralpopulation by 2019. In the Indonesia Broadband Plan 2014-2019, broadband is defined as internet access with guaranteed nonstop connectivity, guaranteed durability and network security, as well as higherlevelstriple-play capability comprised of social networking media activities.voice, internet and IPTV services with a minimum speed of 2 Mbps for fixed access and 1 Mbps for mobile access.
Table of Content
Competition
Measures following the Telecommunications Law’s adoption in 2000 moved the Indonesian telecommunications sector from a duopoly between Indosat and us to one with multiple competing providers. See “Others — Legal Basis and Regulation — Introduction of Competition in the Indonesian Telecommunications Industry”.
Competition Law
TheIndonesian telecommunications sector is regulated by the Telecommunications Law, which became effective on September 8, 2000. The Telecommunications Law sets guidelines for industry reforms, including industry liberalization, to facilitate new entrants as well as to increase transparency and competition. The Telecommunications Law abolished the concept of "organizing entities" in the industry, which terminated the special status of Telkom and Indosat as the organizing body responsible for coordinating telecommunication services domestically and internationally. In order to increase competition, the Telecommunications Law prohibits monopolistic practices and unfair competition among fellow telecommunication operators.
The Telecommunications Law is implemented through various Government regulations and ministerial regulations, including Government Regulation No.52/2000, MoCI Regulation No.1/PER/M.KOMINFO/01/2010 (on provision of telecommunication networks, as amended by MoCI Regulation No.7 of 2015, Decree of the Minister of Transportation No.KM33 of 2004 (on monitoring of fair competition of the fixed network and basic telephone service operations) and Decree of the Minister of Transportation No.KM.4 of 2001 (on the national basic technical plan 2000 for the national telecommunications development) ("National Technical Telecommunications Plan"). The National Technical Telecommunications Plan has been amended several times, most recently by MOCI Decree No.17 of 2014. Along with the Telecommunications Law, the National Technical Telecommunications Plan determines the basic vision for the development of Indonesia’s telecommunications regulator.
The government is currently encouraging healthy competition and transparency in the telecommunications sector, even though the government does not prevent operators from obtaining and increasing its dominance in the market through specific regulations. Nevertheless, the government prohibits market leading operators from abusing its dominant position.
Competition in the telecommunications sector, like all Indonesian business sectors, is also governed more generally by the Competition Law. The Competition Law prohibits agreements and activities which amount to unfair business competition and an abuse of a dominant market position. Pursuant to the Competition Law, the KPPU was established as Indonesia’s antitrust regulator with the authority to enforce the provisions of the Competition Law.
The Competition Law is implemented by various regulations, including Government Regulation No.57/2010 (on mergers and acquisitions potentially causing monopolistic practices or unfair business practices) ("GR No.57/2010"). GR No.57/2010 permits voluntary consultation with the KPPU prior to a merger or acquisition, which will result in the KPPU issuing a non-binding opinion. GR No.57/2010 also requires that a mandatory report be made to the KPPU after a merger or acquisition is completed if the transaction exceeds certain asset or sales value thresholds.
Cellular
We operate our cellular service business through our 65% majority-owned subsidiary, Telkomsel.
As of December 31, 2016, Telkomsel remained the largest cellular provider in Indonesia, with approximately 173.9 million cellular subscribers and a market share of approximately 48% based on the estimated number of total subscribers. The next largest providers were Indosat and XL Axiata, which had a market share of approximately 24% and 13%, respectively, based on the estimated number of total subscribers as of December 31, 2016. Several other smaller GSM and CDMA operators also provide cellular services in Indonesia, including Hutchison, which is part of the Hutchison Asia Telecom Group and operates under the "3" or "Tri" brand, and Smartfren Telecom, which is part of the Sinar Mas Group.
Table of Content
The penetration of SIM cards in the cellular industry in Indonesia is quite high, at well over 100%, making continued growth in penetration increasingly limited. There were approximately 364.3 million cellular subscribers in Indonesia as of December 31, 2016, a 8.9% increase from approximately 334.5 million as of December 31, 2015 according to BMI Research (a Fitch Group company). The shifting trend from legacy services (such as voice and SMS) to data services continues to advance, driven by cheaper prices of smartphones as well as the rapidly growing youth segment. Data traffic has grown significantly, while SMS service traffic has decreased. We expect thatthethat this trend will continue, given that smartphone penetration in Indonesia is still relatively low with relatively low data consumption by smartphone users, and that the growth of mobilethe telecommunications industry will be driven by the growth of data services.
The following table sets out information as of December 31, 2016 for each of three leading cellular providers in Indonesia: | |
| Operator | |
| Telkomsel | | Indosat | | XL Axiata | |
Launch date | 1995 | | 1967 | | 1989 | |
2G, 3G and/or 4G spectrum allocation (GSM 900 MHz) | 15 MHz** | | 10 MHz | | 7.5 MHz | |
2G, 3G and/or 4G spectrum allocation (GSM 1.8 GHz) | 22.5 MHz | | 20 MHz | | 22.5 MHz | |
3G spectrum allocation (2.1 GHz) | 15 MHz | | 10 MHz | | 15 MHz | |
Market share* | 48% | | 24% | | 13% | |
Subscribers* | 173.9 million | | 85.7 million | | 46.5 million | |
(*)As ofDecember 31, 2016 | |
(**) Includes 7.5 Mhz which was reallocated to Telkomsel in connection with the termination of our fixed wireless business. | |
Fixed Services
Our exclusive right to provide domestic fixed line telecommunications services in Indonesia ended following the Telecommunications Law’s implementation in 2000. We compete with other major fixed broadband service providers such as PT Link Net Tbk, First Media and PT Supra Primatama Nusantara (BizNet Networks) as well as new providers such as PT Media Nusantara Citra Tbk and PT Eka Mas Republik (an affiliate of Smartfren Telecom which operates under the "MyRepublic" brand).
International Direct Dialing (IDD)
We compete in traditional IDD services (non-VoIP) in Indonesia primarily with Indosat. However, in line with development of digital technology, our IDD services also face competition from VoIP and other Over The Top voice services such as Skype, WhatsApp and Line.
Voice over Internet Protocol (VoIP)
We formally launched our voice service through VoIP technology in September 2002. VoIP uses data communications to transfer voice traffic over the internet, which usually provides substantial cost savings to subscribers. A number of other companies, including XL Axiata, Indosat, PT Atlasat Solusindo, PT Gaharu Sejahtera, PT Satria Widya Prima, PT Primedia Armoekadata Internet and PT Jasnita Telekomindo also provide licensed VoIP services will continuein Indonesia.
We currently offer our primary VoIP service “Telkom Global-01017” and the lower-cost alternative “Telkom Save”. Telkom Save offers discounted rates for certain countries to which there is heavy traffic from Indonesia while offering regular VoIP tariff rates for other countries. In addition to other VoIP operators, we also compete with Over The Top voice services such as Skype, Whatsapp and Line.
Satellite
The Asia Pacific region and especially Southeast Asia continues to need satellites for both telecommunications and broadcasting infrastructure, due to the characteristics of the region as an archipelago. The capabilities provided by satellites include cellular backhaul, broadband backhaul, enterprise network, occasional usage TV, military and government network, video distribution, DTH television, flight communication and disaster recovery.
Table of Content
We compete with a number of other satellite operators with satellites covering Southeast Asia and South Asia, and several operators are in the process of developing satellites with coverage over these regions. However, we believe that demand for satellite transponder capacity still exceeds current supply. We are currently conducting in-orbit performance tests on the Telkom-3S satellite, which we expect to be fueled oncompleted by April 2017 and are currently developing the backTelkom-4 satellite as a replacement for the Telkom-1 satellite, which is currently planned for launch in the third quarter of 2018. At the completion of the increasing popularityin-orbit performance tests of smartphones, tabletsthe Telkom-3S satellite, we plan to locate it at orbital slot 118 E to replace the Telkom-2 satellite and other internet-enabled mobile devicestransfer all of the Telkom-2 satellite's transmission services to it. The Telkom-2 satellite currently operates at orbital slot 118 E but we plan to relocate it to orbital slot 157 E.
Tower
As of December 31, 2016, we had approximately 25,700 towers, comprised of approximately 8,700 towers owned by Mitratel and approximately 17,000towers owned by Telkomsel, which was larger than the number of towers that were owned by each of Tower Bersama, Protelindo and PT Solusi Tunas Pratama Tbk, which are our principal competitors in Indonesia, faster data transmission of wireless networks, and increasingly affordable smart devices and mobile internet services.the towers business.
3.Others
The increasingly opendynamic development of the telecommunications sector has opened up new opportunities, particularly with the increasing growth ofOverTheTop services which provide a substitute service to basic telecommunications services such as voice and tight competition amongtelecommunication operators,SMS. CertainOverTheTop service providers are particularly popular, including WhatsApp, Facebook, Line and many others. The presence of theseOverTheTop services has affected the use of legacy services, particularly SMS, which is expected to resultin improved service quality, higher industry efficiency, and constant innovationshas resulted in products or services, and will eventually drive more growthtraffic falling in Indonesia's telecommunication industry.recent years.
Legal Basis and RegulationCompetition Law
The framework for the telecommunications industry is comprised of specific laws, government regulations, ministerial regulations and ministerial decrees enacted and issued from time to time. The current telecommunications policy was first formulated and articulated in the Government’s “Blueprint of the Indonesian Government’s Policy on Telecommunications”, contained in MoC Decree No.KM.72/1999 dated September 17, 1999 which was intended to:
-increase the telecommunication sector’s performance in the era of globalization;
-liberalize the sector with a competitive structure by removing monopolistic controls;
-increase transparency and predictability of the regulatory framework;
-create opportunities for national telecommunications operators to form strategic alliances with foreign partners;
-create business opportunities for small and medium enterprises; and
-facilitate new job opportunities.
A.Telecommunications Law
TheTheIndonesian telecommunications sector is primarily governedregulated by Law No.36year1999 (“the Telecommunications Law”),Law, which became effective on September 8, 2000. The Telecommunications Law sets guidelines for industry reforms, including industry liberalization, facilitation ofto facilitate new entrants and enhancedas well as to increase transparency and competition.
The Telecommunications Law eliminatedabolished the concept of “organizing entities”therebyendingour andIndosat’s responsibility"organizing entities" in the industry, which terminated the special status of Telkom and Indosat as the organizing body responsible for coordinating domestictelecommunication services domestically and international telecommunications services, respectively. To enhanceinternationally. In order to increase competition, the Telecommunications Law prohibits monopolistic practices and unfair competition among telecommunicationsfellow telecommunication operators.
The Telecommunications LawwasLaw is implemented through severalvarious Government Regulations, Ministerial Regulationsregulations and Ministerial Decrees. The most important ofsuchministerial regulations, include:
-including Government Regulation No.52/2000, regarding Telecommunications Services;
-MoCI Regulation No.1/PER/M.KOMINFO/01/2010 dated January 25, 2010 regarding Operation(on provision of Telecommunications Networks;
-MoC Decree No.KM.21/2001 regarding the Provision of Telecommunications Services thatwas most recently amendedbytelecommunication networks, as amended by MoCI Regulation No.31/PER/M.KOMINFO/09/2008 regarding the Third AmendmentNo.7 of 2015, Decree of the Minister of Communication No.KM.21/Transportation No.KM33 of 2004 (on monitoring of fair competition of the fixed network and basic telephone service operations) and Decree of the Minister of Transportation No.KM.4 of 2001 regarding(on the Provisionnational basic technical plan 2000 for the national telecommunications development) ("National Technical Telecommunications Plan"). The National Technical Telecommunications Plan has been amended several times, most recently by MOCI Decree No.17 of 2014. Along with the Telecommunications Services; Law, the National Technical Telecommunications Plan determines the basic vision for the development of Indonesia’s telecommunications regulator.
-MoC Decree No.33/2004 regarding Supervision of Healthy The government is currently encouraging healthy competition and transparency in the telecommunications sector, even though the government does not prevent operators from obtaining and increasing its dominance in the market through specific regulations. Nevertheless, the government prohibits market leading operators from abusing its dominant position.
Competition in the Provisiontelecommunications sector, like all Indonesian business sectors, is also governed more generally by the Competition Law. The Competition Law prohibits agreements and activities which amount to unfair business competition and an abuse of Fixed Networka dominant market position. Pursuant to the Competition Law, the KPPU was established as Indonesia’s antitrust regulator with the authority to enforce the provisions of the Competition Law.
The Competition Law is implemented by various regulations, including Government Regulation No.57/2010 (on mergers and Basic Telephony Services;acquisitions potentially causing monopolistic practices or unfair business practices) ("GR No.57/2010"). GR No.57/2010 permits voluntary consultation with the KPPU prior to a merger or acquisition, which will result in the KPPU issuing a non-binding opinion. GR No.57/2010 also requires that a mandatory report be made to the KPPU after a merger or acquisition is completed if the transaction exceeds certain asset or sales value thresholds.
Cellular
We operate our cellular service business through our 65% majority-owned subsidiary, Telkomsel.
As of December 31, 2016, Telkomsel remained the largest cellular provider in Indonesia, with approximately 173.9 million cellular subscribers and
-MoC Decree No.KM.4/2001 dated January 16, 2001 regarding a market share of approximately 48% based on the Determinationestimated number of Fundamental Technical Plan National 2000 for National Telecommunications Development most recently amended by MoCI Regulation No.09/PER/M.KOMINFO/06/2010 dated June 9, 2010 regardingtotal subscribers. The next largest providers were Indosat and XL Axiata, which had a market share of approximately 24% and 13%, respectively, based on the sixth amendmentestimated number of MoC Decree No.KM.4/2001 regardingtotal subscribers as of December 31, 2016. Several other smaller GSM and CDMA operators also provide cellular services in Indonesia, including Hutchison, which is part of the DeterminationHutchison Asia Telecom Group and operates under the "3" or "Tri" brand, and Smartfren Telecom, which is part of Fundamental Technical Plan National 2000 for National Telecommunications Development.
38
Table of Content
B.Telecommunications Regulators
In February 2005,The penetration of SIM cards in the authoritycellular industry in Indonesia is quite high, at well over 100%, making continued growth in penetration increasingly limited. There were approximately 364.3 million cellular subscribers in Indonesia as of December 31, 2016, a 8.9% increase from approximately 334.5 million as of December 31, 2015 according to regulateBMI Research (a Fitch Group company). The shifting trend from legacy services (such as voice and SMS) to data services continues to advance, driven by cheaper prices of smartphones as well as the rapidly growing youth segment. Data traffic has grown significantly, while SMS service traffic has decreased. We expect that this trend will continue, given that smartphone penetration in Indonesia is still relatively low with relatively low data consumption by smartphone users, and that the growth of the telecommunications industry was transferredwill be driven by the growth of data services.
The following table sets out information as of December 31, 2016 for each of three leading cellular providers in Indonesia: | |
| Operator | |
| Telkomsel | | Indosat | | XL Axiata | |
Launch date | 1995 | | 1967 | | 1989 | |
2G, 3G and/or 4G spectrum allocation (GSM 900 MHz) | 15 MHz** | | 10 MHz | | 7.5 MHz | |
2G, 3G and/or 4G spectrum allocation (GSM 1.8 GHz) | 22.5 MHz | | 20 MHz | | 22.5 MHz | |
3G spectrum allocation (2.1 GHz) | 15 MHz | | 10 MHz | | 15 MHz | |
Market share* | 48% | | 24% | | 13% | |
Subscribers* | 173.9 million | | 85.7 million | | 46.5 million | |
(*)As ofDecember 31, 2016 | |
(**) Includes 7.5 Mhz which was reallocated to Telkomsel in connection with the termination of our fixed wireless business. | |
Fixed Services
Our exclusive right to provide domestic fixed line telecommunications services in Indonesia ended following the Telecommunications Law’s implementation in 2000. We compete with other major fixed broadband service providers such as PT Link Net Tbk, First Media and PT Supra Primatama Nusantara (BizNet Networks) as well as new providers such as PT Media Nusantara Citra Tbk and PT Eka Mas Republik (an affiliate of Smartfren Telecom which operates under the "MyRepublic" brand).
International Direct Dialing (IDD)
We compete in traditional IDD services (non-VoIP) in Indonesia primarily with Indosat. However, in line with development of digital technology, our IDD services also face competition from VoIP and other Over The Top voice services such as Skype, WhatsApp and Line.
Voice over Internet Protocol (VoIP)
We formally launched our voice service through VoIP technology in September 2002. VoIP uses data communications to transfer voice traffic over the MoCinternet, which usually provides substantial cost savings to a newly-established Ministry, the MoCI. Pursuant to authorities assigned to him through Telecommunication Law, the Minister of Communication andInformation sets policies, regulates, supervises and controls telecommunications industry in Indonesia. On October 28, 2010,MoCI engaged in certain organizational and administrative reforms that included transferringlicensing andregulatory authority to two newly established general directorates,the Directorate General of Posts and Informatics Resources and Equipment (“DGRE”) and Directorate General of Post and Informatics (“DGPI”)pursuant toMoCI Regulation No.17/PER/M.KOMINFO/10/2010regarding the Organization and Administration of Ministry of Communication andInformation. Following thereforms,certain adjustments were made through MoCI Regulation No.15/PER/M.KOMINFO/06/2011 dated June 20, 2011regarding title adjustments in asubscribers. A number of Decrees and/or MoCI regulations that regulate Special Materialsother companies, including XL Axiata, Indosat, PT Atlasat Solusindo, PT Gaharu Sejahtera, PT Satria Widya Prima, PT Primedia Armoekadata Internet and PT Jasnita Telekomindo also provide licensed VoIP services in PostIndonesia.
We currently offer our primary VoIP service “Telkom Global-01017” and Telecommunications and/or in Decreesthe lower-cost alternative “Telkom Save”. Telkom Save offers discounted rates for certain countries to which there is heavy traffic from Indonesia while offering regular VoIP tariff rates for other countries. In addition to other VoIP operators, we also compete with Over The Top voice services such as Skype, Whatsapp and Line.
Satellite
The Asia Pacific region and especially Southeast Asia continues to need satellites for both telecommunications and broadcasting infrastructure, due to the characteristics of the Director General of Postsregion as an archipelago. The capabilities provided by satellites include cellular backhaul, broadband backhaul, enterprise network, occasional usage TV, military and Telecommunications, which transfer all substances related tothepostalgovernment network, video distribution, DTH television, flight communication and telecommunications sectors to the DGPI including licensing, numbering, interconnection, universal service obligation and business competition. Meanwhile, matters related to radio frequency spectrum and standardization of telecommunications equipments were transferred to the DGRE.
Following the enactment of the Telecommunications Law, the MoC established an independent regulatory body as stipulated in MoC Decree No.KM.31/2003 dated July 11, 2003 regarding the Establishment of the ITRA which was later revokedby MoC Regulation No.KM.36/PER/M.KOMINFO/10/2008 dated October 31, 2008and amendedby MoCI Regulation No.1/PER/M.KOMINFO/02/2011 dated February 7, 2011 (“MoCI Regulation No.36/2008”). Pursuant to MoCI Regulation No.36/2008,theITRAwas assigned the authority to regulate the Indonesian telecommunication industry, including the provision of telecommunication networks and services. TheITRA which is chaired by the Director General of Post and Informatics Operations and comprises of nine members, including sixmembers of the public, andthree members selected from Government institutions (DGRE and Director of DGPI anda government representative appointed by the Minister of Communication and Information).Other regulatory functions of the ITRA include:
-licensing of telecommunication networks and services;
-implementation of operational and service quality standards;
-governance of interconnection charges;
-regulating telecommunicationequipment standards; and
-settlement of disputes between network operators and service providers.
Finally, oversight authority of the ITRA covers:
-operating performance;
-competition; and
-utilization of telecommunication equipments.
C.Classification and Licensing of Telecommunications Providers
TheTelecommunications Law organized telecommunication services intofollowingthree categories:
-provision of telecommunication networks;
-provision of telecommunication services; and
-provision of special telecommunications services.
Licenses issued by MoCI are required for each category of telecommunicationsservices. MoCI Regulation No.1/2010 and MoC Decree No.KM.21/2001 dated May 31, 2001 regarding the Operation of Telecommunications Services,as amendedby MoCI Regulation No.31/PER/M.KOMINFO/09/2008 dated September 9, 2008, are the principal implementing regulations governing licensing.
MoCI Regulation No.1/2010classified network operations into fixed and mobile networks. Fixed network operations are grouped into:
-local fixed network operations;
-fixed domestic long distance operations;
-fixed international connection operations; and
-fixed closed network operations.
39
Table of Content
The mobile network operationswere divided into:
-terrestrial mobile network operations;
-mobile cellular network operations;We compete with a number of other satellite operators with satellites covering Southeast Asia and
-satellite mobile network operations.
MoC Decree No.KM.21/2001categorized the provision of services into basic telephony services, value-added telephony services, South Asia, and multimedia services. The provision of multimedia services isfurthercategorized intoprovision ofinternet services, network access point services, public internet telephony services, and data communication system services. The provision of network services and of telecommunications services requires separate licenses according to the established categories. Special telecommunications license held forprivate purposes, broadcasting, as well as defense and national securityseveral operators are provided separately.
D.Introduction of Competition in the Indonesian Telecommunications Industryprocess of developing satellites with coverage over these regions. However, we believe that demand for satellite transponder capacity still exceeds current supply. We are currently conducting in-orbit performance tests on the Telkom-3S satellite, which we expect to be completed by April 2017 and are currently developing the Telkom-4 satellite as a replacement for the Telkom-1 satellite, which is currently planned for launch in the third quarter of 2018. At the completion of the in-orbit performance tests of the Telkom-3S satellite, we plan to locate it at orbital slot 118 E to replace the Telkom-2 satellite and transfer all of the Telkom-2 satellite's transmission services to it. The Telkom-2 satellite currently operates at orbital slot 118 E but we plan to relocate it to orbital slot 157 E.
Tower
In 1995, we were granted a monopoly to provide local fixed line telecommunications services untilAs of December 31, 2010,2016, we had approximately 25,700 towers, comprised of approximately 8,700 towers owned by Mitratel and DLD services until December 31, 2005. Indosat and Satelindo (which subsequently merged with Indosat) were granted a duopoly for provision of basic international telecommunications services until 2004.
As a consequence of the Telecommunications Law, the Government terminated our exclusive rights to providedomestic fixed linetelephone and DLD services and Indosat’s and Satelindo’s duopoly rightsto provide basic internationaltelephone services.Instead, the Government adopted a duopoly policy tocreatecompetition between Indosat and us as comprehensive service and network providers. The market for IDD servicesapproximately 17,000towers owned by Telkomsel, which was liberalized in August 2003 with the termination of Indosat’s and Satelindo’s exclusive rights.In 2012,Indosat began operating fixed line services and, in 2013, fixed wireless access and DLD services. We subsequently receivedour IDD services license and began offering IDD services in 2004 in direct competition with Indosat.
E.DLD Services
To liberalize DLD services, the Government amended the National Telecommunications Technical Plan pursuant to MoCI Decree No.6/P/M.KOMINFO/5/2005 dated May 17, 2005 (“MoCI Decree No.6/2005”) to assign each provider of DLD services a three-digit access code that would permit their customers to select an alternative DLD services provider by dialing the three-digit access number. MoCI Decree No.6/2005 did not provide for immediate implementation of the three-digit system for DLD calls, but as the first DLD service provider, we were required to gradually open our network to the three-digit access codes in all coded areas throughout Indonesia by April 1, 2010. We were assigned the “017” DLD access code, while Indosat was assigned “011”. The MoCI thereafter amended the National Telecommunications Plan as provided in MoCI Decree No.43/P/M.KOMINFO/12/2007 dated December 3, 2007, (“MoCI Decree No.43/2007”), which delayed the deadline for the implementation ofthree-digit access code for DLD calls throughout all the area code in Indonesia until September 27, 2011.
Pursuant to MoCI Decree No.43/2007, we opened our network to the “01X” three-digit DLD access service in Balikpapan by April 3, 2008. Sincethat date, our customersare ableto make DLD calls from Balikpapan by first dialingIndosat’s“011”. As stipulated in MoCI Regulation No.43/2007,we have provided a nation-wide network for three-digit access code for fixed and fixed wireless DLD with “01X” that can be used by Indosator other licensed operator starting September 27, 2011. To date, no other licensed operators have submitted a request to us to connect their networksandenable DLD access. If there isanother operator that provide the “01X” access code,whether nationally or in certain parts of Indonesia,our customers can choose to use such other operatorto makeDLDcalls, whenever available.
On December 16, 2008, the MoCI issued an in-principle DLD license to Bakrie Telecom, increasinglarger than the number of potential DLD operatorstowers that were owned by each of Tower Bersama, Protelindo and PT Solusi Tunas Pratama Tbk, which are our principal competitors in the towers business.
Others
The dynamic development of the telecommunications sector has opened up new opportunities, particularly with the increasing growth ofOverTheTop services which provide a substitute service to three.However,basic telecommunications services such as ofthe date offiling of thisannual report, Bakrie Telecom has not yet obtained a DLD operating license whichwouldrequirethem to first procure necessaryDLDinfrastructure.
Our DLD tariffs are regulated by MoCI Regulation No.15/PER/M.KOMINFO/4/2008 dated April 30, 2008 regarding Tariff Calculation Procedures for Basic Telephony Services on Fixed Wireline Networks (“MoCI Regulation No.15/2008”),limits our interconnection tariffsin accordanceto aspecifiedcost-based formula. MoCI
Regulation No.15/2008 also provides that our tariff structurebe comprised of a connection fee, monthly charges, usage chargesvoice and additional facilities fees. We are required by MoCI Regulation No.15/2008 to report ourcost-based tariff calculation to the ITRA.
40
Table of Content
F.IDD Services
We received our IDD license in May 2004 and began offering IDD fixed line services to customers in June 2004 using the “007” IDD access code. The Indosat IDD access code is “001”.OurDecember 2005 interconnection agreement with Indosat enables Indosat’s network customers to access our IDD services by dialing “007” and our network customers to access Indosat’s IDD services by dialing “001”.
On February 12, 2009, the MoCI issued a fixed IDD license to Bakrie Telecom, with international access code “009”,which has increased the number of potential IDD operators to three.
Interconnection fees from international network providers to local networkSMS. CertainOverTheTop service providers are determined based on the interconnection offering document for fixed line local network providers.Our fixed lineIDD tariff are regulated by MoCI Regulation No.15/2008 in the same manner as our fixed lineDLDservices.
G.Limited Mobility Wireless Services
MoC Decree No.KM.35/2004 dated March 11, 2004 regarding Implementationparticularly popular, including WhatsApp, Facebook, Line and many others. The presence of Fixed Wireless Networks with Limited Mobility,as amended by MoCI Decree No.16/PER/M.KOMINFO/06/2011 dated June 27, 2011, (“MoC Decree No.KM.35/2004”) provides that only local fixed network operators holding licenses issued by the MoC may offer limited mobility wireless(or fixed wireless)access services. In addition, MoC Decree No.35/2004 states that each limited mobility wireless access operator must provide basic telephone services. Under anautomatedmigration feature, customersare able to make and receive calls on their fixed limited mobility wireless access phones using a different number with a different area code.
Indosat, Bakrie Telecom and Mobile-8 also hold limited mobility wireless operating licenses.
Our fixed wirelesstariff are regulated by MoCI Regulation No.15/2008 in the same manner as our DLD and IDD fixed line services.
H.Cellular
Cellular telephone service is provided in Indonesia on theradio frequency spectrum of1.8 GHz(DCS technology),2.1 GHz(UMTS technology)and 900 MHz(GSM and UMTS technology). The MoCIregulates the use and allocation of theradiofrequency spectrumfor mobile cellular networks. TelkomseltheseOverTheTop services has obtained frequency allocation for cellular serviceson the 900 MHz, 1.8 GHz and 2.1 GHz frequency bands. The Government conducted tenders for the allocation of the 2.1 GHz radio frequency spectrum, and allocated bandwidth, in 2006,theGovernment allocates through the tender prosess for allocation at 5 MHz, while for the allocation of additional radio spectrum allocated through an evaluation mechanism was in2009 and a selection in 2013. The allocation of bandwidth in the 2.1 GHz frequency spectrum is regulated by:
-MoCI Decree No.19/KEP/M.KOMINFO/2/2006 dated February 14, 2006 regarding the Determination of Winner of IMT-2000 Mobile Cellular Operator Selection at 2.1 GHz Radio Frequency Band;
-MoCI Decree No.268/KEP/M.KOMINFO/9/2009 regarding the Determination of Additional Allocation of Radio Frequency Bandwidth Blocks, Tariffs, and Payment Scheme Radio Frequency Spectrum Right of Usage Fees for IMT-2000 Mobile Cellular Operators at 2.1 GHz Radio Frequency Band; and
-MoCI Decree No.191 Year 2013 regarding the Determination of PT Telekomunikasi Selular as Winner in the Selection of Users of Additional Frequency Bandwidth at 2.1 GHz Radio Frequency Band for IMT-2000 Mobile Cellular Operators.
I.Interconnection
The Telecommunications Lawexpressly prohibits monopolistic and unfair businesspractices andrequires network providers to allow users to accessotherusers orobtainservicesfrom other networks by payinginterconnectionfees agreed upon by each network operator. Government Regulation No.52/2000 dated July 11, 2000 regarding Telecommunications Operations provides that interconnection charges between two or more network operators must be transparent, mutually agreedupon and fair.
On February 8, 2006, the MoCI issued Regulation No.8/PER/M.KOMINFO/02/2006 on Interconnection (“MoCI Regulation No.8/2006”), mandated a cost-based interconnection tariff scheme for all network and services operatorsreplacingthepreviousrevenue-sharing scheme. Under the new scheme, interconnection charges are determined by the networkoperator onwhich a call terminates based on along-run incremental cost formula provided underMoCI Regulation No.8/2006.
41
Table of Content
MoCI Regulation No.8/2006requires operators to submit to the ITRA annual RIO proposals containing proposed interconnection tariffs for the coming year. Operators are required to use the cost-based methodology in preparing RIO proposals, and the ITRA and MoCI are required to use the same methodology in evaluating the RIO proposals and approving interconnection tariffs. The RIO proposals also include call scenarios, traffic routing, point of interconnection, procedure for requesting and providing interconnection, and other matters. RIOs must also disclose the type of interconnection services offered and tariffs charged for each service offered. Interconnection access providers are required to implement a queuing system on a First-in-First-Serve basis. Additionally,networkinterconnection must beimplemented in atransparent and without discrimination.
Pursuant to MoCI Regulation No.8/2006 and ITRA Letter No.246/BRTI/VIII/2007 dated August 6, 2007, we submitted a RIO proposal totheITRA in October 2007, which covered adjustments for operational, configuration, technical and service offerings. In December 2007,we andallothernetwork operators signed new interconnection agreementsthat superseded previous interconnection agreements betweenus and othernetwork operators which also amended all interconnection agreements signed in December 2006. These agreements temporarily served inlieu of RIOs while the ITRA continued to review the RIO proposals received from ourselves and other operators.
On February 5, 2008, the ITRA required that we and other operators begin implementing the cost-based interconnection tariff regime. On April 11, 2008, pursuant toDirectorate General of Post and Telecommunication (“DGPT”) Decree No.205/2008, the ITRA and the MoCI approved RIOproposalsfrom all operators to replace previous interconnection agreements. The RIO approved in 2008 waseffective until July 29, 2011 whennewinterconnection chargeswere implemented as stipulatedinITRA Letter No.227/BRTI/XII/2010 dated December 31, 2010 regarding the Implementation of Interconnection Charges in 2011. This is the result of interconnection charges recalculation conducted in 2010 by MoCI that was agreed on by all operators and outlined in a Memorandum of Understanding. In this process,we wereappointed as a default data source for the calculation of fixedwireline andfixedlocalinterconnection tariffs. Our subsidiary, Telkomsel, and Indosat were similary appointed as the default data source for the calculation cellular interconection tariffs. Meanwhile, Indosat data is positioned as a benchmark for calculating the cost of cellular mobile network interconnection. The results ofthis interconnection chargesreform caused aslightdecrease in interconnection costs.
On December 12, 2011, the ITRA changed the SMS interconnection fee basis from a “Sender Keep All” basis to a cost basis interconnection fee calculation which required certain amendments to RIOs agreed upon in 2011. MoCI Regulation No.8/2006 stipulates that the RIO of telecommunications network operators generating operating revenue that is equaltoor more than 25% of the combined revenues of all telecommunication operators that serve the same respective segment, must obtain ITRA’s approval, necessitating changes inour and Telkomsel’s RIOs which were approved on June 20, 2012.In 2012, we and Telkomsel were confirmed as telecommunication network operators that are capable of posting revenue of 25% or more of total operating revenues of all telecommunication operators combined in the respective segments in 2012, through the Decree of the Director General of PPI No.181A/KEP/DJPPI/KOMINFO/5/2012 dated May 16, 2012. Until this report is published, no recalculation of interconnection fees for 2012 had been done as doing such should have been preceded by an evaluation on interconnection charges in 2011.
J.VoIP
In January 2007, the Government implemented new interconnection regulations and a five-digit access code system for VoIP services pursuant to MoCI Decree No.06/P/M.KOMINFO/5/2005. Under the Decree, the prefix for VoIP, which was originally 01X, was changed to 010XY. On April 27, 2011, the MoCI issued Regulation No.14/PER/M.KOMINFO/04/2011, which imposed quality control standards in relation to VoIP services,which becameeffective three months thereafter, to which we and other operators must adhereto.
K.IPTV
In August 19, 2009, MoCI issued Ministerial Decree No.30/PER/M.KOMINFO/8/2009 regarding the undertaking of IPTV services in Indonesia, in order toaddress the convergence oftelecommunications serviceswith broadcasting and electronic transactions. In July 2010, MoCI replaced this regulation withMoCI Regulation No.11/PER/M.KOMINFO/07/2010 (“MoCI Regulation No.11/2010”) which established the legal basis for the licensing and regulates the provision of IPTV services, including the rights and obligations of IPTV providers, technical standards, foreign ownership requirements andaffected the use of domestic independent content providers.legacy services, particularly SMS, which has resulted in traffic falling in recent years.
MoCI Regulation No.11/2010recognizesIPTVas a convergence of telecommunications, broadcasting, multimedia and electronic transactions and provides that only aconsortium comprising at least two Indonesian entities may be licensed as an IPTV provider.Each consortium must together hold licenses as a local fixed network provider,internet services provider and one broadcast services provider.Such consortium mayonlyprovide IPTV services in the areacovered by all three required licenses. MoCI Regulation No.11/2010 further requires that IPTV services be delivered through a wire network.
42
Table of Content
L.Satellite
Our international satellite business is highly regulated. In addition to being subject to domestic licensing requirements and regulation for the use of orbital slots and radio frequencies as stipulated in MoCI Regulation No. 13/P/M.KOMINFO/8/2005 dated September 6, 2004 which is partially amended by MoCI Regulation No.37/P/M.KOMINFO/12/2006 dated December 6, 2006 (“MoCI Regulation No.37/2006”), our satellite operations is also regulated by the Radio Communications Bureau of the International Telecommunications Union.
Furthermore, MoCI Regulation No.37/2006 dated December 6, 2006 requires foreign satellite operators to obtain a landing right license to operate in Indonesia which requires such foreign satellite operators to coordinate with domestic satellite operators, including us, to ensure that no Indonesian satellite and terrestrial systems will be disrupted by their operation.
M.Consumer Protection
Under the Telecommunications Law, eachnetwork provider is required to protect consumerrights in relation to, among others, quality of services,tariffs andcompensation. Customers injured or damaged by negligent operations may file claims against negligent providers. Telecommunications consumer protection regulations provide service standards for telecommunication operators.
N.USO
All telecommunications operators, whether network or service providers, are bound by a USOregulationthat requires them to contribute to providing telecommunication facilities and infrastructure in the interest of opening equal access to telecommunications throughout all regions in Indonesia, which is generally done by way of financial contribution. MoCI Regulation No.32/PER/M.KOMINFO/10/2008 dated October10, 2008 regarding the USO (as amended by MoCI Regulation No.03/PER/M.KOMINFO/02/2010 dated February 1, 2010) (“MoCI Regulation No.32/2008”)stipulated, among others, details services thatshall beprovided in relation toUSO regulation, which is providing telephone, SMS and internet access services in remote and other areas of Indonesia that have been classified as USO regions where it is not economical to provide these services.
USO payment requirements are calculated as a percentage of our and Telkomsel’s unconsolidated gross revenues, net of bad debts and/or interconnectioncharges and/or connection charges. Pursuant toGovernment Regulation No.7/2009 dated January 16, 2009, regarding Tariffs for Non-Tax State Revenue that apply to the Ministry of Communication and Information (“GR No.7/2009”) and Decree No.05/PER/M.KOMINFO/2/2007 dated February 28, 2007, the current USO tariff rate is 1.25% of gross revenue, net of bad debts and/or interconnection charges and/or connection charges. Subsequently, in December 2012, Decree No.05/PER/M.KOMINFO/2/2007 was replaced by Decree No.45 year 2012 of the MoCI which was effective from January 22, 2013. The Decree stipulates, among other things, the exclusion of certain revenues that are not considered as part of gross revenues as a basis to calculate the USO charged, and changed the payment period which was previously on a quarterly basis to become quarterly or semi-annually.
O.Telecommunication Regulatory Charges
On January 16, 2009, the Government issued Government Regulation No.7/2009, which sets the types of non-tax state revenues that apply to the MoCI derived from various services, including telecommunications.
We are required to pay right-of-use fees related to the radio frequency spectrum that we use. The right-of-use fees with reference to our BTS licensingwerepayable annually based on a formula thattookinto account base prices for both radio frequency spectrum and transmission capacity, as adjusted by fee indices set by the Minister of Communications and Information in consultation with the Minister of Finance. The right-of-use fees calculated with reference to our radio frequency spectrum is determined by tender and comprises of both an upfront fee and radio frequency spectrum (“IPSFR”) annual fees.
On December 13, 2010, the Government issued Government Regulation No.76/2010 amending Government Regulation No.7/2009. Pursuant to Government Regulation No.76/2010, we are no longer required to pay right-of-use fees calculated with reference to the BTSs that we deploy in our network, except for BTSs deployed in our backbone, with effect from December 15, 2010. As a result, our right-of-use fees are now calculated based on the bandwidth of the radio frequency spectrum that we use.
In addition to radio frequency spectrum right-of-use fees, Government Regulation No.7/2009 requires all telecommunications operators to pay an annual license fee for telecommunication operation, which is equal to 0.5% of unconsolidated gross revenues, net of bad debts and/or interconnectioncharges and/or connection charges.
43
Table of Content
Pursuant to Law No.28/2009 regarding Local Taxes and Local Fees, local governments are permitted to impose fees on the sites that we use for telecommunications towers. The fees may not exceed 2% of the site’s assessed tax value. Currently, there are some 525 local (provincial and regency level)governmentsthrough outIndonesia that may be authorized to impose these fees to increase in the future.
P.Telecommunications Towers
On March 17, 2008, the MoCI issued MoCI Regulation No.02/PER/M.KOMINFO/3/2008 regarding Guidelines on Construction and Utilization of Sharing Telecommunication Towers (“MoCI Regulation No.02/2008”). Under MoCI Regulation No.02/2008, the construction of telecommunications towers requires permits from the relevant governmental institution, while the local government determines the placement and locations at which telecommunications towers may be constructed. In addition, telecommunications providers that own telecommunication towers and other tower owners are obligated to allow other telecommunication operators to utilize their telecommunication towers without any discrimination, with due regards to the technical capacity of the respective tower.
Since the operations of telecommunication towers involves a number of relevant Government bodies, on March 30, 2009, a joint regulation is issued in the forms of Minister of Home Affairs Regulation No.18/2009, Minister of Public Works Regulation No.07/PRT/M/2009, MoCI Regulation No.19/PER.M.KOMINFO/03/2009 and Head of the Investment Coordinating Board Regulation No.3/P/2009 regarding Guidelines for the Construction and Shared Use of Telecommunications Towers (“Joint Decree”).
The Joint Decree regulates that license for telecommunication tower construction is to be issued by regents or mayors, and for Jakarta Province, its Governor. The Joint Decree also provides for tower construction standards and requires that telecommunications towers be made generally available for shared use by telecommunications service providers. The owner of a telecommunications tower is allowed to collect a fee, which is negotiated with reference to costs associated with investment and operational costs, the return of investment and a profit. Monopolistic practices in the ownership and management of telecommunications towers is prohibited.
In addition to the Joint Decree and MoCI Regulation No.02/2008, several regional authorities have implemented regulations limiting the number and location of telecommunication towers and require operators to share in the utilization of telecommunications towers.
Competition
Measures following the Telecommunications Law’s adoption in 2001 moved the Indonesian telecommunications sector from a duopoly between Indosat and us to one with multiple competing providers. See “Legal Basis and Regulation – Introduction of Competition in the Indonesian Telecommunications Industry”.
Competition Law
TheIndonesian telecommunications sector is regulated by the Telecommunications Law, which became effective on September 8, 2000. The Telecommunications Law sets guidelines for industry reforms, including industry liberalization, to facilitate new entrants as well as to increase transparency and competition. The Telecommunications Law abolished the concept of "organizing entities" in the industry, which terminated the special status of Telkom and Indosat as the organizing body responsible for coordinating telecommunication services domestically and internationally. In order to increase competition, the Telecommunications Law prohibits monopolistic practices and unfair competition among fellow telecommunication operators.
The Telecommunications Law is implemented through various Government regulations and ministerial regulations, including Government Regulation No.52/2000, MoCI Regulation No.1/PER/M.KOMINFO/01/2010 (on provision of telecommunication networks, as amended by MoCI Regulation No.7 of 2015, Decree of the Minister of Transportation No.KM33 of 2004 (on monitoring of fair competition of the fixed network and basic telephone service operations) and Decree of the Minister of Transportation No.KM.4 of 2001 (on the national basic technical plan 2000 for the national telecommunications development) ("National Technical Telecommunications Plan"). The National Technical Telecommunications Plan has been amended several times, most recently by MOCI Decree No.17 of 2014. Along with the Telecommunications Law, the National Technical Telecommunications Plan determines the basic vision for the development of Indonesia’s telecommunications regulator.
The government is currently promotes liberalization,encouraging healthy competition and transparency in the telecommunications sector. Itsector, even though the government does not prevent providersoperators from attainingobtaining and capitalizing upon a dominantincreasing its dominance in the market position. However, the Government does prohibitthrough specific regulations. Nevertheless, the government prohibits market leading operators from abusing aits dominant position. In March 2004, the MoC issued Decree No.33/2004, which prescribes measures to prohibit such abuse by dominant network and service providers. A provider is considered dominant based on factors such as scope of business, service coverage area and controlofa particular market. Specifically, Decree No.33/2004 prohibits dumping, predatory pricing, cross-subsidies, mandatory use of a provider’s services (to the exclusion of competitors) and hampering mandatory interconnection (including discrimination against specific providers).
Competition in the telecommunications sector, like all Indonesian business sectors, is also governed more generally by Law No.5/1999 dated March 5, 1999 regarding Prohibition of Monopolistic Practice and Unfair Businessthe Competition (“Competition Law”).Law. The Competition Law bansprohibits agreements and activities tending towardwhich amount to unfair business competition as well as theand an abuse of a dominant market position. Pursuant to the Competition Law, the Commission for the Supervision of Business Competition (“KPPU”) has beenKPPU was established as Indonesia’s antitrust regulator with the authority to enforce the provisions of the Competition Law.
44
Table of Content
The Competition Law is implemented by various regulations, including Government Regulation No.57/2010 dated July 20, 2010 regarding Mergers(on mergers and Acquisitions Potentially Causing Monopolistic Practicesacquisitions potentially causing monopolistic practices or Unfair Business Practices. Government Regulationunfair business practices) ("GR No.57/2010"). GR No.57/2010 permits voluntary consultation with the KPPU prior to a merger or acquisition, resultingwhich will result in the KPPU issuing a non-binding opinion. Government RegulationGR No.57/2010 also requires that a mandatory report be made to the KPPU after a merger or acquisition is completed if the transaction exceeds certain asset or sales value thresholds.
Cellular
We operate our cellular service business through our 65% majority-owned subsidiary, Telkomsel.
As of December 31, 2016, Telkomsel remained the largest cellular provider in Indonesia, with approximately 173.9 million cellular subscribers and a market share of approximately 48% based on the estimated number of total subscribers. The next largest providers were Indosat and XL Axiata, which had a market share of approximately 24% and 13%, respectively, based on the estimated number of total subscribers as of December 31, 2016. Several other smaller GSM and CDMA operators also provide cellular services in Indonesia, including Hutchison, which is part of the Hutchison Asia Telecom Group and operates under the "3" or "Tri" brand, and Smartfren Telecom, which is part of the Sinar Mas Group.
Table of Content
The penetration of SIM cards in the cellular industry in Indonesia is quite high, at well over 100%, making continued growth in penetration increasingly limited. There were approximately 364.3 million cellular subscribers in Indonesia as of December 31, 2016, a 8.9% increase from approximately 334.5 million as of December 31, 2015 according to BMI Research (a Fitch Group company). The shifting trend from legacy services (such as voice and SMS) to data services continues to advance, driven by cheaper prices of smartphones as well as the rapidly growing youth segment. Data traffic has grown significantly, while SMS service traffic has decreased. We expect that this trend will continue, given that smartphone penetration in Indonesia is still relatively low with relatively low data consumption by smartphone users, and that the growth of the telecommunications industry will be driven by the growth of data services.
The following table sets out information as of December 31, 2016 for each of three leading cellular providers in Indonesia: | |
| Operator | |
| Telkomsel | | Indosat | | XL Axiata | |
Launch date | 1995 | | 1967 | | 1989 | |
2G, 3G and/or 4G spectrum allocation (GSM 900 MHz) | 15 MHz** | | 10 MHz | | 7.5 MHz | |
2G, 3G and/or 4G spectrum allocation (GSM 1.8 GHz) | 22.5 MHz | | 20 MHz | | 22.5 MHz | |
3G spectrum allocation (2.1 GHz) | 15 MHz | | 10 MHz | | 15 MHz | |
Market share* | 48% | | 24% | | 13% | |
Subscribers* | 173.9 million | | 85.7 million | | 46.5 million | |
(*)As ofDecember 31, 2016 | |
(**) Includes 7.5 Mhz which was reallocated to Telkomsel in connection with the termination of our fixed wireless business. | |
A.Fixed Line, Fixed Wireless anServicesdDLD
Our exclusive right to provide domestic fixed line telecommunications services in Indonesia ended following the Telecommunications Law’s implementation in 2000. The MoC issued licenses to Indosat for domesticWe compete with other major fixed line services in August 2002 and for DLD telephone services in May 2004. We entered into an interconnection agreement with Indosat dated September 23, 2005 to allow interconnection between our local fixed line services in Jakarta, Surabaya, Batam, Medan, Balikpapan, Denpasar and certain other areas. By 2006, Indosat was able to provide nationwide DLD services through its CDMA-based fixed wireless network, its fixed line network and these interconnection arrangements with us.
In an attempt to liberalize DLD services, the Government required each DLD provider to implement a three-digit access code to be dialed by customers making DLD calls. These regulations were first implemented in Balikpapan in 2008, with Balikpapan residents given the option to make a normal DLD call or to select a three-digit code assigned to Indosat or to us. Under current regulations, this system is to be applied nationally beginning September 27, 2011. See “Legal Basis and Regulation – Introduction of Competition in the Indonesian Telecommunications Industry”.
Indosat remains our largest competitor with respect to fixed line and DLD services and we also compete against other fixed linebroadband service providers such as PT Bakrie Telecom Tbk. (formerly Ratelindo)Link Net Tbk, First Media and PT Batam Bintan Telecom. However, traditional fixed line services have faced and will continue to increasingly face competition from cellular services, particularlySupra Primatama Nusantara (BizNet Networks) as cellular tariffs decrease, and from other alternate serviceswell as new providers such as fixed wireless, SMS, VoIPPT Media Nusantara Citra Tbk and e-mail services.
Telkom Flexi, our fixed wireless network is the largest in Indonesia with coveragePT Eka Mas Republik (an affiliate of 370 cities offering limited mobility and charging customers based on PSTN tariff that is principally lower than GSM. For comparison, Indosat in 2004 launched its CDMA-based fixed wireless phone serviceSmartfren Telecom which operates under the brand name “StarOne” in Jakarta and Surabaya. Bakrie Telecom offers fixed wireless services in more than 30 cities and Mobile-8 was granted a nationwide fixed wireless access license in 2009. In general, the technologies employed by CDMA and fixed wireless access operators are less capital-intensive, previously allowing these operators to offer more competitive prices than GSM operators. Furthermore, licensing fees for radio stations of fixed wireless mobile phone connections is lower than cellular.
"MyRepublic" brand).
B.International Direct Dialing (IDD)Cellular
We operate our cellular service business through our majority-owned subsidiary, Telkomsel. As of December 31, 2013, Indonesia’s cellular market is dominated by Telkomsel, Indosat and XL Axiata, which collectively account for80.4% of the full-mobility cellular market. Other providers include Hutchison, Natrindo, Smart Telecom and Bakrie Telecom.
There were approximately310 million full-mobility cellular subscribers in Indonesia as of December 31, 2013, a12.3%increase from approximately276 million as of December 31, 2012.
We believe that Telkomsel competes effectively in the Indonesian cellular market on the basis of price, coverage, service quality and value added services.As of December 31, 2013, Telkomsel remained the largest national licensed provider of cellular services in Indonesia, withapproximately 131.5million cellular subscribers and amarket share of 42.4%of the full-mobility cellular market. The second and the third largest providers were Indosat and XLAxiata, which have a market share of19.2%and 18.7% respectively, based on theestimated number of subscribers as of December 31, 2013. In addition to the nationwide GSM operators, a number ofsmaller regional GSM, analog and CDMA fixed wireless providers operate in Indonesia.
45
Table of Content
The following table sets out information as of December 31, 2013 for each of the three leading cellular providers with national coverage:
| | Operator | |
| | Telkomsel | | Indosat | | XL Axiata | |
Launch date | | May-1995 | | Nov-1994(2) | | Oct-1996 | |
2G Licensed frequency bandwidth (GSM 900 & 1800) | | 30 MHz | | 30 MHz | | 30 MHz | |
3G Licensed frequency bandwidth (2.1 GHz) | | 15MHz | | 10 MHz | | 15MHz | |
Market share(1) | | 42.4% | | 19.2% | | 18.7% | |
Subscribers(1) | | 131.5million | | 59.6million | | 58.1 million | |
(1) Internal estimate, dated December 31,2013 based on various statistics compiled by us.
(2) In November 2003, Indosat and Satelindo merged and Indosat took over Satelindo’s cellular operations.
Hutchison and Natrindo also provide cellular services in Indonesia and in 2012 were each awarded an additional 10 MHz of spectrum on the 3G license frequency bandwidth (2.1 GHz). This additional spectrum increased their respective total allocated frequency spectrum to 20 MHz and 25 MHz each. In accordance with the announcement of MoCI No.19/PIH/KOMINFO/2/2013 dated February 25, 2013, Telkomsel has been selected as one of the companies to be granted an additional 3G license with radio frequency in the 2.1 GHz bandwidth.
C.IDD
We compete in traditional IDD services (non-VoIP) in Indonesia primarily with Indosat, as well as Bakrie Telecom.Indosat. However, in line with development of digital technology, our IDD services also facesface competition withfrom VoIP and other internet-basedOver The Top voice services likessuch as Skype, WhatsApp and Google Talk.Line.
D.Voice over Internet Protocol (VoIP)VoIP
We formally launched our voice service through VoIP servicestechnology in September 2002. VoIP uses data communications to transfer voice traffic over the internet, which usually provides substantial cost savings to subscribers. A number of other companies, including XL Axiata, Indosat, PT Atlasat Solusindo, Pte, Ltd., PT Gaharu Sejahtera, PT Satria Widya Prima, PT Primedia Armoekadata Internet and PT Jasnita Telekomindo also provide licensed VoIP services in Indonesia. Other unlicensed operators also provide VoIP services that may be accessed through websites or through software that allows voice communications through the internet using computers or smartphones.
VoIP operators compete primarily on the basis of price and service quality. VoIP operators, including us, offer budget calls and other products aimed at price sensitive users such as prepaid calling cards. We currently offer our primary VoIP service “Telkom Global-01017” and the lower-cost alternative “Telkom Save”. Telkom Save offers discounted rates for certain countries to which there is heavy traffic from Indonesia while offering regular VoIP tariff rates for other countries. In addition to other VoIP operators, we also compete with internet-basedOver The Top voice services likessuch as Skype, Whatsapp and Google Talk.
Line.
E.Satellite
The Asia-PacificAsia Pacific region and especially Southeast Asia continues to need satellites for both telecommunications and broadcasting infrastructure. This need is driveninfrastructure, due to the characteristics of the region as an archipelago. The capabilities provided by the high demand from services such assatellites include cellular backhaul,broadband backhaul,enterprise network,OUTV (Occasional Usage TV), occasional usage TV, military and Governmentgovernment network, video distribution, DTH television,flightcommunication, anddisaster flight communication and disaster recovery.
At the same time, the supply of available satellite transponders in Southeast Asia is limited. Almost all of the orbital slot positions covering Southeast Asiaare occupied. Of the satellites currently under construction one is planned to occupy the 1180E orbital slot,but it is estimated to enter service only in 2016.
Generally, large global satellite operators can use economies of scales to offer more competitive prices without affecting their financial performance. This may result in a market premium subsidy in very competitive markets.
46
Table of Content
We compete with a number of other satellite operators with satellites covering Southeast Asia and South Asia, and several operators are in the process of developing satellites with coverage over these regions. However, we believe that demand for satellite transponder capacity still exceeds current supply. We are currently conducting in-orbit performance tests on the Telkom-3S satellite, which we expect to be completed by April 2017 and are currently developing the Telkom-4 satellite as a replacement for the Telkom-1 satellite, which is currently planned for launch in the third quarter of 2018. At the completion of the in-orbit performance tests of the Telkom-3S satellite, we plan to locate it at orbital slot 118 E to replace the Telkom-2 satellite and transfer all of the Telkom-2 satellite's transmission services to it. The Telkom-2 satellite currently operates at orbital slot 118 E but we plan to relocate it to orbital slot 157 E.
Tower
As of December 31, 2016, we had approximately 25,700 towers, comprised of approximately 8,700 towers owned by Mitratel and approximately 17,000towers owned by Telkomsel, which was larger than the number of towers that were owned by each of Tower Bersama, Protelindo and PT Solusi Tunas Pratama Tbk, which are our principal competitors in the towers business.
Others
The dynamic development of the telecommunications sector has opened up new opportunities, particularly with the increasing growth ofOverTheTop services which provide a substitute service to basic telecommunications services such as voice and SMS. CertainOverTheTop service providers are particularly popular, including WhatsApp, Facebook, Line and many others. The presence of theseOverTheTop services has affected the use of legacy services, particularly SMS, which has resulted in traffic falling in recent years.
Legal Basis and Regulation
The framework for the telecommunications industry comprises specific laws, government regulations, ministerial regulations and ministerial decrees enacted and issued from time to time.
Telecommunications Law
The telecommunications sector is primarily governed by the Telecommunications Law, which became effective on September 8, 2000. The Telecommunications Law sets guidelines for industry reforms, including industry liberalization, facilitation of new entrants, and enhanced transparency and competition.
The Telecommunications Law eliminated the concept of “organizing entities”therebyendingour andIndosat’s responsibility for coordinating domestic and international telecommunications services, respectively. To enhance competition, the Telecommunications Law prohibits monopolistic practices and unfair competition among telecommunications operators.
The Telecommunications Lawwas implemented through several Government Regulations, Ministerial Regulations and Ministerial Decrees. The most important ofsuch regulations include:
·Government Regulation No.52/2000 (on telecommunications services).
·MoCI Regulation No.1/PER/M.KOMINFO/01/2010 (on operation of telecommunications networks), as amended by MoCI Regulation No.7 of 2015.
·Minister of Transportation Decree No.KM.21/2001 (on the provision of telecommunications services) that was most recently amended by MoCI Regulation No.8/2015.
·Minister of Transportation Decree No.33/2004 (on the supervision of healthy competition in the provision of fixed network and basic telephony services).
·Minister of Transportation Decree No.KM.4/2001 (on the determination of fundamental technical plan national 2000 for national telecommunications development) that was most recently amended by MoCI Regulation No.17/2014.
Table of Content
Telecommunications Regulators
The authority to regulate the telecommunications industry is held by the MoCI. Pursuant to authorities assigned to him under the Telecommunications Law, the Minister of Communication and Informatics sets policies, regulates, supervises and controls the telecommunications industry in Indonesia. The authority to regulate the postal and telecommunications sectors in Indonesia including with respect to licensing, numbering, interconnection, universal service obligation and business competition is held by the Directorate General of Post and Informatics of the MoCI (“DGPI”). The authority to regulate matters related to radio frequency spectrum and standardization of telecommunications equipment in Indonesia is held by the Directorate General of Posts and Informatics Resources and Equipment of the MoCI (“DGRE”).
On July 11, 2003, the Ministry of Communication promulgated the Telecommunications Regulatory Authority Regulation, pursuant to which it delegated its authority to regulate, supervise and control the Indonesian telecommunications sector to the ITRA, while maintaining the authority to formulate policies for the industry. The ITRA is chaired by the DGPI and comprises nine members, including six members of the public and three members selected from Government institutions (DGRE and Director of DGPI and a government representative appointed by the Minister of Communication and Information).
Classification and Licensing of Telecommunications Providers
TheTelecommunications Law organized telecommunication services intofollowingthree categories: (i) provision of telecommunication networks; (ii) provision of telecommunication services; and(iii) provision of special telecommunications services.
Licenses issued by MoCI are required for each category of telecommunications services. MoCI Regulation No.1/2010 and Minister of Transportation Decree No.KM.21/2001 (on operation of telecommunications services) which was last amended by MoCI Regulation No.8/2015 (on amendments relating to the provision of telecommunications services), are the principal implementing regulations governing licensing.
MoCI Regulation No.1/2010classified network operations into fixed and mobile networks. Minister of Transportation Decree No.KM.21/2001categorized the provision of services into basic telephony services, value-added telephony services, and multimedia services.
IDD Services
We have a license to provide IDD services underMoCI Decree No.846/2016. We offer IDD fixed line services to customers using the “007” IDD access code.
Cellular
Cellular telephone service is provided in Indonesia on radio frequency spectrum in the 1.8 GHz (neutral technology) and 2.1 GHz (UMTS technology)and900 MHz (neutral technology). The MoCI regulates the use and allocation of radio frequency spectrum for mobile cellular networks. Telkomsel has obtained frequency allocation for cellular services on the 800 MHz, 900 MHz, 1.8 GHz and 2.1 GHz frequencies. The allocation of spectrum in the 2.1 GHz frequency is regulated by:
·MoCI Decree No.19/KEP/M.KOMINFO/2/2006 (on the determination of winner of IMT-2000 mobile cellular operator selection at 2.1 GHz frequency).
·MoCI Decree No.268/KEP/M.KOMINFO/9/2009 (on the determination of additional allocation of radio frequency bandwidth blocks, tariffs, and payment scheme radio frequency spectrum right of usage fees for IMT-2000 mobile cellular operators at 2.1 GHz frequency).
·MoCI Decree No.191 of 2013 (on the determination of Telkomsel as winner in the selection of users of additional frequency bandwidth at 2.1 GHz frequency for IMT-2000 mobile cellular operators).
Table of Content
Interconnection
The Telecommunications Lawexpressly prohibits monopolistic and unfair businesspractices andrequires network providers to allow users to accessotherusers orobtainservicesfrom other networks by payinginterconnectionfees agreed upon by each network operator. Government Regulation No.52/2000 (on telecommunications operations) provides that interconnection charges between two or more network operators must be transparent, mutually agreedupon and fair.
On February 8, 2006, the MoCI issued Regulation No.8/PER/M.KOMINFO/02/2006 (on interconnection) (“MoCI Regulation No.8/2006”),whichmandated a cost-based interconnection tariff scheme for all network and services operatorsand replacedthepreviousrevenue-sharing scheme. Under the new scheme, interconnection charges are determined by the networkoperatorwhichterminates the call based on along-run incremental cost formula. MoCI Regulation No.8/2006requires operatorsto submit to the ITRA annual RIO proposals containing proposed interconnection tariffs for the coming year. Operators are required to use the cost-based methodology in preparing RIO proposals, and the ITRA and MoCI are required to use the same methodology in evaluating the RIO proposals and approving interconnection tariffs.
Pursuant to MoCI Regulation No.8/2006 and ITRA Letter No.246/BRTI/VIII/2007, we submitted a RIO proposal totheITRA in October 2007, which covered adjustments for operational, configuration, technical and service offerings. In December 2007,we andallothernetwork operators signed new interconnection agreementsthat superseded previous interconnection agreements betweenus and othernetwork operators, andalso amended all interconnection agreements signed in December 2006.
On February 5, 2008, the ITRA required that we and other operators begin implementing the cost-based interconnection tariff regime. Newinterconnection chargeswere implemented as stipulatedinITRA Letter No.227/BRTI/XII/2010 (on the implementation of interconnection charges) in 2011. This was the result of interconnection charges recalculation conducted in 2010 by MoCI that was agreed upon by all operators and outlined in a memorandum of understanding.
On December 12, 2011, the ITRA changed the SMS interconnection fee basis from a “Sender Keep All” basis to a cost basis interconnection fee calculation, which required certain amendments to RIOs agreed upon in 2011. MoCI Regulation No.8/2006 stipulates that the RIO of telecommunications network operators generating operating revenue that is equaltoor more than 25% of the combined revenues of all telecommunication operators that serve the same respective segment, must obtain the ITRA’s approval, necessitating changes inour and Telkomsel’s RIOs which were approved on June 20, 2012. ITRB in its letters No.60/BRTI/III/2014 and No.125/BRTI/IV/2014 approved our and Telkomsel's revisions of RIOs regarding the interconnection tariff. Based on the letter, ITRB also approved the changes to the SMS interconnection tariff to Rp24 per SMS. As of the date of this Annual Report, no recalculation of interconnection fees for 2014 had beencarried outas doing so would have been preceded by an evaluation on interconnection charges in 2013.
VoIP
In January 2007, the Government implemented interconnection regulations and a five-digit access code system for VoIP services pursuant to MoCI Decree No.06/P/M.KOMINFO/5/2005. Under the Decree, the prefix for VoIP, which was originally 01X, was changed to 010XY. On April 27, 2011, the MoCI issued Regulation No.14/PER/M.KOMINFO/04/2011, as partly revoked by MoCI Regulation No.11 of 2014,which imposed quality control standards in relation to VoIP services and this becameeffective three months thereafter, to which we and other operators must adhere.
IPTV
Several provisions in the MoCI Regulation No.11/PER/M.KOMINFO/07/2010 (“MoCI Regulation No.11/2010”) (on the implementation of IPTV service) has been amended by MoCI Regulation No.15/2014 (on the implementation of IPTV service) that became the legal basis for the IPTV licensing and regulates the provision of IPTV services, including the rights and obligations of IPTV providers, technical standards, foreign ownership requirements and the use of domestic independent content providers.
Government Regulation No.52/2005 (on broadcasting implementation of the broadcasting subscription institute) provides that broadcasting can be conducted using satellites, cables and terrestrial transmitters. Broadcasting using satellite could have a nationwide range, while cables and terrestrial transmitters have a range of a particular region.
Table of Content
MoCI Regulation No.11/2010recognizesIPTVas a convergence of telecommunications, broadcasting, multimedia and electronic transactions and provides that only aconsortium comprising at least two Indonesian entities may be licensed as an IPTV provider. Referring to MoCI Regulation No.15/2014, the licenses that we needed, among others, included: (a) local fixed network license, mobile network or fixed closed network license, (b) operating internet access/ISP license,and (c) broadcasting operation of subscription television broadcasting services institution license.
Satellite
Our international satellite business is highly regulated. In addition to being subject to domestic licensing requirements and regulation for the use of orbital slots and radio frequencies, as stipulated in MoCI Regulation, our satellite operationsare also regulated by the Radio Communications Bureau of the International Telecommunications Union.
Furthermore, MoCI Regulation No.21/2014 requires foreign satellite operators to obtain a landing right license to operate in Indonesia which requires such foreign satellite operators to coordinate with domestic satellite operators, including us, to ensure that no Indonesian satellite and terrestrial systems will be disrupted by their operation.
Consumer Protection
Under the Telecommunications Law, eachnetwork provider is required to protect consumerrights in relation to, among others, quality of services,tariffs andcompensation. Customers injured or damaged by negligent operations may file claims against negligent providers. Telecommunications consumer protection regulations provide service standards for telecommunication operators.
USO
All telecommunications operators, whether network or service providers, are bound by a USO regulation that requires them to contribute to providing telecommunication facilities and infrastructure in the interest of opening equal access to telecommunications throughout all regions in Indonesia, which is generally done by way of financial contribution. MoCIRegulation No.25 of 2015 stipulated, among others, that when providing telecommunication access and services in rural areas (as part of the Government's USO program), the provider is determined through a selection process by the Rural Telecommunications and Informatics Center (Balai Telekomunikasi dan Informatika Pedesaan or “BTIP”) which was established based on MoCI Decree No.35/PER/M.KOMINFO/11/2006. Subsequently, based on MoCI Decree No.18/PER/M.KOMINFO/11/2010, BTIP was changed to the Telecommunications and Informatics Financing Provider and Management Center (Balai Penyedia dan Pengelola Pembiayaan Telekomunikasi dan Informatika or "BPPPTI").
USO payment requirements are calculated as a percentage of our and Telkomsel’s unconsolidated gross revenues, net of bad debts and/or interconnection charges and/or connection charges. Pursuant to GovernmentRegulation No.80/2015 (on tariffs for non-tax state revenue that apply to the MoCI) (“GR No.80/2015”), the current USO tariff rate is 1.25% of gross revenue, net of bad debts and/or interconnection charges and/or connection charges. Subsequently, in September 2016, the MoCI issued MoCI Regulation No.17/2016 (on guideline of the implementation of tariffs for non-tax state revenue applicable to the USO), which wasamended by MoCI Regulation No.19/2016, effective as of November 8, 2016 ("MoCI Regulation No.17/2016").MoCI Regulation No.17/2016 stipulates, among other things, the exclusion of certain revenues that are not considered as part of gross revenues as a basis to calculate the USO charged.
Telecommunication Regulatory Charges
On November 9, 2015, the Government issued Government Regulation No.80 of 2015 (on the types and tariffs of non-tax state revenue applicable for the MoCI) ("GR No.80/2015") which sets the types of non-tax state revenues that apply to the MoCI derived from various services, including telecommunications.
Based on GR No. 80/2015, the upfront fee are paid in at twice the amount of the offering price submitted by each bidding process winner, while the annual license fee for telecommunication operations are paid according to the amount of the lowest offering price from the bidding process winner. The MoCI will stipulate the amount and timing of payment for the radiofrequency spectrum right of use.
Table of Content
Further, telecommunication equipment and devices for research, development, education and disaster handling purposes can be used after obtaining a utilization period statement letter. After the utilization period as provided in the statement letter has expired, the respective equipment and devices which will be re-used for its original purposes must be certificated with a 50% certification fee. Telecommunication equipment and devices with a local content certificate of higher than 50% are charged at 50% of the certificate type and a testing fee as provided in the GR.
Under GR No. 80/2015, the gross revenue constituting the basis for telecommunication right of use fee calculation can be deducted by (i) receivables which have been written off from the telecommunication operation and (ii) payment of interconnection fee obligation and/or the interconnectedness received by telecommunication operator, which is the right of another party. This deduction is further governed by a MoCI regulation.
Telecommunications Towers
On March 17, 2008, the MoCI issued MoCI Regulation No.02/PER/M.KOMINFO/3/2008 (on guidelines on construction and utilization of sharing telecommunication towers) (“MoCI Regulation No.02/2008”). Under MoCI Regulation No.02/2008, the construction of telecommunications towers requires permits from the relevant governmental institution, while the local government determines the placement and locations at which telecommunications towers may be constructed. In addition, telecommunications providers that own telecommunication towers and other tower owners are obligated to allow other telecommunication operators to utilize their telecommunication towers without any discrimination, with due regards to the technical capacity of the respective tower.
Since the operations of telecommunication towers involves a number of relevant Government bodies, on March 30, 2009, a joint regulationwas issued in the form of Minister of Home Affairs Regulation No.18/2009, Minister of Public Works Regulation No.07/PRT/M/2009, MoCI Regulation No.19/PER.M.KOMINFO/03/2009 and Head of the Investment Coordinating Board Regulation No.3/P/2009 (on guidelines for the construction and shared use of telecommunications towers) (“Joint Decree”).
The Joint Decree regulates that the license for telecommunication tower construction is to be issued by regents or mayors, and for Jakarta Province, its Governor. The Joint Decree also provides for tower construction standards and requires that telecommunications towers be made generally available for shared use by telecommunications service providers. The owner of a telecommunications tower is allowed to collect a fee, which is determined by reference to investment and operational costs, the return of investment and the profit. Monopolistic practices in the ownership and management of telecommunications towers is prohibited.
Content Provider Service
Content provider service is regulated by the Ministry of Communication and Information through Regulation No.21/2013(on themanagement ofcontentproviderservices oncellularmobilenetworks andwirelesslocalstaticnetworks withlimitedmobility), as amended by the Ministry of Communication and Information Regulation No.6/2015 of February 6, 2015.
C.ORGANIZATIONAL STRUCTURE
Wehave adopted a strategic control approach to the management of our Group, which we believe provides productive flexibility throughout our business entities in accordance with the characteristics of each customer facing unit.
In implementing this strategic control approach:
1. the role of the corporate office is focused on creating and implementing our overall corporate strategy (i.e. directing overall strategy, portfolio strategy and parenting strategy).
2. we tailor parenting style to the particular characteristics of the business segment and portfolios.
3. we seek to empower each customer facing unit in line with their respective particular characteristics.
In order to synchronize our organizational structure with our business character as well as with the dynamic business challenges we face, we revised our parenting strategy based on customer segmentation in order to achieve structural and operational alignment with our business portfolios. As a result of this transformation, our strategic control over our subsidiaries is mapped onto five customer facing units, which are discussed in greater detail below:
Table of Content
·Ourmobile customer facing unit is responsible for our mobile portfolio.
·Ourconsumer customer facing unit is responsible for our fixed portfolio.
·Ourenterprise customer facing unitis responsible for our enterprise digital portfolio.
·Ourwholesale and international customer facing unitis responsible for our wholesale and international portfolio as well as our network infrastructure portfolio.
·Ourdigital services customer facing unitis responsible for our consumer digital portfolio.
Each customer facing unit manages subsidiaries that operate our business portfolios which are relevant to such customer facing unit’s customer segmentation. In addition, each customer facing unit is responsible for the strategic development and performance of the subsidiaries which it oversees.
In order to support our parenting strategy, we have four functional units which perform certain specified internal corporate functions. Our functional units are discussed in greater detail below:
·Ourdigitalstrategicportfolio functional unitis responsiblefor creating company value through the optimization and harmonization of functional management strategyand business development, realize synergies within each customer facing units, maximize cross-customer facing unit synergies and optimize synergies among SOEs.
·Ournetwork, IT and solutions functional unit is responsible for promoting integrated network and IT infrastructure across our subsidiaries.
·Ourfinance functional unitis responsiblefor implementation cost and capital eficiency program andmaximizing the value of our assets.
·Ourhumancapitalmanagementfunctional unit is responsible for implementingan organizational structurebased on customer facing units,implementing shared servicewithin our Company, upgradinghuman resources programs to enhance digital andinternational talents and foster digital culture to strengthen digital business.
The table below sets forth our operating companies and significant subsidiaries and associate organized under the relevant customer facing unit and functional unit, including those subsidiaries that hold our principal telecommunications licenses, our percentage ownership interest, direct and indirect, and our voting power in each subsidiary as of December 31, 2016.
Subsidiary and associate | | Customer Facing Unit or Functional Unit | | Country of Incorporation | | Percentage Ownership Interest (Direct and Indirect) (%) | | Voting Power (%) | |
PT Telekomunikasi Selular (Telkomsel) | | Mobile | | Indonesia | | 65 | | 65 | |
PT Telkom Akses (Telkom Akses) | | Consumer | | Indonesia | | 100 | | 100 | |
PT Finnet Indonesia (Finnet) | | Enterprise | | Indonesia | | 60 | | 60 | |
PT Infomedia Nusantara (Infomedia) | | Enterprise | | Indonesia | | 100 | | 100 | |
PT Jalin Pembayaran Nusantara (Jalin) | | Enterprise | | Indonesia | | 100 | | 100 | |
PT Multimedia Nusantara (Telkom Metra) | | Enterprise | | Indonesia | | 100 | | 100 | |
PT Patra Telekomunikasi Indonesia (Patrakom) | | Enterprise | | Indonesia | | 100 | | 100 | |
PT PINS Indonesia (PINS) | | Enterprise | | Indonesia | | 100 | | 100 | |
PT Sigma Cipta Caraka (Sigma) | | Enterprise | | Indonesia | | 100 | | 100 | |
PT TeltraNet Aplikasi Solusi (Teltranet) | | Enterprise | | Indonesia | | 51 | | 51 | |
PT Dayamitra Telekomunikasi (Mitratel) | | Wholesale and International | | Indonesia | | 100 | | 100 | |
PT Infrastruktur Telekomunikasi Indonesia (Telkominfra) | | Wholesale and International | | Indonesia | | 100 | | 100 | |
Table of Content
There are 18 satellite operators with satellites covering Southeast Asia:
1.SES Global (Luxembourg)
2.Eutelsat Asia (France)
3.APT Satellite (Hong Kong)
4.AsiaSat (Hong Kong)
5.JSAT (Japan)
6.MEASAT (Malaysia)
7.MCI – Media Citra Indostar (Indonesia)
8.Indosat (Indonesia)
9.VinaSat (Vietnam)
10.SingTel/Optus (Singapore)
11.Telkom (Indonesia)
12.ChinaSat (China)
13.Mabuhay (Philippines)
14.Thaicom (Thailand)
15.ABS (Hong Kong)
16.Lippo Star (Indonesia)
17.Intelsat (US)
18.Telesat (Canada)
Our satellite operations primarily consist of leasing satellite transponders capacity to broadcasters and operators of VSAT, cellular and IDD services and ISPs, as well as providing earth station satellite up linking and down linking services to domestic and international users. We face competition from foreign and domestic service providers and compete most closely in Indonesia with Indosat and PSN. Other private satellites serving the broadcasting market within the coverage of the Telkom-1 and Telkom-2 satellites include AsiaSat-2, AsiaSat-4, AsiaSat-3S, Apstar-2R, Apstar-5, Apstar-6, ThaiCom-3, Measat-2, Measat-3, Measat-3a, PanAmSat-4 and PanAmSat-7. Our direct competitors in Asia are Measat Sdn. Bhd, which operates the Measat satellites, APT Satellite which operates the Apstar satellites, and Shin Satellite PCL, which operates the ThaiCom satellites.
The satellite industry in Indonesia is one of the most competitive in Southeast Asia. This is evident from the shift in market structure since 2003 from monopoly to oligopoly. One of the reasons for this shift in market structure is that the domestic satellite industry is not strictly regulated by the Government of Indonesia. Although Ministerial Regulation No.37/P/M.KOMINFO/12/2006 dated December 6, 2006 issued by the MoCI was intended as an entry barrier for foreign satellite operators, the currently applied “open sky” policy has in fact increased competition amongst domestic and foreign satellite operators. Another factor in the shift in market structure is the limited capacity of domestic satellite operators, which are thus unable to benefit from the fast growing market demands in Indonesia.
In view of market opportunities and limited supply,we plan to expandour satellite business with the construction of Telkom-3S satellite through a partnership on acquired orbital slot. The Telkom-3S satellite is currently under development.
The current trend in the satellite business is the development ofbroadbandsatellite. As the bandwidths in the C-Band and Ku-Band frequencies are fully utilized, utilization of the Ka-Band frequencies will become an option. The technology for Ka-Band frequencies has been progressing rapidly in the last decade. Broadband satellite utilize Ka-Band frequencies with a re-use configuration, resulting in capacities of up to 100 Gbps. Currently,we are engaged in design and demand studies for broadband satellites.
F.BTS
As of December 31, 2013,we operated 75,579BTS located throughout Indonesia. Through our subsidiary,Dayamitra, we lease out space to other operators to place their telecommunications equipment on these towers, for which we receive a fee. Our principal competitors in this business are XL Axiata, Indosat, Bakrie Telecom and PT Tower Bersama Infrastructure Tbk.
G.Others
Deregulation in the Indonesian telecommunications sector has encouraged competition in the multimedia, internet, and data communications services businesses. The diversification of businesses has gained momentum with the result that competition is now intense, particularly in terms of price, range of services offered, quality and network coverage, as well as customer service quality.
47
Subsidiary and associate | | Customer Facing Unit or Functional Unit | | Country of Incorporation | | Percentage Ownership Interest (Direct and Indirect) (%) | | Voting Power (%) | |
PT Telekomunikasi Indonesia International (Telin) | | Wholesale and International | | Indonesia | | 100 | | 100 | |
PT Melon (Melon) | | Digital Services | | Indonesia | | 100 | | 100 | |
PT Metra Digital Investama (MDI) | | Digital Services | | Indonesia | | 99.99 | | 99.99 | |
PT Metra Plasa (Metra Plasa) | | Digital Services | | Indonesia | | 60 | | 60 | |
PT Metranet (Metranet) | | Digital Services | | Indonesia | | 100 | | 100 | |
PT Graha Sarana Duta (Telkom Property) | | Finance | | Indonesia | | 99.99 | | 99.99 | |
Table of Content
Licensing
To provide national telecommunications services, we have a number of product and service licenses that are consistent with the applicable laws, regulations or decrees.
Following the issuance of MoCI Regulation No.01/PER/M.KOMINFO/01/2010 (“MoCI Decree No.01/2010”) dated January 25, 2010 concerning the Provision of Telecommunication Network, we were required to adjust our telecommunicationslicense to provide telecommunicationsservices. We have secured new licenses that have been adjusted as required of which are as follows:
A.Fixed Network and Basic Telephony Services
Based on the report submitted by us concerning the operation of fixed network and as part of the adjustment to MoCI Decree No.01/2010, we had our licenses adjusted in 2010 for the operation of local fixed network,domestic long distance, international call and closed fixed network, explained as follows:
-MoCI Decree No.381/KEP/M.KOMINFO/10/2010 dated October28,2010 on the License of Operating Local Fixed Network and Basic Telephony Services of PT Telekomunikasi Indonesia Tbk;
-MoCI Decree No.382/KEP/M.KOMINFO/10/2010 dated October28,2010 on the License of Operating Fixed Network of Domestic Long Distance and Basic Telephony of PT Telekomunikasi Indonesia Tbk;
-MoCI Decree No.383/KEP/M.KOMINFO/10/2010 dated October28,2010 on the License of Operating Fixed Network of International Call and Basic Telephony Services of PT Telekomunikasi Indonesia Tbk; and
-MoCI Decree No.398/KEP/M.KOMINFO/11/2010 datedNovember 12,2010 on the License of Operating Closed Fixed Network of PT Telekomunikasi Indonesia Tbk.
Following the issuance of MoCI Decrees No.381, 382 and 383, our previous licenses for operating a fixed network and basic telephony services previously owned by us based on MoC Decree No.KP.162 of 2004 dated May 13, 2004 ceased to be in effect. The licenses do not have a set expiry date, but are evaluated every five years.
B.Cellular
Telkomsel holds licenses to operate a nationwide mobile cellular telephone network using 7.5 MHz of radio frequency bandwidth in the 900 MHz band, 22.5 MHz of radio frequency bandwidth in the 1800 MHz band, and 15 MHz of radio frequency bandwidth in the 2100 MHz band. The licenses do not have a set expiry date, but will be evaluated every five years.Telkomsel also holdlicenses from the Indonesian Investment Coordinating Board that permit Telkomsel to develop cellular services with national coverage, including the expansion of its network capacity. In addition, Telkomsel holds permits and licenses from and registrations with certain regional governments and/or governmental agencies, primarily in connection with its operations in such regions, the properties it owns and/or the construction and use ofits BTS.
C.International Calls
Wecommenced our international call service in 2004. Our license for operating a fixed network to provide international call services was adjusted in 2010 to meet the requirements of MoCI Decree No.01/2010 with the issuance of MoCI Decree No.383/2010. The license does not have a set expiry date, but it will be evaluated in 2015.
We have a license to operate a closed fixed network based on MoCI Decree No.398/KEP/M.KOMINFO/11/2010, which amends the previous license, to meet the provisions in MoCI Decree No.01/2010. The license allows us to lease the installed closed fixed network, to among others, telecommunication network and service operators, including providing an international telecommunication transmission facility through a SCCS directly to Indonesia for overseas telecommunication operators.
According to MoCI Decree No.16/PER/M.KOMINFO/9/2005 dated October 6, 2005 concerning Provision of International Telecommunications Transmission Facilities through SCCS, overseas telecommunications operators wishing to provide an international telecommunications transmission facilities through the SCCS directly to Indonesia are required to set up a partnership with a fixed network of international call services or closed fixed network provider. In line with MoCI Decree No.16/2005, the international telecommunication transmission facilities provided through SCCS are served by us on the basis of landing rights attached to our license to operate fixed network of international call services. We have also secured landing rights based on the landing right Letter No.006-OS/DJPT.6/HLS/3/2010 dated March 2, 2010 from MoCI.
On March 2, 2010, the MoCI issued Decree No.75/KEP/M.KOMINFO/03/2010 granting our subsidiary, TII, a license to operate a closed fixed line network which enables TII to provide international infrastructure services. Separately, TII secured landing rights in Indonesia from the DGPT to provide international telecommunications transmission facilities through SCCS.
48
Table of Content
D.VoIP
We are licensed to provide internet telephony services for public needs as stated in DGPT Decree No.384/KEP/DJPT/M.KOMINFO/11/2010 dated November29,2010onVoice over Internet Protocol ("VoIP")services.This license does not have a set expiry date, but it will be evaluated every five years.
Telkomsel is also licensed to provide publicVoIPservices based on DGPT Decree No.226/DIRJEN/2009 regarding the provision of ITKP services. This license does not have a set expiry date, but it will be evaluated every five years by the Government.
E.ISP
We are licensed as an ISP under DGPI Decree No.83/KEP/DJPPI/KOMINFO/4/2011 dated April 7, 2011. This license does not have a set expiry date, but it will be evaluated every five years.
Telkomsel is also licensed to provide multimediainternetaccessservices with nation-wide coverage under DGPT Decree No.213/DIRJEN/2010. This license does not have a set expiry date, but it will be evaluatedannually, with a comprehensive evaluationevery five years.
F.Internet Interconnection Service
We hold a license to provide internet interconnection services by referring to DGPI Decree No.331/KEP/M.KOMINFO/09/2013dated on September 24, 2013 regarding license for Internet Interconnection Service(Network Access Point)for PT Telekomunikasi Indonesia Tbk. This license does not have a set expiry date, but it will be evaluated every five years.
G.BWA
In July 2009, we wonatender for a BWA license and the right to provide BWA services in twelve zones, comprisingeightzones on 3.3 GHz (North Sumatra, South Sumatra, Central Sumatra, West Kalimantan, East Kalimantan, West Java, JABODETABEK and Banten)andfive zoneson 2.3 GHz (Central Java, East Java, Papua, Maluku, and the northern part of Sulawesi).
In August 2009, the MoCI issued Ministerial Decree No.237/KEP/M.KOMINFO/7/2009 regarding the Appointment of the Winning Bidders for Packet Switched-Based Local Fixed Access Network Operators Using the 2.3 GHz Radio Frequency for Wireless Broadband Services. Because of inadequate implementation by the winning bidders, the MoCI later issued Regulation No.19/PER/M.KOMINFO/09/2011 dated September 14, 2011 (“MoCI Regulation No.19/2011”), which released operators on the 2.3 GHz radio frequency from the obligation to use the particular technology specified in the bid terms for the 2.3 GHz radio frequency, which were set out in MoCI Regulation No.22/PER/M.KOMINF0/04/2009 April 24, 2009 (“MoCI Regulation No.22/2009”). Pursuant to MoCI Regulation No.19/2011, operators on the 2.3 GHz radio frequency are now permitted to freely choose their technology in providing BWA on the 2.3 GHz radio frequency, subject to a requirement that they pay an annual usage rights fee for the third through the tenth year of the license period in which a technology divergent from that specified in MoCI Regulation No.22/2009 is used. On January 9, 2012, MoCI announced that it plans to make available for bidding additional 2.3 GHz radio frequency in the 2300-2360 MHz range for BWA services utilizing neutral technology.
MoCI Regulation No.19/2011 also stipulates domestic component obligations for telecommunications devices and equipment used in providing BWA on the 2.3 GHz radio frequency. Initial domestic component obligations are 30% for subscriber stations and 40% for base stations, to be increased to 50% within five years.
As a result of the switch to neutral technology under MoCI Regulation No.19/2011, we lost vendor support for our preferred technology, which is based on fixed BWA technology. Vendors instead preferred to support the mobile BWA technology selected by other operators. Mobile BWA technology competes with Telkomsel. We therefore returned 4 of the 5 zones, which we had received. We retained our BWA license for Maluku zone so we would continue to qualify as a BWA operator on 2.3 GHz and have the right to access the BWA networks maintained by other operators.
Becoming a broadband wireless access operator is in line with the transformation of our business to TIMES, which requires us to have infrastructure that is capable of responding to an increasingly complex market and the demand for ever more convergent products and services, whether in the consumer, enterprise or wholesale segments.
49
Table of Content
H.Data Communication System (“SISKOMDAT”)
We provide SISKOMDAT services under DGPI Decree No. 169/KEP/DJPPI/KOMINFO/6/2011 dated June 6, 2011 regarding License for Data Communications Systems Services Operation for PT Telekomunikasi Indonesia Tbk. This license does not have a set expiry date but will be thoroughly evaluated every five years.
I.Payment Method Using e-Money
Following the implementation of Bank Indonesia’s Regulation No.11/11/PBI/2009 and Circular Letter of Bank Indonesia No.11/10/DASP each dated on May 13, 2009 regarding how to use card-based payment instruments (“APMK”) and Bank Indonesia’s Regulation No.11/12/PBI/2009 and Circular Letter of Bank Indonesia No.11/11/DASP each dated May 13, 2009 on e-money, Bank Indonesia has redefined the meaning of “principal” and “acquirer” in operating APMK and e-money business. In light of these regulations, Bank Indonesia confirmed our status as an issuer of e-money based on letter of Directorate of Accounting and Payment System of Bank Indonesia No.11/13/DASP dated May 25, 2009. We operate our e-money business under the brand names “T-cash” and“Flexi cash”.
With the issuance of Bank Indonesia Circular Letter No. 9/9/DASP dated January 19, 2007, Telkomsel is also permitted to conduct APMK activities, with the launch of TelkomselTunai prepaid card.
J.Remittance Service
Based on a license from Bank Indonesia No.11/23/Bd/8, dated August 5, 2009, we may operate as a money transfer services provider.
K.IPTV
On April 27, 2011, we and TelkomVision together obtained a license to operate IPTV services through MoCI Decree No.MCIT.160/KEP/M.KOMINFO/04/2011 regarding the Telkom and TelkomVision IPTV Service Consortium Agreement. We now provide IPTV services in five locations: Greater Jakarta, Bandung, Semarang, Surabaya and Bali, under the brand “UseeTV”.
L.Construction Services Business License (“IUJK”)
On June 6, 2012, the City Government of Bandung issued a construction services business license to us through IUJK No.1-3273-858971-2-001772 for Telkom. The IUJK is valid for the execution of construction services throughout the domain of the Republic of Indonesia, comprising architecture, civil, mechanical and electrical works. The IUJK is valid until June 5, 2015.
Telecommunications Services Tariffs
We set our telecommunications tariffs in accordance with government regulations. Under Law No.36/1999 and Government Regulation No.52/2000, tariffs foroperating telecommunications network and/orservices are determined by providers based on the tarifftype, structure and with respect totheprice cap formula set by the Government.
A.Fixedline telephone tariffs
The Government has issued a new adjustment tariff formula which is stipulated in the Decree No. 15/PER/M.KOMINFO/4/2008 dated April 30, 2008 of the Ministry of Communication and Information (“MoCI”) concerning “Procedure for Tariff Determination for Basic Telephony Services Connected through Fixed Line Network”.
Under the Decree, tariff structure for basic telephony services connected through fixed line network consists of the following:
-Activation fee
-Monthly subscription charges
-Usage charges
-Additional facilities fee.
50
Table of Content
B.Mobilecellular telephone tariffs
On April 7, 2008, the MoCI issued Decree No. 09/PER/M.KOMINFO/04/2008 regarding “Mechanism to Determine Tariff of Telecommunication Services Connected through Mobile Cellular Network” which provides guidelines to determine cellular tariffs with a formula consisting of network element cost and retail services activity cost. This Decree replaced the previous Decree No. 12/PER/M.KOMINFO/02/2006.
Under MoCI Decree No. 09/PER/M.KOMINFO/04/2008 dated April 7, 2008, the cellular tariffs of operating telecommunication services connected through mobile cellular network consist of the following:
-Basic telephony services tariff
-Roaming tariff, and/or
-Multimedia services tariff,
with the following traffic structure:
-Activation fee
-Monthly subscription charges
-Usage charges
-Additional facilities fee.
C.Interconnectiontariffs
The Indonesian Telecommunication Regulatory Body (“ITRB”), in its letter No. 227/BRTI/XII/2010 dated December 31, 2010, decided to implement new interconnection tariffs effective from January 1, 2011 for cellular mobile network, satellite mobile network and fixed local network, and effective from July 1, 2011 for fixed wireless local network with a limited mobility.
Based on Decree No. 201/KEP/DJPPI/KOMINFO/7/2011 dated July 29, 2011 of the Director General of Post and Informatics, ITRB approved the Company’s revision of Reference Interconnection Offer (“RIO”) regardingthe interconnectiontariff.
ITRB, in its letter No. 262/BRTI/XII/2011 dated December 12, 2011, decided to change the basis for interconnection SMS tariff to cost basis with a maximum tariff of Rp23 per SMS effective from June 1, 2012, for all telecommunication provider operators.
D.Networkleasetariffs
Through MoCI Decree No. 03/PER/M.KOMINFO/1/2007 dated January 26, 2007 concerning “Network Lease”, the Government regulated the form, type, tariff structure, and tariff formula for services of network lease. Pursuant to the MoCI Decree, the Director General of Post and Telecommunication issued its Letter No. 115 Year 2008 dated March 24, 2008 which stated “The Agreement on Network Lease Service Type Document, Network Lease Service Tariff, Available Capacity of Network Lease Service, Quality of Network Lease Service, and Provision Procedure of Network Lease Service in 2008 Owned by Dominant Network Lease Service Provider”, in conformity with the Company’s proposal.
E.Tariff for other services
The tariffs for satellite lease, telephony services and other multimedia services are determined by the service provider by taking into account the expenditures and market price. The Government only determines the tariff formula for basic telephony services. There is no stipulation for the tariff of other services.
F.IMEStariffs
The tariffs for satellite lease, telephony services, and other multimedia are determined by the service provider by taking into account the expenditures and market price. The Government only determines the tariff formula for basic telephony services. There is no stipulation for the tariff of other services.
Trademarks, Copyrights, Industrial Designs and Patents
We constantly seek to develop product and service innovations in line with a dynamic business portfolio. To provide both protection for and recognition of the creativity involved, we have registered a number of intellectual property rights, including trademarks, copyrights, industrial design and patents, with the Directorate General of Intellectual Property Rights at the Ministry of Law and Human Rights of the Republic of Indonesia.
The intellectual property rights we have registered include: (i) trademarks for our products and services, corporate logo and name; (ii) copyrights on our corporate name and logo, product and service logos, computer programs, research and songs; and (iii) simple and ordinary patents on technological inventions in the form of telecommunications products, systems and methods.
51
Table of Content
The following table lists the brands that have been registered by us in2013:
No
|
| Title
|
| Application No.
|
| Application Date
|
| Registration Date
|
|
1
| | Speedytrek Xpose Ur Music
| | J002009011733
| | April 8, 2009
| | April 19, 2013
| |
2
| | SpeedyGroovia
| | J002010035301
| | October1, 2010
| | December9,2013
| |
3
| | DELIMA
| | J002011004453
| | May 11, 2011
| | January 7, 2013
| |
4
| | TELEPON RUMAH
| | J002011026179
| | July1,2011
| | August19,2013
| |
5
| | Flexi-Lebih Irit kan
| | J002011026180
| | July1,2011
| | August19,2013
| |
The following table lists the brands that we have applied for registrationforin 2013:
No.
|
| Title
|
| Application No.
|
| Application Date
|
|
1
| | U See Zone
| | J002013014812
| | April 2, 2013
| |
2
| | UTV
| | J002013004813
| | April 2, 2013
| |
3
| | U Zone
| | J002013004814
| | April 2, 2013
| |
4
| | U
| | J002013004815
| | April 2, 2013
| |
5
| | U meet me
| | J002013022833
| | May 16, 2013
| |
6
| | Indi Home
| | J002013057768
| | December 3, 2013
| |
The following table lists the copyrights that have been registered by usin 2012 and 2013:
No. | | Innovation Title | | Application No. | | Application Date | | Registration Date | | Innovation Number | |
1 | | Telkom UTV Mobile Primetime | | C00201205694 | | December 11, 2012 | | December 16, 2013 | | 065583 | |
2 | | Telkom Game Center Application | | C00201300509 | | February 7, 2013 | | November 15, 2013 | | 065500 | |
3 | | ART Promo Application | | C00201300510 | | February 7, 2013 | | November 15, 2013 | | 065501 | |
4 | | Telkom Store Application | | C00201300511 | | February 7, 2013 | | November 15, 2013 | | 065502 | |
5 | | Qonnect Application | | C00201300512 | | February 7, 2013 | | November 15, 2013 | | 065503 | |
6 | | Telkom SNS Hub Client | | C00201300513 | | February 7, 2013 | | November 15, 2013 | | 065504 | |
7 | | “Transformer” Computer Program | | C00201203811 | | August 8, 2012 | | July1,2013, 2013 | | 063830 | |
8 | | “Global Billing Application” Computer Program | | C00201203812 | | August 8, 2012 | | July1,2013, 2013 | | 063831 | |
9 | | “Internet Bijak” Logo | | C00201203814 | | August 8, 2012 | | July17,2013 | | 064136 | |
10 | | “Telkom Cloud-explore the possibilities” Logo | | C00201203815 | | August 8, 2012 | | July17,2013 | | 064137 | |
11 | | “U See TV” Logo | | C00201203816 | | August8 2012 | | October29,2013 | | 065176 | |
12 | | SIP Client | | C00201104855 | | December 20, 2011 | | October 12, 2012 | | 060930 | |
13 | | Location Based Social Networking | | C00201104856 | | December 20, 2011 | | October 12, 2012 | | 060931 | |
14 | | Supply Chain Management Application | | C00201200612 | | February 8, 2012 | | December 10, 2012 | | 061589 | |
15 | | RBT Advertising | | C00201200613 | | February 8, 2012 | | December 10, 2012 | | 061590 | |
16 | | Web-based Remote Control Application on Speedy Network | | C00201200614 | | February 8, 2012 | | December 10, 2012 | | 061591 | |
17 | | Flexi Belajar | | C00201200615 | | February 8, 2012 | | December 10, 2012 | | 061592 | |
18 | | Customized Personal View | | C00201200616 | | February 8, 2012 | | December 10, 2012 | | 061593 | |
19 | | Telkomsel Market | | C00201200617 | | February 8, 2012 | | December 10, 2012 | | 061594 | |
We applied for the following copyrights in 2012 and 2013:
No.
|
| Innovation Title
|
| Type of Intellectual Property Rights
|
| Application No.
|
| Application Date
|
| Registration Date
|
|
1
|
| TelkomTelemetering Smart Home
| | Computer Program
| | C00201205695
| | December 11, 2012
| | -
| |
2
| | U See Zone
| | Logo
| | C00201301288
| | April 2, 2013
| | -
| |
3
| | U Zone
| | Logo
| | C00201301289
| | April 2, 2013
| | -
| |
4
| | U
| | Logo
| | C00201301290
| | April 2, 2013
| | -
| |
5
| | UTV
| | Logo
| | Coo201301291
| | April 2, 2013
| | -
| |
6
| | Firmware Telkom Homegateaway
| | Computer Program
| | C00201301292
| | April 2, 2013
| | -
| |
7
| | Indi Home
| | Logo
| | C00201305330
| | December3, 2013
| | | |
We did not file for the registration of any patents in 2013.
52
Table of Content
Network Development
A.Fixed Line Network Development
In 2013, we continued to enhance our network infrastructure and develop our IDN. Our IDN plans represent our commitment to continue developing and improving the quality, efficiency and cost-structure of our network infrastructure. In line with our transformation into a TIMES provider, we are focused on delivering (i) an integrated NGN for the provision of multiple services (“id-Con”), (ii) IP-based optical backbone networks (“id-Ring”) and (iii) high speed broadband access through a fiber optic network and through Wi-Fi (which we term “id-Access”).
Project
|
| Description
|
|
Java-Sumatra-Kalimantan Project (“Jasuka”)
| | We continue to expand the Jasuka submarine infrastructure backbone to support internal needs and demand for domestic and international internet services. During 2013, we expanded capacity by 2 x 100 Gbps. We have now completed three of the five segments of the project, namely Tanjung Pakis - Tanjung Pandan, Cikupa - Dumai and Pontianak - Batam, while the other two segments namely Dumai - Batam and Tanjung pandan – Pontianak, are scheduled to be completed in May 2014 and July 2014, respectively.
| |
Mataram-Kupang Palapa Ring Project
| | In 2013 we only expanded this project with bearers of 2 x 10 Gbps connecting Mataram and Kupang and Mataram and Maumere. This project was completed in 2013.
| |
Development and Modernization of Broadband Access through the TITO Scheme
| | In 2013, we successfully migrated an additional 356,602 customers to fiber optic access through our broadband access development and modernization program through the application of the TITO method, pursuant to which our existing copper cables are replaced with more modern optical cables that are backed by active device technologies such as MSAN, GPON and FTTx.
| |
Broadband Access Development with MSAN (Multi Service Access Node) Platform
| | As of December 31, 2013, we had expanded our MSAN broadband network platform to have a capacity of 1,124,080 connections.
In 2014, we plan to expand our broadband network by equipping aproximately 70% of it with FTTx technology and the reminder with MSAN technology.
| |
Fiber To The Home Development Project
| | We deployed our gigabyte passive optical network in 2013 with 1,937,134 homepass as part of the deployment of our fiber to the home development project. In 2014, we plan to continue the expansion of our broadband access infrastructure, prioritizing the utilization of gigabyte passive optical network technology to expand the implementation of our fiber to the home network.
| |
IMS (IP Multimedia Subsystem) Development
| | IMS development is part of our infrastructure transformation and is intended to modernize our service nodes by providing IP capability, convergence, and enabling new application-based services that will allow us to integrate new customers and migrate existing customers towards multi-services and multi-screen features. In 2013, IMS nodes were built and operated serving 4,846,627 customers.
| |
TSCS (Tarakan Sangata Cable System)
| | To increase network capacity and build highly reliable transport backbone, we started the construction of the Sumatra-Bangka and Tarakan-Sangata submarine transport systems in 2011. In 2013, we began laying cable commissioning tests for the TSCS project.
In 2014 we plan to perform an integration test and load the TSCS network with commercial traffic.
| |
Implementation of the Telkom Cache System
| | We began the construction of the Telkom Cache System in 2012 in order to increase efficiency in the usage of our international internet bandwidth as well as to improve the quality of our internet service. Measurements conducted in 2013 showed that the implementation of Telkom Cache System can potentially save up to 28% of bandwidth. In 2013, we implemented the Telkom Cache System in 12 locations.
| |
Sulawesi, Maluku, Papua Cable System Project
| | In 2012, we began the construction of the Sulawesi, Maluku, Papua Cable System Project in order to expand the scope of our fiber-optic-based submarine transport backbone in eastern Indonesia. This project is expected to provide a maximum capacity of 40 x 100 Gbps and an initial capacity of 1 X 100 Gbps during the first phase.
The work has been carried out in the year 2013 are: contract signature Package # 1 (Sulawesi & Maluku area) and Package # 2 (Papua area), Kick Off Meeting Telkom and Contractors, Site Survey (Dry and Wet part) and Installation of Out site plan at several locations. The Maluku –Sulawesi segment of the cable system, which is considered the first phase of this project, is expected to be completed in December 2014 –January 2015.
| |
Jakarta-Batam-Singapore Cable System Project
| | We continued to improve the capacity and reliability of our network for international broadband internet service through the development of Jakarta-Batam-Singapore cable system with capacities of 1 x 40 Gbps and 9 x 10 Gbps. The Batam-Singapore segment is expected to be completed in 2014.
In 2013, we expanded the capacity of this project with the completion of 1 x 40 Gbps and 9 x 10 Gbps.
| |
In order to further strengthen our TIMES services, we plan to:
1.Continue to improve the capability of our networks to improve our enterprise broadband and broadband anywhere services in Indonesia.
2.Continue to improve the capability of the full-IP data transport network through the following programs: increasing domestic and international internet bandwidth, expanding the Terra IP backbone, expanding IP over lambda with 10 Gbps, 40 Gbps and eventually 100 Gbps per lambda,facilitating convergence and realizing synergies among networks in Telkom Group, continuing the development of Metro Ethernet which function as a single metro transport network to provide IP and multi-play-based services, continuing the development of FTTH, and continuing to replace our existing copper cables with fiber optic cables through the TITO mechanism.
53
Table of Content
3.Expand the capacity oftheIMS-based smart core, install and implement new services, continue to implement an integrated customer profile database, and optimize our service delivery platform as a service brokerage and orchestration.
4.Expand broadband coverage to enterprise and residential customers through a series of programs, including managed enterprise services, managed smart CPE, home automation, surveillance, and home interconnection.
Details ofourother significant commitments and contracts are presented in Note 38 to the Consolidated Financial Statements.
B.Fixed Wireless Network Development
In 2013, we optimized existing BTSs for our fixed wireless network, but did otherwise further develop our fixed wireless network due to our migration strategy. As of December 31, 2013, we had 5,715 BTSs in our fixed wireless network.
C.Cellular Network Development
GSM-based cellular services operated by our subsidiary, Telkomsel, now cover all cities and regencies in Indonesia. In 2013, Telkomsel deployed an additional 15,567 BTS.
D.Data Network Development
In 2013, we continued to improve the quality of our data network by increasing our capacity and network coverage. During the year, we increased our MSAN-based broadband access by 1,124,080 homepass and fiber to the home-based broadband access by 1,856,119 homepass. As of December 31, 2013, we had 8,196,055 homepass with broadband access. We also expanded the capacity and coverage of our Metro Ethernet and expanded the coverage and capacity of IP Core through the implementation of 10 Gbps and 40 Gbps lambda IP-based network services and the implementation of terra router. In 2013, we added an additional 6 terra router nodes bringing the total number of terra router nodes that we operate to 28 as of December 31, 2013, providing nation-wide coverage in Indonesia.
As part of our IDN program, we improved our IP Core network which supports our TIMES businesses and integrated our NGN core network between with our fixed wireline and fixed wireless businesses. Our IP Core was developed by adding core router nodes, PE (primary edge) router nodes and Ethernet ports.As of December 31,2013, our IP core network consisted of 6 core router nodes, 128 PE (primary edge) router nodes, 721 10GB Ethernet ports and 2,650 1GB Ethernet ports.
We expanded our Metro Ethernet network by setting up and upgrading 813 nodes whichenables us to providebroadband services throughout Indonesia. The Metro Ethernet network is also used as the main link for the IP DSLAM, MSAN for Speedy broadband service, softswitch, IP VPN and GPON broadband, whether for mobile backhaul, corporate business solutions or triple play services.In 2013, we added5,242 node B BTSs,resulting ina total of9,559 nodes B BTSs.
As of December 31,2013, we had expanded our internet gateway capacity to an installed capacity of 292 Gbps. In order to ensure adequate internet gateway capacity in anticipation of the expected rapid growth in fixed and mobile broadband traffic.In2013, we also cooperated with Akamai, Google and Yahoo to operate a content distribution network (“CDN”) with a capacity of 261 Gbps.
Throughout 2013, we continued to expand the coverage of our Indonesia Wi-Fi services by installing additional access points, through our own regular deployment program as well as through the implementation of a variety of partnership schemes. A total of75,250 access pointswere installed as of December 31, 2013.
CORPORATE STRATEGY
Ourstrategic targetto achieve our objectives in 2013was improving market capitalization. Our strategies consistedbroadlyof:
-Directional strategy: sustainable competitive growth.
-Portfolio strategy: converged TIMES portfolio.
-Parenting strategy: strategic guidance.
In 2013,we continued to adapt to the dynamics of the industry by updating our strategic initiatives with a focus on implementing the TIMES business framework and strengthening internal consolidation.We believed that thesestrategic initiatives support the comprehensive transformation of our organization, business portfolio, infrastructure, systems, and corporate culture that webelieved was necessary to realize our vision of becoming a leading TIMES company in the region. Besides providing a new growth stream, we believed thatour TIMES business also helped to promote the sustainable growth of our traditional telecommunications business.
54
Table of Content
To achieve the objective of these threecorporatebroadstrategies, wehave developed the following 10 strategic initiatives:
1.Center of Excellence
In order to improve our business performance and implement a new corporate culture we have established the“Telkom Corporate University”, which aims to educate our employees in order to meet international standards in the TIMES industry.
2.Focus on high growth or high value portfolio
We believe that deployingresources to the parts of our portfolio withthehighest growth and value potential will ultimately generate the optimum value for Telkom Group.This includes supporting Telkomsel in order to sustain its growth and market position as well as developing broadband through our Indonesia Digital Network program.
3.Accelerate international expansion
We plan to pursueinternational expansion through partnerships, alliances and acquisitions, giving priority to the Asia Pacific region, the Middle East and North Africa.Our subsidiary TII will be ourmain vehicle for international expansion.
4.Cost transformation
We aim toimprove cost efficiency and infrastructure capability, by utilizing technology (multiplay/multiservice/multiscreen), leverage existing asset (empowerment of the less productive assets) and create a creative business model (through partnerships to share costs).
5.IDN (id-Access, id-Ring, id-Con) Development
We plan tosupportour MP3EI (Government’s Master Plan for the Acceleration and Expansion of Indonesia's Economic Development) target of attainingbroadband access to 30% of households in Indonesia by the year 2015. IDN (Indonesia Digital Network) is also intendedto bridge the digital divide.
6.Indonesia Digital Solution (“IDS”) – Convergent services in digital ecosystem solution
We developed the IDSstrategic initiativeto support the Indonesia Digital Network program such as the digital media ecosystem (cooperation with best partners and differentiation through innovative business models) and business solution ecosystem (accelerate development of innovative business ecosystem &convergence services for excellent customer experience) space.
7.Indonesia Digital Platform (“IDP”) – Platform enabler for ecosystem development
Developed IDP strategic initiative toseekenhance overall customer experience and customer engagement through exploration of best technology, development appropriate business model and partnership scheme.
8.Execution of the best subsidiary management system
We believe that providingstrategic guidance to our subsidiaries is important for the success ofTelkom Group. In general,guidance provided to our subsidiarieswillfocus on the aspects of planning and optimalization of synergy within the Telkom Group.
9.Managing portfolio throughBoard of Executives (“BoE”) andChief Regional Officer (“CRO”)
Manage our subsidiaries subsidiaries through a Board of Executives and CROs. Our BoE compres our Board of Directors and the heads of four businesses, namely,mobile (represented byTelkomsel), multimedia (represented byMetra), infrastructure (represented byDayamitra) and international (represented byTII), and seven CROs representing Sumatera, DKI Jakarta, West Java & Banten, Central Java, East Java, Kalimantan and East Indonesia area.
10.Increasing synergy within Telkom Group
Optimizing synergies at the strategic and operational levels both within Telkom itself and across our subsidiaries.
55
Table of Content
In order to implementourdirectional strategy of sustainable competitive growth, weplan to seekopportunitiesfor inorganic growth through acquisitions & alliances (“A&A”) and corporate restructuring,as described below:
1.A&A program
A&A implementationis part ofour growth strategy objective to mitigate risks, develop capital, increase competency as well as accelerate access to synergy and value contribution. In 2013, we:
–acquired all sharesin PT Patra Telekomunikasi Indonesia (“Patrakom”), enabling us to integrate Patrakom’s line of business, namely providing asatellite-based closed fixed telecommunications network, as well as providing communication network and solutions, with a permit as Operator of Micro Earth Stations Communications System ("SKSBM");
–entered into astrategic partnership with PT Trans Corpora and PT TransMedia Corpora by selling shares of Indonusa (“Telkom Vision”) to strengthen Telkom Vision position in Pay TV industry;
–acquired 51% of PTPojokCelebes Mandiri, which engages in business-ticket bookingand online applications throughthe www.pointer.co.id website whichis been connected with the national airline and a large number of hotels in Indonesia;and
–Divestation all of our ownership from Scicom Bhd. Malaysia due to the differences in call center management strategy.
2.Corporate restructuring
We have implemented corporate restructuring through unit business spin-off program,possible initial public offeringof subsidiaries, established new subsidiaries and capital injection. In 2013, our corporate restructuring programincluded:
–business splitting: Metra Digital Media splitting from our indirect subsidiary, Infomedia;
–established new subsidiaries through overseas expansion such asinAustralia (IT business process outsourcing & solution), Macau (MVNO), Taiwan (MVNO), and United States of America (international network); and
–capital injection into, and increasing competence and certificationof, our subsidiary Telkom Akseswhich is developing the IDN network to provide customerswith a modernized broadband and fiber optic network.
C. ORGANIZATIONAL STRUCTURE
Information on Subsidiaries and Associated Companies
We have experienced continuous organic and inorganic growth. Organic growth is achieved through expansion of our existing operations and creating synergies between our subsidiaries. Inorganic growth is accomplished through acquisition of companies that we deemed were capable to add strategic value to our entire Group and contributing to the long-term revenue growth and sustainability of business.
The following table illustrates our corporate structure as of December 31,2013, including our direct and indirect equity ownership in our subsidiaries.
A complete list of our subsidiaries and investments in associated companies, and our ownership percentage of each entity, as of December 31,2013, is set forth below and31,2016, is contained in Notes1d and11Notes 1d and9 to our Consolidated Financial Statements included elsewhere in this report.
56
Table of Content
Direct Subsidiaries
Companies
|
| Percentage of
Ownership Interest
|
| Nature of Business
|
| Operational Status
|
| Description
|
|
PT Telekomunikasi Selular (“Telkomsel”), Jakarta
| | 65%
| | Telecommunication
| | Operational
| | Telkomsel, established on May 26, 1995, provides telecommunication facilities and mobile cellular services.
| |
PT Multimedia Nusantara (“Metra”), Jakarta
| | 100%
| | Multimedia and line telecommunication services
| | Operational
| | Metra, acquired on May 9, 2003, is our NEB holding company.Metra focuses on network construction, development, maintenance and services, and multimedia services (data communications systems, portal and online transaction services).
| |
PT Telekomunikasi Indonesia International (“TII”), Jakarta
| | 100%
| | Telecommunication
| | Operational
| | Previously known as PT Ariawest International, TII was established on July 31, 2003 and is a wholly owned subsidiary of Telkom. Currently, TII has obtained the Jartaptup license and Network Access Provider license. TII provides network services and international telecommunication services, as well as international business.
| |
PT Pramindo Ikat Nusantara (“PINs”), Jakarta
| | 100%
| | Telecommunication construction and services
| | Operational
| | PINs was originally established to operate our KSO in Sumatra. It was acquired on August 15, 2002.
| |
PT Dayamitra Telekomunikasi (“Dayamitra”), Jakarta
| | 100%
| | Telecommunication
| | Operational
| | Dayamitra provides fixed line telephone services, supply of telecommunications facilities and infrastructure and telecommunications services. Acquired on May 17, 2001, Dayamitra transformed itself by entering the telecommunications infrastructure supply business, which includes supplying telecommunications towers to meet the BTS installment needs of telecommunications operators all over Indonesia.
| |
PT Graha Sarana Duta (“GSD” or “Telkom Property”), Jakarta
| | 99.99%
| | Leasing of offices and providing building management and maintenance services, civil consultant and developer
| | Operational
| | Acquired on April 25, 2001, Telkom Property operates throughout Indonesia and manages buildings owned by us and third parties.
| |
PT Napsindo Primatel Internasional (“Napsindo”), Jakarta
| | 60%
| | Telecommunication
| | Ceased operation
| | Napsindo provided Network Access Point (“NAP”), Voice Over Data (“VOD”) and other related services. Established on December 29, 1998, Napsindo ceased operation as at January 13, 2006.
| |
PT Telkom Akses (“Telkom Akses”), Jakarta
| | 100%
| | Construction services and trade in the field of telecommunication
| | Operational
| | Telkom Akses was established on November 26, 2012.
| |
PT Patra Telekomunikasi Indonesia (“Patrakom”), Jakarta
| | 100%
| | Telecommunication and fixed line communication system
| | Operational
| | Patrakom was established on September 28, 1995.
On September 25 and November 29, 2013, theCompany acquired additional interest of 40% and 20%, respectively, of Patrakom.
| |
57
Table of Content
Indirect Subsidiaries
Companies
|
| Percentage of
Ownership Interest
|
| Nature of Business
|
| Operational Status
|
| Description
|
|
PT Infomedia Nusantara (“Infomedia”), Jakarta
| | 100% (through a 51%ownership by Metra)
| | Data and information service – provides telecommunication information services and other information services in the form of print and electronic media and call center services
| | Operational
| | Infomedia was acquired on September 22, 1999 to operate KSO in Sumatra. Infomedia has transformed from focusing on three pillars of business (directory services, contact center services and content services) to focus on business process outsourcing and digital media & rich content services.
| |
PT Sigma Cipta Caraka (“Telkomsigma”),Tangerang
| | 99.99% ownership by Metra
| | Information technology service – system implementation and integration service, outsourcing and software license maintenance
| | Operational
| | Telkomsigma was established on May 1, 1987. It service focuses on providing IT solutions.
| |
Telekomunikasi Indonesia International Pte. Ltd. (“TII Singapore”), Singapore
| | 100% ownership by TII
| | Telecommunication
| | Operational
| | TII Singapore was established on December 6, 2007, pursuant to the laws of Singapore. TII Singapore is a wholly owned subsidiary of TII. The Company has obtained Facility Based Operator License. Currently, it provides wholesale voice, wholesale data and Managed Service.
| |
PT Metra Plasa
(“Metra Plasa”), Jakarta
| | 60% ownership by Metra
| | Website services
| | Operational
| | Metra established Metra Plasa with eBay International AG on April2, 2012. Metra Plasa provides e-commerce service.
| |
PT Administrasi Medika (“Ad Medika”), Jakarta
| | 75% ownership by Metra
| | Health insurance and administration services
| | Operational
| | Ad Medika was established on February 25, 2010. Ad Medika processes online claim services between the hospitals and health insurance companies.
| |
PT Finnet Indonesia (“Finnet”), Jakarta
| | 60% ownership by Metra
| | Banking data and communication
| | Operational
| | Finnet was established on October 31, 2005, as a provider of IT infrastructure, applications and content for information systems and financial transactions for the banking and financial services industry.
| |
PT Telkom
Landmark Tower
(“TLT”), Jakarta
| | 55% ownership by Telkom Property
| | Service for property development and management
| | Operational
| | Telkom Property established TLT with Yakes Telkom on February 1, 2012.
| |
Telekomunikasi Indonesia International Ltd., Hong Kong (“TII Hong Kong”), Hong Kong
| | 100% ownership by TII
| | Telecommunication
| | Operational
| | TII Hong Kong was established in Hong Kong on December 8, 2010 a wholly owned subsidiary of TII. TII Hong Kong obtained Unified Carrier License on March 1, 2011, Service Based Operator for MVNO on July 27, 2011 and License for Operating Money Service on July 18, 2012. Currently, it provides wholesale voice, wholesale data and retail mobile services. The MVNO service was provided under the brand Kartu As 2in1.
| |
PT Metra-Net (“Metra-Net”), Jakarta
| | 99.99% ownership by Metra
| | Multimedia portal service
| | Operational
| | Metra-Net was established on April 17, 2009 and focuses on e-commerce (B2C) and portals.
| |
Telekomunikasi Selular Finance Limited (“TSFL”), Republic of Mauritius
| | 65% ownership by Telkomsel
| | Finance
| | Still in liquidation process
| | TSFL was established on April 22, 2002 to raise funds for the development of Telkomsel’s business through the issuance of debenture stock, bonds, mortgages or any other securities.
| |
58
Table of Content
Companies
|
| Percentage of
Ownership Interest
|
| Nature of Business
|
| Operational Status
|
| Description
|
|
Telekomunikasi Indonesia International("TL") S.A. (“TII Timor Leste”), Timor Leste
| | 100% ownership by TII
| | Telecommunication
| | Operational
| | TII Timor Leste was a subsidiary of TII established on October 4, 2012. TII Timor Leste has obtained radio spectrum license and general registration certificate. It provides cellular services with coverage all over Timor Leste districts and broadband internet with 3G on 850 MHz frequency, Corporate Solution, as well as Wholesale Voice and Data.
| |
PT Graha Yasa Selaras (“GYS”), Bandung
| | 51% ownership by Telkom Property
| | Tourism service
| | Operational
| | Telkom Property established GYS with Yakes Telkom on April 27, 2012 to focus on hospitality services.
| |
PT Metra Digital Media (“MDM”), Jakarta
| | 99.99% ownership by Metra
| | Telecommunicationinformationservices
| | Operational
| | MDM was established on January28, 2013 and focuses on digital advertising services.
| |
PT Pojok Celebes Mandiri (“Pointer”), Jakarta
| | 51% ownership by Metra
| | Travel agency/bureau
| | Operational
| | Pointer was established on August 30, 2013 and provides travel booking and purchase service.
| |
PT Satelit Multimedia Indonesia (“SMI”), Jakarta
| | 99.99% ownership by Metra
| | Trading and services in telecommunication network, satellite, and multimedia equipment
| | Operational
| | SMI was established onApril 17, 2013 and focuses on commerce and providing network services, telecommunication, satellite and multimedia services.
| |
PT Metra Media (“MM”), Jakarta
| | 99.83% ownership by Metra
| | Trading, supplier, construction, advertising and other services
| | Operational
| | MM established on January29, 2013 and focuses on trading, supplier, construction, advertising and other services.
| |
Telekomunikasi Indonesia International Pty Ltd., (“TII Australia”), Australia
| | 100% ownership by TII
| | Telecommunication and IT-based services
| | Operational
| | TII Australia wholly owned subsidiary of TII. Established on February 6, 2013,it engages in Business Process Outsourcing (BPO), Information Technology Outsourcing (ITO), and IT Services.
| |
PT Metra TV (“Metra TV”), Jakarta
| | 99.83% ownership by Metra
| | Subscription broadcasting services
| | Operational
| | Metra TV was established on January29, 2013 and provides pay TV services.
| |
Telekomunikasi Indonesia International (USA) Inc., USA
| | 100% ownership by TII
| | Telecommunication
| | Dormant
| | Telekomunikasi Indonesia International (USA) Inc. is a wholly owned subsidiary by TII. It was established on December 11, 2013.
| |
59
Table of Content
Associated Companies
Companies
|
| Percentage of
Ownership Interest
|
| Nature of Business
|
| Operational Status
|
| Description
|
|
PT Integrasi Logistik Cipta Solusi (“ILCS”), Jakarta
| | 49% ownership by Metra
| | e-trade logistic services and other related services
| | Operational
| | Metra established ILCS with Pelindo II on September 26, 2012.
| |
PT Citra Sari Makmur (“CSM”), Jakarta
| | 25%
| | Very Small Aperture Terminal (“VSAT”), network application services and consulting services on telecommunications technology and related facilities
| | Operational
| | CSM was established on February 14, 1986.
| |
PT Pasifik Satelit Nusantara (“PSN”), Jakarta
| | 22.38%
| | Satellite transponder leasing and satellite-based communication services in the Asia Pacific region
| | Operational
| | Established on July 2, 1991, PSN held its initial public offering of its ordinary shares in June 1996, listing them on the National Association of Securities Dealers Automated Quotations (“NASDAQ”), but was delisted on November 6, 2001 in connection with its failure to meet certain NASDAQ National Market Listing conditions.
| |
PT Indonusa Telemedia (“Indonusa” or “TelkomVision”), Jakarta
| | 20% (including through 0.46% ownership by Metra)
| | Pay television and content services
| | Operational
| | Established on May 7, 1997, TelkomVision is a multimedia (pay TV, internet service) service provider. Since 2007, TelkomVision was the first Pay TV operator in Indonesia to launch DTH Prepaid (Prepaid Satellite Pay TV), under the “TelkomVision” brand. On October 8, 2013, company sold Indonusa 1.036.059.483 shares (equivalent with 80% of its ownership in Indonusa) to PT Trans Corpora and PT Trans Media Corpora.
| |
Joint Venture Companies
Company
|
| Percentage of
Ownership Interest
|
| Nature of Business
|
| Operational Status
|
| Description
|
|
PT Melon Indonesia (“Melon”), Jakarta
| | 51% ownership by Metra
| | Digital Content Exchange Hub services (“DCEH”)
| | Operational
| | Melon is a joint venture company between Metra and SK Telecom Korea. Melon was established on August 16, 2010.
| |
Telekomunikasi Indonesia
International Malaysia Sdn. Bhd., Kuala Lumpur
| | 49% Ownership by TII
| | Telecommunication
| | Operational
| | Telekomunikasi Indonesia International Malaysia Sdn. Bhd. is a Joint Venture Company with Compudyne. Sdn. Bhd. established on July10, 2013, obtaining Applications Service Provider Class (ASP(C)) on July 23, 2013 and Network Service Provider (NSP) on August 23, 2013. Engaging in the business of providing a full range of telecommunication services and other business related to telecommunications systems, data processing, systems and information systems in Malaysia.
| |
60
Table of Content
Telkom’s Subsidiaries Chart

Information on Our Organizational Structure
We have adopted a holding company approachto corporate management, which we believe shouldprovide productive flexibility for allourbusiness entities in accordance with theneeds of the respectiveunits.
In implementingthis holding companyapproach:
1.The role of the corporate office is focused on the Corporate Level Strategy function (i.e. directing overall strategy, portfolio strategy and parenting strategy).
2.We tailor parenting style to theparticularcharacteristics of the business entity.
3.We seek to empowereach business entity in line with their respectiveparticularcharacteristics.
Accordingly,we have initiated a number of changes in2013 involvingreorganization of divisions as well as division of duties and authority of the Board of Directors, as follows:
1.Werealigned the division which was formerly under the Director of Enterprise & Wholesale to the Director of Enterprise & Business Service, who focuses on developing the enterpriseand small medium enterprise business segments.
2.Werealigned the division which was formerly under the Director of Compliance & Risk Management to the Director of Wholesale & International Service, who focuses on developing the wholesale business segment.We also transferred the duties and authority over the compliance, legal and risk management functions to the Head of Compliance, Risk Management & General Affairs.
3.Werealigned the division which was formerly under the Director of IT, Solution & Strategic Portfolio (“ITSSP”) to the Director of Innovation & Strategic Portfolio, who focuses on business innovation and business portfolio development.
4.Werealigned the division which was formerly under the Director of NWS to the Director of Network, IT & Solution, who focuses on management and utilization of infrastructure, IT and service operation & management, to provide support for the development of established businesses.
61
Table of Content
5.Werealigned the division which was formerly under the Director of Human Capital & General Affair to the Director of Human Capital Management, who focuses on managing human capital.We also transferred of duties and authority over the supply management function to the Head of Compliance, Risk Management & General Affairs.
In addition, we introduced Board of Executives to improve our parenting mechanism. The Board’s membership comprises all members of Telkom’s Board of Directors and a number of Chief of Business.The Chiefs of Business title is reserved for senior business experts, who are our senior executives andhorizontally positioned equivalent toour Directors. OurChief of Business is meant to servein formulating corporate level strategy decisions, fostering a harmonious relationship between subsidiaries andthe parent.
Telkom’s Organizational Structure
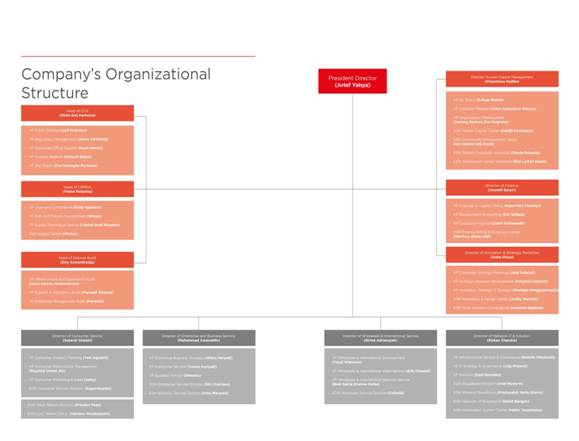
Directorate
|
| Function and Authority
|
|
NITS Directorate
| | Focuses on managing the Infrastructure Strategy & Governance, IT Strategy & Governance, and Solution, as well as managing the IT utilization andservice operation & management, in order to support the capitalization ofestablishedbusinesses and also controlling infrastructure operations through the Network of Broadband, Information System Center Division, Wireless Broadband Division and Broadband Division.
| |
ISP Directorate
| | Focuses on managing the functions ofcorporate strategic planning, strategic business development, innovation strategy & synergy, as well as the operational management of the Solution Convergence Division and Innovation &Des Center units.
| |
CONS Directorate
| | Focuses on managing theconsumer business segment and the operational management of the Consumer Services Division.
| |
EBIS Directorate
| | Focuses on managing the enterprise and small medium enterprise business segment as well as managing the Enterprise Services Division and Business Services Division.
| |
WINS Directorate
| | Focuses on managing the wholesale and international business segment, and the operational management of the Wholesale Services Division.
| |
HCM Directorate
| | Focuses on managing the company’s human resources and the operational management of human resources centrally through the Human Capital Center unit, as well as controlling operations of the Telkom Corporate University Center, Assessment Center Indonesia, and Community Development Center units.
| |
FIN Directorate
| | Focuses on the company’s financial management, and managing financial operations centrally through the Finance, Billing & Collection Center unit.
| |
Table of Content
D. PROPERTY AND EQUIPMENT
Our property and equipment isare primarily used for telecommunication operations, which mainly consist of transmission installation and equipment,andinstallationequipment, cable network and switching equipment. A description of these is contained elsewhere in Note 12Note10 to our Consolidated Financial Statements.
Statements and “— Business Overview — Network Infrastructure and Development". See item 5 “Operating and Financial Review and Prospects— Liquidity— Capital Expenditures” for material plans to construct, expand or improve our property and equipment.
Except for ownership rights granted to individuals in Indonesia, reversionary rights to land rests with the Republic of Indonesia,Government, pursuant to Agrarian Law No.5/No.5 of 1960. Land title is designated through land rights, including Right to Build (Hak Guna Bangunanor HGB) and Right of Use (Hak Guna Usahaor HGU). Land title holders enjoy full use of the land for a specified period, subject to renewal and extensions. In most instances, land rights are freely tradable and may be pledged as security under loan agreements.
We own several pieces of land located throughout Indonesia withrightwith theright to buildand use for a period of 10-45of10 to 45 years, which will expire between 20142017 and 2052.We2053.We believe that there will be no difficulty in obtaining the extension of the land rights when they expire.
As of December 31,2013, we, including our subsidiaries, had land use rights to2,995 properties. Weexpire.We hold registered rights to buildand usefor most of our properties. Pursuant to Government Regulation No.40/1996, the maximum initial period for the right to build is 3530 years and is renewable for an additional 2520 years. We are not aware of any environmental issues that could affect the utilization of our property and equipment. All assets owned byour Company hashave been pledged as collateral for bonds.bonds and certain bank loans. Certain property and equipment ofour subsidiaries with gross carrying value amounting to Rp6,214Rp11,385 billion as of December 31,201331,2016 have been pledged as collateral for lending agreements.See Notes 18 and 19 ofagreements.Please refer to Notes16 and17 to our Consolidated Financial Statements.
Insurance
OurAs of December 31, 2016, property and equipment excluding land arerights,with net carrying amount of Rp105,144 billionwere insured against risks arising from force majeure, fire, theft, earthquake and other specified risks. Our assets are coveredrisks, including business interruption, under property all risk insuranceblanket policies on a sum insured basis and a first loss basis scheme, which include business recovery with the automatic reinstatement of loss clause. Our Telkom-1 and Telkom-2 satellites are insured separately. Our managementtotaling Rp11,861 billion, US$1,236 million, HKD3 millionandSGD40 million. Management believes that ourthe insurance coverage is adequate to cover potential losses from the insured risks.
Disclosure of Iranian Activities under Section 13(r) of the Exchange Act
Section 219 of the Iran Threat Reduction and Syria Human Rights Act of 2012 added Section 13(r) to the Exchange Act. Section 13(r) requires an issuer to disclose in its annual or quarterly reports, as applicable, whether it or any of its affiliates knowingly engaged in certain activities, transactions or dealings relating to Iran or with designated natural persons or entities involved in terrorism or the proliferation of weapons of mass destruction. Disclosure is required even where the activities, transactions or dealings are conducted outside the United States by non-United States affiliates in compliance with applicable law, and whether or not the activities aresanctionableunder U.S. law.
Table of Content
As of the date of this report, we are not aware of any activity, transaction or dealing by us or any of our affiliates in 2016 that requires disclosure in this report under Section 13(r) of the Exchange Act, except as set forth below.
Our subsidiary, Telkomsel, is party to international roaming agreements with Mobile Telecommunication Company of Iran and Irancell Telecommunications Services Company, which are or may be government-controlled entities. In 2016, we recorded gross revenues ofUS$23,126from these agreements. The amount of our net profits earned under these agreements is not determinable, but it does not exceed our gross revenues from these agreements.The purpose of these agreements is to provide Telkomsel’s customers with coverage in areas where Telkomsel does not own networks, and for this reason Telkomsel intends to continue the activities covered by these agreements.
We also provide telecommunications services in the ordinary course of business to the Embassy of Iran in Jakarta, Indonesia. We recorded gross revenue of approximately Rp56.9million from these services in 2016. The amount of our net profits earned under these services is not determinable, but it does not exceed our gross revenues from these services. As one of the primary providers of telecommunications services in Indonesia, we intend to continue providing such services, as we provide to the embassies of many other nations.
ITEM 4A.UNRESOLVED4A. UNRESOLVED STAFF COMMENTS
Not applicable.
ITEM 5.OPERATING5.OPERATING AND FINANCIAL REVIEW AND PROSPECTS
The following discussion and analysis should be read in conjunction with our Consolidated Financial Statements for the years ended December 31, 2011 (Restated), 2012 (Restated) and 2013 included elsewhere in this Form 20-F. These Consolidated Financial Statements were prepared in accordance with IFRS as issued by the IASB.
As discussed in Note 2aa to Consolidated Financial Statements, we changed the method of accounting for defined benefit plans on a retrospective basis as a result of adoption of IAS 19Employee Benefits (Revised 2011), and the 2011 and 2012 Consolidated Financial Statements have been restated.
A. OPERATING RESULTS
We are the principal provider of local, domestic and international telecommunications services in Indonesia, as well as the leading provider of mobile cellular services in Indonesia through our majority-owned subsidiary, Telkomsel. Our objective is to become a leading TIMES player in the region. As of December 31, 2013,2016, we had approximately 175.5 million total subscribers in service, comprising 131.5 million cellular173.9 millionmobilecellular subscribers through Telkomsel, 9.4Telkomsel,10.7 million subscribers on our fixed wireline network, 6.8 million subscribers on our fixed wireless network and 27.864 million broadband subscribers. Wesubscribers.We also provide a wide range of other communication services, including telephone network, interconnection services, multimedia, data and internet communication-related services, satellite transponder leasing, leased line, intelligent network and related services, cable television and VoIP services.We also operate multimedia businesses such as providing content and applications.We intend to continue to cope with market and industry challenges that may arise from time to time by leveraging our customer base, network quality, brand name and strategic execution capabilities.
Table of Content
Growth of the Indonesian economy slowed in 20132016 as growth in gross domestic product decreased from an average of 6.3%of5.8% between 2011and 2015 to4.8% in the period from 2010-2012 to 5.8% in 2013. Inflation2016and inflation accelerated from an average of 4,5%of4.5% between 2012and 2015 to5.0% in the period from 2009-2012 to 8.4% in 20132016 (source: Center of Statistic Bureau) and theRupiahIndonesiaCentralBureau ofStatistics). The Rupiah depreciated from an average ofRp8,779 to one U.S. Dollarin 2012 to an average of Rp9,282Rp13,307 in the period from 2009-2012 to Rp12,189 as2016 and hitting low of December 31, 2013Rp13,946 in 2016 (source: Bank Indonesia). Though we believe that the exposure of our Company and our subsidiaries to foreign exchange rates isare not material, we are exposed to foreign exchange risk on our sales, purchases and borrowings that are primarily denominated inUSinU.S. Dollars and Japanese Yen.
See Item 11 “Quantitative and Qualitative Disclosure about Market Risk – Exchange–ForeignExchange Rate Risk”.
The growth in our revenues in 2013 compare to 2012revenuesin 2016 compared with 2015 was largely driven by increases in revenues from data, internet and information technology services which increased by 14.8% driven largely by increased mobile phone data usage and mobile broadband subscribers, as well as by cellular revenues which increased by 4.6%of 23.3%.
Our expensesoperating resultsin 2016 compared with 2015 also increasedreflected an increase in 2013 as compared to 2012.expenses. This increase was mainly driven by operation, maintenance and telecommunication services expenses, which increased primarily as a result of an increase in expenses relation to expand our network capacities to better serve our customers, especiallyparticularly for internet and data service.
Table of Content
Principal Factors Affecting ourour Financial Condition andand Results of Operations
Increase in Cellular Telephone Revenues with Increase in SubscribersData, Internet, and Stabilizing ARPUInformation Technology Services
Our cellular telephone revenues increased by 4.6% in 2013 compare to 2012 primarily due to an increase in the number of our cellular subscribers by 5.1% in 2013. Our revenues from cellular phone services (e.g. usage charges, monthly subscription charges and features) accounted for 38.7% of our consolidated revenues in 2013, compared to 39.8% in 2012.
In Indonesia mobile phones have become the primary tool for telecommunication, both for voice calls as well as in terms of internet usage. Over 50% of our combined voice and data cellular revenues in 2013 were derived from voice services, but theThe growing popularity of smartphones has contributed to the growth of our ARPU from approximately Rp43,000 in 2015 to approximately Rp45,000 in 2016.
Data, internet and information technology services revenues accounted for 50.6% of our consolidated revenues for 2016, up from 46.6% for 2015. Revenues from our data, revenues in recent years.We believe that competition invoice tariffs hasbeguninternet and information technology services increased by 23.3% from 2015 to stabilize, while the2016. The increase in data, revenue has contributedinternet and information technology services revenues in 2016 was primarily due to a stabilization and slight44.0% increase in our ARPUrevenue from cellular internet and data, and 6.2% increase in 2013. Our average monthly ARPU increased slightlyrevenue from approximately Rp37,000non-cellular internet, data communication and information technology service. We seek to continue to increase such revenues as we continue to invest in 2012 to approximately Rp37,500 in 2013.
improving broadband infrastructure.
We believeexpect that revenue from cellular internet and data will continue to increase and contribute a larger portion of our consolidated revenues in line with an expected increase in the prevalence of smartphone usage in Indonesia. We also intend to increase such revenues by focusing our marketing efforts to encourage customers who currently only utilize mobile voice and SMS services to commence utilizing mobile broadband services. We also intend to continue our promotion of mobile package options in order to encourage existing mobile broadband services customers to increase their use of such services.
Flattening Cellular Telephone Revenues
The rapid development of new technologies, new services and products, and new business models has resulted in distinctions between local, long-distance, wireless, cable and internet communication services being lessened and has brought new competitors into the telecommunications market. Traditional cellular services, such as voice and SMS services, are subject to increasing competition from non-traditional telecommunication services, such as Over The Top products including instant voice and messaging services and other mobile services. As a result, while cellular telephone revenues, which comprise usage charges and monthly subscription charges for mobile voice and SMS services, have increased in the competitionpast, this increase has become more rationalmoderated and we expect that it will continue to moderate in Indonesia,the future. Our cellular telephone revenues increased by 3.3% from Rp37,285 billion in 2015 to Rp38,497 billion 2016. In addition, we still consider it as a major riskalso expect that the contribution of revenues from cellular phone services to our businesses.
consolidated revenues will continue to decrease in the future, as we expect that contribution from data, internet and information technology services will continue to grow and comprise a greater percentage of our consolidated revenues in the future . Our revenues from cellular phone services accounted for 33.1% of our consolidated revenues for 2016 compared to 36.3% for 2015. See Item 3 “Key Information – Risk Factors – Risks Related to Ourour Business – Competition Risks Related to Ourtoour Fixed and Cellular Business (Telkomsel)”Telecommunication Business".
Increase in Data, Internetoperations and Information Technology Services Revenuesmaintenance expenses
Data, internetWe expect that our operations and information technology services revenues accounted for 38.2% of our consolidated revenues in 2013, compared to 35.9% in 2012. Revenues from our data, internet and information technology services increased by 14.8% in 2013 as compare to 2012. The increase in data, internet and information technology services revenues in 2013 was primarily due to a 23.7% increase in revenues from internet, data communication and information technology services, largely driven by increased mobile phone data usage and mobile broadband subscribers. As part of our transformation into a TIMES provider, and our corporate objective of growing our new wave businesses, we seek tomaintenance expenses will continue to increase such revenues.
in the future in line with our expected growth in subscribers and traffic as well as the investments that we intend to make to continue developing our network infrastructure, particularly for internet and data service, in order to increase in our network capacities to better serve our customers. Our operations and maintenance expenses increased by Rp1,918 billion, or 12.7%, from Rp15,129 billion in 2015 toRp17,047 billion in 2016. Our operations and maintenance expenses primarily comprise expenses associated with network maintenance to improve our mobile cellular and fixed broadband services and accounted for21.9% of our total expenses for 2016.
Decrease in Fixed Lines Telephone RevenuesDeferred tax benefits realized under Government tax incentive scheme
OurOn December 29, 2015, we filed an application for fixed lines telephone revenues decreasedassets revaluation for tax purpose using self-assessed revaluation amount and paid the related final income tax amounting to Rp750 billion. We are required to submit the revaluation amount that has been evaluated by 9.0% from Rp10,662 billionPublic Independent Appraiser (“KJPP”). In 2016, we appointed a KJPP to perform fixed assets revaluation. We planned to submit the related KJPP report in 2012 to Rp9,701 billion in 2013 astwo phases, where KJPP reports Phase 1 and Phase 2 will be submitted before December 31, 2016 and December 31, 2017, respectively.
On October 28, 2016, we submitted KJPP report (Phase 1) reporting a revaluation increment of Rp7,078 billion. As a result, we recognized a deferred tax asset of an 8.3% decreaseRp1,415 billion for 2016 which resulted in fixed wireline revenues and an 14.3% decrease in fixed wireless revenues. We believe that fixed lines telephone revenues have been declining due to the increased usage and more competitive tariffsa deferred tax benefit of mobile cellular services and increased penetration of cellular subscribers in Indonesia. Cellular services provide increased convenience, and in certain cases where subscribers call other subscribers using the same provider’s network, tariffs can be lower than fixed wireline calls that are made to subscribers of another provider.Rp1,721 billion for 2016. We expect that the trend of declining fixed lines telephone revenues will continue.
to settle such deferred tax benefit with respect to our book income within 20 years.
Table of Content
On December 15, 2016, we re-submitted fixed assets revaluation application for Phase 2 to Directorate General of Taxation (“DGT”). In accordance with the regulation, we are required to submit the fixed assets revaluation assessed by KJPP on December 31, 2017 at the latest. There is no assurance that the Government will approve of such applications.
Telkom’s Consolidated Statements of Profit or Loss and Other Comprehensive Income
The following table sets out our Consolidated Statements ofProfit or Loss and OtherComprehensive IncomeFor the Years ended December 31, 2014, 2015 and 2016. Each item is expressed as a percentage of total revenues or expenses.
| 2014 | | 2015 | | 2016 | |
| (Rp billion) | | % | | (Rp billion) | | % | | (Rp billion) | | % | | (US$ million) | |
Revenues | | | | | | | | | | | | | | |
Telephone Revenues | | | | | | | | | | | | | | |
Cellular | | | | | | | | | | | | | | |
Usage charges | 33,723 | | 37.6 | | 36,853 | | 35.9 | | 38,238 | | 32.9 | | 2,838 | |
Monthly subscription charges | 567 | | 0.6 | | 432 | | 0.4 | | 259 | | 0.2 | | 19 | |
| 34,290 | | 38.2 | | 37,285 | | 36.3 | | 38,497 | | 33.1 | | 2,857 | |
Fixed Lines | | | | | | | | | | | | | | |
Usage charges | 5,347 | | 6.0 | | 4,635 | | 4.5 | | 3,847 | | 3.3 | | 286 | |
Monthly subscription charges | 2,697 | | 3.0 | | 2,821 | | 2.8 | | 3,311 | | 2.8 | | 246 | |
Call Center | 290 | | 0.3 | | 275 | | 0.3 | | 290 | | 0.2 | | 22 | |
Others | 101 | | 0.1 | | 102 | | 0.1 | | 94 | | 0.1 | | 7 | |
| 8,435 | | 9.4 | | 7,833 | | 7.7 | | 7,542 | | 6.4 | | 561 | |
Total Telephone Revenues | 42,725 | | 47.6 | | 45,118 | | 44.0 | | 46,039 | | 39.5 | | 3,418 | |
Interconnection Revenues | 4,708 | | 5.2 | | 4,290 | | 4.2 | | 4,151 | | 3.6 | | 308 | |
Data, Internet and Information Technology Services Revenues | | | | | | | | | | | | | | |
Cellular, internet and data | 13,563 | | 15.1 | | 19,665 | | 19.2 | | 28,308 | | 24.3 | | 2,101 | |
Short Messaging Service ("SMS") | 14,034 | | 15.7 | | 15,132 | | 14.8 | | 15,980 | | 13.7 | | 1,186 | |
Internet, data communication and information technology services | 9,987 | | 11.1 | | 12,307 | | 12.1 | | 13,073 | | 11.2 | | 970 | |
Pay TV | 96 | | 0.1 | | 581 | | 0.4 | | 1,546 | | 1.3 | | 115 | |
Others | 128 | | 0.2 | | 135 | | 0.1 | | 64 | | 0.1 | | 5 | |
Total Data, Internet and Information Technology Services Revenues | 37,808 | | 42.2 | | 47,820 | | 46.6 | | 58,971 | | 50.6 | | 4,377 | |
Network Revenues | 1,280 | | 1.4 | | 1,231 | | 1.2 | | 1,444 | | 1.4 | | 107 | |
Others Revenues | | | | | | | | | | | | | | |
Sales of handset | 582 | | 0.7 | | 1,516 | | 1.5 | | 1,490 | | 1.3 | | 111 | |
Telecommunication tower leases | 700 | | 0.8 | | 721 | | 0.7 | | 733 | | 0.6 | | 54 | |
Call center service | 446 | | 0.5 | | 668 | | 0.7 | | 678 | | 0.6 | | 50 | |
E-payment | 74 | | 0.1 | | 126 | | 0.1 | | 424 | | 0.4 | | 31 | |
E-health | 165 | | 0.1 | | 192 | | 0.2 | | 415 | | 0.4 | | 31 | |
CPE and terminal | 61 | | 0.1 | | 221 | | 0.2 | | 192 | | 0.1 | | 14 | |
Others | 1,147 | | 1.3 | | 567 | | 0.6 | | 1,796 | | 1.5 | | 134 | |
Total Other Revenues | 3,175 | | 3.6 | | 4,011 | | 4.0 | | 5,728 | | 4.9 | | 425 | |
Total Revenues | 89,696 | | 100.0 | | 102,470 | | 100.0 | | 116,333 | | 100.0 | | 8,635 | |
Expenses | | | | | | | | | | | | | | |
Operations, Maintenance and Telecommunication Services Expenses | | | | | | | | | | | | | | |
Operations and maintenance | 11,512 | | 18.7 | | 15,129 | | 21.1 | | 17,047 | | 21.9 | | 1,265 | |
Table of Content
TELKOM'SCONSOLIDATEDCOMPREHENSIVE INCOME
|
The following table sets out ourConsolidatedComprehensive Income, for 2011 through 2013. Each item is expressed as a percentage of total revenues or expenses.
|
| 2014 | | 2015 | | 2016 | |
| (Rp billion) | | % | | (Rp billion) | | % | | (Rp billion) | | % | | (US$ million) | |
Radio frequency usage charges | 3,207 | | 5.2 | | 3,626 | | 5.1 | | 3,687 | | 4.8 | | 274 | |
Leased line and CPE | 1,073 | | 1.7 | | 1,913 | | 2.7 | | 2,578 | | 3.3 | | 191 | |
Concession fees and USO charges | 1,818 | | 3.0 | | 2,230 | | 3.1 | | 2,217 | | 2.8 | | 165 | |
Cost of IT services | 357 | | 0.6 | | 882 | | 1.2 | | 1,563 | | 2.0 | | 116 | |
Cost of handset sold | 421 | | 0.7 | | 1,493 | | 2.1 | | 1,481 | | 1.9 | | 110 | |
Electricity, gas and water | 1,180 | | 1.9 | | 1,014 | | 1.4 | | 960 | | 1.2 | | 71 | |
Cost of SIM cards and vouchers | 610 | | 1.0 | | 444 | | 0.6 | | 624 | | 0.8 | | 46 | |
Vehicles rental and supporting facilities | 272 | | 0.4 | | 296 | | 0.4 | | 367 | | 0.5 | | 27 | |
Tower lease | 1,065 | | 1.7 | | 646 | | 0.9 | | 322 | | 0.4 | | 24 | |
Insurance | 335 | | 0.5 | | 312 | | 0.4 | | 256 | | 0.3 | | 19 | |
Others | 438 | | 0.7 | | 131 | | 0.2 | | 161 | | 0.2 | | 13 | |
Total Operations, Maintenance and Telecommunication Services Expenses | 22,288 | | 36.1 | | 28,116 | | 39.2 | | 31,263 | | 40.1 | | 2,321 | |
Depreciation and Amortization | 17,178 | | 27.9 | | 18,572 | | 25.9 | | 18,556 | | 23.8 | | 1,377 | |
Personnel Expenses | | | | | | | | | | | | | | |
Salaries and related benefits | 5,076 | | 8.2 | | 5,684 | | 7.9 | | 7,122 | | 9.2 | | 529 | |
Vacation pay, incentives and other benefits | 3,504 | | 5.7 | | 4,575 | | 6.5 | | 4,219 | | 5.4 | | 312 | |
Pension benefit cost | 643 | | 1.1 | | 443 | | 0.6 | | 1,068 | | 1.4 | | 79 | |
Early retirement program | - | | - | | 683 | | 1.0 | | 628 | | 0.8 | | 47 | |
LSA expenses | 115 | | 0.2 | | 152 | | 0.2 | | 237 | | 0.3 | | 18 | |
Net periodic post-employment health care benefit cost | 248 | | 0.4 | | 216 | | 0.3 | | 163 | | 0.1 | | 12 | |
Other employee benefit cost | 56 | | 0.1 | | 53 | | 0.1 | | 82 | | 0.1 | | 6 | |
Other post-employment benefit cost | 48 | | 0.1 | | 47 | | 0.1 | | 48 | | 0.1 | | 4 | |
Others | 86 | | 0.1 | | 32 | | 0.0 | | 45 | | 0.1 | | 3 | |
Total Personnel Expenses | 9,776 | | 15.9 | | 11,885 | | 16.7 | | 13,612 | | 17.5 | | 1,010 | |
Interconnection Expenses | 4,893 | | 7.9 | | 3,586 | | 5.0 | | 3,218 | | 4.1 | | 239 | |
General and Administrative Expenses | | | | | | | | | | | | | | |
General Expenses | 967 | | 1.6 | | 1,032 | | 1.4 | | 1,626 | | 2.1 | | 121 | |
Provision for impairment of receivables | 784 | | 1.3 | | 1,010 | | 1.4 | | 743 | | 1.0 | | 55 | |
Professional fees | 266 | | 0.4 | | 424 | | 0.6 | | 594 | | 0.8 | | 44 | |
Travelling | 355 | | 0.6 | | 347 | | 0.5 | | 436 | | 0.5 | | 32 | |
Training, education and recruitment | 528 | | 0.9 | | 393 | | 0.5 | | 399 | | 0.4 | | 30 | |
Meeting | 162 | | 0.3 | | 163 | | 0.2 | | 207 | | 0.3 | | 15 | |
Collection expenses | 369 | | 0.6 | | 368 | | 0.5 | | 152 | | 0.2 | | 11 | |
Social contribution | 96 | | 0.2 | | 116 | | 0.2 | | 134 | | 0.2 | | 10 | |
Others | 436 | | 0.7 | | 351 | | 0.5 | | 319 | | 0.4 | | 24 | |
Total General and Administrative Expenses | 3,963 | | 6.6 | | 4,204 | | 5.8 | | 4,610 | | 5.9 | | 342 | |
Marketing Expenses | 3,092 | | 5.0 | | 3,275 | | 4.6 | | 4,132 | | 5.3 | | 307 | |
Loss on foreign exchange - net | 14 | | 0.0 | | 46 | | 0.1 | | 52 | | 0.1 | | 4 | |
Other expenses | 396 | | 0.6 | | 1,917 | | 2.7 | | 2,469 | | 3.2 | | 183 | |
Total expenses | 61,617 | | 100.0 | | 71,603 | | 100.0 | | 77,824 | | 100.0 | | 5,776 | |
Other income | 1,076 | | | | 1,500 | | | | 751 | | | | 56 | |
Operating Profit | 29,172 | | | | 32,369 | | | | 39,172 | | | | 2,908 | |
Finance income | 1,238 | | | | 1,407 | | | | 1,716 | | | | 127 | |
Finance costs | (1,814) | | | | (2,481) | | | | (2,810) | | | | (209) | |
Share of profit (loss) of associated companies | (17) | | 0.0 | | (2) | | 0.0 | | 88 | | 0.0 | | 7 | |
Profit before Income Tax | 28,579 | | | | 31,293 | | | | 38,166 | | | | 2,833 | |
Net Income Tax Expense | (7,341) | | | | (8,023) | | | | (9,017) | | | | (669) | |
| Years Ended December 31, | |
| 2011 (Restated) | | 2012 (Restated) | | 2013 | | 2013 | |
| (Rp billion) | | % | | (Rp billion) | | % | | (Rp billion) | | % | | (US$ million) | |
Revenues | | | | | | | | | | | | | | |
Telephone | | | | | | | | | | | | | | |
Cellular | | | | | | | | | | | | | | |
Usage charges | 27,189 | | 38.2 | | 29,477 | | 38.2 | | 30,722 | | 37.0 | | 2,524 | |
Monthly subscription charges | 569 | | 0.8 | | 696 | | 0.9 | | 730 | | 0.9 | | 60 | |
Features | 838 | | 1.2 | | 558 | | 0.7 | | 686 | | 0.8 | | 56 | |
Connection fee charges | 2 | | 0.0 | | - | | 0.0 | | - | | 0.0 | | - | |
Total | 28,598 | | 40.1 | | 30,731 | | 39.8 | | 32,138 | | 38.7 | | 2,641 | |
Fixed Lines | | | | | | | | | | | | | | |
Usage charges | 8,213 | | 11.5 | | 7,323 | | 9.5 | | 6,453 | | 7.8 | | 530 | |
Monthly subscription charges | 3,004 | | 4.2 | | 2,805 | | 3.6 | | 2,682 | | 3.2 | | 220 | |
Call center | 199 | | 0.3 | | 228 | | 0.3 | | 324 | | 0.4 | | 27 | |
Installation charges | 135 | | 0.2 | | 112 | | 0.1 | | 12 | | 0.0 | | 1 | |
Others | 68 | | 0.1 | | 194 | | 0.3 | | 230 | | 0.3 | | 19 | |
Total | 11,619 | | 16.3 | | 10,662 | | 13.8 | | 9,701 | | 11.7 | | 797 | |
Total Telephone | 40,217 | | 56.5 | | 41,393 | | 53.7 | | 41,839 | | 50.4 | | 3,438 | |
Data, Internet and Information Technology Services | | | | | | | | | | | | | | |
Internet, data communication and information technology services | 10,548 | | 14.8 | | 14,857 | | 19.3 | | 18,373 | | 22.1 | | 1,510 | |
SMS | 13,093 | | 18.4 | | 12,631 | | 16.4 | | 13,134 | | 15.8 | | 1,079 | |
VoIP | 245 | | 0.3 | | 81 | | 0.1 | | 119 | | 0.1 | | 10 | |
e-Business | 38 | | 0.1 | | 55 | | 0.1 | | 83 | | 0.1 | | 7 | |
Total Data, Internet and Information Technology Services | 23,924 | | 33.6 | | 27,624 | | 35.8 | | 31,709 | | 38.2 | | 2,606 | |
Interconnection | 3,509 | | 4.9 | | 4,273 | | 5.5 | | 4,843 | | 5.8 | | 398 | |
Network | 1,301 | | 1.8 | | 1,208 | | 1.6 | | 1,253 | | 1.5 | | 103 | |
Other Telecommunications Services | 2,287 | | 3.2 | | 2,629 | | 3.4 | | 3,323 | | 4.0 | | 273 | |
Total Revenues | 71,238 | | 100.0 | | 77,127 | | 100.0 | | 82,967 | | 100.0 | | 6,817 | |
Expenses | | | | | | | | | | | | | | |
Operations, Maintenance and Telecommunication Services Expenses | | | | | | | | | | | | | | |
Operations and maintenance | 9,184 | | 18.4 | | 9,012 | | 16.6 | | 10,667 | | 18.4 | | 876 | |
Radio frequency usage charges | 2,846 | | 5.7 | | 3,002 | | 5.5 | | 3,098 | | 5.4 | | 255 | |
Concession fees andUSO charges | 1,235 | | 2.5 | | 1,445 | | 2.7 | | 1,595 | | 2.8 | | 131 | |
Electricity, gas and water | 836 | | 1.7 | | 879 | | 1.6 | | 1,063 | | 1.8 | | 87 | |
Cost of phone, set top boxes, SIM and RUIM cards | 967 | | 1.9 | | 687 | | 1.3 | | 752 | | 1.3 | | 62 | |
Cost of IT services | 144 | | 0.3 | | 222 | | 0.4 | | 677 | | 1.2 | | 56 | |
Leased lines and CPE | 406 | | 0.8 | | 407 | | 0.8 | | 440 | | 0.8 | | 36 | |
Vehicles rental and supporting facilities | 291 | | 0.6 | | 293 | | 0.5 | | 439 | | 0.8 | | 36 | |
Insurance | 431 | | 0.9 | | 671 | | 1.2 | | 374 | | 0.6 | | 31 | |
Project management | 46 | | 0.1 | | 102 | | 0.2 | | 138 | | 0.2 | | 11 | |
Traveling expenses | 54 | | 0.1 | | 57 | | 0.1 | | 53 | | 0.1 | | 4 | |
Others | 13 | | 0.0 | | 19 | | 0.0 | | 36 | | 0.1 | | 3 | |
TotalOperations, Maintenance and Telecommunication Services Expenses | 16,453 | | 33.0 | | 16,796 | | 31.0 | | 19,332 | | 33.4 | | 1,588 | |
Depreciation and Amortization | 14,823 | | 29.7 | | 14,474 | | 26.7 | | 15,805 | | 27.3 | | 1,299 | |
Personnel Expenses | | | | | | | | | | | | | | |
Salaries and related benefits | 3,001 | | 6.0 | | 3,257 | | 6.0 | | 3,553 | | 6.1 | | 292 | |
Vacation pay, incentives and other benefits | 2,814 | | 5.6 | | 3,400 | | 6.3 | | 3,252 | | 5.6 | | 267 | |
Employees’ income tax | 1,043 | | 2.1 | | 1,022 | | 1.9 | | 1,160 | | 2.0 | | 95 | |
Pension benefit cost | 438 | | 0.9 | | 831 | | 1.5 | | 988 | | 1.7 | | 81 | |
Post-employment health care benefit cost | 158 | | 0.3 | | 246 | | 0.5 | | 382 | | 0.7 | | 31 | |
Housing | 197 | | 0.4 | | 200 | | 0.4 | | 220 | | 0.4 | | 18 | |
Insurance | 70 | | 0.1 | | 83 | | 0.2 | | 92 | | 0.2 | | 8 | |
Other post-employment benefit cost | 46 | | 0.1 | | 42 | | 0.1 | | 41 | | 0.1 | | 3 | |
LSA expense | 96 | | 0.2 | | 121 | | 0.2 | | 19 | | 0.0 | | 2 | |
Other employee benefitscost | 24 | | 0.0 | | 35 | | 0.1 | | 15 | | 0.0 | | 1 | |
Table of Content
| Years Ended December 31, | |
| 2011 (Restated) | | 2012 (Restated) | | 2013 | | 2013 | |
| (Rp billion) | | % | | (Rp billion) | | % | | (Rp billion) | | % | | (US$ million) | |
Early retirement program | 517 | | 1.0 | | 699 | | 1.3 | | - | | - | | - | |
Others | 20 | | 0.0 | | 24 | | 0.0 | | 107 | | 0.2 | | 9 | |
TotalPersonnel Expenses | 8,424 | | 16.9 | | 9,960 | | 18.4 | | 9,829 | | 17.0 | | 808 | |
Interconnection Expenses | 3,555 | | 7.1 | | 4,667 | | 8.6 | | 4,927 | | 8.5 | | 405 | |
Marketing Expenses | 3,278 | | 6.6 | | 3,094 | | 5.7 | | 3,044 | | 5.3 | | 250 | |
General and Administrative Expenses | 2,935 | | 5.9 | | 3,036 | | 5.6 | | 4,155 | | 7.2 | | 341 | |
Loss on foreign exchange - net | 210 | | 0.4 | | 189 | | 0.3 | | 249 | | 0.4 | | 20 | |
Other expenses | 192 | | 0.4 | | 1,973 | | 3.6 | | 480 | | 0.8 | | 40 | |
Total Expenses(1) | 49,880 | | 100.0 | | 54,200 | | 100.0 | | 57,850 | | 100.0 | | 4,753 | |
Other income | 666 | | | | 2,559 | | | | 2,581 | | | | 212 | |
Operating Profit | 22,034 | | | | 25,497 | | | | 27,727 | | | | 2,278 | |
Finance income | 620 | | | | 596 | | | | 836 | | | | 69 | |
Finance costs | (1,662 | ) | | | (2,055 | ) | | | (1,504 | ) | | | (124) | |
Share of loss of associated companies | (10 | ) | 0.0 | | (11 | ) | 0.0 | | (29 | ) | 0.1 | | (2 | ) |
Profit before Income Tax | 20,982 | | | | 24,027 | | | | 27,030 | | | | 2,221 | |
Net Income Tax Expense | (5,437 | ) | | | (5,886 | ) | | | (6,900 | ) | | | (567 | ) |
Profit for the Year | 15,545 | | | | 18,141 | | | | 20,130 | | | | 1,654 | |
Other Comprehensive Income(Expenses) - Net | (1,928 | ) | | | (2,540 | ) | | | 5,115 | | | | 420 | |
Net Comprehensive Income for the Year | 13,617 | | | | 15,601 | | | | 25,245 | | | | 2,074 | |
Profit for the year attributable to owners of the parent company | 11,043 | | | | 12,621 | | | | 14,046 | | | | 1,154 | |
Net comprehensive income for the year attributable to owners of the parent company | 9,183 | | | | 10,056 | | | | 19,018 | | | | 1,562 | |
Basic and Diluted Earnings per Share (in full amount) | | | | | | | | | | | | | | |
Net income per share | 112.73 | | | | 131.45 | | | | 145.77 | | | | 0.01 | |
Net income per ADS (200 Series B shares per ADS) | 22,546.00 | | - | | 26,290.80 | | - | | 29,153.58 | | - | | 2.40 | |
| 2014 | | 2015 | | 2016 | |
| (Rp billion) | | % | | (Rp billion) | | % | | (Rp billion) | | % | | (US$ million) | |
Profit for the Year | 21,238 | | | | 23,270 | | | | 29,149 | | | | 2,164 | |
Other Comprehensive Income (Expenses) - Net | 810 | | | | 493 | | | | (2,099) | | | | (156) | |
Net Comprehensive Income for the Year | 22,048 | | | | 23,763 | | | | 27,050 | | | | 2,008 | |
Profit for the year attributable to owners of the parent company | 14,437 | | | | 15,451 | | | | 19,333 | | | | 1,435 | |
Net comprehensive income for the year attributable to owners of the parent company | 15,291 | | | | 16,003 | | | | 17,312 | | | | 1,285 | |
Basic and Diluted Earnings per Share (in full amount) | | | | | | | | | | | | | | |
Profit per share | 147.78 | | | | 157.38 | | | | 195.99 | | | | 0.01 | |
Profit per ADS (100 shares of common stock per ADS) | 14,778.00 | | | | 15,738.00 | | | | 19,599.85 | | | | 1.45 | |
(1)Expenses are calculated as the sum of the following expenses: operation, maintenance and telecommunication services, depreciation and amortization, personnel, interconnection, marketing, general and administrative, loss (gain) on foreign exchange, share of loss of associated companies and other expenses.
Financial Overview
Year endedended December 31, 2013 compared 2016comparedto year endedyearended December 31, 20122015
1.RevenuesRevenues
Total revenues increased by Rp5,840Rp13,863 billion, or 7.6%13.5%, from Rp77,127Rp102,470 billion in 20122015 to Rp82,967Rp116,333 billion (US$8,635 million) in 2013.2016. The increase in revenues in 2013 was primarily due to an increasecontributed by increases in cellular telephone revenues andinternet, data internet and information technology servicesservice revenues,cellular telephone revenues,and partially offset by a decrease in revenue from fixed lines telephone.others revenues.
a. Cellular Telephone Revenues
Cellular telephone revenues increased by Rp1,407Rp1,212 billion, or 4.6%3.3%, from Rp30,731Rp37,285 billion in 20122015 to Rp32,138Rp38,497 billion (US$2,857 million) in 20132016.This increase was primarily due to increaseanincrease in usage charge as a result of a5.1%increase in our cellular subscribers.
Usage charges increased by Rp1,245Rp1,385 billion, or 4.2%or3.8%, from Rp29,477Rp36,853 billion in 20122015 to Rp30,722Rp38,238 billion in 2013 due to2016 in line with an increase in the numberTelkomsel subscribers from152.6millionas of both our prepaid and postpaid subscribers, and due to anDecember 31, 2015to 173.9million as of December 31, 2016.
This increase waspartiallyoffset by adecrease in our long distance usage. Revenues from features increased by Rp128 billionmonthly subscription charges byRp173billion, or 22.9%40.0%, from Rp558Rp432 billion in 20122015 to Rp686Rp259 billion in 2013. Monthly subscription charges increased by Rp34 billion, or 4.9%, from Rp696 billion in 2012 to Rp730 billion in 2013 primarily due to 15.8% increase in the number of our postpaid subscribers.
Our total cellular telephone revenues accounted for 38.7% of our consolidated revenues in 2013, compared to 39.8% in 2012.
2016.
b. Fixed LinesLine Telephone Revenues
Fixed lines telephone revenues decreased by Rp961decreasedby Rp291 billion, or 9.0%3.7%, from Rp10,662Rp7,833 billion in 20122015 to Rp9,701Rp7,542 billion (US$561 million) in 2013.2016. The decrease in fixed lines telephone revenues wasrevenueswas primarily due to aadecrease in usage chargesof Rp788 billion, or 17.0%, from Rp4,635billion in 2015to Rp3,847billion in 2016 due toa decrease in fixed wireline and fixed wireless revenues of8.3% and 14.3%, respectively. Thefrom voice services.
This decrease in fixed wireline and fixed wireless revenues was primarily due to a decrease in usage charges of Rp870 billion, or 11.9%, and a decreasewaspartiallyoffset by an increase in monthly subscription chargessubscriptionchargesof Rp490 billion, or17.4%, due toan increase in revenues of Rp123 billion, or 4.4%, which were primarily caused by a decrease in local and domestic long distance usage caused by the trend of shifting usage from fixed lines telephone to cellular telephoneIndiHome services.
c. Data, Internet and Information Technology Services Revenues
Our data, internet and information technology service revenues accounted for 38.2%50.6% of our consolidated revenues in 2013,for 2016, compared to 35.9% in 2012.
46.6% for 2015. Data, internet and information technology services revenues increasedservice revenuesincreased by Rp4,085Rp11,151 billion, or 14.8%23.3%, from Rp27,624Rp47,820 billion in 20122015 to Rp31,709Rp58,971 billion (US$4,377 million) in 2013.2016. This increase was primarily due to an:
Table of Content
·increase in data cellular and internet revenues by Rp8,643 billion, or 44.0%, from Rp19,665 billion in 2015 toRp28,308 billion in 2016 primarily driven by an increase in mobile broadband usage and an increase inFlash subscribers from 43.8 million subscribers as of December 31, 2015 to 60.0 million subscribers as of December 31, 2016. For additional information on factors driving the growth of our data cellular and internet revenues, see "--- Principal Factors Affecting our Financial Condition and Results of Operations --- Increase in Data, Internet, and Information Technology Services";
·increase in Pay TV income by Rp965 billion, or 166.1%, from Rp581 billion in 2015 toRp1,546billion in 2016 due to an increase in revenues from interactive TV services that we offer as part of the IndiHome bundled service;
·increase in SMS revenues by Rp848 billion, or 5.6%, from Rp15,132 billion in 2015 to Rp15,980 billion in 2016 primarily due to our implementation of variable pricing which was based on the geographical location of users;and
·increase in internet, data communication and information technology servicesservice revenue by Rp3,516Rp766 billion, or 23.7%6.2%, which was driven by the following factors:
-a 38.7% increase in cellular data communication revenues from Rp7,491Rp12,307 billion in 20122015 to Rp10,393 billionRp13,073billion in 2013, which accounted for32.8%2016 primarily due to an increase of data, internet and information technology revenues in 2013, resulting from a56.5%increase in Flash mobilefixed broadband subscribers from11.0from 4.0 million subscribers in 2012as of December 31, 2015 to 17.34.3 million subscribers in 2013,
-a 6.3% increase in Speedy monthly subscription revenues from Rp4,150 billion in 2012 to Rp4,413 billion in 2013, which accounted for13.9%as of data, internet and information technology revenues in 2013, resulting from a 28.7% increase in Speedy subscribers, from 2.3 million subscribersin2012 to 3.0million subscribers in2013,
-a 47.4% increase indata communication Ethernet revenue from Rp338 billion in 2012 to Rp498 billion in 2013, which accounted for1.6% of data, internet and information technology revenues in 2013 due toa39.4% increase inthevolumeofdata which passed throughMetro Ethernet of, from 240,315 Mbps in 2012 to 334,935 Mbps in 2013,and
-a 7.8% increase indata communicationVPNrevenue from Rp1,621 billion in to Rp1,748 billion in 2013, which accounted for5.5% of data, intenet and information technology revenues in 2013 due toa14.1% increase inthe volumeofdata which passed throughourVPN network, from 40,748Mbps in 2012 to46,505 Mbps in 2013.December 31, 2016.
SMSThis increase was partially offset by adecreasein other data and internet revenues increased by Rp503 billion,byRp71billion, or 4.0%52.6%, from Rp12,631 billionfromRp135billion in 2012 to Rp13,134 billion2015toRp64billion in 2013 due to a25.2% increase in our SMS volumes from118.1 billion messages in 2012 to 147.9 billion messages in 2013. Effective June 1, 2012, in line with the cost-based interconnection regime for voice calls, the Government implemented cost-based interconnection for SMS. As Telkomsel historically had more incoming SMS than outgoing SMS, cost-based interconnection for SMS resulted in an overall benefit for Telkomsel.2016.
d. Interconnection Revenues
Interconnection revenues comprisecomprised interconnection revenues from our fixed line network and interconnection revenues from Telkomsel’s mobile cellular network. Interconnection revenues include incomingnetwork, includingincoming international long-distance revenues from our IDD service (TIC-007).
Interconnection revenues decreased by Rp139 billion, or 3.2%, from Rp4,290 billion in 2015 to Rp4,151 billion (US$308 million) in 2016primarilydue to a decrease in domestic interconnectionof Rp365 billion, or 16.0%, from Rp2,276 billion in 2015 to Rp1,911 billion in 2016 primarily due to a decreaseindomestic interconnection traffic.
This decrease waspartiallyoffset by anincrease in international interconnection revenues of Rp226 billion, or 11.2%, fromRp2,014billion in2015toRp2,240billion in 2016 primarily due to an increase in international interconnection traffic.
e.Network Revenues
Network revenues increased by Rp570Rp213 billion, or 13.3%17.3%, from Rp4,273Rp1,231 billion in 20122015 to Rp4,843Rp1,444 billion (US$107 million) in 2016 primarily due to an increase in satellite transponder lease revenue by Rp533 billion, or104.1%,from Rp512 billion in 2013.2015 to Rp1,045 billion in 2016 primarily due to anincrease ofsatellite transpondercapacity from 4,648 million MHz as of December 31, 2015 to 6,801 million MHz as of December 31, 2016. This increase was partially offset bya decrease in leased line revenue of Rp320 billion, or 44.5%, fromRp719billion in 2015to Rp399billion in 2016.
f.Other Revenues
In 2016, revenues from other services increased by Rp1,717 billion, or 42.8%, from Rp4,011 billion in 2015 to Rp5,728 billion (US$425 million) in 2016. The increase was primarily due to an:
·increasein other revenues by Rp1,229billion, or 216.8%, from Rp567 billion in 2015 to Rp1,796 billion in 2016 primarily due to an increase in revenues from leasing and trading activities PT Telkom Akses, manage non-device others, room rentals, and income from building and hotel;
·increase ine-Payment revenues by Rp298 billion, or236.5%, from Rp126 billion in 2015 to Rp424 billion in 2016; and
·increase in e-health revenue by Rp223billion, or 116.1%, from Rp192 billion in 2015 to Rp415 billion in 2016.
This increase was partially offset by adecrease inCPE revenues byRp29 billion, or 13.1%, fromRp221billion in2015toRp192billion in 2016.
Table of Content
Other Income
Other income decreased by Rp749 billion, from Rp1,500 billion, or49.9%, in 2015 to Rp751 billion (US$56 million) in 2016 primarily due to a decrease in income from sales of scrapped copper cables extracted during the process of replacing copper cables with fiber optic cables and income frompenalties received from third partyvendors.
Expenses
Total expensesincreased by Rp6,221 billion, or 8.7%, from Rp71,603 billion in 2015 to Rp77,824 billion (US$5,776 million) in 2016. The increase in expenses was attributable primarily to increases in operations, maintenance and telecommunication service expenses, personnel expenses and marketing expenses.
a.Operations, Maintenance and Telecommunication Service Expenses
Operations, maintenance and telecommunication service expenses increased byRp3,147 billion, or 11.2%, from Rp28,116 billion in 2015 to Rp31,263 billion (US$2,321 million) in 2016.
The increase in operations, maintenance and telecommunication service expenses was primarily attributable to an:
·increase inoperations, maintenance and telecommunication service expenses by Rp1,918 billion, or 12.7%,from Rp15,129 billion in 2015 to17,047 billion in 2016 due to an increase in expenses associated with network maintenance to improve our mobile cellular and IndiHome service;
·increasein informatics technology services expenses byRp681billion, or 77.2%, from Rp882 billion in 2015 to Rp1,563 billion in 2016in line with an increase in information technology service revenues;
·increase in leased lines and CPE expenses of Rp665billion, or 34.8%, from Rp1,913 billion in 2015 to Rp2,578 billion in 2016 which was used for operation and maintenance of leased lines; and
·increaseincost ofSIM card and voucher sales by Rp180billion, or 40.5%, from Rp444 billion in 2015 to Rp624 billion in 2016.
This increase waspartiallyoffset by adecreasein tower leases of Rp324billion, or50.2%, from Rp646 billion in 2015 to Rp322 billion in 2016.
b.Depreciation and Amortization
Depreciation and amortizationdecreased by Rp16 billion, or 0.1%, from Rp18,572 billion in 2015 to Rp18,556 billion (US$1,377 million) in 2016.
c.Personnel Expenses
Personnel expenses increased by Rp1,727 billion, or 14.5%, from Rp11,885 billion in 2015 to Rp13,612 billion (US$1,010 million) in 2016. This increase was primarily due to an an:
·increase in domestic interconnection and transit revenues of Rp353employees’ salary expensesof Rp1,438 billion, or 13.5%25.3%, an from Rp5,684 billion in 2015 to Rp7,122 billion in 2016 primarily due to performance bonus paid during the year;
·increase in cellular interconnection revenues of Rp335net periodic pension costsof Rp625 billion, or 14.5%141.1%, and an increase of Rp217 billion, or 13.1% in international interconnection revenues, primarily resulting from our promotion rate offers for international calls and the increased number of incoming calls to mobile subscribers.
e.Network Revenues
Network revenues increased by Rp45 billion, or 3.7%, from Rp1,208Rp443 billion in 20122015 to Rp1,253Rp1,068 billion in 20132016 primarily due to an increase in our revenues from leased lines servicescontributions to our employees' pension schemes;
The above increases were partially offset by a decrease in vacation pay, incentives and other benefits expenses of Rp37Rp356 billion, or 4.5%7.8%, from Rp824Rp4,575 billion in 20122015 to Rp861Rp4,219 billion in 2013, primarily resulting from the increasing numberdue to a reclassification of subscribers forcertain benefits that we provide to our leased channel and satellite services by27,078 e1 or 7.0%.
employees as salaries.
Table of Content
f.d. Other Telecommunications ServicesInterconnection Expense
RevenuesInterconnection expensedecreased by Rp368 billion, or 10.3%, from other telecommunications servicesRp3,586 billion in 2015 to Rp3,218 billion (US$239 million) in 2016 in line with a decrease in interconnection revenues.
e.General and Administrative Expense
General and administrative expenses increased by Rp694Rp406 billion, or 9.7%, from Rp4,204 billion in 2015 to Rp4,610 billion (US$342 million) in 2016 primarily due to anincreasein general and administrative expensesof Rp594billion, or 57.6%, from Rp1,032billion in 2015 to Rp1,626 billion in 2016.
Thisincrease waspartiallyoffset by a:
·decrease in provision for impairment of receivablesof Rp267 billion, or 26.4%, from Rp2,629Rp1,010 billion in 20122015 to Rp3,323Rp743 billion in 2013.2016; and
·decrease in collection expensesofRp216 billion, or 58.7%, from Rp368 billion in 2015 to Rp152 billion in 2016.
f.Marketing Expense
Marketing expensesincreased by Rp857 billion, or 26.2%, from Rp3,275 billion in 2015 to Rp4,132 billion (US$307 million) in 2016. This increase was primarily due to increasedexpenses for the marketing of our products, primarily related to Telkomsel's 4G/LTE services and our IndiHome services.
g.Loss on Foreign Exchange - net
Losson foreign exchange – netincreased by Rp6 billion, or13.0%, from Rp46 billion in 2015 to Rp52 billion (US$4 million)in 2016.
h.Other Expenses
Other expenses increased by Rp552 billion, or28.8%, from Rp1,917 billion in 2015 to Rp2,469 billion (US$183 million) in 2016 primarily due to the accrual of expenses relating to value-added tax liabilities for 2016 which are currently under calculation by the Indonesian Tax Office.
Operating Profit and Operating Profit Margin
As a result of the foregoing, operating profitincreased by Rp6,803 billion, or 21.0%, from Rp32,369 billion in 2015 to Rp39,172billion (US$2,908 million) in 2016. Operating profit margin increased from 31.6% in 2015 to 33.7% in 2016.
Profit before Income Tax and Pre-Tax Profit Margin
As a result of the foregoing, profit before income tax increased by Rp6,873 billion, or 22.0%, from Rp31,293 billion in 2015 to Rp38,166 billion (US$2,833 million) in 2016. Pre-tax marginincreased from 30.5% in 2015 to 32.8% in 2016.
Net Income Tax Expense
Income tax expense increased by Rp994 billion, or 12.4%, from Rp8,023 billion in 2015 to Rp9,017 billion (US$669 million) in 2016, in line with the increase in profit before income tax. This was partially offset by deferred tax benefits of Rp1,721billion in 2016 compared to Rp342 billion in 2015, primarily due to deferred tax assets recognized in 2016. For more information regarding such deferred tax benefits, see "--- Principal Factors Affecting Our Financial Condition And Results of Operations --- Deferred tax benefits realized under Government tax incentive scheme
Table of Content
Other Comprehensive Income (Expenses) – Net
We recorded other comprehensive expenses of Rp2,099 billion (US$156 million) for 2016 compared to other comprehensive income of Rp493 billion for 2015 primarily due to actuarial losses recognized in 2016 relating to our Defined Benefit Pension Plan.
Net Comprehensive Income for the Year
Net comprehensive income for the year increased by Rp3,287billion, or 13.8%, from Rp23,763 billion in 2015 to Rp27,050 billion (US$2,008 million) in 2016.
Profit for the Year Attributable to Owners of the Parent Company
Profit for the year attributable to owners of the parent company increased by Rp3,882 billion, or 25.1%, from Rp15,451 billion in 2015 to Rp19,333 billion (US$1,435 million) in 2016.
Net Comprehensive Income for the Year Attributable to Owners of the Parent Company
Net comprehensive income for the year attributable to owners of the parent companyincreased by Rp1,309billion, or 8.2%, from Rp16,003 billion in 2015 to Rp17,312billion (US$1,285 million) in 2016.
Profit per Share
Profit per share increased by Rp39, or 24.5%, from Rp157.38 in 2015 to Rp195.99 in 2016.
Yearended December 31, 2015compared toyearended December31,2014
Revenues
Total revenues increased by Rp12,774 billion, or 14.2%, from Rp89,696 billion in 2014 to Rp102,470 billion in 2015. The increasewas primarily contributed by increases in data, internet and information technology service revenues,cellular telephone revenuesand others telecommunication services revenues.
a.Cellular Telephone Revenues
Cellular telephonerevenues increased by Rp2,995 billion, or 8.7%, from Rp34,290 billion in 2014 to Rp37,285 billion in 2015.
Usage charges increased by Rp3,130 billion, or9.3%, from Rp33,723 billion in 2014 to Rp36,853 billion in 2015 due to an increase of 8.6% in both our prepaid and postpaid subscribers .This increasewaspartially offset byadecrease in monthly subscription charges of Rp135billion, or 23.8%, from Rp567 billion in 2014 to Rp432 billion in 2015.
Our total cellular telephone revenues accounted for 36.3% of our consolidated revenues for the year ended December 31, 2015.
b.Fixed Line Telephone Revenues
Fixed lines revenues decreased by Rp602 billion, or 7.1%, from Rp8,435 billion in 2014 to Rp7,833 billion in 2015. The decrease in fixed lines revenueswasdue to a decrease in usage charges of Rp712 billion, or 13.3%,primarilydue to a decrease in local and domestic long distance usage. This decrease waspartiallyoffset by anincreaseinmonthly subscription charges of Rp124 billion, or 4.6%.
c.Data, Internet and Information Technology Services Revenues
Our data, internet and information technology service revenues accounted for 46.6% of our consolidated revenues for 2015, compared to 42.2% for 2014.
Table of Content
Data, internet and information technology service revenues increased by Rp10,012 billion, or 26.5%, from Rp37,808 billion in 2014 to Rp47,820 billion in 2015. This increasewasprimarilydue to an increase in revenues from data cellularinternetby Rp6,102 billion, or 45.0%, which was driven primarily by a growth in mobile broadband usage including from an increase of 40.3% in Flash subscribers from 31.2 million subscribers as of December 31, 2014 to 43.8 million subscribers as of December 31, 2015 which was primarily driven by an increase in the adoption of smartphones.
SMS revenues increased by Rp1,098 billion, or 7.8%, from Rp14,034 billion in 2014 to Rp15,132 billion in 2015driven primarily by the successful implementation of cluster-based pricing and Pay TV revenues increased by Rp485 billion, or505.2%.
d.Interconnection Revenues
Interconnection revenues comprised interconnection revenues from our fixed line network and interconnection revenues from Telkomsel’s mobile cellular network, includingincoming international long-distance revenues from our IDD service (TIC-007).
Interconnection revenues decreased by Rp418 billion, or 8.9%, from Rp4,708 billion in 2014 to Rp4,290 billion in 2015 primarily due to a decrease in domestic interconnection by Rp632 billion, or 21.7%. This decreasewas partially offset byanincreasein international interconnection revenues of Rp214 billion, or 11.9%.
e.Network Revenues
Network revenues decreased by Rp49 billion, or 3.8%, from Rp1,280 billion in 2014 to Rp1,231 billion in 2015 primarily due to a decrease in our satellite transponder lease revenue by Rp158 billion, or 23.6%, from Rp670 billion in 2014 to Rp512 billion in 2015, which was partially offset byanincrease in leased lines revenue of Rp109 billion, or 17.9%.
f.Other Revenues
In 2015, revenues from other services increased by Rp836 billion, or 26.3%, from Rp3,175 billion in 2014 to Rp4,011 billion in 2015. The increase was primarily due to an increase of Rp260ofRp934 billion, or 64.8%,160.5% in lease revenue, an increase in revenues from USO compensationsales of Rp271handset,Rp222 billion, or 114.3%, primarily due to an increase49.8% in USO projects to establish internet service centers in various provincial capital cities in 2013call centerservicerevenues and an increase of Rp151Rp160 billion, or 14.4%,262.3% in CPE and terminal revenue.
The increase wasrevenues. Itwas partly offset primarily bydecrease inother revenues by a decrease in revenues from pay TV of Rp131Rp580 billion, or 32.3% primarily due to the sale of our 80% ownership in Indonusa, which provides pay TV services in October 201350.6%.
g.Other Income
Other income increased by Rp22Rp424 billion,or 0.9%, from Rp2,559Rp1,076 billion in 20122014 to Rp2,581Rp1,500 billion in 2013 primarily due2015due to a Rp1,383 billionan increase in gain recognized on ourdisposal or sale of 80% of our ownership in PT Indonusa,property and was partially offset by the lack of insurance compensation income from Telkom-3 satellite in 2013, compared to insurance compensation revenue of Rp1,772 billion in 2012.
equipment.
2.ExpensesExpenses
Total expenses increased by Rp3,650 billion,Rp9,986billion, or 6.7%16.2%, from Rp54,200Rp61,617 billion in 20122014 to Rp57,850Rp71,603 billion in 2013.2015. The increase in expenses was attributable primarily to increases in operations, maintenance and telecommunication services, depreciationpersonnel expenses and amortization and general and administrativeother expenses.
a. Operations, Maintenance and Telecommunications ServicesTelecommunication Service Expenses
Operations, maintenance and telecommunications servicestelecommunication service expenses increased by Rp2,536Rp5,828 billion, or 15.1%26.1%, from Rp16,796Rp22,288 billion in 20122014 to Rp19,332Rp28,116 billion in 2013.
2015.
The increase in operations, maintenance and telecommunications servicestelecommunication service expenses was primarily attributable byto the following:
-· An increase in operations and maintenance of Rp1,655increased by Rp3,617 billion, or 18.4%31.4%, due to anincrease in expenses associated with network maintenance to improve our mobilecellularand IndiHomeservice;
· �� cost ofhandsetsales increased by Rp1,072 billion, or 254.6%, from Rp9,012Rp421 billion in 20122014 to Rp10,667Rp1,493 billion in 2013, primarily2015 due to anincreasein cost relating to handset sales;
Table of Content
·leased lines and CPE increased by Rp840 billion, or78.3%,whichwas used for operation and maintenance of leased lines;
·cost of ITservices increased by Rp525 billion, or147.1%;
·radiofrequency and usage charges increased by Rp419 billion, or 13.1%, due to an increase in expenses associated with increasing the capacityannual frequency usage fee of receiverTelkomsel; and transmission stations and Telkomsel’s broadband services.
-· Cost of IT servicesconcession fees and USO charges increased by Rp455Rp412 billion, or 205.0%22.7%.
The above increases were partially offset primarily by decreases intower leases by Rp419 billion, or39.3%, from Rp222Rp1,065 billion in 20122014 to Rp677Rp646 billion in 2013. This increase was primarily2015 due to our termination of ourfixed wireless services in 2015 andother expenses relating to an upgrade in Metra's IT system as well as software license and outsourcing services expenses.
-Electricity, gas and water expenses increased by Rp184Rp307 billion, or 20.9%or70.1%, from Rp879Rp438 billion in 20122014 to Rp1,063Rp131 billion in 2013, primarily due to an increase in electricity expenses resulting from the increasing number of our BTS, the expansion of the network for Telkomsel’s broadband services andincreased electricity tariffs.
The increases was partially offset by a decreased in insurance expenses by Rp297 billion, or 44.3%, from Rp671 billion in 2012 to Rp374 billion in 2013 primarily due to the lack of satellite insurance payment for Telkom-3in 2013, which we paid in 2012.
Our total operations, maintenance and telecommunications services expenses accounted for 33.4% of our consolidated expenses in 2013, compared to 31.0% in 2012
2015.
b. Depreciation and Amortization
Depreciation and amortizationexpenses increased by Rp1,331Rp1,394 billion, or 9.2%8.1%, from Rp14,474Rp17,178 billion in 20122014 to Rp15,805Rp18,572 billion in 2013,2015, primarily due to anincrease in property, plant and equipment to improve our service to customersand accelerateddepreciation expenses of Rp1,235billion, or8.9% from Rp13,898 billion in 2012 to Rp15,133 billion in 2013. The increase in depreciation expenses was primarily due to the increasing number of our BTS, which impacts our depreciation expenses and impairment offixed wireless assets. Fixed wireless assets in ourfixed wireless businessthe amount of Rp596 billion.
TableRp545 billion were fully depreciated in connection with the termination of Content
The impairment indicators on our fixed wireless CGU continued to exist in 2013 mainly due to increased competition in the fixed wireless market and that has resulted in lower average tariffs, declining active customers and declining ARPU and we conducted an impairment test to determine if further impairment was necessary. See Item 3 “Key Information – Risk Factors – Risks Related to Our Business – Risks Related to Our Fixed Telecommunication Business”. We assessed the recoverable value of the assets in the CGU and determined that assets for the fixed wireless CGU were impaired by Rp596 billion at December 31, 2013. The recoverable amount was determined based on value in use ("VIU") calculations. These calculations used pre-tax cash flow projections approved by management covering a five-year period and with cash flows beyond the five-year period extrapolated using a perpetuity growth method. The cash flow projections reflect management’s expectations of revenue, Earnings Before Interest, Tax, Depreciation and Amortization (“EBITDA”) growth and operating cash flows on the basis that the fixed wireless CGU generates positive net cash flows starting from 2014. Management’s cash flow projection also incorporates management’s reasonable expectations for developments in macro economic conditions and market expectations for the Indonesian telecommunications industry. As of December 31, 2013, management applied a pre-tax discount rate of 13.5% derived from the Company’s post-tax weighted average cost of capital and benchmarked to externally available data. As of December 31, 2013, the perpetuity growth rate used is 0% and assuming that subscriber numbers and ARPU may continue to decrease after five years.
A 1% increase in the discount rate used would result in an increase in impairment loss to become approximately Rp703 billion in 2013. However, the recoverable amount of the fixed wireless CGU is most sensitive to whether management will be able to implement its plans, including the cost efficiency plan, such that it generates positive cash flows and returns to profitability as projected. If the performance of the fixed wireless CGU continues to decline or if management’s initiatives are not performing as expected in the next financial year, analysis will be required to assess whether there will be further impairment in the future.
business.
c. Personnel Expenses
Personnel expenses decreasedincreased by Rp131Rp2,109 billion, or 1.3%21.6%, from Rp9,960Rp9,776 billion in 20122014 to Rp9,829Rp11,885 billion in 20132015 due to no early retirement programs being offeredanincreaseof Rp1,071 billion, or30.6%, in 2013 which led to a decreasevacation pay,incentives and other benefit expenses,in line with our performance and an increase in early retirement program expenses by Rp699Rp683 billion or 100.0% in 2013. This decrease was partially offset by an increase100% and in salaries and related benefits by Rp296Rp608 billion, or 9.1% from Rp3,257 billion in 2012 to Rp3,553 billion in 2013 due to an12.0%.This increase in basic salary and benefits, an increasewas partially offset by adecrease in pension benefit cost of Rp157costofRp200 billion, or 18.9%, and an increase in employee’ income tax by Rp138 billion, or 13.5% due to an increase in salary and related benefits.
31.1%.
d. Interconnection ExpensesExpense
Interconnection expenses increasedexpense decreased by Rp260Rp1,307 billion, or 5.6%26.7%, from Rp4,667Rp4,893 billion in 20122014 to Rp4,927Rp3,586 billion in 2013 primarily due to an increase of Rp256 billion, or 7.4%, in domestic interconnection and transit interconnection expenses, primarily driven by the increase of 13.5% in domestic interconnection and transit revenues.
e.Marketing Expenses
Marketing expenses decreased by Rp50 billion, or 1.6%, from Rp3,094 billion in 2012 to Rp3,044 billion in 20132015 primarily due to a decrease in advertising and promotion expensesdomestic interconnection expense by Rp93Rp1,288 billion, or 3.7%,35.4% and international interconnection expense by Rp19 billion, or 1.5% primarily due to the application discounts on our the selective use of media for promotion and increasing group synergy in 2013.interconnection tariffs.
f.e. General and Administrative ExpensesExpense
General and administrative expenses increasedexpensesincreased by Rp1,119Rp241 billion, or 36.9%6.1%, from Rp3,036Rp3,963 billion in 20122014 to Rp4,155Rp4,204 billion in 2013 due2015 primarilydue to an increase in provision for impairment of receivables by Rp674Rp226 billion, or 73.7%28.8%.
f.Marketing Expense
Marketing expenses increased by Rp183 billion, or 5.9%, from Rp915Rp3,092 billion in 20122014 to Rp1,589Rp3,275 billion in 2013. The increased was also due to a 59.1% increase in training, education and recruitment expenses, which increased by Rp153 billion primarily due to cost related to our global talent program to provide our employees with international experience as part of our international expansion and a28.1% increase in general expenses which increased by Rp148 billion primarily2015 due to an increase in directoradvertising and commissioner remuneration.
This increase was partially offsetpromotion expenses by a 34.1% decrease in social contribution expenses, which decreased by Rp44Rp142 billion, in 2013.
Tableor 5.9%, for the marketing of Content
our products, primarily related to Telkomsel's 4G/LTE services and our IndiHome services.
g. Loss on Foreign Exchange - net
Loss onLosson foreign exchange - net increased by Rp60Rp32 billion, or 31.7%, from Rp189Rp14 billion in 20122014 to Rp249Rp46 billion in 2013. The increase was primarily due to the appreciation of the US Dollar against the Rupiah by 26.3% during 2013.2015.
h. Other expensesExpenses
Other expenses decreasedincreased by Rp1,493Rp1,521 billion, or 75.7%384.1%, from Rp1,973Rp396 billion in 20122014 to Rp480Rp1,917 billion in 2013. The decrease primarily2015, due to an increase in commitment and penalty charge by Rp806 billion, mainly contributed by provisions for early termination of the operating leases agreements related to derecognition in 2012restructuring of the carrying value of the Telkom-3 Satellite, which was built and launched, but failed to reach usable orbit,our fixed wireless business which amounted to Rp1,606 billion.Rp666 billion, and others non-operating expense.
Table of Content
3.
Operating Profit and Operating Profit Margin
As a result of the foregoing, operating profit increased by Rp2,230Rp3,197 billion, or 8.7%11.0%, from Rp25,497Rp29,172 billion in 20122014 to Rp27,727Rp32,369 billion in 2013.2015. Operating profit margin increaseddecreased from 33.1%32.5% in 20122014 to 33.4%31.6% in 2013.2015.
4.Profit before Income Tax and Pre-Tax Profit Margin
As a result of the foregoing, profit before income tax increased by Rp3,003Rp2,714 billion, or 12.5%9.5%, from Rp24,027Rp28,579 billion in 20122014 to Rp27,030Rp31,293 billion in 2013.2015. Pre-tax margin slightly increaseddecreased from 31.2%31.9% in 20122014 to 32.6%30.5% in 2013.2015.
5.Net Income Tax Expense
Net incomeIncome tax expenseincreasedexpense increased by Rp1,014Rp682 billion, or 17.2%9.3%, from Rp5,886Rp7,341 billion in 20122014 to Rp6,900Rp8,023 billion in 2013, following2015, in line with the increase in profit before income tax.
6.Other Comprehensive Income(Expenses) -– Net
Other comprehensive income increaseddecreased by Rp7,655Rp317 billion, or 301.4%or39.1%, fromexpenses byRp2,540from Rp810 billion in 2012 toincome byRp5,1152014 to Rp493 billion in 20132015 primarily due to increasetoadecrease in defined benefit plan actuarial gainplanactuarial gains by Rp7,565,Rp417 billion, or53.1%, which was partially offset by an increase in foreign currency translation by Rp104 billion, or 294.8%, from losses in 2012 by Rp2,566 billion to gain by Rp4,999 billion in 2013.
433.3%.
7.NetComprehensive Income for the Year
Net comprehensive income for the year increased by Rp9,644Rp1,715 billion, or 61.8%or7.8%, from Rp15,601Rp22,048 billion in 20122014 to Rp25,245Rp23,763 billion in 2013.2015.
8.Profit for the Year Attributable to Owners of the Parent Company
Profit for the year attributable to owners of the parent company increased by Rp1,425Rp1,014 billion, or 11.3%7.0%, from Rp12,621Rp14,437 billion in 20122014 to Rp14,046Rp15,451 billion in 2013.2015.
9.Profit for the Year Attributable to Non-controlling Interest
Profit for the year attributable to non-controlling interest increased by Rp564 billion, or 10.2%, from Rp5,520 billion in 2012 to Rp6,084 billion in 2013.
10.Net Income per Share
Net income per share increased by Rp14.32, or 10.9%, from Rp131.45 in 2012 to Rp145.77 in 2013.
Year ended December 31, 2012 compared to year ended December 31, 2011
1.Revenues
Total revenues increased by Rp5,889 billion, or 8.3%, from Rp71,238 billion in 2011 to Rp77,127 billion in 2012. The increase in revenues in 2012 was primarily due to the increase in revenues from cellular telephone, data, internet and information technology services, interconnection and other telecommunications services, partly offset by decreases in revenues from fixed lines telephone and network.
a.Cellular Telephone Revenues
Cellular telephone revenues increased by Rp2,133 billion, or 7.5%, from Rp28,598 billion in 2011 to Rp30,731 billion in 2012 primarily due to increases in usage and monthly subscription charges, partially offset by a decrease in revenues from features.
Table of Content
Usage charges increased by Rp2,288 billion, or 8.4%, from Rp27,189 billion in 2011 to Rp29,477 billion in 2012 due to an increase in minutes of usage of 184.8 billion minutes, or 11.1% and a 16.9% increase in total subscribers. Monthly subscription charges increased by Rp127 billion, or 22.3%, from Rp569 billion in 2011 to Rp696 billion in 2012 due to increase in Flash and Blackberry subscribers of 93.1% with revenue growth of 21.5%. The increase was partly offset by a decrease in revenues from features, which decreased by Rp280 billion, or 33.4%, from Rp838 billion in 2011 to Rp558 billion in 2012 as a result of MoCI Regulation No. 01/PER/M.KOMINFO/01/2009 regarding the provision of premium messaging service and broadcasting short message to many receivers.
b.Fixed Lines Telephone Revenues
Fixed lines telephone revenues decreased by Rp957 billion, or 8.2%, from Rp11,619 billion in 2011 to Rp10,662 billion in 2012. The decrease in fixed lines telephone revenues was primarily due to a decrease in usage charges, of Rp890 billion, or 10.8%, from Rp8,213 billion in 2011 to Rp7,323 billion in 2012 which was primarily caused by a decrease in local and domestic long distance usage. Further, monthly subscription charges revenues also decreased by Rp199 billion, or 6.6% in 2012. The decrease in fixed lines telephone revenues was primarily due to shifting usage to cellular telephone services.
c.Data, Internet and Information Technology Services Revenues
Data, internet and information technology services revenues increased by Rp3,700 billion, or 15.5%, from Rp23,924 billion in 2011 to Rp27,624 billion in 2012. This increase was primarily due to an increase in revenues from internet, data communication and information technology services by Rp4,309 billion, or 40.9%, from Rp10,548 billion in 2011 to Rp14,857 billion in 2012, which was in turn largely driven by increases in cellular data communication revenues from increased mobile phone data usage and an increase in Flash mobile broadband subscribers of 99.5%, from 5.5 million subscribers in 2011 to 11.0 million subscribers in 2012. The increase in revenues from internet, data communication and information technology services was also due in part to an increase in Speedy subscribers of 30.9%, from 1.8 million subscribers in 2011 to 2.3 million subscribers in 2012, a 41.9% increase in data volumes through our VPN network, from 28,702 mbps in 2011 to 40,748 mbps in 2012, and a 70.8% increase in data volumes through our Metro Ethernet, from 140,733 mbps in 2011 to 240,315 mbps in 2012.
SMS volumes decreased by 47.8% from 226.4 billion messages in 2011 to 118.1 billion messages in 2012, while SMS revenues decreased by a smaller degree, by Rp462 billion, or 3.5%, from Rp13,093 billion in 2011 to Rp12,631 billion in 2012. The decrease in SMS volumes is in line with general increase in usage of internet-based messaging. Revenues declined by a smaller percentage primarily due to the implementation of cost-based interconnection for SMS on June 1, 2012. Prior to June 2012, SMS were sent and received among operators on a "Sender Keep All" basis. Effective June 1, 2012, in line with the cost-based interconnection regime for voice calls, the Government implemented cost-based interconnection for SMS. As Telkomsel historically had more incoming SMS than outgoing SMS, cost-based interconnection for SMS resulted in an overall benefit for Telkomsel’s SMS revenues.
d.Interconnection Revenues
Interconnection revenues comprised interconnection revenues from our fixed line network and interconnection revenues from Telkomsel’s mobile cellular network. Interconnection revenues included incoming international long-distance revenues from our IDD service (TIC-007).
Interconnection revenues increased by Rp764 billion, or 21.8%, from Rp3,509 billion in 2011 to Rp4,273 billion in 2012. This increase was triggered by an increase in domestic interconnection and transit revenues of Rp547 billion, or 26.4%, from Rp2,071 billion in 2011 to Rp2,618 billion in 2012 primarily due to an increase in cellular interconnection revenues of Rp538 billion, or 30.2%, and an increase of Rp217 billion, or 15.1% in international interconnection revenues, due to our promotion rate offers for international calls and the increased number of incoming calls to mobile subscribers.
Our total interconnection revenues accounted for 5.5% of our consolidated revenues for the year ended December 31, 2012, compared to 4.9% for the year ended December 31, 2011.
e.Network Revenues
Network revenues decreased by Rp93 billion, or 7.1%, from Rp1,301 billion in 2011 to Rp1,208 billion in 2012 mainly due to a decrease in our revenues from leased lines services by Rp87 billion, or 9.5%, from Rp911 billion in 2011 to Rp824 billion in 2012. This decrease was due to declining prices for leased lines.
Table of Content
f.Other Telecommunications Services
Revenues from other telecommunications services increased by Rp342 billion, or 15.0%, from Rp2,287 billion in 2011 to Rp2,629 billion in 2012. The increase was primarily due to an increase of Rp307 billion, or 41.5% in CPE and terminal revenue, an increase of Rp182 billion, or 83.1% in lease revenue, and an increase of Rp146 billion, or 56.4% in revenues from pay TV. The increase in pay TV revenues was primarily due to a 19% increase in the number of subscribers from 1.0 million subscribers in 2011 to 1.2 million subscribers in 2012.
This increase above was partially offset by a decrease in revenues from USO compensation due to a decrease in USO projects to establish internet service centers in various provincial capital cities in 2012 and a decrease in our directory assistance revenues.
g.Other Income
Other income increased by Rp1,893 billion, or 284.2%, from Rp666 billion in 2011 to Rp2,559 billion in 2012. The increase primarily related to insurance compensation received from the insurer amounted to Rp1,772 billion with regards to the insured Telkom-3 Satellite that was built and launched, but failed to reach its orbit on August 7, 2012. See Note 12 to our Consolidated Financial Statements.
2.Expenses
Total expenses increased by Rp4,320 billion, or 8.7%, from Rp49,880 billion in 2011 to Rp54,200 billion in 2012. The increase in expenses was attributable primarily due to increases in personnel expenses, interconnection expenses and operations, maintenance and telecommunication services expenses. These expenses are further explained below:
a.Operations, Maintenance and Telecommunications Services Expenses
Operations, maintenance and telecommunications services expenses increased by Rp343 billion, or 2.1%, from Rp16,453 billion in 2011 to Rp16,796 billion in 2012.
The increase in operations, maintenance and telecommunications services expenses was attributable by the following:
-Insurance expenses increased by Rp240 billion, or 55.7%, from Rp431 billion in 2011 to Rp671 billion in 2012 due to payment of Telkom-3 satellite insurance.
-Concession fees and USO charges increased by Rp210 billion, or 17.0%, from Rp1,235 billion in 2011 to Rp1,445 billion in 2012. This increase was primarily due to the increase in our total revenues, which we use to calculate the amount spent on USO projects, by Rp5,889 billion, or 8.3%.
-Radio frequency usage expenses increased by Rp156 billion, or 5.5%, from Rp2,846 billion in 2011 to Rp3,002 billion in 2012, due to an increase in bandwidth used for cellular.
The above increases were offset by the following:
-A decrease in the cost of handset phone, set up top box, SIM and RUIM cards of Rp280 billion, or 29.0%, from Rp967 billion in 2011 to Rp687 billion in 2012. This decrease was caused by the use of less expensive packaging for SIM and RUIM cards.
-A decrease in operations and maintenance of Rp172 billion, or 1.9%, from Rp9,184 billion in 2011 to Rp9,012 billion in 2012 due to a decrease in expenses associated with increasing the capacity of receiver and transmission stations and Telkomsel’s broadband services.
b.Depreciation and Amortization
Depreciation and amortizationdecreased by Rp349 billion, or 2.4%, from Rp14,823 billion in 2011 to Rp14,474 billion in 2012, primarily due to lower impairment charge on fixed wireless cash generating unit (“CGU”) by Rp316 billion, or 56.1%,from Rp563 billion in 2011 to Rp247 billion in 2012 and the net impact of the change in the estimated useful lives of towers and certain equipment by Rp101 billion, offset by increases in the depreciation of leased assets.
The impairment indicators on our fixed wireless CGU continued to exist in 2012 mainly due to increased competition in the fixed wireless market and that has resulted in lower average tariffs, declining active customers and declining ARPU and we conducted an impairment test to determine if further impairment was necessary. See Item 3 “Key Information – Risk Factors – Risks Related to Our Business – Risks Related to Our Fixed Telecommunication Business”. We assessed the recoverable value of the assets in the CGU and determined that assets for the fixed wireless CGU were impaired amounting to Rp247 billion at December 31, 2012. The recoverable amount was determined based on value-in-use ("VIU") calculations. These calculations used pre-tax cash flow projections approved by management covering a five-year period and with cash flows beyond the five-year period extrapolated using a perpetuity growth rate. The cash flow projections reflect management’s expectations of revenue, EBITDA growth and operating cash flows on the basis that the fixed wireless CGU generates positive net cash flows from 2013. Management’s cash flow projection also incorporates management’s reasonable expectations for developments in macro-economic conditions and market expectations for the Indonesian telecommunications industry. As of December 31, 2012, management applied a pre-tax discount rate of 12.3% derived from the Company’s post-tax weighted average cost of capital and benchmarked to externally available data. The perpetuity growth rate used of 0.5% assumes that subscriber numbers may continue to increase after five years, while ARPU may decline such that the long-term growth will not be significant.
A 1% increase in the discount rate used would result in an increase in impairment loss of approximately Rp458 billion. However, the recoverable amount of the fixed wireless CGU is sensitive to whether management will be able to implement its plans, including the cost efficiency plan, such that it generates positive cash flows and returns to profitability as projected. If the performance of the fixed wireless CGU continues to decline or if management’s initiatives are not performing as expected in the next financial year, analysis will be required to assess whether there will be further impairment next year.
In 2012, the useful life of Telkomsel’s towers was changed from 10 years to 20 years for purposes of calculating depreciation to reflect the current expected usage and the physical wear and tear of the towers. The impact is a reduction of depreciation expense by Rp635 billion recognized in the 2012 consolidated statement of comprehensive income. Moreover, Telkomsel decided to replace certain equipment with net carrying amount of Rp1,037 billion, as part of a modernization program. Accordingly, Telkomsel changed the estimated useful lives of such equipment resulting in additional depreciation expense of Rp534 billion that was charged to the 2012 consolidated statement of comprehensive income. The impact of the changes in the estimated useful lives of the towers and equipment to the profit before income tax is fully discussed in Note 12 to our Consolidated Financial Statements.
c.Personnel Expenses
Personnel expenses increased by Rp1,536 billion, or 18.2%, from Rp8,424 billion in 2011 to Rp9,960 billion in 2012 due to an increase in vacation pay, incentives and other benefits by Rp586 billion, or 20.8%, from Rp2,814 billion in 2011 to Rp3,400 billion in 2012, an increase by Rp393 billion, or 89.7%, in pension benefit cost from Rp438 billion in 2011 to Rp831 billion in 2012, and an increase in salaries and related benefits by Rp256 billion, or 8.5%, from Rp3,001 billion in 2011 to Rp3,257 billion in 2012.
d.Interconnection Expenses
Interconnection expenses increased by Rp1,112 billion, or 31.3%, from Rp3,555 billion in 2011 to Rp4,667 billion in 2012 primarily due to an increase of 43.5% in domestic interconnection and transit interconnection expenses and an increase of 5.4% in international interconnection fees.
Our total interconnection expenses accounted for 8.7% of our consolidated expenses for the year ended December 31, 2012, compared to 7.1% for the year ended December 31, 2011.
e.Marketing Expenses
Marketing expenses decreased by Rp184 billion, or 5.6%, from Rp3,278 billion in 2011 to Rp3,094 billion in 2012 primarily due to a decrease in advertising and promotion expenses by Rp249 billion, or 9.1%, due to marketing cost optimization.
f.General and Administrative Expenses
General and administrative expenses increased by Rp101 billion, or 3.4%, from Rp2,935 billion in 2011 to Rp3,036 billion in 2012 due in part to an increase in general expenses by Rp201 billion, or 61.7%, from Rp326 billion in 2011 to Rp527 billion in 2012. The increase in general expenses was primarily due to vehicle facility reimbursement expenses related to changes of our policy and directors’ severance pay due to the Board of Directors changes in 2012. Provision for impairment of receivables increased by Rp32 billion, or 3.6%, from Rp883 billion in 2011 to Rp915 billion in 2012. This increase primarily resulted from current year individual and collective assessment for impairment of receivables.
The increase in provision for impairment of receivables was partially offset by a decrease in social contribution expenses by Rp161 billion, or 55.5%, from Rp290 billion in 2011 to Rp129 billion in 2012. This decrease resulted from our shareholders’ decision to lower the amount of net profit spent on corporate social responsibility from 2.0% in 2011 to 1.0% in 2012.
Professional fees decreased by Rp48 billion, or 20.4%, while security and screening expense decreased by Rp35 billion, or 36.1%, from Rp97 billion in 2011 to Rp62 billion in 2012.
g. (Loss) gain on Foreign Exchange – net
Loss on foreign exchange - net decreased by Rp21 billion, or 10%, from Rp210 billion in 2011 to Rp189 billion in 2012. The decrease was primarily due to the depreciation of the Japanese Yen by 4.3% which was partially offset by the appreciation of the US Dollar by 6.3%.
h.Other expenses
Other expenses increased by Rp1,781 billion, or 927.6%, from Rp192 billion in 2011 to Rp1,973 billion in 2012. The increase primarily related to derecognition of the carrying value of the Telkom-3 Satellite, which was built and launched, but failed to reach usable orbit on August 7, 2012, amounting to Rp1,606 billion. See Note 12 to our Consolidated Financial Statements.
3.Operating Profit and Operating Profit Margin
As a result of the foregoing, operating profit increased by Rp3,463 billion, or 15.7%, from Rp22,034 billion in 2011 to Rp25,497 billion in 2012. Operating profit margin increased from 30.9% in 2011 to 33.1% in 2012.
4.Profit before Income Tax and Pre-Tax Margin
As a result of the foregoing, profit before income tax increased by Rp3,045 billion, or 14.5%, from Rp20,982 billion in 2011 to Rp24,027 billion in 2012. Pre-tax margin slightly increased from 29.5% in 2011 to 31.2% in 2012.
5.Net Income Tax Expense
Net income tax expense increased by Rp449 billion, or 8.3%, from Rp5,437 billion in 2011 to Rp5,886 billion in 2012, following the increase in profit before income tax by 14.5%.
6.Other Comprehensive Income(Expenses) - Net
Other comprehensiveexpenses increased by Rp612 billion, or 31.7%, from Rp1,928 billion in 2011 to Rp2,540 billion in 2012 due to the increase in defined benefit plan actuarial losses by Rp627 billion, or 32.3%, from Rp1,939 billion in 2011 to Rp2,566 billion in 2012.
7.NetComprehensive Income for the year
Net comprehensive income for the year increased by Rp1,984 billion, or 14.6%, from Rp13,617 billion in 2011 to Rp15,601 billion in 2012.
8.Profit for the Year Attributable to Owners of the Parent Company
ProfitNet comprehensive income for the year attributable to owners of the parent company increasedcompanyincreased by Rp1,578Rp712 billion, or 14.3%4.7%, from Rp11,043Rp15,291 billion in 20112014 to Rp12,621Rp16,003 billion in 2012.
2015.
9.Profit for the Year Attributable to Non-controlling Interest
Profit for the year attributable to non-controlling interest increased by Rp1,018 billion, or 22.6%, from Rp4,502 billion in 2011 to Rp5,520 billion in 2012.
10.Net Income per Share
Net incomeProfit per share increased by Rp18.8,Rp9.60, or 16.7%6.5%, from Rp112.7Rp147.78 in 20112014 to Rp131.5Rp157.38 in 2012.2015.
Segment Overview
We have four main operating segments, namely corporate, home, personal and others, described in more details as follows:
-· Ourcorporate segment provides telecommunications services including interconnection, leased lines, satellite, VSAT, contact center, broadband access, information technology services, data and internet services to companies and institutions.
-· Ourhome segment provides fixed wireline telecommunications services, pay TV, data and internet services to home consumers.customers.
-· Ourpersonal segment provides mobile cellular and fixed wireless telecommunications services including mobile access and information technology services, data and internet serviceswirelesstelecommunications to individual consumers.customers.
-· Ourothers segment provides building management services.
Segment performance is evaluated based on operating profit or loss and is measured on the basisTable of Indonesian Financial Accounting Standards which differ significantly from IFRS primarily in the accounting for land rights and employee benefits.Content
For more detailed information regarding our segment information, see Note 36Note32 to our Consolidated Financial Statements. Our segment results for the year 2012 and 2013 werefor2014,2015and2016were as follows:
Telkom's Results of Operation By Segment |
| |
| |
| |
| |
| |
| Years Ended December 31, | |
| 2014 | | 2015 | | 2016 | | 2016-2015 | |
(Rp billion) | | (Rp billion) | | (Rp billion) | | (US$ million) | | (%) | |
Corporate | | | | | | | | | | |
Revenues | | | | | | | | | | |
External Revenues | 18,763 | | 21,072 | | 24,177 | | 1,795 | | 14.7 | |
Inter-segment revenues | 10,652 | | 14,347 | | 32,675 | | 2,425 | | 127.7 | |
Total segment revenues | 29,415 | | 35,419 | | 56,852 | | 4,220 | | 60.5 | |
Total segment expenses | (22,575) | | (28,305) | | (48,345) | | (3,589) | | 70.8 | |
Segment Results | 6,840 | | 7,114 | | 8,507 | | 631 | | 19.6 | |
Depreciation and amortization | (2,699) | | (2,708) | | (4,148) | | (308) | | 53.2 | |
Provision for impairment of receivables | (184) | | (560) | | (87) | | (6) | | (84.5) | |
Home | | | | | | | | | | |
Revenues | | | | | | | | | | |
External Revenues | 6,682 | | 7,319 | | 7,803 | | 579 | | 6.6 | |
Inter-segment revenues | 2,667 | | 4,352 | | 5,077 | | 377 | | 16.7 | |
Total segment revenues | 9,349 | | 11,671 | | 12,880 | | 956 | | 10.4 | |
Total segment expenses | (8,894) | | (11,411) | | (12,576) | | (933) | | 10.2 | |
Segment Results | 455 | | 260 | | 304 | | 23 | | 16.9 | |
Depreciation and amortization | (1,495) | | (1,203) | | (1,711) | | (127) | | 42.2 | |
Provision for impairment of receivables | (467) | | (297) | | (424) | | (31) | | 42.8 | |
Personal | | | | | | | | | | |
Revenues | | | | | | | | | | |
External Revenues | 64,000 | | 73,766 | | 83,990 | | 6,234 | | 13.9 | |
Inter-segment revenues | 2,686 | | 2,365 | | 2,724 | | 202 | | 15.2 | |
Total segment revenues | 66,686 | | 76,131 | | 86,714 | | 6,436 | | 13.9 | |
Total segment expenses | (44,769) | | (51,303) | | (51,303) | | (3,808) | | 0.0 | |
Segment Results | 21,917 | | 24,828 | | 35,411 | | 2,628 | | 42.6 | |
Depreciation and amortization | (12,071) | | (14,531) | | (12,549) | | (931) | | (13.6) | |
Impairment of fixed assets | (805) | | - | | - | | - | | - | |
Provision for impairment of receivables | (133) | | (148) | | (222) | | (16) | | 50.0 | |
Other | | | | | | | | | | |
Revenues | | | | | | | | | | |
External Revenues | 251 | | 313 | | 363 | | 27 | | 16.0 | |
Inter-segment revenues | 1,632 | | 1,943 | | 2,395 | | 178 | | 23.3 | |
Total segment revenues | 1,883 | | 2,256 | | 2,758 | | 205 | | 22.3 | |
Total segment expenses | (1,718) | | (2,040) | | (2,549) | | (190) | | 25.0 | |
Segment Results | 165 | | 216 | | 209 | | 15 | | (3.2) | |
Depreciation and amortization | (61) | | (92) | | (124) | | (9) | | 34.8 | |
Provision for impairment of receivables | - | | (5) | | (10) | | (1) | | 100.0 | |
Telkom’s Results of Operations by Segment
| Years Ended December 31, | |
| 2011 |
| 2012 |
| 2013 | |
| (Rp billion) |
| (Rp billion) |
| (Rp billion) |
| US$ (million) | |
Corporate | | | | | | | | |
Revenues | | | | | | | | |
External revenues | 14,279 | | 15,579 | | 17,041 | | 1,400 | |
Inter-segment revenues | 5,289 | | 6,468 | | 8,549 | | 702 | |
Total segment revenues | 19,568 | | 22,047 | | 25,590 | | 2,103 | |
Totalsegmentexpenses | (15,659 | ) | (17,976 | ) | (20,375 | ) | (1,674 | ) |
Segmentresults | 3,909 | | 4,071 | | 5,215 | | 429 | |
Depreciation and amortization | (1,890 | ) | (2,079 | ) | (2,423 | ) | (199 | ) |
Provision for impairment of receivables | (255 | ) | (92 | ) | (994 | ) | (82 | ) |
Home | | | | | | | | |
Revenues | | | | | | | | |
External revenues | 8,171 | | 7,360 | | 6,669 | | 548 | |
Inter-segment revenues | 1,888 | | 2,223 | | 2,794 | | 230 | |
Total segment revenues | 10,059 | | 9,583 | | 9,463 | | 778 | |
Totalsegmentexpenses | (8,322 | ) | (7,939 | ) | (8,885 | ) | (730 | ) |
Segmentresults | 1,737 | | 1,644 | | 578 | | 47 | |
Depreciation and amortization | (1,389 | ) | (1,168 | ) | (1,487 | ) | (122 | ) |
Provision for impairment of receivables | (454 | ) | (505 | ) | (390 | ) | (32 | ) |
Personal | | | | | | | | |
Revenues | | | | | | | | |
External revenues | 48,733 | | 54,087 | | 59,028 | | 4,850 | |
Inter-segment revenues | 2,180 | | 2,188 | | 2,358 | | 194 | |
Total segment revenues | 50,913 | | 56,275 | | 61,386 | | 5,044 | |
Totalsegmentexpenses | (34,679 | ) | (36,372 | ) | (39,463 | ) | (3,243 | ) |
Segmentresults | 16,234 | | 19,903 | | 21,923 | | 1,801 | |
Depreciation and amortization | (11,007 | ) | (10,940 | ) | (11,234 | ) | (923 | ) |
Provision for impairment of receivables | (174 | ) | (318 | ) | (202 | ) | (17 | ) |
Others | | | | | | | | |
Revenues | | | | | | | | |
External revenues | 70 | | 117 | | 229 | | 19 | |
Inter-segment revenues | 350 | | 648 | | 909 | | 75 | |
Total segment revenues | 420 | | 765 | | 1,138 | | 94 | |
Totalsegmentexpenses | (342 | ) | (685 | ) | (1,008 | ) | (83 | ) |
Segmentresults | 78 | | 80 | | 130 | | 11 | |
Depreciation and amortization | (14 | ) | (22 | ) | (40 | ) | (3 | ) |
Provision for impairment of receivables | - | | - | | (3 | ) | 0 | |
YearYear ended December 31,2013 2016 compared to year ended December 31,2012. 2015
Corporate Segment
Our corporate segment revenuesincreased by Rp3,543.0 revenuesincreasedby Rp21,433billion, or16.1% 60.5%, from Rp22,047.0 Rp35,419billion in 2015 to Rp56,8522012 billionto Rp25,590.0 billion in2013.The 2016. The increase was mainlyprimarily due to an increase of Rp1,395.1 in:
·other revenues by Rp16,397billion, or27.0%or186.7%, due to an increasee-payment revenues by Rp8,572 billion,or 2,817.2%,managed services revenues by Rp5,556billion, or616.7%,manage device others revenues by Rp656 billion,or 100%, health facilities and services revenues by Rp222 billion,or 2,579.5%, technical assistance service revenues by Rp201 billion,or 218.1%,CPE revenuesby Rp581billion, or665.0%,call centerservicesby Rp402 billion, or19.6%,e-healthrevenuesby Rp23billion, or 13.0%, power supply lease revenuesby Rp191 billion, or74.6%. This increase waspartiallyoffset due to a decrease in directory assistance revenues from by Rp9 billion,or 2.3%;
·data and internet revenues reflectingby Rp3,630 billion, or37.0%, due toanincrease in data communicationothers revenuesby Rp991billion, or72.8%,data communication IT service revenues by Rp1,339 billion,or 71.1%, data communication VPN and ethernet revenues by Rp272 billion,or 9.0%,e-businessrevenuesby Rp346 billion, or85.4%,Astinet revenuesby Rp339 billion, or 44.4%,anddata accessinternetrevenuesby Rp304billion,or 13.3%;and
·network revenues by Rp1,499 billion, or17.6%, as a result of increases in leased line revenues by Rp1,203 billion, or20.9% and transponder revenuesby Rp295 billion, or10.7%.
The revenues increase waspartiallyoffset bya decrease in interconnection revenuesby Rp155billion, or2.5%, due to a decrease in internasionalinterconnection revenuesby Rp536 billion, or11.6%, andincreaseofdomesticinterconnection revenuesby Rp381billion,or22.0%.
Our corporate segment expenses increased by Rp20,040billion, or70.8%, from Rp28,305billion in 2015 to Rp48,345billion in 2016, primarily due toan increase in:
·operation, maintenance and telecommunication services expenses by Rp17,168 billion, or121.1% as a result of increases in cooperation expensesbyRp9,480billion,or262.1%, operation and maintenance (O&M) expenses by Rp6,651billion, or126.6%,cost of IT servicesexpensesby Rp960 billion, or108.8% andelectricity cost by Rp54 billion,or 9.3%;
·personnel expensesby Rp1,420 billion, or34.6%, due to an increase in value added services revenue as well as personnel expensesby Rp500 billion, or70.7%, net periodic pension cost by Rp399 billion, or361.7%, benefit expensesby Rp395 billion,or 37.3%,and bonuses expenses increased by Rp121 billion, or16.4%;and
·depreciation expenses by Rp1,440 billion,or 53.2%,due to depreciation of transmission, satellite and other equipment.
Home Segment
Our home segment revenues increasedby Rp1,209billion, or 10.4%, from Rp11,671billion in 2015 to Rp12,880billion in 2016 mainly due toanincrease in:
·other revenues by Rp926 billion, or51.5%, primarily due toanincrease in Metro Ethernet E-LINE monthly revenue due to the migration from low cap connectivity to high cap connectivity. Revenues fromCPE revenues by Rp930 billion,or 53.5%,andpartiallyoffset by decrease in other telecommunications services increasedtelecommunication service revenues by Rp1,192.4Rp4 billion,or 35.7%78.0%;and
·data and internet revenues by Rp163billion, or2.9%, as a result of an increase in tower leasePay TV revenues by Rp591 billion, or141.8%, in line with the growth in tenancy ratio, and an increase in support CPE revenues. Network revenues increased by Rp516.9 billion, or 16.1%, primarily reflecting anthe IndiHome subscribers of8.3% from3.6millionas of December 31,2015 to3.9millionas of December 31,2016. This increase in C-band satellite transponder monthly subscription revenue due to higher market demand, and an increase in International Ethernet Private Line (IEPL) revenue. Interconnection revenues increased by Rp347.4 billion, or 6.2%, mainly as a result of an increase in IP transit monthly subscription revenue due to higher demand for internet connectivity from ISPs and corporate customers, and an increase in revenues from wholesale voice. A decline of Rp243.4 billion, or 29.3%, was recorded in IDD 007 retail OLO origin interconnection revenue due to the discontinuance of a promotion which we operated in 2012 which had driven interconnection revenues but which did not provide satisfactory margins and thus was discontinued in 2013.
Our corporate segment expensesincreased by Rp2,399.0 billion, or13.3%, from Rp17,976.0 billion in2012 to Rp20,375.0 billion in2013, primarily due to an increase of Rp1,985.3 billion, or 26.9%, in operation and maintenance expenses as a result of higher tower rent expenses as well as an increase in hardware system integration expense in line with the growth of solution services provided to our corporate customers. Generaland administration expenses increased byRp1,087.1 billion, or 99.0% reflecting increases in provision expenses for telecommunication services receivables,director and commisionerremuneration, and in employee training expensesrelating toourglobaltalentprogram. Marketing expenses increased by Rp252.7 billion, or 52.6%, reflecting increases in customer education expense and in marketing expenses primarily relating to promoting and educating customers about our new products. A decline of Rp897.6 billion, or 69.2%, was recorded in other expenses due to a decline in other operating expenses primarily relating to loss of Telkom-3 satellite which was built and launched but failed to reach useable orbit in 2012, which was not repeated in 2013, while the decline of Rp6.4 billion, or 0.2%, in personnel expenses reflected a decline in employee severance payments,partially offset by andecrease in data communication othersrevenuesby Rp451billion, or38.2%.
The increase in post-retirement healthcare benefit expenses.
Home Segment
Our home segment revenues decreased by Rp120.0 billion, or 1.3%, from Rp9,583.0 billion in 2012 to Rp9,463.0 billion in 2013, mainly due to a decline of Rp710.9 billion or 13.2%, in fixed wireline revenue, reflecting a decline in local usage revenue and in monthly subscription revenue in line with the shift in customer communication behavior trends. These werewas partially offset by an increasea decrease in other telecommunication services of Rp225.9fixed wireline revenues by Rp74 billion,or 24.6%, due to increases in CPE lease revenue. Data andinternet revenues increased by Rp159.3 billion, or 4.7%, due to an increase in monthly subscription revenue for Speedy in line with the 28.7% growth in Speedy customer base to 3.0 million subscribers.
Our home segment expenses increased by Rp946.0 billion, or 11.9%, from Rp7,939.0 billion in 2012 to Rp8,885.0 billion in 2013, primarily due to an increase of Rp1,496.7 billion, or 136.8%, in operation and maintenance expenses. A decline of Rp568.5 billion, or 86.0%, was recorded in other expenses, due toa decline in other operating expenses primarily relating to supervising construction.
Personal Segment
Our personal segment revenues increased by Rp5,111.0 billion, or 9.1%, from Rp56,275.0 billion in 2012 to Rp61,386.0 billion in 2013,mainly due to an increase of Rp1,316.8 billion, or 4.3%, in cellular revenues, reflecting an increase in long distance cellular revenue as well as in cellular monthly subscription revenue due to a 5.1% growth in our cellular subscriber base to 131.5 million subscribers. Data and internet revenue increased byRp3,275.1 billion, or 16.3%, due toan increase in cellular data communication revenue in line with the 10.8% growth inourdata services users to 60.5 million users, andan 86.1% growth in data traffic. Cellular SMS revenue also increased due tothe promotion of oursimPATI and kartu As products. Other telecommunication services revenue increased by Rp270.9 billion, or 114.3%. Network revenues increased by Rp173.5 billion, or 64.8%. Revenue from fixed wireless decreased by Rp174.0 billion, or 14.3%, reflectinga decline of Rp129.1 billion, or22.2%, in local prepaid usage in line with ourmigrationstrategy for our fixed wireless business.1.7%;
Our home segment expenses increased by Rp1,165billion, or10.2%, from Rp11,411billion in 2015 to Rp12,576billion in 2016. This increase was primarily due to an increase in:
·operation, maintenance and telecommunication services expenses by Rp1,187 billion, or27.1%, due to an increase in cooperation expenses by Rp566 billion, or79.7%, leased lines and CPE expenses by Rp376 billion, or71.2%,operation and maintenance expenses by Rp102 billion,or 39.1%,andcall center expensesby Rp134billion, or157.9%;and
·marketing expensesby Rp145billion, or25.4%,due toanincrease in advertising and promotion by Rp114 billion,or 32.5%.
The increase was partially offset by a decrease inpersonnel expensesby Rp186 billion, or4.9%, due to a decrease in early retirement program expensesbyRp154 billion, or46.9%,and post retirement health care by Rp49 billion,or 39.7%.
Personal Segment
Our personal segment expensesrevenues increased by Rp3,091.0Rp10,583 billion, or 8.5%13.9%, from Rp36,372.0Rp76,131 billion in 20122015 to Rp39,463.0Rp86,714 billion in 2013,2016, mainly due to an increase of Rp1,475.5in:
·data and internet revenues by Rp9,416 billion, or 14.6%or27.1%, due toanincrease in cellular data communication revenues by Rp8,548billion, or43.8%, in depreciation expense, which reflected anline with the increase in provision for asset impairment lossprimarily relating to our fixed wireless businessTelkomsel Flash subscribers37.1% from 43.8 millionas of December 31,2015 to60.0millionas of December 31,2016. SMS revenues increased by Rp868billion, or5.8% as a result of lower tariffs cluster based pricing implementation;and declining customers
·cellular revenues by Rp1,263 billion, or3.4%, due toanincrease in thecellularmonthly subscriptionby Rp1,369 billion, or13.9%, in line with increased cellular subscribers by13.9% to173.9million of December 31, 2016. The increase partialy offset by decrease international usage by Rp120 billion, or20.9%.
The increase waspartiallyoffset by a decrease in fixed wireless marketrevenuesby Rp101 billion, or109.0%, because of the termination of our fixed wireless business.
Our personal segment expenses constant atRp51,303billion in2016. The expensesprimarily due to the increase in:
·operation, maintenance andtelecommunication services expenses by Rp1,255 billion, or5.0%, due to the increase inradio frequency usage charges by Rp1,129 billion, or28.3%, andleased lineand CPEexpensesby Rp85billion, or5.0%;
·marketing expenses by Rp728 billion, or26.4%, mainly due to an increase in advertising and promotion by Rp609 billion, or27.0% and customer educationand press releaseby Rp119billion, or24.1%;and
·personnel expenses by Rp505billion, or13.2%, primarily due to an increase inpersonnel expenses andemployee benefit by Rp285billion, or 19.4.%, net periodic pension Rp132 billion, or262.7%,andbonuses expenses by Rp60 billion, or5.6%.
The increase waspartiallyoffset by a decrease in:
·depreciation and amortization expenses by Rp1,982 billion, or13.6%,primarily due to depreciation of leased assets. Operationtransmission and maintenanceswitching equipment;
·general and administration expenses increased byRp1,930.3by Rp174 billion, or 13.2%or121.9%, as due toa resultdecrease in collectionfeeexpensesby Rp277 billion, or63.7%, partially offset byprovision for impairment of the receivables by Rp73 billion, or49.0%,andincrease in operationand maintenancesocial contribution by Rp27 billion, or55.2%;and
·other expenses for support facilities, operation and maintenance expenses for antenna and towers by Rp244 billion, or121.9%,due to accelerated BTS construction by Telkomsel, and in operation and maintenance expenses for building installations.toa decreaseinnon-operating expenses.
Table of Content
Other Segment
Our other segment revenues increased by Rp373.0Rp502 billion, or 48.8%or22.3%, from Rp765.0Rp2,256 billion in 2012in2015 to Rp1,138.0Rp2,758 billion in 2013,reflecting an increase of Rp372.0 billion, or 48.6%, in Telkom Property's other telecommunication revenues, mainly as a result of an increase of Rp105.0 billion, or 31.0%, in building maintenance services revenue as well as an increase in security services revenue due to tariff adjustments. Revenue from project management increased by Rp57.5 billion, or 51.3%, reflecting enhanced synergies within the Telkom Groupas we implemented a strategy for all our subsidiaries to use Telkom Property for building management in 2013. Revenue from management transport services a new line of business recorded an increase of Rp56.9 billion, or 100%, from 2012, while revenue from building lease increased by Rp46.2 billion, or 65.0%,in2016mainly due to an increase in rental rates.
otherrevenues by Rp502 billion, or22.3%. This increasewas primarilycontributed by lease building and hotel revenues of Rp140 billion, or10.7% and project management service, property development and retailrevenues increased of Rp362 billion, or38.2%.
Our other segment expenses increased by Rp323.0Rp509 billion, or 47.2%25.0%, from Rp685.0Rp2,040 billion in 20122015 to Rp1,008.0Rp2,549 billion in 2013,2016 mainly reflectingdue to an increase of Rp260.4 billion, or 46.0%, in operation and maintenance expenses, due to increases in project management expenses, electricity bills, and in third-party cooperation expenses.Personnel expenses increased by Rp28.9 billion, or 44.0%, mainly due toan increaseinoutsourcing expenses.
Year ended December 31,2012 compared to year ended December 31,2011
Corporate Segment
in:
Our corporate segment revenues·increasedoperation, maintenance and telecommunication service expensesby Rp2,479Rp402 billion, or12.7%or23.3%, from Rp19,568billion in2011to Rp22,047billion in2012. The increase in corporate segment revenues was primarily due to an increase in interconnection revenue of Rp1,632project management expenses by Rp311 billion, or268.2%, and inoperationandmaintenance otherby Rp57billion, or 40.8%or61.1%;
·depreciation expenses by Rp32 billion, or34.8%, primarily resulting frommainly due to an increase in IP transitdepreciation ofproperty;
·general and outgoing IDD revenues. Data and internet revenues increase of Rp705administration expensesby Rp14 billion, or 15.8%or22.7%, primarily due to an increase in provision for impairment of receivables by Rp6 billion, or114.3% andremunerationexpenses by Rp4 billion, or12.8%;and
·personnel expenses by Rp19 billion, or 13.6%, due to an increase inpersonnelexpenses, position,andmedical benefit.
Year ended December 31, 2015 compared to year ended December 31, 2014
Corporate Segment
Our corporate segment revenues increased by Rp6,004 billion, or 20.4%, from Rp29,415 billion in 2014 to Rp35,419 billion in 2015. The increase was primarily due to an increase in:
·network revenues by Rp4,284 billion, or 101.2%, as a result of increases in leased line revenues by Rp4,144 billion, or 309.9% and transponder revenuesby Rp252 billion, or 10.1%. The increasewas partially offset by a decrease in international leased line by Rp119 billion, or 85.1%;
·data and internet revenues by Rp939 billion, or 10.5%, due toanincrease in data communication others revenues by Rp1,037 billion, or 318.4% which was partially offset by a decrease in high speed internet revenues by Rp86 billion, or 8.6%;
·interconnection revenues by Rp565 billion, or 11.1%, due to an increase in international IDD OLO revenues by Rp360 billion, or 35.5% and an increase in international IDD incoming revenues by Rp354 billion, or 16.0%. The increase waspartiallyoffset by decreases of long distance cellular revenues by Rp89 billion, or 2.2%, and other localby Rp68 billion, or 29.9%;and
·other revenues by Rp418 billion, or 5.7%, due to an increase in call center services revenues by Rp591 billion, or 40.4%andpartially offset by a decrease in revenues from Metro EthernetCPE and data, internetterminal by Rp225 billion, or 24.3%.
The increase was partially offset bya decrease in fixed wirelinerevenuesby Rp212 billion, or 5.6%, due to a decrease in local usage revenues by Rp117 billion, or 24.5%, long distance usage revenues by Rp53 billion, or 12.3%, and telecommunication service in line with an increase of 70.8% in Metro Ethernet data volume from 140,733 Mbps in 2011 to 240,315 Mbps in 2012.
IDD 007 usage revenues by Rp22 billion, or 16.9%.
Our corporate segment expensesincreased by Rp2,317 Rp5,730billion, or14.8% 25.4%, from Rp15,659Rp22,575billion in2011 2014 to Rp17,976Rp28,305 billion in2012, 2015, primarily due to an increase in:
·operation, maintenance and telecommunication services expenses by Rp3,467 billion, or 32.2% as a result of increases in operation and maintenance (O&M) expenses by Rp1,763Rp1,210 billion, or 31.4%57.9%, primarily resulting fromincluding increased cooperation expenseexpenses by Rp771 billion, or 27.2%, leased lines and operatingCPE expenses by Rp716 billion, or 61.7%, cost of IT services by Rp525 billion, or 146.8%, O&M supporting facilities expensesby Rp130 billion, or 36.0%, transportation expensesby Rp65 billion, or 7.3%, and maintenance expense for antennaO&M land and towers. Personnel expense alsobuilding expensesby Rp46 billion, or 14.4%;
Table of Content
·interconnection expenses by Rp779 billion, or 19.4%, as a result of an increase in international IDD007 interconnection expenses by Rp530 billion, or 28.1% and Telkom Global international interconnection expenses by Rp258 billion, or 95.8%;
·personnel expensesby Rp534 billion, or 14.9%, due to an increase in early retirement program expenses by Rp246 billion, or 100.0%, bonuses expenses increased by Rp459Rp179 billion, or 15.1%, from 2011.31.7% and personnel expensesincreased by Rp101 billion, or 16.7%;
·others expensesincreasedby Rp886 billion, or 293.5%, due to increases inpenalty and commitment charge by Rp460 billion, or 100.0%, income tax expenses by Rp117 billion, or 25,415.4%, others non-operating expenses by Rp265 billion, or 127.3%, and tax expensesby Rp33 billion, or 82.9%;and
·marketing expensesby Rp49 billion, or 6.7%, due to an increase in advertising and promotion expenses by Rp43 billion, or 10.2%.
Home Segment
Our home segment revenues decreasedincreased by Rp476Rp2,322 billion, or 4.7%24.8%, from Rp10,059Rp9,349 billion in 20112014 to Rp9,583Rp11,671 billion in 2012,2015 mainly due toanincrease in:
·data and internet revenues by Rp1,361 billion, or 32.3%, as a result of an increase in data communication others by Rp722 billion, or 26.3%, increase in Pay TV revenues by Rp341 billion, or 451.7%, in line with the increase in the IndiHome subscribers more than 1 million subscribers, while high speed internet revenues increased by Rp150 billion, or 4.0% and high speed internet monthly subscription increased by Rp52 billion, or 408.7%;and
·other revenues by Rp1,118 billion, or 164.6%, primarily due toanincrease in sales of handset.
The increase waspartiallyoffset by a decrease in other revenuesby Rp49 billion, or 21.9%, and fixed wireline revenuesby Rp25 billion, or 0.6%.
Our home segmentexpenses increased by Rp2,517 billion, or 28.3%, from Rp8,894 billion in 2014 to Rp11,411 billion in 2015. This increase wasprimarily due to an increase in:
·operation, maintenance and telecommunication services expenses by Rp1,932 billion, or 79.2%, due to an increase in terminal/handset expenses by Rp1,071 billion, or 258.4%, increase in cooperation expenses by Rp552 billion, or 349.6%, increase in leased lines and CPE expenses by Rp403 billion, or 322.2%, which were partially offset by a decrease in insurance expensesby Rp40 billion, or 33.4%,and vehicle rent by Rp30 billion, or 30.7%;
·personnel expenses by Rp508 billion, or 15.4%, due to an increase inearly retirement program expenses by Rp328 billion, or 100.0%, bonuses expenses increased by Rp231 billion, or 35.1%, net periodic post-retirement healthcare benefits increased by Rp81 billion, or 192.1% and partially offset by a decrease in net periodic pension costs by Rp156 billion, or 51.2%;
·other expensesby Rp606 billion, or 1,444.9%, due to an increase in penalty and commitment charge by Rp364 billion, or 100.0% and others non-operating expensesby Rp243 billion, or 1,151.1%.
The increase was partially offset by a decrease in:
·general administrative expensesby Rp291 billion, or 19.7%,due to a decrease in fixed wireline telephone revenuesprovision for impairment of Rp616receivables by Rp160 billion, or 10.2%35.1%, which resulted from both decreased fixed wireline ARPU and usage due to shifting usage to cellulartraining, education and fixed wireless telephone services.
Our home segment expenses decreasedrecruitment by Rp383Rp119 billion, or 4.6%, from Rp8,322 billion in 2011 to Rp7,939 billion in 2012, primarily due to decrease in operation46.4%;and
·depreciation and maintenance expense amortization expensesby Rp1,352Rp291 billion, or 55.3%, which was partially offset by increase in depreciation expense by Rp561 billion, or 46.3%, and personnel expenses by Rp382 billion, or 11.7%19.4%.
Table of Content
Personal Segment
Our personal segment revenues increased by Rp5,362Rp9,445 billion, or 10.5%14.2%, from Rp50,913Rp66,686 billion in 20112014 to Rp56,275Rp76,131 billion in 2012, primarily2015, mainly due to an increase in cellularin:
·data and internet revenues of Rp4,957by Rp7,083 billion, or 15.0%25.7%, and due toan increase in interconnection revenue by Rp444 billion, or 14.1%, compared to 2011. The increase in cellular data communication revenues was primarilyby Rp6,015 billion, or 44.5%, in line with the increase in Telkomsel Flash subscribers 40.3% from 31.2 millionas of December 31,2014 to 43.8 millionas of December 31,2015, payload data increased by 109.6% to 492,245 TB in 2015. Cellular SMS revenues increased by Rp1,195 billion, or 8.6% as a result of cluster based pricing implementation. The increase is partially offset byadecrease in SMS fixed wireless by Rp100 billion, or 97.0%;and
·cellular revenues by Rp3,088 billion, or 9.1%, due toanincrease in data and internet revenuecellular commitment revenues by Rp2,553Rp2,083 billion, or 28.3%, in 2012 as comparedline with increased cellular subscribers by 8.6% to 2011,152.6 million in 2015, cellular long-distance usage by Rp658 billion, or 49.1%7.0%, and ancellular feature revenues by Rp286 billion, or 37.5%.
The increase waspartiallyoffset by a decrease in:
·fixed wireless revenuesby Rp437 billion, or 82.5%, because of the termination of our fixed wireless business, decrease in local used by Rp119 billion, or 71.9%, long distance cellular revenueusage by Rp1,397Rp266 billion, in 2012 as compared to 2011, or 20.6%. The increase in interconnection revenue was primarily89.4% and monthly subscription by Rp49 billion, or 78.1%;and
·other revenues by Rp110 billion, or 50.0%, due to an increaseadecrease in local cellular revenue.
Our personal segment expenses increased by Rp1,693Rp6,534 billion, or14.6%, fromRp44,769 billion in 2014 toRp51,303billion in 2015, primarily due to an increase in:
·operation, maintenance andtelecommunication services expenses by Rp4,540 billion, or 4.9%21.9%, from Rp34,679due to the increase in manage capacity service by Rp1,686 billion, or 100.0%, increase in 2011O&M power supply expensesby Rp906 billion, or 43.8% in line with the growth in the BTSs of Telkomsel by 20.9% to Rp36,372103,289 units in 2015, and O&M transport expenses increased by Rp749 billion, or 16.2%, O&M radio base station increased by Rp1,024 billion, or 24% and rental expensesincreased by Rp210 billion, or 23.2%;
·depreciation and amortization expenses by Rp2,460 billion, or 12.8%, mainly due to an increase in 2012,depreciation of transmission installation and equipment by Rp1,771 billion, or 21.8%, increase in amortization by Rp226 billion, or 67.3%, and increases in depreciation of leased assets by Rp216 billion, or 34.1%, increase in depreciation of building by Rp20 billion, or 76.6%, increase in depreciation of cable network by Rp55 billion, or 103.9%, increase in depreciation switching by Rp13 billion, or 1.1%, increase in depreciation of leasehold by Rp17 billion, or 34.5%, and increase in depreciation of vehicles by Rp3 billion, or 11.4%;and
·personnel expenses by Rp1,091 billion, or 39.9%, primarily due to an increase in bonuses expenses by Rp497 billion, or 87.2%, increase in employees income tax expenses by Rp200 billion, or 44.6%, increase in early retirement program expenses by Rp216 billion, or 100%, and increase in long service award increased by Rp190 billion, or 165.5%.
The increase waspartiallyoffset by a decrease in:
·interconnection expenses of Rp196by Rp1,481 billion, or 4.2% and an increase in operation and maintenance expenses of Rp1,025 billion, or 7.6%. The increase in operation and maintenance expense was primarily due to an increase in transport expense and an increase in radio frequency expenses. On the other hand, depreciation expenses decreased by Rp1,066 billion, or 9.9%31.3%, due to the changesa decrease in the estimated useful livesBlackberry cooperation expenses by Rp1,078 billion, or 69%, in line with decreased of towersBlackberry subscribers by 31.7% to 4.0 million subscribers as of December 31, 2015 and certain equipment.a decrease in cellular to IDD interconnection expensesby Rp331 billion, or 54.1%;
·general administration expensesby Rp66 billion, or 4.1%, due toadecrease in collection expensesby Rp270 billion, or 38.3%, partially offset by increased professional fees by Rp118 billion, or 98.7%, training, education and recruitment by Rp28 billion, or 40.6%, social contribution by Rp22 billion, or 83.6% and provision for impairment of receivables by Rp15 billion, or 11.5%;and
·foreign exchange loss by Rp55 billion, or 53.5%.
Table of Content
Other Segment
Our other segment revenues increased by Rp345Rp373 billion, or 82.1%19.8%, from Rp420Rp1,883 billion in 20112014 to Rp765Rp2,256 billion in 2012,2015, mainly due to thean increase in:
·leased revenues by Rp225 billion, or 20.8%, due to an increase in Telkom Property’s other telecommunication services of Rp273building maintenance revenues by Rp193 billion, or 368%, resulting from the20.5% and an increase in management project of Rp57building leased revenues by Rp28 billion, or 102.8%22.6%;and
·otherrevenues by Rp148 billion, or 18.4%, due toretailrevenues increased by Rp72 billion, or 329.1%, transport management service revenues increased by Rp50 billion, or 40.1%, and security services of Rp206service revenues increased by Rp44 billion, or 100%13.6%. In addition, leaseThe increase was partially offset by a decrease in project management revenues also increase by Rp71Rp30 billion, or 20.5%, due to the increase in building lease of Rp24 billion, or 48.7%, and building maintenance of Rp46 billion, or 15.6%13.7%.
Our other segment expenses increased by Rp343Rp322 billion, or 100.3%18.7%, from Rp342Rp1,718 billion in 20112014 to Rp685Rp2,040 billion in 2012,2015, mainly due to an increase in:
·operation, maintenance and telecommunication service expensesby Rp246 billion, or 16.7%, due to an increase in cooperation expenses by Rp112 billion, or 71.7%, vehicles rental and supporting facilities by Rp42 billion, or 43.9%, electricity, gas and water expenses by Rp44 billion, or 6.8%, and security operational expenses by Rp44 billion, or 15.7%;
·depreciation expenses by Rp35 billion, or 67.2%, mainly due to an increase in depreciation of power supply, depreciation of vehicles, and depreciation of building;
·general and administration expensesby Rp20 billion, or 53.6%, primarily due to an increase in operating and maintenance expensesprovision for impairment of Rp154receivables by Rp5 billion, or 37.4%2,793.9%, primarily resulting frommeeting expenses by Rp4 billion, or 155.7%, and professional fees expenses by Rp3 billion, or 224.0%;and
·personnel expenses by Rp16 billion, or 12.9%, due to an increase in project managementoutsourcing expenses by Rp6 billion, or 11.9%, bonuses expenses relating to the operation of buildingsby Rp4 billion, or 61.9%, pension assistance expensesby Rp3 billion, or 158.9% and land and electricity, gas and water expenses.
incentives expenses by Rp2 billion, or 20.8%, meanwhile marketing expenses increased by Rp2 billion, or 19.7%.
B.LIQUIDITY
Liquidity Sources
The main source of our corporate liquidity is cash provided by operating activities and long-term debt through the capital markets as well as long-term and short-term loans through bank facilities. We divide our liquidity sources into internal and external liquidity.
A.Internal Liquidity Sources
To fulfill our obligations we rely primarily on our internal liquidity. Asliquidity.As of December 31, 2013,31,2016, we had Rp14,696Rp29,767 billion (US$2,209 million) in cash and cash equivalents available. In 2013, cash and cash equivalents increased by Rp1,578 billion. In 2013, theavailable, an increase of cash flow provided by operating activities primarily ariseRp1,650 billion, or 5.9%, from cashRp28,117 billion as of December 31, 2015.
Cash receiptsfrom revenues comprisedprimarilycash receipts from customersrevenue from customer, which amounted to Rp113,288 billion (US$8,409 million) in 2016, and are used for payment of Rp77,013 billion.
We made net repaymentsoperating expenses, acquisition of current indebtedness for borrowed moneyproperty and equipment,intangible assets, long-term investment and business, placement in time deposits, payment of Rp7,967 billion in 2011, Rp5,843 billion in 2012cash dividends and Rp6,239 billion in 2013. Cash outflows in 2013 reflected payments for short-termrepayment of loans and other borrowings of Rp407 billion and long-term loans and other borrowings of Rp5,832 billion.
borrowings.
Our internal liquidity strength reflectedstrengthisreflected in our current ratio, which we calculate as current assets divided by current liabilities, increased from 116.0%liabilities. As of December 31, 2016, our current ratio was 120.0%compared to135.3% as of December 31, 2012 to 116.3% as2015.
Table of December 31, 2013.Content
B.External Liquidity Sources
Our primary external sources of liquidity are short and long-term bank loans, two-step loans, bonds and notes payable. During the year 2013 we usedpayable,other borrowingsand two-step loans. We had external liquidity bank loansliquidityfromloans and other borrowingof Rp7,479 billion as of Rp3,538 billion. December 31, 2016.
C.External Outstanding Liquidity Sources
WeAs of December 31,2016, we had undrawn loan facilities which include the following sources of unused liquidity:
-·BNI loan facility in the amount of Rp1,539 billion;
· Bank CIMB Niaga loan facility in the amount of Rp1,077 billion; Rp291billion;
-· JapanThe Bank for International Cooperationof Tokyo Mitsubishi UFJ, Ltd loan facility in the amount ofRp83billion;
·PT Bank Sumitomo Mitsui Indonesia loan facility in the amount of US$31,350,000; Rp83 billion;
-· BNIBank Mandiri loan facility in the amount of Rp531 billion; Rp88billion;
-· BankRakyatIndonesia loan facility in the amount of Rp42billion;
· �� BNI, BRI and Bank Mandiri syndicated loan facility in the amount of Rp103 million;
·Bank UOB loan facility in the amount of Rp70 billion; Rp82billion;
-· BRI loanBank UOB Singaporeloan facility in the amount of Rp49 billion; Rp323billion;
-· Bank Bukopin loanEkonomi Raharjaloan facility in the amount of Rp9 billion; Rp22billion;
-· BRI Syariah loanBank Danamonloan facility in the amount of Rp1.4 billion; Rp60billion; and
-· Bank Syariah Mandiri loanMandiriloan facility in the amount of Rp1.3 billion; Rp15billion.and
-Syndicated loan facility of BNI, BRI and Bank Mandiri in the amount of Rp749billion.
78
Table of Content
Net Cash Flows
The following table sets out information concerning our consolidated cash flows, as set out in (and prepared on the same basis as) our Consolidated Financial Statements:
| | | | Years Ended December 31, | |
| 2014 | | 2015 | | 2016 | |
| (Rp billion) | | (Rp billion) | | (Rp billion) | | (US$ million) | |
Net cash flows: | | | | | | | | |
provided by operating activities | 37,736 | | 43,669 | | 47,231 | | 3,506 | |
used in investing activities | (24,748) | | (27,421) | | (27,557) | | (2,046) | |
used in financing activities | (10,083) | | (6,407) | | (17,905) | | (1,329) | |
Net increase in cash and cash equivalents | 2,905 | | 9,841 | | 1,769 | | 131 | |
Effect of exchange rate changes on cash and cash equivalents | 71 | | 604 | | (119) | | (8) | |
Cash and cash equivalents at beginning of year | 14,696 | | 17,672 | | 28,117 | | 2,087 | |
Cash and cash equivalents at end of year | 17,672 | | 28,117 | | 29,767 | | 2,210 | |
| | Years ended December 31, | |
| | 2011 |
| 2012 |
| | | 2013 | |
| | (Rp billion) |
| (Rp billion) |
| (Rp billion) |
| (US$ million) | |
Net cash flows: | | | | | | | | | |
provided by operating activities | | 30,462 | | 27,941 | | 36,574 | | 3,004 | |
used in investing activities | | (14,414 | ) | (11,311 | ) | (22,702 | ) | (1,865 | ) |
used in financing activities | | (15,539 | ) | (13,314 | ) | (13,327 | ) | (1,095 | ) |
Net increase in cash and cash equivalents | | 509 | | 3,316 | | 545 | | 44 | |
Effect of exchange rate changes on cash and cash equivalents | | 5 | | 168 | | 1,039 | | 85 | |
Cash and cash equivalents at beginning of year | | 9,120 | | 9,634 | | 13,118 | | 1,078 | |
Ending balance of disposed subsidiary | | - | | - | | (6 | ) | (0 | ) |
Cash and cash equivalents at end of year | | 9,634 | | 13,118 | | 14,696 | | 1,207 | |
Table of Content
Year ended December 31, 20132016 compared to year ended December 31, 20122015
As of December 31, 2016, total cash and cash equivalent amounted to Rp29,767 billion, an increase of Rp1,650 billion, or 5.9%, from Rp28,117 billion as of December 31, 2015.
In 2016, operating activity accounted for the largest cash receipts which amounted toRp118,326billion, or89.5% of total cash receipts,followed by financing activity which amounted to Rp10,921 billion, or 8.2% of total cash receipts, and investing activity which amounted toRp3,007 billion, or 2.3% of total cash receipts.In total, cash receipts increased byRp8,051 billion, or 6.5%, compared to 2015.
In 2016, cash used for operating activities amounted to Rp71,095billion, or54.5% of total cash disbursements, followed by investing activitieswhichamounted to Rp30,564billion, or23.4%of total cash disbursements, and financing activitieswhichamounted to Rp28,826billion, or22.1% of total cash disbursements. Compared to 2015, cash disbursements increased byRp16,123 billion, or 14.1%.
Cash Flows from Operating Activities
Net cash provided by operating activities in 2013 was Rp36,574 billionRp47,231billion (US$3,0043,506 million), compared to Rp27,941Rp43,669 billion in 2012. The increase was primarily due to2015, an increase of Rp5,103Rp3,562billion, or8.2%.
Cash receipts from operating activities amounted to Rp118,326 billion,anincreaseof Rp15,663 billion, or 7.1%15.3%, incompared to 2015. The cash receipts came from:
·cash receipts from customers and other operators ofRp116,116billion;
·interest income receivedofRp1,736 billion; and
·other cash receipts after netted with the other cash disbursementofRp474 billion.
Cash disbursements from other telecommunications operators ofRp528operating activities amounted to Rp71,095 billion, or13.2%, due to the increase in our operating revenue, and decrease of Rp6,211 billion, or18.5%, of cash payments forexpenses. This was partially offset by an increase of Rp1,809anincreaseof Rp12,101 billion, or 32.4%20.5%, in paymentcompared to 2015.The cash disbursements were used for:
·cashpayments for incomeexpenses of Rp42,433 billion;
·payments forcorporate and finalincome taxes and cash paymentsofRp11,304 billion;
·cashpayments to employees ofRp1,721billion,or 21.1%. ofRp11,207 billion;
·payments for interest costsofRp3,455 billion; and
·payments for value added taxes after netted withthe receipt ofclaim for value added taxesof Rp2,696billion.
Cash Flows from Investing Activities
Net cash flows used in investing activities in 20132016 was Rp22,702Rp27,557 billion (US$1,8652,046 million), compared to Rp11,311Rp27,421 billion in 2012. This increase was primarily due to2015, an increase of Rp11,423Rp136billion, or0.5%.
Cash receipts from investing activities amounted to Rp3,007 billion,anincreaseof Rp2,101 billion, or 139.0% in acquisition231.9%, compared to 2015. The cash receipts came from:
·proceeds from escrow accountsof Rp2,159 billion;
·proceeds from sale of property and equipment mainly relatingofRp765 billion;
·proceeds from insurance claimsofRp60 billion; and
Table of Content
·dividends received from associated companyof Rp23 billion.
Cash disbursements from investing activities amounted to Rp30,564 billion,anincreaseof Rp2,237 billion, or 7.9%, compared to 2015.The cash disbursements were used for:
·purchases of property under construction, transmission installation and equipmentequipmentof Rp26,787 billion;
·increases in advances for purchases of property and cable network.equipmentof Rp1,338 billion;
·purchases of intangible assetsof Rp1,098billion;
·placements in time deposits and available-for-sale financial assetsof Rp983billion;
·acquisition of non-controlling interest in subsidiaryof Rp138 billion;
·acquisition of business, net of acquired cashof Rp137 billion;
·additional contribution on long-term investmentsof Rp43 billion; and
·increase in other assetsof Rp40 billion.
Cash Flows from Financing Activities
Net cash flows used in financing activities totaled Rp13,327in 2016 was Rp17,905 billion (US$1,0951,329 million) in 2013, compared to Rp13,314Rp6,407 billion in 2012. This increase was primarily due to2015, an increase of Rp4,112Rp11,498billion, or179.5%.
Cash receipts from financing activities amounted to Rp10,921 billion,a decreaseof Rp9,713 billion, or 235.8%47.1%, in proceedcompared to 2015. The cash receipts came from:
·proceeds from loans and other borrowingsof Rp7,479 billion;
·proceeds from sale of treasury stock. This was partially offset by stockof Rp3,259 billion; and
·capital contribution of non-controlling interests in subsidiariesof Rp183 billion.
Cash disbursements from financing activities amounted to Rp28,826 billion,an increase of Rp1,227increaseof Rp1,785 billion, or 17.2%6.6%, in compared to 2015.The cash disbursements were used for:
·cash dividends paid to our stockholders duethe Company’s stockholdersofRp11,213 billion;
·cash dividends paid to the increasenon-controlling interests of our operating profitsubsidiariesofRp7,058 billion; and a decrease
·repayments of Rp1,349 billion, or 27.6%, in proceed from loanloans and other borrowings.borrowingsof Rp10,555 billion.
Year endedended December 31, 2012 compared to year ended2015comparedtoyearended December 31, 20112014
Cash Flows from Operating Activities
Net cash provided by operating activities in2012 was Rp27,941 billion (US$2,898 million) compared to Rp30,462 billion in 2011. The decrease was primarily due to an increase of Rp8,144 billion, or 31.9%, in cash payments forexpenses. This was partially offset by an increase of Rp4,441 billion, or 6.6%, in cash receipts from customers due to the increase of our revenues.
Cash Flows from Investing Activities
Net cash flows used in investing activities in 2012 was Rp11,311 billion (US$1,173 million) compared to Rp14,414 billion in 2011. This decrease was primarily due to an increase of Rp3,975 billion, or 12,045.5% in placement in time deposits and a decrease of Rp4,884 billion, or 37.3%, in cash payments for the acquisition of property and equipment. This was partially offset by an increase of Rp1,862 billion, or 14,323.1% in proceeds from insurance claims relating to unsuccessful launch of the Telkom-3 satellite.
Apart from cash on hand and cash in banks, we invest the majority of our excess cash from time to time in time deposits. Since May 14, 2004, we also have been investing a part of our excess cash in Rupiah-based mutual funds and other marketable securities. As of December 31, 2012, other current financial assets totaling Rp4,3382015, total cash and cash equivalent amounted to Rp28,117 billion, (US$450 million) in mutual fundsincreased by Rp10,445 billion, or 59.1%, compared to 2014.
In 2015, operating activity accounted for the largest cash receipts Rp102,663 billion, or 82.7%,followed by financing activity amounted to Rp20,634 billion, or 16.6% and other marketable securities were outstanding.investing activity amounted toRp906 billion, or 0.7%.In total, cash receipts increased byRp13,859billion, or12.6% compared to 2014.
Table of Content
Cash used for operating activities amounted to Rp58,994 billion, or 51.6% of total cash expenditures in 2015. Cash used in investment activities amounted to Rp28,327 billion, or 24.8% of total cash expenditures in 2015 and financing activities amounted to Rp27,041billion, or 23.6% of total cash expenditures in 2015. Compared to 2014, cash disbursement in 2015 increased byRp6,923 billion, or6.4%.
Cash Flows from Operating Activities
Net cash provided by operating activities in 2015 was Rp43,669 billion compared to Rp37,736billion in 2014.
Cash receipts from operating activities amounted to Rp102,663 billion, an increase ofRp12,300billion, or13.6%compared to 2014. The cash receipts from operating activities came from:
·cash receipts from customersand other operatorofRp100,702 billion;
·interest income receivedofRp1,386billion; and
·other cash receipts after netted with other cash disbursementofRp575 billion.
Cash disbursements from operating activities amounted to Rp58,994 billion in 2015,whichincreased byRp6,367billion, or12.1%compared to 2014.Thecash disbursementswere used for:
·cashpayments for expenses ofRp35,922 billion;
·cashpayments to employeesofRp10,940billion;
·payments for corporate and finalincome taxes of Rp9,299billion;
·payments for interest costsof R2,623 billion; and
·payments for value added taxes after netted with the receipt of claim for value added taxes of Rp210 billion.
Cash Flows from Investing Activities
Net cash flows used in investing activities in 2015 was Rp27,421 billion compared to Rp24,748 billion in 2014.
Cash receipts from investing activities amounted to Rp906 billion in 2015, which decreased byRp6,006billion, or86.9%compared to 2014. The cash receipts from investing activities came from:
·proceeds from sale of property and equipmentofRp733 billion;
·proceeds from insurance claimsof Rp119billion;
·decrease in other assetsof Rp36 billion; and
·dividends received from associated companyof Rp18 billion.
Cash disbursements from investing activities amounted to Rp28,327 billion in 2015,which decreased byRp3,333billion, or10.5%compared to 2014. The cash disbursements were used for:
·purchases of property and equipment ofRp26,499billion;
·purchasesof intangible assets ofRp1,439billion;
·placements in time deposits and available-for-sale financial assetsof Rp146 billion;
Table of Content
·acquisitions of business, net of acquired cashof Rp114 billion;
·increase in advances for purchases of property and equipmentof Rp67 billion; and
·additional contribution on long-term investmentsof Rp62 billion.
Cash Flows from Financing Activities
Net cash flows used in financing activities totaled Rp13,314in 2015wasRp6,407 billion (US$1,381 million)comparedtoRp10,083 billion in 20122014.
Cash receipts from financing activities amounted toRp20,634billion, an increase ofRp7,565billion, or57.9%, compared to Rp15,539 billion in 2011. This decrease by Rp2,225 billion, or 14.3%, was primarily due to a decrease of Rp3,075 billion, or 41.9%, in repayment of two-step2014. The cash receipts from financing activities came from:
·proceeds from loans and bank loansother borrowingsofRp20,561billion;
·proceeds from sale of treasury stockof Rp68 billion; and a decrease
·capital contribution of Rp315non-controlling interests in subsidiariesof Rp5 billion.
Cash disbursements from financing activities amounted to Rp27,041 billion, or 15.3% in payments for treasury stock. This was partially offset by an increasewhich increased byRp3,889billion, or16.8%compared to 2014. The cash disbursementswere used for:
·repayments ofloans and other borrowings of Rp1,058 billion, or 17.4%, in Rp10,427 billion;
·cash dividends paid to our stockholders.the Company’s stockholders ofRp8,783billion; and
·cash dividends paid to non-controllinginterests of subsidiaries ofRp7,831billion.
Current Assets
As of December 31,2013,31,2016, our current assets wereRp33,075wereRp47,701 billion (US$2,718 million)3,541million) compared to Rp27,973Rp47,912billion as of December 31, 2015, a decreaseof Rp211 billion, or0.4%. This decrease was primarily due to:
·a decrease in other current financial assetsof Rp1,347billion, or 47.8%, from Rp2,818 billion as of December 31, 2012. Theincrease in current assets was mainly2015 to Rp1,471 billion as of December 31, 2016primarily due to the increasewithdrawals of Rp2,534billion,cash from escrow accounts;
·a decreaseinadvances and prepaid expense of Rp593billion, or 58.4%10.2%, infrom Rp5,839 billion as of December 31, 2015 to Rp5,246 billion as of December 31, 2016; and
·a decreasein prepaid other current financial assets, taxes byRp36billion, or 1.4%, from Rp2,657 billion as of December 31, 2015 to Rp2,621 billion as of December 31, 2016.
This decrease waspartiallyoffset by:
·an increase in our cash and cash equivalents of Rp1,578billion,Rp1,650 billion, or 12.0%5.9%, from Rp28,117 billion as of December 31, 2015 to Rp29,767 billion as of December 31, 2016;
·an increase ininventories by Rp56 billion, or 10.6% from Rp528 billion as of December 31, 2015 to Rp584 billion as of December 31, 2016;
·an increase intrade and other receivables by Rp28 billion, or 0.4%, from Rp7,872 billion as of December 31, 2015 to Rp7,900 billion as of December 31, 2016; and
·an increase in trade and other receivables of Rp1,012prepaid income taxes by Rp28 billion, or 18.7%.
Thisincrease was partially offset by a decrease34.6%,from Rp81 billion as of Rp279billion, or 36.9% in prepaid other taxes.December 31, 2015 to Rp109 billion as of December 31, 2016.
Table of Content
Current Liabilities
CurrentAs of December 31, 2016, our current liabilities wereRp28,437 billionwereRp39,762billion (US$2,336 million) 2,951million)compare toRp35,413billion as of December 31,201331,2015, an increase of Rp4,349 billion, or 12.3%.The increase was primarily due to:
·an increase in accrued expensesof Rp3,036 billion, or 36.8%, from Rp8,247 billionas of December 31, 2015 to Rp11,283 billionas of December 31, 2016 in line with payments of general and Rp24,108administrative expenses and marketing expenses;
·an increase in unearned incomeof Rp1,203 billion, or 27.6%, from Rp4,360 billionas of December 31, 2015 to Rp5,563 billionas of December 31, 2016 related to cellular prepaid vouchers;
·an increase in short-term bank loans and current maturities on long-term liabilitiesofRp988 billion, or 22.2%, from Rp4,444 billionas of December 31, 2015 to Rp5,432 billionas of December 31, 2016;
·an increase in other tax liabilities of Rp247 billion, or 16.8%, from Rp1,471 billion as of December 31,2012. Thisincrease was primarily due31, 2015 to Rp1,718 billion as of December 31, 2016;and
·an increase in advances from customers and suppliers Rp35 billion, or 4.3%, from Rp805 billion as of Rp4,531billion,December 31, 2015 to Rp840 billion as of December 31, 2016.
This increase waspartiallyoffset by:
·a decrease in tradeand otherpayableof Rp594 billion, or 60.8%4.2%, from Rp14,284 billionas of December 31, 2015 to Rp13,690 billionas of December 31, 2016due to a decrease in trade and other payables to related party; and an increase of Rp761
·a decrease current income tax liabilitiesof Rp566 billion, or 27.9% in unearned income.
Thisincrease was partially offset by adecrease31.4%, from Rp1,802 billionas of Rp899 million, or 14.6% in accrued expenses.
December 31, 2015 to Rp1,236 billionas of December 31, 2016.
Working Capital
Net working capital, calculated as the difference between current assets and current liabilities, amounted to Rp3,865 billionRp12,499billion as of December 31, 2012 and Rp4,638 billion2015 compared to Rp7,939billion (US$382 million)590million) as of December 31, 2013.2016, a decrease of Rp4,560 billion, or36.5%. The increasedecrease in net working capital was primarily due to:
-· A substantial increase ofRp2,534 billiona decrease in other current financial assets (mainlyassetsof Rp1,347billion, or 47.8%, from time deposit);Rp2,818 billion as of December 31, 2015 to Rp1,471 billion as of December 31, 2016;
-· An increasea decreasein advances and prepaid expense ofRp1,578 billion in cash and cash equivalents; and Rp593billion, or 10.2%, from Rp5,839 billionas of December 31, 2015 to Rp5,246 billionas of December 31, 2016;
-· An increasea decreasein prepaid other taxes byRp36billion, or 1.4%, from Rp2,657 billion as ofRp1,012 December 31, 2015 to Rp2,621 billion in trade and other receivables.
This was partially offset by:
-An increaseas ofRp4,531 billion in trade and other payables; December 31, 2016;
-· A decrease ofRp899 billionan increase in accrued expense;expensesof Rp3,036 billion, or 36.8%, from Rp8,247 billionas of December 31, 2015 to Rp11,283 billionas of December 31, 2016 in line with payment of general and administrative expenses and marketing expenses;
·an increase in unearned incomeof Rp1,203 billion, or 27.6%, from Rp4,360 billionas of December 31, 2015 to Rp5,563 billionas of December 31, 2016 related to cellular prepaid vouchers;
·an increase in short-term bank loans and current maturities on long-term liabilitiesofRp988 billion, or 22.2%, from Rp4,444 billionas of December 31, 2015 to Rp5,432 billionas of December 31, 2016;
·an increase in other tax liabilitiesofRp247 billion, or 16.8%, from Rp1,471 billionas of December 31, 2015 to Rp1,718 billionas of December 31, 2016; and
Table of Content
-· Anan increase in advances from customers and suppliers ofRp761 Rp35 billion, in unearned income.or 4.3%, from Rp805 billion as of December 31, 2015 to Rp840 billion as of December 31, 2016.
We believe that our working capital is sufficient for our present requirements. We expect that our working capital requirements will continue to be addressed by various funding sources, including cash from operating activities and bank loans.
Capital Structure
Our capital structure as of December 31, 20132016 is described as follows:
| | Amount (Rp billion) | | Portion (%) | |
| | |
Short-term Debt | | 432 | | 0.5 | |
Long-term Debt | | 19,824 | | 24.8 | |
Total Debt | | 20,256 | | 25.3 | |
Equity attributable to owners | | 59,753 | | 74.7 | |
Total Invested Capital | | 80,009 | | 100.0 | |
| Amount | | Portion | |
| (Rp billion) | | (%) | |
Short-term debt | 911 | | 0.8 | |
Long-term debt | 30,888 | | 26.6 | |
Totaldebt | 31,799 | | 27.4 | |
Equity attributable to owners of the parent company | 84,163 | | 72.6 | |
Total | 115,962 | | 100.0 | |
We take a qualitative approach towards our capital structure and debt levels. Under our syndicated loan agreement with BNI BRI and Bank Mandiri,BCA, we are required to maintain a debt to equity ratio ofratioshould not more than 2.0 and debtexceed2.5 anddebt service coverage ratio of more than 1.25.ratioshould not be lessthan 1.0. As of December 31, 2013,31,2016, our debt to equity ratio was0.34 and ourwas0.30 andour debt service coverage ratio was6.8,was3.94 times, indicating our strong ability to meet our debt obligations. Our debt levels are primarily driven by our plans to develop our existing and new strategic businesses. In determining our optimum debt levels, we also consider our debt ratios with reference to regional peers in the telecommunications industry.
For further information on our Company’s management policies related to capital, see Note36 to our Consolidated Financial Statements.
Indebtedness
Consolidated total indebtedness (consisting of short-term bank loans, long-term liabilities, current maturities of long-term liabilities and other borrowings as of December 31, 2014, 2015 and 2016 were as follows:
| As of December 31, | |
| 2014 | | 2015 | | 2016 | |
| (Rp billion) | | (Rp billion) | | (Rp billion) | | (US$ million) | |
Indonesia Rupiah | 20,013 | | 31,041 | | 30,100 | | 2,234 | |
U.S. Dollar(1) | 2,643 | | 2,779 | | 992 | | 74 | |
Japanese Yen(2) | 796 | | 792 | | 707 | | 52 | |
Total | 23,452 | | 34,612 | | 31,799 | | 2,360 | |
(1) The amounts as of December 31, 2014, 2015 and 2016 translated into Rupiah at Rp12,385, Rp13,785 and Rp13,472.5 = US$1, respectively, being the Reuters average rates for U.S. Dollar at each of those dates. | |
(2) The amounts as of December 31, 2014, 2015 and 2016 translated into Rupiah at Rp103.59, Rp114.52 and Rp115.06 = Yen 1, respectively, being the Reuters average rates for Yen at each of those dates. | |
Of our total indebtedness, as of December 31, 2016,Rp5,432 billion,Rp8,982 billion, Rp7,254 billion and Rp10,131 billion were scheduled for repayment in 2017, 2018-2019, 2020-2021 and thereafter, respectively.
For further information on our Company’s indebtedness, see Notes 16 and 17to our Consolidated Financial Statements.
Table of Content
IndebtednessCapital Expenditures
Consolidated total indebtedness (consisting of long-term liabilities, current maturities of long-term liabilities, short-term bank loans and deferred consideration for business combinations) as of December 31, 2011, 2012 and 2013 were as follows:
| | As of December 31, | |
| | 2011 | | 2012 | | 2013 | | 2013 | |
| | (Rp billion) | | (Rp billion) | | (Rp billion) | | (US$ million) | |
Indonesian Rupiah | | 14,142 | | 16,192 | | 17,543 | | 1,441 | |
US Dollar(1) | | 2,561 | | 2,052 | | 1,734 | | 142 | |
Japanese Yen(2) | | 1,168 | | 1,031 | | 979 | | 80 | |
Total | | 17,871 | | 19,275 | | 20,256 | | 1,663 | |
(1)The amounts as of December 31, 2011, 2012 and 2013 translated into Rupiah at Rp9,075, Rp9,645 and Rp12,180 = US$1, respectively, being the Reuters sell rates for US Dollar at each of those dates.
(2)The amounts as of December 31, 2011, 2012 and 2013 translated into Rupiah at Rp117.0, Rp111.8 and Rp115.9 = Yen 1, respectively, being the Reuters sell rates for Yen at each of those dates.
Of our total indebtedness, as of December 31, 2013,Rp20,256 billion,Rp5,525 billion,Rp6,465 billion, Rp2,853billion, and Rp5,413 billion were scheduled for repayment in 2014, 2015 toIn 2016, 2017 to 2018 and thereafter, respectively.
For further information on our Company’s indebtedness, see Notes 18-19 to our Consolidated Financial Statements.
CAPITAL EXPENDITURES
In 2013, we incurred capital expenditures of Rp24,898billion(US$2,046million), whichwas in line with the realization of the plan to develop of network infrastructure, services node, applications and supporting system.
Rp29,199billion(US$2,167million). Our capital expenditures are grouped intofourcategories of development plan to characterizeinto the network element and asset classification, as follows: following categories for planning purposes:
-· Broadband services, which consist ofprogram developmentof broadband, IT, application and capacity expansion ofbroadband access,content and service provision servers,applications,content andIT system; node;
-· Network infrastructure, which consists ofaof core transmission network, of nationalmetro-ethernet and regional backbone transmissionRegional Metro JunctionMetro Ethernet, (“RMJ”),IP backbone and satellite;
-· Optimizing legacy, for fixed wireline;lines; and
-· Capex supports.
Of our Rp24,898billioncapitalRp29,199billioncapital expenditure in 2013,2016, Telkom, (asas parent company)company, incurred capital expenditures of Rp5,313billionRp10,309billion (US$437765 million), Telkomsel incurred capital expenditures of Rp15,662billion(US$1,287million)Rp12,564billion(US$932million) and our other subsidiaries incurred capital expenditures of Rp3,923 billion(US$322million)Rp6,326 billion(US$470 million). The following table set forth our capital expenditure breakdown between Telkom as follows:
a parent company, Telkomsel and our other subsidiaries for the periods indicated.
Table of realization of our capital expenditure | | | | | | | | |
| | Years Ended December 31, | | | | Years Ended December 31, | |
| | 2011 | | 2012 | | 2013 | | 2014 | | 2015 | | 2016 | |
| | (Rp billion) | | (Rp billion) | | (Rp billion) | | (Rp billion) | | (Rp billion) | | (Rp billion) | | (US$ million) | |
Telkom (parent company) | | | | | | | | 8,099 | | 9,641 | | 10,309 | | 765 | |
Broadband service | | 1,875 | | 1,662 | | 3,286 | | |
Networkinfrastructure | | 1,979 | | 2,060 | | 1,674 | | |
Optimizing legacy | | 156 | | 86 | | 191 | | |
Support | | 192 | | 232 | | 162 | | |
Subtotal for Telkom | | 4,202 | | 4,040 | | 5,313 | | |
Subsidiaries | | | | | | | | | | | | | | | |
Telkomsel | | 8,472 | | 10,656 | | 15,662 | | 13,002 | | 11,321 | | 12,564 | | 932 | |
Others | | 1,929 | | 2,576 | | 3,923 | | 3,560 | | 5,439 | | 6,326 | | 470 | |
Subtotal for subsidiaries | | 10,401 | | 13,232 | | 19,585 | | 16,562 | | 16,760 | | 18,890 | | 1,402 | |
Total for Telkom Group | | 14,603 | | 17,272 | | 24,898 | | 24,661 | | 26,401 | | 29,199 | | 2,167 | |
Table of Content
Material Commitments for Capital Expenditures
As of December 31,2013,31, 2016, we had material commitments for capital expenditures under certain contractual arrangements of Rp18,461totaling Rp11,812 billion (US$877 million), principally relating to procurement and installation ofthe broadband network,of data, internet and information technology, cellular, transmission equipment andfiber opticcablesystem. and cable network in Indonesia.
The following table sets forth information on our committed capitalexpenditures undercontractualagreements as of December 31, 2016.
Currencies | | Amounts in Foreign Currencies | | Equivalent in Rupiah | |
| (in millions) | | (in billions) | |
Rupiah | | - | | 7,210 | |
U.S. Dollar | | 341 | | 4,600 | |
Euro | | 0.16 | | 2 | |
Total | |
| | 11,812 | |
For a more detailed discussion regarding our material commitments for capital expenditures, see Note 38a33a to ourConsolidatedour Consolidated Financial Statements.
SourceSource of Funds
We have historically funded our capital expenditures primarily with cash generated from operationsand additional fund raised from external sources as well.operations. In 2014, weexpect2017, we expect that ourcapitalour capital expenditure to revenue ratiowillratio will be approximatelyinapproximately in the range of 25%-30%.We. We expect that of the total increase in amount of capital expenditure in 2014 over 2013, the most significant proportionswillproportionsof capital expenditurewill be allocatedfor mobile andbroadband servicesandallocatedtobroadband services, with a portion of the increase will be synergistically functionalizedallocated to oursubsidiaries.our subsidiaries. We expect to fund the above commitments with our internal and external source of funds.
Table of Content
The realizationrealizationand use of the future capital expenditures may differ from the amounts indicated above due to various factors, including but not limited to changes in the Indonesian and global economyenvironments,economy, the Rupiah/US DollarorotherU.S. Dollar or other applicable foreign exchange rates, the availability ofsupply orvendorof supply or vendor or other financing on terms acceptable to us,and also anytechnicalany technical or other problems inthein the implementation.
Critical Accounting Policies, Estimates and Judgments
For a complete discussion of our critical accounting policies, estimates and judgments, see Note 2abNote2aa to our Consolidated Financial Statements.
New Standards and Interpretations
See Note 44Note39 to our Consolidated Financial Statements for a discussion of the new standards, amendments to standards and interpretations not yet effective for the year ended December 31, 2013 and2016 which have not been applied in preparing the Consolidated Financial Statements.
C.RESEARCH AND DEVELOPMENT, PATENTS AND LICENSES, ETC.Research and Development, Patents and Licenses, etc.
We routinely make investments As a technology-based company, we continue to improve productsfocus on product and services. Total expenditure reached about Rp13 billion, Rp13 billionservice innovation through ongoing research and Rp14 billion (US$1 million), in 2011, 2012 and 2013, respectively. In 2013,we engaged inresearch and developmentin the areas of business, products and servicesto support of the implementation of mobile broadband, cloud computing, and development of ecosystem-based solutions, such as e-tourism, mobile payment, mobile games, and smart home solutions, that are designed to promote a digital lifestyle in Indonesia.We also engaged indevelopment. Our research and development relating totelecommunicationactivities are conducted under the Digital Service Division. The primary activity of our Digital Service Division is to analyze new technologies and equipment which we plan to integrate into our network infrastructure.
infrastructure in order to ensure a seamless integration process. In addition, our Digital Service Division is mandated with conducting feasibility studies on prospective technologies that we will need to procure in order to support our transformation into a digital telecommunications company.
We also conduct joint innovation activities with certain partners to enhance our current products and services and create new business models that could produce new revenue generators. We also conduct joint innovation activities that aim to enhance our current products and services and create new business models to produce new revenue generators. Involving a number of partners, namely Cisco, Huawei, NEC/NetCracker, NTT, SK Telecom and ZTE, the joint innovation has resulted in new IndiHome digital services, enhancement to IndiHome architecture as well as new technology mastery in virtualization/cloudification and Internet of Things. In the area of IndiHome digital services, new business opportunities have been developed, two business incubators locatedsuch as personalized IPTV EPG, Android Over The Top TV, TV messaging system, TV video call and speed-on demand services. With regard IndiHome architecture, innovation on open STB, IPTV service quality monitoring as well as introduction of video centric network design were key improvements that we expect will drive cost efficiency and improve quality of services. Exploration on future technology and observation onInternet Of Things has also contributed much toour long term benefit in terms of updated knowledge as well as human capital development that may create opportunities for additional revenue and cost savings in the citiesfuture.
Our research and development activities include our open innovation program where we aim to leverage the creativity of BandungIndonesian digital technology entrepreneurs with the aim of integrating the products and Yogyakarta called Bandungservices that they develop into our business. We provide office facilities such as shared meeting rooms, classrooms and common areas for entrepreneurs which are known as Digital Valley ("BDV")Innovation Lounges at 14 locations in Indonesia. In 2016, we received 20,000 proposals from startups as part of our startup discovery program. We conduct incubation and Jogja Digital Valley ("JDV"), respectively. Each incubator is intendedacceleration activities under which we provide mentorships to help build a national digital creative industry while strengthening ourassist startups to develop and validate their business portfolio and focuses on innovative ideasmodel. We occasionally provide seed financing in the form of equity to startups which have may or may not been fully market-tested but that we believe have potential.are commercially viable. We also support startups to market their products and services and obtain follow-on financing. In 2016, we successfully integrated the products and services of certain startups including Priviy-ID (an application that facilitates secure electronic signatures), Modegi (a developer of residential Internet of Things enablers), X-Igent (an application that facilitates emergency messages) and Run-system (an enterprise resources planning application for SMEs).
Our total expenditure for research and development activities was approximately Rp4 billion, Rp11 billion and Rp13 billion in 2014, 2015 and 2016, respectively.
BDV commenced operations in 2012 and has been involved in the incubationTable of over a dozen startup companies. We expectJDVto commence incubation activities in 2014.Content
D.TREND INFORMATIONTrend Information
The significant trends, or developments that have had in recent years, and may have in the future, a material impact on our results of operations, financial condition and capital expenditures, include (i) an increase in cellular telephone revenues with increases in subscribers, minutes of use, ARPU and regulatory aspects (ii) an increase in revenues from data, internet and information technology services revenues and (iii)(ii) a decreaseflattening in the growth of legacy services such as fixed linesline telephone, cellular voice and SMS revenues. See “Operating Results”.
We believe favorable external factors, among others, will support our ability to continue to drive revenue growth from both cellular and non-cellular data,internet and information technology services as well as from mobile phone services. Indonesia's economy recorded a relatively robusthealthy growth in recent yearsdespite a sluggish global economy.years. With good economic fundamentals, Indonesia’s national economy is expected to continue to grow steadily, with a corresponding increase in consumer purchasing power, which in turn is expected to result in higher demand for telecommunications services, for both basic telecommunications services as well as the more sophisticated value-added services that are part of the increasingly prevalent digital lifestyle in modern societies.
Table of Content
In the longer term, Indonesia’s economyinformation and communication technology sector is also expected to enjoy support from Government initiatives such as the MasterIndonesia Broadband Plan for2014-2019. Under the AccelerationIndonesia Broadband Plan 2014-2019, the Government intends to facilitate an increase in access to fixed broadband infrastructure in Indonesia. Access to fixed broadband infrastructure in urban areas (with capacity of at least 20 Mbps) is targeted to reach 71% of households and Expansion of Indonesia’s Economic Development, which was launched in 2011. One30% of the three pillarsurban population, while access to mobile broadband infrastructure (with capacity of at least 1 Mbps) is targeted to reach the entireurbanpopulation by 2019. For rural areas, access to fixed broadband infrastructure (with capacity of at least 10 Mbps) is targeted to reach 49% of households and 6% of the master planrural population, while access to mobile broadband infrastructure (with capacity of at least 1 Mbps) is targeted to reach 52% of theruralpopulation by 2019.
In addition, the Government has implemented a National Medium-Term Development Plan (RPJMN) 2015-2019 under which it intends to accelerate economic development of national connectivity, including development of the information and communication technology sector. This is in line with our IDN program and our strategic initiative on the development of our Nusantara Superhighway project (i.e. the Palapa ring project known as id-Ring), an optical-based network of six interconnected rings which links Indonesia’s main island groups, namely the Sumatra ring, the Java ring, the Kalimantan ring, the Sulawesi ring, the Bali and Nusa Tenggara ring and the Maluku and Papua ring.Indonesia by, among others, developing infrastructure at major economic corridors. We expect that the development of this extensive telecommunication network connecting all the six majorthese economic corridors will provide opportunities for us to expand our sales of products and services and allow us to offer more value-added services, and to reach more customers in a much larger scale, as well as provide opportunitiesscale.
In line with Indonesia Broadband Plan, President Joko Widodo aspires for Indonesia to be one of the largest digital economies in Southeast Asia by 2020. We believe that our products and servicesIndonesia Digital Network program is in line with the IMES areas.
foregoing Government initiatives.
We believe the shift in consumer preferences towards a digital lifestyle will be a key factor that we expect will drive our business in the future. We believe thisforegoing trends will lead to continuing increase in broadband demand (including mobile broadband),for data, internet and information technology services as well as cloud and digital services, compensating for the declineflattening in the growth of our legacy business (bothservices such as fixed wireline andlines telephone, cellular telephone revenuesvoice and SMS revenues). We expect the increase in demand for data communications and corporate internet to continue next year as we increase our capacity to cover more small and medium enterprises.
revenues.
E.OFF-BALANCE SHEET ARRANGEMENTSOff-Balance Sheet Arrangements
As of December 31, 2013,2016, we had no off-balance sheet arrangements that were reasonably likely to have a current or future material effect on our financial position,financialcondition, revenues or expenses, results of operations, liquidity, capital expenditures or capital resources.
Table of Content
F.TABULAR DISCLOSURE OF CONTRACTUAL OBLIGATIONSTabular Disclosure of Contractual Obligations
The following table sets forth information on certain of our material contractual obligations as of December 31, 2013.2016:
Contractual Obligations | By Payment Due Dates | |
Total | | Less than 1 year(7) | | 1-3 years(7) | | 3-5 years(7) | | More than 5 years(7) | |
(Rp billion) | | (Rp billion) | | (Rp billion) | | (Rp billion) | | (Rp billion) | |
Long-Term Debts(1)(5) | 14,855 | | 4,445 | | 5,405 | | 1,756 | | 3,249 | |
Capital Lease Obligations(2) | 4,969 | | 648 | | 1,060 | | 1,097 | | 2,164 | |
Operating Leases Obligation(3) | 14,037 | | 1,845 | | 3,270 | | 3,095 | | 5,827 | |
Interest on Long-term Debts and Capital Lease Obligations(6) | 5,348 | | 1,424 | | 1,856 | | 1,159 | | 909 | |
Unconditional Purchase Obligations(4) | 18,461 | | 18,461 | | - | | - | | - | |
Total | 57,670 | | 26,823 | | 11,591 | | 7,107 | | 12,149 | |
| | By Payment Due Date | |
Contractual Obligation | | Total | | Less Than 1 Year(7) | | 1-3 years(7) | | 3-5 years(7) | | More than 5 years(7) | |
| | (Rp billion) | | (Rp billion) | | (Rp billion) | | (Rp billion) | | (Rp billion) | |
Long-Term Debts(1)(5) | | 26,878 | | 3,863 | | 7,751 | | 6,007 | | 9,257 | |
Capital Lease Obligation(2) | | 4,010 | | 658 | | 1,231 | | 1,247 | | 874 | |
Interest on Long-Term Debts and Capital Lease(6) | | 15,879 | | 2,715 | | 4,116 | | 2,547 | | 6,501 | |
Operating Lease(3) | | 29,617 | | 3,814 | | 7,269 | | 7,210 | | 11,324 | |
Unconditional Purchase Obligations(4) | | 11,812 | | 11,812 | | - | | - | | - | |
Total | | 88,196 | | 22,862 | | 20,367 | | 17,011 | | 27,956 | |
(1) See notes 16 and 17 to our Consolidated Financial Statements | |
(2) Related to the lease of the slot site of the tower, transmission installation and equipment, power supply, data processing equipment, office equipment, vehicles and CPE assets | |
(3) Related to leases of leased line, telecommunication installation and equipment and land and building | |
(4) Capital expenditure committed under contractual arrangements | |
(5) Excludes the related contractually committed interest obligations | |
(6) See item 3 "Key Information - Business Overview - Risk Factors - Risk Related to Our Business - Financial Risk - We are exposed to interest rate risk" | |
(7)Less than 1 year = 2017, 1-3 years = 2018-2019, 3-5years = 2020-2021, more than 5 years = 2022andthereafter | |
(1)See Notes 18-19 to our Consolidated Financial Statements.
(2)Related to the leases of the slot of the tower, property and equipment under RSA, transmission installation and equipment, data processing equipment, office equipment, vehicles and CPE assets.
(3)Related primarily to leases of slot of the tower, leased line, telecommunication equipment and land and building.
(4)Capital expenditures committed under contractual arrangements.
(5)Excludes the related contractually committed interest obligations.
(6)See “Item 3 Key Item Information – Selected Financial Data – Risk Factors – Risks Related to Our Business – Financial Risks – We are exposed to interest rate risk”.
(7)Less than 1 year = 2014, 1-3 years = 2015-2016, 3-5 years = 2017-2018, more than 5 years = 2019 further.
See Note 38Note33 to our Consolidated Financial Statements for further details on our contractual commitments. In addition to the above contractual obligations, as of December 31, 2013, we had long-term liabilities for pension benefit and other post-employmentfordefinedpension benefits and long service awards. In 2013, we contributed Rp471billion to ourotherpost-employment benefits plan and Rp182 billionpost-employment health care benefit provision. In2016, wedid notcontribute to our defined benefit pension plan.plan and post-employment health care benefit provision. See Note 33Note29 to our Consolidated Financial Statements.
G.SAFE HARBORSafe Harbor
All information that is not historical in nature disclosed under “Off-Balance Sheet Arrangements” and “Tabular Disclosure of Contractual Obligations” is deemed to be a forward-looking statement. See “Forward-Looking Statements".
Table of Content
ITEM 6.DIRECTORS,6. DIRECTORS, SENIOR MANAGEMENT AND EMPLOYEES
A.DIRECTORS AND SENIOR MANAGEMENT
In accordance with Indonesian law,Law No.40 of 2007 on Limited Liability Companies, we have a Board of Commissioners and a Board of Directors. These boards are separate and no individual may be a member of both boards.
The members of the Board of Commissioners and Board of Directors are elected and dismissed by shareholders’ resolutions at a GMS. As stated in theour Articles of Association, to be elected, candidates must be nominated by the Government as holder of the Series A Dwiwarna share. TheShare.The term of office for each Commissioner and Director is five years fromcommences at the date of his/her election, unless the date of expirationclosing of the termGMS which appoints such Commissioner or Director or such other time as specified by such GMS, and terminates at the closing of office falls on a day other than a business day, in which case such term of office shall expire on the following business day.fifth AGMS held after his/her appointment. Shareholders, through an AGMS or an EGMS, have the right to discharge a Commissioner or Director at any time before the expiration of his/her term of office.
Table of Content
Board of Commissioners
TheOur Board of Commissioners is responsible for supervising and providing advice toadvising the Board of Directors. TheOur Board of Commissioners consists ofsixof seven members, one of whom is designated the President Commissioner.
As of December 31, 2016, the Board of Commissioners consisted of seven members as listed below:
Name | | Age | | Date of Birth | | Commissioner Since | | Position | |
Hendri Saparini | | 52 | | June 16, 1964 | | 2014 | | President Commissioner | |
Hadiyanto | | 54 | | October 10, 1962 | | 2012 | | Commissioner | |
Dolfie Othniel Fredric Palit | | 48 | | October 27, 1968 | | 2014 | | Commissioner | |
Pontas Tambunan | | 56 | | February 16, 1961 | | 2016 | | Commissioner | |
Margiyono Darsasumarja | | 40 | | September 14, 1976 | | 2015 | | Independent Commissioner | |
Rinaldi Firmansyah | | 56 | | June 10, 1960 | | 2015 | | Independent Commissioner | |
Pamiyati Pamela Johanna Waluyo | | 58 | | June 20, 1958 | | 2015 | | Independent Commissioner | |
Each of our Commissionerswas a citizenofand domiciled inIndonesia as of December 31, 2016. In accordance with OJK regulations and IDX rules which require 30% of our Board of Commissioners to be independent, the followingthree Commissioners have been designated as our Independent Commissioners: Johnny Swandi SjamCommissioners. Our Independent Commissioners are: Margiyono Darsasumarja, Rinaldi Firmansyah and Virano Gazi Nasution.Pamiyati Pamela Johanna Waluyo. The principal duty of suchour Independent Commissioners, in addition to exercising supervision, is to represent the interests of the minority shareholders.
AsSet forth below is a brief biography of December 31, 2013, the Boardeach of Commissioners consisted ofsix members as listed below:our Commissioners:
Name | | Age | | Commissioner Since | | Position | |
Jusman Syafii Djamal | | 59 | | 2011 | | President Commissioner | |
Hadiyanto | | 51 | | 2012 | | Commissioner | |
Parikesit Suprapto | | 62 | | 2012 | | Commissioner | |
Gatot Trihargo | | 53 | | 2013 | | Commissioner | |
Johnny Swandi Sjam | | 53 | | 2011 | | Independent Commissioner | |
Virano Gazi Nasution | | 45 | | 2012 | | Independent Commissioner | |
Jusman Syafii DjamalHendri Saparini
Jusman Syafii Djamalassumed the role of President Commissioner in December 2014. Dr. Saparini founded the Center of Reform on Economics (CORE Indonesia) and has served asourPresident Commissioner since January 1, 2011.as its executive director from 2013. Currently, heshe also serves as President Commissioner (Independent) at PT Cardig Aero Services Tbk, as President Commissioner (Independent) at PT Toba Bara Sejahtera Tbk., asPresidentCommissioner (Independent) at PTMandala Airline Tbk, and as Chairman at Matsushita Gobel Foundation. Since May 20, 2011, he is by appointment of the President of the Republic of Indonesia, a member of the National Innovation Committee (a thinktank ofthePresident oftheRepublic Indonesia on Innovation Policy).Industry and Economics Committee(Komite Ekonomi dan Industri Nasional orKEIN) from2016 and as lecturer at the Institute of State Administration (Lembaga Administrasi Negara)from 2009. Previously Mr. Djamal wasDr. Saparini served as managing director (2005-2013) and researcher (1994-2013) at the Minister of TransportationECONIT Advisory Group. She has also served as budgetary consultant for the “Indonesia Bersatu Pertama” cabinet (2007-2009)Indonesian House of Representatives Secretariat General (2009-2012).Dr. Saparini holds a doctorate in international political economics and concurrently a membermaster degree in international policymanagementfrom Tsukuba University, Japan and a bachelor of the National Transportation Safety and Security Evaluation Team (2007) founded to evaluate and find the“root causes” of accidentsarts degree in Shipping/Marine, Railways and Highways transportation. He has vast experience in aircraft industry management due to exposures to a variety of strategic positions: as the President Director of PT Dirgantara Indonesia (2000-2002), as Director of Human Resources of PT IPTN (1999-2000), as Director of Helicopters, Defense Technology and Satellite (1996-1999), as Chairman of PT IPTN’s Restructuring Program Implementation team (1998-2001), and as Chief Project Engineer for N250 Development & Constructional Design (1989-1995). As a professionalaerodynamicsengineer with twenty years of experience in Computational Aerodynamics and Configuration Development, he holds, an Intellectual Property Right Patent No.ID 0 021 669 for electronic-based Flight Control Systems issued on August 15, 2008 together with the late Bambang Pamungkas. He was awarded the Nararya Dedicational Awardeconomics from the Republic of Indonesia on August 17, 1995.He is the co-author of Grand Techno Economic Strategy - Siasat Memicu Produktivitas (Mizan Publishers, 2009). He earned his Bachelor of Mechanical Engineering in Aeronautical Engineering from Institut Teknologi Bandung (1983).Gadjah Mada University, Yogyakarta.
Table of Content
Hadiyanto
Hadiyanto has served asourassumed the role of Commissioner sincein May 11, 2012. Currently, he also serves as Director GeneralasSecretaryGeneral of State Treasury at the Ministry of Finance of the Republic of Indonesia. HeFinancefrom 2015.Dr. Hadiyanto has assumed, among other positions, Director General for State Assets of the Ministry of Finance (2006-2016), Head of the Legal Bureau, SecretariatLegalBureau of theSecretariat General of the Ministry of Finance and was the AlternateFinance(2005-2006) andAlternate Executive Director at the World Bank in Washington D.C., US.(2003-2005). He was the Presidenthas also served asPresident Commissioner of PT Garuda Indonesia Tbk.(Persero) Tbk (2007-2012) and President Commissioner of PT Bank Export Indonesia (Persero) (also known as Indonesia Exim Bank) (2007-2009). He holds a Bachelor’sdoctorate in legal studies and a bachelor of law degree in Law from the University of Padjadjaran, Bandung and a Master of Law Degree (“LLM”)Laws from Harvard University Law School, USA, and a PhD.School.
Dolfie Othniel Fredric Palit assumed the role of Commissioner in Law from the University of Padjadjaran, Bandung.
Parikesit Suprapto
Parikesit SupraptoDecember 2014.Previously, Mr. Palit has served asour Commissioner since May 11, 2012. Previously he was the Deputy of Business Services at the Ministry of SOE (2010-2012), Deputy Head of Banking and Finance Industry at the Ministry of SOE (2008-2010) and Advisor to the Minister ofSOE for Small Business Sector (2006-2008). He was a Commissioner of PT Indosat Tbk (2011-2012) and a Commissioner of PT Bank Negara Indonesia (Persero) Tbk. He earned a Bachelor’s degree in Corporate Economics from Sekolah Tinggi ManajemenIndustri, Jakarta (1980), a Master’s degree in Economic Development from Indiana University, Indiana, USA (1990) and a PhD degree in DevelopmentEconomicsfrom the University of Notre Dame, Indiana, USA (1995).
Johnny Swandi Sjam
Johnny Swandi Sjam has served asourIndependent Commissioner since January 1, 2011. Currently he is also the Chairmanas Executive Director of the Standing CommitteeStrategic Consultancy Institute for Research on InfrastructurePolicy and Telecommunications ServicesRegional Autonomy (Lembaga Konsultan Strategis Riset Kebijakan dan Otonomi Daerah or REKODE) (2004-2009) and as Operational Director at Bumi Indonesia Hijau Foundation (2001-2003). Mr. Palit served as a member of the Indonesian ChamberHouse of CommerceRepresentatives (2009-2014), where he acted as member of the Special Committee for the Prevention and Industry (“KADIN”). He previously served, among other positions, as a Commissioner at PT Inti Limited (2010-2011),Combating Money Laundering, the President DirectorBank Century Supervisory Team, the Budget Committee of PT Indosat Tbk. (2007-2009), the DirectorHouse of PT Indosat Tbk. (2005-2007),Representatives and the President DirectorSpecial Committee of Satelindo (2002-2003),the Law on the Healthcare and several other important positions at subsidiaries of Indosat like Satelindo, Sisindosat and Intikom (1997-2002)Social Security Agency (Badan Penyelenggara Jaminan Sosial or BPJS). He holds a Diploma III in Computer Engineeringbachelor degree from the Bandung Institute of Technology, a Diploma IV from Sekolah Tinggi Manajemen Industri of the Department of Industry of Indonesia, a Bachelor’s degree in Informatics Management from Gunadarma University, Jakarta, and a Master’s degree in Business Policy and Administration from the University of Indonesia, Jakarta.
Virano Gazi Nasution
Virano Gazi Nasution has served asourIndependent Commissioner since May 11, 2012. He was previously the Commercial Director of PT Indonesia Comnet Plus, a subsidiary of PT PLN (Persero) (2009-2012), Advisor to the Minister of Communications and Informatics (2008-2009), and the President Director of PT Bakrie Telecom Tbk. (2001-2005). He earned his Master of Science degree in Engineering Economics from Stanford University, USA.
Gatot Trihargo
Gatot Trihargo,hasserved as a Commissioner since 19 April 2013. He currently serves as a Deputy of Services Business in the Ministry of State-Owned Enterprises of the Republic of Indonesia.He holds a degree in accounting from the State College of Accountancy, Jakartaand a Master's degree in Accountancy and Financial Information Systems from Cleveland State University in Ohio, USA. Gatot Trihargo was appointed as a members ofPlanning and Risk Evaluation and Monitoring Committee (“KEMPR”) based on the Decree of the Board of Commissioners No.05/KEP/DK/2013 dated May 14,2013 on the Membership Composition of thePlanning and Risk Evaluation and Monitoring Committee of Limited Liability Company (Persero) PT Telekomunikasi Indonesia, Tbk. As a member of KEMPR, Gatot Trihargo is responsible for monitoring and supervision ofRencana Jangka Panjang Perseroan (“RJPP”)/Corporate Strategic Scenario (“CSS”) implementations,Rencana Kerja dan Anggaran Perseroan (“RKAP”) implementations, and enterprise risk management implementations, as well as the development of non-organic business initiative implementations.Technology.
Our Board of Commissioners is assisted by a Board Secretary whose main function is to ensure that while performing its tasks, the Board of Commissioners complies with our Articles of Association as well as applicable laws and regulations. The Board of Commissioners’ office address is Grha Merah Putih Building, 5th Floor, Jl. Gatot Subroto Kav.52, Jakarta,12710, Indonesia.
Table of Content
Pontas Tambunanassumed the role ofCommissioner in April 2016. Currently, he also serves as Deputy for the Construction and Transportation Infrastructure and Facilities Business Sectors of the MSOE from 2015.Previously, he served asa commissioner of PT Pertamina EP (2015-2016) and served at the MSOE as First Assistant Deputy for the Infrastructure and Logistics Business Sectors (2010-2012) and Assistant Deputy for the Transportation Facilities Business Sector (2006-2010).In addition, Mr. Tambunan has served as finance director of PT Perkebunan Nusantara V (Persero) (2012-2015) and a commissioner of PT Wijaya Karya (Persero) Tbk (2007-2012), PT Pelabuhan Indonesia II (Persero) (2010-2012) and PT Sucofindo (Persero) (2010-2012). He holds a master degree in management from Gadjah Mada University, Yogyakarta and a bachelor degree in law from Tarumanegara University, Jakarta.
Margiyono Darsasumarjaassumed the role ofIndependentCommissioner in April 2016. He has served as coordinator of advocacy and partnership for government reform of the Bureaucracy Reform Project (2012-2015), a lecturer in law and media ethics at Ahmad Bakrie University (2012-2014) and a media development manager at Voice of Human Rights Media, a radio program in Indonesia (2001-2011). He holds a master of laws from the University of Leeds, England and a bachelor of law from the University of Indonesia.
Rinaldi Firmansyahassumed the role of Independent Commissioner in April 2015. Currently, he also serves asacommissioner at PT Elnusa Tbk from 2014 and PT Bluebird Tbk from 2013. Mr. Firmansyah also serves as an advisoryboardmember of Daestrum Capital from 2016 and as managing partner of Fidelitas Capital from 2015. Dr. Firmansyah served as a commissioner atIndosat(2015), our President Director (2007-2012) and our Director of Finance (2004-2007).He holds a doctorate in management from the University of Padjadjaran, Bandung, an MBA from the Indonesian Institute of Management Development (IPMI), Jakarta and a bachelor degree in electrical engineering from the Bandung Institute of Technology. Dr. Firmansyah is a Chartered Financial Analyst.
PamiyatiPamela Johanna Waluyoassumed the role of Independent Commissioner in April 2015. Previously, she has served as corporate marketing director of Obsession Media Group (2014-2015), assistantdirector of sales and marketing at PT Media Televisi Indonesia (the broadcaster of Metro TV) (2006-2014), andcorporate public relations professional at PT Media Televisi Indonesia and Media Group (2000-2006). She holds a master degree from the Delft UniversityofTechnology, the Netherlands and a bachelor degree from the Trisakti Business School, Jakarta.
Board of Directors
Our Board of Directors is responsible for our overall management and day-to-day operations under the supervision of the Board of Commissioners. The Board of Directors consists of eight members, including aincludinga President Director.
The following table sets forth the functions and authority of our Directors.
Role | | Functions and Authority | |
Director of Consumer Services | | 1.Responsible for the business strategy to drive disruptive competitive growth through winning competition and growing thefixed and consumer digital segment business portfolio. 2.Oversees our parenting strategy by implementing strategic control, coordination and subsidiary performance management over the consumer customer facing unit, in order to create company value through optimizing and harmonizing relations between our Company and our subsidiaries and managing the operations of subsidiaries under the consumer customer facing unit. | |
Director of Enterprise and Business Service | | 1.Responsible for the business strategy to drive disruptive competitive growth through winning competition and growing theenterprise digitalsegment business portfolio (enterprise, government and business). 2.Oversees our parenting strategy by implementing strategic control, coordination and subsidiary performance management over the enterprise customer facing unit, in order to create company value through optimizing and harmonizing relations between our Company and our subsidiaries and managing the operations of subsidiaries under the enterprise customer facing unit. | |
Table of Content
Role | | Functions and Authority | |
Director of Wholesale and International Services | | 1.Responsible for the business strategy to drive disruptive competitive growth through winning competitions and growing the wholesale and international segment business portfolio. 2.Oversees our parenting strategy by implementing strategic control, coordination and subsidiary performance management over the wholesale and international customer facing unit, in order to create company value through optimizing and harmonizing relations between our Company and our subsidiaries and managing the operations of subsidiaries under the wholesale and international customer facing unit. | |
Director of Network, IT and Solution | | 1.Responsible for the business strategy to leverage our existing resources in order to develop and exploit our established businesses and services by utilizing infrastructure, IT and solutions to support our business portfolio synergistically. 2.Oversees our parenting strategy over the network, IT and solutions functionalunitin order to create company value through optimizing and harmonizing the functional management of network, IT and solutions within our Group. | |
Director of Digital and Strategic Portfolio | | 1.Responsible for (i) distributing corporate strategy, including directional strategy, portfolio strategy and parenting strategy, (ii) exploring new sources of growth through collaboration, acquisition and synergy and (iii) developing a strategy for innovation in order to optimize business exploration in digital services. 2.Oversees our parenting strategy over the digital strategic portfolio functional unit in order to create company value through optimizing and harmonizing the management of strategy and business development within our Group 3.Oversees our parenting strategy by implementing strategic control, coordination and subsidiary performance management over the digital services customer facing unit, in order to create company value through optimizing and harmonizing relations between our Company and our subsidiaries and managing the operations of subsidiaries under the digital services customer facing unit. | |
Director of Finance | | 1.Responsible for distributing corporate strategy, including portfolio strategy and parenting strategy with regard to financial operations and procurement in order to encourage optimal financial performance, procurement and assets growth, and drive disruptive competitive growth within our Group. 2.Oversees our parenting strategy by implementing strategic control, coordination and subsidiary performance management over the finance functional unit, in order to create company value through optimizing and harmonizing relations between our Company and our subsidiaries and managing the operations of subsidiaries under the finance functional unit. | |
Director of Human Capital Management | | 1.Responsible for distributing corporate strategy, including directional strategy, portfolio strategy and parenting strategy on aspects related to the development of human capital, employee organization, corporate culture, leadership architecture and industrial relations. 2.Oversees human capital management within the Telkom Group and supervises the Pension Fund and Telkom Foundation (Yayasan Telkom) by implementing strategic control, coordination and foundation performance management in order to create Company value through optimizing and harmonizing relations between our Company and our subsidiaries and managing the operations of subsidiaries under the human capital management functional unit. | |
Table of Content
As DecemberofDecember 31, 2013,2016, the Board of Directors consisted of eightofseven members as listed below:below :
Name | | Age | | Date of Birth | | Director Since | | Position | |
Alex J. Sinaga | | 55 | | September 27, 1961 | | 2014 | | President Director(1) | |
Harry M. Zen | | 48 | | January 9, 1969 | | 2016 | | Director of Finance(2) | |
Indra Utoyo | | 55 | | February 17, 1962 | | 2007 | | Director of Digitaland Strategic Portfolio | |
Abdus Somad Arief | | 53 | | September 25, 1963 | | 2014 | | Director of Network, ITand Solution | |
Herdy Rosadi Harman | | 53 | | June 28, 1963 | | 2014 | | Director of Human Capital Management | |
Dian Rachmawan | | 52 | | May 14, 1964 | | 2014 | | Director of Consumer Services | |
Honesti Basyir | | 48 | | June 24, 1968 | | 2012 | | Director of Wholesaleand International Services and Acting Director of Enterpriseand Business Service | |
(1) This position is of the same level as Chief Executive Officer (“CEO”).
(2) This position isof the same level as Chief Financial Officer (“CFO”).
Name | | Age | | Director Since | | Position | |
Arief Yahya | | 52 | | 2012 | | President Director (CEO) | |
Honesti Basyir | | 45 | | 2012 | | Director of Finance (CFO) | |
Indra Utoyo | | 51 | | 2007 | | Director of Innovation & Strategic Portfolio (ISP) | |
Sukardi Silalahi | | 48 | | 2012 | | Director of Consumer Service (CONS) | |
Muhammad Awaluddin | | 45 | | 2012 | | Director of Enterprise & Business Service (EBIS) | |
Rizkan Chandra | | 44 | | 2012 | | Director of Network IT & Solution (NITS) | |
Priyantono Rudito | | 46 | | 2012 | | Director of Human Capital Management (HCM) | |
Ririek Adriansyah | | 50 | | 2012 | | Director of Wholesale & International Service (WINS) | |
Each of our Directors was a citizen and domiciled in Indonesia as of December 31, 2016. In accordance with Listing Regulation No.IA in KEP.00001/BEI/01-2014 issued by the IDX (“IDX Regulation I-A”), the board of directors of a listed company must consist of at least one independent director. We have appointed Honesti Basyir as our Independent Director.
Set forth below is a brief biography of each of our Directors:
Arief YahyaAlex J. Sinaga
Arief Yahya has servedasour assumed the role of President Director since May 11, 2012. Concurrently,in December 2014.Currently, he also serves as President Commissioner of Telkomsel from 2014. Mr. Sinaga started his career with our subsidiary. Company in 1987. He has served as President Director of Telkomsel (2012-2014), President Director ofTelkomMetra (2007-2012), Executive General Manager of our Enterprise Services Division (2005-2007), Executive General Manager of our Fixed Wireless Division (2002-2005), Senior Manager of Business Performance for Telkom's Regional Division II Jakarta (2002) and General Manager of Telkom West Jakarta Branch Office (2000-2002). Prior to that, Mr. Sinaga served as General Manager at the West Surabaya Branch Office (1998-1999) and Malang Branch Office (1997-1998).He is currently the Chairman of the Indonesian Cellular Telecommunication Association (ATSI) and is an executive member of the Indonesia Chamber of Commerce (KADIN) for England and Europe for the information, communication and technology sector.Mr. Sinaga holds a master degree in telematics from the University of Surrey, England and a bachelor degree inelectrical engineering from the Bandung Institute of Technology.
Harry M. Zenassumed the role of Director of Finance in April 2016. Currently, he also serves as President Commissioner ofTelkom Propertyfrom2016and as a commissioner ofTelkomsel from2016.Prior to his appointment as our Director, Mr. Zen served as President Director of PT Credit Suisse Securities Indonesia (2008-2015), Director of Barclays Capital (2007-2008) and co-head of investment banking at PT Bahana Securities (2001-2008). Mr. Zen holds an MBA from the State University of New York at Buffalo and a bachelor degree in metallurgical engineering from the University of Indonesia.
Indra Utoyo assumed the role of Director ofDigital and Strategic Portfolio in April 2012.Currently, he led a career withalso serves as President Commissioner of PT Metra Digital Investama (our venture capital fund which is also known as MDI Ventures) from2016 and Commissioner of Telkom Metra from2015.He joined our Company in 1986 and has held various other positions including Director of Information Technology Solution and Supply (2007-2012) andSenior General Manager of our Information System Center (2005-2007). Mr. Utoyo holds a master degree in communication and signal processing from Imperial College, London and a bachelor degree in electrical telecommunications engineering from the Bandung Institute of Technology.
Abdus Somad Arief assumed the role of Director of Network,IT and Solution in December 2014.Currently, he also serves as President Commissioner of Telkominfra from2015and Commissioner of PT TeltraNet Aplikasi Solusifrom2015. Mr. Arief started hiscareer with our Company in 1992. He has served as Director of Network at Telkomsel (2012-2014)and Executive General Manager for our Enterprise Services Division (2009-2012), Vice-President of Business Development for our Enterprise and Wholesale Directorate (2008-2009) and Deputy Executive General Manager ofour Enterprise Services Division (2007-2008).In addition, Mr. Arief has servedas President Commissioner of PT Pramindo Ikat Nusantara (which has changed its name to PINS) (2011-2012) and as aCommissioner of PT Infomedia Nusantara(2010-2011). Mr. Arief holds a master degree in information and technology systems and a bachelor degree in electrical engineering from the Bandung Institute of Technology.
Table of Content
Herdy Rosadi Harman assumed the role of Director of Human Capital Management in December 2014. Currently, he also serves as Commissioner of Telkom Propertyfrom2015 and as the President Commissioner ofPT Infomedia Nusantarafrom 2016. Mr. Harman started his career with our Company in 1987.Prior to his appointment as our Director, Mr. Harman served as Director of Human Capital Management at Telkomsel (2012-2014), Vice-President of Regulatory Management at our Company (2007-2012) and Vice-President of Legal & Wholesale (2005-2012)Compliance at our Company (2006-2007). He has also served as our Company's General Manager for Management Support (2004-2006). Mr. Harman holds a Master of Laws from Washington College of Law, at the American University,Washington D.C.,an MBAfrom the Asian Institute of Management, Philippines, and theBandung Institute of Management (now known as Telkom University) and a bachelor of law degree fromtheUniversity of Padjadjaran, Bandung.
Dian Rachmawan assumed the role of Director of Consumer Services in December 2014. Currently, he also serves as President Commissioner of Telkom Akses from 2015. Mr. Rachmawan started his career with our Company in 1989. He has served as CEO of Telin Hong Kong (2011-2014), Head ofDirector ofNetwork Operation & Engineering at Telin (2007-2011) and Executive General Manager for Fixed Wireless Network Division at our Company (2005-2007). Previously, Mr. Rachmawan served as our Company's General Manager for South Jakarta Branch Office (2004-2005), General Manager for Interconnection & Partnership for Regional Division V East Java (2004-2005)II Jakarta (2001-2004) and Head of Regional Division VI Kalimantan (2003-2004)Assistant Vice President for Interconnection Planning at our headquarters (2000-2001). HeMr.Rachmawan holds a Bachelor’smaster degree in Electrical Engineeringtelecommunications engineeringand a master of science in communication and real time systems from Institut Teknologi Bandung (1986)Bradford University, England and a Master’sbachelor degree in Telematics from Universityinelectronicand telecommunication engineering fromSurabaya Institute of Surrey, UK (1994).Technology.
Honesti Basyir
Honesti Basyirhas assumed the role of Director of Wholesaleand International Services in December 2014 before which he served asourDirector of Finance since May 11, 2012. Prior to his appointment as our Director of Finance from May 2012.Currently,he hasalso serves asour Acting Director of Enterprise & Business Service from September 13, 2016,President Commissioner ofTelinfrom2015andPresidentCommissioner ofTelkom Metrafrom2016. Mr. Basyirstarted his career with our Company in 1994 andhas held a number of key positions with Telkom,within our Company, including Vice President (“VP”)forStrategic Business Development at ITSS Directorate (2012), VPVice-President for Strategic Business Development at SICP (2010-2012)theIT, Solution & Strategic Portfolio Directorate (2012), Vice-President for Strategic Business Development atthe Strategic Investment & Corporate Planning Unit (2010-2011), Project Controller (Level 1) of Project Management Office (2009-2010) and Assistant Vice President (“AVP”)forBusinessVice-President for Business & Finance Analysis at the Strategic Investment & Corporate Planning Unit (2006-2009). He.He holds a Bachelor’smaster degree in Industrial Technologycorporate finance from Institut Teknologithe Bandung (1992)Instituteof Management (now known as Telkom University), and a Master’sbachelor degree in Corporate Financeindustrial engineering from Sekolah Tinggi Manajementhe Bandung (2004).Institute of Technology.
Other than as provided for under our Articles of Association, none of our Commissioners or Directors has any arrangement or understanding with any major shareholder, customer, supplier or with us pursuant to which such person was selected as a Commissioner or Director, nor are any such arrangements, understanding or contracts proposed or under consideration. There is no family relationship between or among any of the Commissioners or Directors listed above. The business address of our Commissioners and Directors isJl. Japati No.1, Bandung,40133, Indonesia.
Indra UtoyoB.COMPENSATION
Indra Utoyohas served asour Director ofInnovation & Strategic Portfolio (“ISP”) sinceFebruary 28, 2007.He joined Telkomin 1986and has held a variety of positions. Prior to his appointment as Director of ISP he served as Director of Information Technology Solution & Supply (2007-2012). He holds a Bachelor’s degree in Electrical Engineering from Institut Teknologi Bandung (1985) and a Master’s degree in Communication & Signal Processing from Imperial College, UK (1994).
Sukardi SilalahiCompensation
Sukardi Silalahihas servedasour Director of ConsumerServicesince May 11, 2012. He joined Telkomin 1991 and, prior to his appointment as Director of Consumer Service, he servedin of Commissionersa variety of positions, including Executive General Manager (“EGM”) of Eastern Consumer Service Division (2011-2012), Deputy EGM of Western Consumer Service Division (2010-2011), EGM of Regional Division VI Kalimantan (2008-2010) and Deputy EGM of Fixed Wireless Network Division (2007-2008). He holds a Bachelor’s degree in Civil Engineering from Institut Teknologi Bandung (1989).
Muhammad Awaluddinnd Directors
Muhammad Awaluddin has served asour Director of Enterprise &Business Service (“EBIS”) since May 11, 2012. Concurrently, he also serves as President Commissioner of Infomedia, our indirect subsidiary. Prior to his appointment as Director of EBIS, he served, among other positions, as President Director of Infomedia (2010-2012), EGM of Access Network Division (2010) and EGM of Regional Division I Sumatra (2007-2010). He holds a Bachelor’s degree in Electrical Engineering from Universitas Sriwijaya, Palembang (1990) and a Master’s degree in Business Administration from the European University, Antwerp, Belgium (1998).
Table of Content
Rizkan Chandra
Rizkan Chandra has served asour Director of Network IT & Solution (“NITS”) since May 11, 2012. Concurrently, he also serves as Commissionerof Telkomsel, our subsidiary, and as Commissioner at Metranet, our indirect subsidiary. Prior to his appointment as Director of NITS, among other positions, he served as President Director of Sigma,our indirect subsidiary (2010-2012), Senior General Manager (“SGM”) of Telkom Learning Center (2008-2010) and VPforInfrastructure & Service Planning, Telkom (2007-2008). He holds a Bachelor’s degree in Informatics from Institut Teknologi Bandung (1992) and a Master’s degree in Management of Technology fromtheNational University of Singapore (2000).
Priyantono Rudito
Priyantono Ruditohas served asour Director of HumanCapitalManagement (“HCM”) since May 11, 2012. Concurrently, he also serves as Commissioner of Telkomsel, our subsidiary.Since he joined Telkomin 1991, he has served in a number of positions, including as VPforCorporate Strategic Planning (2011-2012) and VP for Marketing & Consumer Care (2007-2011). He holds a Bachelor’s degree in Industrial Engineering from Institut Teknologi Bandung (1991) and a Master’s degree in Business (Marketing)(1997)and a Doctoral degree in Management (2011) fromtheRoyal Melbourne Institute of Technology, Australia.
Ririek Adriansyah
Ririek Adriansyahhas served asourDirector ofWholesale & International Service (“WINS”) since May 11, 2012. Concurrently, he also serves as President Commissioner of TII, our subsidiary. Hejoined Telkomin 1990 and, prior to his appointment as Director of WINS, served as, among other positions, President Director of TII, our subsidiary (2011-2012), Director of Marketing & Sales, TII (2010-2011), Director of International Carrier Service, TII (2008-2010) and Deputy EGM of Infratel Division, Telkom (2004-2008). He holds a Bachelor’s degree in Electrical Engineering from Institut Teknologi Bandung (1989).
B. COMPENSATION
Compensation of Commissioners and Directors are determined by the shareholders at the GMS, who grant authority and authorization to the Board of Commissioners, with prior approval fromthe holder of theDwiwarna Share, to decide on the amount of tantiem which will be given to the members of Board of Director and Board of Commissioners for the 2016 financial year and also as to the amount of the salary orhonorarium, including facilities and allowances for the members of Board of Directors and Board of Commissioners for the 2016 financial year. The Nomination and Remuneration Committee is responsible for formulating the honorarium of our Commissioners and Directors, which is further discussed in a joint meeting of our Board of Directors and Board of Commissioners for approval.
Each Commissioner is entitled to monthly remuneration and benefits. They are also entitled to bonuses based on our business performance and achievements, which amount is determined by shareholders at the GMS. Commissioners are also entitled to a lump sum allowance upon resignation.
achievements.
Each Director is entitled to a remuneration consisting of a monthly salary and other allowances (including retirement benefit).allowances. Directors also receive an annual bonus based on our business performance and achievements, which amount is determined by shareholders at the GMS.achievements. The bonus and incentive are budgeted every year based on recommendations ofa formula prepared by the DirectorsNomination and Remuneration Committee and confirmation from the Board of Commissioners before being considered by shareholders at the GMS.
The Nomination and Remuneration Committee is responsible for formulating the Commissioners’ and Directors’ salaries, which is further discussed in a joint meeting of our Board of Directors and Board of Commissioners for approval. The agreed formula is then submitted to the shareholders at the AGMS for consideration and approval.
The procedure for determining remuneration of our Board of Commissioners is as follows:
-The Board of Commissioners requests the Nomination and Remuneration Committee to formulate a proposal for the remuneration of the Board of Commissioners;
-The Nomination and Remuneration Committee requests an independent party to formulate the framework for the remuneration of the Board of Commissioners;
-The Nomination and Remuneration Committee proposes the remuneration framework to the Board of Commissioners;
-The Board of Commissioners proposes the remuneration for the members of the Board of Commissioners to the GMS; and
-The GMS determines the remuneration for the members of the Board of Commissioners.
Table of Content
Bonus and incentives are budgeted every year based on recommendations of the Board of Directors and confirmation from the Board of Commissioners before being considered by the shareholders at the AGMS. The Nomination and Remuneration Committee is responsible for formulating proposed formulae for the salaries of the Board of Directors’ which are further discussed during a joint meeting Board of Directors and Board of Commissioners for approval. The approved formula is then proposed in GMS for final approval. The performance of the Board of Directors and other management is measured through effective performance evaluations, which are conducted comprehensively, systematically and periodically inIn accordance with a decreeregulations relating to SOEs in Indonesia, all of the Board of Commissioners. The criteria used in the assessment on the performance of Board of Directors is based on the balanced scorecard method measuring four main aspects, namely Financial, Customer, Internal Business Process, and Learning and Growth, each comprising three key performance indicators (“KPI”): Shared KPI, Common KPI and Specific KPI. Shared KPIs are the same in name, target, realization and achievement for all the Board of Directors. Common KPIs have the same name and target, but specify different realization and achievement for each of the Directors. Specific KPIs are different for each of the Directors and represent specific programs as the primary duty and priority for each of the Directors and its Directorate.
The net amount of remuneration paid to our Commissioners and Directors are entitled to post-employment benefits, including an insurance scheme into which we are required to contribute up to 25% of the salary of our Commissioners and Directors. There are no service contracts providing for benefits to be provided for our Directors or Commissioners upon their termination as Directors or Commissioners. We also provide our Commissioners and Directors with long-term incentives in the form ofsharesor for our Independent Commissioners in the form of cash.
We budgeted incentives for the current year ended December 31, 2013, including basic compensation (honorarium), bonusbut will be distribute such incentives in the following year after the publication of our audited financial statements and otherhaving the approval in a GMS. We only distribute cash incentives if we achieve certain performance targets.
For 2016, the total remuneration paid to the entire Board of Commissioners was Rp164 billion (US$20million). There is no management pension plans or contingent compensationRp58.8billion. Taxes from remuneration borne by our Company amounted to Rp4.3 billion. The table below sets forth the remuneration that our Commissioners received in place.2016:
Board ofCommissioners | | Honorarium and Allowance | | Tantiem,THR(1), Long-term Incentives and Post-employment Benefit | | Total | |
| (Rp million) | |
Hendri Saparini | | 1,244 | | 7,889 | | 9,133 | |
Dolfie Othniel Fredric Palit | | 1,120 | | 7,100 | | 8,220 | |
Hadiyanto | | 1,120 | | 7,100 | | 8,220 | |
Pontas Tambunan(2) | | 774 | | 71 | | 845 | |
Margiono Darsasumarja | | 1,120 | | 5,040 | | 6,160 | |
Rinaldi Firmansyah | | 1,120 | | 5,040 | | 6,160 | |
Pamiyati Pamela Johanna Waluyo | | 1,120 | | 5,040 | | 6,160 | |
Parikesit Suprapto(3) | | 346 | | 7,889 | | 8,235 | |
Imam Apriyanto Putro(4) | | - | | 1,904 | | 1,904 | |
Johny Swandi Sjam(4) | | - | | 1,904 | | 1,904 | |
Virano Gazi Nasution(4) | | - | | 1,904 | | 1,904 | |
Note (1) “THR” refers totunjangan hari raya or religious holiday allowance. (2) Since the AGMS on April 22, 2016. (3) Up to the AGMS on April 22, 2016. (4) Up to the AGMS on April 17, 2015. | |
For 2016, the total remuneration of the entire Board of Directors was Rp121.6 billion. Taxes from remuneration borne byourCompany amounted to Rp7.6 billion.The table below sets forth theremunerations thatour Directors receivedin2016:
Board of Directors | | Honorarium | | TantiemandTHR(1) | | Allowance | | Total | |
| (Rp million) | |
Alex J. Sinaga | | 2,304 | | 14,128 | | 300 | | 16,732 | |
Harry M. Zen(2) | | 1,434 | | 158 | | 208 | | 1,800 | |
Indra Utoyo | | 2,074 | | 12,715 | | 300 | | 15,089 | |
Dian Rachmawan | | 2,074 | | 12,597 | | 300 | | 14,971 | |
Abdus Somad Arief | | 2,074 | | 12,715 | | 300 | | 15,089 | |
Herdy Rosadi Harman | | 2,074 | | 12,715 | | 300 | | 15,089 | |
Honesti Basyir | | 2,074 | | 12,715 | | 300 | | 15,089 | |
Heri Sunaryadi(3) | | 634 | | 12,557 | | 100 | | 13,291 | |
Muhammad Awaluddin(4) | | 1,555 | | 12,715 | | 225 | | 14,495 | |
Note (1) “THR” refers totunjangan hari raya or religious holiday allowance. (2) Since the AGMS on April 22, 2016. (3) Up to the AGMS on April 22, 2016. (4) Up to September 2016. | |
Thetotal accrued remuneration of Board of Commissioners and Directors for 2016 was Rp524 billion, consisting of long-term incentives and tantiem.
Table of Content
C.BOARD PRACTICES
Our Board of Commissioners acts as our overall supervisory and monitoring body with principal functions including planning and development, operations and budgeting in compliance with our Articles of Association, and to carry out the mandate and resolutions of the AGMS and EGMS. The Board of Commissioners does not have the authority to run or manage our Company, except in the exceptional situation ofwhen all members of the Board of Directors having beenare suspended for any reason. The Board of Commissioners provides advice and opinions to the AGMS with respect to financial reporting, business development, appointment of auditors, and other important and strategic matters related to corporate actions. The Board of Commissioners also reviews our work plan and budget, keeps abreast of our progress, and in case our Company gives an indication of slowing-down,any decline in the growth of our business immediately requests the Board of Directors to notify the shareholders and provides recommendations on measures for mitigation. Finally, the Board of Commissioners ensures that our corporate governance program is properly applied and maintained according toin accordance with the applicable regulations.
The Board of Commissioners is obliged to carry out its duties and responsibilities according toin accordance with our Articles of Association, decisions from themade during any AGMS and EGMS and applicable laws and regulations.
The Board of Commissioners is assisted by a Board of Commissioners Secretary as well as the Audit Committee, the Nomination and Remuneration Committee and the Planning and Risk Evaluation and Monitoring Committee. As necessary, the Board of Commissioners seeksmay seek assistance from professional advisors.
Meetings of the Board of Commissioners are held at least once a month at any time deemed necessary by one or more members of the Board of Commissioners, or at the request of the Board of Directors, or at the written request of one or more shareholders holding at least one-tenth of our outstanding shares of common stock. The Board of Commissioners must hold joint meetings with the Board of Directors at least once every four months. Decisions at Board of Commissioners meetings are taken through a process of deliberation and consensus. If a consensus cannot be reached, decisions are based on a majority vote of the Commissioners in attendance or who are represented at the meeting. In the event of a tie, the proposal in question mustproposed resolution will be rejected.decided by the Commissioner who chairs such Board of Commissioners meeting. The quorum for all Board of Commissioners meetings isrequires attendance in person, through video conference, or by proxy granted to another Commissioner, of Commissioners representing more than one-half of the total number of Commissioners then represented in person or by proxy granted to another Commissioner at such meeting.Commissioners.
OurThe Board of Directors is generally responsible for managing our business in accordance with applicable laws, our Articles of Association and the policies and directives issued by the GMS and the Board of Commissioners. The Board of Directors also has the right to act for and on our behalf, inside or outside a court of law, on any matter and for any event, with another party.
Meetings of the Board of Directors may be convened at any time deemed necessary or at the request of one or more members of the Board of Directors, or at the request of the Board of DirectorsCommissioners or upon a written request from one or more shareholders representing one-tenth or more of the total number of outstanding shares of common stock.
Meetings of the Board of Directors are chaired by the President Director. In the event that the President Director is unavailable or absent for any reason, the meeting will be chaired by a member of the Board of Directors appointed in the meeting.chairedbyanother Director.
Table of Content
The decisions of theDecisions at Board of Directors meetings shallare taken through a process of deliberation and consensus. If consensus cannot be reached, by consensus through deliberation. If this method fails, the decision shall be passed by votingdecisions are based on a majority vote of the majority votes by Board of Director members castDirectors in attendance at the meeting. A quorum is reached atIn the event of a meeting where more than half oftie, the members of theproposed resolution will be decided by a Director who chairs such Board of Directors are presentmeeting. The quorum for all Board of Directors meeting requires attendance in person, or represented legallythrough video conference or by proxy in the meeting. Each membergranted to another Director, of Directors representing more than one-half of the Boardtotal number of DirectorsDirectors. Each Director who is present at thea Board of Directors meeting shall beis entitled to cast one vote (and one vote for each other member of the Board of Directors whom he represents)Director represented by proxy).
Individual Directors are charged with specific responsibilities.responsibilities.For more detailed information regarding the functions and authority of each of our Directors, see "— Directors and Senior Management — Board of Directors".
Table of Content
Audit Committee
The Audit Committee operates under the authority of the Audit Committee Charter, which was promulgated byadopted under a Decree of the Board of Commissioners.Commissioners No.07/KEP/DK/2013 dated July 23, 2013 in relation to the Charter of the Telkom Group Audit Committee. The Audit Committee Charter is regularly evaluated and, if necessary, amended to ensure compliance with OJK and SEC requirements and other relevant regulations. The Audit Committee charter was stipulated by the Board of Commissioners’ Decree No.11/KEP/DK/2011 dated November 30, 2011 regarding the Charter of the Telkom Group Audit Committee. In 2013,2016, no changes were made to regulations related to our Audit Committee that would require us to amend our Audit Committee Charter.
The Audit Committee Charter outlines the Audit Committee’s purpose, function and responsibilities. It provides that the Audit Committee is responsible for:for, among others:
-· Overseeingoverseeing our financial reporting process on behalf of the Board of Commissioners;
-· Providingproviding recommendations to the Board of Commissioners regarding the selection of our external auditor, subject to shareholder approval;
-· Discussingdiscussing with our internal and external auditors on the overall scope and plans of their respective audits;
-· Reviewingreviewing our Consolidated Financial Statementsconsolidated financial statements and the effectiveness of Internal Controls Over Financial Reporting (“ICOFR”)internal controls over financial reporting (ICOFR);
-· Conveningconvening regular meetings with internal and external auditors, without the presence of management, to discuss the results of their evaluation and audit of our internal controls as well as the overall quality of our financial reporting;
·providing independent advice in cases where difference of opinion exists between management and our independent auditors;
·monitoring the steps taken by Directors to follow up on the findings of our internal auditors; and
-· Carryingcarrying out additional tasks that are assigned by the Board of Commissioners, especially on financial and accounting related matters as well as other obligations required by the Sarbanes OxleySarbanes-Oxley Act of 2002.
The Audit Committee may engage an independent consultant or other professional advisersadvisors to assist in carrying out its functions. In addition, the Audit Committee receives and handles complaints.
Audit Committee Independence
Bapepam-LK
OJK Rule No.55/POJK.04/2015 on Establishment and Code of Conduct for Audit Committees (the "OJK Audit Committee RulesRegulation") and IDX Regulation No.1-A require that the board of commissioners of a public company which is listed on the IDX (such as our Company) to establish an audit committee which is chaired by an independent commissioner. In addition, the OJK Audit Committee consistRegulation requires each member of such audit committee to be either an independent commissioner or external independent member, with the audit committee comprised of at least three members with at least one of whom must be an Independent Commissioner who servesindependent commissioner presiding over the audit committee as chairman while the other two members must be independent. Atand one external independent member and at least one member of these two members mustthe audit committee having expertise in accounting or finance. We also require at least one external independent member to have expert knowledge (in the context of Item 16A of Form 20-F) in the field of accountancyaccounting or finance.
In order to be considered independent under the prevailing Indonesian rules, the external members of the Audit Committee:audit committee may not:
-· May not be an executive officer of a public accountant firm that has provided audit or non-audit services to us within the six months prior to his or her appointment as an Audit Committeeaudit committee member;
-· May not have been our executive officer within the six months prior to his or her appointment as an Audit Committeeaudit committee member;
-· May not be affiliated with our majority shareholder;
-· May not have a family relationship with any member of the Boardboard of Commissionerscommissioners or Boardboard of Directors;directors;
Table of Content
-· May not own, directly or indirectly, any of our shares; and
-· May not have any business relationship that relates to our businesses.
Currently, the Audit Committee consists offiveof six members: (i) Johnny Swandi SjamRinaldi Firmansyah (Independent Commissioner and Chairman)Chairman of the Audit Committee); (ii) Agus Yulianto (Secretary)Tjatur Purwadi (Secretary of the Audit Committee and external independent member); (iii) Virano Gazi NasutionMargiyono Darsasumarja (Independent Commissioner); (iv) Parikesit Suprapto (Commissioner)Dolfie Othniel Fredric Palit (Commissioner and non-voting member); (v) Sahat Pardede.
Pontas Tambunan (Commissioner and non-voting member); and (vi) Sarimin Mietra Sardi (external independent member).
Audit Committee Financial Expert
See Item 16A “Audit Committee Financial Expert”.
Exemption from USFrom U.S. Listing Standards forFor Audit Committees
See Item 16D “Exemptions from the Listing Standards for Audit Committees”.
Table of Content
Nomination and Remuneration Committee
Our Nomination and Remuneration Committee was formed pursuant to Board of Commissioner’s decree No.003/No.6/KEP/DK/20052016 dated April 21, 200525, 2016 regarding the Establishment of the Nomination and Remuneration Committee.
The objective of the Nomination and Remuneration Committee is to establish, administer and enforce corporate governance principles in the process of nomination for strategic management positions and the determination of the Board of Directors’ remuneration. The duties of the Nomination and Remuneration Committee are to:include the following:
-· Deviseto devise a nomination and selection system for strategic positions within Telkom,our Company by, referring to corporate governance principles, such as transparency, accountability, responsibility, fairness and independence;
-· Assistto assist the Board of Commissioners who are engaged with the Directors in selecting candidates for strategic positions in Telkomour Company (i.e. positions which are one level under the Directorsdirectorships of our Company) and similarly for Directorsdirectors and Commissionerscommissioners of aany consolidated subsidiary that contributes 30% or more of our consolidated revenue, such as Telkomsel). Exclusively forFor Telkomsel, the Nomination and Remuneration Committee’s recommendation would be passed on to the holder of the Series A Dwiwarna share;Share; and
-· Formulateto formulate a remuneration system for Directors based on fairness and performance.
As of December 31, 2013,Currently, the members of our Nomination and Remuneration Committee were Jusman Syafii Djamal (Presidentare Margiyono Darsasumarja (Independent Commissioner and Chairman of the Nomination and Remuneration Committee), Pontas Tambunan (Commissioner), Hadiyanto (Commissioner), Dolfie OthnielFredricPalit (Commissioner), Rinaldi Firmansyah (Independent Commissioner), Hadiyanto, Parikesit Suprapto, Johnny Swandi Sjam, Virano Gazi NasutionPamiyati Pamela Johanna Waluyo (Independent Commissioner) and Yuki Indrayadi.Ario Guntoro (Secretary of the Board of Commissioner). To maintain independence in the execution of their tasks, members of the Nomination and Remuneration Committee have no relationship, either directly or indirectly, with us. There are no service contracts or benefits to be provided for Board of Directors of our Company or subsidiaries upon their termination as Board of Directors.
D.EMPLOYEES
We had a total of25,011employeesof 23,876 employees as of December 31, 2013,2016, consisting of17,881of 14,933 Telkom employees and 7,130employeesof8,943 employees of our subsidiaries. This figure represents adecrease 2.6%represented a decrease of 909 employees compared to the positionour total number of employees as of December 31,2012, reflecting the continued implementation of31, 2015, due to an increased participation by our multi exit program initiatedemployees in 2002which aims to improve efficiency.our early retirement program. See “—Retirement Program”.
The following isour employee profile by position, educational background and age group.
Position | | 2013 | |
| Telkom | | Subsidiaries | | Telkom Group | | Percentage (%) | |
Senior Management | | 135 | | 306 | | 441 | | 1.8 | |
Middle Management | | 2,711 | | 1,276 | | 3,987 | | 15.9 | |
Supervisors | | 9,936 | | 2,095 | | 12,031 | | 48.1 | |
Others | | 5,099 | | 3,453 | | 8,552 | | 34.2 | |
Total | | 17,881 | | 7,130 | | 25,011 | | 100 | |
As of December 31, 2013, 25.2%2016, we had 620 senior management employees, compared with 608 senior management employees as of December 31, 2015. Total middle management employees increased from 4,651 employees as of December 31, 2015 to 5,290 employees as of December 31, 2016. Supervisor level employees decreased from 13,017 employees as of December 31, 2015 to 12,044 employees as of December 31, 2016. Other employees decreased from 6,509 employees as of December 31, 2015 to 5,922 employees as of December 31, 2016. We did not employ a significant number of temporary employees in 2016. The following table shows our employee profile by position.
Table of Content
Position | | As of December 31, 2016 | |
| Telkom | | Subsidiaries | | Telkom Group | | Percentage (%) | |
Senior Management | | 207 | | 413 | | 620 | | 2.6 | |
Middle Management | | 3,856 | | 1,434 | | 5,290 | | 22.2 | |
Supervisors | | 8,917 | | 3,127 | | 12,044 | | 50.4 | |
Others | | 1,953 | | 3,969 | | 5,922 | | 24.8 | |
Total | | 14,933 | | 8,943 | | 23,876 | | 100.0 | |
Our employee profile based on educational background as of December 31, 2016 was dominated by university graduates which accounted for 51.6% of our employees did not have a tertiary education (pre university), compared to45.0% who had graduated university.total employees. This reflects our focus to recruit highly educated candidates with the right qualifications to support our growth. The following table shows our employee profile by educational background.
Level of Education | | 2013 | | | As of December 31, 2016 | |
| Telkom | | Subsidiaries | | Telkom Group | | Percentage (%) | | | Telkom | | Subsidiaries | | Telkom Group | | Percentage (%) | |
Pre University | | 5,632 | | 665 | | 6,297 | | 25.2 | | | 3,834 | | 689 | | 4,523 | | 18.9 | |
Diploma Graduates | | 4,260 | | 974 | | 5,234 | | 20.9 | | | 3,217 | | 1,261 | | 4,478 | | 18.8 | |
University Graduates | | 6,262 | | 5,002 | | 11,264 | | 45.0 | | | 5,987 | | 6,337 | | 12,324 | | 51.6 | |
Post Graduates | | 1,727 | | 489 | | 2,216 | | 8.9 | | | 1,895 | | 656 | | 2,551 | | 10.7 | |
Total | | 17,881 | | 7,130 | | 25,011 | | 100 | | | 14,933 | | 8,943 | | 23,876 | | 100.0 | |
Table of Content
As of December 31, 2013, employees over the age of 45 continued to dominate our workforce, comprising65.7%2016, 23,793 of our total employees followed by employees in the 31 to 45 age group which comprised24.7% and those under 30 age group which comprised9.6%.
Age Group | | 2013 | |
| Telkom | | Subsidiaries | | Telkom Group | | Percentage (%) | |
<30 | | 756 | | 1,644 | | 2,400 | | 9.6 | |
31 - 45 | | 4,170 | | 2,001 | | 6,171 | | 24.7 | |
>45 | | 12,955 | | 3,485 | | 16,440 | | 65.7 | |
Total | | 17,881 | | 7,130 | | 25,011 | | 100 | |
Approximately 78.3% ofouremployeeswere locatedin western Indonesia andapproximately21.7% ofouremployees were located in easternIndonesia and 83 of our employees were located outside of Indonesia.
Retirement Program
The retirement age for all our employees is 56.We have two56 years.We havetwo pension schemes, which areschemes: (a) Defined Benefit Pension Plan (“DBPP”) tailored for, which is applicable to permanent employees who were hired prior to July 1, 2002 (other than our Directors) and (b) Defined Contribution Pension Plan (“DCPP”) that applieswhich is applicable to all other permanent employees.employees (other than our Directors).
a.Defined Benefit Pension Plan (“DBPP”)
DBPP is calculated for participants based on years of service, salary level at retirement and is transferable to dependent families if the respective employee passes away. Telkom Pension Fund Division administers the program while the main source of pension fund comes from us and employee contributions. Employees participate in the program with 18%with18% of their basic salary (before March 2003, the employee contribution rate was 8.4%) while we contribute the remaining balance. The minimum monthly pension benefit for retired employees is approximately Rp425,000perRp425,000 per month. OurWe did not make any contribution to the DBPP pension fund reached Rp187 billion, Rp186 billionfor 2014, 2015 and Rp182 billion, respectively, for the years ended December 31, 2011, 2012 and 2013.2016.
Telkomsel operates its own DBPP for its employees. With this program, employees are entitled to retirement benefits calculated based on their latest basic salary or take-home pay and years of services. PT Asuransi Jiwasraya (Persero) manages this program after they secured annualunder annuity insurance contracts. Up to 2004, employees would contribute 5% of their monthly basic salaries to the program, while Telkomsel would contribute the remaining balance. Since 2005, Telkomsel has contributed the entire amount to the program.
Infomedia also has its own DBPPprogram, which totaled Rp98 billion, Rp192 billion and Rp83 billion for its employees.
2014, 2015 and 2016, respectively.
b.DefinedContribution Pension Plan(“DCPP”)
We operate a Defined Contribution Pension PlanDCPP for permanent employees other than Directors who were recruitedon orafter July 1, 2002. DCPP is managed by several appointed financial institutions pension fund from which employees can choose. Our contribution to the financial institutions pension fund is determined by the portion taken from participating employee’s basic salary, whichtotalled Rp5whichtotaled Rp6 billion, Rp5Rp7billion and Rp9 billion, for December 31,2014, 2015 and Rp6billion, respectively, for the years ended December 31, 2011, 2012 and 2013.
2016, respectively.
To create a more effective and competitive business environment, we also have implemented an Early Retirement Program (“ERP”).Program. The programEarly Retirement Program is run in line with the executionimplementation of the 2013-20172016 to 2020 Human Capital Master Plan under which is expectedwe expect to release1,548release 985 employees. This program is offered to employees who are deemed to have met certain requirements in terms of education, age, position and performance. From 2002 through December 31,2013, wespent Rp7.3 trillionIn 2016, we spent Rp628 billion as compensation for14,195for 382 employees who participated in the program.In 2013, we did not execute an early retirement program.Early Retirement Program.
Table of Content
ManagementManagement of Employee Relations with Management
Pursuant to the Presidential Decree No.83/1998 regarding Ratification of ILO Convention No.87/1948regarding Freedom of Association and Protection of the Right Organize,our employees established the Telkom Employees Union (“SEKAR”).SEKAR. As of December 31, 2013,2016, SEKARrepresented a total of16,283of14,472 employees or91.1%or89.9% ofour totalworkforce.totalworkforce (excluding the employees of our subsidiaries).
Pursuant to Law No.13/2003 regarding Manpower and Regulation of the Minister of Manpower and Transmigration No.PER.16/2011 concerning Procedures, Preparation andRatificationand Ratification of Company Regulations and Preparation and Registration of Collective Work Agreement, (“CWA”), SEKAR is entitled to represent employees in the negotiation of the CWAcollective work agreements with our management. To renew the expired CWA IV, negotiations for the CWA V were conducted during 2013. These negotiations have resulted in anOur Company and SEKAR entered into a sixth collective work agreement that was signed by both parties on August 23, 2013, anddated September 18, 2015 (the "Sixth CWA"), which has been ratified by the Directorate General of Work Requirement, Welfare and Discrimination Analysis of the Ministry of Manpower and Transmigration.CWA VisTransmigration. The Sixth CWA is in effect untilAugust 23, 2015.for a period of two years.
The employees of Telkomsel and PT Infomedia Nusantara have also haveestablished employees’ unions. Telkomsel’s employees’ union,“SEPAKAT”, has3,972 members As of December 31, 2016, the Telkomsel Workers’ Union (Serikat Pekerja Telkomselor representing93.1%SEPAKAT) represented a total of 3,929 Telkomsel employees or 75.7% of Telkomsel’s total employees.Neitheremployees. Neither we norournor our subsidiaries with employees union have experienced material labor action.
E.SHARE OWNERSHIP
As of February 28, 2014,2017, none of our Commissioners, Directors or senior managersSenior Managers beneficially owned more than 1.0% of our outstanding shares of common stock. In addition, no Commissioners beneficially own our shares of common stock. For information regarding share ownership of our directorsCommissioners, Directors and senior management,Senior Management, see Item 7 “Major Shareholders and Related Party Transactions –— Major Shareholders.”
Employee Stock Ownership Program
The Employee Stock Ownership Program (“ESOP”) is an employee-owner scheme that provides our employee with an ownership interest in ourCompany.our Company. At our initial public offering on November 14, 1995, a total of 116,666,475 shares were issued to 43,218 employees. On June 14, 2013, the Companywe transferred a portion of theour treasury stock to itsour employees as part of the 2012 annual incentives. TheOn such date, 59,811,400 (equal to 299,057,000 shares after stock split) treasuryshares of common stock were transferred to 24,993 employees which hadwith a total fair value of Rp661 billion.
As of February 28, 2014, 228,546,810March 21, 2016, 110,256,210 of our shares were owned by 23,52014,373 of our employees and our retirees. In 2014, 2015, and 2016, we did notexercise any ESOP. We also provide our Commissioners (except for Independent Commissioners) and Directors with long-term incentives in the form of shares. See “Compensation — Compensation of Commissioners and Directors”.
Stock Split and Depositary Receipt Ratio
At our general shareholders' meetingGMS on April 19, 2013, a stock split with a ratio of 1:5 was approved by our shareholders. New Series Bshares of common sharesstock were deposited into shareholders accounts on September 2, 2013 as part of the stock split. In connection with our stock split, effective September 3, 2013, we changed the ratio of our ADSs from one ADS representing 40 Series Bshares of common shares,stock, par value Rp250 per share, to one ADS representing 200 Series Bshares of common shares,stock, par value Rp50 per share.
OnOctober 26, 2016,we changed the ratio of our ADSs from one ADS representing 200 shares of common stock, par value Rp50 per share, to one ADS representing 100 shares of common stock, par value Rp50 per share.
Table of Content
ITEM 7.MAJOR7. MAJOR SHAREHOLDERS AND RELATED PARTY TRANSACTIONS
A.MAJOR SHAREHOLDERS
Shareholder Composition
Our authorized capital stock consists of one Series A Dwiwarna shareShare, and 399,999,999,999 Series B (common stock) shares.Ourauthorizedshares of common stock. Our authorized shares, 100,799,996,400 of which are issued and fully paid, consists of one Series A Dwiwarna shareShare and 100,799,996,399 shares of Series B common stock. The Series A Dwiwarna shareShare is owned by the Government and carries special voting rights, and the right to nominate, and to veto the appointment and removal of, any director or commissioner, the issue of new shares and amendments to our Articles of Association including amendments to merge or dissolve us, prior to the expiry of its term of existence, to increase or decrease our authorized capital or to reduce our subscribed capital. The material rights and restrictions placed onapplicable to the common stock also apply to the Dwiwarna share,Share, except that the Government cannot transfer the Dwiwarna share.Share. The Government’s ownership of the Dwiwarna shareShare gives it effective control over our Company even if it reduces its ownership of our common stock, and its rights with respect to the Dwiwarna shareShare may only be modified by an amendment of our Articles of Association, which the Government may veto.
This page intentionally left blank
TableThe table below sets forth the composition of Content
Company Shareholders perour shareholders as of February 28, 20142017.
| Series A Dwiwarna Share | | Series B Shares (Common Stock) | | Percentage of Ownership | | | Dwiwarna Share | | Common Stock | | Percentage of Ownership | |
Government | 1 | | 51,602,353,559 | | 53.14 | | | 1 | | 51,602,353,559 | | 52.09 | |
Public | | | 45,498,500,040 | | 46.86 | | | | | 47,459,863,040 | | 47.91 | |
Capital Subtotal (issued and outstanding) | 1 | | 97,100,853,599 | | 100.00 | | |
Subtotal (Capital issued and outstanding) | | | 1 | | 99,062,216,599 | | 100 | |
Treasury Stock | | | 3,699,142,800 | | - | | | | | 1,737,779,800 | | - | |
Total | 1 | | 100,799,996,399 | | 100.00 | | | 1 | | 100,799,996,399 | | 100 | |
Shareholders Owning More Than 5% of Shares (Major Shareholder)
The table below sets forth the shareholding of our major shareholder which own more than 5% of our shares as of February 28, 2017.
Title of Class | | Person or Group | | Number of Shares | | Percentage of Ownership | |
Series A | | Government | | 1 | | - | |
Series B | | Government | | 51,602,353,559 | | 53.14 | |
Title of Class | | Person or Group | | Number of Shares | | Percentage of Ownership | |
Dwiwarna Share | | Government | | 1 | | - | |
Common Stock | | Government | | 51,602,353,559 | | 52.09 | |
During the past three years, theThe percentage of shares held by the Government was, 52.8%52.6%, 53.9%52.6% and52.09% as of February 28, 2015, 2016 and 53.1% as ofFebruary 28, 2012, 2013 and 2014,2017, respectively.
Table of Content
Shares Owned by Commissioners and Directors
The table below sets forth information regarding persons known to us to own more than 5% of each class of our shares (whether directly or beneficially through the ADSs) as of February 28, 2017. No other persons own 5% or more of our shares of common stock.
Commissioners or Directors | | Number of Shares | | Percentage of Ownership | |
DirectorsCommissioners
|
|
|
|
|
|
| Hendri Saparini | | | | | |
Indra Utoyo
| | 27,540414,157
| | <0.01 | |
Honesti Basyir
| Hadiyanto | | 540875,297
| | <0.01 | |
Priyantono Rudito
| Dolfie Othniel Fredric Palit | | 540372,741
| | <0.01 | |
Sukardi SilalahiDirectors
|
|
| | 540
| |
| Alex J. Sinaga | | 920,349 | | <0.01 | |
Total
| Indra Utoyo | | 29,160 1,972,644
| | <0.01 | |
| Honesti Basyir | | 1,945,644 | | <0.01 | |
| Dian Rachmawan | | 888,854 | | <0.01 | |
| Abdus Somad Arief | | 828,314 | | <0.01 | |
| Herdy Rosadi Harman | | 828,012 | | <0.01 | |
Total |
|
| 9,046,012 |
| <0.01 |
|
Shareholders Owning Less Than 5% of Shares
The table below sets forth the shareholding of our shareholders which owned less than 5% of our shares of common stock as of February 28, 2017.
Group | | Number of Shares | | Percentage ofOwnership | |
Foreign | | | | | |
Business | | 37,630,826,424 | | 38.75 | |
Individual | | 15,345,500 | | 0.01 | |
Local | | | | | |
Business Entities | | | | | |
Companies | | 2,298,992,229 | | 2.37 | |
Mutual Funds | | 2,441,456,684 | | 2.51 | |
Insurance Companies | | 1,899,435,600 | | 1.96 | |
Pension Funds | | 613,687,650 | | 0.63 | |
Other Business Entities | | 59,213,990 | | 0.06 | |
Individuals | | 539,541,963 | | 0.56 | |
Total | | 45,498,500,040 | | 46.85 | |
Group | | Number of Shares of Common Stock Owned | | Percentage of Ownership | |
Foreign | | | | | |
| Business Entities | | 39,044,902,954 | | 39.42 | |
| Individuals | | 16,873,800 | | 0.01 | |
Local | | | | | |
| Business Entities | | | | | |
| Companies | | 1,913,787,659 | | 1.93 | |
| Mutual Funds | | 2,239,104,904 | | 2.26 | |
| Insurance Companies | | 2,948,501,550 | | 2.98 | |
| Pension Funds | | 677,218,550 | | 0.68 | |
| Others Business Entities | | 84,839,350 | | 0.09 | |
| Individuals | | 534,634,273 | | 0.54 | |
Total | | | 47,459,863,040 | | 47.91 | |
Relationship with the Government and Government Agencies
Our relationship with the Government is multi-faceted. The Government is our majority and controlling shareholder. It is also our regulator as it adopts, administers and enforces relevant laws that regulate the telecommunications sector, sets tariffs and issues licenses. It is also one of our customers and one of our lenders.
As used in this section, the term “Government” includes the Government of Indonesia and its ministries, directly-owned government departments and agencies, but excludes SOEs.
Table of Content
The Government as Shareholder
The Government is our majority and controlling shareholder and owned 53.1 %52.09% of our issued and outstanding common stock as ofFebruaryof February 28, 2014.2017. Its ownership of the Series A Dwiwarna shareShare gives it special voting and veto rights. Under the relevant laws, the “ownership” of our common stock and the single outstanding Series A Dwiwarna shareShare is vested in the Ministry of Finance (“MoF”).Finance. In turn, and under the authority of the MoF,Ministry of Finance, the Minister of State-Owned Enterprise (“MSOE”)MSOE exercises the rights vested in these securities as our “controlling shareholder”.
shareholder.”
As our majority shareholder and controlling shareholder, the Government has an interest in our performance, both in terms of the service we provide to the nation and our ability to operate on a commercial basis. The material rights and restrictions that apply to our common stock also apply to the Series A Dwiwarna share,Share, except that the Government may not transfer the Series A Dwiwarna share,Share, and has right of veto with regard to: (1) the nomination, appointment and removal of our Directors; (2) the nomination, appointment and removal of our Commissioners; (3) the issuance of new shares and (4) any amendments to our Articles of Association, including with respect to actions to merge or dissolve our Company, increase or reduce our authorized capital, stock, or reduce our subscribed capital stock.
capital.
Accordingly, the Government effectively has control over these matters even if it owns less than a majority share of the outstanding shares of common stock. The Government’s rights with respect to the Series A Dwiwarna shareShare will not expire unless there is a change that requires the amendment of our Articles of Association, which would require the consent of the Government as the holder of Series Athe Dwiwarna share.
Share.
The Government as Regulator
The Government regulates the telecommunications sector through the MoCI. The MoCI has the authority to issue regulations that implement laws, which are typically broad in scope. Through such decrees the MoCI defines the structure of the industry, determines tariff formulas, establishes our USO, and otherwise controls many factors that could influence our competitive position, operations and financial position. Through the DGPT, the MoCI regulates the allocation of frequencies and sets numbers for fixed telephone lines. We are required to obtain a license from the DGPT for each type of service offered, including licenses for the frequencies we use (as allocated by the MoCI). We and other operators are required to pay frequency usage fees. Telkomsel also holds licenses issued by the MoCI (some of which were previously issued by the Minister of Communications) for the provision of cellular services, and from the Indonesian Investment Coordinating Board in relation to Telkomsel’s investments for the development of cellular phone services with national coverage, including the expansion of network coverage. The Government, through the MoCI as regulator, has the authority to issue new licenses for the establishment of new joint ventures and other new arrangements, particularly in telecommunications.
Certain licenses require us to pay a concession fee to operate. We pay concession fees for telecommunications services provided and radio frequency usage charges to the MoCI. Concession fees amounted to Rp451Rp570 billion in 20122015 and Rp442Rp1,757 billion (US$36130.4 million) in 2013.2016. Concession fees as a percentage of total expenses amounted to 0.8% in 2012 and 0.8%2015 and2.3% in 2013.2016. Radio frequency usage charges amounted to Rp3,002Rp3,626 billion in 20122015 and Rp3,098Rp3,687 billion (US$255273.6 million) in 2013.2016. Radio frequency usage charges as a percentage of total expenses amounted to 5.5%5.1% in 2012 and 5.4%2015 and4.7 % in 2013.2016. USO charges to the MoCI amountingamounted to Rp994Rp1,660 billion in 20122015 and Rp1,059Rp460 billion (US$8734.1 million) in 2013.2016. USO charges as a percentage of our total expenses cameamounted to 1.8%2.3% in 2012 and 1.8%2015 and0.6% in 2013.
2016.
The Government as Lender
In July 1994, the Government arranged a facility under which certain foreign institutions provided us with a two-step loan for certain expenditures (the “sub-loan borrowings”). The sub-loan borrowings were made through the Government and are guaranteed by it. As of December 31, 2013,2016, we had a total of Rp1,915Rp1,292 billion (US$15795.9 million), in such outstanding two-step loans, including current maturities. We are required to pay the Government interest and repay the principal, which the Government then remits to the respective lenders. As of December 31, 2013, 73.5%2016,77.6% of such sub-loan borrowings were denominated in foreign currencies, with the remaining 26.5%remaining22.4% denominated in Rupiah. In 2013,2016, the annual interest rates charged 6.79%charged8.25% on loans repayable in Rupiah, 4.0% Rupiah,3.85%on those denominated in USU.S. Dollar and 3.1% forand2.95% on those denominated in Japanese Yen.
95
Table of Content
The Government as Customer
Certain Government departments and agencies purchase services from us as direct customers, the terms of which are negotiated on a commercial basis. No services are provided for free or on an in-kind basis. We deal with these departments and agencies as separate customers. In 2013,2016, the amount of revenues from Government departments and agencies was Rp508Rp2,486 billion, which was approximately 0.61%accounted for2.14% of our consolidated revenues and did not constitute a material part of our revenues. The Government departments and agencies are treated for tariff purposes with respect to connection charges and monthly charges as “residential”, which tariffs are lower than the business service rates. This does not apply to the tariffs for local, long distance and IDD calls.
In addition, we provide enterprise digital services and solutions to SOEs, includingATM switching, payment gateway and e-Commerce platform services.
It is our policy not to enter into any transactions with affiliates unless the terms are no less favorable to us than they would be with a third party. The MSOE has advised us that it would not cause us to enter into transactions with other entities under its control unless the terms were consistent with our policy as referred to above.
Pursuant to OJK regulations, because we are listed on the IDX, any transaction where there is an inherent conflict of interest (as defined below) with another IDX-listed company must be approved by a majority of the holders of our shares of common stock who do not have a conflict of interest in the proposed transaction, unless such conflict of interest existed before listing and was fully disclosed in the offering documents.
OJK regulations define a conflict of interest as a conflict between our economic interests and the shareholders’ interests on the one hand and, on the other, the personal economic interests of members of the Board of Commissioners, Board of Directors or other principal shareholders (defined as a holder of 20% or more of our shares of common stock) or their affiliates, either jointly or individually. A conflict of interest also exists if a member of the Board of Commissioners or Board of Directors or a principal shareholder or their respective affiliates is involved in a transaction in which its personal interests may be in conflict with ours. The OJK has the authority to enforce these rules regarding conflicts of interest and holders of our shares of common stock are also entitled to bring a suit to enforce these.
Under OJK regulations, transactions between us and other State-Ownedstate-owned or controlledstate-controlled enterprises may cause a conflict of interest. In such cases, the approval of the disinterested shareholders must be obtained if a conflict of interest arises. We believe that many transactions conducted with State-Ownedstate-owned or controlledstate-controlled enterprises are on an arms-length, commercial basis and do not constitute conflict of interest transactions that would require an independent shareholders vote. Such transactions include our sale of telephone services to State-Ownedstate-owned or controlledstate-controlled enterprises and our purchase of electricity from a State-Owned Enterprise. an SOE.We expect that from time to time, in connection with the development and growth of our business we would enter into joint ventures, agreements or transactions with such enterprises. Under such circumstances, we may consult with the OJK to determine whether a proposed joint venture, agreement or transaction would require a vote of independent shareholders under OJK rules. If the OJK is of the view that such transaction would not require such a vote, we would proceed without seeking the independent shareholders’ approval. Otherwise, we would seek the requisite approval or abandon the proposed action.
Proportion of Common Stock Held in Indonesia and Abroad
As of February 28, 2014,2017, we had 44,518 46,621 holders of shares ofcommon stock shareholders, including(including the Government.Government). This total includes 38,696,301,724 39,185,506,554 shares ofcommon stock shares ownedheld by 1,821 shareholders2,407holders of common stock located outside Indonesia. As of the same date, there were 104 ADSwere92ADS shareholders who owned 56,880,177 ADS (1 ADS is equivalent to 200 common stock shares).
66,048,569ADSs.
Change in Control
As of the date of this Annual Report, we are not aware of any plans or developments that could result in a change of control over us, including changes that are still at the planning stage.
B. RELATED PARTY TRANSACTIONS
We are party to certain agreements and engage in transactions with certain parties that are related to us, such as cooperatives and foundations. Such parties include the Government and entities related to or owned or controlled by the Government, such as other State-Owned Enterprises.SOEs. For further details on our related party transactions, see Note35Note31 to our Consolidated Financial Statements.
Table of ContentITEM 8.
FINANCIAL INFORMATION
ITEM 8.FINANCIAL INFORMATION
A.CONSOLIDATED STATEMENTS AND OTHER FINANCIAL INFORMATION
See Item 18 “Financial Statements” for our audited Consolidated Financial Statements filed as part of this Form 20-F.
Material LitigationMATERIAL LITIGATION
In the ordinary course of business, we have been named as defendant in various legal actions related toin relation with land disputes, monopolistic practice and unfair business competition and SMS cartel practices.We do not believe that subsequent investigations or court decisions regarding those cases will have significant financial impact on us orpractices. See Note 34 to our subsidiaries. Based on management's estimates on the probable outcomes of those cases, we have made provisions of Rp49 billion as at December 31, 2013.
For cases involving the Company and cases involving subsidiaries, seeNote 39 to ourCompany’s Consolidated Financial Statements.
In 2013,2016, there were no material legal proceedings involving our Company or any serving member of the BoC and BoD.Commissioner or Director.
Dividend PolicyDIVIDEND POLICY
The AGMSAnAGMS has the authority to determine the amount of dividends we pay. In 2016, we paid an interim cash dividend for 2016 of Rp19.38 per share. Our final cash dividend and dividend payout ratio for 20132016 will be decided at the AGMS scheduled for 2014.
2017.
Dividend Year | | Date of AGMS | | Payout Ratio (%)1 | | Amount of Dividends (Rp million) | | Dividend per Share (Rp)6 | | | Date of AGMS | | Payout Ratio (%)1 | | Amount of Dividends (Rp million) | | Dividend per Share After Stock Split (Rp) | |
2008 | | June 12, 2009 | | 55 | | 5,840,7082 | | 59.39 | | |
2009 | | June 11, 2010 | | 50 | | 5,666,0700 | | 57.61 | | |
2010 | | May 19, 2011 | | 55 | | 6,345,3503 | | 64.52 | | |
2011 | | May 11, 2012 | | 65 | | 7,127,3334 | | 74.21 | | | May 11, 2012 | | 65 | | 7,127,333 (2) | | 74.21 | |
2012 | | April 19, 2013 | | 65 | | 8,352,5975 | | 87.24 | | | April 19, 2013 | | 65 | | 8,352,597 (3) | | 87.24 | |
2013 | | | April 4, 2014 | | 70 | | 9,943,294 (4) | | 102.40 | |
2014 | | | April 17, 2015 | | 60 | | 8,782,812 (5) | | 89.46 | |
2015 | | | April 22, 2016 | | 60 | | 9,293,184 (6) | | 94.64 | |
(1)Represents the percentage of profit attributable to owners of the parent paid to shareholders in dividends.
(2) Including interim cash dividend paid in December 2009 amounting to Rp524,190 million.
(3) Including interim cash dividend paid in December 2010 and January 2011 amounting to Rp276,072 million and Rp250,085 million respectively.
(4) Consists of cash dividend amounting to Rp6,030,820 million and special cash dividend amounting to Rp1,096,513 million.
(5) (3)Consists of cash dividend amounting to Rp7,067,582 million and special cash dividend amounting to Rp1,285,015 million.
(4)Consists of cash dividend amounting to Rp7,812,588 million and special cash dividend amounting to Rp2,130,706 million.
(5)Consists of cash dividend amounting to Rp7,319,010 million and special cash dividend amounting to Rp1,463,802 million.
(6) After stock splitConsists of cash dividend amounting to Rp7,744,304 million and special cash dividend amounting to Rp1,548,880 million.
Telkomsel DividendTELKOMSEL DIVIDEND
Pursuant to its AGMS in April 2013,onApril 15, 2016, Telkomsel approved, the payment of a cash dividenddividends in the amount of Rp13,358Rp20,105 billion, which represented 85%90% of Telkomsel’sTelkomsel's net profitprofits in 2012, Rp4,675 billion2015. We are entitled to receive 65% of this dividend was distributed to SingTel Mobile.
In 2011, 2012 and 2013, cashany dividends were paid to SingTel Mobile, a non-controlling shareholderapproved for payment by Telkomsel by virtue of Telkomsel, amounting to Rp2,726 billion, Rp3,591 billion and Rp4,675 billion.
our shareholding therein.
B.SIGNIFICANT CHANGES
See Note 43Note38 to our Consolidated Financial Statements.
97
Table of Content
ITEM 9.THE9.THE OFFER AND LISTING
A.OFFER AND LISTING DETAILS
The table below shows the high, low, closing quoted prices, trading volume, outstanding shares and market capitalization for our common stock on the IDX during the periods indicated:
Calendar Year | | Price per Share of Common Stock | | Volume (shares) | | Outstanding Shares | | Market Capitalization (Rp billion)* | |
| High | | Low (in Rupiah) | | Closing | | | | |
| | | | | | |
2009 | | 2,070 | | 1,150 | | 1,890 | | 20,872,067,500 | | 98,347,123,900 | | 190,512 | |
2010 | | 1,960 | | 1,390 | | 1,590 | | 28,539,250,000 | | 98,347,123,900 | | 160,272 | |
2011 | | 1,610 | | 1,320 | | 1,410 | | 22,207,895,000 | | 96,931,696,600 | | 142,128 | |
2012 | | 1,990 | | 1,330 | | 1,810 | | 23,002,802,500 | | 95,745,344,100 | | 182,448 | |
First Quarter | | 1,430 | | 1,330 | | 1,400 | | 5,197,855,000 | | 96,096,969,100 | | 141,120 | |
Second Quarter | | 1,740 | | 1,400 | | 1,630 | | 6,934,820,000 | | 95,921,374,100 | | 164,304 | |
Third Quarter | | 1,970 | | 1,590 | | 1,890 | | 5,100,152,500 | | 95,767,844,100 | | 190,512 | |
Fourth Quarter | | 1,990 | | 1,730 | | 1,810 | | 5,769,975,000 | | 95,745,344,100 | | 182,448 | |
2013 | | 2,580 | | 1,760 | | 2,150 | | 27,839,305,000 | | 97,100,853,600 | | 216,720 | |
First Quarter | | 2,230 | | 1,760 | | 2,200 | | 5,993,025,000 | | 95,745,344,100 | | 221,760 | |
Second Quarter | | 2,580 | | 1,900 | | 2,250 | | 8,265,647,500 | | 96,044,401,100 | | 226,800 | |
Third Quarter | | 2,450 | | 1,950 | | 2,100 | | 7,206,438,500 | | 97,100,853,600 | | 211,680 | |
Fourth Quarter | | 2,375 | | 1,980 | | 2,150 | | 6,374,194,000 | | 97,100,853,600 | | 216,720 | |
September | | 2,450 | | 1,950 | | 2,100 | | 2,644,068,500 | | 97,100,853,600 | | 211,680 | |
October | | 2,375 | | 2,100 | | 2,350 | | 2,019,709,500 | | 97,100,853,600 | | 236,880 | |
November | | 2,350 | | 2,025 | | 2,175 | | 2,055,114,500 | | 97,100,853,600 | | 219,240 | |
December | | 2,200 | | 1,980 | | 2,150 | | 2,299,370,000 | | 97,100,853,600 | | 216,720 | |
2014 | | | | | |
| | | | | | | |
January | | 2,275 | | 2,060 | | 2,275 | | 1,758,433,800 | | 97,100,853,600 | | 229,320 | |
February | | 2,420 | | 2,170 | | 2,325 | | 2,015,617,700 | | 97,100,853,600 | | 234,360 | |
| | | Price per share of Common Stock (IDX) | | Volume | | Outstanding shares | | Market Capitalization | |
Calendar Year | High | | Low | | Closing | | | | |
| | | (in Rupiah) | | (shares) | | | (Rp billion) | |
2012 | 1,990 | | 1,330 | | 1,810 | | 23,002,802,500 | | 95,745,344,100 | | 182,448 | |
2013 | 2,580 | | 1,760 | | 2,150 | | 27,839,305,000 | | 97,100,853,600 | | 216,720 | |
2014 | 3,010 | | 2,060 | | 2,865 | | 24,035,761,600 | | 98,175,853,600 | | 288,792 | |
2015 | 3,170 | | 2,485 | | 3,105 | | 18,742,850,400 | | 98,198,216,600 | | 312,984 | |
| First Quarter | 3,020 | | 2,770 | | 2,890 | | 5,209,728,100 | | 97,100,853,600 | | 291,312 | |
| Second Quarter | 2,955 | | 2,595 | | 2,930 | | 4,816,156,800 | | 98,175,853,600 | | 295,344 | |
| Third Quarter | 2,970 | | 2,485 | | 2,645 | | 4,061,559,500 | | 98,175,853,600 | | 266,616 | |
| Fourth Quarter | 3,170 | | 2,600 | | 3,105 | | 4,655,406,000 | | 98,198,216,600 | | 312,984 | |
2016 | 4,570 | | 3,045 | | 3,980 | | 23,017,915,300 | | 99,062,216,600 | | 401,184 | |
| First Quarter | 3,510 | | 3,045 | | 3,325 | | 5,852,647,000 | | 98,198,216,600 | | 335,160 | |
| Second Quarter | 4,010 | | 3,305 | | 3,980 | | 5,808,895,400 | | 99,062,216,600 | | 401,184 | |
| Third Quarter | 4,570 | | 3,950 | | 4,310 | | 5,821,745,500 | | 99,062,216,600 | | 434,448 | |
| Fourth Quarter | 4,400 | | 3,640 | | 3,980 | | 5,534,627,400 | | 99,062,216,600 | | 401,184 | |
| September | 4,400 | | 3,950 | | 4,310 | | 2,010,068,700 | | 99,062,216,600 | | 434,448 | |
| October | 4,400 | | 4,120 | | 4,220 | | 1,365,432,500 | | 99,062,216,600 | | 425,376 | |
| November | 4,300 | | 3,640 | | 3,780 | | 2,680,143,800 | | 99,062,216,600 | | 381,024 | |
| December | 4,020 | | 3,670 | | 3,980 | | 1,489,051,100 | | 99,062,216,600 | | 401,184 | |
2017 | 4,030 | | 3,780 | | 3,850 | | 2,770,417,700 | | 99,062,216,600 | | 388,080 | |
| January | 4,030 | | 3,780 | | 3,870 | | 1,280,778,000 | | 99,062,216,600 | | 390,096 | |
| February | 3,980 | | 3,830 | | 3,850 | | 1,489,639,700 | | 99,062,216,600 | | 388,080 | |
(1) We conducted a five for one split of our common stock from a nominal value of Rp250 per share to Rp50 per share as resolved by the AGMS on April 19, 2013, effective September 2, 2013. | |
(2) The price per share of the common stock reflects this two splits mentioned above for all periods shown. | |
(3) Market capitalization is the product of the share price and issued and fully paid share which is 100,799,996,400 shares. | |
On the last day of trading on the IDX in 2016, which was December 30, 2016, the closing price for our common stock was Rp3,980 per share. The table below shows the high, low and closing quoted prices and trading volume for our ADSs on the NYSE during the periods indicated. | |
* Market capitalization iscalculated bymultiplying the share price by the number ofissued and fully paid shares which is 100,799,996,400 shares.
The price per share of the common stockon the table abovereflects this two splitsfor all periods shown:
-We conducted a two for one split of our common stock from a nominal value of Rp500 per share to Rp250 per share as resolved by the AGMS on July 30, 2004, effective October 1, 2004.
-We conducted a five for one split of our common stock from a nominal value of Rp250 per share to Rp50 per share as resolved by the AGMS on April 19, 2013, effective September 2, 2013.
On December 30, 2013, the last day of trading on the IDX in 2013, the closing price for our common stock wasRp2,150 per share.
The high, low, closing prices and trading volume for our ADSs on the NYSE and the LSE for the periods indicated are shown in the table below. Trading in ADSs is effected “off exchange” on the LSE. Under LSE rules, off exchange trading means that transactions are carried out on other exchanges and once the transaction has taken place, it is reported to the LSE.
98
Table of Content
Calendar Year | | Price per ADS (NYSE) | | Volume (in ADS) | | Price per ADS (LSE) | | Volume (in ADS) | |
| High | | Low (in US Dollars) | | Closing | | | High | | Low (in US Dollars) | | Closing | | |
| | | | | | | | |
2009 | | 41.55 | | 20.19 | | 39.95 | | 67,767,999 | | 40.76 | | 25.67 | | 41.02 | | 3,757 | |
2010 | | 43.80 | | 30.33 | | 35.65 | | 69,803,576 | | 42.00 | | 30.76 | | 34.91 | | 19,673 | |
2011 | | 36.96 | | 30.29 | | 30.74 | | 69,279,100 | | 35.89 | | 21.02 | | 30.50 | | 1,406,292 | |
2012 | | 41.14 | | 29.26 | | 36.95 | | 88,190,589 | | 40.12 | | 30.24 | | 36.50 | | 746,278 | |
First Quarter | | 31.69 | | 29.26 | | 30.36 | | 19,265,880 | | 31.04 | | 30.24 | | 30.95 | | 236,546 | |
Second Quarter | | 37.00 | | 30.38 | | 34.83 | | 32,660,280 | | 36.64 | | 30.40 | | 33.70 | | 293,809 | |
Third Quarter | | 41.14 | | 34.28 | | 38.93 | | 19,696,121 | | 39.78 | | 34.30 | | 39.10 | | 88,412 | |
Fourth Quarter | | 41.00 | | 36.00 | | 36.95 | | 16,568,308 | | 40.12 | | 36.50 | | 36.50 | | 127,511 | |
2013 | | 50.61 | | 33.75 | | 35.85 | | 67,061,105 | | 50.59 | | 33.44 | | 35.33 | | 6,579,103 | |
First Quarter | | 45.32 | | 36.17 | | 45.08 | | 13,876,752 | | 45.83 | | 37.06 | | 45.28 | | 12,819 | |
Second Quarter | | 50.61 | | 38.75 | | 42.74 | | 15,688,290 | | 50.59 | | 39.31 | | 45.34 | | 6,465,258 | |
Third Quarter | | 47.20 | | 34.54 | | 36.31 | | 18,713,653 | | 47.44 | | 35.62 | | 36.27 | | 79,240 | |
Fourth Quarter | | 41.69 | | 33.75 | | 35.85 | | 18,782,410 | | 41.69 | | 33.44 | | 35.33 | | 21,786 | |
September | | 42.39 | | 34.54 | | 36.31 | | 6,791,001 | | 42.10 | | 35.62 | | 36.27 | | 44,011 | |
October | | 41.69 | | 36.95 | | 40.76 | | 5,975,745 | | 41.69 | | 37.29 | | 41.69 | | 20,830 | |
November | | 40.90 | | 34.70 | | 36.54 | | 5,866,608 | | 40.95 | | 34.43 | | 36.36 | | 0 | |
December | | 37.21 | | 33.75 | | 35.85 | | 6,940,057 | | 37.38 | | 33.44 | | 35.33 | | 956 | |
2014 | | | | | | | | | | | | | | | | | |
January | | 37.49 | | 33.91 | | 36.27 | | 5,498,292 | | 37.26 | | 33.83 | | 37.36 | | 0 | |
February | | 40.53 | | 35.19 | | 39.23 | | 5,149,305 | | 38.06 | | 35.98 | | 38.06 | | 0 | |
| | | | | | | | | | | | | | | | | | | |
Calendar Year | | | | Price per ADS | | Volume (in ADS) | |
| High | | Low | | Closing | | |
| | | (in U.S. Dollars) | | |
2012 | | 20.57 | | 14.63 | | 18.48 | | 177,219,324.00 | |
2013 | | 25.31 | | 16.88 | | 17.93 | | 134,122,210.00 | |
2014 | | 24.38 | | 16.95 | | 22.62 | | 104,501,896.00 | |
2015 | | 23.54 | | 17.05 | | 22.20 | | 87,438,232.00 | |
| First Quarter | | 23.54 | | 20.56 | | 21.77 | | 18,351,674.00 | |
| Second Quarter | | 22.48 | | 20.26 | | 21.70 | | 21,794,470.00 | |
| Third Quarter | | 21.99 | | 17.05 | | 17.83 | | 20,440,486.00 | |
| Fourth Quarter | | 22.76 | | 17.47 | | 22.20 | | 26,851,602.00 | |
2016 | | 34.65 | | 21.22 | | 29.16 | | 110,532,172.00 | |
| First Quarter | | 26.92 | | 21.22 | | 25.43 | | 24,848,124.00 | |
| Second Quarter | | 30.96 | | 25.06 | | 30.73 | | 31,010,592.00 | |
| Third Quarter | | 34.65 | | 29.63 | | 33.04 | | 27,153,358.00 | |
| Fourth Quarter | | 33.57 | | 27.17 | | 29.16 | | 27,520,098.00 | |
| September | | 33.38 | | 29.63 | | 33.04 | | 8,680,416.00 | |
| October | | 33.57 | | 31.59 | | 32.49 | | 8,246,024.00 | |
| November | | 32.85 | | 28.00 | | 28.10 | | 9,242,784.00 | |
| December | | 29.75 | | 27.17 | | 29.16 | | 10,031,290.00 | |
2017 | | 30.16 | | 28.16 | | 28.50 | | 16,271,010.00 | |
| January | | 30.16 | | 28.16 | | 29.42 | | 8,079,524.00 | |
| February | | 29.71 | | 28.47 | | 28.50 | | 8,191,486.00 | |
On December 31, 2013, the last day of trading on the NYSE and LSE in 2013, the closing price for one Telkom ADS was US$36and US$35, respectively.
B.PLAN OF DISTRIBUTION
Not applicable.
C. MARKETS
Our common stock is listed and traded on the IDX. Our ADSs are also listed and traded on the NYSE and the LSE as ADSs, wherewith one ADS represents 200representing 100 shares of Common Stock. Our shares are also Publicly Offered Without Listing (“POWL”) in Japan.common stock.
The Indonesian Stock Market
Indonesia’s stock market, known as the IDX, grewemerged out of the December 1, 2007 merger of two stock exchanges operating in two different locations in Indonesia, namely the Jakarta Stock Exchange which was located in Jakarta, the capital city of Indonesia, and the Surabaya Stock Exchange which was located in Surabaya in East Java.
As of December 31, 2013,2016, the IDX had 483537 issuers for equity and 114 106active brokerage houses. In 2013,2016, IDX recorded a trading volume of 1,343 270.8billion shares. As ofAsof December 31, 2013,2016, the total market capitalization was valued at Rp4,219Rp5,753.6 trillion (US$346.7 427.1billion).
Trading is divided into three segments: the regular market, negotiated market and the cash market (except for rights issues, which can only be traded on the cash market and the negotiated market for the first session). The regular market is the mechanism for trading stock in standard lots on a continuous auction basis during exchange hours. Auctions on the IDX on regular market and cash market take place according to the price and time priorities. Price priority refers to the giving of priority to buying orders at a higher price or selling orders at a lower price. If buying or selling orders are placed at the same price, priority is given to the earlier placed buying or selling order (time priority). Trading on the negotiated market is conducted through direct negotiation between (i) IDX members, (ii) clients through one IDX member, (iii) a client and an IDX member, or (iv) an IDX member and the PT Kliring Penjaminan Efek Indonesia (“KPEI”). KPEI provides clearing and guarantee services of stock exchange transactions settlement. It also improves efficiency and certainty of transactions settlement inon the IDX.
99
Table of Content
On November 14, 2012, IDX issued aThe Decree of BOD the Board of Directors of the IDXNo. Kep-00399/BEI/11-2012regardingthe Change of Trading Regulation No. IIA on Equity – Type Securities Tradingwhich changed theIDX’s trading hours, effectiveJanuary11-2012 provides that, effective January 2, 2013, withthe trading sessions of the IDX is as follows:
Trading Session |
| Market |
| Day |
| Trading Hours | |
Pre-opening | | Regular | Monday– Friday
| 08.45.00 –08.55.00 Monday-Friday
| | 08.45.00-08.55.00 | |
1st | | Regular | Monday –Thursday
| 09.00.00 –12.00.00 Monday-Thursday
| | 09.00.00-12.00.00 | |
Cash
| |
Cash and Negotiated | | Friday | 09.00.00 –11.30.00
| |
Negotiation09.00.00-11.30.00
| |
2nd | | Regular | Monday –Thursday
| 13.30.00 –15.49.59 Monday-Thursday
| | 13.30.00-15.49.59 | |
| | | | Friday | 14.00.00 –15.49.59
| 14.00.00-15.49.59 | |
Negotiation
| Monday –Thursday
| 13.30.00 –16.15.00 Negotiated
| | Monday-Thursday | | 13.30.00-16.15.00 | |
| | | | Friday | 14.00.00 –16.15.00
| 14.00.00-16.15.00 | |
Pre-closing | | Regular | Monday –Friday
| 15.50.00 –16.00.00 Monday-Friday
| | 15.50.00-16.00.00 | |
Post Trading | | Regular | Monday –Friday
| 16.05.00 –16.15.00 Monday-Friday
| | 16.05.00-16.15.00 | |
On November 8, 2013, IDX issued aThe Decree of BODthe Board of Directors of the IDX No.Kep-00071/BEI/11-2013regarding 11-2013,the Change of Trading Regulation No. IIA on Equity – Type Securities Trading that changethe effective January 2, 2013, reduced lot size tick price and maximum price movement, effectiveJanuary 2,2013,
lot sizechanged from 500 shares to 100 shares, and changed the tick price and maximum share price movementchangedas follows:
movement to the following:
Previous
|
| New
| |
Group Price |
| Tick Price |
| Maximum Share Price Movement |
| Group Price
|
| Tick Price
|
| Maximum Share Price Movement
|
|
≤Rp200
| | Rp1
| | Rp10
| | ≤Rp500 | | Rp1 | | Rp20 | |
Rp200 – Rp500
| | Rp5
| | Rp50
| | | | | | | |
Rp500 – Rp2,000
| | Rp10
| | Rp100
| | Rp500 – Rp5,000 | | Rp5 | | Rp100 | |
Rp2,000 – ≥Rp5,000
| | Rp25 | | Rp250Rp500
| |
The Decree of the Board of Directors of the IDX No.Kep-00023/BEI/04-2016, effective May 2, 2016, changed the group price, tick price and maximum share price movement to the following:
New |
|
|
|
|
|
Group Price |
| Tick Price |
| Maximum Share Price Movement |
|
≤Rp200 | | Rp1 | | | | Rp10 | |
≥Rp5,000Rp200 – <Rp500
| | Rp2 | | Rp20 | |
Rp500-<Rp2,000 | | Rp5 | | Rp50 | |
Rp500Rp2,000-<Rp5,000
| | Rp10 | | Rp100 | |
≥Rp5,000 | | Rp25 | | Rp500Rp250
| |
Transactions on the IDX regular market must be settled no later than the third trading day after the transaction. Transactions on the negotiated market are settled on the basis of the agreement between the selling exchange members and the buying exchange members, on a transaction by transactiontransaction-by-transaction basis. Transactions on the IDX cash market must be settled on the day of the transaction and reported to the IDX. If an exchange member defaults on the settlement of a transaction, the securities can be traded by direct negotiation on cash and carry terms. Each exchange member is required to pay a transaction fee as stipulated by the IDX. Any delay in payment of the transaction fee is subject to a fine of 1%1.0% of the outstanding amount foramountof the paymentfor each day of delay. The IDX may impose sanctions on its members for any violation of exchange rules, which may include fines, written warnings, suspension or revocation of licenses.
When conducting share transactions on the IDX, each exchange member is required to pay a transaction cost for transactions on the regular market and cash market of 0.03%, a guarantee fundof0.01%fund of 0.01% of the transaction value and VAT and other tax obligation. For the negotiated market, a transaction cost isof 0.03% or depended any otheran amount as stipulated by the IDX is applicable. Aminimum monthly transaction fee of Rp2 million is applied as a contribution for the provision of exchange facilities and continues in effect for members who are suspended or whose Exchange Member Approval (“SPAB”) revoked.Approvalisrevoked.
Since the global financial crisis in the last quarter of 2008 that caused a typical share price movements, the IDX has applied a policy of auto rejection, a mechanism whereby share trading can be halted automatically in order to maintain orderly, fair and efficient trading. Following changes made by the IDX in October 2008 and January 2009 the auto rejection trigger levels are 35% above or below the reference price for stocks in the Rp50 -to Rp200 price range, 25% for stocks in the Rp200 to Rp5,000 price range, and 20% for stocks priced abovemore than Rp5,000. The auto rejection level in the case of an IPOinitial public offering is determined at a level which is twice as high asfornormalas for normal trading.Auto rejection also arises when selling offer or buying request volume reaches of over 5 billion shares or 5% of total shares listed, whichever is smaller.
100
Table of Content
The Decree of the Board of Directors of the IDX No. Kep-00023/BEI/04-2016, effective May 2, 2016, also stipulates the change of auto rejection policy. The Jakarta Automated Trading System (JATS) will automatically reject price orders input into the JATS at the Regular and Cash Markets if (i) the selling or buying order is smaller than Rp50; (ii) the selling or buying orders input into the JATS are more than 35% (thirty five percent) above or 10% (ten percent) below the Reference Price for stock prices ranging from Rp50 to Rp200; (iii) the selling or buying orders input into the JATS are more than 25% above or 10% below the Reference Price for stock price ranging from above Rp200 to Rp5,000; and (iv) the selling or buying orders input into the JATS are more than 20% above or 10% below the Reference Price for stock price that is more than Rp5,000. Stock trading as a result of initial public offering is determined twice wider than Auto Rejection percentage as mentioned above.
Trading on the NYSE and LSEonthe NYSE
See Item 12 “Description of Securities Other Than Equity Securities”.
D.B. SELLING STOCKHOLDERS
Not applicable.
E.C. DILUTION
Not applicable.
F.D. EXPENSES OF THE ISSUE
Not applicable.
ITEM 10.ADDITIONAL10.ADDITIONAL INFORMATION
A.SHARE CAPITAL
Not applicable.
B.MEMORANDUM AND ARTICLES OF ASSOCIATION
DescriptionofArticlesofAssociation
Our Articles of Association are registered in accordance with the Limited Liability Company Law No.1 of 1995 on Limited Liability Companies, and approved by Ministerial Decree No.C2-7468.HT.01.04.TH.97No.C2-7468.HT.01.04.Th.97 of 1997. Pursuant toFollowing the issuanceenactment of the Indonesian Company Law No.40 of 2007 which revoked Limited Liability Companies Law No.1 of 1995 on Limited Liability Companies, we have amended our Articles of Association which waswere approved by the MinisterMinistry of Law and Human Rights of the Republic of Indonesia pursuant to the Decree of the MinisterMinistry of Justice and Human Rights No.AHU.46312.AH.01.02 of 2008 dated July 31, 2008 and registered in the State Gazette of the Republic of Indonesia No.84 dated October 17, 2008, Supplement to State Gazette No.20155.
Our Articles of Association have been amended several times, the latest amendment of whichprimarilywhich primarily related to (i) certain adjustments as required under OJK rules and, (ii) the change ofourcapital structureresulting fromin certain restrictions to the authority of our 5-for-1 stock split whereby each shareDirectors with par valuerespect to resolution of Rp250 split intofive sharesthe Board of par valueRp50 per share, andchanges relating to exclusion ofthepartnership andcommunitydevelopmentprogramme (PKBL) from theworkplan andcompany budgets, based on notarial deed No. 11 dated May 8, 2013Directors which require the approval of Ashoya Ratam, S.H., MKn. The latestthe Board of Commissioners. This last amendment was accepted and approved by the Ministry of Law and Human Rights of the Republic of Indonesia (“MoLHR”)Right in its Letter No. AHU-AH.01.10-22500No.AHU-AH.01.03-0938775 dated June 7, 2013.9, 2015 and Decision No.AHU-0936901.AH.01.02.Th.2015 dated June 9, 2015.
UnderIn accordance with Article 3 of theour Articles of Association, the scope of our businessactivities is to provide telecommunications networkstelecommunication network and telecommunicationstelecommunication and information services, and to optimize our Company’s resources with due attention to the prevailing laws and regulations. To attainIn order to achieve the aforementioned objectives, we may undertake business activities that incorporate the following:
Table of Content
1.Main Business
a. To plan, build, deliver, develop, operate, market/sell/lease,Planning, building, providing, developing, operating, marketing or selling, leasing, and maintain telecommunicationsmaintaining telecommunication and information networks in the broadest sense in accordance with respect to provisions of laws andprevailing regulations.
b. To plan, develop, deliver, market/sellPlanning, developing, providing, marketing or selling, and improveimproving telecommunications and information services in the broadest sense in accordance with respect to provisions of laws andprevailing regulations.
101
c.Investing, including equity capital, in other companies in order to realize our purposes and objectives.
Table of Content
2.Supporting Business
a. To provideProviding payment transactiontransactions and remittancemoney transferring services viathrough telecommunications and information networks.
b. To carry outPerforming activities and other undertakings in respectconnection with the optimization of optimizing our resources which, among others, include the utilization of our property and equipment and moveablemovable assets, information system facilities,systems, education and training facilities,and repairs and maintenance and repair facilities.
c.Collaborating with other parties to optimize the information, communication or technology resources owned by other parties as a service provider in the information, communication and technology industry in order to realize our purposes and objectives.
In accordance with the Indonesian Company Law, we have a Board of Commissioners and a Board of Directors. The two BoardsThese boards are separate and no individual may be a member of both Boards.boards. Each Director receives a bonus if we surpass certain financial and operating targets, the amounts of which are determined by the shareholders at the AGMS.
TheOur Articles of Association state that any transaction involving a conflict of interest between our Company and our Directors, Commissioners and shareholders should be approved by a shareholdersshareholders’ meeting, where approval is required from more than half of the votes of the independent shareholders.
A member of the Board of Directors shall have no right to represent therepresentour Company if such member has a conflict of interest with thewithour Company. To take any legal actions in the form of transactions containing conflicttransactionsin which aconflict of interests betweeninterestsexistsbetween the personal economic interest of members of the Board of Directors, Board of Commissioners or shareholders and theofaDirector,aCommissioner orashareholder andour Company’s economic interest, the Board of Directors requires theDirectorsmust obtainthe approval of a General Meeting of Shareholders.GMS. Such General Meeting of ShareholdersGMS must be attended by independent shareholders (i.e. those shareholders having no conflict of interest) who hold more than one-half of the total number of shares with valid voting rights held by all independent shareholders and the resolution must be passed by the affirmative votes of independent shareholders holding more than one-half of the total number of shares with valid voting rights. In passing any resolutions, the mainprincipal shareholders, members of the Board of DirectorstheDirectors and members of the Board of Commissioners withwho have conflicts of interests with theinthe transaction that is being decided shalldecidedare not be entitled to give any recommendation or opinion. Any resolution passed by independent shareholders shall be confirmed by the whole meetingentire quorum of themeeting to be followed by all shareholders present in the meeting, including those withthosehaving conflicts of interest.
Compensation of members of the Board of Directors is decided at a General Meeting of Shareholders,GMS, although the authority may be delegated to the Board of Commissioners, in which case compensation shall be determined based on a resolution of the Board of Commissioners.
Our ArticleArticles of Association is not arrange borrowing power exercisable byrequire our Board of DirectorDirectors to obtain the written approval of our Board of Commissioners in order to obtain (i) any loan with a term of less than one year for non-operational purposes and how such(ii) any loan with a term of more than one year, in each case which quantum exceeds an amount specified under a working plan and budget which has been validated by our Board of Commissioners. The borrowing power canpowers of our Board of Directors may only be varied.varied through an amendment to the Articles of Association.
The Board of Directors is responsible for leading and managing our Company in accordance with our objectives and purposes and to control, preserve and manage the assets of our Company.
Table of Content
Our Articles of Association do not contain any requirement for theour Directors to: (i) retire by a specified age,age; or (ii) to own any or a specified number of shares of our Company. The rights, preferences and restrictions attaching to each class of the shares of our Company in respect of specified matters are set forth below:
-· Dividend rights. Dividends are to be paid based upon our financial condition and in accordance with the resolution of the shareholders in a general meeting,GMS, which will also determine the form of and time forof payment of the dividend;
-· Voting rights. The holder of each voting share is entitled to one vote at a GMS;
-· Rights to share in our Company’s profits.profits. See dividend rights;
-· Rights to share in any surplus in the event of liquidation. Stockholders are entitled to surplus in the event of liquidation in accordance with their proportion of shareholding, provided the nominal value of the common stock that they hold is fully paid-up;
-· Redemption provisions. There are no stock redemption provisions in our Articles.Articles of Association. However, based on Article 37 of the Indonesian Company Law, we may buy back up to 10% of our issued and outstanding shares;
-· Reserved fund provisions. RetainedWe are required to set aside retained earnings up to a minimumin the amount of at least 20% of our issued capital are to be set aside to cover potential losses suffered by us.losses. If the amount in the reserved fund exceeds 20% of our issued capital, a GMS may authorize us to utilize such excess funds for the purposes of our Company;
-· Liability for further capital calls. Our shareholders may be asked to subscribe for new shares in our Company from time to time. Such rights are to be offered to shareholders prior to being offered to third parties and may be transferred at the option of the shareholder. TheOur Board of Directors is authorized to offer the new shares to third parties in the event that an existing shareholder is unable or unwilling to subscribe for such new shares; and
-· ProvisionsOur Articles of Association do not contain any provisions discriminating against any existing or prospective holder of such securities because of such shareholder owning a substantial number of sharesshares.. The Articles do not contain any such provision.
In order to change the rights of shareholders, an amendment to the relevant provisions of theour Articles would beof Association is required. Any amendment to our Articles of Association requires the Articles requiresapproval of the holder of the Series A Dwiwarna Share and the other shareholders or their authorized proxies jointly representing at least two thirds (2/3) of the total number of votes cast in the meeting.
102
Table of Content
Any GMS may only be convened upon the issuance of the requisite notice by us. In addition, the Board of Directors may issue such notice and convene an EGMS based on a written request by the Board of Commissioners or one or more shareholders holding at least 10% of our shares. The notice is to be published in at least two newspapers in Indonesia (one each in Bahasa Indonesia and English) having general circulation within Indonesia and other media in accordance withon the provisionswebsite of Indonesian capital markets rulesour Company and regulations.the IDX. Such announcement/notice of a GMS is required to be given to shareholders at least 14 days (excluding the date of(without counting the notice date and the date of the invitation)invitation date) prior to the invitation for the GMS. The invitation for the GMS is also required to be published in at least two newspapers in Indonesia having general circulation within Indonesia and other media in accordancethe same manner as with the provisionsannouncement of Indonesian capital markets rules and regulationsthe notice at least 14 days (excluding the date of(without counting the invitation date and the date of the meeting)meeting date) prior to the GMS. The quorum for AGMS or EGMS isrequires shareholders representing more than halfone-half of the total shares with voting rights issued by us. In case the quorum is not reached, then the invitation to thea second meeting can be made without prior announcement/notice that aan invitation to a meeting will be made. Such invitation to the meeting is required to be served at least seven days prior to the second meeting (not including the date of(without counting the invitation todate and the meeting and the date of the meeting)date). The second meeting will be valid and may pass binding resolutions if attended by shareholders representing at least one thirdone-third of the total shares with valid voting rights. In case the quorum is not reached at the second meeting, a third meeting may be held, at theour Company’s request, with the quorum of attendance to be determined by the Chairman of the OJK in accordance with the provisions of the laws.
Stockholders may vote by proxy. All resolutions are to be passed by consensus.consensus and deliberation. If consensus cannot be reached, resolutions are passed by simple majority, unless a larger majority is required by the Articles. Theour Articles of Association. Our Articles of Association do not contain any limitations on the right of any person, to own our shares or to exercise their right to vote. Indonesian capital market regulations do not contain any limitation on the right of any person, whether local or foreign, to own shares in a company listed on the IDX.
Table of Content
Any takeover of our Company is required to be approved by the holder of the Series A Dwiwarna Share and a majority constituting at least three fourthsthree-fourths of the total number of shares at a GMS that must be attended by the holder of the Series A Dwiwarna Share. There are no other provisions in theour Articles of Association that would have the effect of delaying, deferring or preventing a change in control of our Company.
Each Director and Commissioner has an obligation to report to the OJK with regard to their ownership and any changes in their ownership of our Company, and this obligation also applies to shareholders who have an ownership stake of 5% or more in our paid up capital. We believe that theour Articles of Association are not significantly different from those generally prevailing in Indonesia in respect of companies listed on the IDX (other than with respect to provisions and rights relating to the Dwiwarna Share, which are common for SOEs listed on the IDX). We also believe that the provisions in theour Articles of Association relating to changes in our capital are not more stringent than that required by Indonesian law.
C.MATERIAL CONTRACTS
In 20132016 and 2012,2015, we did not enter into any new material contracts nor did we amend any existing material contracts, other than contracts entered into or amended in the ordinary course of business as disclosedindisclosed at Note 3833 of our Consolidated Financial Statements. Statement.
D.EXCHANGE CONTROLS
See Item 3 “Key Information –Selected— Selected Financial Data –— Exchange Controls” included elsewhere in this Form 20-F.
E. TAXATION
The following summary contains a description of the principal Indonesian and USUnited States federal tax consequences of the purchase, ownership and disposition of ADSs or shares of common stock. This summary does not purport to be a complete description of all of the tax considerations that may be relevant to a decision to purchase, own or dispose of ADSs or shares of common stock.
Investors should consult their tax advisors about the Indonesian and US Federal,United States federal, state and local tax consequences to them of the purchase, ownership and disposition of ADSs or shares of common stock.
a.Indonesian Taxation
The following is a summary of the principal Indonesian tax consequences of the ownership and disposition of common stock or ADSs to a non-resident individual or non-resident entity that holds common stock or ADSs (a “Non-Indonesian Holder”). A “non-resident individual” is a foreign national individual who does not reside or intend to reside in Indonesia and is not physically present in Indonesia at the mostfor more than 183 days within 12 montha 12-month period, during which period such non-resident individual receives income in respect of the ownership or disposition of common stock or ADSs and a “non-resident entity” is a corporation or a non-corporate body that is established, domiciled or organized under the laws of a jurisdiction other than Indonesia and does not have a fixed place of business or otherwise conducts business or carries out activities through a permanent establishment in Indonesia during an Indonesian tax year in which such non-resident entity receives income in respect of the ownership or disposition of common stock or ADSs. In determining the residency of an individual or entity, consideration will be given to the provisions of any applicable double taxation treaty to which Indonesia is a party.
103
Table of Content
1.Dividends
Dividends declared by us out of retained earnings and distributed to a Non-Indonesian Holder in respect of common stock or ADSs are subject to Indonesian withholding tax, which, as of the date of this Annual Report, is at the rate of 20%, on the amount of the distribution (in the case of cash dividends) or on the shareholders’ proportional share of the value of the distribution. A lower rate provided under double taxation treaties may be applicable, provided the recipient is able to comply with the following strict requirements: (i) the recipient of the income is the beneficial owner of the dividends, (ii) the recipient of the income must have submitted a specific form set by the Indonesian Tax Office acting as a Certificate of Residency (the “Certificate of Residency”) that is filled in by the recipient of the income and validated by the competent authority of the country where the recipients arerecipient is resident and (iii) the recipient of the income does not misuse the tax treaty as set out in the provision on the prevention of misuse themisuseofthe tax treaty. Indonesia has concluded double taxation treaties with a number of countries, including Australia, Belgium, Canada, France, Germany, Japan, Malaysia, the Netherlands, Singapore, Sweden, Switzerland, the United Kingdom and the United States of America.States. Under the US-IndonesiaUnited States-Indonesia double taxation treaty, the withholding tax on dividends is generally, in the absence of a 25% voting interest, reduced to 15%.
2.Capital Gains
The sale or transfer of common stock through the IDX is subject to a final withholding tax at the rate of 0.1% of the value of the transaction. The broker executing the transaction is obligated to withhold such tax. The holding of founder shares or the sale or transfer of founder shares through anthroughthe IDX may, under current Indonesian tax regulations, be subject to additional income tax if the 0.5% final income tax.
tax has not been settled after the initial public offering.
Subject to the promulgation of implementing regulations, the estimated net income received or accrued from the sale of movable assets in Indonesia, which may include common stock not listed on anthe IDX or ADSs, by a Non-Indonesian holderHolder (with the exception of the sale of assets under Article 4 paragraph (2) of the Indonesian income tax law) may be subject to Indonesian withholding tax at the rate of 20%. In 1999, the Ministry of Finance issued a decision that stipulates the estimated net income for
There is no specific tax regulation on the sale of listed shares receivedoutside the IDX. If the transfer of listed shares outside the IDX by a non-resident taxpayer inis considered as the transfer of unlisted shares by a non-public company tonon-resident taxpayer, then general tax regulation will be 25% of the sale price, resulting in an effectiveapplied, that is, withholding tax rate of 5% of the sales price. This is a final withholding tax andprice (or subject to the obligation to pay lies with the buyer (if it is an Indonesian taxpayer) or our Company (if the buyer is a non-resident taxpayer). Exemption from withholding tax on income from the sale of shares in a non-public company may be available to non-resident sellers of shares depending on the provisions of the relevant double taxation treaties. In order to benefit from the exemption under the relevant double taxation treaty, the non-resident seller must provide a specific form set by the Indonesian Tax Office acting as a Certificate of Residence that is completed by the recipient of the income and validated by the competent authority of the country where the recipients are resident to the buyer or our Company and to the Indonesian Tax Office that has jurisdiction over the buyer or our Company (if the buyer is a non-resident taxpayer).
treaty) will be applicable.
In cases where a purchaser or Indonesian broker will beis required under Indonesian tax laws to withhold tax on payment of the purchase price for common stock or ADSs through the IDX, theoretically, that payment may be exempt from Indonesian withholding or other Indonesian income tax under applicable double taxation treaties to which Indonesia is a party (including the US-IndonesiaUnited States-Indonesia double taxation treaty). However, except for the sale or transfer of shares in a non-public company, the current Indonesian tax regulations do not provide specific procedures for removing the purchaser’s or Indonesian broker’s obligation to withhold tax from the proceeds of such sale. To take advantage of the double taxation treaty relief, Non-Indonesian Holders may have to seek a refund from the Indonesian Tax Office through the IDX by making a specific application accompanied by a specific form set by the Indonesian Tax Office acting as a Certificate of Residency that is filled in by the recipient of the income and validated by the competent authority of the country where the recipients are resident.
3.Stamp Duty
Stock transactions in Indonesia are subject to stamp duty. Pursuant to Government Regulation No. 24/No.24/2000, on the amendment and thenominal amount of the Indonesian stamp duty rates Imposing Limits Imposed Price Nominal stamp duty,is Rp6,000 for transactions having a transactionvalue greater than Rp1 million and Rp3,000 for transactions having a value of up to Rp1,000,000 needs a stamp duty of Rp3,000, while any transaction of more than Rp1,000,000 needs a stamp duty of Rp6,000.Rp1 million.
104
Table of Content
b.Considerations Regarding Certain USU.S. Federal Income Tax
Pursuant to requirements relating to practice before the Internal Revenue Service, any tax advice in this communication (including any attachments) is not intended to be used and cannot be used, for the purpose of (i) avoiding penalties imposed under the US Internal Revenue Code, or (ii) promoting, marketing, or recommending to another person any tax-related matter.
The following is a summary of certain USU.S. federal income tax considerations relating to the acquisition ownership and disposition of ADSs or common stock by US Holders (as defined below) that hold theirfor ADSs or common stock as “capital assets” (generally, property held for investment) under section 1221 of the USU.S. Internal Revenue Code of 1986, as amended, (the “Tax Code”“Code”). This summary is based upon existing US federal income tax law,the Code, its legislative history, final, temporary and proposed U.S. Treasury regulations promulgated thereunder, published rulings and court decisions, as well as the Convention between the Government of the United States and the Government of the Republic of Indonesia for the Avoidance of Double Taxation and the Prevention of Fiscal Evasion with Respect to Taxes on Income (the “Treaty”), as in effect on the date hereof, all of which isare subject to differing interpretationschange, or change,changes in interpretation, possibly with retroactive effect. In addition, this discussion is based in part upon representations of the depositary and the assumption that each obligation in the deposit agreement and any related agreements will be performed according to its terms.
Table of Content
This summary does not discuss all aspects of USU.S. federal income taxation which may be important to particular investors in light of their individual investment circumstances, including investors subject to special tax rules (for example, financial institutions, insurance companies, broker-dealers, partnerships and their partners, and tax-exempt organizations (including private foundations)), holders who are not USU.S. Holders, investors that will hold ADSs or common stock as part of a straddle, hedge, conversion, constructive sale, or other integrated transaction for USU.S. federal income tax purposes, or investors that have a functional currency other than the USU.S. Dollar, all of whom may be subject to tax rules that differ significantly from those summarized below. In addition, this summary does not discuss any USaddress U.S. federal estate, and gift or alternative minimum taxes, the U.S. federal Medicare tax considerations,on net investment income, or state, local, or non-USnon-U.S. tax considerations. Each holder is urged to consult theirits tax advisorsadvisor regarding the USU.S. federal, state, local and non-USnon-U.S. income, and other tax considerations of their investment in the ADSs or common stock.
For purposes of this summary, a “US“U.S. Holder” is a beneficial owner of ADSs or common stock that is, for USU.S. federal income tax purposes, (i) an individual who is a citizen or resident of the US,United States, (ii) a corporation, or other entity treated as a corporation for US federal income tax purposes, created in, or organized under the laws of, the USUnited States or any state thereof or the District of Columbia, (iii) any entity created or organized in or under the laws of any other jurisdiction if treated as a domestic corporation pursuant to the Tax Code, (iv) an estate the income of which is includible in gross income for USU.S. federal income tax purposes regardless of its source, or (v)(iv) a trust (A) the administration of which is subject to the primary supervision of a USU.S. court and which has one or more USU.S. persons who have the authority to control all substantial decisions of the trust or (B) that has otherwise electedmade a valid election to be treated as a USU.S. person under the Tax Code.
If a partnership (or other entity treated as a “tax transparent” entity for USU.S. tax purposes) is the beneficial owner of ADSs or common stock, the tax treatment of a partner in the partnership (or interest holder in the “tax transparent” entity) will generally depend uponon the status of the partner (or interest holder) and the activities of the partnership (or “tax transparent” entity). For USU.S. federal income tax purposes, USU.S. Holders of ADSs will be treated as the beneficial owners of the underlying Common Stockcommon stock represented by the ADSs.
1.Distributions on the Common Shares or ADSsThreshold Passive
Subject to the discussion below under “Passive Foreign Investment Company (“PFIC”) Classification Matters
A non-US corporation, suchCompany”, below, the gross amount of any distribution (without reduction for any Indonesian tax withheld) we make on the common shares or ADSs out of our current or accumulated earnings and profits (as determined for U.S. federal income tax purposes) will be includible in your gross income as ordinary dividend income when the distribution is actually or constructively received by you, or by the depositary in the case of ADSs. Distributions that exceed our Company,current and accumulated earnings and profits will be treated as a return of capital to you, to the extent of your basis in the ADSs or common shares and thereafter as capital gain. We, however, do not calculate earnings and profits in accordance with U.S. tax principles. Accordingly, all distributions by us to U.S. Holders will generally be treated as dividends. Any dividend will not be eligible for the dividends-received deduction generally granted to U.S. corporations in respect of dividends received from U.S. corporations. The amount of any distribution of property other than cash will be the fair market value of such property on the date of such distribution.
Subject to certain exceptions for short-term and hedged positions, the U.S. Dollar amount of dividends received by certain non-corporate holders will be subject to taxation at a maximum rate of 20% if the dividends are “qualified dividends”. Dividends paid on ADSs or common shares will be treated as qualified dividends if either (i) we are eligible for the benefits of a comprehensive income tax treaty with the United States that the Internal Revenue Service, or IRS, has approved for the purposes of the qualified dividend rules, or (ii) the dividends are with respect to ADSs readily tradable on a U.S. securities market, provided, in each case, that we were not, in the year prior to the year in which the dividend was paid, and are not, in the year in which the dividend is paid, a passive foreign investment company, or PFIC. The Treaty has been approved for the purposes of the qualified dividend rules, and we expect to qualify for benefits under the Treaty so long as there is substantial and regular trading in our common shares on the IDX. We are considered a qualified foreign corporation with respect to the ADSs because our ADSs are listed on the New York Stock Exchange. Finally, based on our audited Consolidated Financial Statements and relevant market data, we believe that we did not satisfy the definition for PFIC status for USU.S. federal income tax purposes if 75% or more of its gross income consists of certain types of “passive” income or 50% or more of its assets are passive. Basedwith respect to our 2016 taxable year. In addition, based on our 2013audited Consolidated Financial Statements and our current expectations regarding the value and nature of our assets, the sources and nature of our income, and relevant market data, we do not anticipate becoming a PFIC for our 2017 taxable year or any future year. However, our status in the current year and future years will depend on our income and assets we do not believe that we should be classified as a PFIC(which for 2013. Because PFIC status is a fact-intensive determination madethis purpose depends in part on an annual basis, no assurance can be given that we are notthe market value of the ADSs or will not become classified as a PFIC. Thecommon shares) in those years. See the discussion below under “Dividends” and “Sale or Other Disposition“Passive Foreign Investment Company”.
Holders of ADSs or common stock” is written onshares should consult their own tax advisors regarding the basis that we will not be classified as a PFIC for US federal incomeavailability of the reduced dividend tax purposes.
rate in light of their own particular circumstances.
105
Table of Content
2.Dividends
Any cash distributions paid by us outThe amount of earnings and profits, as determined under US federalthe dividend distribution that a U.S. holder must include in its income tax principles, will be subjectthe U.S. Dollar value of the Rupiah payments made, determined at the spot Rupiah/U.S. Dollar rate on the date the dividend distribution is actually or constructively received, regardless of whether the payment is in fact converted into U.S. Dollars. Generally, any gain or loss resulting from currency exchange fluctuations during the period from the date the U.S. holder includes the dividend payment in income to tax as dividend income andthe date it converts the payment into U.S. Dollars will be includible in the gross income of a US Holder upon receipt. A non-corporate recipient of dividend income will generally be subject to tax on dividend income from a “qualified foreign corporation” at a maximum US federal tax rate of 15% rather than the marginal tax rates generally applicable to ordinary income provided that certain holding period requirements are met. Note that as from January 1, 2011, dividends from a qualified foreign corporation are treated as ordinary income or loss from U.S. sources.
Subject to various limitations, any Indonesian tax withheld from distributions in accordance with a maximumthe Treaty will be deductible or creditable against your U.S. federal income tax rate of 39.6% for non-corporate recipients of dividends received after the end of 2010. A non-US corporation (other than a PFIC)liability. Dividends paid by us generally will constitute income from sources outside the United States for U.S. foreign tax credit limitation purposes and will be considered to be a qualified foreign corporation (i) if it is eligible for the benefits of a comprehensive tax treaty with the US which the Secretary of Treasury of the US determines is satisfactory for purposes of this provision and which includes an exchange of information programcategorized as “passive category income” or, (ii) with respect to any dividend it pays on stock (or ADSs backed by such stock) which is readily tradable on an established securities market in the US. There is currently acase of certain U.S. Holders, as “general category income” for U.S. foreign tax treaty in effect betweencredit purposes.
In the US and Indonesia which the Secretary of Treasury has determined is satisfactory for these purposes andevent we believe that we should be eligible for the benefits of the treaty. Additionally, because the ADSs are listedrequired to withhold Indonesian income tax on the NYSE, an established securities market in the US, they are considered readily tradable on that exchange.
The amount of any cash distributiondividends paid in Rupiah should equal the US Dollar value of such Rupiah on the date of receipt of the distribution, regardless of whether the Rupiah are actually converted into US Dollar at that time. Gain or loss, if any, recognized on a subsequent sale, conversion, or other disposition of Rupiah generally will be US source ordinary income or loss. Dividends receivedto U.S. Holders on the ADSs or common stock will generallyshares (see discussion under “Indonesian Taxation”), you may be able to claim a reduced 15% rate of Indonesian withholding tax if you are eligible for benefits under the Treaty. You should consult your own tax advisor about the eligibility for reduction of Indonesian withholding tax.
You may not be eligible for the dividends received deduction allowed to corporations.
Dividends generally will be treated as income from foreign sources for US foreign tax credit purposes. A US Holder may be eligible, subject to a number of complex limitations,able to claim a foreign tax credit in respect of any foreign withholding(and instead may claim a deduction) for non-U.S. taxes imposed on dividends receivedpaid on the ADSs or common stock. A US Holder who doesshares if you (i) have held the ADSs or common shares for less than a specified minimum period during which you are not electprotected from risk of loss with respect to claimsuch shares, or (ii) are obligated to make payments related to the dividends (for example, pursuant to a short sale). The rules relating to the U.S. foreign tax credit forare complex and U.S. Holders may be subject to various limitations on the amount of foreign tax withheld, may instead claimcredits that are available. In addition, if the dividends are taxed as qualified dividend income (as discussed above), the amount of the dividend taken into account for purposes of calculating a deduction, for US federalU.S. Holder's foreign tax credit limitation will generally be limited to the gross amount of the taxable dividend, multiplied by the reduced tax rate applicable to qualified dividend income and divided by the highest tax purposes,rate normally applicable to dividends. U.S. Holders should consult their own tax advisors regarding the effect of these rules in respect of such withholdings, but only for a year in which such holder elects to do so for all creditable foreign income taxes.
their particular circumstance.
3.Sale or Other Disposition of ADSs or Common Stock
A US holderSubject to the discussion below under “Passive Foreign Investment Company”, upon a sale, exchange or other disposition of the ADSs or common shares, you will generally recognize capital gain or loss for U.S. federal income tax purposes in an amount equal to the difference between the U.S. Dollar value of the amount realized and your tax basis, determined in U.S. Dollars, in such ADSs or common shares. Generally, gain or loss recognized upon the sale or other disposition of ADSs or common stock in an amount equal to the difference between the amount realized upon the disposition and the holder’s adjusted tax basis in such ADSs or common stock. Anyshares will be capital gain or loss, will be long-term capital gain or loss if the U.S. Holder's holding period for such ADSs or Common Stock have been held for more thancommon shares exceeds one year, and will be income or loss from sources within the United States for foreign tax credit limitation purposes. For non-corporate U.S. Holders, the U.S. income tax rate applicable to net long-term capital gain currently will not exceed 20%. The deductibility of capital losses is subject to significant limitations.
A U.S. Holder that receives foreign currency from a sale or disposition of ADSs or common shares generally will realize an amount equal to the U.S. Dollar value of the foreign currency determined on (i) the date of receipt of payment in the case of a cash basis U.S. Holder and (ii) the date of disposition in the case of an accrual basis U.S. Holder. If ADSs or common shares are treated as traded on an “established securities market”, a cash basis taxpayer or, if it so elects, an accrual basis taxpayer, will determine the U.S. Dollar value of the amount realized by translating the amount received at the spot rate of exchange on the settlement date of the sale. A U.S. Holder will have a tax basis in the foreign currency received equal to the U.S. Dollar amount realized. Any currency exchange gain or loss realized on a subsequent conversion of the foreign currency into U.S. Dollars for a different amount generally will be treated as ordinary income or loss from sources within the United States. However, if such foreign currency is converted into U.S. Dollars on the date received by the U.S. Holder, a cash basis or electing accrual basis U.S. Holder should not recognize any gain or loss on such conversion.
Any gain or loss will generally be USU.S. source gain or loss for US foreign tax credit purposes. The deductibilitylimitation purposes and as a result of the U.S. foreign tax credit limitation, foreign taxes, if any, imposed upon capital gains in respect of the ADSs or common shares may not be currently creditable. U.S. Holders should consult their own tax advisors regarding the effect of these rules in their particular circumstances.
Table of Content
Passive Foreign Investment Company
In general, a foreign corporation is a PFIC for any taxable year in which, after applying relevant look-through rules with respect to the income and assets of subsidiaries:
·75% or more of its gross income consists of passive income, such as dividends, interest, rents, royalties, and gains from the sale of assets that give rise to such income; or
·50% or more of the average quarterly value of its gross assets consists of assets that produce, or are held for the production of, passive income.
“Passive income” for this purpose includes, for example, dividends, interest, royalties, rents and gains from commodities and securities transactions. Passive income does not include rents and royalties derived from the active conduct of a capital losstrade or business. If the stock of a non-U.S. corporation is subjectpublicly traded for the taxable year, the asset test is applied using the fair market value of the assets for purposes of measuring such corporation's assets. If we own at least 25% (by value) of the stock of another corporation, we will be treated, for purposes of the PFIC tests, as owning our proportionate share of the other corporation's assets and receiving our proportionate share of the other corporation's income for purposes of the PFIC income and asset tests.
Based on the current and anticipated composition of our assets and income and the current expectations regarding the price of the ADSs and common shares, we believe that we were not a PFIC for U.S. federal income tax purposes with respect to limitations.
4.our 2016 taxable year and we do not intend to become or anticipate becoming a PFIC Considerationsfor any future taxable year. However, the determination of PFIC status is a factual determination that must be made annually at the close of each taxable year, and therefore, there can be no certainty as to our status in this regard until the close of the 2017 taxable year. Changes in the nature of our income or assets or a decrease in the trading price of the ADSs or common shares may cause us to be considered a PFIC in the current or any subsequent year.
If we were to be classified as a PFIC in any taxable year a US Holderthat you held the ADSs or common shares, you generally would be subject to special rules generally intendedwith respect to reduce or eliminate any benefits from the deferral of US federal income tax that a US Holder could derive from investing in a non-US company that does not distribute all of its earnings on a current basis. In such event, a US Holder may be subject to tax at ordinary income tax rates on (i) any gain recognized“excess distributions” made by us on the sale of ADSs or common stockshares and (ii) any “excess distribution” paid onwith respect to gain from your disposition of the ADSs or common stock (generally, a distributionshares. An “excess distribution” generally is defined as the excess of the distributions you receive with respect to the ADSs or common shares in excess ofany taxable year over 125% of the average annual distributions paid byyou have received from us induring the shorter of the three preceding years, or your holding period for the ADSs or common shares. Generally, you would be required to allocate any excess distribution or gain from the disposition of the ADSs or common shares ratably over your holding period for the ADSs or common shares. The portion of the excess distribution or gain allocated to a prior taxable years). In addition,year, other than a US Holder willyear prior to the first year in which we became a PFIC, would be taxed at the highest U.S. federal income tax rate on ordinary income in effect for such taxable year, and you would be subject to an interest charge on the resulting tax liability, determined as if the tax liability had been due with respect to such particular taxable year. The portion of the excess distribution or gain that is not allocated to prior taxable years, together with the portion allocated to the years prior to the first year in which we became a PFIC, would be included in your gross income for the taxable years of the excess distribution or disposition and taxed as ordinary income. If we were a PFIC in any year during a U.S. Holder's holding period, we would generally be treated as a PFIC for each subsequent year absent a “purging” election by the U.S. Holder.
These adverse tax consequences may be avoided if the U.S. Holder is eligible to and does elect to annually mark-to-market the ADSs or common shares. If a U.S. Holder makes a mark-to-market election, such holder will generally include as ordinary income the excess, distribution. Finally,if any, of the 15% maximum ratefair market value of the ADSs or common shares at the end of each taxable year over their adjusted basis, and will be permitted an ordinary loss in respect of the excess, if any, of the adjusted basis of the ADSs or common shares over their fair market value at the end of the taxable year (but only to the extent of the net amount of income previously included as a result of the mark-to-market election). Any gain recognized on Company dividendsthe sale or other disposition of the ADSs or common shares will be treated as ordinary income during any year in which we are a PFIC. The mark-to-market election is available only for “marketable stock”, which is stock that is traded in other than de minimis quantities for at least 15 days during each calendar quarter on a qualified exchange or other market, as defined in the applicable Treasury regulations. The ADSs should qualify as “marketable stock” because the ADSs are listed on the New York Stock Exchange. However, the stock of any of our subsidiaries that were PFICs would not applybe eligible for the mark-to-market election.
Table of Content
A U.S. Holder's adjusted tax basis in the ADSs or common shares will be increased by the amount of any income inclusion and decreased by the amount of any deductions under the mark-to-market rules. If a U.S. Holder makes a mark-to-market election it will be effective for the taxable year for which the election is made and all subsequent taxable years unless the ADSs or common shares are no longer regularly traded on a qualified exchange or the IRS consents to the revocation of the election. U.S. Holders are urged to consult their tax advisors about the availability of the mark-to-market election, and whether making the election would be advisable in their particular circumstances.
Alternatively, a timely election to treat us as a qualified electing fund could be made to avoid the foregoing rules with respect to excess distributions and dispositions. You should be aware, however, that if we become classified as a PFIC. Each US Holder is urgedPFIC, we do not intend to consult its tax advisor regarding the potential tax consequencessatisfy record keeping requirements that would permit you to such holder ifmake a qualified electing fund election.
If we are or become classifiedwere regarded as a PFIC, a U.S. Holder of ADSs or common shares generally would be required to file an information return on IRS Form 8621 for any year in which the holder received a direct or indirect distribution with respect to the ADSs or common shares, recognized gain on a direct or indirect disposition of the ADSs or common shares, or made an election with respect to the ADSs or common shares, reporting distributions received and gains realized with respect to the ADSs or common shares. In addition, if we were regarded as well as certain electionsa PFIC, a U.S. Holder would be required to file an annual information return (also on IRS Form 8621) relating to the holder's ownership of the ADSs or common shares. This requirement would be in addition to other reporting requirements applicable to ownership in a PFIC.
We encourage you to consult your own tax advisor concerning the U.S. federal income tax consequences of holding the ADSs or common shares that may be available to mitigate such consequences.would arise if we were considered a PFIC.
5.Backup Withholding Tax and Information Reporting Requirements
USU.S. backup withholding tax and information reporting requirements generally apply to certain payments made to certain non corporatenon-corporate holders of stock. Information reporting generally will apply to payments of dividends on and to proceeds from the sale or redemption of, ordinary shares made within the USUnited States or by a US payU.S. payor or USU.S. middleman to a holder of ordinary sharesADSs or common stock (other than an “exempt recipient,” including a corporation, a payee that is not a USU.S. person that provides an appropriate certification, and certain other persons).
A payor will be required to withhold backup withholding tax from any payments of dividends on, or the proceeds from the sale or redemption of, ADSs or common stock within the USUnited States or by a USU.S. payor or USU.S. middleman to a holder, other than an exempt recipient, if such holder fails to furnish its correct taxpayer identification number or otherwise fails to comply with, or establish an exemption from, such backup withholding tax requirements. The backup withholding tax rate is 25% for years through 2013.
106
Table of Content
The backup withholding tax is not an additional tax and may be credited against a US holder’sU.S. Holder’s regular USU.S. federal income tax liability or, if in excess of such liability, refunded by the Internal Revenue Service (“IRS”)IRS if a timely refund claim is filed with the IRS. Copies of any information returns or tax returns for claims for refund filed by non-US
Information With Respect To Foreign Financial Assets
Certain U.S. Holders with the IRS may be made available byrequired to report information with respect to such holder's interest in “specified foreign financial assets” (as defined in Section 6038D of the IRS, under the provisionsCode), including stock of a specific treaty or other agreement providing for information exchange,non-U.S. corporation that is not held in an account maintained by certain financial institutions, if the aggregate value of all such assets exceeds certain dollar thresholds. Persons who are required to report specified foreign financial assets and fail to do so may be subject to substantial penalties. U.S. Holders are urged to consult their own tax advisors regarding the foreign financial asset reporting obligations and their possible application to the taxing authoritiesholding of the country in which a non-US Holder resides.
ADSs or common shares.
F.DIVIDENDS AND PAYING AGENTS
Not applicable.
G.STATEMENT BY EXPERTS
Not applicable.
Table of Content
H.DOCUMENTS ON DISPLAY
Any material which is filed as an exhibit to this Annual Report on Form 20-F with the USU.S. Securities and Exchange Commission is available for inspection at our offices. See Item 4 “Information on the Company”Company — History and Development of the Company — ProfileofTelkom Indonesia”.
I.SUBSIDIARY INFORMATION
Not applicable.
ITEM 11.QUANTITATIVE11. QUANTITATIVE AND QUALITATIVE DISCLOSURE ABOUT MARKET RISK
We are exposed to market risks that arise from changes in foreign exchange rates and interest rates credit risk and liquidity risk, each of which will have an impact on us. We do not generally hedge our long-term liabilities in foreign currencies but hedge our obligations for the current year. As of December 31, 2013,2016, assets in foreign currencies reached 87.0%reached99.77% against our liabilities denominated in foreign currencies. Our exposure to interest rate risk is managed through a mix of fixed and variable rate liabilities and assets, including short-term fixed rate assets. Our exposure to such market risks fluctuated during 2011, 20122014, 2015 and 20132016 as the Indonesian economy was affected by changes in the US Dollar-RupiahU.S. Dollar to Rupiah exchange rate and interest rates themselves. We are not able to predict whether such conditions will continue during 20142017 or there after.thereafter.
ForeignExchange Rate Risk
We are exposed to foreign exchange risk on sales, purchases and borrowings that are denominated in foreign currencies, primarily in U.S. dollarU.S.Dollar and Japanese yen.Yen. Our exposures to other foreign exchange rates are not material. Increasing risks of foreign currency exchange rates on our obligations are expected to be offset by time deposits and receivables in foreign currencies that are equal to at least 25% of theofour outstanding current liabilities.
The information presented in the following table is based on assumptions of selling and buyingbid andoffer rates in USU.S. Dollar, as well as other currencies, which were quoted by Reuters on December 31, 201330, 2016 and applied respectively to monetary assets and liabilities. The buyingbid and selling ratesofferrates as of December 31, 201330, 2016 were Rp12,160Rp13,470 and Rp12,180Rp13,475 to US$1,1.00, respectively.
107
Table of Content
However, we believe these assumptions and the information described in the following table may be influenced by a number of factors, including a fluctuation and/or depreciation of the Rupiah in the future.
| Outstanding Balance as of December 31, 2013 | | Expected Maturity Date | | Fair Value | |
| Foreign Currency | | Rp Equiv. | | 2014 | | 2015 | | 2016 | | 2017 | | 2018 | | Thereafter | | |
| (million) | | (Rp million) | | (Rp million) | |
ASSETS | | | | | | | | | | | | | | | | | | |
Cash and Cash Equivalents | | | | | | | | | | | | | | | | | | |
US Dollar | 394 | | 4,801,231 | | 4,801,231 | | - | | - | | - | | - | | - | | 4,801,231 | |
Japanese Yen | 1 | | 142 | | 142 | | - | | - | | - | | - | | - | | 142 | |
Other(1) | 11 | | 138,825 | | 138,825 | | - | | - | | - | | - | | - | | 138,825 | |
Other Current Financial Assets | | | | | | | | | | | | | | | | | | |
US Dollar | 11 | | 131,256 | | 131,256 | | - | | - | | - | | - | | - | | 131,256 | |
Trade Receivables | | | | | | | | | | | | | | | | | | |
Related Parties | | | | | | | | | | | | | | | | | | |
US Dollar | 2 | | 29,660 | | 29,660 | | - | | - | | - | | - | | - | | 29,660 | |
Third Parties | | | | | | | | | | | | | | | | | | |
US Dollar | 66 | | 806,437 | | 806,437 | | - | | - | | - | | - | | - | | 806,437 | |
Other(1) | 0 | | 2,030 | | 2,030 | | - | | - | | - | | - | | - | | 2,030 | |
Other Receivables | | | | | | | | | | | | | | | | | | |
US Dollar | 1 | | 8,271 | | 8,271 | | - | | - | | - | | - | | - | | 8,271 | |
Other(1) | 0 | | 1,583 | | 1,583 | | - | | - | | - | | - | | - | | 1,583 | |
Advances and Other Non-current Assets | | | | | | | | | | | | | | | | | | |
US Dollar | 6 | | 70,253 | | - | | 70,253 | | - | | - | | - | | - | | 70,253 | |
LIABILITIES | | | | | | | | | | | | | | | | | | |
Trade Payables | | | | | | | | | | | | | | | | | | |
Related Parties | | | | | | | | | | | | | | | | | | |
US Dollar | 1 | | 17,014 | | 17,014 | | - | | - | | - | | - | | - | | 17,014 | |
Third Parties | | | | | | | | | | | | | | | | | | |
US Dollar | 275 | | 3,356,036 | | 3,356,036 | | - | | - | | - | | - | | - | | 3,356,036 | |
Other(1) | 4 | | 52,711 | | 52,711 | | - | | - | | - | | - | | - | | 52,711 | |
Other Payables | | | | | | | | | | | | | | | | | | |
US Dollar | 8 | | 92,938 | | 92,938 | | - | | - | | - | | - | | - | | 92,938 | |
Other(1) | 0 | | 1,145 | | 1,145 | | - | | - | | - | | - | | - | | 1,145 | |
Accrued Expenses | | | | | | | | | | | | | | | | | | |
US Dollar | 51 | | 626,637 | | 626,637 | | - | | - | | - | | - | | - | | 626,637 | |
Japanese Yen | 19 | | 2,158 | | 2,158 | | - | | - | | - | | - | | - | | 2,158 | |
Other(1) | 0 | | 175 | | 175 | | - | | - | | - | | - | | - | | 175 | |
Advances from Customers and Suppliers | | | | | | | | | | | | | | | | | | |
US Dollar | 2 | | 19,526 | | 19,526 | | - | | - | | - | | - | | - | | 19,526 | |
Other(1) | 0 | | 122 | | 122 | | - | | - | | - | | - | | - | | 122 | |
Current Maturities of Long-term Liabilities | | | | | | | | | | | | | | | | | | |
US Dollar | 35 | | 424,610 | | 424,610 | | - | | - | | - | | - | | - | | 465,793 | |
Japanese Yen | 768 | | 88,976 | | 88,976 | | - | | - | | - | | - | | - | | 116,603 | |
Promissory Notes | | | | | | | | | | | | | | | | | | |
US Dollar | 29 | | 349,169 | | 276,022 | | 61,995 | | 11,152 | | - | | - | | - | | 348,665 | |
Long-term Liabilities(2) | | | | | | | | | | | | | | | | | | |
US Dollar | 79 | | 960,415 | | - | | 352,264 | | 240,707 | | 154,036 | | 54,317 | | 159,091 | | 973,557 | |
Japanese Yen | 7,679 | | 889,763 | | - | | 88,976 | | 88,976 | | 88,976 | | 88,976 | | 533,859 | | 893,355 | |
| Outstanding Balance as of December 31, 2016 | | Expected Maturity Date | | Fair Value | |
Foreign Currency (million) | | Rp Equivalent (Rp billion) | | 2017 | | 2018 | | 2019 | | 2020 | | 2021 | | Thereafter | | |
| | (Rp billion) | | |
ASSETS | | | | | | | | | | | | | | | | | | |
Cash and Cash Equivalents | | | | | | | | | | | | | | | | | | |
| U.S. Dollar | 204 | | 2,749 | | 2,749 | | - | | - | | - | | - | | - | | 2,749 | |
| Japanese Yen | 6 | | 1 | | 1 | | - | | - | | - | | - | | - | | 1 | |
| Others(1) | 21 | | 282 | | 282 | | - | | - | | - | | - | | - | | 282 | |
Other Current Financial Assets | | | | | | | | | | | | | | | | | | |
| U.S. Dollar | 9 | | 117 | | 117 | | - | | - | | - | | - | | - | | 117 | |
| Others(1) | 0 | | 5 | | 5 | | - | | - | | - | | - | | - | | 5 | |
Trade Receivables | | | | | | | | | | | | | | | | | | |
Related Parties | | | | | | | | | | | | | | | | | | |
| U.S. Dollar | - | | - | | - | | - | | - | | - | | - | | - | | - | |
| Others(1) | - | | - | | - | | - | | - | | - | | - | | - | | - | |
(1) Assets and liabilities denominated in other foreign currencies are presented as US Dollars equivalents using the Reuters buy and sell rates prevailing at end of the reporting period.
|
(2) Long-term liabilities for the purpose of this table consist of loans denominated in foreign currencies from two-step loans, obligation under finance leases and long-term bank loans.
|
108
Table of Content
| Outstanding Balance as of December 31, 2016 | | Expected Maturity Date | | Fair Value | |
Foreign Currency (million) | | Rp Equivalent (Rp billion) | | 2017 | | 2018 | | 2019 | | 2020 | | 2021 | | Thereafter | | |
| | (Rp billion) | | |
Third Parties | | | | | | | | | | | | | | | | | | |
| U.S. Dollar | 107 | | 1,437 | | 1,437 | | - | | - | | - | | - | | - | | 1,437 | |
| Others(1) | 4 | | 51 | | 51 | | - | | - | | - | | - | | - | | 51 | |
Other Receivables | | | | | | | | | | | | | | | | | | |
| U.S. Dollar | 0 | | 6 | | 6 | | - | | - | | - | | - | | - | | 6 | |
| Others(1) | 0 | | 1 | | 1 | | - | | - | | - | | - | | - | | 1 | |
Advances and Other Non-current Assets | | | | | | | | | | | | | | | | | | |
| U.S. Dollar | 4 | | 56 | | 56 | | - | | - | | - | | - | | - | | 56 | |
LIABILITIES | | | | | | | | | | | | | | | | | | |
Trade Payables | | | | | | | | | | | | | | | | | | |
Related Parties | | | | | | | | | | | | | | | | | | |
| U.S. Dollar | 0 | | 2 | | 2 | | - | | - | | - | | - | | - | | 2 | |
| Others(1) | 0 | | 0 | | 0 | | - | | - | | - | | - | | - | | 0 | |
Third Parties | | | | | | | | | | | | | | | | | | |
| U.S. Dollar | 163 | | 2,194 | | 2,194 | | - | | - | | - | | - | | - | | 2,194 | |
| Japanese Yen | 5 | | 1 | | 1 | | - | | - | | - | | - | | - | | 1 | |
| Others(1) | 6 | | 51 | | 51 | | - | | - | | - | | - | | - | | 51 | |
Other Payables | | | | | | | | | | | | | | | | | | |
| U.S. Dollar | 5 | | 72 | | 72 | | - | | - | | - | | - | | - | | 72 | |
| Others(1) | 1 | | 16 | | 16 | | - | | - | | - | | - | | - | | 16 | |
Accrued Expenses | | | | | | | | | | | | | | | | | | |
| U.S. Dollar | 28 | | 376 | | 376 | | - | | - | | - | | - | | - | | 376 | |
| Japanese Yen | 21 | | 2 | | 2 | | - | | - | | - | | - | | - | | 2 | |
| Others(1) | - | | 3 | | 3 | | - | | - | | - | | - | | - | | 3 | |
Advances from Customers and Suppliers | | | | | | | | | | | | | | | | | | |
| U.S. Dollar | - | | 7 | | 7 | | - | | - | | - | | - | | - | | 7 | |
Current Maturities of Long-term Liabilities | | | | | | | | | | | | | | | | | | |
| U.S. Dollar | 11 | | 147 | | 147 | | - | | - | | - | | - | | - | | 170 | |
| Japanese Yen | 768 | | 88 | | 88 | | - | | - | | - | | - | | - | | 107 | |
Promissory Notes | | | | | | | | | | | | | | | | | | |
| U.S. Dollar | - | | 1 | | 1 | | - | | - | | - | | - | | - | | 1 | |
Long-term liabilites(2) | | | | | | | | | | | | | | | | | | |
| U.S. Dollar | 64 | | 863 | | - | | 143 | | 236 | | 194 | | 178 | | 112 | | 724 | |
| Japanese Yen | 5,375 | | 619 | | - | | 88 | | 88 | | 88 | | 88 | | 267 | | 630 | |
(1) Assets and liabilities denominated in other foreign currencies are presented as U.S. Dollar equivalents using the Reuters bid and offer rates prevailing at the end of the reporting period. | |
(2) Long-term liabilities for the purpose of this table consist of loans denominated in foreign currencies from two-step loans, obligation under finance leases and long-term bank loans. | |
Interest Rate Risk
Our exposure to interest rate fluctuations results primarily from changes to the floating rate applied for long-term debt. This risk relates to loans under the Government on-lending program that has been used to finance our capital expenditures.Interestexpenditures.Interest rate fluctuation is monitored to minimize any negative impact to financial position. Borrowings at variable interest rates exposeour Company and our subsidiaries to interest rate risk. To measure market risk fluctuations in interest rates,our Companyand our subsidiariesprimarily use interestmarginusetheinterestmargin and maturity profile of the financial assets and liabilities based on changingonthechanging schedule of the interest rate.
Table of Content
The actual cash flows from our debt are denominated in Rupiah,US U.S. Dollar,, and Japanese Yen, as appropriate and as indicated in the table. The information presented in the table has been determined based on the following assumptions: (i) fixed interest rates on Rupiah time deposits are based on average interest rates offered for three monththree-month placements in effect as of December 31,2013 2016 by the banks where such deposits were located; (ii) variable interest rates on Rupiah denominated long-term liabilities are calculated as of December 31,2013 2016 and are based on contractual terms setting interest rates based on average rates for the preceding six months on three monththree-month certificates issued by Bank of Indonesia or based on the average three monththree-month deposit rate offered by the lenders; (iii) fixed interest rates onUS U.S. Dollar deposits are based on average interest rates offered for three monththree-month placements by the various lending institutions where such deposits are located as of December 31,2013 2016; and (iv) the value of marketable securities is based on the value of such securities on December 31,2013. 2016. However, these assumptions may change in the future. These assumptions are different from the rates used in our Consolidated Financial Statements; accordingly, amounts shown in the table may differ from the amounts shown in our Consolidated Financial Statements.
Interest Rate Risk | Outstanding Balance as of December 31, 2016 | | Expected Maturity Date | | Fair Value
| |
Original Currency (in millions) | | Rupiah Equivalent (in billions) | | Rate (%) | | 2017 | | 2018 | | 2019 | | 2020 | | 2021 | | Thereafter | | |
| | | (Rp billion) | | |
ASSETS | | | | | | | | | | | | | | | | | | | | |
Fixed Rate | | | | | | | | | | | | | | | | | | | | |
Cash and Cash Equivalent | | | | | | | | | | | | | | | | | | | | |
Time Deposit | | | | | | | | | | | | | | | | | | | | |
Rupiah | 23,857,045 | | 23,858 | | 3.20% - 10.00% | | 23,858 | | - | | - | | - | | - | | - | | 23,858 | |
U.S. Dollar | 119 | | 1,596 | | 0.10% - 2.00% | | 1,596 | | - | | - | | - | | - | | - | | 1,596 | |
Singapore Dollar | 14 | | 139 | | 0.80% - 1.00% | | 139 | | - | | - | | - | | - | | - | | 139 | |
Other Current Financial Assets | | | | | | | | | | | | | | | | | | | | |
Time Deposit | | | | | | | | | | | | | | | | | | | | |
Rupiah | 62,352 | | 63 | | 5.75% - 6.00% | | 63 | | - | | - | | - | | - | | - | | 63 | |
U.S. Dollar | 1 | | 13 | | 0.58% - 1.64% | | 13 | | - | | - | | - | | - | | - | | 13 | |
Available-for-sale Financial Assets | | | | | | | | | | | | | | | | | | | | |
Rupiah | 1,075,865 | | 1,076 | | 10.40% | | 1,076 | | - | | - | | - | | - | | - | | 1,076 | |
U.S. Dollar | 6 | | 82 | | 6.88% - 7.25% | | 82 | | - | | - | | - | | - | | - | | 82 | |
| | | | | | | | | | | | | | | | | | | | |
LIABILITIES | | | | | | | | | | | | | | | | | | | | |
Short-term Bank Loans | | | | | | | | | | | | | | | | | | | | |
Variable Rate | | | | | | | | | | | | | | | | | | | | |
Rupiah | | | | | | | | | | | | | | | | | | | | |
Principal | 639,811 | | 640 | | - | | 640 | | - | | - | | - | | - | | - | | 640 | |
Interest | - | | - | | - | | - | | - | | - | | - | | - | | - | | - | |
Fixed Rate | | | | | | | | | | | | | | | | | | | | |
Rupiah | | | | | | | | | | | | | | | | | | | | |
Principal | 271,199 | | 271 | | - | | 271 | | - | | - | | - | | - | | - | | 271 | |
Interest | - | | - | | - | | - | | - | | - | | - | | - | | - | | - | |
Long-term Liabilities(1) | | | | | | | | | | | | | | | | | | | | |
Variable Rate | | | | | | | | | | | | | | | | | | | | |
Rupiah | | | | | | | | | | | | | | | | | | | | |
109
Table of Content
| Outstanding Balance as of December 31, 2013 | | Expected Maturity Date | | |
Original Currency (million) | | Rp Equiv. (Rp million) | | Rate (%) | | 2014 | | 2015 | | 2016 | | 2017 | | 2018 | | There after | | Fair Value | | |
| (Rp million) | | |
ASSETS | | | | | | | | | | | | | | | | | | | | | |
Fixed Rate | | | | | | | | | | | | | | | | | | | | | |
Cash and Cash Equivalents | | | | | | | | | | | | | | | | | | | | | |
Time deposit | | | | | | | | | | | | | | | | | | | | | |
Rupiah | 8,185,170 | | 8,185,170 | | 1.00-11.50 | | 8,185,170 | | - | | - | | - | | - | | - | | 8,185,170 | | |
US Dollar | 309 | | 3,767,769 | | 0.03-3.00 | | 3,767,769 | | - | | - | | - | | - | | - | | 3,767,769 | | |
Available-for-Sale Financial Assets | | | | | | | | | | | | | | | | | | | | | |
Rupiah | 140,781 | | ,140,781 | | 1.60-10.50 | | 140,781 | | - | | - | | - | | - | | - | | 140,781 | | |
US Dollar | 11 | | 131,256 | | 1.00-1.10 | | 131,256 | | - | | - | | - | | - | | - | | 131,256 | | |
LIABILITIES | | | | | | | | | | | | | | | | | | | | | |
Short-term Bank Loans | | | | | | | | | | | | | | | | | | | | | |
Variable Rate | | | | | | | | | | | | | | | | | | | | | |
Rupiah | | | | | | | | | | | | | | | | | | | | | |
Interest Rate Risk | | Outstanding Balance as of December 31, 2016 | | Expected Maturity Date | | Fair Value
| |
| Original Currency (in millions) | | Rupiah Equivalent (in billions) | | Rate (%) | | 2017 | | 2018 | | 2019 | | 2020 | | 2021 | | Thereafter | |
| | | | (Rp billion) | | |
Principal | 431,751 | | 431,751 | | - | | 431,751 | | - | | - | | - | | - | | - | | 431,751 | | 14,207,819 | | 14,208 | | - | | 3,561 | | 4,539 | | 2,139 | | 2,022 | | 859 | | 1,088 | | 14,127 | |
Interest | 8,868 | | 8,868 | | 8.00-13.00 | | 8,868 | | - | | - | | - | | - | | - | | - | | 3,078,363 | | 3,078 | | 6.86% - 13.8% | | 1,207 | | 858 | | 482 | | 269 | | 142 | | 120 | | - | |
Long-term Liabilities (1) | | | | | | | | | | | | | | | | | | | | | |
Variable Rate | | | | | | | | | | | | | | | | | | | | | |
Rupiah | | | | | | | | | | | | | | | | | | | | | |
Principal | 9,223,335 | | 9,223,335 | | - | | 3,685,445 | | 2,651,044 | | 950,368 | | 835,399 | | 540,934 | | 560,145 | | 9,026,752 | | |
Interest | 1,661,905 | | 1,661,905 | | 6.58-11.09 | | 635,136 | | 416,386 | | 221,357 | | 141,740 | | 82,187 | | 165,099 | | - | | |
US Dollar | | | | | | | | | | | | | | | | | | | | | |
U.S. Dollar | | | | | | | | | | | | | | | | | | | | | |
Principal | 83 | | 1,008,691 | | - | | 473,947 | | 264,718 | | 175,757 | | 94,269 | | - | | - | | 1,034,976 | | 42 | | 567 | | - | | 34 | | 33 | | 151 | | 134 | | 134 | | 81 | | 471 | |
Interest | 2 | | 21,332 | | 1.17-6.50 | | 11,228 | | 6,402 | | 2,806 | | 896 | | - | | - | | - | | 3 | | 46 | | 2.31% - 2.63% | | 13 | | 12 | | 10 | | 7 | | 3 | | 1 | | - | |
Fixed Rate | | | | | | | | | | | | | | | | | | | | | | | | | | | | | | | | | | | | | | | | |
Rupiah | | | | | | | | | | | | | | | | | | | | | | | | | | | | | | | | | | | | | | | | |
Principal | 3,000,000 | | 3,000,000 | | - | | - | | 1,005,000 | | - | | - | | - | | 1,995,000 | | 3,141,774 | | 10,976,758 | | 10,977 | | - | | 72 | | 160 | | 359 | | 2,319 | | 258 | | 7,809 | | 11,337 | |
Interest | 1,471,571 | | 1,471,571 | | 9.60-10.20 | | 299,970 | | 253,070 | | 203,490 | | 203,490 | | 203,490 | | 308,061 | | - | | 11,480,118 | | 11,480 | | 5.18% - 11.00% | | 1,133 | | 1,121 | | 1,106 | | 1,007 | | 828 | | 6,285 | | - | |
US Dollar | | | | | | | | | | | | | | | | | | | | | |
U.S. Dollar | | | | | | | | | | | | | | | | | | | | | |
Principal | 53 | | 643,805 | | - | | 196,624 | | 126,357 | | 53,911 | | 53,911 | | 53,911 | | 159,091 | | 671,332 | | 31 | | 419 | | - | | 108 | | 109 | | 85 | | 60 | | 43 | | 14 | | 417 | |
Interest | 7 | | 82,847 | | 4.00-4.56 | | 24,982 | | 16,136 | | 12,331 | | 10,142 | | 7,985 | | 11,271 | | - | | 3 | | 36 | | 2.18% - 3.82% | | 13 | | 10 | | 7 | | 4 | | 2 | | 0 | | - | |
Japanese Yen | | | | | | | | | | | | | | | | | | | | | | | | | | | | | | | | | | | | | | | | |
Principal | 8,447 | | 978,739 | | - | | 88,976 | | 88,976 | | 88,976 | | 88,976 | | 88,976 | | 533,859 | | 1,009,958 | | 6,143 | | 707 | | - | | 88 | | 88 | | 88 | | 89 | | 89 | | 267 | | 737 | |
Interest | 1,506 | | 174,511 | | 3.10 | | 29,646 | | 26,887 | | 24,197 | | 21,371 | | 18,613 | | 53,797 | | - | | 770 | | 89 | | 2.95% | | 20 | | 18 | | 15 | | 12 | | 10 | | 14 | | - | |
Finance Leases | | | | | | | | | | | | | | | | | | | | | |
Finance Lease | | | | | | | | | | | | | | | | | | | | | |
Rupiah | | | | | | | | | | | | | | | | | | | | | | | | | | | | | | | | | | | | | | | | |
Principal | 4,886,957 | | 4,886,957 | | - | | 617,493 | | 501,917 | | 512,343 | | 546,364 | | 544,869 | | 2,163,971 | | 4,886,957 | | 4,003,729 | | 4,004 | | - | | 652 | | 626 | | 605 | | 613 | | 634 | | 874 | | 4,003 | |
Interest | 1,926,984 | | 1,926,984 | | 7.70-12.50 | | 419,551 | | 357,392 | | 310,177 | | 260,154 | | 208,217 | | 371,493 | | - | | 1,149,097 | | 1,149 | | 2.75% - 15.00% | | 328 | | 266 | | 211 | | 158 | | 105 | | 81 | | - | |
US Dollar | | | | | | | | | | | | | | | | | | | | | |
U.S. Dollar | | | | | | | | | | | | | | | | | | | | | |
Principal | 7 | | 81,696 | | - | | 30,061 | | 23,183 | | 22,191 | | 5,855 | | 406 | | - | | 81,696 | | 1 | | 6 | | - | | 6 | | - | | - | | - | | - | | - | | 6 | |
Interest | 1 | | 9,084 | | 8.00 | | 3,215 | | 2,639 | | 2,506 | | 685 | | 39 | | - | | - | | - | | 1 | | 4.00% - 5.80% | | 1 | | - | | - | | - | | - | | - | | - | |
(1) Long-term liabilities consist of loans which are subject to interest; namely two-step loans, bonds and notes, long-term bank loans and other borrowings, which in each case include their maturities. | | (1) Long-term liabilities consist of loans which are subject to interest; namely two-step loans, bonds and notes, long-term bank loans and other borrowings, which in each case include their maturities. | |
(1) Long-term liabilities consist of loans which are subject to interest; namely two-step loans, bonds and notes, obligation under finance leases and long-term bank loans, which in each case include their maturities.
|
ITEM 12.DESCRIPTION12. DESCRIPTION OF SECURITIES OTHER THAN EQUITY SECURITIES
American Depositary Shares
Bank of New York Mellon Corporation (previously “The Bank of New York”) serves as the “Depositary” for our ADSs, which are traded on the NYSE and LSE.
NYSE.
Investors pay a depositary fee directly, or through a broker acting on their behalf, for the delivery or surrender of ADSs for the purpose of withdrawal. The Depositary also collects fees for making distributions to investors by deducting the fee from the amount distributed or by selling a portion of the distributable property to pay the fee. The Depositary may collect its annual fee for depositary services by making a deduction from the cash distributions or by directly billing investors or by charging the book-entry system accounts of the parties acting on their behalf. The Depositary may refuse to provide fee-generating services until its bills for such services are paid.
110
Table of Content
Costs Related to ADS Issue andand Handling
Shareholders depositing or withdrawing ordinary shares or ADS must pay: |
| For: |
|
US$5 (or less) per 100 ADS (or part of 100 ADS). | | Issuance of ADS,ADSs, including issuance resulting from a distribution of shares or rights or other property. Cancellation of ADSADSs for the purpose of withdrawal, including in case of termination of the deposit agreement. | |
US$0.02 (or less) per ADS. | | Any cash payment to registered ADS shareholders. | |
Up to US$0.05 per ADS. | | Receiving or distributing dividends. | |
A fee equivalent to the fee payable if the securities distributed to shareholders had been shares and those shares had been deposited for the issuance of ADS. | | Delivery of securities by the Depositary to registered ADS shareholders. | |
US$0.02 (or less) per ADS per calendar year. | | Depositary services. | |
Registration or transfer fees. | | Transfer or registration of shares on the share register to or from the name of the Depositary or its agent when shareholders deposit or withdraw ordinary shares. | |
Depositary Fees.fees. | | Telegram, telex and fax transmissions (if provided for in the deposit agreement). Converting foreign currency to US Dollar.U.S. Dollars. | |
Taxes and other duties levied by the government, the Depositary or the custodian upon payment of the ADSADSs or other shares underlying the ADS,ADSs, such as share transfer tax, stamp duty or income tax. | | As necessary. | |
Any costs incurred by the Depositary or its agent for servicing the securities deposited. | | As necessary. | |
The Depositary has agreed to reimburse us up to US$400,0001.0 million in 2016 for certain expense we incur in relation to the administration and maintenance of the ADS facility, including, but not limited to, investor relations expenses, legal fees and disbursements and other ADS program-related expenses. In addition, the Depositary has agreed to reimburse us an additional amount of up to US$850,000 per year until 2015in 2017 and for the five years thereafter for certain expenses we incur in relation to the administration and maintenance of the ADS facility, including, but not limited to, direct or indirect investor relations expenses and other ADS program-related expenses. The reimbursement will be evaluated and adjusted if the Depositary’s collection of dividend fees and the number of ADSs outstanding falls below a stipulated minimum or if they are delisted fromminimum.
The table below sets forth the NYSE. We expect to renegotiatetypes of expenses and the reimbursement amount for subsequent years after 2015. In 2013, we receivedinvoices that the Depositary has reimbursed in 2016US$319,000 in reimbursements from the Depositary.:
111
Types of Fees |
| Amount (US$) |
|
Listing and related fees for 2016 | | 479,946 | |
Training expenses | | 63,519 | |
AGMS-related expenses for 2016 | | 10,953 | |
Expenses related to the preparation of our annual report and sustainability reportfor 2016 | | 47,789 | |
Expenses related to investor education | | 124,468 | |
Expenses related to investor relations activities | | 42,175 | |
Total |
| 768,850 |
|
The Depositary did not waive, or pay directly to third parties on our behalf, any expenses relating to the year ended December 31, 2016.
Table of Content
PART II
ITEM 13.DEFAULTS,13. DEFAULTS, DIVIDEND ARREARAGES AND DELINQUENCIES
There are no defaults, dividend arrearages and delinquencies to which this Item applies.
ITEM 14.MATERIAL14. MATERIAL MODIFICATIONS TO THE RIGHTS OF SECURITY HOLDERS AND USE OF PROCEEDS
Not applicable.
ITEM 15.CONTROLS15. CONTROLS AND PROCEDURES
a.Disclosure Controls and ProceduresA. DISCLOSURE CONTROLS AND PROCEDURES
Management conducted an evaluation on the effectiveness of the company'sofourCompany's disclosure controls and procedures under the supervision and with the participation oftheof management, including the President Director, which is of the same level asChief Executive Officer(“CEO”)andFinance Director,as CEOandDirector of Finance, which is of the same level asChief Financial Officer (“CFO”)as CFO (as such term is defined in Rules 13a-15(e) and 15d-15(e) under the Securities Exchange Act). Based on this evaluation,the CEO and CFO have concluded that, as of December 31,2013,the company’s31,2016,our Company’s disclosure controls and procedures were effective.Disclosure controls and proceduresconducted by the managementinclude controls and proceduresthat are designed to ensure that information required to be disclosed in reports filed or submitted under the Exchange Act is recorded, processed, summarized and reported within the time periods specified in the SEC’s rules and forms, and that such information is accumulated and communicated to our management, including theCEO and CFO, as appropriate, to allow timely decisions regarding required disclosure.
b.Management’s Report on Internal Control over Financial ReportingB. MANAGEMENT’S REPORT ON INTERNAL CONTROL OVER FINANCIAL REPORTING
TheOur Company's Managementmanagement is responsible forestablishing and maintaining adequate internal control over financial reporting, as such term is defined in Exchange Act Rules 13a-15(f) and 15d-15(f).The internal control over financial reporting is a process designed by, or under the supervision of,the CEO and CFO, and executed bythe Board ofDirectors, management and other personnel, to provide reasonable assurance regarding the reliability of financial reporting and the preparation ofConsolidated Financial Statementsofconsolidatedfinancialstatements for external purposes in accordance with IFRS as issued by the IASB, and includes those policies and procedures that (1) pertain to the maintenance of records that, in reasonable detail, accurately and fairly reflect the transactions and dispositions of the assets oftheof our Company, (2) provide reasonable assurance that transactions are recorded as necessary to permit preparation ofconsolidated financial statements in accordance with IFRS as issued by the IASB, and that receipts and expenditures oftheof our Company are being made only in accordance with authorizations oftheofour Company’smanagement andBoard of Directors, and (3) provide reasonable assurance regarding prevention or timely detection of unauthorized acquisition, use or disposition oftheof our Company’s assets that could have a material effect on theConsolidatedFinancialStatements.
Because of its inherent limitations, internal control over financial reporting may not prevent or detectallmisstatements. Also, projections of any evaluation of effectiveness to future periods are subject to the risk that controls may become inadequate because of changes in conditions, or that the degree of compliance with the policies or procedures may deteriorate.
The managementManagement has assessed the effectiveness ofthe company’sofour Company’s internal control over financial reporting as of December 31, 2013.2016. In making this assessmenttheassessment, management used the criteria set forth in Internal Control – Integrated Framework issued by the Committee of SponsoringOrganizations of the TreadwayCommission (1992TreadwayCommission(“COSO”)(2013 framework)(“COSO”). Based on this assessment, management concluded that as of December 31, 2013,2016, our internal control over financial reporting was effective.
c.Attestation Reportof the Registered Public Accounting FirmC. ATTESTATION REPORT OF THE REGISTERED PUBLIC ACCOUNTING FIRM
The effectiveness of our internal control over financial reporting as of December 31, 20132016 has been audited byKAP Purwantono, SuhermanSungkoro &Surja, an independent registered public accounting firm, as stated in their report which appears onthe Consolidatedis included in theConsolidated Financial Statements.
112
Table of Content
d.Changes in Internal Control over Financial ReportingD. CHANGES IN INTERNAL CONTROL OVER FINANCIAL REPORTING
There have been no significant changes in our Company’s internal control over financial reporting during the most recently completed fiscal year that would materially affect or are reasonably likely to materially affect, our Company’s internal control over financial reporting.
We are committed to continual improvements in internal control processes, and will continue to review and monitor the control over financial reporting and its procedures in order to ensure compliance with the requirements of the Sarbanes-Oxley Act andActof 2002and related regulations as stipulated by COSO.We will also continue to assign significant company resources from time to time to improve itsour internal control over financial reporting.
ITEM 16A.AUDIT16A.AUDIT COMMITTEE FINANCIAL EXPERT
The BoardTheBoard of Commissioners has determinedhasdetermined that Sahat Pardede, as an independent memberMr.Tjatur Purwadi, the secretary of ourthe Audit Committee, qualifies as an Audit Committee FinancialCommitteeFinancial Expert in accordance with the requirements of ItemofItem 16A of Form 20-F and as an “independent” memberpursuantto"independent" member in accordance with the provisions of Rule 10A-3 ofunder the Exchange Act.Mr. PardedePurwadi has been a member of our Audit Committee since February 2004.March 2014. Mr. Purwadi previously served as Director of Assurance at KAP Tanudiredja, Wibisana, Rintis & Partners (a member firm of the PwC global network) from 2012 to2013. Prior to his appointment as a memberthat, he served at our Company since 1979 where he rose to becomeVice-President of our Audit Committee, Sahat Pardede practicedFinancial and is currently practicing, as a Public Accountant in IndonesiaLogistics Policy and provided auditing services and other financial services to numerous private companies and public institutions. He is a Certified Public Accountant and is also a memberHead of the Indonesian Institute of Certified Public Accountants.Internal Audit.
ITEM 16B.CODE16B.CODE OF ETHICS
In compliance with Section 406 of the Sarbanes-Oxley Act of 2002, Section 406, our code of ethics applies equally to our Commissioners, our President Director and our Director of Finance Director (positions equivalent to Chief Executive Officer and Chief Financial Officer, respectively), Directors and other key officers as well as all of our employees. You may view our code of ethics on our web sitewebsite at http://www.telkom.co.id/about-telkom/business-ethics. Amendments to or waivers from the code of ethics will be posted on our website as well. Information contained on that website is not a part of this annual report on Form 20-F. Copies of our code of ethics may also be obtained at no charge by writing to our Investor RelationsUnit at Graha Merah Putih, Jl. Gatot Subroto No.52, 5th Floor, Jakarta 12710, Indonesia.
ITEM 16C.PRINCIPAL16C.PRINCIPAL ACCOUNTANT FEES AND SERVICES
In line with existing procedures and taking into consideration the independence and qualifications of independent auditors, our Annual General Meeting of Shareholders (“AGMS”) onApril 19, 2013atour AGMS on April 22, 2016, we appointed the Public Accountant Firm (or “KAP”)KAP Purwantono, Sungkoro& Surja (formerly Purwantono, Suherman & SurjaSurja) (a member firm of Ernst & Young Global Limited),a registered KAP with the OJK, to perform the audit on our Consolidated Financial Statementsconsolidated financial statements for the fiscal year ended December 31, 20132016 and on theEffectiveness ofInternalControl on Financial Reportingthe effectiveness of internal control over financial reporting as of December 31, 2013.31,2016. The fee for the audit on the Consolidated Financial Statements for fiscal year 20132016 was agreed at Rp28.6Rp37 billion (excluding VAT). The audit fee is excluding consent letter issuance fee to KAP Tanudiredja, Wibisana & Rekan amounted to Rp4.4 billion.
The independent auditor for our Consolidated Financial Statements for fiscal year 2011 was KAP Tanudiredja, Wibisana & Rekan, a member firm of the PwC global network.
KAP Purwantono, SuhermanSungkoro & Surja has been our public accountant firm since 2012.
KAP Purwantono, SuhermanSungkoro & Surja is also assigned to perform an audit onof funds utilization of the Partnership and Community Development Program (“PKBL”) for fiscal year 2013.
113
Table of Content
2016.
Fees and Services of the External AuditorFEES AND SERVICES OF THE EXTERNAL AUDITOR
The following table summarizes the fees for audit serviceservices in 2011, 2012 and2013: 2014, 2015 and2016:
| For Years Ended December 31, | |
| 2011(1) | | 2012(2) | | 2013(2) | |
| (Rp million) | | (Rp million) | | (Rp million) | |
Audit Fees | 40,503 | | 26,619 | | 28,601 | |
Tax Service Fees | 70 | | - | | - | |
All other fees | 400 | | 326 | | 340 | |
| For Years Ended on December 31, | |
| 2014 | | 2015 | | 2016 | |
| (Rp million) | | (Rp million) | | (Rp million) | |
Audit Fee | 34,459 | | 39,943 | | 36,655 | |
All Other Fees | 370 | | 400 | | 1,405 | |
(1)Table of ContentAudited by KAP Tanudiredja, Wibisana & Rekan.
(2)Audited by KAP Purwantono, Suherman & Surja.
Audit Committee Pre-Approval Policies and ProceduresAUDIT COMMITTEE PRE-APPROVAL POLICIES AND PROCEDURES
We have adopted pre-approval policies and procedures under which all non-audit services provided by our independent registered public accounting firm must be pre-approved by our Audit Committee, as set forth in the Audit Committee Charter. Pursuant to the charter, permissible non-audit services may be performed by our independent registered public accounting firm provided that: (i) our Board of Directors must deliver to the Audit Committee (through the Board of Commissioners) a detailed description of the non-audit service that is to be performed by the independent public accounting firm, and (ii) the Audit Committee will determine whether the proposed non-audit service will affect the independence of our independent public accounting firm or would give rise to any conflict of interest.
Pursuant to Section 10(i)(1)(B) of the Exchange Act and paragraph (c)(7)(i)(C) of Rule 2-01 of Regulation S-X issued there under, our Audit Committee Charter waives the pre-approval requirement for permissible non-audit services where: (i) the aggregate amount of the fees for such non-audit services constitutes no more than five5% percent of the total amount of fees paid by us to our independent registered public accounting firm during the year in which the services are provided,provided; or (ii) the proposed services are not regarded as non-audit services at the time the contract to perform the engagement is signed. In addition to these two requirements, the performance of non-audit services must be approved prior to the completion of the audit by a member of the Audit Committee who has been delegated pre-approval authority by the full Audit Committee, or by the full Audit Committee itself. itself.
ITEM 16D.EXEMPTIONS16D. EXEMPTIONS FROM THE LISTING STANDARDS FOR AUDIT COMMITTEES
The NYSE listing standards require that a USUnitedStates listed company must have an Audit Committee,audit committee, a nominating/corporate governance committee and a compensation committee. Each of these committees must consist solely of Independent Directorsindependent directors and must have a written charter that addresses certain matters specified in the listing standards.
The Indonesian Company Law does not require Indonesian public companies to form any of the committees described in the NYSE listing standards. However, Bapepam-LK Rule No.IX.I.5 andthe OJK Audit Committee Regulationand IDX Regulation I-ANo.1-A require theboard ofcommissioners of a public company which is listed on the Board of Commissioners of an IDX-listed companyIDX (such as our Company) to establish an audit committeewhich is chaired by an independent commissioner. In addition, the OJK Audit Committee which must consistRegulation requires each member of such audit committee to be either an independent commissioner or external independent member, with the audit committee comprised of at least three members one of whom must be an Independent Commissioner and serve as chair of the Audit Committee, while the other two members must be independent parties of whomwith at least one such party must have accounting and/or finance expertise.
Our Audit Committee has six members: two Independent Commissioners,independent commissioner and one Commissioner, and three external independent members who are not affiliated with our Company.member and at least one member of the audit committee having expertise in accounting or finance.
The NYSE Listing Standards TheNYSElistingstandards,as required by RulebyRule 10A-3(c)(3) of the Exchange Act require foreign private issuers whose shares are listed on the NYSE to have an Audit Committeeaudit committee comprised of Independent Directors.independent directors. However, such foreign privateforeignprivate issuers may be exempted from the independence requirement ifif: (i) the home country government or stock exchange requires the companythecompany to have an Audit Committee;audit committee; (ii) the Audit Committeeaudit committee is separate from the Boardboard of Directors and includes non-board membersdirectors andincludes non-boardmembers as in our case, members from the Board of Commissioners; (iii)the Audit Committeeauditcommittee members are not selectednotselected by management and no executive officersofficer of the company is a member of the Audit Committee;audit committee; (iv) the home country government or stock exchange requires the Audit Committee to betheauditcommitteetobe independent of the company’s managementthecompany’smanagement; and (v) the Audit Committeetheauditcommittee is responsible for the appointment, retention and oversight of the work of the external auditor.auditors. We avail ourselves of this exemption and document this on our Section 303A Annual Written Affirmations submitted to the NYSE. However, unlike the NYSE Listing StandardsNYSElistingstandards requirements, according to the current provisions for Audit Committeesregulations relating to audit committees in Indonesia, our Audit Committee does not have direct responsibility for the appointment, compensation and retention of thean external auditor. Our Audit Committee may only recommend the appointment of thean external auditor to the Board of Commissioners and the Board of Commissioner’s decision must have the approval of the shareholders.
114
Table of Content
Our Audit Committee has six members: two Independent Commissioners, two Commissioners and two external independent members who are not affiliated with our Company.
Not all members of our Audit Committee are Independent Directorsindependent directors as required by Rule 10A-3 of the Exchange Act. We rely on the general exemption pursuant tounder Rule 10A-3(c)(3) regarding the composition of theour Audit Committee. We believe that our reliance on this exemption does not materially and adversely affect the ability of theour Audit Committee to act independently. We
Table of Content
Further, we believe that the intent of the provision in requiring thatwhich requires each member of the Audit Committee be an Independent Directoraudit committeetobe an independent director is to ensure that the Audit Committeeaudit committee is independent from influence by management and provides a forum separate from management in which auditors and other interested parties can candidly discuss concerns. The Bapepam-LK Audit Committee Rules requireOJK AuditCommittee Regulation requires each member of the Audit Committeean audit committee to be independent. The Bapepam-LK Audit Committee Rules also require that at least two of the members, theeither an independent commissioner or external independent members,member. Suchexternal independent member(s) is/are, in effect, be independent not only of the management but also of the Board of Commissioners, andthe Board of Directors and our Company as a whole. We therefore believe that the standard established by the Bapepam-LKOJK Audit Committee RulesRegulation is at least equally effective in ensuring the ability of the Audit Committeean audit committee to act independently.
ITEM 16E.PURCHASES16E. PURCHASES OF EQUITY SECURITIES BY THE ISSUER AND AFFILIATED PURCHASERS
Share Buy Back Program | | Accordance with | | Purchase Periode | | Total Number of Shares Purchased* | | Average Price Paid per Share in Rp* | | Total Number of Shares Purchased as Part of Publicly Announced Plans* | | Maximum Number of Shares that May Yet Be Purchased Under the Plans* | |
SBB I | | EGMS December 21, 2005 | | May 19, 2006 - June 06, 2007 | | 211,290,500 | | 8,657 | | 211,290,500 | | - | |
SBB II | | AGMS June 29, 2007 | | June 29, 2007 - December 28, 2008 | | 215,000,000 | | 9,160 | | 215,000,000 | | - | |
SBB III | | AGMS June 20, 2008 | | June 20, 2008 - December 20, 2009 | | 64,284,000 | | 7,238 | | 64,284,000 | | - | |
SBB IV | | AGMS May 19, 2011 | | May 19, 2011 - November 20, 2012 | | 520,355,960 | | 7,305 | | 520,355,960 | | - | |
*before stock splitNot applicable.
As of December 31, 2012, we had repurchased 1,010,930,460 common stock shares, equivalent to 5.2% of our issued and outstanding common stock, at an aggregate repurchase price of Rp8,067 billion, excluding broker and custodian fees. Under our repurchase program, we repurchased 118,376,500 shares in 2006, 126,364,000 shares in 2007, 245,834,000 shares in 2008, 283,085,460 shares in 2011 and 237,270,500 shares in 2012. In 2011 and 2012, we repurchased 520,355,960 common stock shares at an aggregate repurchase price Rp3,803 billion.
On April 19, 2013 in accordance with the Resolution of the AGMS and regard with clause 4 letter a number (3) Bapepam-LK XI.B.2 we executed the transfer of 59,811,400, or after stock split 299,057,000 shares of Series B from Share Buyback Phase III through Employee Stock Ownership Program.
On July 30, 2013, we have sold 211,290,500 or after stock split 1,056,452,500 shares which are part of Share Buyback Phase I by private placement. The selling price after stock split was Rp2,280 per share, which is not lower than Rp1,731 per share which is the average repurchase price after stock split of treasury stock,Rp2,258 per share which is the average closing priceafter stock split for the last 90 (ninety) days before the sale, and Rp2,280 per share after stock split, which is the closing price on the day before the selling date.
As of December 31, 2013, our treasury stock balance is 739,828,560 or after stock split 3,699,142,800 common stock shares, equivalent to 3.8% of our issued and outstanding common stock which comprise of Share Buyback Phase II and IV with average repurchase price after stock split were Rp1,832 and Rp1,462, excluding broker and custodian fees. See Note 23 to our Consolidated Financial Statement.
We plan to retain, sell or use repurchased stock for other purposes in accordance withBapepam-LK RuleNo.XI.B.2, Law No.40/2007 regarding Limited Liability Companies and the resolutions of the AGMS on April 19, 2013, that require the Board of Directors to seek prior approval from the Board of Commissioners to undertake any change or transfer of treasury stock and report its utilization or transfer to the AGMS. Before giving its approval, the Board of Commissioners must consult with the holder of the Series A Dwiwarna share.
See Note 23 to our Consolidated Financial Statement.
115
Table of Content
ITEM 16F.CHANGE16F. CHANGE IN REGISTRANT’S CERTIFYING ACCOUNTANT
Not applicable.
ITEM 16G.CORPORATE16G. CORPORATE GOVERNANCE
The following is a summary of significant differences between the corporate governance practices followed by Indonesian companies and those required by NYSE listing standards for domestic USUnited States issuers.
a.Overview of Indonesian LawA. OVERVIEW OF INDONESIAN LAW
Indonesian public companies are required to observe and comply with certain Good Corporate Governancegood corporate governance practices. The requirements and the standards for good corporate governance practices for public companies are embodied in the following regulations: Law No.40/2007 on Limited Liability Companies (“the Indonesian Company Law”);Law; the Indonesian Capital Market Law;the Indonesian Law No.8/1995 on Capital Markets (“Capital Markets Law”); Law No.19/2003 on State-Owned Enterprises;SOEs; Regulation of the Minister of State-Owned Enterprises No.PER-09/EnterprisesNo.PER-09/MBU/2012 on Amendment of Regulation of the MinistertheMinister of State-Owned Enterprises No.PER-01/EnterprisesNo.PER-01/MBU/2011 on the Implementation of Good Corporate Governance to State-Owned Enterprises; the regulations of OJK (“OJK Regulations”)regulations; and the rules issued by the IDX. InIDX rules.In addition to the above, the articles of association of public companies incorporate provisions directing the implementation of good corporate governance practices.
Similar to the laws of the US,United States, Indonesian laws require public companies to observe and comply with corporate governance standards that are more stringent than those applied to privately-owned companies. In Indonesia, the term “public company” does not necessarily refer to a company whose shares are listed on a securities exchange. Under the CapitaltheIndonesianCapital Markets Law, a non-listed company may be deemed a public company, and subjected to the laws and regulations governing public companies, if such company meets or exceeds the capital and shareholder requirements applicable to a publicly-listed company.
On November 30, 2004, the National Committee on Governance (“NCG”) was established pursuant to the Decree of the Coordinating Minister for Economic Affairs No.KEP.49/M.EKONOM/1/2004 (“KEP.49”), which was formed to revitalize the former National Committee on Good Corporate Governance established in 1999. The NCG aimed at enhancing comprehensionaims to enhance thecomprehension and implementation of good governance in Indonesia and advises the Government on governance issues, both in public and corporate sectors. Furthermore, based on Decree of the Coordinating Minister for Economic Affairs No.KEP-14/M.EKON/03/2008, dated March 18, 2008 (“KEP.14”), KEP.49 was revoked. Therefore, any working results which have been made by the Committee, which was established based ontheCommittee operating under KEP.49, will be delivered and continued by the Committee under KEP.14.
continuedpursuant toKEP.14.
The NCG formulated the Code for Good Corporate Governance 2006 (“Code”(the“GCGCode”) which recommended setting more stringent corporate governance standards for Indonesian companies, such as the appointment of Independent Commissionersofindependentcommissioners and nomination and remuneration committees by the Board of Commissioners,theboard ofcommissioners, as well as increasing the scope of disclosure obligations for Indonesian companies. Although the NCG recommended that the GCG Code be adopted by the Government as a basis for legal reform, as of the date of this Annual Report, the Government has not enacted regulations that fully implement the provisions of theGCGCode.
Table of Content
In 2014, the Code.
OJK issued the Indonesia Corporate Governance Roadmap, which provides for recommendations for Indonesian issuers and public companies to implement certain corporate governance standards, such as procedures with respect to conduct of EGMS and nominations of directors and commissioners.
b.Composition of Independent Board of Directors and Board of CommissionersB. COMPOSITION OF INDEPENDENT BOARD OF DIRECTORS AND BOARD OF COMMISSIONERS
The NYSE listing standards provide that the Board of Directorstheboard ofdirectors of a USUnited States listed company must consist of a majority of Independent Directors andindependent directorsand that certain committees must consist solely of Independent Directors. A Directorofindependentdirectors. Adirector qualifies as independent only if the board affirmatively determines that the Directorthedirector has no material relationship with the company, either directly or indirectly.
Unlike companies incorporated in the US,United States, the management of an Indonesian company consists of two organs of equal stature, the Board of Directorstheboard ofdirectors and the Board of Commissioners.theboard ofcommissioners. Generally, the Board of Directorstheboard ofdirectors is responsible for the day-to-day business activities of the company and is authorized to act for and on behalf of the company, while the Board of Commissionerstheboard ofcommissioners has the authority and responsibility to supervise the Board of Directorstheboard ofdirectors and is statutorily mandated to provide advice to theboard ofdirectors by the Board of Directors by Indonesian Company Law.
With regard to the Board of Commissioners, the IndonesiaThe Indonesian Company Law requires the board of commissioners of a public company Board of Commissioners to have at least two members. Although the Indonesian Company Law is silent as to the composition of the Boardboard of Commissioners, Listing Regulation No.IA in KEP.305/BEJ/07-2004 issued by the IDX(“commissioners, IDX Regulation I-A”)statesI-Astates that at least 30% of the members of the Boardboard of Commissionerscommissioners of a public company (such as our Company) must be independent.
116
Table of Content
The Indonesian Company Law states that the Boardprovidesthat theboard ofdirectors of Directors hasa listed companyhas the authority to manage the daily operationoperations of the company and must have at least two members, each of whom must meet the minimum qualification requirements set forth in the Indonesian Company Law. In addition, based on IDX Regulation I-A, the Board of Directorstheboard ofdirectors of the listed company must consist of at least one unaffiliated director.
oneindependentdirector.
Given the difference between the role of the members of the Board of Directorstheboard ofdirectors in an Indonesian company and that of their counterparts in a USUnited States company, Indonesian law does not require that certain members of the Board of Directorstheboard ofdirectors must be independent and neither does it require the creation of certain committees composed entirely of Independent Directors.
ofindependentdirectors.
c.Committees C. COMMITTEES
See Item 16D “Exemptions from the Listing Standards for Audit Committees”.
d.Disclosure Regarding Corporate GovernanceD. DISCLOSURE REGARDING CORPORATE GOVERNANCE
The NYSE listing standards require USUnited States companies to adopt, and post on their websites, a set of corporate governance guidelines. The guidelines must address, among other things: director qualification standards, director responsibilities, director access to management and independent advisers,advisors, director compensation, director orientation and continuing education, management succession, and an annual performance evaluation itself. In addition, the CEO of a USUnited States company must certify to the NYSE annually that he or she is not aware of any violations by the company of the NYSE’s corporate governance listing standards. The certification must be disclosed in our Annual Report to shareholders. Indonesian law does not have disclosure requirements similar to NYSE listing standards. However, the Indonesian Capital Markets Law generally requires Indonesian public companies to disclose certain types of information to shareholders and to the OJK, particularly information relating to changes in the public company’s shareholdings and material facts that may affect the decision of shareholders to maintain their share ownership in such public company.
e.Code of Business Conduct and EthicsE. CODE OF BUSINESS CONDUCT AND ETHICS
NYSETheNYSE listing standards require each USUnited States listed company to adopt, and post on its web site,website, a code of business conduct and ethics for its Directors,itsdirectors, officers and employees. There is no similar requirement under Indonesian law. However, companies that are required to file or furnish reports to the SEC must disclose in their Annual Reports whether they have adopted a code of ethics for their senior financial officers. Although the requirements as to the contents of the code of ethics under SEC rules are not identical to those set forth in the NYSE listing standards, there are significant similarities in which under SEC rules, the code of ethics must be designed to promote: (a) honest and ethical conduct, including the handling of conflicts of interest between personal and professional relationships; (b) full, fair, accurate and timely disclosure in reports and documents filed with or submitted to the SEC; (c) compliance with applicable laws and regulations; (d) prompt internal reporting of violations of the code and (e) accountability for adherence to the code. Furthermore, shareholders must be given access to physical or electronic copies of the code.
ITEM 16H.MINE SAFETY DISCLOSURE
Not applicable.
117
Table of Content
ITEM 16H. MINE SAFETY DISCLOSURE
Not applicable.
PART III
ITEM 17.FINANCIAL17. FINANCIAL STATEMENTS
We have responded to Item 18 in lieu of this Item.
ITEM 18.FINANCIAL18. FINANCIAL STATEMENTS
See pages F-1 through F-123.F-130.
ITEM 19.EXHIBITS19. EXHIBITS
The following exhibits are filed as part of this Form 20-F:
1.1
| Articles of Association (as amended on May 8, 2013).
|
8.1
| Please refer to Item 4 “Information on The Company – Organizational Structure” for a list of subsidiaries of the Registrant.
|
12.1 | Certification of the Chief Executive Officer pursuant to Rule 13a-14(a) of the Securities Exchange Act of 1934 and 15 U.S.C. Section 7241, as adopted pursuant to Section 302 of the Sarbanes-Oxley Act of 2002. |
12.2 | Certification of the Chief Financial Officer pursuant to Rule 13a-14(a) of the Securities Exchange act of 1934 and 15 U.S.C. Section 7241, as adopted pursuant to Section 302 of the Sarbanes-Oxley Act of 2002. |
13.1 | Certification of the Chief Executive Officer pursuant to Rule 13a-14(b) of the Securities Exchange Act of 1934 and 18 U.S.C. Section 1350, as adopted pursuant to Section 906 of the Sarbanes-Oxley Act of 2002. |
13.2 | Certification of the Chief Financial Officer pursuant to Rule 13a-14(b) of the Securities Exchange Act of 1934 and 18 U.S.C. Section 1350, as adopted pursuant to Section 906 of the Sarbanes-Oxley Act of 2002. |
15.1
| Letter of the Company’s predecessor auditor to the Securities and Exchange Commission dated March 25, 2014 in relation to Item 16F. Change in Registrant’s Certifying Accountant.
|
118
Table of Content
Exhibit 12.1
SIGNATURESCERTIFICATION PURSUANT TO
15 U.S.C. SECTION 7241,
AS ADOPTEDPURSUANT TO
SECTION 302 OFTHE SARBANES-OXLEY ACT OF 2002
I, Alex J. Sinaga, President Director (Chief Executive Officer) of Perusahaan Perseroan (Persero) PT Telekomunikasi Indonesia Tbk (the “Company”), certify that:
Pursuant to the requirements of Section 12 of the Securities Exchange Act 1934, as amended, the Registrant hereby certifies that it meets all of the requirements for filing1.I have reviewed this Annual Report on Form 20-F of the Company;
2.Based on my knowledge, this report does not contain any untrue statement of a material fact or omit to state a material fact necessary to make the statements made, in light of the circumstances under which such statements were made, not misleading with respect to the period covered by this Report;
3.Based on my knowledge, the financial statements, and other financial information included in this report, fairly present in all material respects the financial condition, results of operations and cash flows of the Company as of, and for, the periods presented in this Report;
4.The Company’s other certifying officer and I are responsible for establishing and maintaining disclosure controls and procedures (as defined in Exchange Act Rules 13a-15(e) and 15d-15(e)) and internal control over financial reporting (as defined in Exchange Act Rules 13a-15(f) and 15d-15(f)) for the Company and have:
(a)Designed such disclosure controls and procedures, or caused such disclosure controls and procedures to be designed under our supervision, to ensure that itmaterial information relating to the Company, including its consolidated subsidiaries, is made known to us by others within those entities, particularly during the period in which this Annual Report is being prepared;
(b)Designed such internal control over financial reporting, or caused such internal control over financial reporting to be designed under our supervision, to provide reasonable assurance regarding the reliability of financial reporting and the preparation of financial statements for external purposes in accordance with generally accepted accounting principles;
(c)Evaluated the effectiveness of the Company’s disclosure controls and procedures and presented in this report our conclusions about the effectiveness of the disclosure controls and procedures, as of the end of the period covered by this report based on such evaluation; and
(d)Disclosed in this report any change in the Company’s internal control over financial reporting that occurred during the period covered by the Annual Report that has duly causedmaterially affected, or is reasonably likely to materially affect, the Company’s internal control over financial reporting; and authorized
5.The Company’s other certifying officer and I have disclosed, based on our most recent evaluation of internal control over financial reporting, to the undersignedCompany’s auditors and the audit committee of the Company’s board of directors (or persons performing the equivalent functions):
(a)All significant deficiencies and material weaknesses in the design or operation of internal control over financial reporting which are reasonably likely to sign this Form 20-F on its behalf.adversely affect the Company’s ability to record, process, summarize and report financial information; and
(b)Any fraud, whether or not material, that involves management or other employees who have a significant role in the Company’s internal control over financial reporting.
Jakarta, March24,2017
By: | /s/ Alex J. Sinaga |
| Alex J. Sinaga President Director / Chief Executive Officer |
Exhibit 12.2
Table of Content
CERTIFICATION PURSUANT TO
15 U.S.C. SECTION 7241,
AS ADOPTEDPURSUANT TO
SECTION 302 OFTHE SARBANES-OXLEY ACT OF 2002
I,Harry M. Zen, Director of Finance (Chief Financial Officer) of Perusahaan Perseroan (Persero) PT Telekomunikasi Indonesia Tbk. (the “Company”), certify that:
1.I have reviewed this Annual Report on Form 20-F of the Company;
2.Based on my knowledge, this report does not contain any untrue statement of a material fact or omit to state a material fact necessary to make the statements made, in light of the circumstances under which such statements were made, not misleading with respect to the period covered by this report;
3.Based on my knowledge, the financial statements, and other financial information included in this report, fairly present in all material respects the financial condition, results of operations and cash flows of the Company as of, and for, the periods presented in this report;
4.The Company’s other certifying officer and I are responsible for establishing and maintaining disclosure controls and procedures (as defined in Exchange Act Rules 13a-15(e) and 15d-15(e)) and internal control over financial reporting (as defined in Exchange Act Rules 13a-15(f) and 15d-15(f)) for the Company and have:
(a)Designed such disclosure controls and procedures, or caused such disclosure controls and procedures to be designed under our supervision, to ensure that material information relating to the Company, including its consolidated subsidiaries, is made known to us by others within those entities, particularly during the period in which this Annual Report is being prepared;
(b)Designed such internal control over financial reporting, or caused such internal control over financial reporting to be designed under our supervision, to provide reasonable assurance regarding the reliability of financial reporting and the preparation of financial statements for external purposes in accordance with generally accepted accounting principles;
(c)Evaluated the effectiveness of the Company’s disclosure controls and procedures and presented in this report our conclusions about the effectiveness of the disclosure controls and procedures, as of the end of the period covered by this report based on such evaluation; and
(d)Disclosed in this report any change in the Company’s internal control over financial reporting that occurred during the period covered by the Annual Report that has materially affected, or is reasonably likely to materially affect, the Company’s internal control over financial reporting; and
5.The Company other certifying officer and I have disclosed, based on our most recent evaluation of internal control over financial reporting, to the Company’s auditors and the audit committee of the Company’s board of directors (or persons performing the equivalent functions):
(a)All significant deficiencies and material weaknesses in the design or operation of internal control over financial reporting which are reasonably likely to adversely affect the Company’s ability to record, process, summarize and report financial information; and
(b)Any fraud, whether or not material, that involves management or other employees who have a significant role in the Company’s internal control over financial reporting.
Jakarta, March24, 2017
By: | /s/Harry M. Zen |
| Harry M. Zen Director of Finance / Chief Financial Officer |
Table of Content
Exhibit 13.1 |
CERTIFICATION PURSUANT TO 18 U.S.C. SECTION 1350, AS ADOPTED PURSUANT TO SECTION 906 OF THE SARBANES-OXLEY ACT OF 2002
|
In connection with the Annual Report of Perusahaan Perseroan (Persero) PT Telekomunikasi Indonesia Tbk. (the “Company”) on Form 20-F for the year ending December 31, 2016 as filed with the Securities and Exchange Commission on the date hereof (the “Report”), I, Alex J. Sinaga, President Director, (Chief Executive Officer) of the Company, certify, pursuant to 18 U.S.C. Section 1350, as adopted pursuant to Section 906 of the Sarbanes-Oxley Act of 2002, that, to my knowledge: |
| (1) | The Report fully complies with the requirements of section 13(a) or 15(d) of the Securities Exchange Act of 1934; and |
| (2) | The information contained in the Report fairly presents, in all material respects, the financial condition and results of operations of the Company. |
This certification accompanies this Report pursuant to Section 906 of the Sarbanes-Oxley Act of 2002and shall not be deemed filed with the Securities and Exchange Commission by the Company as part of the Report or as a separate disclosure document. |
Jakarta, March24, 2017 |
|
|
By: | /s/ Alex J. Sinaga |
| Alex J. Sinaga President Director / Chief Executive Officer |
| | | |
Table of Content
Exhibit 13.2 |
CERTIFICATION PURSUANT TO 18 U.S.C. SECTION 1350, AS ADOPTED PURSUANT TO SECTION 906 OF THE SARBANES-OXLEY ACT OF 2002
|
In connection with the Annual Report of Perusahaan Perseroan (Persero) PT Telekomunikasi Indonesia Tbk (the “Company”) on Form 20-F for the year ending December 31, 2016 as filed with the Securities and Exchange Commission on the date hereof (the “Report”), I,Harry M. Zen, Director of Finance (Chief Financial Officer) of the Company, certify, pursuant to 18 U.S.C. Section 1350, as adopted pursuant to Section 906 of the Sarbanes-Oxley Act of 2002, that, to my knowledge: |
| (1) | The Report fully complies with the requirements of section 13(a) or 15(d) of the Securities Exchange Act of 1934; and |
| (2) | The information contained in the Report fairly presents, in all material respects, the financial condition and results of operations of the Company. |
This certification accompanies this Report pursuant to Section 906 of the Sarbanes-Oxley Act of 2002and shall not be deemed filed with the Securities and Exchange Commission by the Company as part of the Report or as a separate disclosure document. |
Jakarta, March24, 2017 |
|
|
By: | /s/Harry M. Zen |
| Harry M. Zen Director of Finance / Chief Financial Officer |
| | | |
Table of Content
SIGNATURES
|
Pursuant to the requirement of Section 12 of the Securities Exchange Act of 1934, as amended, the Registrant hereby certifies that it meets all the requirement for filing on Form 20-F and that is has duly caused and authorized the undersigned to sign this Form 20-F on its behalf. |
| |
PERUSAHAAN PERSEROAN (PERSERO) PT TELEKOMUNIKASI INDONESIA TBK |
|
Jakarta, March 26, 2014March24, 2017 | |
| |
By: /s/ Arief Yahya | /s/ Alex J. Sinaga | |
| Arief YahyaAlex J. Sinaga
President Director / Chief Executive Officer 119
Table of Content
Exhibit 12.1
CERTIFICATION PURSUANT TO
15 U.S.C. SECTION 7241,
AS ADOPTEDPURSUANT TO
SECTION 302 OFTHE SARBANES-OXLEY ACT OF 2002
I, Arief Yahya, President Director (Chief Executive Officer) of Perusahaan Perseroan (Persero) PT Telekomunikasi Indonesia Tbk. (the “Company”), certify that:
1.I have reviewed this Annual Report on Form 20-F of the Company;
2.Based on my knowledge, this report does not contain any untrue statement of a material fact or omit to state a material fact necessary to make the statements made, in light of the circumstances under which such statements were made, not misleading with respect to the period covered by this Report;
3.Based on my knowledge, the financial statements, and other financial information included in this report, fairly present in all material respects the financial condition, results of operations and cash flows of the Company as of, and for, the periods presented in this Report;
4.The Company’s other certifying officer and I are responsible for establishing and maintaining disclosure controls and procedures (as defined in Exchange Act Rules 13a-15(e) and 15d-15(e)) and internal control over financial reporting (as defined in Exchange Act Rules 13a-15(f) and 15d-15(f)) for the Company and have:
(a)Designed such disclosure controls and procedures, or caused such disclosure controls and procedures to be designed under our supervision, to ensure that material information relating to the Company, including its consolidated subsidiaries, is made known to us by others within those entities, particularly during the period in which this Annual Report is being prepared;
(b)Designed such internal control over financial reporting, or caused such internal control over financial reporting to be designed under our supervision, to provide reasonable assurance regarding the reliability of financial reporting and the preparation of financial statements for external purposes in accordance with generally accepted accounting principles;
(c)Evaluated the effectiveness of the Company’s disclosure controls and procedures and presented in this report our conclusions about the effectiveness of the disclosure controls and procedures, as of the end of the period covered by this report based on such evaluation; and
(d)Disclosed in this report any change in the Company’s internal control over financial reporting that occurred during the period covered by the Annual Report that has materially affected, or is reasonably likely to materially affect, the Company’s internal control over financial reporting; and
5.The Company’s other certifying officer and I have disclosed, based on our most recent evaluation of internal control over financial reporting, to the Company’s auditors and the audit committee of the Company’s board of directors (or persons performing the equivalent functions):
(a)All significant deficiencies and material weaknesses in the design or operation of internal control over financial reporting which are reasonably likely to adversely affect the Company’s ability to record, process, summarize and report financial information; and
(b)Any fraud, whether or not material, that involves management or other employees who have a significant role in the Company’s internal control over financial reporting.
Jakarta, March 26, 2014
By:
| /s/ Arief Yahya
| | Arief Yahya
President Director / Chief Executive Officer
|
120
Table of Content
Exhibit 12.2
CERTIFICATION PURSUANT TO
15 U.S.C. SECTION 7241,
AS ADOPTEDPURSUANT TO
SECTION 302 OFTHE SARBANES-OXLEY ACT OF 2002
I, Honesti Basyir, Director of Finance (Chief Financial Officer) of Perusahaan Perseroan (Persero) PT Telekomunikasi Indonesia Tbk. (the “Company”), certify that:
1.I have reviewed this Annual Report on Form 20-F of the Company;
2.Based on my knowledge, this report does not contain any untrue statement of a material fact or omit to state a material fact necessary to make the statements made, in light of the circumstances under which such statements were made, not misleading with respect to the period covered by this report;
3.Based on my knowledge, the financial statements, and other financial information included in this report, fairly present in all material respects the financial condition, results of operations and cash flows of the Company as of, and for, the periods presented in this report;
4.The Company’s other certifying officer and I are responsible for establishing and maintaining disclosure controls and procedures (as defined in Exchange Act Rules 13a-15(e) and 15d-15(e)) and internal control over financial reporting (as defined in Exchange Act Rules 13a-15(f) and 15d-15(f)) for the Company and have:
(a)Designed such disclosure controls and procedures, or caused such disclosure controls and procedures to be designed under our supervision, to ensure that material information relating to the Company, including its consolidated subsidiaries, is made known to us by others within those entities, particularly during the period in which this Annual Report is being prepared;
(b)Designed such internal control over financial reporting, or caused such internal control over financial reporting to be designed under our supervision, to provide reasonable assurance regarding the reliability of financial reporting and the preparation of financial statements for external purposes in accordance with generally accepted accounting principles;
(c)Evaluated the effectiveness of the Company’s disclosure controls and procedures and presented in this report our conclusions about the effectiveness of the disclosure controls and procedures, as of the end of the period covered by this report based on such evaluation; and
(d)Disclosed in this report any change in the Company’s internal control over financial reporting that occurred during the period covered by the Annual Report that has materially affected, or is reasonably likely to materially affect, the Company’s internal control over financial reporting; and
5.The Company other certifying officer and I have disclosed, based on our most recent evaluation of internal control over financial reporting, to the Company’s auditors and the audit committee of the Company’s board of directors (or persons performing the equivalent functions):
(a)All significant deficiencies and material weaknesses in the design or operation of internal control over financial reporting which are reasonably likely to adversely affect the Company’s ability to record, process, summarize and report financial information; and
(b)Any fraud, whether or not material, that involves management or other employees who have a significant role in the Company’s internal control over financial reporting.
Jakarta, March 26, 2014
By:
| /s/ Honesti Basyir
| | Honesti Basyir
Director of Finance / Chief Financial Officer
|
121
Table of Content
Exhibit 13.1
| CERTIFICATION PURSUANT TO
18 U.S.C. SECTION 1350,
AS ADOPTED PURSUANT TO
SECTION 906 OF THE SARBANES-OXLEY ACT OF 2002
| In connection with the Annual Report of Perusahaan Perseroan (Persero) PT Telekomunikasi Indonesia Tbk. (the “Company”) on Form 20-F for the year ending December 31, 2013 as filed with the Securities and Exchange Commission on the date hereof (the “Report”), I, Arief Yahya, President Director, (Chief Executive Officer) of the Company, certify, pursuant to 18 U.S.C. Section 1350, as adopted pursuant to Section 906 of the Sarbanes-Oxley Act of 2002, that, to my knowledge:
| | (1)
| The Report fully complies with the requirements of section 13(a) or 15(d) of the Securities Exchange Act of 1934; and
| | (2)
| The information contained in the Report fairly presents, in all material respects, the financial condition and results of operations of the Company.
| This certification accompanies this Report pursuant to Section 906 of the Sarbanes-Oxley Act of 2002and shall not be deemed filed with the Securities and Exchange Commission by the Company as part of the Report or as a separate disclosure document.
| Jakarta, March 26, 2014
| | | By:
| /s/ Arief Yahya
| | Arief Yahya
President Director / Chief Executive Officer
| | | | |
122
Table of Content
Exhibit 13.2
| CERTIFICATION PURSUANT TO
18 U.S.C. SECTION 1350,
AS ADOPTED PURSUANT TO
SECTION 906 OF THE SARBANES-OXLEY ACT OF 2002
| In connection with the Annual Report of Perusahaan Perseroan (Persero) PT Telekomunikasi Indonesia Tbk. (the “Company”) on Form 20-F for the year ending December 31, 2013 as filed with the Securities and Exchange Commission on the date hereof (the “Report”), I, Honesti Basyir, Director of Finance (Chief Financial Officer) of the Company, certify, pursuant to 18 U.S.C. Section 1350, as adopted pursuant to Section 906 of the Sarbanes-Oxley Act of 2002, that, to my knowledge:
| | (1)
| The Report fully complies with the requirements of section 13(a) or 15(d) of the Securities Exchange Act of 1934; and
| | (2)
| The information contained in the Report fairly presents, in all material respects, the financial condition and results of operations of the Company.
| This certification accompanies this Report pursuant to Section 906 of the Sarbanes-Oxley Act of 2002and shall not be deemed filed with the Securities and Exchange Commission by the Company as part of the Report or as a separate disclosure document.
| Jakarta, March 26, 2014
| | | By:
| /s/ Honesti Basyir
| | Honesti Basyir
Director of Finance / Chief Financial Officer
| | | | |
123
Perusahaan Perseroan (Persero)
PT Telekomunikasi Indonesia Tbk
and subsidiaries
Consolidated financial statements with report of
independent registered public accounting firm
as ofJanuary 1, 2012 (Restated),December 31,
2012(Restated) and December 31,2013 and for the
years ended December 31, 2011 (Restated),
2012(Restated)and 2013
PERUSAHAAN PERSEROAN (PERSERO)
| PT TELEKOMUNIKASI INDONESIA Tbk AND SUBSIDIARIES
| CONSOLIDATED FINANCIALSTATEMENTS WITH REPORT OF
| INDEPENDENT REGISTEREDPUBLIC ACCOUNTING FIRM
| AS OFJANUARY 1, 2012 (RESTATED),DECEMBER 31, 2012(RESTATED)AND
| DECEMBER 31,2013 AND FOR THE YEARS ENDED
| DECEMBER 31, 2011 (RESTATED), 2012(RESTATED)AND 2013
|
TABLE OF CONTENTS
| | | | Page
| Report of Independent Registered Public Accounting Firm
| |
|
Perusahaan Perseroan (Persero)
PT Telekomunikasi Indonesia Tbk and subsidiaries Consolidated financial statementswith report of independent registered public accounting firmas of December 31, 2015 and 2016 and for the years ended December 31, 2014, 2015 and 2016
Statement of the Board of Directors regarding the Board of Director’s Responsibility for
Consolidated financial statements as ofDecember3Consolidated Statements of Financial Position | 1, 2016and forthe year thenended Perusahaan Perseroan (Persero) PT Telekomunikasi Indonesia Tbk and itsSubsidiaries
On behalf ofthe Board of Directors, weundersigned: 1. Name :Alex J. Sinaga Businessaddress :Jl. Japati No.1 Bandung 40133 Address : Jl.Anggrek Nelimurni B-70No.38Kelurahan Kemanggisan Kecamatan Palmerah, Jakarta Barat Phone : (022) 452 7101 Position : President Director 2. Name :Harry M. Zen Business address :Jl. Japati No.1 Bandung 40133 Address :Jl. Zeni AD VI No. 4 Kelurahan Rawajati Kecamatan Pancoran, Jakarta Selatan Phone : (022) 452 7201/ 021 520 9824 Position : Director of Finance We hereby state as follows: 1. We are responsible for the preparation and presentation of the consolidated financial statement of
PT Telekomunikasi Indonesia Tbk (the “Company”) and its subsidiaries; 2. The Company and its subsidiaries’ consolidated financial statement have been prepared and presented in accordance withInternational Financial Reporting Standards; 3. All information has been fully and correctly disclosed in the Company and its subsidiaries’consolidated financial statement; 4. The Company and its subsidiaries’ consolidated financial statement do not contain false material information or facts, nor do they omit any material information or facts; 5. We are responsible for the Company and its subsidiaries’ internal control system. This statement is considered to be true and correct. Jakarta,March, 2017
Alex J. Sinaga President Director | Harry M. Zen Director of Finance |
PERUSAHAAN PERSEROAN (PERSERO) PT TELEKOMUNIKASI INDONESIA Tbk AND SUBSIDIARIES CONSOLIDATED FINANCIAL STATEMENTSWITH REPORT OF INDEPENDENT REGISTERED PUBLIC ACCOUNTING FIRM AS OF DECEMBER 31, 2015 AND 2016 AND FOR THE YEARS ENDED DECEMBER 31, 2014, 2015 AND 2016
Table of Contents
 Report of Independent Registered Public Accounting Firm | Report No. RPC-5162/PSS/2014
The Shareholders and the Boards of Commissioners and Directors of
Perusahaan Perseroan (Persero) PT Telekomunikasi Indonesia Tbk
We have audited the accompanying consolidated statements of financial position of Perusahaan Perseroan (Persero) PT Telekomunikasi Indonesia Tbk (the “Company”) and subsidiaries as of December 31, 2013 and 2012, and the related consolidated statements of comprehensive income, changes in equity and cash flows for the years then ended. These financial statements are the responsibility of the Company's management. Our responsibility is to express an opinion on these financial statements based on our audits.
We conducted our audits in accordance with the standards of the Public Company Accounting Oversight Board (United States). Those standards require that we plan and perform the audit to obtain reasonable assurance about whether the financial statements are free of material misstatement. An audit includes examining, on a test basis, evidence supporting the amounts and disclosures in the financial statements. An audit also includes assessing the accounting principles used and significant estimates made by management, as well as evaluating the overall financial statement presentation. We believe that our audits provide a reasonable basis for our opinion.
In our opinion, the financial statements referred to above present fairly, in all material respects, the consolidated financial position of Perusahaan Perseroan (Persero) PT Telekomunikasi Indonesia Tbk and subsidiaries as of December 31, 2013 and 2012, and the consolidated results of their operations and their cash flows for the years then ended, in conformity with International Financial Reporting Standards as issued by the International Accounting Standards Board.
As discussed in Note 2aa to the consolidated financial statements, the Company changed its method of accounting for defined benefit plans on a retrospective basis effective January 1, 2013, and the 2012 and 2011 consolidated financial statements have been restated. In addition, we audited the adjustments described in Note 36 that were applied to restate the 2011 reportable segments disclosures to conform with the reportable segments in 2013 and 2012. In our opinion, such adjustments are appropriate and have been properly applied. We were not engaged to audit, review or apply any procedures to the 2011 consolidated financial statements of the Company other than with respect to the adjustments on the reportable segments and, accordingly, we do not express an opinion or any other form of assurance on the 2011 consolidated financial statements taken as a whole.
Report of Independent Registered Public Accounting Firm (continued)
Report No. RPC-5162/PSS/2014 (continued)
We also have audited, in accordance with the standards of the Public Company Accounting Oversight Board (United States), Perusahaan Perseroan (Persero) PT Telekomunikasi Indonesia Tbk and subsidiaries' internal control over financial reporting as of December 31, 2013, based on criteria established in Internal Control-Integrated Framework issued by the Committee of Sponsoring Organizations of the Treadway Commission (1992 framework) and our report dated March 25, 2014 expressed an unqualified opinion thereon.
/s/Purwantono, Suherman & Surja
Purwantono, Suherman & Surja
Jakarta, Indonesia
March 25, 2014
Report of Independent Registered Public Accounting Firm
Report No. RPC-5163/PSS/2014
The Shareholders and the Boards of Commissioners and Directors of
Perusahaan Perseroan (Persero) PT Telekomunikasi Indonesia Tbk
We have audited Perusahaan Perseroan (Persero) PT Telekomunikasi Indonesia Tbk (the “Company”) and subsidiaries’ internal control over financial reporting as of December 31, 2013, based on criteria established in Internal Control—Integrated Framework issued by the Committee of Sponsoring Organizations of the Treadway Commission (1992 framework) (the COSO criteria). The Company and subsidiaries’ management is responsible for maintaining effective internal control over financial reporting, and for its assessment of the effectiveness of internal control over financial reporting included in the accompanying Management’s Report on Internal Control over Financial Reporting. Our responsibility is to express an opinion on the Company and subsidiaries’ internal control over financial reporting based on our audit.
We conducted our audit in accordance with the standards of the Public Company Accounting Oversight Board (United States). Those standards require that we plan and perform the audit to obtain reasonable assurance about whether effective internal control over financial reporting was maintained in all material respects. Our audit included obtaining an understanding of internal control over financial reporting, assessing the risk that a material weakness exists, testing and evaluating the design and operating effectiveness of internal control based on the assessed risk, and performing such other procedures as we considered necessary in the circumstances. We believe that our audit provides a reasonable basis for our opinion.
A company’s internal control over financial reporting is a process designed to provide reasonable assurance regarding the reliability of financial reporting and the preparation of financial statements for external purposes in accordance with International Financial Reporting Standards as issued by the International Accounting Standards Board. A company’s internal control over financial reporting includes those policies and procedures that (1) pertain to the maintenance of records that, in reasonable detail, accurately and fairly reflect the transactions and dispositions of the assets of the company; (2) provide reasonable assurance that transactions are recorded as necessary to permit preparation of financial statements in accordance with International Financial Reporting Standards, and that receipts and expenditures of the company are being made only in accordance with authorizations of management and directors of the company; and (3) provide reasonable assurance regarding prevention or timely detection of unauthorized acquisition, use, or disposition of the company’s assets that could have a material effect on the financial statements. Because of its inherent limitations, internal control over financial reporting may not prevent or detect misstatements. Also, projections of any evaluation of effectiveness to future periods are subject to the risk that controls may become inadequate because of changes in conditions, or that the degree of compliance with the policies or procedures may deteriorate.
Report of Independent Registered Public Accounting Firm (continued)
Report No. RPC-5163/PSS/2014 (continued)
In our opinion, Perusahaan Perseroan (Persero) PT Telekomunikasi Indonesia Tbk and subsidiaries maintained, in all material respects, effective internal control over financial reporting as of December 31, 2013, based on the COSO criteria.
We also have audited, in accordance with the standards of the Public Company Accounting Oversight Board (United States), the consolidated statements of financial position of Perusahaan Perseroan (Persero) PT Telekomunikasi Indonesia Tbk and subsidiaries as of December 31, 2013 and 2012, and the related consolidated statements of comprehensive income, changes in equity and cash flows for the years then ended and our report dated March 25, 2014 expressed an unqualified opinion thereon.
/s/Purwantono, Suherman & Surja
Purwantono, Suherman & Surja
Jakarta, Indonesia
March 25, 2014

REPORT OF INDEPENDENT REGISTERED PUBLIC ACCOUNTING FIRM
TO THE STOCKHOLDERS OF
PERUSAHAAN PERSEROAN (PERSERO) PT TELEKOMUNIKASI INDONESIA Tbk
In our opinion, the consolidated statements of comprehensive income, changes in equity, and cash flows for the year ended 31 December 2011, before the effects of the adjustments to retrospectively reflect the change in the composition of reportable segments described in Note 36, present fairly, in all material respects, the results of operations and cash flows of Perusahaan Perseroan (Persero) PT Telekomunikasi Indonesia Tbk and its subsidiaries for the year ended 31 December 2011 in conformity with International Financial Reporting Standards as issued by the International Accounting Standards Board (the 2011 consolidated financial statements before the effects of the adjustments on Note 36 are not presented herein). These financial statements are the responsibility of the Company's management. Our responsibility is to express an opinion on these financial statements based on our audit. We conducted our audit, before the effects of the adjustments described above, of these statements, in accordance with the standards of the Public Company Accounting Oversight Board (United States). Those standards require that we plan and perform the audits to obtain reasonable assurance about whether the financial statements are free of material misstatement. An audit includes examining, on a test basis, evidence supporting the amounts and disclosures in the financial statements, assessing the accounting principles used and significant estimates made by management, and evaluating the overall financial statement presentation. We believe that our audit provide a reasonable basis for our opinion.
We were not engaged to audit, review, or apply any procedures to the adjustments to retrospectively reflect the change in composition of reportable segments described in Note 36 and accordingly, we do not express an opinion or any other form of assurance about whether such adjustments are appropriate and have been properly applied. Those adjustments were audited by other auditors.
As discussed in Note 2aa to the consolidated financial statements, the Company has changed the manner in which it accounts for defined benefit plans in 2013.
JAKARTA
30 March 2012, except for the change in accounting for defined benefit plans discussed in Note 2aa, and the effects of the stock split discussed in Note 25, as to which the date is 25 March 2014
/s/Chrisna A. Wardhana, CPA
Chrisna A. Wardhana, CPA
Public Accountant License No. AP.0231

PERUSAHAAN PERSEROAN (PERSERO)
| PT TELEKOMUNIKASI INDONESIA Tbk AND SUBSIDIARIES
| CONSOLIDATED STATEMENTS OF FINANCIAL POSITION
| January 1, 2012 (Restated),December 31, 2012(Restated)andDecember 31,2013
| (Figures in tables are presented in billions of rupiah and millions of U.S. dollar)
|
Tabel of Content
| | | | | December 31, | | | | | January 1, 2012 | | 2012 | | | | | | | | | (Restated) | | (Restated) | | 2013 | | | Notes | | Rp | | Rp | | Rp | | US$ (Note 4) | | ASSETS | | | | | | | | | | | CURRENT ASSETS | | | | | | | | | | | Cash and cash equivalents | 2c,2e,2t,5,35,40 | | 9,634 | | 13,118 | | 14,696 | | 1,207 | | Other current financial assets | 2c,2e,2t,6,35,40 | | 373 | | 4,338 | | 6,872 | | 565 | | Trade and other receivables | 2c,2g,2t,7,35,40 | | 5,393 | | 5,409 | | 6,421 | | 527 | | Inventories | 2h,8 | | 758 | | 579 | | 509 | | 42 | | Advances and prepaid expenses | 2c,2i,2m,9,35 | | 3,294 | | 3,721 | | 3,937 | | 324 | | Prepaid income taxes | 2s,32 | | 633 | | 52 | | 58 | | 5 | | Prepaid other taxes | 2s,32 | | 525 | | 756 | | 477 | | 39 | | Asset held for sale | 2j,10 | | 791 | | - | | 105 | | 9 | | Total Current Assets | | | 21,401 | | 27,973 | | 33,075 | | 2,718 | | NON-CURRENT ASSETS | | | | | | | | | | | Long-term investments | 2f,2t,11,40 | | 235 | | 275 | | 304 | | 25 | | Property and equipment | 2l,2m,2z,12,37 | | 74,638 | | 76,908 | | 86,599 | | 7,116 | | Prepaid pension benefit cost | 2r,33 | | 409 | | - | | 949 | | 78 | | Advances and other non-current assets | 2c,2g,2i,2m,2s,2t, 13,35,37,38,40 | | 3,817 | | 3,510 | | 5,294 | | 435 | | Intangible assets | 2d,2k,2z,14 | | 1,791 | | 1,443 | | 1,508 | | 124 | | Deferred tax assets | 2s,32 | | 75 | | 102 | | 67 | | 5 | | Total Non-current Assets | | | 80,965 | | 82,238 | | 94,721 | | 7,783 | | TOTAL ASSETS | | | 102,366 | | 110,211 | | 127,796 | | 10,501 | | LIABILITIES AND EQUITY | | | | | | | | | | | CURRENT LIABILITIES | | | | | | | | | | | Trade and other payables | 2c,2n,2t,15,35,40 | | 8,355 | | 7,457 | | 11,988 | | 985 | | Current income tax liabilities | 2s,32 | | 729 | | 1,280 | | 942 | | 77 | | Other tax liabilities | 2s,32 | | 310 | | 564 | | 756 | | 62 | | Accrued expenses | 2c,2t,16,35,40 | | 4,790 | | 6,163 | | 5,264 | | 432 | | Unearned income | 2q,17 | | 2,821 | | 2,729 | | 3,490 | | 287 | | Advances from customers and suppliers | 2c,35 | | 271 | | 257 | | 472 | | 39 | | Short-term loans and other borrowings | 2c,2m,2o,2t,12,18,35,40 | | 4,913 | | 5,658 | | 5,525 | | 454 | | Total Current Liabilities | | | 22,189 | | 24,108 | | 28,437 | | 2,336 | | NON-CURRENT LIABILITIES | | | | | | | | | | | Deferred tax liabilities | 2s,32 | | 3,159 | | 2,252 | | 2,908 | | 239 | | Other liabilities | 2n,2q | | 242 | | 334 | | 472 | | 39 | | Long service award provisions | 2r,34 | | 287 | | 347 | | 336 | | 28 | | Pension benefit and other post-employment benefit obligations | 2c,2r,33,35 | | 5,372 | | 8,184 | | 4,258 | | 350 | | Long-term loans and other borrowings | 2c,2m,2o,2t,12,19,35,40 | | 12,958 | | 13,617 | | 14,731 | | 1,210 | | Total Non-current Liabilities | | | 22,018 | | 24,734 | | 22,705 | | 1,866 | | TOTAL LIABILITIES | | | 44,207 | | 48,842 | | 51,142 | | 4,202 | | EQUITY | | | | | | | | | | | Capital stock | 1c,21 | | 5,040 | | 5,040 | | 5,040 | | 414 | | Additional paid-in capital | 2u,22 | | 1,073 | | 1,073 | | 1,845 | | 152 | | Treasury stock | 2u,23 | | (6,323 | ) | (8,067 | ) | (5,805 | ) | (477 | ) | Retained earnings | | | 44,998 | | 47,927 | | 58,475 | | 4,805 | | Other reserves | 2f,2t,24 | | 56 | | 82 | | 198 | | 16 | | Net Equity Attributable to Owners of the Parent Company | | | 44,844 | | 46,055 | | 59,753 | | 4,910 | | Non-controlling interests | 2b,20 | | 13,315 | | 15,314 | | 16,901 | | 1,389 | | TOTAL EQUITY | | | 58,159 | | 61,369 | | 76,654 | | 6,299 | | TOTAL LIABILITIES AND EQUITY | | | 102,366 | | 110,211 | | 127,796 | | 10,501 | |
The accompanying notes to the consolidated financial statements form an integral part of these consolidated financial statements taken as a whole.
PERUSAHAAN PERSEROAN (PERSERO)
| PT TELEKOMUNIKASI INDONESIA Tbk AND SUBSIDIARIES
| CONSOLIDATED STATEMENTS OF COMPREHENSIVE INCOME
| Years Ended December 31, 2011 (Restated), 2012 (Restated) and 2013
| (Figures in tables are presented in billions of rupiah and millions of U.S. dollar, unless otherwise stated)
|
Tabel of Content
| | | 2011 | | 2012 | | | | | | | | | (Restated) | | (Restated) | | 2013 | | | Notes | | Rp | | Rp | | Rp | | US$ (Note 4) | | REVENUES | 2c,2q,26,35 | | 71,238 | | 77,127 | | 82,967 | | 6,817 | | Operations, maintenance and telecommunication service expenses | 2c,2q,29,35 | | (16,453 | ) | (16,796 | ) | (19,332 | ) | (1,588) | | Depreciation and amortization | 2k,2l,2m,12,13,14 | | (14,823 | ) | (14,474 | ) | (15,805 | ) | (1,299) | | Personnel expenses | 2c,2q,2r,28,33,34,35 | | (8,424 | ) | (9,960 | ) | (9,829 | ) | (808) | | Interconnection expenses | 2c,2q,31,35 | | (3,555 | ) | (4,667 | ) | (4,927 | ) | (405) | | Marketing expenses | 2q | | (3,278 | ) | (3,094 | ) | (3,044 | ) | (250) | | General and administrative expenses | 2c,2q,30,35 | | (2,935 | ) | (3,036 | ) | (4,155 | ) | (341 | ) | Loss on foreign exchange - net | 2p | | (210 | ) | (189 | ) | (249 | ) | (20 | ) | Other income | 2b,2q,3,11,12a,12c | | 666 | | 2,559 | | 2,581 | | 212 | | Other expenses | 2q,12c | | (192 | ) | (1,973 | ) | (480 | ) | (40 | ) | OPERATING PROFIT | | | 22,034 | | 25,497 | | 27,727 | | 2,278 | | Finance income | 2c,35 | | 620 | | 596 | | 836 | | 69 | | Finance costs | 2c,2q,35 | | (1,662 | ) | (2,055 | ) | (1,504 | ) | (124) | | Share of loss of associated companies | 2f,11 | | (10 | ) | (11 | ) | (29 | ) | (2) | | PROFIT BEFORE INCOME TAX | | | 20,982 | | 24,027 | | 27,030 | | 2,221 | | INCOME TAX (EXPENSE) BENEFIT | 2s,32 | | | | | | | | | | Current | | | (5,673 | ) | (6,628 | ) | (6,995 | ) | (575 | ) | Deferred | | | 236 | | 742 | | 95 | | 8 | | Net Income Tax Expense | | | (5,437 | ) | (5,886 | ) | (6,900 | ) | (567 | ) | PROFIT FOR THE YEAR | | | 15,545 | | 18,141 | | 20,130 | | 1,654 | | OTHER COMPREHENSIVE INCOME (EXPENSES) | | | | | | | | | | | Other comprehensive income to be reclassified to profit or loss in subsequent periods: | | | | | | | | | | | Foreign currency translation | 1d,2f,24 | | 7 | | 31 | | 120 | | 10 | | Net (loss) gain on available-for-sale financial assets | 2t,24 | | 4 | | (5 | ) | (4 | ) | (1 | ) | Other comprehensive incomenotto be reclassified to profit or loss in subsequent periods: | | | | | | | | | | | Defined benefit plan actuarial gain (losses), net of tax | 2r,33 | | (1,939 | ) | (2,566 | ) | 4,999 | | 411 | | Other Comprehensive Income (Expenses) - Net | | | (1,928 | ) | (2,540 | ) | 5,115 | | 420 | | NET COMPREHENSIVE INCOME FOR THE YEAR | | | 13,617 | | 15,601 | | 25,245 | | 2,074 | | Profit for the year attributable to: | | | | | | | | | | | Owners of the parent company | | | 11,043 | | 12,621 | | 14,046 | | 1,154 | | Non-controlling interests | | | 4,502 | | 5,520 | | 6,084 | | 500 | | | | | 15,545 | | 18,141 | | 20,130 | | 1,654 | | Net comprehensive income for the yearattributable to: | | | | | | | | | | | Owners of the parent company | | | 9,183 | | 10,056 | | 19,018 | | 1,562 | | Non-controlling interests | 2b,20 | | 4,434 | | 5,545 | | 6,227 | | 512 | | | | | 13,617 | | 15,601 | | 25,245 | | 2,074 | | BASIC AND DILUTED EARNINGS PER SHARE(in full amount) | 2w,25 | | | | | | | | | | Net income per share | | | 112.73 | | 131.45 | | 145.77 | | 0.01 | | Net income per ADS (200 Series B shares per ADS) | | | 22,546.00 | | 26,290.80 | | 29,153.58 | | 2.40 | |
The accompanying notes to the consolidated financial statements form an integral part of these consolidated financial statements taken as a whole.
PERUSAHAAN PERSEROAN (PERSERO)
| PT TELEKOMUNIKASI INDONESIA Tbk AND SUBSIDIARIES
| CONSOLIDATED STATEMENTS OF CHANGES IN EQUITY
| Years Ended December 31, 2011 (Restated), 2012 (Restated) and 2013
| (Figures in tables are presented in billions of rupiah)
|
Tabel of Content
| | | | Attributable toowners of the parent company | | | | | | Description | | Notes | | Capital stock | | Additional paid-in capital | | Treasury stock | | Retained earnings | | Other reserves | | Net | | Non-controlling interests | | Total equity | | Balance, January 1, 2011 | | | | 5,040 | | 1,073 | | (4,264 | ) | 42,726 | | 52 | | 44,627 | | 11,911 | | 56,538 | | Adjustment in relation to implementation ofInternational Accounting Standards (“IAS”) 19,Employee Benefits (Revised 2011) | | | | - | | - | | - | | (1,081 | ) | - | | (1,081 | ) | - | | (1,081 | ) | Balance, January 1, 2011, restated | | | | 5,040 | | 1,073 | | (4,264 | ) | 41,645 | | 52 | | 43,546 | | 11,911 | | 55,457 | | Net comprehensive income for the year | | 1d,2b | | | | | | | | | | | | | | | | | | Profit for the year | | | | - | | - | | - | | 11,043 | | - | | 11,043 | | 4,502 | | 15,545 | | Other comprehensive (expenses) income | | 2f,2r,2t | | - | | - | | - | | (1,871 | ) | 11 | | (1,860 | ) | (68 | ) | (1,928 | ) | Net comprehensive income for the year | | | | - | | - | | - | | 9,172 | | 11 | | 9,183 | | 4,434 | | 13,617 | | Gain on investment in securities | | 2t | | - | | - | | - | | - | | (7 | ) | (7 | ) | - | | (7 | ) | Transactions with owners recorded directly in equity | | | | | | | | | | | | | | | | | | | | Cash dividends | | 2v,21 | | - | | - | | - | | (5,819 | ) | - | | (5,819 | ) | (3,030 | ) | (8,849 | ) | Treasury stock acquired - at cost | | 2u | | - | | - | | (2,059 | ) | - | | - | | (2,059 | ) | - | | (2,059 | ) | Total transactions with owners | | | | - | | - | | (2,059 | ) | (5,819 | ) | - | | (7,878 | ) | (3,030 | ) | (10,908 | ) | Balance, December 31, 2011, restated | | | | 5,040 | | 1,073 | | (6,323 | ) | 44,998 | | 56 | | 44,844 | | 13,315 | | 58,159 | |
The accompanying notes to the consolidated financial statements form an integral part of these consolidated financial statements taken as a whole.
F-3
PERUSAHAAN PERSEROAN (PERSERO)
| PT TELEKOMUNIKASI INDONESIA Tbk AND SUBSIDIARIES
| CONSOLIDATED STATEMENTS OF CHANGES IN EQUITY (continued)
| Years Ended December 31, 2011 (Restated), 2012 (Restated) and 2013
| (Figures in tables are presented in billions of rupiah)
|
Tabel of Content
| | | | Attributable toowners of the parent company | | | | | | Description | | Notes | | Capital stock | | Additional paid-in capital | | Treasury stock | | Retained earnings | | Other reserves | | Net | | Non-controlling interests | | Totalequity | | Balance,January 1, 2012,restated | | | | 5,040 | | 1,073 | | (6,323 | ) | 44,998 | | 56 | | 44,844 | | 13,315 | | 58,159 | | Netcomprehensive income for the year | | 1d,2b | | | | | | | | | | | | | | | | | | Profit for the year | | | | - | | - | | - | | 12,621 | | - | | 12,621 | | 5,520 | | 18,141 | | Other comprehensive(expenses)income | | 2f,2r,2t | | - | | - | | - | | (2,591 | ) | 26 | | (2,565 | ) | 25 | | (2,540 | ) | Net comprehensive income for the year | | | | - | | - | | - | | 10,030 | | 26 | | 10,056 | | 5,545 | | 15,601 | | Transactions with owners recordeddirectlyin equity | | | | | | | | | | | | | | | | | | | | Distributions to owners | | | | | | | | | | | | | | | | | | | | Cash dividends | | 2v,21 | | - | | - | | - | | (7,127 | ) | - | | (7,127 | ) | (3,607 | ) | (10,734 | ) | Treasury stock acquired - at cost | | 2u,23 | | - | | - | | (1,744 | ) | - | | - | | (1,744 | ) | - | | (1,744 | ) | Totaldistributions to ownersand acquisition of treasury stock | | | | - | | - | | (1,744 | ) | (7,127 | ) | - | | (8,871 | ) | (3,607 | ) | (12,478 | ) | Establishment of a subsidiary | | 1d | | - | | - | | - | | | | - | | - | | 32 | | 32 | | Acquisition of non-controlling interests in subsidiaries | | 1d | | - | | - | | - | | (23 | ) | - | | (23 | ) | (10 | ) | (33 | ) | Issuance of new shares of a subsidiary | | 1d | | - | | - | | - | | 49 | | - | | 49 | | 39 | | 88 | | Net change in ownership interests in subsidiaries | | | | - | | - | | - | | 26 | | - | | 26 | | 61 | | 87 | | Total transactions with owners | | | | - | | - | | (1,744 | ) | (7,101 | ) | - | | (8,845 | ) | (3,546 | ) | (12,391 | ) | Balance, December 31, 2012, restated | | | | 5,040 | | 1,073 | | (8,067 | ) | 47,927 | | 82 | | 46,055 | | 15,314 | | 61,369 | |
The accompanying notes to the consolidated financial statements form an integral part of these consolidated financial statements taken as a whole.
F-4
PERUSAHAAN PERSEROAN (PERSERO)
| PT TELEKOMUNIKASI INDONESIA Tbk AND SUBSIDIARIES
| CONSOLIDATED STATEMENTS OF CHANGES IN EQUITY (continued)
| Years Ended December 31, 2011 (Restated), 2012 (Restated) and 2013
| (Figures in tables are presented in billions of rupiah)
|
Tabel of Content
| | | | Attributable toowners of the parent company | | | | | | Description | | Notes | | Capital stock | | Additional paid-in capital | | Treasury stock | | Retained earnings | | Other reserves | | Net | | Non-controlling interests | | Total equity | | Balance,January 1, 2013,restated | | | | 5,040 | | 1,073 | | (8,067 | ) | 47,927 | | 82 | | 46,055 | | 15,314 | | 61,369 | | Netcomprehensive income for the year | | 1d,2b | | | | | | | | | | | | | | | | | | Profit for the year | | | | - | | - | | - | | 14,046 | | - | | 14,046 | | 6,084 | | 20,130 | | Other comprehensive income | | 2f,2r,2t | | - | | - | | - | | 4,856 | | 116 | | 4,972 | | 143 | | 5,115 | | Net comprehensive income for the year | | | | - | | - | | - | | 18,902 | | 116 | | 19,018 | | 6,227 | | 25,245 | | Transactions with owners recordeddirectlyin equity | | | | | | | | | | | | | | | | | | | | Cash dividends | | 2v,21 | | - | | - | | - | | (8,354 | ) | - | | (8,354 | ) | (4,690 | ) | (13,044 | ) | Sale of treasury stockand transfer to employees stock ownership program | | 2u,22,23 | | - | | 772 | | 2,262 | | - | | - | | 3,034 | | - | | 3,034 | | Acquisition of a business | | 1d | | - | | - | | - | | - | | - | | - | | 5 | | 5 | | Issuance of new shares ofsubsidiaries | | 1d | | - | | - | | - | | - | | - | | - | | 45 | | 45 | | Total transactions with owners | | | | - | | 772 | | 2,262 | | (8,354 | ) | - | | (5,320 | ) | (4,640 | ) | (9,960 | ) | Balance, December 31, 2013 | | | | 5,040 | | 1,845 | | (5,805 | ) | 58,475 | | 198 | | 59,753 | | 16,901 | | 76,654 | |
The accompanying notes to the consolidated financial statements form an integral part of these consolidated financial statements taken as a whole.
F-5
PERUSAHAAN PERSEROAN (PERSERO)
| PT TELEKOMUNIKASI INDONESIA Tbk AND SUBSIDIARIES
| CONSOLIDATED STATEMENTS OF CASH FLOWS
| Years Ended December 31, 2011, 2012 and 2013
| (Figures in tables are presented in billions of rupiah and millions of U.S. dollar)
|
Tabel of Content
| Notes | | 2011 | | 2012 | | 2013 | | | | | Rp | | Rp | | Rp | | US$ (Note4) | | CASH FLOWS FROM OPERATING ACTIVITIES | | | | | | | | | | | Cash receipts from: | | | | | | | | | | | Customers | | | 67,469 | | 71,910 | | 77,013 | | 6,328 | | Other operators | | | 3,586 | | 3,993 | | 4,521 | | 371 | | Total cash receipts from revenues | | | 71,055 | | 75,903 | | 81,534 | | 6,699 | | Interest income received | | | 599 | | 585 | | 832 | | 68 | | Advance receipts from (refund to) customers | | | (226 | ) | (37 | ) | 186 | | 15 | | Other cashreceipts- net | | | - | | - | | 216 | | 18 | | Cash payments for expenses | | | (25,507 | ) | (33,651 | ) | (27,440 | ) | (2,255 | ) | Cash payments to employees | | | (8,509 | ) | (8,162 | ) | (9,883 | ) | (812 | ) | Payments for income taxes | | | (5,359 | ) | (5,586 | ) | (7,395 | ) | (608 | ) | Payments for interest costs | | | (1,591 | ) | (1,111 | ) | (1,476 | ) | (121 | ) | Net cash provided by operating activities | | | 30,462 | | 27,941 | | 36,574 | | 3,004 | | CASH FLOWS FROM INVESTING ACTIVITIES | | | | | | | | | | | Divestment of investment in subsidiary | 3 | | - | | - | | 926 | | 76 | | Proceeds from sale of property and equipment | 12 | | 56 | | 360 | | 466 | | 38 | | Divestment of long-term investment | 11 | | - | | - | | 153 | | 13 | | Proceeds from insurance claims | 12 | | 13 | | 1,875 | | 60 | | 5 | | Proceeds from sale of available-for-sale financial assets | | | 59 | | 53 | | 49 | | 4 | | Acquisition of property and equipment | 12 | | (13,105 | ) | (8,221 | ) | (19,644 | ) | (1,614 | ) | Placements in time deposits | 6 | | (33 | ) | (4,008 | ) | (2,288 | ) | (188 | ) | (Increase)decrease in advances and other non-current assets | 13 | | 34 | | (134 | ) | (791 | ) | (65 | ) | Increase in advances for purchases of property and equipment | 13 | | (834 | ) | (487 | ) | (775 | ) | (64 | ) | Acquisition of intangible assets | 14 | | (604 | ) | (437 | ) | (637 | ) | (52 | ) | Acquisition of business, net of acquired cash | 1d,3 | | - | | (230 | ) | (201 | ) | (16 | ) | Acquisition of long-term investments | 11 | | - | | (49 | ) | (20 | ) | (2 | ) | Acquisition of non-controlling interests in subsidiaries | 1d | | - | | (33 | ) | - | | - | | Net cash used in investing activities | | | (14,414 | ) | (11,311 | ) | (22,702 | ) | (1,865 | ) | CASH FLOWS FROM FINANCING ACTIVITIES | | | | | | | | | | | Proceeds from loans and other borrowings | 18,19 | | 3,589 | | 4,887 | | 3,538 | | 291 | | Proceeds from sale (payments for acquisition) of treasury stock | 23 | | (2,059 | ) | (1,744 | ) | 2,368 | | 195 | | Capital contribution of non-controlling interests in subsidiaries | 1d | | - | | 120 | | 50 | | 4 | | Cash dividends paid to the Company’s stockholders | 21 | | (6,069 | ) | (7,127 | ) | (8,354 | ) | (687 | ) | Repayments of loans and other borrowings | 12,18,19 | | (7,967 | ) | (5,843 | ) | (6,239 | ) | (513 | ) | Cash dividends paid to non-controlling interests of subsidiaries | | | (3,033 | ) | (3,607 | ) | (4,690 | ) | (385 | ) | Net cash used in financing activities | | | (15,539 | ) | (13,314 | ) | (13,327 | ) | (1,095 | ) | NET INCREASE IN CASH AND CASH EQUIVALENTS | | | 509 | | 3,316 | | 545 | | 44 | | EFFECT OF EXCHANGE RATE CHANGES ON CASH AND CASH EQUIVALENTS | | | 5 | | 168 | | 1,039 | | 85 | | CASH AND CASH EQUIVALENTS AT BEGINNING OF YEAR | 5 | | 9,120 | | 9,634 | | 13,118 | | 1,078 | | ENDING BALANCE OF DISPOSED SUBSIDIARY | | | - | | - | | (6 | ) | (0 | ) | CASH AND CASH EQUIVALENTS AT END OF YEAR | 5 | | 9,634 | | 13,118 | | 14,696 | | 1,207 | |
The accompanying notes to the consolidated financial statements form an integral part of these consolidated financial statements taken as a whole.
F-6
PERUSAHAAN PERSEROAN (PERSERO)
| PT TELEKOMUNIKASI INDONESIA Tbk AND SUBSIDIARIES
| NOTES TO THE CONSOLIDATED FINANCIAL STATEMENTS
| As of January 1, 2012 (Restated), December 31, 2012 (Restated) and December 31, 2013
| and for the years ended December 31, 2011 (Restated), 2012 (Restated) and 2013
| (Figures in tables are presented in billions of rupiah, unless otherwise stated)
| |
Tabel of Content
| 1. GENERAL
a. Establishment and general information
Perusahaan Perseroan (Persero) PT Telekomunikasi Indonesia Tbk (the “Company”) was originally part of“Post en Telegraafdienst”, which was established and operated commercially in 1884 under the framework of Decree No. 7 dated March 27, 1884 of the Governor General of the Dutch Indies. Decree No. 7 was published in State Gazette No. 52 dated April 3, 1884.
In 1991, the status of the Company was changed into a state-owned limited liability corporation (“Persero”) based on Government Regulation No. 25/1991. The ultimate parent of the Company is the Government of the Republic of Indonesia (the “Government”).
The Company was established based on notarial deed No. 128 dated September 24, 1991 of Imas Fatimah, S.H. Its deed of establishment was approved by the Ministry of Justice of the Republic of Indonesia in its Decision Letter No. C2-6870.HT.01.01.Th.1991 dated November 19, 1991 and was published in State Gazette No. 5 dated January 17, 1992, Supplement No. 210. The Articles of Association has been amended several times, the latest amendment of which was about, among others, the change of capital structure through the Company’s 5-for-1 stock split whereby each share with par value of Rp250 would be split into Rp50 per share, and the Partnership and Community Development Programme (“PKBL”) was excluded from the Work Plan and Company Budgets, based on notarial deed No. 11 dated May 8, 2013 of Ashoya Ratam, S.H., MKn. The latest amendment was accepted and approved by the Ministry of Law and Human Rights of the Republic of Indonesia (“MoLHR”) in its Letter No. AHU-AH.01.10-22500 dated June 7, 2013.
In accordance with Article 3 of the Company’s Articles of Association, the scope of its activities is to provide telecommunication network and services and informatics, and to optimize the Company’s resources in accordance with prevailing regulations. To achieve this objective, the Company is involved in the following activities:
a.Main business:
i.Planning, building, providing, developing, operating, marketing or selling, leasing and maintaining telecommunications and information networks in accordance with prevailing regulations.
ii.Planning, developing, providing, marketing or selling and improving telecommunications and information services in accordance with prevailing regulations.
b.Supporting business:
i.Providing payment transactions and money transferring services through telecommunications and information networks.
ii.Performing activities and other undertakings in connection with the optimization of the Company's resources, which, among others, include the utilization of the Company's property and equipment andmoving assets, information systems, education and training and repairs and maintenance facilities.
The Company’s head office is located at Jalan Japati No. 1, Bandung, West Java.
The Company was granted several telecommunications licenses by the Government of the Republic of Indonesia which are valid for an unlimited period of time as long as the Company complies with prevailing laws and telecommunications regulations and fulfills the obligation stated in those licenses. For every license, an evaluation is performed annually and an overall evaluation is performed every five years.
F-7
PERUSAHAAN PERSEROAN (PERSERO)
| PT TELEKOMUNIKASI INDONESIA Tbk AND SUBSIDIARIES
| NOTES TO THE CONSOLIDATED FINANCIAL STATEMENTS
| As of January 1, 2012 (Restated), December 31, 2012 (Restated) and December 31, 2013
| and for the years ended December 31, 2011 (Restated), 2012 (Restated) and 2013
| (Figures in tables are presented in billions of rupiah, unless otherwise stated)
| |
TabelConsolidated Statements of ContentFinancial Position
| 1 1. GENERAL (continued)
| |
| | | a. EstablishmentConsolidated Statements ofProfit orLoss and general information (continued)OtherComprehensiveIncome
| 2 | | The Company is obliged to submit reports
| | | Consolidated Statements of services annuallyChanges in Equity | 3-5 |
| | | | Consolidated Statements of Cash Flows | 6 |
| | | | Notes to the Indonesian Directorate General of Post and Informatics (“DGPI”), which replaced the previous Indonesian Directorate General of Post and Telecommunications (“DGPT”). The reports comprise information such as network development progress, service quality standard achievement, total customers, license payment and universal service contribution, while for internet telephone services for public purpose (“ITKP”), there is additional information required such as operational performance, customer segmentation, traffic and gross revenue.Consolidated Financial Statements |
Details of these licenses are as follows:
License
|
| License No.
|
| Type of services
|
| Grant date/latest renewal date7-130
| | License to operate
local fixed line and
basic telephone
services network
| | 381/KEP/
M.KOMINFO/
10/2010
| | Local fixed line and
basic telephone
services network
| | October 28, 2010
| | License to operate
fixed domestic
long distance and
basic telephone
services network
| | 382/KEP/
M.KOMINFO/
10/2010
| | Fixed domestic long
distance and basic
telephone services
network
| | October 28, 2010
| | License to operate
fixed international
and basic telephone
services network
| | 383/KEP/
M.KOMINFO/
10/2010
| | Fixed international
and basic telephone
services network
| | October 28, 2010
| | License to operate
fixed closed
network
| | 398/KEP/
M.KOMINFO/
11/2010
| | Fixed closed
network
| | November 12, 2010
| | License to operate
internet telephone
services for public
purpose
| | 384/KEP/DJPT/
M.KOMINFO/
11/2010
| | ITKP
| | November 29, 2010
| | License to operate as
internet service
provider
| | 83/KEP/DJPPI/
KOMINFO/
4/2011
| | Internet service
provider
| | April 7, 2011
| | License to operate
data communication
system services
| | 169/KEP/DJPPI/
KOMINFO/
6/2011
| | Data communication
system services
| | June 6, 2011
| | License to operate
packet switched
based local fixed
line network
| | 331/KEP/
M.KOMINFO/
07/2011
| | Packet switched
based local fixed
line network
| | July 27, 2011
| | License to operate
network access point
| | 331/KEP/
M.KOMINFO/
09/2013
| | Network Access
|

Report of Independent Registered Public Accounting Firm Report No.RPC-3250/PSS/2017
The Shareholders,the Boards of Commissioners and Directors of Perusahaan Perseroan (Persero) PT Telekomunikasi Indonesia Tbk
We have audited the accompanying consolidated statements of financial position of Perusahaan Perseroan (Persero) PT Telekomunikasi Indonesia Tbk (the “Company”) and subsidiaries as of December 31, 2016 and 2015, and the related consolidated statements of profit or loss and other comprehensive income, changes in equity and cash flows for each of the three years in the period ended December 31, 2016. These financial statements are the responsibility of the Company's management. Our responsibility is to express an opinion on these financial statements based on our audits. We conducted our audits in accordance with the standards of the Public Company Accounting Oversight Board (United States). Those standards require that we plan and perform the audit to obtain reasonable assurance about whether the financial statements are free of material misstatement. An audit includes examining, on a test basis, evidence supporting the amounts and disclosures in the financial statements. An audit also includes assessing the accounting principles used and significant estimates made by management, as well as evaluating the overall financial statement presentation. We believe that our audits provide a reasonable basis for our opinion. In our opinion, the financial statements referred to above present fairly, in all material respects, the consolidated financial position of Perusahaan Perseroan (Persero) PT Telekomunikasi Indonesia Tbk and subsidiaries at December 31, 2016 and 2015, and the consolidated results of their operations and their cash flows for each of the three years in the period ended December 31, 2016, in conformity with International Financial Reporting Standards as issued by the International Accounting Standards Board. We also have audited, in accordance with the standards of the Public Company Accounting Oversight Board (United States), Perusahaan Perseroan (Persero) PT Telekomunikasi Indonesia Tbk’s internal control over financial reporting as of December 31, 2016, based on criteria established in Internal Control-Integrated Framework issued by the Committee of Sponsoring Organizations of the Treadway Commission (2013 framework) and our report dated March 24, 2017 expressed an unqualified opinion thereon. /s/ Purwantono, Sungkoro&Surja Jakarta, Indonesia March 24, 2017 
Report of Independent Registered Public Accounting Firm Report No. RPC-3251/PSS/2017
The Shareholders, the Boards of Commissioners and Directors of Perusahaan Perseroan (Persero) PT Telekomunikasi Indonesia Tbk
We have audited Perusahaan Perseroan (Persero) PT Telekomunikasi Indonesia Tbk (the “Company”) and subsidiaries’ internal control over financial reporting as of December 31, 2016, based on criteria established in Internal Control-Integrated Framework issued by the Committee of Sponsoring Organizations of the Treadway Commission (2013 framework) (the COSO criteria). Perusahaan Perseroan (Persero) PT Telekomunikasi Indonesia Tbk and subsidiaries’ management is responsible for maintaining effective internal control over financial reporting, and for its assessment of the effectiveness of internal control over financial reporting included in the accompanying Management’s Report on Internal Control over Financial Reporting. Our responsibility is to express an opinion on the company’s internal control over financial reporting based on our audit. We conducted our audit in accordance with the standards of the Public Company Accounting Oversight Board (United States). Those standards require that we plan and perform the audit to obtain reasonable assurance about whether effective internal control over financial reporting was maintained in all material respects. Our audit included obtaining an understanding of internal control over financial reporting, assessing the risk that a material weakness exists, testing and evaluating the design and operating effectiveness of internal control based on the assessed risk, and performing such other procedures as we considered necessary in the circumstances. We believe that our audit provides a reasonable basis for our opinion. A company’s internal control over financial reporting is a process designed to provide reasonable assurance regarding the reliability of financial reporting and the preparation of financial statements for external purposes in accordance with International Financial Reporting Standards as issued by the International Accounting Standards Board. A company’s internal control over financial reporting includes those policies and procedures that (1) pertain to the maintenance of records that, in reasonable detail, accurately and fairly reflect the transactions and dispositions of the assets of the company; (2) provide reasonable assurance that transactions are recorded as necessary to permit preparation of financial statements in accordance with International Financial Reporting Standards as issued by the International Accounting Standards Board, and that receipts and expenditures of the company are being made only in accordance with authorizations of management and directors of the company; and (3) provide reasonable assurance regarding prevention or timely detection of unauthorized acquisition, use, or disposition of the company’s assets that could have a material effect on the financial statements. 
Report of Independent Registered Public Accounting Firm (continued) Report No. RPC-3251/PSS/2017 (continued)
Because of its inherent limitations, internal control over financial reporting may not prevent or detect misstatements. Also, projections of any evaluation of effectiveness to future periods are subject to the risk that controls may become inadequate because of changes in conditions, or that the degree of compliance with the policies or procedures may deteriorate. In our opinion, Perusahaan Perseroan (Persero) PT Telekomunikasi Indonesia Tbk and subsidiaries maintained, in all material respects, effective internal control over financial reporting as of December 31, 2016, based on the COSO criteria. We also have audited, in accordance with the standards of the Public Company Accounting Oversight Board (United States), the consolidated statements of financial position ofPerusahaan Perseroan (Persero) PT Telekomunikasi Indonesia Tbkand subsidiaries as of December 31, 2016 and 2015, and the relatedconsolidated statements of profit or loss and other comprehensive income, changes in equity and cash flows for each of the three years in the period ended December 31, 2016 ofPerusahaan Perseroan (Persero) PT Telekomunikasi Indonesia Tbkand subsidiaries and our report dated March 24, 2017 expressed an unqualified opinion thereon. /s/ Purwantono, Sungkoro&Surja Jakarta, Indonesia March 24, 2017 PERUSAHAAN PERSEROAN (PERSERO) PT TELEKOMUNIKASI INDONESIA Tbk AND SUBSIDIARIES CONSOLIDATED STATEMENTS OF FINANCIAL POSITION As ofDecember 31,2015 and2016 (Figures in tables are expressed in billions ofRupiah and millions of U.S. dollar)
Table of Content
| | | 2015 | | 2016 | | | Notes | | Rp | | Rp | | US$ (Note3) | | ASSETS | | | | | | | | | CURRENT ASSETS | | | | | | | | | Cash and cash equivalents | 2c,2e,2t,4,31,35 | | 28,117 | | 29,767 | | 2,210 | | Other current financial assets | 2c,2e,2t,5,31,35 | | 2,818 | | 1,471 | | 109 | | Trade and other receivables | 2c,2g,2t,2aa,6,31,35 | | 7,872 | | 7,900 | | 586 | | Inventories | 2h,7 | | 528 | | 584 | | 43 | | Advances and prepaid expenses | 2c,2i,2m,8,31 | | 5,839 | | 5,246 | | 390 | | Prepaidincome taxes | 2s,28 | | 81 | | 109 | | 8 | | Prepaid other taxes | 2s,28 | | 2,657 | | 2,621 | | 195 | | Assets held for sale | 2j,10 | | - | | 3 | | 0 | | Total Current Assets | | | 47,912 | | 47,701 | | 3,541 | | NON-CURRENT ASSETS | | | | | | | | | Long-term investments | 2f,9 | | 1,807 | | 1,847 | | 137 | | Property and equipment | 2c,2l,2m,2z,10,31,33 | | 103,455 | | 114,230 | | 8,479 | | Prepaid pension benefit cost | 2r,29 | | 1,331 | | 199 | | 15 | | Intangible assets | 2d,2k,2z,12 | | 3,056 | | 3,089 | | 229 | | Deferred tax assets | 2s,28 | | 201 | | 769 | | 57 | | Advances and other non-current assets | 2c,2g,2i,2m,2s,2t,11,31,35 | | 8,166 | | 11,508 | | 854 | | Total Non-current Assets | | | 118,016 | | 131,642 | | 9,771 | | TOTAL ASSETS | | | 165,928 | | 179,343 | | 13,312 | | LIABILITIES AND EQUITY | | | | | | | | | CURRENT LIABILITIES | | | | | | | | | Trade and other payables | 2c,2n,2t,13,31,35 | | 14,284 | | 13,690 | | 1,016 | | Current income tax liabilities | 2s,28 | | 1,802 | | 1,236 | | 92 | | Other tax liabilities | 2s,28 | | 1,471 | | 1,718 | | 128 | | Accrued expenses | 2c,2t,14,31,35 | | 8,247 | | 11,283 | | 837 | | Unearned income | 2q,15 | | 4,360 | | 5,563 | | 413 | | Advances from customers and suppliers | 2c,31 | | 805 | | 840 | | 62 | | Short-term bank loans and current maturities of long-term borrowings | 2c,2m,2o,2t,16,31,35 | | 4,444 | | 5,432 | | 403 | | Total Current Liabilities | | | 35,413 | | 39,762 | | 2,951 | | NON-CURRENT LIABILITIES | | | | | | | | | Deferred tax liabilities | 2s,28 | | 2,110 | | 745 | | 55 | | Unearned income | 2q,15 | | 371 | | 425 | | 32 | | Other liabilities | | | 11 | | 29 | | 2 | | Long service award provisions | 2r,30 | | 501 | | 613 | | 46 | | Pension benefit and other post-employment benefit obligations | 2r,29 | | 4,171 | | 6,126 | | 455 | | Long-term loans and other borrowings | 2c,2m,2o,2t,17,31,35 | | 30,168 | | 26,367 | | 1,957 | | Total Non-current Liabilities | | | 37,332 | | 34,305 | | 2,547 | | TOTAL LIABILITIES | | | 72,745 | | 74,067 | | 5,498 | | EQUITY | | | | | | | | | Capital stock | 1c,19 | | 5,040 | | 5,040 | | 374 | | Additional paid-in capital | 2u,20 | | 2,457 | | 4,453 | | 331 | | Treasury stock | 2u,21 | | (3,804 | ) | (2,541 | ) | (189 | ) | Retained earnings | | | 70,893 | | 77,033 | | 5,718 | | Other reserves | 2f,2t,22 | | 348 | | 178 | | 13 | | Net Equity Attributable to Owners of the Parent Company | | | 74,934 | | 84,163 | | 6,247 | | Non-controlling Interests | 2b,18 | | 18,249 | | 21,113 | | 1,567 | | TOTAL EQUITY | | | 93,183 | | 105,276 | | 7,814 | | TOTAL LIABILITIES AND EQUITY | | | 165,928 | | 179,343 | | 13,312 | |
The accompanying notes to the consolidated financial statements form an integral part of these consolidated financial statements taken as a whole. PERUSAHAAN PERSEROAN (PERSERO) PT TELEKOMUNIKASI INDONESIA Tbk AND SUBSIDIARIES CONSOLIDATED STATEMENTS OF PROFIT OR LOSS AND OTHER COMPREHENSIVE INCOME For the Years Ended December 31, 2014, 2015 and 2016 (Figures in tables are expressed in billions ofRupiah and millions of U.S. dollar,
unless otherwise stated)
Table of Content
| | | 2014 | | 2015 | | 2016 | | | Notes | | Rp | | Rp | | Rp | | US$ (Note3) | | REVENUES | 2c,2q,24,31 | | 89,696 | | 102,470 | | 116,333 | | 8,635 | | Operation, maintenance and
telecommunication service expenses | 2c,2q,26,31 | | (22,288 | ) | (28,116 | ) | (31,263 | ) | (2,321 | ) | Depreciation and amortization | 2k,2l,2m,2z,10,12 | | (17,178 | ) | (18,572 | ) | (18,556 | ) | (1,377 | ) | Personnel expenses | 2c,2q,2r,25,31 | | (9,776 | ) | (11,885 | ) | (13,612 | ) | (1,010 | ) | Interconnection expenses | 2c,2q,31 | | (4,893 | ) | (3,586 | ) | (3,218 | ) | (239 | ) | General and administrative expenses | 2c,2q,27,31 | | (3,963 | ) | (4,204 | ) | (4,610 | ) | (342 | ) | Marketing expenses | 2q | | (3,092 | ) | (3,275 | ) | (4,132 | ) | (307 | ) | Loss on foreign exchange - net | 2p | | (14 | ) | (46 | ) | (52 | ) | (4 | ) | Other income | 2l,2q,10 | | 1,076 | | 1,500 | | 751 | | 56 | | Other expenses | 2q,10 | | (396 | ) | (1,917 | ) | (2,469 | ) | (183 | ) | OPERATING PROFIT | | | 29,172 | | 32,369 | | 39,172 | | 2,908 | | Finance income | 2c,2q,31 | | 1,238 | | 1,407 | | 1,716 | | 127 | | Finance costs | 2c,2o,2q,31 | | (1,814 | ) | (2,481 | ) | (2,810 | ) | (209 | ) | Share of profit (loss) of associated companies | 2f,9 | | (17 | ) | (2 | ) | 88 | | 7 | | PROFIT BEFORE INCOME TAX | | | 28,579 | | 31,293 | | 38,166 | | 2,833 | | INCOME TAX (EXPENSE) BENEFIT | 2s,28 | | | | | | | | | | Current | | | (7,616 | ) | (8,365 | ) | (10,738 | ) | (797 | ) | Deferred | | | 275 | | 342 | | 1,721 | | 128 | | Net Income Tax Expense | | | (7,341 | ) | (8,023 | ) | (9,017 | ) | (669 | ) | PROFIT FOR THE YEAR | | | 21,238 | | 23,270 | | 29,149 | | 2,164 | | OTHER COMPREHENSIVE INCOME (EXPENSES) | | | | | | | | | | | Other comprehensive income to be reclassified to profit or loss in subsequent periods: | | | | | | | | | | | Foreign currency translation | 2p,22 | | 24 | | 128 | | (40 | ) | (3 | ) | Net gain (loss) on available-for-sale financial assets | 2t,22 | | 1 | | (1 | ) | 0 | | 0 | | Share of other comprehensive income of associated companies | 2f,9 | | - | | (2 | ) | (1 | ) | (0 | ) | Other comprehensive income notto be reclassified to profit or loss in subsequent periods: | | | | | | | | | | | Defined benefit plan actuarial(loss)gain - net of tax | 2r,29 | | 785 | | 368 | | (2,058 | ) | (153 | ) | OtherComprehensive Income -net | | | 810 | | 493 | | (2,099 | ) | (156 | ) | NET COMPREHENSIVE INCOME FOR THE YEAR | | | 22,048 | | 23,763 | | 27,050 | | 2,008 | | Profit for the year attributable to: | | | | | | | | | | | Owners of the parent company | 23 | | 14,437 | | 15,451 | | 19,333 | | 1,435 | | Non-controlling interests | 2b, 18 | | 6,801 | | 7,819 | | 9,816 | | 729 | | | | | 21,238 | | 23,270 | | 29,149 | | 2,164 | | Net comprehensive income for the yearattributable to: | | | | | | | | | | | Owners of the parent company | 23 | | 15,291 | | 16,003 | | 17,312 | | 1,285 | | Non-controlling interests | 2b,18 | | 6,757 | | 7,760 | | 9,738 | | 723 | | | | | 22,048 | | 23,763 | | 27,050 | | 2,008 | | BASIC AND DILUTED EARNINGS PER SHARE(in full amount) | 2w,23 | | | | | | | | | | Profit per share | | | 147.78 | | 157.38 | | 195.99 | | 0.01 | | Profit per ADS (100 Series B shares per ADS) | | | 14,778.00 | | 15,738.00 | | 19,599.85 | | 1.45 | |
The accompanying notes to the consolidated financial statements form an integral part of these consolidated financial statements taken as a whole. F-2
PERUSAHAAN PERSEROAN (PERSERO) PT TELEKOMUNIKASI INDONESIA Tbk AND SUBSIDIARIES CONSOLIDATED STATEMENTS OFCHANGES IN EQUITY For the Years Ended December 31, 2014, 2015 and 2016 (Figures in tables are expressed in billions ofRupiah)
Table of Content | | | | Attributable toowners of the parent company | | | | | | Description | | Notes | | Capital stock | | Additional paid-in capital | | Treasury stock | | Retained earnings | | Other reserves | | Net | | Non-controlling interests | | Total equity | | Balance,December 31, 2013 | | | | 5,040 | | 1,845 | | (5,805 | ) | 58,475 | | 198 | | 59,753 | | 16,901 | | 76,654 | | Netcomprehensive income for the year | | 2b | | | | | | | | | | | | | | | | | | Profit for the year | | | | - | | - | | - | | 14,437 | | - | | 14,437 | | 6,801 | | 21,238 | | Other comprehensive income (expenses) | | 2f,2r,2t | | - | | - | | - | | 829 | | 25 | | 854 | | (44 | ) | 810 | | Net comprehensive income for the year | | | | - | | - | | - | | 15,266 | | 25 | | 15,291 | | 6,757 | | 22,048 | | Transactions with owners recorded directlyin equity | | | | | | | | | | | | | | | | | | | | Cash dividends | | 2v,19 | | - | | - | | - | | (9,943 | ) | - | | (9,943 | ) | (5,485 | ) | (15,428 | ) | Sale of treasury stock | | 2u,20,21 | | - | | 576 | | 1,969 | | - | | - | | 2,545 | | - | | 2,545 | | Issuance of new shares of subsidiaries | | 1d | | - | | - | | - | | - | | - | | - | | 74 | | 74 | | Acquisition of a business | | 1d | | - | | - | | - | | - | | - | | - | | 39 | | 39 | | Net transactions with owners | | | | - | | 576 | | 1,969 | | (9,943 | ) | - | | (7,398 | ) | (5,372 | ) | (12,770 | ) | Balance, December 31, 2014 | | | | 5,040 | | 2,421 | | (3,836 | ) | 63,798 | | 223 | | 67,646 | | 18,286 | | 85,932 | |
The accompanying notes to the consolidated financial statements form an integral part of these consolidated financial statements taken as a whole. F-3
PERUSAHAAN PERSEROAN (PERSERO) PT TELEKOMUNIKASI INDONESIA Tbk AND SUBSIDIARIES CONSOLIDATED STATEMENTS OFCHANGES IN EQUITY (continued) For the Years Ended December 31, 2014, 2015 and 2016 (Figures in tables are expressed in billions ofRupiah) Table of Content
| | | | Attributable toowners of the parent company | | | | | | Description | | Notes | | Capital stock | | Additional paid-in capital | | Treasury stock | | Retained earnings | | Other reserves | | Net | | Non-controlling interests | | Total equity | | Balance,December 31, 2014 | | | | 5,040 | | 2,421 | | (3,836 | ) | 63,798 | | 223 | | 67,646 | | 18,286 | | 85,932 | | Netcomprehensive income for the year | | 2b | | | | | | | | | | | | | | | | | | Profit for the year | | | | - | | - | | - | | 15,451 | | - | | 15,451 | | 7,819 | | 23,270 | | Other comprehensive income (expenses) | | 2f,2r,2t | | - | | - | | - | | 427 | | 125 | | 552 | | (59 | ) | 493 | | Net comprehensive income for the year | | | | - | | - | | - | | 15,878 | | 125 | | 16,003 | | 7,760 | | 23,763 | | Transactions with owners recorded directlyin equity | | | | | | | | | | | | | | | | | | | | Cash dividends | | 2v,19 | | - | | - | | - | | (8,783 | ) | - | | (8,783 | ) | (7,831 | ) | (16,614 | ) | Sale of treasury stock | | 2u,20,21 | | - | | 36 | | 32 | | - | | - | | 68 | | - | | 68 | | Issuance of new shares of subsidiaries | | 1d | | - | | - | | - | | - | | - | | - | | 5 | | 5 | | Acquisition of a business | | 1d | | - | | - | | - | | - | | - | | - | | 29 | | 29 | | Net transactions with owners | | | | - | | 36 | | 32 | | (8,783 | ) | - | | (8,715 | ) | (7,797 | ) | (16,512 | ) | Balance, December 31, 2015 | | | | 5,040 | | 2,457 | | (3,804 | ) | 70,893 | | 348 | | 74,934 | | 18,249 | | 93,183 | |
The accompanying notes to the consolidated financial statements form an integral part of these consolidated financial statements taken as a whole. F-4
PERUSAHAAN PERSEROAN (PERSERO) PT TELEKOMUNIKASI INDONESIA Tbk AND SUBSIDIARIES CONSOLIDATED STATEMENTS OFCHANGES IN EQUITY (continued) For the Years Ended December 31, 2014, 2015 and 2016 (Figures in tables are expressed in billions ofRupiah) Table of Content
| | | | Attributable toowners of the parent company | | | | | | Description | | Notes | | Capital stock | | Additional paid-in capital | | Treasury stock | | Retained earnings | | Other reserves | | Net | | Non-controlling interests | | Total equity | | Balance,December 31, 2015 | | | | 5,040 | | 2,457 | | (3,804 | ) | 70,893 | | 348 | | 74,934 | | 18,249 | | 93,183 | | Netcomprehensive income for the year | | 2b | | | | | | | | | | | | | | | | | | Profit for the year | | | | - | | - | | - | | 19,333 | | - | | 19,333 | | 9,816 | | 29,149 | | Other comprehensive income (expenses) | | 2f,2r,2t | | - | | - | | - | | (1,980 | ) | (41 | ) | (2,021 | ) | (78 | ) | (2,099 | ) | Net comprehensive income for the year | | | | - | | - | | - | | 17,353 | | (41 | ) | 17,312 | | 9,738 | | 27,050 | | Transactions with owners recordeddirectlyin equity | | | | | | | | | | | | | | | | | | | | Cash dividends | | 2v,19 | | - | | - | | - | | (11,213 | ) | - | | (11,213 | ) | (7,058 | ) | (18,271 | ) | Sale of treasury stock | | 2u,20,21 | | - | | 1,996 | | 1,263 | | - | | - | | 3,259 | | - | | 3,259 | | Issuance of new shares of a subsidiary | | 1d | | - | | - | | - | | - | | - | | - | | 183 | | 183 | | Acquisition of a business | | 1d | | - | | - | | - | | - | | - | | - | | 10 | | 10 | | Acquisition of non-controlling interests | | 1d | | - | | - | | - | | - | | (129 | ) | (129 | ) | (9 | ) | (138 | ) | Net transactions with owners | | | | - | | 1,996 | | 1,263 | | (11,213 | ) | (129 | ) | (8,083 | ) | (6,874 | ) | (14,957 | ) | Balance, December 31, 2016 | | | | 5,040 | | 4,453 | | (2,541 | ) | 77,033 | | 178 | | 84,163 | | 21,113 | | 105,276 | |
The accompanying notes to the consolidated financial statements form an integral part of these consolidated financial statements taken as a whole. F-5
PERUSAHAAN PERSEROAN (PERSERO) PT TELEKOMUNIKASI INDONESIA Tbk AND SUBSIDIARIES CONSOLIDATED STATEMENTS OF CASH FLOWS For the Years Ended December 31, 2014, 2015 and 2016 (Figures in tables are expressed in billions ofRupiah and millions of U.S. dollar) Table of Content | Notes | | 2014 | | 2015 | | 2016 | | | | | Rp | | Rp | | Rp | | US$ (Note3) | | CASH FLOWS FROM OPERATING ACTIVITIES | | | | | | | | | | | Cash receipts from: | | | | | | | | | | | Customers | | | 84,748 | | 98,002 | | 113,288 | | 8,409 | | Other operators | | | 4,379 | | 2,700 | | 2,828 | | 210 | | Total cash receiptsfrom customers and other operators | | | 89,127 | | 100,702 | | 116,116 | | 8,619 | | Interest income received | | | 1,236 | | 1,386 | | 1,736 | | 129 | | Cash payments for expenses | | | (33,124 | ) | (35,922 | ) | (42,433 | ) | (3,149 | ) | Payments for corporate and final income taxes | | | (7,436 | ) | (9,299 | ) | (11,304 | ) | (839 | ) | Cash payments to employees | | | (9,594 | ) | (10,940 | ) | (11,207 | ) | (832 | ) | Payments for interest costs | | | (1,911 | ) | (2,623 | ) | (3,455 | ) | (257 | ) | Payments for value added taxes - net | | | (514 | ) | (210 | ) | (2,696 | ) | (200 | ) | Other cash (payment) receipts - net | | | (48 | ) | 575 | | 474 | | 35 | | Net cash provided by operating activities | | | 37,736 | | 43,669 | | 47,231 | | 3,506 | | CASH FLOWS FROM INVESTING ACTIVITIES | | | | | | | | | | | (Placements in) proceeds from escrow accounts | | | (2,121 | ) | - | | 2,159 | | 160 | | Proceeds from sale of property and equipment | 10 | | 501 | | 733 | | 765 | | 57 | | Proceeds from insurance claims | 10 | | 212 | | 119 | | 60 | | 4 | | Dividends received from associated company | 9 | | - | | 18 | | 23 | | 2 | | Purchase of property and equipment | 10,37 | | (24,798 | ) | (26,499 | ) | (26,787 | ) | (1,989 | ) | Increase in advances for purchases of property and equipment | | | (1,808 | ) | (67 | ) | (1,338 | ) | (99 | ) | Purchase of intangible assets | 12,37 | | (1,328 | ) | (1,439 | ) | (1,098 | ) | (82 | ) | Proceeds from (placement in) time deposits and available-for-sale financial assets - net | | | 6,193 | | (146 | ) | (983 | ) | (73 | ) | Acquisition of non-controlling interest in asubsidiary | 1d | | - | | - | | (138 | ) | (10 | ) | Acquisition of business, net of acquired cash | 1d | | (110 | ) | (114 | ) | (137 | ) | (10 | ) | Additional contribution on long-term investments | 9 | | (1,487 | ) | (62 | ) | (43 | ) | (3 | ) | (Increase) decreasein other assets | 11 | | (8 | ) | 36 | | (40 | ) | (3 | ) | Divestment of long-term investment | | | 6 | | - | | - | | - | | Net cash used in investing activities | | | (24,748 | ) | (27,421 | ) | (27,557 | ) | (2,046 | ) | CASH FLOWS FROM FINANCING ACTIVITIES | | | | | | | | | | | Proceeds from loans and other borrowings | 16,17 | | 10,454 | | 20,561 | | 7,479 | | 555 | | Proceeds from sale of treasury stock | 21 | | 2,541 | | 68 | | 3,259 | | 241 | | Capital contribution of non-controlling interests in subsidiaries | | | 74 | | 5 | | 183 | | 14 | | Cash dividends paid to the Company’s stockholders | 19 | | (9,943 | ) | (8,783 | ) | (11,213 | ) | (832 | ) | Repayments of loans and other borrowings | 16,17 | | (7,724 | ) | (10,427 | ) | (10,555 | ) | (783 | ) | Cash dividends paid to non-controlling interests of subsidiaries | | | (5,485 | ) | (7,831 | ) | (7,058 | ) | (524 | ) | Net cash used in financing activities | | | (10,083 | ) | (6,407 | ) | (17,905 | ) | (1,329 | ) | NET INCREASE IN CASH AND CASH EQUIVALENTS | | | 2,905 | | 9,841 | | 1,769 | | 131 | | EFFECT OF EXCHANGE RATE CHANGES ON CASH AND CASH EQUIVALENTS | | | 71 | | 604 | | (119 | ) | (8 | ) | CASH AND CASH EQUIVALENTS AT BEGINNING OF YEAR | 4 | | 14,696 | | 17,672 | | 28,117 | | 2,087 | | CASH AND CASH EQUIVALENTS AT END OF YEAR | 4 | | 17,672 | | 28,117 | | 29,767 | | 2,210 | |
The accompanying notes to the consolidated financial statements form an integral part of these consolidated financial statements taken as a whole. Table of Content 1. GENERAL
a. Establishment and general information Perusahaan Perseroan (Persero) PT Telekomunikasi Indonesia Tbk (the “Companyâ€) was originally part of“Post en Telegraafdienstâ€, which was established and operated commercially in 1884 under the framework of Decree No. 7 dated March 27, 1884 of the Governor General of the Dutch Indies. Decree No. 7was published in State Gazette No. 52 dated April 3, 1884. In 1991, the status of the Company was changed into a state-owned limited liability corporation (“Perseroâ€) based on Government Regulation No. 25/1991. The ultimate parent of the Company is the Government of the Republic of Indonesia (the “Governmentâ€) (Notes 1c and 19). The Company was established based on notarial deed No. 128 dated September 24, 1991 of Imas Fatimah, S.H. Its deed of establishment was approved by the Ministry of Justice of the Republic of Indonesia in its Decision Letter No. C2-6870.HT.01.01.Th.1991 dated November 19, 1991 and was published in State Gazette No. 5 dated January 17, 1992, Supplement No. 210. The Articles of Association has been amended several times, the latest amendments of which were about, among others,in compliance with the Financial Services Authority Regulations and the Ministry of State-Owned Enterprises Regulations and Circular Letters, addition of main and supplementary business activities of the Company, addition of special right of Series A Dwiwarna stockholder, revision regarding the change in authority limitation of the Board of Directors which requires approval from the Board of Commissioners in performing such managing activities of the Company as well as improvement in the editorial and order of Articles of Association related to the addition of Articles of Association substance based on notarial deed No. 20 dated May 12, 2015 of Ashoya Ratam, S.H., MKn.The latest amendments were accepted and approved by the Ministry of Law and Human Rights of the Republic of Indonesia (“MoLHRâ€) in its LetterNo. AHU-AH.01.03-0938775 dated June 9, 2015 and MoLHRDecision No. AHU-0936901.AH.01.02.Th.2015 dated June 9, 2015. In accordance with Article 3 of the Company’s Articles of Association, the scope of its activities is to provide telecommunication network and telecommunication and information services, and to optimize the Company’s resources in accordance with prevailing regulations. In regard to achieving its objectives, the Company is involved in the following activities: a.Main business: i.Planning, building, providing, developing, operating, marketing orselling orleasing, and maintaining telecommunication and information networksin a broad sensein accordance with prevailingregulations. ii.Planning, developing, providing, marketing/selling, and improving telecommunication and information servicesin a broad sensein accordance with prevailingregulations. iii.Investing includingequitycapital in other companies in line withachieving the purposes and objectives of the Company. b.Supporting business: i.Providing payment transactions and money transferring services through telecommunication and information networks. ii.Performing activities and other undertakings in connection with the optimization of the Company's resources, which among others, include the utilization of the Company's property and equipment and moving assets, information systems, education and training, repairs and maintenance facilities. iii.Collaborating with other parties in order to optimize the information, communication or technology resources owned by other parties asservice provider ininformation, communication and technology industryas to achieve the purposes and objectives of the Company. F-7
PERUSAHAAN PERSEROAN (PERSERO) PT TELEKOMUNIKASI INDONESIA Tbk AND SUBSIDIARIES NOTES TO THE CONSOLIDATED FINANCIAL STATEMENTS As of December 31, 2015 and 2016 and for the Years Ended December 31, 2014, 2015 and 2016 (Figures in tables are expressedin billions ofRupiah, unless otherwise stated)
Table of Content
1. GENERAL (continued) a. Establishment and general information (continued) The Company’s head office is located at Jalan Japati No. 1, Bandung, West Java. The Companywas granted severalnetworks and/or services licenses by theGovernment which are valid for an unlimited period of time as long as the Company complies withprevailing lawsand fulfills the obligation stated in those licenses. For every license issued by the Ministry of Communication and Information (“MoCIâ€), an evaluation is performed annually and an overall evaluation is performed every 5 (five) years. The Company is obliged to submit reports ofnetworks and/orservices annually to the Indonesian Directorate General of Post and Informatics (“DGPIâ€), which replaced the previous Indonesian Directorate General of Post and Telecommunications (“DGPTâ€). The reports comprise information such as network development progress, service quality standard achievement,number ofcustomers, license payment and universal service contribution, while for internet telephone services for public purpose, internet interconnection service, and internet access service, there is additional information required such as operational performance, customer segmentation, traffic, and gross revenue.
Details of these licenses are as follows: License | | License No. |
| Type of services |
| Grant date/latestrenewal date | | License of electronic money issuer | | Bank Indonesia License No.11/432/DASP | | Electronic money | | July 3, 2009 | | License ofmoneyremittance | | Bank Indonesia License
No.11/23/bd/8 | | Money remittance service | | August 5, 2009 | | License to operate internet service provider | | 302/KEP/DJPPI/ KOMINFO/8/2013 | | Internet service provider | | August 2, 2013 | | License to operate network access point | | 331/KEP/DJPPI/ KOMINFO/09/2013 | | Network Access Point (“NAP”) | | September 24, 2013 | |
License to operate internet telephone services for public purpose | | 127/KEP/DJPPI/ KOMINFO/3/2016 | | F-8Internet telephone services for public purpose
| PERUSAHAAN PERSEROAN (PERSERO)
| March 30, 2016 | PT TELEKOMUNIKASI INDONESIA Tbk AND SUBSIDIARIES
| NOTES TO THE CONSOLIDATED FINANCIAL STATEMENTS
| As of January 1, 2012 (Restated), December 31, 2012 (Restated) and December 31, 2013
| and for the years ended December 31, 2011 (Restated), 2012 (Restated) and 2013
| (Figures in tables are presented in billions of rupiah, unless otherwise stated)
| |
| License to operate fixed domestic long distance network | | Tabel of Content839/KEP/
M.KOMINFO/05/2016 | | 1.Fixed domestic long distance and basic telephone services network
| | May 16, 2016 | | License to operate fixed international network | | 846/KEP/ M.KOMINFO/05/2016 | | Fixed international and basic telephone services network | | May 16, 2016 | | License to operate fixed closed network | | 844/KEP/ M.KOMINFO/05/2016 | | Fixed closed network | | May 16, 2016 | | License to operate circuit switched based local fixed line network | | 948/KEP/ M.KOMINFO/05/2016 | | Circuit Switched based local fixed line network | | May 31, 2016 | | License to operate data communication system services | | 191/KEP/DJPPI/ KOMINFO/10/2016 | | Data communication system services | | October 31, 2016 | | | | |
F-8
PERUSAHAAN PERSEROAN (PERSERO)
PT TELEKOMUNIKASI INDONESIA Tbk AND SUBSIDIARIES
NOTES TO THE CONSOLIDATED FINANCIAL STATEMENTS
As of December 31, 2015 and 2016 and for the
Years Ended December 31, 2014, 2015 and 2016
(Figures in tables are expressedin billions ofRupiah, unless otherwise stated)
Table of Content
1. GENERAL (continued)
b. Company’s Board of Commissioners, Board of Directors, Audit Committee and Corporate Secretary
1. Boards of Commissioners and Directors
Based on resolutions made at theAnnual General Meeting (“AGMâ€) of Stockholders of the Company as coveredby notarial deed No. 50 of Ashoya Ratam, S.H., MKn., dated April 22, 2016, andAGM of Stockholders of the Company as coveredby notarial deed No. 26 of Ashoya Ratam, S.H., MKn., dated April 17, 2015,the composition ofthe Company’s Boards of Commissioners and Directors as of December 31, 2015 and 2016,respectively,was as follows:
|
| b. Company’s Board2015
| | 2016 | |
President Commissioner | | Hendri Saparini | | Hendri Saparini | |
Commissioner | | Dolfie Othniel Fredric Palit | | Dolfie Othniel Fredric Palit | |
Commissioner | | Hadiyanto | | Hadiyanto | |
Commissioner | | Margiyono Darsasumarja | | Pontas Tambunan | |
Independent Commissioner | | Rinaldi Firmansyah | | Rinaldi Firmansyah | |
Independent Commissioner | | Parikesit Suprapto | | Margiyono Darsasumarja | |
Independent Commissioner | | Pamiyati Pamela Johanna | | Pamiyati Pamela Johanna | |
President Director | | Alex Janangkih Sinaga | | Alex Janangkih Sinaga | |
Director of Commissioners, BoardFinance | | Heri Sunaryadi | | Harry Mozarta Zen | |
Director ofDigital and Strategic Portfolio | | Indra Utoyo | | Indra Utoyo | |
Director of Directors, Audit CommitteeEnterprise and Business Service* | | Muhammad Awaluddin | | - | |
Director of Wholesale and International Services | | Honesti Basyir | | Honesti Basyir | |
Director of Human Capital Management | | Herdy Rosadi Harman | | Herdy Rosadi Harman | |
Director of Network, Information Technology and Solution | | Abdus Somad Arief | | Abdus Somad Arief | |
Director of Consumer Services | | Dian Rachmawan | | Dian Rachmawan | |
*On September 9, 2016, Muhammad Awaluddin was appointed as Director of PT Angkasa Pura II. Based on the Board of Directors’ decision No. 33/REG/IX/2016 dated September 13, 2016, Honesti Basyir as Director of Wholesale and International Services was appointed to act as Director of Enterprise and Business Service.
2. Audit Committee and Corporate Secretary
The composition of the Company’s Audit Committee and the Corporate Secretary as ofDecember 31, 2015 and 2016, were as follows:
|
| 2015 | | 2016* | |
Chairman | | Rinaldi Firmansyah | | Rinaldi Firmansyah | |
Secretary | | Tjatur Purwadi | | Tjatur Purwadi | |
Member | | Parikesit Suprapto | | Margiyono Darsasumarja | |
Member | | Dolfie Othniel Fredric Palit | | Dolfie Othniel Fredric Palit | |
Member | | - | | Sarimin Mietra Sardi | |
Member | | - | | Pontas Tambunan | |
Corporate Secretary | | 1. Boards of Commissioners and DirectorsAndi Setiawan
| | Based on resolutions made at the Annual General Meeting (“AGM”) of Stockholders of the Company held on May 11, 2012 as covered by notarial deed No. 14 of Ashoya Ratam, S.H., MKn. and the AGM of Stockholders of the Company held on May 8, 2013 as covered by notarial deed No. 11 of Ashoya Ratam, S.H., MKn., the composition of the Company’s Boards of Commissioners and Directors as of December 31, 2012 and 2013, respectively,Andi Setiawan
| |
*The changes in the Audit Committee are based on the Board of Commissioners’ decision No. 09/KEP/DK/2016 dated July 27, 2016.
F-9
PERUSAHAAN PERSEROAN (PERSERO)
PT TELEKOMUNIKASI INDONESIA Tbk AND SUBSIDIARIES
NOTES TO THE CONSOLIDATED FINANCIAL STATEMENTS
As of December 31, 2015 and 2016 and for the
Years Ended December 31, 2014, 2015 and 2016
(Figures in tables are expressedin billions ofRupiah, unless otherwise stated)
Table of Content
1. GENERAL (continued)
c. Public offering of securities of the Company
The Company’s shares prior to its Initial Public Offering (“IPOâ€) totalled 8,400,000,000, consisting of 8,399,999,999 Series B shares and 1 Series A Dwiwarna share, and werewholly-owned by the Government.On November 14, 1995, 933,333,000 new Series B shares and 233,334,000 Series B shares owned by the Government were offered to the public through an IPO and listed on the Indonesia Stock Exchange (“IDXâ€) and 700,000,000 Series B shares owned by the Government were offered to the public and listed on the New York Stock Exchange (“NYSEâ€) and the London Stock Exchange (“LSEâ€), in the form of American Depositary Shares (“ADSâ€). There were 35,000,000 ADS and each ADS represented 20 Series B shares at that time.
In December 1996, the Government had a block sale of its 388,000,000 Series B shares, and in 1997, distributed 2,670,300 Series B shares as incentive to the Company’s stockholders who did not sell their shares within one year from the date of the IPO. In May 1999, the Government further sold 898,000,000 Series B shares.
To comply with Law No. 1/1995 on Limited Liability Companies, at the AGM of Stockholders of the Company on April 16, 1999, the Company’s stockholders resolved to increase the Company’s issued share capital by the distribution of 746,666,640 bonus shares through the capitalization of certain additional paid-in capital, which was made to the Company’s stockholders in August 1999. On August 16, 2007, Law No. 1/1995 on Limited Liability Companies was amended by the issuance of Law No. 40/2007 on Limited Liability Companies which became effective on the same date. Law No. 40/2007 has no effect on the public offering of shares of the Company. The Company has complied with Law No. 40/2007.
In December 2001, the Government had another block sale of its 1,200,000,000 shares or 11.9% of the total outstanding Series B shares. In July 2002, the Government further sold a block of 312,000,000 shares or 3.1% of the total outstanding Series B shares.
At the AGM of Stockholders of the Company held on July 30, 2004, the minutes of which are covered by notarial deed No. 26 of A. Partomuan Pohan, S.H., LLM., the Company’s stockholders approved the Company’s 2-for-1 stock split for Series A Dwiwarna and Series B share. The Series A Dwiwarna share with par value of Rp500 per share was split into 1 Series A Dwiwarna share with par value of Rp250 per share and 1 Series B share with par value of Rp250 per share. The stock split resulted in an increase of the Company’s authorized capital stock from 1 Series A Dwiwarna share and 39,999,999,999 Series B shares to 1 Series A Dwiwarna share and 79,999,999,999 Series B shares, and the issued capital stock from 1 Series A Dwiwarna share and 10,079,999,639 Series B shares to 1 Series A Dwiwarna share and 20,159,999,279 Series B shares. After the stock split, each ADS represented 40 Series B shares.
During the Extraordinary General Meeting of Stockholders (“EGMâ€) held on December 21, 2005 and the AGMs held on June 29, 2007, June 20, 2008 and May 19, 2011, the Company’s stockholders approved phase I, II, III and IV plan, respectively, of the Company’s program to repurchase its issued Series B shares (Note21).
F-10
PERUSAHAAN PERSEROAN (PERSERO)
PT TELEKOMUNIKASI INDONESIA Tbk AND SUBSIDIARIES
NOTES TO THE CONSOLIDATED FINANCIAL STATEMENTS
As of December 31, 2015 and 2016 and for the
Years Ended December 31, 2014, 2015 and 2016
(Figures in tables are expressedin billions ofRupiah, unless otherwise stated)
Table of Content
1. GENERAL (continued)
c. Public offering of securities of the Company (continued)
During the period December 21, 2005 to June 20, 2007, the Company had bought back 211,290,500 shares from the public (stock repurchase program phase I). On July 30, 2013, the Company has sold all such shares(Note 21).
At the AGM held on April 19, 2013 as covered by notarial deed No. 38 dated April 19, 2013 of Ashoya Ratam, S.H., MKn., the stockholders approved the changes to the Company’s plan on the treasury stock acquired under phase III (Note 21).
At the AGM held on April 19, 2013, the minutes of which are covered by notarial deed No. 38 of Ashoya Ratam, S.H., MKn., the stockholders approved the Company’s 5-for-1stock split for Series A Dwiwarna and Series B shares. Series A Dwiwarna share with par value of Rp250 per share was split into 1 Series A Dwiwarna share with par value of Rp50 per share and 4 Series B shares with par value of Rp50 per share. The stock split resulted in an increase of the Company’s authorized capital stock from 1 Series A Dwiwarna and 79,999,999,999 Series B shares to 1 Series A Dwiwarna and 399,999,999,999 Series B shares, and the issued capital stock from 1 Series A Dwiwarna and 20,159,999,279 Series B shares to 1 Series A Dwiwarna and 100,799,996,399 Series B shares. After the stock split, each ADS represented 200 Series B shares. Effective from October 26, 2016, the Companychanged the ratio of Depositary Receipt from 1 ADS representing 200 series B sharestobecome 1 ADS representing 100 series B shares (Note 19). Profit per ADS information have been retrospectively adjusted to reflect the changes in the ratio of ADS.
On May 16 and June 5, 2014, the Company deregistered fromtheTokyo Stock Exchange (“TSEâ€) and delisted from the LSE, respectively.
As ofDecember 31, 2016, all of the Company’s Series B shares are listed on the IDX and70,005,900ADS shares are listed on the NYSE (Note19).
OnJune 25,2010, the Company issuedthe second rupiah bondswith a nominal amount of Rp1,005 billion for Series A, a five-year period, and Rp1,995 billion for Series B, a ten-year period, respectively, which are listed on the IDX (Note17b).
On June 16, 2015, the Company issued Continuous Bond I Telkom Phase I 2015, with a nominal amountofRp2,200 billion for Series A, a seven-year period, Rp2,100 billion for Series B, a ten-year period, Rp1,200 billion for Series C, a fifteen-year period, and Rp1,500 billion for Series D, a thirty-year period, respectively,whichare listed on the IDX (Note 17b).
On December 21, 2015, the Company sold the remainingtreasurysharesphase III (Note 21).
On June 29, 2016, the Company sold the treasury shares phase IV (Note 21).
F-11
PERUSAHAAN PERSEROAN (PERSERO)
PT TELEKOMUNIKASI INDONESIA Tbk AND SUBSIDIARIES
NOTES TO THE CONSOLIDATED FINANCIAL STATEMENTS
As of December 31, 2015 and 2016 and for the
Years Ended December 31, 2014, 2015 and 2016
(Figures in tables are expressedin billions ofRupiah, unless otherwise stated)
Table of Content
1. GENERAL (continued)
d. Subsidiaries
As of December 31, 2015 and 2016, the Company has consolidated the following directly or indirectly owned subsidiaries (Notes 2b and 2d):
(i)Direct subsidiaries:
| | | | Year of start of commercial operations | | Percentage of ownership interest | | Total assets before elimination | |
Subsidiary/place of incorporation | | Nature of business | | | 2015 | | 2016 | | 2015 | | 2016 | |
PT Telekomunikasi Selular (“Telkomselâ€), Jakarta, Indonesia | | Telecommunication - provides telecommunication facilities and mobile cellular services using Global Systemsfor Mobile Communication (“GSMâ€) technology | | 1995 | | 65 | | 65 | | 83,695 | | 89,645 | |
PT Dayamitra Telekomunikasi (“Dayamitraâ€), Jakarta, Indonesia | | Telecommunication | | 1995 | | 100 | | 100 | | 9,341 | | 10,689 | |
PT Multimedia Nusantara (“Metraâ€), Jakarta, Indonesia | | Network telecommunication services and multimedia | | 1998 | | 100 | | 100 | | 8,543 | | 9,996 | |
PT TelekomunikasiIndonesia International (“TIIâ€), Jakarta, Indonesia | | Telecommunication | | 1995 | | 100 | | 100 | | 5,604 | | 7,147 | |
PT Telkom Akses (“Telkom Aksesâ€), Jakarta, Indonesia | | Construction, service and trade in the field oftelecommunication | | 2013 | | 100 | | 100 | | 3,696 | | 5,098 | |
PT Graha Sarana Duta (“GSDâ€), Jakarta, Indonesia | | Leasing of offices and providing building management and maintenance services, civil consultant and developer | | 1982 | | 99.99 | | 99.99 | | 3,576 | | 4,328 | |
PTPINS Indonesia(“PINSâ€),Jakarta, Indonesia | | Telecommunication construction and services | | 1995 | | 100 | | 100 | | 2,960 | | 3,146 | |
PTInfrastruktur Telekomunikasi Indonesia(“Telkom Infratelâ€),Jakarta, Indonesia | | Construction, service and trade in the field of telecommunication | | 2014 | | 100 | | 100 | | 647 | | 1,015 | |
PT Patra Telekomunikasi Indonesia (“Patrakomâ€), Jakarta, Indonesia | | Telecommunication- providessatellite communication system, services and facilities | | 1996 | | 100 | | 100 | | 471 | | 471 | |
PT MetraNet (“MetraNetâ€), Jakarta, Indonesia | | Multimedia portal service | | 2009 | | 99.99 | | 100 | | 66 | | 370 | |
PT Jalin Pembayaran Nusantara (“Jalinâ€),Jakarta, Indonesia | | Payment services -principals, switching, clearing and settlement activities | | 2016 | | - | | 100 | | - | | 15 | |
PT Napsindo Primatel Internasional (“Napsindoâ€), Jakarta, Indonesia | | Telecommunication - provides Network Access Point (NAP), Voice Over Data (VOD) and other related services | | 1999; ceased operations on January 13, 2006 | | 60 | | 60 | | 5 | | 5 | |
F-12
PERUSAHAAN PERSEROAN (PERSERO)
PT TELEKOMUNIKASI INDONESIA Tbk AND SUBSIDIARIES
NOTES TO THE CONSOLIDATED FINANCIAL STATEMENTS
As of December 31, 2015 and 2016 and for the
Years Ended December 31, 2014, 2015 and 2016
(Figures in tables are expressedin billions ofRupiah, unless otherwise stated)
Table of Content
1. GENERAL (continued)
d. Subsidiaries (continued)
(ii)Immediate indirect subsidiaries:
Subsidiary/place of incorporation | | | | Year of start of commercial operations | | Percentage of ownership interest | | Total assets before elimination | |
| Nature of business | | | 2015 | | 2016 | | 2015 | | 2016 | |
PT Sigma Cipta Caraka (“Sigmaâ€), Tangerang, Indonesia | | Information technology service - system implementation and integration service, outsourcing and software license maintenance | | 1988 | | 100 | | 100 | | 3,683 | | 4,278 | |
Telekomunikasi Indonesia International Pte. Ltd., Singapore | | Telecommunication | | 2008 | | 100 | | 100 | | 1,625 | | 2,566 | |
PT Infomedia Nusantara (“Infomediaâ€), Jakarta, Indonesia | | Data and information service - provides telecommunication information services and other information services in the form of print and electronic media and call center services | | 1984 | | 100 | | 100 | | 1,664 | | 1,853 | |
PT Telkom Landmark Tower (“TLTâ€), Jakarta, Indonesia | | Service for property development and management | | 2012 | | 55 | | 55 | | 1,245 | | 1,683 | |
Telekomunikasi Indonesia International S.A. (“TLâ€), Dili, Timor Leste | | Telecommunication | | 2012 | | 100 | | 100 | | 854 | | 755 | |
PT Metra Digital Media (“MD Mediaâ€), Jakarta, Indonesia | | Directory information services | | 2013 | | 99.99 | | 99.99 | | 610 | | 684 | |
PT Finnet Indonesia (“Finnetâ€),Jakarta,Indonesia | | Information technology services | | 2006 | | 60 | | 60 | | 513 | | 629 | |
Telekomunikasi Indonesia International Ltd., Hong Kong | | Telecommunication | | 2010 | | 100 | | 100 | | 326 | | 441 | |
PT Metra Digital Investama (“MDIâ€), Jakarta, Indonesia | | Trading and/or providing service related to information and technology, multimedia, entertainment and investments | | 2013 | | 99.99 | | 99.99 | | 4 | | 331 | |
PT Metra Plasa (“Metra Plasaâ€), Jakarta, Indonesia | | Networkande-commerce services | | 2012 | | 60 | | 60 | | 85 | | 325 | |
PT Nusantara Sukses Investasi (â€NSIâ€), Jakarta, Indonesia | | Service and trading | | 2014 | | 99.99 | | 99.99 | | 165 | | 227 | |
PT Administrasi Medika (“Ad Medikaâ€), Jakarta, Indonesia | | Health insurance administration services | | 2002 | | 75 | | 100 | | 160 | | 204 | |
PT Melon (“Melonâ€), Jakarta, Indonesia | | Digital content exchange hub services | | 2010 | | 51 | | 100 | | - | | 178 | |
PT Graha Yasa Selaras (“GYSâ€),Jakarta, Indonesia | | Tourism service | | 2012 | | 51 | | 51 | | 160 | | 174 | |
Telekomunikasi Indonesia Internasional Pty. Ltd.(“Telkom Australiaâ€),Sydney, Australia | | Telecommunication | | 2013 | | 100 | | 100 | | 235 | | 161 | |
F-13
PERUSAHAAN PERSEROAN (PERSERO)
PT TELEKOMUNIKASI INDONESIA Tbk AND SUBSIDIARIES
NOTES TO THE CONSOLIDATED FINANCIAL STATEMENTS
As of December 31, 2015 and 2016 and for the
Years Ended December 31, 2014, 2015 and 2016
(Figures in tables are expressedin billions ofRupiah, unless otherwise stated)
Table of Content
1. GENERAL (continued)
d. Subsidiaries (continued)
(ii)Immediate indirect subsidiaries: (continued)
Subsidiary/place of incorporation | | Nature of business | | Year of start of commercial operations | | Percentage of ownership interest | | Total assets before elimination | |
| | | 2015 | | 2016 | | 2015 | | 2016 | |
PT Sarana Usaha Sejahtera Insanpalapa (“TelkoMedikaâ€), Jakarta, Indonesia | | Health services,medicine services including pharmacies, laboratories and other health care support | | 2008 | | 75 | | 75 | | 49 | | 72 | |
PT Satelit Multimedia Indonesia (“SMIâ€),Jakarta, Indonesia | | Satelliteservice | | 2013 | | 99.99 | | 99.99 | | 13 | | 18 | |
Telekomunikasi Indonesia International Inc. (“TelkomUSAâ€), Los Angeles, USA | | Telecommunication | | 2014 | | 100 | | 100 | | 52 | | 9 | |
PT Nusantara Sukses Sarana (â€NSSâ€),Jakarta, Indonesia | | Building and hotelmanagement services, and other services | | - | | 99.99 | | 99.99 | | - | | - | |
PT Nusantara Sukses Realti(â€NSRâ€),Jakarta,Indonesia | | Serviceandtrading | | - | | 99.99 | | 99.99 | | - | | - | |
PT Metra TV(“Metra TVâ€), Jakarta, Indonesia | | Subscription - broadcastingservices | | 2013 | | 99.83 | | 99.83 | | - | | - | |
(a)Metra
On November 30, 2015, Metra acquired 13,850 shares of TelkoMedika (equivalent to 75% ownership) with acquisition costamounting toRp69.5 billion. TelkoMedikaisengaged in healthprocurement and medicinal services including the establishment of pharmacies, hospital, clinic, orother healthcare support. Metra acquired TelkoMedika because it expands the range of products and services in the corporate segment that can be offered to its customers.
On February 29, 2016, based on notarial deed of Utiek Rochmuljati Abdurachman S.H., M.LI., M.Kn., No. 22, which has been approved by MoLHR through its decision letter No.AHU-AHA.01.03-0027722 dated March 1, 2016, Metraplasa's stockholders approved an increase in its authorized capital and the additional of paid in capital amounting to Rp152 billion. The increase of authorized capital was taken proportionately by Metra and its non-controlling interest amounting to Rp91 billion and Rp61 billion, respectively.
Based on notarial deedofUtiek Rochmuljati Abdurachman, S.H., M.LI, M.Kn., No. 10, 11, 12, 13, and 14dated May 25, 2016,Metra purchased 2,000 shares of Ad Medika from the non-controlling interest equivalent to 25% ownership amounting to Rp138 billion.
On October 24, 2016, based on notarial deed of Utiek Rochmuljati Abdurachman S.H., M.LI., M.Kn., No. 07, which has been approved by MoLHR through its decision letter No. AHU-AHA.01.03-0092364 dated October 25, 2016, Metraplasa's stockholders approved an increase in its authorized capital and the additional of paid in capital amounting to Rp304 billion. The increase of authorized capital was taken proportionately by Metra and its non-controlling interest amounting to Rp182 billion and Rp122 billion, respectively.
F-14
PERUSAHAAN PERSEROAN (PERSERO)
PT TELEKOMUNIKASI INDONESIA Tbk AND SUBSIDIARIES
NOTES TO THE CONSOLIDATED FINANCIAL STATEMENTS
As of December 31, 2015 and 2016 and for the
Years Ended December 31, 2014, 2015 and 2016
(Figures in tables are expressedin billions ofRupiah, unless otherwise stated)
Table of Content
1. GENERAL (continued)
d. Subsidiaries (continued)
(b)Sigma
Based onnotarialdeedofUtiek Rochmuljati Abdurachman, S.H., M.LI, M.Kn.,No. 09 dated December 18, 2015 which was approved by MoLHR through its decision letterNo. AHU-AH.01.03-09904427 dated December 22, 2015, Sigmapurchased 55%ownership in PT Media NusantaraData Global ("MNDG") which is engaged in data center services. Sigma acquired MNDG to enlarge the capacity of its data centers that can be offered to its customers. The acquisition cost amounted to Rp45 billion and the fair value of identifiable net assets amounted to Rp30 billion resulting in a goodwill of Rp15 billion (Note 12).
The goodwill represents the fair value of expected synergies arising from the acquisition.
Based on notarial deed of Utiek Rochmuljati Abdurachman, S.H., M.LI, M.Kn., No. 15 dated June 29, 2016, Sigma purchased 13,770 shares of PT Pojok Celebes Mandiri (“PCMâ€) (equivalent to 51% ownership) from Metra amounting to Rp7.8 billion.
(c) TII
On May 19, 2015, Pachub Acquisition Co. was incorporated, with Telekomunikasi Indonesia International (USA) obtaining 100% direct ownership.
On May 29, 2015, Telkom USA and Pachub Acquisition Co. entered into an agreement and plan of merger with AP Teleguam Holdings, Inc. On May 30, 2016, the agreement related to the merger was terminated.
(d) Jalin
On November 3, 2016, the Company established a wholly-owned subsidiary under the name PT Jalin Pembayaran Nusantara (“Jalinâ€) which was approved by the MoLHR through its Decision Letter No. AHU-0050800.AH.01.01 dated November 15, 2016. Jalin is engaged in organizing ICT (Information and Communication Technology) business focusing on non-cash payment for national payment gateway.
(e) Metranet
On November 10, 2016, Metranet increased its share capital from Rp244 billion to Rp325 billion by issuing 18,800,000 new shares which were wholly-owned by the Company.
Based on notarial deed of Utiek Rochmuljati Abdurachman, S.H., M.LI, M.Kn., No. 08 and 09 dated November 14, 2016, Metranet purchased 4,900,000 shares of Melon (equivalent to 49% ownership) from SK Planet Co. and 300,000 shares of Melon (equivalent to 3% ownership) from Metra. Cash consideration amounting to US$13,000,000 or Rp170.4 billion and Rp13.2 billion were paid to SK Planet Co. and Metra, respectively. As a result of this transaction, Metranet acquired 52% ownership in Melon and the remaining shares are held by Metra. As of December 31, 2016, the initial accounting for the acquisition has not been completed since the independent valuation of assets and liabilities acquired has not yet been received.
e. Authorization for the issuance of the consolidated financial statements
The consolidated financial statements were approved for issuance by the Board of Directors on March 24, 2017.
F-15
PERUSAHAAN PERSEROAN (PERSERO)
PT TELEKOMUNIKASI INDONESIA Tbk AND SUBSIDIARIES
NOTES TO THE CONSOLIDATED FINANCIAL STATEMENTS
As of December 31, 2015 and 2016 and for the
Years Ended December 31, 2014, 2015 and 2016
(Figures in tables are expressedin billions ofRupiah, unless otherwise stated)
Table of Content
2. SUMMARY OF SIGNIFICANT ACCOUNTING POLICIES
The consolidated financial statements of the Company and subsidiaries (collectively referred to as “the Groupâ€) have been prepared in accordance withInternational Financial Reporting Standards (“IFRSâ€) as issued by theInternational Accounting Standards Board (“IASBâ€).
a. Basis of preparation of the financial statements
The consolidated financial statements, except for the consolidated statements of cash flows, are prepared on the accrual basis. The measurement basis used is historical cost, except for certain accounts which are measured using the basis mentioned in the relevant notes herein.
The consolidated statements of cash flows are prepared using the direct method and present the changes in cash and cash equivalentsfrom operating, investing and financing activities.
b. Principles of consolidation
The consolidated financial statements consist of the financial statements of the Company and the subsidiaries over which it has control. Control is achieved when the Group is exposed, or has rights, to variable returns from its involvement with the investee and has the ability to affect those returns through its power over the investee. Specifically, the Group controls an investee if and only if the Group has the power over the investee, exposure or rights, to variable returns from its involvement with the investee, and the ability to use its power over the investee to affect its returns.
The Group re-assesses whether it controls an investee if facts and circumstances indicate that there are changes to one or more of the three elements of control. Consolidation of a subsidiary begins when the Group obtains control over the subsidiary and ceases when the Group loses control over the subsidiary. Assets, liabilities, income and expenses, of a subsidiary acquired or disposed of during the year are included in the consolidatedstatements of profit or loss and other comprehensive income from the date the Group gains financial control until the date the Group ceases to control the subsidiary.
Profit or loss and each component of other comprehensive income (“OCIâ€) are attributed to the equity holders of the Company and to the non-controlling interests, even if this results in the non-controlling interests having a deficit balance.
Intercompany balances and transactions have been eliminated in the consolidated financial statements.
In case of loss of control over a subsidiary, the Group:
·derecognizes the assets (including goodwill) and liabilities of the subsidiary at the carrying amounts on the date when it loses control;
·derecognizes the carrying amounts of any non-controlling interests of its former subsidiary on the date when it loses control;
·recognizes the fair value of the consideration received (if any) from the transaction, events, or condition that caused the loss of control;
·recognizes the fair value of any investment retained in the subsidiary at fair value on the date of loss of control;
·recognizes any surplus or deficit in profit or loss that is attributable to the Group.
F-16
PERUSAHAAN PERSEROAN (PERSERO)
PT TELEKOMUNIKASI INDONESIA Tbk AND SUBSIDIARIES
NOTES TO THE CONSOLIDATED FINANCIAL STATEMENTS
As of December 31, 2015 and 2016 and for the
Years Ended December 31, 2014, 2015 and 2016
(Figures in tables are expressedin billions ofRupiah, unless otherwise stated)
Table of Content
2.SUMMARY OF SIGNIFICANT ACCOUNTING POLICIES (continued)
c. Transactions with related parties
The Group has transactions with related parties. The definition of related parties used is in accordance with International Accounting Standards (IAS) 24, Related Party Disclosures. The party which is considered a related party is a person or entity that is related to the entity that is preparing its financial statements.
Key management personnel are identified as the persons having authority and responsibility for planning, directing and controlling the activities of the entity, directly or indirectly, including any director (whether executive or otherwise) of the Group. The related party status extends to the key management of the subsidiaries to the extent they direct the operations of subsidiaries with minimal involvement from the Company’s management.
d. Business combinations
Business combination is accounted for using the acquisition method. The consideration transferred is measured at fair value, which is the aggregate of the fair value of the assets transferred, liabilities incurred or assumed and the equity instruments issued in exchange for control of the acquiree. For each business combination, non-controlling interest is measured at fair value or at the proportionate share of the acquiree’s identifiable net assets. The choice of measurement basis is made on a transaction-by-transaction basis. Acquisition-related costs are expensed as incurred. The acquiree’s identifiable assets and liabilities are recognized at their fair values at the acquisition date.
Goodwill is initially measured at cost, being the excess of the aggregate of the consideration transferred and the amount recognized for non-controlling interests, and any previous interest held, over the net identifiable assets acquired and liabilities assumed. If the fair value of the net assets acquired is in excess of the aggregate consideration transferred, the Group re-assesses whether it has correctly identified all of the assets acquired and all of the liabilities assumed, and reviews the procedures used to measure the amounts to be recognized at the acquisition date. If the re-assessment still results in an excess of the fair value of net assets acquired over the aggregate consideration transferred, then the gain is recognized in profit or loss.
When the determination of consideration from a business combination includes contingent consideration, it is measured at its fair value on acquisition date. Contingent consideration is classified either as equity or a financial liability. Amounts classified as a financial liability are subsequently remeasured to fair value with changes in fair value recognized in profit or loss when adjustments are recorded outside the measurement period. Changes in the fair value of the contingent consideration that qualify as measurement-period adjustments are adjusted retrospectively, with corresponding adjustments made against goodwill. Measurement-period adjustments are adjustments that arise from additional information obtained during the measurement period, which cannot exceed one year from the acquisition date, about facts and circumstances that existed at the acquisition date.
In a business combination achieved in stages, the acquirer remeasures its previously held equity interest in the acquiree at its acquisition-date fair value and recognizes the resulting gain or loss, if any, in profit or loss.
F-17
PERUSAHAAN PERSEROAN (PERSERO)
PT TELEKOMUNIKASI INDONESIA Tbk AND SUBSIDIARIES
NOTES TO THE CONSOLIDATED FINANCIAL STATEMENTS
As of December 31, 2015 and 2016 and for the
Years Ended December 31, 2014, 2015 and 2016
(Figures in tables are expressedin billions ofRupiah, unless otherwise stated)
Table of Content
2. SUMMARY OF SIGNIFICANT ACCOUNTING POLICIES (continued)
e. Cash and cash equivalents
Cash and cash equivalents comprises cash on hand and in banks and all unrestricted time deposits with original maturities of three months or less at the time of placement.
Time deposits with maturities of more than three months but not more than one year are presented as part of “Other Current Financial Assets†in the consolidated statements of financial position.
f. Investments in associated companies
An associate is an entity over which the Group (as investor) has significant influence. Significant influence is the power to participate in the financial and operating policy decisions of the investee, but does not include control or joint control over those operating policies. The considerations made in determining significant influence are similar to those necessary to determine control over subsidiaries.
The Group’s investments in its associates are accounted for using the equity method.
Under the equity method, the investment in an associate is initially recognized at cost. The carrying amount of the investment is adjusted to recognize changes in the investor’s share of the net assets of the associate since the acquisition date. On acquisition of the investment, any difference between the cost of the investment and the entity's share of the net fair value of the investee's identifiable assets and liabilities is accounted for as follows:
a.Goodwill relating to an associate or a joint venture is included in the carrying amount of the investment and is neither amortized nor individually tested for impairment.
b.Any excess of the entity's share of the net fair value of the investee's identifiable assets and liabilities over the cost of the investment is included as income in the determination of the entity's share of the associate or joint venture's profit or loss in the period in which the investment is acquired.
The consolidatedstatements of profit or loss and other comprehensive income reflect the Group’s share of the results of operations of the associate. Any change in the other comprehensive income of the associate is presented as part of other comprehensive income. In addition, when there has been a change recognized directly in the equity of the associate, the Group recognizes its share of the change in the consolidated statements of changes in equity. Unrealized gain and losses resulting from transactions between the Group and the associate are eliminated to the extent of the interest in the associate.
The Group determines at each reporting date whether there is any objective evidence that the investments in associated companies are impaired. If there is, the Group calculates and recognizes the amount of impairment as the difference between the recoverable amount of the investments in the associated companies and their carrying value.
These assets are included in “Long-term Investments†in the consolidated statements of financial position.
F-18
PERUSAHAAN PERSEROAN (PERSERO)
PT TELEKOMUNIKASI INDONESIA Tbk AND SUBSIDIARIES
NOTES TO THE CONSOLIDATED FINANCIAL STATEMENTS
As of December 31, 2015 and 2016 and for the
Years Ended December 31, 2014, 2015 and 2016
(Figures in tables are expressedin billions ofRupiah, unless otherwise stated)
Table of Content
2.SUMMARY OF SIGNIFICANT ACCOUNTING POLICIES(continued)
f. Investments in associated companies (continued)
The functional currency of PT Citra Sari Makmur (“CSMâ€) is the United States dollar (“U.S. dollarsâ€), and Telin Malaysia is the Malaysian ringgit (“MYRâ€). For the purpose of reporting these investments using the equity method, the assets and liabilities of these companies as of the statements of financial position date are translated into Indonesian rupiah using the rate of exchange prevailing at that date, while revenues and expenses are translated into Indonesian rupiah at the average rates of exchange for the year. The resulting translation adjustments are reported as part of “Other Reserves†in the equity section of the consolidated statements of financial position.
g. Trade and other receivables
Trade and other receivables are recognized initially at fair value and subsequently measured at amortized cost, less provision for impairment. This provision for impairment is made based on management’s evaluation of the collectibility of the outstanding amounts. Receivables are written off in the year they are determined to be uncollectible.
h. Inventories
Inventories consist of components, which are subsequently expensed upon use. Components represent telephone terminals, cables and other spare parts. Inventories also include Subscriber Identification Module (“SIMâ€) cards, handsets, set top boxes, wireless broadband modems and blank prepaid vouchers, which are expensed upon sale.
The costs of inventories consist of the purchase price, import duties, other taxes, transport, handling, and other costs directly attributable to their acquisition. Inventories are recognized at the lower of cost and net realizable value. Net realizable value is the estimate of selling price less the costs to sell.
Cost is determined using the weighted average method.
The amounts of any write-down of inventoriesbelow costto net realizable value and all losses of inventories are recognized as an expense in the period in which the write-down or loss occurs. The amount of any reversal of any write-down of inventories, arising from an increase in net realizable value, is recognized as a reduction in the amount of general and administrative expenses in the year in which the reversal occurs.
Provision for obsolescence is primarily based on the estimated forecast of future usage of these inventory items.
i. Prepaid expenses
Prepaid expenses are amortized over their future beneficial periods using the straight-line method.
j. Assets held for sale
Assets (or disposal groups) are classified as held for sale when their carrying amount is to be recovered principally through a sale transaction rather than through continuing use and a sale is considered highly probable. They are stated at the lower of carrying amount and fair value less costs to sell.
Assets that meet the criteria to be classified as held for sale are reclassified from property and equipment and depreciation on such assetsisceased.
F-19
PERUSAHAAN PERSEROAN (PERSERO)
PT TELEKOMUNIKASI INDONESIA Tbk AND SUBSIDIARIES
NOTES TO THE CONSOLIDATED FINANCIAL STATEMENTS
As of December 31, 2015 and 2016 and for the
Years Ended December 31, 2014, 2015 and 2016
(Figures in tables are expressedin billions ofRupiah, unless otherwise stated)
Table of Content
2.SUMMARY OF SIGNIFICANT ACCOUNTING POLICIES(continued)
k. Intangible assets
Intangible assetsmainlyconsist of software. Intangible assets are recognized if it is highly probable that the expected future economic benefits that are attributable to each asset will flow to the Group, and the cost of the asset can be reliably measured.
Intangible assets are stated at cost less accumulated amortization and impairment losses, if any. Intangible assets are amortized over their estimated useful lives. The Group estimates the recoverable value of its intangible assets. When the carrying amount of an intangible asset exceeds its estimated recoverable amount, the asset is written down to its estimated recoverable amount.
Intangible assets except goodwill are amortized using the straight-line method, based on the estimated useful lives of the intangible assets as follows:
| 2012
|
| 2013*
|
President Commissioner
| Jusman Syafii Djamal
| | Jusman Syafii Djamal
|
Commissioner
| Parikesit Suprapto
| | Parikesit Suprapto
|
Commissioner
| Hadiyanto
| | Hadiyanto
|
Commissioner
| -
| | Gatot Trihargo**
|
Independent Commissioner
| Virano Gazi Nasution
| | Virano Gazi Nasution
|
Independent Commissioner
| Johnny Swandi Sjam
| | Johnny Swandi Sjam
|
President Director
| Arief Yahya
| | Arief Yahya
|
Director of Finance
| Honesti Basyir
| | Honesti Basyir
|
Director of Innovation andStrategic Portfolio
| Indra Utoyo
| | Indra Utoyo
|
Director of Enterprise and Business Service
| Muhamad Awaluddin
| | Muhamad Awaluddin
|
Director of Wholesale and International Services
| Ririek Adriansyah
| | Ririek Adriansyah
|
Director of Human Capital Management
| Priyantono Rudito
| | Priyantono Rudito
|
Director of Network, Information Technologyand Solution
| Rizkan Chandra
| | Rizkan Chandra
|
Director of ConsumersServices
| Sukardi Silalahi
| | Sukardi Silalahi
|
*
| | The change in nomenclature of the Directors is based on Directors’ Regulation No.202.11/r.00/HK.200/COP-B0400000/2013 dated June 25, 2013 and Directors’ Decree No. SK.2287/PS320/HCC-10/2013 dated June 28, 2013.
|
**
| | Appointed in the General Meeting of Stockholders held on April 19, 2013.
|
2. Audit Committee and Corporate Secretary
The composition of the Company’s Audit Committee and the Corporate Secretary as of December 31, 2012 and 2013, were as follows:
| 2012
|
| 2013
|
Chair
| Johnny Swandi Sjam
| | Johnny Swandi Sjam
|
Secretary
| Salam
| | Agus Yulianto
|
Member
| Parikesit Suprapto
| | Parikesit Suprapto
|
Member
| Agus Yulianto
| | -
|
Member
| Sahat Pardede
| | Sahat Pardede
|
Member
| Virano Gazi Nasution
| | Virano Gazi Nasution
|
Corporate Secretary
| Agus Murdiyatno
| | Honesti Basyir
|
F-9
PERUSAHAAN PERSEROAN (PERSERO)
|
PT TELEKOMUNIKASI INDONESIA Tbk AND SUBSIDIARIES
|
NOTES TO THE CONSOLIDATED FINANCIAL STATEMENTS
|
As of January 1, 2012 (Restated), December 31, 2012 (Restated) and December 31, 2013
|
and for the years ended December 31, 2011 (Restated), 2012 (Restated) and 2013
|
(Figures in tables are presented in billions of rupiah, unless otherwise stated)
|
|
Tabel of Content
1. GENERAL (continued)
c. Public offering of securities of the Company
The Company’s shares prior to its Initial Public Offering (“IPO”) totalled 8,400,000,000, consisting of 8,399,999,999 Series B shares and 1 Series A Dwiwarna share, and were 100%-owned by the Government of the Republic of Indonesia (the “Government”). On November 14, 1995, 933,333,000 new Series B shares and 233,334,000 Series B shares owned by the Government were offered to the public through an IPO and listed on the Indonesia Stock Exchange (“IDX”) and 700,000,000 Series B shares owned by the Government were offered to the public and listed on the New York Stock Exchange (“NYSE”) and the London Stock Exchange (“LSE”), in the form of American Depositary Shares (“ADS”). There were 35,000,000 ADS and each ADS represented 20 Series B shares at that time.
In December 1996, the Government had a block sale of its 388,000,000 Series B shares, and in 1997, distributed 2,670,300 Series B shares as incentive to the Company’s stockholders who did not sell their shares within one year from the date of the IPO. In May 1999, the Government further sold 898,000,000 Series B shares.
To comply with Law No. 1/1995 on Limited Liability Companies, at the AGM of Stockholders of the Company on April 16, 1999, the Company’s stockholders resolved to increase the Company’s issued share capital by the distribution of 746,666,640 bonus shares through the capitalization of certain additional paid-in capital, which were made to the Company’s stockholders in August 1999. On August 16, 2007, Law No. 1/1995 on Limited Liability Companies was amended by the issuance of Law No. 40/2007 on Limited Liability Companies which became effective on the same date. Law No. 40/2007 has no effect on the public offering of shares of the Company. The Company has complied with Law No. 40/2007.
In December 2001, the Government had another block sale of 1,200,000,000 shares or 11.9% of the total outstanding Series B shares. In July 2002, the Government further sold a block of 312,000,000 shares or 3.1% of the total outstanding Series B shares.
At the AGM of Stockholders of the Company held on July 30, 2004, the minutes of which are covered by notarial deed No. 26 of A. Partomuan Pohan, S.H., LLM., the Company’s stockholders approved the Company’s 2-for-1 stock split for Series A Dwiwarna and Series B share. The Series A Dwiwarna share with par value of Rp500 per share was split into 1 Series A Dwiwarna share with par value of Rp250 per share and 1 Series B share with par value of Rp250 per share. The stock split resulted in an increase of the Company’s authorized capital stock from 1 Series A Dwiwarna share and 39,999,999,999 Series B shares to 1 Series A Dwiwarna share and 79,999,999,999 Series B shares, and the issued capital stock from 1 Series A Dwiwarna share and 10,079,999,639 Series B shares to 1 Series A Dwiwarna share and 20,159,999,279 Series B shares. After the stock split, each ADS represented 40 Series B shares.
During the Extraordinary General Meeting (“EGM”) held on December 21, 2005 and the AGMs held on June 29, 2007, June 20, 2008, and May 19, 2011, the Company’s stockholders approved phase I, II, III and IV plan, respectively, of the Company’s program to repurchase its issued Series B shares (Note 23).
F-10
PERUSAHAAN PERSEROAN (PERSERO)
|
PT TELEKOMUNIKASI INDONESIA Tbk AND SUBSIDIARIES
|
NOTES TO THE CONSOLIDATED FINANCIAL STATEMENTS
|
As of January 1, 2012 (Restated), December 31, 2012 (Restated) and December 31, 2013
|
and for the years ended December 31, 2011 (Restated), 2012 (Restated) and 2013
|
(Figures in tables are presented in billions of rupiah, unless otherwise stated)
|
|
Tabel of Content
1. GENERAL (continued)
c. Public offering of securities of the Company (continued)
At the AGM held on April 19, 2013 as covered by notarial deed No. 38 dated April 19, 2013 of Ashoya Ratam, S.H., MKn., the stockholders approved the changes to the Company’s plan on the treasury stock acquired under phase III.
At the AGM held on April 19, 2013, the minutes of which are covered by notarial deed No.38 dated April 19, 2013 of Ashoya Ratam, S.H., MKn., the stockholders approved the Company’s 5-for-1 stock split for Series A Dwiwarna and Series B shares. Series A Dwiwarna share with par value of Rp250 per share was split into 1 Series A Dwiwarna share with par value of Rp50 per share and 4 Series B shares with par value of Rp50 per share. The stock split resulted in an increase of the Company’s authorized capital stock from 1 Series A Dwiwarna and 79,999,999,999 Series B shares to 1 Series A Dwiwarna and 399,999,999,999 Series B shares, and the issued capital stock from 1 Series A Dwiwarna and 20,159,999,279 Series B shares to 1 Series A Dwiwarna and 100,799,996,399 Series B shares. After the stock split, each ADS represented 200 Series B shares (Notes 21 and 23).
As of December 31, 2013, all of the Company’s Series B shares are listed on the IDX and 50,155,649 ADS shares are listed on the NYSE and LSE (Note 21).
As of December 31, 2013, the Company’s outstanding rupiah bonds representing the second rupiah bonds issued on June 25, 2010 with a nominal amount of Rp1,005 billion for a five-year period and Rp1,995 billion for a ten-year period for Series A and Series B, respectively, are listed on the IDX (Note 19b).
d. Subsidiaries
As of December 31, 2012 and 2013, the Company has consolidated the following directly or indirectly owned subsidiaries:
(i)Direct subsidiaries:
| | | | Start of | | Percentage of ownership interest | | Total assets before elimination | |
Subsidiary/place of incorporation | | Nature of business | | commercial operations | | 2012 | | 2013 | | 2012 | | 2013 | |
PT Telekomunikasi Selular (“Telkomsel”),Jakarta, Indonesia | | Telecommunication – provides telecommunication facilities and mobile cellular services using Global System for Mobile Communication (“GSM”) technology | | 1995 | | 65 | | 65 | | 62,844 | | 73,245 | |
PT Dayamitra Telekomunikasi (“Dayamitra”), Jakarta, Indonesia | | Telecommunication | | 1995 | | 100 | | 100 | | 4,931 | | 7,363 | |
PT Multimedia Nusantara (“Metra”), Jakarta, Indonesia | | Multimedia and line telecommunication services | | 1998 | | 100 | | 100 | | 3,394 | | 5,283 | |
PT Telekomunikasi Indonesia International (“TII”), Jakarta, Indonesia | | Telecommunication | | 1995 | | 100 | | 100 | | 2,440 | | 3,804 | |
F-11
PERUSAHAAN PERSEROAN (PERSERO)
|
PT TELEKOMUNIKASI INDONESIA Tbk AND SUBSIDIARIES
|
NOTES TO THE CONSOLIDATED FINANCIAL STATEMENTS
|
As of January 1, 2012 (Restated), December 31, 2012 (Restated) and December 31, 2013
|
and for the years ended December 31, 2011 (Restated), 2012 (Restated) and 2013
|
(Figures in tables are presented in billions of rupiah, unless otherwise stated)
|
|
Tabel of Content
1. GENERAL (continued)
d. Subsidiaries (continued)
(i)Direct subsidiaries: (continued)
| | | | Start of | | Percentage of ownership interest | | Total assets before elimination | |
Subsidiary/place of incorporation | | Nature of business | | commercial operations | | 2012 | | 2013 | | 2012 | | 2013 | |
PT Pramindo Ikat Nusantara (“Pramindo”), Jakarta, Indonesia | | Telecommunication construction and services | | 1995 | | 100 | | 100 | | 1,202 | | 1,365 | |
PT Graha Sarana Duta (“GSD”), Jakarta, Indonesia | | Leasing of offices and providing building management maintenance services,and civil consultant and developer | | 1982 | | 99.99 | | 99.99 | | 622 | | 1,571 | |
PT Indonusa Telemedia (“Indonusa”), Jakarta, Indonesia* | | Pay television and content services | | 1997 | | 100(including 0.46% ownership through Metra) | | 20(including 0.46% ownership through Metra) | | 771 | | - | |
PT Telkom Akses (“Telkom Akses”), Jakarta, Indonesia | | Construction service and trade in the field of telecommunication | | 2013 | | 100 | | 100 | | - | | 946 | |
PT Patra Telekomunikasi Indonesia (“Patrakom”) Jakarta, Indonesia** | | Telecommunication provides fixed line communication system | | 1996 | | 40 | | 100 | | 218 | | 254 | |
PT Napsindo Primatel Internasional (“Napsindo”), Jakarta, Indonesia | | Telecommunication - provides Network Access Point (NAP), Voice Over Data (VOD) and other related services | | 1999; ceased operations on January 13, 2006 | | 60 | | 60 | | 5 | | 5 | |
*
| | On October 8, 2013, the Company disposed 80% of its interest in PT Indonusa (Notes 3 and 11).
|
**
| | On September 25 and November 29, 2013, the Company acquired additional interest of 40% and 20%, respectively, of Patrakom (Notes 3 and 11).
|
(ii)Indirect subsidiaries:
| | | | Start of | | Percentage of ownership interest | | Total assets before elimination | |
Subsidiary/place of incorporation | | Nature of business | | commercial operations | | 2012 | | 2013 | | 2012 | | 2013 | |
PT Sigma Cipta Caraka (“Sigma”),Tangerang, Indonesia | | Information technology service – system implementation and integration service, outsourcing and software license maintenance | | 1988 | | 100 | | 100 | | 1,012 | | 1,886 | |
F-12
PERUSAHAAN PERSEROAN (PERSERO)
|
PT TELEKOMUNIKASI INDONESIA Tbk AND SUBSIDIARIES
|
NOTES TO THE CONSOLIDATED FINANCIAL STATEMENTS
|
As of January 1, 2012 (Restated), December 31, 2012 (Restated) and December 31, 2013
|
and for the years ended December 31, 2011 (Restated), 2012 (Restated) and 2013
|
(Figures in tables are presented in billions of rupiah, unless otherwise stated)
|
|
Tabel of Content
1. GENERAL (continued)
d. Subsidiaries (continued)
(ii)Indirect subsidiaries:(continued)
| | | | | | Percentage of ownership interest | | Total assets before elimination | |
Subsidiary/place of incorporation | | Nature of business | | Start of commercial operations | | 2012 | | 2013 | | 2012 | | 2013 | |
PT Infomedia Nusantara (“Infomedia”),Jakarta, Indonesia | | Data and information service – provides telecommunication information services and other information services in the form of print and electronic media and call center services | | 1984 | | 100 | | 100 | | 982 | | 1,218 | |
Telekomunikasi Indonesia International (“TL”) S.A., Timor Leste | | Telecommunication | | 2012 | | 100 | | 100 | | 149 | | 803 | |
Telekomunikasi Indonesia International Pte. Ltd.,Singapore | | Telecommunication | | 2008 | | 100 | | 100 | | 522 | | 785 | |
PT Metra Digital Media (“MDM”), Jakarta, Indonesia | | Telecommunication information services | | 2013 | | - | | 99.99 | | - | | 692 | |
PT Telkom Landmark Tower (“TLT”),Jakarta, Indonesia | | Service for property development and management | | 2012 | | 55 | | 55 | | 150 | | 493 | |
PT Finnet Indonesia (“Finnet”),Jakarta,Indonesia | | Banking data and communication | | 2006 | | 60 | | 60 | | 113 | | 203 | |
Telekomunikasi Indonesia International Ltd.,Hong Kong | | Telecommunication | | 2010 | | 100 | | 100 | | 95 | | 90 | |
PT Administrasi Medika (“Ad Medika”), Jakarta, Indonesia | | Health insurance administration services | | 2010 | | 75 | | 75 | | 95 | | 127 | |
PT Metra Plasa (“Metra Plasa”),Jakarta, Indonesia | | Website services | | 2012 | | 60 | | 60 | | 95 | | 86 | |
PT Metra-Net (“Metra-Net”),Jakarta, Indonesia | | Multimedia portal service | | 2009 | | 100 | | 100 | | 33 | | 40 | |
PT Graha Yasa Selaras (“GYS”) Bandung, Indonesia | | Tourism service | | 2013 | | 51 | | 51 | | 7 | | 32 | |
PT Pojok Celebes Mandiri (“Pointer”)Jakarta, Indonesia | | Tour agent/bureau services | | 2008 | | - | | 51 | | - | | 14 | |
Telekomunikasi Indonesia International Pty Ltd.Australia | | Telecommunication and IT based services | | 2013 | | - | | 100 | | - | | 7 | |
PT Satelit Multimedia Indonesia (“SMI”)Jakarta, Indonesia | | Commerce and providing networkservices, Telecommunication satellite and multimedia services | | 2013 | | - | | 99.99 | | - | | 6 | |
F-13
PERUSAHAAN PERSEROAN (PERSERO)
|
PT TELEKOMUNIKASI INDONESIA Tbk AND SUBSIDIARIES
|
NOTES TO THE CONSOLIDATED FINANCIAL STATEMENTS
|
As of January 1, 2012 (Restated), December 31, 2012 (Restated) and December 31, 2013
|
and for the years ended December 31, 2011 (Restated), 2012 (Restated) and 2013
|
(Figures in tables are presented in billions of rupiah, unless otherwise stated)
|
|
Tabel of Content
1. GENERAL (continued)
d. Subsidiaries (continued)
(ii) Indirect subsidiaries:(continued)
| | | | Start of | | Percentage of ownership interest | | Total assets before elimination | |
Subsidiary/place of incorporation | | Nature of business | | commercial operations | | 2012 | | 2013 | | 2012 | | 2013 | |
PT Metra Media (“MM”) Jakarta, Indonesia | | Trade service, construction purveyor / supplier, advertising services | | 2013 | | - | | 99.83 | | - | | - | |
Telkomsel Finance B.V., (“TFBV”),Amsterdam, The Netherlands* | | Finance - established in 2005 for the purpose of borrowing, lending and raising funds including issuance of bonds, promissory notes or debts | | 2005 | | 65 | | - | | 8 | | - | |
Aria West International Finance B.V. (“AWI BV”), The Netherlands** | | Established to engage in rendering services in the field of trade and finance services | | 1996; ceased operations on July 31, 2003 | | 100 | | - | | - | | - | |
Telekomunikasi Selular Finance Limited (“TSFL”), Mauritius*** | | Finance - established to raise funds for the development of Telkomsel’s business through the issuance of debenture stock, bonds, mortgages or any other securities | | 2002 | | 65 | | 65 | | 0 | | - | |
PT Metra TV(“Metra TV”) Jakarta, Indonesia | | Pay TVservices | | 2013 | | - | | 99.83 | | - | | - | |
Telekomunikasi Indonesia International (USA) Inc. USA | | Telecommunication | | - | | - | | 100 | | - | | - | |
*
| Based on Decision Letter No. 959/2013 dated November 1, 2013 off the Amsterdam Court, TFBV was liquidated effective from August 22, 2013.
|
**
| On December 2, 2013, AWI BV was liquidated.
|
***
| As of December 31,2013, TSFL was under liquidation process.
|
(a) Metra
On April 2, 2012, based on notarial deed No. 03 dated April 2, 2012 of Utiek R. Abdurachman, S.H., MLI., MKn., Metra established PT Metra Plasa with authorized capital of Rp50 million and issued and fully paid capital of Rp12.5 million.
On July 20, 2012, based on the Circular Resolution of Stockholders of Metra Plasa, as covered by notarial deed No. 1 dated October 1, 2012 of Utiek R. Abdurachman, S.H., MLI., MKn. Metra Plasa’s stockholders agreed on the following:
i.to increase Metra Plasa’s authorized capital from Rp50 million to Rp60 billion consisting of 6,000,000 shares with nominal value of Rp10,000 (full amount) per share;
ii.to increase its issued and fully paid capital from Rp12.5 million owned 100% by Metra to Rp15.25 billion by issuing 1,523,750 additional shares with nominal value of Rp10,000 (full amount) per share;
F-14
PERUSAHAAN PERSEROAN (PERSERO)
|
PT TELEKOMUNIKASI INDONESIA Tbk AND SUBSIDIARIES
|
NOTES TO THE CONSOLIDATED FINANCIAL STATEMENTS
|
As of January 1, 2012 (Restated), December 31, 2012 (Restated) and December 31, 2013
|
and for the years ended December 31, 2011 (Restated), 2012 (Restated) and 2013
|
(Figures in tables are presented in billions of rupiah, unless otherwise stated)
|
|
Tabel of Content
1. GENERAL (continued)
d. Subsidiaries (continued)
(a)Metra (continued)
iii.from the issued new shares, 913,750 shares with total nominal value of Rp9 billion were subscribed by Metra while 610,000 shares with total nominal value of Rp6 billion were subscribed by eBay International AG at a premium totaling Rp78 billion. Metra’s ownership was diluted to 60% with the remaining 40% owned by eBay International AG.
On September 21, 2012, based on notarial deed No. 11 dated September 21, 2012 of N.M. Dipo Nusantara Pua Upa, S.H., MKn., which was approved by the MoLHR in its Letter No. AHU-50211.AH.01.01/2012 dated September 26, 2012, Metra established a company with Pelindo II, a related party of the Company,under the name PT Integrasi Logistik Cipta Solusi (“ILCS”) with Metra obtaining 49% ownership. ILCS is engaged in providing E-trade logistic services and other related services.
On January 8, 2013, based on notarial deed No. 02 dated January 8, 2013 of Utiek R. Abdurachman, S.H., MLI.,MKn., which was approved by the MoLHR through its Letter No. AHU-03276.AH.01.01/2013 dated January 29, 2013, Metra established a subsidiary, PT Metra Media, and obtained 99.83% ownership. MM is engaged in providing trade, construction, advertising and other services.
On January 8, 2013, based on notarial deed No. 03 dated January 8, 2013 of Utiek R. Abdurachman, SH., MLI., MKn., which was approved by the MoLHR through its Letter No. AHU-03261.AH.01.01/2013 dated January 29, 2013, Metra established a subsidiary, PT Metra TV, and obtained 99.83% ownership. Metra TV is engaged in providing subscription-broadcasting services.
On January 22, 2013, based on notarial deed No. 28 dated January 22, 2013 of N.M. Dipo Nusantara Pua Upa, S.H., MKn., which was approved by the MoLHR through its Letter No. AHU-03084.AH.01.01/2013 dated January 28, 2013, Metra established a subsidiary, PT Metra Digital Media, and obtained 99.99% ownership. MDM is engaged in providing telecommunication information and other services.
On March 25, 2013, based on notarial deed No. 38 dated March 25, 2013 of N.M. Dipo Nusantara Pua Upa, S.H., MKn., which was approved by the MoLHR in its Letter No.AHU-20566.AH.01.01/2013 dated April 17, 2013, Metra established PT Satelit Multimedia Indonesia and obtained 99.99% ownership. SMI is engaged in commerce and providing network services, telecommunication, satellite and multimedia devices.
On August 16, 2013, based on notarial deed No. 5 dated August 16, 2013 of N.M. Dipo Nusantara Pua Upa, S.H., MKn. which was approved by the MoLHR in its Letter No. AHU-0081886.AH.01.09/2013 dated August 30, 2013, Metra acquired the ownership of PT Pojok Celebes Mandiri after the signing of Sales and Purchase of Shares Agreement dated June 12, 2013 regarding the purchase of Pointer’s2,550 shares equivalent to Rp255 million or 51% ownership.
(b) TII
Based on the Circular Resolution of Stockholders of TII dated September 11, 2012, as covered by notarial deed No. 04 dated October 4, 2012 of Siti Safarijah, S.H., TII’s stockholders agreed to establish a subsidiary in Timor Leste under the name Telekomunikasi Indonesia International S.A. to engage in providing telecommunication services.
F-15
PERUSAHAAN PERSEROAN (PERSERO)
|
PT TELEKOMUNIKASI INDONESIA Tbk AND SUBSIDIARIES
|
NOTES TO THE CONSOLIDATED FINANCIAL STATEMENTS
|
As of January 1, 2012 (Restated), December 31, 2012(Restated) and December31, 2013
|
and for the years ended December 31, 2011 (Restated), 2012 (Restated) and2013
|
(Figures in tables are presented in billions of rupiah, unless otherwise stated)
|
|
Tabel of Content
1. GENERAL (continued)
d. Subsidiaries (continued)
(b) TII (continued)
On January 9, 2013, based on the Circular Resolution of the Stockholders of TII dated January 9, 2013, as covered by notarial deed No. 04 dated February 6, 2013 of Siti Safarijah, S.H., TII’s stockholders agreed to establish a subsidiary, Telekomunikasi Indonesia International Australia Pty Ltd. (“Telkom Australia”). Telkom Australia is engaged in providing telecommunication services and IT-based services.
On May 13, 2013, TII through Telekomunikasi Indonesia International (Hong Kong) Ltd. established a subsidiary in Macau under the name Telkom Macau, Ltd. (“Telkom Macau”). Telkom Macau is engaged in providing telecommunication services.
On June 3, 2013, TII through Telekomunikasi Indonesia International (Hong Kong) Ltd. established a subsidiary in Taiwan under the name Telkom Taiwan, Ltd. (“Telkom Taiwan”). Telkom Taiwan is engaged in providing telecommunication services.
OnDecember11, 2013, TII established a subsidiary in theUnited States of America,Telekomunikasi Indonesia International (USA), Inc.Ltd. (“TelkomUSA”). TelkomUSAwill be engaged in providing telecommunication services. For the year ended December 31, 2013, Telkom USA had no financial and operational activities yet.
(c) GSD
Based on notarial deed No. 71 dated December 27, 2011 of Kartono, S.H. which was approved by the MoLHR through its Decision Letter No. AHU-05281.AH.01.01/2012 dated February 1, 2012, GSD and Yayasan Kesehatan (“Yakes”), a related party of the Company, established a subsidiary under the name PT Telkom Landmark Tower, with GSD obtaining 55% ownership. TLT is engaged in property development and management.
Based on notarial deed No.48 dated February 7, 2012 of Sri Ahyani, S.H. which was approved by the MoLHR in its Letter No. AHU-22272.AH.01.01/2012 dated April 27, 2012, GSD and Yakes established a subsidiary under the name PT Graha Yasa Selaras, with GSD obtaining 51% ownership. GYS is engaged in the tourism business.
(d) Telkom Akses
On November 26, 2012, based on notarial deed No. 20 dated November 26, 2012 of Siti Safarijah, S.H. which was approved by the MoLHR in its Letter No.AHU-60691.AH.01.01/2012 dated November 28, 2012, the Company established a wholly owned subsidiary, PT Telkom Akses. Telkom Akses is engaged in providing construction service and trade in the field of telecommunication.
(e) Sigma
On June 29, 2012, based on notarial deed No.3 dated August13, 2012 ofUtiek R. Abdurachman, S.H., MLI., MKn., Sigma entered into a Sales Purchase Agreement to purchase 150,000 shares of PT Sigma Solusi Integrasi (“SSI”) or the equivalent of30% ofSSI’s total ownership, with a transaction value of Rp26 billion fromMarina Budiman, a non-controlling interest. On July 19, 2012,Sigma settled the transaction.The difference between the acquisition cost and the carrying amount of the interest acquired amounting to Rp22 billion is recorded as part of “Difference due to acquisition of non-controlling interests in subsidiaries” which is presented under the equity section of the consolidated statements of financial position.
F-16
PERUSAHAAN PERSEROAN (PERSERO)
|
PT TELEKOMUNIKASI INDONESIA TbkAND SUBSIDIARIES
|
NOTES TO THE CONSOLIDATED FINANCIAL STATEMENTS
|
As of January 1, 2012 (Restated), December 31, 2012(Restated) and December31, 2013
|
and for the years ended December 31, 2011 (Restated), 2012 (Restated) and2013
|
(Figures in tables are presented in billions of rupiah, unless otherwise stated)
|
|
Tabel of Content
1. GENERAL (continued)
d. Subsidiaries (continued)
(e) Sigma (continued)
On August 15, 2012, based on a notarial deed dated August 15, 2012 of Ny. Bomantari Julianto, S.H., Sigma entered into a Conditional Sales Purchase Agreement with PT Bina Data Mandiri (“BDM”) to purchase a Data Center Business, with a transaction value of Rp230 billion, from BDM. Based on the closing agreement dated November 30, 2012, the identifiable assets arising from the acquisition consisted of land, buildings, machine and equipment with total fair value amounting to Rp150 billion and intangible assets which included customer contracts and backlog with fair value amounting to Rp3 billion. The acquisition resulted in a goodwill amounting to Rp77 billion.
On September 17, 2012, based on notarial deed No. 10 dated September 17, 2012 of Utiek R. Abdurachman, SH., MLI.,MKn., Sigma’s stockholders agreed to liquidated its subsidiary, PT Sigma Karya Sempurna (“SKS”), effective from September 17, 2012. The liquidation constituted a process of internal restructuring of Sigma Group’s business. As of the issuance date of the consolidated financial statements, the liquidation process has been carried out to the extent of sales of assets and liabilities settlement.
(f) Infomedia
On October 24, 2012 based on notarial deed No. 15 dated October 24, 2012 of Zulkifli Harahap, S.H., which was approved by the MoLHR through its Decision Letter No. AHU-55715.AH.01.01/2012 dated October 30, 2012, Infomedia established a wholly owned subsidiary under the name PT Infomedia Solusi Humanika (“ISH”). ISH is engaged in the services for distribution and supply of labor.
On December 17, 2012, based on notarial deed No. 231 dated December 17, 2012 of M. Kholid Artha, SH., Infomedia purchased 1,778 and 1,777 shares of Balebat, a subsidiary of Infomedia, or the equivalent of 15.73% each of Balebat’s total ownership, with a transaction value of Rp4.4 billion each from Zikra Lukman and Siti Chadijah, respectively, who are the non-controlling interests. The difference amounting to Rp1 billion between the purchase price and the carrying amount of the interests acquired is recorded as part of “Difference due to acquisition of non-controlling interests in subsidiaries” which is presented under the equity section of the consolidated statements of financial position.
Based on notarial deed No.04 datedMarch 7, 2013 ofSjaaf De Carya Siregar, S.H.,Infomedia’s stockholders agreed to distribute dividend amounting to Rp44 billion which was returned as increment of issued and fully paid capital.
Based on notarial deed No. 18 dated July 24, 2013 of Zulkifli Harahap, S.H. Infomedia’s stockholders approved an increase in its paid-in capital by 88,529,790 shares, amounting to Rp44 billion.
On November 20, 2013, Infomedia signed an agreement transferring its Telephone Directory Management business to MDMedia.
F-17
PERUSAHAAN PERSEROAN (PERSERO)
|
PT TELEKOMUNIKASI INDONESIA TbkAND SUBSIDIARIES
|
NOTES TO THE CONSOLIDATED FINANCIAL STATEMENTS
|
As of January 1, 2012 (Restated), December 31, 2012(Restated) and December31, 2013
|
and for the years ended December 31, 2011 (Restated), 2012 (Restated) and2013
|
(Figures in tables are presented in billions of rupiah, unless otherwise stated)
|
|
Tabel of Content
1. GENERAL (continued)
d. Subsidiaries (continued)
(g) Dayamitra
On April 5, 2013, based on notarial deed No.002 dated April 5, 2013 of Andi Fatma Hasiah, S.H.,M.Kn., Dayamitra’s stockholders agreed to distribute dividend amounting to Rp31 billion which was returned as increment of issued and fully paid capital.
e. Authorization for the issuance of the consolidated financial statements
The consolidated financial statements wereprepared and approvedfor issuanceby the Board of Directors on March25, 2014.
2. SUMMARY OF SIGNIFICANT ACCOUNTING POLICIES
The consolidated financial statements of the Group have been prepared in accordance withInternational Financial Reporting Standards (“IFRS”) as issued by theInternational Accounting Standards Board (“IASB”).
a. Basis of preparation of the financial statements
The consolidated financial statements, except for the consolidated statements of cash flows, are prepared on the accrual basis. The measurement basis used is historical cost, except for certain accounts which are measured using the basis mentioned in the relevant notes herein.
The consolidated statements of cash flows are prepared using the direct method and present the changes in cash and cash equivalents from operating, investing and financing activities.
The consolidated financial statements provide comparative information in respect of the previous period. In addition, the Group presents an additional statement of financial position at the beginning of the earliest period presented when there is a retrospective application of an accounting policy, a retrospective restatement, or a reclassification of items in the financial statements. An additional statement of financial position as of January 1, 2012 is presented in these consolidated financial statements due to the retrospective application of IAS 19,Employee Benefits(Revised 2011) (Note 2aa).
b. Principles of consolidation
The consolidated financial statements consist of the financial statements of the Group. Control is achieved when the Group is exposed, or has rights, to variable returns from its involvement with the investee and has the ability to affect those returns through its power over the investee. Specifically, the Group controls an investee if and only if the Group has the power over the investee, exposure, or rights, to variable returns from its involvement with the investee, and the ability to use its power over the investee to affect its returns.
F-18
PERUSAHAAN PERSEROAN (PERSERO)
|
PT TELEKOMUNIKASI INDONESIA TbkAND SUBSIDIARIES
|
NOTES TO THE CONSOLIDATED FINANCIAL STATEMENTS
|
As of January 1, 2012 (Restated), December 31, 2012(Restated) and December31, 2013
|
and for the years ended December 31, 2011 (Restated), 2012 (Restated) and2013
|
(Figures in tables are presented in billions of rupiah, unless otherwise stated)
|
|
Tabel of Content
2. SUMMARY OF SIGNIFICANT ACCOUNTING POLICIES (continued)
b. Principles of consolidation (continued)
The Group re-assesses whether or not it controls an investee if facts and circumstances indicate that there are changes to one or more of the three elements of control. Consolidation of a subsidiary begins when the Group obtains control over the subsidiary and ceases when the Group loses control of the subsidiary. Assets, liabilities, income and expenses of a subsidiary acquired or disposed of during the year are included in the consolidated statements of comprehensive income from the date the Group gains control until the date the Group ceases to control the subsidiary.
Profit or loss and each component of other comprehensive income (OCI) are attributed to the equity holders of the Company and to the non-controlling interests, even if this results in the non-controlling interests having a deficit balance.
Intercompany balances and transactions have been eliminated in the consolidated financial statements.
In case of loss of control over a subsidiary, the Group:
·derecognizes the assets (including goodwill) and liabilities of the subsidiary at the carrying amounts on the date when it loses control;
·derecognizes the carrying amounts of any non-controling interests of its former subsidiary on the date when it loses control;
·recognizes the fair value of the consideration received (if any) from the transaction, events, or condition that caused the loss of control;
·recognizes the fair value of any investment retained in the subsidiary at fair value on the date of loss of control;
·recognizes any surplus or deficit in profit or loss that is attributable to the Group.
c. Transactions with related parties
The Group has transactions with related parties. The definition of related parties used is in accordance with IAS 24,Related Party Disclosures. The party which is considered a related party is a person or entity that is related to the entity that is preparing its financial statements.
Key management personnel are identified as the persons having authority and responsibility for planning, directing and controlling the activities of the entity, directly or indirectly, including any director (whether executive or otherwise) of the Group. The related party status extends to the key management of the subsidiaries to the extent they direct the operations of subsidiaries with minimal involvement from the Company’s management.
d. Business combinations
Business combination is accounted for using the acquisition method. The consideration transferred is measured at fair value, which is the aggregate of the fair value of the assets transferred, liabilities incurred or assumed and the equity instruments issued in exchange for control of the acquiree. For each business combination, non-controlling interest is measured at fair value or at the proportionate share of the acquiree’s identifiable net assets. The choice of measurement basis is made on a transaction-by-transaction basis. Acquisition-related costs are expensed as incurred. The acquiree’s identifiable assets and liabilities are recognized at their fair values at the acquisition date.
F-19
PERUSAHAAN PERSEROAN (PERSERO)
|
PT TELEKOMUNIKASI INDONESIA TbkAND SUBSIDIARIES
|
NOTES TO THE CONSOLIDATED FINANCIAL STATEMENTS
|
As of January 1, 2012 (Restated), December 31, 2012(Restated) and December31, 2013
|
and for the years ended December 31, 2011 (Restated), 2012 (Restated) and2013
|
(Figures in tables are presented in billions of rupiah, unless otherwise stated)
|
|
Tabel of Content
2. SUMMARY OF SIGNIFICANT ACCOUNTING POLICIES (continued)
d. Business combinations (continued)
Goodwill is initially measured at cost, being the excess of the aggregate of the consideration transferred and the amount recognized for non-controlling interests, and any previous interest held, over the net identifiable assets acquired and liabilities assumed. If the fair value of the net assets acquired is in excess of the aggregate consideration transferred, the Group re-assesses whether it has correctly identified all of the assets acquired and all of the liabilities assumed and reviews the procedures used to measure the amounts to be recognized at the acquisition date. If the re-assessment still results in an excess of the fair value of net assets acquired over the aggregate consideration transferred, then the gain is recognized in profit or loss.
When the determination of consideration from a business combination includes contingent consideration, it is measured at its fair value on acquisition date. Contingent consideration is classified either as equity or a financial liability. Amounts classified as a financial liability are subsequently remeasured to fair value with changes in fair value recognized in profit or loss when adjustments are recorded outside the measurement period. Changes in the fair value of the contingent consideration that qualify as measurement-period adjustments are adjusted retrospectively, with corresponding adjustments made against goodwill. Measurement-period adjustments are adjustments that arise from additional information obtained during the measurement period, which cannot exceed one year from the acquisition date, about facts and circumstances that existed at the acquisition date.
In a business combination achieved in stages, any previously held equity interest is remeasured at its acquisition-date fair value and the resulting gain or loss, if any, is recognized in profit or loss.
e. Cash and cash equivalents
Cash and cash equivalents consist of cash on hand and in banks and all unrestricted time deposits with original maturities of three months or less at the time of placement.
Time deposits with maturities of more than three months but not more than one year are presented as other current financial assets in the consolidated statements of financial position.
f. Investments in associated companies
An associate is an entity over which the Group (as investor) has significant influence. Significant influence is the power to participate in the financial and operating policy decisions of the investee, but does not include control or joint control over those operating policies. The considerations made in determining significant influence are similar to those necessary to determine control over subsidiaries.
The Group’s investments in its associates are accounted for using the equity method.
F-20
PERUSAHAAN PERSEROAN (PERSERO)
|
PT TELEKOMUNIKASI INDONESIA TbkAND SUBSIDIARIES
|
NOTES TO THE CONSOLIDATED FINANCIAL STATEMENTS
|
As of January 1, 2012 (Restated), December 31, 2012(Restated) and December31, 2013
|
and for the years ended December 31, 2011 (Restated), 2012 (Restated) and2013
|
(Figures in tables are presented in billions of rupiah, unless otherwise stated)
|
|
Tabel of Content
2. SUMMARY OF SIGNIFICANT ACCOUNTING POLICIES (continued)
f. Investments in associated companies (continued)
Under the equity method, the investment in an associate is initially recognized at cost. The carrying amount of the investment is adjusted to recognize changes in the investor’s share of the net assets of the associate since the acquisition date. Goodwill relating to the associate is included in the carrying amount of the investment and is neither amortized nor individually tested for impairment.
The consolidated statements of comprehensive income reflect the Group’s share of the results of operations of the associate. Any change in the other comprehensive income of the associate is presented as part of other comprehensive income. In addition, when there has been a change recognized directly in the equity of the associate, the Group recognizes its share of the change in the consolidated statements of changes in equity. Unrealized gains and losses resulting from transactions between the Group and the associate are eliminated to the extent of the interest in the associate.
The Group determines at each reporting date whether there is any objective evidence that the investments in the associated companiesare impaired.If there is, theGroup calculates and recognizes the amount of impairment as the difference between the recoverable amount of the investments in the associated companiesandtheir carrying value.
These assets are included in long-term investments in the consolidated statements of financial position.
The functional currency of PT Pasifik Satelit Nusantara (“PSN”) and PT Citra Sari Makmur (“CSM”) is the United States dollar(“U.S. dollars”) and the functional currency of Scicom (MSC)Berhad (“Scicom”) and Telin Malaysia is the Malaysian ringgit (“MYR”). For the purpose of reporting these investments using the equity method, the assets and liabilities of these companies as of the statement of financial position date are translated into Indonesian rupiah using the rate of exchange prevailing at that date, while revenues and expenses are translated into Indonesian rupiah at the average rates of exchange for the year. The resulting translation adjustments are reported as part of other reserves in the equity section of the consolidated statements of financial position.
g. Trade and other receivables
Trade and other receivables are recognized initially at fair value and subsequently measured at amortized cost, less provision for impairment. This provision for impairment is made based on management’s evaluation of the collectibility of the outstanding amounts. Receivables are written off in the year they are determined to be uncollectible.
F-21
PERUSAHAAN PERSEROAN (PERSERO)
|
PT TELEKOMUNIKASI INDONESIA TbkAND SUBSIDIARIES
|
NOTES TO THE CONSOLIDATED FINANCIAL STATEMENTS
|
As of January 1, 2012 (Restated), December 31, 2012 (Restated) and December31, 2013
|
and for the years ended December 31, 2011 (Restated), 2012 (Restated) and 2013
|
(Figures in tables are presented in billions of rupiah, unless otherwise stated)
|
|
Tabel of Content
2. SUMMARY OF SIGNIFICANT ACCOUNTING POLICIES (continued)
h. Inventories
Inventories consist of components, which are subsequently expensed or transferred to property and equipment upon use. Components represent telephone terminals, cables and other spare parts. Inventories also include Subscriber Identification Module (“SIM”) cards, Removable User Identity Module (“RUIM”) cards, handsets, set top boxes, wireless broadband modems and blank prepaid vouchers, which are expensed upon sale. The costs of inventories consist of the purchase price, import duties, other taxes, transport, handling and other costs directly attributable to their acquisition. Inventories are recognized at the lower of cost and net realizable value. Net realizable value is the estimate of selling price less the costs to sell.
Cost is determined using the weighted average method.
The amount of any write-down of inventories to net realizable value below cost and all losses of inventories are recognized as an expense in the year in which the write-down or loss occurs.
Provision for obsolescence is primarily based on the estimated forecast of future usage of these items.
i. Prepaid expenses
Prepaid expenses are amortized over their future beneficial periods using the straight-line method.
j. Assets held for sale
Assets (or disposal groups) are classified as held for sale when their carrying amount is to be recovered principally through a sale transaction rather than through continuing use and a sale is considered highly probable. They are stated at the lower of carrying amount and fair value less costs to sell.
Assets that meet the criteria to be classified as held for sale are reclassified from property and equipment and depreciation on such assetsisceased.
k. Intangible assets
Intangible assets consist of goodwill arising from business acquisitions, software and license. Intangible assets are recognized if it is probable that the expected future economic benefits that are attributable to each asset will flow to the Group, and the cost of the asset can be reliably measured.
Intangible assets are stated at cost less accumulated amortization and impairment, if any. Intangible assets are amortized over their useful lives. The Group estimates the recoverable value of its intangible assets. When the carrying amount of an asset exceeds its estimated recoverable amount, the asset is written down to its estimated recoverable amount.
Intangible assets are amortized using the straight-line method, based on the estimated useful lives of the assets as follows:
| Years |
Software
| 3-6
|
License
| 3-20
|
Other intangible assets
| 1-30
|
F-22
PERUSAHAAN PERSEROAN (PERSERO)
|
PT TELEKOMUNIKASI INDONESIA Tbk AND SUBSIDIARIES
|
NOTES TO THE CONSOLIDATED FINANCIAL STATEMENTS
|
As of January 1, 2012 (Restated), December 31, 2012 (Restated) and December 31, 2013
|
and for the years ended December 31, 2011 (Restated), 2012 (Restated) and 2013
|
(Figures in tables are presented in billions of rupiah, unless otherwise stated)
|
|
Tabel of Content
2.SUMMARY OF SIGNIFICANT ACCOUNTING POLICIES (continued)
k. Intangible assets (continued)
Intangible assets are derecognized when no further economic benefits are expected, either from further use or from disposal. The difference between the carrying amount and the net proceeds received from disposal is recognized in the consolidated statements of comprehensive income.
l. Property and equipment
Property and equipment directly acquired are stated at cost less accumulated depreciation and impairment losses.
The cost of an item of property and equipment includes: (a) purchase price, (b) any costs directly attributable to bringing the asset to its location and condition, and (c) the initial estimate of the costs of dismantling and removing the item and restoring the site on which it is located. Each part of an item of property and equipment with a cost that is significant in relation to the total cost of the item is depreciated separately.
Property and equipment are depreciated and amortized using the straight-line method based on the estimated useful lives of the assets as follows:
| Years
|
Land rights
| 50
|
Buildings
| 15-40
|
Leasehold improvements
| 2-15
|
Switching equipment
| 3-15
|
Telegraph, telex and data communication equipment
| 5-15
|
Transmission installation and equipment
| 3-25
|
Satellite, earth station and equipment
| 3-20
|
Cable network
| 5-25
|
Power supply
| 3-20
|
Data processing equipment
| 3-20
|
Other telecommunications peripherals
| 5
|
Office equipment
| 2-5
|
Vehicles
| 4-8
|
Asset Customer Premise Equipment (“CPE”)
| 10
|
Other equipment
| 2-5
|
The depreciation method, useful life and residual value of an asset are reviewed at least at each financial year end and adjusted, if appropriate. The residual value of an asset is the estimated amount thatthe Group would currently obtain from disposal of the asset, after deducting the estimated costs of disposal, if the assetisalready of the age and in the condition expected at the end of its useful life.
The Group periodically evaluates its property and equipment for impairment, whenever events and circumstances indicate that the carrying amount of the assets may not be recoverable. When the carrying amount of an asset exceeds its estimated recoverable amount, the asset is written down to its estimated recoverable amount, which is determined based on the higher of its fair value less cost to sell or value in use.
Property and equipment acquired in exchange for a non-monetary asset or for a combination of monetary and non-monetary assets are measured at fair values unless (i) the exchange transaction lacks commercial substance; or (ii) the fair value of neither the assets received nor the asset given up is reliably measurable.
F-23
PERUSAHAAN PERSEROAN (PERSERO)
|
PT TELEKOMUNIKASI INDONESIA Tbk AND SUBSIDIARIES
|
NOTES TO THE CONSOLIDATED FINANCIAL STATEMENTS
|
As of January 1, 2012 (Restated), December 31, 2012 (Restated) and December 31, 2013
|
and for the years ended December 31, 2011 (Restated), 2012 (Restated) and 2013
|
(Figures in tables are presented in billions of rupiah, unless otherwise stated)
|
|
Tabel of Content
2. SUMMARY OF SIGNIFICANT ACCOUNTING POLICIES (continued)
l. Property and equipment(continued)
Major spare parts and standby equipment that are expected to be used for more than 12 months are recorded as part of property and equipment.
When assets are retired or otherwise disposed of, their cost and the related accumulated depreciation are derecognized from the consolidated statements of financial position, and the resulting gains or losses on the disposal or sale of the property and equipment are recognized in the consolidated statements of comprehensive income.
Certain computer hardware can not be used without the availability of certain computer software. In such circumstance, the computer software is recorded as part of the computer hardware. If the computer software is independent from its computer hardware, it is recorded as part of intangible assets.
The cost of maintenance and repairs is charged to the consolidatedstatements of comprehensive incomeas incurred. Significant renewals and betterments are capitalized.
Property under construction is stated at cost until the construction is completed, at which time it is reclassified to the specific property and equipment account to which it relates. During the construction period until the property is ready for its intended use or sale, borrowing costs, which include interest expense and foreign currency exchange differences incurred on loans obtained to finance the construction of the asset, as long as it meets the definition of a qualifying asset, are capitalized in proportion to the average amount of accumulated expenditures during the period. Capitalization of borrowing cost ceases when the construction is completed and the asset is ready for its intended use.
Equipment temporarily unused is reclassified to equipment not used in operations and depreciated over its estimated useful life using the straight-line method.
m. Leases
In determining whether an arrangement is, or contains a lease, the Group performs an evaluation over the substance of the arrangement. A lease is classified as a finance lease or operating lease based on the substance, not the form of the contract.Finance lease is recognized if the lease transfers substantially all the risks and rewards incidental to the ownership of the leased asset.
Assets and liabilities under a finance lease are recognized in the consolidated statements of financial position at amounts equal to the fair value of the leased assets or, if lower, the present value of the minimum lease payments. Any initial direct costs of the Group are added to the amount recognized as asset.
Minimum lease payments are apportioned between the finance charge and the reduction of the outstanding liability. The finance charge is allocated to each period during the lease term so as to produce a constant periodic rate of interest on the remaining balance of the liability. Contingent rents are charged as expenses in the year in which they are incurred.
Leased assets are depreciated using the same method and based on the useful lives as estimated for directly acquired property and equipment. However, if there is no reasonable certainty that the Group will obtain ownership by the end of the lease term, the leased assets are fully depreciated over the shorter of the lease terms and their economic useful lives.
Lease arrangements that do not meet the above criteria are accounted for as operating leases for which payments are charged as an expense on the straight-line basis over the lease period.
F-24
PERUSAHAAN PERSEROAN (PERSERO)
|
PT TELEKOMUNIKASI INDONESIA Tbk AND SUBSIDIARIES
|
NOTES TO THE CONSOLIDATED FINANCIAL STATEMENTS
|
As of January 1, 2012 (Restated), December 31, 2012 (Restated) and December 31, 2013
|
and for the years ended December 31, 2011 (Restated), 2012 (Restated) and2013
|
(Figures in tables are presented in billions of rupiah, unless otherwise stated)
|
|
Tabel of Content
2. SUMMARY OF SIGNIFICANT ACCOUNTING POLICIES (continued)
n. Trade payables
Trade payables are obligations to pay for goods or services that have been acquired in the ordinary course of business from suppliers. Trade payables are classified as current liabilities if payment is due within one year or less (or in the normal operating cycle of the business, if this period is longer). If not, they are presented as non-current liabilities.
Trade payables are recognized initially at fair value and subsequently measured at amortized cost using the effective interest rate method.
o. Borrowings
Borrowings are recognized initially at fair value, net of transaction costs incurred. Borrowings are subsequently carried at amortized cost; any difference between the proceeds (net of transaction costs) and the redemption value is recognized in the consolidated statements of comprehensive income over the period of the borrowings using the effective interest method.
Fees paid onobtaining loan facilities are recognized as transaction costs of the loan to the extent that it is probable that some or all of the facility will be drawn down. In this case, the fee is deferred until the drawdown occurs. To the extent there is no evidence that it is probable that some or all of the facility will be drawn down, the fee is capitalized as a pre-payment for liquidity services and amortized over the period of the facilities towhichit relates.
p. Foreign currency translations
The functional currency and the reporting currency of the Group are both the Indonesian rupiah, except for the functional currency of Telekomunikasi Indonesia International Pte. Ltd., Hong Kong and Telekomunikasi Indonesia International Pte. Ltd., Singapore and Telekomunikasi Indonesia International S.A., Timor Leste whose accounting records are maintained in U.S.dollars. Transactions in foreign currencies are translated into Indonesian rupiah at the rates of exchange prevailing at transaction date. At the consolidated statements of financial position date, monetary assets and liabilities denominated in foreign currencies are translated into Indonesian rupiah based on the buy and sell rates quoted by Reuters prevailing at the consolidated statements of financial position date, as follows:
| 2012 | | 2013 | |
| Buy | | Sell | | Buy | | Sell | |
United States dollar (“US$”) 1 | 9,630 | | 9,645 | | 12,160 | | 12,180 | |
Euro 1 | 12,721 | | 12,743 | | 16,744 | | 16,774 | |
Yen 1 | 111.65 | | 111.84 | | 115.67 | | 115.87 | |
The resulting foreign exchange gains or losses, realized and unrealized, are credited or charged to the consolidated statements of comprehensive income, except for foreign exchange differences incurred on borrowings during the construction of qualifying assets which are capitalized to the extent that the borrowings can be attributed to the construction of those qualifying assets (Note 2l).
F-25
PERUSAHAAN PERSEROAN (PERSERO)
|
PT TELEKOMUNIKASI INDONESIA Tbk AND SUBSIDIARIES
|
NOTES TO THE CONSOLIDATED FINANCIAL STATEMENTS
|
As of January 1, 2012 (Restated), December 31, 2012 (Restated) and December 31, 2013
|
and for the years ended December 31, 2011 (Restated), 2012 (Restated) and 2013
|
(Figures in tables are presented in billions of rupiah, unless otherwise stated)
|
|
Tabel of Content
2. SUMMARY OF SIGNIFICANT ACCOUNTING POLICIES (continued)
q. Revenue and expense recognition
i. Fixed line telephone revenues
Revenues from fixed line installations,including incremental costs, are deferred and recognized as revenue and costs over the expected term of the customer relationships. Based on reviews of historical information and customer trends, the Company determined the expected term of the customer relationships in 2012 and 2013 to be 10 years and 18 years, respectively. Revenues from usage charges are recognized as customers incur the charges. Monthly subscription charges are recognized as revenues when incurred by subscribers.
ii. Cellular and fixed wireless telephone revenues
Revenues from postpaid service, which consist of usage and monthly charges, are recognized as follows:
·Airtime and charges for value added services are recognized based on usage by subscribers.
·Monthly subscription charges are recognized as revenues when incurred by subscribers.
Revenues from prepaid card subscribers, which consist of the sale of starter packs (also known as SIM cards in the case of cellular and RUIM in the case of fixed wireless telephone and start-up load vouchers) and pulse reload vouchers (either bundled in starter packs or sold as separate items), are recognized initially as unearned income and recognized proportionately as usage revenue based on duration and total of successful calls made and the value added services used by the subscribers or the expiration of the unused stored value of the voucher.
iii. Interconnection revenues
The revenues from network interconnection with other domestic and international telecommunications carriers are recognized monthly on the basis of the actual recorded traffic for the month. Interconnection revenues consist of revenues derived from other operators’ subscriber calls to the Group’s subscribers (incoming) and calls between subscribers of other operators through the Group’s network (transit).
iv. Data, internet and information technology services revenues
Revenues from data communication and internet are recognized based onservice activity and performance whicharemeasured bytheduration of internet usage or based on the fixed amountofcharges depending on the arrangements with customers.
Revenues from sales, installation and implementation of computer software and hardware, computer data network installation service and installation are recognized when the goods are delivered to customers or the installation takes place.
Revenue from computer software development service is recognized using the percentage-of-completion method.
F-26
PERUSAHAAN PERSEROAN (PERSERO)
|
PT TELEKOMUNIKASI INDONESIA Tbk AND SUBSIDIARIES
|
NOTES TO THE CONSOLIDATED FINANCIAL STATEMENTS
|
As of January 1, 2012 (Restated), December 31, 2012 (Restated) and December 31, 2013
|
and for the years ended December 31, 2011 (Restated), 2012 (Restated) and 2013
|
(Figures in tables are presented in billions of rupiah, unless otherwise stated)
|
|
Tabel of Content
2. SUMMARY OF SIGNIFICANT ACCOUNTING POLICIES (continued)
q. Revenue and expense recognition(continued)
v. Revenues from network
Revenues from network consist of revenues from leased lines and satellite transponder leases which are recognized over the period in which the services are rendered.
vi. Other telecommunications service revenues
Revenues from other telecommunications services consist ofRevenue-Sharing Arrangements (“RSA”)and sales of other telecommunication services or goods.
The RSA are recorded in a manner similar to capital leases where the property and equipment and obligation under RSA are reflected in the consolidatedstatements of financial position. All revenues generated from the RSA are recorded as a component of revenues, while a portion of the investors’ share of the revenues from the RSA is recorded as finance costs, with the balance treated as a reduction of the obligation under RSA.
Universal Service Obligation (“USO”) compensation from construction activities is recognized on a stage-of-completion basis. Revenues from operating and maintenance activities in respect of assets under the concession are recognized when the services are rendered.
In concession contracts under USO, the Group recognizes a financial asset to the extent that it has a contractual right to receive cash or other financial assets from the Government for the construction services, where the Government has little, if any, discretion to avoid payment. The Group recognizes an intangible asset to the extent that it receives a license to charge users of the public service.
Revenues from sales of other telecommunication services or goods are recognized upon completion of services and or delivery of goods to customers.
vii. Multiple-element arrangements
Where two or more revenue-generating activities or deliverables are sold under a single arrangement, each deliverable that is considered to be a separate unit of accounting is accounted for separately. The total revenue is allocated to each separately identifiable component based on the relative fair value of each component and the appropriate revenue recognition criteria are applied to each component as described above.
viii. Agency relationship
Revenues from an agency relationship are recorded based on the gross amount billed to the customers when the Group acts as principal in the sale of goods and services. Revenues are recorded based on the net amount retained (the amount paid by the customer less amount paid to the suppliers) when, in substance, the Group has acted as agent and earned commission from the suppliers of the goods and services sold.
ix. Expenses
Expenses are recognizedas they are incurred.
F-27
PERUSAHAAN PERSEROAN (PERSERO)
|
PT TELEKOMUNIKASI INDONESIA Tbk AND SUBSIDIARIES
|
NOTES TO THE CONSOLIDATED FINANCIAL STATEMENTS
|
As of January 1, 2012 (Restated), December 31, 2012 (Restated) and December 31, 2013
|
and for the years ended December 31, 2011 (Restated), 2012 (Restated) and 2013
|
(Figures in tables are presented in billions of rupiah, unless otherwise stated)
|
|
Tabel of Content
2. SUMMARY OF SIGNIFICANT ACCOUNTING POLICIES (continued)
r. Employee benefits
i. Short-term employee benefits
All short-term employee benefits which consist of salaries and related benefits, vacation pay, incentives and other benefits are recognized as expense on undiscounted basis when employees have rendered service to the Group.
ii. Pension and post-retirement health care benefit plans
The Company provides a funded defined benefit pension plan for its employees with permanent status prior to July 1, 2002, which calculation is based on the participating employees’ latest basic salary at retirement and the number of years of their service. Defined contribution pension plan is provided for its employees with permanent status on or after July 1, 2002. The Company also provides a funded defined post-employment health care benefit plan for its employees hired before November 1, 1995. Defined contribution post-employement health care benefit plan is provided for its employees with permanent status on or after November 1, 1995.
Telkomsel provides a funded defined benefit pension plan to its employees, which benefit is calculated based on their latest basic salary or take-home pay and the number of years of their service.
Under Law No. 13 Year 2003, the Group is required to provide minimum pension benefits, if not covered yet by the sponsored pension plans, to its employees upon retirement age.
iii. Long Service Awards (“LSA”) and Long Service Leave (“LSL”)
Employees of Telkomsel are entitled to receive certain cash awardsor certain numbers of days leave benefits based on length of service requirements. LSA are either paid at the time the employees reach certain anniversary dates during employment, or at the time of termination.LSL is either a certain number of days leave benefit or cash, subject to approval by management, provided to employees who have met the requisite number of years of service andwitha certain minimum age.
The obligation with respect to LSA and LSL is calculated by an independent actuary using the projected unit credit method.
iv. Early retirement benefits
Early retirement benefits are accrued at the time the Company makes a commitment to provide early retirement benefits as a result of an offer made in order to encourage voluntary redundancy. A commitment to a termination arises when, and only when, a detailed formal plan for the early retirement cannot be withdrawn.
F-28
PERUSAHAAN PERSEROAN (PERSERO)
|
PT TELEKOMUNIKASI INDONESIA Tbk AND SUBSIDIARIES
|
NOTES TO THE CONSOLIDATED FINANCIAL STATEMENTS
|
As of January 1, 2012 (Restated), December 31, 2012 (Restated) and December 31, 2013
|
and for the years ended December 31, 2011 (Restated), 2012 (Restated) and 2013
|
(Figures in tables are presented in billions of rupiah, unless otherwise stated)
|
|
Tabel of Content
2. SUMMARY OF SIGNIFICANT ACCOUNTING POLICIES (continued)
r. Employee benefits (continued)
v. Pre-retirement benefits
Employees of the Company are entitled to a benefit during a pre-retirement period in which they are inactive for 6 months prior to their normal retirement age of 56 years. During the pre-retirement period, the employees still receive benefits provided to active employees, which include, but are not limited to, regular salary, health care, annual leave, bonus and other benefits. Benefits provided to employees who enter pre-retirement period are calculated by an independent actuary using the projected unit credit method.
vi. Other post-employment benefits
Employees are entitled to home leave passage benefits and final housing facility benefits to their retirement age of 56 years. Those benefits are calculated by an independent actuary using the projected unit credit method.
vii. Share-based payments
The Company operates an equity-settled, share-based compensation plan. The fair value of the employees’ services rendered which are compensated with the Company’s shares is recognized as an expense in the consolidated statements of comprehensive income and credited to additional paid-in capital at the grant date.
The net obligations in respect of the defined pension benefit and post-retirement health care benefit plans are calculated at the present value of estimated future benefits that the employees have earned in return for their service in the current and prior periods less the fair value of plan assets. The calculation is performed by an independent actuary using the projected unit credit method. The present value of the defined benefit obligation is determined by discounting the estimated future cash outflows using interest rates of Government bonds that are denominated in the currencies in which the benefits will be paid and that have terms to maturity approximating the terms of the related retirement benefit obligation. Government bonds are used as there are no deep markets for high quality corporate bonds.
Plan assets are assets that are held by the pension and post-retirement health care benefit plans. These assets are measured at fair value at the end of the reporting period.
Actuarial gains or losses arising from experience adjustments and changes in actuarial assumptionsare charged or credited toOCI. Such actuarial gains and losses are also immediately recognized in retained earnings and are not reclassified to profit or loss in subsequent periods.
Pastservice costs are recognized immediately in profit or loss on the earlier of:
·The date of plan amendment or curtailment; and
·The date that the Group recognized restructuring-related costs
Net interest is calculated by applying the discount rate to the net defined benefit liability or assets.
Gains or losses on curtailment are recognized when there is a commitment to make a material reduction in the number of employees covered by a plan or when there is an amendment of defined benefit plan terms such as that a material element of future services to be provided by current employees will no longer qualify for benefits, or will qualify only for reduced benefits.
F-29
PERUSAHAAN PERSEROAN (PERSERO)
|
PT TELEKOMUNIKASI INDONESIA Tbk AND SUBSIDIARIES
|
NOTES TO THE CONSOLIDATED FINANCIAL STATEMENTS
|
As of January 1, 2012 (Restated), December 31, 2012 (Restated) and December 31, 2013
|
and for the years ended December 31, 2011 (Restated), 2012 (Restated) and 2013
|
(Figures in tables are presented in billions of rupiah, unless otherwise stated)
|
|
Tabel of Content
2. SUMMARY OF SIGNIFICANT ACCOUNTING POLICIES (continued)
r. Employee benefits (continued)
Gains or losses on settlement are recognized when there is a transaction that eliminates all further legal or constructive obligation for part or all of the benefits provided under a defined benefit plan.
For defined contribution plans, the regular contributions constitute net periodic costs for the period in which they are due and, as such, are included in personnel expenses as they become payable.
s. Income tax
Current and deferred taxes arerecognized as income or an expense and included intheconsolidated statements of comprehensive income, except to the extent thatifthe tax arises from a transaction or event which is recognized directly in equity,in which case,the taxis recognized directlyin equity.
Current tax assets and liabilities are measured at the amount expected to be recovered or paid using the tax rates and tax laws that have been enacted at each reporting date. Management periodically evaluates positions taken in tax returns with respect to situations in which applicable tax regulation is subject to interpretation. Where appropriate, management establishes provisions based on the amounts expected to be paid to the tax authorities.
The Group recognizes deferred tax assets and liabilities for temporary differences between the financial and tax bases of assets and liabilities at each reporting date. The Group also recognizes deferred tax assets resulting from the recognition of future tax benefits, such as the benefit of tax losses carried forward to the extent their future realization is probable. Deferred tax assets and liabilities are measured using enacted or substantively enacted tax rates and tax laws at each reporting date which are expected to apply to taxable income in the years in which those temporary differences are expected to be recovered or settled, such as tax rates and tax laws which have been enacted or substantially enacted at each reporting date.
The carrying amount of deferred tax asset is reviewed at the end of each reporting period and reduced to the extent that it is no longer probable that sufficient taxable income will be available to allow the benefit of part or all of that deferred tax asset to be utilized.
Deferred tax assets and liabilities are offset in the consolidated statements of financial position, except if these are for different legal entities, in the same manner the current tax assets and liabilities are presented.
Amendment to taxation obligation is recorded when an assessment letter (“Surat Ketetapan Pajak” or “SKP”) is received or if appealed against, when the results of the appeal are determined. The additional taxes and penalty imposed through SKP are recognized in the current year profit or loss, unless objection/appeal is taken. The additional taxes and penalty imposed through SKP are deferred as long as they meet the asset recognition criteria.
t. Financial instruments
The Group classifies financial instruments into financial assets and financial liabilities.Financial assets and liabilities are recognized initially at fair value including transaction costs. These are subsequently measured either at fair value or amortized cost using the effective interest rate method in accordance with their classification.
F-30
PERUSAHAAN PERSEROAN (PERSERO)
|
PT TELEKOMUNIKASI INDONESIA Tbk AND SUBSIDIARIES
|
NOTES TO THE CONSOLIDATED FINANCIAL STATEMENTS
|
As of January 1, 2012 (Restated), December 31, 2012 (Restated) and December 31, 2013
|
and for the years ended December 31, 2011 (Restated), 2012 (Restated) and 2013
|
(Figures in tables are presented in billions of rupiah, unless otherwise stated)
|
|
Tabel of Content
2. SUMMARY OF SIGNIFICANT ACCOUNTING POLICIES (continued)
t. Financial instruments (continued)
i. Financial assets
The Group classifies its financial assets as (i) financial assets at fair value through profit or loss, (ii) loans and receivables, (iii) held-to-maturity financial assets or (iv) available-for-sale financial assets. The classification depends on the purpose for which the financial assets are acquired. Management determines the classification of financial assets at initial recognition.
Purchases or sales of financial assets that require delivery of assets within a time frame established by regulation or convention in the market place (regular way trades) are recognized on the trade date, i.e., the date that the Group commits to purchase or sell the assets.
TheGroup’s financial assets include cash and cash equivalents,other current financial assets,trade and other receivables, long-term investments, advances and other non-current assets.
a. Financial assets at fair value through profit or loss
Financial assets at fair value through profit or loss are financial assets classified as held for trading. A financial asset is classified as held for trading if it is acquired principally for the purpose of selling or repurchasing it in the near term and for which there is evidence of a recent actual pattern of short-term profit taking.Gains or losses arising from changes in fair value of the trading securities are presented as other (expenses)/ income in the consolidated statements of comprehensive income in the period in which they arise. Financial asset measured at fair value through profit or loss represents derivative asset - put option which is recognized as part of other current financial assets in the 2013 consolidated statement of financial position.
b.Loans and receivables
Loans and receivables are non-derivative financial assets with fixed or determinable payments that are not quoted in an active market. Loans and receivables consist of, among other assets,cash and cash equivalents, other current financial assets,trade and other receivables, advances and other non-current assets.
These are initially recognized at fair value including transaction costs and subsequently measured at amortized cost, using the effective interest method.
c. Held-to-maturity financial assets
Held-to-maturity investments are non-derivative financial assets with fixed or determinable payments and fixed maturities on which management has the positive intention and ability to hold to maturity, other than:
a)those that the Group, upon initial recognition, designates as at fair value through profit or loss;
b)those that the Group designates as available for sale; and
c)those that meet the definition of loans and receivables.
No financial assets were classified as held-to-maturity financial assets as of December 31, 2012 and 2013.
F-31
PERUSAHAAN PERSEROAN (PERSERO)
|
PT TELEKOMUNIKASI INDONESIA Tbk AND SUBSIDIARIES
|
NOTES TO THE CONSOLIDATED FINANCIAL STATEMENTS
|
As of January 1, 2012 (Restated), December 31, 2012 (Restated) and December 31, 2013
|
and for the years ended December 31, 2011 (Restated), 2012 (Restated) and 2013
|
(Figures in tables are presented in billions of rupiah, unless otherwise stated)
|
|
Tabel of Content
2. SUMMARY OF SIGNIFICANT ACCOUNTING POLICIES (continued)
t. Financial instruments (continued)
i. Financial assets (continued)
d. Available-for-sale financial assets
Available-for-sale investments are non-derivative financial assets that are intended to be held for indefinite periods of time, which may be sold in response to needs for liquidity or changes in interest rates, exchange rates or that are not classified as loans and receivables, held-to-maturity investments or financial assets at fair value through profit or loss.Available-for-sale financial assets consist ofbonds and mutual funds whichare recorded aspart of other current financial assets in the consolidated statements of financial position.
Available-for-sale securities are stated at fair value. Unrealized holding gains or losses on available-for-sale securities are excluded from income of the current period and are reported as a separate component in the equity section of the consolidated statements of financial position until realized. Realized gains or losses from the sale of available-for-sale securities are recognized in the consolidated statements of comprehensiveincome, and are determined on a specific identification basis. A decline in the fair value of any available-for-sale securities below cost that is deemed to be other than temporary is charged to the consolidated statements of comprehensive income.
ii. Financial liabilities
The Group classifies its financial liabilities as (i) financial liabilities at fair value through profit or loss or (ii) financial liabilities measured at amortized cost.
The Group’sfinancial liabilities include trade and other payables, accrued expenses, loans and other borrowings which consist of short-term bank loans, obligations under finance leases, two-step loans, bonds and notes, and long-term bank loans.
a.Financial liabilities at fair value through profit or loss
Financial liabilities at fair value through profit or loss are financial liabilities classified as held for trading. A financial liability is classified as held for trading if it is incurred principally for the purpose of selling or repurchasing it in the near term and for which there is evidence of a recent actual pattern of short-term profit taking.
No financial liabilities were categorized as held for trading as of December 31, 2012 and 2013.
b.Financial liabilities measured at amortized cost
Financial liabilities that are not classified as liabilities at fair value through profit or loss fall into this category and are measured at amortized cost. Financial liabilities measured at amortized cost aretrade and other payables, accrued expenses, loans and other borrowings which consist of short-term bank loans, obligations under finance leases, two-step loans, bonds and notes, and long-term bank loans.
F-32
PERUSAHAAN PERSEROAN (PERSERO)
|
PT TELEKOMUNIKASI INDONESIA Tbk AND SUBSIDIARIES
|
NOTES TO THE CONSOLIDATED FINANCIAL STATEMENTS
|
As of January 1, 2012 (Restated), December 31, 2012 (Restated) and December 31, 2013
|
and for the years ended December 31, 2011 (Restated), 2012 (Restated) and 2013
|
(Figures in tables are presented in billions of rupiah, unless otherwise stated)
|
|
Tabel of Content
2. SUMMARY OF SIGNIFICANT ACCOUNTING POLICIES (continued)
t. Financial instruments (continued)
iii. Offsetting financial instruments
Financial assets and liabilities are offset and the net amount is reported in the consolidated statements of financial position when there is a legally enforceable right to offset the recognized amounts and there is an intention to settle them on a net basis, or realize the assets and settle the liabilities simultaneously.
iv.Fair value of financial instruments
Fair value is the amount for which an asset could be exchanged, or liability settled, in an arm’s length transaction.
The fair value of financial instruments that are traded in active markets at each reporting date is determined by reference to quoted market prices, without any deduction for transaction costs.
For financial instruments not traded in an active market, the fair value is determined using appropriate valuation techniques. Such techniques may include using recent arm’s length market transactions, reference to the current fair value of another instrument that is substantially the same, a discounted cash flow analysis or other valuation models.
An analysis of fair values of financial instruments and further details as to how they are measured are provided in Note40.
v. Impairment of financial assets
The Group assesses the impairment of financial assets if there is objective evidence that a loss event has a negative impact on the estimated future cash flows of the financial assets. Impairment is recognized when the loss event can be reliably estimated. Losses expected as a result of future events, no matter how likely, are not recognized.
Impairment loss of financial assets carried at cost is measured as the difference between the assets’ carrying amount and the present value of estimated future cash flows discounted at the financial assets’ original effective interest rate. Cash flows relating to short-term receivables are not discounted if the effect of discounting is immaterial.
When a decline in the fair value of an available-for-sale financial asset has been recognized in other comprehensive income and there is objective evidence that the asset is impaired, the cumulative loss that had been recognized in other comprehensive income is recognized in profit or loss as an impairment loss. The amount of the cumulative loss is the difference between the acquisition cost (net of any principal repayment and amortization) and current fair value, less any impairment loss on that financial asset previously recognized.
vi.Derecognition of financial instrument
The Group derecognizes a financial asset when the contractual rights to the cash flows from the financial asset expire, or when the Group transfers substantially all the risks and rewards of ownership of the financial asset.
The Group derecognizes a financial liability when the obligation specified in the contract is discharged or cancelled or expired.
F-33
PERUSAHAAN PERSEROAN (PERSERO)
|
PT TELEKOMUNIKASI INDONESIA Tbk AND SUBSIDIARIES
|
NOTES TO THE CONSOLIDATED FINANCIAL STATEMENTS
|
As of January 1, 2012 (Restated), December 31, 2012 (Restated) and December 31, 2013
|
and for the years ended December 31, 2011 (Restated), 2012 (Restated) and 2013
|
(Figures in tables are presented in billions of rupiah, unless otherwise stated)
|
|
Tabel of Content
2. SUMMARY OF SIGNIFICANT ACCOUNTING POLICIES (continued)
u. Treasury stock
Reacquired Company shares of stock are accounted for at their reacquisition cost and classified as “Treasury Stock” and presented as a deduction to equity. The cost of treasury stock sold/ transferred is accounted for using the weighted average method. The portion of treasury stock transferred for employee stock ownership program is accounted for at its fair value at grant date. The difference between the cost and the proceeds from the sale/ transfer of treasury stock is credited to “Additional Paid-in Capital”.
v. Dividends
Dividend for distribution to the stockholders is recognized as a liability in the consolidated financial statements in the year in which the dividend is approved by the stockholders. The interim dividend is recognized as a liability based on the Board of Directors’ decision supported by the approval from the Board of Commissioners.
w. Basicand dilutedearnings per share and earnings per ADS
Basic earnings per share is computed by dividing profit for the year attributable to owners of the parent company by the weighted average number of shares outstanding during the year. Income per ADS is computed by multiplying the basic earnings per share by 200, the number of shares represented by each ADS.
The Company does not have potentially dilutive financialinstruments.
x. Segment information
The Group's segment information is presented based upon identified operating segments. An operating segment is a component of an entity: a)that engages in business activities from which it may earn revenues and incur expenses (including revenues and expenses relating to transactions with other components of the same entity); b) whose operating results are regularly reviewed by the Group’s chief operating decision maker i.e., the Directors, to make decisions about resources to be allocated to the segment and assess its performance; and c) for which discrete financial information is available.
y. Provisions
Provisions are recognized when the Group has present obligations (legal or constructive) as a result of past events, and it is probable that an outflow of resources embodying economic benefits will be required to settle the obligations and a reliable estimate can be made of the obligations.
z. Impairment of non-financial assets
The Group assesses, at the end of each reporting period, whether there is an indication that an asset may be impaired. If such indication exists, the recoverable amount is estimated for the individual asset. If it is not possible to estimate the recoverable amount of the individual asset, the Group determines the recoverable amount of the Cash-Generating Unit (“CGU”) to which the asset belongs (“the asset’s CGU”).
F-34
PERUSAHAAN PERSEROAN (PERSERO)
|
PT TELEKOMUNIKASI INDONESIA Tbk AND SUBSIDIARIES
|
NOTES TO THE CONSOLIDATED FINANCIAL STATEMENTS
|
As of January 1, 2012 (Restated), December 31, 2012 (Restated) and December 31, 2013
|
and for the years ended December 31, 2011 (Restated), 2012 (Restated) and 2013
|
(Figures in tables are presented in billions of rupiah, unless otherwise stated)
|
|
Tabel of Content
2. SUMMARY OF SIGNIFICANT ACCOUNTING POLICIES (continued)
z. Impairment of non-financial assets (continued)
The recoverable amount of an asset (either individual asset or CGU) is the higher of the asset’s fair value less costs to sell and its value in use. Where the carrying amount of the asset exceeds its recoverable amount, the asset is considered impaired and is written down to its recoverable amount. In assessing the value in use, the estimated net future cash flows are discounted to their present value using a pre-tax discount rate that reflects current market assessments of the time value of money and the risks specific to the asset.
In determining fair value less costs to sell, recent market transactions are taken into account, if available. If no such transactions can be identified, the Group uses an appropriate valuation model to determine the fair value of the asset. These calculations are corroborated by valuation multiples or other available fair value indicators.
Impairment losses of continuing operations are recognizedin profit or loss under “Depreciation and amortization” in the consolidated statements of comprehensive income.
An assessment is made at the end of each reporting period as to whether there is any indication that previously recognized impairment losses for an asset other than goodwill may no longer exist or may have decreased. If such indication exists, the recoverable amount is estimated. A previously recognized impairment loss for an asset other than goodwill is reversed only if there has been a change in the assumptions used to determine the asset’s recoverable amount since the last impairment loss was recognized. The reversal is limited such that the carrying amount of the asset does not exceed its recoverable amount, nor exceeds the carrying amount that would have been determined, net of depreciation, had no impairment been recognized for the asset in prior periods. Reversal of an impairment loss is recognized in profit or loss.
Goodwill is tested for impairment annually and when circumstances indicate that the carrying value may be impaired. Impairment is determined for goodwill by assessing the recoverable amount of each CGU (or group of CGUs) to which the goodwill relates. When the recoverable amount of the CGU is less than its carrying amount, an impairment loss is recognized. Impairment loss relating to goodwill cannot be reversed in future periods.
aa. Changes in accounting policies and disclosures
Implementation of IAS 19, Employee Benefits (Revised 2011)
The Group applied IAS 19,Employee Benefits(Revised 2011), retrospectively in the current period in accordance with the transitional provisions set out in the revised standard. The opening statement of financial position of the earliest comparative period presented (January 1, 2012) and the comparative figures have been accordingly restated.
IAS 19,Employee Benefits(Revised 2011), changes, among other things, the accounting for defined benefit plans. Some of the key changes that impacted the Group include the following:
·All past service costs are recognized at the earlier of when the amendment/ curtailment occurs or when the related restructuring or termination costs are recognized. As a result, unvested past service costs can no longer be deferred and recognized over the future vesting period.
·The interest cost and expected return on plan assets used in the previous version of IAS 19 are replaced with a net interest amount under IAS 19,Employee Benefits(Revised 2011), which is calculated by applying the discount rate to the net defined benefit liability or asset at the start of each annual reporting period.
F-35
PERUSAHAAN PERSEROAN (PERSERO)
|
PT TELEKOMUNIKASI INDONESIA Tbk AND SUBSIDIARIES
|
NOTES TO THE CONSOLIDATED FINANCIAL STATEMENTS
|
As of January 1, 2012 (Restated), December 31, 2012 (Restated) and December 31, 2013
|
and for the years ended December 31, 2011 (Restated), 2012 (Restated) and 2013
|
(Figures in tables are presented in billions of rupiah, unless otherwise stated)
|
|
Tabel of Content
2. SUMMARY OF SIGNIFICANT ACCOUNTING POLICIES (continued)
aa. Changes in accounting policies and disclosures (continued)
Implementation of IAS 19, Employee Benefits (Revised 2011) (continued)
As a result of the changes, the comparative figures in the consolidated financial statements have been restated as follows:
| Before restatement | | Restatement | | After restatement | |
Consolidated statement of financial position as of January 1, 2012 | | | | | | |
Prepaid pension benefit cost | 765 | | (356 | ) | 409 | |
Total non-current assets | 81,321 | | (356 | ) | 80,965 | |
Total assets | 102,722 | | (356 | ) | 102,366 | |
Deferred tax liabilities | 3,448 | | (289 | ) | 3,159 | |
Pension benefit and other post-employment benefit obligations | 4,572 | | 800 | | 5,372 | |
Total non-current liabilities | 21,507 | | 511 | | 22,018 | |
Total liabilities | 43,696 | | 511 | | 44,207 | |
Retained earnings | 45,865 | | (867 | ) | 44,998 | |
Net equity attributable toowners of the parentcompany | 45,711 | | (867 | ) | 44,844 | |
Total equity | 59,026 | | (867 | ) | 58,159 | |
Totalliabilities and equity | 102,722 | | (356 | ) | 102,366 | |
Consolidated statement of comprehensive income for the year ended December 31, 2011 | | | | | | |
Personnelexpenses | (8,671 | ) | 247 | | (8,424 | ) |
Operatingprofit | 21,787 | | 247 | | 22,034 | |
Profit before income tax | 20,735 | | 247 | | 20,982 | |
Incometaxbenefit - deferred | 288 | | (52 | ) | 236 | |
Netincometaxexpense | (5,385 | ) | (52 | ) | (5,437 | ) |
Profitfortheyear | 15,350 | | 195 | | 15,545 | |
Defined benefit plan actuarial losses, net of tax | (1,958 | ) | 19 | | (1,939 | ) |
Othercomprehensiveexpenses - net | (1,947 | ) | 19 | | (1,928 | ) |
Netcomprehensiveincomefortheyear | 13,403 | | 214 | | 13,617 | |
Profit for the year attributable to | | | | | | |
Owners of the parent company | 10,848 | | 195 | | 11,043 | |
Net comprehensive income for the year attributable to | | | | | | |
Owners of the parent company | 8,969 | | 214 | | 9,183 | |
Basicanddilutedearningspershare (in full amount) | | | | | | |
Netincome per share | 110.74 | | 1.99 | | 112.73 | |
Net income per ADS | 22,148.00 | | 398 | | 22,546.00 | |
F-36
PERUSAHAAN PERSEROAN (PERSERO)
|
PT TELEKOMUNIKASI INDONESIA Tbk AND SUBSIDIARIES
|
NOTES TO THE CONSOLIDATED FINANCIAL STATEMENTS
|
As of January 1, 2012 (Restated), December 31, 2012 (Restated) and December 31, 2013
|
and for the years ended December 31, 2011 (Restated), 2012 (Restated) and 2013
|
(Figures in tables are presented in billions of rupiah, unless otherwise stated)
|
|
Tabel of Content
2. SUMMARY OF SIGNIFICANT ACCOUNTING POLICIES (continued)
aa. Changes in accounting policies and disclosures (continued)
Implementation of IAS 19 Employee Benefits (Revised 2011) (continued)
| Before restatement | | Restatement | | After restatement | |
Consolidated statement of financial position as of December 31, 2012 | | | | | | |
Deferred tax liabilities | 2,485 | | (233 | ) | 2,252 | |
Pension benefit and other post-employment benefit obligations | 7,306 | | 878 | | 8,184 | |
Total non-current liabilities | 24,089 | | 645 | | 24,734 | |
Total liabilities | 48,197 | | 645 | | 48,842 | |
Retained earnings | 48,572 | | (645 | ) | 47,927 | |
Net equity attributable toowners of the parentcompany | 46,700 | | (645 | ) | 46,055 | |
Total equity | 62,014 | | (645 | ) | 61,369 | |
Consolidated statement of comprehensive income for the year ended December 31, 2012 | | | | | | |
Personnelexpenses | (9,695 | ) | (265 | ) | (9,960 | ) |
Operatingprofit | 25,762 | | (265 | ) | 25,497 | |
Profit before income tax | 24,292 | | (265 | ) | 24,027 | |
Incometaxbenefit - deferred | 720 | | 22 | | 742 | |
Netincometaxexpense | (5,908 | ) | 22 | | (5,886 | ) |
Profitfortheyear | 18,384 | | (243 | ) | 18,141 | |
Defined benefit plan actuarial losses, net of tax | (3,031 | ) | 465 | | (2,566 | ) |
Othercomprehensiveexpenses - net | (3,005 | ) | 465 | | (2,540 | ) |
Netcomprehensiveincomefortheyear | 15,379 | | 222 | | 15,601 | |
Profit for the year attributable to Owners of the parent company | 12,864 | | (243 | ) | 12,621 | |
Net comprehensive income for theyear attributable to Owners of the parent company | 9,834 | | 222 | | 10,056 | |
Basicanddilutedearningspershare (in full amount) | | | | | | |
Net income per share | 133.98 | | (2.53 | ) | 131.45 | |
Net income per ADS | 26,796.80 | | (506 | ) | 26,290.80 | |
IAS 19 (Revised 2011) also requires more extensive disclosures. These have been provided in Note 33.
The implementation of IAS 19,Employee Benefits(Revised 2011), did not have impact on the consolidated statements of cash flows.
Othernew and amended standards and interpretations
The Group has also applied, for the first time, certain other standards and amendments. The nature and the impact of each of the new standards and amendments are described below:
a)IAS 1, Presentation of Items of Other Comprehensive Income - Amendments to IAS 1
The amendments to IAS 1 introduce a grouping of items presented in OCI. Items that will be reclassified (‘recycled’) to profit or loss at a future point in time have to be presented separately from items that will not be reclassified. The amendments affect presentation only and have no impact on the Group’s financial position, performance or cashflows.
F-37
PERUSAHAAN PERSEROAN (PERSERO)
|
PT TELEKOMUNIKASI INDONESIA Tbk AND SUBSIDIARIES
|
NOTES TO THE CONSOLIDATED FINANCIAL STATEMENTS
|
As of January 1, 2012 (Restated), December 31, 2012 (Restated) and December 31, 2013
|
and for the years ended December 31, 2011 (Restated), 2012 (Restated) and 2013
|
(Figures in tables are presented in billions of rupiah, unless otherwise stated)
|
|
Tabel of Content
2. SUMMARY OF SIGNIFICANT ACCOUNTING POLICIES (continued)
aa. Changes in accounting policies and disclosures (continued)
b)IFRS 7, Disclosures - Offsetting Financial Assets and Financial Liabilities - Amendments to IFRS 7
These amendments require an entity to disclose information about rights to set off and related arrangements (e.g., collateral agreements). The disclosures would provide users with information that is useful in evaluating the effect of netting arrangements on an entity’s financial position. The new disclosures are required for all recognized financial instruments that are set off in accordance with IAS 32, Financial Instruments: Presentation. IFRS 7 disclosures are provided in Note 40.
c)IFRS 12, Disclosure of Interests in Other Entities
IFRS 12 sets out the requirements for disclosures relating to an entity’s interests in subsidiaries, joint arrangements, associates and structured entities. The requirements in IFRS 12 are more comprehensive than the previously existing disclosure requirements for subsidiaries. While the Company has a subsidiary with material non-controlling interest, there are no unconsolidated structured entities. IFRS 12 disclosures are provided in Note 20.
Several other amendments also applied for the first time in 2013. However, they do not impact the consolidated financial statements of the Group.
ab. Critical accounting estimates, judgments and assumptions
Estimates and judgments are continually evaluated and are based on historical experience and other factors, including expectations of future events that are believed to be reasonable under the circumstances.
The Group makes estimates and assumptions concerning the future. The resulting accounting estimates will, by definition, seldom equal the related actual results. The estimates and assumptions that have a significant risk of causing a material adjustment to the carrying amounts of assets and liabilities within the next financial year are addressed below.
i.Retirement benefits
The present value of the pension benefit obligations depends on a number of factors that are determined on an actuarial basis using a number of assumptions. The assumptions used in determining the net cost (income) for pensions include the discount rate. Any changes in the assumptions will impact the carrying amount of the retirement benefit obligations.
The Group determines the appropriate discount rate at the end of each reporting period. This is the interest rate that should be used to determine the present value of estimated future cash outflows expected to be required to settle the obligations. In determining the appropriate discount rate, the Group considers the interest rates of government bonds that are denominated in the currency in which the benefits will be paid and that have terms to maturity approximating the terms of the related retirement benefit obligations.
F-38
PERUSAHAAN PERSEROAN (PERSERO)
|
PT TELEKOMUNIKASI INDONESIA Tbk AND SUBSIDIARIES
|
NOTES TO THE CONSOLIDATED FINANCIAL STATEMENTS
|
As of January 1, 2012 (Restated), December 31, 2012 (Restated) and December 31, 2013
|
and for the years ended December 31, 2011 (Restated), 2012 (Restated) and 2013
|
(Figures in tables are presented in billions of rupiah, unless otherwise stated)
|
|
Tabel of Content
2. SUMMARY OF SIGNIFICANT ACCOUNTING POLICIES (continued)
ab. Critical accounting estimates, judgments and assumptions (continued)
i.Retirement benefits (continued)
If there is an improvement in the ratings of such government bonds or a decrease in interest rates as a result of improving economic conditions, there could be a material impact on the discount rate used in determining the post-employment benefits obligations.
Other key assumptions for pension benefit obligations are based in part on current market conditions. Additional information is disclosed in Notes 33 and 34.
ii. Estimating useful lives of property and equipment and intangible assets
The Group estimates the useful lives of its property and equipment and intangible assets based on expected asset utilization, considering strategic business plans, expected future technological developments and market behavior. The estimates of useful lives of property and equipment are based on the Group’s collective assessment of industry practice, internal technical evaluation and experience with similar assets.
The Group reviews estimates of useful lives at least each financial year end which are updated if expectations differ from previous estimates due to physical wear and tear, technical or commercial obsolescence and legal or other limitations on the use of the assets. The amounts and timing of recorded expenses for any year will be affected by changes in these factors and circumstances. A change in the estimated useful lives of the property and equipment is a change in accounting estimate and is applied prospectively in profit or loss in the period of the change and future periods.
Detail of nature and carrying amounts of property and equipment is disclosed in Note 12 and intangible assets in Note 14.
iii. Provision for impairment of receivables
The Group assesses whether there is objective evidence that trade and other receivables have been impaired at the end of each reporting period. Provision for impairment of receivables is calculated based on a review of the current status of existing receivables and historical collection experience. Such provisions are adjusted periodically to reflect the actual and anticipated experience. Details of the nature and carrying amount of provision for impairment of receivables are disclosed in Note 7.
iv. Income taxes
Significant judgment is required in determining the provision for income taxes. There are many transactions and calculations for which the ultimate tax determination is uncertain. The Group recognizes liabilities for anticipated tax audit issues based on estimates of whether additional taxes will be due. Where the final tax outcome of these matters is different from the amounts that were initially recorded, such differences will impact the current and deferred income tax assets and liabilities in the year in which such determination is made. Details of nature and carrying amounts of income tax are disclosed in Note 32.
v. Impairment of non-financial assets
The Group annually assesses whether goodwill is impaired. Other non-financial assets are reviewed for impairment whenever events or changes in circumstances indicate that the carrying amount of the asset exceeds its recoverable amount. The recoverable amount of an asset or a CGU is determined based on the higher of its fair value less costs to sell and its value in use, calculated on the basis of management’s assumptions and estimations.
F-39
PERUSAHAAN PERSEROAN (PERSERO)
|
PT TELEKOMUNIKASI INDONESIA Tbk AND SUBSIDIARIES
|
NOTES TO THE CONSOLIDATED FINANCIAL STATEMENTS
|
As of January 1, 2012 (Restated), December 31, 2012 (Restated) and December 31, 2013
|
and for the years ended December 31, 2011 (Restated), 2012 (Restated) and 2013
|
(Figures in tables are presented in billions of rupiah, unless otherwise stated)
|
|
Tabel of Content
2. SUMMARY OF SIGNIFICANT ACCOUNTING POLICIES (continued)
ab. Critical accounting estimates, judgments and assumptions (continued)
v. Impairment of non-financial assets (continued)
In determining valuein use, the Group applies management judgment in establishing forecasts of future operating performance, as well as the selection of growth rates and discount rates. These judgments are applied based on our understanding of historical information and expectations of future performance. Changing the key assumptions, including the discount rates or the growth rate assumptions in the cash flow projections, could materially affect the value in use calculations.
For the years ended December 31, 2011, 2012 and 2013, the Company recognized Rp563 billion, Rp247 billion and Rp596 billion, respectively, of impairment loss on property and equipment pertaining to the fixed wireless services. A 1% increase in the discount rate used would result in an increase in impairment loss to become approximately Rp907 billion, Rp458 billion and Rp703 billion in 2011, 2012 and 2013, respectively. However, the recoverable amount of the fixed wireless CGU is most sensitive to whether management will be able to implement its plans, including the cost efficiency plan, such that it generates positive cash flows and returns to profitability as projected. If the performance of the fixed wireless CGU continues to decline or if management’s initiatives are not performing as expected in the next financial year, analysis will be required to assess whether there will be further impairment in the future(Note 12b).
3. BUSINESS COMBINATIONS
a.Acquisitions
Acquisition of PT German Center Indonesia
On January 17, 2013, Sigma signeda sales and purchase of shares and transfer ofdebtagreementwith Landeskreditbank Baden-Wurttemberg-Forderbank (“L-Bank”) and Step Stuttgarter Engineering Park Gmbh (“STEP”) as shareholdersof PT German Centre Indonesia (“GCI”). Based on the agreement, on April 30, 2013 Sigma bought shares owned by L-Bank and STEP in GCI. Through the acquisition, Sigma enlarged itsdata center capacity that can be offered to its customers.
Acquisition of Patrakom
On September 25, 2013, based on notarial deed No. 22 of Ashoya Ratam, S.H.,M.Kn., the Companyenteredinto aSales Purchase Agreement (SPA) with PT Elnusa Tbk for the acquisition of the40% ownership in PTPatra Telekomunikasi IndonesiaforRp45.6 billion. This SPA resulted in the Company’s ownership in Patrakom to increase from 40%to 80% (Note 11).
Subsequently, on November 29, 2013, based on notarial deed No. 54dated November 29, 2013of Ashoya Ratam, S.H., M.Kn., the Companyhas signed an SPA with PT Tanjung Mustika Tbk for theacquisition of theremaining 20% ownership in Patrakom forRp24.8 billion.
Patrakom is a satellite-based closed fixed telecommunications network operator and a provider of communications solutions and network with a permitasOperator of Micro Earth Stations Communications Systems (“SKSBM”) in partnership with manufacturers of telecommunications equipment to serve various companies.Through the acquisitionof Patrakom,theGroup can integrate Patrakom’s business activities in accordance with the Group’s business development plan.
F-40
PERUSAHAAN PERSEROAN (PERSERO)
|
PT TELEKOMUNIKASI INDONESIA Tbk AND SUBSIDIARIES
|
NOTES TO THE CONSOLIDATED FINANCIAL STATEMENTS
|
As of January 1, 2012 (Restated), December 31, 2012 (Restated) and December 31, 2013
|
and for the years ended December 31, 2011 (Restated), 2012 (Restated) and 2013
|
(Figures in tables are presented in billions of rupiah, unless otherwise stated)
|
|
Tabel of Content
3. BUSINESS COMBINATIONS (continued)
a.Acquisitions (continued)
The fair values of the assets acquired and liabilities transferredatthe acquisitiondatesare as follows:
| GCI | | Patrakom | | Total | |
Cash and cash equivalents | 3 | | 39 | | 42 | |
Other current assets | 18 | | 122 | | 140 | |
Property andequipment (Note 12) | 225 | | 171 | | 396 | |
Current liabilities | (15 | ) | (171 | ) | (186 | ) |
Non-current liabilities | (16 | ) | (45 | ) | (61 | ) |
Fair value ofthe identifiablenet assets acquired | 215 | | 116 | | 331 | |
Bargain purchase | (42 | ) | - | | (42 | ) |
Fair value ofpreviously held equity interests | - | | (46 | ) | (46 | ) |
Fair value of theconsiderationtransferred | 173 | | 70 | | 243 | |
The excess amounting to Rp42 billion of fair value of the identifiable net asset acquired over the fair value of the consideration transferred, was recorded as other income in the consolidated statement of comprehensive income of the current year. Transaction costs of Rp4.3 billion were expensed in the current period.
Since the acquisition dates, GCI and Patrakom contributed Rp23 billion of operating revenues.
b.Disposal ofIndonusa
On October 8, 2013, the Company sold 80% of its ownership in Indonusa to PT Trans Corpora and PT Trans Media Corpora for Rp926 billion. Further, on the same date, the Company, Metra and PT Trans Corpora signed a Shareholders Agreement that establishes mutual relationship among the shareholders of Indonusa, including the grant of the right to the Company and Metra to sell their 20% remaining ownership in Indonusa to PT Trans Corpora at any time in 24 months after the second year of the closing transaction at a certain price (Put Option).
The Company had received the full payment for thesaletransaction.
The Company recognized gain onsale ofIndonusashares as part of other incomein the 2013 consolidated statement ofcomprehensive income,as follows:
| Amount
| |
Fair value ofconsiderationreceived:
|
|
|
Cash
| 926
| |
PutOption
| 289
| |
Fair value ofinterest retained in Indonusa (Note 11)
| 182
| |
Carrying amount of assets and liabilities of Indonusa
| (14
| )
|
Gainon sale of shares
| 1,383
| |
Software | | F-41
PERUSAHAAN PERSEROAN (PERSERO)3-6
| PT TELEKOMUNIKASI INDONESIA Tbk AND SUBSIDIARIES
| NOTES TO THE CONSOLIDATED FINANCIAL STATEMENTS
| As of January 1, 2012 (Restated), December 31, 2012 (Restated) and December 31, 2013
| and for the years ended December 31, 2011 (Restated), 2012 (Restated) and 2013
| (Figures in tables are presented in billions of rupiah, unless otherwise stated)
| |
License |
| 3-20 | | Other intangible assets | | 1-30 | |
Intangible assets are derecognizedon disposal, orwhen no further economic benefits are expected, either from further use or from disposal. The difference between the carrying amount and the net proceeds received from disposal is recognized in the consolidated statements ofprofit or loss and othercomprehensive income. l. Property and equipment Property and equipment are stated at cost less accumulated depreciation and impairment losses. The cost of an item of property and equipment includes: (a) purchase price, (b) any costs directly attributable to bringing the asset to its location and condition, and (c) the initial estimate of the costs of dismantling and removing the item and restoring the site on which it is located. Each part of an item of property and equipment with a cost that is significant in relation to the total cost of the item is depreciated separately. Property and equipment are depreciated or amortized using the straight-line method based on the estimated useful lives of the assets as follows:
|
| TabelYears
|
| Land rights | | 50 | | Buildings | | 15-40 | | Leasehold improvements | | 2-15 | | Switching equipment | | 3-15 | | Telegraph, telex and data communication equipment | | 5-15 | | Transmission installation and equipment | | 3-25 | | Satellite, earth station and equipment | | 3-20 | | Cable network | | 5-25 | | Power supply | | 3-20 | | Data processing equipment | | 3-20 | | Other telecommunications peripherals | | 5 | | Office equipment | | 2-5 | | Vehicles | | 4-8 | | Customer Premises Equipment (“CPEâ€) assets | | 4-5 | | Other equipment | | 2-5 | |
F-20
PERUSAHAAN PERSEROAN (PERSERO) PT TELEKOMUNIKASI INDONESIA Tbk AND SUBSIDIARIES NOTES TO THE CONSOLIDATED FINANCIAL STATEMENTS As of December 31, 2015 and 2016 and for the Years Ended December 31, 2014, 2015 and 2016 (Figures in tables are expressedin billions ofRupiah, unless otherwise stated)
Table of Content
2.SUMMARY OF SIGNIFICANT ACCOUNTING POLICIES(continued)
l. Property and equipment(continued) Significant expenditures related to leasehold improvements are capitalized anddepreciated over the lease term. The depreciation method, useful life and residual value of an asset are reviewed at least at each financial year-end and adjusted, if appropriate.The residual value of an asset is the estimated amount that the Group would currently obtain from disposal of the asset, after deducting the estimated costs of disposal, if the asset is already of the age and in the condition expected at the end of its useful life. Property and equipment acquired in exchange for a non-monetary asset or for a combination of monetary and non-monetary assets are measured at fair value unless, (i) the exchange transaction lacks commercial substance; or (ii) the fair value of neither the asset received nor the asset given up is reliably measurable. Major spare parts and standby equipment that are expected to be used for more than 12 months are recorded as part of property and equipment. When assets are retired or otherwise disposed of, their cost and the related accumulated depreciation are derecognized from the consolidated statements of financial position and the resulting gains or losses on the disposal or sale of the property and equipment are recognized in the consolidated statements ofprofit or loss and othercomprehensive income. Certain computer hardware can not be used without the availability of certain computer software.In such circumstance, the computer software is recorded as part of the computer hardware. If the computer software is independent from its computer hardware, it is recorded as part of intangible assets. The cost of maintenance and repairs is charged to the consolidatedstatements of profit or loss and othercomprehensive incomeas incurred. Significant renewals and betterments are capitalized. Property under construction is stated at cost until the construction is completed, at which time it is reclassified to the property and equipment account to which it relates. During the construction period until the property is ready for its intended use or sale, borrowing costs, which include interest expense and foreign currency exchange differences incurred on loans obtained to finance the construction of the asset, as long as it meets the definition of a qualifying asset are, capitalized in proportion to the average amount of accumulated expenditures during the period. Capitalization of borrowing cost ceases when the construction is completed and the asset is ready for its intended use. m. Leases
In determining whether an arrangement is, or contains a lease, the Group performs an evaluation over the substance of the arrangement. A lease is classified as a finance lease or operating lease based on the substance, not the form of the contract.Finance lease is recognized if the lease transfers substantially all the risks and rewards incidental to the ownership of the leased asset. F-21
PERUSAHAAN PERSEROAN (PERSERO) PT TELEKOMUNIKASI INDONESIA Tbk AND SUBSIDIARIES NOTES TO THE CONSOLIDATED FINANCIAL STATEMENTS As of December 31, 2015 and 2016 and for the Years Ended December 31, 2014, 2015 and 2016 (Figures in tables are expressedin billions ofRupiah, unless otherwise stated)
Table of Content
2.SUMMARY OF SIGNIFICANT ACCOUNTING POLICIES(continued) m. Leases(continued)
Assets and liabilities under a finance lease are recognized in the consolidated statements of financial position at amounts equal to the fair value of the leased assets or, if lower, the present value of the minimum lease payments. Any initial direct costs of the Group are added to the amount recognized as assets. Minimum lease payments are apportioned between the finance charge and the reduction of the outstanding liability. The finance charge is allocated to each period during the lease term so as to produce a constant periodic rate of interest on the remaining balance of the liability. Contingent rents are charged as expenses in the year in which they are incurred. Leased assets are depreciated using the same method and based on the useful lives as estimated for directly acquired property and equipment. However, if there is no reasonable certainty that the Group will obtain ownership by the end of the lease terms, the leased assets are fully depreciated over the shorter of the lease terms and their economic useful lives. Lease arrangements that do not meet the above criteria are accounted for as operating leases for which payments are charged as an expense on the straight-line basis over the lease period. n. Trade payables
Trade payables are obligations to pay for goods or services that have been acquired from suppliers in the ordinary course of business. Trade payables are classified as current liabilities if the payment is due within one year or less. If not, they are presented as non-current liabilities. Trade payables are recognized initially at fair value and subsequently measured at amortized cost using the effective interest method.
o. Borrowings
Borrowings are recognized initially at fair value, net of transaction costs incurred. Borrowings are subsequently carried at amortized cost; any difference between the proceeds (net of transaction costs) and the redemption value is recognized in the consolidated statements ofprofit or loss and other comprehensive income over the period of the borrowings using the effective interest method. Fees paid onobtaining loan facilities are recognized as transaction costs of the loan to the extent that it is probable that some or all of the facilities will be drawn down. In this case, the fee is deferred until the drawdown occurs. To the extent there is no evidence that it is probable that some or all of the facilities will be drawn down, the fee is capitalized as a pre-payment for liquidity services and amortized over the period of the facilities towhichit relates. F-22
PERUSAHAAN PERSEROAN (PERSERO) PT TELEKOMUNIKASI INDONESIA Tbk AND SUBSIDIARIES NOTES TO THE CONSOLIDATED FINANCIAL STATEMENTS As of December 31, 2015 and 2016 and for the Years Ended December 31, 2014, 2015 and 2016 (Figures in tables are expressedin billions ofRupiah, unless otherwise stated)
Table of Content
2.SUMMARY OF SIGNIFICANT ACCOUNTING POLICIES(continued)
p. Foreign currency translations
The functional currency and the reporting currency of the Group are both the Indonesian rupiah, except for the functional currency of Telekomunikasi Indonesia International Pte. Ltd., Hong Kong, Telekomunikasi Indonesia International Pte. Ltd., Singapore, Telekomunikasi Indonesia International Inc., USA and Telekomunikasi Indonesia International S.A., Timor Leste whose functional currency is U.S. dollars and Telekomunikasi Indonesia International, Pty. Ltd.,Australia whose functional currency is Australian dollars. Transactions in foreign currencies are translated into Indonesian rupiah at the rates of exchange prevailing at transaction date. At the consolidated statements of financial position dates, monetary assets and liabilities denominated in foreign currencies are translated into Indonesian rupiah based on the buy and sell rates quoted by Reuters prevailing at the consolidated statements of financial position dates, as follows (in full amount): | | 2015 | | 2016 | | | | Buy | | Sell | | Buy | | Sell | | United States dollar (“US$â€) 1 | | 13,780 | | 13,790 | | 13,470 | | 13,475 | | Australian dollar (“AUDâ€) 1 | | 10,076 | | 10,092 | | 9,721 | | 9,726 | | Euro 1 | | 15,049 | | 15,064 | | 14,170 | | 14,181 | | Yen 1 | | 114.47 | | 114.56 | | 115.01 | | 115.10 | |
The resulting foreign exchange gain or losses, realized and unrealized, are credited or charged to the consolidated statements of profit or loss and other comprehensive income, except for foreign exchange differences incurred on borrowings during the construction of qualifying assets which are capitalized to the extent that the borrowings can be attributed to the construction of those qualifying assets (Note 2l).
q. Revenue and expense recognition
i.Cellular and fixed wireless telephone revenues Revenues from postpaid service, which consist of usage and monthly charges, are recognized as follows: ·Airtime and charges for value added services are recognized based on usage by subscribers. ·Monthly subscription charges are recognized as revenues when incurred by subscribers. Revenues from prepaid service, which consist of the sale of starter packs (also known as SIM cards and start-up load vouchers) and pulse reload vouchers, are recognized initially as unearned income and recognized as revenue based on total of successful calls made and the value added services used by the subscribers or the expiration of the unused stored value of the voucher. ii. Fixed line telephone revenues Revenues from usage charges are recognized as customers incur the charges. Monthly subscription charges are recognized as revenues when incurred by subscribers. Revenues from fixed line installations are deferred and recognized as revenue on the straight-line basis over the expected term of the customer relationships. Based on reviews of historical information and customer trends, the Company determined the term of the customer relationships is 18 years. F-23
PERUSAHAAN PERSEROAN (PERSERO) PT TELEKOMUNIKASI INDONESIA Tbk AND SUBSIDIARIES NOTES TO THE CONSOLIDATED FINANCIAL STATEMENTS As of December 31, 2015 and 2016 and for the Years Ended December 31, 2014, 2015 and 2016 (Figures in tables are expressedin billions ofRupiah, unless otherwise stated) Table of Content
2.SUMMARY OF SIGNIFICANT ACCOUNTING POLICIES(continued) q. Revenue and expense recognition(continued)
iii. Interconnection revenues Revenues from network interconnection with other domestic and international telecommunications carriers are recognized monthly on the basis of the actual recorded traffic for the month. Interconnection revenues consist of revenues derived from other operators’ subscriber calls to the Group’s subscribers (incoming) and calls between subscribers of other operators through the Group’s network (transit). iv. Data, internet, and information technology services revenues Revenues from data communication and internet are recognized based onservice activity and performance whicharemeasured bytheduration of internet usage or based on the fixed amountofcharges depending on the arrangements with customers. Revenues from sales, installation and implementation of computer software and hardware, computer data network installation service and installation are recognized when the goods are delivered to customers or the installation takes place. Revenue from computer software development service is recognized using the percentage-of-completion method. v. Network revenues Revenues from network consist of revenues from leased lines and satellite transponder leases which are recognized over the period in which the services are rendered. vi. Other revenues Revenues from sales of handsets or other telecommunications equipments are recognized when delivered to customers. Revenues fromtelecommunicationtower leases are recognized on straight-line basis over the lease period in accordance with the agreement with the customers. Revenues from other services are recognized when services are rendered to customers. vii. Multiple-element arrangements
Where two or more revenue-generating activities or deliverables are sold under a single arrangement, each deliverable that is considered to be a separate unit of accounting is accounted for separately. The total revenue is allocated to each separately identifiable component based on the relative fair value of each component and the appropriate revenue recognition criteria are applied to each component as described above. viii. Agency relationship Revenues from an agency relationship are recorded based on the gross amount billed to the customers when the Group acts as principal in the sale of goods and services. Revenues are recorded based on the net amount retained (the amount paid by the customer less amount paid to the suppliers) when, in substance, the Group has acted as agent and earned commission from the suppliers of the goods and services sold. F-24
PERUSAHAAN PERSEROAN (PERSERO) PT TELEKOMUNIKASI INDONESIA Tbk AND SUBSIDIARIES NOTES TO THE CONSOLIDATED FINANCIAL STATEMENTS As of December 31, 2015 and 2016 and for the Years Ended December 31, 2014, 2015 and 2016 (Figures in tables are expressedin billions ofRupiah, unless otherwise stated) Table of Content
2. SUMMARY OF SIGNIFICANT ACCOUNTING POLICIES (continued) q. Revenue and expense recognition(continued)
ix. Customer loyalty programme The Group operates a loyalty programme, which allows customers to accumulate points for every certain multiple of the telecommunication services usage. The points can be redeemed in the future for free or discounted products or services, provided other qualifying conditions are achieved. Consideration received is allocated between the telecommunication services and the points issued, with the consideration allocated to the points equal to their fair value. Fair value of the points is determined based on historical information about redemption rate of award points. Fair value of the points issued is deferred and recognized as revenue when the points are redeemed or expired. x. Expenses Expenses are recognizedas they are incurred. r. Employee benefits i. Short-term employee benefits All short-term employee benefits which consist of salaries and related benefits, vacation pay, incentives and other short-term benefits are recognized as expense on undiscounted basis when employees have rendered service to the Group. ii. Post-employment benefit plans and other long-term employee benefits Post-employment benefit plans consist of funded and unfunded defined benefit pension plans, defined contribution pension plan, other post-employment benefits, post-employment health care benefit plan, defined contribution health care benefit plan and obligations under the Labor Law. Other long-term employee benefits consist of Long Service Awards (“LSAâ€), Long Service Leave (“LSLâ€), and pre-retirement benefits. The cost of providing benefits under post-employment benefit plans and other long-term employee benefits calculation is performed by an independent actuary using the projected unit credit method. The net obligations in respect of the defined pension benefit plans and post-retirementhealth care benefit plan are calculated at the present value of estimated future benefits that the employees have earned in return for their service in the current and prior periods less the fair value of plan assets. The present value of the defined benefit obligation is determined by discounting the estimated future cash outflows using interest rates of Government bonds that are denominated in the currencies in which the benefits will be paid and that have terms to maturity approximating the terms of the related retirement benefit obligation. Government bonds are used as there are no deep markets for high quality corporate bonds. F-25
PERUSAHAAN PERSEROAN (PERSERO) PT TELEKOMUNIKASI INDONESIA Tbk AND SUBSIDIARIES NOTES TO THE CONSOLIDATED FINANCIAL STATEMENTS As of December 31, 2015 and 2016 and for the Years Ended December 31, 2014, 2015 and 2016 (Figures in tables are expressedin billions ofRupiah, unless otherwise stated) Table of Content
2. SUMMARY OF SIGNIFICANT ACCOUNTING POLICIES (continued)
r. Employee benefits (continued)
ii.Post-employment benefit plans and other long-term employee benefits (continued) Plan assets are assets owned by defined benefit pension plan and post-retirement health care benefits plan as well asqualifying insurance policy. The assets are measured at fair valueas of reporting dates. The fair value ofqualifyinginsurance policy isdeemed to be the present value of the related obligations (subject to any reduction required if the amounts receivable under the insurance policies are not recoverable in full). Remeasurement, comprising of actuarial gain and losses, the effect of the asset ceiling (excluding amounts included in net interest on the net defined benefit liability (asset) and the return on plan assets (excluding amounts included in net interest on the net defined benefit liability (asset) are recognized immediately in the consolidated statements of financial position with a corresponding debit or credit to retained earnings through OCI in the period in which they occur. Remeasurements are not reclassified to profit or loss in subsequent periods. Pastservice costs are recognized immediately in profit or loss on the earlier of: ·The date of plan amendment or curtailment; and ·The date that the Group recognized restructuring-related costs. Net interest is calculated by applying the discount rate to the net defined benefit liability or assets. Gain or losses on curtailment are recognized when there is a commitment to make a material reduction in the number of employees covered by a plan or when there is an amendment of defined benefit plan terms such that a material element of future services to be provided by current employees will no longer qualify for benefits, or will qualify only for reduced benefits.
Gain or losses on settlement are recognized when there is a transaction that eliminates all further legal or constructive obligation for part or all of the benefits provided under a defined benefit plan(other than the payment of benefit in accordance with the program and included in the actuarial assumptions).
For defined contribution plans, the regular contributions constitute net periodic costs for the period in which they are due and, as such, are included in “Personnel Expenses†as they become payable. iii. Share-based payments
The Company operates an equity-settled, share-based compensation plan. The fair value of the employees’ services rendered which are compensated with the Company’s shares is recognized as an expense in the consolidated statements of profit or loss and othercomprehensive income and credited to additional paid-in capital at the grant date. iv.Early retirement benefits Early retirement benefits are accrued at the time the Companyand subsidiariesmake a commitment to provide early retirement benefits as a result of an offer made in order to encourage voluntary redundancy. A commitment to a termination arises when, and only when a detailed formal plan for the early retirement cannot be withdrawn. F-26
PERUSAHAAN PERSEROAN (PERSERO) PT TELEKOMUNIKASI INDONESIA Tbk AND SUBSIDIARIES NOTES TO THE CONSOLIDATED FINANCIAL STATEMENTS As of December 31, 2015 and 2016 and for the Years Ended December 31, 2014, 2015 and 2016 (Figures in tables are expressedin billions ofRupiah, unless otherwise stated) Table of Content
2.SUMMARY OF SIGNIFICANT ACCOUNTING POLICIES(continued)
s. Income tax Current and deferredincometaxes arerecognized as income or an expense and included inthe consolidated statements of profit or loss and othercomprehensive income, except to the extent that the tax arises from a transaction or event which is recognized directly in equity,in which case,the taxis recognized directlyin equity. Current tax assets and liabilities are measured at the amount expected to be recovered or paid using the tax rates and tax laws that have been enacted at each reporting date. Management periodically evaluates positions taken in tax returns with respect to situations in which applicable tax regulation is subject to interpretation. Where appropriate, management establishes provisions based on the amounts expected to be paid to the tax authorities. The Group recognizes deferred tax assets and liabilities for temporary differences between the financial and tax bases of assets and liabilities at each reporting date. The Group also recognizes deferred tax assets resulting from the recognition of future tax benefits, such as the benefit of tax losses carried forward to the extent their future realization is probable. Deferred tax assets and liabilities are measured using enacted or substantively enacted tax rates and tax laws at each reporting date which are expected to apply to taxable income in the years in which those temporary differences are expected to be recovered or settled.
The carrying amount of deferred tax asset is reviewed at the end of each reporting period and reduced to the extent that it is no longer probable that sufficient taxable income will be available to allow the benefit of part or all of that deferred tax asset to be utilized.
Deferred tax assets and liabilities are offset in the consolidated statements of financial position, except if these are for different legal entities, in the same manner the current tax assets and liabilities are presented. Amendment to taxation obligation is recorded when an assessment letter (“Surat Ketetapan Pajak” or “SKP”) is received or, if appealed against, when the results of the appeal are determined. The additional taxes and penalty imposed through SKP are recognized in the current year profit or loss, unless objection/appeal is taken. The additional taxes and penalty imposed through SKP are deferred as long as they meet the asset recognition criteria. Indonesian tax regulations impose final tax on several types of transactions based on the gross value of the transaction. Therefore, such transaction remains subject to tax even though the taxpayer incurred a loss on the transaction. Final income taxon construction services and leaseis presented as part of“OtherExpenses”.
t. Financial instruments The Group classifies financial instruments into financial assets and financial liabilities.Financial assets and liabilities are recognized initially at fair value including transaction costs. These are subsequently measured either at fair value or amortized cost using the effective interest method in accordance with their classification. i. Financial assets The Group classifies its financial assets as (i) financial assets at fair value through profit or loss, (ii) loans and receivables, (iii) held-to-maturity investments or (iv) available-for-sale financial assets. The classification depends on the purpose for which the financial assets are acquired. Management determines the classification of financial assets at initial recognition. PERUSAHAAN PERSEROAN (PERSERO) PT TELEKOMUNIKASI INDONESIA Tbk AND SUBSIDIARIES NOTES TO THE CONSOLIDATED FINANCIAL STATEMENTS As of December 31, 2015 and 2016 and for the Years Ended December 31, 2014, 2015 and 2016 (Figures in tables are expressedin billions ofRupiah, unless otherwise stated) Table of Content 2.SUMMARY OF SIGNIFICANT ACCOUNTING POLICIES(continued)
t. Financial instruments(continued)
i. Financial assets (continued) Purchases or sales of financial assets that require delivery of assets within a time frame established by regulation or convention in the marketplace (regular way trades) are recognized on the trade date, i.e., the date that the Group commits to purchase or sell the assets. TheGroup’s financial assets include cash and cash equivalents, other current financial assets, trade and other receivables,and other non-current assets.
a. Financial assets at fair value through profit or loss Financial assets at fair value through profit or loss are financial assets classified as held for trading. A financial asset is classified as held for trading if it is acquired principally for the purpose of selling or repurchasing it in the near term and for which there is evidence of a recent actual pattern of short-term profit taking. Gains or losses arising from changes in fair value of the trading securities are presented as other (expenses)/income in consolidatedstatements of profit or loss and other comprehensive income in the period in which they arise. Financial asset measured at fair value through profitorloss consists ofaderivative asset-put option, which is recognized as part of “OtherCurrentFinancialAssets†in the consolidated statements of financial position. b.Loans and receivables Loans and receivables are non-derivative financial assets with fixed or determinable payments that are not quoted in an active market. Loans and receivables consist of, among otherassets, cash and cash equivalents, other current financial assets,trade and other receivables, and other non-current assets (long-term trade receivables and restricted cash). These are initially recognized at fair value including transaction costs and subsequently measured at amortized cost, using the effective interest method. c. Held-to-maturityinvestments Held-to-maturity investments are non-derivative financial assets with fixed or determinable payments and fixed maturities on which management has the positive intention and ability to hold to maturity, other than: a)those that theGroup, upon initial recognition, designates as at fair value through profit or loss; b)those that theGroup designates as available-for-sale; and c)those that meet the definition of loans and receivables. No financial assets were classified as held-to-maturity investments as of December 31, 2015 and 2016. F-28
PERUSAHAAN PERSEROAN (PERSERO) PT TELEKOMUNIKASI INDONESIA Tbk AND SUBSIDIARIES NOTES TO THE CONSOLIDATED FINANCIAL STATEMENTS As of December 31, 2015 and 2016 and for the Years Ended December 31, 2014, 2015 and 2016 (Figures in tables are expressedin billions ofRupiah, unless otherwise stated) Table of Content
2.SUMMARY OF SIGNIFICANT ACCOUNTING POLICIES(continued)
t. Financial instruments(continued)
i. Financial assets (continued) d. Available-for-sale financial assets Available-for-sale investments are non-derivative financial assets that are intended to be held for indefinite periods of time, which may be sold in response to needs for liquidity or changes in interest rates, exchange rates or that are not classified as loans and receivables, held-to-maturity investments or financial assets at fair value through profit or loss. Available-for-sale financial assetsprimarilyconsist ofmutual funds, and corporate and government bonds,which are recorded aspart of “OtherCurrentFinancialAssets†in the consolidated statements of financial position. Available-for-sale securities are stated at fair value. Unrealized holding gain or losses on available-for-sale securities are excluded from income of the current period and are reported as a separate component in the equity section of the consolidated statements of financial position until realized. Realized gain or losses from the sale of available-for-sale securities are recognized in the consolidated statements ofprofit or loss and othercomprehensive income, and are determined on the specific identification basis. ii. Financial liabilities
The Group classifies its financial liabilities as (i) financial liabilities at fair value through profit or loss or (ii) financial liabilities measured at amortized cost. The Group’s financial liabilities include trade and other payables, accrued expenses, and interest-bearing loans and other borrowings.Interest-bearing loans and other borrowingsconsist of short-term bank loans, two-step loans, bonds and notes, long-term bank loans andobligations underfinance leases. a.Financial liabilities at fair value through profit or loss Financial liabilities at fair value through profit or loss are financial liabilities classified as held for trading. A financial liability is classified as held for trading if it is incurred principally for the purpose of selling or repurchasing it in the near term and for which there is evidence of a recent actual pattern of short-term profit taking. No financial liabilities were categorized as held for trading as of December 31, 2015 and 2016. b.Financial liabilities measured at amortized cost Financial liabilities that are not classified as liabilities at fair value through profit or loss fall into this category and are measured at amortized cost. Financial liabilities measured at amortized cost are tradeandother payables, accrued expenses, and interest-bearing loans and other borrowings.Interest-bearing loans and other borrowings consist of short-term bank loans, two-step loans, bonds and notes, long-term bank loans and obligations under finance leases. F-29
PERUSAHAAN PERSEROAN (PERSERO) PT TELEKOMUNIKASI INDONESIA Tbk AND SUBSIDIARIES NOTES TO THE CONSOLIDATED FINANCIAL STATEMENTS As of December 31, 2015 and 2016 and for the Years Ended December 31, 2014, 2015 and 2016 (Figures in tables are expressedin billions ofRupiah, unless otherwise stated) Table of Content
2.SUMMARY OF SIGNIFICANT ACCOUNTING POLICIES(continued) t. Financial instruments (continued) iii. Offsetting financial instruments Financial assets and liabilities are offset and the net amount is reported in the consolidated statementsof financial position when there is a legally enforceable right to offset the recognized amounts and there is an intention to settle them on a net basis, or realize the assets and settle the liabilities simultaneously. The right of set-off must not be contingent on a future event and must be legally enforceable in all of the following circumstances: a.the normal course of business; b.the event of default; and c.the event of insolvency or bankruptcy of the Group and all of the counterparties.
iv.Fair value of financial instruments Fair value is the amount for which an asset could be exchanged, or liability settled, in an arm’s length transaction. The fair value of financial instruments that are traded in active markets at each reporting date is determined by reference to quoted market prices, without any deduction for transaction costs. For financial instruments not traded in an active market, the fair value is determined using appropriate valuation techniques. Such techniques may include using recent arm’s length market transactions, reference to the current fair value of another instrument that is substantially the same, a discounted cash flow analysis or other valuation models. An analysis of fair values of financial instruments and further details as to how they are measured are provided in Note35.
v. Impairment of financial assets The Group assesses the impairment of financial assets if there is objective evidence that a loss event has a negative impact on the estimated future cash flows of the financial assets. Impairment is recognized when the loss can be reliably estimated. Losses expected as a result of future events, no matter how likely, are not recognized. For financial assets carried at amortized cost, the Group first assesses whether impairment exists individually for financial assets that are individually significant, or collectively for financial assets that are not individually significant. If the Group determines that no objective evidence of impairment exists for an individually assessed financial asset, whether significant or not, it includes the asset in a group of financial assets with similar credit risk characteristics and collectively assesses them for impairment. Assets that are individually assessed for impairment and for which an impairment loss is, or continues to be, recognized are not included inthe collective assessment of impairment. The amount of any impairment loss identified is measured as the difference between the asset’s carrying amount and the present value of estimated future cash flows (excluding future expected credit losses that have not yet been incurred). The present value of the estimated future cash flows is discounted at the financial asset’s original effective interest rate. The carrying amount of the asset is reduced through the use of an allowance account and the loss is recognized in profit or loss. F-30
PERUSAHAAN PERSEROAN (PERSERO) PT TELEKOMUNIKASI INDONESIA Tbk AND SUBSIDIARIES NOTES TO THE CONSOLIDATED FINANCIAL STATEMENTS As of December 31, 2015 and 2016 and for the Years Ended December 31, 2014, 2015 and 2016 (Figures in tables are expressedin billions ofRupiah, unless otherwise stated) Table of Content
2.SUMMARY OF SIGNIFICANT ACCOUNTING POLICIES(continued)
t. Financial instruments (continued) v. Impairment of financial assets (continued) Foravailable-for-salefinancial assets, the Group assesses at each reporting date whether there is objective evidence that an investment or a group of investments is impaired. When a decline in the fair value of an available-for-sale financial asset has been recognized in other comprehensive income and there is objective evidence that the asset is impaired, the cumulative loss that had been recognized in other comprehensive income is recognized in profit or loss as an impairment loss. The amount of the cumulative loss is the difference between the acquisition cost (net of any principal repayment and amortization) and current fair value, less any impairment loss on that financial asset previously recognized.
vi.Derecognition of financial instrument The Group derecognizes a financial asset when the contractual rights to the cash flows from the financial asset expire, or when the Group transfers substantially all the risks and rewards of ownership of the financial asset. The Group derecognizes a financial liability when the obligation specified in the contract is discharged or cancelled or has expired.
u. Treasury stock Reacquired Company shares of stock are accounted for at their reacquisition cost and classified as “Treasury Stock†and presented as a deduction in equity. The cost of treasury stock sold/transferred is accounted for using the weighted average method. The portion of treasury stock transferred for employee stock ownership program is accounted for at its fair value at grant date. The difference between the cost and the proceeds from the sale/transfer of treasury stock is credited to “Additional Paid-in Capitalâ€.
v. Dividends Dividend for distribution to the stockholders is recognized as a liability in the consolidated financial statements in the year in which the dividend is approved by the stockholders. The interim dividend is recognized as a liability based on the Board of Directors’ decision supported by the approval from the Board of Commissioners.
w. Basicand dilutedearnings per share and per ADS Basic earnings per share is computed by dividing profit for the year attributable to owners of the parent company by the weighted average number of shares outstanding during the year. Income per ADS is computed by multiplying the basic earnings per share by100, the number of shares represented by each ADS. The Company does not have potentially dilutive financialinstruments. F-31
PERUSAHAAN PERSEROAN (PERSERO) PT TELEKOMUNIKASI INDONESIA Tbk AND SUBSIDIARIES NOTES TO THE CONSOLIDATED FINANCIAL STATEMENTS As of December 31, 2015 and 2016 and for the Years Ended December 31, 2014, 2015 and 2016 (Figures in tables are expressedin billions ofRupiah, unless otherwise stated)
Table of Content
2. SUMMARY OF SIGNIFICANT ACCOUNTING POLICIES (continued) x. Segment information
The Group's segment information is presented based upon identified operating segments. An operating segment is a component of an entity: a)that engages in business activities from which it may earn revenues and incur expenses (including revenues and expenses relating to transactions with other components of the same entity); b) whose operating results are regularly reviewed by the Group’s chief operating decision maker i.e., the Directors, to make decisions about resources to be allocated to the segment and assess its performance; and c) for which discrete financial information is available. y. Provisions
Provisions are recognized when the Group has present obligations (legal or constructive) arising from past events and it is probable that an outflow of resources embodying economic benefits will be required to settle the obligations and the amount can be measured reliably.
Provisions for onerous contracts are recognized when the contract becomes onerous for the lower of the cost of fulfilling the contract and any compensation or penalties arising from failure to fulfill the contract.
z. Impairment of non-financial assets At the end of each reporting period,the Group assesses whether there is an indication that an asset may be impaired. If such indication exists, the recoverable amount is estimated for the individual asset. If it is not possible to estimate the recoverable amount of the individual asset, the Group determines the recoverable amount of the Cash-Generating Unit (“CGUâ€) to which the asset belongs (“the asset’s CGUâ€). The recoverable amount of an asset (either individual asset or CGU) is the higher of the asset’s fair value less costs to sell and its value in use (“VIUâ€). Where the carrying amount of the asset exceeds its recoverable amount, the asset is considered impaired and is written down to its recoverable amount. In assessing the value in use, the estimated net future cash flows are discounted to their present value using a pre-tax discount rate that reflects current market assessments of the time value of money and the risks specific to the asset. In determining fair value less costs to sell, recent market transactions are taken into account, if available. If no such transactions can be identified, the Group uses an appropriate valuation model to determine the fair value of the asset. These calculations are corroborated by valuation multiples or other available fair value indicators.
Impairment losses of continuing operations are recognizedin profit or loss as part of “Depreciation and Amortization†in the consolidated statements of profit or loss and other comprehensive income. At the end of each reporting period, the Group assesses whether there is any indication that previously recognized impairment losses for an asset, other than goodwill, may no longer exist or may have decreased. If such indication exists, the recoverable amount is estimated. A previously recognized impairment loss for an asset, other than goodwill, is reversed only if there has been a change in the assumptions used to determine the asset’s recoverable amount since the last impairment loss was recognized. The reversal is limited such that the carrying amount of the asset does not exceed its recoverable amount, nor exceeds the carrying amount that would have been determined, net of depreciation, had no impairment been recognized for the asset in prior periods. Reversal of an impairment loss is recognized in profit or loss. F-32
PERUSAHAAN PERSEROAN (PERSERO) PT TELEKOMUNIKASI INDONESIA Tbk AND SUBSIDIARIES NOTES TO THE CONSOLIDATED FINANCIAL STATEMENTS As of December 31, 2015 and 2016 and for the Years Ended December 31, 2014, 2015 and 2016 (Figures in tables are expressedin billions ofRupiah, unless otherwise stated) Table of Content
2. SUMMARY OF SIGNIFICANT ACCOUNTING POLICIES (continued)
z. Impairment of non-financial assets (continued) Goodwill is tested for impairment annually and when circumstances indicate that the carrying value may be impaired. Impairment is determined for goodwill by assessing the recoverable amount of each CGU (or group of CGUs) to which the goodwill relates. When the recoverable amount of the CGU is less than its carrying amount, an impairment loss is recognized. Impairment loss relating to goodwill can not be reversed in future periods.
aa. Critical accounting estimates, judgments and assumptions
Estimates and judgments are continually evaluated and are based on historical experience and other factors, including expectations of future events that are believed to be reasonable under the circumstances. The Group makes estimates and assumptions concerning the future. The resulting accounting estimates will, by definition, seldom equal the related actual results. The estimates and assumptions that have a significant risk of causing a material adjustment to the carrying amounts of assets and liabilities within the next financial year are addressed below. i. Retirement benefits The present value of theretirement benefit obligations depends on a number of factors that are determined on an actuarial basis using a number of assumptions. The assumptions used in determining the net cost (income) for pensions include the discount rate. Any changes intheseassumptions will impact the carrying amount of the retirement benefit obligations.
The Group determines the appropriate discount rate at the end of each reporting period. This is the interest rate that should be used to determine the present value of estimated future cash outflows expected to be required to settle the obligations. In determining the appropriate discount rate, the Group considers the interest rates of Government bonds that are denominated in the currency in which the benefits will be paid and that have terms to maturity approximating the terms of the related retirement benefit obligations. If there is an improvement in the ratings of such Government bonds or a decrease in interest rates as a result of improving economic conditions, there could be a material impact on the discount rate used in determining the post-employment benefit obligations. Other key assumptions for retirement benefit obligations are based in part on current market conditions. Additional information is disclosed in Notes 29 and 30. ii. Useful lives of property and equipment The Group estimates the useful lives of its property and equipment based on expected asset utilization, considering strategic business plans, expected future technological developments and market behavior. The estimates of useful lives of property and equipment are based on the Group’s collective assessment of industry practice, internal technical evaluation and experience with similar assets. F-33
PERUSAHAAN PERSEROAN (PERSERO) PT TELEKOMUNIKASI INDONESIA Tbk AND SUBSIDIARIES NOTES TO THE CONSOLIDATED FINANCIAL STATEMENTS As of December 31, 2015 and 2016 and for the Years Ended December 31, 2014, 2015 and 2016 (Figures in tables are expressedin billions ofRupiah, unless otherwise stated) Table of Content
2. SUMMARY OF SIGNIFICANT ACCOUNTING POLICIES (continued) aa. Critical accounting estimates, judgments and assumptions (continued) ii. Useful lives of property and equipment (continued) The Group reviews its estimates of useful lives at least each financial year-end and such estimates are updated if expectations differ from previous estimates due to changes in expectation of physical wear and tear, technical or commercial obsolescence and legal or other limitations on the continuing use of the assets. The amounts of recorded expenses for any year will be affected by changes in these factors and circumstances. A change in the estimated useful lives of the property and equipment is a change in accounting estimates and is applied prospectively in profit or loss in the period of the change and future periods. Details of the nature and carrying amounts of property and equipmentare disclosed in Note 10. iii. Provision for impairment of receivables The Group assesses whether there is objective evidence that trade and other receivables have been impaired at the end of each reporting period. Provision for impairment of receivables is calculated based on a review of the current status of existing receivables and historical collection experience. Such provisions are adjusted periodically to reflect the actual and anticipated experience. Details of the nature and carrying amounts of provision for impairment of receivables are disclosed in Note 6. iv. Income taxes Significant judgment is required in determining the provision for income taxes. There are many transactions and calculations for which the ultimate tax determination is uncertain. The Group recognizes liabilities for anticipated tax audit issues based on estimates of whether additional taxes will be due. Where the final tax outcome of these matters is different from the amounts that were initially recorded, such differences will impact the current and deferred income tax assets and liabilities in the year in which such determination is made. Details of the nature and carrying amounts of income tax are disclosed in Note28. F-34
PERUSAHAAN PERSEROAN (PERSERO) PT TELEKOMUNIKASI INDONESIA Tbk AND SUBSIDIARIES NOTES TO THE CONSOLIDATED FINANCIAL STATEMENTS As of December 31, 2015 and 2016 and for the Years Ended December 31, 2014, 2015 and 2016 (Figures in tables are expressedin billions ofRupiah, unless otherwise stated) Table of Content
3.TRANSLATION OF RUPIAH INTO UNITED STATES DOLLAR
The consolidated financial statements are stated in Indonesian rupiah. The translation of the Indonesian rupiah amounts into U.S. dollar amounts are included solely for the convenience of the readers and has been made using the average of the market buy and sell rates of Rp13,472.5to US$1 as published by Reuters on December 30, 2016. The convenience translation should not be construed as representations that the Indonesian rupiah amounts have been, could have been, or could in the future be, converted into U.S. dollar at this or any other rate of exchange.
4. CASH AND CASH EQUIVALENTS
The breakdown of cash and cash equivalents is as follows: | | | 2015 | | 2016 | | | | | Balance | | Balance | | | Currency | | Original currency (in millions) | | Rupiah equivalent | | Original currency (in millions) | | Rupiah equivalent | | Cash on hand | Rp | | - | | 10 | | - | | 10 | | | | | | | | | | | | | Cash in banks | | | | | | | | | | | Related parties | | | | | | | | | | | PT Bank Mandiri (Persero) Tbk (“Bank Mandiriâ€) | Rp | | - | | 672 | | - | | 1,897 | | | US$ | | 51 | | 707 | | 41 | | 548 | | | JPY | | 11 | | 1 | | 6 | | 1 | | | EUR | | 1 | | 8 | | 1 | | 11 | | | HKD | | 1 | | 1 | | 1 | | 1 | | | AUD | | 0 | | 0 | | 0 | | 0 | | PT Bank Negara Indonesia (Persero) Tbk (“BNIâ€) | Rp | | - | | 508 | | - | | 581 | | | US$ | | 22 | | 299 | | 6 | | 84 | | | EUR | | 5 | | 72 | | 5 | | 68 | | | SGD | | 0 | | 0 | | 0 | | 0 | | PT Bank Rakyat Indonesia (Persero) Tbk (“BRIâ€) | Rp | | - | | 140 | | - | | 95 | | | US$ | | 11 | | 155 | | 8 | | 107 | | Others | Rp | | - | | 20 | | - | | 29 | | | US$ | | 0 | | 0 | | 0 | | 0 | | Sub-total | | | | | 2,583 | | | | 3,422 | |
F-35
PERUSAHAAN PERSEROAN (PERSERO) PT TELEKOMUNIKASI INDONESIA Tbk AND SUBSIDIARIES NOTES TO THE CONSOLIDATED FINANCIAL STATEMENTS As of December 31, 2015 and 2016 and for the Years Ended December 31, 2014, 2015 and 2016 (Figures in tables are expressedin billions ofRupiah, unless otherwise stated) Table of Content 4. TRANSLATION OF RUPIAH INTO UNITED STATES DOLLAR
The consolidated financial statements are stated in Indonesian rupiah. The translations of the Indonesian rupiah amounts into U.S. dollar amounts are included solely for the convenience of the readers and have been made using the average of the market buy and sell rates of Rp12,170 to US$1 as published by Reuters on December 31, 2013. The convenience translations should not be construed as representations that the Indonesian rupiah amounts have been, could have been, or could in the future be, converted into United States dollar at this or any other rate of exchange.
5. CASH AND CASH EQUIVALENTS
| 2012 | | 2013 | | Cash on hand | 7 | | 7 | | Cash in banks | | | | | Related parties | | | | | Rupiah | | | | | PT Bank Mandiri (Persero) Tbk (“Bank Mandiri”) | 913 | | 804 | | PT Bank Negara Indonesia (Persero) Tbk (“BNI”) | 284 | | 409 | | PT Bank Rakyat Indonesia (Persero) Tbk (“BRI”) | 87 | | 70 | | PT Bank Tabungan Negara (Persero) Tbk (“BTN”) | 13 | | 50 | | Others | 9 | | 10 | | | 1,306 | | 1,343 | | Foreign currencies | | | | | Bank Mandiri | 222 | | 458 | | BNI | 20 | | 224 | | BRI | 2 | | 75 | | Others | 0 | | 0 | | | 244 | | 757 | | Sub-total | 1,550 | | 2,100 | | Third parties | | | | | Rupiah | | | | | Deutsche Bank AG (“DB”) | 62 | | 62 | | Others (each below Rp50 billion) | 154 | | 159 | | | 216 | | 221 | | Foreign currencies | | | | | Standard Chartered Bank (“SCB”) | 112 | | 313 | | Others (each below Rp50 billion) | 65 | | 102 | | | 177 | | 415 | | Sub-total | 393 | | 636 | | Total cash in banks | 1,943 | | 2,736 | |
F-42
PERUSAHAAN PERSEROAN (PERSERO)
| PT TELEKOMUNIKASI INDONESIA Tbk AND SUBSIDIARIES
| NOTES TO THE CONSOLIDATED FINANCIAL STATEMENTS
| As of January 1, 2012 (Restated), December 31, 2012 (Restated) and December 31, 2013
| and for the years ended December 31, 2011 (Restated), 2012 (Restated) and 2013
| (Figures in tables are presented in billions of rupiah, unless otherwise stated)
| |
Tabel of Content
5. CASH AND CASH EQUIVALENTS (continued)
| | | 2015 | | 2016 | | | | | Balance | | Balance | | | Currency | | Original currency (in millions) | | Rupiah equivalent | | Original currency (in millions) | | Rupiah equivalent | | Cash in banks (continued) | | | | | | | | | | | Third parties | | | | | | | | | | | The Hongkong and Shanghai Banking Corporation Ltd. (“HSBCâ€) | US$ | | 8 | | 110 | | 13 | | 176 | | | HKD | | 10 | | 18 | | 2 | | 4 | | | SGD | | 1 | | 6 | | - | | - | | Standard Chartered Bank (“SCBâ€) | Rp | | - | | 0 | | - | | 0 | | | US$ | | 31 | | 430 | | 6 | | 74 | | | SGD | | 1 | | 13 | | 5 | | 43 | | PT Bank Permata Tbk (“Bank Permataâ€) | Rp | | - | | 12 | | - | | 14 | | | US$ | | 0 | | 0 | | 7 | | 96 | | Development Bank of Singapore (â€DBSâ€) | Rp | | - | | 0 | | - | | 101 | | | US$ | | - | | - | | 0 | | 0 | | PT Bank Muamalat Indonesia Tbk (“Bank Muamalatâ€) | Rp | | - | | 61 | | - | | 6 | | | US$ | | 27 | | 373 | | 2 | | 24 | | Citibank, N.A. (“Citibankâ€) | Rp | | - | | 103 | | - | | 5 | | | US$ | | 2 | | 26 | | 1 | | 12 | | | EUR | | 0 | | 4 | | 0 | | 1 | | Others | Rp | | - | | 80 | | - | | 139 | | | US$ | | 1 | | 15 | | 2 | | 33 | | | SGD | | - | | - | | 0 | | 0 | | | EUR | | 0 | | 0 | | 0 | | 0 | | | AUD | | 1 | | 13 | | 1 | | 12 | | | TWD | | 19 | | 8 | | 3 | | 1 | | | MYR | | 0 | | 0 | | 0 | | 0 | | | HKD | | 0 | | 0 | | 0 | | 0 | | | MOP | | 0 | | 0 | | 0 | | 1 | | Sub-total | | | | | 1,272 | | | | 742 | | Total cash in banks | | | | | 3,855 | | | | 4,164 | | Time deposits | | | | | | | | | | | Related parties | | | | | | | | | | | BRI | Rp | | - | | 2,831 | | - | | 4,076 | | | US$ | | 201 | | 2,763 | | 47 | | 632 | | BNI | Rp | | - | | 3,031 | | - | | 4,043 | | | US$ | | 1 | | 9 | | 25 | | 336 | | PT Bank Tabungan Negara (Persero) Tbk (“Bank BTNâ€) | Rp | | - | | 885 | | - | | 3,356 | | PT Bank Pembangunan Daerah Jawa Barat dan Banten Tbk (“BJBâ€) | Rp | | - | | 1,884 | | - | | 2,020 | | | US$ | | 10 | | 138 | | - | | - | | Bank Mandiri | Rp | | - | | 2,863 | | - | | 1,552 | | | US$ | | 5 | | 69 | | 5 | | 67 | | Others | Rp | | - | | 50 | | - | | 27 | | Sub-total | | | | | 14,523 | | | | 16,109 | |
F-36
PERUSAHAAN PERSEROAN (PERSERO) PT TELEKOMUNIKASI INDONESIA Tbk AND SUBSIDIARIES NOTES TO THE CONSOLIDATED FINANCIAL STATEMENTS As of December 31, 2015 and 2016 and for the Years Ended December 31, 2014, 2015 and 2016 (Figures in tables are expressedin billions ofRupiah, unless otherwise stated)
Table of Content
4. CASH AND CASH EQUIVALENTS (continued) | | | 2015 | | 2016 | | | | | Balance | | Balance | | | Currency | | Original currency (in millions) | | Rupiah equivalent | | Original currency (in millions) | | Rupiah equivalent | | Time deposits (continued) | | | | | | | | | | | Third parties | | | | | | | | | | | PT Bank CIMB Niaga Tbk (“Bank CIMB Niagaâ€) | Rp | | - | | 1,605 | | - | | 2,025 | | PT Bank OCBC NISP Tbk (“OCBC NISPâ€) | Rp | | - | | 950 | | - | | 1,550 | | | US$ | | - | | - | | 10 | | 134 | | Bank Permata | Rp | | - | | 1,692 | | - | | 1,492 | | PT Bank Mega Tbk (“Bank Megaâ€) | Rp | | - | | 1,265 | | - | | 1,226 | | | US$ | | 70 | | 960 | | 14 | | 185 | | PT Bank UOB Indonesia (“UOBâ€) | Rp | | - | | 300 | | - | | 1,345 | | PT Bank Tabungan Pensiunan Nasional Tbk (“BTPNâ€) | Rp | | - | | 146 | | - | | 461 | | SCB | Rp | | - | | 550 | | - | | - | | | US$ | | - | | - | | 18 | | 242 | | | SGD | | - | | - | | 15 | | 139 | | Bank Muamalat | Rp | | - | | 142 | | - | | 305 | | Bank ANZ (“Bank ANZâ€) | Rp | | - | | - | | - | | 200 | | PT Bank Bukopin Tbk (“Bank Bukopinâ€) | Rp | | - | | 1,173 | | - | | 148 | | | US$ | | 55 | | 759 | | - | | - | | PTBank Pan Indonesia Tbk (“Bank Paninâ€) | Rp | | - | | 91 | | - | | - | | Others | Rp | | - | | 96 | | - | | 32 | | Sub-total | | | | | 9,729 | | | | 9,484 | | Total time deposits | | | | | 24,252 | | | | 25,593 | | Grand Total | | | | | 28,117 | | | | 29,767 | |
Interest rates per annum on time deposits are as follows: | 2012 | | 2013 | | Time deposits | | | | | Related parties | | | | | Rupiah | | | | | BRI | 2,883 | | 2,445 | | BNI | 1,511 | | 1,975 | | Bank Mandiri | 312 | | 1,271 | | BTN | 401 | | 375 | | PT Bank Pembangunan Daerah Jawa Barat dan Banten Tbk (“Bank Jabar”) | 170 | | 245 | | PT Bank Syariah Mandiri (“BSM”) | 23 | | 50 | | Others | 20 | | - | | | 5,320 | | 6,361 | | Foreign currencies | | | | | BRI | 1,966 | | 3,260 | | BNI | 112 | | 264 | | Bank Mandiri | 222 | | - | | | 2,300 | | 3,524 | | Sub-total | 7,620 | | 9,885 | | Third parties | | | | | Rupiah | | | | | PT Bank Central Asia Tbk (“BCA”) | - | | 599 | | PT Bank Mega Tbk (“Bank Mega”) | 335 | | 275 | | PT Bank Muamalat Indonesia Tbk | 153 | | 150 | | PT Bank Yudha Bhakti | - | | 145 | | PT Bank Tabungan Pensiunan Nasional Tbk | 167 | | 136 | | PT Bank Internasional Indonesia Tbk (“BII”) | 120 | | 126 | | PT Bank CIMB Niaga Tbk (”Bank CIMB Niaga”) | 225 | | 83 | | PT Bank Ekonomi Raharja Tbk (“Bank Ekonomi”) | - | | 73 | | PT Bank Pan Indonesia Tbk | 100 | | 70 | | PT Bank Bukopin Tbk (“Bank Bukopin”) | 160 | | 65 | | PT Bank OCBC NISP Tbk (“OCBC NISP”) | 400 | | - | | Citibank N.A. (“Citibank”) | 400 | | - | | PT Bank Danamon Indonesia Tbk (“Bank Danamon”) | 61 | | - | | PT Bank UOB Indonesia (“Bank UOB”) | 60 | | - | | Others (each below Rp50 billion) | 46 | | 102 | | | 2,227 | | 1,824 | | Foreign currencies | | | | | OCBC NISP | 517 | | 244 | | SCB | 804 | | - | | | 1,321 | | 244 | | Sub-total | 3,548 | | 2,068 | | Total time deposits | 11,168 | | 11,953 | | Grand Total | 13,118 | | 14,696 | |
|
| 2015 | | F-43
PERUSAHAAN PERSEROAN (PERSERO)2016
| PT TELEKOMUNIKASI INDONESIA Tbk AND SUBSIDIARIES
| NOTES TO THE CONSOLIDATED FINANCIAL STATEMENTS
| As of January 1, 2012 (Restated), December 31, 2012 (Restated) and December 31, 2013
| and for the years ended December 31, 2011 (Restated), 2012 (Restated) and 2013
| (Figures in tables are presented in billions of rupiah, unless otherwise stated)
| |
Rupiah | | Tabel of Content3.75%-10.50%
| | 5. CASH AND CASH EQUIVALENTS (continued)3.20%-10.00%
| | Interest rates per annum on time deposits are as follows:Foreign currency
| | 2012 | | 2013 | | Rupiah | 2.25% - 8.50% | | 1.00% - 11.50% | | Foreign currencies | 0.05% - 3.50% | | 0.03% - 3.00% | |
| 0.10%-3.00% | | The related parties in which the Group places its funds are state-owned banks. The Group placed a majority of its cash and cash equivalents in these banks because they have the most extensive branch networks in Indonesia and are considered to be financially sound banks, as they are owned by the State.0.10%-2.00%
| Refer to Note 35 for details of related party transactions.
6. OTHER CURRENT FINANCIAL ASSETS
| 2012 | | 2013 | | Time deposits | | | | | Related parties | | | | | BRI | 1,650 | | 1,000 | | Others | - | | 22 | | Sub-total | 1,650 | | 1,022 | | Third parties | | | | | SCB | 1,350 | | 1,859 | | BankCIMB Niaga | - | | 1,800 | | OCBC NISP | 1,000 | | 1,600 | | Others | - | | 7 | | Sub-total | 2,350 | | 5,266 | | Total time deposits | 4,000 | | 6,288 | | Available-for-sale financial assets | | | | | Related parties | | | | | Government | 123 | | 133 | | State-owned enterprises | 68 | | 74 | | PT Bahana Securities (“Bahana”) | 48 | | - | | Others | 19 | | 17 | | Sub-total | 258 | | 224 | | Third parties | 52 | | 48 | | Total available-for-sale financial assets | 310 | | 272 | | Derivative asset - Put Option | - | | 297 | | Others | 28 | | 15 | | Total | 4,338 | | 6,872 | |
| |
The related parties in whichthe Group places its funds are state-owned banks. The Group placed the majority of its cash and cash equivalents in these banks because they have the most extensive branch networks in Indonesia and are considered to be financially sound banks, as they are owned by theState. Refer to Note 31 for details of related party transactions. F-37
PERUSAHAAN PERSEROAN (PERSERO) PT TELEKOMUNIKASI INDONESIA Tbk AND SUBSIDIARIES NOTES TO THE CONSOLIDATED FINANCIAL STATEMENTS As of December 31, 2015 and 2016 and for the Years Ended December 31, 2014, 2015 and 2016 (Figures in tables are expressedin billions ofRupiah, unless otherwise stated)
Table of Content
5. OTHER CURRENT FINANCIAL ASSETS
The breakdown of other current financial assets is as follows:
| | | 2015 | | 2016 | | | | | Balance | | Balance | | | Currency | | Original currency (in millions) | | Rupiah equivalent | | Original currency (in millions) | | Rupiah equivalent | | Time deposits | | | | | | | | | | | Related parties | | | | | | | | | | | BNI | Rp | | - | | - | | - | | 63 | | Bank Mandiri | US$ | | 20 | | 278 | | - | | - | | Third parties | | | | | | | | | | | UOB | US$ | | - | | - | | 1 | | 13 | | SCB | US$ | | 1 | | 11 | | - | | - | | Total time deposits | | | | | 289 | | | | 76 | | | | | | | | | | | | | Available-for-sale financial assets | | | | | | | | | | | Related parties | | | | | | | | | | | PT Bahana TCW Investment Management (â€Bahana TCWâ€) | Rp | | - | | 55 | | - | | 559 | | PT Mandiri Manajemen Investasi | Rp | | - | | - | | - | | 500 | | State-owned enterprises | US$ | | 4 | | 59 | | 4 | | 55 | | Government | US$ | | 2 | | 29 | | 2 | | 27 | | Others | Rp | | - | | 17 | | - | | 17 | | Total available-for-sale financial assets | | | | | 160 | | | | 1,158 | | | | | | | | | | | | | Escrow accounts | Rp | | - | | 2,121 | | - | | 112 | | | US$ | | 3 | | 41 | | 2 | | 22 | | Others | Rp | | - | | 192 | | - | | 98 | | | US$ | | 0 | | 1 | | - | | - | | | AUD | | 1 | | 14 | | 0 | | 5 | | Total | | | | | 2,818 | | | | 1,471 | |
As of December 31, 2012 and 2013, time deposits denominated in foreign currency amounted to Rp nil and Rp59 billion, respectively.
The time depositshavematurities of more than three months but not more than one year, with interest rates as follows: | 2012
|
| 2013 | | 2015 | | 2016 | | Rupiah | | - | | 5.75%-6.00% | | Foreign currency | | 0.85%-0.88% | | 0.58%-1.64% | |
Refer to Note 31 for details of related party transactions. 6. TRADE AND OTHER RECEIVABLES
The breakdown of trade and other receivables is as follows:
| 2015 | | 2016 | | Trade receivables | 10,565 | | 10,353 | | Provision for impairment of receivables | (3,048 | ) | (2,990 | ) | Net | 7,517 | | 7,363 | | Other receivables | 358 | | 542 | | Provision for impairment of receivables | (3 | ) | (5 | ) | Net | 355 | | 537 | | Totaltrade and otherreceivables | 7,872 | | 7,900 | |
F-38
PERUSAHAAN PERSEROAN (PERSERO) PT TELEKOMUNIKASI INDONESIA Tbk AND SUBSIDIARIES NOTES TO THE CONSOLIDATED FINANCIAL STATEMENTS As of December 31, 2015 and 2016 and for the Years Ended December 31, 2014, 2015 and 2016 (Figures in tables are expressedin billions ofRupiah, unless otherwise stated) Table of Content
6. TRADE and OTHER RECEIVABLES (continued)
Trade receivables arise from services provided to both retail and non-retail customers, with details as follows: a. By debtor (i)Related parties | 2015 | | 2016 | | Government agencies | 1,181 | | 676 | | Indonusa | 342 | | 431 | | PT Indosat Tbk (“Indosatâ€) | 361 | | 370 | | State-owned enterprises | 270 | | 151 | | Others | 363 | | 348 | | Total | 2,517 | | 1,976 | | Provision for impairment of receivables | (920 | ) | (488 | ) | Net | 1,597 | | 1,488 | |
(ii)Third parties | 2015 | | 2016 | | Individual and business subscribers | 6,854 | | 7,125 | | Overseas international carriers | 1,194 | | 1,252 | | Total | 8,048 | | 8,377 | | Provision for impairment of receivables | (2,128 | ) | (2,502 | ) | Net | 5,920 | | 5,875 | |
b. By age (i)Related parties | 2015 | | 2016 | | Up to3 months | 1,283 | | 1,065 | | 3 to6 months | 128 | | 100 | | More than6 months | 1,106 | | 811 | | Total | 2,517 | | 1,976 | | Provision for impairment of receivables | (920 | ) | (488 | ) | Net | 1,597 | | 1,488 | |
F-39
PERUSAHAAN PERSEROAN (PERSERO) PT TELEKOMUNIKASI INDONESIA Tbk AND SUBSIDIARIES NOTES TO THE CONSOLIDATED FINANCIAL STATEMENTS As of December 31, 2015 and 2016 and for the Years Ended December 31, 2014, 2015 and 2016 (Figures in tables are expressedin billions ofRupiah, unless otherwise stated) Table of Content
6.TRADE AND OTHER RECEIVABLES(continued) b. By age (continued)
(ii) Third parties
| 2015 | | 2016 | | Up to3 months | 5,305 | | 5,191 | | 3 to6 months | 455 | | 597 | | More than6 months | 2,288 | | 2,589 | | Total | 8,048 | | 8,377 | | Provision for impairment of receivables | (2,128 | ) | (2,502 | ) | Net | 5,920 | | 5,875 | |
(iii)Aging of total trade receivables | 2015 | | 2016 | | | Gross | | Provision for impairment of receivables | | Gross | | Provision for impairment of receivables | | Not past due | 4,353 | | 266 | | 4,535 | | 177 | | Past due up to 3 months | 2,235 | | 202 | | 1,721 | | 401 | | Past due more than 3 to 6 months | 583 | | 216 | | 697 | | 495 | | Past due more than 6 months | 3,394 | | 2,364 | | 3,400 | | 1,917 | | Total | 10,565 | | 3,048 | | 10,353 | | 2,990 | |
The Group has made provision for impairment of trade receivables based on the collective assessment of historical impairment rates and individual assessment of its customers’ credit history. The Group does not apply a distinction between related party and third party receivables in assessing amounts past due. As of December 31, 2015 and 2016, the carrying amounts of trade receivables of the Group considered past due but not impaired amounted to Rp3,430 billion and Rp3,005 billion, respectively. Management believes that receivables past due but not impaired, along with trade receivables that are neither past due nor impaired, are due from customers with good credit history and are expected to be recoverable. F-40
PERUSAHAAN PERSEROAN (PERSERO) PT TELEKOMUNIKASI INDONESIA Tbk AND SUBSIDIARIES NOTES TO THE CONSOLIDATED FINANCIAL STATEMENTS As of December 31, 2015 and 2016 and for the Years Ended December 31, 2014, 2015 and 2016 (Figures in tables are expressedin billions ofRupiah, unless otherwise stated) Table of Content
6. TRADE AND OTHER RECEIVABLES(continued) c. By currency (i) Related parties
| 2015 | | 2016 | | Rupiah | 2,493 | | 1,976 | | U.S. dollar | 24 | | 0 | | Others | - | | 0 | | Total | 2,517 | | 1,976 | | Provision for impairment of receivables | (920 | ) | (488 | ) | Net | 1,597 | | 1,488 | |
(ii)Third parties | 2015 | | 2016 | | Rupiah | 6,596 | | 6,889 | | U.S. dollar | 1,435 | | 1,437 | | Australian dollar | 14 | | 40 | | Others | 3 | | 11 | | Total | 8,048 | | 8,377 | | Provision for impairment of receivables | (2,128 | ) | (2,502 | ) | Net | 5,920 | | 5,875 | |
d. Movements in the provision for impairment of receivables | 2015 | | 2016 | | Beginning balance | 3,096 | | 3,048 | | Provision recognized during the year (Note 27) | 1,010 | | 743 | | Receivables written off | (1,058 | ) | (801 | ) | Ending balance | 3,048 | | 2,990 | |
The receivables written off relate to bothrelated party andthird partytradereceivables. Management believes that the provision for impairment oftradereceivables is adequate to cover losses on uncollectible trade receivables. As of December 31, 2016, certain trade receivables of the subsidiaries amounting to Rp4,550billion have been pledged as collateral under lending agreements (Notes 16, 17b and 17c). Refer to Note 31 for details of related party transactions. F-41
PERUSAHAAN PERSEROAN (PERSERO) PT TELEKOMUNIKASI INDONESIA Tbk AND SUBSIDIARIES NOTES TO THE CONSOLIDATED FINANCIAL STATEMENTS As of December 31, 2015 and 2016 and for the Years Ended December 31, 2014, 2015 and 2016 (Figures in tables are expressedin billions ofRupiah, unless otherwise stated) Table of Content
7. INVENTORIES
The breakdown of inventories is as follows:
| 2015 | | 2016 | | Components | 342 | | 299 | | SIM cards andblankprepaid vouchers | 131 | | 168 | | Others | 96 | | 164 | | Total | 569 | | 631 | | Provision for obsolescence | | | | | Components | (14 | ) | (18 | ) | SIM cards andblankprepaid vouchers | (27 | ) | (29 | ) | Others | 0 | | 0 | | Total | (41 | ) | (47 | ) | Net | 528 | | 584 | |
Movements in the provision for obsolescence are as follows: | 2015 | | 2016 | | Beginning balance | 43 | | 41 | | Provision recognized during the year | 2 | | 11 | | Inventory writtenoff | (4 | ) | (5 | ) | Ending balance | 41 | | 47 | |
The inventories recognized as expense and included in operations, maintenance, and telecommunication service expenses as ofDecember 31, 2014, 2015 and 2016 amounted to Rp1,031 billion,Rp1,937 billion and Rp2,105 billion, respectively (Note 26). Management believes that the provision is adequate to cover losses from decline in inventory value due to obsolescence. Certain inventories of the subsidiaries amounting to Rp256 billion have been pledged as collateral under lending agreements (Notes 16 and 17). As of December 31, 2015 and 2016, modules and components held by the Group with book value amounting toRp219 billion and Rp199 billion, respectively, have been insured against fire, theft and other specific risks. Modules are recorded as part of property and equipment. Total sum insured as of December 31, 2015 and 2016 amounted to Rp291 billion and Rp220 billion, respectively. Management believes that the insurance coverage is adequate to cover potential losses of inventories arising from the insured risks.
F-42
PERUSAHAAN PERSEROAN (PERSERO) PT TELEKOMUNIKASI INDONESIA Tbk AND SUBSIDIARIES NOTES TO THE CONSOLIDATED FINANCIAL STATEMENTS As of December 31, 2015 and 2016 and for the Years Ended December 31, 2014, 2015 and 2016 (Figures in tables are expressedin billions ofRupiah, unless otherwise stated) Table of Content
8. ADVANCES AND PREPAID EXPENSES
The breakdown of advances and prepaid expenses is as follows:
| 2015 | | 2016 | | Frequency license (Notes 33c.i and 33c.ii) | 2,935 | | 3,056 | | Prepaid rental | 1,055 | | 1,234 | | Advances | 729 | | 394 | | Salaries | 347 | | 229 | | Advance to employee | 28 | | 32 | | Others | 745 | | 301 | | Total | 5,839 | | 5,246 | |
Refer to Note 31 for details of related party transactions. 9. LONG-TERM INVESTMENTS
The details of long-term investments as of December 31, 2015 are as follows: | 2015 | | | Percentage of ownership | | Beginning balance | | Additions (Deduction) | | Share of net (loss) profit of associated company | | Dividend | | Share of other comprehensive income of associated company | | Ending balance | | Long-term investments in associated companies: | | | | | | | | | | | | | | | Tiphonea | 24.65 | | 1,392 | | - | | 32 | | (18 | ) | (2 | ) | 1,404 | | Indonusab | 20.00 | | 221 | | - | | - | | - | | - | | 221 | | PT Teltranet Aplikasi Solusi (“Teltranetâ€)c | 51.00 | | 52 | | 43 | | (24 | ) | - | | - | | 71 | | PT Melon Indonesia (“Melonâ€)d | 51.00 | | 43 | | - | | 7 | | - | | - | | 50 | | PT Integrasi Logistik Cipta Solusi(“ILCSâ€)e | 49.00 | | 38 | | - | | 2 | | - | | - | | 40 | | Telin Malaysiaf | 49.00 | | 6 | | 19 | | (19 | ) | - | | (0 | ) | 6 | | CSMg | 25.00 | | - | | - | | - | | - | | - | | - | | Sub-total | | | 1,752 | | 62 | | (2 | ) | (18 | ) | (2 | ) | 1,792 | | Other long-term investments | | | 15 | | - | | - | | - | | - | | 15 | | Total long-term investments | | | 1,767 | | 62 | | (2 | ) | (18 | ) | (2 | ) | 1,807 | |
F-43
PERUSAHAAN PERSEROAN (PERSERO) PT TELEKOMUNIKASI INDONESIA Tbk AND SUBSIDIARIES NOTES TO THE CONSOLIDATED FINANCIAL STATEMENTS As of December 31, 2015 and 2016 and for the Years Ended December 31, 2014, 2015 and 2016 (Figures in tables are expressedin billions ofRupiah, unless otherwise stated) Table of Content
9. LONG-TERM INVESTMENTS (continued) Summarized financial information of the Group’s investments accounted forundertheequity method for 2015: | Tiphone | | Indonusa | | Teltranet | | Melon | | ILCS | | Telin Malaysia | | CSM | | Statements of financial position | | | | | | | | | | | | | | | Current assets | 6,539 | | 501 | | 117 | | 131 | | 105 | | 18 | | 185 | | Non-current assets | 1,261 | | 333 | | 58 | | 27 | | 32 | | 10 | | 1,221 | | Current liabilities | (1,657 | ) | (535 | ) | (35 | ) | (57 | ) | (54 | ) | (17 | ) | (731 | ) | Non-current liabilities | (3,073 | ) | (568 | ) | (1 | ) | (2 | ) | (1 | ) | - | | (1,535 | ) | Equity (deficit) | 3,070 | | (269 | ) | 139 | | 99 | | 82 | | 11 | | (860 | ) | Statements of profit or loss and other comprehensive income | | | | | | | | | | | | | | | Revenues | 22,060 | | 599 | | 0 | | 201 | | 111 | | 6 | | 164 | | Cost of revenues and operating expenses | (21,295 | ) | (559 | ) | (72 | ) | (184 | ) | (108 | ) | (40 | ) | (364 | ) | Other income (expenses) including finance costs - net | (265 | ) | (82 | ) | 9 | | 2 | | (0 | ) | (3 | ) | (74 | ) | Profit (loss) before tax | 500 | | (42 | ) | (63 | ) | 19 | | 3 | | (37 | ) | (274 | ) | Income tax benefit (expense) | (130 | ) | - | | 16 | | (5 | ) | (0 | ) | - | | - | | Profit (loss) for the year | 370 | | (42 | ) | (47 | ) | 14 | | 3 | | (37 | ) | (274 | ) | Other comprehensiveloss | (7 | ) | - | | - | | 0 | | 0 | | - | | - | | Total comprehensive income(loss)for the year | 363 | | (42 | ) | (47 | ) | 14 | | 3 | | (37 | ) | (274 | ) |
The details of long-term investments as of December 31, 2016 are as follows:
| 2016 | | | Percentageof ownership | | Beginning balance | | Additions (Deductions) | | Share of net (loss) profit of associated company | | Dividend | | Share of other comprehensive income of associated company | | Ending balance | | Long-term investments in associated companies: | | | | | | | | | | | | | | | Tiphonea | 24.43 | | 1,404 | | - | | 108 | | (23 | ) | (1 | ) | 1,488 | | Indonusab | 20.00 | | 221 | | - | | - | | - | | - | | 221 | | Teltranetc | 51.00 | | 71 | | - | | (33 | ) | - | | - | | 38 | | Melon d | 51.00 | | 50 | | (67 | ) | 17 | | - | | - | | - | | ILCS e | 49.00 | | 40 | | - | | 2 | | - | | - | | 42 | | Telin Malaysiaf | 49.00 | | 6 | | - | | (6 | ) | - | | - | | - | | CSMg | 25.00 | | - | | - | | - | | - | | - | | - | | Sub-total | | | 1,792 | | (67 | ) | 88 | | (23 | ) | (1 | ) | 1,789 | | Other long-term investments | | | 15 | | 43 | | - | | - | | - | | 58 | | Totallong-term investments | | | 1,807 | | (24 | ) | 88 | | (23 | ) | (1 | ) | 1,847 | |
F-44
PERUSAHAAN PERSEROAN (PERSERO) PT TELEKOMUNIKASI INDONESIA Tbk AND SUBSIDIARIES NOTES TO THE CONSOLIDATED FINANCIAL STATEMENTS As of December 31, 2015 and 2016 and for the Years Ended December 31, 2014, 2015 and 2016 (Figures in tables are expressedin billions ofRupiah, unless otherwise stated) Table of Content
9. LONG-TERM INVESTMENTS (continued) Summarized financial information of the Group’s investments accounted forundertheequity method for 2016: | Tiphone | | Indonusa | | Teltranet | | ILCS | | Telin Malaysia | | CSM | | Statements of financial position | | | | | | | | | | | | | Current assets | 7,709 | | 170 | | 66 | | 131 | | 9 | | 161 | | Non-current assets | 743 | | 444 | | 88 | | 29 | | 10 | | 761 | | Current liabilities | (1,248 | ) | (532 | ) | (78 | ) | (73 | ) | (35 | ) | (594 | ) | Non-current liabilities | (3,762 | ) | (405 | ) | (2 | ) | (1 | ) | (6 | ) | (1,206 | ) | Equity (deficit) | 3,442 | | (323 | ) | 74 | | 86 | | (22 | ) | (878) | | Statements of profit or loss and other comprehensiveincome | | | | | | | | | | | | | Revenues | 27,310 | | 605 | | 66 | | 116 | | 8 | | 131 | | Cost of revenues and operating expenses | (26,445 | ) | (583 | ) | (149 | ) | (112 | ) | (43 | ) | (221 | ) | Other expenses including finance costs - net | (231 | ) | (17 | ) | (3 | ) | 0 | | - | | (88 | ) | Profit (loss) before tax | 634 | | 5 | | (86 | ) | 4 | | (35 | ) | (178 | ) | Income tax benefit (expense) | (166 | ) | (33 | ) | 21 | | 0 | | - | | - | | Profit (loss) for the year | 468 | | (28 | ) | (65 | ) | 4 | | (35 | ) | (178 | ) | Other comprehensive income (loss) | (5 | ) | 7 | | (0 | ) | (0 | ) | - | | - | | Total comprehensive income(loss)for the year | 463 | | (21 | ) | (65 | ) | 4 | | (35 | ) | (178 | ) |
The summarized financial information of associated companies above was prepared under Indonesian Financial Accounting Standards. a Tiphonewas established on June 25, 2008 asPTTiphone Mobile Indonesia Tbk. Tiphoneis engaged inthetelecommunication equipment business, such as forcelullar phone including spare parts, accessories, pulsereload vouchers, repair service and content provider through its subsidiaries. On September 18, 2014, the Company through PINS acquired 25% ownership in Tiphonefor Rp1,395 billion. As ofDecember 31,2016, the share percentage of ownership was diluted to 24.43%, due to warrant exercise by the other shareholder. As ofDecember 31, 2015 and 2016, the fair value oftheinvestment amounted to Rp1,351billion and Rp1,500billion, respectively. The fair value was calculated by multiplyingthenumber of shares by the published price quotation as ofDecember 31, 2015 and 2016 amounting to Rp770 and Rp855per share, respectively. Reconciliation of financial information to the carrying amount of long-term investment in Tiphoneas of December 31, 2015 and 2016,is as follows: | 2015 | | 2016 | | Assets | 7,800 | | 8,452 | | Liabilities | (4,730 | ) | (5,010 | ) | Net assets | 3,070 | | 3,442 | | Group’s proportionate share of net assets (24.65% in 2015 and24.43% in 2016) | 757 | | 841 | | Goodwill | 647 | | 647 | | Carrying amount of long-term investment | 1,404 | | 1,488 | |
b Indonusa had been a subsidiary of the Company until 2013 when the Company disposed 80% of its interest in Indonusa.On May 14, 2014, based on the Circular Resolution of the Stockholders of Indonusa as covered by notarial deed No. 57 dated April 23, 2014 of FX Budi Santoso Isbandi, S.H., which was approved by the MoLHR in its Letter No. AHU-02078.40.20.2014 dated April 29, 2014, Indonusa’s stockholders approved an increase in its issued andfullypaid capitalby Rp80 billion. The Company waived its right to own the new shares issued and transferred it to Metra and, asaresult, Metra’s ownership in Indonusa increased to 4.33%.
F-45
PERUSAHAAN PERSEROAN (PERSERO) PT TELEKOMUNIKASI INDONESIA Tbk AND SUBSIDIARIES NOTES TO THE CONSOLIDATED FINANCIAL STATEMENTS As of December 31, 2015 and 2016 and for the Years Ended December 31, 2014, 2015 and 2016 (Figures in tables are expressedin billions ofRupiah, unless otherwise stated) Table of Content
9. LONG-TERM INVESTMENTS (continued)
c Investment in Teltranetis accounted for under the equity method, and is covered by anagreement between Metra and Telstra Holding Singapore Pte. Ltd.dated August 29, 2014.Teltranetis engaged in communicationsystem services. Metradoes not have controlas it does not determine thefinancial and operating policies of Teltranet. d In 2015, Metra does not have control over Melon due to the existence of substantive participating rights held by SK Planet Co., the other stockholder, over the financial and operating policies of Melon. In 2016, the Group purchased 49% stake in Melon from SK Planet Co. through Metranet, thus Melon became a consolidated subsidiary (Note 1d). e ILCS is engaged in providing E-trade logistic services and other related services. f Telin Malaysia is engaged in telecommunication services in Malaysia. The unrecognized share of losses of Telin Malaysia for the year ended December 31, 2016 is Rp2 billion. g CSM is engaged in providing Very Small Aperture Terminal (“VSATâ€), network application services and consulting services on telecommunications technology and related facilities. The unrecognized share of losses of CSM for theyears endedDecember 31,2015 and 2016 are Rp215 billion and Rp219 billion,respectively. 10. PROPERTY AND EQUIPMENT The details of property and equipment are as follows: | December 31, 2014 | | Additions | | Deductions | | Reclassifications/ Translations | | December 31, 2015 | | At cost: | | | | | | | | | | | Land rights | 1,184 | | 86 | | - | | - | | 1,270 | | Buildings | 4,571 | | 263 | | - | | 1,199 | | 6,033 | | Leasehold improvements | 943 | | 41 | | (151 | ) | 203 | | 1,036 | | Switching equipment | 19,257 | | 126 | | (66 | ) | 555 | | 19,872 | | Telegraph, telex and data communication equipment | 6 | | 870 | | - | | - | | 876 | | Transmission installation and equipment | 113,457 | | 4,538 | | (2,520 | ) | 9,514 | | 124,989 | | Satellite, earth station and equipment | 7,927 | | 93 | | (1 | ) | 127 | | 8,146 | | Cable network | 33,313 | | 4,458 | | (227 | ) | 542 | | 38,086 | | Power supply | 12,776 | | 471 | | (92 | ) | 757 | | 13,912 | | Data processing equipment | 10,344 | | 408 | | (97 | ) | 759 | | 11,414 | | Other telecommunications peripherals | 604 | | 37 | | - | | (7 | ) | 634 | | Office equipment | 972 | | 202 | | (46 | ) | 7 | | 1,135 | | Vehicles | 390 | | 185 | | (2 | ) | (4 | ) | 569 | | CPE assets | 22 | | - | | - | | - | | 22 | | Other equipment | 99 | | - | | - | | - | | 99 | | Property under construction | 3,853 | | 14,623 | | - | | (13,896 | ) | 4,580 | | Total | 209,718 | | 26,401 | | (3,202 | ) | (244 | ) | 232,673 | |
| December 31, 2014 | | Additions | | Deductions | | Reclassifications/ Translations | | December 31, 2015 | | Accumulated depreciation and impairment losses: | | | | | | | | | | | Land rights | 207 | | 38 | | - | | - | | 245 | | Buildings | 1,954 | | 183 | | - | | 4 | | 2,141 | | Leasehold improvements | 669 | | 105 | | (151 | ) | - | | 623 | | Switching equipment | 13,897 | | 1,443 | | (62 | ) | (17 | ) | 15,261 | | Telegraph, telex and data communication equipment | 4 | | 0 | | - | | - | | 4 | | Transmission installation and equipment | 56,454 | | 11,423 | | (2,492 | ) | 14 | | 65,399 | | Satellite, earth station and equipment | 6,099 | | 607 | | (1 | ) | 1 | | 6,706 | | Cable network | 18,933 | | 1,338 | | (225 | ) | (340 | ) | 19,706 | | Power supply | 7,978 | | 1,268 | | (85 | ) | (29 | ) | 9,132 | | Data processing equipment | 7,703 | | 953 | | (97 | ) | (3 | ) | 8,556 | | Other telecommunications peripherals | 323 | | 70 | | - | | (7 | ) | 386 | | Office equipment | 665 | | 152 | | (45 | ) | (8 | ) | 764 | | Vehicles | 118 | | 65 | | (1 | ) | (3 | ) | 179 | | CPE assets | 15 | | 2 | | - | | - | | 17 | | Other equipment | 97 | | 2 | | - | | - | | 99 | | Total | 115,116 | | 17,649 | | (3,159 | ) | (388 | ) | 129,218 | | Net Book Value | 94,602 | | | | | | | | 103,455 | |
F-46
PERUSAHAAN PERSEROAN (PERSERO) PT TELEKOMUNIKASI INDONESIA Tbk AND SUBSIDIARIES NOTES TO THE CONSOLIDATED FINANCIAL STATEMENTS As of December 31, 2015 and 2016 and for the Years Ended December 31, 2014, 2015 and 2016 (Figures in tables are expressedin billions ofRupiah, unless otherwise stated) Table of Content
10. PROPERTY AND EQUIPMENT (continued)
| December 31, 2015 | | Business acquisition | | Additions | | Deductions | | Reclassifications/ Translations | | December 31, 2016 | | At cost: | | | | | | | | | | | | | Land rights | 1,270 | | 89 | | 59 | | (1 | ) | - | | 1,417 | | Buildings | 6,033 | | 10 | | 311 | | (3 | ) | 1,486 | | 7,837 | | Leasehold improvements | 1,036 | | - | | 13 | | (37 | ) | 104 | | 1,116 | | Switching equipment | 19,872 | | - | | 218 | | (160 | ) | 609 | | 20,539 | | Telegraph, telex and data communication equipment | 876 | | - | | 751 | | (41 | ) | - | | 1,586 | | Transmission installation and equipment | 124,989 | | - | | 2,832 | | (12,134 | ) | 11,221 | | 126,908 | | Satellite, earth station and equipment | 8,146 | | - | | 80 | | - | | 219 | | 8,445 | | Cable network | 38,086 | | - | | 6,746 | | (302 | ) | 460 | | 44,990 | | Power supply | 13,912 | | - | | 286 | | (77 | ) | 1,116 | | 15,237 | | Data processing equipment | 11,414 | | 12 | | 395 | | (138 | ) | 916 | | 12,599 | | Other telecommunications peripherals | 634 | | - | | 73 | | - | | (5 | ) | 702 | | Office equipment | 1,135 | | 5 | | 142 | | (12 | ) | 259 | | 1,529 | | Vehicles | 569 | | - | | 123 | | (169 | ) | (1 | ) | 522 | | CPE assets | 22 | | - | | - | | - | | - | | 22 | | Other equipment | 99 | | - | | 1 | | - | | - | | 100 | | Property under construction | 4,580 | | - | | 17,169 | | - | | (17,199 | ) | 4,550 | | Total | 232,673 | | 116 | | 29,199 | | (13,074 | ) | (815 | ) | 248,099 | |
| | December 31, 2015 | | Additions | | Deductions | | Reclassifications/ Translations | | December 31, 2016 | | Accumulated depreciation and impairment losses: | | | | | | | | | | | | Land rights | | 245 | | 24 | | (0 | ) | (1 | ) | 268 | | Buildings | | 2,141 | | 290 | | (2 | ) | 6 | | 2,435 | | Leasehold improvements | | 623 | | 106 | | (37 | ) | - | | 692 | | Switching equipment | | 15,261 | | 1,590 | | (160 | ) | (1 | ) | 16,690 | | Telegraph, telex and data communication equipment | | 4 | | 329 | | - | | - | | 333 | | Transmission installation and equipment | | 65,399 | | 10,499 | | (11,501 | ) | (32 | ) | 64,365 | | Satellite, earth station and equipment | | 6,706 | | 415 | | - | | (23 | ) | 7,098 | | Cable network | | 19,706 | | 1,545 | | (302 | ) | (455 | ) | 20,494 | | Power supply | | 9,132 | | 1,225 | | (70 | ) | (25 | ) | 10,262 | | Data processing equipment | | 8,556 | | 1,114 | | (118 | ) | (40 | ) | 9,512 | | Other telecommunications peripherals | | 386 | | 77 | | - | | (1 | ) | 462 | | Office equipment | | 764 | | 184 | | (11 | ) | 3 | | 940 | | Vehicles | | 179 | | 88 | | (66 | ) | (1 | ) | 200 | | CPE assets | | 17 | | 2 | | - | | - | | 19 | | Other equipment | | 99 | | - | | - | | - | | 99 | | Total | | 129,218 | | 17,488 | | (12,267 | ) | (570 | ) | 133,869 | | Net Book Value | | 103,455 | | | | | | | | 114,230 | |
Refer to Note 31 for details of related party transactions. a. Gain on disposal or sale of property and equipment | 2014 | | 2015 | | 2016 | | Proceeds from sale of property and equipment | 501 | | 733 | | 765 | | Netbookvalue | (62 | ) | (8 | ) | (152 | ) | Gain on disposal or sale of property and equipment | 439 | | 725 | | 613 | |
The gain on disposal or sale of property and equipment includes gain from disposal of the copper cable as part of the Company’s modernization program through Trade In/Trade Off method with PT Industri Telekomunikasi Indonesia (“INTIâ€) and PT LEN Industri(Persero)(“LENâ€). F-47
PERUSAHAAN PERSEROAN (PERSERO) PT TELEKOMUNIKASI INDONESIA Tbk AND SUBSIDIARIES NOTES TO THE CONSOLIDATED FINANCIAL STATEMENTS As of December 31, 2015 and 2016 and for the Years Ended December 31, 2014, 2015 and 2016 (Figures in tables are expressedin billions ofRupiah, unless otherwise stated) Table of Content
10.PROPERTY AND EQUIPMENT (continued)
b. Asset impairment (i)As of December 31, 2015 and 2016, the CGUs that independently generate cash inflows were fixed wireline, fixed wireless, cellular and others. In 2014, the Group decided to cease its fixed wireless business no later than December 14, 2015. The Company assessed the recoverable amount to be Rp549 billion and determined that the assets for fixed wireless CGU were further impaired by Rp805 billion. The recoverable amount has been determined based on VIU calculation using the most recent cash flows projection approved by management. The cash flows projection included cash inflows from the continuing use of the assets during the remaining service period and projected net cash flows to be received for the disposal of the assets for fixed wireless CGU at the end of service period. Projected net cash flows to be received for the disposal of the assets were determined based on cost approach, adjusted for physical, technological and economic obsolescence. Management applied a pre-tax discount rate of 13.5%derived from the Company’s post-tax weighted average cost of capital andbenchmarked to externally available data. In addition, management also applied technological and economic obsolescence rate of 30% based on the Company’s internal data,due to thelack of comparable market data because of the nature of the assets. Thedetermination of VIU calculation is most sensitive to the technological and economic obsolescence rate assumption. An increase in technological and economic obsolescence rate to 40% would result in a further impairment of Rp70 billion. Loss on impairment of assets is recognized as part of “Depreciation and Amortization†in the consolidatedstatements of profit or loss and other comprehensive income. In connection with the restructuring of fixed wireless business (Note 33c.ii), the Company acceleratedthe depreciation ofitsfixed wireless assets. As of December 31, 2015, all of the Company’s fixed wireless assets have been fully depreciated. In 2016, the Company derecognized its fixed wireless assets with cost and accumulated depreciation amounting to Rp5,203 billion, respectively. (ii)Management believes that there is no indication of impairment in the assets of other CGUs as of December 31, 2015 and 2016. c. Others (i)Interest capitalized to property under construction amountedto Rp127 billion, Rp328 billionand Rp444 billion for the years ended December 31, 2014, 2015 and 2016, respectively. The capitalization rate used to determine the amount of borrowing costs eligible for capitalization ranged from11% to18.31%,6.84% to 11% and from 10.20% to 11%for theyears ended December 31, 2014, 2015 and 2016, respectively. (ii)No foreign exchange loss was capitalized as part of property under construction for the years ended December 31, 2014, 2015 and 2016. F-48
PERUSAHAAN PERSEROAN (PERSERO) PT TELEKOMUNIKASI INDONESIA Tbk AND SUBSIDIARIES NOTES TO THE CONSOLIDATED FINANCIAL STATEMENTS As of December 31, 2015 and 2016 and for the Years Ended December 31, 2014, 2015 and 2016 (Figures in tables are expressedin billions ofRupiah, unless otherwise stated) Table of Content
10. PROPERTY AND EQUIPMENT (continued)
c. Others (continued) (iii)In 2015 and 2016, the Group received proceeds from the insurance claim onlost and broken property and equipment, with a total value of Rp119 billion and Rp77 billion, respectively, and were recorded as part of “Other Income†in the consolidated statements of profit or loss and other comprehensive income. In2015 and2016, the net carrying values ofthose assets of Rp35 billion and Rp19 billion, respectively, were chargedto the consolidated statements of profit or loss and other comprehensive income.
(iv)In 2016, Telkomsel decided to replace certain equipment units with net carrying amount of Rp528 billion, as part of its modernization program. Accordingly, Telkomsel accelerated the depreciation of such equipment units. The impact of the change was an increase in the depreciation expense for the year ended December 31, 2016 amounting to Rp489 billion. This modernization program will increase profit before income tax in 2017 amounting to Rp205 billion. In 2015, Telkomsel decided to replace certain equipment units with a net carrying amount of Rp1,967 billion, as part of its modernization program. Accordingly, Telkomsel accelerated the depreciation of such equipment units. The impact of the acceleration was an increase in depreciation expense for the years ended December 31, 2015, 2016, and 2017 amounting to Rp1,410 billion, Rp274 billion and Rp30 billion, respectively.This modernization program will decrease profit before income tax in 2016 and 2017 amounting to Rp274 billion andRp30 billion, respectively. (v)In 2015 and 2016, Telkomsel’s certain equipment units with net carrying amount ofRp5 billion and Rp636 billion were exchanged with equipment from NSN OY and PT Huawei Tech Investment (“Huaweiâ€) and Ericsson AB and Huawei, respectively. As of December 31, 2016, Telkomsel’s equipment units with net carrying amount of Rp3 billion are going to be exchanged with equipment fromEricsson AB and Huaweiand, therefore, these equipment units werereclassified as assets held for sale in the consolidated statements of financial position. (vi)The Group owns several pieces of land located throughout Indonesia with Building Use Rights (“Hak Guna Bangunan†or “HGBâ€) for a period of 10-45 years which will expire between 2017 and 2053. Management believes that there will be no issue in obtaining the extension of the land rights when they expire. (vii)As ofDecember 31, 2016, the Group’s property and equipment excluding land rights, with net carrying amount of Rp105,144billion were insured against fire, theft, earthquake and other specified risks,including business interruption, under blanket policies totallingRp11,861billion, US$1,236million,HKD3 million andSGD40 million.Management believes that the insurance coverage is adequate to cover potential losses from the insured risks. (viii)As ofDecember 31, 2016, the percentage of completion of property under construction was around58.15% of the total contract value, with estimated dates of completion betweenJanuary 2017and December 2018. The balance of property under construction mainly consists of buildings, transmission installation and equipment, cable network and power supply. Management believes that there is no impediment to the completion of the construction in progress. F-49
PERUSAHAAN PERSEROAN (PERSERO) PT TELEKOMUNIKASI INDONESIA Tbk AND SUBSIDIARIES NOTES TO THE CONSOLIDATED FINANCIAL STATEMENTS As of December 31, 2015 and 2016 and for the Years Ended December 31, 2014, 2015 and 2016 (Figures in tables are expressedin billions ofRupiah, unless otherwise stated) Table of Content
10. PROPERTY AND EQUIPMENT (continued) c. Others (continued) (ix)All assets owned by the Company have been pledged as collateral for bonds and certain bank loans (Notes 17b.i, 17b.ii and 17c). Certain property and equipment of the Company’s subsidiaries with gross carrying value amounting to Rp11,385billion have been pledged as collateral under lending agreements (Notes 16 and 17). (x)As of December 31, 2016, the cost of fully depreciated property and equipment of the Group that are still used in operations amounted to Rp54,993 billion. The Group is currently performing modernization of network assets to replace the fully depreciated property and equipment. (xi)The Company and Telkomsel entered into several agreements with tower providers to lease spaces in telecommunication towers (slot) and sites of the towers for a period of 10 years. The Company and Telkomsel may extend the lease period based on mutual agreement with the relevant parties. In addition, the Group also has lease commitments for transmission installation and equipment, data processing equipment, office equipment, vehicles and CPE assets with the option to purchase certain leased assets at the end of the lease terms. Future minimum lease payments required for assets under finance leases are as follows: Years | 2015 | | 2016 | | 2016 | 1,027 | | - | | 2017 | 991 | | 987 | | 2018 | 888 | | 892 | | 2019 | 800 | | 816 | | 2020 | 766 | | 771 | | 2021 | 724 | | 740 | | Thereafter | 873 | | 954 | | Total minimum lease payments | 6,069 | | 5,160 | | Interest | (1,489 | ) | (1,150 | ) | Net present value of minimum lease payments | 4,580 | | 4,010 | | Current maturities (Note 16b) | (641 | ) | (658 | ) | Long-term portion (Note 17) | 3,939 | | 3,352 | |
The details of obligations under finance leasesas of December 31, 2015 and 2016 are as follows: | 2015 | | 2016 | | PT Tower Bersama Infrastructure Tbk | 1,589 | | 1,465 | | PT Profesional Telekomunikasi Indonesia | 1,460 | | 1,295 | | PT Solusi Tunas Pratama | 340 | | 241 | | PT Putra Arga Binangun | 227 | | 217 | | PT Bali Towerindo Sentra | 132 | | 112 | | PT Naragita Dinamika Komunika | 84 | | 5 | | Others (each below Rp75 billion) | 748 | | 675 | | Total | 4,580 | | 4,010 | |
F-50
PERUSAHAAN PERSEROAN (PERSERO) PT TELEKOMUNIKASI INDONESIA Tbk AND SUBSIDIARIES NOTES TO THE CONSOLIDATED FINANCIAL STATEMENTS As of December 31, 2015 and 2016 and for the Years Ended December 31, 2014, 2015 and 2016 (Figures in tables are expressedin billions ofRupiah, unless otherwise stated) Table of Content
11.ADVANCES AND OTHER NON-CURRENT ASSETS The breakdown of advances and other non-current assets is as follows: | 2015 | | 2016 | | Advances for purchases of property and equipment | 3,653 | | 5,432 | | Prepaid rental - net of current portion (Note 8) | 2,190 | | 2,471 | | Prepaid other taxes - net of current portion (Note 28) | 369 | | 2,164 | | Prepaid income taxes - net of current portion(Note28) | 704 | | 492 | | Deferred charges | 444 | | 387 | | Frequency license - net of current portion (Note 8) | 404 | | 320 | | Security deposit | 96 | | 144 | | Restricted cash | 111 | | 31 | | Others | 195 | | 67 | | Total | 8,166 | | 11,508 | |
Prepaid rentalcoversrent ofleased line and telecommunication equipment and land and building under lease agreements of theGroup with remaining rental periods ranging from1to40 years. As of December 31, 2015 and 2016, deferred charges represent deferred Indefeasible Right of Use (“IRUâ€) Agreement charges. Total amortization of deferred charges for the years ended December 31, 2014, 2015 and 2016 amounted to Rp86 billion, Rp46 billion and Rp40 billion, respectively. Refer to Note 31 for details of related party transactions. 12. INTANGIBLE ASSETS
The details of intangible assetsare as follows: | Goodwill | | Software | | License | | Other intangible assets | | Total | | Gross carrying amount: | | | | | | | | | | | Balance, December 31, 2014 | 322 | | 4,771 | | 67 | | 572 | | 5,732 | | Additions | - | | 1,489 | | 1 | | 9 | | 1,499 | | Acquisition (Note 1d) | 15 | | - | | - | | - | | 15 | | Deductions | - | | (1 | ) | - | | - | | (1 | ) | Reclassifications/translations | (1 | ) | 8 | | - | | (1 | ) | 6 | | Balance, December 31, 2015 | 336 | | 6,267 | | 68 | | 580 | | 7,251 | | Accumulated amortization and impairment losses: | | | | | | | | | | | Balance, December 31, 2014 | (21 | ) | (2,862 | ) | (43 | ) | (343 | ) | (3,269 | ) | Amortization | - | | (883 | ) | (6 | ) | (34 | ) | (923 | ) | Deductions | - | | 1 | | - | | - | | 1 | | Reclassifications/translations | - | | (4 | ) | - | | - | | (4 | ) | Balance, December 31, 2015 | (21 | ) | (3,748 | ) | (49 | ) | (377 | ) | (4,195 | ) | Net | 315 | | 2,519 | | 19 | | 203 | | 3,056 | |
F-51
PERUSAHAAN PERSEROAN (PERSERO) PT TELEKOMUNIKASI INDONESIA Tbk AND SUBSIDIARIES NOTES TO THE CONSOLIDATED FINANCIAL STATEMENTS As of December 31, 2015 and 2016 and for the Years Ended December 31, 2014, 2015 and 2016 (Figures in tables are expressedin billions ofRupiah, unless otherwise stated) Table of Content
12. INTANGIBLE ASSETS (continued)
| Goodwill | | Software | | License | | Other intangible assets | | Total | | Gross carrying amount: | | | | | | | | | | | Balance, December 31, 2015 | 336 | | 6,267 | | 68 | | 580 | | 7,251 | | Additions | - | | 925 | | 9 | | 27 | | 961 | | Acquisition (Note 1d) | 117 | | 10 | | - | | - | | 127 | | Deductions | - | | - | | (2 | ) | - | | (2 | ) | Reclassifications/translations | (4 | ) | 20 | | - | | - | | 16 | | Balance,December 31, 2016 | 449 | | 7,222 | | 75 | | 607 | | 8,353 | | Accumulated amortization and impairment losses: | | | | | | | | | | | Balance, December 31, 2015 | (21 | ) | (3,748 | ) | (49 | ) | (377 | ) | (4,195 | ) | Amortization | - | | (1,027 | ) | (7 | ) | (34 | ) | (1,068 | ) | Deductions | - | | - | | - | | - | | - | | Reclassifications/translations | - | | (1 | ) | - | | - | | (1 | ) | Balance,December 31, 2016 | (21 | ) | (4,776 | ) | (56 | ) | (411 | ) | (5,264 | ) | Net | 428 | | 2,446 | | 19 | | 196 | | 3,089 | |
(i)Goodwill resulted from the acquisition of Sigma (2008), AdMedika (2010), data center BDM (2012), Contact Centres Australia Pty. Ltd. (2014), MNDG (2015), and Melon (2016) (Note 1d). In addition, there was an acquisition of 80% ownership of PT Griya Silkindo Drajatmoerni (“GSDmâ€) by NSI. (ii)The amortization is presented as part of “Depreciation and Amortization†in the consolidated statements of profit or loss and other comprehensive income. The remaining amortization periods of software range from1to5 years.
13. TRADE AND OTHER PAYABLES
This account consists of the following: | 2015 | | 2016 | | Trade payables | 13,994 | | 13,518 | | Other payables | 290 | | 172 | | Total trade and other payables | 14,284 | | 13,690 | |
F-52
PERUSAHAAN PERSEROAN (PERSERO) PT TELEKOMUNIKASI INDONESIA Tbk AND SUBSIDIARIES NOTES TO THE CONSOLIDATED FINANCIAL STATEMENTS As of December 31, 2015 and 2016 and for the Years Ended December 31, 2014, 2015 and 2016 (Figures in tables are expressedin billions ofRupiah, unless otherwise stated) Table of Content
13. TRADE AND OTHER PAYABLES (continued) The breakdown of trade payables is as follows: | 2015 | | 2016 | | Related parties | | | | | Radio frequency usage charges, concession feesand Universal Service Obligation (“USOâ€) charges | 1,329 | | 1,256 | | Purchases of equipment, materials and services | 1,891 | | 1,262 | | Payables to other telecommunication providers | 184 | | 324 | | Sub-total | 3,404 | | 2,842 | | Third parties | | | | | Purchases of equipment, materials and services | 9,593 | | 9,395 | | Payables to other telecommunication providers | 997 | | 1,281 | | Sub-total | 10,590 | | 10,676 | | Total | 13,994 | | 13,518 | |
Trade payables by currency are as follows: | 2015 | | 2016 | | Rupiah | 11,169 | | 11,270 | | U.S. dollar | 2,791 | | 2,196 | | Others | 34 | | 52 | | Total | 13,994 | | 13,518 | |
Refer to Note 31 for details of related party transactions.
14. ACCRUED EXPENSES
The breakdown of accrued expenses is as follows: | 2015 | | 2016 | | Operation, maintenance and telecommunication services | 4,459 | | 6,165 | | Salaries and benefits | 1,689 | | 2,993 | | General, administrative and marketing expenses | 1,859 | | 1,914 | | Interest and bank charges | 240 | | 211 | | Total | 8,247 | | 11,283 | |
Refer to Note 31 for details of related party transactions. F-53
PERUSAHAAN PERSEROAN (PERSERO) PT TELEKOMUNIKASI INDONESIA Tbk AND SUBSIDIARIES NOTES TO THE CONSOLIDATED FINANCIAL STATEMENTS As of December 31, 2015 and 2016 and for the Years Ended December 31, 2014, 2015 and 2016 (Figures in tables are expressedin billions ofRupiah, unless otherwise stated) Table of Content
15. UNEARNED INCOME The breakdown of unearned income is as follows: a.Current | 2015 | | 2016 | | Prepaid pulse reload vouchers | 3,630 | | 4,959 | | Telecommunication tower leases | 165 | | 199 | | Other telecommunications services | 96 | | 189 | | Others | 469 | | 216 | | Total | 4,360 | | 5,563 | |
b.Non-current
| 2015 | | 2016 | | Other telecommunications services | 289 | | 256 | | Indefeasible Right of Use | 82 | | 169 | | Total | 371 | | 425 | |
16. SHORT-TERM BANK LOANS AND CURRENT MATURITIES OF LONG-TERM BORROWINGS This account consists of the following:
| 2015 | | 2016 | | Short-term bank loans | 602 | | 911 | | Current maturities of long-term borrowings | 3,842 | | 4,521 | | Total | 4,444 | | 5,432 | |
a. Short-term bank loans | | | | 2015 | | 2016 | | | | | | Outstanding | | Outstanding | | Lenders | | Currency | | Original currency (in millions) | | Rupiah equivalent | | Original currency (in millions) | | Rupiah equivalent | | Related party | | | | | | | | | | | | BNI | | Rp | | - | | 25 | | - | | 143 | | Third parties | | | | | | | | | | | | UOB | | Rp | | - | | 200 | | - | | 269 | | Bank CIMB Niaga | | Rp | | - | | 152 | | - | | 143 | | PT Bank DBS Indonesia | | Rp | | - | | - | | - | | 95 | | SCB | | Rp | | - | | 39 | | - | | 90 | | PT Bank Danamon Indonesia, Tbk (“Danamonâ€) | | Rp | | - | | 80 | | - | | 60 | | Others | | Rp | | - | | 106 | | - | | 111 | | Sub-total | | | | | | 577 | | | | 768 | | Total | | | | | | 602 | | | | 911 | |
Refer to Note 31 for details of related party transactions. F-54
PERUSAHAAN PERSEROAN (PERSERO) PT TELEKOMUNIKASI INDONESIA Tbk AND SUBSIDIARIES NOTES TO THE CONSOLIDATED FINANCIAL STATEMENTS As of December 31, 2015 and 2016 and for the Years Ended December 31, 2014, 2015 and 2016 (Figures in tables are expressedin billions ofRupiah, unless otherwise stated) Table of Content
16. SHORT-TERM BANK LOANS AND CURRENT MATURITIES OF LONG-TERM BORROWINGS (continued) a. Short-term bank loans (continued) Other significant information relating to short-term bank loans as of December 31, 2016is as follows:
| Borrower | | Currency | | Total facility (in billions) | | Maturity date | | Interest payment period | | Interest rate per annum | | Security | | UOB | | | | | | | | | | | | | | | November 22, 2013 | Infomedia | | Rp | | 200 | | November 22, 2017 | | Monthly | | 11.5%-12% | | Trade receivables (Note6) | | December 20, 2016 | Finnet | | Rp | | 300 | | December 21, 2018 | | Monthly | | 1 month JIBOR+2.25% | | None | | Bank CIMB Niaga | | | | | | | | | | | | | | | April 28, 2013a | GSD | | Rp | | 85 | | January 1, 2017 | f | Monthly | | 10.9%-11.5% | | Trade receivables (Note 6), and property and equipment
(Note 10) | | October 29, 2014 | Infomedia Solusi Humanikad | | Rp | | 50 | | January 18, 2017 | | Monthly | | 10.00% | | Trade receivables (Note6) | | December 14, 2015b | Balebatc | | Rp | | 17 | | July 30, 2017 | | Monthly | | 13.00% | | Trade receivables (Note 6), inventories (Note 7) andproperty and equipment (Note 10) | | BNI | | | | | | | | | | | | | | | October 31, 2016 | Telkom Infra | | Rp | | 44 | | October 31, 2017 | | Monthly | | 1 month JIBOR+3.35% | | Trade receivables (Note6) | | December 31, 2016 | Telkom Infra | | Rp | | 101 | | November 30, 2017 | | Monthly | | 1 month JIBOR+3.35% | | Trade receivables (Note6) | | PT. Bank DBS Indonesia | | | | | | | | | | | | | | | April 12, 2016 | Sigmae | | USD | | 0.02 | | July 31, 2017 | | Semi-annually | | 3.25% (USD) / 10.75% (IDR) | | Trade receivables (Note 6) | | SCB | | | | | | | | | | | | | | | June 26, 2015 | GSD | | Rp | | 91 | | December 30, 2016 | f | Monthly | | 10.50% | | None | | Danamon | | | | | | | | | | | | | | | December 15, 2016 | Infomedia | | Rp | | 60 | | December 15, 2017 | | Monthly | | 8.75% | | Trade receivables (Note6) | |
The credit facilities were obtained by the Company’s subsidiaries for working capital purposes. a Based on the latest amendment datedNovember 11, 2014. b Based on the latest amendment datedDecember 14, 2015. cMD Media’s subsidiary. dInfomedia’s subsidiary. e Facility in USD. Withdrawal can be executed in USD and IDR. f Unsettled loan will be automatically extended. F-55
PERUSAHAAN PERSEROAN (PERSERO) PT TELEKOMUNIKASI INDONESIA Tbk AND SUBSIDIARIES NOTES TO THE CONSOLIDATED FINANCIAL STATEMENTS As of December 31, 2015 and 2016 and for the Years Ended December 31, 2014, 2015 and 2016 (Figures in tables are expressedin billions ofRupiah, unless otherwise stated) Table of Content
16. SHORT-TERM BANK LOANS AND CURRENT MATURITIES OF LONG-TERM BORROWINGS (continued)
b. Current maturities of long-term borrowings | Notes | | 2015 | | 2016 | | Two-step loans | 17a | | 224 | | 225 | | Bonds and notes | 17b | | 49 | | 1 | | Bank loans | 17c | | 2,928 | | 3,637 | | Obligations under finance leases | 10c.xi | | 641 | | 658 | | Total | | | 3,842 | | 4,521 | |
Refer to Note 31 for details of related party transactions.
17. LONG-TERM LOANS AND OTHER BORROWINGS
Long-term loans and other borrowings consist of the following: | Notes | | 2015 | | 2016 | | Two-step loans | 17a | | 1,296 | | 1,067 | | Bonds and notes | 17b | | 9,499 | | 9,322 | | Bank loans | 17c | | 15,434 | | 11,929 | | Other borrowings | 17d | | - | | 697 | | Obligations under finance leases | 10c.xi | | 3,939 | | 3,352 | | Total | | | 30,168 | | 26,367 | |
Scheduled principal payments as ofDecember 31, 2016 are as follows:
| | | | | | | | | Year | | | | | | | Notes | | Total | | 2018 | | 2019 | | 2020 | | 2021 | | Thereafter | | Two-step loans | 17a | | 1,067 | | 201 | | 182 | | 183 | | 166 | | 335 | | Bonds and notes | 17b | | 9,322 | | 0 | | 220 | | 2,115 | | 0 | | 6,987 | | Bank loans | 17c | | 11,929 | | 4,675 | | 2,313 | | 2,219 | | 1,110 | | 1,612 | | Other borrowings | 17d | | 697 | | 53 | | 107 | | 107 | | 107 | | 323 | | Obligations under finance leases | 10c.xi | | 3,352 | | 626 | | 605 | | 613 | | 634 | | 874 | | Total | | | 26,367 | | 5,555 | | 3,427 | | 5,237 | | 2,017 | | 10,131 | |
F-56
PERUSAHAAN PERSEROAN (PERSERO) PT TELEKOMUNIKASI INDONESIA Tbk AND SUBSIDIARIES NOTES TO THE CONSOLIDATED FINANCIAL STATEMENTS As of December 31, 2015 and 2016 and for the Years Ended December 31, 2014, 2015 and 2016 (Figures in tables are expressedin billions ofRupiah, unless otherwise stated) Table of Content
17. LONG-TERM LOANS AND OTHER BORROWINGS (continued) a. Two-step loans Two-step loans are unsecured loans obtained by the Government from overseas banks which are then re-loaned to the Company. Loans obtained up to July 1994 are payable in rupiah based on the exchange rate at the date of drawdown. Loans obtained after July 1994 are payable in their original currencies and any resulting foreign exchange gain or loss is borne by the Company.
| | | | 2015 | | 2016 | | | | | | Outstanding | | Outstanding | | Lenders | | Currency | | Original currency (in millions) | | Rupiah equivalent | | Original currency (in millions) | | Rupiah equivalent | | Overseas banks | | Yen | | 6,911 | | 792 | | 6,143 | | 707 | | | | US$ | | 26 | | 363 | | 22 | | 295 | | | | Rp | | - | | 365 | | - | | 290 | | Total | | | | | | 1,520 | | | | 1,292 | | Current maturities (Note 16b) | | | | | | (224 | ) | | | (225 | ) | Long-term portion | | | | | | 1,296 | | | | 1,067 | |
Lenders |
| Currency |
| Principal payment schedule |
| Interest payment period |
| Interest rate per annum |
| Overseas banks | | Yen |
| Semi-annually |
| Semi-annually |
| 2.95% |
|
|
| US$ |
| Semi-annually |
| Semi-annually |
| 3.85% |
| | | Rp |
| Semi-annually |
| Semi-annually |
| 8.25% | | Rupiah
| 6.25% - 6.75%
| | 1.60% - 10.50%
| | Foreign currency
| -
| | 1.00% -1.10%
| |
Refer to Note 35
|
The loans were intended for the development of telecommunications infrastructure and supporting telecommunications equipment. The loans will be settled semi-annually and due on various dates through 2024. The Company had used all facilities under the two-step loans program since 2008. Under the loan covenants, the Company is required to maintain financial ratios as follows: a. Projected net revenue to projected debt service ratio should exceed 1.2:1 for the two-step loans originating from Asian Development Bank (“ADBâ€). b. Internal financing (earnings before depreciation and finance costs) should exceed 20% compared to annual average capital expenditures for loans originating from the ADB. As of December 31, 2016, the Company has complied with the above-mentioned ratios. Refer to Note 31 for details of related party transactions. F-44
PERUSAHAAN PERSEROAN (PERSERO)
| PT TELEKOMUNIKASI INDONESIA Tbk AND SUBSIDIARIES
| NOTES TO THE CONSOLIDATED FINANCIAL STATEMENTS
| As of January 1, 2012 (Restated), December 31, 2012 (Restated) and December 31, 2013
| and for the years ended December 31, 2011 (Restated), 2012 (Restated) and 2013
| (Figures in tables are presented in billions of rupiah, unless otherwise stated)
| |
Tabel of Content
7. TRADE AND OTHER RECEIVABLES
Trade and other receivables as of December 31,2012 and 2013 consist of:
| 2012 | | 2013 | | Trade receivables | 7,270 | | 8,898 | | Provision for impairment of receivables | (2,047 | ) | (2,872 | ) | Net | 5,223 | | 6,026 | | Other receivables | 190 | | 403 | | Provision for impairment of receivables | (4 | ) | (8 | ) | Net | 186 | | 395 | | Total trade and other receivables | 5,409 | | 6,421 | |
Trade receivables arise from services provided to both retail and non-retail customers, with details as follows:
a. By debtor
(i)Related parties
| 2012 | | 2013 | | State-owned enterprises | 549 | | 877 | | Government agencies | 683 | | 842 | | Indonusa | - | | 180 | | PT Indosat Tbk (“Indosat”) | 55 | | 48 | | CSM | 51 | | 45 | | Patrakom* | 56 | | - | | Others | 62 | | 241 | | Total | 1,456 | | 2,233 | | Provision for impairment of receivables | (72 | ) | (555 | ) | Net | 1,384 | | 1,678 | |
* In 2013, Patrakom became a subsidiary (Notes 1d and 3).
(ii) Third parties
| 2012 | | 2013 | | Individual and business subscribers | 5,494 | | 6,168 | | Overseas international carriers | 320 | | 497 | | Total | 5,814 | | 6,665 | | Provision for impairment of receivables | (1,975 | ) | (2,317 | ) | Net | 3,839 | | 4,348 | |
Trade receivables from certain parties are presented net of the Group’s liabilities to such parties due to the existence of a legal right of set-off in accordance with the agreements with those parties.
F-45
PERUSAHAAN PERSEROAN (PERSERO)
| PT TELEKOMUNIKASI INDONESIA Tbk AND SUBSIDIARIES
| NOTES TO THE CONSOLIDATED FINANCIAL STATEMENTS
| As of January 1, 2012 (Restated), December 31, 2012 (Restated) and December 31, 2013
| and for the years ended December 31, 2011 (Restated), 2012 (Restated) and 2013
| (Figures in tables are presented in billions of rupiah, unless otherwise stated)
| |
Tabel of Content
7. TRADE AND OTHER RECEIVABLES (continued)
b. By age
(i) Related parties
| 2012 | | 2013 | | Up to 6 months | 1,125 | | 1,477 | | 7 to 12 months | 248 | | 317 | | More than 12 months | 83 | | 439 | | Total | 1,456 | | 2,233 | | Provision for impairment of receivables | (72 | ) | (555 | ) | Net | 1,384 | | 1,678 | |
(ii) Third parties
| 2012 | | 2013 | | Up to 3 months | 3,286 | | 3,965 | | More than 3 months | 2,528 | | 2,700 | | Total | 5,814 | | 6,665 | | Provision for impairment of receivables | (1,975 | ) | (2,317 | ) | Net | 3,839 | | 4,348 | |
(iii) Aging of total trade receivables
| 2012 | | 2013 | | | | | Provision for impairment | | | | Provision for impairment | | | Gross | | of receivables | | Gross | | of receivables | | Not past due | 3,174 | | 140 | | 3,618 | | 10 | | Past due up to 3 months | 1,250 | | 157 | | 1,525 | | 401 | | Past due more than 3 to 6 months | 455 | | 193 | | 703 | | 321 | | Past due more than 6 months | 2,391 | | 1,557 | | 3,052 | | 2,140 | | Total | 7,270 | | 2,047 | | 8,898 | | 2,872 | |
The Group has made provision for impairment of trade receivables based on the collective assessment of historical impairment rates and individual assessment of its customers’ credit history. The Group does not apply a distinction between related party and third party receivables in assessing amounts past due. AsofDecember 31,2012 and 2013, the carrying amount of trade receivables of the Group considered past due but not impaired amounted to Rp2,189 billion and Rp2,418billion, respectively. Management believes that receivables past due but not impaired, along with trade receivables that are neither past due nor impaired, are due from customers with good credit history and are expected to be recoverable.
F-46
PERUSAHAAN PERSEROAN (PERSERO)
| PT TELEKOMUNIKASI INDONESIA Tbk AND SUBSIDIARIES
| NOTES TO THE CONSOLIDATED FINANCIAL STATEMENTS
| As of January 1, 2012 (Restated), December 31, 2012 (Restated) and December 31, 2013
| and for the years ended December 31, 2011 (Restated), 2012 (Restated) and 2013
| (Figures in tables are presented in billions of rupiah, unless otherwise stated)
| |
Tabel of Content
7. TRADE AND OTHER RECEIVABLES (continued)
c. By currency
(i) Related parties
| 2012 | | 2013 | | Rupiah | 1,369 | | 2,203 | | U.S. dollar | 87 | | 30 | | Total | 1,456 | | 2,233 | | Provision for impairment of receivables | (72 | ) | (555 | ) | Net | 1,384 | | 1,678 | |
(ii) Third parties
| 2012 | | 2013 | | Rupiah | 5,087 | | 5,857 | | U.S. dollar | 722 | | 806 | | Euro | 3 | | 1 | | Hong Kong dollar | 2 | | 1 | | Total | 5,814 | | 6,665 | | Provision for impairment of receivables | (1,975 | ) | (2,317 | ) | Net | 3,839 | | 4,348 | |
d. Movements in the provision for impairment of receivables
| 2012 | | 2013 | | Beginning balance | 1,732 | | 2,047 | | Provision recognized during the year (Note 30) | 848 | | 1,589 | | Receivables written-off | (533 | ) | (622 | ) | Acquisition | - | | 1 | | Divestment | - | | (158 | ) | Reversal | - | | 15 | | Ending balance | 2,047 | | 2,872 | |
The receivables written off arerelated-party andthird-party trade receivables.
Management believes that the provision for impairment of trade receivables is adequate to cover losses on uncollectible trade receivables.
Certain trade receivables of the subsidiaries amounting to Rp1,700 billion have been pledged as collateral under lending agreements (Notes18 and19).
Refer to Note 35 for details of related party transactions.
F-47
PERUSAHAAN PERSEROAN (PERSERO) PT TELEKOMUNIKASI INDONESIA Tbk AND SUBSIDIARIES NOTES TO THE CONSOLIDATED FINANCIAL STATEMENTS As of December 31, 2015 and 2016 and for the Years Ended December 31, 2014, 2015 and 2016 (Figures in tables are expressedin billions ofRupiah, unless otherwise stated) | PT TELEKOMUNIKASI INDONESIA Tbk AND SUBSIDIARIES
| NOTES TO THE CONSOLIDATED FINANCIAL STATEMENTS
| As of January 1, 2012 (Restated), December 31, 2012 (Restated) and December 31, 2013
| and for the years ended December 31, 2011 (Restated), 2012 (Restated) and 2013
| (Figures in tables are presented in billions of rupiah, unless otherwise stated)
| |
Tabel of Content
8. INVENTORIES
| 2012 | | 2013 | | Components | 183 | | 272 | | SIM cards, RUIM cards, set top boxesandblankprepaid vouchers | 134 | | 102 | | Others | 410 | | 157 | | Total | 727 | | 531 | | Provision for obsolescence | | | | | Components | (51 | ) | (21 | ) | SIM cards, RUIM cards, set top boxesandblankprepaid voucher | (1 | ) | (1 | ) | Others | (96 | ) | - | | Total | (148 | ) | (22 | ) | Net | 579 | | 509 | |
Movements in the provision for obsolescence are as follows:
| 2012 | | 2013 | | Beginning balance | 106 | | 148 | | Divestment | - | | (1 | ) | Provision (reversal) recognized during the year | 67 | | (29 | ) | Reclassification | - | | (96 | ) | Inventories written-off | (25 | ) | - | | Ending balance | 148 | | 22 | |
The inventories recognized as expense and included in operations, maintenance and telecommunication service expenses (Note 29) for the years ended December 31, 2011, 2012 and 2013 amounted toRp818 billion, Rp633 billion and Rp752 billion, respectively.
Management believes that the provision is adequate to cover losses from declines in inventory value due to obsolescence.
Certain inventories of the subsidiaries amounting to Rp53 billion have been pledged as collateral under lending agreements (Notes 18 and 19).
As of December 31, 2012 and 2013, modules and components with book value amounting to Rp272 billion andRp280 billon, respectively, which are held by the Group have been insured against fire, theft and other specific risks. Modules are recorded as part of property and equipment. Total sum insured as of December 31, 2012 and 2013amounted to Rp275 billion andRp261 billion, respectively.
Management believes that the insurance coverage is adequate to cover potential losses on inventories arising from the insured risks.
F-48
PERUSAHAAN PERSEROAN (PERSERO)Table of Content
17. LONG-TERM LOANS AND OTHER BORROWINGS (continued) b.Bonds and notes
| PT TELEKOMUNIKASI INDONESIA Tbk AND SUBSIDIARIES
| NOTES TO THE CONSOLIDATED FINANCIAL STATEMENTS
| As of January 1, 2012 (Restated), December 31, 2012 (Restated) and December 31, 2013
| and for the years ended December 31, 2011 (Restated), 2012 (Restated) and 2013
| (Figures in tables are presented in billions of rupiah, unless otherwise stated)
| |
Tabel of Content
9. ADVANCES AND PREPAID EXPENSES
| 2012 | | 2013 | | Frequency license (Notes 38c.i and 38c.ii) | 2,563 | | 2,330 | | Prepaid rental | 666 | | 744 | | Advances | 120 | | 297 | | Salaries | 165 | | 209 | | Deferred expense | 45 | | 124 | | Insurance | 18 | | 84 | | Others (each below Rp50 billion) | 144 | | 149 | | Total | 3,721 | | 3,937 | |
Refer to Note 35 for details of related party transactions.
10. ASSET HELD FOR SALE
This account represents the carrying amount of Telkomsel’s equipment to be exchanged with equipment of Nokia Siemens Network Oy (“NSN Oy”) and PT Huawei Tech Investment (“PT Huawei”). The equipment will be used as part of the settlement for the exchanges of equipment from these companies.
In 2013, Telkomsel’s equipment with net carrying amount of Rp105billion is reclassified to asset held for sale (Note 12c.vi).
Asset held for sale is presented under personal segment (Note 36).
11. LONG-TERM INVESTMENTS
| | 2012 | | | | Percentage of ownership | | Beginning balance | | Addition | | Share of net (loss) profit of associated companies | | Dividend | | Translations | | Ending balance | | Long-term investments in associated companies: | | | | | | | | | | | | | | | | Scicomh | | 29.71 | | 101 | | - | | (2 | ) | (8 | ) | 7 | | 98 | | ILCSc | | 49.00 | | - | | 49 | | (1 | ) | - | | - | | 48 | | Patrakomg | | 40.00 | | 43 | | - | | 5 | | (2 | ) | - | | 46 | | PT Melon Indonesia (“Melon”)b | | 51.00 | | 44 | | - | | (2 | ) | - | | - | | 42 | | CSMe | | 25.00 | | 26 | | - | | (11 | ) | - | | 5 | | 20 | | PSNf | | 22.38 | | - | | - | | - | | - | | - | | - | | Sub-total | | | | 214 | | 49 | | (11 | ) | (10 | ) | 12 | | 254 | | Other long-term investments | | 21 | | - | | - | | - | | - | | 21 | | Total long-term investments | | 235 | | 49 | | (11 | ) | (10 | ) | 12 | | 275 | |
F-49
PERUSAHAAN PERSEROAN (PERSERO) | | | | 2015 | | 2016 | | | | | | Outstanding | | Outstanding | | Bonds and notes | | Currency | | Original currency (in millions) | | Rupiah equivalent | | Original currency (in millions) | | Rupiah equivalent | | Bonds | | | | | | | | | | | | 2010 | | | | | | | | | | | | Series B | | Rp | | - | | 1,995 | | - | | 1,995 | | 2015 | | | | | | | | | | | | Series A | | Rp | | - | | 2,200 | | - | | 2,200 | | Series B | | Rp | | - | | 2,100 | | - | | 2,100 | | Series C | | Rp | | - | | 1,200 | | - | | 1,200 | | Series D | | Rp | | - | | 1,500 | | - | | 1,500 | | Medium Term Notes (“MTNâ€) | | | | | | | | | | | | GSD | | | | | | | | | | | | Series A | | Rp | | - | | 220 | | - | | 220 | | Series B | | Rp | | - | | 120 | | - | | 120 | | Finnet | | | | | | | | | | | | MTN I | | Rp | | - | | 200 | | - | | - | | Promissory notes | | | | | | | | | | | | PT Huawei | | US$ | | 1 | | 14 | | - | | - | | PT ZTE Indonesia (“ZTEâ€) | | US$ | | 1 | | 14 | | 0 | | 1 | | Total | | | | | | 9,563 | | | | 9,336 | | Unamortized debt issuance cost | | | | | | (15 | ) | | | (13 | ) | Total | | | | | | 9,548 | | | | 9,323 | | Current maturities (Note 16b) | | | | | | (49 | ) | | | (1 | ) | Long-term portion | | | | | | 9,499 | | | | 9,322 | |
(i)Bonds 2010
| PT TELEKOMUNIKASI INDONESIA Tbk AND SUBSIDIARIES
| NOTES TO THE CONSOLIDATED FINANCIAL STATEMENTS
| As of January 1, 2012 (Restated), December 31, 2012 (Restated) and December 31, 2013
| and for the years ended December 31, 2011 (Restated), 2012 (Restated) and 2013
| (Figures in tables are presented in billions of rupiah, unless otherwise stated)
| |
Tabel of Content
11. LONG-TERM INVESTMENTS (continued)
Summarized financial information of the Group’s investments accounted undertheequity method for 2012:
| Scicom | | ILCS | | Patrakom | | Melon | | CSM | | PSN | | Statements of financial position | | | | | | | | | | | | | Current assets | 181 | | 98 | | 91 | | 69 | | 269 | | 137 | | Non-current assets | 42 | | 6 | | 127 | | 20 | | 899 | | 453 | | Current liabilities | (16 | ) | (5 | ) | (76 | ) | (6 | ) | (813 | ) | (932 | ) | Non-current liabilities | (1 | ) | (2 | ) | (26 | ) | (1 | ) | (92 | ) | (580 | ) | Equity (deficit) | 206 | | 97 | | 116 | | 82 | | 263 | | (922 | ) | Statements of comprehensive income | | | | | | | | | | | | | Revenue | 399 | | 1 | | 226 | | 10 | | 403 | | 292 | | Cost ofrevenuesand operating expenses | (359 | ) | (4 | ) | (209 | ) | (21 | ) | (345 | ) | (294 | ) | Other(expenses) income, including finance costs - net | (1) | | 0 | | - | | - | | (125 | ) | 3 | | Profit(loss)before tax | 39 | | (3 | ) | 17 | | (11 | ) | (67 | ) | 1 | | Net income taxbenefit (expense) | 1 | | - | | (5 | ) | 7 | | 23 | | - | | Profit(loss)for the year | 40 | | (3 | ) | 12 | | (4 | ) | (44 | ) | 1 | |
| 2013 | | | Percentage of ownership | | Beginning balance | | Additions (Deductions) | | Share of net (loss) profit of associated companies | | Dividend | | Translations | | Ending balance | | Long-term investments in associated companies: | | | | | | | | | | | | | | | Indonusaa | 20.00 | | - | | 182 | | 7 | | - | | - | | 189 | | Melonb | 51.00 | | 42 | | - | | (3 | ) | - | | - | | 39 | | ILCSc | 49.00 | | 48 | | - | | (11 | ) | - | | - | | 37 | | Telin Malaysiad | 49.00 | | - | | 20 | | (6 | ) | - | | 4 | | 18 | | CSMe | 25.00 | | 20 | | - | | (20 | ) | - | | - | | - | | PSNf | 22.38 | | - | | - | | - | | - | | - | | - | | Patrakomg | 40.00 | | 46 | | (46 | ) | 2 | | (2 | ) | - | | - | | Scicomh | 29.71 | | 98 | | (88 | ) | 2 | | (3 | ) | (9 | ) | - | | Sub-total | | | 254 | | 68 | | (29 | ) | (5 | ) | (5 | ) | 283 | | Other long-term investments | | 21 | | - | | - | | - | | - | | 21 | | Total long-term investments | | 275 | | 68 | | (29 | ) | (5 | ) | (5 | ) | 304 | |
F-50
PERUSAHAAN PERSEROAN (PERSERO)
| PT TELEKOMUNIKASI INDONESIA Tbk AND SUBSIDIARIES
| NOTES TO THE CONSOLIDATED FINANCIAL STATEMENTS
| As of January 1, 2012 (Restated), December 31, 2012 (Restated) and December 31, 2013
| and for the years ended December 31, 2011 (Restated), 2012 (Restated) and 2013
| (Figures in tables are presented in billions of rupiah, unless otherwise stated)
| |
Bonds | | Principal | | Issuer | | Listed on | | Issuance date | | Maturity date | | Interest payment period | | Interest rate per annum | | Series B | | 1,995 | | The Company | | IDX | | June 25, 2010 | | July 6, 2020 | | Quarterly | | 10.20% | |
Tabel of Content
11. LONG-TERM INVESTMENTS (continued)
Summarized financial information of the Group’s investments accountedundertheequity method for 2013:
| Indonusa | | Melon | | ILCS | | Telin Malaysia | | CSM | | PSN | | Statements of financial position | | | | | | | | | | | | | Current assets | 124 | | 73 | | 64 | | 33 | | 222 | | 183 | | Non-current assets | 1,426 | | 17 | | 24 | | 4 | | 1,051 | | 634 | | Current liabilities | (662 | ) | (21 | ) | (12 | ) | (1 | ) | (1,091 | ) | (1,418 | ) | Non-current liabilities | (7 | ) | (1 | ) | (1 | ) | - | | (296 | ) | (730 | ) | Equity (deficit) | 881 | | 68 | | 75 | | 36 | | (114 | ) | (1,331 | ) | Statements of comprehensive income | | | | | | | | | | | | | Revenue | 363 | | 73 | | 4 | | 0 | | 306 | | 462 | | Cost ofrevenues andoperating expenses | (517 | ) | (79 | ) | (27 | ) | (11 | ) | (420 | ) | (460 | ) | Other(expenses) income, including finance costs - net | (9 | ) | - | | 1 | | - | | (124 | ) | (57 | ) | Loss before tax | (163 | ) | (6 | ) | (22 | ) | (11 | ) | (238 | ) | (55 | ) | Net income taxbenefit | 39 | | - | | - | | - | | 57 | | - | | Lossfor the year | (124 | ) | (6 | ) | (22 | ) | (11 | ) | (181 | ) | (55 | ) |
a Indonusa had been the Company’s subsidiary until 2013 when the Company disposed 80% of its interest in Indonusa (Notes 1d and 3).
b Melon is engaged in providing Digital Content Exchange Hub services (“DCEH”). As a result of the existence of substantive participating rights held by the other venturer over the significant financial and operating policies of Melon, Metra does not have control over Melon.
c ILCS is engaged in providing E-trade logistic services and other related services.
d Telin Malaysia is engaged in telecommunication services in Malaysia.
e CSM is engaged in providing Very Small Aperture Terminal (“VSAT”), network application services and consulting services on telecommunications technology and related facilities. The unrecognized share of losses of CSM for the year ended December 31, 2013 is Rp29 billion.
f PSN is engaged in providing satellite transponder leasing and satellite-based communication services in the Asia-Pacific Region. The Company’s share in losses of PSN has exceeded the carrying amount of its investment since 2001; accordingly, the investment value has been reduced to Rp nil. The unrecognized share of losses of PSN for the years ended December 31, 2013 and 2012 are Rp298 billion and Rp 206 billion, respectively.
g Patrakom has been engaged in providing satellite communication system services, related services and facilities to companies in the petroleum industry. Starting in 2013, Patrakom has become a subsidiary (Notes 1d and 3).
h Scicom (MSC) Berhad-Malaysia (Scicom) is engaged in providing call center services in Malaysia. On September 19, 2013, the Company sold its investment in Scicom, with the proceeds of disposal and the carrying amount of the investment on the date of disposal amounting to Rp153 billion and Rp88 billion, respectively, resulting in a gain of Rp65 billion.
The bonds are secured by all of the Company’s assets, movable or non-movable, either existing or in the future (Note10c.ix). The underwriters of the bonds are PT Bahana Securities (“Bahanaâ€), PT Danareksa Sekuritas and PT Mandiri Sekuritas and the trustee is Bank CIMB Niaga.
F-51
PERUSAHAAN PERSEROAN (PERSERO)
| PT TELEKOMUNIKASI INDONESIA Tbk AND SUBSIDIARIES
| NOTES TO THE CONSOLIDATED FINANCIAL STATEMENTS
| As of January 1, 2012 (Restated), December 31, 2012 (Restated) and December 31, 2013
| and for the years ended December 31, 2011 (Restated), 2012 (Restated) and 2013
| (Figures in tables are presented in billions of rupiah, unless otherwise stated)
| |
Tabel of Content
12. PROPERTY AND EQUIPMENT
| January 1, 2012 | | Additions | | Deductions | | Reclassifications/ Translations | | December 31, 2012 | | At cost: | | | | | | | | | | | Land rights | 842 | | 135 | | - | | (0 | ) | 977 | | Buildings | 3,417 | | 98 | | (0 | ) | 272 | | 3,787 | | Leasehold improvements | 650 | | 6 | | (3 | ) | 130 | | 783 | | Switching equipment | 25,551 | | 91 | | (1,438 | ) | (371 | ) | 23,833 | | Telegraph, telex and data communication equipment | 20 | | - | | - | | (1 | ) | 19 | | Transmission installation and equipment | 78,697 | | 3,328 | | (1,484 | ) | 7,629 | | 88,170 | | Satellite, earth station and equipment | 7,069 | | 35 | | - | | 163 | | 7,267 | | Cable network | 26,772 | | 1,965 | | (244 | ) | (469 | ) | 28,024 | | Power supply | 9,285 | | 194 | | (29 | ) | 984 | | 10,434 | | Data processing equipment | 8,426 | | 329 | | (210 | ) | (10 | ) | 8,535 | | Other telecommunications peripherals | 474 | | - | | - | | (192 | ) | 282 | | Office equipment | 753 | | 60 | | (47 | ) | (71 | ) | 695 | | Vehicles | 132 | | 6 | | (52 | ) | (15 | ) | 71 | | CPE assets | 22 | | - | | - | | - | | 22 | | Other equipment | 112 | | 1 | | - | | (2 | ) | 111 | | Property under construction | 1,205 | | 11,024 | | (43 | ) | (10,874 | ) | 1,312 | | Total | 163,427 | | 17,272 | | (3,550 | ) | (2,827 | ) | 174,322 | |
| January 1, 2012 | | Additions | | Impairments | | Deductions | | Reclassifications/ Translations | | December 31, 2012 | | Accumulated depreciation and impairment losses: | | | | | | | | | | | | | Land rights | 121 | | 18 | | - | | - | | - | | 139 | | Buildings | 1,671 | | 130 | | - | | (0 | ) | (62 | ) | 1,739 | | Leasehold improvements | 502 | | 63 | | - | | (3 | ) | 47 | | 609 | | Switching equipment | 17,447 | | 2,071 | | - | | (1,112 | ) | (1,260 | ) | 17,146 | | Telegraph, telex and data communication equipment | 17 | | 0 | | - | | - | | (1 | ) | 16 | | Transmission installation and equipment | 35,377 | | 7,410 | | 153 | | (909 | ) | (27 | ) | 42,004 | | Satellite, earth station and equipment | 4,135 | | 517 | | 94 | | - | | (62 | ) | 4,684 | | Cable network | 17,128 | | 1,085 | | - | | (238 | ) | (485 | ) | 17,490 | | Power supply | 4,873 | | 1,221 | | - | | (18 | ) | (94 | ) | 5,982 | | Data processing equipment | 6,406 | | 1,052 | | - | | (165 | ) | (677 | ) | 6,616 | | Other telecommunications peripherals | 354 | | 5 | | - | | - | | (99 | ) | 260 | | Office equipment | 531 | | 65 | | - | | (14 | ) | (27 | ) | 555 | | Vehicles | 120 | | 7 | | - | | (52 | ) | (14 | ) | 61 | | CPE assets | 9 | | 2 | | - | | - | | - | | 11 | | Other equipment | 98 | | 5 | | - | | - | | (1 | ) | 102 | | Total | 88,789 | | 13,651 | | 247 | | (2,511 | ) | (2,762 | ) | 97,414 | | Net | 74,638 | | | | | | | | | | 76,908 | |
F-52
PERUSAHAAN PERSEROAN (PERSERO)
| PT TELEKOMUNIKASI INDONESIA Tbk AND SUBSIDIARIES
| NOTES TO THE CONSOLIDATED FINANCIAL STATEMENTS
| As of January 1, 2012 (Restated), December 31, 2012 (Restated) and December 31, 2013
| and for the years ended December 31, 2011 (Restated), 2012 (Restated) and 2013
| (Figures in tables are presented in billions of rupiah, unless otherwise stated)
| |
Tabel of Content
12. PROPERTY AND EQUIPMENT (continued)
| January 1, 2013 | | Business acquisition | | Divestment | | Additions | | Deductions | | Reclassifications/ Translations | | December 31, 2013 | | At cost: | | | | | | | | | | | | | | | Land rights | 977 | | 110 | | - | | 13 | | - | | (2 | ) | 1,098 | | Buildings | 3,787 | | 120 | | - | | 98 | | (1 | ) | 220 | | 4,224 | | Leasehold improvements | 783 | | - | | - | | 24 | | (27 | ) | 32 | | 812 | | Switching equipment | 23,833 | | - | | - | | 428 | | (2,896 | ) | (2,577 | ) | 18,788 | | Telegraph, telex and data communication equipment | 19 | | - | | - | | - | | - | | (13 | ) | 6 | | Transmission installation and equipment | 88,170 | | - | | (30 | ) | 4,947 | | (1,641 | ) | 10,098 | | 101,544 | | Satellite, earth station and equipment | 7,267 | | 158 | | (110 | ) | 56 | | (2 | ) | 87 | | 7,456 | | Cable network | 28,024 | | - | | (601 | ) | 2,084 | | (117 | ) | (37 | ) | 29,353 | | Power supply | 10,434 | | 3 | | (0 | ) | 253 | | (71 | ) | 1,136 | | 11,755 | | Data processing equipment | 8,535 | | - | | (1 | ) | 973 | | (283 | ) | 129 | | 9,353 | | Other telecommunications peripherals | 282 | | - | | - | | 230 | | - | | (10 | ) | 502 | | Office equipment | 695 | | 5 | | (11 | ) | 138 | | (9 | ) | (41 | ) | 777 | | Vehicles | 71 | | 0 | | (1 | ) | 305 | | (1 | ) | (16 | ) | 358 | | CPE assets | 22 | | - | | - | | - | | - | | - | | 22 | | Other equipment | 111 | | - | | (2 | ) | - | | - | | (5 | ) | 104 | | Property under construction | 1,312 | | - | | - | | 15,349 | | - | | (14,690 | ) | 1,971 | | Total | 174,322 | | 396 | | (756 | ) | 24,898 | | (5,048 | ) | (5,689 | ) | 188,123 | |
| January 1, 2013 | | Business acquisition | | Divestment | | Additions | | Impairment | | Deductions | | Reclassifications/ Translations | | December 31, 2013 | | Accumulated depreciation and impairment losses: | | | | | | | | | | | | | | | | | Land rights | 139 | | - | | - | | 25 | | - | | - | | (2 | ) | 162 | | Buildings | 1,739 | | - | | - | | 163 | | - | | (0 | ) | (62 | ) | 1,840 | | Leasehold improvements | 609 | | - | | - | | 67 | | - | | (27 | ) | - | | 649 | | Switching equipment | 17,146 | | - | | - | | 1,988 | | - | | (2,718 | ) | (3,466 | ) | 12,950 | | Telegraph, telex and data communication equipment | 16 | | - | | - | | - | | - | | - | | (13 | ) | 3 | | Transmission installation and equipment | 42,004 | | - | | (3 | ) | 8,507 | | 321 | | (1,535 | ) | (1,269 | ) | 48,025 | | Satellite, earth station and equipment | 4,684 | | - | | (142 | ) | 663 | | 226 | | (2 | ) | (239 | ) | 5,190 | | Cable network | 17,490 | | - | | (181 | ) | 1,055 | | 49 | | (106 | ) | (317 | ) | 17,990 | | Power supply | 5,982 | | - | | (0 | ) | 1,171 | | - | | (67 | ) | (292 | ) | 6,794 | | Data processing equipment | 6,616 | | - | | (1 | ) | 775 | | - | | (264 | ) | (221 | ) | 6,905 | | Other telecommunications peripherals | 260 | | - | | - | | 18 | | - | | - | | (10 | ) | 268 | | Office equipment | 555 | | - | | (6 | ) | 73 | | - | | (7 | ) | (49 | ) | 566 | | Vehicles | 61 | | - | | (1 | ) | 26 | | - | | (1 | ) | (16 | ) | 69 | | CPE asets | 11 | | - | | - | | 2 | | - | | - | | - | | 13 | | Other equipment | 102 | | - | | (1 | ) | 4 | | - | | - | | (5 | ) | 100 | | Total | 97,414 | | - | | (335 | ) | 14,537 | | 596 | | (4,727 | ) | (5,961 | ) | 101,524 | | Net | 76,908 | | | | | | | | | | | | | | 86,599 | |
a. Gain on disposal or sale ofproperty and equipmentPERUSAHAAN PERSEROAN (PERSERO) PT TELEKOMUNIKASI INDONESIA Tbk AND SUBSIDIARIES NOTES TO THE CONSOLIDATED FINANCIAL STATEMENTS As of December 31, 2015 and 2016 and for the Years Ended December 31, 2014, 2015 and 2016 (Figures in tables are expressedin billions ofRupiah, unless otherwise stated) Table of Content
17. LONG-TERM LOANS AND OTHER BORROWINGS (continued) b. Bonds and notes (continued) (i)Bonds (continued) The Company received the proceeds from the issuance of bonds on July 6, 2010. The funds received from the public offering of bonds net of issuance costs, were used tofinance capital expenditures which consisted of wave broadband (bandwidth, softswitching, datacom, information technology and others) and infrastructure (backbone, metro network, regional metro junction, internet protocol, and satellite system) and to optimize legacy and supporting facilities (fixed wireline and wireless). As ofDecember 31, 2016, the rating of the bonds issued by PT Pemeringkat Efek Indonesia (Pefindo) is idAAA (stable outlook).
Based on the indenture trusts agreement, the Company is required to comply with all covenants or restrictions, including maintaining financial ratios as follows: 1. Debt to equity ratio should not exceed 2:1. 2. EBITDA to finance costs ratio should not be less than 5:1. 3. Debt service coverage is at least 125%. As ofDecember 31, 2016, the Company has complied with the above-mentioned ratios. 2015 Bonds | | Principal | | Issuer | | Listed on | | Issuance date | | Maturity date | | Interest payment period | | Interest rate per annum | | Series A | | 2,200 | | The Company | | IDX | | June 23, 2015 | | June 23, 2022 | | Quarterly | | 9.93% | | Series B | | 2,100 | | The Company | | IDX | | June 23, 2015 | | June 23, 2025 | | Quarterly | | 10.25% | | Series C | | 1,200 | | The Company | | IDX | | June 23, 2015 | | June 23, 2030 | | Quarterly | | 10.60% | | Series D | | 1,500 | | The Company | | IDX | | June 23, 2015 | | June 23, 2045 | | Quarterly | | 11.00% | | Total | | 7,000 | | | | | | | | | | | | | |
The bonds are secured by all of the Company’s assets, movable or non-movable, either existing or in the future(Note 10c.ix). The underwriters of the bonds are Bahana, PT Danareksa Sekuritas, PT Mandiri Sekuritas, andPT Trimegah Sekuritas andthe trustee isBank Permata. The Company received the proceeds from the issuance of bonds on June 23, 2015. The funds received from the public offering of bonds net of issuance costs, were used to finance capital expenditures which consisted of wave broadband, backbone, metro network, regional metro junction, information technology application and support, and merger and acquisition ofsome domestic and international entities. F-59
PERUSAHAAN PERSEROAN (PERSERO) PT TELEKOMUNIKASI INDONESIA Tbk AND SUBSIDIARIES NOTES TO THE CONSOLIDATED FINANCIAL STATEMENTS As of December 31, 2015 and 2016 and for the Years Ended December 31, 2014, 2015 and 2016 (Figures in tables are expressedin billions ofRupiah, unless otherwise stated) Table of Content
17. LONG-TERM LOANS AND OTHER BORROWINGS (continued)
b. Bonds and notes (continued) (i)Bonds (continued) As of December 31, 2016, the rating of the bonds issued by Pefindo is idAAA (stable outlook). Based on the indenture trusts agreement, the Company is required to comply with all covenants or restrictions, including maintaining financial ratios as follows: 1. Debt to equity ratio should not exceed 2:1. 2. EBITDA to finance costs ratio should not be less than 4:1. 3. Debt service coverageis at least 125%. As of December 31, 2016, the Company has complied with the above-mentioned ratios. (ii)MTN GSD
Notes | | Currency | | Principal | | Issuance date | | Maturity date | | Interest payment period | | Interest rate per annum | | Series A | | Rp | | 220 | | November 14, 2014 | | November 14, 2019 | | Semi-annually | | 11.00% | | SeriesB | | Rp | | 120 | | March 6, 2015 | | March 6, 2020 | | Semi-annually | | 11.00% | | Total | | | | 340 | | | | | | | | | |
Based on Agreement of Issuance and Appointment of Monitoring and Insurance Agents of Medium Term Notes PT Graha Sarana Duta Year 2014 dated November 13, 2014 as covered by notarial deed No. 30 of Arry Supratno, S.H., GSD will issue MTN with the principal amount of up to Rp500 billion in series. PT Mandiri Sekuritas acts as the Arranger, Bank Mandiri as the Monitoring and Insurance Agent, andPT Kustodian Sentral Efek Indonesia (“KSEIâ€) as thepayment agent and custodian. The funds obtained from MTN are used for investment projects. Trade receivables, inventories, land and building related with investment development funded by MTN that are owned or will be owned by GSD, have been pledged as collateral for MTN (Notes 6,7 and 10c.ix). Under the agreement, GSD is required to comply with all covenants or restrictions including maintaining financial ratios as follows: 1.Debt to equity ratio should not exceed 6.5:1. 2.EBITDA to interest ratio should not be less than 1.2:1. 3.Minimum current ratio is 120%. 4.Maximum leverage ratio is 450%. As of December 31, 2016, GSD has complied with the above-mentioned ratios. F-60
PERUSAHAAN PERSEROAN (PERSERO) PT TELEKOMUNIKASI INDONESIA Tbk AND SUBSIDIARIES NOTES TO THE CONSOLIDATED FINANCIAL STATEMENTS As of December 31, 2015 and 2016 and for the Years Ended December 31, 2014, 2015 and 2016 (Figures in tables are expressedin billions ofRupiah, unless otherwise stated) Table of Content
17. LONG-TERM LOANS AND OTHER BORROWINGS (continued)
b. Bonds and notes (continued)
(ii)MTN (continued)
FINNET
Notes | | Currency | | Principal | | Issuance date | | Maturity date | | Payment period | | Rate per annum | | MTN I Finnet year 2015 | | Rp | | 200 | | July 1, 2015 | | July 1, 2022 | | Quarterly | | 11.00% | |
Based on Agreement of Debt Acknowledgement of Medium Term Notes (MTN) I Finnet Year 2015 as covered by notarial deed No. 47 dated June 30, 2015, of Utiek R. Abdurachman, S.H., MLI., M.Kn., Finnet will issue MTN through private placement with the principalamounting to Rp200 billion. PT BNI Asset Management acts as the arranger, Bank Mega as the trustee and KSEI as the payment agent and custodian.
The funds obtained from MTN are used for Finnet’s working capital related toRetail NationalChannel Bank project as Telkomsel’s billing payment aggregator. The rating of the MTN issued by PT Fitch Rating Indonesia is A (ind). The MTN is not secured by any specific collateral. The MTNis secured by all of Finnet’s assets, movable or non-movable either existing or in the future. Under the agreement, Finnet is required to comply with all covenants or restrictions, including maintaining financial ratios as follows: 1.Debt to equity ratio should notexceed 3.5:1. 2.EBITDA to interest ratio shouldnot be less than 2.5:1. In 2016, Finnet has made early payments on MTN amounting to Rp200 billion through refinancingfrom UOB with the term of the agreement for two years. (iii)Promissorynotes | 2012 | | 2013 | | Proceeds from sale of property and equipment | 360 | | 466 | | Net book value | (144 | ) | (53 | ) | Gain on disposal or sale of property and equipment | 216 | | 413 | |
Supplier
| | Currency | | F-53
PERUSAHAAN PERSEROAN (PERSERO)Principal*
| PT TELEKOMUNIKASI INDONESIA Tbk AND SUBSIDIARIES
| NOTES TO THE CONSOLIDATED FINANCIAL STATEMENTS
| As of January 1, 2012 (Restated), December 31, 2012 (Restated) and December 31, 2013
| and for the years ended December 31, 2011 (Restated), 2012 (Restated) and 2013
| (Figures in tables are presented in billions of rupiah, unless otherwise stated)
| |
Tabel of Content(in billions)
| | 12. PROPERTY AND EQUIPMENT (continued)Issuance date
| | b. Assets impairmentPrincipal payment schedule
(i) As of December 31, 2012 and 2013, the CGUs that independently generate cash inflows were fixed wireline, fixed wireless, cellular and others. As of December 31, 2012 and 2013, there were indications of impairment in the fixed wireless CGU (presented as part of personal segment), which were mainly due to increased competition in the fixed wireless market that resulted in lower average tariffs, declining active customers and declining Average Revenue Per User (“ARPU”). The Company assessed the recoverable value of the assets in the CGU and determined that assets for the fixed wireless CGU were impaired by Rp247 billion and Rp596 billion at December 31, 2012 and 2013, respectively, which are recognized in the consolidated statements of comprehensive income under “Depreciation and amortization”. The recoverable amount has been determined based on value in use (VIU) calculations. These calculations used pre-tax cash flow projections approved by management covering a five-year period and with cash flows beyond the five-year period extrapolated using a perpetuity growth method. The cash flow projections reflect management’s expectations of revenue, Earnings Before Interest, Tax, Depreciation and Amortization (“EBITDA”) growth and operating cash flows on the basis that the fixed wireless CGU generates positive net cash flows starting from 2014. Management’s cash flow projection also incorporates management’s reasonable expectations for developments in macro economic conditions and market expectations for the Indonesian telecommunications industry. As of December 31, 2012 and 2013, management applied a pre-tax discount rate of 12.3% and 13.5%, respectively, derived from the Company’s post-tax weighted average cost of capital and benchmarked to externally available data. As of December 31, 2012 and 2013, the perpetuity growth rate used is 0.5% and 0%, respectively, and assuming that subscriber numbers and ARPU may continue to decrease after five years.
If the performance of the fixed wireless CGU continues to decline or if management’s initiatives are not performing as expected in the next financial year, analysis will be required to assess whether there will be further impairment next year.
(ii) Management believes that there is no indication of impairment in the assets of other CGUs as of December 31, 2012 and 2013.
c. Others
(i)Interest capitalized to property under construction amounted to Rp44 billion and Rp100 billion for the years ended December 31, 2012 and 2013, respectively, while no interest was capitalized for 2011. The capitalization rate used to determine the amount of borrowing costs eligible for capitalization ranged from 7.72% to 9.75% and from 9.75% to 13.07% for the years ended December 31, 2012 and 2013, respectively.
(ii)No foreign exchange loss was capitalized as part of property under construction for the years ended December 31, 2011, 2012 and 2013.
(iii)On August 7, 2012, Telkom-3 Satellite with a total value of Rp1,606 billion was built and launched, but failed to reach its orbit. The carrying value of the satellite was charged to other expenses in the 2012 consolidated statement of comprehensive income. Telkom-3 Satellite was insured with insurance coverage that was adequate to cover losses from the insured risks such as the event experienced by the Company. Insurance claim was made and the amount of insurance compensation amounting to Rp1,772 billion was agreed and approved by the insurer and recorded as part of other income in the 2012 consolidated statement of comprehensive income. The Company received the proceeds from the insurance claim in November 2012.
F-54
PERUSAHAAN PERSEROAN (PERSERO)
| PT TELEKOMUNIKASI INDONESIA Tbk AND SUBSIDIARIES
| NOTES TO THE CONSOLIDATED FINANCIAL STATEMENTS
| As of January 1, 2012 (Restated), December 31, 2012 (Restated) and December 31, 2013
| and for the years ended December 31, 2011 (Restated), 2012 (Restated) and 2013
| (Figures in tables are presented in billions of rupiah, unless otherwise stated)
| |
Tabel of Content
| 12. PROPERTY AND EQUIPMENT (continued)Interest payment period
| | c. Others (continued)Interest rate
per annum
(iv)In 2012, Telkomsel decided to replace certain equipment units with net carrying amount of Rp1,037 billion, as part of its modernization program. Accordingly, Telkomsel changed the estimated useful lives of such equipment. In 2013, the effect of the change is the additional depreciation expense amounting to Rp131 billion.
The impact of the change in the estimated useful lives of the equipment for the year ended December 31, 2014 is to decrease the profit before income tax by Rp84 billion.
(v)In 2012, the useful lives of Telkomsel’s towers were changed from 10 years to 20 years to reflect their current economicusefullives. The impact is a reduction of depreciation expense by Rp606 billion recognized in the 2013 consolidated statement of comprehensive income.
The impact of the change in the estimated useful lives of the towers in future periods is to increase the profit before income tax as follows:
Years | Amount | 2014 | 565 | 2015 | 469 | 2016 | 301 | 2017 | 92 |
(vi)Exchange of property and equipment
·In 2011, the Company and PT Industri Telekomunikasi Indonesia (“INTI”) signed Purchase Orders of Procurement and Installation Agreement for the Modernization of the Copper Cable Network through Optimization of Asset Copper Cable Network Trade In/Trade Off with total procurement value amounting to Rp1,499 billion up to December 31, 2013.
In 2012 and 2013, the Company derecognized the copper cable network asset with net carrying value of Rp6.2 billion and Rp1.6 billion, respectively, and recorded the fiber optic network asset from the exchange transaction of Rp430 billion and Rp203 billion, respectively.
·In 2013, certain equipment units of Telkomsel with net carrying amount of Rp268 billion were exchanged with equipment from NSN Oy and PT Huawei. As of December 31, 2013, Telkomsel’s equipment units with net carrying amount of Rp105 billion are going to be exchanged with equipment from NSN Oy and PT Huawei; therefore, these equipment units were reclassified as assets held for sale (Note10).
In 2012, certain equipment units of Telkomsel with net carrying amount Rp1,686 billion were exchanged with equipment from NSN Oy and PT Huawei, where Rp791 billion relates to asset held for sale that was recognized in 2011.
The cost of the acquired equipment is measured at the aggregate of the carrying amount of the equipment given up and the amount of cash paid.
| F-55
PERUSAHAAN PERSEROAN (PERSERO)
| PT TELEKOMUNIKASI INDONESIA Tbk AND SUBSIDIARIES
| NOTES TO THE CONSOLIDATED FINANCIAL STATEMENTS
| As of January 1, 2012 (Restated), December 31, 2012 (Restated) and December 31, 2013
| and for the years ended December 31, 2011 (Restated), 2012 (Restated) and 2013
| (Figures in tables are presented in billions of rupiah, unless otherwise stated)
| |
Tabel of Content
12. PROPERTY AND EQUIPMENT (continued)
c.Others (continued)
(vii)The Group owns several pieces of land rights located throughout Indonesia with Building Use Rights (“Hak Guna Bangunan” or “HGB”) for a period of 10 - 45 years which will expire between 2014 and 2052. Management believes that there will be no issue in obtaining the extension of the land rights when they expire.
(viii)As of December 31, 2013, the Group’s property and equipment except land rights, with net carrying amount of Rp72,000 billion were insured against fire, theft, earthquake and other specified risks, with a maximum loss claim of Rp4,449 billion, US$52.51 million, EURO0.63 million, SGD16.55 million and HKD8.44 million, and on a first-loss basis of Rp6,815 billion including business recovery of Rp324 billion with the Automatic Reinstatement of Loss Clause. In addition, Telkom-1 and Telkom-2 were insured separately for US$3.41 million and US$28.55 million, respectively. Management believes that the insurance coverage is adequate to cover potential losses from the insured risks.
(ix)As of December 31, 2013, the percentage of completion of property under construction was around 32.69% of the total contract value, with estimated dates of completion between January 2014 and December 2015. The balance of property under construction mainly consists of buildings, transmission installation and equipment, cable network and power supply. Management believes that there is no impediment to the completion of the construction in progress.
(x)All assets owned by the Company have been pledged as collateral for bonds (Note 19b). Certain property and equipment of the Company’s subsidiaries with gross carrying value amounting to Rp6,214 billion have been pledged as collateral under lending agreements (Notes 18a and 19c).
(xi)As of December 31, 2013, the cost of fully depreciated property and equipment of the Group that are still used in operations amounted to Rp40,791 billion. The Group is currently performing modernization of network assets to replace the fully depreciated property and equipment.
(xii)As of December 31, 2013, the total fair values of land rights and buildings of the Group, which are determined based on the sale value of the tax object (“Nilai Jual Objek Pajak” or “NJOP”) of the related land rights and buildings, amounted to Rp15,307 billion.
(xiii)The Company and Telkomsel entered into several agreements with PT Profesional Telekomunikasi Indonesia, PT Tower Bersama Infrastructure Tbk, PT Solusindo Kreasi Pratama, PT Prima Media Selaras, PT Naragita Dinamika Komunika and other tower providers to lease spaces in telecommunication towers (slot) and sites of the towers for a period of 10 years. The Company and Telkomsel may extend the lease period based on the agreement by both parties. In addition, the Group also has lease commitments for property and equipment under RSA, transmission installation and equipment, data processing equipment, office equipment, vehicles and CPE assets with the option to purchase certain leased assets at the end of the lease terms.Huawei
F-56
PERUSAHAAN PERSEROAN (PERSERO)
| PT TELEKOMUNIKASI INDONESIA Tbk AND SUBSIDIARIES
| NOTES TO THE CONSOLIDATED FINANCIAL STATEMENTS
| As of January 1, 2012 (Restated), December 31, 2012 (Restated) and December 31, 2013
| and for the years ended December 31, 2011 (Restated), 2012 (Restated) and 2013
| (Figures in tables are presented in billions of rupiah, unless otherwise stated)
| |
Tabel of Content
12. PROPERTY AND EQUIPMENT (continued)
c. Others (continued)
Future minimum lease payments for assets under finance lease are as follows:
Year | 2012 | | 2013 | | 2013 | 652 | | - | | 2014 | 548 | | 1,070 | | 2015 | 398 | | 885 | | 2016 | 354 | | 847 | | 2017 | 334 | | 813 | | 2018 | 279 | | 754 | | Thereafter | 607 | | 2,535 | | Total minimum lease payments | 3,172 | | 6,904 | | Interest | (848 | ) | (1,935 | ) | Net present value of minimum lease payments | 2,324 | | 4,969 | | Current maturities (Note 18b) | (510 | ) | (648 | ) | Long-term portion(Note 19) | 1,814 | | 4,321 | |
13. ADVANCES AND OTHER NON-CURRENT ASSETS
Advances and other non-current assets as of December 31, 2012 and 2013 consist of:
| 2012 | | 2013 | | Advances for purchases of property and equipment | 775 | | 1,550 | | Prepaid rental - net of current portion (Note 9) | 1,367 | | 1,403 | | Frequency license - net of current portion (Note9) | 279 | | 619 | | Long-term trade receivables - net of current portion (Note 7) | 294 | | 558 | | Deferred charges | 471 | | 529 | | Claim for tax refund- net of current portion (Note 32) | - | | 499 | | Security deposits | 103 | | 73 | | Restricted cash | 217 | | 54 | | Assets not used in operations - net | 0 | | 0 | | Others | 4 | | 9 | | Total | 3,510 | | 5,294 | |
Prepaid rentalcoversrentofleased line and telecommunication equipment and land and building under lease agreements of theGroup with rental periods ranging from 1 to33 years.
Long-term trade receivables aremeasured at amortized cost using the effective interest ratemethod payable in installments over 4 years, and arose from providing telecommunication access and services in rural areas (USO) (Note 27).
As of December 31,2012and 2013, deferred charges represent deferredRevenue-Sharing Arrangement (“RSA”) charges and deferred Indefeasible Right of Use (“IRU”) Agreement charges. Total amortization of deferred charges for the years ended December 31, 2011, 2012 and 2013 amounted to Rp84 billion, Rp87 billion and Rp91 billion, respectively.
F-57
PERUSAHAAN PERSEROAN (PERSERO)
| PT TELEKOMUNIKASI INDONESIA Tbk AND SUBSIDIARIES
| NOTES TO THE CONSOLIDATED FINANCIAL STATEMENTS
| As of January 1, 2012 (Restated), December 31, 2012 (Restated) and December 31, 2013
| and for the years ended December 31, 2011 (Restated), 2012 (Restated) and 2013
| (Figures in tables are presented in billions of rupiah, unless otherwise stated)
| |
Tabel of Content
13. ADVANCES AND OTHER NON-CURRENT ASSETS (continued)
As of December 31, 2012 and 2013, restricted cash represents time deposits with original maturities of more than one year and cash pledged as collateral for bank guarantees for the USO contract (Note 27) and other contracts.
As of December 31, 2012 and 2013, the carrying amount of theGroup’s temporarily idle property and equipment amounted to Rp0.4 billion and Rp nil, respectively.
Refer to Note 35 for details of related party transactions.
14. INTANGIBLE ASSETS
(i) The changes in the carrying amount of goodwill, software, license and other intangible assets for the years ended December 31, 2012 and 2013are as follows:
| Goodwill | | Software | | License | | Other intangible assets | | Total | | Gross carrying amount: | | | | | | | | | | | Balance, January 1, 2012 | 192 | | 2,536 | | 815 | | 236 | | 3,779 | | Additions | - | | 431 | | - | | 6 | | 437 | | Acquisition of BDM’s Data Center | | | | | | | | | | | (Note 1d) | 77 | | - | | - | | 3 | | 80 | | Deductions | - | | (58 | ) | - | | - | | (58 | ) | Reclassifications | - | | - | | (749 | ) | 155 | | (594 | ) | Balance, December 31, 2012 | 269 | | 2,909 | | 66 | | 400 | | 3,644 | | Accumulated amortization: | | | | | | | | | | | Balance, January 1, 2012 | (21 | ) | (1,459 | ) | (339 | ) | (169 | ) | (1,988 | ) | Amortization expense during the year | - | | (424 | ) | (6 | ) | (36 | ) | (466 | ) | Deductions | - | | 58 | | - | | - | | 58 | | Reclassifications | - | | - | | 314 | | (119 | ) | 195 | | Balance, December 31, 2012 | (21 | ) | (1,825 | ) | (31 | ) | (324 | ) | (2,201 | ) | Net Book Value | 248 | | 1,084 | | 35 | | 76 | | 1,443 | | Weighted-average amortization period | | | 6.86 years | | 10.43 years | | 11.11 years | | | |
F-58
PERUSAHAAN PERSEROAN (PERSERO)
| PT TELEKOMUNIKASI INDONESIA Tbk AND SUBSIDIARIES
| NOTES TO THE CONSOLIDATED FINANCIAL STATEMENTS
| As of January 1, 2012 (Restated), December 31, 2012 (Restated) and December 31, 2013
| and for the years ended December 31, 2011 (Restated), 2012 (Restated) and 2013
| (Figures in tables are presented in billions of rupiah, unless otherwise stated)
| |
Tabel of Content
14. INTANGIBLE ASSETS (continued)
| Goodwill | | Software | | License | | Other intangible assets | | Total | | Gross carrying amount: | | | | | | | | | | | Balance, January 1, 2013 | 269 | | 2,909 | | 66 | | 400 | | 3,644 | | Additions | 1 | | 521 | | 1 | | 114 | | 637 | | Deductions | - | | (8 | ) | - | | (112 | ) | (120 | ) | Reclassifications/translations | - | | 10 | | - | | (1 | ) | 9 | | Balance, December 31, 2013 | 270 | | 3,432 | | 67 | | 401 | | 4,170 | | Accumulated amortization: | | | | | | | | | | | Balance, January 1, 2013 | (21 | ) | (1,825 | ) | (31 | ) | (324 | ) | (2,201 | ) | Amortization expense during the year | - | | (458 | ) | (6 | ) | (114 | ) | (578 | ) | Deductions | - | | 8 | | - | | 112 | | 120 | | Reclassifications/translations | - | | (3 | ) | - | | - | | (3 | ) | Balance, December 31, 2013 | (21 | ) | (2,278 | ) | (37 | ) | (326 | ) | (2,662 | ) | Net Book Value | 249 | | 1,154 | | 30 | | 75 | | 1,508 | | Weighted-average amortization period | | | 7.51 years | | 11.30 years | | 9.78 years | | | |
(ii) Goodwill resulted fromsales-purchase transaction ofDataCenterBusiness between Sigma and BDM in 2012 (Note 1d), and from theacquisitions of Ad Medika in 2010 and Sigma in 2008.
(iii) The estimated annual amortization expense of intangible assets from December 31, 2013 is approximately Rp475 billion. The remaining amortization periods of intangible assets, excluding land rights, range from1 to20 years.
(iv) As of December 31, 2013, the cost of fully amortized intangible assets that are still used in operations amounted to Rp1,321 billion.
15. TRADE AND OTHER PAYABLES
Trade and other payables as of December 31, 2012 and 2013 consist of:
| 2012 | | 2013 | | Trade payables | 7,280 | | 11,600 | | Other payables | 177 | | 388 | | Total trade and other payables | 7,457 | | 11,988 | |
F-59
PERUSAHAAN PERSEROAN (PERSERO)
| PT TELEKOMUNIKASI INDONESIA Tbk AND SUBSIDIARIES
| NOTES TO THE CONSOLIDATED FINANCIAL STATEMENTS
| As of January 1, 2012 (Restated), December 31, 2012 (Restated) and December31, 2013
| and for the years ended December 31, 2011 (Restated), 2012 (Restated) and 2013
| (Figures in tables are presented in billions of rupiah, unless otherwise stated)
| |
Tabel of Content
15. TRADE AND OTHER PAYABLES (continued)
Trade payables to related parties and third parties as of December 31, 2012 and 2013 consist of:
| 2012 | | 2013 | | Related parties | | | | | Radio frequency usage charges, concession fees and USO charges | 607 | | 960 | | Purchases of equipment, materials and services | 414 | | 807 | | Payables to other telecommunications providers | 20 | | 21 | | Sub-total | 1,041 | | 1,788 | | Thirdparties | | | | | Purchases of equipment, materials and services | 6,035 | | 9,756 | | Payables to other telecommunications providers | 204 | | 56 | | Sub-total | 6,239 | | 9,812 | | Total | 7,280 | | 11,600 | |
Trade payables by currency are as follows:
| 2012 | | 2013 | | Rupiah | 4,146 | | 8,174 | | U.S.dollar | 3,111 | | 3,373 | | Others | 23 | | 53 | | Total | 7,280 | | 11,600 | |
Refer to Note 35 for details of related party transactions.
16. ACCRUED EXPENSES
| 2012 | | 2013 | | Operations, maintenance and telecommunications services | 2,917 | | 2,504 | | Salaries and benefits | 1,491 | | 1,453 | | General, administrative and marketing expenses | 882 | | 1,126 | | Interest and bank charges | 174 | | 181 | | Early retirement program (Note 28) | 699 | | - | | Total | 6,163 | | 5,264 | |
F-60
PERUSAHAAN PERSEROAN (PERSERO)
| PT TELEKOMUNIKASI INDONESIA Tbk AND SUBSIDIARIES
| NOTES TO THE CONSOLIDATED FINANCIAL STATEMENTS
| As of January 1, 2012 (Restated), December 31, 2012 (Restated) and December31, 2013
| and for the years ended December 31, 2011 (Restated), 2012 (Restated) and 2013
| (Figures in tables are presented in billions of rupiah, unless otherwise stated)
| |
Tabel of Content
16. ACCRUED EXPENSES (continued)
Accruals for early retirement program arose from the Decision Letter No. PR.206.01/r.02/PD000/COP-B0010000/2012 dated November 1, 2012 of the Human Capital and General Affairs Director on early retirement program which was communicated to the employees on the same date. The Company estimated the accrual on the basis of the number of eligible employees that met the criteria stipulated in the Company’s regulation related to this program. Accrued early retirement benefits as of December 31, 2012 amounting to Rp699 billion were charged to the 2012 consolidated statement of comprehensive income(Note 28). In 2013, the early retirement program had been completed and the related costs had been fully paid to the eligible employees.
Refer to Note 35 for details of related party transaction.
17. UNEARNED INCOME
| 2012 | | 2013 | | Prepaid pulse reload vouchers | 2,352 | | 3,117 | | Other telecommunications services | 132 | | 46 | | Others | 245 | | 327 | | Total | 2,729 | | 3,490 | |
18. SHORT-TERM LOANS AND OTHER BORROWINGS
Short-term loans and other borrowings consist of short-term bank loans and current maturities portion of long-term borrowings, as follows:
| 2012 | | 2013 | | Short term bank loans | 37 | | 432 | | Current maturities portion of long-term borrowings | 5,621 | | 5,093 | | Total | 5,658 | | 5,525 | |
a. Short-term bank loans
| | | | 2012 | | 2013 | | | | | | Outstanding | | Outstanding | | Lenders | | Currency | | Original currency (inmillions) | | Rupiah equivalent | | Original currency (in millions) | | Rupiah equivalent | | Bank CIMB Niaga | | Rp | | - | | 20 | | - | | 155 | | Bank UOB (Note 43h) | | Rp | | - | | - | | - | | 130 | | Bank Danamon | | Rp | | - | | - | | - | | 80 | | BRI | | Rp | | - | | - | | - | | 50 | | Others | | Rp | | - | | 13 | | - | | 17 | | | | US$ | | 0.42 | | 4 | | - | | - | | Total | | | | | | 37 | | | | 432 | |
Refer to Note 35 for details of related party transactions.
F-61
PERUSAHAAN PERSEROAN (PERSERO)
| PT TELEKOMUNIKASI INDONESIA Tbk AND SUBSIDIARIES
| NOTES TO THE CONSOLIDATED FINANCIAL STATEMENTS
| As of January 1, 2012 (Restated), December 31, 2012 (Restated) and December 31, 2013
| and for the years ended December 31, 2011 (Restated), 2012 (Restated) and 2013
| (Figures in tables are presented in billions of rupiah, unless otherwise stated)
| |
Tabel of Content
18. SHORT-TERM LOANS AND OTHER BORROWINGS (continued)
a. Short-term bank loans (continued)
Other significant information relating to short-term bank loans as of December 31, 2013is as follows:
| Borrower | | Currency | | Total facility (in billions) | | Maturity date | | Interest payment period | | Interest rate annum | | Security | | Bank CIMB Niaga | | | | | | | | | | | | | | | April 25, 2005 a | Balebat | | Rp | | 12 | | October 18, 2014 | | Monthly | | 11.00% | | Property and equipment (Note 12), inventories (Note8) and trade receivables (Note7 | ) | April 29, 2008 a | Balebat | | Rp | | 10 | | October 18, 2014 | | Monthly | | 11.00% | | Property and equipment (Note 12), inventories (Note8) and trade receivables (Note7 | ) | March 21, 2013 | Infomedia | | Rp | | 38 | | October 18, 2014 | | Monthly | | 10.25% | | Trade receivables (Note7 | ) | March 25, 2013 | Infomedia | | Rp | | 38 | | October 18, 2014 | | Monthly | | 10.25% | | Trade receivables (Note7 | ) | March 27, 2013 | Infomedia | | Rp | | 24 | | October 18, 2014 | | Monthly | | 10.25% | | Trade receivables (Note7 | ) | April 28, 2013 | GSD | | Rp | | 85 | | August 18, 2014 | | Monthly | | 9.75% | | Property and equipment (Note 12 | ) | September 30, 2013 | GSD | | Rp | | 50 | | August 18, 2014 | | Monthly | | 9.75% | | Property and equipment (Note 12 | ) | BRI | | | | | | | | | | | | | | | March 14, 2013 | Infomedia | | Rp | | 50 | | March 14, 2014 | | Monthly | | 10.00% | | Trade receivables (Note 7 | ) | Bank Danamon | | | | | | | | | | | | | | | August 23, 2013 | Infomedia | | Rp | | 80 | | August 23, 2014 | | Monthly | | 10.50% | | Trade receivables (Note 7 | ) | Bank UOB | | | | | | | | | | | | | | | November 22, 2013 | Infomedia | | Rp | | 200 | | November 22, 2014 | | Monthly | | 10.60% | | Trade receivables (Note 7 | ) |
The credit facilities obtained by the Company’s subsidiaries are used for working capital purposes.
abased on the latest amendment on October 10, 2012
b. Current maturities of long-term borrowings
| | Notes | | 2012 | | 2013 | | Two-step loans | 19a | | 196 | | 213 | | Bonds and notes | 19b | | 440 | | 276 | | Bank loans | 19c | | 4,475 | | 3,956 | | Obligations under finance leases | 12c.xiii | | 510 | | 648 | | Total | | | 5,621 | | 5,093 | |
| US$ | | Refer to Note 35 for details of related party transactions.0.2
| | April 30, 2013 | | - | | F-62Semi-annually
| PERUSAHAAN PERSEROAN (PERSERO)
| PT TELEKOMUNIKASI INDONESIA Tbk AND SUBSIDIARIES
| NOTES TO THE CONSOLIDATED FINANCIAL STATEMENTS
| As of January 1, 2012 (Restated), December 31, 2012 (Restated) and December 31, 2013
| and for the years ended December 31, 2011 (Restated), 2012 (Restated) and 2013
| (Figures in tables are presented in billions of rupiah, unless otherwise stated)
| |
Tabel of Content
19. LONG-TERM LOANS AND OTHER BORROWINGS
Long-term loans and other borrowings consist of long-term bank loans, bonds and notes, two-step loans and obligations under finance leases with balances as of December 31, 2012 and 2013 as follows:
| 2012 | | 2013 | | Two-step loans | 1,791 | | 1,702 | | Bonds and notes | 3,229 | | 3,073 | | Bank loans | 6,783 | | 5,635 | | Obligations under finance leases (Note 12c.xiii) | 1,814 | | 4,321 | | Total | 13,617 | | 14,731 | |
Scheduled principal payments as ofDecember 31, 2013 are as follows:
| | | Year | | | Total | | 2015 | | 2016 | | 2017 | | 2018 | | Thereafter | | Two-step loans | 1,702 | | 215 | | 218 | | 220 | | 196 | | 853 | | Bonds and notes | 3,073 | | 1,045 | | 33 | | - | | - | | 1,995 | | Bank loans | 5,635 | | 2,854 | | 1,040 | | 853 | | 487 | | 401 | | Obligations under finance leases | 4,321 | | 525 | | 535 | | 552 | | 545 | | 2,164 | | Total | 14,731 | | 4,639 | | 1,826 | | 1,625 | | 1,228 | | 5,413 | |
a. Two-step loans
Two-step loans are unsecured loans obtained by the Government which are then re-loaned to the Company. The loans entered into up to July 1994 are payable in rupiah based on the exchange rate at the date of drawdown. Loans entered into after July 1994 are payable in their original currencies and any resulting foreign exchange gain or loss is borne by the Company.
| | | | 2012 | | 2013 | | Lenders | | Currency | | Original currency (in millions) | | Rupiah equivalent | | Original currency (in millions) | | Rupiah equivalent | | Overseas bank | | Yen | | 9,215 | | 1,031 | | 8,447 | | 979 | | | | Rp | | - | | 574 | | - | | 507 | | | | US$ | | 40 | | 382 | | 35 | | 429 | | Total | | | | | | 1,987 | | | | 1,915 | | Current maturities (Note 18b) | | | | | | (196 | ) | | | (213 | ) | Long-term portion | | | | | | 1,791 | | | | 1,702 | |
Lenders
|
| Currency
|
| Principal payment
schedule
|
| Interest payment
period
|
| Interest rate
per annum
|
| Overseas banks
| | Yen
| | Semi-annually
| | Semi-annually
| | 3.10%
| | | | Rp
| | Semi-annually
| | Semi-annually
| | 6.79%
| | | | US$
| | Semi-annually
| | Semi-annually
| | 4.00%
| |
F-63
PERUSAHAAN PERSEROAN (PERSERO)
| PT TELEKOMUNIKASI INDONESIA Tbk AND SUBSIDIARIES
| NOTES TO THE CONSOLIDATED FINANCIAL STATEMENTS
| As of January 1, 2012 (Restated), December 31, 2012 (Restated) and December 31, 2013
| and for the years ended December 31, 2011 (Restated), 2012 (Restated) and 2013
| (Figures in tables are presented in billions of rupiah, unless otherwise stated)
| |
Tabel of Content
19. LONG-TERM LOANS AND OTHER BORROWINGS (continued)
a. Two-step loans (continued)
The loans were intended for the development of telecommunications infrastructure and supporting telecommunications equipment. The loans are due on various dates through 2024.
Since 2008, the Company had used all facilities under the two-step loans program and the drawdown period for the two-step loans had expired.
Under the loan covenants, the Company is required to maintain financial ratios as follows:
a. Projected net revenue to projected debt service ratio should exceed 1.2:1 for the two-step loans originating from Asian Development Bank (“ADB”).
b. Internal financing (earnings before depreciation and finance costs) should exceed 20% compared to annual average capital expenditures for loans originating from the ADB.
As of December 31, 2013, the Company has complied with the above-mentioned ratios.
Refer to Note 35 for details of related party transactions.
b. Bonds and notes
| | | | 2012 | | 2013 | | Bonds and notes | | Currency | | Original currency (inmillions) | | Rupiah equivalent | | Original currency (inmillions) | | Rupiah equivalent | | Bonds | | | | | | | | | | | | Series A | | Rp | | - | | 1,005 | | - | | 1,005 | | Series B | | Rp | | - | | 1,995 | | - | | 1,995 | | Promissorynotes | | | | | | | | | | | | PT Huawei | | US$ | | 46 | | 445 | | 18 | | 213 | | PT. ZTE Indonesia (“ZTE”) | | US$ | | 22 | | 216 | | 11 | | 136 | | Medium Term Notes (“MTN”) | | | | | | | | | | | | Finnet | | Rp | | - | | 8 | | - | | - | | Total | | | | | | 3,669 | | | | 3,349 | | Current maturities (Note 18b) | | | | | | (440) | | | | (276) | | Long-term portion | | | | | | 3,229 | | | | 3,073 | |
1.Bonds
Bonds | | Principal | | Issuer | | Listed on | | Issuance date | | Maturity date | | Interest payment period | | Interest rate per annum | | Series A | | 1,005 | | The Company | | IDX | | June 25, 2010 | | July 6, 2015 | | Quarterly | | 9.60% | | Series B | | 1,995 | | The Company | | IDX | | June 25, 2010 | | July 6, 2020 | | Quarterly | | 10.20% | | Total | | 3,000 | | | | | | | | | | | | | |
The funds received from the public offering of bonds net of issuance costs, were used to increase capital expenditures which consisted of wave broadband (bandwidth, softswitching, datacom, information technology and others) and infrastructure (backbone, metro network, regional metro junction, internet protocol and satellite system) and to optimize legacy and supporting facilities (fixed wireline and wireless).
The Company received the proceeds from the issuance of bonds on July 6 2010.
The bonds are secured by all of the Company’s assets, movable or non-movable, either existing or in the future (Note 12c.x). The underwriters of the bonds are Bahana, PT Danareksa Sekuritas and PT Mandiri Sekuritas and the trustee is Bank CIMB Niaga.
F-64
PERUSAHAAN PERSEROAN (PERSERO)
| PT TELEKOMUNIKASI INDONESIA Tbk AND SUBSIDIARIES
| NOTES TO THE CONSOLIDATED FINANCIAL STATEMENTS
| As of January 1, 2012 (Restated), December 31, 2012 (Restated) and December 31, 2013
| and for the years ended December 31, 2011 (Restated), 2012 (Restated) and 2013
| (Figures in tables are presented in billions of rupiah, unless otherwise stated)
| |
Tabel of Content
19. LONG-TERM LOANS AND OTHER BORROWINGS (continued)
b. Bonds and notes (continued)
1.Bonds (continued)
As of December 31, 2013, the rating of the bonds issued by PT Pemeringkat Efek Indonesia (Pefindo) is idAAA (stable outlook).
Based on the indenture trusts agreement, the Company is required to comply with all covenants or restrictions, including maintaining financial ratios as follows:
1. Debt to equity ratio should not exceed 2:1.
2. EBITDA to finance costs ratio should not be less than 5:1.
3. Debt service coverage is 125%.
As of December 31, 2013, the Company has complied with the above-mentioned ratios.
2.Promissorynotes
Supplier
| | Currency
|
| Principal
(inmillions)
|
| Issuance
date
|
| Interest payment
period
|
| Payment schedule
|
| Interest rate per annum
| | PTHuawei
| | US$
| | 300
| | June 19, 2009
| | Semi-annually
| | Semi-annually
(January 11, 2014 - June 23, 2016)
| | 6 month LIBOR+2.5%
| | ZTE
| | US$
| | 100
| | August 20, 2009
| | Semi-annually
| | Semi-annually
(February 11, 2014 - June 15, 2016)
| | 6 monthmonths LIBOR+1.5%
| |
ZTE | | Based on Agreement of Frame Supply and Deferred Payment Arrangement between the Company and each of ZTE and PT Huawei, the promissory notes issued by the Company to each of ZTE and PT Huawei are vendor financing facilities with no collateral covering 85% of Hand-over Report (“Berita Acara Serah Terima”) projects with ZTE and PT Huawei.US$
| | c. Bank loans0.1
| | | | | 2012 | | 2013 | | Lenders | | Currency | | Original currency (in millions) | | Rupiah equivalent | | Original currency (in millions) | | Rupiah equivalent | | BRI | | Rp | | - | | 4,011 | | - | | 3,035 | | Syndication of banks | | Rp | | - | | 1,950 | | - | | 2,426 | | BNI | | Rp | | - | | 1,201 | | - | | 1,305 | | BCA | | Rp | | - | | 1,564 | | - | | 858 | | Bank Mandiri | | Rp | | - | | 1,417 | | - | | 722 | | ABN Amro Bank N.V. Stockholm (“AAB Stockholm”) and SCB | | US$ | | 68 | | 659 | | 55 | | 673 | | Bank CIMB Niaga | | Rp | | - | | 174 | | - | | 365 | | Japan Bank for International Cooperation (“JBIC”) | | US$ | | 30 | | 289 | | 18 | | 219 | | Bank Bukopin | | Rp | | - | | - | | - | | 31 | | | | US$ | | - | | - | | 1 | | 12 | | Bank Ekonomi | | Rp | | - | | 41 | | - | | - | | | | US$ | | 0 | | 3 | | - | | - | | Others | | Rp | | - | | - | | - | | 1 | | Total | | | | | | 11,309 | | | | 9,647 | | Unamortized debt issuance cost | | | | | | (51 | ) | | | (56 | ) | | | | | | | 11,258 | | | | 9,591 | | Current maturities (Note 18b) | | | | | | (4,475 | ) | | | (3,956 | ) | Long-term portion | | | | | | 6,783 | | | | 5,635 | |
| August 20, 2009b | | Refer to Note 35 for details of related party transactions.February 4, 2017
| | Semi-annually | | F-656 months LIBOR+1.5%
| PERUSAHAAN PERSEROAN (PERSERO)
| PT TELEKOMUNIKASI INDONESIA Tbk AND SUBSIDIARIES
| NOTES TO THE CONSOLIDATED FINANCIAL STATEMENTS
| As of January 1, 2012 (Restated), December 31, 2012 (Restated) and December 31, 2013
| and for the years ended December 31, 2011 (Restated), 2012 (Restated) and 2013
| (Figures in tables are presented in billions of rupiah, unless otherwise stated)
| |
Tabel of Content
19
| | |
*in original currency. ahas beenfullypaid on July 30, 2016. bbased onthe latest amendmentonAugust 15, 2011. Based on Agreement of Frame Supply and Deferred Payment Arrangement between the Company, ZTE and PT Huawei, the promissory notes issued by the Company to ZTE and PT Huawei are vendor financing facilities with no collateral covering 85% of Hand-over Report (“Berita Acara Serah Terimaâ€) projects with ZTE and PT Huawei. F-61
PERUSAHAAN PERSEROAN (PERSERO) PT TELEKOMUNIKASI INDONESIA Tbk AND SUBSIDIARIES NOTES TO THE CONSOLIDATED FINANCIAL STATEMENTS As of December 31, 2015 and 2016 and for the Years Ended December 31, 2014, 2015 and 2016 (Figures in tables are expressedin billions ofRupiah, unless otherwise stated) Table of Content
17. LONG-TERM LOANS AND OTHER BORROWINGS(continued) c. Bank loans (continued)
Other significant information relating to bank loans as of December 31, 2013 is as follows:
| Borrower | | Currency | | Total facility (in billions) | | Current period payment | | Payment schedule | | Interest payment period | | Interest rate per annum | | Security | | BRI | | | | | | | | | | | | | | | | | October 13, 2010a | The Company | | Rp | | 3,000 | | 1,000 | | Semi-annually (2013-2015) | | Quarterly | | 3 months JIBOR+1.25% | | None | | July 20, 2011a | Dayamitra | | Rp | | 1,000 | | 160 | | Semi-annually (2011-2017) | | Quarterly | | 3 months JIBOR+1.40% | | Property and equipment (Note 12) | | April 26, 2013 | GSD | | Rp | | 141 | | - | | Monthly (2014-2018) | | Monthly | | 10.00% | | Propety and equipment (Note 12) and lease agreement | | October 30, 2013 | GSD | | Rp | | 70 | | - | | Monthly (2014-2021) | | Monthly | | 10.00% | | Property and equipment (Note 12), trade receivables (Note 7) and lease agreement | | October 30, 2013 | GSD | | Rp | | 34 | | - | | Monthly (2014-2021) | | Monthly | | 10.00% | | Property and equipment (Note 12), trade receivables (Note 7) and lease agreement | | Syndication of banks | | | | | | | | | | | | | | | | | July 29, 2008a | The Company | | Rp | | 2,400 | | 600 | | Semi-annually (2010-2013) | | Quarterly | | 3 months JIBOR+1.20% | | None | | (BNI, BRI and BJB) | | | | | | | | | | | | | | | | | June 16, 2009a | The Company | | Rp | | 2,700 | | 675 | | Semi-annually (2011-2014) | | Quarterly | | 3 months JIBOR+2.45% | | None | | (BNI and BRI) | | | | | | | | | | | | | | | | | December 19, 2012 | Dayamitra | | Rp | | 2,500 | | - | | Semi annually (2014-2020) | | Quarterly | | 3 months JIBOR + 3.00% | | Property and equipment (Note 12) and trade receivables (Note 7) | | (BNI, BRI and Bank Mandiri) k | | | | | | | | | | | | | | | | | BNI | | | | | | | | | | | | | | | | | October 13, 2010a | The Company | | Rp | | 1,000 | | 286 | | Semi-annually (2013-2015) | | Quarterly | | 3 months JIBOR+1.25% | | None | | December 23, 2011 a | PIN | | Rp | | 500 | | 43 | | Semi-annually (2013-2016) | | Quarterly | | 3 months JIBOR+1.50% | | Inventories (Note 8) and trade receivables (Note 7) | | November 28, 2012a | Metra | | Rp | | 44 | | 4 | | Annually (2013-2015) | | Monthly | | 10.25% | | Property and equipment (Note 12) and trade receivables (Note 7) | | March 13, 2013a&h | Sigma | | Rp | | 300 | | 35 | | Monthly (2013-2015) | | Monthly | | 1 month JIBOR +3.35% | | Property and equpment (Note 12) and trade receivables (Note 7) | |
F-66
PERUSAHAAN PERSEROAN (PERSERO)
| PT TELEKOMUNIKASI INDONESIA Tbk AND SUBSIDIARIES
| NOTES TO THE CONSOLIDATED FINANCIAL STATEMENTS
| As of January 1, 2012 (Restated), December 31, 2012 (Restated) and December 31, 2013
| and for the years ended December 31, 2011 (Restated), 2012 (Restated) and 2013
| (Figures in tables are presented in billions of rupiah, unless otherwise stated)
| |
Tabel of Content
19. LONG-TERM LOANS AND OTHER BORROWINGS (continued)
c. Bank loans | | | | 2015 | | 2016 | | | | | | Outstanding | | Outstanding | | Lenders | | Currency | | Original currency (in millions) | | Rupiah equivalent | | Original currency (in millions) | | Rupiah equivalent | | Related parties | | | | | | | | | | | | BNI | | Rp | | - | | 3,430 | | - | | 3,222 | | BRI | | Rp | | - | | 1,806 | | - | | 1,871 | | Bank Mandiri | | Rp | | - | | 2,191 | | - | | 1,232 | | Sub-total | | | | | | 7,427 | | | | 6,325 | | Third parties | | | | | | | | | | | | Syndication of banks | | Rp | | - | | 4,900 | | - | | 3,650 | | The Bank of Tokyo-Mitsubishi-UFJ, Ltd. | | Rp | | - | | 2,370 | | - | | 2,361 | | | | US$ | | 75 | | 1,035 | | - | | - | | Bank CIMB Niaga | | Rp | | - | | 770 | | - | | 1,162 | | PTBank Sumitomo Mitsui Indonesia | | Rp | | - | | 370 | | - | | 647 | | UOB | | Rp | | - | | - | | - | | 500 | | United Overseas Bank Limited(“UOB Singaporeâ€) | | US$ | | - | | - | | 36 | | 484 | | PTBank ANZ Indonesia | | Rp | | - | | 90 | | - | | 240 | | | | US$ | | 75 | | 1,035 | | - | | - | | Japan Bank for International Cooperation (“JBICâ€) | | US$ | | 22 | | 303 | | 16 | | 211 | | PT Bank Central Asia Tbk (“BCAâ€) | | Rp | | - | | 111 | | - | | - | | Others | | Rp | | - | | 19 | | - | | 37 | | Sub-total | | | | | | 11,003 | | | | 9,292 | | Total | | | | | | 18,430 | | | | 15,617 | | Unamortized debt issuance cost | | | | | | (68 | ) | | | (51 | ) | | | | | | | 18,362 | | | | 15,566 | | Current maturities (Note 16b) | | | | | | (2,928 | ) | | | (3,637 | ) | Long-term portion | | | | | | 15,434 | | | | 11,929 | |
Refer to Note 31 for details of related party transactions. Other significant information relating to bank loans as of December 31, 2016 is as follows:
| | Borrower | | Currency | | Total facility* (in billions) | | Current period payment (in billions) | | Principal payment schedule | | Interest payment period | | Interest rate per annum | | Security | | Syndication of banks | | | | | | | | | | | | | | | | | | December 19, 2012 (BNI, BRI and Bank Mandiri)a | | Dayamitra | | Rp | | 2,500 | | 1,000 | | Semi-annually (2014-2020) | | Quarterly | | 3 months JIBOR+3.00% | | Trade receivables (Note6) and property and equipment (Note10) | | March 13, 2015 (BNI and BCA) a&h | | The Company | | Rp | | 2,900 | | 242 | | Semi-annually (2016-2022) | | Quarterly | | 3 months JIBOR+2.5% | | All assets (Note 10c.ix) | | March 13, 2015 (BNI and BCA) a&h | | GSD | | Rp | | 100 | | 8 | | Semi-annually (2016-2022) | | Quarterly | | 3 months JIBOR+2.5% | | All assets (Note 10c.ix) | | BNI | | | | | | | | | | | | | | | | | | March 13, 2013a&i | | Sigma | | Rp | | 1,400 | | 91 | | Monthly (2016-2020) | | Monthly | | 1 month JIBOR+3.35% | | Trade receivables (Note6) andproperty and equipment (Note10) | |
F-62
PERUSAHAAN PERSEROAN (PERSERO) PT TELEKOMUNIKASI INDONESIA Tbk AND SUBSIDIARIES NOTES TO THE CONSOLIDATED FINANCIAL STATEMENTS As of December 31, 2015 and 2016 and for the Years Ended December 31, 2014, 2015 and 2016 (Figures in tables are expressedin billions ofRupiah, unless otherwise stated) Table of Content
17. LONG-TERM LOANS AND OTHER BORROWINGS (continued) c. Bank loans (continued) | Borrower | | Currency | | Total facility (in billions) | | Current period payment | | Payment schedule | | Interest payment period | | Interest rate per annum | | Security | | BNI (continued) | | | | | | | | | | | | | | | | | March 26, 2013a | Metra | | Rp | | 60 | | 15 | | Quarterly (2013-2016) | | Quarterly | | 10.25% | | Property and equpment (Note12) and trade receivables (Note7) | | May 2, 2013a | Sigma | | Rp | | 312 | | - | | Monthly (2015-2021) | | Monthly | | 1 month JIBOR +3.35% | | Property and equpment (Note12) and trade receivables (Note7) | | November 25, 2013a | Metra | | Rp | | 90 | | - | | Quarterly (2013-2016) | | Monthly | | 10.25% | | Property and equpment (Note12) and trade receivables (Note7) | | BCA | | | | | | | | | | | | | | | | | July9, 2009b&c and July 5, 2010 b&c | Telkomsel | | Rp | | 4,000 | | 666 | | Semi-annually (2009-2016) | | Quarterly | | 3 months JIBOR+1.00% | | None | | December 16, 2010a | TII | | Rp | | 200 | | 40 | | Semi-annually (2011-2015) | | Quarterly | | 3 months JIBOR+1.25% | | None | | Bank Mandiri | | | | | | | | | | | | | | | | | July9, 2009b&c and July 5, 2010 b&c | Telkomsel | | Rp | | 5,000 | | 695 | | Semi-annually (2009-2016) | | Quarterly | | 3 months JIBOR+1.00% | | None | | AAB Stockholm and SCB | | | | | | | | | | | | | | | | | December 30, 2009b&d | Telkomsel | | US$ | | 0.3 | | 0 | | Semi-annually (2011-2016) | | Semi-annually | | 6 months LIBOR+0.82% | | None | | Bank CIMB Niaga | | | | | | | | | | | | | | | | | March 21, 2007f | GSD | | Rp | | 21 | | 4 | | Quarterly (2007-2015) | | Monthly | | 9.75% | | Property and equipment (Note12) | | July 28, 2009g | Balebat | | Rp | | 2 | | 0.6 | | Monthly (2010-2015) | | Monthly | | 11.00% | | Property and equipment (Note12), inventories (Note8), and trade receivables (Note7) | | May 24, 2010 g | Balebat | | Rp | | 1 | | 0.4 | | Monthly (2010-2015) | | Monthly | | 11.00% | | Property and equipment (Note12), inventories (Note8), and trade receivables (Note7) | | March 31, 2011 | GSD | | Rp | | 24 | | 3 | | Monthly (2011-2020) | | Monthly | | 9.75% | | Property and equipment (Note12) andleaseagreement | |
F-67
PERUSAHAAN PERSEROAN (PERSERO)
| PT TELEKOMUNIKASI INDONESIA Tbk AND SUBSIDIARIES
| NOTES TO THE CONSOLIDATED FINANCIAL STATEMENTS
| As of January 1, 2012 (Restated), December 31, 2012 (Restated) and December 31, 2013
| and for the years ended December 31, 2011 (Restated), 2012 (Restated) and 2013
| (Figures in tables are presented in billions of rupiah, unless otherwise stated)
| |
Tabel of Content
19. LONG-TERM LOANS AND OTHER BORROWINGS (continued)
c. Bank loans (continued)
| | Borrower | | Currency | | Total facility* (in billions) | | Current period payment (in billions) | | Principal payment schedule | | Interest payment period | | Interest rate per annum | | Security | | BNI (continued) | | | | | | | | | | | | | | | | | | June 27, 2013 | | NSI | | Rp | | 4 | | 0 | | Monthly (2014-2023) | | Monthly | | 11.00% | | Property and equipment(Note10) | | November 20, 2013 | | The Company | | Rp | | 1,500 | | 375 | | Semi-annually (2015-2018) | | Quarterly | | 3 months JIBOR+2.65% | | None | | January 10, 2014 a&c | | Sigma | | Rp | | 247 | | 38 | | Monthly (2016-2022) | | Monthly | | 1 month JIBOR+3.35% | | Trade receivables (Note6) and property and equipment (Note10) | | March 17, 2014 | | NSI | | Rp | | 0.7 | | 0 | | Monthly (2014-2023) | | Monthly | | 12.25% | | Property and equipment
(Note10) | | June 27, 2014 | | NSI | | Rp | | 2.5 | | 0 | | Monthly (2014-2023) | | Monthly | | 13.5% | | Property and equipment
(Note10) | | July 21, 2014 a | | Metra | | Rp | | 40 | | 13 | | Semi-annually (2015-2017) | | Monthly | | 10.00% | | Trade receivables (Note 6) and property andequipment (Note 10) | | November 3, 2014a&g | | Telkom Infratel | | Rp | | 450 | | 131 | | Quarterly (2015-2018) | | Monthly | | 1 month JIBOR+3.35% | | Trade receivables (Note 6) | | April 8, 2015 a | | Telkomsel | | Rp | | 1,000 | | 667 | | April 14, 2018 | | Quarterly | | 3 months JIBOR+1.95% | | None | | June 10, 2015 a | | Metra | | Rp | | 44 | | 15 | | Semi-annually (2015-2017) | | Monthly | | 10.00% | | Trade receivables (Note 6) and property and equipment (Note 10) | | October 12, 2015a | | Telkom Akses | | Rp | | 1,400 | | 151 | | Semi-annually (2016-2019) | | Quarterly | | 3 months JIBOR+2.9% | | Trade receivables (Note 6), inventories (Note 7) and property and equipment(Note 10) | | October 31, 2016 | | Telkom Infratel | | Rp | | 59 | | - | | Quarterly (2017-2019) | | Monthly | | 1 month JIBOR+3.35% | | Trade receivables (Note 6) | | The Bank of Tokyo - Mitsubishi UFJ, Ltd. | | | | | | | | | | | | | | | | | | October 9, 2014 | | Dayamitra | | Rp | | 600 | | 120 | | Quarterly (2016-2019) | | Quarterly | | 3 monthsJIBOR+2.4% | | Trade receivables (Note6) and property andequipment (Note 10) | | March 13, 2015a&h | | Metra | | Rp | | 400 | | 12 | | Quarterly (2016-2020) | | Quarterly | | 3 monthsJIBOR+2.15% | | None | | March 13, 2015a&h | | Infomedia | | Rp | | 250 | | 5 | | Quarterly (2016-2020) | | Quarterly | | 3 monthsJIBOR+2.15% | | None | | April 8, 2015a | | Telkomsel | | Rp | | 1,000 | | 667 | | April 14, 2018 | | Quarterly | | 3 monthsJIBOR+1.95% | | None | | April 8, 2015a | | Telkomsel | | US$ | | 0.075 | | 0.075 | | April 14, 2018 | | Quarterly | | 3 monthsLIBOR+1.2% | | None | |
F-63
PERUSAHAAN PERSEROAN (PERSERO) PT TELEKOMUNIKASI INDONESIA Tbk AND SUBSIDIARIES NOTES TO THE CONSOLIDATED FINANCIAL STATEMENTS As of December 31, 2015 and 2016 and for the Years Ended December 31, 2014, 2015 and 2016 (Figures in tables are expressedin billions ofRupiah, unless otherwise stated) Table of Content
17. LONG-TERM LOANS AND OTHER BORROWINGS (continued) c. Bank loans (continued) | | Borrower | | Currency | | Total facility* (in billions) | | Current period payment (in billions) | | Principal payment schedule | | Interest payment period | | Interest rate per annum | | Security | | The Bank of Tokyo - Mitsubishi UFJ, Ltd. (continued) | | | | | | | | | | | | | | | | | | November 2, 2015 | | Dayamitra | | Rp | | 400 | | - | | Quarterly (2017-2020) | | Quarterly | | 3 months JIBOR+2.6% | | Trade receivables (Note 6), and property andequipment (Note 10) | | March 13, 2015 a&h | | Dayamitra | | Rp | | 100 | | 3 | | Quarterly (2016-2020) | | Quarterly | | 3 months JIBOR+2.15% | | None | | October 3, 2016 | | Dayamitra | | Rp | | 500 | | - | | Semi-annually (2019-2024) | | Quarterly | | 3 months JIBOR+2.25% | | Property and equipment (Note10) | | BRI | | | | | | | | | | | | | | | | | | July 20, 2011a | | Dayamitra | | Rp | | 1,000 | | 220 | | Semi-annually (2013-2017) | | Quarterly | | 3 months JIBOR+1.40and 3 months JIBOR+3.50% | | Property andequipment(Note 10) | | October 30, 2013 | | GSD | | Rp | | 70 | | 8 | | Monthly (2014-2021) | | Monthly | | 10.00% | | Trade receivables (Note6), property and equipment (Note10) and lease agreement | | October 30, 2013 | | GSD | | Rp | | 34 | | 45 | | Monthly (2014-2021) | | Monthly | | 10.00% | | Trade receivables (Note6), property and equipment (Note10) and lease agreement | | November 20, 2013 | | The Company | | Rp | | 1,500 | | 375 | | Semi-annually (2015-2018) | | Quarterly | | 3 months JIBOR+2.65% | | None | | December18, 2015 | | Dayamitra | | Rp | | 800 | | - | | Semi-annualy (2017-2020) | | Quarterly | | 3 months JIBOR+2.70% | | Property and equipment
(Note10) | | Bank Mandiri | | | | | | | | | | | | | | | | | | November 20, 2013 | | The Company | | Rp | | 1,500 | | 375 | | Semi-annually (2015-2018) | | Quarterly | | 3 months JIBOR+2.65% | | None | | August 11, 2014 | | Graha Yasa Selaras | | Rp | | 71 | | 4 | | Monthly (2016-2021) | | Monthly | | 3 months JIBOR+3.25% | | Property and equipment(Note 10) | | August 11, 2014 | | Graha Yasa Selaras | | Rp | | 71 | | 2 | | Monthly (2016-2021) | | Monthly | | 3 months JIBOR+3.25% | | Property and equipment(Note 10) | | April 8, 2015 a | | Telkomsel | | Rp | | 1,000 | | 667 | | April 14, 2018 | | Quarterly | | 3 months JIBOR+1.95% | | None | | September 27, 2016 | | Patrakom | | Rp | | 70 | | - | | Quarterly (2017-2019) | | Monthly | | 9.5% | | Trade receivables (Note 6) and property and equipment (Note 10) | | Bank CIMB Niaga | | | | | | | | | | | | | | | | | | March 31, 2011 | | GSD | | Rp | | 24 | | 3 | | Monthly (2011-2020) | | Monthly | | 9.75% | | Property and equipment (Note10) and lease agreement | | March 31, 2011 | | GSD | | Rp | | 13 | | 2 | | Monthly (2011-2019) | | Monthly | | 9.75% | | Property and equipment (Note10) and lease agreement | | September 9, 2011 | | GSD | | Rp | | 41 | | 4 | | Monthly (2011-2021) | | Monthly | | 9.75% | | Property and equipment (Note10) andlease agreement | |
F-64
PERUSAHAAN PERSEROAN (PERSERO) PT TELEKOMUNIKASI INDONESIA Tbk AND SUBSIDIARIES NOTES TO THE CONSOLIDATED FINANCIAL STATEMENTS As of December 31, 2015 and 2016 and for the Years Ended December 31, 2014, 2015 and 2016 (Figures in tables are expressedin billions ofRupiah, unless otherwise stated) Table of Content
17. LONG-TERM LOANS AND OTHER BORROWINGS (continued) c. Bank loans (continued) | | Borrower | | Currency | | Total facility* (in billions) | | Current period payment (in billions) | | Principal payment schedule | | Interest payment period | | Interest rate per annum | | Security | | Bank CIMB Niaga (continued) | | | | | | | | | | | | | | | | | | September 20, 2012a | | TLT | | Rp | | 1,150 | | - | | Monthly (2015-2030) | | Quarterly | | 3 months JIBOR+3.45% | | Property and equipment
(Note10) | | September 20, 2012a | | TLT | | Rp | | 118 | | - | | Monthly (2015-2030) | | Monthly | | 9.00% | | Property and equipment (Note 10) | | August 26, 2013d | | Balebatf | | Rp | | 3.5 | | 1 | | Monthly (2013-2018) | | Monthly | | 13.00% | | Trade receivables (Note6), inventories (Note7) and property and equipment(Note 10) | | PT Bank Sumitomo Mitsui Indonesia | | | | | | | | | | | | | | | | | | March 13, 2015 a&h | | Metra | | Rp | | 400 | | 12 | | Quarterly (2016-2020) | | Quarterly | | 3 months JIBOR+2.15% | | None | | March 13, 2015a&h | | Infomedia | | Rp | | 250 | | 5 | | Quarterly (2016-2020) | | Quarterly | | 3 months JIBOR+2.15% | | None | | March 13, 2015a&h | | Dayamitra | | Rp | | 100 | | 3 | | Quarterly(2016-2020) | | Quarterly | | 3months JIBOR+2.15% | | None | | UOB | | | | | | | | | | | | | | | | | | September 22, 2016 | | Dayamitra | | Rp | | 500 | | - | | Semi-annually (2018-2024) | | Quarterly | | 3months JIBOR+2.2% | | Property and equipment
(Note10) | | UOB Singapore | | | | | | | | | | | | | | | | | | September 9, 2016 | | TII | | US$ | | 0.06 | | - | | Semi-annually (2019-2022) | | Quarterly | | 3 months LIBOR+1.5% | | None | | Bank ANZ Indonesia | | | | | | | | | | | | | | | | | | March 13, 2015 a&h | | GSD | | Rp | | 249.5 | | - | | June 13, 2020 | | Quarterly | | 3 monthsJIBOR+2.00% | | None | | April 8, 2015 a | | Telkomsel | | US$ | | 0.075 | | 0.075 | | April 14, 2018 | | Quarterly | | 3 months LIBOR+1.20% | | None | | JBIC | | | | | | | | | | | | | | | | | | March 28, 2013a&e | | The Company | | US$ | | 0.03 | | 0.006 | | Semi-annually (2014-2019) | | Semi-annually | | 2.18% and
6 months LIBOR+1.20% | | None | | BCA | | | | | | | | | | | | | | | | | | July 9, 2009b and July 5, 2010b | | Telkomsel | | Rp | | 4,000 | | 111 | | Semi-annually
(2009-2016) | | Quarterly | | 3 months JIBOR+1.00% | | None | |
The credit facilitieswereobtained by the Group for working capital purposes. * In original currency. a As stated in the agreements, the Group is required to comply with all covenants or restrictions such as dividend distribution, obtaining new loans, and maintaining financial ratios. As of December 31, 2016, the Group has complied with all covenants or restrictions, except for certain loans. As of December 31, 2016, the Groupobtainedwaiver fromlenders to not demand the loan payment as consequence of the breachofcovenants. b Telkomsel has no collateral for its bank loans, or other credit facilities. The terms of the various agreements with Telkomsel’s lenders and financiers require compliance with a number of covenants and negative covenants as well as financial and other covenants, which include, among other things, certain restrictions on the amount of dividends and other profit distributions which could adversely affect Telkomsel’s capacity to comply with its obligation under the facility. The terms of the relevant agreements also contain default and cross default clauses. As of December 31, 2016 Telkomsel has complied with the above covenants. F-65
PERUSAHAAN PERSEROAN (PERSERO) PT TELEKOMUNIKASI INDONESIA Tbk AND SUBSIDIARIES NOTES TO THE CONSOLIDATED FINANCIAL STATEMENTS As of December 31, 2015 and 2016 and for the Years Ended December 31, 2014, 2015 and 2016 (Figures in tables are expressedin billions ofRupiah, unless otherwise stated)
Table of Content
17. LONG-TERM LOANS AND OTHER BORROWINGS (continued) c. Bank loans (continued) c Based on the latest amendment on January 12, 2015. d Based on the latest amendment on September 22, 2014. e In connection with the agreement with NEC Corporation Consortium and TE SubCom, the Company entered into a loan agreement with JBIC, for the procurement of goods and services from NEC Corporation Consortium and TE SubCom for the Southeast Asia Japan Cable System project. The facilities consist of facilities A and B amounting to US$18.8 million and US$12.5 million, respectively. f MD Media’s subsidiary. g Based on the latest amendment onJuly 13, 2015. h OnMarch 13, 2015, the Company, GSD, Metra and Infomedia entered into several credit facilities agreements with PT Bank Sumitomo Mitsui Indonesia, The Bank of Tokyo- Mitsubishi UFJ, Ltd., PT Bank ANZ Indonesia and syndication of banks (BCA and BNI) amounting to Rp750 billion, Rp750 billion, Rp500 billion, and Rp3,000 billion, respectively. As ofDecember 31, 2016, the unused facilities for PT Bank Sumitomo Mitsui Indonesia, The Bank of Tokyo - Mitsubishi UFJ, Ltd.,andPT Bank ANZ Indonesia amounted to Rp82.5billion, Rp82.5billion and Rp250.5billion, respectively. i Based on the latest amendment on November 14, 2016. d.Other borrowing | Borrower | | Currency | | Total facility (in billions) | | Current period payment | | Payment schedule | | Interest payment period | | Interest rate per annum | | Security | | Bank CIMB Niaga (continued) | | | | | | | | | | | | | | | | | March 31, 2011 | GSD | | Rp | | 13 | | 2 | | Monthly (2011-2019) | | Monthly | | 9.75% | | Property and equipment (Note 12) and lease agreement | | March 31, 2011 | GSD | | Rp | | 12 | | 2 | | Monthly (2011-2016) | | Monthly | | 9.75% | | Property and equipment (Note 12) and lease agreement | | September 9, 2011 | GSD | | Rp | | 41 | | 4 | | Monthly (2011-2021) | | Monthly | | 9.75% | | Property and equipment (Note 12) and lease agreement | | September 9, 2011 | GSD | | Rp | | 11 | | 3 | | Monthly (2011-2015) | | Monthly | | 9.75% | | Property and equipment (Note 12) and lease agreement | | August 2, 2012g | Balebat | | Rp | | 4 | | 1 | | Monthly (2012-2015) | | Monthly | | 11.00% | | Property and equipment (Note 12), inventories (Note 8), and trade receivables (Note 7) | | September 20, 2012a | TLT | | Rp | | 1,150 | | - | | Monthly (2015-2030) | | Monthly | | 3 Month JIBOR+3.45% | | Property and equipment (Note 12) | | September 20, 2012a | TLT | | Rp | | 118 | | - | | Monthly (2015-2030) | | Monthly | | 9.00% | | Property and equipment (Note 12) | | October 10, 2012g | Balebat | | Rp | | 1 | | 0.5 | | Monthly (2012-2015) | | Monthly | | 11.00% | | Property and equipment (Note 12), inventories (Note 8), and trade receivables (Note 7) | | August 26, 2013 | Balebat | | Rp | | 3.5 | | 0.2 | | Monthly (2013-2018) | | Monthly | | 11.00% | | Property and equipment (Note 12), inventories (Note 8) and trade receivables (Note 7) | |
| | F-68
PERUSAHAAN PERSEROAN (PERSERO)
| PT TELEKOMUNIKASI INDONESIA Tbk AND SUBSIDIARIES
| NOTES TO THE CONSOLIDATED FINANCIAL STATEMENTS
| As of January 1, 2012 (Restated), December 31, 2012 (Restated) and December 31, 2013
| and for the years ended December 31, 2011 (Restated), 2012 (Restated) and 2013
| (Figures in tables are presented in billions of rupiah, unless otherwise stated)Borrower
|
| Currency |
| Total facility (in billions) |
| Current period payment
(in billions) |
| Principal payment schedule |
| Interest payment period |
| Interest rate per annum |
| Security |
| PT Sarana Multi Infrastruktur | | | | | | | | | | | | | | | | | |
October 12, 2016 | | Tabel of ContentDMT
19. LONG-TERM LOANS AND OTHER BORROWINGS (continued)
c. Bank loans (continued)
| Borrower | | Currency | | Total facility (in billions) | | Current period payment | | Payment schedule | | Interest payment period | | Interest rate per annum | | Security | | JBIC | | | | | | | | | | | | | | | | | March 26, 2010a&e | The Company | | US$ | | 0.06 | | 0 | | Semi-annually (2010-2015) | | Semi-annually | | 4.56% and 6 months LIBOR+0.70% | | None | | March 28, 2013a&j | The Company | | US$ | | 0.03 | | - | | Semi-annually | | Semi-annually | | 2.18% and 6 months LIBOR+1.20% | | None | | Bank Bukopin | | | | | | | | | | | | | | | | | August 4, 2011i | Patrakom | | Rp | | 9 | | 2 | | Monthly (2012-2015) | | Monthly | | 11.00% | | Property and equipment (Note 12) and trade receivables (Note 7) | | June28, 2013 | Patrakom | | Rp | | 35 | | 1.5 | | Monthly (2013-2016) | | Monthly | | 11.00% | | Property and equipment (Note 12) | | December 18, 2012 | Patrakom | | US$ | | 0.013 | | 0.0003 | | Monthly (2013-2016) | | Monthly | | 6.50% | | Property and equipment (Note12) | | Bank Ekonomi | | | | | | | | | | | | | | | | | September 10, 2008a&h | Sigma | | Rp | | 33 | | 15 | | Monthly (2009-2015) | | Monthly | | 9.00% | | Property and equipment (Note 12) and trade receivables (Note 7) | | August 7, 2009a&h | Sigma | | Rp | | 35 | | 3 | | Monthly for some installments (2009-2013) | | Monthly | | 9.00% | | Property and equipment (Note 12) and trade receivables (Note7) | | August 7, 2009a&h | Sigma | | Rp | | 20 | | 7 | | Monthly for some installments (2009-2014) | | Monthly | | 9.00% | | Property and equipment (Note 12) and trade receivables (Note 7) | | February 23, 2011a&h | Sigma | | Rp | | 30 | | 16 | | Monthly (2011-2015) | | Monthly | | 9.00% | | Property and equipment (Note 12) and trade receivables (Note 7) | | February 23, 2011a&h | Sigma | | US$ | | 0.002 | | 0.0003 | | Monthly (2011-2015) | | Monthly | | 6.00% | | Property and equipment (Note 12) and trade receivables (Note 7) | |
| | Rp | | 700 | | F-69-
| PERUSAHAAN PERSEROAN (PERSERO)
| Semi-annually (2018-2025) | | Quarterly | | 3 monthsJIBOR+2.20% | | Property and equipment
(Note10) | | PT TELEKOMUNIKASI INDONESIA Tbk AND SUBSIDIARIES
| NOTES TO THE CONSOLIDATED FINANCIAL STATEMENTS
| As of January 1, 2012 (Restated), December 31, 2012 (Restated) and December 31, 2013
| and for the years ended December 31, 2011 (Restated), 2012 (Restated) and 2013
| (Figures in tables are presented in billions of rupiah, unless otherwise stated)
| |
Tabel of Content
19. LONG-TERM LOANS AND OTHER BORROWINGS (continued)
c. Bank loans (continued)
The credit facilities obtained by the Group are used for working capital purposes.
a As stated in the agreements, the Group is required to comply with all covenants or restrictions such as dividend distribution, obtaining new loans, including maintaining financial ratios. As of December 31, 2013, the Group has complied with all covenants or restrictions.
b Telkomsel has no collateral for its bank loans, or other credit facilities. The terms of the various agreements with Telkomsel’s lenders and financiers require compliance with a number of pledges and negative pledges as well as financial and other covenants, which include, among other things, certain restrictions on the amount of dividends and other profit distributions which could adversely affect Telkomsel’s capacity to comply with its obligation under the facility. The terms of the relevant agreements also contain default and cross default clauses. As of December 31, 2013, Telkomsel has complied with the above covenants.
c In January 2012, the availability periods of the facilities from BCA and Bank Mandiri expired.
d Pursuant to the agreements with PT Ericsson Indonesia (“Ericsson Indonesia”) and Ericsson AB (Note 38a.ii), Telkomsel entered into an EKN-Backed Facility Agreement (“facility”) with ABN Amro Bank N.V. Stockholm branch (as “the original lender”) and Standard Chartered Bank (as “the original lender” , “the arranger”, “the facility agent” and “the EKN agent”) and ABN Amro Bank N.V., Hong Kong (as “the arranger”) for the purchase of Ericsson telecommunication equipment and services. The facilities consist of facility 1, 2 and 3 amounting to US$117 million, US$106 million and US$95 million, respectively. The availability period of facility 1, 2 and 3 expired in July 2010, March 2011 and November 2011, respectively. In October 2011, EKN agreed to reduce the premium of the unused facility by US$3 million through a cash refund.
e In connection with the agreement with NSW-Fujitsu Consortium, the Company entered into a loan agreement with JBIC, the international arm of Japan Finance Corporation, for the purchase of NSW-Fujitsu Consortium telecommunication equipment and services. The facilities consist of facility A and B amounting to US$36 million and US$24 million, respectively.
f Based on the latest amendment on March 31, 2011
g Based on the latest amendment in 2013
h In March 2013, the bank loan was fully repaid by Sigma through refinancing with BNI.
i In August 2013,thebank loan was rescheduledup to February 2015.
jIn connection with the agreement withNEC CorporationConsortium and TE SubCom, the Company entered into a loan agreement with JBIC, for the procurement of goods and services from NEC Corporation Consortium and TE SubCom for the Southeast Asia Japan Cable System Project. The facilities consist of facility A and facility B amounting to US$18.8 million and US$12.5 million, respectively.
20.
| |
Under the agreement, DMT is required to comply with all covenants or restrictions, including maintaining financial ratios as follows : 1.Debt to equity ratio should not exceed 5:1 2.Net debt to EBITDA ratio should not exceed 4:1 3.Debt service coverage of at least 100% As of December 31, 2016, DMT has complied with the above-mentioned ratios. Refer to Note 31 for details of related party transactions. 18. NON-CONTROLLING INTERESTS
The details of non-controlling interests are as follows:
| 2015 | | 2016 | | Non-controlling interests in net assets of subsidiaries | | | | | Telkomsel | 17,981 | | 20,731 | | GSD | 137 | | 141 | | Metra | 95 | | 208 | | TII | 36 | | 33 | | Total | 18,249 | | 21,113 | |
F-66
PERUSAHAAN PERSEROAN (PERSERO) PT TELEKOMUNIKASI INDONESIA Tbk AND SUBSIDIARIES NOTES TO THE CONSOLIDATED FINANCIAL STATEMENTS As of December 31, 2015 and 2016 and for the Years Ended December 31, 2014, 2015 and 2016 (Figures in tables are expressedin billions ofRupiah, unless otherwise stated) Table of Content
18. NON-CONTROLLING INTERESTS (continued)
| 2014 | | 2015 | | 2016 | | Non-controlling interests innet comprehensive income (loss)of subsidiaries: | | | | | | | Telkomsel | 6,740 | | 7,760 | | 9,786 | | GSD | (7 | ) | 7 | | (5 | ) | Metra | 21 | | (5 | ) | (40 | ) | TII | 3 | | (2 | ) | (3 | ) | Total | 6,757 | | 7,760 | | 9,738 | |
Material partly-owned subsidiary As ofDecember 31,2015 and 2016, the non-controlling interestholds 35%ownership interest in Telkomselwhich is considered material to the Company (Note 1d). The summarized financial information of Telkomsel below is provided based on amounts before elimination of inter-company balances and transactions.
Summarized statements of financial position | 2015 | | 2016 | | Current assets | 25,660 | | 28,818 | | Non-current assets | 58,304 | | 60,827 | | Current liabilities | (20,020 | ) | (21,891 | ) | Non-current liabilities | (12,565 | ) | (8,520 | ) | Total equity | 51,379 | | 59,234 | | Attributable to: | | | | | Equity holders of parent company | 33,398 | | 38,503 | | Non-controlling interest | 17,981 | | 20,731 | |
Summarized statements of profit or loss andothercomprehensive income
| 2014 | | 2015 | | 2016 | | Revenues | 66,252 | | 76,055 | | 86,725 | | Operating expenses | (40,584 | ) | (46,455 | ) | (49,765 | ) | Other income – net | 48 | | 105 | | 483 | | Profit beforeincometax | 25,716 | | 29,705 | | 37,443 | | Income tax expense – net | (6,333 | ) | (7,361 | ) | (9,263 | ) | Profit for the year from continuing operations | 19,383 | | 22,344 | | 28,180 | | Other comprehensive income (expenses) – net | (122 | ) | (167 | ) | (222 | ) | Net comprehensive income for the year | 19,261 | | 22,177 | | 27,958 | | Attributable to non-controlling interest | 6,740 | | 7,760 | | 9,786 | | Dividend paid to non-controlling interest | 5,464 | | 7,810 | | 7,036 | |
Summarized statements of cash flows
| 2014 | | 2015 | | 2016 | | Operating activities | 30,863 | | 36,130 | | 42,827 | | Investing activities | (11,052 | ) | (12,951 | ) | (12,794 | ) | Financing activities | (15,563 | ) | (19,456 | ) | (24,132 | ) | Net increase in cash and cash equivalents | 4,248 | | 3,723 | | 5,901 | |
F-67
PERUSAHAAN PERSEROAN (PERSERO) PT TELEKOMUNIKASI INDONESIA Tbk AND SUBSIDIARIES NOTES TO THE CONSOLIDATED FINANCIAL STATEMENTS As of December 31, 2015 and 2016 and for the Years Ended December 31, 2014, 2015 and 2016 (Figures in tables are expressedin billions ofRupiah, unless otherwise stated) Table of Content 19. CAPITAL STOCK
The details of capital stock are as follows: | | 2015 | | Description | | Number of shares | | Percentage of ownership | | Total paid-in capital | | Series A Dwiwarna share | | | | | | | | Government | | 1 | | 0 | | 0 | | Series B shares | | | | | | | | Government | | 51,602,353,559 | | 52.55 | | 2,580 | | The Bank of New York Mellon Corporation* | | 8,161,361,980 | | 8.31 | | 408 | | Commissioners (Note 1b): | | | | | | | | Hendri Saparini | | 18,982 | | 0 | | 0 | | Dolfie Othniel Fredric Palit | | 17,084 | | 0 | | 0 | | Hadiyanto | | 519,640 | | 0 | | 0 | | Parikesit Suprapto | | 502,555 | | 0 | | 0 | | Directors (Note 1b): | | | | | | | | Alex Janangkih Sinaga | | 42,723 | | 0 | | 0 | | Heri Sunaryadi | | 37,965 | | 0 | | 0 | | Indra Utoyo | | 1,182,295 | | 0 | | 0 | | Muhammad Awaluddin | | 1,154,755 | | 0 | | 0 | | Honesti Basyir | | 1,155,295 | | 0 | | 0 | | Herdy Rosadi Harman | | 37,663 | | 0 | | 0 | | Abdus Somad Arief | | 37,965 | | 0 | | 0 | | Dian Rachmawan | | 98,505 | | 0 | | 0 | | Public (individually less than 5%) | | 38,429,695,633 | | 39.14 | | 1,922 | | Total | | 98,198,216,600 | | 100.00 | | 4,910 | | Treasury stock (Note 21) | | 2,601,779,800 | | - | | 130 | | Total | | 100,799,996,400 | | 100.00 | | 5,040 | |
| | 2016 | | Description | | Number of shares | | Percentage of ownership | | Total paid-in capital | | Series A Dwiwarna share Government | | 1 | | 0 | | 0 | | Series B shares Government | | 51,602,353,559 | | 52.09 | | 2,580 | | The Bank of New York Mellon Corporation* | | 7,000,589,980 | | 7.07 | | 350 | | Commissioners (Note 1b): | | | | | | | | Hendri Saparini | | 414,157 | | 0 | | 0 | | Dolfie Othniel Fredric Palit | | 372,741 | | 0 | | 0 | | Hadiyanto | | 875,297 | | 0 | | 0 | | Directors (Note 1b): | | | | | | | | Alex JanangkihSinaga | | 920,349 | | 0 | | 0 | | Indra Utoyo | | 1,972,644 | | 0 | | 0 | | Honesti Basyir | | 1,945,644 | | 0 | | 0 | | Herdy Rosadi Harman | | 828,012 | | 0 | | 0 | | Abdus Somad Arief | | 828,314 | | 0 | | 0 | | Dian Rachmawan | | 888,854 | | 0 | | 0 | | Public (individually less than 5%) | | 40,450,227,048 | | 40.84 | | 2,023 | | Total | | 99,062,216,600 | | 100.00 | | 4,953 | | Treasury stock (Note 21) | | 1,737,779,800 | | 0 | | 87 | | Total | | 100,799,996,400 | | 100.00 | | 5,040 | |
* The Bank of New York Mellon Corporation serves as the Depositary oftheregistered ADS holders for the Company’s ADSs. F-68
PERUSAHAAN PERSEROAN (PERSERO) PT TELEKOMUNIKASI INDONESIA Tbk AND SUBSIDIARIES NOTES TO THE CONSOLIDATED FINANCIAL STATEMENTS As of December 31, 2015 and 2016 and for the Years Ended December 31, 2014, 2015 and 2016 (Figures in tables are expressedin billions ofRupiah, unless otherwise stated) Table of Content 19. CAPITAL STOCK (continued) The Company issued only 1 Series A Dwiwarna share which is held by the Government and can not be transferred to any party, and has a veto in the General Meeting of Stockholders of the Company with respect to election and removal from the Boards of Commissioners and Directors, issuance of new shares, and amendments of the Company’s Articles of Association. Pursuant to the AGM of Stockholders of the Company as stated in notarialdeed No. 4 dated April4, 2014 of Ashoya Ratam, S.H., MKn., the Company’s stockholders approved the distribution of cash dividend and special cash dividend for 2013 amounting to Rp7,813 billion (Rp80.46 per share) and Rp2,130 billion (Rp21.94 per share), respectively. OnMay 16, 2014, the Company paid the cash dividend and special cash dividend totalling Rp9,943 billion. Pursuant to the AGM of Stockholders of the Company as stated in notarial deed No. 26 dated April 17, 2015 of Ashoya Ratam, S.H., MKn., the Company’s stockholders approved the distribution of cash dividend and special cash dividend for 2014 amounting to Rp7,319 billion (Rp74.55 per share) and Rp1,464 billion (Rp14.91 per share), respectively. On May 21, 2015, the Company paid the cash dividend and special cash dividend totalling Rp8,783 billion. Pursuant to the AGM of Stockholders of the Company as stated in notarial deed No. 50 dated April 22, 2016 of Ashoya Ratam, S.H., MKn., the Company’s stockholders approved the distribution of cash dividend and special cash dividend for 2015 amounting to Rp7,744 billion (Rp78.86 per share) and Rp1,549 billion (Rp15.77 per share), respectively. On May 26, 2016, the Company paid the cash dividend and special cash dividend totalling Rp9,293 billion. On December 27, 2016, the Company paidthe interim dividend amounting to Rp1,920 billion or Rp19.38 per share. 20. ADDITIONAL PAID-IN CAPITAL The breakdown of additional paid-in capital is as follows: | 2015 | | 2016 | | Proceeds from sale of 933,333,000 shares in excess of par value through IPO in 1995 | 1,446 | | 1,446 | | Excess of value over cost of selling 215,000,000 shares under the treasury stock plan phase II (Note 21) | 576 | | 576 | | Excess of value over cost of selling211,290,500 shares under the treasury stock plan phase I (Note 21) | 544 | | 544 | | Excess of value over cost of treasury stock transferred to employee stock ownership program (Note 21) | 228 | | 228 | | Excess of value over cost of selling22,363,000 shares under the treasury stock plan phase III (Note 21) | 36 | | 36 | | Excess of value over cost of selling864,000,000 shares under the treasury stock plan phase IV (Note 21) | - | | 1,996 | | Capitalization into 746,666,640 Series B shares in 1999 | (373 | ) | (373 | ) | Net | 2,457 | | 4,453 | |
F-69
PERUSAHAAN PERSEROAN (PERSERO) PT TELEKOMUNIKASI INDONESIA Tbk AND SUBSIDIARIES NOTES TO THE CONSOLIDATED FINANCIAL STATEMENTS As of December 31, 2015 and 2016 and for the Years Ended December 31, 2014, 2015 and 2016 (Figures in tables are expressedin billions ofRupiah, unless otherwise stated) Table of Content
21. TREASURY STOCK | 2012 | | 2013 | | Non-controlling interests in net assets of subsidiaries: | | | | | Telkomsel | 15,218 | | 16,752 | | Metra | 65 | | 89 | | GSD | 31 | | 58 | | Patrakom | - | | 2 | | Total | 15,314 | | 16,901 | |
| 2012 | | 2013 | | Non-controlling interests in total comprehensive income of subsidiaries: | | | | | Telkomsel | 5,532 | | 6,211 | | Metra | 14 | | 22 | | Patrakom | - | | 0 | | GSD | (1 | ) | (6 | ) | Total | 5,545 | | 6,227 | |
F-70
PERUSAHAAN PERSEROAN (PERSERO)
| PT TELEKOMUNIKASI INDONESIA Tbk AND SUBSIDIARIES
| NOTES TO THE CONSOLIDATED FINANCIAL STATEMENTS
| As of January 1, 2012 (Restated), December 31, 2012 (Restated) and December 31, 2013
| and for the years ended December 31, 2011 (Restated), 2012 (Restated) and 2013
| (Figures in tables are presented in billions of rupiah, unless otherwise stated)
| |
Tabel of Content
20. NON-CONTROLLING INTERESTS (continued)
Material partly-owned subsidiary
As of December 31, 2012 and 2013, a non-controlling interest holds 35% ownership interests of Telkomsel (Note 1d) which is considered material to the Company.
The summarized financial information of Telkomsel is provided below. This information is based on amounts before inter-company eliminations.
Summarized statements ofcomprehensive income
| 2012 | | 2013 | | Revenue | 54,531 | | 60,031 | | Operating expenses | (33,519 | ) | (36,761 | ) | Other expenses | (22 | ) | (180 | ) | Profit before tax | 20,990 | | 23,090 | | Income tax | (5,264 | ) | (5,748 | ) | Profit for the year from continuing operations | 15,726 | | 17,342 | | Total comprehensive income | 15,812 | | 17,746 | | Attributable to non-controlling interest | 5,532 | | 6,211 | | Dividend paid to non-controlling interest | 3,591 | | 4,675 | |
Summarized statements of financial position
| 2012 | | 2013 | | Current assets | 13,582 | | 16,603 | | Non-current assets | 49,262 | | 56,642 | | Current liabilities | (13,039 | ) | (16,406 | ) | Non-current liabilities | (6,324 | ) | (8,971 | ) | Total equity | 43,481 | | 47,868 | | Attributable to: | | | | | Equity holders of parent | 28,263 | | 31,116 | | Non-controlling interest | 15,218 | | 16,752 | |
Summarized statements of cash flows
| 2012 | | 2013 | | Operating | 26,229 | | 29,602 | | Investing | (13,527 | ) | (14,444 | ) | Financing | (12,191 | ) | (14,789 | ) | Net increase in cash and cash equivalents | 511 | | 369 | |
F-71
PERUSAHAAN PERSEROAN (PERSERO)
| PT TELEKOMUNIKASI INDONESIA Tbk AND SUBSIDIARIES
| NOTES TO THE CONSOLIDATED FINANCIAL STATEMENTS
| As of January 1, 2012 (Restated), December 31, 2012 (Restated) and December 31, 2013
| and for the years ended December 31, 2011 (Restated), 2012 (Restated) and 2013
| (Figures in tables are presented in billions of rupiah, unless otherwise stated)
| |
Tabel of Content
21. CAPITAL STOCK
| | 2012 | | Description | | Number of shares** | | Percentage of ownership | | Total paid-up capital | | Series A Dwiwarna share | | | | | | | | Government | | 1 | | - | | 0 | | Series B shares | | | | | | | | Government | | 51,602,353,559 | | 53.90 | | 2,580 | | The Bank of New York Mellon Corporation* | | 10,988,441,080 | | 11.48 | | 549 | | Directors (Note 1b): | | | | | | | | Indra Utoyo | | 27,540 | | - | | 0 | | Honesti Basyir | | 540 | | - | | 0 | | Priyantono Rudito | | 540 | | - | | 0 | | Sukardi Silalahi | | 540 | | - | | 0 | | Public (individually less than 5%) | | 33,154,520,300 | | 34.62 | | 1,658 | | Total | | 95,745,344,100 | | 100.00 | | 4,787 | | Treasury stock (Note 23) | | 5,054,652,300 | | - | | 253 | | Total | | 100,799,996,400 | | 100.00 | | 5,040 | |
| | 2013 | | Description | | Number of shares | | Percentage of ownership | | Total paid-up capital | | Series A Dwiwarna share | | | | | | | | Government | | 1 | | - | | 0 | | Series B shares | | | | | | | | Government | | 51,602,353,559 | | 53.14 | | 2,580 | | The Bank of New York Mellon Corporation* | | 10,031,129,780 | | 10.33 | | 502 | | Directors (Note 1b): | | | | | | | | Indra Utoyo | | 27,540 | | - | | 0 | | Honesti Basyir | | 540 | | - | | 0 | | Priyantono Rudito | | 540 | | - | | 0 | | Sukardi Silalahi | | 540 | | - | | 0 | | Public (individually less than 5%) | | 35,467,341,100 | | 36.53 | | 1,773 | | Total | | 97,100,853,600 | | 100.00 | | 4,855 | | Treasury stock (Note 23) | | 3,699,142,800 | | - | | 185 | | Total | | 100,799,996,400 | | 100.00 | | 5,040 | |
* The Bank of New York Mellon Corporation serves as thedepositary oftheregistered ADS holders for the Company’s ADSs.
** After stock split (Note 1c).
The Company issued only 1 Series A Dwiwarna share which is held by the Government and cannot be transferred to any party, and has a veto in the General Meeting of Stockholders of the Company with respect to election and removal from the Boards of Commissioners and Directors, issuance of new shares, and amendments of the Company’s Articles of Association.
Pursuant to the AGM of Stockholders of the Company as stated in notarial deed No. 21 dated May 19, 2011 of A. Partomuan Pohan, S.H., LLM., the Company’s stockholders agreed on the distribution of cash dividends for 2010 amounting to Rp6,345 billion or Rp64.52 per share (of which Rp526 billion or Rp5.35 per share was distributed as an interim cash dividend in December 2010).
Pursuant to the AGM of Stockholders of the Company as stated in notarial deed No. 14 dated May 11, 2012 of Ashoya Ratam, S.H., MKn., the Company’s stockholders agreed on the distribution of cash dividend and special cash dividend for 2011 amounting to Rp6,031 billion and Rp1,096 billion, respectively. On June 22, 2012 the Company paid the above-mentioned cash dividend and special cash dividend totaling Rp7,127 billion.
F-72
PERUSAHAAN PERSEROAN (PERSERO)
| PT TELEKOMUNIKASI INDONESIA Tbk AND SUBSIDIARIES
| NOTES TO THE CONSOLIDATED FINANCIAL STATEMENTS
| As of January 1, 2012 (Restated), December 31, 2012 (Restated) and December 31, 2013
| and for the years ended December 31, 2011 (Restated), 2012 (Restated) and 2013
| (Figures in tables are presented in billions of rupiah, unless otherwise stated)
| |
Tabel of Content
21. CAPITAL STOCK (continued)
Pursuant to the AGM of Stockholders of the Company as stated in notarial deed No.38 dated April 19, 2013 of Ashoya Ratam, S.H.,Mkn. the Company’s stockholders agreed on the distribution of cash dividend and special cash dividend for 2012 amounting to Rp7,068 billion and Rp1,286 billion, respectively. On June 18, 2013, the Company paid the cash dividend and special cash dividend totalling Rp8,354 billion.
22. ADDITIONAL PAID-IN CAPITAL
| 2012 | | 2013 | | Proceeds from sale of 933,333,000 shares in excess of par value through IPO in 1995 | 1,446 | | 1,446 | | Excess of value over cost of selling211,290,500shares under the treasury stock plan phase I (Note 23) | - | | 544 | | Excess of value over cost of treasury stock for employee stock ownership program (Note 23) | - | | 228 | | Capitalization into 746,666,640 Series B shares in 1999 | (373 | ) | (373 | ) | Net | 1,073 | | 1,845 | |
23. TREASURY STOCK
| | | | | | Maximum Purchase |
| Phase
|
| Basis
|
| Period
|
| Number of Shares
|
| Phase | | Basis | | Period | | Number of shares | | Amount | | I | | EGM | | December 21, 2005 - June 20, 2007 | | 1,007,999,964 | | Rp5,250 | | II | | AGM | | June 29, 2007 - December 28, 2008 | | 215,000,000 | | Rp2,000 | | III | | AGM | | June 20, 2008 - December 20, 2009 | | 339,443,313 | | Rp3,000 | | - | | BAPEPAM - LK | | October 13, 2008 - January 12, 2009 | | 4,031,999,856 | | Rp3,000 | | IV | | AGM | | May 19, 2011 - November 20, 2012 | | 645,161,290 | | Rp5,000 | | II
| | AGM
| | June 29, 2007 - December, 28, 2008
| | 215,000,000
| | Rp2,000
| | III
| | AGM
| | June 20, 2008 - December 20, 2009
| | 339,443,313
| | Rp3,000
| | -
| | BAPEPAM - LK
| | October 13, 2008 - January 12, 2009
| | 4,031,999,856
| | Rp3,000
| | IV
| | AGM
| | May 19, 2011 - November 20, 2012
| | 645,161,290
| | Rp5,000
| |
Movements in treasury stock as a result of the repurchase of shares are as follows: | 2012 | | 2013 | | | Number of shares* | | % | | Rp | | Number of shares | | % | | Rp | | Beginning balance | 3,868,299,800 | | 3.84 | | 6,323 | | 5,054,652,300 | | 5.01 | | 8,067 | | Number of shares acquired | 1,186,352,500 | | 1.17 | | 1,744 | | - | | - | | - | | Transfer to employees stock ownership program | - | | - | | - | | (299,057,000 | ) | (0.29 | ) | (433 | ) | Proceeds from sale of treasury stock | - | | - | | - | | (1,056,452,500 | ) | (1.05 | ) | (1,829 | ) | Ending balance | 5,054,652,300 | | 5.01 | | 8,067 | | 3,699,142,800 | | 3.67 | | 5,805 | |
*After stock split (Note 1c)
Pursuant to the AGM of Stockholders of the Company held on June 11, 2010, the stockholders approved the change in the Company's plan for treasury stock phase I, II and III to become (i) for reissuance inside or outside stock exchange, (ii) for retirement of the stock by deducting from equity, (iii) for equity stock conversion and (iv) for funding purposes.
In the AGM on April 19, 2013, the Company's stockholders approved the change to the plan for the treasury stock phase III, which was decided to be used for the implementation of the Employee Stock Ownership Program (“ESOP”) for the year 2013.
F-73
PERUSAHAAN PERSEROAN (PERSERO)
| PT TELEKOMUNIKASI INDONESIA Tbk AND SUBSIDIARIES
| NOTES TO THE CONSOLIDATED FINANCIAL STATEMENTS
| As of January 1, 2012 (Restated), December 31, 2012 (Restated) and December 31, 2013
| and for the years ended December 31, 2011 (Restated), 2012 (Restated) and 2013
| (Figures in tables are presented in billions of rupiah, unless otherwise stated)
| |
Tabel of Content
23. TREASURY STOCK (continued)
On May 31, 2013, the Company offered to all its eligible employees and those of its subsidiaries (collectively referred to as the “participants”), the right to purchase a fixed number of its shares at a certain price. The shares have become an entitlement of the employees on the transaction dates and are no longer conditional on the satisfaction of any vesting conditions. Shares which are held by employees through the ESOP have a lock-up period that varies from 0 up to 12 months, depending on the position of the employee.
In the lock-up period, participants may not transfer shares or have shares transactions either through or outside the stock exchange.
Price per share offered was Rp10,714 and each participant received allowance (discount) of Rp5,575 per share. At the closing of this program, the Company had transferred a part of the treasury stock phase III to employees totaling 59,811,400 shares (equivalent to 299,057,000 shares after the stock split) with fair value amounting to Rp661 billion. The excess amounting to Rp228 billion in value of treasury stock transferred over their acquisition cost was recorded as additional paid-in capital (Note 22).
The difference amounting to Rp353 billionbetween the fair value of thetreasury stock and amount paid by the participantsisrecorded as part of personnel expenses in the 2013 consolidated statement of comprehensive income.
On July 30, 2013, the Company resold 211,290,500 shares (equal to 1,056,452,500 shares after stock split) of treasury stock phase I with fair value amounting to Rp2,409 billion. The excess amounting to Rp544 billion in value of the treasury stock sold over their acquisition cost was recorded as additional paid-in capital (net of related cost to sell the shares) (Note 22).
24. OTHER RESERVES
Other reserves consist of the translation reserve and fair value reserve. The translation reserve consists of all foreign currency differences arising from the translation of the financial statements of foreign operations (including equity-accounted investees) amounting to Rp40 billion and Rp160billion as of December 31, 2012 and 2013, respectively.The amount reclassified to profit or loss for the year ended December 31, 2013 amounted to Rp9 billion.
The fair value reserve consists of the cumulative net change in the fair value of available-for-sale financial assets until the investments are derecognized or impaired amounting to Rp42 billion and Rp38billion as of December 31, 2012 and2013,respectively.The amounts reclassified to profit or loss for the years ended December 31, 2011, 2012 and 2013 amounted to Rp7 billion, Rp nil and Rp4 billion, respectively.
25. BASIC AND DILUTED EARNINGS PER SHARE
Basic earnings per share is computed by dividingprofit for the year attributable to owners of the parent company amounting to Rp11,043 billion, Rp12,621 billion and Rp14,046 billion by the weighted average number of shares outstanding during the year totaling97,959,362,720 shares, 96,011,315,505 shares and96,358,660,797shares(after stock split) for the years ended December 31, 2011, 2012 and 2013, respectively.
Basic earnings per share amounted to Rp112.73,Rp131.45and Rp145.77 for the years ended December 31, 2011, 2012 and2013, respectively. The Company does not have potentially dilutive financial instruments as of December 31, 2011, 2012 and 2013.
The calculation of basic earning per share in 2011 and 2012 has been retrospectively adjusted in connection with the Company’s stock split and initial application of IAS 19,Employee Benefits(Revised 2011)(Notes 1c and 2aa).
F-74
PERUSAHAAN PERSEROAN (PERSERO)
| PT TELEKOMUNIKASI INDONESIA Tbk AND SUBSIDIARIES
| NOTES TO THE CONSOLIDATED FINANCIAL STATEMENTS
| As of January 1, 2012 (Restated), December 31, 2012 (Restated) and December 31, 2013
| and for the years ended December 31, 2011 (Restated), 2012 (Restated) and 2013
| (Figures in tables are presented in billions of rupiah, unless otherwise stated)
| |
Tabel of Content
26.REVENUES
| 2011 | | 2012 | | 2013 | | Telephone revenues | | | | | | | Cellular | | | | | | | Usage charges | 27,189 | | 29,477 | | 30,722 | | Monthly subscription charges | 569 | | 696 | | 730 | | Features | 838 | | 558 | | 686 | | Connection fee charges | 2 | | - | | - | | | 28,598 | | 30,731 | | 32,138 | | Fixed lines | | | | | | | Usage charges | 8,213 | | 7,323 | | 6,453 | | Monthly subscription charges | 3,004 | | 2,805 | | 2,682 | | Call center | 199 | | 228 | | 324 | | Installation charges | 135 | | 112 | | 12 | | Others | 68 | | 194 | | 230 | | | 11,619 | | 10,662 | | 9,701 | | Total telephone revenues | 40,217 | | 41,393 | | 41,839 | | Interconnection revenues | | | | | | | Domestic interconnection and transit | 2,071 | | 2,618 | | 2,971 | | International interconnection | 1,438 | | 1,655 | | 1,872 | | Totalinterconnectionrevenues | 3,509 | | 4,273 | | 4,843 | | Data,internet andinformationtechnology service revenues | | | | | | | Internet, data communication and information technology services | 10,548 | | 14,857 | | 18,373 | | Short Messaging Services (“SMS”) | 13,093 | | 12,631 | | 13,134 | | Voice over Internet Protocol (“VoIP”) | 245 | | 81 | | 119 | | E-business | 38 | | 55 | | 83 | | Total data, internet and information technology servicerevenues | 23,924 | | 27,624 | | 31,709 | | Network revenues | | | | | | | Leased lines | 911 | | 824 | | 861 | | Satellite transponder lease | 390 | | 384 | | 392 | | Totalnetworkrevenues | 1,301 | | 1,208 | | 1,253 | | Other telecommunications service revenues | | | | | | | CPE and terminal | 739 | | 1,046 | | 1,197 | | Leases | 219 | | 401 | | 661 | | USO compensation | 415 | | 237 | | 508 | | Directory assistance | 349 | | 295 | | 308 | | Pay TV | 259 | | 405 | | 274 | | Others | 306 | | 245 | | 375 | | Totalothertelecommunicationsservice revenues | 2,287 | | 2,629 | | 3,323 | | Total revenues | 71,238 | | 77,127 | | 82,967 | |
Refer to Note 35 for details of related party transactions.
F-75
PERUSAHAAN PERSEROAN (PERSERO)
| PT TELEKOMUNIKASI INDONESIA Tbk AND SUBSIDIARIES
| NOTES TO THE CONSOLIDATED FINANCIAL STATEMENTS
| As of January 1, 2012 (Restated), December 31, 2012 (Restated) and December 31, 2013
| and for the years ended December 31, 2011 (Restated), 2012 (Restated) and 2013
| (Figures in tables are presented in billions of rupiah, unless otherwise stated)
| |
Tabel of Content
27. SERVICE CONCESSION ARRANGEMENT
The Ministry of Communication and Information (“MoCI”) issued Regulation No. 15/PER/M.KOMINFO/9/2005 dated September 30, 2005, which sets forth the basic policies underlying the USO program and requires telecommunications operators in Indonesia to contribute 0.75% of their gross revenues (with due consideration for bad debts and interconnection charges) for USO development. Based on the Government’s Decree No. 7/2009 dated January 16, 2009, and Decree No. 05/PER/M.KOMINFO/2/2007 dated February 28, 2007 the contribution was changed to 1.25% of gross revenues, net of bad debts and/or interconnection charges and/or connection charges.Subsequently, in December 2012, Decree No. 05/PER/M.KOMINFO/2/2007 was replaced by Decree No. 45 year 2012 of the MoCI which was effective from January 22, 2013. The Decree stipulates, among other things, the exclusion of certain revenues that are not considered as part of gross revenues as a basis to calculate the USO charged, and changed the payment period which was previously on a quarterly basis to become quarterly or semi-annually.
Based on MoCI Decree No. 32/PER/M.KOMINFO/10/2008 dated October 10, 2008 (as amended by Decree No. 03/PER/M.KOMINFO/2/2010 dated February 1, 2010) which replaced MoCI Decree No. 11/PER/M.KOMINFO/04/2007 dated April 13, 2007 and MoCI Decree No. 38/PER/M.KOMINFO/9/2007 dated September 20, 2007, it is stipulated that, among others, in providing telecommunication access and services in rural areas (USO Program), the provider is determined through a selection process byBalai Telekomunikasi dan Informatika Pedesaan (“BTIP”) which was established based on MoCI Decree No. 35/PER/M.KOMINFO/11/2006 dated November 30, 2006. Subsequently, based on Decree No. 18/PER/M.KOMINFO/11/2010 dated November 19, 2010 of MoCI, BTIP was changed toBalai Penyedia dan Pengelola Pembiayaan Telekomunikasi dan Informatika (“BPPPTI”).
a. Company
On March 12, 2010, the Company was selected in a tender by the Government through BTIP to provide internet access service centers for USO sub-districts for a total amount of Rp322 billion, covering Nanggroe Aceh Darussalam, North Sumatra, North Sulawesi, Gorontalo, Central Sulawesi, West Sulawesi, South Sulawesi and South East Sulawesi.
On December 23, 2010, the Company was selected in a tender by the Government through BPPPTI to provide mobile internet access service centers for USO sub-districts for a total amount of Rp528 billion, covering Jambi, Riau, Kepulauan Riau, North Sulawesi, Central Sulawesi, Gorontalo, West Sulawesi, South East Sulawesi, Central Kalimantan, South Sulawesi, Papua and West Irian Jaya.
b. Telkomsel
On January 16 and 23, 2009, Telkomsel was selected in a tender by the Government through BTIP to provide telecommunication access and services in rural areas (USO Program) for a total amount of Rp1.66 trillion, covering all Indonesian territories except Sulawesi, Maluku and Papua. Telkomsel will obtain local fixed-line licenses and the right to use radio frequency in the 2390 MHz - 2400 MHz bandwidth.
Subsequently, in 2010 and 2011, the agreementswith BTIPwere amended, which amendments cover, among other things, changing the price to Rp1.76 trillion and changing the term of payment from quarterly to monthly or quarterly.
In January 2010, the MoCI granted Telkomsel operating license to provide local fixed-line services under the USO program.
F-76
PERUSAHAAN PERSEROAN (PERSERO)
| PT TELEKOMUNIKASI INDONESIA Tbk AND SUBSIDIARIES
| NOTES TO THE CONSOLIDATED FINANCIAL STATEMENTS
| As of January 1, 2012 (Restated), December 31, 2012 (Restated) and December 31, 2013
| and for the years ended December 31, 2011 (Restated), 2012 (Restated) and 2013
| (Figures in tables are presented in billions of rupiah, unless otherwise stated)
| |
Tabel of Content
27. SERVICE CONCESSION ARRANGEMENT(continued)
b. Telkomsel (continued)
On December 27, 2011, Telkomsel (on behalf of Konsorsium Telkomsel, a consortium which was established with Dayamitra on December 9, 2011) was selected by BPPPTI as a provider of the USO Program in the border areas for all packages (package 1 to package 13) with a total price of Rp830 billion. On such date, Telkomsel was also selected by BPPPTI as a provider of the USO Program (upgrading) “Desa Pinter” or “Desa Punya Internet” for 1, 2 and 3 packages with a total price of Rp261 billion.
For the years ended December 31, 2011, 2012 and 2013, the Company and Telkomsel recognized the following amounts:
| 2011 | | 2012 | | 2013 | | Revenues | | | | | | | Construction | 112 | | 245 | | 67 | | Operation of telecommunication service centre | 255 | | 353 | | 508 | | Profits (losses) | | | | | | | Construction | (16 | ) | 6 | | 11 | | Operation of telecommunication service centre | 105 | | 83 | | 150 | |
As of December 31, 2013, the Company’s and Telkomsel’s trade receivables from the USO programs which are measured at amortized cost using the effective interest rate method amount to Rp654 billion (Notes7 and 13).
28. PERSONNEL EXPENSES
| 2011 (Restated) | | 2012 (Restated) | | 2013 | | | | | | | | | Salaries and related benefits | 3,001 | | 3,257 | | 3,553 | | Vacation pay, incentives and other benefits | 2,814 | | 3,400 | | 3,252 | | Employees’ income tax | 1,043 | | 1,022 | | 1,160 | | Pension benefit cost (Note 33) | 438 | | 831 | | 988 | | Post-employment health care benefitcost (Note33) | 158 | | 246 | | 382 | | Housing | 197 | | 200 | | 220 | | Insurance | 70 | | 83 | | 92 | | Other post-employment benefit cost (Note 33) | 46 | | 42 | | 41 | | LSA expense (Note34) | 96 | | 121 | | 19 | | Other employee benefits cost (Note 33) | 24 | | 35 | | 15 | | Early retirement program (Note 16) | 517 | | 699 | | - | | Others | 20 | | 24 | | 107 | | Total | 8,424 | | 9,960 | | 9,829 | |
Refer to Note 35 for details of related party transactions.
F-77
PERUSAHAAN PERSEROAN (PERSERO)
| PT TELEKOMUNIKASI INDONESIA Tbk AND SUBSIDIARIES
| NOTES TO THE CONSOLIDATED FINANCIAL STATEMENTS
| As of January 1, 2012 (Restated), December 31, 2012 (Restated) and December 31, 2013
| and for the years ended December 31, 2011 (Restated), 2012 (Restated) and 2013
| (Figures in tables are presented in billions of rupiah, unless otherwise stated)
| |
Tabel of Content
29. OPERATIONS, MAINTENANCE AND TELECOMMUNICATION SERVICE EXPENSES
| 2011 | | 2012 | | 2013 | | Operations and maintenance | 9,184 | | 9,012 | | 10,667 | | Radio frequency usage charges (Notes 38c.i and 38c.ii) | 2,846 | | 3,002 | | 3,098 | | Concession fees andUSOcharges | 1,235 | | 1,445 | | 1,595 | | Electricity, gas and water | 836 | | 879 | | 1,063 | | Cost of phone, set top boxes, SIM and RUIM cards | 967 | | 687 | | 752 | | Cost of IT services | 144 | | 222 | | 677 | | Leased lines and CPE | 406 | | 407 | | 440 | | Vehicles rental and supporting facilities | 291 | | 293 | | 439 | | Insurance | 431 | | 671 | | 374 | | Project management | 46 | | 102 | | 138 | | Travelling expenses | 54 | | 57 | | 53 | | Others | 13 | | 19 | | 36 | | Total | 16,453 | | 16,796 | | 19,332 | |
Refer to Note 35 for details of related party transactions.
30. GENERAL AND ADMINISTRATIVE EXPENSES
| 2011 | | 2012 | | 2013 | | Provision for impairment of receivables (Note 7d) | 883 | | 915 | | 1,589 | | General expenses | 326 | | 527 | | 675 | | Training, education and recruitment | 229 | | 259 | | 412 | | Travelling | 256 | | 259 | | 341 | | Collection expenses | 327 | | 341 | | 340 | | Professional fees | 235 | | 187 | | 272 | | Meetings | 86 | | 105 | | 138 | | Security and screening | 97 | | 62 | | 93 | | Social contribution | 290 | | 129 | | 85 | | Stationery and printing | 53 | | 55 | | 73 | | Others | 153 | | 197 | | 137 | | Total | 2,935 | | 3,036 | | 4,155 | |
Refer to Note 35 for details of related party transactions.
31. INTERCONNECTION EXPENSES
| 2011 | | 2012 | | 2013 | | Domestic interconnection and transit | 2,414 | | 3,464 | | 3,720 | | International interconnection | 1,141 | | 1,203 | | 1,207 | | Total | 3,555 | | 4,667 | | 4,927 | |
Refer to Note 35 for details of related party transactions.
F-78
PERUSAHAAN PERSEROAN (PERSERO)
| PT TELEKOMUNIKASI INDONESIA Tbk AND SUBSIDIARIES
| NOTES TO THE CONSOLIDATED FINANCIAL STATEMENTS
| As of January 1, 2012 (Restated), December 31, 2012 (Restated) and December 31, 2013
| and for the years ended December 31, 2011 (Restated), 2012 (Restated) and 2013
| (Figures in tables are presented in billions of rupiah, unless otherwise stated)
| |
Tabel of Content
32. TAXATION
a. Prepaid income taxes
| 2012 | | 2013 | | Corporate income taxes - subsidiaries | 52 | | 96 | | Current portion | (52 | ) | (58 | ) | Non-current portion (Note 13) | - | | 38 | |
b. Prepaid other taxes
| 2012 | | 2013 | | The Company: | | | | | VAT | - | | 142 | | Subsidiaries: | | | | | Import duties(Note 43) | 10 | | 10 | | VAT | 735 | | 751 | | Article 23 - Withholding tax on services delivery | 11 | | 35 | | Total | 756 | | 938 | | Current portion | (756 | ) | (477 | ) | Non-current portion (Note 13) | - | | 461 | |
c. Current income tax liabilities
| 2012 | | 2013 | | | | | | | The Company: | | | | | Article 25 - Installment of corporate income tax | 30 | | 53 | | Article 29 - Corporate income tax | 198 | | 165 | | Subsidiaries: | | | | | Article 25 - Installment of corporate income tax | 378 | | 440 | | Article 29 - Corporate income tax | 674 | | 284 | | Total | 1,280 | | 942 | |
d. Other tax liabilities
| 2012 | | 2013 | | The Company: | | | | | Article 4 (2) - Final tax | 6 | | 11 | | Article 21 - Individual income tax | 21 | | 34 | | Article 22 - Withholding tax on goods delivery and import | - | | 5 | | Article 23 - Withholding tax on services | 10 | | 12 | | Article 26 - Withholding tax on non-resident income | 3 | | 1 | | VAT | 374 | | 441 | | Sub-total | 414 | | 504 | |
F-79
PERUSAHAAN PERSEROAN (PERSERO)
| PT TELEKOMUNIKASI INDONESIA Tbk AND SUBSIDIARIES
| NOTES TO THE CONSOLIDATED FINANCIAL STATEMENTS
| As of January 1, 2012 (Restated), December 31, 2012 (Restated) and December 31, 2013
| and for the years ended December 31, 2011 (Restated), 2012 (Restated) and 2013
| (Figures in tables are presented in billions of rupiah, unless otherwise stated)
| |
Tabel of Content
32. TAXATION (continued)
d. Other tax liabilities(continued)
| 2012 | | 2013 | | Subsidiaries: | | | | | Article 4 (2) - Final tax | 37 | | 48 | | Article 21 - Individual income tax | 60 | | 82 | | Article 23 - Withholding tax on services | 32 | | 34 | | Article 26 - Withholding tax on non-resident income | 18 | | 16 | | VAT | 3 | | 72 | | Sub-total | 150 | | 252 | | Total | 564 | | 756 | |
e. The components of income tax expense (benefit) are as follows:
| 2011 (Restated) | | 2012 (Restated) | | 2013 | | Current | | | | | | | The Company | 777 | | 878 | | 909 | | Subsidiaries | 4,896 | | 5,750 | | 6,086 | | Sub-total | 5,673 | | 6,628 | | 6,995 | | Deferred | | | | | | | The Company | 43 | | (461 | ) | (113 | ) | Subsidiaries | (279 | ) | (281 | ) | 18 | | Net | (236 | ) | (742 | ) | (95 | ) | Total | 5,437 | | 5,886 | | 6,900 | |
f. Reconciliation of income tax expense
The reconciliation between the income tax expense calculated by applying the applicable tax rate of 20% to the profit before income tax less income subject to final tax, and the net income tax expense as shown in the consolidated statements of comprehensive income is as follows:
| 2011 (Restated) | | 2012 (Restated) | | 2013 | | Profit before income tax | 20,982 | | 24,027 | | 27,030 | | Less income subject to final tax | (462 | ) | (913 | ) | (1,780 | ) | | 20,520 | | 23,114 | | 25,250 | | Tax calculated at the Company’s applicable statutory tax rate of 20% | 4,104 | | 4,623 | | 5,050 | | Difference in applicable statutory tax rate for subsidiaries | 906 | | 1,050 | | 1,213 | | Non-deductible expenses | 329 | | 392 | | 567 | | Final income tax expense | 63 | | 52 | | 93 | | Realization on sale of long-term investment | - | | - | | (100 | ) | Others | 35 | | (231 | ) | 77 | | Net income tax expense | 5,437 | | 5,886 | | 6,900 | |
F-80
PERUSAHAAN PERSEROAN (PERSERO)
| PT TELEKOMUNIKASI INDONESIA Tbk AND SUBSIDIARIES
| NOTES TO THE CONSOLIDATED FINANCIAL STATEMENTS
| As of January 1, 2012 (Restated), December 31, 2012 (Restated) and December 31, 2013
| and for the years ended December 31, 2011 (Restated), 2012 (Restated) and 2013
| (Figures in tables are presented in billions of rupiah, unless otherwise stated)
| |
Tabel of Content
32.TAXATION (continued)
f. Reconciliation of income tax expense(continued)
The computations of the income tax expense for the years ended December 31, 2011, 2012 and 2013 are as follows:
| 2011 (Restated) | | 2012 (Restated) | | 2013 | | Estimated taxable income of the Company | 3,568 | | 4,209 | | 4,241 | | Corporate income tax: | | | | | | | The Company | 714 | | 842 | | 848 | | Subsidiaries | 4,896 | | 5,750 | | 6,086 | | Final tax expense -the Company | 63 | | 36 | | 61 | | Total income tax expense - current | 5,673 | | 6,628 | | 6,995 | | Income tax (benefit) expense - deferred - effect of temporary differences at enacted maximum tax rates | | | | | | | The Company | | | | | | | Accrued early retirement benefits | - | | (140 | ) | 140 | | Valuation oflong-term investment | - | | - | | 70 | | Provision for impairment of receivables and trade receivables written off | (47 | ) | 58 | | (170 | ) | Finance leases | (6 | ) | 31 | | (73 | ) | Depreciation and gain on sale of property and equipment | 36 | | (348 | ) | (38 | ) | Net periodic post-employment benefits costs | 20 | | (94 | ) | (18 | ) | Deferred installation fee | 21 | | 31 | | (16 | ) | Accrued expenses and provisions for obsolescence | (4 | ) | 8 | | (5 | ) | Amortization of intangible assets, land rights and others | (4 | ) | (7 | ) | (3 | ) | Payments of deferred consideration for business combinations | 27 | | - | | - | | The Company - net | 43 | | (461 | ) | (113 | ) | Telkomsel | | | | | | | Charges from leasing transactions | - | | 23 | | 98 | | Amortization of license | - | | (5 | ) | 19 | | Accounts receivable - Government | (17 | ) | (14 | ) | 6 | | Depreciation of property and equipment | (238 | ) | (156 | ) | (95 | ) | Provision for employee benefits | (38 | ) | (49 | ) | (44 | ) | Provision for impairment of receivables and trade receivables written off | (14 | ) | (53 | ) | (4 | ) | Telkomsel - net | (307 | ) | (254 | ) | (20 | ) | Subsidiaries - others - net | 28 | | (27 | ) | 38 | | Net income taxbenefit - deferred | (236 | ) | (742 | ) | (95 | ) | Income tax expense - net | 5,437 | | 5,886 | | 6,900 | |
F-81
PERUSAHAAN PERSEROAN (PERSERO)
| PT TELEKOMUNIKASI INDONESIA Tbk AND SUBSIDIARIES
| NOTES TO THE CONSOLIDATED FINANCIAL STATEMENTS
| As of January 1, 2012 (Restated), December 31, 2012 (Restated) and December 31, 2013
| and for the years ended December 31, 2011 (Restated), 2012 (Restated) and 2013
| (Figures in tables are presented in billions of rupiah, unless otherwise stated)
| |
Tabel of Content
32. TAXATION(continued)
f. Reconciliation of income tax expense (continued)
Tax Law No. 36/2008, which is further regulated in Government Regulation No. 77/2013 stipulates a reduction of 5% from the top rate applicable to qualifying listed companies, for those whose shares of stock are traded in the IDX which meet the prescribed criteria that the public owns 40% or more of the total fully paid and traded shares, and such shares are owned by at least 300 parties, with each party owning less than 5% of the total paid-up shares. These requirements must be met by a company for a period of 183 days in one tax year. The Company has met all of the required criteria;therefore, for purposes of calculating income tax expense and liabilities for thefinancial reporting periods endedDecember 31, 2011, 2012 and 2013, the Company hasreduced the applicable tax rate by 5%.
The Company applied a tax rate of 20% for the fiscal years 2011,2012 and 2013. The subsidiaries applied a tax rate of 25% for the fiscal years 2011,2012 and 2013.
The Company will submit the above corporate income tax computation in its income tax returns (“Surat Pemberitahuan Tahunan” or “Annual SPT”) for the fiscal year 2013 that will be reported to the tax office based on prevailing regulations. The amount of corporate income tax for the year ended December 31, 2012 agreed with what was reported in the Annual SPT.
g. Tax assessments
(i)The Company
The Directorate General of Tax (“DGT”)assessedthe Companyfor Value Added Tax, withholding income taxesand corporate income taxfor fiscal year2011.The taxaudit for the fiscal year 2008 has beencompleted with the issuance of Tax Assessment Letter (SKP) No. SPHP-2/WPJ.19/KP.03/2014 regarding noticeofworkup with no correction for Income Tax Article 21/22/23/26 and 4 (2).
In November 2013, the Company received SKPKBs No. 00056/207/07/093/13 to No. 00065/207/07/093/13 dated November 15, 2013, for the underpayment of Value Added Tax (VAT) for the periods January - September and November 2007 of Rp142 billion. In January 2014, the Company filed an objection to the Tax Authorities regarding the underpayment of VAT. As of the issuance date of the consolidated financial statements, the Tax Authorities have not yet issued their decision on the objection.
(ii) Telkomsel
On February 25, 2009, the Tax Authorities filed a judicial review request to the Indonesian Supreme Court (“SC”) for the Tax Court’s acceptance of Telkomsel’s appeal on its 2002 withholding tax amounting to Rp115 billion. On April 3, 2009, Telkomsel filed a contra-appeal to the SC. In November 2012, Telkomsel received a favorable verdict from the SC which accepted Telkomsel’s contra-appeal.
On April 21, 2010, the Tax Authorities filed ajudicial review request to the SC for the Tax Court’s acceptance of Telkomsel’s request to cancel the Tax Collection Letter (STP) for the underpayment of December 2008 Income Tax Article 25 amounting to Rp429 billion (including a penalty of Rp8 billion). In May 2010, Telkomsel filed a contra-appeal to the SC. As of the date of approval and authorization for issuance oftheseconsolidated financial statements, the judicial review is still in process.
F-82
PERUSAHAAN PERSEROAN (PERSERO)
| PT TELEKOMUNIKASI INDONESIA Tbk AND SUBSIDIARIES
| NOTES TO THE CONSOLIDATED FINANCIAL STATEMENTS
| As of January 1, 2012 (Restated), December 31, 2012 (Restated) and December 31, 2013
| and for the years ended December 31, 2011 (Restated), 2012 (Restated) and 2013
| (Figures in tables are presented in billions of rupiah, unless otherwise stated)
| |
Tabel of Content
32. TAXATION (continued)
g. Tax assessments (continued)
(ii) Telkomsel (continued)
On August 10, 2010 the Tax Authorities filed a judicial review request to the SC for the Tax Court’s acceptance of Telkomsel’s appeal onits2004 and 2005 VAT totaling Rp215 billion. In September 2010, Telkomsel filed a contra-appeal to the SC. As of the date of approval and authorization for issuance of these consolidated financial statements, the judicial review is still in process.
In May and June 2012, Telkomsel received the refund of penalty of 2010 Income Tax Article 25 underpayment amounting to Rp15.7 billion based on the Tax Court’s verdict. On July 17, 2012, the Tax Authorities filed a judicial review request to the SC on the Tax Court’s verdict. On September 14, 2012, Telkomsel filed a contra-appeal to the SC. As of the date of approval and authorization for issuance of these consolidated financial statements, the judicial review is still in process.
In August 2012, the Tax Authorities accepted Telkomsel’s objection and refunded the whole claim for 2008 underpayment of VAT amounting to Rp232 billion (including penalty of Rp81.9 billion).
On March 12, 2012, Telkomsel received assessment letters as a result ofa tax audit for the fiscal year 2010 by the Tax Authorities. Based on the letters, Telkomsel overpaid corporate income tax and underpaid VAT amounting to Rp597.4 billionandRp302.7 billion (including penalty of Rp73.3 billion), respectively. Telkomsel accepted theassessment on theoverpayment of corporate income tax and Rp12.1 billionof theunderpayment of the VAT (including penalty of Rp6.3 billion). The accepted portion was charged to the 2012 consolidated statement of comprehensive income. On April 5, 2012, Telkomsel received a refund for the overpayment of corporate income tax for fiscal year 2010 amounting to Rp294.7 billion, net of the underpayment of VAT. On May 24, 2012, Telkomsel filed an objection to the Tax Authorities for the underpayment of VAT of Rp290.6 billion (including penalty of Rp67 billion) and recorded it as a claim for tax refund. On May 1, 2013,the TaxAuthorities rejected Telkomsel’s objection. Subsequently, on July 29, 2013, Telkomsel filed an appeal to theTax Court. As of thedate of approval and authorization for the issuanceoftheseconsolidated financial statements, the appeal is still in process.
In December 2013, the Tax Court accepted Telkomsel’s appeal on 2006 VAT and withholding taxes totaling Rp116 billion. The amount which was previously presented as part of prepaid other taxes is reclassified to advances and other non-current assets.
F-83
PERUSAHAAN PERSEROAN (PERSERO)
| PT TELEKOMUNIKASI INDONESIA Tbk AND SUBSIDIARIES
| NOTES TO THE CONSOLIDATED FINANCIAL STATEMENTS
| As of January 1, 2012 (Restated), December 31, 2012 (Restated) and December 31, 2013
| and for the years ended December 31, 2011 (Restated), 2012 (Restated) and 2013
| (Figures in tables are presented in billions of rupiah, unless otherwise stated)
| |
Tabel of Content
32. TAXATION (continued)
h. Deferred tax assets and liabilities
The details of the Group's deferred tax assets and liabilities are as follows:
| January 1, 2012 (Restated) | | (Charged) credited to the consolidated statements of comprehensive income | | Recognized in other comprehensive income | | Realized to equity | | December 31, 2012 (Restated) | | The Company | | | | | | | | | | | Deferred tax assets: | | | | | | | | | | | Net periodic pension and other post-employment benefit cost | 623 | | 3 | | 225 | | - | | 851 | | Provision for impairment of receivables | 334 | | (58 | ) | - | | - | | 276 | | Provision for employee benefits | 82 | | 91 | | - | | - | | 173 | | Provision for early retirement expense | - | | 140 | | - | | - | | 140 | | Deferred connection fee | 85 | | (31 | ) | - | | - | | 54 | | Accrued expenses and provision for inventory obsolescence | 30 | | (8 | ) | - | | - | | 22 | | Total deferred tax assets | 1,154 | | 137 | | 225 | | - | | 1,516 | | Deferred tax liabilities: | | | | | | | | | | | Difference between accounting and tax property and equipment net book value | (1,929 | ) | 348 | | - | | - | | (1,581 | ) | Finance leases | (33 | ) | (31 | ) | - | | - | | (64 | ) | Land rights, intangible assets and others | (21 | ) | 7 | | - | | - | | (14 | ) | Total deferred tax liabilities | (1,983 | ) | 324 | | - | | - | | (1,659 | ) | Net deferred tax liabilities | (829 | ) | 461 | | 225 | | - | | (143 | ) | Telkomsel | | | | | | | | | | | Deferred tax assets: | | | | | | | | | | | Provision for employee benefits | 277 | | 49 | | (29 | ) | - | | 297 | | Provision for impairment of receivables | 64 | | 53 | | - | | - | | 117 | | Recognition of interest under USO arrangements | (8 | ) | 14 | | - | | - | | 6 | | Total deferred tax assets | 333 | | 116 | | (29 | ) | - | | 420 | | Deferred tax liabilities: | | | | | | | | | | | Difference between accounting and tax property and equipment net book value | (2,519 | ) | 156 | | - | | - | | (2,363 | ) | Finance leases | - | | (23 | ) | - | | - | | (23 | ) | License amortization | (48 | ) | 5 | | - | | - | | (43 | ) | Total deferred tax liabilities | (2,567 | ) | 138 | | - | | - | | (2,429 | ) | Net deferred tax liabilities of Telkomsel | (2,234 | ) | 254 | | (29 | ) | - | | (2,009 | ) | Net deferred tax liabilities of the other subsidiaries | (96 | ) | (4 | ) | 0 | | - | | (100 | ) | Total deferred tax liabilities | (3,159 | ) | 711 | | 196 | | - | | (2,252 | ) | Net deferred tax assets of other subsidiaries | 75 | | 31 | | 1 | | (5 | ) | 102 | |
F-84
PERUSAHAAN PERSEROAN (PERSERO)
| PT TELEKOMUNIKASI INDONESIA Tbk AND SUBSIDIARIES
| NOTES TO THE CONSOLIDATED FINANCIAL STATEMENTS
| As of January 1, 2012 (Restated), December 31, 2012 (Restated) and December 31, 2013
| and for the years ended December 31, 2011 (Restated), 2012 (Restated) and 2013
| (Figures in tables are presented in billions of rupiah, unless otherwise stated)
|
|
Tabel of Content
32. TAXATION (continued)
h. Deferred tax assets and liabilities (continued)
| | January 1, 2013 (Restated) | | (Charged) credited to the consolidated statement of comprehensive income | | Recognized in other comprehensive income | | Acquisition/ divestment of subsidiary | | December 31, 2013 | | The Company | | | | | | | | | | | | Deferred tax assets: | | | | | | | | | | | | Provision for impairment of receivables | | 276 | | 170 | | - | | - | | 446 | | Net periodic pension and other post-employment benefit cost | | 851 | | 48 | | (558 | ) | - | | 341 | | Provision for employee benefits | | 173 | | (30 | ) | - | | - | | 143 | | Deferred connection fee | | 54 | | 16 | | - | | - | | 70 | | Accrued expenses and provision for inventory obsolescence | | 22 | | 5 | | - | | - | | 27 | | Finance leases | | (64 | ) | 73 | | - | | - | | 9 | | Provision for early retirement expense | | 140 | | (140 | ) | - | | - | | - | | Total deferred tax assets | | 1,452 | | 142 | | (558 | ) | - | | 1,036 | | Deferred tax liabilities: | | | | | | | | | | | | Difference between accounting and tax property and equipment net book value | | (1,581 | ) | 38 | | - | | - | | (1.543 | ) | Valuation of Long-term Investment | | - | | (70 | ) | - | | - | | (70 | ) | Land rights, intangible assets and others | | (14 | ) | 3 | | - | | - | | (11 | ) | Total deferred tax liabilities | | (1,595 | ) | (29 | ) | - | | - | | (1,624 | ) | Net deferred tax liabilities | | (143 | ) | 113 | | (558 | ) | - | | (588 | ) | Telkomsel | | | | | | | | | | | | Deferred tax assets: | | | | | | | | | | | | Provision for employee benefits | | 297 | | 44 | | (134 | ) | - | | 207 | | Provision for impairment of receivables | | 117 | | 4 | | - | | - | | 121 | | Recognition of interest under USO arrangements | | 6 | | (6 | ) | - | | - | | - | | Total deferred tax assets | | 420 | | 42 | | (134 | ) | - | | 328 | | Deferred tax liabilities: | | | | | | | | | | | | Difference between accounting and tax property and equipment net book value | | (2,363 | ) | 95 | | - | | - | | (2,268 | ) | Finance leases | | (23 | ) | (98 | ) | - | | - | | (121 | ) | License amortization | | (43 | ) | (19 | ) | - | | - | | (62 | ) | Total deferred tax liabilities | | (2,429 | ) | (22 | ) | - | | | | (2,451 | ) | Net deferred tax liabilities of Telkomsel | | (2,009 | ) | 20 | | (134 | ) | - | | (2,123 | ) | Net deferred tax liabilities of the other subsidiaries | | (100 | ) | (88 | ) | (4 | ) | (5 | ) | (197 | ) | Total deferred tax liabilities | | (2,252 | ) | 45 | | (696 | ) | (5 | ) | (2,908 | ) | Net deferred tax assets of other subsidiaries | | 102 | | 50 | | (5 | ) | (80 | ) | 67 | |
F-85
PERUSAHAAN PERSEROAN (PERSERO)
| PT TELEKOMUNIKASI INDONESIA Tbk AND SUBSIDIARIES
| NOTES TO THE CONSOLIDATED FINANCIAL STATEMENTS
| As of January 1, 2012 (Restated), December 31, 2012 (Restated) and December 31, 2013
| and for the years ended December 31, 2011 (Restated), 2012 (Restated) and 2013
| (Figures in tables are presented in billions of rupiah, unless otherwise stated)
|
|
Tabel of Content
32. TAXATION(continued)
h. Deferred tax assets and liabilities (continued)
As of December 31, 2012 and 2013, the aggregate amounts of temporary differences associated with investments in subsidiaries and associated companies, for which deferred tax liabilities have not been recognized were Rp20,317 billion and Rp24,252 billion, respectively.
Realization of the deferred tax assets is dependent upon the Group’s capability in generating future profitable operations. Although realization is not assured, the Group believes that it is probable that these deferred tax assets will be realized through reduction of future taxable income when temporary differences reverse. The amount of deferred tax assets is considered realizable; however, it can be reduced if actual future taxable income is lower than estimates.
i. Administration
From 2008 to 2012, the Company has been consecutively entitled to income tax rate reduction of 5% for meeting the requirements in accordance with the Government Regulation No. 81/2007 in conjunction with the Ministry of Finance Regulation No. 238/PMK.03/2008. On the basis of historical data, for the year 2013, the Company calculates the deferred tax using the tax rate of 20%.
The taxation laws of Indonesia require that the Company andits localsubsidiaries submit individual tax returns on the basis of self-assessment. Under prevailing regulations, the DGT may assess or amend taxes within a certain period. For fiscal years 2007 and earlier, this period is within ten yearsfromthe time the tax became due, but not later than 2013, while for fiscal years 2008 and onwards, the period is within five yearsfrom the time the tax became due.
The Ministry of Finance of the Republic of Indonesia has issued Regulation No. 85/PMK.03/2012 dated June 6, 2012 concerning the appointment of State-Owned Enterprises ("SOEs") to withhold, deposit and report VAT and Sales Tax on Luxury Goods ("PPnBM") according to the procedures outlined in the Regulation which is effective from July 1, 2012. The Ministry of Finance of the Republic Indonesia also has issued Regulation No. 224/PMK.011/2012 dated December 26, 2012 concerning the appointment of SOEs to withhold income tax article 22 which is effective from February 23, 2013. The Company has withheld, deposited and reported the VAT, PPnBM and income tax article 22 in accordance with the Regulation.
No tax audit has been conducted for fiscal years 2003, 2005, 2006, 2007, 2009 and 2010 on the Company. Tax audits have been completed for all other fiscal years, except for fiscal year 2011.
The Company received a certificate of tax audit exemption from the DGT for fiscal years 2007, 2008, 2009, 2010 and 2012 which is valid unless the Company files for corporate income tax overpayment, in which case a tax audit will be performed.
F-86
| 2015 | | 2016 | | | Number of shares | | % | | Rp | | Number of shares | | % | | Rp | | Beginning balance | 2,624,142,800 | | 2.60 | | 3,836 | | 2,601,779,800 | | 2.58 | | 3,804 | | Sale of treasury stock | (22,363,000 | ) | (0.02 | ) | (32 | ) | (864,000,000 | ) | (0.86 | ) | (1,263 | ) | Ending balance | 2,601,779,800 | | 2.58 | | 3,804 | | 1,737,779,800 | | 1.72 | | 2,541 | |
Pursuant to the AGM of Stockholders of the Company held on June 11, 2010, the stockholders approved the change in the Company’s plan for treasury stock phases I, II, and III to become: (i) for reissuance inside or outside the stock exchange, (ii) for retirement of the stock by deducting from equity, (iii) for equity stock conversion and (iv) for funding purposes. Pursuant to the AGM of Stockholders of the Company held on May 19, 2011, thestockholders approved to execute the repurchase plan for treasury stockphase IV. In 2012, the Company bought back 237,270,500 shares(equivalent to 1,186,352,500 shares after stock split)fromthepublic (part ofstock repurchase programphase IV) for Rp1,744 billion. In theAGM on April 19, 2013, the Company's stockholders approved the change to the plan for the treasury stock phase III, which was decided to be used for the implementation of the Employee Stock Ownership Program (“ESOPâ€) for the year 2013. On May 31, 2013, the Company offered all its eligible employees and those of its subsidiaries (collectively referred to as the “participantsâ€), the right to purchase a fixed number of its shares at a certain price. The shares became an entitlement of the employees on the transaction dates and were no longer conditional on the satisfaction of any vesting conditions. Shares which were held by employees through the ESOP had a lock-up period that varied from 0 up to 12 months, depending on the position of the employee. In the lock-up period, participants could not transfer shares or have shares transactions either through or outside the stock exchange. Price per share offered was Rp10,714 and each participant received allowance (discount) of Rp5,575 per share. At the closing of this program, the Company had transferred a part of the treasury stock phase III to employees totalling 59,811,400 shares (equivalent to 299,057,000 shares after the stock split) with fair value amounting to Rp661 billion. The excess amounting to Rp228 billion in value of the treasury stock transferred over their acquisition cost was recorded as additional paid-in capital (Note 20).
The difference amounting to Rp353 billion between the fair value of treasury stock and amount paid by the participants was recorded as part of “Personnel Expenses†in the 2013 consolidated statement of profit or loss and other comprehensive income. On July 30, 2013, the Company resold 211,290,500 shares (equivalent to 1,056,452,500 shares after stock split) of treasury stock phase I with fair value amounting to Rp2,368 billion (net of related costs to sell the shares). The excess amounting to Rp544 billion in value of the treasury shares sold over their acquisition cost was recorded as additional paid-in capital (Note20). F-70
PERUSAHAAN PERSEROAN (PERSERO) PT TELEKOMUNIKASI INDONESIA Tbk AND SUBSIDIARIES NOTES TO THE CONSOLIDATED FINANCIAL STATEMENTS As of December 31, 2015 and 2016 and for the Years Ended December 31, 2014, 2015 and 2016 (Figures in tables are expressedin billions ofRupiah, unless otherwise stated) Table of Content
21. TREASURY STOCK (continued) OnJune 13,2014, the Company resold215,000,000 shares (equivalent to1,075,000,000 shares after stock split) of treasury stock phaseII with fair value amounting to Rp2,541 billion (net ofrelated coststo sell the shares). The excess amounting to Rp576 billion in value of the treasury stock sold over their acquisition cost was recorded as additional paid-in capital (Note 20). On December 21, 2015, the Company resold 4,472,600 shares (equivalent to 22,363,000 shares after stock split) of treasury stock phase III with fair value amounting to Rp68 billion (net of related costs to sell the shares). The excess amounting to Rp36 billion in value of the treasury stock sold over their acquisition cost was recorded as additional paid-in capital (Note 20). On June 29, 2016, the Company resold 172,800,000 shares (equivalent to 864,000,000 shares after stock split)of treasury stock phase IV with fair value of Rp3,259 billion (net of related costs to sell the shares). The excess amounting to Rp1,996 billion in value of the treasury stock sold over their acquisition cost was recorded as additional paid-in capital(Note 20).
22. OTHER RESERVES
Other reserves mainly consist of the translation reserve and fair value reserve. The translation reserve consists of all foreign currency differences arising from the translation of the financial statements of foreign operations amounting to Rp312 billion and Rp272 billionas of December 31, 2015 and 2016, respectively. There were no reclassifications to profit or loss for the years ended December 31, 2014, 2015 and 2016. The fair value reserve consists of the cumulative net change in the fair value of available-for-sale financial assets until the investments are derecognized or impaired amounting to Rp38 billion and Rp38billion as of December 31, 2015 and 2016,respectively. There were no reclassifications to profit or loss for the years ended December 31, 2014, 2015 and 2016.
23. BASIC AND DILUTED EARNINGS PER SHARE
Basic earnings per share is computed by dividing profit for the year attributable to owners of the parent company amounting to Rp14,437 billion, Rp15,451 billionand Rp19,333billion by the weighted average number of shares outstanding during the year totalling 97,695,785,107 shares, 98,176,527,553 sharesand98,638,501,532 sharesfor theyearsended December 31, 2014, 2015 and 2016, respectively. The weighted average number of shares takes into account the weighted average effect of changes in treasury stock transactions during the year. Basic earnings per share amounted to Rp147.78, Rp157.38 and Rp195.99for theyearsended December 31, 2014, 2015 and 2016, respectively. The Company does not have potentially dilutive financial instruments as of December 31,2014,2015 and 2016. F-71
PERUSAHAAN PERSEROAN (PERSERO) PT TELEKOMUNIKASI INDONESIA Tbk AND SUBSIDIARIES NOTES TO THE CONSOLIDATED FINANCIAL STATEMENTS As of December 31, 2015 and 2016 and for the Years Ended December 31, 2014, 2015 and 2016 (Figures in tables are expressedin billions ofRupiah, unless otherwise stated) Table of Content
24. REVENUES | 2014 | | 2015 | | 2016 | | Telephone revenues | | | | | | | Cellular | | | | | | | Usage charges | 33,723 | | 36,853 | | 38,238 | | Monthly subscription charges | 567 | | 432 | | 259 | | Sub-total | 34,290 | | 37,285 | | 38,497 | | Fixed lines | | | | | | | Usage charges | 5,347 | | 4,635 | | 3,847 | | Monthly subscription charges | 2,697 | | 2,821 | | 3,311 | | Call center | 290 | | 275 | | 290 | | Others | 101 | | 102 | | 94 | | Sub-total | 8,435 | | 7,833 | | 7,542 | | Total telephone revenues | 42,725 | | 45,118 | | 46,039 | | Interconnectionrevenues | 4,708 | | 4,290 | | 4,151 | | Data,internet andinformationtechnologyservice revenues | | | | | | | Cellular internet and data | 13,563 | | 19,665 | | 28,308 | | Short Messaging Services (“SMSâ€) | 14,034 | | 15,132 | | 15,980 | | Internet, data communication and information technology services | 9,987 | | 12,307 | | 13,073 | | Pay TV | 96 | | 581 | | 1,546 | | Others | 128 | | 135 | | 64 | | Total data, internet and information technology servicerevenues | 37,808 | | 47,820 | | 58,971 | | Networkrevenues | 1,280 | | 1,231 | | 1,444 | | Other revenues | | | | | | | Sales of handset | 582 | | 1,516 | | 1,490 | | Telecommunication tower leases | 700 | | 721 | | 733 | | Call center service | 446 | | 668 | | 678 | | E-payment | 74 | | 126 | | 424 | | E-health | 165 | | 192 | | 415 | | CPE and terminal | 61 | | 221 | | 192 | | Others | 1,147 | | 567 | | 1,796 | | Totalotherrevenues | 3,175 | | 4,011 | | 5,728 | | Total revenues | 89,696 | | 102,470 | | 116,333 | |
Refer to Note 31 for details of related party transactions. F-72
PERUSAHAAN PERSEROAN (PERSERO) PT TELEKOMUNIKASI INDONESIA Tbk AND SUBSIDIARIES NOTES TO THE CONSOLIDATED FINANCIAL STATEMENTS As of December 31, 2015 and 2016 and for the Years Ended December 31, 2014, 2015 and 2016 (Figures in tables are expressedin billions ofRupiah, unless otherwise stated) Table of Content
25. PERSONNEL EXPENSES
The breakdown of personnel expenses is as follows: | 2014 | | 2015 | | 2016 | | Salaries and related benefits | 5,076 | | 5,684 | | 7,122 | | Vacation pay, incentives and other benefits | 3,504 | | 4,575 | | 4,219 | | Pension benefit cost (Note29) | 643 | | 443 | | 1,068 | | Early retirement program | - | | 683 | | 628 | | LSA expense (Note 30) | 115 | | 152 | | 237 | | Net periodic post-employment health care benefit cost (Note 29) | 248 | | 216 | | 163 | | Other employee benefit cost (Note29) | 56 | | 53 | | 82 | | Other post-employment benefit cost (Note29) | 48 | | 47 | | 48 | | Others | 86 | | 32 | | 45 | | Total | 9,776 | | 11,885 | | 13,612 | |
Refer to Note 31 for details of related party transactions.
26.OPERATION, MAINTENANCE AND TELECOMMUNICATION SERVICE EXPENSES
The breakdown of operation, maintenance and telecommunication service expenses is as follows:
| 2014 | | 2015 | | 2016 | | Operation and maintenance | 11,512 | | 15,129 | | 17,047 | | Radio frequency usage charges (Notes33c.i and 33c.ii) | 3,207 | | 3,626 | | 3,687 | | Leased lines and CPE | 1,073 | | 1,913 | | 2,578 | | Concession fees and USO charges | 1,818 | | 2,230 | | 2,217 | | Cost of IT services | 357 | | 882 | | 1,563 | | Cost of handset sold (Note 7) | 421 | | 1,493 | | 1,481 | | Electricity, gas and water | 1,180 | | 1,014 | | 960 | | Cost of SIM cards and vouchers(Note7) | 610 | | 444 | | 624 | | Vehicles rental and supporting facilities | 272 | | 296 | | 367 | | Tower leases | 1,065 | | 646 | | 322 | | Insurance | 335 | | 312 | | 256 | | Others | 438 | | 131 | | 161 | | Total | 22,288 | | 28,116 | | 31,263 | |
Refer to Note 31 for details of related party transactions.
27. GENERAL AND ADMINISTRATIVE EXPENSES The breakdown of general and administrative expenses is as follows: | 2014 | | 2015 | | 2016 | | General expenses | 967 | | 1,032 | | 1,626 | | Provision for impairment of receivables (Note6d) | 784 | | 1,010 | | 743 | | Professional fees | 266 | | 424 | | 594 | | Travelling | 355 | | 347 | | 436 | | Training, education and recruitment | 528 | | 393 | | 399 | | Meeting | 162 | | 163 | | 207 | | Collection expenses | 369 | | 368 | | 152 | | Social contribution | 96 | | 116 | | 134 | | Others | 436 | | 351 | | 319 | | Total | 3,963 | | 4,204 | | 4,610 | |
Refer to Note 31 for details of related party transactions.
F-73
PERUSAHAAN PERSEROAN (PERSERO) PT TELEKOMUNIKASI INDONESIA Tbk AND SUBSIDIARIES NOTES TO THE CONSOLIDATED FINANCIAL STATEMENTS As of December 31, 2015 and 2016 and for the Years Ended December 31, 2014, 2015 and 2016 (Figures in tables are expressedin billions ofRupiah, unless otherwise stated) Table of Content
28. TAXATION
a. Prepaid income taxes The breakdown of prepaid income taxes is as follows: | 2015 | | 2016 | | The Company - corporate income tax | 479 | | 473 | | Subsidiaries - corporate income tax | 306 | | 128 | | Total | 785 | | 601 | | Current portion | (81 | ) | (109 | ) | Non-current portion (Note 11) | 704 | | 492 | |
b. Prepaid other taxes The breakdown of prepaid other taxes is as follows: | 2015 | | 2016 | | The Company: | | | | | Value Added Tax (“VATâ€) | 648 | | 1,410 | | Article 19- Revaluation of fixed assets (Note 28h) | 750 | | 538 | | Subsidiaries: | | | | | VAT | 1,608 | | 2,785 | | Article 23 - Withholding tax on services delivery | 20 | | 52 | | Total | 3,026 | | 4,785 | | Current portion | (2,657 | ) | (2,621 | ) | Non-current portion (Note 11) | 369 | | 2,164 | |
c. Current income tax liabilities
The breakdown of current income tax liabilities is as follows: | 2015 | | 2016 | | The Company: | | | | | Article 25 - Installment of corporate income tax | 17 | | - | | Subsidiaries: | | | | | Article 25 - Installment of corporate income tax | 237 | | 136 | | Article 29 - Corporate income tax | 1,548 | | 1,100 | | Total | 1,802 | | 1,236 | |
F-74
PERUSAHAAN PERSEROAN (PERSERO) PT TELEKOMUNIKASI INDONESIA Tbk AND SUBSIDIARIES NOTES TO THE CONSOLIDATED FINANCIAL STATEMENTS As of December 31, 2015 and 2016 and for the Years Ended December 31, 2014, 2015 and 2016 (Figures in tables are expressedin billions ofRupiah, unless otherwise stated) Table of Content
28. TAXATION (continued) d. Other tax liabilities The breakdown of other tax liabilities is as follows: | 2015 | | 2016 | | The Company: | | | | | Article 4 (2) - Final tax | 37 | | 29 | | Article 21 - Individual income tax | 51 | | 141 | | Article 22 - Withholding tax on goods delivery and imports | 2 | | 2 | | Article 23 - Withholding tax on services | 23 | | 42 | | Article 26 - Withholding tax on non-resident income | 2 | | 136 | | VAT- asTaxCollector | 396 | | 297 | | Sub-total | 511 | | 647 | | Subsidiaries: | | | | | Article 4 (2) - Final tax | 54 | | 63 | | Article 21 - Individual income tax | 113 | | 121 | | Article 22 - Withholding tax on goods delivery and imports | 1 | | 2 | | Article 23 - Withholding tax on services | 102 | | 93 | | Article 26 - Withholding tax on non-resident income | 9 | | 16 | | VAT | 681 | | 776 | | Sub-total | 960 | | 1,071 | | Total | 1,471 | | 1,718 | |
e. The components of income tax expense (benefit) are as follows:
| 2014 | | 2015 | | 2016 | | Current | | | | | | | The Company | 822 | | 201 | | 671 | | Subsidiaries | 6,794 | | 8,164 | | 10,067 | | Sub-total | 7,616 | | 8,365 | | 10,738 | | Deferred | | | | | | | The Company | (174 | ) | (38 | ) | (844 | ) | Subsidiaries | (101 | ) | (304 | ) | (877 | ) | Sub-total | (275 | ) | (342 | ) | (1,721 | ) | Net income tax expense | 7,341 | | 8,023 | | 9,017 | |
F-75
PERUSAHAAN PERSEROAN (PERSERO) PT TELEKOMUNIKASI INDONESIA Tbk AND SUBSIDIARIES NOTES TO THE CONSOLIDATED FINANCIAL STATEMENTS As of December 31, 2015 and 2016 and for the Years Ended December 31, 2014, 2015 and 2016 (Figures in tables are expressedin billions ofRupiah, unless otherwise stated) Table of Content
28. TAXATION (continued) f. Reconciliation of income tax expense The reconciliation between the income tax expense calculated by applying the applicable tax rate of 20% to the profit before income tax less income subject to final tax, and the net income tax expense as shown in the consolidatedstatements of profit or loss and other comprehensive income is as follows:
| 2014 | | 2015 | | 2016 | | Profit before income tax | 28,579 | | 31,293 | | 38,166 | | Less: income subject to final tax - net | (2,334 | ) | (1,531 | ) | (1,684 | ) | Net | 26,245 | | 29,762 | | 36,482 | | Income tax expense calculated at the Company’s applicable statutory tax rate of 20% | 5,249 | | 5,952 | | 7,296 | | Difference in applicable statutory tax rate for subsidiaries | 1,236 | | 1,509 | | 1,904 | | Non-deductible expenses | 512 | | 332 | | 496 | | Final income tax expense | 168 | | 111 | | 345 | | Deferred tax assets on fixed assetsrevaluationfor tax purpose | - | | - | | (1,415 | ) | Deferredtaxassets that cannot be utilized-net | 94 | | - | | 56 | | Others | 82 | | 119 | | 335 | | Net income tax expense | 7,341 | | 8,023 | | 9,017 | |
The details of the net income tax expense for the yearsended December 31, 2014, 2015 and 2016 are as follows:
| 2014 | | 2015 | | 2016 | | Estimated taxable income of the Company | 3,687 | | 552 | | 1,703 | | Corporate income tax: | | | | | | | The Company | 738 | | 110 | | 340 | | Subsidiaries | 6,710 | | 8,144 | | 10,053 | | Final tax expense: | | | | | | | The Company | 84 | | 91 | | 331 | | Subsidiaries | 84 | | 20 | | 14 | | Total income tax expense – current | 7,616 | | 8,365 | | 10,738 | |
F-76
PERUSAHAAN PERSEROAN (PERSERO) PT TELEKOMUNIKASI INDONESIA Tbk AND SUBSIDIARIES NOTES TO THE CONSOLIDATED FINANCIAL STATEMENTS As of December 31, 2015 and 2016 and for the Years Ended December 31, 2014, 2015 and 2016 (Figures in tables are expressedin billions ofRupiah, unless otherwise stated) Table of Content
28. TAXATION (continued) f. Reconciliation of income tax expense(continued) | 2014 | | 2015 | | 2016 | | Income tax (benefit) expense - deferred - effect of temporary differences at enacted maximum tax rates | | | | | | | The Company | | | | | | | Realizationof accrual(accrual)ofexpenses and inventory write-off (provision forinventoryobsolescence) | (49 | ) | (135 | ) | 142 | | Finance leases | (13 | ) | (47 | ) | 68 | | Trade receivables write-off (provision for impairment of receivables) | (24 | ) | 41 | | 41 | | Depreciation and gain on disposal or sale of property and equipment | (85 | ) | 139 | | (825 | ) | Net periodic post-employment benefits costs and provision for employee benefits | (3 | ) | (28 | ) | (214 | ) | Valuation oflong-term investments | (1 | ) | (24 | ) | (34 | ) | Amortization of intangible assets, land rights and others | 3 | | 9 | | (12 | ) | Amortizationof(addition to) deferred installation fee | (2 | ) | 7 | | (10 | ) | Net | (174 | ) | (38 | ) | (844 | ) | Telkomsel | | | | | | | Charges from leasing transactions | 133 | | 131 | | 164 | | Depreciation of property and equipment | (224 | ) | (350 | ) | (913 | ) | Provision for employee benefits | (27 | ) | (18 | ) | (55 | ) | Trade receivables write-off (provision for impairment of receivables) | (8 | ) | (9 | ) | (5 | ) | Amortization of license | (1 | ) | (9 | ) | (4 | ) | Accounts receivable - Government | - | | 0 | | - | | Net | (127 | ) | (255 | ) | (813 | ) | Subsidiaries - others - net | 26 | | (49 | ) | (64 | ) | Net income tax benefit - deferred | (275 | ) | (342 | ) | (1,721 | ) | Income tax expense - net | 7,341 | | 8,023 | | 9,017 | |
Tax Law No. 36/2008 with implementing rules under Government Regulation No. 56/2015 stipulates a reduction of 5% from the maximum rate applicable to qualifying listed companies, for those whose stocks are traded in the IDX which meet the prescribed criteria that the public owns 40% or more of the total fully paid and traded shares, and such shares are owned by at least 300 parties, with each party owning less than 5% of the total paid-up shares. These requirements must be met by a company for a period of 183 days in one tax year. The Company has met all of the required criteria;therefore, forthepurpose of calculating income tax expense and liabilities for the financial reporting yearsendedDecember 31,2014,2015 and 2016,the Company hasreduced the applicable tax rate by 5%. F-77
PERUSAHAAN PERSEROAN (PERSERO) PT TELEKOMUNIKASI INDONESIA Tbk AND SUBSIDIARIES NOTES TO THE CONSOLIDATED FINANCIAL STATEMENTS As of December 31, 2015 and 2016 and for the Years Ended December 31, 2014, 2015 and 2016 (Figures in tables are expressedin billions ofRupiah, unless otherwise stated)
Table of Content
28. TAXATION (continued) f. Reconciliation of income tax expense(continued) The Company applied the tax rate of 20% for theyearsended December 31, 2014, 2015 and 2016. The subsidiaries applied the tax rate of 25% for theyearsended December 31, 2014, 2015 and 2016. TheCompany will submit the above corporate income tax computation in its income tax return (“Surat Pemberitahuan Tahunan†or Annual Tax Return) for fiscal year 2016 that will be reported to the tax office based on prevailing regulations. The amount of corporate income tax for the year ended December 31, 2015 agreed with what was reported in the annual tax return. g. Tax assessments (i)The Company In November 2013, theCompany received tax underpayment assessment letters (“SKPKBsâ€) No. 00056/207/07/093/13 to No. 00065/207/07/093/13 dated November 15, 2013, for the underpayment of VAT for theperiod Januaryto September and November 2007 amounting to Rp142 billion.On January 20, 2014, the Company filedits objection to the Tax Authorities. The Company has received the rejection of its objection through The Directorate General of Taxation (“DGTâ€) decision letters Nos. 2498 to 2504 and 2541 to 2543/WPJ.19/2014 dated December 16 and 18, 2014, respectively. The Companyaccepted the assessment on the underpayment of VAT amounting to Rp22 billion (including penalty of Rp10 billion).The accepted portion was charged tothe 2014consolidated statement of profit or loss and other comprehensive income and the portion of VAT Interconnection amounting to Rp120 billion (including penaltyofRp39 billion) is recognized as claim for tax refund.The Company has filed an appealtothe Tax Court onthe rejectionof its objection to the assessmentof VATInterconnection No. Tel. 59/KU000/COP-10000000/2015 to No. Tel. 68/KU000/COP-10000000/2015datedMarch 12, 2015. As of the date of approval and authorization for the issuance of these consolidated financial statements, the appeal is still in process. In November 2014, the Company received SKPKBs from theTax Authorities astheresult ofthetax audit for fiscal year 2011. Based onthe letters, the Companywas assessed VAT underpayment for the tax period January to December 2011 amounting to Rp182.5 billion (including penaltyofRp60 billion) and corporate income tax underpayment assessment amounting to Rp2.8 billion (including penalty of Rp929 million). The Company has paid the underpayment.The accepted portion on the VATunderpaymentamounting to Rp4.7 billion (including penaltyofRp2 billion)was charged to the 2014 consolidatedstatement of profit or loss and other comprehensive income and the portion of VAT Interconnection amounting to Rp178 billion (including penalty of Rp58 billion) is recognized as claim for tax refund.The Company filed on January 7, 2015 an objection on the 2011 VATInterconnection assessmentto the Tax Authorities.The TaxAuthorities rejected the Company’s objection through its decrees Nos. 1907 to 1914 dated October 20, 2015 for the tax period January to August 2011, Nos. 2026 to 2028 dated November 2, 2015 for the tax period October to December 2011 and No. 2642/WPJ.19/2015 dated December 29, 2015 for the tax period September 2011. On January 20, 2016, the Company filed an appeal to the Tax Court on the rejection of its objection. As of the date of approval and authorization for the issuance of these consolidated financial statements, the appeal is still in process. F-78
PERUSAHAAN PERSEROAN (PERSERO) PT TELEKOMUNIKASI INDONESIA Tbk AND SUBSIDIARIES NOTES TO THE CONSOLIDATED FINANCIAL STATEMENTS As of December 31, 2015 and 2016 and for the Years Ended December 31, 2014, 2015 and 2016 (Figures in tables are expressedin billions ofRupiah, unless otherwise stated) Table of Content
28. TAXATION (continued) g. Tax assessments(continued) (i)The Company (continued) The Company received a letter from theTax AuthoritiesNo. Pemb-00427/WPJ.19/KP.0405/RIK.SIS/2015 dated June 29, 2015regardingField Tax Audit Notificationforthetax periodJanuary to December 2014.On April 20, 2016, the Company receivedtax overpayment letter No. 00022/406/14/093/16 for the overpayment ofincometax for fiscal year 2014 amounting to Rp51.5 billion. On May 3, 2016, the Tax Authorities issued Field TaxAudit Notification Letter for tax period January to December 2012. The Company received SKPKBs as a result of the tax audit. Based on the letters, the Company was assessed underpayment of corporate income tax amounting to Rp991.6 billion (including penalty of Rp321.6 billion), VAT underpayment amounting to Rp467 billion (including penalty of Rp153.5 billion), VAT underpayment on taxable services from outside the Indonesia customs territory amounting to Rp1.2 billion (including penalty of Rp392 million), and VAT underpayment on tax collected amounting to Rp57 billion (including penalty of Rp18.5 billion). The Company also received tax collection letter (“STPâ€) for VAT amounting to Rp37.5 billion, withholding tax article 21 underpayment assessment amounting to Rp16.2 billion (including penalty of Rp5.3 billion), final withholding tax article 21 underpayment assessment amountingtoRp1.2 billion (including penalty of Rp407 million), withholding tax article 23 underpayment assessment amounting to Rp63.5 billion (including penalty of Rp20.6 billion), withholding tax article 4(2) underpayment assessment amounting to Rp25 billion (including penaltyofRp8.1 billion) and withholding tax article 26 underpayment assessment amounting to Rp197.6 billion (including penalty of Rp64 billion).The Companyhasagreed to the recalculation of input tax credit on incoming interconnection services amounting to Rp35 billion, corporate income tax amounting to Rp613 million and withholding tax article 26 amounting to Rp311.5 million that have been charged in the consolidated statement of profit or loss and other comprehensive income. The Company filed an objection against the remaining assessments on November 16, 2016. As of the date of approval and authorization for the issuance of these consolidated financial statements, the objection is still in process. The Company received a letter from the Tax Authorities dated August 23, 2016 regarding Field Tax Audit Notification forthetax period January to December 2015. As of the date of approval and authorization for the issuance of these consolidated financial statements, the audit process is still ongoing. F-79
PERUSAHAAN PERSEROAN (PERSERO) PT TELEKOMUNIKASI INDONESIA Tbk AND SUBSIDIARIES NOTES TO THE CONSOLIDATED FINANCIAL STATEMENTS As of December 31, 2015 and 2016 and for the Years Ended December 31, 2014, 2015 and 2016 (Figures in tables are expressedin billions ofRupiah, unless otherwise stated) Table of Content
28. TAXATION (continued)
g. Tax assessments (continued) (ii) Telkomsel In December 2013, the Tax Court accepted Telkomsel’s appeal on the 2006 VAT and withholding taxes totaling Rp116 billion. In February 2014,Telkomsel received the refund. On July 3, 2015, in response to Telkomsel’s letter claiming for interest income related to favorable 2006 VAT and withholding tax verdicts, the Tax Authorities informedTelkomsel that the claim cannot be granted since the Tax Authorities filed a request for judicial review to the Supreme Court (“SCâ€). On August 19, 2016, Telkomsel received a notification from the Tax Court that the Tax Authorities filed a request for judicial review toSC for the VAT case amounting to Rp108 billion. Telkomsel filed a contra-appeal to the SC on September 14, 2016. On April 21, 2010, the Tax Authorities filed a judicial review request to the SC for the Tax Court’s acceptance of Telkomsel’s request to cancel the Tax Collection Letter (“STPâ€) for the underpayment of December 2008 income tax article 25 amounting to Rp429 billion (including a penalty of Rp8.4 billion). In May 2010, Telkomsel filed a contra-appeal to the SC. In July 2016, the verdict on the case has been announced in theSC website in favor of the Tax Authorities. Although Telkomsel has not received the official written verdict from the SC, for conservatism purpose, the tax penalty of Rp8.4 billionhas been charged to profit or loss. The income tax of Rp421 billion will not become an additional tax expense as such corporate income tax is creditable against Telkomsel’s income tax liability. In May and June 2012, Telkomsel received the refund ofthepenalty onthe2010 income tax article 25 underpayment amounting to Rp15.7 billion based on the Tax Court’s verdict. On July 17, 2012, the Tax Authorities filed a judicial review request to the SC on the Tax Court’s Verdict. On September 14, 2012, Telkomsel filed a contra-appeal to the SC. In July 2016, conservatively, Telkomsel recognized the tax penalty of Rp15.7 billion as expense based on its previous experience on a similar income tax case. On May 24, 2012, Telkomsel filed an objection to the Tax Authorities for the 2010 underpayment ofVAT of Rp290.6 billion (including penalty of Rp67 billion) and recorded it as a claim for tax refund. On May 1, 2013, the Tax Authorities rejected Telkomsel’s objection. Subsequently, on July 29, 2013, Telkomsel filed an appeal to the Tax Court. On March 16, 2015, the Tax Court accepted Telkomsel’s appeal. On May 13, 2015, Telkomsel receivedthe refund forVAT amounting to Rp290.6 billion. On June 24, 2015,the Tax Authorities filed a judicial reviewrequestto the SC. On May 2, 2016, Telkomsel received a notification fromtheTax Court regarding the judicial review. Subsequently, on May 27, 2016 Telkomsel filed a contra-appeal to the SC. As of the date of approval and authorization for issuance of theseconsolidatedfinancial statements, the judicial review is still in process. F-80
PERUSAHAAN PERSEROAN (PERSERO) PT TELEKOMUNIKASI INDONESIA Tbk AND SUBSIDIARIES NOTES TO THE CONSOLIDATED FINANCIAL STATEMENTS As of December 31, 2015 and 2016 and for the Years Ended December 31, 2014, 2015 and 2016 (Figures in tables are expressedin billions ofRupiah, unless otherwise stated) Table of Content
28. TAXATION (continued)
g. Tax assessments (continued) (ii) Telkomsel (continued) On November 7, 2014, Telkomsel received assessment letters as a result of a tax audit for the fiscal year 2011 by the Tax Authorities. According to the letters, Telkomsel is liable for the underpayment of corporate income tax, value added tax and withholding tax amounting to Rp257.8 billion, Rp2.9 billion and Rp2.2 billion (including penalty of Rp85.3 billion), respectively.In December 2014,Telkomsel accepted the assessment of Rp7.8 billion for the underpayment of corporate income tax, Rp1 billion for the underpayment of VAT and Rp2.2 billion for the underpayment of withholding tax (including penalty of Rp3.5 billion). The accepted portion was charged to the 2014 consolidated statement of profit or loss and other comprehensive income. In December 2014, Telkomselpaid the assessments andfiled objectionlettersto the Tax Authorities for the underpayment of corporate income tax of Rp250 billion (including penalty of Rp81.1 billion) andVAT of Rp1.9 billion (including penalty of Rp670 million). In November and December 2015, Telkomsel received the rejection letters from the Tax Authorities for corporate income tax ofRp250 billion and VAT of Rp1.4 billion. The remaining amount of Rp250 million was charged to the 2015 statement of profit or loss and other comprehensive income. In August 2015, Telkomsel received a letter from the Tax Authoritiesconfirmingthat towers should be classified as building and depreciated for 20 years. This letter is based onaspecific tax ruling on fiscal depreciation of towersissued in July 2015. Subsequently, part oftheclaim forbasic incometax refund has been reclassified to deferred tax liabilitieswhile thepenaltywascharged tothe 2015profit or loss amounting to Rp125.5 billion and Rp60 billion, respectively. On February 15, 2016, Telkomsel filed an appeal to the Tax Authorities for the 2011 underpayment of corporate income tax of Rp250 billion (including penalty of Rp81.1 billion). Subsequently, on March 17, 2016,Telkomsel also filed an appeal to the Tax Court for the underpayment of VAT amounting to Rp1.2 billion (including penalty of Rp392 million). In December 2016, after the court hearing sessions ended, Telkomsel reviewed the corporate income tax developments resulting in a downward adjustment of Rp18 billion to the claim for tax refund which was reduced from Rp66 billion to Rp48 billion. As of the date of approval and authorization for issuance of these consolidated financial statements, Telkomsel has not received the Tax Court’s verdict. On July 28, 2016,Telkomselreceived the tax audit instruction letter for compliance of fiscal year 2014. As of the date of approval and authorization for issuance of these consolidated financial statements, the tax audit is still in progress. F-81
PERUSAHAAN PERSEROAN (PERSERO) PT TELEKOMUNIKASI INDONESIA Tbk AND SUBSIDIARIES NOTES TO THE CONSOLIDATED FINANCIAL STATEMENTS As of December 31, 2015 and 2016 and for the Years Ended December 31, 2014, 2015 and 2016 (Figures in tables are expressedin billions ofRupiah, unless otherwise stated) Table of Content
28. TAXATION (continued) h. Tax incentives In December 2015, the Company took advantage of the Economic Policy Package V in the form of tax incentives for fixed assets revaluation as stipulated in the Ministry of Finance Regulation (“PMKâ€) No. 191/PMK.010/2015 juncto PMK No. 233/PMK.03/2015 juncto PMK No. 29/PMK.03/2016. In accordance with the PMK, the Company is allowed to revalue its fixed assets for tax purposes and will obtain lower income tax when the application of the revaluation is submitted to DGT during the period between the effective date of PMK and December 31, 2016. The final income tax is determined at a rate ranging from 3%-6% on the excess of the revalued amount of fixed assets over its original net book value depending on the timing of submission of application to the DGT. On December 29, 2015, the Company filed an application for fixed assets revaluation using self-assessed revaluation amount and has paid the related final income tax amounting to Rp750 billion. Based on the PMK, the self-assessed revaluation amount should be evaluated by aPublicIndependentAppraiser (“KJPPâ€) or valuation specialist, which is registered with the Government before December 31, 2016. Upon verification of the completeness and accuracy of the application, the DGT may issue approval letter within 30 days after the receipt of complete application. The Company has appointed a KJPP to perform fixed assets revaluation of the Company. The Company planned to submit the related KJPP report in two phases, where KJPP reports Phase 1 and Phase 2 will be submitted before December 31, 2016 and December 31, 2017, respectively. Consequently, the Company expects to be eligible for 3% tax rate for Phase 1 report and 6% tax rate for Phase 2. On October 28, 2016, the Company submitted KJPP report (Phase 1) reporting a revaluation increment of Rp7,078 billion. On November 10, 2016 the DGT through its decision letter No.KEP-580/WPJ.19/2016 approved the Company’s application (Phase 1). In its letter, DGT also affirmed that the related final income tax is Rp212 billion which will be taken from the prepayment of Rp750 billion made by the Company on December 29, 2015. On December 15, 2016, the Company submitted its fixed assets revaluation application for Phase 2 to DGT and expects to be eligible for 6% tax rate. In its application, the Company estimated a revaluation increment of Rp8,961 billion with estimated final income tax of Rp538 billion which will be taken from the prepayment of Rp750 billion made by the Company on December 29, 2015. In accordance with the regulation, the Company is required to submit the fixed assets revaluation assessed by KJPP on December 31, 2017 at the latest in order to be eligible for 6% tax rate. As of the date of approval and authorization for issuance of these consolidated financial statements, the fixed assets revaluation assessment from KJPP is still on-going. A deductible temporary difference arose on this fixed assets revaluation for tax purposes since the tax base of the fixed assets is higher than their carrying amount. The deductible temporary difference results in a deferred tax asset since the economic benefits will flow to the Company in a form of reduction of taxable income in the future periods when the assets are recovered. In 2016, the Company recognized deferred tax assets amounting to Rp1,415 billion on the revaluation increment on fixed assets, as approved by the DGT. F-82
PERUSAHAAN PERSEROAN (PERSERO) PT TELEKOMUNIKASI INDONESIA Tbk AND SUBSIDIARIES NOTES TO THE CONSOLIDATED FINANCIAL STATEMENTS As of December 31, 2015 and 2016 and for the Years Ended December 31, 2014, 2015 and 2016 (Figures in tables are expressedin billions ofRupiah, unless otherwise stated) Table of Content
28. TAXATION (continued) i.Deferred tax assets and liabilities The details of deferred tax assets and liabilities are as follows: | December 31, 2014 | | (Charged) credited to profit or loss | | (Charged) credited to other comprehensive income | | Reclassification | | December 31, 2015 | | The Company | | | | | | | | | | | Deferred tax assets: | | | | | | | | | | | Provision for impairment of receivables | 470 | | (41 | ) | - | | - | | 429 | | Net periodic pension and other post-employment benefits costs | 330 | | 3 | | 2 | | - | | 335 | | Accrued expenses and provision for inventory obsolescence | 76 | | 135 | | - | | - | | 211 | | Provisions for employee benefit | 72 | | 25 | | - | | - | | 97 | | Finance leases | 22 | | 47 | | - | | - | | 69 | | Deferred installation fee | 72 | | (7 | ) | - | | - | | 65 | | Total deferred tax assets | 1,042 | | 162 | | 2 | | - | | 1,206 | | Deferred tax liabilities: | | | | | | | | | | | Difference between accounting and tax property and equipment net carrying value | (1,458 | ) | (139 | ) | - | | - | | (1,597 | ) | Valuation of long-term investment | (69 | ) | 24 | | - | | - | | (45 | ) | Land rights, intangible assets and others | (14 | ) | (9 | ) | - | | - | | (23 | ) | Total deferred tax liabilities | (1,541 | ) | (124 | ) | - | | - | | (1,665 | ) | Deferred tax liabilities of the Company - net | (499 | ) | 38 | | 2 | | - | | (459 | ) | Telkomsel | | | | | | | | | | | Deferred tax assets: | | | | | | | | | | | Provisions for employee benefits | 274 | | 18 | | 57 | | - | | 349 | | Provision for impairment of receivables | 129 | | 9 | | - | | - | | 138 | | Total deferred tax assets | 403 | | 27 | | 57 | | - | | 487 | | Deferred tax liabilities: | | | | | | | | | | | Difference between accounting and tax property and equipment net carrying value | (2,044 | ) | 350 | | - | | 299 | | (1,395 | ) | Finance leases | (254 | ) | (131 | ) | - | | - | | (385 | ) | Lisence amortization | (61 | ) | 9 | | - | | - | | (52 | ) | Total deferred tax liabilities | (2,359 | ) | 228 | | - | | 299 | | (1,832 | ) | Deferred tax liabilities of Telkomsel - net | (1,956 | ) | 255 | | 57 | | 299 | | (1,345 | ) | Deferred tax liabilities of other subsidiaries - net | (248 | ) | (59 | ) | 1 | | - | | (306 | ) | Deferred tax liabilities - net | (2,703 | ) | 234 | | 60 | | 299 | | (2,110 | ) | Deferred tax assets - net | 95 | | 107 | | (1 | ) | - | | 201 | |
F-83
PERUSAHAAN PERSEROAN (PERSERO) PT TELEKOMUNIKASI INDONESIA Tbk AND SUBSIDIARIES NOTES TO THE CONSOLIDATED FINANCIAL STATEMENTS As of December 31, 2015 and 2016 and for the Years Ended December 31, 2014, 2015 and 2016 (Figures in tables are expressedin billions ofRupiah, unless otherwise stated) Table of Content
28. TAXATION (continued)
i. Deferred tax assets and liabilities (continued) The details of deferred tax assets and liabilities are as follows (continued): | December 31, 2015 | | (Charged) credited to profit or loss | | (Charged) credited to other comprehensive income | | (Charged) credited to equity | | December 31,2016 | | The Company | | | | | | | | | | | Deferred tax assets: | | | | | | | | | | | Net periodic pension and other post-employment benefit costs | 335 | | 102 | | 126 | | - | | 563 | | Provision for impairment of receivables | 429 | | (41 | ) | - | | - | | 388 | | Provision for employee benefits | 97 | | 112 | | - | | - | | 209 | | Deferred installation fee | 65 | | 10 | | - | | - | | 75 | | Accrued expenses and provision for inventory obsolescence | 211 | | (142 | ) | - | | - | | 69 | | Finance leases | 69 | | (68 | ) | - | | - | | 1 | | Total deferred tax assets | 1,206 | | (27 | ) | 126 | | - | | 1,305 | | Deferred tax liabilities: | | | | | | | | | | | Difference between accounting and tax property and equipment net carrying value | (1,597) | | 825 | | - | | - | | (772 | ) | Valuation of long-term investment | (45) | | 34 | | - | | - | | (11 | ) | Land rights, intangible assets and others | (23) | | 12 | | - | | - | | (11 | ) | Total deferred tax assets | (1,665) | | 871 | | - | | - | | (794 | ) | Net deferred taxassets (liabilities) of the Company | (459) | | 844 | | 126 | | - | | 511 | | Telkomsel | | | | | | | | | | | Deferred tax assets: | | | | | | | | | | | Provision for employee benefits | 349 | | 55 | | 74 | | - | | 478 | | Provision for impairment of receivables | 138 | | 5 | | - | | - | | 143 | | Total deferred tax assets | 487 | | 60 | | 74 | | - | | 621 | | Deferred tax liabilities: | | | | | | | | | | | Finance leases | (385 | ) | (164 | ) | - | | - | | (549 | ) | Difference between accountingand tax property and equipment net carrying value | (1,395 | ) | 913 | | - | | - | | (482 | ) | License amortization | (52 | ) | 4 | | - | | - | | (48 | ) | Total deferred tax liabilities | (1,832 | ) | 753 | | - | | - | | (1,079 | ) | Net deferred tax liabilities of Telkomsel | (1,345 | ) | 813 | | 74 | | - | | (458 | ) | Net deferred tax liabilities of the other subsidiaries | (306 | ) | 14 | | 5 | | - | | (287 | ) | Total deferred tax liabilities – net | (2,110 | ) | 1,286 | | 79 | | - | | (745 | ) | Net deferred taxassets of the other subsidiaries | 201 | | 50 | | 3 | | 4 | | 258 | | Total deferred tax assets– net | 201 | | 435 | | 129 | | 4 | | 769 | |
F-84
PERUSAHAAN PERSEROAN (PERSERO) PT TELEKOMUNIKASI INDONESIA Tbk AND SUBSIDIARIES NOTES TO THE CONSOLIDATED FINANCIAL STATEMENTS As of December 31, 2015 and 2016 and for the Years Ended December 31, 2014, 2015 and 2016 (Figures in tables are expressedin billions ofRupiah, unless otherwise stated) Table of Content
28. TAXATION (continued)
i. Deferred tax assets and liabilities (continued)
As of December 31, 2015 and 2016, the aggregate amounts of temporary differences associated with investments in subsidiaries and associated companies, for which deferred tax liabilities have not been recognized were Rp28,203 billion and Rp34,466 billion, respectively. Realization of the deferred tax assets is dependent upon the Group’s capability of generating future profitable operations. Although realization is not assured, the Group believes that it is probable that these deferred tax assets will be realized through reduction of future taxable income when temporary differences reverse. The amount of deferred tax assets is considered realizable; however, it may be reduced if actual future taxable income is lower than estimates. j. Administration From 2008 to 2016, the Company has been consecutively entitled to income tax rate reduction of 5% for meeting the requirements in accordance with the Government Regulation No. 81/2007as amended by Government Regulation No. 77/2013 andthe latest by Government Regulation No. 56/2015in conjunction with PMK No. 238/PMK.03/2008. On the basis of historical data, for theyear ended December 31, 2016, the Company calculates the deferred tax using the tax rate of 20%. The taxation laws of Indonesia require that the Company and its local subsidiaries submit individual tax returns on the basis of self-assessment. Under prevailing regulations, the DGT may assess or amend taxes within a certain period. For fiscal years 2007 and earlier, the period is within ten years from the time the tax became due, but not later than 2013, while for fiscal years 2008 and onwards, the period is within five years from the time the tax became due.
The Ministry of Finance of the Republic of Indonesia has issued Regulation No. 85/PMK.03/2012 dated June 6, 2012as amended by PMK No. 136-PMK.03/2012 dated August 16, 2012concerning the appointment of State-Owned Enterprises ("SOEs") to withhold, deposit and report VAT and Sales Tax on Luxury Goods ("PPnBM") according to the procedures outlined in the Regulation which is effective from July 1, 2012. The Ministry of Finance of the Republic of Indonesia also has issued Regulation No. 224/PMK.011/2012 dated December 26, 2012 concerning the appointment of SOEs to withhold income tax article 22 as amended by PMK No. 16/PMK.010/2016 dated February 3, 2016. The Company has withheld, deposited, and reported the VAT, PPnBM and also income tax article 22 in accordance with the Regulations. F-85
PERUSAHAAN PERSEROAN (PERSERO) PT TELEKOMUNIKASI INDONESIA Tbk AND SUBSIDIARIES NOTES TO THE CONSOLIDATED FINANCIAL STATEMENTS As of December 31, 2015 and 2016 and for the Years Ended December 31, 2014, 2015 and 2016 (Figures in tables are expressedin billions ofRupiah, unless otherwise stated) Table of Content
29. PENSION AND OTHER POST-EMPLOYMENT BENEFITS
The details of pension and other post-employment benefit liabilities are as follows:
| Notes | | 2015 | | 2016 | | Prepaid pension benefit cost | | | | | | | The Company – funded | 29a.i.a | | 1,329 | | 197 | | MDM | | | 2 | | 1 | | Infomedia | | | 0 | | 1 | | Total | | | 1,331 | | 199 | | Pension benefit and other post-employment benefit obligations | | | | | | | Pension benefit | | | | | | | The Company - unfunded | 29a.i.b | | 2,500 | | 2,507 | | Telkomsel | 29a.ii | | 803 | | 1,193 | | Patrakom | | | - | | 0 | | Sub-total pension benefit | | | 3,303 | | 3,700 | | Net periodic post-employment health care benefit | 29b | | 118 | | 1,592 | | Other post-employment benefit | 29c | | 497 | | 502 | | Obligation under the Labor Law | 29d | | 253 | | 332 | | Total | | | 4,171 | | 6,126 | |
The breakdown of the net benefit expense recognized in the consolidatedstatements of profit or loss and other comprehensive income is as follows:
| Notes | | 2014 | | 2015 | | 2016 | | Pension benefit cost | | | | | | | | | The Company - funded | 29a.i.a | | 254 | | 12 | | 608 | | The Company - unfunded | 29a.i.b | | 274 | | 251 | | 279 | | Telkomsel | 29a.ii | | 115 | | 179 | | 181 | | MDM | | | - | | 1 | | 0 | | Infomedia | | | 0 | | 0 | | 0 | | Patrakom | | | - | | - | | 0 | | Total pension benefit cost | 25 | | 643 | | 443 | | 1,068 | | Net periodic post-employment health care benefit cost | 25,29b | | 248 | | 216 | | 163 | | Other post-employment benefit cost | 25,29c | | 48 | | 47 | | 48 | | Obligation under the Labor Law | 25,29d | | 56 | | 53 | | 82 | | Total | | | 995 | | 759 | | 1,361 | |
The amounts recognized inOCI are as follows:
| Notes | | 2014 | | 2015 | | 2016 | | Defined benefit plan actuarial(gain) losses | | | | | | | | | Pension | | | | | | | | | The Company - funded | 29a.i.a | | (483 | ) | (186 | ) | 492 | | The Company -unfunded | 29a.i.b | | 31 | | 187 | | 119 | | Telkomsel | 29a.ii | | 167 | | 172 | | 292 | | MDM | | | 0 | | (1 | ) | 1 | | Infomedia | | | 0 | | 0 | | 0 | | Patrakom | | | - | | - | | 0 | | Post-employment health care benefit cost | 29b | | (576 | ) | (540 | ) | 1,309 | | Other post-employment benefit | 29c | | 24 | | 11 | | 20 | | Obligation under the Labor Law | 29d | | 10 | | 48 | | 33 | | Sub-total | | | (827 | ) | (309 | ) | 2,266 | | Deferred tax effect at the applicable tax rates | 28i | | 42 | | (59 | ) | (208 | ) | Defined benefit plan actuarial (gain) losses - net | | | (785 | ) | (368 | ) | 2,058 | |
F-86
PERUSAHAAN PERSEROAN (PERSERO) PT TELEKOMUNIKASI INDONESIA Tbk AND SUBSIDIARIES NOTES TO THE CONSOLIDATED FINANCIAL STATEMENTS As of December 31, 2015 and 2016 and for the Years Ended December 31, 2014, 2015 and 2016 (Figures in tables are expressedin billions ofRupiah, unless otherwise stated) Table of Content
29. PENSION AND OTHER POST-EMPLOYMENT BENEFITS (continued) a.Pension benefit cost i. The Company a.Funded pension plan The Company sponsors a defined benefit pension plan for employees with permanent status prior to July 1, 2002. The plan is governed by the pension laws in Indonesia and managed by Telkom Pension Fund (“Dana Pensiun Telkom†or “Dapenâ€). The pension benefits are paid based on the participating employees’ latest basic salary at retirement and the number of years of their service. The participating employees contribute 18% (before March 2003: 8.4%) of their basic salaries to the pension fund. The Company did not make contributions to the pension fund for theyearsended December 31, 2014, 2015 and 2016. The following table presents the changes in projected pension benefit obligations, changes in pension benefit plan assets, funded status of the pension plan and net amount recognized in the consolidated statements of financial position as of December 31, 2015 and 2016, under the defined benefit pension plan: | 2015 | | 2016 | | Changes in projected pension benefitobligations | | | | | Projected pension benefit obligations at beginning of year | 17,402 | | 16,505 | | Charged to profit or loss: | | | | | Service costs | 218 | | 363 | | Past service cost - plan amendments | (55 | ) | 245 | | Interest costs | 1,445 | | 1,444 | | Pension plan participants’ contributions | 45 | | 44 | | Actuarial (gain) losses | (1,666 | ) | 1,680 | | Pension benefits paid | (808 | ) | (1,432 | ) | Settlement | (76 | ) | - | | Projected pension benefit obligations at end of year | 16,505 | | 18,849 | | Changes in pension benefit plan assets | | | | | Fair value of pension plan assets at beginning of year | 18,929 | | 17,834 | | Interest income | 1,576 | | 1,458 | | Return on plan assets (excluding amount included in net interest expense) | (1,837 | ) | 1,188 | | Pension plan participants’ contributions | 45 | | 44 | | Pension benefits paid | (808 | ) | (1,432 | ) | Plan administration cost | (71 | ) | (46 | ) | Fair value of pension plan assets at end of year | 17,834 | | 19,046 | | Funded status | 1,329 | | 197 | | Effect of asset ceiling | - | | - | | Prepaid pension benefitcost | 1,329 | | 197 | |
F-87
PERUSAHAAN PERSEROAN (PERSERO) PT TELEKOMUNIKASI INDONESIA Tbk AND SUBSIDIARIES NOTES TO THE CONSOLIDATED FINANCIAL STATEMENTS As of December 31, 2015 and 2016 and for the Years Ended December 31, 2014, 2015 and 2016 (Figures in tables are expressedin billions ofRupiah, unless otherwise stated) Table of Content
29. PENSION AND OTHER POST-EMPLOYMENT BENEFITS (continued)
a. Pension benefit cost (continued) i. The Company (continued)
a.Funded pension plan (continued) As of December 31, 2015 and 2016, plan assets consist of: | 2015 | | 2016 | | | Quoted in active market | | Unquoted | | Quoted in active market | | Unquoted | | Cash and cash equivalents | 1,335 | | - | | 1,064 | | - | | Equity instruments | | | | | | | | | Finance | 1,153 | | - | | 1,039 | | - | | Consumer goods | 953 | | - | | 1,206 | | - | | Infrastructure, utilities and transportation | 637 | | - | | 536 | | - | | Construction, property and real estate | 573 | | - | | 577 | | - | | Basic industry and chemical | 163 | | - | | 130 | | - | | Trading, service and investment | 183 | | - | | 216 | | - | | Mining | 45 | | - | | 62 | | - | | Agriculture | 29 | | - | | 71 | | - | | Miscellaneous industries | 240 | | - | | 361 | | - | | Equity-based mutual fund | 1,120 | | - | | 1,296 | | - | | Fixed income instruments | | | | | | | | | Corporate bonds | - | | 3,587 | | - | | 3,817 | | Government bonds | 7,257 | | - | | 7,978 | | - | | Mutual funds | - | | - | | 30 | | - | | Non-public equity: | | | | | | | | | Property | - | | 156 | | - | | 188 | | Direct placement | - | | 163 | | - | | 174 | | Others | - | | 240 | | - | | 301 | | Total | 13,688 | | 4,146 | | 14,566 | | 4,480 | |
Pension plan assets also include Series B shares issued by the Company with fair values totalling Rp445 billion and Rp395 billion, representing2.49% and2.07% of total plan assets as ofDecember 31, 2015 and 2016, respectively, and bonds issued by the Company with fair value totalling Rp464 billionand Rp311 billionrepresenting2.60% and 1.63% of total plan assets as ofDecember 31, 2015 and 2016, respectively. The expected return is determined based on market expectation for returns over the entire life of the obligation by considering the portfolio mix of the plan assets. The actual return on plan assets was(Rp332billion) (loss) and Rp2,600 billionfor the years ended December 31,2015 and 2016, respectively. Based on the Company’s policy issued on January 14, 2014 regarding Dapen’s Funding Policy, the Company will not contribute to Dapen when Dapen’s Funding Sufficiency Ratio (FSR) is above 105%.Based on Dapen’s financial statements as of December 31, 2016, Dapen’s FSR is above 105%. Therefore, the Companydid not contribute to the defined benefit pension plan in 2016. Based on the Company policy issued on July 1, 2014 regarding Pension Regulation by “Dana PensiunTelkom”, there is an increase in monthly benefits given to the pensioners, widow/widower or the children of participants who stopped working before the end of June 2002. PERUSAHAAN PERSEROAN (PERSERO) PT TELEKOMUNIKASI INDONESIA Tbk AND SUBSIDIARIES NOTES TO THE CONSOLIDATED FINANCIAL STATEMENTS As of December 31, 2015 and 2016 and for the Years Ended December 31, 2014, 2015 and 2016 (Figures in tables are expressedin billions ofRupiah, unless otherwise stated) Table of Content 29. PENSION AND OTHER POST-EMPLOYMENT BENEFITS (continued)
a. Pension benefit cost (continued) i. The Company (continued)
a.Funded pension plan (continued) During 2015,the Companymade settlements to pensioners, widow/widower or the children of participants who have monthly pension benefits under Rp1,500,000and choseto withdraw their pension benefits in lump sum. Based on the Company’spolicy issued on June 24, 2016 regarding Pension Regulation byDana Pensiun Telkom, widow/widower or the children of participants who enrolled before April 20, 1992, will receive increase in monthly pension benefits from 60% to 75% of pension benefits received by the pensioners whichbecameeffective starting from January 1, 2016. In addition, the Company provided other benefits toenhance the pensioners’ welfare whichwereprovidedonlyin 2016.Such one-timeother benefits consistof Rp6 millionto monthlypension beneficiaries who retired before end of June 2002 and other benefit of Rp3 million to monthly pension beneficiaries who retired starting from the end of June 2002 until the end of May 2016. The movements of the prepaid pension benefit cost during the years ended December 31, 2015 and 2016 are as follows: | 2015 | | 2016 | | Prepaid pension benefit cost at beginning of year | 1,170 | | 1,329 | | Net periodic pension benefit cost | (27 | ) | (640 | ) | Actuarial gain (losses) recognizedin OCI | 1,666 | | (1,680 | ) | Asset ceiling recognizedin OCI | 357 | | - | | Return on plan assets(excluding amount included in net interest expense) | (1,837 | ) | 1,188 | | Prepaid pension benefit cost at end of year | 1,329 | | 197 | |
The components of net periodic pension benefit costfor the years ended December 31, 2014, 2015 and 2016are as follows: | 2014 | | 2015 | | 2016 | | Service costs | 188 | | 218 | | 363 | | Past service cost - plan amendments | 204 | | (55 | ) | 245 | | Plan administration cost | 56 | | 71 | | 46 | | Net interest cost | (186 | ) | (131 | ) | (14 | ) | Settlement | - | | (76 | ) | - | | Net periodic pension benefit cost | 262 | | 27 | | 640 | | Amount charged to subsidiaries under contractual agreements | (8 | ) | (15 | ) | (32 | ) | Net periodic pension benefit cost | 254 | | 12 | | 608 | |
F-89
PERUSAHAAN PERSEROAN (PERSERO) PT TELEKOMUNIKASI INDONESIA Tbk AND SUBSIDIARIES NOTES TO THE CONSOLIDATED FINANCIAL STATEMENTS As of December 31, 2015 and 2016 and for the Years Ended December 31, 2014, 2015 and 2016 (Figures in tables are expressedin billions ofRupiah, unless otherwise stated) Table of Content
29. PENSION AND OTHER POST-EMPLOYMENT BENEFITS (continued)
a. Pension benefit cost (continued) i. The Company (continued) a.Funded pension plan (continued) Amounts recognized inOCI are as follows: | 2014 | | 2015 | | 2016 | | Actuarial (gain) losses recognized during the year due to: | | | | | | | Experience adjustments | 566 | | (991 | ) | 70 | | Changes in demographic assumptions | - | | 137 | | 140 | | Changes in financial assumptions | 905 | | (812 | ) | 1,470 | | Effect of asset ceiling | (614 | ) | (357 | ) | - | | Return on plan assets(excluding amount included in net interest expense) | (1,340 | ) | 1,837 | | (1,188 | ) | Net | (483 | ) | (186 | ) | 492 | |
The actuarial valuation for the defined benefit pension plan was performed based on the measurement date as of December 31,2014,2015 and 2016, with reports dated March 13, 2015, February 25, 2016 and February 22, 2017, respectively, by PT Towers Watson Purbajaga (“TWPâ€), an independent actuary in association withWillisTowers Watson (“WTWâ€) (formerlyTowers Watson). The principal actuarial assumptions used by the independent actuaryas of December 31, 2014, 2015 and 2016 are as follows: | 2014 | | 2015 | | 2016 | | Discount rate | 8.50% | | 9.00% | | 8.00% | | Rate of compensation increases | 8.00% | | 8.00% | | 8.00% | | Indonesian mortality table | 2011 | | 2011 | | 2011 | |
b.Unfunded pension plan The Company sponsors unfunded defined benefit pension plans and a defined contribution pension plan for its employees. The defined contribution pension plan is provided to employees with permanent status hired on or after July 1, 2002. The plan is managed by Financial Institutions Pension Fund ( | PT TELEKOMUNIKASI INDONESIA Tbk AND SUBSIDIARIES
| NOTES TO THE CONSOLIDATED FINANCIAL STATEMENTS
| As of January 1, 2012 (Restated), December 31, 2012 (Restated) and December 31, 2013
| and for the years ended December 31, 2011 (Restated), 2012 (Restated) and 2013
| (Figures in tables are presented in billions of rupiah, unless otherwise stated)
|
|
Tabel of Content
33. PENSION AND OTHER POST-EMPLOYMENT BENEFITS
The detail of pension and other post-employment benefit liabilities is as follows:
| | Notes | | 2012 (Restated) | | 2013 | | Prepaid pension benefit cost | | | | | | | | The Company | | 33a.i.a | | - | | 949 | | Pension benefit and other post-employment benefit obligations | | | | | | | | Pension | | | | | | | | The Company | | | | | | | | Funded | | 33a.i.a | | 1,027 | | - | | Unfunded | | 33a.i.b | | 2,437 | | 2,201 | | Telkomsel | | 33a.ii | | 806 | | 460 | | Total pension | | | | 4,270 | | 2,661 | | Post-employment health care benefit | | 33b | | 3,249 | | 993 | | Other post-employment benefit | | 33c | | 508 | | 450 | | Obligation under the Labor Law | | 33d | | 157 | | 154 | | Total | | | | 8,184 | | 4,258 | |
The net benefit expense recognized in the consolidated statements of comprehensive income is as follows:
| | Notes | | 2011 (Restated) | | 2012 (Restated) | | 2013 | | Pension | | | | | | | | | | The Company | | 33a.i.a,33a.i.b | | 333 | | 659 | | 809 | | Telkomsel | | 33a.ii | | 105 | | 172 | | 178 | | Infomedia | | | | 0 | | 0 | | 1 | | Total pension | | 28 | | 438 | | 831 | | 988 | | Post-employment health care benefit | | 28,33b | | 158 | | 246 | | 382 | | Other post-employment benefit | | 28,33c | | 46 | | 42 | | 41 | | Obligation under the Labor Law | | 28,33d | | 24 | | 35 | | 15 | | Total | | | | 666 | | 1,154 | | 1,426 | |
The amounts recognized inOCI are as follows:
| | Notes | | 2011 (Restated) | | 2012 (Restated) | | 2013 | | Defined benefit plan actuarial (gain) losses | | | | | | | | | | Pension | | | | | | | | | | The Company - netof asset ceiling limitation | | 33a.i.a,33a.i.b | | 892 | | 1,100 | | (2,718 | ) | Telkomsel | | 33a.ii | | 260 | | (103 | ) | (524 | ) | Post-employment health care benefit | | 33b | | 1,028 | | 1,742 | | (2,336 | ) | Other post-employment benefit | | 33c | | 40 | | 32 | | (72 | ) | Obligation under the Labor Law | | 33d | | 21 | | (8 | ) | (50 | ) | Sub-total | | | | 2,241 | | 2,763 | | (5,700 | ) | Deferred tax effect at the applicable tax rates | | 32h | | (302 | ) | (197 | ) | 701 | | Defined benefit plan actuarial (gain) losses, net of tax | | | | 1,939 | | 2,566 | | (4,999 | ) |
F-87
PERUSAHAAN PERSEROAN (PERSERO)
| PT TELEKOMUNIKASI INDONESIA Tbk AND SUBSIDIARIES
| NOTES TO THE CONSOLIDATED FINANCIAL STATEMENTS
| As of January 1, 2012 (Restated), December 31, 2012 (Restated) and December 31, 2013
| and for the years ended December 31, 2011 (Restated), 2012 (Restated) and 2013
| (Figures in tables are presented in billions of rupiah, unless otherwise stated)
|
|
Tabel of Content
33. PENSION AND OTHER POST-EMPLOYMENT BENEFITS (continued)
a.Pension benefit cost
i. The Company
a.Funded pension plan
The Company sponsors a defined benefit pension plan for employees with permanent status prior to July 1, 2002. The pension benefits are paid based on the participating employees’ latest basic salary at retirement and the number of years of their service. The plan is managed by Telkom Pension Fund (“Dana Pensiun Telkom” or “Dapen”). The participating employees contribute 18% (before March 2003: 8.4%) of their basic salaries to the pension fund. The Company’s contributions to the pension fund for the years ended December 31, 2011, 2012 and 2013 amounted to Rp187 billion, Rp186 billion and Rp182 billion, respectively.
The following table presents the change in projected pension benefit obligations, change in pension plan assets, funded status of the pension plan and net amount recognized in the Company’s consolidated statements of financial position as of December 31,2012 and 2013, for its defined benefit pension plan:
| | 2012 (Restated) | | 2013 | | Changes in projected pension benefitobligations | | | | | | Projected pension benefit obligations at beginning of year | | 16,188 | | 19,249 | | Charged to profit or loss | | | | | | Service costs | | 372 | | 450 | | Interest costs | | 1,151 | | 1,183 | | Pension plan participants’ contributions | | 44 | | 44 | | Actuarial (gains) losses recognized in OCI | | 2,123 | | (5,387 | ) | Expected pension benefits paid | | (629 | ) | (656 | ) | Projected pension benefit obligations at end of year | | 19,249 | | 14,883 | | Changes in pension benefit plan assets | | | | | | Fair value of pension plan assets at beginning of year | | 16,597 | | 18,222 | | Interest income | | 1,189 | | 1,125 | | Return on plan assets (excluding amount included in net interest expense) | | 895 | | (2,039 | ) | Employer’s contributions | | 186 | | 182 | | Pension plan participants’ contributions | | 44 | | 44 | | Expected pension benefits paid | | (629 | ) | (656 | ) | Administrative expenses paid | | (60 | ) | (75 | ) | Fair value of pension plan assets at end of year | | 18,222 | | 16,803 | | Funded status | | (1,027 | ) | 1,920 | | Unrecoverable surplus (effect of asset ceiling) | | - | | (971 | ) | Prepaid (provision for) pension benefitcost | | (1,027 | ) | 949 | |
F-88
PERUSAHAAN PERSEROAN (PERSERO)
| PT TELEKOMUNIKASI INDONESIA Tbk AND SUBSIDIARIES
| NOTES TO THE CONSOLIDATED FINANCIAL STATEMENTS
| As of January 1, 2012 (Restated), December 31, 2012 (Restated) and December 31, 2013
| and for the years ended December 31, 2011 (Restated), 2012 (Restated) and 2013
| (Figures in tables are presented in billions of rupiah, unless otherwise stated)
|
|
Tabel of Content
33. PENSION AND OTHER POST-EMPLOYMENT BENEFITS (continued)
a. Pension benefit cost (continued)
i. The Company (continued)
a.Funded pension plan (continued)
As of December 31, 2012 and 2013, plan assets consisted of:
| | 2012 | | 2013 | | | | Quoted in active market | | Unquoted | | Quoted in active market | | Unquoted | | Cash and cash equivalent | | 2,367 | | - | | 1,149 | | - | | Equity instruments | | | | | | | | | | Finance | | 986 | | - | | 884 | | - | | Consumer goods | | 577 | | - | | 634 | | - | | Infrastructure, utilities and transportation | | 585 | | - | | 625 | | - | | Basic industry and chemical | | 405 | | - | | 421 | | - | | Miscellaneous industry | | 413 | | - | | 373 | | - | | Trading, service and investment | | 306 | | - | | 288 | | - | | Construction, property and real estate | | 257 | | - | | 226 | | - | | Mining | | 318 | | - | | 159 | | - | | Agriculture | | 128 | | - | | 82 | | - | | Equity-based mutual fund | | 1,156 | | - | | 1,080 | | - | | Fixed income instruments | | | | | | | | | | Government bonds | | 6,335 | | 582 | | 6,354 | | 495 | | Corporate bonds | | - | | 3,136 | | - | | 3,516 | | Mutual funds | | 123 | | - | | - | | - | | Non-publicequity: | | | | | | | | | | Direct placement | | - | | 119 | | - | | 121 | | Limited mutual funds participation unit for share-based securities | | - | | 60 | | - | | - | | Property | | - | | 119 | | - | | 106 | | Others | | - | | 250 | | - | | 290 | | Total | | 13,956 | | 4,266 | | 12,275 | | 4,528 | |
Pension plan assets also include Series B shares issued by the Company with fair values totaling Rp223 billion and Rp336 billion, representing 1.23% and2.00% of total plan assets as of December 31, 2012 and 2013, respectively, and bonds issued by the Company with fair value totaling Rp159 billion and Rp151 billion representing 0.87% and0.90% of total assets as of December 31, 2012 and 2013, respectively.
The expected return is determined based on market expectation for returns over the entire life of the obligation by considering the portfolio mix of the plan assets. The actual return on plan assets wasRp2,024 billion and(Rp989 billion) for the years ended December 31, 2012 and 2013, respectively. Based on the Company’spolicyissued on January 14, 2014 regarding Dapen’s Funding Policy, the Company will not contribute to Dapen when Dapen’s Funding Sufficiency Ratio (FSR) is above 105%. Therefore, the Company expects no contribution to the plan in 2014.
F-89
PERUSAHAAN PERSEROAN (PERSERO)
| PT TELEKOMUNIKASI INDONESIA Tbk AND SUBSIDIARIES
| NOTES TO THE CONSOLIDATED FINANCIAL STATEMENTS
| As of January 1, 2012 (Restated), December 31, 2012 (Restated) and December 31, 2013
| and for the years ended December 31, 2011 (Restated), 2012 (Restated) and 2013
| (Figures in tables are presented in billions of rupiah, unless otherwise stated)
|
|
Tabel of Content
33. PENSION AND OTHER POST-EMPLOYMENT BENEFITS (continued)
a. Pension benefit cost (continued)
i. The Company (continued)
a.Funded pension plan (continued)
The movements of the prepaid pension benefit costs during the years ended December 31, 2012 and 2013 are as follows:
| | 2012 (Restated) | | 2013 | | Prepaid pension benefit cost at beginning of year | | 409 | | (1,027 | ) | Net periodic pensionbenefitcost | | (394 | ) | (583 | ) | Actuarial gains (losses) recognized via the OCI | | (2,123 | ) | 5,387 | | Asset ceiling recognized via the OCI | | - | | (971 | ) | Return on plan assets(excluding amount included in net interest expense) | | 895 | | (2,039 | ) | Employer’s contributions | | 186 | | 182 | | Prepaid (provision for) pension benefit cost at end of year | | (1,027 | ) | 949 | |
The components of net periodic pension benefit cost are as follows:
| | 2011 (Restated) | | 2012 (Restated) | | 2013 | | Service costs | | 307 | | 372 | | 450 | | Plan administration cost | | 57 | | 60 | | 75 | | Net interest cost | | (312 | ) | (38 | ) | 58 | | Net periodic pension benefit cost | | 52 | | 394 | | 583 | | Amount charged to subsidiaries under contractual agreements | | (2 | ) | (12 | ) | (21 | ) | Net periodic pension benefit cost- net | | 50 | | 382 | | 562 | |
Amounts recognized inOCI are as follows:
| | 2011 (Restated) | | 2012 (Restated) | | 2013 | | Actuarial (gains) losses recognized during the year | | 3,391 | | 2,123 | | (5,387) | | Asset ceiling limitation | | (2,252 | ) | - | | 971 | | Return on plan assets(excluding amount included in net interest expense) | | (491 | ) | (895 | ) | 2,039 | | Net | | 648 | | 1,228 | | (2,377) | |
The actuarial valuation for the defined benefit pension plan and the other post-employment benefits was performed based on the measurement date as of December 31, 2011, 2012 and 2013 (Notes 33a.i.b and 33c), with reports dated March 7, 2012, February28,2013 and February 28, 2014, respectively, by PT Towers Watson Purbajaga (“TWP”), an independent actuary in association with Towers Watson (“TW”) (formerly Watson Wyatt Worldwide). The principal actuarial assumptions used by the independent actuary as of December 31,2011, 2012 and 2013 are as follows:
| | 2011 | | 2012 | | 2013 | | Discount rate | | 7.25% | | 6.25% | | 9,00% | | Rate of compensation increases | | 8.00% | | 8.00% | | 8.00% | | Indonesian mortality table | | 1999 | | 2011 | | 2011 | |
F-90
PERUSAHAAN PERSEROAN (PERSERO)
| PT TELEKOMUNIKASI INDONESIA Tbk AND SUBSIDIARIES
| NOTES TO THE CONSOLIDATED FINANCIAL STATEMENTS
| As of January 1, 2012 (Restated), December 31, 2012 (Restated) and December 31, 2013
| and for the years ended December 31, 2011 (Restated), 2012 (Restated) and 2013
| (Figures in tables are presented in billions of rupiah, unless otherwise stated)
|
|
Tabel of Content
33. PENSION AND OTHER POST-EMPLOYMENT BENEFITS (continued)
a. Pension benefit cost (continued)
i. The Company (continued)
b.Unfunded pension plan
The Company sponsors unfunded defined benefit pension plans and a defined contribution pension plan for its employees.
The defined contribution pension plan is provided to employees hired with permanent status on or after July 1, 2002. The plan is managed by Financial Institutions Pension Fund (“Dana Pensiun Lembaga Keuangan” or “DPLK”“DPLKâ€). The Company’sCompany’s contribution to DPLK is determined based on a certain percentage of the participants’participants’ salaries and amounted to Rp5toRp7 billion and Rp6 billion forRp9 billionfor the years ended December 31, 2012and2013,2015 and 2016, respectively.
TheSince 2007, the Company also provides additional unfunded defined benefits (known as “has provided pension benefit based on uniformization for both participants prior to and from April 20, 1992 effective for employees retiring beginning February 1, 2009. In 2010, the Company replaced the uniformization withManfaat Pensiun Sekaligus” (“MPS” (“MPSâ€)). MPS is given to its employees with permanent status prior to June 1, 2002 andthose employees reaching retirement age, upon death or upon beingbecoming disabled starting from February 1, 2009.
F-90
PERUSAHAAN PERSEROAN (PERSERO) PT TELEKOMUNIKASI INDONESIA Tbk AND SUBSIDIARIES NOTES TO THE CONSOLIDATED FINANCIAL STATEMENTS As of December 31, 2015 and 2016 and for the Years Ended December 31, 2014, 2015 and 2016 (Figures in tables are expressedin billions ofRupiah, unless otherwise stated) Table of Content
29. PENSION AND OTHER POST-EMPLOYMENT BENEFITS (continued) a. Pension benefit cost (continued) i. The Company (continued) b.Unfunded pension benefits formula is determined based on the period in which the employee obtained the permanent status (before or after April 20, 1992).plan (continued) The Company also provides benefits to employees duringemployeesduring a pre-retirement period in which they are inactive for 6 months prior to their normal retirement age of 56 years, known as pre-retirement benefits (“(Masa Persiapan Pensiun” or “MPP”“MPPâ€). During.During the pre-retirement period, the employees still receive benefits provided to active employees, which include, but are not limited to, regular salary, health care, annual leave, bonus and other benefits. Since 2012, the Company has issued a new requirement for MPP effective for employees retiring beginningretiringsince April 1, 2012, whereby the employee is required to file a request for MPP and if the employee does not file the request, he or shesuch employee is required to work until the retirement datedate.. The following table presents the changes in the unfunded projected pension benefits obligation ofbenefit obligations for MPS and MPP for the years ended December 31, 20122015 and 2013: 2016:
| 2015 | | 2016 | | Unfunded projected pension benefit obligations at beginning of year | 2,326 | | 2,500 | | Charged to profit or loss: | | | | | Service costs | 60 | | 64 | | Interest costs | 191 | | 215 | | Actuariallosses recognized in OCI | 187 | | 119 | | Benefits paid by employer | (264 | ) | (391 | ) | Unfunded projected pension benefit obligations at end of year | 2,500 | | 2,507 | |
The components of total periodic pension benefit costfor the years ended December 31, 2014, 2015 and 2016are as follows: | | 2012 (Restated) | | 2013 | | Changes in projected pension benefit obligation | | | | | | Unfunded projected pension benefit obligation at beginning of year | | 2,440 | | 2,437 | | Periodic pensionbenefitcost | | 277 | | 247 | | Actuarial gainsrecognized in OCI | | (128 | ) | (341 | ) | Benefits paid by employer | | (152 | ) | (142 | ) | Unfunded projected pension benefit obligation at end of year | | 2,437 | | 2,201 | |
| 2014 | | 2015 | | 2016 | | Service costs | 80 | | 60 | | 64 | | Net interest costs | 194 | | 191 | | 215 | | Total periodic pension benefit cost | 274 | | 251 | | 279 | |
Amounts recognized in OCI amounted to Rp244 billion, (Rp128 billion) and(Rp341 billion) for the years ended December 31, 2011,2012 and 2013, respectively. The components of periodic pension benefit cost are as follows:
| | 2011 (Restated) | | 2012 (Restated) | | 2013 | | Service costs | | 89 | | 104 | | 97 | | Net interest costs | | 194 | | 173 | | 150 | | Total | | 283 | | 277 | | 247 | |
| 2014 | | 2015 | | 2016 | | Actuarial (gain) losses recognized during the year due to: | | | | | | | Experience adjustments | (12 | ) | (30 | ) | (9 | ) | Changes in demographic assumptions | - | | 50 | | 30 | | Changes in financial assumptions | 43 | | 167 | | 98 | | Net | 31 | | 187 | | 119 | |
The actuarial valuation for the defined benefit pension plan was performed, based on the measurement date as of December 31, 2014, 2015 and 2016, with reports dated March 13, 2015, February 25, 2016 and February 22, 2017, respectively, by TWP, an independent actuary in association with WTW. F-91
PERUSAHAAN PERSEROAN (PERSERO) PT TELEKOMUNIKASI INDONESIA Tbk AND SUBSIDIARIES NOTES TO THE CONSOLIDATED FINANCIAL STATEMENTS As of December 31, 2015 and 2016 and for the Years Ended December 31, 2014, 2015 and 2016 (Figures in tables are expressedin billions ofRupiah, unless otherwise stated) PERUSAHAAN PERSEROAN (PERSERO)
| PT TELEKOMUNIKASI INDONESIA Tbk AND SUBSIDIARIES
| NOTES TO THE CONSOLIDATED FINANCIAL STATEMENTS
| As of January 1, 2012 (Restated), December 31, 2012 (Restated) and December 31, 2013
| and for the years ended December 31, 2011 (Restated), 2012 (Restated) and 2013
| (Figures in tables are presented in billions of rupiah, unless otherwise stated)
|
|
TabelTable of Content
3329. PENSION AND OTHER POST-EMPLOYMENT BENEFITSBENEFITS (continued)
a. Pension benefit cost (continued) i. The Company (continued) b.Unfunded pension plan (continued) The principal actuarial assumptions used by the independent actuary for the years ended December 31, 2014, 2015 and 2016 are as follows: | 2014 | | 2015 | | 2016 | | Discount rate | 8.50% | | 9.00% | | 7.75% - 8.00% | | Rate of compensation increases | 8.00% | | varies | | 6.10% - 8.00% | | Indonesian mortality table | 2011 | | 2011 | | 2011 | |
ii. Telkomsel Telkomsel providessponsors a defined benefit pension plan to its employees. Under this plan, employees are entitled to pension benefits based on their latest basic salary or take-home pay and the number of years of their service. PT Asuransi Jiwasraya (“Jiwasraya”(“Jiwasrayaâ€), a state-owned life insurance company, manages the plan under an annuity insurance contract. Until 2004, the employees contributed 5% of their monthly salaries to the plan and Telkomsel contributed any remaining amount required to fund the plan. Starting 2005, the entire contributionsarecontributions have been fully made by Telkomsel. Telkomsel's contributions to Jiwasraya amounted to Rp42toRp192 billion and Rp nil forRp83 billionfor the years ended December 31,201231, 2015 and 2013,2016, respectively. The following table presents the changechanges in the projected pension benefitsbenefit obligation, changechanges in pension benefit plan assets, funded status of the pension plan and net amount recognized in the consolidated statementsstatement of financial position for defined benefit pension plan: | | 2012 (Restated) | | 2013 | | Changes in projected pension benefit obligations | | | | | | Projected benefits obligation at beginning of year | | 1,237 | | 1,472 | | Charged to profit or loss | | | | | | Service costs | | 120 | | 130 | | Net interest cost | | 83 | | 88 | | Actuarial(gains) losses recognized in OCI | | 37 | | (789 | ) | Expected benefits paid | | (5 | ) | (2 | ) | Projected pension benefit obligations at end of year | | 1,472 | | 899 | | Changes in pension benefit plan assets | | | | | | Fair value of plan assets at beginning of year | | 458 | | 666 | | Interest income in profit or loss | | 31 | | 40 | | Return on plan assets(excluding amount included in net interest expense) in OCI | | 140 | | (265 | ) | Employer’s contributions | | 42 | | 0 | | Expected benefits paid | | (5 | ) | (2 | ) | Fair value of plan assets at end of year | | 666 | | 439 | | Funded status | | (806 | ) | (460 | ) | Provision for pension benefitcost | | (806 | ) | (460 | ) |
Movements of the pension benefit cost provisions during the years ended December 31, 20122015 and 2013: 2016, under Telkomsel’s defined benefit pension plan:
| | 2012 (Restated) | | 2013 | | Pension benefit cost provisions at beginning of year | | (779 | ) | (806 | ) | Periodic pension benefit cost | | (172 | ) | (178 | ) | Actuarial gains (losses) recognized via the OCI | | (37 | ) | 789 | | Return on plan assets (excluding amount included in net interest expense) | | 140 | | (265 | ) | Employer contributions | | 42 | | 0 | | Pension benefit costs provisions at end of year | | (806 | ) | (460 | ) |
| 2015 | | 2016 | | Changes in projected pension benefit obligation | | | | | Projected pension benefit obligation at beginning of year | 1,281 | | 1,415 | | Charged to profit or loss: | | | | | Service costs | 101 | | 107 | | Net interest costs | 106 | | 130 | | Actuarial (gain) losses recognized in OCI | (64 | ) | 392 | | Benefits paid | (9 | ) | (10 | ) | Projected pension benefit obligation at end of year | 1,415 | | 2,034 | | Changes in pension benefit plan assets | | | | | Fair value of plan assets at beginning of year | 637 | | 612 | | Interest income in profit or loss | 28 | | 56 | | Return on plan assets (excluding amount included in net interest expense) | (236 | ) | 100 | | Employer’s contributions | 192 | | 83 | | Benefits paid | (9 | ) | (10 | ) | Fair value of plan assets at end of year | 612 | | 841 | | Funded status | (803 | ) | (1,193 | ) | Pension benefit obligation - net | 803 | | 1,193 | |
F-92
PERUSAHAAN PERSEROAN (PERSERO) PT TELEKOMUNIKASI INDONESIA Tbk AND SUBSIDIARIES NOTES TO THE CONSOLIDATED FINANCIAL STATEMENTS As of December 31, 2015 and 2016 and for the Years Ended December 31, 2014, 2015 and 2016 (Figures in tables are expressedin billions ofRupiah, unless otherwise stated) PERUSAHAAN PERSEROAN (PERSERO)
| PT TELEKOMUNIKASI INDONESIA Tbk AND SUBSIDIARIES
| NOTES TO THE CONSOLIDATED FINANCIAL STATEMENTS
| As of January 1, 2012 (Restated), December 31, 2012 (Restated) and December 31, 2013
| and for the years ended December 31, 2011 (Restated), 2012 (Restated) and 2013
| (Figures in tables are presented in billions of rupiah, unless otherwise stated)
|
|
TabelTable of Content
3329. PENSION AND OTHER POST-EMPLOYMENT BENEFITSBENEFITS (continued)
a. Pension benefit cost (continued) ii. Telkomsel(continued) Movements of the pension benefitobligation during the years ended December 31, 2015 and 2016:
| 2015 | | 2016 | | Pension benefit obligation at beginning of year | (644 | ) | (803 | ) | Periodic pension benefit cost | (179 | ) | (181 | ) | Actuarial gain(losses) recognizedin OCI | 64 | | (392 | ) | Return on plan assets (excluding amount included in net interest expense) | (236 | ) | 100 | | Employer contributions | 192 | | 83 | | Pension benefit obligation at end of year | (803 | ) | (1,193 | ) |
The components of the periodic pension benefit cost arecostfor the years ended December 31, 2014, 2015 and 2016are as follows:
| | 2011 (Restated) | | 2012 (Restated) | | 2013 | | 2014 | | 2015 | | 2016 | | Service costs | | 67 | | 120 | | 130 | | 74 | | 101 | | 107 | | Net interest cost | | 38 | | 52 | | 48 | | | Net interest costs | | 41 | | 78 | | 74 | | Total | | 105 | | 172 | | 178 | | 115 | | 179 | | 181 | |
Amounts recognized inOCI are as follows: | | 2011 (Restated) | | 2012 (Restated) | | 2013 | | Actuarial(gains)losses recognized during the year | | 452 | | 37 | | (789 | ) | Return on plan assets(excluding amount included in net interest expense) | | (192 | ) | (140 | ) | 265 | | Net | | 260 | | (103 | ) | (524 | ) |
| 2014 | | 2015 | | 2016 | | Actuarial(gain)losses recognized during the year due to: | | | | | | | Experience adjustments | 55 | | (20 | ) | 32 | | Changes in financial assumptions | 179 | | (44 | ) | 360 | | Return on plan assets(excluding amountincluded in net interest expense) | (67 | ) | 236 | | (100 | ) | Net | 167 | | 172 | | 292 | |
The periodic pension cost for the pensionTheactuarial valuationfor thedefined benefitpension plan was calculatedwasperformed based on actuarialthe measurement date as of December 31, 2011, 201231,2014,2015 and 2013,2016, with reports dated datedFebruary 5, 2015,February 24, 2012, February12, 2013 andFebruary 20, 2014,12, 2016 and February 7, 2017 respectively, by TWP, an independent actuary in association with TW.withWTW. The principal actuarial assumptions used by the independent actuary based on the measurement date as of December 31, 2011, 2012 and 2013,2014, 2015and 2016, are as follows:
| 2014 | | 2015 | | 2016 | | Discount rate | 8.25% | | 9.25% | | 8.25% | | Rate of compensation increases | 6.50% | | 8.00% | | 8.00% | | Indonesian mortality table | 2011 | | 2011 | | 2011 | |
F-93
PERUSAHAAN PERSEROAN (PERSERO) PT TELEKOMUNIKASI INDONESIA Tbk AND SUBSIDIARIES NOTES TO THE CONSOLIDATED FINANCIAL STATEMENTS As of December 31, 2015 and 2016 and for the Years Ended December 31, 2014, 2015 and 2016 (Figures in tables are expressedin billions ofRupiah, unless otherwise stated) Table of Content | | 2011 | | 2012 | | 2013 | | Discount rate | | 6.75% | | 6.00% | | 9.00% | | Rate of compensation increases | | 8.00% | | 6.50% | | 6.50% | | Indonesian mortality table | | 1999 | | 2011 | | 2011 | |
29. PENSION AND OTHER POST-EMPLOYMENT BENEFITS (continued) b. Post-employmenthealth care benefit provisionscost The Company provides post-employment health care benefits to all of its employees hired before November 1, 1995 who have worked for the Company for 20 years or more when they retire, and to their eligible dependents. The requirement to work for 20 years does not apply to employees who retired prior to June 3, 1995. The employees hired by the Company starting from November 1, 1995 are no longer entitled to this plan. The plan is managed by Yakes.Yayasan Kesehatan Telkom (“Yakesâ€). The defined contribution post-employment health care benefit plan is provided to employees hired with permanent status hired on or after November 1, 1995 or employees with terms of service less than 20 years at the time of retirement. The Company’sCompany did not make contribution amounted to Rp18 billion and Rp17 billionthe plan for the years ended December 31, 20122015 and 2013, respectively.2016. The following table presents the changes in the projected post-employment health care benefit obligation, change in post-employment health care benefit plan assets, funded status of the post-employment health care benefit plan and net amount recognized in the Company’sCompany’s consolidated statements of financial positionstatements as of December 31,201231, 2015 and 2013. 2016 and for the yearsthenended: | 2015 | | 2016 | | Changes in projected post-employment health care benefit obligation | | | | | Projected post-employment health care benefit obligation at beginning of year | 11,505 | | 10,942 | | Charged to profit or loss: | | | | | Service costs | 49 | | 9 | | Net interest costs | 961 | | 994 | | Actuarial (gain) losses | (1,187 | ) | 1,828 | | Post-employment health care benefits paid | (386 | ) | (416 | ) | Projected post-employment health care benefit obligation at end of year | 10,942 | | 13,357 | | Changes in post-employment health care planassets | | | | | Fair value of plan assets at beginning of year | 11,064 | | 10,824 | | Interest income | 924 | | 982 | | Return on plan assets (excluding amount included in net interest expense) | (647 | ) | 519 | | Post-employment health care benefits paid | (386 | ) | (416 | ) | Plan administration cost | (131 | ) | (144 | ) | Fair value of plan assets at end of year | 10,824 | | 11,765 | | Funded status | (118) | | (1,592 | ) | Projected post-employment health care benefit obligation – net | 118 | | 1,592 | |
F-93F-94
PERUSAHAAN PERSEROAN (PERSERO) PT TELEKOMUNIKASI INDONESIA Tbk AND SUBSIDIARIES NOTES TO THE CONSOLIDATED FINANCIAL STATEMENTS As of December 31, 2015 and 2016 and for the Years Ended December 31, 2014, 2015 and 2016 (Figures in tables are expressedin billions ofRupiah, unless otherwise stated) PERUSAHAAN PERSEROAN (PERSERO)
| PT TELEKOMUNIKASI INDONESIA Tbk AND SUBSIDIARIES
| NOTES TO THE CONSOLIDATED FINANCIAL STATEMENTS
| As of January 1, 2012 (Restated), December 31, 2012 (Restated) and December 31, 2013
| and for the years ended December 31, 2011 (Restated), 2012 (Restated) and 2013
| (Figures in tables are presented in billions of rupiah, unless otherwise stated)
|
|
TabelTable of Content
3329. PENSION AND OTHER POST-EMPLOYMENT BENEFITSBENEFITS (continued)
b. Post-employmenthealth care benefit provisionscost (continued) | | 2012 (Restated) | | 2013 | | Changes in projected post-employment health care benefit provisions | | | | | | Projected post-employment health care benefit obligations at beginning of year | | 10,547 | | 13,162 | | Service costs | | 56 | | 70 | | Interest costs | | 755 | | 813 | | Actuarial (gains) losses | | 2,074 | | (3,099 | ) | Expected post-employment health care benefits paid | | (270 | ) | (293 | ) | Projected post-employment health care benefit provisions at end of year | | 13,162 | | 10,653 | | Changes in post-employment health care planassets | | | | | | Fair value of plan assets at beginning of year | | 8,986 | | 9,913 | | Interest income | | 653 | | 620 | | Return on plan assets (excluding amount included in net interestexpense) | | 332 | | (763 | ) | Employer’s contributions | | 300 | | 302 | | Expected post-employment health care benefits paid | | (270 | ) | (293 | ) | Administrative expenses paid | | (88 | ) | (119 | ) | Fair value of plan assets at end of year | | 9,913 | | 9,660 | | Funded status | | (3,249 | ) | (993 | ) | Provision for pension benefit cost | | (3,249 | ) | (993 | ) |
As of December 31, 20122015 and 2013,2016, plan assets consistedconsist of: | | 2012 | | 2013 | | 2015 | | 2016 | | | | Quoted in active market | | Unquoted | | Quoted in active market | | Unquoted | | Quoted in
active market | | Unquoted | | Quoted in
active market | | Unquoted | | Cash and cash equivalent | | 1,062 | | - | | 355 | | - | | | Listed shares: | | | | | | | | | | | Manufacturing and consumer | | 247 | | - | | 400 | | - | | | Finance industry | | 180 | | - | | 263 | | - | | | Cash and cash equivalents | | 811 | | - | | 894 | | - | | Equity instruments: | | | | | | | | | | Manufacturingand consumer | | 571 | | - | | 754 | | - | | Finance industries | | 566 | | - | | 540 | | - | | Construction | | 301 | | - | | 351 | | - | | Infrastructure and telecommunication | | 81 | | - | | 166 | | - | | 211 | | - | | 245 | | - | | Construction | | 52 | | - | | 154 | | - | | | Wholesale | | 89 | | - | | 139 | | - | | 70 | | - | | 101 | | - | | Mining | | 68 | | - | | 63 | | - | | 12 | | - | | 27 | | - | | Other industries: | | | | | | | | | | | Services | | 33 | | - | | 17 | | - | | Agriculture | | 22 | | - | | 25 | | - | | 23 | | - | | 44 | | - | | Biotech and Pharma Industry | | - | | - | | 3 | | - | | | Services | | 10 | | - | | 42 | | - | | | Biotechnology andPharmaIndustry | | 6 | | - | | 6 | | - | | Others | | 5 | | - | | 15 | | - | | 3 | | - | | 2 | | - | | Equity-based mutual funds | | 1,672 | | - | | 1,683 | | - | | 1,129 | | - | | 1,311 | | - | | Fixed income-based securities: | | | | - | | | | - | | | Fixed income instruments: | | | | | | | | | | Fixed income mutual funds | | 6,298 | | - | | 6,219 | | - | | 6,837 | | - | | 7,241 | | - | | Unlisted shares: | | | | | | | | | | | | | | | | | | Private placement | | - | | 48 | | - | | 83 | | - | | 213 | | - | | 232 | | Limited mutual funds participation unit forshare-based securities | | - | | 60 | | - | | - | | | Others | | - | | 19 | | - | | 50 | | - | | 38 | | - | | - | | Total | | 9,786 | | 127 | | 9,527 | | 133 | | 10,573 | | 251 | | 11,533 | | 232 | |
F-94
PERUSAHAAN PERSEROAN (PERSERO)
| PT TELEKOMUNIKASI INDONESIA Tbk AND SUBSIDIARIES
| NOTES TO THE CONSOLIDATED FINANCIAL STATEMENTS
| As of January 1, 2012 (Restated), December 31, 2012 (Restated) and December 31, 2013
| and for the years ended December 31, 2011 (Restated), 2012 (Restated) and 2013
| (Figures in tables are presented in billions of rupiah, unless otherwise stated)
|
|
Tabel of Content
33. PENSION AND OTHER POST-EMPLOYMENT BENEFITS (continued)
b. Post-employment health care benefit provisions (continued)
Yakes plan assets also include Series B shares issued by the Company with fair value totaling Rp35totalling Rp174 billion and Rp120Rp217 billion, representing 0.35%1.61% and 1.25% 1.84%of total assetstotalplanassets as of December 31, 2012and2013,2015 and 2016, respectively. The expected return is determined based on market expectation for returnsforthereturns over the entire life of the obligation by considering the portfolio mix of the plan assets. The actual return on plan assets was Rp896wasRp147 billion and (Rp261 billion)Rp1,357 billionfor the years ended December 31, 2015 and 2016, respectively.
The movements of the projected post-employment health care benefit obligation for the years ended December 31, 20122015 and 2013, respectively. The Company expects to contributeRp226 billion to its post-employment2016 are as follows:
| 2015 | | 2016 | | Projected post-employment health care benefitobligation at beginning of year | 441 | | 118 | | Net periodicpost-employment health care benefit costs | 217 | | 165 | | Actuarial(gain)losses recognizedin OCI | (1,187 | ) | 1,828 | | Return on plan assets(excluding amount included innet interest expense) | 647 | | (519 | ) | Projectedpost-employment health care benefit obligation - net | 118 | | 1,592 | |
F-95
PERUSAHAAN PERSEROAN (PERSERO) PT TELEKOMUNIKASI INDONESIA Tbk AND SUBSIDIARIES NOTES TO THE CONSOLIDATED FINANCIAL STATEMENTS As of December 31, 2015 and 2016 and for the Years Ended December 31, 2014, 2015 and 2016 (Figures in tables are expressedin billions ofRupiah, unless otherwise stated) Table of Content
29. PENSION AND OTHER POST-EMPLOYMENT BENEFITS (continued)
b. Post-employment health care plan during 2014. benefitcost (continued) The components of net periodic post-employment health care benefit cost for the years ended December 31, 2011, 20122014, 2015 and 20132016 are as follows: | | 2011 (Restated) | | 2012 (Restated) | | 2013 | | 2014 | | 2015 | | 2016 | | Service costs | | 43 | | 56 | | 70 | | 45 | | 49 | | 9 | | Plan administration cost | | 62 | | 88 | | 119 | | 126 | | 131 | | 144 | | Net interest cost | | 53 | | 102 | | 193 | | 79 | | 37 | | 12 | | Net periodic post-employment health care benefit cost | | 158 | | 246 | | 382 | | | Periodic post-employment health care benefit cost | | 250 | | 217 | | 165 | | Amounts charged to subsidiaries under contractualagreements | | (0 | ) | (1 | ) | (2 | ) | (2 | ) | (1 | ) | (2 | ) | Net periodic post-employment health care benefit cost | | 158 | | 245 | | 380 | | | Net periodic post-employment health carebenefit cost less cost charged to subsidiaries | | 248 | | 216 | | 163 | |
Amounts recognized inOCI are as follows: | | 2011 (Restated) | | 2012 (Restated) | | 2013 | | Actuarial(gains)losses recognized during the year | | 1,208 | | 2,074 | | (3,099 | ) | Return on plan assets(excluding amount included in net interest expense) | | (180 | ) | (332 | ) | 763 | | Total | | 1,028 | | 1,742 | | (2,336 | ) |
| 2014 | | 2015 | | 2016 | | Actuarial (gain) losses recognized during the year due to: | | | | | | | Experience adjustments | 97 | | (53 | ) | 26 | | Changes in demographic assumptions | - | | 92 | | 66 | | Changes in financial assumptions | 141 | | (1,226 | ) | 1,736 | | Return on plan assets(excluding amount included in net interest expense) | (814 | ) | 647 | | (519 | ) | Net | (576 | ) | (540 | ) | 1,309 | |
The actuarial valuation for the post-employment health care benefits plan was performed based on the measurement date as of December 31, 2011, 2012 and 2013,31,2014, 2015and 2016, with reports dated March 7, 2012,13, 2015, February 28, 201325, 2016 andFebruary 28, 2014,22, 2017, respectively, by TWP, an independent actuary in association with TW.withWTW. The principal actuarial assumptions used by the independent actuary as of December 31, 2011, 201231,2014,2015 and 20132016 are as follows: | | 2011 | | 2012 | | 2013 | | 2014 | | 2015 | | 2016 | | Discount rate | | 7.25% | | 6.25% | | 9.00% | | 8.50% | | 9.25% | | 8.50% | | Health care costs trend rate assumed for next year | | 7.00% | | 7.00% | | 7.00% | | 7.00% | | 7.00% | | 7.00% | | Ultimate health care costs trend rate | | 7.00% | | 7.00% | | 7.00% | | 7.00% | | 7.00% | | 7.00% | | Year that the rate reaches the ultimate trend rate | | 2012 | | 2013 | | 2014 | | 2015 | | 2016 | | 2017 | | Indonesian mortality table | | 1999 | | 2011 | | 2011 | | 2011 | | 2011 | | 2011 | |
F-95F-96
PERUSAHAAN PERSEROAN (PERSERO) PT TELEKOMUNIKASI INDONESIA Tbk AND SUBSIDIARIES NOTES TO THE CONSOLIDATED FINANCIAL STATEMENTS As of December 31, 2015 and 2016 and for the Years Ended December 31, 2014, 2015 and 2016 (Figures in tables are expressedin billions ofRupiah, unless otherwise stated) PERUSAHAAN PERSEROAN (PERSERO)
| PT TELEKOMUNIKASI INDONESIA Tbk AND SUBSIDIARIES
| NOTES TO THE CONSOLIDATED FINANCIAL STATEMENTS
| As of January 1, 2012 (Restated), December 31, 2012 (Restated) and December 31, 2013
| and for the years ended December 31, 2011 (Restated), 2012 (Restated) and 2013
| (Figures in tables are presented in billions of rupiah, unless otherwise stated)
|
|
TabelTable of Content
3329. PENSION AND OTHER POST-EMPLOYMENT BENEFITSBENEFITS (continued)
b. Post-employment health care benefit provisions(continued)
The movements of the projected post-employment health care benefit obligation for the years ended December 31, 2012 and 2013, are as follows:
| | 2012 (Restated) | | 2013 | | Changes in projected post-employment health care benefitobligation | | | | | | Defined benefit liability at end of prior fiscal year | | 1,561 | | 3,249 | | Net periodic pension cost | | 246 | | 382 | | Employer contributions | | (300 | ) | (302 | ) | Actuarial(gains)losses recognized via the OCI | | 2,074 | | (3,099 | ) | Return on plan assets(excluding amount included in net interest expense) | | (332 | ) | 763 | | Post-employment health care benefitprovisions | | 3,249 | | 993 | |
c. Other post-employment benefits provisionscost The Company provides other post-employment benefits in the form of cash paid to employees on their retirement or termination. These benefits consist of final housing allowance (“(Biaya Fasilitas Perumahan Terakhir” or BFPT)“BFPTâ€) and home passage leave (“(Biaya Perjalanan Pensiun dan Purnabhakti” or BPP)or“BPPâ€). The changes inThemovementsof the unfunded projected other post-employment benefit obligationobligations for the years ended December 31, 20122015 and 20132016 are as follows:
| | 2012 (Restated) | | 2013 | | Changes in projected other post-employment benefitobligation | | | | | | Unfunded projected benefits obligation at beginning of year | | 462 | | 508 | | Charged to profit or loss | | | | | | Service costs | | 10 | | 11 | | Net interest cost | | 32 | | 30 | | Actuarial (gains) losses recognizedin OCI | | 32 | | (72 | ) | Benefits paid by employer | | (28 | ) | (27 | ) | Unfunded projected benefits obligation at end of year | | 508 | | 450 | |
| 2015 | | 2016 | | Projected other post-employment benefit obligations at beginning of year | 488 | | 497 | | Charged to profit or loss: | | | | | Service costs | 8 | | 7 | | Net interest costs | 39 | | 41 | | Actuarial losses recognizedin OCI | 11 | | 20 | | Benefits paid by employer | (49 | ) | (63 | ) | Projected other post-employment benefit obligations at the end of year | 497 | | 502 | |
Amounts recognized in OCI amounted to Rp40 billion, Rp32 billion and(Rp72 billion) for the years ended December 31, 2011,2012 and 2013, respectively.
The components of the projected other post-employment benefit cost for the years ended December 31,2014,2015 and 2016 are as follows:
| 2014 | | 2015 | | 2016 | | Service costs | 9 | | 8 | | 7 | | Net interest costs | 39 | | 39 | | 41 | | Total | 48 | | 47 | | 48 | |
Amounts recognized inOCI are as follows:
| 2014 | | 2015 | | 2016 | | Actuarial (gain) losses recognized during the year due to: | | | | | | | Experience adjustments | 12 | | 20 | | 2 | | Changes in demographic assumptions | - | | (0 | ) | 0 | | Changes in financial assumptions | 12 | | (9 | ) | 18 | | Net | 24 | | 11 | | 20 | |
The actuarial valuation for the other post-employment benefitsplanwas performed based on measurement date as of December 31, 2011,20122014, 2015 and 20132016, with reports dated March 13, 2015, February 25, 2016 and February 22, 2017respectively, by TWP, an independent actuary in association with WTW.The principal actuarial assumptions used by the independent actuary as ofDecember 31, 2014, 2015 and 2016, are as follows: | | 2011 (Restated) | | 2012 (Restated) | | 2013 | | Service costs | | 9 | | 10 | | 11 | | Net interest cost | | 37 | | 32 | | 30 | | Total | | 46 | | 42 | | 41 | |
| 2014 | | 2015 | | 2016 | | Discount rate | 8.50% | | 9.00% | | 7.75% | | Indonesian mortality table | 2011 | | 2011 | | 2011 | |
F-96F-97
PERUSAHAAN PERSEROAN (PERSERO) PT TELEKOMUNIKASI INDONESIA Tbk AND SUBSIDIARIES NOTES TO THE CONSOLIDATED FINANCIAL STATEMENTS As of December 31, 2015 and 2016 and for the Years Ended December 31, 2014, 2015 and 2016 (Figures in tables are expressedin billions ofRupiah, unless otherwise stated) PERUSAHAAN PERSEROAN (PERSERO)
| PT TELEKOMUNIKASI INDONESIA Tbk AND SUBSIDIARIES
| NOTES TO THE CONSOLIDATED FINANCIAL STATEMENTS
| As of January 1, 2012 (Restated), December 31, 2012 (Restated) and December 31, 2013
| and for the years ended December 31, 2011 (Restated), 2012 (Restated) and 2013
| (Figures in tables are presented in billions of rupiah, unless otherwise stated)
|
|
TabelTable of Content
3329. PENSION AND OTHER POST-EMPLOYMENT BENEFITSBENEFITS (continued)
d. Obligation under the Labor Law provisions Under Law No. 13 Year 2003, the Group is required to provide minimum pension benefits, if not covered yet by the sponsored pension plans, to its employees upon retirement age.retirement. The total related obligation recognized as of December 31,2012 and 201331,2015 and2016 amounted to Rp157Rp253 billion and Rp154Rp332 billion, respectively. The related employee benefits cost charged to expense amounted to Rp24billion, Rp35Rp56 billion, Rp53 billion and Rp15Rp82 billion for theyearsended December 31, 2014, 2015 and 2016, respectively (Note 25). The actuarial losses recognized in OCI amounted to Rp10 billion, Rp48 billionand Rp33 billionfor the years ended December 31, 2011,20122014, 2015 and 2013, respectively. The actuarial losses (gains) recognized inOCI amounted to Rp21 billion, (Rp8 billion) and (Rp50billion) for the years ended December 31, 2011,2012 and 2013,2016, respectively. e. Maturity Profile of Defined Benefit Obligation (“DBO”(“DBOâ€) Weighted Average duration of DBO for the Company and Telkomsel are 19.96 years and 15.14 years, respectively. The timing of benefits payments for 2013 isand weightedaverage duration of DBO for2016 are as follows (in millions of rupiah)billions ofRupiah):
| | Expected Benefits Payment | | | | Expected Benefits Payment | | The Company | | | Post-employment health care benefits | | Other post-employment benefits | | Time Period | | Funded | | Unfunded | | Telkomsel | | Post-employment health care | | Other post- employment benefits | | Funded | | Unfunded | | Telkomsel | | | Within next 10 years | | 13,077 | | 3,207 | | 206 | | 4,670 | | 691 | | 16,888 | | 2,914 | | 1,653 | | 6,273 | | 578 | | Within 10-20 years | | 18,562 | | 587 | | 2,340 | | 6,405 | | 197 | | 20,052 | | 263 | | 6,257 | | 8,401 | | 139 | | Within 20-30 years | | 16,588 | | 26 | | 6,021 | | 6,659 | | 53 | | 17,289 | | 29 | | 5,758 | | 8,648 | | 47 | | Within 30-40 years | | 9,775 | | 0 | | 6,550 | | 5,337 | | 4 | | 11,827 | | 5 | | 936 | | 6,711 | | 3 | | Within 40-50 years | | 3,188 | | - | | - | | 2,832 | | - | | 2,872 | | - | | - | | 2,986 | | - | | Within 50-60 years | | 465 | | - | | - | | 430 | | - | | 238 | | - | | - | | 245 | | - | | Within 60-70 years | | 24 | | - | | - | | 2 | | - | | 9 | | - | | - | | 1 | | - | | Within 70-80 years | | 0 | | - | | - | | 0 | | - | | 0 | | - | | - | | 0 | | - | | Weightedaverage duration of DBO | | 9.15 years | | 4.33 years | | 11.33 years | | 13.81 years | | 3.62 years | |
f. Sensitivity Analysis 0.5%1% change in discount rate and rate of salarycompensation would have effect on DBO, as follows:
| | Discount Rate | | Rate of Compensation | | | | Discount Rate | | Rate of Compensation | | 1% Increase | | 1% Decrease | | 1% Increase | | 1% Decrease | | Sensitivity | | 0.5% Increase | | 0.5% Decrease | | 0.5% Increase | | 0.5% Decrease | | Increase (decrease) in amounts | | Increase (decrease) in amounts | | Funded | | (722 | ) | 786 | | 113 | | (123 | ) | (1,579 | ) | 1,860 | | 384 | | (397 | ) | Unfunded | | (47 | ) | 48 | | 27 | | (29 | ) | (68 | ) | 73 | | 70 | | (70 | ) | Telkomsel | | (83 | ) | 94 | | 55 | | (51 | ) | (108 | ) | 116 | | 115 | | (108 | ) | Post-employment health care | | (679 | ) | 753 | | 1,720 | | (1,413 | ) | | Post-employment health care benefits | | (1,544 | ) | 1,882 | | 2,034 | | (1,687 | ) | Other post-employment benefits | | (10 | ) | 11 | | - | | - | | (16 | ) | 18 | | - | | - | |
The sensitivity analyses haveanalysis has been determined based on a method that extrapolates the impact on DBO as a result of reasonable changes in key assumptions occurring at the end of the reporting period.
The sensitivity results above determine the individual impact on the Plan’s endPlan’sDBO at theend of the year DBO.year. In reality, the Plan is subject to multiple external experience items which may move the DBO in similar or opposite directions,and the Plan’sPlan’s sensitivity to such changes can vary over time. There are no changes in the methods and assumptions used in preparing the sensitivity analysesanalysis from the previous period.
F-97F-98
PERUSAHAAN PERSEROAN (PERSERO) PT TELEKOMUNIKASI INDONESIA Tbk AND SUBSIDIARIES NOTES TO THE CONSOLIDATED FINANCIAL STATEMENTS As of December 31, 2015 and 2016 and for the Years Ended December 31, 2014, 2015 and 2016 (Figures in tables are expressedin billions ofRupiah, unless otherwise stated) PERUSAHAAN PERSEROAN (PERSERO)
| PT TELEKOMUNIKASI INDONESIA Tbk AND SUBSIDIARIES
| NOTES TO THE CONSOLIDATED FINANCIAL STATEMENTS
| As of January 1, 2012 (Restated), December 31, 2012 (Restated) and December 31, 2013
| and for the years ended December 31, 2011 (Restated), 2012 (Restated) and 2013
| (Figures in tables are presented in billions of rupiah, unless otherwise stated)
|
|
TabelTable of Content
340. LSA PROVISIONS Telkomsel providesand Patrakom provide certain cash awards or certain number of days leave benefits to itstotheir employees based on the employees’employees’ length of service requirements, including LSA and LSL. LSA are either paid at the time the employees reachcertain years duringemployment,ofemployment, or at the time of termination. LSL are either certainLSLare eithercertain number of days leave benefit or cash, subject to approval by management, provided to employees who meet the requisite number of years of service andandreach a certain minimum age. The obligation with respect to these awards wasawardswhichwas determined based on an actuarial valuation using the Projected Unit Credit method, amounted to Rp347 billion andRp336toRp501billion and Rp613 billion as of December 31, 20122015 and 2013,2016, respectively. The related benefit costs charged to expense amounted to Rp96toRp115 billion, Rp121Rp152 billion andRp19 billionforand Rp237 billion for the years ended December 31, 2011, 20122014, 2015 and 2013,2016, respectively (Note 28)25). 35.31. RELATED PARTY TRANSACTIONS
In the normal course of its business, theGroupentered into transactions with related parties. It is the Company’s policy that the pricings of these transactions be the same as those of arm’s length transactions.
a. Nature of relationships and accounts/transactions with related parties Details of the nature of relationships and accounts/transactions with significant related parties are as follows: Related parties | | Nature of relationshipswith related parties | | Nature of transactions/accounts/transactions | | The Government MinistryGovernment-Ministry of Finance | | Majority stockholder | | FinanceInternet and data service revenues, other telecommunication service revenues, finance income, finance costs andinvestment and investment in financial instruments
| | Government Agenciesagencies | | EntityEntities under common control
| | Network service revenues, internet and data service revenues and operating expensesother telecommunication revenues | | MoCI | | EntityEntities under common control
| | Concession fees, radio frequency usage charge,charges, USO charges, and telecommunication service revenue | | State-owned enterprises
| | Entity under common control
| | Operatingrevenues and operation and maintenance expenses purchase of property and equipment, construction and installation services, insurance expense, finance income, finance costs, investment in financial instruments
| | Indosat | | Entity under common control | | Interconnection revenues, network service revenues, interconnection expenses, telecommunications facilities usage, operatingleased line expenses, operation and maintenance cost, leased lines revenue, satellite transpondersusage revenues,usage of data communication network system expenses and lease revenues | | PT Aplikanusa Lintasarta (“Lintasarta”(“Lintasartaâ€) | | Entity under common control | | Network service revenues, usage of data communication network system expenses and leased lines expenses | | Indosat Mega Media | | Entity under common control | | Network service revenues | | CSMPT Perusahaan Listrik Negara (“PLNâ€)
|
| Entity under common control |
| Electricity expenses, finance income, finance costs and investment in financial instrument |
| PT Pertamina (Persero) (“Pertaminaâ€) |
| Entity under common control | | Associated companyInternet and data service revenues, other telecommunication service revenues
|
| PT Kereta Api Indonesia (“KAIâ€) | | Satellite transponders usageEntity under common control
| | Internet and data service revenues, leased linesother telecommunication service revenues transmission lease expenses | | Patrakom*) PT Pegadaian
| | Associated companyEntity under common control
| | Satellite transponders usageInternet and data service revenues, leased linesother telecommunication service revenues transmission lease expenses
| | PSNPT Garuda Indonesia
| | Associated companyEntity under common control
| | Satellite transponders usageInternet and data service revenues, leased linesother telecommunication service revenues transmission lease expenses, interconnection revenues and interconnection expense
| | Indonusa**PT Indonesia Comnet Plus (“ICON Plusâ€)
| | Associated companyEntity under common control
| | Leased lineInternet and data service revenues, other telecommunication servicesservice revenues, network service revenue and interconnection revenues
| | Badan Penyelenggara Jaminan Sosial (“BPJSâ€) | | Entities under common control | | Internet and data service revenues, other telecommunication expenseservice revenues and insurance expenses | |
*) Patrakom became a subsidiary on September 25, 2013 (Note 3).
**) OnOctober 8, 2013, the Company sold its 80% ownership in Indonusa (Notes 3 and 11).
F-98F-99
PERUSAHAAN PERSEROAN (PERSERO) PT TELEKOMUNIKASI INDONESIA Tbk AND SUBSIDIARIES NOTES TO THE CONSOLIDATED FINANCIAL STATEMENTS As of December 31, 2015 and 2016 and for the Years Ended December 31, 2014, 2015 and 2016 (Figures in tables are expressedin billions ofRupiah, unless otherwise stated) PERUSAHAAN PERSEROAN (PERSERO)
| PT TELEKOMUNIKASI INDONESIA Tbk AND SUBSIDIARIES
| NOTES TO THE CONSOLIDATED FINANCIAL STATEMENTS
| As of January 1, 2012 (Restated), December 31, 2012 (Restated) and December 31, 2013
| and for the years ended December 31, 2011 (Restated), 2012 (Restated) and 2013
| (Figures in tables are presented in billions of rupiah, unless otherwise stated)
|
|
TabelTable of Content
35.31. RELATED PARTY TRANSACTIONS (continued)
a. Nature of relationships and accounts/transactions with related parties (continued) Related parties | | Nature of relationshipswith related parties | | Nature of transactions/accounts/transactions | | PT Industri TelekomunikasiAsuransi Jasa Indonesia (“INTI”(“Jasindoâ€) | | Entity under common control | | Insurance expenses | | PT Adhi Karya Tbk (“Adhi Karyaâ€) | | Entity under common control | | Purchase of materials and construction services | | INTI | | Entity under common control | | Purchase of property and equipment and construction service | | PT Asuransi Jasa Indonesia (“Jasindo”)LEN
| | Entity under common control | | InsuranceforPurchase of property and equipment
| | PT Jaminan Sosial Tenaga Kerja (“Jamsostek”)
| | Entity under common control
| | Insurance for employees
| | PT Perusahaan Listrik Negara (Persero) (“PLN”)
| | Entity under common control
| | Electricity expenses
| | PT Pos Indonesia
| | Entity under common control
| | Cost of SIM cards
| | State-owned banks
| | Entity under common control
| | Finance income and finance costsconstruction service
| | BNI | | Entity under common control | | FinanceInternet and data service revenues, other telecommunication service revenues, finance income and finance costs
| | Bank Mandiri | | Entity under common control | ��
| FinanceInternet and data service revenues, other telecommunication service revenues, finance income and finance costs
| | BRI | | Entity under common control | | Finance incomeInternet and data service revenues, other telecommunication service revenues, finance costs
| | Bank Jabar
| | Entity under common control
| | Finance income and finance costs
| | BTN | | Entity under common control | | FinanceInternet and data service revenues, other telecommunication service revenues, finance income and finance costs
| | BSM
| | Entity under common control
| | Finance costs
| | PT Bank BRI Syariah (“BRI Syariah”)
| | Entity under common control
| | Finance costs
| | Bahana | | Entity under common control | | Available-for-sale financial assets, bonds and notes | | Koperasi Pegawai Telkom (“Kopegtel”PT Pos Indonesia (“Pos Indonesiaâ€)
| | Entity under significant influencecommon control | | Marketing expenses | | CSM | | Associated company | | Network service revenues | | Indonusa | | Associated company | | Network service revenues and operation and maintenance expenses | | PT Poin Multi Media Nusantara (“POINâ€)* | | Associated company | | Cost of handset sold | | Teltranet | | Associated company | | Leased line and CPE expenses and operation and maintenance expenses | | Tiphone | | Associated company | | Distribution of sim card and voucher | | Koperasi Pegawai Telkom (“Kopegtelâ€) | | Other related entity | | Purchase of property and equipment, construction and installation services, leases of buildings, leases of vehicles, purchases of materials and construction services, utilites ofoperation and maintenance expenses, leased line and cleaning servicesCPE expenses | | Yakes | | Other related entity | | Medical expenses, internet and RSAdata service revenues and e-health revenues | | PT Sandhy Putra Makmur (“SPM”(“SPMâ€) | | Entity under significant influenceOther related entity
| | Leases of buildings, leases of vehicles, purchasesPurchase of materials and construction services, utilities maintenance and cleaning servicesservices.
| | Koperasi Pegawai Telkomsel (“Kisel”(“Kiselâ€) | | Entity under significant influenceOther related entity
| | LeasesInternet and data service revenues, other telecommunication service revenues, purchase of vehicle, printingproperty and equipment, operation and maintenance expenses and distribution of customer bills, collection feesim card and other services fee, distribution of SIM cards and pulse reload vouchersvoucher
| | PT Graha Informatika Nusantara (“Gratika”(“Gratikaâ€) | | Entity under significant influenceOther related entity
| | Leased linesNetwork service revenues, operation and maintenance expenses, purchase of property and equipment installation expense and maintenance expenseconstruction services and distribution of sim card and voucher
| | PT Pembangunan Telekomunikasi Indonesia (“Bangtelindoâ€) | | Other related entity | | Purchase of property and equipment and construction services | | Telin Malaysia | | Other related entity | | Other telecommunication service revenues | | Sarana Janesia Utama | | Other related entity | | Insurance expenses and professional fees | | Directors and commissioners | | Key management personnel | | Honorarium and facilities | | Yakes
| | Entity under common control
| | Medical expenses
| |
*On September 18, 2014, PINS acquired 25% ownership in Tiphone (Note 9). POIN is a subsidiary of Tiphone. F-100
PERUSAHAAN PERSEROAN (PERSERO) PT TELEKOMUNIKASI INDONESIA Tbk AND SUBSIDIARIES NOTES TO THE CONSOLIDATED FINANCIAL STATEMENTS As of December 31, 2015 and 2016 and for the Years Ended December 31, 2014, 2015 and 2016 (Figures in tables are expressedin billions ofRupiah, unless otherwise stated) Table of Content
31. RELATED PARTY TRANSACTIONS (continued)
a.Nature of relationships and accounts/transactions with related parties (continued)
The outstanding balances of trade receivables and payables at year-end are unsecured and interest free and settlement occurs in cash. There have been no guarantees provided or received for any related party receivables or payables. In 2016, the Group recorded impairment of receivables from related parties of(Rp224 billion).Impairment assessment is undertaken each financial year through examining the current status of existing receivables and historical collection experience. b. Transactions with related parties The following are significant transactions with related parties: | | 2011 | | 2012 | | 2013 | | 2014 | | 2015 | | 2016 | | | | Amount | | % of total revenues | | Amount | | % of total revenues | | Amount | | % of total revenues | | Amount | | % of total revenues | | Amount | | % of total revenues | | Amount | | % of total revenues | | REVENUES | | | | | | | | | | | | | | | | | | | | | | | | | | Entity under common control | | | | | | | | | | | | | | | Majority Stockholder | | | | | | | | | | | | | | The Government - Ministry of Finance | | 168 | | 0.19 | | 206 | | 0.20 | | 207 | | 0.18 | | Entities under common control | | | | | | | | | | | | | | Government agencies | | 1,328 | | 1.48 | | 1,650 | | 1.61 | | 2,279 | | 1.96 | | Indosat | | 857 | | 1.20 | | 1,033 | | 1.34 | | 1,053 | | 1.27 | | 1,015 | | 1.13 | | 1,020 | | 1.00 | | 2,167 | | 1.86 | | Government agencies | | 415 | | 0.58 | | 237 | | 0.31 | | 508 | | 0.61 | | | MoCI | | 253 | | 0.28 | | 98 | | 0.10 | | 241 | | 0.21 | | BRI | | 277 | | 0.31 | | 188 | | 0.18 | | 181 | | 0.16 | | Bank Mandiri | | 133 | | 0.15 | | 151 | | 0.15 | | 161 | | 0.14 | | BNI | | 137 | | 0.15 | | 126 | | 0.12 | | 136 | | 0.12 | | BTN | | 30 | | 0.03 | | 41 | | 0.04 | | 107 | | 0.09 | | Lintasarta | | 93 | | 0.13 | | 85 | | 0.11 | | 64 | | 0.08 | | 81 | | 0.09 | | 82 | | 0.08 | | 99 | | 0.09 | | PT Pegadaian | | 306 | | 0.34 | | 89 | | 0.09 | | 93 | | 0.08 | | PT Garuda Indonesia | | 52 | | 0.06 | | 77 | | 0.08 | | 75 | | 0.06 | | KAI | | 100 | | 0.11 | | 90 | | 0.09 | | 68 | | 0.06 | | Pertamina | | 69 | | 0.08 | | 99 | | 0.10 | | 64 | | 0.06 | | ICON Plus | | 24 | | 0.03 | | 63 | | 0.06 | | 56 | | 0.05 | | BPJS | | 28 | | 0.03 | | 35 | | 0.03 | | 46 | | 0.04 | | Others | | 291 | | 0.32 | | 216 | | 0.21 | | 451 | | 0.39 | | Sub-total | | 1,365 | | 1.91 | | 1,355 | | 1.76 | | 1,625 | | 1.96 | | 4,124 | | 4.59 | | 4,025 | | 3.94 | | 6,224 | | 5.37 | | Other related entities | | | | | | | | | | | | | | Yakes | | 16 | | 0.02 | | 18 | | 0.02 | | 153 | | 0.13 | | Gratika | | 43 | | 0.05 | | 32 | | 0.03 | | 42 | | 0.04 | | Others | | 15 | | 0.02 | | 8 | | 0.01 | | 58 | | 0.05 | | Sub-total | | 74 | | 0.09 | | 58 | | 0.06 | | 253 | | 0.22 | | Associated companies | | | | | | | | | | | | | | Indonusa | | 74 | | 0.08 | | 60 | | 0.06 | | 105 | | 0.09 | | Telin Malaysia | | - | | - | | - | | - | | 35 | | 0.03 | | CSM | | 37 | | 0.04 | | 34 | | 0.03 | | 32 | | 0.03 | | Others | | - | | - | | 9 | | 0.01 | | 26 | | 0.02 | | Sub-total | | 111 | | 0.12 | | 103 | | 0.10 | | 198 | | 0.17 | | Total | | 4,477 | | 4.99 | | 4,392 | | 4.30 | | 6,882 | | 5.94 | |
F-99
PERUSAHAAN PERSEROAN (PERSERO)
| PT TELEKOMUNIKASI INDONESIA Tbk AND SUBSIDIARIES
| NOTES TO THE CONSOLIDATED FINANCIAL STATEMENTS
| As of January 1, 2012 (Restated), December 31, 2012 (Restated) and December 31, 2013
| and for the years ended December 31, 2011 (Restated), 2012 (Restated) and 2013
| (Figures in tables are presented in billions of rupiah, unless otherwise stated)
|
|
Tabel of Content
35. RELATED PARTY TRANSACTIONS(continued)
b. Transactions with related parties (continued)
The following are significant transactions with related parties: (continued)
| | 2011 | | 2012 | | 2013 | | | | Amount | | % of total revenues | | Amount | | % of total revenues | | Amount | | % of total revenues | | REVENUES (continued) | | | | | | | | | | | | | | Entity under significant influence | | | | | | | | | | | | | | Kisel | | 2,347 | | 3.29 | | 2,351 | | 3.05 | | 2,751 | | 3.32 | | Gratika | | - | | - | | 3 | | 0.00 | | 342 | | 0.41 | | Sub-total | | 2,347 | | 3.29 | | 2,354 | | 3.05 | | 3,093 | | 3.73 | | Associated companies | | | | | | | | | | | | | | Indonusa | | - | | - | | - | | - | | 45 | | 0.05 | | CSM | | 57 | | 0.08 | | 47 | | 0.06 | | 31 | | 0.04 | | Patrakom | | 67 | | 0.09 | | 80 | | 0.10 | | - | | - | | Sub-total | | 124 | | 0.17 | | 127 | | 0.16 | | 76 | | 0.09 | | Others | | 30 | | 0.04 | | 27 | | 0.04 | | 99 | | 0.12 | | Total | | 3,866 | | 5.41 | | 3,863 | | 5.01 | | 4,893 | | 5.90 | |
| | 2011 (Restated) | | 2012 (Restated) | | 2013 | | | | Amount | | % of total expenses | | Amount | | % of total expenses | | Amount | | % of total expenses | | EXPENSES | | | | | | | | | | | | | | Entity under common control | | | | | | | | | | | | | | Government agencies | | 4,165 | | 8.42 | | 6,539 | | 12.57 | | 4,606 | | 8.07 | | Indosat | | 814 | | 1.65 | | 1,004 | | 1.93 | | 1,008 | | 1.77 | | PLN | | 1,243 | | 2.51 | | 660 | | 1.27 | | 651 | | 1.14 | | Jasindo | | 401 | | 0.81 | | 370 | | 0.71 | | 333 | | 0.58 | | Yakes | | 121 | | 0.24 | | 150 | | 0.29 | | 159 | | 0.28 | | PT Pos Indonesia | | 54 | | 0.11 | | 51 | | 0.10 | | 64 | | 0.11 | | Jamsostek | | 33 | | 0.07 | | 36 | | 0.07 | | 39 | | 0.07 | | Sub-total | | 6,831 | | 13.81 | | 8,810 | | 16.94 | | 6,860 | | 12.02 | | Entity under significant influence | | | | | | | | | | | | | | Kisel | | 745 | | 1.51 | | 825 | | 1.59 | | 743 | | 1.30 | | Kopegtel | | 956 | | 1.93 | | 817 | | 1.57 | | 692 | | 1.21 | | SPM | | 91 | | 0.18 | | 25 | | 0.05 | | 118 | | 0.21 | | Sub-total | | 1,792 | | 3.62 | | 1,667 | | 3.21 | | 1,553 | | 2.72 | | Associated companies | | | | | | | | | | | | | | PSN | | 170 | | 0.34 | | 165 | | 0.32 | | 187 | | 0.33 | | CSM | | 107 | | 0.22 | | 100 | | 0.19 | | 63 | | 0.11 | | Patrakom | | 77 | | 0.16 | | 73 | | 0.14 | | - | | - | | Sub-total | | 354 | | 0.72 | | 338 | | 0.65 | | 250 | | 0.44 | | Others (each below Rp30 billion) | | 47 | | 0.10 | | 36 | | 0.07 | | 80 | | 0.14 | | Total | | 9,024 | | 18.25 | | 10,851 | | 20.87 | | 8,743 | | 15.32 | |
F-100
PERUSAHAAN PERSEROAN (PERSERO)
| PT TELEKOMUNIKASI INDONESIA Tbk AND SUBSIDIARIES
| NOTES TO THE CONSOLIDATED FINANCIAL STATEMENTS
| As of January 1, 2012 (Restated), December 31, 2012 (Restated) and December 31, 2013
| and for the years ended December 31, 2011 (Restated), 2012 (Restated) and 2013
| (Figures in tables are presented in billions of rupiah, unless otherwise stated)
|
|
Tabel of Content
35. RELATED PARTY TRANSACTIONS(continued)
b. Transactions with related parties (continued)
The following are significant transactions with related parties: (continued)
| | 2011 | | 2012 | | 2013 | | | | Amount | | % of total finance income | | Amount | | % of total finance income | | Amount | | % of total finance income | | FINANCE INCOME | | | | | | | | | | | | | | Majority stockholder | | | | | | | | | | | | | | The Government | | 74 | | 11.94 | | 13 | | 2.18 | | 13 | | 1.56 | | Entity under common control | | | | | | | | | | | | | | State-owned banks | | 320 | | 51.61 | | 366 | | 61.41 | | 530 | | 63.40 | | Others | | - | | - | | - | | - | | 7 | | 0.84 | | Total | | 394 | | 63.55 | | 379 | | 63.59 | | 550 | | 65.80 | |
| | 2011 | | 2012 | | 2013 | | | | Amount | | % of total finance costs | | Amount | | % of total finance costs | | Amount | | % of total finance costs | | FINANCE COSTS | | | | | | | | | | | | | | Majority stockholder | | | | | | | | | | | | | | The Government | | 169 | | 10.17 | | 82 | | 3.99 | | 84 | | 5.59 | | Entity under common control | | | | | | | | | | | | | | State-owned banks | | 621 | | 37.36 | | 424 | | 20.63 | | 518 | | 34.44 | | Others | | - | | - | | - | | - | | 4 | | 0.27 | | Total | | 790 | | 47.53 | | 506 | | 24.62 | | 606 | | 40.30 | |
| | 2012 | | 2013 | | | | Amount | | % of total fixed assets purchased | | Amount | | % of total fixed assets purchased | | PURCHASE OF PROPERTY AND EQUIPMENT(Note 12) | | | | | | | | | | Entity under common control | | | | | | | | | | State-owned enterprises | | 98 | | 0.57 | | 126 | | 0.51 | | Entity under significant influence | | | | | | | | | | Kopegtel | | 237 | | 1.37 | | 223 | | 0.90 | | Others (each below Rp30 billion) | | 47 | | 0.27 | | 59 | | 0.24 | | Total | | 382 | | 2.21 | | 408 | | 1.65 | |
Presented below are balances of accounts with related parties:
| | 2012 | | 2013 | | | | Amount | | % of total assets | | Amount | | % of total assets | | a. Cash and cash equivalents (Note 5) | | 9,170 | | 8.32 | | 11,985 | | 9.37 | | b. Other current financial assets(Note 6) | | 1,908 | | 1.73 | | 1,246 | | 0.97 | |
F-101
PERUSAHAAN PERSEROAN (PERSERO) PT TELEKOMUNIKASI INDONESIA Tbk AND SUBSIDIARIES NOTES TO THE CONSOLIDATED FINANCIAL STATEMENTS As of December 31, 2015 and 2016 and for the Years Ended December 31, 2014, 2015 and 2016 (Figures in tables are expressedin billions ofRupiah, unless otherwise stated) PERUSAHAAN PERSEROAN (PERSERO)
| PT TELEKOMUNIKASI INDONESIA Tbk AND SUBSIDIARIES
| NOTES TO THE CONSOLIDATED FINANCIAL STATEMENTS
| As of January 1, 2012 (Restated), December 31, 2012 (Restated) and December 31, 2013
| and for the years ended December 31, 2011 (Restated), 2012 (Restated) and 2013
| (Figures in tables are presented in billions of rupiah, unless otherwise stated)
|
|
TabelTable of Content
351. RELATED PARTY TRANSACTIONS(continued) b. Transactions with related parties (continued)
| 2014 | | 2015 | | 2016 | | | Amount | | % of total expenses | | Amount | | % of total expenses | | Amount | | % of total expenses | | EXPENSES | | | | | | | | | | | | | Entities under common control | | | | | | | | | | | | | MoCI | 5,031 | | 8.22 | | 5,862 | | 8.42 | | 5,911 | | 7.84 | | PLN | 721 | | 1.18 | | 738 | | 1.06 | | 1,037 | | 1.38 | | Indosat | 937 | | 1.53 | | 978 | | 1.40 | | 939 | | 1.25 | | Jasindo | 291 | | 0.48 | | 256 | | 0.37 | | 267 | | 0.35 | | Pos Indonesia | 42 | | 0.07 | | - | | - | | 49 | | 0.06 | | BPJS | 46 | | 0.08 | | 33 | | 0.05 | | - | | - | | Others | 12 | | 0.02 | | 32 | | 0.05 | | 79 | | 0.10 | | Sub-total | 7,080 | | 11.58 | | 7,899 | | 11.35 | | 8,282 | | 10.98 | | Associated companies | | | | | | | | | | | | | POIN | 320 | | 0.52 | | 1,485 | | 2.13 | | 1,459 | | 1.94 | | Indonusa | 6 | | 0.01 | | - | | - | | 145 | | 0.19 | | Teltranet | - | | - | | - | | - | | 49 | | 0.06 | | Others | 50 | | 0.08 | | 9 | | 0.01 | | 38 | | 0.05 | | Sub-total | 376 | | 0.61 | | 1,494 | | 2.14 | | 1,691 | | 2.24 | | Other related entities | | | | | | | | | | | | | Kisel | 922 | | 1.51 | | 748 | | 1.07 | | 771 | | 1.02 | | Kopegtel | 550 | | 0.90 | | 460 | | 0.66 | | 533 | | 0.71 | | Yakes | 157 | | 0.26 | | 174 | | 0.25 | | 192 | | 0.25 | | Sarana Janesia
Utama | 10 | | 0.02 | | 12 | | 0.02 | | 106 | | 0.14 | | Others | 20 | | 0.03 | | 18 | | 0.03 | | 82 | | 0.11 | | Sub-total | 1,659 | | 2.72 | | 1,412 | | 2.03 | | 1,684 | | 2.23 | | Total | 9,115 | | 14.91 | | 10,805 | | 15.52 | | 11,657 | | 15.45 | |
| 2014 | | 2015 | | 2016 | | | Amount | | % of total finance income | | Amount | | % of total finance income | | Amount | | % of total finance income | | FINANCE INCOME | | | | | | | | | | | | | Majority stockholder | | | | | | | | | | | | | The Government - Ministry of Finance | 13 | | 1.05 | | 9 | | 0.64 | | 2 | | 0.12 | | Entities under common control | | | | | | | | | | | | | State-owned banks | 750 | | 60.58 | | 830 | | 58.99 | | 895 | | 52.16 | | Others | 3 | | 0.24 | | 17 | | 1.21 | | 39 | | 2.27 | | Total | 766 | | 61.87 | | 856 | | 60.84 | | 936 | | 54.55 | |
| 2014 | | 2015 | | 2016 | | | Amount | | % of total finance costs | | Amount | | % of total finance costs | | Amount | | % of total finance costs | | FINANCE COSTS | | | | | | | | | | | | | Majority stockholder | | | | | | | | | | | | | The Government - Ministry of Finance | 85 | | 4.69 | | 76 | | 3.06 | | 64 | | 2.28 | | Entities under common control | | | | | | | | | | | | | State-owned banks | 830 | | 45.76 | | 1,061 | | 42.77 | | 1,228 | | 43.70 | | Total | 915 | | 50.45 | | 1,137 | | 45.83 | | 1,292 | | 45.98 | |
PERUSAHAAN PERSEROAN (PERSERO) Presented belowPT TELEKOMUNIKASI INDONESIA Tbk AND SUBSIDIARIES
NOTES TO THE CONSOLIDATED FINANCIAL STATEMENTS As of December 31, 2015 and 2016 and for the Years Ended December 31, 2014, 2015 and 2016 (Figures in tables are balancesexpressedin billions of accountsRupiah, unless otherwise stated) Table of Content
31. RELATED PARTY TRANSACTIONS(continued)
b. Transactions with related parties:parties (continued)
| | 2012 | | 2013 | | | | Amount | | % of total assets | | Amount | | % of total assets | | c. Trade receivables (Note7) | | 1,384 | | 1.26 | | 1,678 | | 1.31 | | d. d. Advances and prepaid expenses (Note 9) | | | | | | | | | | Entity under common control | | | | | | | | | | MoCI | | 2,588 | | 2.35 | | 2,349 | | 1.84 | | Others (each below Rp30 billion) | | 18 | | 0.02 | | 82 | | 0.06 | | Total | | 2,606 | | 2.37 | | 2,431 | | 1.90 | | e. e. Advances and other non-current assets (Note 13) | | | | | | | | | | Entities under common control | | | | | | | | | | BNI | | - | | - | | 52 | | 0.04 | | Others | | 14 | | 0.01 | | 11 | | 0.01 | | Associated Company Indonusa | | - | | - | | 297 | | 0.23 | | Total | | 14 | | 0.01 | | 360 | | 0.28 | |
| 2015 | | 2016 | | | Amount | | % of total property and equipment purchased | | Amount | | % of total property and equipment purchased | | PURCHASE OF PROPERTY AND EQUIPMENT (Note 10) | | | | | | | | | Entities under common control | | | | | | | | | INTI | 394 | | 1.49 | | 374 | | 1.28 | | LEN | 72 | | 0.27 | | 114 | | 0.39 | | Adhi karya | - | | - | | 39 | | 0.13 | | Sub-total | 466 | | 1.76 | | 527 | | 1.80 | | Other related entities | | | | | | | | | Kopegtel | 131 | | 0.50 | | 198 | | 0.68 | | Bangtelindo | 86 | | 0.33 | | 84 | | 0.29 | | SPM | 62 | | 0.23 | | 73 | | 0.25 | | Kisel | 73 | | 0.28 | | 66 | | 0.23 | | Gratika | 45 | | 0.17 | | 25 | | 0.09 | | Others | 12 | | 0.05 | | 20 | | 0.07 | | Sub-total | 409 | | 1.56 | | 466 | | 1.61 | | Total | 875 | | 3.32 | | 993 | | 3.41 | |
| | 2012 | | 2013 | | | | Amount | | % of total liabilities | | Amount | | % of total liabilities | | f. Trade payables (Note 15) | | | | | | | | | | Entities under common control | | | | | | | | | | MoCI | | 609 | | 1.25 | | 960 | | 1.88 | | INTI | | 197 | | 0.40 | | 115 | | 0.22 | | Yakes | | 39 | | 0.08 | | 43 | | 0.08 | | Indosat | | 31 | | 0.06 | | 17 | | 0.03 | | State-owned enterprises | | 3 | | 0.01 | | 1 | | 0.00 | | Sub-total | | 879 | | 1.80 | | 1,136 | | 2.21 | | Entity under significant influence | | | | | | | | | | Kopegtel | | 115 | | 0.24 | | 82 | | 0.16 | | Others (each below Rp30 billion) | | 47 | | 0.10 | | 570 | | 1.11 | | Total | | 1,041 | | 2.14 | | 1,788 | | 3.48 | | g. Accrued expenses (Note 16) | | | | | | | | | | Majority stockholder | | | | | | | | | | The Government | | 17 | | 0.03 | | 17 | | 0.04 | | Entity under common control | | | | | | | | | | State-owned banks | | 72 | | 0.15 | | 53 | | 0.10 | | Total | | 89 | | 0.18 | | 70 | | 0.14 | | h. Advances from customers and suppliers | | | | | | | | | | Majority stockholder | | | | | | | | | | The Government | | 64 | | 0.13 | | 19 | | 0.04 | | i. Short-term bank loans (Note 18) | | | | | | | | | | Entity under common control | | | | | | | | | | BRI | | - | | - | | 50 | | 0.09 | | BSM | | 5 | | 0.01 | | 14 | | 0.03 | | BRI Syariah | | - | | - | | 3 | | 0.01 | | Total | | 5 | | 0.01 | | 67 | | 0.13 | |
| 2014 | | 2015 | | 2016 | | | Amount | | % of totalrevenues | | Amount | | % of totalrevenue | | Amount | | % of totalrevenues | | DISTRIBUTION OF SIM CARD AND VOUCHER | | | | | | | | | | | | | Other related entities | | | | | | | | | | | | | Kisel | 3,073 | | 3.43 | | 3,866 | | 3.77 | | 4,600 | | 3.95 | | Gratika | 346 | | 0.39 | | 384 | | 0.37 | | 408 | | 0.35 | | Tiphone | - | | - | | - | | - | | 3,441 | | 2.96 | | Total | 3,419 | | 3.82 | | 4,250 | | 4.14 | | 8,449 | | 7.26 | |
F-102F-103
PERUSAHAAN PERSEROAN (PERSERO) PT TELEKOMUNIKASI INDONESIA Tbk AND SUBSIDIARIES NOTES TO THE CONSOLIDATED FINANCIAL STATEMENTS As of December 31, 2015 and 2016 and for the Years Ended December 31, 2014, 2015 and 2016 (Figures in tables are expressedin billions ofRupiah, unless otherwise stated) PERUSAHAAN PERSEROAN (PERSERO)
| PT TELEKOMUNIKASI INDONESIA Tbk AND SUBSIDIARIES
| NOTES TO THE CONSOLIDATED FINANCIAL STATEMENTS
| As of January 1, 2012 (Restated), December 31, 2012 (Restated) and December 31, 2013
| and for the years ended December 31, 2011 (Restated), 2012 (Restated) and 2013
| (Figures in tables are presented in billions of rupiah, unless otherwise stated)
|
|
TabelTable of Content
351. RELATED PARTY TRANSACTIONS(continued) b. Transactions with related parties (continued) Presented below are balances of accounts with related parties: (continued) | | 2012 | | 2013 | | | | Amount | | % of total liabilities | | Amount | | % of total liabilities | | j. Two-step loans (Note 19a) | | | | | | | | | | Majority stockholder | | | | | | | | | | The Government | | 1,987 | | 4.07 | | 1,915 | | 3.74 | | k. MTN (Note 19b) | | | | | | | | | | Entity under common control | | | | | | | | | | Bahana | | 8 | | 0.02 | | - | | - | | l. Long-term bank loans (Note 19c) | | | | | | | | | | Entity under common control | | | | | | | | | | BRI | | 4,630 | | 9.48 | | 4,043 | | 7.91 | | BNI | | 2,349 | | 4.81 | | 2,351 | | 4.60 | | Bank Mandiri | | 1,417 | | 2.90 | | 1,069 | | 2.09 | | Bank Jabar | | 175 | | 0.36 | | - | | - | | Total | | 8,571 | | 17.55 | | 7,463 | | 14.60 | |
| | 2015 | | 2016 | | | | Amount | | % of total assets | | Amount | | % of total assets | | a. | Cash and cash equivalents (Note4) | 17,106 | | 10.31 | | 19,531 | | 10.89 | | b. | Other current financial assets (Note5) | 2,574 | | 1.55 | | 1,221 | | 0.68 | | c. | Trade receivables (Note6) | 1,597 | | 0.96 | | 1,488 | | 0.83 | | d. | Advances and prepaid expenses (Note8) | | | | | | | | | | Entity under common control | | | | | | | | | | MoCI | 2,935 | | 1.77 | | 3,056 | | 1.70 | | | Others | 15 | | 0.01 | | 41 | | 0.02 | | | Sub-total | 2,950 | | 1.78 | | 3,097 | | 1.72 | | | Other related entity | | | | | | | | | | Kisel | - | | - | | 52 | | 0.03 | | | Sub-total | - | | - | | 52 | | 0.03 | | | Total | 2,950 | | 1.78 | | 3,149 | | 1.75 | | e. | Advances and other non-current assets (Note 11) | | | | | | | | | | Entity under common control | | | | | | | | | | MoCI | 404 | | 0.24 | | 320 | | 0.18 | | | INTI | - | | - | | 275 | | 0.15 | | | Others | 4 | | 0.00 | | 22 | | 0.02 | | | Sub-total | 408 | | 0.24 | | 617 | | 0.35 | | | Other associated companies | - | | - | | 7 | | 0.00 | | | Other related entities | 2 | | 0.00 | | 9 | | 0.00 | | | Total | 410 | | 0.24 | | 633 | | 0.35 | |
| | 2015 | | 2016 | | | | Amount | | % of total liabilities | | Amount | | % of total liabilities | | f. | Trade payables (Note 13) | | | | | | | | | | Entities under common control | | | | | | | | | | MoCI | 1,329 | | 1.83 | | 1,288 | | 1.74 | | | INTI | 443 | | 0.61 | | 625 | | 0.84 | | | Indosat | 295 | | 0.41 | | 275 | | 0.37 | | | LEN | 91 | | 0.13 | | 137 | | 0.18 | | | Adhi Karya | 96 | | 0.13 | | 81 | | 0.11 | | | Others | 19 | | 0.03 | | 67 | | 0.09 | | | Sub-total | 2,273 | | 3.14 | | 2,473 | | 3.33 | | | Other related entities | 1,131 | | 1.55 | | 369 | | 0.50 | | | Total | 3,404 | | 4.69 | | 2,842 | | 3.83 | |
F-104
PERUSAHAAN PERSEROAN (PERSERO) PT TELEKOMUNIKASI INDONESIA Tbk AND SUBSIDIARIES NOTES TO THE CONSOLIDATED FINANCIAL STATEMENTS As of December 31, 2015 and 2016 and for the Years Ended December 31, 2014, 2015 and 2016 (Figures in tables are expressedin billions ofRupiah, unless otherwise stated) Table of Content
31. RELATED PARTY TRANSACTIONS (continued)
b. Transactions with related parties (continued)
| | 2015 | | 2016 | | | | Amount | | % of total liabilities | | Amount | | % of total liabilities | | g. | Accrued expenses (Note 14) | | | | | | | | | | Majority stockholder | | | | | | | | | | The Government - Ministry of Finance | 16 | | 0.02 | | 12 | | 0.02 | | | Entities under common control | | | | | | | | | | PLN | 112 | | 0.16 | | 124 | | 0.17 | | | State-owned banks | 68 | | 0.09 | | 52 | | 0.07 | | | Others | 2 | | 0.00 | | 10 | | 0.01 | | | Sub-total | 182 | | 0.25 | | 186 | | 0.25 | | | Other related entities | | | | | | | | | | Kisel | 188 | | 0.26 | | 118 | | 0.16 | | | Others | - | | - | | 5 | | 0.01 | | | Sub-total | 188 | | 0.26 | | 123 | | 0.17 | | | Total | 386 | | 0.53 | | 321 | | 0.44 | | h. | Advances from customers and suppliers | | | | | | | | | | Majority stockholder | | | | | | | | | | The Government - Ministry of Finance | 19 | | 0.03 | | 19 | | 0.03 | | | Entity under common control | | | | | | | | | | PLN | - | | - | | 12 | | 0.02 | | | Total | 19 | | 0.03 | | 31 | | 0.05 | | i. | Short-term bank loans (Note16) | 25 | | 0.03 | | 143 | | 0.19 | | j. | Two-step loans (Note 17a) | 1,520 | | 2.09 | | 1,292 | | 1.74 | | k. | Long-term bank loans (Note 17c) | 7,427 | | 10.21 | | 6,325 | | 8.54 | | l. | Other borrowing (Note 17d) | - | | - | | 697 | | 0.94 | |
F-105
PERUSAHAAN PERSEROAN (PERSERO) PT TELEKOMUNIKASI INDONESIA Tbk AND SUBSIDIARIES NOTES TO THE CONSOLIDATED FINANCIAL STATEMENTS As of December 31, 2015 and 2016 and for the Years Ended December 31, 2014, 2015 and 2016 (Figures in tables are expressedin billions ofRupiah, unless otherwise stated) Table of Content
31. RELATED PARTY TRANSACTIONS (continued) c. Significant agreements with related parties i. The Government The Company obtained two-step loans from the Government (Note 19a)17a). ii. Indosat The Company has an agreement with Indosat for the provision ofto provide international telecommunications services to the public. The Company has also entered into an interconnection agreement between the Company’sCompany’s fixed line network (Public Switched Telephone Network or “PSTN”“PSTNâ€) and Indosat’sIndosat’s GSM mobile cellular telecommunications network in connection with the implementation of the Indosat Multimedia Mobile services and the settlement of the related interconnection rights and obligations. The Company also has an agreement with Indosat for the interconnection of Indosat's GSM mobile cellular telecommunications network with the Company's PSTN, enabling each party’swhich enableeach party’s customers to make domestic calls between Indosat’sIndosat’s GSM mobile network and the Company’sCompany’s fixed line network, and allowing Indosat’sas well asallowing Indosat’s mobile customers to access the Company’sCompany’s IDD service by dialing “007”“007â€. The Company has been handling customer billings and collections for Indosat. Indosat is gradually taking over the activities and performing its own direct billing and collection. The Company receiveshas received compensation from Indosat computed at 1% of the collections made by the Company beginningCompanystarting from January 1, 1995, plusas well as the billing process expenses which are fixed at a certain amount per record. On December 11, 2008, the Company and Indosat agreed to implement IDD service charge tariff which already takestook into account the compensation for its billing and collection. The agreement is valid and effective starting onfrom January to December 2012, and can be applied until a new agreement becomes available.
F-103
PERUSAHAAN PERSEROAN (PERSERO)
| PT TELEKOMUNIKASI INDONESIA Tbk AND SUBSIDIARIES
| NOTES TO THE CONSOLIDATED FINANCIAL STATEMENTS
| As of January 1, 2012 (Restated), December 31, 2012 (Restated) and December 31, 2013
| and for the years ended December 31, 2011 (Restated), 2012 (Restated) and 2013
| (Figures in tables are presented in billions of rupiah, unless otherwise stated)
|
|
Tabel of Content
35. RELATED PARTY TRANSACTIONS(continued)
c. Significant agreements with related parties (continued)
ii. Indosat (continued)
On December 28, 2006, the Company and Indosat signed amendments to the interconnection agreements for the fixed line networks (local, SLJJ and international) and mobile network for the implementation of the cost-based tariff obligations under the MoCI Regulation No.8/Year 2006. These amendments took effect starting on January 1, 2007. Telkomsel also entered into an agreement with Indosat for the provision of international telecommunications services to its GSM mobile cellular customers. The Company provides leased lines to Indosat and its subsidiaries, namely PT Indosat Mega Media and Lintasarta. The leased lines can be used by these companies for telephone, telegraph, data, telex, facsimile or other telecommunication services. iii. Others The Company has entered into agreements with associated companies, namely CSM PSN and Gratika for the utilization of the Company's satellite transponders or frequency channels of communication satellite and leased lines. Telkomsel has an agreement with PSN for the lease of PSN’s transmission link. Based on the agreement, which was made on March 14, 2001, the minimum lease period is 2 years since the operation of the transmission link and is extendable subject to agreement by both parties.
F-106
PERUSAHAAN PERSEROAN (PERSERO) PT TELEKOMUNIKASI INDONESIA Tbk AND SUBSIDIARIES NOTES TO THE CONSOLIDATED FINANCIAL STATEMENTS As of December 31, 2015 and 2016 and for the issuance date Years Ended December 31, 2014, 2015 and 2016 (Figures in tables are expressedin billions ofRupiah, unless otherwise stated) Table of the consolidated financial statements, the extension is still in process.Content
31. RELATED PARTY TRANSACTIONS (continued)
c. Significant agreements with related parties (continued) iii. Others (continued) Kisel is a cooperativeco-operative that was established by Telkomsel’sTelkomsel’s employees to engage in car rental services, printing and distribution of customer bills, collection and other services principally for the benefit of Telkomsel. Telkomsel also has dealership agreements with Kisel for distribution of SIM cards and pulse reload vouchers. d. BoardsRemuneration of the Board of Commissioners and key management personnel remuneration BoardsThe Company provides remuneration in the form of Commissioners and key management personnel consist of the Boards of Commissioners and Directors of the Group.
The Group provides salaries/honorarium and facilities to support the oversightgovernance and governanceoversight duties of the Board of Commissioners and short-term employment benefits in the form of salariesleadership and facilities to support the operationalmanagement duties of the Board of Directors. The total of such benefitsremuneration is as follows:
| | 2011 | | 2012 | | 2013 | | 2014 | | 2015 | | 2016 | | | | Amount | | % of total expense | | Amount | | % of total expense | | Amount | | % of total expense | | Amount | | % of total expenses | | Amount | | % of total expenses | | Amount | | % of total expenses | | Board of Directors | | 181 | | 0.36% | | 252 | | 0.49% | | 354 | | 0.62% | | 262 | | 0.43% | | 168 | | 0.24% | | 427 | | 0.57% | | Board of Commissioners | | 57 | | 0.11% | | 61 | | 0.12% | | 106 | | 0.19% | | 75 | | 0.12% | | 64 | | 0.09% | | 121 | | 0.16% | |
The amounts disclosed in the table are the amounts recognized as an expense during the reporting periods.
F-104
PERUSAHAAN PERSEROAN (PERSERO)3
| PT TELEKOMUNIKASI INDONESIA Tbk AND SUBSIDIARIES
| NOTES TO THE CONSOLIDATED FINANCIAL STATEMENTS
| As of January 1, 2012 (Restated), December 31, 2012 (Restated) and December 31, 2013
| and for the years ended December 31, 2011 (Restated), 2012 (Restated) and 2013
| (Figures in tables are presented in billions of rupiah, unless otherwise stated)
| |
Tabel of Content
362. SEGMENT INFORMATION
In 2012, management decided to change the way it manages the Group's business portfolios from a product-based approach to a customer-centric approach, as part of the Group’s strategy to provide a one-stop solution to its customers. This resulted in a change in the Group’s organizational structure to accommodate decision making and performance assessment based on a customer – centric approach. Consequently, the segment financial information presented to the Group’s Chief Operational Decision Maker was amended facilitate decision making on the new segments. The segment information for the year ended December 31, 2011 has been restated to conform with the presentation of segment information for the year ended December 31, 2012.
The Group has four main operating segments, namely personal,corporate, home, corporatepersonal and others. The personal segment provides mobile cellular and fixed wireless telecommunications services to individual customers. The home segment provides fixed wireline telecommunications services, pay TV, data and internet services to home customers. The corporate segment provides telecommunications services, including interconnection, leased lines, satellite, VSAT, contact center, broadband access, information technology services, data and internet services to companies and institutions. The home segment provides fixed wireline telecommunications services, pay TV, data and internet services to home customers. The personal segment provides mobile cellular and fixed wireless telecommunications services to individual customers. Operating segments that are not monitored separately bytheChiefby the Chief Operation Decision Maker are presented as "Others", which providesprovide building management services.
No operating segments have been aggregated to form the operating segments of personal, home and others, while corporate operating segment is aggregated from business, enterprise, wholesale and international operating segments since they have the similar economic characteristics and similar in other qualitative criteria such as providing similar network services and serving corporate customers.
F-107
PERUSAHAAN PERSEROAN (PERSERO) PT TELEKOMUNIKASI INDONESIA Tbk AND SUBSIDIARIES NOTES TO THE CONSOLIDATED FINANCIAL STATEMENTS As of December 31, 2015 and 2016 and for the Years Ended December 31, 2014, 2015 and 2016 (Figures in tables are expressedin billions ofRupiah, unless otherwise stated) Table of Content
32. SEGMENT INFORMATION (continued) Management monitors the operating results of the business units separately for the purpose of making decisions about resource allocation and performance assessment. Segment performance is evaluated based on operating profit or loss and is measured onmeasuredon the basis of Indonesian Financial Accounting Standards which differ significantly from IFRS primarily in the accounting for land rights and employee benefits.rights. However, the financing activities and income taxes are managed on a group basis and not separately monitored and are not allocated to operating segments. Segment revenues and expenses include transactions between operating segmentsbetweenoperatingsegments and are accounted atpricesaccountedforat prices that Managementmanagement believes represent marketprices. market prices. | | 2011 | | 2014 | | | | Corporate | | Home | | Personal | | Others | | Total before Elimination | | Elimination | | Total Consolidated | | IFRS Reconciliation (Restated) | | IFRS Balance (Restated) | | Corporate | | Home | | Personal | | Others | | Total before elimination | | Elimination | | Total consolidated | | IFRS reconciliation | | IFRS balance | | Segment results | | | | | | | | | | | | | | | | | | | | | | | | | | | | | | | | | | | | | | Revenues | | | | | | | | | | | | | | | | | | | | | | | | | | | | | | | | | | | | | | External revenues | | 14,279 | | 8,171 | | 48,733 | | 70 | | 71,253 | | - | | 71,253 | | (15 | ) | 71,238 | | 18,763 | | 6,682 | | 64,000 | | 251 | | 89,696 | | - | | 89,696 | | - | | 89,696 | | Inter-segment revenues | | 5,289 | | 1,888 | | 2,180 | | 350 | | 9,707 | | (9,707 | ) | - | | - | | - | | 10,652 | | 2,667 | | 2,686 | | 1,632 | | 17,637 | | (17,637 | ) | - | | - | | - | | Total segment revenues | | 19,568 | | 10,059 | | 50,913 | | 420 | | 80,960 | | (9,707 | ) | 71,253 | | (15 | ) | 71,238 | | 29,415 | | 9,349 | | 66,686 | | 1,883 | | 107,333 | | (17,637 | ) | 89,696 | | - | | 89,696 | | Expenses | | | | | | | | | | | | | | | | | | | | | | | | | | | | | | | | | | | | | | External expenses | | (12,362 | ) | (6,408 | ) | (29,999 | ) | (526 | ) | (49,295 | ) | - | | (49,295 | ) | 91 | | (49,204 | ) | (16,014 | ) | (5,407 | ) | (37,243 | ) | (1,655 | ) | (60,319 | ) | - | | (60,319 | ) | (205 | ) | (60,524 | ) | Inter-segment expenses | | (3,297 | ) | (1,914 | ) | (4,680 | ) | 184 | | (9,707 | ) | 9,707 | | - | | | - | - | | (6,561 | ) | (3,487 | ) | (7,526 | ) | (63 | ) | (17,637 | ) | 17,637 | | - | | - | | - | | Total segment expenses | | (15,659 | ) | (8,322 | ) | (34,679 | ) | (342 | ) | (59,002 | ) | 9,707 | | (49,295 | ) | 91 | | (49,204 | ) | (22,575 | ) | (8,894 | ) | (44,769 | ) | (1,718 | ) | (77,956 | ) | 17,637 | | (60,319 | ) | (205 | ) | (60,524 | ) | Segment results | | 3,909 | | 1,737 | | 16,234 | | 78 | | 21,958 | | - | | 21,958 | | 76 | | 22,034 | | 6,840 | | 455 | | 21,917 | | 165 | | 29,377 | | - | | 29,377 | | (205 | ) | 29,172 | | Other information | | | | | | | | | | | | | | | | | | | | | | | | | | | | | | | | | | | | | | Segment assets | | 26,842 | | 16,893 | | 62,368 | | 390 | | 106,493 | | (4,465 | ) | 102,028 | | (688 | ) | 101,340 | | | Assets held for sale | | - | | - | | 791 | | - | | 791 | | - | | 791 | | - | | 791 | | | Long-term investments | | 214 | | - | | 21 | | - | | 235 | | - | | 235 | | - | | 235 | | | Total consolidated assets | | 27,056 | | 16,893 | | 63,180 | | 390 | | 107,519 | | (4,465 | ) | 103,054 | | (688 | ) | 102,366 | | | Capital expenditures | | (4,390 | ) | (1,529 | ) | (8,684 | ) | (45 | ) | (14,648 | ) | - | | (14,648 | ) | 94 | | (14,554 | ) | (7,312 | ) | (3,529 | ) | (13,200 | ) | (620 | ) | (24,661 | ) | - | | (24,661 | ) | - | | (24,661 | ) | Depreciation and amortization | | (1,890 | ) | (1,389 | ) | (11,007 | ) | (14 | ) | (14,300 | ) | - | | (14,300 | ) | 40 | | (14,260 | ) | (2,699 | ) | (1,495 | ) | (12,071 | ) | (61 | ) | (16,326 | ) | - | | (16,326 | ) | (47 | ) | (16,373 | ) | Impairment of assets | | - | | - | | (563 | ) | - | | (563 | ) | - | | (563 | ) | - | | (563 | ) | - | | - | | (805 | ) | - | | (805 | ) | - | | (805 | ) | - | | (805 | ) | Provision for impairment of receivables | | (255 | ) | (454 | ) | (174 | ) | - | | (883 | ) | - | | (883 | ) | - | | (883 | ) | | Provision recognized in current period | | (184 | ) | (467 | ) | (133 | ) | - | | (784 | ) | - | | (784 | ) | - | | (784 | ) |
| 2015 | | | Corporate | | Home | | Personal | | Others | | Total before elimination | | Elimination | | Total consolidated | | IFRS reconciliation | | IFRS balance | | Segment results | | | | | | | | | | | | | | | | | | | Revenues | | | | | | | | | | | | | | | | | | | External revenues | 21,072 | | 7,319 | | 73,766 | | 313 | | 102,470 | | - | - | 102,470 | | - | | 102,470 | | Inter-segment revenues | 14,347 | | 4,352 | | 2,365 | | 1,943 | | 23,007 | | (23,007 | ) | - | | - | | - | - | Total segment revenues | 35,419 | | 11,671 | | 76,131 | | 2,256 | | 125,477 | | (23,007 | ) | 102,470 | | - | | 102,470 | | Expenses | | | | | | | | | | | | | | | | | | | External expenses | (20,239 | ) | (6,705 | ) | (41,130 | ) | (1,978 | ) | (70,052 | ) | - | - | (70,052 | ) | (49 | ) | (70,101 | ) | Inter-segment expenses | (8,066 | ) | (4,706 | ) | (10,173 | ) | (62 | ) | (23,007 | ) | 23,007 | | - | - | - | | - | - | Total segment expenses | (28,305 | ) | (11,411 | ) | (51,303 | ) | (2,040 | ) | (93,059 | ) | 23,007 | | (70,052 | ) | (49 | ) | (70,101 | ) | Segment results | 7,114 | | 260 | | 24,828 | | 216 | | 32,418 | | - | - | 32,418 | | (49 | ) | 32,369 | | Other information | | | | | | | | | | | | | | | | | | | Capital expenditures | (10,007 | ) | (4,172 | ) | (11,321 | ) | (901 | ) | (26,401 | ) | - | - | (26,401 | ) | - | | (26,401 | ) | Depreciation and amortization | (2,708 | ) | (1,203 | ) | (14,531 | ) | (92 | ) | (18,534 | ) | - | - | (18,534 | ) | (38 | ) | (18,572 | ) | Provision recognized in current period | (560 | ) | (297 | ) | (148 | ) | (5 | ) | (1,010 | ) | - | - | (1,010 | ) | - | | (1,010 | ) |
F-105F-108
PERUSAHAAN PERSEROAN (PERSERO) PT TELEKOMUNIKASI INDONESIA Tbk AND SUBSIDIARIES NOTES TO THE CONSOLIDATED FINANCIAL STATEMENTS As of December 31, 2015 and 2016 and for the Years Ended December 31, 2014, 2015 and 2016 (Figures in tables are expressedin billions ofRupiah, unless otherwise stated) PERUSAHAAN PERSEROAN (PERSERO)
| PT TELEKOMUNIKASI INDONESIA Tbk AND SUBSIDIARIES
| NOTES TO THE CONSOLIDATED FINANCIAL STATEMENTS
| As of January 1, 2012 (Restated), December 31, 2012 (Restated) and December 31, 2013
| and for the years ended December 31, 2011 (Restated), 2012 (Restated) and 2013
| (Figures in tables are presented in billions of rupiah, unless otherwise stated)
|
|
TabelTable of Content
3632. SEGMENT INFORMATION (continued)
| | 2012 | | 2016 | | | | Corporate | | Home | | Personal | | Others | | Total before Elimination | | Elimination | | Total Consolidated | | IFRS Reconciliation (Restated) | | IFRS Balance (Restated) | | Corporate | | Home | | Personal | | Others | | Total before elimination | | Elimination | | Total consolidated | | IFRS reconciliation | | IFRS balance | | Segment results | | | | | | | | | | | | | | | | | | | | | | | | | | | | | | | | | | | | | | Revenues | | | | | | | | | | | | | | | | | | | | | | | | | | | | | | | | | | | | | | External revenues | | 15,579 | | 7,360 | | 54,087 | | 117 | | 77,143 | | - | | 77,143 | | (16 | ) | 77,127 | | 24,177 | | 7,803 | | 83,990 | | 363 | | 116,333 | | - | | 116,333 | | - | | 116,333 | | Inter-segment revenues | | 6,468 | | 2,223 | | 2,188 | | 648 | | 11,527 | | (11,527 | ) | - | | - | | - | | 32,675 | | 5,077 | | 2,724 | | 2,395 | | 42,871 | | (42,871 | ) | - | | - | | - | - | Total segment revenues | | 22,047 | | 9,583 | | 56,275 | | 765 | | 88,670 | | (11,527 | ) | 77,143 | | (16 | ) | 77,127 | | 56,852 | | 12,880 | | 86,714 | | 2,758 | | 159,204 | | (42,871 | ) | 116,333 | | - | | 116,333 | | Expenses | | | | | | | | | | | | | | | | | | | | | | | | | | | | | | | | | | | | | | External expenses | | (13,961 | ) | (5,646 | ) | (31,169 | ) | (669 | ) | (51,445 | ) | - | | (51,445 | ) | (185 | ) | (51,630 | ) | (26,014 | ) | (10,201 | ) | (38,800 | ) | (2,123 | ) | (77,138 | ) | - | | (77,138 | ) | (23 | ) | (77,161 | ) | Inter-segment expenses | | (4,015 | ) | (2,293 | ) | (5,203 | ) | (16 | ) | (11,527 | ) | 11,527 | | - | | - | | - | | (22,331 | ) | (2,375 | ) | (12,503 | ) | (426 | ) | (37,635 | ) | 37,635 | | - | | - | | - | | Total segment expenses | | (17,976 | ) | (7,939 | ) | (36,372 | ) | (685 | ) | (62,972 | ) | 11,527 | | (51,445 | ) | (185 | ) | (51,630 | ) | (48,345 | ) | (12,576 | ) | (51,303 | ) | (2,549 | ) | (114,773 | ) | 37,635 | | (77,138 | ) | (23 | ) | (77,161 | ) | Segment results | | 4,071 | | 1,644 | | 19,903 | | 80 | | 25,698 | | - | | 25,698 | | (201 | ) | 25,497 | | 8,507 | | 304 | | 35,411 | | 209 | | 44,431 | | (5,236 | ) | 39,195 | | (23 | ) | 39,172 | | Other information | | | | | | | | | | | | | | | | | | | | | | | | | | | | | | | | | | | | | | Segment assets | | 30,458 | | 17,780 | | 67,216 | | 611 | | 116,065 | | (4,971 | ) | 111,094 | | (1,158 | ) | 109,936 | | | Long-term investments | | 254 | | - | | 21 | | - | | 275 | | - | | 275 | | - | | 275 | | | Total consolidated assets | | 30,712 | | 17,780 | | 67,237 | | 611 | | 116,340 | | (4,971 | ) | 111,369 | | (1,158 | ) | 110,211 | | | Capital expenditures | | (4,375 | ) | (2,083 | ) | (10,664 | ) | (150 | ) | (17,272 | ) | - | | (17,272 | ) | - | | (17,272 | ) | (11,419 | ) | (4,437 | ) | (12,565 | ) | (778 | ) | (29,199 | ) | - | | (29,199 | ) | - | | (29,199 | ) | Depreciation and amortization | | (2,079 | ) | (1,168 | ) | (10,940 | ) | (22 | ) | (14,209 | ) | - | | (14,209 | ) | (18 | ) | (14,227 | ) | (4,148 | ) | (1,711 | ) | (12,549 | ) | (124 | ) | (18,532 | ) | - | | (18,532 | ) | (24 | ) | (18,556 | ) | Impairment of assets | | - | | - | | (247 | ) | | - | (247 | ) | | - | (247 | ) | - | | (247 | ) | | Provision for impairment of receivables | | (92 | ) | (505 | ) | (318 | ) | - | | (915 | ) | - | | (915 | ) | - | | (915 | ) | | Provision recognized in current period | | (87 | ) | (424 | ) | (222 | ) | (10 | ) | (743 | ) | - | | (743 | ) | - | | (743 | ) |
Geographic information: | | 2013 | | | | Corporate | | Home | | Personal | | Others | | Total before Elimination | | Elimination | | Total Consolidated | | IFRS Reconciliation | | IFRS Balance | | Segment results | | | | | | | | | | | | | | | | | | | | Revenues | | | | | | | | | | | | | | | | | | | | External revenues | | 17,041 | | 6,669 | | 59,028 | | 229 | | 82,967 | | - | | 82,967 | | - | | 82,967 | | Inter-segment revenues | | 8,549 | | 2,794 | | 2,358 | | 909 | | 14,610 | | (14,610 | ) | - | | - | | - | | Total segment revenues | | 25,590 | | 9,463 | | 61,386 | | 1,138 | | 97,577 | | (14,610 | ) | 82,967 | | - | | 82,967 | | Expenses | | | | | | | | | | | | | | | | | | | | External expenses | | (15,211 | ) | (5,939 | ) | (32,991 | ) | (980 | ) | (55,121 | ) | | - | (55,121) | | (119 | ) | (55,240 | ) | Inter-segment expenses | | (5,164 | ) | (2,946 | ) | (6,472 | ) | (28 | ) | (14,610 | ) | 14,610 | | - | | | - | - | | Total segment expenses | | (20,375 | ) | (8,885 | ) | (39,463 | ) | (1,008 | ) | (69,731 | ) | 14,610 | | (55,121) | | (119 | ) | (55,240 | ) | Segment results | | 5,215 | | 578 | | 21,923 | | 130 | | 27,846 | | - | | 27,846 | | (119 | ) | 27,727 | | Other information | | | | | | | | | | | | | | | | | | | | Segment assets | | 39,718 | | 18,992 | | 75,604 | | 1,571 | | 135,885 | | (8,343 | ) | 127,542 | | (155 | ) | 127,387 | | Asset held-for-sale | | - | | - | | 105 | | - | | 105 | | - | | 105 | | - | | 105 | | Long-term investments | | 182 | | 101 | | 21 | | - | | 304 | | - | | 304 | | - | | 304 | | Total consolidated assets | | 39,900 | | 19,093 | | 75,730 | | 1,571 | | 136,294 | | (8,343 | ) | 127,951 | | (155 | ) | 127,796 | | Capital expenditures | | (6,237 | ) | (2,340 | ) | (15,662 | ) | (659 | ) | (24,898 | ) | | - | (24,898 | ) | - | | (24,898 | ) | Depreciation and amortization | | (2,423 | ) | (1,487 | ) | (11,234 | ) | (40 | ) | (15,184 | ) | - | | (15,184 | ) | (25 | ) | (15,209 | ) | Impairment of assets | | - | | - | | (596 | ) | - | | (596 | ) | - | | (596 | ) | | - | (596 | ) | Provision for impairment of receivables | | (994 | ) | (390 | ) | (202 | ) | (3 | ) | (1,589 | ) | | - | (1,589 | ) | - | | (1,589 | ) |
| 2014 | | 2015 | | 2016 | | External revenues | | | | | | | Indonesia | 87,896 | | 100,456 | | 114,093 | | Foreign countries | 1,800 | | 2,014 | | 2,240 | | Total | 89,696 | | 102,470 | | 116,333 | |
TheGrouppredominantly generatesThe revenue and profit within Indonesia. Revenue with respect to international interconnections and assets held by geographicalinformation above is based on the location are disclosed in Note 26 and Note 1, respectively.of the customers.
There is no revenue from major customer which exceeds 10% of total revenues for the year ended December 31, 2016. F-106
PERUSAHAAN PERSEROAN (PERSERO)
| PT TELEKOMUNIKASI INDONESIA Tbk AND SUBSIDIARIES
| NOTES TO THE CONSOLIDATED FINANCIAL STATEMENTS
| As of January 1, 2012 (Restated), December 31, 2012 (Restated) and December 31, 2013
| and for the years ended December 31, 2011 (Restated), 2012 (Restated) and 2013
| (Figures in tables are presented in billions of rupiah, unless otherwise stated)
|
|
| 2014 | | 2015 | | 2016 | | Non-current operating assets | | | | | | | Indonesia | 95,920 | | 105,116 | | 114,948 | | Foreign countries | 1,145 | | 1,395 | | 2,371 | | Total | 97,065 | | 106,511 | | 117,319 | |
TabelNon-current operating assets for this purpose consist of Content
37. RSA
The Company has entered into separate agreements with several investors under RSA to develop fixed lines, public card-phone booths, data and internet network, and related supporting telecommunications facilities.
As of December 31, 2013, the Company has 4 RSA’s with 4 investors. The RSA’s are located in East Java, Makassar, Pare-pare, Manado, Denpasar, Mataram and Kupang, with concession periods ranging from 129 to 148 months.
Under the RSA, the investors finance the costs incurred in developing the telecommunications facilities and the Company manages and operates the telecommunications facilities upon the completion of the constructions. Repairs and maintenance costs during RSA period are borne jointly by the Company and investors. The investors legally retain the rights to the property and equipment constructed by them during the RSA periods. At the end of the RSA period, the investors transfer the ownership of the telecommunication facilities to the Company at a nominal price.
Generally, the revenues earned in the form of line installation charges, outgoing telephone pulses and monthly subscription charges are shared between the Company and investors based on certain agreed amount and/or ratio.intangible assets.
383. SIGNIFICANT COMMITMENTS AND AGREEMENTS a. Capital expenditures As of DecemberofDecember 31, 2013,2016, capital expenditures committed under the contractual arrangements, principally relating to procurement and installation of switching equipment,data, internet and information technology, cellular, transmission equipment and cable network are as follows: Currencies | | Amounts in foreign currencies (in millions) | | Equivalent in rupiah | | | Amounts in foreign currencies (in millions) | | Equivalent in Rupiah | | Rupiah | | - | | 10,404 | | | - | | 7,210 | | U.S. dollar | | 660 | | 8,043 | | | 341 | | 4,600 | | JPY | | 58 | | 7 | | | Euro | | 0.3 | | 5 | | | 0.16 | | 2 | | SGD | | 0.2 | | 2 | | | Total | | | | 18,461 | | | | | 11,812 | |
F-107F-109
PERUSAHAAN PERSEROAN (PERSERO) PT TELEKOMUNIKASI INDONESIA Tbk AND SUBSIDIARIES NOTES TO THE CONSOLIDATED FINANCIAL STATEMENTS As of December 31, 2015 and 2016 and for the Years Ended December 31, 2014, 2015 and 2016 (Figures in tables are expressedin billions ofRupiah, unless otherwise stated) PERUSAHAAN PERSEROAN (PERSERO)
| PT TELEKOMUNIKASI INDONESIA Tbk AND SUBSIDIARIES
| NOTES TO THE CONSOLIDATED FINANCIAL STATEMENTS
| As of January 1, 2012 (Restated), December 31, 2012 (Restated) and December 31, 2013
| and for the years ended December 31, 2011 (Restated), 2012 (Restated) and 2013
| (Figures in tables are presented in billions of rupiah, unless otherwise stated)
|
|
TabelTable of Content
383. SIGNIFICANT COMMITMENTS AND AGREEMENTS (continued) a. Capital expenditures (continued) The above balance includes the following significant agreements:
(i) The Company (i)The Company
Contracting parties |
| Initial date of agreement |
| NatureSignificant provisions of transactionthe agreement
|
| The Company and Sansaine Huawei ConsortiumPT Cisco Technologies Indonesia | | August 3, 2009
| November 14, 2013 | Procurement and installation agreement for Softswitchof WIFI CISCO | The Company and modernization of MSAN Divre I, Divre II, Divre III and Divre IVThales Alenia Space France | July 14, 2014 | Procurement of Telkom-3 Substitution (T3S) Satellite System | The Company and PTHuawei Tech Investment | October 23, 2014 | Procurement and installation of Access Point Indonesia WIFI Platform Huawei | The Company, Telkom Malaysia Berhad, TII, Alcatel-Lucent Submarine Networks and NEC Corporation | January 30, 2015 | Procurement and installation of Southeast Asia - Middle East - Western Europe 5 Cable System
(SEA - ME - WE 5) | The Company and PT ZTE Indonesia | | September 4, 2009
| August 28, 2015 | Procurement and installation agreement for modernization of MSAN Softswitch Divre VI and Divre VII | modernization for acceleration of the disposal of copper wire Platform ZTE | The Company and PT ZTE IndonesiaDatacomm Diangraha | | October 6, 2010
| November 20, 2015 | Procurement and installation agreement for Gigabit Capable Passive Optical Network (G-PON)Metro Ethernet Platform ALU | The Company and PT Sarana Global Indonesia | December 31, 2015 | Procurement and installation of Sistem Komunikasi Kabel Laut (“SKKLâ€) Sibolga-Nias, Batam-Tanjung Balai Karimun, Larantuka-Kabalahi-Atambua | The Company and PT Industri Telekomunikasi Indonesia | December 29, 2015 | December 30, 2010
| | ProcurementRenewal agreement of procurement and installation agreement for the modernization of copper wire access modernizationcable network through optimalization of asset copper cable network through Trade In/Trade Off method
| | The Company and PT Lintas Teknologi IndonesiaLen Industri (Persero) | December 29, 2015 | June 8, 2011
| | ProcurementRenewal agreement of procurement and installation agreement for DWDM Alcatel Lucent (ALU)
| the modernization of copper cable network through optimalization of asset copper cable network through Trade In/Trade Off method | The Company and G-Pas ConsortiumSpace System/Loral, LLC | | June 14, 2011
| February 29, 2016 | Procurement and installation agreement for Outside Plant Fiber Optic (OSP-FO) Access and RMJ GPAS | of Telkom 4 Satellite System | The Company and Mandiri Maju ConsortiumNEC Corporation | May 12, 2016 | June 14, 2011
| | Procurement and installation agreement for OSP-FO Access & RMJ | of SKKLIndonesia Global Gateway | The Company and PT QDC TechnologiesMastersystem Infotama | October24,2016 | June 14, 2011
| | Procurement and installation agreement for OSP-FO Access and RMJ
| ProcurementofExpand IP Backbone 2016 | The Company and TEKKEN-DMT ConsortiumSpace Exploration Technologies Corp | November3,2016 | June 14, 2011
| | Procurement and installation agreement for OSP-FO Access and RMJ
| | The Company and DJAFa Consortium
| | June 14, 2011
| | Procurement and installation agreement for OSP-FO Access and RMJ
| | The Company and PT Telekomindo Primakarya
| | June 14, 2011
| | Procurement and installation agreement for OSP-FO Access and RMJ
| | The Company and PT Nasio Karya Pratama
| | June 14, 2011
| | Procurement and installation agreement for OSP-FO Access and RMJ
| | The Company and Jembo Kabel-Tridayasa Consortium
| | June 14, 2011
| | Procurement and installation agreement for OSP-FO Access and RMJ
| | The Company and Pancamas Consortium
| | June 14, 2011
| | Procurement and installation agreement for OSP-FO Access and RMJ
| | The Company and PT Ardhinusa Mitratel
| | June 14, 2011
| | Procurement and installation agreement for OSP-FO Access and RMJ
| | The Company and PT Karya Mitra Nugraha
| | June 14, 2011
| | Procurement and installation agreement for OSP-FO Access and RMJ
| | The Company and PT Merbau Prima Sakti
| | June 14, 2011
| | Procurement and installation agreement for OSP-FO Access and RMJ
| | The Company and PT Huawei Tech Investment
| | October 11, 2011
| | Procurement and installation agreement for IMS (IP-Multimedia System)
| | The Company and PT Bina Nusantara Perkasa
| | December 9, 2011
| | Procurement and installation agreement for “Sistem Komunikasi Kabel Laut” (“SKKL”) Sumatera-Bangka (SBCS) and SKKL Tarakan-Tanjung Selor (TSCS)
| |
F-108
PERUSAHAAN PERSEROAN (PERSERO)
| PT TELEKOMUNIKASI INDONESIA Tbk AND SUBSIDIARIES
| NOTES TO THE CONSOLIDATED FINANCIAL STATEMENTS
| AsLaunch services of January 1, 2012 (Restated), December 31, 2012 (Restated) and December 31, 2013
| and for the years ended December 31, 2011 (Restated), 2012 (Restated) and 2013
| (Figures in tables are presented in billions of rupiah, unless otherwise stated)
|
|
Tabel of Content
38. SIGNIFICANT COMMITMENTS AND AGREEMENTS (continued)
a. Capital expenditures (continued)
(i)The Company (continued)
Contracting parties
|
| Initial date of agreement
|
| Nature of transaction
| The Company and PT Multipolar Technology
| | December 29, 2011
| | Procurement and installation agreement for Telkom Cache4 Satellite System
| The Company and PT Huawei Tech Investment | | January 5, 2012
| November25,2016 | Procurement and installation agreement for ISP WDM SBCS JASUKA | The Company and PT Ericsson Indonesia-PT Infracell Nusatama
| | February 8, 2012
| | Procurement and installation agreement for IMS
| The Company and PT Len Industri (Persero)
| | March 29, 2012
| | Procurement and installation agreement for copper wire access modernization through Trade In/Trade Off method
| The Company and PT Sisindokom Lintasbuana
| | July 4, 2012
| | Procurement and installation agreement for managed WIFI for Program of Indonesia WIFI Package-1
| The Company and PT Ketrosden Triasmitra - PT Nautic Maritime Salvage
| | August 30, 2012
| | Procurement and installation agreement for SKKL Luwuk-Tutuyan Cable System (LTCS)
| The Company and Furukawa and Partners Consortium
| | November 14, 2012
| | Procurement and installation of Outside Plant Fiber To The Home (OSP FTTH) DIVA Regional V and VII
| The Company and INTI-Huawei Consortium
| | November 14, 2012
| | Procurement and installation of OSP FTTH DIVA Regional III, IV and VI
| The Company and JF DJAFA Consortium
| | November 14, 2012
| | Procurement and installation agreement for OSP FTTH DIVA Regional II
| The Company and PT Mastersystem Infotama
| | December 5, 2012
| | Procurement and installation agreement for IP Backbone (IPBB) System
| The Company and Binainfo Lokatara Consortium
| | December 7, 2012
| | Procurement and installation agreement for Wireless Access Gateway (WAG), Policy and Charging Enforcement
Function (PCEF) and Policy and Chargingrule Function (PCRF) Platform Ericsson
| The Company and PT Huawei Tech Investment
| | December 20, 2012
| | Procurement and installation agreement for WAG, PCEF and PCRF Huawei
| The Company and PT Infra Karya Pratama
| | December 28, 2012
| | Procurement and installation agreement for managed WIFI for Program of Indonesia WIFI Package-2
| The Company and ASN - PT Lintas Consortium
| | May 6, 2013
| | Procurement and installation agreement of Sulawesi Maluku Papua Cable System (SMPCS) project
| The Company and PT Sisindokom Lintasbuana
| | May 8, 2013
| | Procurement and installation agreement for expansion of PE-VPN CISCO
| The Company and NEC Corp - PT NEC Indonesia Consortium
| | May 28, 2013
| | Procurement and installation of SMPCS package-2
| The Company and PT Huawei Tech Investment
| | June 3, 2013
| | Procurement and installation agreement for expansion of Metro EthernetDWDM Platform Huawei
| The Company and PT Datacomm DiangrahaZTE Indonesia | | June 26, 2013
| December 15, 2016 | Procurement and installation agreement for expansion of Maintenance Support (MS) Service for Metro EthernetSTB Platform ALUZTE | The Company and PT NECZTE Indonesia | | July 8, 2013
| December 15, 2016 | Procurement for ONT Retail Platform ZTE | The Company, PT Sigma Cipta Caraka, PT Graha Sarana Duta and installation agreement for expansion of PE-Speedy and redirectorPT Huawei Tech Investment | December 29, 2016 | Agreement establishing IOC-N | The Company and PT Lintas Teknologi IndonesiaLancs Arche Consumma | | July 22, 2013
| December 30, 2016 | Procurement and installation agreement for reengineering and expansion of DWDN platform ALU | The Company and NEC Corporation
| | October 2, 2013
| | Procurement and installation agreement for expansion of Ring Capacity of Surabaya-Ujung Pandang-Banjarmasin Backbonenetwork DWDM capacity Platform Coriant
|
F-110
PERUSAHAAN PERSEROAN (PERSERO) PT TELEKOMUNIKASI INDONESIA Tbk AND SUBSIDIARIES NOTES TO THE CONSOLIDATED FINANCIAL STATEMENTS As of December 31, 2015 and 2016 and for the Years Ended December 31, 2014, 2015 and 2016 (Figures in tables are expressedin billions ofRupiah, unless otherwise stated) PERUSAHAAN PERSEROAN (PERSERO)
| PT TELEKOMUNIKASI INDONESIA Tbk AND SUBSIDIARIES
| NOTES TO THE CONSOLIDATED FINANCIAL STATEMENTS
| As of January 1, 2012 (Restated), December 31, 2012 (Restated) and December 31, 2013
| and for the years ended December 31, 2011 (Restated), 2012 (Restated) and 2013
| (Figures in tables are presented in billions of rupiah, unless otherwise stated)
|
|
TabelTable of Content
3833. SIGNIFICANT COMMITMENTS AND AGREEMENTS (continued)
a. Capital expenditures (continued) (i)(ii)The Company (continued)Telkomsel
Contracting parties |
| Initial date of agreement |
| NatureSignificant provisions of transaction
|
| The Company and PT ZTE Indonesia
| | October 2, 2013
| | Procurement and installation agreement of OLT and ONT
| | The Company and PT Wahana Ciptasinatria
| | November 7, 2013
| | Procurement and installation agreement for Policy Control Equipment and Enforcement Function (PCEF)
| | The Company and PT Cisco Technologies Indonesia
| | November 14, 2013
| | The partnership for procurement and installation agreement of WIFI CISCO
| | The Company and PT Huawei Tech Investment
| | December 6, 2013
| | Procurement and installation agreement for IP Radio Equipment for Backhaul Node-B Telkomsel Package-2 Platform Huawei
| | The Company and PT Huawei Tech Investment
| | December 6, 2013
| | Procurement and installation agreement for 10 Gigabyte of Capable Passive Optical Network (XGPON) Platform Huawei
| | The Company and PT ASB-PT ALU Indonesia-PT GBN-PT Lintas Consortium
| | December6, 2013
| | Procurement and installation agreement for XGPON Platform ALU
| |
(ii) Telkomsel
Contracting parties
| | Initial date ofthe agreement
| | Nature of transaction
| | Telkomsel, PT Ericsson Indonesia, Ericsson AB, PT Nokia Siemens Networks, NSN Oy and Nokia Siemens Network GmbH & Co. KG | | April 17, 2008 | | The combined 2G and 3G CS Core Network Rollout Agreements | Agreement | Telkomsel, PT Ericsson Indonesia and PT Nokia Siemens Networks | | April17,2008
| April 17, 2008 | Technical Service Agreementagreement (TSA) for combined 2G and 3G CS Core Network | | Telkomsel, PT Ericsson Indonesia, Ericsson AB, PT Nokia Siemens Networks, NSN Oy, Huawei International Pte. Ltd., PT Huawei and PT ZTE Indonesia | | March and June2009 | June 2009 | 2G BSS and 3G UTRAN Rollout agreement for the provision of2Gof 2G GSM BSS and 3G UMTS Radio Access Network | | Telkomsel, PT Packet SystemsDimension Data Indonesia and PT Huawei | | February 3, 2010 | | Maintenance and procurementProcurement of equipmentEquipment and related service agreement for Next Generation Convergence IP RAN Rollout and Technical Support | | Telkomsel, PT Datacraft Indonesia and PT Huawei
| | February 3, 2010
| | Maintenance and procurement of equipment and related serviceRelated Service agreement for Next Generation Convergence Core Transport Rollout and Technical Support
| | Telkomsel, Amdocs Software Solutions Limited Liability Company and PT Application Solutions | | February 8,2010 | 8, 2010 | Online Charging System (“OCS”(“OCSâ€) and Service Control Points (“SCP”(“SCPâ€) System Solution Development Agreement | agreement | Telkomsel and PT Application Solutions | | February 8, 2010 | | Technical Support Agreementagreement to provide technical support services for the OCS and SCP | | Telkomsel, PT Nokia Siemens Networks andNSN Oy
| | January 27, 2011
| | Soft HLR Rollout agreement
| | Telkomsel and PT Nokia Siemens Networks
| | January 27, 2011
| | Soft HLR Technical Support Agreement
| | Telkomsel, Amdocs Software Solutions Limited Liability Company and PT Application Solutions | | July 5, 2011 | | Development and Rollout agreement for Customer Relationship Management and Contact Center solutions | | Telkomsel andPT Ericsson Indonesia
| | December 21, 2011
| | Development and Rollout agreement Operation Support System (“OSS”)
| | Telkomsel, Apple South Asia Pte. Ltd. and PT Mitra Telekomunikasi Selular (“MTS”)
| | July 16, 2012
| | Purchasing of iPhone products and provision of cellular network service
| |
F-110
PERUSAHAAN PERSEROAN (PERSERO)
| PT TELEKOMUNIKASI INDONESIA Tbk AND SUBSIDIARIES
| NOTES TO THE CONSOLIDATED FINANCIAL STATEMENTS
| As of January 1, 2012 (Restated), December 31, 2012 (Restated) and December 31, 2013
| and for the years ended December 31, 2011 (Restated), 2012 (Restated) and 2013
| (Figures in tables are presented in billions of rupiah, unless otherwise stated)
|
|
Tabel of Content
38. SIGNIFICANT COMMITMENTS AND AGREEMENTS (continued)
a. Capital expenditures (continued)
(ii) Telkomsel (continued)
Contracting parties
| | Initial date of agreement
| | Nature of transaction
| Solutions | Telkomsel and Huawei International Pte. Ltd. and PT Huawei | | July 17, 2012
| | CS Core System Rollout and CS Core System Technical Support agreement
| | Telkomsel andPT Ericsson Indonesia
| | March 25, 2013 | | Technical Support Agreement (TSA)agreement for the procurement of Gateway GPRS Support Node (“GGSN”(“GGSNâ€) Service Complex agreement | | Telkomsel and Wipro Limited, Wipro Singapore Pte. Ltd. and PT WT Indonesia | | April 23, 2013 | | Development and procurement of OSDSS Solution agreement | | Telkomsel andPTand PT Ericsson Indonesia | | October 22, 2013 | | Procurement of GGSN Service Complex Rollout agreement | Telkomsel and PT Dimension Data Indonesia | May 25, 2016 | Maintenance and Procurement of Equipment and Related Service agreement for Next Generation Convergence RAN Transport Rollout |
(iii)GSD Contracting parties |
| Initial date of agreement |
| NatureSignificant provisions of transactionthe agreement
|
| TLT and PT Adhi Karya | | November 6, 2012 | | Service arrangement structureStructure and main contractor architecture for Telkom Tower Building development project
| | TLT and PT Indalex
| | February 11, 2013
| | Procurementservices agreement for the Facade construction phase I unitized system Tower I and Tower II of Telkom Landmark Tower Building
| | GSD and PT Pembangunan Perumahan (Persero)
| | March 5, 2013
| | Development of Telkomsel’s building agreement
| | TLT and PT Jaya Kencana
| | May 14, 2013
| | Procurement and installation agreement for electrical construction of Telkom Landmark Tower Building
| building |
(iii) DMT
Contracting parties
|
| Initial date of agreement
|
| Nature of transaction
|
| DMT and PT M Jusuf & Sons
| | December 20, 2012
| | Telecommunication tower development agreement
| |
(iii) TII
Contracting parties
|
| Initial date of agreement
|
| Nature of transaction
|
| TLand Digicel (TL) LDA (Digicel)
| | August 28, 2012
| | Trading tower location agreement
| | TL, Ericsson AB and PT Ericsson Indonesia
| | November 2, 2012
| | Operational Supporting System (OSS), Base Sub Station (BSS) and Value Added System (VAS) System Rollout and Radio Access Network (RAN) and Core System Rollout agreement
| | TL, Ericsson AB and PT Ericsson Indonesia
| | February 1, 2013
| | Management service agreement for end-to-end mobile network
| | TL and PT Cascadiant Indonesia
| | December 31, 2012
December 31, 2012
November 20, 2013
| | Installation and maintenance service agreement
Purchase of equipment phase I agreement
Purchase of equipment phase II agreement
| | | |
F-111
PERUSAHAAN PERSEROAN (PERSERO) PT TELEKOMUNIKASI INDONESIA Tbk AND SUBSIDIARIES NOTES TO THE CONSOLIDATED FINANCIAL STATEMENTS As of December 31, 2015 and 2016 and for the Years Ended December 31, 2014, 2015 and 2016 (Figures in tables are expressedin billions ofRupiah, unless otherwise stated) PERUSAHAAN PERSEROAN (PERSERO)
| PT TELEKOMUNIKASI INDONESIA Tbk AND SUBSIDIARIES
| NOTES TO THE CONSOLIDATED FINANCIAL STATEMENTS
| As of January 1, 2012 (Restated), December 31, 2012 (Restated) and December 31, 2013
| and for the years ended December 31, 2011 (Restated), 2012 (Restated) and 2013
| (Figures in tables are presented in billions of rupiah, unless otherwise stated)
|
|
TabelTable of Content
3833. SIGNIFICANT COMMITMENTS AND AGREEMENTS (continued)
b.Borrowings and other credit facilities (i)As of DecemberofDecember 31, 2013,2016, the Company has bank guarantee facilities for tender bond, performance bond, maintenance bond, deposit guarantee and advance payment bond for various projects of the Company, as follows: | | | | | | | | Facility utilized | | | | | | | | | Facility utilized | | Lenders | | Total facility | | Maturity | | Currency | | Original currency (in millions) | | Rupiah equivalent | | | Total facility | | Maturity | | Currency | | Original currency (in millions) | | Rupiah equivalent | | BRI | | 350 | | March 14, 2014 | | Rp | | - | | 209 | | | 350 | | March 14, 2018 | | Rp | | - | | 31 | | | US$ | | 0 | | 1 | | | | | | | | | | US$ | | 0 | | 1 | | BNI | | 250 | | March 31, 2014 | | Rp | | - | | 100 | | | 250 | | March 31, 2017 | | Rp | | - | | 137 | | | US$ | | 0 | | 2 | | | | | | | | | | US$ | | 0 | | 1 | | Bank Mandiri | | 150 | | December 23, 2014 | | Rp | | - | | 45 | | | 300 | | December 23, 2017 | | Rp | | - | | 76 | | | | | | | | | | | | | | | | | US$ | | 0 | | 1 | | Total | | 750 | | | | | | | | 357 | | | 900 | | | | | | | | 247 | |
(ii)Telkomsel has a US$3 million bond and bank guarantee and standby letter of credit facilities with SCB, Jakarta. The facilities expire on July 31, 2014.2017. Under these facilities, as of DecemberofDecember 31, 2013,2016, Telkomsel has issued a bank guarantee of Rp20 billion (equivalent to US$1.71.5 million) for a 3G performance bond (Note 38c.i)(Note33c.i). The bank guaranteeisguaranteeis valid until March untilMarch 24, 2014.2016. As of the date of approval and authorization for the issuance of the consolidated financial statements, the bank guarantee has not been extended. Telkomsel has a Rp200Rp500 billion bank guarantee facility with BRI. The facility will expire on September 25, 2014.2017. Under thethis facility, as of December 31, 2013,2016, Telkomsel has issued a bank guarantee of Rp20Rp443 billion (equivalent to US$1.633 million) as a 3G performance bond (Note 38c.i) valid until May 31, 2014 and Rp111 billion (equivalent to US$9.1 million) as payment commitmentaspaymentforcommitment guarantee for annual right of usage fee valid untilMarch 31, 2017 andRp20 billion (equivalent to US$1.5 million) for a 3G performance guarantee valid until MarchMay 31, 2014.2017. As of the date of approval and authorization for issuance of these consolidated financial statements, the extension of the facility is still in process. Telkomsel has a Rp150 billion bank guaranteefacilitywith BCA. Thefacility will expire on April 15, 2017. Telkomsel has also has a Rp100 billion bank guarantee facility with BNI. The bank guarantee is valid until Decemberfacility will expire onDecember 11, 2014.2017. Telkomsel uses this facility to replace the time depositrequireddeposit required as guaranty for the USO Programprogram amounting to Rp92.653 billion.Rp52 billion (Note 33c.iv). (iii) TII has a US$15 million bank guarantee from Bank Mandiri. The facility expires on December 19, 2014. Under thiswill expire onDecember 18, 2017. Theoutstanding bank guarantee facility as of December 31, 2013, TII has issued a bank guarantee2016 amounted to US$10 million. PERUSAHAAN PERSEROAN (PERSERO) PT TELEKOMUNIKASI INDONESIA Tbk AND SUBSIDIARIES NOTES TO THE CONSOLIDATED FINANCIAL STATEMENTS As of Rp9 billion (equivalent to US$0.76 million)December 31, 2015 and 2016 and for mobile spectrum license performance bondthe Years Ended December 31, 2014, 2015 and 2016 (Figures in Timor Leste.tables are expressedin billions ofRupiah, unless otherwise stated) Table of Content 33. SIGNIFICANT COMMITMENTS AND AGREEMENTS (continued) c.Others (i) 3G license With reference to the Decision Letters No. 07/PER/M.KOMINFO/2/2006, No. 268/KEP/M.KOMINFO/9/2009 and No. 191 Year2013year 2013 of the MoCI, Telkomsel is required, among other things, to: 1.Pay an annual BHP fee which is calculated based on a certain formula over the license term (10 years) as set forth in the Decision Letters. The BHP is payable upon receipt of the notification letter (“(“Surat Pemberitahuan Pembayaran”Pembayaranâ€) from the DGPI. The BHP fee is payable annually up to the expiry date of the license.license 2.Provide roaming access for the existing other 3G operators.operators 3.Contribute to USO development.development 4.Construct a 3G network which covers at least 14 provinces by the sixth year of holding the 3G license. license 5. Issue a performance bond each year amounting to Rp20 billion or 5% of the annual fee to be paid for the subsequent year, whichever is higher.
F-112
PERUSAHAAN PERSEROAN (PERSERO)
| PT TELEKOMUNIKASI INDONESIA Tbk AND SUBSIDIARIES
| NOTES TO THE CONSOLIDATED FINANCIAL STATEMENTS
| As of January 1, 2012 (Restated), December 31, 2012 (Restated) and December 31, 2013
| and for the years ended December 31, 2011 (Restated), 2012 (Restated) and 2013
| (Figures in tables are presented in billions of rupiah, unless otherwise stated)
|
|
Tabel of Content
38. SIGNIFICANT COMMITMENTS AND AGREEMENTS (continued)
c. Others (continued)
(ii) Radio Frequency Usage Based on the Decree No. 76 dated December 15, 2010 of the Government of the Republic of Indonesia, which amended Decree No. 7 dated January 16, 2009, the annual frequency usage fees for bandwidths of 800 Megahertz (“MHz”(“MHzâ€), 900 MHz and 1800 MHz are determined using a formula set forth intheDecree. The Decree is applicable for 5 years unless further amended. As an implementation of the above Decree,the Company and Telkomsel paidthepaid the first year and secondto fifth year annual frequency usage fees for 2010 to 2014. Based on Decision letter No. 983 issued in 20102015, the MoCI determined that the sixth year (Y6), 2015 annual frequency usage fee of Telkomsel was Rp2,398 billion. The fee was paid in December 2015. Based on Decision letter No. 1949 issued in 2016, the MoCI determined that the seventh year (Y7), 2016 annual frequency usage fee of Telkomsel was Rp2,511 billion. The fee was paid in December 2016.
On July 6, 2015, Telkomsel received Decision Letter No. 644 Year 2015 dated June 30, 2015, of the MoCI, which replaced Decision Letter No. 42 Year 2014 dated January 29, 2014, whereby the MoCI granted Telkomsel the rights to provide: (i)Mobile telecommunication services with radio frequency bandwidth in the 800 MHz, 900 MHz and 2011, respectively. 1800 MHz bands; (ii)Mobile telecommunication services IMT-2000 with radio frequency bandwidth in the 2.1 GHz bands (3G); and (iii)Basic telecommunication services. Conditional Business Transfer Agreement (“CBTAâ€)
In order to maximize business opportunities within the group synergy, the Company restructured its fixed wireless business unit by transferring its fixed wireless business and subscribers to Telkomsel. On June 27, 2014, the Company signed a CBTA with Telkomsel to transfer such business and subscribers to Telkomsel (Notes 5 and 10b).
F-113
PERUSAHAAN PERSEROAN (PERSERO) PT TELEKOMUNIKASI INDONESIA Tbk AND SUBSIDIARIES NOTES TO THE CONSOLIDATED FINANCIAL STATEMENTS As of December 31, 2015 and 2016 and for the Years Ended December 31, 2014, 2015 and 2016 (Figures in tables are expressedin billions ofRupiah, unless otherwise stated) Table of Content
33. SIGNIFICANT COMMITMENTS AND AGREEMENTS (continued)
c. Others (continued) (ii) Radio Frequency Usage(continued) Conditional Business Transfer Agreement (“CBTA”)(continued) Based on Decision LettersLetter No. 495934 dated August 29, 2012 and No. 491 dated August 29, 2012,September 26, 2014, the MoCI determined thatapproved the third year (Y3), 2012, annualtransfer of the Company’s frequency usage feeslicenseon radio frequency spectrum of 800 MHz, specifically on spectrum of 880 - 887.5 MHz paired with 925 - 932.5 MHz, to Telkomsel. Telkomsel can use the radio frequency spectrumsince the date the Decision Letter was issued. During the transition period, the Company is still able to use the radio frequency spectrum of 880 - 887.5 MHz paired with 925 - 932.5 MHz at the latest until December 14, 2015. Based on MoCI Decision letter No. 807/KOMINFO/OJ-SOPI.4/SP.03.03/10/2016 dated October 13, 2016, the migration process of frequency spectrum of 800 MHz has been completed and Telkomsel is able to use the frequency spectrum nationwide. Accordingly, the Company and Telkomsel were Rp174 billion and Rp1,718 billion, respectively. The fees were paid in December 2012. Based on Decision Letters No. 881 dated September 10, 2013 and No. 884 dated September 10, 2013, the MoCI determinedagreed that the fourth year (Y4), 2013, annual frequency usage fees of the Company and Telkomsel were Rp213 billion and Rp1,649 billion, respectively. The fees were paid in December 2013.CBTA has been completed on October 21, 2016.
(iii) Apple, IncOperating On July 16, 2012, Telkomsel entered into an agreement with Apple South Asia Pte Ltd (“Apple”) for the purchase of iPhone products and provision of cellular network services in Indonesia. Based on the agreement:
·Telkomsel may authorize Authorized Purchaser (“AP”) to place PO under the agreement provided that a contract of Adherence is signed between Apple, Telkomsel and AP binding such AP to the terms and conditions of the agreement. If any of the AP fails to pay an invoice from Apple or Apple’s affiliate as required by the agreement, after receipt of Apple’s notice, Telkomsel should pay the sums due and the unpaid amount.
·Telkomsel shall order and take delivery or cause its AP to order and take delivery of at least 500,000 iPhone units up to June 2015.
Effective on August 17, 2012, Telkomsel appointed PT Mitra Telekomunikasi Selular (“MTS”), third party, as the AP. In accordance with the agreement with MTS, issuance of PO by MTS is subject to Telkomsel’s approval and required to be covered by a bank guarantee.
(iv)Future Minimum Lease Payments under Operating Leaselease commitments
The Group entered into non-cancelable lease agreements with both third and related parties. The lease agreements cover leased lines, telecommunication equipment and land and building with terms ranging from 1 to 10 years and with expiry dates between 20142017 and 2023. 2026. Periods may be extended based on the agreement by both parties. Minimum lease payments charged to profit or loss in 2016 amounted to Rp4,948 billion. Future minimum lease paymentspayments/receivables under thenon-cancelable operating lease agreements as of DecemberofDecember 31, 20132016 are as follows: | | Total | | Less than 1 year | | 1-5 years | | More than 5 years | | Total | | Less than 1 year | | 1-5 years | | More than 5 years | | As lessee | | 14,037 | | 1,845 | | 6,365 | | 5,827 | | 29,617 | | 3,814 | | 14,479 | | 11,324 | | As lessor | | 4,571 | | 1,025 | | 2,596 | | 950 | | 2,443 | | 774 | | 1,400 | | 269 | |
The future minimum lease payments/receivables include payments from non-lease elements in the arrangement. In connection with the restructuring of its fixed wireless business (Note 33c.ii), the Company is undertaking a negotiation to early terminate its operating lease arrangements, and has recorded provisions for early termination amounting to Rp666 billion and Rp202 billion which are presented as “Other Expense” in 2015 and 2016, respectively. As of December 31, 2016,outstanding provisions for early termination amounted to Rp300 billion. PERUSAHAAN PERSEROAN (PERSERO) PT TELEKOMUNIKASI INDONESIA Tbk AND SUBSIDIARIES NOTES TO THE CONSOLIDATED FINANCIAL STATEMENTS As of December 31, 2015 and 2016 and for the Years Ended December 31, 2014, 2015 and 2016 (Figures in tables are expressedin billions ofRupiah, unless otherwise stated) Table of Content 33. SIGNIFICANT COMMITMENTS AND AGREEMENTS (continued)
c. Others (continued) (iv) Service Concession Arrangement
TheMoCI issued Regulation No. 15/PER/M.KOMINFO/9/2005 dated September 30, 2005,which sets forth the basic policies underlying the USO program and requires telecommunications operators in Indonesia to contribute 0.75% of their gross revenues (with due consideration for bad debts and interconnection charges) for USO development. Based on the Government’s Decree No. 80 year 2015 dated November 9, 2015 which replaced Government’s Decree No. 7 year 2009 dated January 16, 2009 and Decree No. 05/PER/M.KOMINFO/2/2007 dated February 28, 2007, the contribution was changed to 1.25% of gross revenues (with due consideration for bad debts and/or interconnection charges and/or connection charges). Subsequently, in December 2012, Decree No. 05/PER/M.KOMINFO/2/2007 was replaced by Decree No. 45 year 2012 of the MoCI which was effective from January 22, 2013. Subsequently, in September 2016, Decree No. 45 year 2012 was replaced by Decree No. 17 year 2016 which was effective from September 26, 2016. The Decree stipulates, among other things, the exclusion of certain revenues that are not considered as part of gross revenues as a basis to calculate the USO charged. Subsequently, Decree No. 17 year 2016 dated September 26, 2016 was replaced by Decree No. 19 year 2016 which was effective from November 8, 2016. The latest Decree stipulates, among other things, the USO charged was effective for fiscal year 2016 and thereafter. BasedonMoCI Decree No. 32/PER/M.KOMINFO/10/2008 dated October 10, 2008 (as amended by Decree No. 03/PER/M.KOMINFO/2/2010 dated February 1, 2010) which replaced MoCI Decree No. 11/PER/M.KOMINFO/04/2007 dated April 13, 2007 and MoCI Decree No. 38/PER/M.KOMINFO/9/2007 dated September 20, 2007, it is stipulated that, among others, in providing telecommunication access and services in rural areas (USO Program), the provider is determined through a selection process byBalai Telekomunikasi dan Informatika Pedesaan(“BTIP”) which was established based on MoCI Decree No. 35/PER/M.KOMINFO/11/2006 dated November 30, 2006.Subsequently, based on Decree No. 18/PER/M.KOMINFO/11/2010 dated November 19, 2010 of MoCI, BTIP was changed toBalai Penyedia dan Pengelola Pembiayaan Telekomunikasi dan Informatika (“BPPPTI”). a. The Company On March 12, 2010, the Company was selected in a tender by the Government through BTIP to provide internet access service centers for USO sub-districts for a total amount of Rp322 billion, covering Nanggroe Aceh Darussalam, North Sumatra, North Sulawesi, Gorontalo, Central Sulawesi, West Sulawesi, South Sulawesi and South East Sulawesi. On December 23, 2010, the Company was selected in a tender by the Government throughBPPPTI to provide mobile internet access service centers for USO sub-districts for a total amount of Rp528 billion, covering Jambi, Riau, Kepulauan Riau, North Sulawesi, Central Sulawesi, Gorontalo, West Sulawesi, South East Sulawesi, Central Kalimantan, South Sulawesi, Papua and West Irian Jaya.
In 2015, the program was ceased. On September 8, 2015, the Company filed an arbitration claim to the Indonesia National Board of Arbitration (“BANI”) for the settlement of the outstanding receivables of USO-PLIK and USO-MPLIK. On September 22, 2016, BANI decided that BPPPTI should pay the underpayment to the Company for USO-PLIK and USO-MPLIK project amounting to Rp127 billion and Rp342 billion, respectively. As of the date of the issuance of these consolidated financial statements, the Company has received payment from BPPPTI amounting to Rp278 billion. PERUSAHAAN PERSEROAN (PERSERO) PT TELEKOMUNIKASI INDONESIA Tbk AND SUBSIDIARIES NOTES TO THE CONSOLIDATED FINANCIAL STATEMENTS As of December 31, 2015 and 2016 and for the Years Ended December 31, 2014, 2015 and 2016 (Figures in tables are expressedin billions ofRupiah, unless otherwise stated) Table of Content 33. SIGNIFICANT COMMITMENTS AND AGREEMENTS (continued) c. Others (continued) (iv) Service Concession Arrangement (continued) b. Telkomsel On January 16 and 23, 2009, Telkomsel was selected in a tender by the Government through BTIP to provide and operate telecommunication access and services in rural areas (USO Program) for a total amount of Rp1.66 trillion, covering all Indonesian territories except Sulawesi, Maluku and Papua.Accordingly,Telkomsel obtained local fixed-line licenses and the right to use radio frequency in the 2,390 MHz - 2,400 MHz bandwidth. Subsequently, in 2010 and 2011, the agreements with BTIP were amended, which amendments cover, among other things, changing the price to Rp1.76 trillion and changing the term of payment from quarterly to monthly or quarterly. In January 2010, the MoCI granted Telkomsel operating licenses to provide local fixed-line services under the USO program. On December 27, 2011, Telkomsel (on behalf of Konsorsium Telkomsel, a consortium which was established with Dayamitra on December 9, 2011) was selected by BPPPTI as a provider of the USO Program in the border areas for all packages (package 1-13) with a total price of Rp830 billion. On such date, Telkomsel was also selected by BPPPTI as a provider of the USO Program (Upgrading) of “Desa Pinter†or “Desa Punya Internet†for 1, 2 and 3 packages with a total price of Rp261 billion. OnMarch 31, 2014, the USO program for packages 1,2,3,6and 7 were ceased. As of September18, 2014, Telkomsel filed an arbitration claimto BANI for the settlement of the outstanding receivable from BPPPTI. On October 23, 2015, BANI decided that Telkomsel should paythe overpayment by BPPPTI for the USO program amounting to Rp94.2 billion. Telkomsel accepted the decision and paid theoverpayment in December 2015. On October 29, 2015, BPPPTI informed that operational license for USO program of “Desa Pinter†could not be issued. In January 2016, Telkomsel filed an arbitration claim to BANI for terminating the USO program. For the years ended December 31, 2014, 2015 and 2016, the Company and Telkomsel recognized the following amounts: | 2014 | | 2015 | | 2016 | | Revenues | | | | | | | Construction | 1 | | - | | - | | Operation of telecommunications service center | 180 | | - | | - | | Profits (losses) | | | | | | | Construction | 0 | | - | | - | | Operation of telecommunications service center | (139 | ) | (161 | ) | (35 | ) |
As ofDecember 31, 2015 and 2016, the Company'sand Telkomsel’s net carrying amount of tradereceivablesfor theUSO programwhich are measured at amortized cost using the effective interest method amounted to Rp179 billion and Rp178 billion, respectively (Note 6). F-113F-116
PERUSAHAAN PERSEROAN (PERSERO) PT TELEKOMUNIKASI INDONESIA Tbk AND SUBSIDIARIES NOTES TO THE CONSOLIDATED FINANCIAL STATEMENTS As of December 31, 2015 and 2016 and for the Years Ended December 31, 2014, 2015 and 2016 (Figures in tables are expressedin billions ofRupiah, unless otherwise stated) PERUSAHAAN PERSEROAN (PERSERO)
| PT TELEKOMUNIKASI INDONESIA Tbk AND SUBSIDIARIES
| NOTES TO THE CONSOLIDATED FINANCIAL STATEMENTS
| As of January 1, 2012 (Restated), December 31, 2012 (Restated) and December 31, 2013
| and for the years ended December 31, 2011 (Restated), 2012 (Restated) and 2013
| (Figures in tables are presented in billions of rupiah, unless otherwise stated)
|
|
TabelTable of Content
3934. CONTINGENCIES
In the ordinary course of business, the Group has been named as defendantsdefendant in various legal actions inconnectionin relation with land disputes, monopolistic practice and unfair business competition and SMS cartel practices. Based on management's estimate of the probable outcomes of these matters, the Group has recognized provision for losses amounting toRp49 billion as of December 31, 2013. a.The Company, Telkomsel and seven other local operators are being investigated by The Commission for the Supervision of Business Competition (“(Komisi Pengawasan Persaingan Usaha” or “KPPU”“KPPUâ€) for allegations of SMS cartel practices. On June 17, 2008, in case No. 26/KPPU-L/2007, the Company, Telkomsel and seven other local operators were investigated. As a result of the investigations, on June 17, 2008, KPPU foundstated that the Company, Telkomsel and certainfive other local operators had violated Law No. 5 year 1999 article 5 and charged the Company and Telkomsel penalty in the amounts of Rp18 billion and Rp25 billion, respectively. Management believes that there are no such cartel practices that led to a breach of prevailing regulations. Accordingly, the Company and Telkomsel filed an appeal with the Bandung District Court and South Jakarta District Court on July 14, 2008 and July 11, 2008, respectively. DueSeven other local operators also filed an appeal in various courts. In relation to the filing of cases by operators in various courts,case, the KPPU subsequently requested the Supreme Court (SC) to consolidate the cases into the Central Jakarta District Court. Based on the SC’sSC’s decision letter dated April 12, 2011, the SCappointed theCentral Jakarta District Courtto investigate and resolve the case.On May 27, 2015, theCentral Jakarta District Courtin case No. 03/KPPU/208/PN.JKT.PSTdecided that the Company, Telkomsel and seven other local operatorswonthe case.
AsOn July 23, 2015, KPPU filed an appeal to the SC regarding the case of SMS cartel practices. On February 29, 2016, the issuance date of the consolidated financial statements, there has not been any notificationSCin case No. 9 K/Pdt.Sus-KPPU/2016decided on the case fromin favor of KPPU, therefore the court.Company and Telkomsel have to paythepenalty charged by KPPU amounting to Rp18 billion and Rp25 billion, respectively.Based on management’s estimate of the probable outcomes of this matter, the Group has recognized provision for losses amounting to Rp43 billion as of December 31, 2016.The Company and Telkomselhavepaidthe penalty to the treasury fund in January 2017.
b. The Company is a defendant in a case filed in Makassar District Court by Andi Jindar Pakki and his affiliates over a land property onat Jl. A.P. Pettarani. On May 8, 2013, the court pronouncedCourt announced its verdict and orderedrequiring the Company to pay fair compensation or to vacate and surrender the disputed land to the plaintiffs. On May 20, 2013, the Company filed an appeal to the Makassar High Court, objecting to the District Court’s ruling.InCourt’s ruling. In December 2013,theMakassar the Makassar High CourtpronouncedCourt announced its verdictthat is favorableto theplaintiffs andverdict that was favorable to the plaintiffs so the Company filed an appeal to the SC. On January 9, 2015, the Company received the SC NoticeNo. 226/Pdt.G/2012/PN.Mks, regarding the case which rejected the Company’s appeal. On February 5, 2015, the Company requested for a judicial review of the case by the SC.
On December 16, 2015, through its letter No. 336 PK/Pdt/2015, the SC decided on the case in favor of the Company. F-117
PERUSAHAAN PERSEROAN (PERSERO) PT TELEKOMUNIKASI INDONESIA Tbk AND SUBSIDIARIES NOTES TO THE CONSOLIDATED FINANCIAL STATEMENTS As of December 31, 2015 and 2016 and for the issuance date Years Ended December 31, 2014, 2015 and 2016 (Figures in tables are expressedin billions ofRupiah, unless otherwise stated) Table of the consolidated financial statements, no decision has been reached on the appeal.Content 4035. FINANCIAL RISK MANAGEMENT
1. Financial assets andfinancialliabilities a. Classification 1.i. Financial risk managementassets
| 2015 | | 2016 | | Financial assets at fair value through profit or loss | | | | | Derivative asset - put option | 172 | | - | | Loans and receivables | | | | | Cash and cash equivalents | 28,117 | | 29,767 | | Trade and other receivables | 7,872 | | 7,900 | | Other current financial assets | 2,486 | | 313 | | Other non-current assets | 379 | | 210 | | Available-for-sale financial assets | | | | | Available-for-sale investments | 160 | | 1,158 | | Totalfinancial assets | 39,186 | | 39,348 | |
The Group’s activities expose it to a variety of financial risks such as market risks (including foreign exchange risk and interest rate risk), credit risk and liquidity risk. Overall, the Group’s financial risk management program is intended to minimize losses on the financial assets and financial liabilities arising from fluctuation of foreign currency exchange rates and the fluctuation of interest rates. Management has a written policy for foreign currency risk management mainly on time deposit placements and hedging to cover foreign currency risk exposures for periods ranging from 3 up to 12 months.
ii.Financial liabilities Financial risk management is carried out bytheCorporate Finance unit under policies approved by the Board of Directors. TheCorporate Finance unit identifies, evaluates and hedges financial risks.
| 2015 | | 2016 | | Financial liabilities measured at amortized cost | | | | | Trade and other payables | 14,284 | | 13,690 | | Accrued expenses | 8,247 | | 11,283 | | Interest-bearing loans and other borrowings | | | | | Short-term bank loans | 602 | | 911 | | Two-step loans | 1,520 | | 1,292 | | Bonds and notes | 9,548 | | 9,323 | | Long-term bank loans | 18,362 | | 15,566 | | Obligations under finance leases | 4,580 | | 4,010 | | Other borrowings | - | | 697 | | Total financial liabilities | 57,143 | | 56,772 | |
b.Fair values | | | | | | Fair value measurement at reporting date using | | 2015 | | Carrying value | | Fair value | | Quoted prices in active markets for identical assets or liabilities (level 1) | | Significant other observable inputs (level 2) | | Significant unobservable inputs (level 3) | | Financial assets measured at fair value | | | | | | | | | | | | Available-for-sale investments | | 160 | | 160 | | 55 | | 105 | | - | | Fair value through profit or loss | | 172 | | 172 | | - | | - | | 172 | | Total | | 332 | | 332 | | 55 | | 105 | | 172 | | Financial liabilities for which fair values are disclosed | | | | | | | | | | | | Interest-bearing loans and other borrowings | | | | | | | | | | | | Two-step loans | | 1,520 | | 1,538 | | - | | - | | 1,538 | | Bonds and notes | | 9,548 | | 9,541 | | 8,972 | | - | | 569 | | Long-term bank loans | | 18,362 | | 18,314 | | - | | - | | 18,314 | | Obligations under finance leases | | 4,580 | | 4,580 | | - | | - | | 4,580 | | Total | | 34,010 | | 33,973 | | 8,972 | | - | | 25,001 | |
F-114F-118
PERUSAHAAN PERSEROAN (PERSERO) PT TELEKOMUNIKASI INDONESIA Tbk AND SUBSIDIARIES NOTES TO THE CONSOLIDATED FINANCIAL STATEMENTS As of December 31, 2015 and 2016 and for the Years Ended December 31, 2014, 2015 and 2016 (Figures in tables are expressedin billions ofRupiah, unless otherwise stated) PERUSAHAAN PERSEROAN (PERSERO)
| PT TELEKOMUNIKASI INDONESIA Tbk AND SUBSIDIARIES
| NOTES TO THE CONSOLIDATED FINANCIAL STATEMENTS
| As of January 1, 2012 (Restated), December 31, 2012 (Restated) and December 31, 2013
| and for the years ended December 31, 2011 (Restated), 2012 (Restated) and 2013
| (Figures in tables are presented in billions of rupiah, unless otherwise stated)
|
|
TabelTable of Content
4035. FINANCIAL RISK MANAGEMENT (continued)
1.Financial risk management (continued)
a. Foreign exchange risk
TheGroup isexposed to foreign exchange risk on sales, purchases and borrowings that are denominated in foreign currencies. The foreign currency denominated transactions are primarily in U.S.dollars and Japaneseyen. TheGroup’s exposures to other foreign exchange rates are not material.
Increasing risks of foreign currency exchange rates on the obligations of theGroup are expected to be offset by the effects of the exchange rates on time deposits and receivables in foreign currencies that are equal to at least 25% of the outstandingcurrentliabilities.
The following tablepresents theGroup’s financial assets andfinancialliabilitiesexposure to foreign currency risk:
| | 2012 | | 2013 | | | | U.S. dollar (in billions) | | Japanese yen (in billions) | | U.S. dollar (in billions) | | Japanese yen (in billions) | | Financial assets | | 0.51 | | 0.00 | | 0.48 | | 0.00 | | Financial liabilities | | (0.61 | ) | (9.25 | ) | (0.48 | ) | (8.47 | ) | Net exposure | | (0.10 | ) | (9.25 | ) | 0.00 | | (8.47 | ) |
Sensitivity analysis(continued)
A strengthening of theU.S. dollar and Japaneseyen, as indicated below, against the rupiah at December 31, 2013 would have decreased equity and profit or loss by the amounts shown below. This analysis is based on foreign currency exchange rate variances that the Group considered to be reasonably possible at the reporting date. The analysis assumes that all other variables, in particular interest rates, remain constant.
|
| Equity/profit (loss)
|
| December 31, 2013
| | | | U.S. dollar (1% strengthening)
| | 0
| | Japanese yen (5% strengthening)
| | (48
| )
|
A weakening of theU.S. dollar and Japaneseyen against the rupiah at December31, 2013 would have had an equal but opposite effect on the above currencies to the amounts shown above, on the basis that all other variables remain constant.
b. Market price risk
TheGroup isexposed to changes in debt and equity market prices related to available-for-sale investments carried at fair value. Gains and losses arising from changes in the fair value of available-for-sale investments are recognized in equity.
F-115
PERUSAHAAN PERSEROAN (PERSERO)
| PT TELEKOMUNIKASI INDONESIA Tbk AND SUBSIDIARIES
| NOTES TO THE CONSOLIDATED FINANCIAL STATEMENTS
| As of January 1, 2012 (Restated), December 31, 2012 (Restated) and December 31, 2013
| and for the years ended December 31, 2011 (Restated), 2012 (Restated) and 2013
| (Figures in tables are presented in billions of rupiah, unless otherwise stated)
|
|
Tabel of Content
40. FINANCIAL RISK MANAGEMENT (continued)
1.Financial risk management (continued) b. Market price risk (continued)
The performance of theGroup’s available-for-sale investmentsis monitored periodically, together with a regular assessment of their relevance to theGroup’s long-term strategic plans.
As of December 31, 2013, management considered the price risk for the Group’s available-for-sale investments to be immaterial in terms of the possible impact on profit or loss and total equity from a reasonably possible change in fair value.
c. Interest rate risk
Interest rate fluctuation is monitored to minimize any negative impact to financial performance. Borrowings at variable interest rates expose theGroup to interest rate risk (Notes 18 and 19). To measure market riskpertaining tofluctuations in interest rates, theGroupprimarily uses interest margin and maturity profile of the financial assets and liabilities based on changing schedule of the interest rate.
At reporting date, the interest rate profile of the Group’s interest-bearing borrowings wasas follows:
| | 2012 | | 2013 | | Fixed rate borrowings | | (7,025 | ) | (9,591 | ) | Variable rate borrowings | | (12,250 | ) | (10,665 | ) |
Sensitivity analysis for variable rate borrowings
At December 31, 2013, a decrease (increase) by 25 basis points in interest rates of variable rate borrowings would have increased (decreased) equity and profit or loss by Rp27 billion, respectively. This analysis assumes that all other variables, in particular foreign currency rates, remain constant.
d. Credit risk
The following table presentsthe maximum exposure to credit risk of the Group’s financial assets:
| | 2012 | | 2013 | | Cash and cash equivalents | | 13,118 | | 14,696 | | Other currentfinancialassets | | 4,338 | | 6,872 | | Trade and other receivables | | 5,409 | | 6,421 | | Long-term investments | | 21 | | 21 | | Advances and other non-current assets | | 614 | | 685 | | Total | | 23,500 | | 28,695 | |
F-116
PERUSAHAAN PERSEROAN (PERSERO)
| PT TELEKOMUNIKASI INDONESIA Tbk AND SUBSIDIARIES
| NOTES TO THE CONSOLIDATED FINANCIAL STATEMENTS
| As of January 1, 2012 (Restated), December 31, 2012 (Restated) and December 31, 2013
| and for the years ended December 31, 2011 (Restated), 2012 (Restated) and 2013
| (Figures in tables are presented in billions of rupiah, unless otherwise stated)
|
|
Tabel of Content
40. FINANCIAL RISK MANAGEMENT (continued)
1.Financial risk management (continued)
d. Credit riskandfinancialliabilities (continued)
TheGroup isexposed to credit risk primarily from trade and other receivables.The credit risk is managed by continuous monitoringofoutstanding balances and collection.
b.Fair values (continued) Trade and other receivables do not have any major concentrationofrisk whereas no customer receivable balances exceed 2% of trade receivables as ofDecember 31, 2013.
Management is confident in its ability to continue to control and sustain minimal exposureto credit risk given that theGroup hasrecognized sufficientprovision for impairment of receivables to cover incurred loss arising from uncollectible receivables based on existing historicaldata on credit losses.
e. Liquidity risk
Liquidity risk arises in situations where theGroup hasdifficulties in fulfilling financial liabilities when they become due.
Prudent liquidity risk management implies maintaining sufficient cash in order tomeet theGroup’s financialobligations. TheGroupcontinuously performs an analysis to monitorfinancial position ratios,such asliquidity ratios and debt-to-equity ratio, against debt covenant requirements.
The following is the maturity profile of the Group’s financial liabilities:
| | Carrying amount | | Contractual cash flows | | 2014 | | 2015 | | 2016 | | 2017 | | 2018 and thereafter | | | | | | | Fair value measurement at reporting date using | | Trade and other payables | | 11,988 | | (11,988 | ) | (11,988 | ) | - | | - | | - | | - | | | Accrued expenses | | 5,264 | | (5,264 | ) | (5,264 | ) | - | | - | | - | | - | | | Loans and other borrowings | | | | | | | | | | | | | | | | | Bank loans | | 10,023 | | (11,618 | ) | (5,028 | ) | (3,264) | | (1,248 | ) | (980 | ) | (1,098 | ) | | Obligations under finance leases | | 4,969 | | (6,904 | ) | (1,070 | ) | (885 | ) | (847 | ) | (813 | ) | (3,289 | ) | | 2016 | | | Carrying value | | Fair value | | Quoted prices in active markets for identical assets or liabilities (level 1) | | Significant other observable inputs (level 2) | | Significant unobservable inputs
(level 3) | | Financial assets measured at fair value | | | | | | | | | | | | | Available-for-sale investments | | | 1,158 | | 1,158 | | 1,058 | | 100 | | - | | Financial liabilities for which fair values are disclosed | | | | | | | | | | | | | Interest-bearing loans and other borrowings | | | | | | | | | | | | | Two-step loans | | 1,915 | | (2,308 | ) | (292 | ) | (285 | ) | (278 | ) | (271 | ) | (1,182 | ) | | 1,292 | | 1,312 | | - | | - | | 1,312 | | Bonds and notes | | 3,349 | | (4,817 | ) | (582 | ) | (1,311 | ) | (215 | ) | (203 | ) | (2,506 | ) | | 9,323 | | 9,684 | | 9,342 | | - | | 342 | | Long-term bank loans | | | 15,566 | | 15,404 | | - | | - | | 15,404 | | Obligations under finance leases | | | 4,010 | | 4,010 | | - | | - | | 4,010 | | Other borrowings | | | 697 | | 689 | | - | | - | | 689 | | Total | | 37,508 | | (42,899 | ) | (24,224 | ) | (5,745 | ) | (2,588 | ) | (2,267 | ) | (8,075 | ) | | 30,888 | | 31,099 | | 9,342 | | - | | 21,757 | |
The difference between the carrying amount and the contractual cash flows is interest value.
F-117
PERUSAHAAN PERSEROAN (PERSERO)
| PT TELEKOMUNIKASI INDONESIA Tbk AND SUBSIDIARIES
| NOTES TO THE CONSOLIDATED FINANCIAL STATEMENTS
| As of January 1, 2012 (Restated), December 31, 2012 (Restated) and December 31, 2013
| and for the years ended December 31, 2011 (Restated), 2012 (Restated) and 2013
| (Figures in tables are presented in billions of rupiah, unless otherwise stated)
| |
Tabel of Content
40. FINANCIAL RISK MANAGEMENT (continued)
2. Fair value of financial assets andfinancialliabilities
a. Fair value measurement
Fair value is the amount for which an asset could be exchanged, or liability settled, in an arm’s length transaction.
The Group determined the fair value measurement for disclosure purposes of each class of financial assets and financial liabilities based on the following methods and assumptions:
(i)The fair values of short-term financial assets and financial liabilities with maturities of one year or less (cash and cash equivalents, trade receivables, other receivables, other current assets, trade payables, other payables, dividend payable, accrued expenses, advances from customers and suppliers and short-term bank loans) are considered toapproximate their carrying amountsas the impact of discounting is not significant.
(ii)Available-for-sale financial assets primarily consist of shares, mutual funds, andcorporate and Governmentandgovernment bonds. Shares and mutualMutual funds actively traded in an established market are stated at fair value using quoted market price or, if unquoted, determined using a valuation technique.and classified within level 1. Corporate and Government bonds are stated at fair value by reference to prices of similar securities at the reporting date.
(iii)The fair values of long-termfinancialliabilities are estimated by discounting the future contractual cash flows of each liability at rates offered to theGroupfor similarliabilities of comparable maturities by the bankers of theGroup, except for bonds which are based on market prices.
The fair value estimates are inherently judgmental and involve various limitations, including:
a. Fair values presented do not take into consideration the effect of future currency fluctuations.
b.Estimated fair values are not necessarily indicative of the amounts that the Group would record upon disposal/termination of the financial assets and liabilities.
b. Classification and fair value
The followingtable presents the carrying value and estimated fair values of the Group's financial assets and liabilities based on their classifications:
| | 2012 | | 2013 | | | | Carrying value | | Fair value | | Carrying value | | Fair value | | Current financial assets | | | | | | | | | | Available-for-sale - Other current financial assets | | 310 | | 310 | | 272 | | 272 | | Fair value through profit or loss - Other current financial assets | | - | | - | | 297 | | 297 | | Total | | 310 | | 310 | | 569 | | 569 | | Non-current financial liabilities | | | | | | | | | | Financial liabilities measured at amortized cost | | | | | | | | | | Loans and other borrowings | | | | | | | | | | Obligations under finance lease | | 2,324 | | 2,324 | | 4,969 | | 4,969 | | Two-step loans | | 1,987 | | 2,075 | | 1,915 | | 1,921 | | Bonds and notes | | 3,669 | | 4,022 | | 3,349 | | 3,490 | | Long-term bank loans | | 11,258 | | 11,346 | | 9,591 | | 9,474 | | Total | | 19,238 | | 19,767 | | 19,824 | | 19,854 | |
F-118
PERUSAHAAN PERSEROAN (PERSERO)
| PT TELEKOMUNIKASI INDONESIA Tbk AND SUBSIDIARIES
| NOTES TO THE CONSOLIDATED FINANCIAL STATEMENTS
| As of January 1, 2012 (Restated), December 31, 2012 (Restated) and December 31, 2013
| and for the years ended December 31, 2011 (Restated), 2012 (Restated) and 2013
| (Figures in tables are presented in billions of rupiah, unless otherwise stated)
|
|
Tabel of Content
40. FINANCIAL RISK MANAGEMENT(continued)
2. Fair value of financial assets andfinancialliabilities(continued)
c. Fair value hierarchy
The following table provides the fair value measurement hierarchy of the Group’s assets and liabilities.
| | | | Fair value measurement at reporting date using | | | | Fair value | | Quoted prices in active markets for identical assets or liabilities (level 1) | | Significant other observable inputs (level 2) | | Significant unobservable inputs (level 3) | | 2012 | | | | | | | | | | Financial assets measured at fair value | | | | | | | | | | Available-for-sale securities | | 310 | | 52 | | 210 | | 48 | | Financial liabilities for which fair values are disclosed (Note 40.2b) | | | | | | | | | | Loans and other borrowings | | | | | | | | | | Obligations under finance lease | | 2,324 | | - | | - | | 2,324 | | Two-step loans | | 2,075 | | - | | - | | 2,075 | | Bonds and notes | | 4,022 | | 3,355 | | - | | 667 | | Long-term bank loans | | 11,346 | | - | | - | | 11,346 | | Total | | 19,767 | | 3,355 | | - | | 16,412 | | 2013 | | | | | | | | | | Financial assets measured at fair value | | | | | | | | | | Available-for-sale | | 272 | | 48 | | 224 | | - | | Fair value through profit or loss | | 297 | | - | | - | | 297 | | Total | | 569 | | 48 | | 224 | | 297 | | Financial liabilities for which fair values are disclosed (Note 40.2b) | | | | | | | | | | Loans and other borrowings | | | | | | | | | | Obligations under finance lease | | 4,969 | | - | | - | | 4,969 | | Two-step loans | | 1,921 | | - | | - | | 1,921 | | Bonds and notes | | 3,490 | | 3,141 | | - | | 349 | | Long-term bank loans | | 9,474 | | - | | - | | 9,474 | | Total | | 19,854 | | 3,141 | | - | | 16,713 | |
Available-for-sale financial assets primarily consist of shares, mutual funds andcorporate and Government bonds. Corporate and Governmentandgovernment bonds are stated at fair value by reference to prices of similar securities at the reporting date. As they are not actively traded in an established market, these securities are classified as level 2.
Financial asset at fair value through profit or loss represents the Put Option on the 20% remaining ownership in Indonusa which was received as part of the divestment considerations (Note 3). Since the fair value is not observable and valuation technique is used to determine the fair value , this financial asset is classified as level 3.
F-119
PERUSAHAAN PERSEROAN (PERSERO)
| PT TELEKOMUNIKASI INDONESIA Tbk AND SUBSIDIARIES
| NOTES TO THE CONSOLIDATED FINANCIAL STATEMENTS
| As of January 1, 2012 (Restated), December 31, 2012 (Restated) and December 31, 2013
| and for the years ended December 31, 2011 (Restated), 2012 (Restated) and 2013
| (Figures in tables are presented in billions of rupiah, unless otherwise stated)
|
|
Tabel of Content
40. FINANCIAL RISK MANAGEMENT(continued)
2. Fair value of financial assets andfinancialliabilities(continued)
c. Fair value hierarchy (continued)
Shares and mutual funds actively traded in an established market are stated at fair value using quoted market price and classified within level 1.considerations. The valuation of the mutual funds invested incorporate and Government bonds and Put Optionput option requires significant management judgment due to the absence of quoted market prices and the inherent lack of liquidity andcomparable instruments in the long-term nature of such assets.market. As these investments arethe put option is subject to restrictions on redemption (such as transfer restrictions and initial lock-up periods) and observable activity for the investmentsinvestment is limited, these investments arethis investment is therefore classified within level 3 of the fair value hierarchy. Management considers among other assumptions, the valuation and quoted price of the arrangement of the mutual funds. The fair value of Put Option is determined using binomial tree model.
Reconciliations of the beginning and ending balances for items measured at fair value using significant unobservable inputs (level 3) as of December 31, 20122015 and 20132016 are as follows: | | 2012 | | 2013 | | Balance at January 1 | | 64 | | 48 | | Purchase | | 8 | | - | | PutOption | | - | | 289 | | Included in consolidated statementsof comprehensive income: | | | | | | Realized loss - recognizedin profit or loss | | (1 | ) | - | | Unrealized loss - recognizedin other comprehensive income | | (2 | ) | 8 | | Redemption | | (21 | ) | (48 | ) | Balance atDecember 31 | | 48 | | 297 | |
| 2015 | | 2016 | | Beginning balance | 290 | | 172 | | Unrealized loss recognizedin the consolidated statements of profit or loss and other comprehensive income | (118 | ) | (172 | ) | Ending balance | 172 | | - | |
F-119
PERUSAHAAN PERSEROAN (PERSERO) PT TELEKOMUNIKASI INDONESIA Tbk AND SUBSIDIARIES NOTES TO THE CONSOLIDATED FINANCIAL STATEMENTS As of December 31, 2015 and 2016 and for the Years Ended December 31, 2014, 2015 and 2016 (Figures in tables are expressedin billions ofRupiah, unless otherwise stated) 3.Table of Content
Offsetting35. FINANCIAL RISK MANAGEMENT (continued)
1. Financial assets andfinancialliabilities(continued) c. Fair value measurement
Fair value is the amount for which an asset could be exchanged, or liability settled, between parties in an arm’s length transaction. The Group determined the fair value measurement for disclosure purposes of each class of financial assets and financial liabilities based on the following methods and assumptions: (i)the fair values of short-term financial assets and financial liabilities with maturities of one year or less (cash and cash equivalents, trade and other receivables, other current financial assets, trade and other payables, accrued expenses, and short-term bank loans) and other non-current assets are considered toapproximate their carrying amountsas the impact of discounting is not significant; (ii)the fair values of long-term financial assets and financial liabilities (other non-current assets(long-term trade receivables and restricted cash)and liabilities) approximate their carrying amounts as they were measured based on the discounted future contractual cash flows; (iii)available-for-sale financial assets primarily consist of mutual funds,corporate andgovernment bonds. Mutual funds actively traded in an established market are stated at fair value using quoted market price or, if unquoted, determined using a valuation technique. Corporate andgovernment bonds are stated at fair value by reference to prices of similar securities at the reporting date; (iv)the fair values of long-termfinancialliabilities are estimated by discounting the future contractual cash flows of each liability at rates offered to the Group for similarliabilities of comparable maturities by the bankers of the Group, except for bonds which are based on market prices. The following representfair value estimates are inherently judgmental and involve various limitations, including: a. fair values presented do not take into consideration the recognizedeffect of future currency fluctuations. b. estimated fair values are not necessarily indicative of the amounts that the Group would record upon disposal/termination of the financial instrumentsassets and liabilities. 2.Financial risk management The Group’s activities exposeit to a variety of financial risks such as market risks (including foreign exchange risk, market price risk and interest rate risk), credit risk and liquidity risk. Overall,the Group’s financial risk management program is intended to minimize losses on the financial assets and financial liabilities arising from fluctuation of foreign currency exchange rates and the fluctuation of interest rates. Management has a written policy on foreign currency risk management mainly on time deposit placements and hedging to cover foreign currency risk exposures for periods ranging from 3 up to 12 months. Financial risk management is carried out bytheCorporate Finance unit under policies approved by the Board of Directors. TheCorporate Finance unit identifies, evaluates and hedges financial risks. a. Foreign exchange risk The Group is exposed to foreign exchange risk on sales, purchases and borrowings that are offset: | | 2012 | | 2013 | | | | Financial Assets | | Financial Liabilities | | Financial Assets | | Financial Liabilities | | Gross amounts | | 1,436 | | (913 | ) | 1,477 | | (684 | ) | The amounts that have right of set-off | | (781 | ) | 781 | | (597 | ) | 597 | | Net amounts presented in theconsolidated statements of financial position (Notes 7 and 15) | | 655 | | (132 | ) | 880 | | (87 | ) |
denominated in foreign currencies. The foreign currency denominated transactions are primarily in U.S.dollar and Japaneseyen. The Group’s exposures to other foreign exchange rates are not material. F-120
PERUSAHAAN PERSEROAN (PERSERO) PT TELEKOMUNIKASI INDONESIA Tbk AND SUBSIDIARIES NOTES TO THE CONSOLIDATED FINANCIAL STATEMENTS As of December 31, 2015 and 2016 and for the Years Ended December 31, 2014, 2015 and 2016 (Figures in tables are expressedin billions ofRupiah, unless otherwise stated) PERUSAHAAN PERSEROAN (PERSERO)
| PT TELEKOMUNIKASI INDONESIA Tbk AND SUBSIDIARIES
| NOTES TO THE CONSOLIDATED FINANCIAL STATEMENTS
| As of January 1, 2012 (Restated), December 31, 2012 (Restated) and December 31, 2013
| and for the years ended December 31, 2011 (Restated), 2012 (Restated) and 2013
| (Figures in tables are presented in billions of rupiah, unless otherwise stated)
|
|
TabelTable of Content
4351. FINANCIAL RISK MANAGEMENT (continued)
2.Financial risk management(continued) a. Foreign exchange risk (continued) Increasing risks of foreign currency exchange rates on the obligations of the Group are expected to bepartlyoffset by the effects of the exchange rates on time deposits and receivables in foreign currencies that are equal to at least 25% of the outstandingcurrent foreign currencyliabilities.
The following tablepresents the Group’s financial assets andfinancialliabilitiesexposure to foreign currency risk: | 2015 | | 2016 | | | U.S. dollar (in millions) | | Japanese yen (in millions) | | U.S. dollar (in millions) | | Japanese yen (in millions) | | Financial assets | 635 | | 11 | | 324 | | 6 | | Financial liabilities | (461 | ) | (6,947 | ) | (272 | ) | (6,169 | ) | Net exposure | 174 | | (6,936 | ) | 52 | | (6,163 | ) |
Sensitivity analysis
A strengthening of theU.S. dollar and Japaneseyen, as indicated below, against the rupiah atDecember 31, 2016 would have (decreased)/increased equity and profit or loss by the amounts shown below. This analysis is based on foreign currency exchange rate variances thatthe Group considered to be reasonably possible at the reporting date. The analysis assumes that all other variables, in particular interest rates, remain constant. | Equity/profit (loss) | | December 31, 2016 | |
| U.S. dollar (1% strengthening) | 7 |
| Japanese yen (5% strengthening) | (35 | ) |
A weakening of theU.S. dollar and Japaneseyen against the rupiah atDecember 31, 2016 would have had an equal but opposite effect on the above currencies at the amounts shown above, on the basis that all other variables remain constant. b. Market price risk The Group is exposed to changes in debt and equity market prices related to available-for-sale investments carried at fair value. Gain and losses arising from changes in the fair value of available-for-sale investments are recognized in equity. The performance of the Group’s available-for-sale investmentsis monitored periodically, together with a regular assessment of their relevance to the Group’s long-term strategic plans. As ofDecember 31, 2016, management considered the price risk on theGroup’s available-for-sale investments to be immaterial in terms of the possible impact on profit or loss and total equity from a reasonably possible change in fair value. F-121
PERUSAHAAN PERSEROAN (PERSERO) PT TELEKOMUNIKASI INDONESIA Tbk AND SUBSIDIARIES NOTES TO THE CONSOLIDATED FINANCIAL STATEMENTS As of December 31, 2015 and 2016 and for the Years Ended December 31, 2014, 2015 and 2016 (Figures in tables are expressedin billions ofRupiah, unless otherwise stated) Table of Content
35. FINANCIAL RISK MANAGEMENT(continued) 2.Financial risk management (continued) c. Interest rate risk Interest rate fluctuation is monitored to minimize any negative impact to financial performance. Borrowings at variable interest rates expose the Group to interest rate risk (Notes16 and 17). To measure market riskpertaining tofluctuations in interest rates, the Group primarily uses interest margin and maturity profile of the financial assets and liabilities based on changing schedule of the interest rate. At reporting date, the interest rate profile of the Group’s interest-bearing borrowings was as follows: | 2015 | | 2016 | | Fixed rate borrowings | (16,687 | ) | (16,383 | ) | Variable rate borrowings | (17,925 | ) | (15,416 | ) |
Sensitivity analysis for variable rate borrowings
As of December 31, 2016, a decrease (increase) by25 basis points in interest rates of variable rate borrowings would have increased (decreased) equity and profit or loss by Rp38.5 billion, respectively. This analysis assumes that all other variables, in particular foreign currency rates, remain constant.
d. Credit risk
The following table presentsthe maximum exposure to credit risk of the Group’s financial assets: | 2015 | | 2016 | | Cash and cash equivalents | 28,117 | | 29,767 | | Other current financial assets | 2,818 | | 1,471 | | Trade and other receivables | 7,872 | | 7,900 | | Other non-current assets | 379 | | 210 | | Total | 39,186 | | 39,348 | |
The Group is exposed to credit risk primarily fromcash and cash equivalents andtrade and other receivables. Credit risk from balances with banks and financial institutions is managed by the Group’sCorporate Finance department in accordance with the Group’s written policy. The Group placed the majority of its cash and cash equivalents in state-owned banks because they have the most extensive branch networks in Indonesia and are considered to be financially sound banks, as they are owned by the State. Therefore, it is intended to minimize financial loss through banks and financial institutions’ potential failure to make payments. F-122
PERUSAHAAN PERSEROAN (PERSERO) PT TELEKOMUNIKASI INDONESIA Tbk AND SUBSIDIARIES NOTES TO THE CONSOLIDATED FINANCIAL STATEMENTS As of December 31, 2015 and 2016 and for the Years Ended December 31, 2014, 2015 and 2016 (Figures in tables are expressedin billions ofRupiah, unless otherwise stated) Table of Content
35. FINANCIAL RISK MANAGEMENT(continued) 2.Financial risk management (continued) d. Credit risk (continued) The customer credit risk is managed by continuous monitoringofoutstanding balances and collection.Trade and other receivables do not have any major concentration of risk whereas no customerreceivable balance exceeds5% of trade receivables as ofDecember 31, 2016. Management is confident in its ability to continue to control and sustain minimal exposureto the customercredit risk given thatthe Group has recognized sufficientprovision for impairment of receivables to cover incurred loss arising from uncollectible receivables based on existing historicaldata on credit losses. e. Liquidity risk Liquidity risk arises in situations where the Group has difficulties in fulfilling financial liabilities when they become due. Prudent liquidity risk management implies maintaining sufficient cash in order tomeet the Group’s financialobligations. The Group continuously performs an analysis to monitorfinancial position ratios,such asliquidity ratios and debt-to-equity ratios, against debt covenant requirements. The following is the maturity profile of the Group’s financial liabilities based on contractual undiscounted payments:
| 2015 | | | Carrying amount | | Contractual cash flows | | 2016 | | 2017 | | 2018 | | 2019 | | 2020 and thereafter | | Trade and other payables | 14,284 | | (14,284 | ) | (14,284 | ) | - | | - | | - | | - | | Accrued expenses | 8,247 | | (8,247 | ) | (8,247 | ) | - | | - | | - | | - | | Interest-bearing loans and other borrowings | | | | | | | | | | | | | | | Two-step loans | 1,520 | | (1,791 | ) | (293 | ) | (282 | ) | (247 | ) | (219 | ) | (750 | ) | Bonds and notes | 9,548 | | (20,919 | ) | (1,032 | ) | (1,012 | ) | (1,008 | ) | (1,226 | ) | (16,641 | ) | Bank loans | 18,964 | | (23,760 | ) | (5,182 | ) | (4,339 | ) | (8,780 | ) | (2,037 | ) | (3,422 | ) | Obligations under finance leases | 4,580 | | (6,069 | ) | (1,027 | ) | (991 | ) | (888 | ) | (800 | ) | (2,363 | ) | Total | 57,143 | | (75,070 | ) | (30,065 | ) | (6,624 | ) | (10,923 | ) | (4,282 | ) | (23,176 | ) |
F-123
PERUSAHAAN PERSEROAN (PERSERO) PT TELEKOMUNIKASI INDONESIA Tbk AND SUBSIDIARIES NOTES TO THE CONSOLIDATED FINANCIAL STATEMENTS As of December 31, 2015 and 2016 and for the Years Ended December 31, 2014, 2015 and 2016 (Figures in tables are expressedin billions ofRupiah, unless otherwise stated) Table of Content
35. FINANCIAL RISK MANAGEMENT(continued) 2.Financial risk management (continued) e. Liquidity risk (continued) | 2016 | | | Carrying amount | | Contractual cash flows | | 2017 | | 2018 | | 2019 | | 2020 | | 2021 and thereafter | | Trade and other payables | 13,690 | | (13,690 | ) | (13,690 | ) | - | | - | | - | | - | | Accrued expenses | 11,283 | | (11,283 | ) | (11,283 | ) | - | | - | | - | | - | | Interest bearing loans and other borrowings | | | | | | | | | | | | | | | Two-step loans | 1,292 | | (1,487 | ) | (279 | ) | (244 | ) | (216 | ) | (209 | ) | (539 | ) | Bonds and notes | 9,323 | | (19,670 | ) | (969 | ) | (967 | ) | (1,187 | ) | (3,000 | ) | (13,547 | ) | Bank loans | 16,477 | | (20,421 | ) | (5,875 | ) | (5,635 | ) | (2,883 | ) | (2,565 | ) | (3,463 | ) | Obligations under finance leases | 4,010 | | (5,160 | ) | (987 | ) | (892 | ) | (816 | ) | (771 | ) | (1,694 | ) | Other borrowings | 697 | | (1,007 | ) | (60 | ) | (118 | ) | (164 | ) | (153 | ) | (512 | ) | Total | 56,772 | | (72,718 | ) | (33,143 | ) | (7,856 | ) | (5,266 | ) | (6,698 | ) | (19,755 | ) |
The difference between the carrying amount and the contractual cash flows is interest value. The interest values of variable-rate borrowings are determined based on the interest rates effective as of reporting dates. 36. CAPITAL MANAGEMENT The capital structure of the Group is as follows:follows: | | 2012 (Restated) | | 2013 | | 2015 | | 2016 | | | | Amount | | Portion | | Amount | | Portion | | Amount | | Portion | | Amount | | Portion | | Short-term debts | | 37 | | 0.06% | | 432 | | 0.54% | | 602 | | 0.55% | | 911 | | 0.79% | | Long-term debts | | 19,238 | | 29.45% | | 19,824 | | 24.78% | | 34,010 | | 31.05% | | 30,888 | | 26.63% | | Total debts | | 19,275 | | 29.51% | | 20,256 | | 25.32% | | 34,612 | | 31.60% | | 31,799 | | 27.42% | | Equity attributable to owners | | 46,055 | | 70.49% | | 59,753 | | 74.68% | | | Equity attributable to owners of the parent company | | 74,934 | | 68.40% | | 84,163 | | 72.58% | | Total | | 65,330 | | 100.00% | | 80,009 | | 100.00% | | 109,546 | | 100.00% | | 115,962 | | 100.00% | |
The Group’sGroup’s objectives when managing capital are to safeguard the Group’sGroup’s ability to continue as a going concern in order to provide returns for stockholders and benefits to other stakeholders and to maintain an optimum capital structure to minimize the cost of capital. Periodically, the Group conducts debt valuation to assess possibilities of refinancing existing debts with new ones which have more efficient cost that will lead to more optimized cost-of-debt. In case of idle cash with limited investment opportunities, the Group will consider buying back its shares of stock or paying dividend to its stockholders. In addition to complying with loan covenants, the Group also maintains its capital structure at the level it believes will not risk its credit rating andwhichis comparable withthat ofits competitors. F-124
PERUSAHAAN PERSEROAN (PERSERO) PT TELEKOMUNIKASI INDONESIA Tbk AND SUBSIDIARIES NOTES TO THE CONSOLIDATED FINANCIAL STATEMENTS As of December 31, 2015 and 2016 and for the Years Ended December 31, 2014, 2015 and 2016 (Figures in tables are expressedin billions ofRupiah, unless otherwise stated) Table of Content
36. CAPITAL MANAGEMENT(continued) Debt-to-equity ratio (comparing net interest-bearing debt to total equity) is a ratio which is monitored by management to evaluate the Group’s capital structure and review the effectiveness of the Group’s debts. The Group monitors its debt levels to ensure the debt-to-equity ratio complies with or is below the ratio set out in its contractual borrowings arrangements and that such ratiois comparable or better than that of regional area entities in the telecommunications industry. The Group’s debt-to-equity ratio as of December 31, 20122015 and 20132016 is as follows: | | 2012(Restated) | | 2013 | | 2015 | | 2016 | | Total interest bearing debts | | 19,275 | | 20,256 | | | Total interest-bearing debts | | 34,612 | | 31,799 | | Lesscash and cash equivalents | | (13,118 | ) | (14,696 | ) | (28,117 | ) | (29,767 | ) | Net debt | | 6,157 | | 5,560 | | 6,495 | | 2,032 | | Total equity attributable to owners | | 46,055 | | 59,753 | | | Net debt-to-equity ratio | | 13.37% | | 9.30% | | | Total equity attributable to owners of the parent company | | 74,934 | | 84,163 | | Net debt-to-equity ratio | | 8.67% | | 2.41% | |
As stated in Note 19,17, the Group is required to maintain a certain debt-to-equity ratio and debt service coverage ratio by the lenders. During the years ended December 31,2012 and 2013, the Group complied with the externally imposed capital requirements.
F-121
PERUSAHAAN PERSEROAN (PERSERO)
| PT TELEKOMUNIKASI INDONESIA Tbk AND SUBSIDIARIES
| NOTES TO THE CONSOLIDATED FINANCIAL STATEMENTS
| As of January 1, 2012 (Restated), December 31, 2012 (Restated) and December 31, 2013
| and for the years ended December 31, 2011 (Restated), 2012 (Restated) and 2013
| (Figures in tables are presented in billions of rupiah, unless otherwise stated)
|
|
Tabel of Content
4237. SUPPLEMENTAL CASH FLOW INFORMATION
The non-cash investing activities for the years ended December 31, 2011, 201231,2014,2015 and 20132016 are as follows: | | 2011 | | 2012 | | 2013 | | Acquisitions of property and equipment credited to: | | | | | | | | Trade payables | | 4,900 | | 4,627 | | 6,412 | | Obligations under finance leases | | 79 | | 2,588 | | 3,201 | | Non-monetary exchange | | 1,226 | | 1,686 | | 268 | | Acquisition of data center business | | - | | 150 | | - | | Reclassification of property and equipment to asset held for sale | | 791 | | - | | 105 | |
| 2014 | | 2015 | | 2016 | | Acquisitions of property and equipment: | | | | | | | Credited to trade payables | 5,621 | | 4,979 | | 6,199 | | Non-monetary exchange | 126 | | - | | 636 | | Credited to obligations under finance leases | 528 | | 452 | | 368 | | Interest capitalization | - | | - | | 188 | | Reclassification of property and equipment to assets held for sale | 41 | | - | | - | | Acquisitions of intangible assets: Credited to trade payables | 119 | | 179 | | 41 | |
4338. SUBSEQUENT EVENTS
a. On January 10, 2014, Sigma entered into short-term and long-term working capital facility agreements involving Rp25 billion and Rp322 billion, respectively,23, 2017, Telkom Akses received VAT restitution related to the tax overpayment letter for the development of data center located in Sentul.period May - December 2014 amounting to Rp169.4 billion. b. On JanuaryFebruary 15, 2014, PT Graha2017, the Company successfully launched its ninth satellite, Telkom Sigma (“GTS”)3S, in Kourou, French Guiana with an investment of US$215 million or equivalent to Rp2,896 billion, that includes the cost of manufacturing the satellite, launching services and PT Granary Reka Cipta signed an agreement for the development of utilization, and the development and processing of assets that belong to GTS located in Baturiti, Tabanan Bali. The cooperation is carried out under a revenue-sharing agreement for 10 years.insurance. c. On January 20, 2014,March 24, 2017, the Company filed an objection to the Tax Underpayment Assessment for VAT for the year 2007 that was received by the Company in November 2013 (Note 32). d.On January 22, 2014, Telkomsel received a formal verdict from the Tax Court concerning Telkomsel’s claim for tax refund for import duties. Based on its verdict, the Tax Court accepted portion of the claimGroup entered into several credit facilities agreements with Bank Mandiri, BNI and BRI amounting to Rp8.5Rp1,500 billion, (Note 32). As of the issuance date of the consolidated financial statements, Telkomsel has not received the refund.
e.On January 23, 2014, the Company establishedasubsidiary, PT Infrastruktur Telekomunikasi Indonesia (Telkom Infratel), whose establishment waslegalized based on the Ministry of LawRp1,500 billion and Human Rights (MoLHR) Decision Letter No. AHU-03196.AH.01.01. Year 2014.
f.On January 29, 2014, the MoCI issued Decision Letter No. 42 Year 2014, granting Telkomsel the license to provide:
a.Mobile telecommunication services with radio frequency bandwidth in the 900 MHz and 1800 MHz bands;
b.Mobile telecommunication services IMT-2000 with radio frequency bandwidth in the 2.1 GHz bands (3G); and
c.Basic telecommunication services.
The license replaced Decision Letter No. 101/KEP/M.KOMINFO/10/2006 dated October 11, 2006.
g.On January 30, 2014, the Indonesian Telecommunication Regulatory Body of Telkomsel, in its letter No. 118/KOMINFO/DJPPI/PI.02.04/01/2014, decided to implement new interconnection tariffs effective from February 2014 until December 2016, subject to evaluation on an annual basis.
h.On February 20, 2014, Infomedia made a drawdown from the credit facility from Bank UOB amounting to Rp70Rp1,000 billion, (Note 18a). respectively.
F-122F-125
PERUSAHAAN PERSEROAN (PERSERO) PT TELEKOMUNIKASI INDONESIA Tbk AND SUBSIDIARIES NOTES TO THE CONSOLIDATED FINANCIAL STATEMENTS As of December 31, 2015 and 2016 and for the Years Ended December 31, 2014, 2015 and 2016 (Figures in tables are expressedin billions ofRupiah, unless otherwise stated) PERUSAHAAN PERSEROAN (PERSERO)
| PT TELEKOMUNIKASI INDONESIA Tbk AND SUBSIDIARIES
| NOTES TO THE CONSOLIDATED FINANCIAL STATEMENTS
| As of January 1, 2012 (Restated), December 31, 2012 (Restated) and December 31, 2013
| and for the years ended December 31, 2011 (Restated), 2012 (Restated) and 2013
| (Figures in tables are presented in billions of rupiah, unless otherwise stated)
|
|
TabelTable of Content
4439. NEW ACCOUNTING STANDARDS AND INTERPRETATIONS NOT YET ADOPTED
The accounting standards and interpretations that are issued, but not yet effective for the year ended December 31, 20132016 and which have not been applied in preparing these consolidated financial statements are disclosed below. The Group intends to adopt these standards, if applicable, when they become effective. Effective for annual periods beginning on or after January 1, 2014 2017 · IAS 32, Offsetting Financial Assets and Financial Liabilities - Amendments to IAS 327, Disclosure Initiative These amendments clarifyThe amendmentsrequire the meaningentity to provide disclosures that enable users of “currently has a legally enforceable rightfinancial statements to set off”. The amendments also clarify the application of the IAS 32 offsetting criteria to settlement systems (such as central clearing house systems) which apply gross settlement mechanisms that are not simultaneous. These amendments are not expected to impact the Group’s consolidated financial position or performance.evaluate changes in liabilities arising from financing activities, including both changes arising from cash flows and non-cash changes.
· IFRS 9, Financial Instruments: ClassificationAmendments to IAS 12, Recognition of Deferred Tax Assets for Unrealised Losses The amendments: -Add illustrative examples to clarify that the deductible temporary differences arise when the carrying amount of debt instruments measured at fair value and Measurementthe fair value is less than the taxable base, regardless of whether the entity expects to recover the carrying amount of a debt instrument by sale or by use, for example by holding it and collecting contractual cash flows, or a combination of both. -Clarify that in order to assess whether taxable profits will be available against which it can utilise a deductible temporary difference, the assessment of that deductible temporary difference is carried out in accordance with tax law. -Clarify that tax reduction from the reversal of deferred tax assets is excluded from the estimation of future taxable profit. The entity compares the deductible temporary differences with future taxable profit that excludes tax deductions resulting from the reversal of those deductible temporary differences to assess whether the entity has sufficient future taxable profit. -The estimate of probable future taxable profit may include the recovery of some of an entity’s assets for more than their carrying amount if there is sufficient evidence that it is probable that the entity will achieve this. ·Amendments to IFRS 9, as issued, reflects the first phase12, Clarification of the IASB’s work onScope of the replacementStandard IFRS 12 is amended to clarify that when an entity’s interest in a subsidiary, a joint venture or an associate (or a portion of IAS 39 and appliesits interest in a joint venture or an associate) is classified (or included in a disposal group that is classified) as held for sale in accordance with IFRS 5, the entity is not required to classification and measurementdisclose summarized financial information of financial assets and financial liabilities as definedthat subsidiary, joint venture or associate in IAS 39. The standard was initially effectiveaccordance with paragraphs B10-B16 of IFRS 12. Effective for annual periods beginning on or after January 1, 2013, but2018 Amendments to ·IFRS 9, Mandatory Effective Date of Financial Instruments
IFRS 9 and Transition Disclosures , issued in December 2011, moved the mandatory effective date to January 1, 2015. In subsequent phases, the IASB will address hedge accounting and impairment of financial assets. The adoption of the first phase of IFRS 9 will have an effectincludes revised guidance on the classification and measurement of the Group’sfinancial instruments, including a new expected credit loss model for calculating impairment on financial assets, butand the new general hedge accounting requirements. It also carries forward the guidance on recognition and derecognition of financial instruments from IAS 39. IFRS 9, published in July 2014, replaces the existing guidance in IAS 39, Financial Instruments: Recognition and Measurement. IFRS 9 is effective for annual reporting periods beginning on or after 1 January 2018, with early adoption permitted. The Group does not intend to adopt IFRS 9 before the effective date.
F-126
PERUSAHAAN PERSEROAN (PERSERO) PT TELEKOMUNIKASI INDONESIA Tbk AND SUBSIDIARIES NOTES TO THE CONSOLIDATED FINANCIAL STATEMENTS As of December 31, 2015 and 2016 and for the Years Ended December 31, 2014, 2015 and 2016 (Figures in tables are expressedin billions ofRupiah, unless otherwise stated)
Table of Content
39. NEW ACCOUNTING STANDARDS AND INTERPRETATIONS NOT YET ADOPTED (continued) Effective for annual periods beginning on or after January 1, 2018 (continued) ·IFRS 9, Financial Instruments (continued) While the Group has yet to undertake a detailed assessment of the classification and measurement of financial assets, mutual funds and corporate and government bonds currently classified as available-for-sale financial assets would appear to satisfy the conditions for classification as at fair value through other comprehensive income (FVOCI) and hence there will be no change to the accounting for these assets. The other financial assets held by the Group include cash and cash equivalents, other current financial assets, trade and other receivables, and other non-current assets (long-term trade receivables and restricted cash) currently classified as loans and receivables and measured at amortized cost which appear to meet the conditions for classification at amortized cost under IFRS 9. Accordingly, the Group does not expect the new guidance to have ana significant impact on the classification and measurementsmeasurement of its financial assets. There will be no impact on the Group’s accounting for financial liabilities, as the new requirements only affect the accounting for financial liabilities that are designated at fair value through profit or loss and the Group does not have any such liabilities. The new impairment model requires the recognition of impairment provisions based on expected credit losses (ECL) rather than only incurred credit losses as is the case under IAS 39. While the Group has not yet undertaken a detailed assessment of how its impairment provisions would be affected by the new model, it may result in an earlier recognition of credit losses. ·IFRS 15, Revenue from Contracts with Customers IFRS 15establishes a comprehensive framework to determine how, when and how much revenue is to be recognized. The standard provides a single, principles-based five-step model for the determination and recognition of revenue to be applied to all contracts with customers. The standard also provides specific guidance requiring certain types of costs to obtain and/or fulfil a contract to be capitalized and amortized on a systematic basis that is consistent with the transfer to the customer of the goods or services to which the capitalized cost relates. IFRS 15replaces a number of existing revenue standards, including IAS 18 - Revenue, IAS 11 - Construction Contracts and IFRIC 13 - Customer Loyalty Programmes. IFRS 15 will be effective for annual reporting periods beginning on or after 1 January 2018, with a permission for early adoption. There are two transition methods available for implementation. Under one method, the standard is applied retrospectively to contracts for each reporting period presented, subject to allowable practical expedients. Under the other method, the Group is allowed to use a modified retrospective approach by applying IFRS 15 only to the most current period presented, recognizing the cumulative effect of the change as an adjustment to the beginning balance of retained earnings, and provides additional disclosures comparing the results to the previous revenue guidance. Further, under the modified retrospective approach, the Group may elect to apply IFRS 15 only to contracts that are not completed as of January 1, 2018. F-127
PERUSAHAAN PERSEROAN (PERSERO) PT TELEKOMUNIKASI INDONESIA Tbk AND SUBSIDIARIES NOTES TO THE CONSOLIDATED FINANCIAL STATEMENTS As of December 31, 2015 and 2016 and for the Years Ended December 31, 2014, 2015 and 2016 (Figures in tables are expressedin billions ofRupiah, unless otherwise stated) Table of Content
39. NEW ACCOUNTING STANDARDS AND INTERPRETATIONS NOT YET ADOPTED (continued) Effective for annual periods beginning on or after January 1, 2018 (continued) ·IFRS 15, Revenue from Contracts with Customers (continued) The Grouphas decided not to early adopt IFRS 15 and will apply the modified retrospective approach to adopt the standard beginning on January 1, 2018. The Groupis still in the process of assessing the full implications of this standard. However, the Group expects the following indicative impacts: -IFRS 15puts greater emphasis on identifying distinct performance obligations within a contract. A performance obligation is a promise to transfer a distinct good or service to a customer. The Group is currently assessing performance obligations that are included in the customer contracts with bundled services. The Group expects there will be changes to the timing of recognition and allocation of revenue across the identified performance obligations in bundled contracts under IFRS 15 as compared to the existing practice. -IFRS 15requires the Group to capitalize some portion of the costs incurred to obtain contracts and/ or fulfil performance obligations of contracts that are satisfied over time as an asset on the statement of financial liabilities. The Groupposition. In contrast to the current treatment where these costs are expensed at a point in time as incurred, the capitalized contract fulfilment costs will quantify the effect in conjunctionbe amortized on a systematic basis that is consistent with the other phases, whentransfer to the final standard, includingcustomer of the goods or services to which the costs relate. -IFRS 15gives more guidance on how to account for contract modifications compared to the current revenue standards. Depending on whether distinct goods and services are provided, and the pricing involved, the Group may have to reallocate the transaction prices of the modified contracts across the outstanding performance obligations. -Therewill be a corresponding effect on deferred tax assets or liabilities in relation to all phases, is issued.of the above impacts. · Amendments to IAS 36, Impairment of Assets on Recoverable Amount Disclosures28, Measuring an Associate or Joint Venture at Fair Value These amendments address the disclosure of information about the recoverable amount of impaired assets ifIAS 28 is amended to clarify that amount is based onwhen an investment entity elects to measure its investment in an associate or joint venture at fair value less coststhrough profit or loss in accordance with IFRS 9, it shall make this election separately for each associate or joint venture, at initial recognition of disposal. The Group does not expect that these amendments will have material financial impact in future financial statements.the associate or joint venture.
A non-investment entity investor can elect to retain the fair value accounting applied by its investment entity associate or joint venture. This election is made separately for each investment entity associate or joint venture, at the later of the date on which (a) the investment entity associate or joint venture is initially recognized; (b) the associate or joint venture becomes an investment entity; and (c) the investment entity associate or joint venture first becomes a parent. · IFRS Interpretations Committee (“IFRIC”) Interpretation 21 Levies (IFRIC 21)Amendments to IAS 40, Transfer of Investment Property IFRIC 21 clarifiesIAS 40 is amended to clarify that an entity recognizesentityshall transfer a liability forproperty to, or from, investment property when, and only when, there is a levychange in use. A change in use occurs when the activity that triggers payment, as identified byproperty meets, or ceases to meet, the relevant legislation, occurs. Fordefinition of investment property and there is evidence of the change in use. In isolation, a levy that is triggered upon reachingchange in management’s intentions for the use of a minimum threshold, the interpretation clarifies that no liability should be anticipated before the specified minimum threshold is reached. The Groupproperty does not expect that IFRIC 21 will have materialprovide evidence of a change in use.
·Amendments to IFRS 1, Deletion of Short-term Exemptions for First-time Adopters IFRS 1 is amended to delete short-term exemptions for first-time adopters regarding disclosures about financial impact in future financial statements. instruments, employee benefits and investment entities. F-123F-128
PERUSAHAAN PERSEROAN (PERSERO) PT TELEKOMUNIKASI INDONESIA Tbk AND SUBSIDIARIES NOTES TO THE CONSOLIDATED FINANCIAL STATEMENTS As of December 31, 2015 and 2016 and for the Years Ended December 31, 2014, 2015 and 2016 (Figures in tables are expressedin billions ofRupiah, unless otherwise stated) PERUSAHAAN PERSEROAN (PERSERO)
| PT TELEKOMUNIKASI INDONESIA Tbk AND SUBSIDIARIES
| NOTES TO THE CONSOLIDATED FINANCIAL STATEMENTS
| As of January 1, 2012 (Restated), December 31, 2012 (Restated) and December 31, 2013
| and for the years ended December 31, 2011 (Restated), 2012 (Restated) and 2013
| (Figures in tables are presented in billions of rupiah, unless otherwise stated)
|
|
TabelTable of Content
4439. NEW ACCOUNTING STANDARDS AND INTERPRETATIONS NOT YET ADOPTED (continued)
Effective for annual periods beginning on or after January 1, 2018 (continued) ·Amendments to IFRS 2, Classification and Measurement of Shared-based Payment Transactions IFRS 2 is amended to provide some additional accounting requirement for cash-settled share-based payment transactions regarding treatment of vesting and non-vesting conditions, share-based payment transactions with a net settlement feature for withholding tax obligations, and modification of a share-based payment transaction that changes its classification from cash-settled to equity-settled. ·IFRS Interpretation Committee (IFRIC) 22, Foreign Currency Transactions and Advance Consideration IFRIC 22 defines that the date on which an entity initially recognizes the non-monetary asset or non-monetary liability arising from the payment or receipt of advance consideration is the date of the transaction for the purpose of determining the exchange rate to use on initial recognition of the related asset, expense or income (or part of it) on the derecognition of a non-monetary asset or non-monetary liability arising from the payment or receipt of advance consideration in a foreign currency. Effective for annual periods beginning on or after January 1, 2019 ·IFRS 16, Leases IFRS 16 was issued in January 2016 and it replaces IAS 17, Leases and IFRIC 4 Determining whether an Arrangement contains a Lease. IFRS 16 sets out the principles for the recognition, measurement, presentation and disclosure of leases and requires lessees to account for all leases under a single on-balance sheet model similar to the accounting for finance leases under IAS 17. The standard includes two recognition exemptions for lessees – leases of ’low-value’ assets (e.g., personal computers) and short-term leases (i.e., leases with a lease term of 12 months or less). At the commencement date of a lease, a lessee will recognize a liability to make lease payments (i.e., the lease liability) and an asset representing the right to use the underlying asset during the lease term (i.e., the right-of-use asset). Lessees will be required to separately recognize the interest expense on the lease liability and the depreciation expense on the right-of-use asset. Lessees will be also required to remeasure the lease liability upon the occurrence of certain events (e.g., a change in the lease term, a change in future lease payments resulting from a change in an index or rate used to determine those payments). The lessee will generally recognize the amount of the remeasurement of the lease liability as an adjustment to the right-of-use asset. Lessor accounting under IFRS 16 is substantially unchanged from today’s accounting under IAS 17. Lessors will continue to classify all leases using the same classification principle as in IAS 17 and distinguish between two types of leases: operating and finance leases. F-129
PERUSAHAAN PERSEROAN (PERSERO) PT TELEKOMUNIKASI INDONESIA Tbk AND SUBSIDIARIES NOTES TO THE CONSOLIDATED FINANCIAL STATEMENTS As of December 31, 2015 and 2016 and for the Years Ended December 31, 2014, 2015 and 2016 (Figures in tables are expressedin billions ofRupiah, unless otherwise stated) Table of Content
39. NEW ACCOUNTING STANDARDS AND INTERPRETATIONS NOT YET ADOPTED (continued) Effective for annual periods beginning on or after January 1, 2014 2019 (continued) · IAS 39 Novation of Derivatives and Continuation of Hedge Accounting - Amendments to IAS 39IFRS 16, Leases (continued) These amendments provide relief from discontinuing hedge accounting when novation of a derivative designated as a hedging instrument meets certain criteria. The Group has not novatedany derivatives during the current period. However, these amendments would be considered for future novations.IFRS 16 also requires lessees and lessors to make more extensive disclosures than under IAS 17.
EffectiveIFRS 16 is effective for annual periods beginning on or after July 1 201January 2019. Early application is permitted, but not before an entity applies IFRS 15. A lessee can choose to apply the standard using either a full retrospective or a modified retrospective approach. The standard’s transition provisions permit certain reliefs. The Group does not intend to adopt the standard before the effective date.
The Group is currently assessing the potential impact of IFRS 16 on its consolidated financial statements. 4 The effective date was postponed to a date yet to be determined
· Amendments to IFRS 10 and IAS 19 -Defined Benefit Plans: Employee28, Sale or Contribution This amends the requirement of the contributions from employeesAssets between an Investor and its Associate or third parties that are linked to service. If contributions are not linked to service, theywill affect remeasurements of the net defined benefit liability (asset). If contributions are linked to service and independent of the number of years of service, an entity is permitted to recognize such contributions as reduction in the service cost in the period in which the related service is rendered. If contributions are linked and dependent of the number of years of service, an entity is required to attribute those contributions to periods of service using the same attribution method for the gross benefits (i.e., either using the plan’s contribution formula or on straight-line basis). Based on preliminary analyses, no material impact is expected on the consolidated financial position and performance of the Group.
·Amendments to IAS 24 - Key Management Personnel
These amendments introduce additional criteria for the entity that can be classified as related party to the reporting entity. The additional criteriaprovides thatan entity is related to the reporting entity if that entity, or any member of a group of which it is a part, provides key management personnel services to the reporting entity or to the parent of the reporting entity. These amendments also introduce additional disclosure requirements related to that new related party criterion. These amendments are not expected to impact the Group’s consolidated financial position or performance.
·Amendments to IFRS 2 - Definition of Vesting Condition
These amendments modify the definitions of “market condition” and “vesting conditions” and add the definitions of “performance condition” and “service condition”. Based on preliminary analyses, these amendments are not expected to impact the Group’s consolidated financial position or performance.
·Amendments to IAS 16, Property Plant EquipmentJoint Venture
TheseThe amendments clarify thatprovide guidance for accounting treatment when an itema parentlosescontrol of property, plant and equipment is revalued, the carrying amount of the asset is adjusted to the revalued amount. The restatement of the accumulated depreciation is not always proportionate to the change in the gross carrying amount but is adjusteda subsidiary in a manner that is consistenttransaction with an associate or joint venture. The amendments require full gain to be recognized when the revaluation ofthecarrying amountassets transferred meet the definition of the asset.The accumulated depreciation at the date of the revaluation is adjusted to equal the difference between the gross carrying amount and the carrying amount of the asset after taking into account accumulated impairment losses.a “business” under IFRS 3, Business Combinations. These amendments are not expected to impact the Group’s consolidated financial position or performance.
F-124
PERUSAHAAN PERSEROAN (PERSERO)
F-130 | PT TELEKOMUNIKASI INDONESIA Tbk AND SUBSIDIARIES
| NOTES TO THE CONSOLIDATED FINANCIAL STATEMENTS
| As of January 1, 2012 (Restated), December 31, 2012 (Restated) and December 31, 2013
| and for the years ended December 31, 2011 (Restated), 2012 (Restated) and 2013
| (Figures in tables are presented in billions of rupiah, unless otherwise stated)
|
|
Tabel of Content
44. NEW ACCOUNTING STANDARDS AND INTERPRETATIONS NOT YET ADOPTED (continued)
Effective for annual periods beginning on or after July 1, 2014 (continued)
·Amendmends toIAS 38, Intangible Assets
These amendments clarify that when an item of intangible asset is revalued, the carrying amount of the asset is adjusted to the revalued amount. The restatement of the accumulated amortization is not always proportionate to the change in the gross carrying amount but is adjusted in a manner that is consistent with the revaluation ofthecarrying amount of the asset. The accumulated amortization at the date of the revaluation is adjusted to equal the difference between the gross carrying amount and the carrying amount of the asset after taking into account accumulated impairment losses. These amendments are not expected to impact the Group’s consolidated financial position or performance.
·Amendment to IAS 40, Investment Property
The amendment clarifies theinterrelationship between IFRS 3 and IAS 40 when classifying property as investment property or owner-occupied property.The Group does not expect that this amendment will have material financial impact in future financial statements.
·Amendments to IFRS 8, Operating Segment
These amendments require an entity to disclose information about the judgments made by management in applying the aggregation criteria of operating segments as a complement of the disclosure required. The amendments also require an entity to provide a reconciliation of the total of the reportable segments’ assets to the entity’s assets if the entity reports a measure of total assets and liabilities for each reportable segment.Based on preliminary analyses, no material impact is expected on the consolidated financial position and performance of theGroup.
·Amendments to IFRS 3 - Accounting for Contingent Consideration in a Business Combination and Scope Exception for Joint Ventures
These amendments require that the acquirer shall classify an obligation to pay contingent consideration that meets the definition of a financial instrument as a financial liability or as equity on the basis of the definitions of an equity instrument and a financial liability in IAS 32, Financial Instruments: Presentation. The amendments also clarify that IFRS 3 does not apply to the accounting for the formation of a joint arrangement in the financial statements of the joint arrangement itself. These amendments are not expected to impact the Group’s consolidated financial position or performance.
·Amendment to IFRS 13 - Portfolio Exception
An entity that manages the group of financial assets and financial liabilities on the basis of its net exposure to either market risks or credit risks is permitted to apply an exception for measuring at fair value. The amendment clarifies that the exception applies only to financial assets, financial liabilities and other contracts within the scope of IAS 39, Financial Instruments: Recognition and Measurement or IFRS 9 Financial Instruments. The amendment is not expected to impact the Group’s consolidated financial position or performance.
F-125
|