The following table sets forth information as to the period end, average, the high and the low exchange rate for Canadian Dollars and U.S. Dollars for the periods indicated based on the noon buying rate in New York City for cable transfers in Canadian Dollars as certified for customs purposes by the Federal Reserve Bank of New York (Canadian dollar = US$1).
| Year Ended | ||||
| January 31, | Average | Period End | High | Low |
| 2005 | 1.2960 | 1.2380 | 1.3968 | 1.1774 |
| 2006 | 1.2060 | 1.1439 | 1.2704 | 1.1439 |
| 2007 | 1.1358 | 1.1792 | 1.1824 | 1.0990 |
| 2008 | 1.0603 | 1.0022 | 1.1853 | 0.9170 |
| 2009 | 1.0849 | 1.2364 | 1.2969 | 0.9719 |
Year Ended January 31, | Average | Period End | High | Low |
| 2003 | 1.5655 | 1.5286 | 1.6112 | 1.5108 |
| 2004 | 1.3803 | 1.3265 | 1.5315 | 1.2690 |
| 2005 | 1.2961 | 1.2396 | 1.3970 | 1.1775 |
| 2006 | 1.2061 | 1.1436 | 1.2703 | 1.1436 |
| 2007 | 1.1357 | 1.1792 | 1.1824 | 1.0989 |
The following table sets forth the high and low exchange rate for the past six months.months based on the noon buying rate. As of July 25, 2007,August 10, 2009, the exchange rate was CDN$1.04231.0848 for each US$1.
| Month | High | Low |
| February 2009 | 1.2890 | 1.2192 |
| March 2009 | 1.3000 | 1.2245 |
| April 2009 | 1.2643 | 1.1940 |
| May 2009 | 1.1872 | 1.0872 |
| June 2009 | 1.1625 | 1.0827 |
| July 2009 | 1.1655 | 1.0790 |
Month | High | Low |
| January 2007 | 1.1824 | 1.1647 |
| February 2007 | 1.1852 | 1.1586 |
| March 2007 | 1.181 | 1.153 |
| April 2007 | 1.1583 | 1.068 |
| May 2007 | 1.1136 | 1.0707 |
| June 2007 | 1.0727 | 1.0579 |
C. Reasons for the Offer and Use of Proceeds
Not Applicable.
D. Risk Factors
In addition to the other information presented in this Annual Report, the following should be considered carefully in evaluating the Company and its business. This Annual Report contains forward-looking statements that involve riskrisks and uncertainties. The Company’s actual results may differ materially from the results discussed in the forward-looking statements. Factors that might cause such a difference include, but are not limited to, those discussed below and elsewhere in this Annual Report.
We will be required to raise additional capital to mine our properties.
The Company is currently in the exploration stage of its properties. If the Company determines based on its most recent information that it is feasible to begin operations on its properties, the Company will be required to raise additional capital in order to develop and bring the properties into production. TheThe commercial quantities of ore cannot be accurately predicted.
Whether an ore body will be commercially viable depends on a number of factors including the particular attributes of the deposit, such as size, grade and proximity to infrastructure, as well as mineral prices and government regulations, including regulations relating to prices, taxes, royalties, land tenure, land use, importing and exporting of minerals and environmental protection. The exact effect of these factors cannot be accurately predicted, but the combination of these factors may result in a mineral deposit being unprofitable.The mining industry is highly speculative and involves substantial risks
. The mining industry, from exploration, development and production is a speculative business, characterized by a number of significant risks including, among other things, unprofitable efforts resulting not only from the failure to discover mineral deposits but from finding mineral deposits which, though present, are insufficient in quantity and quality to return a profit from production. The marketability of minerals acquired or discovered by the Company may be affected by numerous factors which are beyond the control of the Company and which cannot be accurately predicted, such as market fluctuations, the proximity and capacity of milling facilities, mineral markets and processing equipment, and government regulations, including regulations relating to royalties, allowable production, importing and exporting of minerals, and environmental protection. The combination of such factors may result in the Company not receiving an adequate return on investment capital.The Company’s properties are all at the exploration stage and have no proven reserves
. All of theThe Company’s mineral exploration efforts may be unsuccessful
. Despite exploration work on its mineral claims, no known bodies of commercial ore or economic deposits have been established on any of the Company’s properties. In addition, the Company is at the exploration stage on all of its properties and substantial additional work will be required in order to determine if any economic deposits occur on the Company’s properties. Even in the event commercial quantities of minerals are discovered, the exploration properties might not be brought into a state of commercial production. Finding mineral deposits is dependent on a number of factors, including the technical skill of exploration personnel involved. The commercial viability of a mineral deposit once discovered is also dependent on a number of factors, some of which are particular attributes of the deposit, such as size, grade and proximity to infrastructure, as well as metal prices.7
Competition for mineral land
. There is a limited supply of desirable mineral lands available for acquisition, claim staking or leasing in the areas where the Company contemplates expanding its operations and conducting exploration activities. Many participants are engaged in the mining business, including large, established mining companies. Accordingly, there can be no assurance that the Company will be able to compete successfully for new mining properties.Uncertainty of exploration and development programs
. TheLicenses and permits
. The operations of the Company require licenses and permits from various governmental authorities. The Company believes that it holds all necessary licenses and permits under applicable laws and regulations and believes that it is presently complying in all material respects with the terms of such licenses and permits. However, such licenses and permits are subject to change in various circumstances. There can be no guarantee that the Company will be able to obtain or maintain all necessary licenses and permits as are required to explore and develop its properties, commence construction or operation of mining facilities and properties under exploration or development or to maintain continued operations that economically justify the cost.Litigation.
Although the Company is not currently subject to litigation, it may become involved in disputes with other parties in the future which may result in litigation. Any litigation could be costly and time consuming and could divertAcquisitions
. The Company undertakes evaluations of opportunities to acquire additional mining properties. Any resultant acquisitions may be significant in size, may change the scale of the8
Conflict of interest.
Certain directors and officers of the Company are officers and/or directors of, or are associated with, other natural resource companies that acquire interests in mineral properties. Such associations may give rise to conflicts of interest from time to time. The directors are required by law, however, to act honestly and in good faith with a view to the best interests of the Company and its shareholders and to disclose any personal interest which they may have in any material transaction which is proposed to be entered into with the Company and to abstain from voting as a director for the approval of any such transaction.Uncertainty of continuing as a going concern.
The continuation of the Company and the recoverability of mineral property costs depends upon its ability to discover economically recoverable mineral reserves, attain profitable operations and generate cash flow from operations and/or to raise equity capital through the sale of its securities. TheLimited and volatile trading volume.
Although theVolatility of share price.
In recent years, securities markets in Canada have experienced a high level of price volatility. The market price of many resource companies, particularly those, like the Company, that are considered speculative exploration companies, have experienced wide fluctuations in price, resulting in substantial losses to investors who have sold their shares at a low price point. These fluctuations are based only in part on the level of progress of exploration, and can reflect general economic and market trends, world events or investor sentiment, and may sometimes bear no apparent relation to any objective factors or criteria. During theDifficulty for United States investors to effect service of process against the Company.
The Company is incorporated under the laws of the Province of British Columbia, Canada. Consequently, it will be difficult for United States investors toThe Company has incurred net losses since ourits inception and expect losses to continue.
There are no assurances that we will discover minerals on a commercially viable basis.
The Company’s ability to generate revenues and profits is expected to occur through exploration, development and production of its existing properties as well as through acquisitions of interests in new properties. Substantial expenditures will be incurred in an attempt to establish the economic feasibility of mining operations by identifying mineral deposits and establishing ore reserves through drilling and other techniques, developing metallurgical processes to extract metals from ore, designing facilities and planning mining operations.9
The economic feasibility of a project depends on numerous factors, including the cost of mining and production facilities required to extract the desired minerals, the total mineral deposits that can be mined using a given facility, the proximity of the mineral deposits to a user of the minerals, and the market price of the minerals at the time of sale. There is no assurance that existing or future exploration programs or acquisitions will result in the identification of deposits that can be mined profitably.
The Company'sCompany’s exploration activities are subject to various federal, state and local laws and regulations.
Market price is highly speculative.
The market prices of metals are highly speculative and volatile. Instability in metal prices may affect the interest in mining properties and the exploration, development and production of such properties. If gold prices substantially decline, this may adversely affect the Company’s ability to raise capital to explore for existing and new mineral properties.The Company operates in a highly competitive industry
. The Company competes with other developmental resource companies which have similar operations, and many competitors have operations and financial resources and industry experience greater than those of the Company. The Company may encounter increasing competition from other mining companies in its efforts to acquire mineral properties and hire experienced resource industry professionals. Increased competition inPenny stock rules may make it more difficult to trade the Company’s common shares.
TheThe Company is subject to foreign currency fluctuations
Item 4.
Information on the CompanyCautionary Note to United States Investors
The Company describes its properties utilizing mining terminology such as “measured resources” and “indicated resources” that are required by Canadian regulations but are not recognized by the SEC.United States investors are cautioned not to assume that any part of the mineral deposits in these categories will ever be converted into reserves.
10
A. History and Development of the Company
The Company was organized under theCompany Actof the Province of British Columbia, Canada on January 22, 1981 under the name of Carol Energy Corporation, which name was changed to Coral Energy Corporation on March 3, 1982, and to Coral Gold Corp. on September 9, 1987. On September 14, 2004, the Company changed it name to Coral Gold Resources Ltd in conjunction with a 10 to 1 share consolidation. The principal executive office of the Company is located at 455 Granville Street, Suite 400, Vancouver, British Columbia V6C 1T1, and its telephone number is 604-682-3701.
The Company is a natural resource company primarily engaged in the exploration and development of natural resource properties. OurIts principal business activities have been the exploration of certain mineral properties located in the States of Nevada and California in the United States. Since fiscal 2004, we have made aggregate principal capital2007, the Company has spent $5,343,825 on mineral property acquisition and exploration expenditures of $2,936,348 on ourits properties known as the Robertson Mining Claims located in the State of Nevada. The Robertson Mining Claims comprise three separate claim groups known as: (i) the Robertson Property;Core Claims; (ii) the Carve Out Claims, and (iii) the Norma Sass and Ruf Claims. Of the aggregate capital expenditures of $2,936,348, $2,894,520 was spent on the Robertson Property and $41,829 was spent on the Norma Sass and Ruf Claims.
In the 2006 fiscal year, the Company completed the purchase of 1,391,860 shares of Marcus Corporation, which we refer to as "Marcus"“Marcus”, representing 98.49% of the total issued shares of Marcus. Marcus is a non-reporting Nevada corporation, which owns the Marcus mining claims, consisting of 39 unpatented lode claims and two placer claims, and which comprise a portion of the Company’s Robertson Property. By acquiring Marcus, the Company now controls Marcus and owns an indirect interest in the mining lease between the Company and Marcus, which provides for an annual advanced royalty to Marcus of US$12,000, and a 5% net smelter returns royalty up to a maximum payment of US$2.5 million.
In consideration of the acquisition, the Company issued one common share of the Company for every four common shares of Marcus, for a total of 347,964 common shares of the Company. In addition, each tendering Marcus shareholder received a non-transferable share purchase warrant, permitting such shareholders to purchase one additional common share of the Company at an exercise price of $2.00 per share for a period of up to two years from the closing date of the acquisition, for every two shares of the Company received on the share exchange.
Please refer to noteNote 6 of the financial statements (Item 17) for information regarding the Company'sCompany’s principal capital expenditures on its mineral properties.
At the AnnnualAnnual General Meeting of the Company on July 17, 2007, the shareholders of the Company passed an ordinary resolution amending the Company'sCompany’s share structure by subdividing the Company'sCompany’s issued share capital of 8,267,360 common shares without par value into 24,802,080 common shares without par value, every one common share being subdivided into three common shares, referred to as the "Subdivision"“Subdivision”. For the purpose of this Annual Report, all amounts with respect to the Company's common shares and options do not take into account the Subdivision as it has yet to be implemented.
B. Business Overview
Operations and Principal Activities
Presently, the Company’s principal business activity is the exploration of mineral properties. The Company is in the process of exploring its mineral properties and has not yet determined whether its mineral properties contain ore reserves that are economically recoverable. There is no assurance that a commercially viable mineral deposit exists on any of the Company'sCompany’s properties, and future exploration will be required before final evaluation as to the economic and legal feasibility is determined.
The Company’s mining claims are located in the states of Nevada and California in the United States. The Company’s present principal exploration activities have been focused on the Robertson Mining Claims located in Crescent Valley, Nevada.
During the fiscal year ended January 31, 1999, the Company entered into an option agreement dated October 8, 1998, which we refer to as the "Option Agreement"“Option Agreement”, with Placer Dome U.S. Inc., referred to as "Placer"“Placer”, which was later assigned by Placer to the Cortez Joint Venture, doing business as Cortez Gold Mines (a joint venture owned by Placer and KennecottMinerals), which we refer to as "Cortez"“Cortez”.
Effective December 30, 1999, pursuant to the terms of the Option Agreement, Cortez elected to terminate the Option Agreement. This required the Company to post its own security for the reclamation bond for the Robertson Property and obtain a full release of Placer’s guarantee of the original reclamation bond. In order to satisfy its obligations under the Option Agreement, the Company spent a large portion of fiscal year 2003 conducting reclamation on the Robertson Property to reduce its US$2,000,000 reclamation bond that Placer had guaranteed for the Company. The Company was able to obtain a release of Placer'sPlacer’s guarantee by conducting sufficient reclamation work to reduce the bonding requirement, and by raising sufficient funds to provide satisfactory alternative security of the reclamation bond. The reclamation bond was reduced to US$786,100 during the fiscal year ended 2003, for which the Company posted cash. In fiscal year ended 2006, with more reclamation work having been completed and accounted for, the reclamation bond was further reduced to US$228,205. In fiscal year ended 2007, with further drilling activities being proposed and performed, the required reclamation bond was increased to US$282,268. The costIn fiscal year ended 2008, additional planned exploration activities in Nevada were approved and the required reclamation bond was increased to the CompanyUS$319,400 and then again in fiscal year ended 2009 up to conduct the reclamation and other associated costs was approximately US$25,887 (year ended January 31, 2007) (US$263,017 since 2003).
The Company received a preliminary assessment report entitled “Update of the Geological Report on the Robertson Property” dated April 25, 2006 on the gold resources at its Robertson Property situated on the Battle Mountain – Eureka Trend (Cortez Trend) in Lander County, Nevada. The Report was prepared by Robert T. McCusker, Consulting Geologist, a “qualified person” in accordance with the requirements ofNational Instrument 43-101implemented by the Canadian Securities Administration, referred to as "NI 43-101"“NI 43-101”.
During fiscal 2007,2006, the Company completed a major drilling programat its 100-percent-owned Robertson Property located on the Cortez gold trend in eastern Lander County, Nevada, USA. Drilling was completed in two phases.
| in (1) the Distal Zone; (2) on the northeast flank of Altenburg Hill; (3) in the gravel-covered area between the |
During 2007, the Company receivedcompleted two deep flooded reverse circulation drill holes, TV07-1 and TV07-2, to depths of 2,990 ft and 3,450 ft, respectively. The drilling was designed to test the lower plate of the Roberts Mountains thrust fault (RMTF) for high-grade Carlin-type mineralization hosted by favorable carbonate strata. TV07-1 intersected a permitthick sequence of fine grained siliceous sedimentary and volcanic rocks followed by biotite and quartz hornfels equivalents in the upper plate of the RMTF. Although the hole failed to reach the lower plate of the RMTF, it did intersect a number of narrow low-grade zones. TV07-2 was collared along a dike-filled splay of the Try fault zone and intersected a sequence of mostly fine grained siliceous sedimentary rocks and hornfels to 3,080 ft, at which point altered and mineralized limy mudstone in the lower plate was encountered. Beginning at 3,280 ft, the hole returned 200 ft of weakly to strongly anomalous gold values ranging from 0.031 to 2.190 ppm gold, including four 10-ft-thick intervals that exceed 0.01 oz Au/t.
In the US Bureaufiscal year ending January 31, 2008, the Company purchased 100% interest in the 72 claims comprising the Fanny Komp/Elwood Wright lease which forms part of Land Management to drill four deep holes (3 – 5,000 feet) onthe core area of the Robertson Property and drilling commenced in July 2007.
12
In calendar 2006, Coral Gold’s field staff carried out programs of detailed structural geological mapping, geochemical soil sampling, gravity geophysics and airborne magnetometric interpretation to define areasFebruary 2008, the Company received the final NI 43-101 compliantMineral Resource Estimate for the deep drilling program.
The zones included in the Beacon Hill estimate are located within the Robertson’s Core Claims only. Beacon Hill reported the following updated resource estimate:
| Zone (Core Claims) | Qty | Grade | Qty | Grade | Contained | ||||||||||
| (Tons) | oz Au/ton | (Tonnes) | g Au/tonne | oz Au | |||||||||||
| Distal | 10,355,041 | 0.0335 | 9,376,398 | 1.148 | 346,893 | ||||||||||
| 39A | 25,010,247 | 0.0287 | 22,690,382 | 0.984 | 717,794 | ||||||||||
| Triplet Gulch | 5,904,713 | 0.0269 | 5,357,012 | 0.922 | 158,837 | ||||||||||
| Outside | 2,187,500 | 0.0208 | 1,984,595 | 0.713 | 45,500 | ||||||||||
| Gold Pan Oxide | 7,049,181 | 0.0262 | 6,395,323 | 0.898 | 184,689 | ||||||||||
| Altenburg Hill Oxide | 4,558,402 | 0.0208 | 4,135,580 | 0.713 | 94,815 | ||||||||||
| Porphyry Oxide | 19,121,927 | 0.0213 | 17,348,243 | 0.730 | 407,297 | ||||||||||
| Gold Pan Sulphide | 12,053,279 | 0.0208 | 10,935,258 | 0.713 | 250,708 | ||||||||||
| Altenburg Hill Sulphide | 584,016 | 0.0176 | 529,845 | 0.603 | 10,279 | ||||||||||
| Porphyry Sulphide | 4,480,533 | 0.0223 | 4,064,934 | 0.765 | 99,916 | ||||||||||
| TOTALS | 91,284.800 | 0.0250 | 82,817,600 | 0.870 | 2,316,728 |
For details on claim and gold zone locations, please see corresponding maps and diagrams at the Company’s website atwww.coralgold.com. The information contained in the Company’s website does not form part of this Annual Report.
Resource estimate parameters:
- Gold ounces were calculated on the basis of US$600/oz Au and 70% Au recovery.
- The 0.015 ozAu/ton cut-off grade utilized to report the resource was derived from a mining cost of US$1.02/ton, process cost of US$5.00/ton and waste cost of US$1.14/ton.
- The mineral resources in the table above were estimated using the CIM Standards on Mineral Resources and Reserves.
- The database comprised a total of 1,160 drill holes,
drilled in calendar 2006 into the existing computer block model. Meanwhile application will be made for permits for533,453 feet (162,638 metres) of drillingto further expand the Distal, 39AandPorphyry/Altenburg Hill Zones. A series of core holes are also planned for metallurgical test work to add to existing information at101,757 gold assays. - The inferred resource covers 6 distinct and separate areas; Distal, 39A, Gold Pan, Porphyry, Altenburg Hill, Southern Area and
Porphyry/then all remaining blocks outside these areas that warrant inclusion as an inferred resource. In addition, Gold Pan, Porphyry and AltenburgHill.
The Company commissioned Beacon Hill to not only update the Robertson resource estimate but to also outline a program for continued development of the Core Claims in 2008 and beyond. Beacon Hill recommended a three-pronged development approach:
13
| 1) | Additional exploratory and definition drilling to increase the resource base and also the level of confidence in the resource to the indicated and/or measured categories. | |
| 2) | Complete a metallurgical program to enhance the metallurgical data. | |
| 3) | Commence a Preliminary Assessment Study on the mineralized zones within the Robertson Property to determine which of the zones have the greater potential for viability. The zones can then be prioritized for development. |
Beacon Hill recommended the following drilling on the Core Claims:
Phase I:52 RC holes ranging in depth from 500 ft to 1,200 ft and totaling 37,600 ft, to focus on:
- 39A Zone:Ten holes totaling 8,400 ft drilled along the southeast and northeast margins of the zone to test for additional high-grade mineralization.
- Distal Zone:Ten holes totaling 12,000 ft drilled in the Distal Zone, which remains open for discovery of high- grade mineralization in all directions.
- Altenburg Hill/South Porphyry Area:Twenty holes totaling 10,000 ft as infill and offset drilling on the northeast flank of Altenburg Hill and in the gravel- covered area south of the Porphyry Zone.
- Triplet Gulch:Twelve wide-spaced RC holes totaling 7,200 ft to test potential continuity and grade of inferred mineralization.
Phase II:should consist of 21 diamond core holes (HQ diameter) ranging from 300-ft to 1,000-ft-deep and totaling 11,900 ft. The purpose of core drilling is to provide geological data on the controls of mineralization, acquire geotechnical data (RQD and specific gravity), confirm grade and continuity and provide material for metallurgical testing. Drilling has been recommended as follows:
- 39A Zone:Six “twin” core holes totaling 5,000 ft focused in areas of higher grade mineralization.
- Distal Zone:Four pre-collared “twin” core holes totaling 2,400 ft drilled to confirm grade and geological controls.
- Altenburg Hill/South Porphyry Area:Six (or more) “twin” core holes totaling 3,000 ft to provide ore-grade oxide mineralization for metallurgical studies and confirm the grade and continuity of mineralization.
- Gold Pan Zone:Five shallow “twin” core holes totaling 1,500 ft drilled mainly to provide ore-grade oxide mineralization for metallurgical studies and to confirm grade, continuity and geological controls for mineralization.
Mr. Garth D. Kirkham, P.Geo., and Mr. Peter Stokes, P.Eng., of Beacon Hill and Mr. Robert McCusker, Consultant Geologist and Project Manager, are responsible for preparing the report and are “qualified persons” in accordance with NI 43-101. Messrs Kirkham, Stokes and McCusker are independent of the Company as defined by NI 43-101.
Deep drilling in 2007 encountered Carlin-type geochemistry including gold in the important lower plate host rocks for Carlin-type structure beneath the Roberts Mountains thrust fault. The gold intercepts indicate a Carlin type system in Lower Plate rocks on a western part of the property. Follow up mapping, rock sampling and infill gravity surveys in 2008 lead to the Company’s identification of a new lower plate target zone that extends from the coral deep hole, 2 km to the south. The West Deep Carlin-type target adds significant discovery potential to the Robertson Property for a world-class gold deposit. The target zone lies north of the Pipeline Mine open pit along a projected mineralized fault and fracture system that controls gold within that deposit. Considerably more drilling on the Robertson West Deep target is warranted. While the Company would prefer to continue drilling and expanding these targets in 2009, the Company must wait and see what unfolds in the equity markets and its ability to raise additional exploration capital. In addition, the Company continues to seek joint venture partners for a proposed deep drilling program to follow up the successful results from the 2007 drilling program which intersected enormous gold values in the Lower Plate limestone sequence at the Robertson Property.
14
In February 2009, the Company completed a Reverse Circulation drilling program at the Robertson Property. The program totaled 22,835 ft of drilling in 33 vertical holes which ranged in depth from 500 to 1200 ft. The holes were located on the Altenburg Hill, South Porphyry, 39A and Distal zones in order to increase the gold resource in these zones. Hole locations can be viewed in maps on our website at www.coralgold.com. The information contained in the Company’s website does not form part of this Annual Report.
Robert McCusker, Consultant Geologist supervised the drill programs as a “Qualified Person” for NI 43-101.
Norma Sass and Ruf Claims – Operations and Activities
Effective December 31, 1999, the Company and Levon Resources Ltd., referred to as "Levon"“Levon”, entered into a fourth amending agreement whereby Levon could earn an undivided 50% interest in the Norma Sass and Ruf Claims upon completion of certain terms. This agreement was further amended effective December 31, 2001 (but signed on October 3, 2002), whereby Levon was transferred a 33-1/3%33.3% interest in the Company’s interest in the Norma Sass and Ruf claims, in consideration of 300,000 common shares of Levon previously issued to the Company and the prior payment of $350,294 for exploration work. The Company currently owns a 66-2/3%66.6% interest in the Norma Sass and Ruf claims (subject to certain royalties to underlying property owners, as described below), following the execution of the December 2001 fifth amending agreement with Levon.
On December 4, 2002, the Company granted an option to acquire 33-1/3%33.3% of the Company’s interest in the Norma Sass and Ruf Claims to Goldfranchise Corporation, referred to as “Goldfranchise”. In order to earn the interest, Goldfranchise was required to:
In January 2005, wethe Company announced the formation of an exploration agreement with Agnico-Eagle Mines Limited, referred to as "Agnico-Eagle"“Agnico-Eagle”. The agreement coverscovered our Norma Sass, Blue Nugget and Lander Ranch claims. The Norma Sass agreement also includesincluded our partnership with Levon. Under the agreement, Agnico-Eagle cancould earn a 51% interest in the Norma Sass, Blue Nugget and Lander Ranch claims by completing at least 45,000 feet of exploration drilling and paying certain advance royalties. At its option, Agnico-Eagle may acquire the claim leases from the underlying owners for its benefit and Agnico-Eagle shall be deemed to have earned an additional 24% interest. Agnico-Eagle will then have the option of acquiring the remaining 25% interest by producing a positive feasibility study and making a positive production decision.
Agnico-Eagle mobilized a reverse circulation drill supplied by Lang Exploratory Drilling of Elko, Nevada to the Norma Sass property on May 15, 2006. Drilling commenced on the Lander Ranch target area and Agnico-Eagle drilled 15,000 ft. in 12 to 15 holes on the Norma Sass and related properties. In February 2007, Agnico-Eagle Mines Ltd. has notified the Company that it would not be continuing its option on Company'sthe Company’s Norma Sass, Lander Ranch and Blue Nugget properties because of other corporate priorities. The Company has beenwas pleased with the work done by Agnico-Eagle during the past two years. Theyas they successfully showed depths to the lower plate sequence across the Norma Sass ground and extended the area of gold mineralization at Lander Ranch.
In September 2008, the Company entered into an exploration, development and mine operating agreement (the “Agreement”) with Barrick Gold Exploration Inc. (“Barrick”), wherein Barrick was granted the option to acquire up to a 75% interest in the Company’s and Levon’s interests in the Norma Sass Property, Nevada, consisting of 36 unpatented mining claims.
Barrick may earn a 60% interest by incurring total exploration expenditures of at least US$3 million in annual installments by December 31, 2014. Barrick may earn an additional 10% (for an aggregate interest of 70%) by incurring an additional US$1.5 million by December 31, 2015. Barrick may earn an additional 5% (for an aggregate interest of 75%) by carrying the Company and Levon through to commercial production.
15
Alternatively, at the time of earning either its 60% or 70% interest, Barrick may be given the option to buy-out the Company’s and Levon’s joint interest by paying US$6 million and granting them a 2% net smelter returns royalty.
In May 2009, Barrick announced that plans are underway to do target delineation work in the second quarter followed by deep drilling in the third quarter on the Norma Sass property, Cortez Gold Trend, Nevada. Norma Sass is a 36-claim property immediately west of the Pipeline Mine open pit. Norma Sass was optioned to Barrick as disclosed above.
Norma Sass’ proximity to Pipeline, offers the deep discovery potential Barrick is pursuing. They have completely remapped and reinterpreted the Pipeline open pit geology since their acquisition of Placer Dome, and have a new stratigraphic model for the host rocks and structural setting of the gold deposit.
Barrick has notified the Company that they will commence the drilling of the planned holes in September 2009.
June Claims
The Company announced the completion of a mineral lease with option to purchase agreement to explore, develop, and exploit six lode mining claims located in Lander County, State of Nevada (the “June Claims”). The June Claims are adjacent to the Company’s View Claims in the northwest section of its Robertson Property. The agreement is for an initial term of 4 years in consideration of the payment of an annual rent of US$25,000, renewable in successive four year terms, provided that the rent will be reviewing resultsincrease by US$5,000 every four years. The property is subject to a royalty charge of Agnico-Eagle’s exploration programs in order3% of net smelter returns (“NSR”), subject to plan further work.
Reclamation Activities
The Company spent approximately $16,175$176,672 on reclamation and maintenance in fiscal year 20072009 on the Robertson Property. The Company is reclaiming past mining and exploration related disturbances to public lands as required by the Bureau of Land Management (“BLM”) and the Nevada Department of Environmental Protection referred(“NDEP”).
In August 2008, SRK Consulting prepared an “Aerial Survey Ground Truthing and Revised Cost Estimate” Report for the Company, which following amendments and revisions was submitted to as the "Bureau".
The report outlined and updated results of reclamation done by the Company at the Robertson Property up to 2008.
The BLM and NDEP replied with required changes and updates in March/April 2009 and a revised “Aerial Survey Ground Truthing and Revised Cost Estimate” was prepared by SRK Consulting on June 10, 2009 and submitted to the BLM and NDEP. The Company is awaiting acceptance of the report.
In other reclamation activity, The Company resolved confusion concerning disturbance at Mill Gulch (in the Robertson Core area) and at the Company’s JDN claims in the Hilltop area. The BLM agreed in July 2008 that the Company is not responsible for the land disturbance at Mill Gulch. The disturbance was caused by placer gold mining activity before the Company’s involvement at Robertson.
In the Try/View area of the Robertson Property the Company renewed the Notice of Intent to allow further deep drilling. The bond covering this area was increased to approximately $37,000.
In the core area of the Robertson Property, the Company also submitted a new “Storm Water Pollution Prevention Plan” and technical report which was approved by the BLM and NDEP in June 2009.
16
In addition the Company has authorized SRK Consulting to prepare:
(a) Comprehensive Permit, List and Schedules (a diary of permitting requirements); and
(b) memo of existing reclamation status and planning for further reclamation.
During the year ended January 31, 2007,2009, additional planned exploration activities were approved by the Bureau. Therefore,BLM. Accordingly, the BureauBLM increased the amount of the required reclamation deposit to US$282,268.
Competition
The mining industry in which the Company is engaged is highly competitive. Competitors include well-capitalized mining companies, independent mining companies and other companies having financial and other resources far greater than those of the Company. The companies compete with other mining companies in connection with the acquisition of gold and other precious metal properties. In general, properties with a higher grade of recoverable mineral and/or which are more readily minable afford the owners a competitive advantage in that the cost of production of the final mineral product is lower. Thus, a degree of competition exists between those engaged in the mining industries to acquire the most valuable properties. As a result, the Company may eventually be unable to acquire attractive gold mining properties.
Dependence on Customers and Suppliers
The Company is not dependent upon a single or few customers or suppliers for revenues or its operations.
Government Regulation
We are subject to various federal and state laws and regulations including environmental laws and regulations. Environmental regulations impose, among other things, restrictions, liabilities and obligations in connection with the generation, handling, use, storage, transportation, treatment and disposal of hazardous substances and waste and in connection with spills, releases and emissions of various substances to the environment. Environmental regulation also requires that facility sites and other properties associated with our operations be operated, maintained, abandoned and reclaimed to the satisfaction of applicable regulatory authorities. In addition, certain types of operations, including exploration and development projects and changes to certain existing projects, may require the submission and approval of environmental impact assessments or permit applications. Compliance with environmental regulation can require significant expenditures, including expenditures for clean up costs and damages arising out of contaminated properties and failure to comply with environmental regulations may result in the imposition of fines and penalties. We believe that we are in substantial compliance with such laws and regulations. However, such laws and regulations may change in the future in a manner which will increase the burden and cost of compliance.
Certain laws and governmental regulations may impose liability on us for personal injuries, clean-up costs, environmental damages and property damages, as well as administrative, civil and criminal penalties. We maintain limited insurance coverage for sudden and accidental environmental damages, but do not maintain insurance coverage for the full potential liability that could be caused by sudden and accidental environmental damage. Accordingly, we may be subject to liability or may be required to cease production from properties in the event of such damages.
Environmental Regulations
The Company’s exploration programs in Nevada and California are subject to state and federal regulations regarding environmental considerations. All operations involving the exploration for the production of minerals are subject to existing laws and regulations relating to exploration procedures, safety precautions, employee health and safety, air quality standards, pollution of streams and fresh water sources, odor, noise, dust and other environmental protection controls adopted by federal, state and local governmental authorities as well as the rights of adjoining property owners. The Company may be required to prepare and present to federal, state or local authorities data pertaining to the effect or impact that any proposed exploration for or production of minerals may have upon the environment.
17
All requirements imposed by any such authorities may be costly, time consuming and may delay commencement or continuation of exploration or production operations. Future legislation may significantly emphasize the protection of the environment, and, as a consequence, the activities of the Company may be more closely regulated to further the cause of environmental protection. Such legislation, as well as further interpretation of existing laws in the United States, may require substantial increases in equipment and operating costs to the Company and delays, interruptions, or a termination of operations, the extent of which cannot be predicted. Environmental problems known to exist at this time in the United States may not be in compliance with regulations that may come into existence in the future. This may have a substantial impact upon the capital expenditures required of the Company in order to deal with such problem and could substantially reduce earnings. At the present time, the Company’s exploration activities in Nevada are in compliance with all known environmental requirements.
The regulatory bodies that directly regulate the Company'sCompany’s activities are the Bureau of Land Management (Federal) and the Nevada Department of Environmental Protection (State).
C. Organizational Structure
The Company has two wholly-owned subsidiaries, Coral Energy Corporation of California, a California corporation which holds title to the Company’s California property, and Coral Resources, Inc., a Nevada corporation, which holds title to the Company’s mining claims located in Nevada. In the 2006 fiscal year, the Company completed the purchase of 1,391,860 shares, representing 98.49% of the issued shares, of Marcus, a Nevada Corporation that owns the Marcus mining claims, consisting of 39 unpatented lode claims and two placer claims, and which comprise a portion of the Company’s Robertson Property.
D. Property, Plant and Equipment
Presently, the Company is an “exploration stage company”, as all of the Company’s properties are currently in the exploratory stage of development. In order to determine if a commercially viable mineral deposit exists in any of the Company’s properties, further geological work will need to be done and a final evaluation based upon the results obtained to conclude economic and legal feasibility.
The Company’s primary focus has been on the Robertson Mining Claims, in Nevada, United States.
Robertson Mining Claims, Nevada, U.S.A.
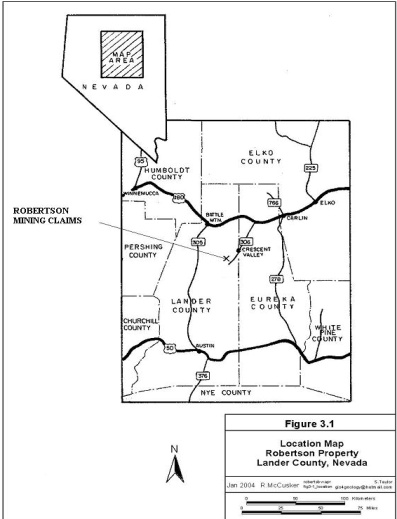
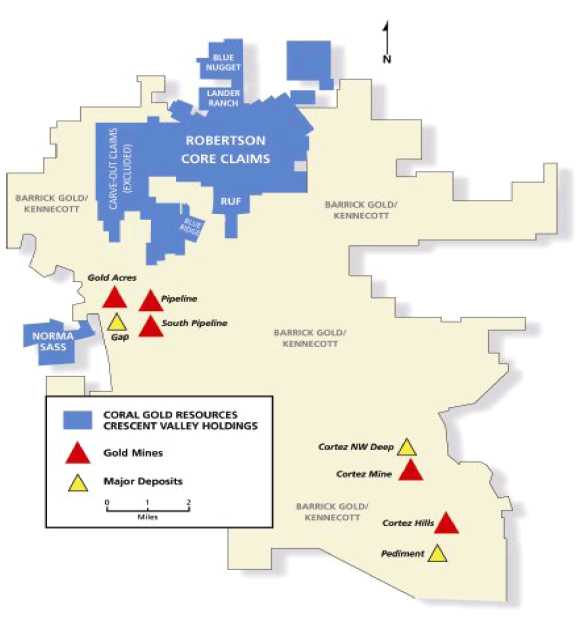
The Robertson Mining Claims are located in Crescent Valley, Nevada on the western flanks of the Shoshone Range, 28 miles to the southeast of Battle Mountain, Nevada, which lies some 230 miles northeast of Reno, Nevada. The Robertson Mining Claims comprise approximately 11,000 acres in the Bullion Mining District, Lander County, Nevada, and currently include 724 unpatented and patented lode and placer mining claims. The Robertson Mining Claims are recorded undercomprise three separate claim groups known as: (i) the Robertson Property;Core Claims; (ii) the Carve-Out Claims;Carve Out Claims, and (iii) the Norma Sass and Ruf Claims,Claims. as described more particularly below.
These mining claims have been acquired over a period of several years from different sources. The entire Robertson Mining Claims are subject to a 3% net smelter royalty to Geomex Development Eighth Partnership, referred to as "Geomex 8"“Geomex 8”, which royalty shall cease at such time as the sum of US$1,250,000 has been paid to Geomex 8, and various mining leases requiring minimum annual advanced royalties ranging from 2% to 8% of net smelter returns.
There is no underground or surface plant or equipment located on the Robertson Mining Claims.

(i) Robertson Property
The Robertson Property is the subject of twothree technical reports dated January 15, 2004, and April 25, 2006 and January 27, 2008. The first two technical reports were prepared by Robert T. McCusker, P.Geol. in accordance with NI 43-101, which we refer to as the "McCusker Reports"“McCusker Reports”. The following historical information concerningthird and most recent report was prepared by Beacon Hill of Vancouver, British Columbia referred hereinto as the “Beacon Hill Report”. The zones included in the Beacon Hill estimate are located within the Robertson’s Core claims only. The Company’s other Claim blocks, including Norma Sass, Lander Ranch, Ruf, Blue Nugget and the Excluded claims (joint ventured with Cortez Gold Mines), were not part of the estimate.
Property Description and Location
The Robertson Property is extracted from the McCusker Reports. The reader is referred to the entire text of the McCusker Reports, copies of which are available under the Company’s filings on EDGAR at www.sec.gov and on SEDAR at www.sedar.com.
In 2001, a boundary agreement between the Company and the Cortez resolved claim boundary overlaps and seniority issues along the east and south sides of the Robertson claim block. This agreement required both parties to amend and/or abandon certain claims in order to achieve the agreed upon boundary. This was completed during the 2002-2003 assessment year.
Approximately 17361 of the 532495 of the claims that comprise the Robertson Property are controlled by the Company through six mining leases and option agreements. The claimsCore Claims held by the Company under lease or option agreements require minimum advance royalty payments and production royalties in the event of production. Total annual payments for the various leases and minimum advance royalties are US$55,800.36,000.
A summary compilation of the terms of these agreements are presented in the Tabletable below:
Mining Lease and Option Agreements
| Advance | ||||
| Number of | Production | Royalty | ||
| Company/Date | Claims | Option Payment | Royalty | Payment |
| Tenabo Gold Mining Co. | ||||
| Nov. 30, 1975 | 13 | $2M | 8% NSR | $12,000/yr |
| Northern Nevada Au, Inc. | ||||
| Sept. 30, 1986 | 12 | $ - | 4% GSR | $9,600/yr |
| Albany Gold Corp. | ||||
| (Geomex) | All | $1.25M | 3% NSR | Nil |
| Mauzy, et al | ||||
| Apr. 21, 1989 | 36 | $1.5M | 2% NSR | $14,400/yr |
Company/Date | Number of Claims | Option Payment | Production Royalty | Advance Royalty Payment |
| Tenabo Gold Mining Co. Nov. 30, 1975 | 13 | $2M | 8% NSR | $12,000/yr |
| Fannie Komp Sept. 16, 1986 | 76 | $1M | 5% NSR | $24,000/yr |
| Florence Johnson Nov. 5, 1986 | 16 | $50,000 | 5% GSR | $1,800/yr |
| Northern Nevada Au, Inc. Sept. 30, 1986 | 12 | $0.3M | 4% GSR | $9,600/yr |
| Albany Gold Corp. (Geomex) | All | $1.25M | 3% NSR | None/yr |
| Mauzy, et al Apr. 21, 1989 | 36 | $0.75M | 2% NSR | $14,400/yr |
Annual federal rental fees of US$44,300,81,760, payable to the BLM, and Notice of Intent to Hold Mining Claims have been filed for the 2005-20062009-2010 assessment year.
Environmental Liabilities
In 1988-89, the Company operated a small open pit gold mining operation and heap leach facility on the Robertson Property. The resulting disturbances include three small open pit mines, waste dumps, haul roads, drill roads, open drill holes, and a 350,000 ton heap leach facility and related recovery plant. In 1994, a reclamation plan was prepared by Amax Gold Exploration Inc., referred to as "Amax"“Amax”, and submitted to the Battle Mountain office of the BLM.
21
The cost to perform the reclamation of the Robertson mine site was estimated at that time to be US$2,000,000. In 2001, the Company began reclamation activities which were accelerated in 2002, with the recontouring of waste dumps, reclamation of the leach pad, haul roads and the filling of all open drill holes. As a result of this activity, in June 2003, the BLM reduced the bonding requirements for the project to US$406,000. The Company currently maintains a required performance bond with the Nevada State Office of the BLM. The Company is working with the BLM and the United States Department of Interior in efforts to further reduce the bond.
In March 2003, on behalf of the Company, SRK Consulting submitted a final plan for permanent closure with the BLM and Nevada Division of Environmental Protection, referred to as the "NDEP".NDEP. The closure plan was been approved by both agencies. The major component of the closure plan was the installation of a site fluid management system. As a result of this work, during 2004 the BLM lowered the bonding requirements to $226,205. The Company currently maintains a required performance bond with the Nevada State Office of the BLM.BLM in the amount of US$389,360. The Company is working with the BLM and the United States Department of Interior in efforts to further reduce the bond.
Permitting
In 2002, the Company submitted and was granted a five year renewal of Water Pollution Control Permit (NEV60035) by the NDEP for the Robertson Property. In addition, the Company continues to conduct reclamation and exploration activities under a Plan of Operation (NV067688) approved in 1989 by the Bureau of Land Management.
During the period 2000 through 2003, no exploration activity was conducted on the Robertson Property. However, during that period a significant amount of surface reclamation was completed on the property. As a result, new exploration activities in reclaimed areas will require submission and approval of an Amendment to the Plan of Operation. Additionally, theNational Historic Preservation Actrequires that all operators on public lands conduct an archeological survey of the proposed sites of new disturbance. Much of the Robertson Property has been previously cleared under various surveys conducted by Amax. Recent and planned future exploration activities by the Company have moved outside the area covered by previous archeological surveys. It is possible that future exploration will experience delays in receiving approval because additional surveys will be required by state and federal agencies. In 2004-05,
During 2004 through 2006, the Company conducted exploratory drilling under a series of amendments to the Plan of Operation which were approved by the Battle Mountain office of the BLM and NDEP.
There are no known environmental or threatened and endangered species issues at the Robertson Property that would provide grounds for denial of approval of an Amended Plan of Operation.
History and Exploration
The Robertson Property is located in the Tenabo area, a sub-district of the Bullion mining district. Historic lode mining in this district dates from 1905 and Placerplacer gold was discovered in many of the dry washes in the Tenabo area in 1916. Between 1937-39,1937 and 1939, a small dragline dredge and washing plant operated in the district, and a dredge was reported by Humphrey to be operating in lower Mill Gulch in 1945.
During the period 1966-70,1966 through 1970, a number of companies explored the district in search of porphyry copper-style mineralization. In 1968, while drilling a series of shallow rotary holes near the Gold Pan mine, Superior Oil discovered a small, but relatively high-grade zone of gold at shallow depths in what is now known as the Gold Pan zone. However, with additional drilling, Superior Oil quickly lost interest in the district. They were soon followed by a number of mainly Vancouver-based junior mining companies, including Placer Development (1974-75), Teck Corporation (1977), Aaron Mining Ltd. (1975-86), and E & B Exploration Ltd. (1980-81), all of whomwhich sporadically explored the Tenabo area with limited success. A summary of the drilling completed by these companies prior to the Company’s involvement (1986) is presented in the table below:
22
Summary of Pre-Coral Drilling Activities at Robertson Property
| Date of | Number and Type of | Drill | ||
| Company | Activity | Holes Drilled | Footage(ft) | Target |
| Superior Oil | 1968-70 | 92 Conv. Rotary | c. 32,000 | Gold Pan |
| Placer Development | 1973-74 | 23 Conv. Rotary | c. 3,500 | none |
| Teck Corporation | 1977 | None | none | none |
| Aaron Mining Ltd. | 1977 | 7 Conv. Rotary | c.300 | Gold Quartz |
| E & B Exploration Ltd. | 1980-81 | 148 Rev. Circulation | 30,807 | Gold Pan |
| Totals | 270 | 66,607 |
Modern open pit mining and heap leaching began as early as 1974, when Aaron Mining Ltd., referred to as "Aaron"“Aaron”, initiated a pilot leach operation on the Robertson Property. During the period 1978-80,From 1978 through 1980, Aaron expanded its leaching operations and continued exploration and began consolidating and acquiring claims in the district.
In 1986, the Company acquired Aaron'sAaron’s interest in the Robertson Property and immediately began a series of major drilling programs beginning in 1986 and continuing until 1989. Mining operations on the Robertson Property commenced in 1988, but were suspended less than one year later. During the operating life of the Robertson Property mine, approximately 350,000 tons of low-grade material was placed on leach pads from which about 6,200 ounces of gold were recovered.
During the period 1986 through 1989, the Company completed approximately 380 reverse circulation drill holes and seven diamond drill holes, totaling about 109,377 ft. Much of this drilling was focused in four resources areas including the Gold Pan, Gold Quartz, Gold Quartz extension (also called Gold Quartz West) and the Triplet Gulch areas. The purpose of this drilling was to determine the limits and continuity of mineralization within these zones. Nearly all of the reverse circulation holes were drilled vertically to an average depth of about 300 ft.
During the later stages of the Company’s exploration program, theythe Company completed two “deep” reverse circulation holes that reached depths of 1,400 ft and 1,810 ft, respectively. In addition to resource definition, the Company also embarked on a program of district-wide exploratory and follow-up drilling of numerous surface anomalies.
In 1990, the Company and Amax entered into an amended and restated option and earn-in Agreementagreement in which Amax could earn a 60% interest in the Robertson Property by producing a bankable feasibility study. From 1990, until theyAmex withdrew from the venture in 1996, Amax completed an exploration program that included drilling 338 reverse circulation holes and 62 diamond drill holes, totaling over 176,000 ft.
In 1998, Cortez, entered into an option and earn-in agreement with the Company in which Cortez could earn a 70% interest in the Robertson Property by producing a bankable feasibility study. The focus of theirCortez’s exploration was to expand the 39A zone and test a number of outlying targets. During 1999, Cortez completed 46 reverse circulation drill holes and a single flood rotary hole, totaling 57,000 feet. Of the 13 holes directed at expanding the 39A zone, only two holes, 99401 and 99413, encountered significant mineralization. This drilling program did little to expand the resource. Of the remaining holes drilled by Cortez, only two holes (99406 and 99419) encountered significant mineralization. Both holes were designed to offset and/or follow up existing drill intersections and surface gold anomalies.
After completing this drilling program, Cortez declared its interest in renegotiating the terms of the Option Agreement with the Company. When the Company declined, Cortez subsequently terminated the Option Agreement on December 30, 1999, and did not earn an interest in the Robertson Property.
During 2004 and 2005, the Company conducted three drilling programs consisting of 32 reverse circulation holes totaling 24,020 feetft on the Robertson Property. The focus of this exploration was to expand and further define the 39A Zone, test the "deep"“deep” Gold Pan Zone for extensions of the 39A Zone and offset previous ore-grade intersections in the "distal“distal target area"area”.
23
The Phase I and Phase II drilling programs in 2006 totaled 35,615 ft of reverse circulation drilling in 46 holes. Depths ranged from 450 ft to 1,500 ft. Due to the relatively flat-lying nature of mineralization at Robertson, all holes were drilled vertically.
The 2007 deep drilling program on the Robertson Property encountered Carlin-type mineralization, locally with strongly anomalous gold values, in the lower plate of the Robert Mountains thrust fault. The program consisted of two flooded reverse circulation drill holes totaling 6,450 ft.
In 2008, the Company entered into a contract for 37,600-feet of reverse circulation drilling on the Company’s 100% owned Robertson property at Crescent Valley, Nevada. The agreement, signed with Lang Exploratory Drilling of Salt Lake City, Utah, began in April following permit approval from the BLM.
In Phase I, the Company drilled 52 reverse circulation holes and Phase II included 11,000 ft of diamond drilling.
Both Phase I and Phase II were aimed at expanding and upgrading Robertson’s 2.3 million-ounce inferred resource. In February 2008, Beacon Hill reported the Robertson resource, to date situated in a small portion of the property, had increased by more than 110% from the previous calculation. The updated resource was calculated from work completed in 2006 and 2007. With the 2008 drilling, the Company hoped to upgrade a significant portion of the inferred resources into the measured and indicated categories.
The reverse circulation drilling of Phase I ranged in depth from 500 to 1,200 ft. The work was focused on key, shallow-lying zones locally exposed on surface and also potentially in an open pit mining configuration. Some of the new resources remained open to expansion on strike and at depth.
The planned 21 diamond drill holes of Phase II ranged from 300 to 1,000 ft in depth. Phase II drilling would:
1) provide geological data on the controls of mineralization;
3) help confirm grade and continuity; and
4) provide material for metallurgical testing.
The Company continued to reevaluate all past Robertson exploration data and apply some new insights into gold controls in the Cortez Gold Trend, preparing for the 2008 resource expansion drilling.
To help derive exploration priorities to expand the current resource with the 2008 drilling campaign, a series of in-house, draft open pit shapes had been modeled around the 2008 NI 43-101 compliant inferred resource.
The inferred resource estimate of 2.3 million ounces of gold grading 0.0250 oz/ton (0.870 g/tonne was announced in February 2008 and a NI 43-101 compliant report is posted on the Company’s website for review athttp://www.coralgold.com/i/pdf/Robertson43-101Final.pdf. The information contained in the Company’s website does not form part of this Annual Report.
The loosely constrained open pit shapes were calculated at the posted resource cut off grades, for gold prices that range from $600 to $2000 per ounce gold. For simplicity, off site toll milling was considered and loosely estimated Nevada operating costs were used to produce non engineered, simple and idealized open pit shape alternatives. The point of the exercise is not to mimic or consider production alternatives, but provide semi quantitative exploration insight into where added resources might be most effective in any future open pit alternatives.
In February 2009, the Company completed its reverse circulation drilling program at the Robertson Property in Crescent Valley, Nevada, USA.
24
The program totaled 22,835 ft of drilling in 33 vertical holes which ranged in depth from 500 to 1200 ft. The holes were located on the Altenburg Hill, South Porphyry, 39A and Distal zones in order to increase the gold resource in these zones. Hole locations can be viewed in maps on the Company’s website atwww.coralgold.com. The information contained in the Company’s website does not form part of this Annual Report.
Geological Setting
Geologically, the Robertson Property consists of a series of relatively flat-lying, vertically stacked thrust sheets that form part of the Roberts Mountain allochthon, which is composed of siliciclastic rocks of Ordovician through Devonian age. The district is dominated by a very thick sequence of middle to late Devonian Slaven Chert composed mainly of argillite, chert, lesser siltstone and shale, and minor intermediate volcanic rocks. Structurally overlying the Slaven Chert along the north and east sides of the district are a sequence of rusty brown weathering siltstone, sandstone and very minor limestone of the Silurian Elder Sandstone.
Intruding the thick Paleozoic sequence is an elliptical-shaped, composite granodiorite stock (or lacolith) of Eocene age. The orientation of the principal axis of the stock is approximately east-west. Associated with it are numerous dikes, sills and plugs that vary in composition from diorite, the earliest known intrusion, to rhyolite, the latest. Most of the identified gold resources, including the Porphyry, Gold Pan and 39A zones, lie along or near the northern contact of the composite stock. A series of narrow and laterally continuous (up to 1,600 ft) intrusive “pebble” dikes extend northward from the northern contact of the granodiorite stock. Near contacts with the Tertiary intrusions, many of the sedimentary and volcanic rocks, and early phases of the stock, have undergone significant thermal metamorphism, intense recrystallization, bleaching and pervasive metasomatism. Many of these rocks have been converted to layered sequences of biotite, “quartz” and calc-silicate hornfels, marble, exoskarn and endoskarn.
Mineralization at the Robertson Property is strongly controlled by a system of low and high-angle faults and related fracture zones. Less commonly, brecciation associated with axial plane shear zones developed in isoclinal folds are also important hosts for mineralization, locally. Although individual structures host ore-grade gold, higher grades commonly occur where one or more structures intersect.
Deposit Types and Mineralization
The Company has been focusing its exploration activities on four zones localized along the northern contact of the Tenabo stock forming the general east-west trend. These zones are the Porphyry, Gold Pan, Altenburg Hill and 39A zones. The Porphyry, Gold Pan and Altenburg Hill zones occur in highly fractured hornfels and skarn units at the contact of the granodiorite stock, whereas the 39A zone is localized at the intersection of two high-angle faults in retrograde-altered hornfels.
The following is a summary of the main minerals identified at the Robertson Property:
| Native gold | Native silver | Electrum | Pyrite |
| Pyrrhotite | Marcasite | Arsenopyrite | Stibnite |
| Chalcopyrite | Sphalerite | Galena | Bournonite |
| Acanthite | Loellingite | Gersdorffite | Tetradymite |
| Petzite | Hessite | Hedleyite | Tellurobismuthite |
| Altaite | Tetrhedrite | Bornite | Chalcocite |
| Covellite | Digenite | Native copper | Cuprite |
| Chysocolla | Azurite | Goethite | Magnetite |
| Hematite | Illmenite | Scorodite |
Mineral Resource Estimates
In late 2005, an independent third party was contracted by the Company to undertake a Preliminary Assessment of the currently defined mineral resources at the Robertson Property. The results of this study are reported in a NI 43-101 compliant technical report dated April 25, 2006 prepared by R. T. McCusker entitled "Update“Update of the Geological Report on the Robertson Property"Property”.
25
The purpose for this study was to update the 2001 resource estimate, include results from the 2004-2005 drilling programs in the estimate and examine the effect of higher gold price on the economics of the existing resources. The mineral resource estimates of the Porphyry and combined 39A/Gold Pan Zones were conducted by an independent third party and a qualified person pursuant to NI 43-101. The Altenburg Hill and distal Target inferred mineral resources were estimated by R. T. McCusker, a qualified person pursuant to NI 43-101. A summary of the mineral resources estimated to be present on the Robertson Property are presented in the following Table.
| Measured mineral resources | Indicated mineral resources | Total measured and indicated | Inferred mineral resources | |||||||||
| Short | Gold | Contained | Short | Gold | Contained | Short | Gold | Contained | Short | Gold | ||
| tons | Grade | ozs | tons | Grade | ozs | tons | Grade | ozs | Tons | Grade | Contained | |
| Zone | (000s) | (oz/ton) | (000s) | (000s) | (oz/ton) | (000s) | (000s) | (oz/ton) | (000s) | (000s) | (oz/ton) | ozs (000s) |
| Porphyry(1) | 10,600 | 0.020 | 212 | 2,100 | 0.018 | 37 | 12,700 | 0.020 | 249 | |||
| 39A/Gold Pan(2) | 10,200 | 0.044 | 450 | 10,200 | 0.044 | 450 | 4,900 | 0.039 | 192 | |||
| Altenburg Hill(1) | 3,500 | 0.018 | 63 | |||||||||
| Distal Target(3) | 1,008 | 0.178 | 179 | |||||||||
| Total | 10,600 | 0.020 | 212 | 12,300 | 0.040 | 487 | 22,900 | 0.031 | 699 | 9,408 | 0.046 | 434 |
| (1) | Estimates calculated using a 0.010 oz Au/t cutoff grade. | |
| (2) | Estimates calculated using a 0.015 oz Au/t cutoff grade. | |
| (3) | Estimates calculated using a 0.05 oz Au/t cutoff grade. |
It should be noted that the resource classifications applied by an independent third party and R. T. McCusker conform to the Canadian Institute of Mining, Metallurgy and Petroleum definitions for measured, indicated and inferred mineral resources, respectively, pursuant to usage under NI 43-101. Further, it should also be noted that mineral resources that are not mineral reserves do not have demonstrated economic viability.
The zones included in the Beacon Hill estimate are located within the Robertson’s Core claims only. The Company’s other claim blocks, including Norma Sass, Lander Ranch, Ruf, Blue Nugget and the Excluded claims (joint ventured with Cortez Gold Mines), were not part of the estimate.
Cautionary Note to U.S. Investors concerning Estimates of Measured, Indicated and Inferred Resources
This section uses the terms “measured resources” and “indicated resources.” The Company advises United States investors that while those terms are recognized and required by Canadian regulations, the United States Securities and Exchange Commission does not recognize them
This section uses the term "inferred resources"“inferred resources”. We advise United States investors that while this term is recognized and required by Canadian regulations, the U.S. Securities and Exchange Commission does not recognize it.
26
Robertson Inferred Resources 2008 (by Beacon Hill)
| Zone | Tons | Oz/tAu | Ounces |
| Distal | 10,335,041 | 0.0335 | 346,224 |
| 39A | 25,010,247 | 0.0287 | 717,794 |
| South Zone | 5,904,713 | 0.0269 | 158,837 |
| Outside | 2,187,500 | 0.0208 | 45,500 |
| Gold Pan Oxide | 7,049,181 | 0.0262 | 184,689 |
| Altenburg Hill Oxide | 4,558,402 | 0.0208 | 94,815 |
| Porphyry Oxide | 19,121,927 | 0.0213 | 407,297 |
| Gold Pan Sulphide | 12,053,279 | 0.0208 | 250,708 |
| Altenburg Hill Sulphide | 584,016 | 0.0176 | 10,279 |
| Porphyry Sulphide | 4,480,533 | 0.0223 | 99,916 |
| TOTAL | 91,284,840 | 0.0253 | 2,309,506 |
- Gold ounces were calculated on the basis of US$600/oz Au and 70% Au recovery.
- The 0.015 ozAu/ton cut-off grade, utilized to report the resource, was derived from a mining cost of US$1.02/ton, process cost of US$5.00/ton and waste cost of US$1.14/ton.
The mineral resources in the table above were estimated using the CIM Standards on Mineral Resource 2006 (by R.T. McCusker)
Measured mineral resources | Indicated mineral resources | Total measured and indicated | Inferred mineral resources | |||||||||||||||||||||||||||||||||||||||||||||
| Zone | Short tons (000s) | Gold Grade (oz/ton) | Contained ozs (000s) | Short tons (000s) | Gold Grade (oz/ton) | Contained ozs (000s) | Short tons (000s) | Gold Grade (oz/ton) | Contained ozs (000s) | Short Tons (000s) | Gold Grade (oz/ton) | Contained ozs (000s) | ||||||||||||||||||||||||||||||||||||
Porphyry(1) | 10,600 | 0.020 | 212 | 2,100 | 0.018 | 37 | 12,700 | 0.020 | 249 | |||||||||||||||||||||||||||||||||||||||
39A/Gold Pan(1) | 10,200 | 0.044 | 450 | 10,200 | 0.044 | 450 | 4,900 | 0.039 | 192 | |||||||||||||||||||||||||||||||||||||||
Altenburg Hill(1) | 3,500 | 0.018 | 63 | |||||||||||||||||||||||||||||||||||||||||||||
Distal Target(1) | 1,008 | 0.178 | 179 | |||||||||||||||||||||||||||||||||||||||||||||
Total | 10,600 | 0.020 | 212 | 12,300 | 0.040 | 487 | 22,900 | 0.031 | 699 | 9,408 | 0.046 | 434 | ||||||||||||||||||||||||||||||||||||
This resource is compliant with NI 43-101.
Data Used for Estimate
A total of 1,204 drill holes were supplied for the Robertson Property in Lander County, Nevada which are the combined drill holes for the Gold Pan, 39A, Porphyry, Altenburg Hill and Lower Triplet Gulch zones in addition to areas that due tohave drilling but lie outside the low-grade naturemain areas of interest. The drill holes within the database included collars, downhole surveys, assays, and lithology.
Solids models of the main ore zones within the Robertson mineralDeposit were created that encompass the Gold Pan, 39A, Porphyry, Altenburg Hill, Distal and Triplet Gulch deposit areas. The ore zones to be included within the solids model and then to be used for constraining the interpolation procedure are split into an Oxide Zone and a Sulphide Zone where sufficient data existed to do so which included the Gold Pan, 39A, Porphyry and Altenburg Hill areas. Due to its depth, the Distal zone is considered to be sulphide material.
Approximately 200 historic core samples were analyzed for dry bulk density using the volume displacement method. Densities for both ore and waste are primarily related to lithology, argillization, calc-silicate content and sulfide content. The average density for country rock was determined to be 12.2 cu ft/ton and 15.5 cu ft/ton for alluvium (2 determinations). These are historic determinations, which appear to be located for the most part, within the Porphyry Zone however, the exact locations are not known. The relative scarcity of specific gravity data is the primary reason for the resources they are sensitivebeing categorized as inferred and it is recommended that a comprehensive program to determine localized specific gravity be undertaken for future studies.
Estimate Method
The estimation plan includes the following items:
- Storage of the mineralized zone code and percentage of mineralization.
- Application of density based on limited SG measurements.
- Estimation of the grades for Au using ordinary kriging.
27
- Ellipsoid orientation was orthogonal and ranges were set to 300 feet in the northing and easting whilst 200 feet in elevation.
The estimation strategy employed a minimum of four composites and a maximum of 15 with a maximum of two from any one drillhole.
Also, an octant search was used as it aids in declustering the estimate. This means that it helps to avoid over-influence of individual drill holes or sectors being overly informed, avoiding the use of samples that clustered together and thereby redundant. The maximum number of parameters including gold recovery, operating costs, capital costcomposites allowed in any one octant was two.
Conclusions
It can be concluded that the Robertson Property is one of merit and gold price. Estimated net revenue generated byis worthy of additional development work to enhance the 39A/Gold Panresource base and Porphyry resources atincrease the level of confidence in the resource. It is also concluded that a gold pricePreliminary Assessment be completed to ascertain the potential viability of $550/ounce and 683,000 ounces of recoverable gold generates a net revenue of $97.5 million, which makes the resources uneconomic as evaluated.
Proposed Exploration
The Company believes that there is a potential for discovery of additional mineral resources on the Robertson Property. The Company plans to continue to explore the Robertson Property or seek third party partners for further exploration.
(ii) Carve-Out Claims, Nevada, U.S.A.
Under the terms of an Exploration and Mining Venture Agreement dated July 11, 1997, Barrick, formerly Placer, holds an undivided 61% interest and the Company has a 39% interest carried to production in the Carve-Out Claims.
Beginning in 1997 and continuing through 1998, Cortez conducted a series of exploratory drilling programs on the Carve-Out Claims with limited success. In 2002, the Company conducted a drilling program on the Carve-Out Claims with follow-up drilling in the immediate vicinity of existing drill holes with mixed results. To date, no significant mineral resources have been discovered on the Carve-Out Claims. However, the wide-space deep drilling has established the presence of scattered significant gold values, anomalous levels of Carlin-type trace elements, key structural components and the occurrence of a preferred host strata.
The Company plans to rely on Cortez to further explore the property for mineral resources.
There is no underground or surface plant or equipment located on the Carve-Out Claims, nor any known body of commercial ore.
No further work on the Carve-Out Claims is proposed at this time.
(iii) Norma Sass and Ruf Claims, Nevada, U.S.A
The Company currently owns a 66-2/3%66.6% interest in the Norma Sass and Ruf Claims, which originally were a part of the Carve-Out Claims, after an option agreement with Levon was amended on October 3, 2002 transferring to Levon a 33-1/3 percent33.3% interest in the Norma Sass and Ruf Claims. Levon is a British Columbia company also engaged in the exploration of precious minerals and has four directors in common to the Company.
In January 2005, we announced the formation of an exploration agreement with Agnico-Eagle. The agreement covers our the Norma Sass, Blue Nugget and Lander Ranch claims. The Norma Sass agreement also includes our partnership with Levon. Under the agreement, Agnico-Eagle can earn a 51% interest in the Norma Sass, Blue Nugget and Lander Ranch claims by completing at least 45,000 feetft of exploration drilling and paying certain advance royalties. At its option, Agnico-Eagle may acquire the claim leases from the underlying owners for its benefit and Agnico-Eagle shall be deemed to have earned an additional 24% interest. Agnico-Eagle will then have the option of acquiring the remaining 25% interest by producing a positive feasibility study and making a positive production decision.
28
At the fifth anniversary and every year thereafter until production occurs, the advance royalty payment will be US$150,000 per annum. All advance royalty payments will be credited towards Agnico-Eagle'sAgnico-Eagle’s payment of a royalty of 2.5% net smelter returns from production to the Company and Levon. Agnico-Eagle has reserved the right to purchase 1% of this net smelter returns royalty (to reduce the royalty to the Company and Levon to 1.5%) for a cash payment of US$1.0 million. The Company and Levon have agreed to share in any benefits from the agreement with Agnico-Eagle in proportion to their current respective interests in the Norma Sass Property.
In February 2007, Agnico-Eagle Mines Ltd. has notified the Company that it would not be continuing its option on Company'sCompany’s Norma Sass, Lander Ranch and Blue Nugget properties because of other corporate priorities. The Company has beenwas pleased with the work done by Agnico-Eagle during the past two years.Agnico-Eagle. They successfully showed depths to the lower plate sequence across the Norma Sass ground and extended the area of gold mineralization at Lander Ranch. The Company will beis reviewing results of Agnico-Eagle’s exploration programs in order to plan further work.
In September 2008 the Company entered into an exploration, development and mine operating agreement with Barrick, wherein Barrick is granted the option to acquire up to a 75% interest in the Company’s and Levon interests in the Norma Sass Property, Nevada, consisting of 36 unpatented mining claims.
Barrick may earn a 60% interest by incurring total exploration expenditures of at least US $3 million in annual installments by December 31, 2014. Barrick may earn an additional 10% (for an aggregate interest of 70%) by incurring an additional US $1.5 million by December 31, 2015. Barrick may earn an additional 5% (for an aggregate interest of 75%) by carrying the Company and Levon through to commercial production.
Alternatively, at the time of earning either its 60% or 70% interest, Barrick may be given the option to buy-out the Company’s and Levon’s joint interest by paying US $6 million and granting them a 2% net smelter returns royalty.
In May 2009, Barrick announced that plans are underway to do target delineation work in the second quarter followed by deep drilling in the third quarter on the Norma Sass property, Cortez Gold Trend, Nevada. Norma Sass is a 36-claim property immediately west of the Pipeline Mine open pit. Norma Sass was optioned to Barrick as mentioned in the above paragraph.
There is no underground or surface plant or equipment located on the Norma Sass and Ruf Claims, nor any known body of commercial ore.
(iv) June Claims
The Company announced the completion of a mineral lease with option to purchase agreement to explore, develop, and exploit six lode mining claims located in Lander County, State of Nevada (the “June Claims”). The June Claims are adjacent to the Company’s View Claims in the northwest section of its Robertson Property. The agreement is for an initial term of 4 years in consideration of the payment of an annual rent of US$25,000, renewable in successive four year terms, provided that the rent will increase by US$5,000 every four years. The property is subject to a royalty charge of 3% of net smelter returns (“NSR”), subject to the Company’s exclusive right to purchase the NSR for US$1,000,000 per percentage point upon notice to the Lessors. The Company also has the exclusive right to purchase the property, subject to the NSR, for US $1,000,000 upon notice to the Lessors. No further work on the June Claims is proposed at this time.
(v) JDN Claims, Nevada, U.S.A
. (formerly known as the JD Mining Claim)On December 16, 1986, the Company acquired six mining claims on 550 acres of land near Crescent Valley (Lander County), Nevada for US$10,000. The Company located an additional 28 unpatented lode mining claims covering some 30 acres in May 1996 and acquired a 100% interest by staking the “JDN Claims”. The JDN Claims are located approximately three miles north of the Robertson Mining Claims.
29
In 1987, geological mapping was conducted. In fiscal year 1994, the Company optioned a 50% interest in the JDN claims to Mill Bay Ventures Inc., formerly First International Metals Corp., referred to as "Mill Bay"“Mill Bay”, a company with two directors in common to the Company, for $10,000 and an initial installment of 50,000 common shares of Mill Bay. On February 5, 1997, Mill Bay exercised the option by issuing to the Company an additional 50,000 common shares and completion of specified exploration work.
Access to the JDN Claims from Elko, Nevada, a regional mining supply center, is via Highways 80 and 306, a distance of approximately 102 kilometers to the community of Crescent Valley and then an additional 18 kilometers on a gravel access road from the community of Crescent Valley. A four-wheel drive vehicle is usually necessary to access all roads on the property. As of fiscal year 2001, the Company has written down the JDN Claims to a nominal value. There is no underground or surface plant or equipment located on the JDN Claims, nor any known body of commercial ore.
(vi) C-Eagle Claims, Nevada, U.S.A.
In 1987, the Company acquired a 100% interest in the C-Eagle Claims. The C-Eagle Claims consist of 15 lode mineral claims, and are located at Corral Canyon, in Lander County, Nevada, approximately 16 kilometers north-northwest of Placer’s Cortez gold mine and comprises a total of approximately 646 acres. The C-Eagle Claims are approximately three miles west of Crescent Valley, Nevada, and approximately 18 miles southeast of Battle Mountain, Nevada. Access to the C-Eagle Claims from Elko, Nevada, a regional mining supply center, is via Highways 80 and 306, a distance of approximately 90 kilometers and then an additional 13 kilometers on a gravel access road from the community of Crescent Valley. A four-wheel drive vehicle is usually necessary to access all roads on the property.
The C-Eagle Claims are subject to a 3% net smelter royalty to Geomex 8, which royalty shall cease at such time as the sum of US$1,250,000 has been paid to Geomex 8.
In fiscal year 1994, the Company optioned a 50% interest in these claims to Levon for $10,000 and 100,000 Levon common shares. During 1996, Levon exercised its option and holds a 50% interest in the C-Eagle Claims with the Company. During fiscal year 2000, no substantial work at the C-Eagle Claims was conducted and as of fiscal year 2001, the Company has written down the C-Eagle Claims to a nominal value. There is no underground or surface plant or equipment on the C-Eagle Claims, noror any known body of commercial ore.
(vii) Ludlow Property, California, U.S.A.
The Company owns certain mining property consisting of approximately 128 acres in San Bernardino County, California, referred to as the "Ludlow Property"“Ludlow Property”. The purchase price for the Ludlow Property was $28,187, and as of January 31, 2000, the Company expended $36,885 on exploration costs. The property is located approximately six miles south of Ludlow, California, and is readily accessible by dirt road from Ludlow. Ludlow lies at the western junction of U.S. Highway 40 and Route 66. Old wagon roads allow any part of the property to be reached by an easy walk. The Ludlow property has previously been explored as evidenced by trenches, pits and shallow shafts and adits. The only recorded data relating to previous exploration applies to the Baghdad-Chase Mine which lies approximately two kilometers to the south of the Ludlow Property.
There has been no underground exploration or development work done on the claims by the Company other than geochemical soil sampling and, to the Company’s knowledge, there is no record of the previous work carried out on the claims as indicated by the evidence of trenches, pits and shallow shafts and adits that are located thereon. No exploration work has been performed on the property for the past five fiscal years. In order to keep the mining title to the Ludlow Property in good standing, the Company is required to pay property taxes. As of fiscal year 2001, the Company wrote down the Ludlow Property to a nominal value. There is no surface or underground plant or equipment on the Ludlow Property, nor any known body of commercial ore.
Item 4A
The following discussion and analysis of the operatingoperations, results and the financial position of the Company is for the years ended January 31, 2007, 20062009, 2008 and 2005, and2007 should be read in conjunction with the consolidatedJanuary 31, 2009 Consolidated Financial Statements and the notes thereto.
30
The financial statements andare prepared in accordance with Canadian GAAP which has several notable differences from US GAAP. Canadian GAAP permits the related notes included herein at item 17. Please see item 3 for a reconciliationdeferral of Canadian and U.S. GAAP.
January 31, 2007 | January 31, 2006 | January 31, 2005 | ||||||||||
| $ | $ | $ | ||||||||||
| Loss for the period | (2,528,614 | ) | (2,263,288 | ) | (983,665 | ) | ||||||
| Loss per share | (0.38 | ) | (0.47 | ) | (0.21 | ) | ||||||
| Total assets | 14,892,422 | 11,385,912 | 10,737,683 | |||||||||
| Total liabilities | 3,991,576 | 3,711,170 | 2,761,897 | |||||||||
Overall Performance
The following is a summary of significant events and transactions during the year ended January 31, 2009:
Robertson Property, Nevada
Core Area
The Company doubled the inferred gold resource to over 2.3 million ounces in late 2007. This new calculation was based on 91,284,800 tons grading 0.025 oz Au/ton using a gold price of US$600/oz and a cutoff grade of 0.015 oz Au/ton. (Details are available in our February 11, 2008 news release). Later in 2008, the Company also completed 22,385 feet of reverse circulation drilling in 33 vertical holes, partially extending the areas of mineralization in several zones. Highlights of the drill program included Hole #CR08-13, which intersected 100 feet grading 0.075 oz Au/ton and included 25 feet grading 0.17 oz Au/ton. Complete drill results and program details are available in the Company’s news release issued February 4, 2009. The 2008 drilling program has not as yet been incorporated in the Company’s current resource figures.
Deep drilling in 2007 encountered Carlin-type geochemistry including gold in the important lower plate host rocks for Carlin-type structure beneath the Roberts Mountains thrust fault. The gold intercepts indicate a Carlin type system in Lower Plate rocks on a western part of the property. Follow up mapping, rock sampling and infill gravity surveys in 2008 lead to the Company’s identification of a new lower plate target zone that extends from the coral deep hole, 2 km to the south. The West Deep Carlin-type target adds significant discovery potential to the Robertson Property for a world-class gold deposit. The target zone lies north of the Pipeline Mine open pit along a projected mineralized fault and fracture system that controls gold within that deposit. Considerably more drilling on the Robertson West Deep target is warranted. While the Company would prefer to continue drilling and expanding these targets in 2009, the Company must wait and see what unfolds in the equity markets and regarding its ability to raise additional exploration capital.
A. Results of Operations
Twelve months ended January 31, 20072009 compared with the twelve months ended January 31, 2006.
General and administrative expenses
General and administrative expenses totaled $2,516,862 for the year ended January 31, 2009 compared with $1,359,172 for the year ended January 31, 2008, an increase of $1,157,690. The current year had decreases of $324,141 in legal and accounting fees, $51,076 in listing and filing fees, and $29,490 in management fees. Cost items that increased were $1,459,017 in stock based compensation, $26,320 in consulting fees, $26,233 in travel, $24,690 in salaries and benefits, $13,917 in office and miscellaneous, and $11,098 in investor relations and shareholder information.
31
The increase in consulting fees during fiscal 2009 was attributable to the addition of a consultant. The increased expense in investor relations and travel come from a contract with an investor relation firm engaged earlier in the fiscal year. The significant higher legal and accounting fees in the prior year were resulting from the title search of the Robertson Property during the year. As discussed above, the increase in stock-based compensation was due the extension of expiry dates of warrants. Listing and filing fees decreased during the year ended January 31, 2009 with less activity in this area while there were private placement and a share split in the prior year. The management fees declined during the year because of the elimination of payment to a former executive officer.
Loss for the year
The loss for the year ended January 31, 2009 was $3,746,165 compared with a loss of $1,319,185 for the year ended January 31, 2008, an increase of $2,426,980. In addition to the increase in general and administrative expenses, there was a future income tax expense of $533,297 and a foreign exchange loss of $765,770, which primarily related to the future income tax calculation. Interest income also decreased by $95,240 due to a lower cash balance. During the year ended January 31, 2008, there was also a write-down of $24,029 in advances receivable whereas this did not occur in the year ended January 31, 2009.
Twelve months ended January 31, 2008 compared with the twelve months ended January 31, 2007.
General and administrative expenses
General and administrative expenses totaled $1,359,172 for the year ended January 31, 2008 compared with $1,983,965 for the year ended January 31, 2007, compared with $2,301,983 fora decrease of $624,793. The year ended January 31, 2008 had decreases of $98,995 in consulting fees, $50,000 in directors fees, $43,640 in legal and accounting, $38,368 in office and miscellaneous, $438,163 in stock-based compensation and $14,378 in travel. Cost items that increased were investor relations and shareholder information by $8,988, listing and filing fees by $30,346, management fees by $2,275 and salaries and benefits by $17,287.
Legal and accounting fees, consulting fees, office and miscellaneous and directors fees were all higher in the year ended January 31, 2006, a decrease of $318,018. Items that contributed to the decrease in general and administrative expenses were decreases of $538,403 in salaries and benefits and $307,691 in stock-based compensation. The reason for the decrease in salaries and benefits is that no bonuses were recorded in fiscal 2007 compared to $525,000 recorded in fiscal 2006. Offsetting the decrease in costs were increases of $92,072 in consulting fees, $50,000 in directors’ fees, $49,837 in investor relations and shareholder information, $273,703 in legal and accounting, $15,255 in listing and filing fees, $27,215 in management fees, $14,722 in office and miscellaneous expenses and $4,738 in transfer agent fees. Consulting fees, directors’ fees and legal fees were significantly higher as2007as a result of the US Gold offer. Consultingdue diligence in connection with a buyout offer and a mineral property review and title search of the Robertson Property. In addition to requiring U.S. based legal services for these activities, there were such items as special committee fees includedfor the directors, liability insurance and financial advisory services whereas these costs were much less or were not incurred in the year ended January 31, 2008.
Listing and directors’filing fees were a resulthigher in the year ended January 31, 2008 because of the extra timefee associated with performing the 3-for-1 common share split. Salaries and effort required of the special committee members in addressing the offer. Legal fees largely increased due to the title review of the company’s mineral properties. Investor relations and shareholder information costsbenefits were higher due to increased efforts to promote the company and items associated with the U.S. Gold offer. Management fees were higher due to the hiring of a Chief Financial Officer in the fiscal 2007 year. Higher listing and filing fees were a direct result of the fees paid to the TSX-V to get approval for the private placement that was closed and an increase in the annual sustaining fees.
Loss for the period
Loss for the year ended January 31, 20072008 was $2,528,614$1,319,185 compared with a loss of $2,263,288$2,528,614 for the year ended January 31, 2006, an increase2007, a decrease of $265,326.$1,209,429. The reasonprimary reasons for the increase in the loss for the fiscal 2007 year is the future income tax expense, foreign exchange loss and write-down of advances receivable noted above. The write-down was primarily a result of an allowance being made against cost recoveries associated with the U.S. Gold offer that were expected but not received. Reducing the overall loss was the decrease in general and administrative expenses described above and an increase in interest income of $123,968 for the fiscal 2007 year.
B. Liquidity and Capital Resources
During year ended January 31, 2009, the Company incurred expenditures that increased itsthe mineral property carrying value on the Robertson Property by $1,660,128.$1,683,612. At this time, the Company has no operating revenuesincome but did earnis earning interest income of $144,422 in 2007 compared to $20,454 in 2006.
32
At January 31, 2007,2009, the Company had working capital of $2,212,386$959,419 and cash and cash equivalents of $2,545,711.$1,332,316. During the fiscal 2007 year ended January 31, 2009, the Company raised grosshad cash proceeds of $4,500,000 through a private placement of 1,500,000 shares at a price of $3.00 per share. The Company also raised proceeds of $527,888$59,920 from the exercisingexercise of 191,194 warrants and $66,430 from the exercising of 36,900107,000 stock options. Subsequent to the fiscal 2007 year end the Company has closed a private non-brokered private placement of up to 1,410,000 units at a price of $3.00 per unit. The Company is continuing its exploration program and the estimated cost for the following year is $3 million.
The Company has sufficient cash on hand at this time to finance the limited exploration work on its mineral properties and maintain administrative operations through January 31, 2008.
Mineral exploration and development is capital intensive, and in order to maintain its interestinterests, the Company will be required to raise new equity capital in the future. There is no assurance that the Company will be successful in raising additional new equity capital.
C. Research and Development, Patents and Licenses, etc.
As the Company is a mineral exploration company with no research and development, patents and licenses, etc.
D. Trend information
As at January 31, 2007, the Company hadis a mineral exploration company with no currently producing properties, the followinginformation required by this section is not applicable.
E. Off-Balance Sheet Arrangements
The Company has no off-balance sheet arrangements.
F. Tabular Disclosure of Contractual Obligations
The Company has no contractual obligations:
Total | < 1 year | 1-3 years | 3-5 years | More than 5 years | ||||||||||||||||
| Investor relations contract | $ | 16,000 | $ | 16,000 | - | - | - | |||||||||||||
| Site restoration liability | 15,614 | - | 15,614 | - | - | |||||||||||||||
| Total | 31,614 | 16,000 | 15,614 | - | - | |||||||||||||||
G. Safe Harbor
Certain statements in this Annual Report, including those appearing under this Item 5, constitute "forward-looking statements"“forward-looking statements” within the meaning of the United States Private Securities Litigation Reform Act of 1995,, Section 21E of the United States Securities Exchange Act of 1934,, as amended, and Section 27A of the United States Securities Act of 1933,, as amended. Additionally, forward-looking statements may be made orally or in press releases, conferences, reports, on our website or otherwise, in the future, by us or on our behalf. Such statements are generally identifiable by the terminology used such as "plans"“plans”, "expects"“expects”, "estimates"“estimates”, "budgets"“budgets”, "intends"“intends”, "anticipates"“anticipates”, "believes"“believes”, "projects"“projects”, "indicates"“indicates”, "targets"“targets”, "objective"“objective”, "could"“could”, "may"“may”, or other similar words.
The forward-looking statements are subject to known and unknown risks and uncertainties and other factors that may cause actual results, levels of activity and achievements to differ materially from those expressed or implied by such statements. Such factors include, among others: market prices for metals; the results of exploration and development drilling and related activities; economic conditions in the countries and provinces in which we carry on business, especially economic slowdown; actions by governmental authorities including increases in taxes, changes in environmental and other regulations, and renegotiations of contracts; political uncertainty, including actions by insurgent groups or other conflict; the negotiation and closing of material contracts; and the other factors discussed in Item 3 Key Information – "Risk Factors"“Risk Factors”, and in other documents that we file with the SEC. The impact of any one factor on a
33
particular forward-looking statement is not determinable with certainty as such factors are interdependent upon other factors; our course of action would depend upon our assessment of the future considering all information then available. In that regard, any statements as to future production levels; capital expenditures; the allocation of capital expenditures to exploration and development activities; sources of funding of our capital program; drilling; expenditures and allowances relating to environmental matters; dates by which certain areas will be developed or will come on-stream; expected finding and development costs; future production rates; ultimate recoverability of reserves; dates by which transactions are expected to close; cash flows; uses of cash flows; collectability of receivables; availability of trade credit; expected operating costs; expenditures and allowances relating to environmental matters; debt levels; and changes in any of the foregoing are forward-looking statements, and there can be no assurances that the expectations conveyed by such forward-looking statements will, in fact, be realized.
Although we believe that the expectations conveyed by the forward-looking statements are reasonable based on information available to us on the date such forward-looking statements were made, no assurances can be given as to future results, levels of activity, achievements or financial condition.
Readers should not place undue reliance on any forward-looking statement and should recognize that the statements are predictions of future results, which may not occur as anticipated. Actual results could differ materially from those anticipated in the forward-looking statements and from historical results, due to the risks and uncertainties described above, as well as others not now anticipated. The foregoing statements are not exclusive and further information concerning us,the Company, including factors that could materially affect ourits financial results, may emerge from time to time. We doThe Company does not intend to update forward-looking statements to reflect actual results or changes in factors or assumptions affecting such forward-looking statements.
Item 6
A. Directors and Senior Management
The following is a list of the Company’s directors and officers as of July 17, 2007.31, 2009. The directors were re-elected by the Company’s shareholders on July 17, 2007June 26, 2009 and are elected for a term of one year which term expires at the election of the directors at the next annual meeting of shareholders.
Name | Position Held | Principal Occupation | Director/Officer Since |
| Louis Wolfin | Chief Executive Officer | Mining Executive; | July 1990 |
| and Director | |||
| Bralorne Gold Mines Ltd., | |||
| Director of Avino Silver & | |||
| Gold Mines Ltd., Chief | |||
| Executive Officer and | |||
| Director of Levon | |||
| Resources Ltd. and Director | |||
| of Cresval Capital Corp. | |||
| Lloyd Andrews | Chairman and Director | September 1997 | |
| Gold Mines Ltd. and the | |||
| Company. | |||
| Chris Sampson | Vice President | Director and Vice President | January 1996 |
| Exploration and Director | Exploration of the Company; | ||
| Professional Engineer, | |||
| Director of Sego Resources | |||
| Ltd. | |||
| David Wolfin(1) | Director and President | Director of the Company; | September 1997 |
| and Director of Bralorne |
34
| Name | Position Held | Principal Occupation | Director/Officer Since |
| Gold Mines Ltd. and | |||
| Berkley Resources Inc.; | |||
| President of Gray Rock | |||
| Resources Ltd.; President | |||
| and Director of Avino Silver | |||
| & Gold Mines Ltd.; and | |||
| Director of Mill Bay | |||
| Ventures Inc. and Cresval | |||
| Capital Corp.; Director and | |||
| VP Finance of Levon | |||
| Resources Ltd. |
| Gary Robertson | Director | Certified Financial Planner, | July 2003 |
| Director of the Company and | |||
| Director of Avino Silver & | |||
| Gold Mines Ltd., Bralorne | |||
| Gold Mines Ltd., Levon | |||
| Resources Ltd., Mill Bay | |||
| Ventures Inc. and Sage Gold | |||
| Inc. | |||
| Dorothy Chin | Corporate Secretary | Corporate Secretary of the | September 2008 |
| Company and of Avino | |||
| Silver & Gold Mines Ltd., | |||
| Bralorne Gold Mines Ltd., , | |||
| Gray Rock Resources Ltd., | |||
| Levon Resources Ltd. | |||
| Mill Bay Ventures Inc. | |||
| Lisa Sharp | Chief Financial Officer | Chief Financial Officer of | June 2008 |
| Bralorne Gold Mines Ltd., | |||
| Coral Gold Resources Ltd., | |||
| Gray Rock Resources Ltd., | |||
| Levon Resources Ltd., Mill | |||
| Bay Ventures Inc. and | |||
| Technology Solutions Inc. |
(1)
Mr. David Wolfin is the son of Mr. Louis Wolfin.B. Compensation
For purposes of the Company. On March 15, 2006 the Company announced that Mr. Lindsay Gorrill was appointed Chief Financial Officer. Following the Company's annual meeting on July 17, 2007, Mr. Louis Wolfin was appointed Chief Executive Officerthis Item 6(B), “named executive officer” of the Company and Mr. David Wolfin was appointed President ofmeans an individual who, at any time during the Company.
| (a) | the Company’s chief executive officer (“CEO”); | |
| (b) | the Company’s chief financial officer (“CFO”); | |
| (c) | each of the Company’s three most highly compensated executive officers, other than the CEO and CFO, who were serving as executive officers as at the end of the most recently completed financial year and whose total salary and bonus exceeded $150,000; and |
35
| (d) | any additional individuals for whom disclosure would have been provided under (c) except that the individuals was not serving as an officer of the Company at the end of the most recently completed financial year, |
each a “Named Executive Officer” (“NEO”).
Based on the foregoing definition, during the last completed fiscal year of the Company, there were three (3) Named Executive Officers, namely, its CEO, Louis Wolfin, its current CFO, Lisa Sharp, and its former CFO, Kevin Bales.
1) Compensation Discussion and Analysis
The Company does not have not been compensated bya compensation program other than paying base salaries, incentive bonuses, and incentive stock options to the NEOs. The Company recognizes the need to provide compensation package that will attract and retain qualified and experienced executives, as well as align the compensation level of each executive to that executive’s level of responsibility. The objectives of base salary are to recognize market pay, and acknowledge the competencies and skills of individuals. The objectives of incentive bonuses in their capacities as directorsthe form of cash payments are designed to add a variable component of compensation, based on corporate and individual performances for executive officers and employees. No incentive bonuses were paid to executive officers and employees during the most recently completed fiscal year. The objectives of the stock option are to reward achievement of long-term financial yearand operating performance and focus on key activities and achievements critical to the ongoing success of the Company. Implementation of a new incentive stock option plan and amendments to the existing stock option plan are the responsibility of the Company’s Compensation Committee.
The Company has no other than an aggregateforms of $12,000compensation, although payments may be made from time to time to individuals or companies they control for the provision of consulting services. Such consulting services are paid to Lloyd Andrews for director’s fees. In addition,by the Company paid an aggregateat competitive industry rates for work of $31,250 to Frobisher Securities Ltd., a private British Columbia Corporation controlledsimilar nature by Louis Wolfin and directorreputable arm’s length services providers.
The process for determining executive compensation relies solely on discussions amongst the board of the Company for management advisory services. The Company paid an aggregate of $65,000 to Wear Wolfin Designs Ltd., a private British Columbia corporation controlled by the spouse of Matt Wayrynen, Vice-President, former President and a director of the Company, for management advisory services. The Company paid an aggregate of $30,000 to Intermark Capital Corp, a private British Columbia Corporation controlled by David Wolfin, a director of the Company, for management advisory services. The Company paid an aggregate of $20,000 to Gary Robertson for acting as Chairman of the special committee formed pursuant to the U.S. Gold offer, referred to as the Special Committee. The Company paid Florian Riedl-Riedenstein an aggregate of $15,000 for his services as a member of the Special Committee. Incentive stock options have been granted to non-employee directors of the Company to purchase an aggregate of 73,400 shares(the “Board”) with the input from and upon the recommendations of the Company at aCompensation Committee, without any formal objectives criteria and analysis.
Actual compensation will vary based on the performance of the executives relative to the achievement of goals and the price of $1.70 per share exercisable on or before December 1, 2009, 29,400 of which have been exercised and an aggregate of 75,000 shares of the Company at a price of $3.55 per share exercisable on or before December 12, 2010, none of which have been exercised and an aggregate of 55,000 shares of the Company at a price of $3.92 per share exercisable on or before September 5, 2011, none of which has been exercised.Company’s securities.
| Compensation Element | Description | Compensation Objectives |
| Annual Base Salary (all NEOs) | Salary is market-competitive, fixed level of compensation | Retain qualified leaders, motivate strong business performance. |
| Incentive Bonuses | Cash payment to add variable component to compensation | Based on corporate and individual performances of key personnel. |
| Incentive Stock Option (all NEOs) | Equity grants are made in the form of stock options. The amount of grant will be dependent on individual and corporate performance. | Retain qualified leaders, motivate strong business performance. |
The following table sets forth particulars concerning the compensation paid or accrued for services rendered to the Company in all capacities during each of the last threemost recently completed financial yearsyear ended January 31, 2009 of the Company to its Chief Executive Officer, Chief Financial OfficerNEOs:
36
Name and principal position | Year | Salary ($) | Share- based awards ($) | Option- based awards ($) | Non-equity incentive plan compensation ($) | Pension value ($) | All other compensation ($) | Total compensation ($) | |
| Annual incentive plans | Long- term incentive plans | ||||||||
| Louis Wolfin(1) CEO and Director | 2008 | $75,000 | NIL | NIL | NIL | NIL | NIL | NIL | $75,000 |
| Lisa Sharp(2) CFO | 2008 | $12,756 | NIL | NIL | NIL | NIL | NIL | NIL | $12,756 |
| Kevin Bales Former CFO | 2008 | $5,227 | NIL | NIL | NIL | NIL | NIL | NIL | $5,227 |
| (1) | The Company paid an aggregate of $75,000 to Frobisher Securities Ltd., a private corporation controlled by Mr. Louis Wolfin. |
| (2) | Ms. Lisa Sharp was appointed CFO of the Company on June 9, 2008. |
Annual Base Salary
Base Salary for the NEOs are determined by the Board upon the recommendation of the Compensation Committee and its recommendations are reached primarily by comparison of the remuneration paid by other reporting issuers with the same size and industry and with publicly available information on remuneration that the Compensation Committee feels is suitable.
The Annual Base Salary paid to the other executive officersNEOs shall, for the purpose of establishing appropriate increases, be reviewed annually by the Board upon the recommendation of the Company who received a combinedCompensation Committee thereof as part of the annual review of executive officers. The decision on whether to grant an increase to the executive’s base salary and bonusthe amount of any such increase shall be in excessthe sole discretion of $150,000, referredthe Board and Compensation Committee thereof.
Long Term Incentive Plan (LTIP)
The Company does not have a LTIP, pursuant to which cash or non-cash compensation intended to serve as an incentive for performance (whereby performance is measured by reference to financial performance or the "Named Executive Officers"price of the Company’s securities), was paid or distributed to the NEO during the most recently completed financial year ended January 31, 2007.
Summary Compensation Table | |||||||
Annual Compensation | Long-Term Compensation Awards | ||||||
Name/Principal Position | Year | Salary(1) $ | Bonus for the Year $ | Other Annual Compensation $ | Securities Under Options/SARs Granted (#)(2) | Restricted Shares/Units Awarded $ | All Other Compensation $ |
Matt Wayrynen, Vice President and former President | 2007 2006 2005 | 47,500 60,000 60,000 | - - - | 17,500 45,000 15,000 | 97,000 77,000 75,000 | - - - | 1,479 1,389 1,082 |
Louis Wolfin President | 2007 2006 2005 | 31,250 - - | - 525,000(3) - | - 2,000 - | 175,000 100,000 50,000 | - - - | 1,320 1,831 1,392 |
Lindsay Gorrill Chief Financial Officer | 2007 2006 2005 | 35,965 N/A N/A | - N/A N/A | - N/A N/A | 20,000 N/A N/A | - N/A N/A | - N/A N/A |
Option Based Award
An Option Based Award is in excessthe form of $100,000.
In the June 26, 2009 Shareholders’ Meeting, the “disinterested” shareholders approved the implementation of a new stock option plan to supersede and replace the existing 2008 Stock Option Plan. The new stock option plan (the "2009 Stock Option Plan") for insiders, employees and other service providers to the Company, will reserve up to 10% of the issued shares from time to time, as a “rolling stock option plan”. Currently, there are 24,989,771 shares issued, so the 2009 Stock Option Plan will currently permit up to 2,498,977 shares for incentive stock option grants under the plan to qualifying persons, less the currently issued and outstanding stock options. New stock options may be granted under the 2009 Stock Option Plan for up to a maximum of ten (10) years.
37
In addition, the 2009 Stock Option Plan will limit the number of stock options, which may be granted to any one individual to not more than 5% of the total commonissued shares of the Company in any 12 month period, and not more than 10% of the total issued shares to all insiders at any time or granted over any 12 month period (in the absence of disinterested shareholder approval). The number of options granted to any one consultant, or a person employed to provide investor relations activities, in any 12 month period must not exceed 2% of the total issued shares of the Company. Any stock options granted under the 2009 Stock Option Plan will not be subject to any vesting schedule, unless otherwise determined by the Board of Directors
For details of the option plan please refer to “Particulars of Matters to be Act Upon” in the Information Circular filed with the SEC on June 8, 2009.
The 2009 Stock Option Plan is administered by the Compensation Committee pursuant to the 2009 Stock Option Plan. The process the Company uses to grant option-based awards to executive officers is upon the recommendations of the Compensation Committee to the Board.
The role of the Compensation Committee is to recommend to the Board the compensation of the Company’s directors and the NEOs which the Committee feels is suitable.
All previous grants of option-based awards are taken into account when considering new grants.
3) Incentive Plan Awards
Outstanding share-based awards and option-based awards
The following table sets forth the options asgranted to the NEOs to purchase or acquire securities of the Company outstanding at the end of the fiscal year.
| Option-based Awards | Share-based Awards | |||||
Name | Number of securities underlying unexercised options (#) | Option exercise price ($) | Option expiration date | Value of unexercised in- the-money options ($)(1) | Number of shares or units of shares that have not vested (#) | Market or payout value of share-based awards that have not vested ($)(1) |
| Louis Wolfin CEO and Director | 150,000 150,000 225,000 | $0.56 $1.17 $1.29 | Dec. 1, 2009 Dec. 12, 2010 Sept. 5, 2011 | Nil | Nil | Nil |
| Lisa Sharp CFO | Nil | N/A | N/A | N/A | N/A | N/A |
| Kevin Bales, Former CFO | 10,000 30,000 | $0.56 $1.29 | Dec 31, 2008 Dec 31, 2008 | Nil | Nil | Nil |
(1) No value was attributed to unexercised options that were out of the money on January 31, 2009.
Incentive plan awards – value vested or earned during the year
The following table sets forth the value vested or earned during the year of option-based awards, share-based awards and contributionsnon-equity incentive plan compensation paid to NEOs during the Company.
38
| Name | Option-based awards – Value vested during the year ($)(1) | Share-based awards – Value vested during the year ($) | Non-equity incentive plan compensation – Value earned during the year ($) |
| Louis Wolfin CEO and Director | Nil | Nil | Nil |
| Lisa Sharp CFO | N/A | N/A | N/A |
(1) No value was attributed to unexercised vested options that were out of the money on January 31, 2009.
4) Pension Plan Benefits
No pension plan or retirement benefit plans have been instituted by the Company and none are proposed at this time.
5) Termination and Change of Employment, Changes in Responsibilities and Employment Contracts
The Company does not have anany employment contractcontracts with the Named Executive Officers,NEOs, and there are no contractual provisions for termination of employment or change in responsibilities.
6) Director Compensation
The following table sets forth the value of all compensation paid to the directors during the most recently completed financial year ended January 31, 2009:
Name | Fees earned ($) | Share- based awards ($) | Option- based awards ($)(1) | Non-equity incentive plan compensation ($) | Pension value ($) | All other compensation ($) | Total ($) |
| Lloyd Andrews | $12,000 | NIL | NIL | NIL | NIL | NIL | $12,000 |
| Gary Robertson | NIL | NIL | NIL | NIL | NIL | NIL | NIL |
| Chris Sampson | NIL | NIL | NIL | NIL | NIL | NIL | NIL |
| David Wolfin | NIL | NIL | NIL | NIL | NIL | NIL | NIL |
| Victor Chevillon(2) | NIL | NIL | NIL | NIL | NIL | NIL | NIL |
| (1) | The fair value of stock options granted during the last financial year is based on the difference between the exercise price of the stock options granted, and the last closing price of the Company’s shares on the trading date immediately preceding the dates of grant of the stock options, as a reasonable estimate of the benefit conferred at the time of the grant. |
| (2) | Mr. Chevillon resigned as a director of the Company in May 2009. |
The Company paid Lloyd Andrews, an independent director, an annual payment of $12,000 ($6,000 for fees and $6,000 for office expenses).
Incentive stock options have been granted to non-employee directors of the Company to purchase an aggregate of 220,200 shares of the Company at a price of $0.56 per share exercisable on or before December 1, 2009, of which 160,200 have been exercised, an aggregate of 225,000 shares of the Company at a price of $1.17 per share exercisable on or before December 12, 2010, none of which have been exercised; an aggregate of 165,000 shares of the Company at a price of $1.29 per share exercisable on or before September 5, 2011, none of which have been exercised; and an aggregate of 125,000 shares of the Company at a price of $1.00 per share exercisable on or before September 26, 2012, none of which have been exercised.
39
Termination of Employment, Changes in Responsibilities and Employment Contracts
The Company does not have an employment contract with the NEOs, and there are no contractual provisions for termination of employment or change in responsibilities.
C. Board Practices
Currently, the Company has sixfive directors. The size and experience of the boardBoard is important for providing the Company with effective governance in the mining industry. The board’sBoard’s mandate and responsibilities can be effectively and efficiently administered at its current size. The chairman of the boardBoard is not a member of management. The boardBoard has functioned, and is of the view that it can continue to function, independently of management as required. At the Annual General Meeting, held on July 17, 2007,June 26, 2009, the shareholders elected Lloyd Andrews, Gary Robertson, Chris Sampson, David Wolfin, and Louis Wolfin as directors. Mr C. Victor Chevillon was appointed to the board of directors on July 17, 2007.
The boardBoard has considered the relationship of each director to the Company and considers two of the five directors to be “independent” (Messrs. Andrews and Robertson) for the purposes of National Instrument 58-101 –
Disclosure of Corporate Governance Practices..
Two of the directors (Messrs. David Wolfin and Louis Wolfin) who are considered related (Messrs. David Wolfin, Louis Wolfin) are related by family. Chris Sampson is also the Vice-President of Exploration of the Company.
The boardBoard has addressed the related directorship issues and intends, given a transitional period, to eventually be comprised of a majority of unrelated directors. Procedures are in place to allow the boardBoard to function independently. At the present time, the boardBoard has experienced directors that have made a significant contribution to the Company’s success, and are satisfied that it is not constrained in its access to information, in its deliberations or in its ability to satisfy the mandate established by law to supervise the business and affairs of the Company. The Company’s chairman and independent directors meet in the absence of managing directors. Committees meet independent of management and other directors. Committees appoint a chairman from their number who presides over the committee meetings.
Mandate of the Board of Directors, its Committees and Management
The role of the boardBoard is to oversee the conduct of the Company’s business, including the supervision of management, and determining the Company’s strategy. Management is responsible for the Company’s day to day operations, including proposing its strategic direction and presenting budgets and business plans to the board of directorsBoard for consideration and approval. The strategic plan takes into account, among other things, the opportunities and risks of the Company’s business. Management provides the boardBoard with periodic assessments as to those risks and the implementation of the Company’s systems to manage those risks. The boardBoard reviews the personnel needs of the Company from time to time, having particular regard to succession issues relating to senior management. Management is responsible for the training and development of personnel. The boardBoard assesses how effectively the Company communicates with shareholders, but has not adopted a formal communications policy. Through the audit committee, and in conjunction with its auditors, the boardBoard assesses the adequacy of the Company’s internal control and management information systems. The boardBoard looks to management to keep it informed of all significant developments relating to or effecting the Company’s operations. Major financings, acquisitions, dispositions and investments are subject to boardBoard approval. A formal mandate for the board of directorsBoard and the chief executive officerChief Executive Officer has not been considered necessary since the relative allocation of responsibility is well understood by both management and the board.
The boardBoard and committee’s may take action at these regularregularly held meetings or at a meeting by conference call or by written consent.
Corporate Governance Committee
The corporate governance committeeCorporate Governance Committee assists the boardBoard in establishing the Company’s corporate governance policies and practices generally, identifying individuals qualified to become members of the board,Board, reviewing the composition and functioning of the boardBoard and its committees and making recommendations to the board of directorsBoard as appropriate. When considering nominees to the boardBoard the committee’sCorporate Governance Committee’s mandate requires that it consider the current composition of the boardBoard and give consideration to candidates having experience in the industry, life experience and background. The committeeCorporate Governance Committee is also responsible for the Company’s corporate governance guidelines. The committeeCorporate Governance Committee may retain legal or other advisors.
The corporate governance committeeCorporate Governance Committee currently consists of three directors (Messrs. Lloyd Andrews, Gary Robertson and Chevillon)Chris Sampson). AllMessrs. Andrews and Robertson are independent directors.
Audit Committee
The audit committeeAudit Committee assists the boardBoard in its oversight of the Company’s financial statements and other related public disclosures, the Company’s compliance with legal and regulatory requirements relating to financial reporting, the external auditors, qualifications and independence and the performance of the internal audit function and the external auditors. The committeeAudit Committee has direct communications channels with the Company’s auditors. The committeeAudit Committee reviews the Company’s financial statements and related management’s discussion and analysis of financial and operating results. The committeeAudit Committee can retain legal, accounting or other advisors.
The audit committeeAudit Committee consists of Gary Robertson, Lloyd Andrews and Chris Sampson, all of whom are financially literate. Currently, the committeeAudit Committee has at least one member with accounting or related financial management expertiseexpertise. “Financially literate” means the ability to read and understand a balance sheet, an income statement, and a cash flow statement. “Accounting or related financial expertise” means the ability to analyze and interpret a full set of financial statements, including the notes attached thereto, in accordance with Canadian GAAP. Gary Robertson and Lloyd Andrews are both independent, having no direct or indirect material relationship with the Company which could, in the view of the board of directors,Board, reasonably interfere with the exercise of a member’s independent judgment.
It is intended that this committeeAudit Committee eventually will be comprised solely of unrelated directors.
The boardBoard has adopted a charter for the audit committeeAudit Committee which is reviewed annually and sets out the role and oversight responsibilities of the audit committeeAudit Committee with respect to:
|
Compensation Committee
The compensation committeeCompensation Committee recommends to the boardBoard the compensation of the Company'sCompany’s directors and the Chief Executive Officer which the Compensation Committee feels is suitable. Its recommendations are reached primarily by comparison of the remuneration paid by the Company with publicly available information on remuneration paid by other reporting issuers that the Compensation Committee feels are similarly placed within the same business of the Company.
41
The committeeCompensation Committee consists of two unrelated directors (Messrs. Robertson and Andrews) and one related director (Mr. David Wolfin). It is intended that the compensation committeeCompensation Committee will eventually be comprised solely of unrelated directors.
D. Employees
As at January 31, 2009, the Company has one full-time employee located in Nevada, United States.
E. Share Ownership
Name of Executive Officer | Securities Under Option Granted | % of Total Options Granted to Employees in Financial Year | Executive or base Price ($/Security) | Market Value of Securities underlying Options on Date of Grant ($/Security) | Expiration Date |
| Louis Wolfin | 75,000 | 26.79% | $3.92 | $3.92 | September 5, 2011 |
| Lindsay Gorrill | 20,000 | 7.14% | $3.92 | $3.92 | September 5, 2011 |
| Matt Wayrynen | 20,000 | 7.14% | $3.92 | $3.92 | September 5, 2011 |
The following table sets out the share ownership of the directors and officers of the Company as of July 11, 2007.31, 2009:
| Name of Beneficial Owner | Number of Shares | Percent |
| Louis Wolfin | 1,476,101 | 5.91% |
| Chris Sampson | 66,300 | * |
| Lloyd Andrews | Nil | * |
| Gary Robertson | 173,550 | * |
| David Wolfin | 538,600 | 2.16% |
| Dorothy Chin | Nil | * |
| Lisa Sharp | Nil | * |
Name of Beneficial Owner | Number of Shares | Percent |
| Matt Wayrynen | 0 | * |
| Louis Wolfin | 483,132 | 5.01% |
| Chris Sampson | 22,100 | * |
| Lloyd Andrews | 10,000 | * |
| Gary Robertson | 59,850 | * |
| David Wolfin | 202,700 | 1.29% |
| Connie Lillico | 4,500 | * |
| Lindsay Gorrill | 6,000 | * |
*Less than one percent
Outstanding Options
The following information, as of July 31, 2009, reflects outstanding options held by the Named Executive Officers:
| Exercise | ||||
| No. of Shares | Date of Grant | Price | Expiration Date | |
| Louis Wolfin | 150,000 | December 1, 2004 | $0.56 | December 1, 2009 |
| CEO and Director | 150,000 | December 12, 2005 | $1.17 | December 12, 2010 |
| 225,000 | September 5, 2006 | $1.29 | September 5, 2011 | |
| Lisa Sharp | Nil | N/A | N/A | N/A |
| CFO |
Item 7
A. Major Shareholders
To the knowledge of the Company, it is not directly or indirectly owned or controlled by any other corporation or by the Canadian Government, or any foreign government or by any other natural or legal person(s) severally or jointly.
As of July 31, 2009, to the knowledge of the Company’s directors and senior officers, the following table sets forth certain information as at July 9, 2007 concerning the ownership of the Company’s common shares as to eachno person known by the directors and senior officers, bases solely upon public records and filings, to be the direct and/or indirect owner ofwho owned more than five (5%) percent of the company’s common shares, who owned more than five percent of the outstanding shares of each class of the Company’s voting securities.
Title of Class | Identity of Person or Group | Amount Owned | Percentage of Class |
| Common Shares | Robert McEwen | 1,250,000 | 15.12% |
| Common Shares and Warrants | Stone's Throw Capital Corp. | 1,500,0001 | 16.63% |
| Common Shares | All the Officers and Directors of the Company | 558,051 | 6.75% |
42
B. Related Party Transactions
Related party transactions for the Company's common shares carryyear ended January 31, 2009 are as follows:
During the same voting rightsyear ended January 31, 2009:
| (a) | $30,000 (2008 - $30,000; 2007 - $30,000) was paid for consulting fees to a private company controlled by a director and officer of the Company; | |
| (b) | $75,000 (2008 - $75,000; 2007 - $31,250) was paid for management fees to a private company controlled by a director and officer of the Company; | |
| (c) | $30,000 (2008- $30,000; 2007 - $65,000) was paid for management fees to a private company controlled by a officer of the Company; | |
| (d) | $30,000 (2008- $Nil; 2007 - $Nil) was paid for consulting fees to a private company controlled by a officer of a related Company; | |
| (e) | $186,734 (2008 - $168,983; 2007 - $116,135) was charged for office, occupancy and miscellaneous costs and salaries, and administrative services paid on behalf of the Company by Oniva International Services Corp. (“Oniva”), a private company owned by the Company and five other reporting issuers having common directors; | |
| (f) | $39,526 (2008- $15,332; 2007 - $Nil) was paid for geological consulting services to a private company controlled by a director of the Company; | |
| (g) | $35,888 (2008- $42,661; 2007 - $47,198) was paid for geological consulting services to a private company controlled by a director and officer of the Company; and | |
| (h) | $12,000 (2008- $12,000; 2007 - $62,000) was paid for directors’ fees to the Directors’ of the Company. |
These charges were measured at the Companyexchange amount, which is not aware of any arrangements which may at a subsequent date result in a change of control of the Company.
The subscription agreementCompany entered into between Mr. McEwen and the Company provides, among other things, that,a cost-sharing agreement during 2005 to reimburse Oniva for a periodvariable percentage of two years following the closingits overhead expenses, to reimburse 100% of the acquisition of the common shares, if at any time subsequent to the closing of the acquisition of such common shares, Mr. McEwen owns not less than 10% of the issued and outstanding common sharesits out-of-pocket expenses incurred on behalf of the Company, (assumingand to pay a percentage fee based on the exercisetotal overhead and corporate expenses referred to above. The agreement may be terminated with one month’s notice by either party.
Advances receivable from related comprises of any warrants held$52,891 US (2008 - $52,891 US) less an allowance for bad debt of $39,113 US (2008 - $39,113). The advances receivable from related parties is from a public company related by Mr. McEwen), then Mr. McEwen shall havecommon directors. Amounts due are without stated terms of interest or repayment.
Advances payable to related parties include $12,288 (2008 - $16,662) owed to Oniva, $17,000 (2008 - $17,000; owed to a right of first refusal to participate in any future financingsdirector of the Company, and $40,796 (2008 - $25,967owed to three private companies controlled by directors and officers of the Company.
C. Interests of Experts and Counsel
Not Applicable.
43
Item 8. Financial Information
A. Consolidated Statements and Other Financial Information
The following financial statements of the Company are included under Item 17 to this Annual Report and include the following:
- Auditor’s Reports;
- Consolidated Balance Sheets as at January 31, 2009 and January 31, 2008;
- Consolidated Statements of Operations and Comprehensive Loss for the years ended January 31, 2009, 2008 and 2007;
- Consolidated Statements of Shareholders’ Equity for the years ended January 31, 2009, 2008 and 2007;
- Consolidated Statements of Cash Flows for the years ended January 31, 2009, 2008 and 2007; and
- Notes to the Consolidated Financial Statements for the years ended January 31, 2009, 2008 and 2007.
Dividend Policy
The Company has never paid any dividends and does not intend to in the near future.
B. Significant Changes
None.
Item 9. The Offering and Listing
A. Offer and Listing Details
As of July 6, 2007,31, 2009, there were 30569 holders of record holders in the United States holding 85.43%12.81% of the Company’s outstanding common stockshares representing approximately 14.74%81.17% of the total shareholders. The Company’s Common stock iscommon shares are issued in registered form and the percentage of shares reported to be held by record holders in the United States is taken from the records of the Pacific Corporate Trust CompanyComputershare Investor Services Inc. in the City of Vancouver, the registrar and transfer agent for the common stock.
The following financial statements oftable sets forth the Company are attached to this Annual Report:
| TSX-V | OTCBB | |||
| (Canadian Dollars) | (United States Dollars) | |||
| Last Six Months | High | Low | High | Low |
| July 2009 | 0.64 | 0.35 | 0.57 | 0.31 |
| June 2009 | 0.61 | 0.44 | 0.59 | 0.32 |
| May 2009 | 0.62 | 0.45 | 0.59 | 0.32 |
| April 2009 | 0.66 | 0.48 | 0.61 | 0.35 |
| March 2009 | 0.74 | 0.54 | 0.62 | 0.41 |
| February 2009 | 0.94 | 0.32 | 0.68 | 0.15 |
| 2008-2009 | High | Low | High | Low |
| Fourth Quarter ended January 31, 2009 | 0.40 | 0.13 | 0.30 | 0.07 |
| Third Quarter ended October 31, 2008 | 0.64 | 0.11 | 0.60 | 0.08 |
| Second Quarter ended July 31, 2008 | 1.08 | 0.58 | 1.05 | 0.56 |
| First Quarter ended April 30, 2008 | 1.49 | 0.80 | 1.49 | 0.80 |
44
TSX-V (Canadian Dollars) | OTCBB (United States Dollars) | |||
Last Six Months | High | Low | High | Low |
| June 2007 | 3.30 | 2.66 | 2.85 | 2.47 |
| May 2007 | 3.20 | 2.79 | 2.91 | 2.62 |
| April 2007 | 3.39 | 2.90 | 2.96 | 2.31 |
| March 2007 | 3.52 | 2.80 | 2.99 | 2.36 |
| February 2007 | 3.98 | 2.70 | 2.80 | 2.28 |
| January 2007 | 3.66 | 2.70 | 2.90 | 2.30 |
2006-2007 | High | Low | High | Low |
| Fourth Quarter ended January 31, 2007 | 4.05 | 2.70 | 3.55 | 2.30 |
| Third Quarter ended October 31, 2006 | 4.29 | 3.02 | 4.05 | 2.55 |
| Second Quarter ended July 31, 2006 | 5.75 | 2.87 | 5.19 | 2.76 |
| First Quarter ended April 30, 2006 | 6.99 | 3.14 | 5.95 | 2.74 |
2005-2006 | High | Low | High | Low |
| Fourth Quarter ended January 31, 2006 | 4.17 | 0.99 | 3.30 | 0.80 |
| Third Quarter ended October 31, 2005 | 2.10 | 1.30 | 1.71 | 1.06 |
| Second Quarter ended July 31, 2005 | 1.89 | 1.31 | 1.49 | 1.07 |
| First Quarter ended April 30, 2005 | 2.20 | 1.33 | 1.99 | 1.07 |
Last Five Fiscal Years | High | Low | High | Low |
| 2007 Annual | 6.99 | 2.70 | 5.95 | 2.30 |
| 2006 Annual | 4.17 | 0.99 | 3.30 | 0.80 |
| 2005 Annual | 4.30 | 1.12 | 2.40 | 0.90 |
| 2004 Annual* | 0.61 | 0.25 | 0.45 | 0.20 |
| 2003 Annual* | 0.68 | 0.14 | 0.48 | 0.09 |
| 2007-2008 | High | Low | High | Low |
| Fourth Quarter ended January 31, 2008 | 0.85 | 0.45 | 0.85 | 0.45 |
| Third Quarter ended October 31, 2007(2) | 1.25 | 0.66 | 1.12 | 0.60 |
| Second Quarter ended July 31, 2007(2) | 3.25 | 2.66 | 1.17 | 0.77 |
| First Quarter ended April 30, 2007(2) | 3.98 | 2.70 | 1.15 | 0.76 |
| Last Five Fiscal Years | High | Low | High | Low |
| 2009 Annual | 1.49 | 0.11 | 1.49 | 0.07 |
| 2008 Annual(2) | 3.98 | 0.45 | 1.17 | 0.45 |
| 2007 Annual | 6.99 | 2.70 | 5.95 | 2.30 |
| 2006 Annual | 4.17 | 0.99 | 3.30 | 0.80 |
| 2005 Annual(1) | 4.30 | 1.12 | 2.40 | 0.90 |
| (1) | On July 30, 2004, the shareholders approved a 10:1 share consolidation. The share consolidation was effective September 14, 2004. These share prices reflect the pre-consolidation shares. |
| (2) | On July 17, 2007 the shareholders approved a subdivision of the Company’s issued share capital by dividing one common share into three common shares. This was accepted for filing by the TSX Venture Exchange on August 19, 2007 and the common shares commenced trading on a sub-divided basis at the opening of August 29, 2007. |
B. Plan of Distribution
Not Applicable.
C. Markets
The Commoncommon stock of the Company is listed on the TSX-V under the symbol “CGR”“CLH”, in the United States on the OTCBB under the symbol “CGREF”“CLHRF” and on the FSE under the symbol “GV8”.
D. Selling Shareholders
Not Applicable.
E. Dilution
Not Applicable.
F. Expenses of the Issue.
Not Applicable.
Item 10
A. Share Capital
Not Applicable
B. Memorandum and Articles of Association
Carol Energy Corporation was incorporated on January 22, 1981 under the Company Act of the Province of British Columbia, which changed its name to Coral Energy Corporation on March 3, 1981. On September 9, 1987, Coral Energy Corporation changed its name to the Coral Gold Corp. On September 13, 2004, the Company changed its name to Coral Gold Resources Ltd. in conjunction with a 10:1 share consolidation. It is anticipated that this consolidation may help the Company access institutional investors in both the United States and Europe.
All issued and outstanding common shares are fully paid and non-assessable. Each holder of record of common shares is entitled to one vote for each common share so held on all matters requiring a vote of shareholders, including the election of directors. The holders of common shares will be entitled to dividends on a pro-rata basis, if and when as declared by the board of directors. There are no preferences, conversion rights, preemptive rights, subscription rights, or restrictions or transfers attached to the common shares. In the event of liquidation, dissolution, or winding up of the Company, the holders of common shares are entitled to participate in the assets of the Company available for distribution after satisfaction of the claims of creditors.
Powers and Duties of Directors
The directors shall manage or supervise the management of the affairs and business of the Company and shall have authority to exercise all such powers of the Company as are not, by the British ColumbiaBusiness Corporations Actor by the Memorandum or Articles, required to be exercised by the Company in a general meeting.
Directors will serve as such until the next annual meeting. In general, a director who is, in any way, directly or indirectly interested in an existing or proposed contract or transaction with the Company whereby a duty or interest might be created to conflict with his duty or interest as a director, that director shall declare the nature and extent of his interest in such contract or transaction or the conflict or potential conflict with his duty and interest as a director. Such director shall not vote in respect of any such contract or transaction with the Company in which he is interested and if he shall do so, his vote shall not be counted, but he shall be counted in the quorum present at the meeting at which such vote is taken. However, notwithstanding the foregoing, directors shall have the right to vote on determining the remuneration of the directors.
The directors may from time to time on behalf of the Company: (a) borrow money in such manner and amount from such sources and upon such terms and conditions as they think fit; (b) issue bonds, debentures and other debt obligations; and/or (c) mortgage, charge or give other security on the whole or any part of the property and assets of the Company.
The majority of the directors of the Company must be persons ordinarily resident in Canada and one director of the Company must be ordinarily resident in British Columbia and be of the full age of 18 years. There is no minimum share ownership to be a Director.director. No person shall be a Directordirector of the Company who is not capable of managing their own affairs; is an undischarged bankrupt; convicted of an offense in connection with the promotion, formation or management of a corporation or involved in fraud within the last five years; or a person that has had a registration in any capacity under the “British ColumbiaSecurities Act” or the "British“British ColumbiaMortgage Brokers Act"” canceled within the last five years.
Shareholders
An annual general meeting shall be held once in every calendar year at such time and place as may be determined by the directors. A quorum at an annual general meeting and special meeting shall be two shareholders or one or more proxy holder representing two shareholders, or one shareholder and a proxy holder representing another shareholder. There is no limitation imposed by the laws of Canada or by the charter or other constituent documents of the Company on the right of a non-resident to hold or vote the common shares, other than as provided in theInvestment Canada Act, (the “Investment Act”) discussed below under “Item 10. Additional Information, D. Exchange Controls.”
In accordance with British Columbia law, directors shall be elected by an “ordinary resolution” which means: (a) a resolution passed by the shareholders of the Company inat a general meeting by a simple majority of the votes cast in person or by proxy: or (b) a resolution that has been submitted to the shareholders of the Company who would have been entitled to vote on it in person or by proxy at a general meeting of the Company and that has been consented to in writing by such shareholders of the Company holding shares carrying not less than 3/4the requisite majority of the votes entitled to be cast on it.
46
Under British Columbia law certain items such as an amendment to the Company’s articles or entering into a merger requires approval by a special resolution which shall mean:means: (a) a resolution passed by a majority of not less than 3/4the requisite majority of the votes cast by the shareholders of the Company who, being entitled to do so, vote in person or by proxy at a general meeting of the company; or (b) a resolution consented to in writing by every shareholder of the Company who would have been entitled to vote in person or by proxy at a general meeting of the Company, and a resolution so consented to is deemed to be a special resolution passed at a general meeting of the Company.
C. Material Contracts
The Company has not entered into any material contracts.
D. Exchange Controls
Canada has no system of exchange controls. There isare no law, governmental decree or regulation in Canada that restrictsCanadian restrictions on the export or importrepatriation of capital or affectsearnings of a Canadian public company to non-resident investors. There are no laws in Canada or exchange restrictions affecting the remittance of dividends, profits, interest, orroyalties and other payments to a non-resident holderholders of common shares other than withholding tax requirements. Any such remittances to United States residentsthe Issuer’s securities, except as discussed below under “Item 10. Additional Information, E. Taxation.”
There are subject to withholding tax. See "Taxation".
E. Taxation
Canadian Federal Income Tax Consequences
The following summarizes the principal Canadian federal income tax consequences applicable to the holding and disposition of common shares in the capital of the Company by a United States resident, and who holds common shares solely as capital property, referred to as a "U.S. Holder"“U.S. Holder”. This summary is based on the current provisions of theIncome Tax Act(Canada) (the “Tax Act”), the regulations thereunder, all amendments thereto publicly proposed by the government of Canada, the published administrative practices of Revenue Canada, Customs, Excise and Taxation, and on the current provisions of theCanada-United States Income Tax Convention, 1980, as amended, referred to as the "Treaty"“Treaty”. Except as otherwise expressly provided, this summary does not take into account any provincial, territorial or foreign (including without limitation, any U.S.) tax law or treaty. It has been assumed that all currently proposed amendments will be enacted substantially as proposed and that there is no other relevant change in any governing law or practice, although no assurance can be given in these respects.
Each U.S. Holder is advised to obtain tax and legal advice applicable to such U.S. Holder’s particular circumstances.
Every U.S. Holder is liable to pay a Canadian withholding tax on every dividend that is or is deemed to be paid or credited to the U.S. Holder on the U.S. Holder’s common shares. The statutory rate of withholding tax is 25% of the gross amount of the dividend paid. The Treaty reduces the statutory rate with respect to dividends paid to a U.S. Holder for the purposes of the Treaty. Where applicable, the general rate of withholding tax under the Treaty is 15% of the gross amount of the dividend, but if the U.S. Holder is a company that owns at least 10% of the voting stock of the Company and beneficially owns the dividend, the rate of withholding tax is 5% for dividends paid or credited after 1996 to such corporate U.S. Holder. The Company is required to withhold the applicable tax from the dividend payable to the U.S. Holder, and to remit the tax to the Receiver General of Canada for the account of the U.S. Holder.
47
Pursuant to the Tax Act, a U.S. Holder will not be subject to Canadian capital gains tax on any capital gain realized on an actual or deemed disposition of a common share, including a deemed disposition on death, provided that the U.S. Holder did not hold the common share as capital property used in carrying on a business in Canada, and that neither the U. S. Holder nor persons with whom the U.S. Holder did not deal at arm'sarm’s length (alone or together) owned or had the right or an option to acquire 25% or more of the issued shares of any class of the Company at any time in the five years immediately preceding the disposition.
United States Federal Income Tax Consequences
Passive Foreign Investment Company.
The Company believes that it is a passive foreign investment company, referred to as a "PFIC"“PFIC” for United States federal income tax purposes with respect to a United States Investor. The Company will be a PFIC with respect to a United States Investor if, for any taxable year in which such United States Investor held the Company’s shares, either (i) at least 75 % of the gross income of the Company for the taxable year is passive income, or (ii) at least 50% of the Company’s assets are attributable to assets that produce or are held for the production of passive income. In each case, the Company must take into account a pro rata share of the income and the assets of any company in which the Company owns, directly or indirectly, 25% or more of the stock by value (the “look-through” rules). Passive income generally includes dividends, interest, royalties, rents (other than rents and royalties derived from the active conduct of a trade or business and not derived from a related person), annuities, and gains from assets that produce passive income. As a publicly traded corporation, the Company would apply the 50% asset test based on the value of the Company’s assets.
Because the Company believes it qualifies as a PFIC, unless a United States Investor who owns shares in the Company (i) elects (a section 1295 election) to have the Company treated as a “qualified electing fund”, referred to as a "QEF"“QEF” (described below), or (ii) marks the stock to market (described below), the following rules apply:
| 1. | Distributions made by the Company during a taxable year to a United States Investor who owns shares in the Company that are an “excess distribution” (defined generally as the excess of the amount received with respect to the shares in any taxable year over 125% of the average received in the shorter of either the three previous years or such United States |
| 2. | The entire amount of any gain realized upon the sale or other disposition of the shares will be treated as an excess distribution made in the year of sale or other disposition and as a consequence will be treated as ordinary income and, to the extent allocated to years prior to the year of sale or disposition, will be subject to the interest charge described above. |
A shareholder that makes a section 1295 election will be currently taxable on his or her pro rata share of the Company’s ordinary earnings and net capital gain (at ordinary income and capital gains rates, respectively) for each taxable year of the Company, regardless of whether or not distributions were received. The shareholder’s basis in his or her shares will be increased to reflect taxed but undistributed income. Distributions of income that had previously been taxed will result in a corresponding reduction of basis in the shares and will not be taxed again as a distribution to the shareholder.
48
A shareholder may make a section 1295 election with respect to a PFIC for any taxable year of the shareholder (a "shareholder’s“shareholder’s election year"year”). A section 1295 election is effective for the shareholder’s election year and all subsequent taxable years of the shareholder. Procedures exist for both retroactive elections and filing of protective statements. Once a section 1295 election is made it remains in effect, although not applicable, during those years that the Company is not a PFIC. Therefore, if the Company re-qualifies as a PFIC, the section 1295 election previously made is still valid and the shareholder is required to satisfy the requirements of that election. Once a shareholder makes a section 1295 election, the shareholder may revoke the election only with the consent of the Commissioner.
If the shareholder makes the section 1295 election for the first tax year of the Company as a PFIC that is included in the shareholder’s holding period, the PFIC qualifies as a pedigreed QEF with respect to the shareholder. If a QEF is an unpedigreed QEF with respect to the shareholder, the shareholder is subject to both the non-QEF and QEF regimes. Certain elections are available which enable shareholders to convert an unpedigreed QEF into a pedigreed QEF thereby avoiding such dual application.
A shareholder making the section 1295 election must make the election on or before the due date, as extended, for filing the shareholder’s income tax return for the first taxable year to which the election will apply. A shareholder must make a section 1295 election by completing Form 8621; attaching said Form to its federal income tax return; and reflecting in the Form the information provided in the PFIC Annual Information Statement or if the shareholder calculated the financial information, a statement to that effect. The PFIC Annual Information Statement must include the shareholder’s pro rata shares of the ordinary earnings and net capital gain of the PFIC for the PFIC’s taxable year or information that will enable the shareholder to calculate its pro rata shares. In addition, the PFIC Annual Information Statement must contain information about distributions to shareholders and a statement that the PFIC will permit the shareholder to inspect and copy its permanent books of account, records, and other documents of the PFIC necessary to determine that the ordinary earnings and net capital gain of the PFIC have been calculated according to federal income tax accounting principles. A shareholder may also obtain the books, records and other documents of the foreign corporation necessary for the shareholder to determine the correct earnings and profits and net capital gain of the PFIC according to federal income tax principles and calculate the shareholder’s pro rata shares of the PFIC’s ordinary earnings and net capital gain. In that case, the PFIC must include a statement in its PFIC Annual Information Statement that it has permitted the shareholder to examine the PFIC’s books of account, records, and other documents necessary for the shareholder to calculate the amounts of ordinary earnings and net capital gain. A shareholder that makes a Section 1295 election with respect to a PFIC held directly or indirectly, for each taxable year to which the Section 1295 election applies, must comply with the foregoing submissions.
Because the Company’s stock is “marketable” under section 1296(e), a U.S. Investor may elect to mark the stock to market each year. In general, a PFIC shareholder who elects under section 1296 to mark the marketable stock of a PFIC includes in income each year an amount equal to the excess, if any, of the fair market value of the PFIC stock as of the close of the taxable year over the shareholder’s adjusted basis in such stock. A shareholder is also generally allowed a deduction for the excess, if any, of the adjusted basis of the PFIC stock over the fair market value as of the close of the taxable year. Deductions under this rule, however, are allowable only to the extent of any net mark to market gains with respect to the stock included by the shareholder for prior taxable years. While the interest charge regime under the PFIC rules generally does not apply to distributions from and dispositions of stock of a PFIC where the U.S. Investor has marked to market, coordination rules for limited application will apply in the case of a U.S. Investor that marks to market PFIC stock later than the beginning of the shareholder'sshareholder’s holding period for the PFIC stock.
Special rules apply with respect to the calculation of the amount of the foreign tax credit with respect to excess distributions by a PFIC or inclusions under a QEF.
Sections 951 through 964 and Section 1248 of the Internal Revenue Code (the “Code”) relate to controlled foreign corporations, referred to as "CFCs"“CFCs”. A foreign corporation that qualifies as a CFC will not be treated as a PFIC with respect to a shareholder during the portion of the shareholder’s holding period after December 31, 1997, during which the shareholder is a 10% United States shareholder and the corporation is a CFC. The PFIC provisions continue to apply in the case of PFIC that is also a CFC with respect to shareholders that are less than 10% United States shareholders.
The 10% United States shareholders of a CFC are subject to current United States tax on their pro rata shares of certain income of the CFC and their pro rata shares of the CFC’s earnings invested in certain United States property. The effect is that the CFC provisions may impute some portion of such a corporation’s undistributed income to certain shareholders on a current basis and convert into dividend income some portion of gains on dispositions of stock, which would otherwise qualify for capital gains treatment.
The Company does not believe that it will be a CFC. It is possible that the Company could become a CFC in the future. Even if the Company were classified as a CFC in a future year, however, the CFC rules referred to above would apply only with respect to 10% shareholders.
Personal Holding Company/Foreign Personal Holding Company/Foreign Investment Company
A corporation will be classified as a personal holding company, referred to asor a "PHC"“PHC”, if at any time during the last half of a tax year (i) five or fewer individuals (without regard to their citizenship or residence) directly or indirectly or by attribution own more than 50% in value of the corporation’s stock and (ii) at least 60% of its ordinary gross income, as specially adjusted, consists of personal holding company income (defined generally to include dividends, interest, royalties, rents and certain other types of passive income). A PHC is subject to a United States PHCfederal income tax of 15%39.6% on its undistributed personal holding company income (generally limited, in the case of a foreign corporation, to United States source income) in addition to.
A corporation will be classified as a foreign personal holding company, or an “FPHC”, and not a PHC if at any time during a tax year (i) five or fewer individual United States federalcitizens or residents directly or indirectly or by attribution own more than 50% of the total combined voting power or value of the corporation’s stock and (ii) at least 60% of its gross income tax.
A corporation will be classified as a foreign investment company, or an “FIC”, if for any taxable year it: (i) is registered under the Investment Company Act of 1940, as amended, as a management company or share investment trust or is engaged primarily in the business of investing or trading in securities or commodities (or any interest therein); and (ii) 50% or more of the value or the total combined voting power of all the corporation’s stock is owned directly or indirectly (including stock owned through the application of attribution rules) by United States persons. In general, unless an FIC elects to distribute 90% or more of its taxable income (determined under United States tax principles as specially adjusted) to its shareholders, gain on the sale or exchange of FIC stock is treated as ordinary income (rather than capital gain) to the extent of such shareholder’s ratable share of the corporation’s earnings and profits for the period during which such stock was held.
The Company believes that it is not and will not be a PHC.PHC, FPHC or FIC. However, no assurance can be given as to the Company’s future status.
Dividends are generally subject to the information reporting requirements of the Code. Dividends may be subject to backup withholding at the rate of 28% for 200631% unless the holder provides a taxpayer identification number on a properly completed Form W-9 or otherwise establishes an exemption.
The amount of any backup withholding will not constitute additional tax and will be allowed as a credit against the United States Investor'sInvestor’s federal income tax liability.
Filing of Information Returns.
Under a number of circumstances, a United States Investor acquiring shares of the Company may be required to file an information return. In particular, any United States Investor who becomes the owner, directly or indirectly, of 10% or more of the shares of the Company will be required to file such a return. Other filing requirements may apply and United States Investors should consult their own tax advisors concerning these requirements.
F. Dividends and Paying Agents
Not Applicable.
G. Statement by Experts
Not Applicable.
H. Documents on Display
The Company is required to file financial statements and other information with the Securities Commission in the Provinces of British Columbia, Ontario and Alberta, electronically through the Canadian System for Electronic Document Analysis and Retrieval (SEDAR)(“SEDAR”) which can be viewed at www.sedar.com.
The Company files annual reports and furnishes other information with the Securities and Exchange Commission.SEC. You may read and copy any document that we file at the Commission’sSEC’s Public Reference Room at 450 Fifth Street, N.W., Room 1024, Washington, D.C. 20549 or by accessing the Commission’s website (http://www.sec.gov).
Copies of the Company’s material contracts are kept in the Company’s administrative headquarters.
I. Subsidiary Information
Not Applicable.
Item 11
Not Applicable.
Item 12
Not Applicable.
None.
Item 14
None.
Item 15
Disclosure Controls and Procedures
As required by paragraph (b) of Rules 13a-15 or 15d-15 under the Chief Financial OfficerExchange Act, the Company’s principal executive officer and principal financial officer evaluated the Company’s disclosure controls and procedures (as defined in rules 13a-15(e) and 15d-15(e) of the Exchange Act) as of the end of the period covered by this Annual Report. Based on the evaluation, these officers concluded that as of the end of the period covered by this Annual Report, our disclosure controls and procedures were not effective to ensure that the information required to be disclosed by the Company are responsible for designingin reports it files or submits under the Exchange Act is recorded, processed, summarized and reported within the time period specified in the rules and forms of the SEC. These disclosure controls and procedures include controls and procedures designed to ensure that such information is accumulated and communicated to the Company’s management, including the Company’s principal executive officer and principal financial officer, to allow timely decisions regarding required disclosure. The conclusion that our disclosure controls and procedures were not effective was due to the presence of material weaknesses in internal controlscontrol over financial reporting or causing themas identified below under the heading “Management’s Report on Internal Control Over Financial Reporting.”
Management anticipates that such disclosure controls and procedures will not be effective until the material weaknesses are remediated. The Company intends to beremediate the material weaknesses as set out below.
Because of the inherent limitations in all control systems, no evaluation of controls can provide absolute assurance that all control issues, if any, within the Company have been detected.
Management’s Report on Internal Control Over Financial Reporting
The Company’s management is responsible for establishing and maintaining adequate internal control over financial reporting (as defined in Rules 13a-15(f) and 15d-15(f) of the Exchange Act) for the Company. The Company’s internal control over financial reporting is designed under their supervision, to provide reasonable assurance, not absolute assurance, regarding the reliability of financial reporting and the preparation of financial statements for external purposes in accordance with Canadian GAAP.generally accepted accounting principles. Internal control over financial reporting includes those policies and procedures that: (i) pertain to the maintenance of records that, in reasonable detail, accurately and fairly reflect the transactions and dispositions of the Company’s assets; (ii) provide reasonable assurance that transactions are recorded as necessary to permit preparation of financial statements in accordance with Canadian generally accepted accounting principles, and that the Company’s receipts and expenditures are being made only in accordance with authorizations of the Company’s management and directors; and (iii) provide reasonable assurance regarding prevention or timely detection of unauthorized acquisition, use or disposition of assets that could have a material effect on the Company’s financial statements.
Because of its inherent limitations, internal control over financial reporting may not prevent or detect misstatements. In addition, projections of any evaluation of effectiveness to future periods are subject to the risk that controls may become inadequate because of changes in conditions and that the degree of compliance with the policies or procedures may deteriorate.
52
The Company’s management, including the Company’s principal executive officer and principal financial officer, along with an independent consultant, conducted an evaluation of the design and operation of the Company’s internal control over financial reporting as of January 31, 2009 based on the criteria set forth in Internal Control –Integrated Framework issued by the Committee of Sponsoring Organizations of the Treadway Commission. This evaluation included review of the documentation of controls, evaluation of the design effectiveness of controls, testing of the operating effectiveness of controls and a conclusion on this evaluation. Based on this evaluation, the Company’s management concluded the Company’s internal control over financial reporting was not effective as at January 31, 2009 due to the following material weaknesses: (i) inadequate segregation of duties and effective risk assessment; (ii) insufficient written policies and procedures for accounting, financial reporting and corporate governance; and (iii) insufficient disaster recovery plans.
The Company assessedhas taken steps to enhance and improve the design of the Company’s internal controls over financial reporting, however these steps were not complete as atof January 31, 2007 and concluded that there are2009. During the period covered by this Annual Report, we have not been able to remediate the material weaknesses inidentified above. To remediate such weaknesses, we plan to implement the following changes during it’s the Company’s fiscal year ending January 31, 2010: (i) address inadequate segregation of duties and ineffective risk management; (ii) adopt sufficient written policies and procedures for accounting, financial reporting and corporate governance; and (iii) implement a disaster recovery plan.
The Company’s internal controlscontrol over financial reporting which are as follows:
Because of the inherent limitations in all control systems, no evaluation of controls can provide absolute assurance that all control issues, if any, within the Company have been detected. These inherent limitations include the realities that judgments in decision-making can be faulty and their related risks are not uncommon in a company the size of Coral Goldthat breakdowns can occur because of limitationssimple error or mistake.
Changes in size and number of staff. The Company believes it has taken initial steps to mitigate these risks by consulting outside advisors and involving the Audit Committee and Board of Directors in reviews and consultations where necessary. However, these weaknessesInternal Control over Financial Reporting
There were no changes in internal controlscontrol over financial reporting couldin the year ended January 31, 2009. However, as a result in a more than remote likelihood that a material misstatement would not be prevented or detected. The Company believes that it must take additional stepsof the evaluation of the Company’s internal control over financial reporting as of January 31, 2009, conducted by the Company’s principal executive officer, principal financial officer and an independent consultant, we expect to further mitigate these risks by consulting outside advisors on a more regular and timely basis.
Item 16A
The Board of Directors determined that Mr. Gary Robertson is an “audit committee financial expert” as defined in Item 16A of Form 20-F under the Exchange Act,, and that Mr. Robertson is independent as perdefined in the applicable rules promulgated by the SEC.
Item 16B
The Company has not currently adopted a code of ethics but is evaluating its internal procedures to determine the necessity of same. In the event that it is determined that a code of ethics is necessary, an appropriate code will be implemented.
Item 16C
The independent auditor for the lastyear ended January 31, 2009 was Smythe Ratcliffe LLP, Chartered Accountants. The independent auditor for the fiscal yearyears ended January 31, 2008 and January 31, 2007 was Ernst & Young LLP, Chartered Accountants. The prior auditor was Moore Stephens - Ellis Foster, Chartered Accountants.
Audit Fees
The aggregate fees billed by the Company’s independent auditors for professional services renderedSmythe Ratcliffe LLP for the audit of the Company'sCompany’s annual financial statements on Form 20-F for the fiscal year ended January 31, 20072009 were $66,000 and$44,000. The fees billed by Ernst & Young LLP for the fiscal year ended January 31, 20062008 were $37,600.
The audit-related fees billed by Smythe Ratcliffe LLP for the year ended January 31, 2009 are estimated to be $2,500. These fees relate to the advisory services provided with respect to the Company’s Form 20-F. The audit related fees billed by Ernst & Young LLP were $67,000$10,000 for the year ended January 31, 2008 and $4,750 for the year ended January 31, 2007. These fees related to the interim reviewCompany’s adoption of July 31, 2006 consolidated financial statements,new accounting policies and restatement audit ofadvisory services provided with respect to the January 31, 2006 consolidated financial statements. Audit relatedCompany’s Form 20-F.
Tax Fees
The tax fees were $15,000billed by Smythe Ratcliffe LLP for the year ended January 31, 2006.
All Other Fees
The aggregate fees billed for all other professional services rendered by the Company’s independent auditorsregistered public accounting firm were nil for the fiscal yearyears ended January 31, 2007 was $47,7002009 and January 31, 2006 was $8,300. For fiscal 2007, these fees were in relation to the U.S. Gold buyout offer and fiscal 2006 restatement. For fiscal 2006, these fees were in relation to advisory services provided with respect to the Company's Form 20-F for that year.
The Audit Committee approved 100% of the fees paid to the principal accountant for audit-related, tax and other fees in the fiscal year 2007.2009. The Audit Committee pre-approves all non-audit services to be performed by the auditor in accordance with the Audit Committee Charter. The percentage of hours expended on the principal accountant'saccountant’s engagement to audit the Company'sCompany’s financial statements for the most recent fiscal year that were attributed to work performed by persons other than the principal accountant'saccountant’s full-time, permanent employees was 0%.
Item 16D
Not applicable.
Item 16E
None.
Item 17
The following Financial Statements pertaining to the Company are filed as part of this annual report:
| Auditors’ Report of Independent Registered Public Accounting Firm (2008-2007) | 58 |
| Consolidated Balance Sheets |
| Consolidated Statements of Operations and |
Item 18
Not applicable. See Item 17.
Exhibit Number | Name |
| 1.1 | Memorandum of Coral Gold Resources Ltd.* |
| Articles of Coral Gold Resources Ltd.* | |
| 8.1 | List of Subsidiaries |
| 12.1 | Certification of the Principal Executive Officer |
| 12.2 | Certification of the Principal Financial Officer |
| 13.1 | Certificate of Principal Executive Officer under the Sarbanes-Oxley Act |
| 13.2 | Certificate of Principal Financial Officer under the Sarbanes-Oxley Act |
| 13.3 | Consent of Expert |
| 13.4 | Consent of |
| 13.5 | Consent of Expert |
| 13.6 | Consent of Expert |
| 15.1 | Geological Report on the Robertson Property* |
| 15.2 | Update of the Geological Report on the Robertson Property* |
_________________________________________
* Previously filed.
55
MANAGEMENT’S RESPONSIBILITY FOR FINANCIAL REPORTING
The consolidated financial statements of Contents
The Board of Directors is responsible for ensuring management fulfills its responsibilities. The Audit Committee reviews the results of the audit and the annual financial statements prior to their submission to the Board of Directors for approval.
The consolidated financial statements as at and Shareholdersfor the year ended January 31, 2009 have been audited by Smythe Ratcliffe LLP, Chartered Accountants, and their report outlines the scope of
| “Louis Wolfin” | “Lisa Sharp” | |
| Louis Wolfin | Lisa Sharp | |
| CEO | CFO |
Vancouver, British Columbia
May 21, 2009
56

AUDITORS’ REPORT
TO THE SHAREHOLDERS OF CORAL GOLD RESOURCES LTD.
(an exploration stage company)
We have audited the accompanying consolidated balance sheetssheet of Coral Gold Resources Ltd. (an exploration stage company)(an Exploration Stage Company) as ofat January 31, 20072009 and 2006, and the related consolidated statements of operations and deficit,comprehensive loss, shareholders’ equity, and cash flows and mineral properties for each of the years in the two year periodthen ended, January 31, 2007, and for the period from January 22, 1981 (inception) through January 31, 2007.2009. These financial statements are the responsibility of the Company’s management. Our responsibility is to express an opinion on these financial statements based on our audits. The consolidated financial statements as of January 31, 2005 and for the year then ended, and for the period from January 22, 1981 (inception) through January 31, 2005, were audited by other auditors who have ceased operations and whose report dated April 13, 2005 expressed an unqualified opinion on those statements prior to restatement. The consolidated financial statements for the period from January 22, 1981 (inception) through January 31, 2005 prior to restatement included total revenues and net loss of $2,176,079 and $20,510,872, respectively. Our opinion on the consolidated statements of operations and deficit and cash flows for the period from January 22, 1981 (inception) through January 31, 2007, insofar as it relates to amounts for prior periods through January 31, 2005 before restatement is based solely on the report of other auditors.
We conducted our auditsaudit in accordance with Canadian generally accepted auditing standards and the standards of the Public Company Accounting Oversight Board (United States of America). Those standards require that we plan and perform the audit to obtain reasonable assurance about whether the financial statements are free of material misstatements. We were not engaged to perform an audit of the Company’s internal control over financial reporting. Our audits included consideration of internal control over financial reporting as a basis for designing audit procedures that are appropriate in the circumstances, but not for the purpose of expressing an opinion on the effectiveness of the Company’s internal control over financial reporting. Accordingly, we express no such opinion. An audit also includes examining, on a test basis, evidence supporting the amounts and disclosures in the financial statements, assessing the accounting principles used and significant estimates made by management, and evaluating the overall financial statement presentation. We believe that our audits and the report of other auditors provide a reasonable basis for our opinion.
In our opinion, these consolidated financial statements presentedpresent fairly, in all material respects, the consolidated financial position of the companyCompany as at January 31, 20052009 and the results of its operations and its cash flows for the year then ended January 31, 2005 and for the cumulative period January 22, 1981 (inception) to January 31, 2005 in accordance with Canadian generally accepted accounting principles.
The consolidated financial statements as at January 31, 2005 and the determination of net loss2008, for the yearyears ended January 31, 2005 are summarized in note 14.
“MOORE STEPHENS ELLIS FOSTER LTD.”
Chartered Accountants
Vancouver, British Columbia
May 21, 2009
 | |||
| 7thFloor, Marine Building | Fax: | 604.688.4675 | |
| 355 Burrard Street, Vancouver, BC | Telephone: | 604.687.1231 | |
| Canada V6C 2G8 | Web: | SmytheRatcliffe.com |
57
REPORT OF INDEPENDENT REGISTERED PUBLIC ACCOUNTING FIRM
To the Shareholders of which are as of July 21, 2005)
Coral Gold Resources Ltd.
(an exploration stage company)
We have audited the accompanying consolidated balance sheets ofCoral Gold Resources Ltd. (an exploration stage company)as at January 31, 2008 and 2007 and the related consolidated statements of loss and comprehensive loss and cash flows for each of the years in the three year period ended January 31, 2008, and for the period from January 22, 1981 (inception) through January 31, 2008 and the related consolidated statements of shareholders’ equity and mineral properties for each of the years in the three year period ended January 31, 2008. These consolidated financial statements are the responsibility of the Company’s management. Our responsibility is to express an opinion on these consolidated financial statements based on our audits. The consolidated financial statements for the period from January 22, 1981 (inception) through January 31, 2005, were audited by other auditors who have ceased operations and whose report dated April 13, 2005 expressed an unqualified opinion on those statements. The consolidated financial statements for the period from January 22, 1981 (inception) through January 31, 2005 included total revenues and net loss of $2,176,079 and $20,510,872, respectively. Our opinion on the consolidated statements of loss and deficit and cash flows for the period from January 22, 1981 (inception) through January 31, 2008, insofar as it relates to amounts for prior periods through January 31, 2005 is based solely on the report of other auditors.
We conducted our audits in accordance with Canadian generally accepted auditing standards and the standards of the Public Company Accounting Oversight Board (United States). Those standards require that we plan and perform an audit to obtain reasonable assurance whether the financial statements are free of material misstatement. We were not engaged to perform an audit of the Company’s internal controls over financial reporting. Our audits included consideration of internal control over financial reporting as a basis for designing audit procedures that are appropriate in the circumstances, but not for the purpose of expressing an opinion on the effectiveness of the Company’s internal control over financial reporting. Accordingly, we express no such opinion. An audit includes examining, on a test basis, evidence supporting the amounts and disclosures in the financial statements. An audit also includes assessing the accounting principles used and significant estimates made by management, as well as evaluating the overall financial statement presentation. We believe that our audits provide a reasonable basis for our opinion.
In our opinion, these consolidated financial statements present fairly, in all material respects, the financial position of the Company as at January 31, 2008 and 2007 and the results of its operations and its cash flows for each of the years in the three year period ended January 31, 2008 and for the period from January 22, 1981 (inception) through January 31, 2008 in conformity with Canadian generally accepted accounting principles.
| Vancouver, Canada, | /s/ Ernst & Young LLP |
| May 27, 2008 | Chartered Accountants |
58
| CORAL GOLD RESOURCES LTD. (an Exploration Stage Company) |
| Consolidated Balance Sheets |
| (In Canadian Dollars) |
| As at January 31 |
| 2009 | 2008 | |||||
| (Note 16 | ) | |||||
| ASSETS | ||||||
| Current | ||||||
| Cash | $ | 1,332,316 | $ | 3,602,089 | ||
| Advances receivable from related parties (Note 9) | 16,899 | 13,808 | ||||
| Interest and other amounts receivable | 9,747 | 55,615 | ||||
| Prepaid expenses | 5,854 | 3,163 | ||||
| 1,364,816 | 3,674,675 | |||||
| Investment securities (Note 4) | 78,803 | 167,282 | ||||
| Equipment (Note 5) | 7,544 | 2,327 | ||||
| Mineral properties (Note 6) | 15,704,913 | 14,021,301 | ||||
| Reclamation deposit (Note 7) | 477,550 | 320,103 | ||||
| $ | 17,633,626 | $ | 18,185,688 | |||
| LIABILITIES AND SHAREHOLDERS’ EQUITY | ||||||
| Current | ||||||
| Accounts payable and accrued liabilities | $ | 64,334 | $ | 121,368 | ||
| Advances payable to related parties (Note 9) | 70,084 | 36,499 | ||||
| Asset retirement obligation (Note 10) | 270,979 | 194,361 | ||||
| 405,397 | 352,228 | |||||
| Future income tax liability (Note 13) | 4,963,038 | 3,562,808 | ||||
| 5,368,435 | 3,915,036 | |||||
| Non-controlling interest | 10,320 | 10,320 | ||||
| Shareholders’ equity | ||||||
| Share capital (Note 8) | 40,301,644 | 40,211,705 | ||||
| Contributed surplus | 4,960,907 | 3,221,663 | ||||
| Accumulated other comprehensive income (loss) | (39,948 | ) | 48,531 | |||
| Deficit | (32,967,732 | ) | (29,221,567 | ) | ||
| 12,254,871 | 14,260,332 | |||||
| $ | 17,633,626 | $ | 18,185,688 | |||
| Nature of Operations and Going Concern (Note 1) | ||||||
| Commitment (Note 15) | ||||||
| Subsequent Event (Note 17) |
Approved by the Directors:
| “Louis Wolfin” | Director | “Gary Robertson” | Director |
| Louis Wolfin | Gary Robertson |
The accompanying notes are an integral part of these consolidated financial statements
59
| CORAL GOLD RESOURCES LTD. (An Exploration Stage Company) |
| Consolidated Statements of Operations and Comprehensive Loss |
| (In Canadian Dollars) |
| Years ended January 31 |
| For the period from | ||||||||||||
| inception on | ||||||||||||
| January 22, 1981 to | ||||||||||||
| January 31, 2009 | 2009 | 2008 | 2007 | |||||||||
| (Note 16 | ) | (Note 16 | ) | |||||||||
| REVENUE | ||||||||||||
| Sales | $ | 2,176,079 | $ | - | $ | - | $ | - | ||||
| Cost of Sales | (5,383,348 | ) | ||||||||||
| (3,207,269 | ) | - | - | - | ||||||||
| EXPENSES | ||||||||||||
| Administrative services | 1,058,598 | - | - | - | ||||||||
| Amortization | 5,738 | 1,703 | 581 | 726 | ||||||||
| Consulting fees | 453,883 | 60,000 | 33,680 | 132,675 | ||||||||
| Directors’ fees | 161,763 | 12,000 | 12,000 | 62,000 | ||||||||
| Investor relations and shareholder information | 2,335,914 | 155,206 | 144,108 | 135,120 | ||||||||
| Legal and accounting | 3,634,394 | 114,236 | 438,377 | 482,017 | ||||||||
| Listing and filing fees | 338,894 | 25,919 | 76,995 | 46,649 | ||||||||
| Management fees | 726,205 | 105,000 | 134,490 | 132,215 | ||||||||
| Office and miscellaneous | 2,263,980 | 72,278 | 58,361 | 96,729 | ||||||||
| Salaries and benefits | 1,241,867 | 128,925 | 104,235 | 86,948 | ||||||||
| Stock-based compensation | 4,227,551 | 1,769,263 | 310,246 | 748,409 | ||||||||
| Travel | 1,110,102 | 72,332 | 46,099 | 60,477 | ||||||||
| 17,558,889 | 2,516,862 | 1,359,172 | 1,983,965 | |||||||||
| Loss before other items: | (20,766,158 | ) | (2,516,862 | ) | (1,359,172 | ) | (1,983,965 | ) | ||||
| Other items | ||||||||||||
| Interest income | 1,233,480 | 69,764 | 165,004 | 144,422 | ||||||||
| Foreign exchange gain (loss) | 109,283 | (765,770 | ) | 519,722 | (115,024 | ) | ||||||
| Gain realized on disposition of option on property | 143,552 | - | - | - | ||||||||
| Gain on sale of investment securities | 17,692 | - | - | - | ||||||||
| Write-down of advances receivable | (438,472 | ) | - | (24,029 | ) | (66,120 | ) | |||||
| Financing costs | (341,006 | ) | - | - | - | |||||||
| Write-down of investment securities | (838,485 | ) | - | - | (28,657 | ) | ||||||
| Loss on equipment disposals | (32,784 | ) | - | - | - | |||||||
| Write-down of equipment | (16,335 | ) | - | - | - | |||||||
| Write-down of mineral properties | (7,110,148 | ) | - | - | - | |||||||
| (7,273,223 | ) | (696,006 | ) | 660,697 | (65,379 | ) | ||||||
| Loss for the year before future income | ||||||||||||
| taxes and non-controlling interest | (28,039,381 | ) | (3,212,868 | ) | (698,475 | ) | (2,049,344 | ) | ||||
| Future income tax expense (Note 13) | (4,928,340 | ) | (533,297 | ) | (620,710 | ) | (479,270 | ) | ||||
| Non-controlling interest | (11 | ) | - | - | - | |||||||
| Net Loss for the Year | (32,967,732 | ) | (3,746,165 | ) | (1,319,185 | ) | (2,528,614 | ) | ||||
| Other Comprehensive Income | ||||||||||||
| Unrealized loss on investment | ||||||||||||
| securities (Note 4) | (39,948 | ) | (88,479 | ) | (19,352 | ) | - | |||||
| Total Comprehensive Loss | $ | (33,007,680 | ) | $ | (3,834,644 | ) | $ | (1,338,537 | ) | $ | (2,528,614 | ) |
| Basic and diluted | ||||||||||||
| Loss per share | $ | (0.15 | ) | $ | (0.06 | ) | $ | (0.13 | ) | |||
| Weighted average number of | ||||||||||||
| common shares outstanding | 24,979,312 | 23,570,728 | 19,857,210 |
The accompanying notes are an integral part of these consolidated financial statements
60
| CORAL GOLD RESOURCES LTD. (An Exploration Stage Company) |
| Consolidated Statements of Shareholders’ Equity |
| (In Canadian Dollars) |
| Years ended January 31 |
| Accumulated | |||||||||||||||||||||
| Number of | Subscriptions | Other | Total | ||||||||||||||||||
| Common | Contributed | Received in | Comprehensive | Shareholders’ | |||||||||||||||||
| Shares | Share Capital | Surplus | Advance | Deficit | Income (Loss) | Equity | |||||||||||||||
| Balance, January 31, 2006 | 5,106,266 | $ | 31,560,337 | $ | 1,428,173 | $ | 60,000 | $ | (25,373,768 | ) | $ | - | $ | 7,674,742 | |||||||
| Common shares issued for cash: | |||||||||||||||||||||
| Private placement | 1,500,000 | 4,500,000 | - | (60,000 | ) | - | - | 4,440,000 | |||||||||||||
| Exercise of warrants | 191,194 | 527,888 | - | - | - | - | 527,888 | ||||||||||||||
| Exercise of stock options | 36,900 | 66,430 | - | - | - | - | 66,430 | ||||||||||||||
| Shares returned to treasury | (2,000 | ) | (11,000 | ) | - | - | - | - | (11,000 | ) | |||||||||||
| Share issue costs | - | (17,009 | ) | - | - | - | - | (17,009 | ) | ||||||||||||
| Fair value of stock options exercised | - | 35,147 | (35,147 | ) | - | - | - | - | |||||||||||||
| Fair value of warrants exercised | - | 44,685 | (44,685 | ) | - | - | - | - | |||||||||||||
| Stock-based compensation | - | - | 748,409 | - | - | - | 748,409 | ||||||||||||||
| Loss for the year | - | - | - | - | (2,528,614 | ) | - | (2,528,614 | ) | ||||||||||||
| Balance, January 31, 2007 | 6,832,360 | 36,706,478 | 2,096,750 | - | (27,902,382 | ) | - | 10,900,846 | |||||||||||||
| Stock split on a 3 for 1 basis | 13,664,720 | - | - | - | - | - | - | ||||||||||||||
| 20,497,080 | 36,706,478 | 2,096,750 | - | (27,902,382 | ) | - | 10,900,846 | ||||||||||||||
| Transitional adjustment for fair value of | |||||||||||||||||||||
| investment securities | - | - | - | - | - | 67,883 | 67,883 | ||||||||||||||
| Common shares issued for cash: | |||||||||||||||||||||
| Private placement | 4,230,000 | 3,369,900 | 860,100 | - | - | - | 4,230,000 | ||||||||||||||
| Exercise of warrants | 20,691 | 13,794 | - | - | - | - | 13,794 | ||||||||||||||
| Exercise of stock options | 135,000 | 76,100 | - | - | - | - | 76,100 | ||||||||||||||
| Fair value of stock options exercised | - | 40,840 | (40,840 | ) | - | - | - | - | |||||||||||||
| Fair value of warrants exercised | - | 4,593 | (4,593 | ) | - | - | - | - | |||||||||||||
| Stock-based compensation | - | - | 310,246 | - | - | - | 310,246 | ||||||||||||||
| Loss for the year | - | - | - | - | (1,319,185 | ) | (1,319,185 | ) | |||||||||||||
| Unrealized loss on investment securities | - | - | - | - | - | (19,352 | ) | (19,352 | ) | ||||||||||||
| Balance January 31, 2008 | 24,882,771 | 40,211,705 | 3,221,663 | - | (29,221,567 | ) | 48,531 | 14,260,332 | |||||||||||||
| Common shares issued for cash: | |||||||||||||||||||||
| Exercise of stock options | 107,000 | 59,920 | - | - | - | - | 59,920 | ||||||||||||||
| Fair value of stock options exercised | - | 30,019 | (30,019 | ) | - | - | - | - | |||||||||||||
| Stock-based compensation | - | - | 1,769,263 | - | - | - | 1,769,263 | ||||||||||||||
| Loss for the year | - | - | - | - | (3,746,165 | ) | - | (3,746,165 | ) | ||||||||||||
| Unrealized loss on investment securities | - | - | - | - | - | (88,479 | ) | (88,479 | ) | ||||||||||||
| Balance January 31, 2009 | 24,989,771 | $ | 40,301,644 | $ | 4,960,907 | $ | - | $ | (32,967,732 | ) | $ | (39,948 | ) | $ | 12,254,871 |
The accompanying notes are an integral part of these consolidated financial statements
61
| CORAL GOLD RESOURCES LTD. (An Exploration Stage Company) |
| Consolidated Statements of Cash Flows |
| (In Canadian Dollars) |
| Year ended January 31 |
| For the period from | ||||||||||||
| inception on January | ||||||||||||
| 22, 1981 to January | ||||||||||||
| 31, 2009 | 2009 | 2008 | 2007 | |||||||||
| (Note 16 | ) | |||||||||||
| OPERATING ACTIVITIES | ||||||||||||
| Loss for the period | $ | (32,967,732 | ) | $ | (3,746,165 | ) | $ | (1,319,185 | ) | $ | (2,528,614 | ) |
| Adjustments for items not involving cash: | ||||||||||||
| Amortization | 5,738 | 1,703 | 581 | 726 | ||||||||
| Write-down of equipment | 16,335 | - | - | - | ||||||||
| Stock based compensation | 4,227,551 | 1,769,263 | 310,246 | 748,409 | ||||||||
| Non-controlling interest | 11 | - | - | - | ||||||||
| Future income tax expense | 4,928,340 | 533,297 | 620,710 | 479,270 | ||||||||
| Write-down of investment securities | 838,485 | - | - | 28,657 | ||||||||
| Write-down of mineral properties | 7,110,148 | - | - | - | ||||||||
| Write-down of advances receivable | 438,472 | - | 24,029 | 66,120 | ||||||||
| Loss on equipment disposals | 32,784 | - | - | - | ||||||||
| Gain on sale of investment securities | (17,692 | ) | - | - | - | |||||||
| Gain realized on disposition of option on property | (143,552 | ) | - | - | - | |||||||
| Gain (loss) on foreign exchange | (300,597 | ) | 908,329 | (577,162 | ) | 89,877 | ||||||
| Net change in non-cash working capital (Note 12) | (366,524 | ) | (24,160 | ) | (260,860 | ) | (359,733 | ) | ||||
| Cash Used in Operating Activities | (16,198,233 | ) | (557,733 | ) | (1,201,641 | ) | (1,475,288 | ) | ||||
| INVESTING ACTIVITIES | ||||||||||||
| Mineral properties acquisition and | ||||||||||||
| exploration expenditures incurred | (21,367,567 | ) | (1,609,696 | ) | (2,074,001 | ) | (1,660,128 | ) | ||||
| Acquisition of Marcus Corporation | (14,498 | ) | - | - | - | |||||||
| Proceeds on sale of equipment | 92,732 | - | - | - | ||||||||
| Repayment of loan receivable | 83,000 | |||||||||||
| Purchase of equipment | (152,405 | ) | (6,920 | ) | - | - | ||||||
| Purchase of investments | (1,058,950 | ) | - | - | - | |||||||
| Decrease (increase) in reclamation deposit | (477,550 | ) | (157,447 | ) | 12,126 | (71,253 | ) | |||||
| Cash Used In Investing Activities | (22,978,238 | ) | (1,774,063 | ) | (2,061,875 | ) | (1,648,381 | ) | ||||
| FINANCING ACTIVITY | ||||||||||||
| Issuance of shares for cash, net | 40,477,555 | 59,920 | 4,319,894 | 5,006,309 | ||||||||
| Cash Provided By Financing Activity | 40,477,555 | 59,920 | 4,319,894 | 5,006,309 | ||||||||
| Foreign Exchange Effect on Cash Held in a | ||||||||||||
| Foreign Currency | 2,103 | 2,103 | - | - | ||||||||
| Net Increase (Decrease) in Cash | 1,303,187 | (2,269,773 | ) | 1,056,378 | 1,882,640 | |||||||
| Cash, beginning of year | 29,129 | 3,602,089 | 2,545,711 | 663,071 | ||||||||
| Cash, end of year | $ | 1,332,316 | $ | 1,332,316 | $ | 3,602,089 | $ | 2,545,711 | ||||
| Supplementary disclosure of cash flow information: | ||||||||||||
| Cash paid during the year for: | ||||||||||||
| Interest paid | $ | 2,795 | $ | 333 | $ | 57 | ||||||
| Income taxes paid | $ | - | $ | - | $ | - | ||||||
| Expenditures on mineral property interests | ||||||||||||
| included in advances payable to related party | $ | 40,797 | $ | - | $ | - |
The accompanying notes are an integral part of these consolidated financial statements
62
| CORAL GOLD RESOURCES LTD. (An Exploration Stage Company) |
| Notes to Consolidated Financial Statements |
| For the years ended January 31, 2009, 2008 and 2007 |
| (In Canadian Dollars) |
| 1. | Nature of Operations and Going Concern | |||||||||
Coral Gold Resources Ltd. (the “Company”) was incorporated under theCompany Actof British Columbia and is primarily involved in the exploration and development of its mineral properties. | ||||||||||
The business of mining and | ||||||||||
| and the Company’s continued existence is dependent upon the preservation of its interest in the underlying properties, the discovery of economically recoverable reserves, the achievement of profitable operations, or the ability of the Company to raise alternative financing. Changes in future conditions could require material write-downs of the carrying values. | ||||||||||
At January 31, 2009, the Company had working capital of $959,419 (2008 - $3,322,447) and an accumulated deficit of $32,967,732 (2008 - $29,221,567). Management of the Company believes that it has sufficient funds to pay its ongoing administrative expenses and meet its liabilities for the ensuing year as they fall due, to fund cash payments for administration, ongoing commitments and current planned exploration programs. | ||||||||||
Significant Accounting Policies | ||||||||||
| a) | Basis of Presentation and Consolidation | |||||||||
These audited consolidated financial statements have been prepared in accordance with Canadian generally accepted accounting principles (“Canadian GAAP”), which are in conformity with United States generally accepted accounting principles (“US GAAP”), except as described in Note 18 to | ||||||||||
| these consolidated financial statements. All figures are in Canadian dollars unless otherwise stated. | ||||||||||
These consolidated financial statements include the accounts of the Company and its wholly-owned integrated subsidiaries, Coral Resources, Inc. and Coral Energy Corporation of California and its 98.49% owned integrated subsidiary Marcus Corporation of Nevada. Significant inter-company accounts and transactions have been eliminated. | ||||||||||
| b) | Equipment | |||||||||
Equipment is recorded at historical cost less accumulated amortization. Using the following methods, amortization is calculated and charged to operations as follows: | ||||||||||
| Computer Hardware | Declining balance on 20% annual rate |
| Equipment | Declining balance on 20% annual rate |
| Vehicles | Straight line over 5 years |
63
| CORAL GOLD RESOURCES LTD. (An Exploration Stage Company) |
| Notes to Consolidated Financial Statements |
| For the years ended January 31, 2009, 2008 and 2007 |
| (In Canadian Dollars) |
| 2. | Significant Accounting Policies(Continued) | |||||||||
| c) | Mineral Properties | |||||||||
The Company is in the exploration stage and defers all expenditures related to its mineral properties until such time as the properties are put into commercial production, sold or abandoned. Under this method, all amounts shown as mineral properties represent costs incurred to date, including acquisition costs, exploration and development expenditures, net of any recoveries. These amounts represent costs incurred to date and do not necessarily reflect present of future values. | ||||||||||
The costs are deferred until such time as the extent of mineralization has been determined and mineral property interests are either developed or the Company’s mineral rights are allowed to lapse. If the properties are put into commercial production, the expenditures will be depleted based upon the proven and probable reserves available. If the properties are sold or abandoned, the expenditures will be charged to operations. The Company does not accrue the estimated future costs, such as land taxes, of maintaining its mineral properties in good standing. | ||||||||||
The carrying values of mineral properties, on a property-by-property basis, are reviewed by management at least annually to determine if the mineral properties have become impaired. If impairment is deemed to exist, the mineral property will be written down to its fair value. The ultimate recoverability of the amounts capitalized for the mineral properties is dependent upon the delineation of economically recoverable ore reserves and the Company’s ability to obtain the necessary financing to complete their development and realize profitable production or proceeds from the disposition thereof. Management’s estimates of recoverability of the Company’s investment in various projects have been based on current conditions. However, it is reasonably possible that changes could occur in the near term which could adversely affect management’s estimates and may result in future write-downs of capitalized property carrying values. | ||||||||||
| d) | Asset Retirement Obligation (“ARO”) | |||||||||
The Company recognizes an estimate of the liability associated with an ARO in | ||||||||||
For the period from inception on January 22, 1981 to January 31, 2007 | Years ended January 31, 2007 | 2006 | 2005 | |||||||||||||
| $ | $ | $ | $ | |||||||||||||
REVENUE | ||||||||||||||||
| Sales | 2,176,079 | — | — | — | ||||||||||||
| Cost of sales | (5,383,348 | ) | — | — | — | |||||||||||
| (3,207,269 | ) | — | — | — | ||||||||||||
EXPENSES | ||||||||||||||||
| Administrative services | 1,058,598 | — | — | — | ||||||||||||
| Amortization | 3,454 | 726 | 909 | 1,136 | ||||||||||||
Consulting fees [note 11(c)] | 360,203 | 132,675 | 40,603 | 41,480 | ||||||||||||
Directors fees [note 11(e)] | 137,763 | 62,000 | 12,000 | 14,000 | ||||||||||||
| Investor relations and shareholder information | 2,036,600 | 135,120 | 85,283 | 74,075 | ||||||||||||
| Legal and accounting | 3,081,781 | 482,017 | 208,314 | 74,308 | ||||||||||||
| Listing and filing fees | 170,062 | 32,787 | 17,532 | 20,428 | ||||||||||||
Management fees [note 11(d)] | 486,715 | 132,215 | 105,000 | 75,000 | ||||||||||||
| Office and miscellaneous | 2,133,341 | 96,729 | 82,007 | 93,910 | ||||||||||||
| Salaries and benefits | 1,008,707 | 86,948 | 625,351 | 79,929 | ||||||||||||
Stock-based compensation [note 9(c)] | 2,148,042 | 748,409 | 1,056,100 | 343,533 | ||||||||||||
| Transfer agent fees | 65,918 | 13,862 | 9,124 | 12,470 | ||||||||||||
| Travel | 991,671 | 60,477 | 59,760 | 35,816 | ||||||||||||
| 13,682,855 | 1,983,965 | 2,301,983 | 866,085 | |||||||||||||
| Loss before the following | (16,890,124 | ) | (1,983,965 | ) | (2,301,983 | ) | (866,085 | ) | ||||||||
Other items | ||||||||||||||||
| Interest income | 998,712 | 144,422 | 20,454 | 33,786 | ||||||||||||
| Foreign exchange gain (loss) | 355,331 | (115,024 | ) | 193,650 | 110,909 | |||||||||||
| Gain realized on disposition of | ||||||||||||||||
| option on property | 143,552 | — | — | — | ||||||||||||
| Gain on sale of investment | 17,692 | — | — | — | ||||||||||||
| Recovery (writedown) of advances receivable | (414,443 | ) | (66,120 | ) | 12,467 | — | ||||||||||
| Financing costs | (341,006 | ) | — | — | — | |||||||||||
| Writedown of investment securities | (838,485 | ) | (28,657 | ) | — | — | ||||||||||
| Loss on equipment disposals | (32,784 | ) | — | — | — | |||||||||||
| Writedown of equipment | (16,335 | ) | — | — | — | |||||||||||
| Writedown of mineral properties | (7,110,148 | ) | — | — | — | |||||||||||
| Loss for the year before future income taxes and non-controlling interest | (24,128,038 | ) | (2,049,344 | ) | (2,075,412 | ) | (721,390 | ) | ||||||||
Future income tax expense [note 13] | (3,774,333 | ) | (479,270 | ) | (187,865 | ) | (262,275 | ) | ||||||||
| Non-controlling interest | (11 | ) | — | (11 | ) | — | ||||||||||
Loss for the period | (27,902,382 | ) | (2,528,614 | ) | (2,263,288 | ) | (983,665 | ) | ||||||||
| Deficit, beginning of the period | (25,373,768 | ) | (23,110,480 | ) | (22,126,815 | ) | ||||||||||
Deficit, end of the period | (27,902,382 | ) | (25,373,768 | ) | (23,110,480 | ) | ||||||||||
Basic and diluted: | ||||||||||||||||
| Loss per share | (0.38 | ) | (0.47 | ) | (0.21 | ) | ||||||||||
Weighted average number of common shares outstanding | 6,619,070 | 4,789,881 | 4,629,892 | |||||||||||||
Years ended January 31 | ||||||||||||||||
For the period from inception on January 22, 1981 to January 31, 2007 | 2007 | 2006 | 2005 | |||||||||||||
| $ | $ | $ | $ | |||||||||||||
OPERATING ACTIVITIES | ||||||||||||||||
| Loss for the period | (27,902,382 | ) | (2,528,614 | ) | (2,263,288 | ) | (983,665 | ) | ||||||||
| Adjustments for items not involving cash: | ||||||||||||||||
| Amortization | 3,454 | 726 | 909 | 1,136 | ||||||||||||
| Writedown of equipment | 16,335 | — | — | — | ||||||||||||
| Stock-based compensation | 2,148,042 | 748,409 | 1,056,100 | 343,533 | ||||||||||||
| Non-controlling interest | 11 | — | 11 | — | ||||||||||||
| Future income tax expense | 3,774,333 | 479,270 | 187,865 | 262,275 | ||||||||||||
| Writedown of investment securities | 838,485 | 28,657 | — | — | ||||||||||||
| Writedown of mineral properties | 7,110,148 | — | — | — | ||||||||||||
| Writedown of advances receivable | 414,443 | 66,120 | 12,467 | — | ||||||||||||
| Loss on equipment disposals | 32,784 | — | — | — | ||||||||||||
| Gain on sales of investments | (17,692 | ) | — | — | — | |||||||||||
| Gain realized on disposition of option on property | (143,552 | ) | — | — | — | |||||||||||
| Foreign exchange (gain) loss | (631,764 | ) | 89,877 | (214,051 | ) | (157,429 | ) | |||||||||
| Change in non-cash working capital: | ||||||||||||||||
| (Increase) decrease in advances receivable | (464,885 | ) | 11,916 | 3,276 | (21,556 | ) | ||||||||||
| (Increase) decrease in interest receivable and | ||||||||||||||||
| prepaid expenses | (86,644 | ) | (82,908 | ) | (57,209 | ) | (1,671 | ) | ||||||||
| Increase (decrease) in accounts payable | ||||||||||||||||
| and accrued liabilities | 452,439 | (244,371 | ) | 610,873 | 7,590 | |||||||||||
| (Decrease) increase in advances payable | ||||||||||||||||
| to related parties | 17,972 | (43,984 | ) | (14,396 | ) | (6,397 | ) | |||||||||
| Decrease in asset restoration obligation | (386 | ) | (386 | ) | — | — | ||||||||||
Cash used in operating activities | (14,438,859 | ) | (1,475,288 | ) | (677,443 | ) | (556,184 | ) | ||||||||
INVESTING ACTIVITIES | ||||||||||||||||
| Mineral properties acquisition and | ||||||||||||||||
| exploration expenditures incurred | (17,683,870 | ) | (1,660,128 | ) | (584,880 | ) | (897,908 | ) | ||||||||
| Acquisition of Marcus Corporation | (14,498 | ) | — | (14,498 | ) | — | ||||||||||
| Proceeds on sale of equipment | 92,732 | — | — | — | ||||||||||||
| Repayment of (advances of) loan receivable | — | 83,000 | (33,000 | ) | (50,000 | ) | ||||||||||
| Purchase of equipment | (145,485 | ) | — | — | — | |||||||||||
| Purchase of investments | (1,058,950 | ) | — | (17,474 | ) | — | ||||||||||
| Decrease (increase) in reclamation deposit | (332,229 | ) | (71,253 | ) | 257,081 | 33,662 | ||||||||||
Cash used in investing activities | (19,142,300 | ) | (1,648,381 | ) | (392,771 | ) | (914,246 | ) | ||||||||
FINANCING ACTIVITIES | ||||||||||||||||
| Increase (decrease) in subscriptions received in advance | — | — | 60,000 | — | ||||||||||||
| Cash from share subscriptions receivable | — | — | 11,945 | 58,700 | ||||||||||||
| Issuance of shares for cash, net | 36,097,741 | 5,006,309 | 189,194 | 316,720 | ||||||||||||
Cash provided by financing activities | 36,097,741 | 5,006,309 | 261,139 | 375,420 | ||||||||||||
Net increase (decrease) in cash and cash equivalents | 2,516,582 | 1,882,640 | (809,075 | ) | (1,095,010 | ) | ||||||||||
| Cash and cash equivalents, beginning of period | 29,129 | 663,071 | 1,472,146 | 2,567,156 | ||||||||||||
Cash and cash equivalents, end of period | 2,545,711 | 2,545,711 | 663,071 | 1,472,146 | ||||||||||||
Supplementary disclosure of cash flow information: | ||||||||||||||||
| Cash paid during the year for: | ||||||||||||||||
| Interest | 57 | 40 | 145 | |||||||||||||
| Income taxes | — | — | — | |||||||||||||
Acquisition Cost | Exploration Expenditures | Proceeds of Interest Disposed of | Total | |||||||||||||
| $ | $ | $ | $ | |||||||||||||
Robertson Property[note 6(a)(i) and 6(a)(iii)] | ||||||||||||||||
| Balance, January 31, 2005 | 801,956 | 9,566,092 | (1,937,625 | ) | 8,430,423 | |||||||||||
| 2006 transactions, net | — | 1,623,354 | — | 1,623,354 | ||||||||||||
| Balance, January 31, 2006 | 801,956 | 11,189,446 | (1,937,625 | ) | 10,053,777 | |||||||||||
| 2007 transactions, net | 14,068 | 1,669,522 | — | 1,683,590 | ||||||||||||
| Balance, January 31, 2007 | 816,024 | 12,858,968 | (1,937,625 | ) | 11,737,367 | |||||||||||
Ruf and Norma Sass Properties[note 6(a)(ii)] | ||||||||||||||||
| Balance, January 31, 2005 | — | 81,130 | (39,301 | ) | 41,829 | |||||||||||
| 2006 transactions, net | — | — | — | — | ||||||||||||
| Balance, January 31, 2006 | — | 81,130 | (39,301 | ) | 41,829 | |||||||||||
| 2007 transactions, net | — | (23,462 | ) | — | (23,462 | ) | ||||||||||
| Balance, January 31, 2007 | — | 57,668 | (39,301 | ) | 18,367 | |||||||||||
Eagle Property[note 6(b)] | ||||||||||||||||
| Balance, January 31, 2005, 2006 and 2007 | 1 | — | — | 1 | ||||||||||||
Ludlow Property [note 6(c)] | ||||||||||||||||
| Balance, January 31, 2005, 2006 and 2007 | 1 | — | — | 1 | ||||||||||||
JDN Property[note 6(d)] | ||||||||||||||||
| Balance, January 31, 2005, 2006 and 2007 | 1 | — | — | 1 | ||||||||||||
Total Properties, as at January 31, 2007 | 816,027 | 12,916,636 | (1,976,926 | ) | 11,755,737 | |||||||||||
Income Taxes | ||||||||
The Company follows the asset and liability method of accounting for income taxes. Under this method of tax allocation, future income tax assets and liabilities are determined based on differences between the financial statement carrying values and their respective income tax basis (temporary differences). Future income tax assets and liabilities are measured using the tax rates expected to be in effect when the temporary differences are likely to reverse. The effect on future income tax assets and liabilities of a change in tax rates is included in operations in the period in which the change is enacted or substantially assured. The amount of future income tax assets recognized is limited to the amount of the benefit that is more likely than not to be realized. | ||||||||
64
| CORAL GOLD RESOURCES LTD. (An Exploration Stage Company) |
| Notes to Consolidated Financial Statements |
| For the years ended January 31, 2009, 2008 and 2007 |
| (In Canadian Dollars) |
| 2. | Significant Accounting Policies(Continued) | |||||||
| f) | Foreign Currency Translation | |||||||
The Company’s integrated foreign subsidiaries are financially and operationally dependent on the Company. The Company uses the temporal method to translate the accounts of its integrated foreign operations into Canadian dollars. Assets and liabilities denominated in foreign currencies are translated into Canadian dollars at exchange rates in effect at the balance sheet date for monetary items and at exchange rates prevailing at the transaction dates for non-monetary items. Revenues and expenses are translated at the average exchange rate prevailing during the year except for amortization, which is translated at historical exchange rates. Gains and losses arising from this translation are included in the determination of net loss for the year. | ||||||||
| g) | Use of Estimates | |||||||
The preparation of financial statements in conformity with Canadian GAAP requires management to make estimates and assumptions that affect the reported amounts of assets and liabilities and disclosure of contingent assets and liabilities at the date of the consolidated financial statements and the reported amounts of revenues and expenses during the reporting period. Significant areas requiring the use of estimates include the recoverability of mineral property interests, estimated balances of accrued liabilities, valuation of asset retirement obligation, the assumptions used in the determination of the fair value of stock-based compensation and the determination of the valuation allowance for future income taxes. Although management believes its estimates are reasonable, actual results could differ from those estimates and could impact future results of operations and cash flows. | ||||||||
| h) | Stock-Based Compensation | |||||||
The Company accounts for stock-based compensation using a fair value based method with respect to all stock-based payments measured and recognized, to directors, employees and non-employees. For directors and employees, the fair value of the options is measured at the date of grant. For non-employees, the fair value of the options is measured on the earlier of the date at which the counterparty performance is completed or the date the performance commitment is reached or the date at which the equity instruments are granted if they are fully vested and non-forfeitable. The fair value of the options is accrued and charged either to operations or mineral properties, with the offset credit to contributed surplus. For directors and employees the options are recognized over the vesting period, and for non-employees the options are recognized over the related service period. If and when the stock options are ultimately exercised, the applicable amounts of contributed surplus are transferred to share capital. | ||||||||
| i) | Loss Per Share | |||||||
Basic loss per share is calculated using the weighted average number of common shares outstanding during the year. The Company uses the treasury stock method for calculating diluted earnings per share. Under this method, the dilutive effect on earnings per share is recognized on the use of the proceeds that could be obtained upon exercise of options, warrants and similar instruments. It assumes that the proceeds would be used to purchase common shares at the average market price during the period. However, diluted loss per share is not presented where the effects on conversion and exercise of options and warrants would be anti- dilutive. | ||||||||
| j) | Accounting for Equity Units | |||||||
Proceeds received on the issuance of units, consisting of common shares and warrants, are first allocated to warrants based on their fair value calculated using the Black-Scholes option pricing model and the remainder is allocated to common shares. | ||||||||
65
| CORAL GOLD RESOURCES LTD. (An Exploration Stage Company) |
| Notes to Consolidated Financial Statements |
| For the years ended January 31, 2009, 2008 and 2007 |
| (In Canadian Dollars) |
| 2. | Significant Accounting Policies(Continued) | |
| k) | Financial Instruments and Comprehensive Income | |
All financial instruments are classified as one of the following: held-to-maturity, loans and receivables, held-for- trading, available-for-sale or other financial liabilities. Financial assets and liabilities held-for-trading are measured at fair value with gains and losses recognized in net income. Financial assets held-to-maturity, loans and receivables, and other financial liabilities are measured at amortized cost using the effective interest method. Available-for-sale instruments are measured at fair value with unrealized gains and losses recognized in other comprehensive income (loss) and reported in shareholders’ equity. Any financial instrument may be designated as held-for-trading upon initial recognition. | ||
Transaction costs that are directly attributable to the acquisition or issue of financial instruments that are classified as other than held-for-trading, which are expensed as incurred, are included in the initial carrying value of such instruments. | ||
Comprehensive income (loss) is defined as the change in equity from transactions and other events from sources other than the Company’s shareholders. Other comprehensive income or loss refers to items recognized in comprehensive income or loss that are excluded from operations calculated in accordance with Canadian GAAP. | ||
| l) | New Accounting Standards | |
Effective February 1, 2008, the Company adopted the following standards of the Canadian Institute of Chartered Accountants (“CICA”) Handbook: | ||
| (i) | Capital Disclosures (Section 1535) | ||
Section 1535 specifies the disclosure of: (i) an entity’s objectives, policies and procedures for managing capital; (ii) quantitative data about what the entity regards as capital; (iii) whether the entity has complied with any capital requirements; and (iv) if it has not complied, the consequences of such non- compliance. | |||
As a result of the adoption of this standard, additional disclosure on the Company’s capital management strategy have been included in Note 11. | |||
| (ii) | Financial Instruments – Disclosures (Section 3862) and Financial Instruments – Presentation (Section 3863) | ||
Sections 3862 and 3863 replace Handbook Section 3861, “Financial Instruments – Disclosures and Presentation”, revising its disclosure requirements, and carrying forward its presentation requirements. These new sections place increased emphasis on disclosures about the nature and extent of risks arising from financial instruments and how the entity manages those risks. | |||
Section 3862 specifies disclosures that enable users to evaluate: (i) the significance of financial instruments for the entity’s financial position and performance; and (ii) the nature and extent of risks arising from financial instruments to which the entity is exposed and how the entity manages those risks. | |||
As a result of the adoption of these standards, additional disclosures on the risks of certain financial instruments have been included in Note 3. |
| CORAL GOLD RESOURCES LTD. (An Exploration Stage Company) |
| Notes to Consolidated Financial Statements |
| For the years ended January 31, 2009, 2008 and 2007 |
| (In Canadian Dollars) |
| 2. | Significant Accounting Policies(Continued) |
| l) | New Accounting Standards(Continued) |
| (iii) | Going Concern | |
In June 2007, the CICA amended Section 1400, “General Standards of Financial Statement Presentation”, which requires management to make an assessment of the Company’s ability to continue as a going concern. When financial statements are not prepared on a going concern basis, that fact shall be disclosed together with the basis on which the consolidated financial statements are prepared and the reason why the company is not considered a going concern. The Company adopted this policy on February 1, 2008 with no significant effect on these consolidated financial statements. |
| m) | Recent Accounting Pronouncements |
| (i) | International Financial Reporting Standards (“IFRS”) | |
In 2006, the Canadian Accounting Standards Board (“AcSB”) published a new strategic plan that will significantly affect financial reporting requirements for Canadian companies. The AcSB strategic plan outlines the convergence of Canadian generally accepted accounting principles with IFRS over an expected five year transitional period. In February 2008, the AcSB announced that 2011 is the changeover date for publicly-listed companies to use IFRS, replacing Canada’s own generally accepted accounting principles. The date is for interim and annual financial statements relating to fiscal years beginning on or after February 1, 2011. The transition date of February 1, 2011 will require the restatement for comparative purposes of amounts reported by the Company for the year ended January 31, 2011. While the Company has begun assessing the adoption of IFRS for 2012, the financial reporting impact of the transition to IFRS cannot be reasonably estimated at this time. | ||
| (ii) | Business Combinations | |
In January 2009, the CICA issued Section 1582, “Business Combinations”, Section 1601, “Consolidations”, and Section 1602, “Non-Controlling Interests”. These sections replace the former Section 1581, “Business Combinations”, and Section 1600, “Consolidated Financial Statements”, and establish a new section for accounting for a non-controlling interest in a subsidiary. | ||
Sections 1582 and 1602 will require net assets, non-controlling interests and goodwill acquired in a business combination to be recorded at fair value and non-controlling interests will be reported as a component of equity. In addition, the definition of a business is expanded and is described as an integrated set of activities and assets that are capable of being managed to provide a return to investors or economic benefits to owners. Acquisition costs are not part of the consideration and are to be expensed when incurred. Section 1601 establishes standards for the preparation of consolidated financial statements. |
67
| CORAL GOLD RESOURCES LTD. (An Exploration Stage Company) |
| Notes to Consolidated Financial Statements |
| For the years ended January 31, 2009, 2008 and 2007 |
| (In Canadian Dollars) |
| 2. | Significant Accounting Policies(Continued) |
| m) | Recent Accounting Pronouncements(Continued) |
| (iii) | Business Combinations (Continued) | |
These new sections apply to the Company’s interim and annual consolidated financial statements relating to fiscal years beginning on or after February 1, 2011. Earlier adoption of these sections is permitted as of the beginning of a fiscal year. All three sections must be adopted concurrently. The Company is currently evaluating the impact of the adoption of these sections. |
| 3. | Risk Management and Financial Instruments | |
The Company classified its cash as held-for-trading; investment securities as available-for-sale; advances receivable from related parties, interest and other amounts and reclamation deposit as loans and receivable; and accounts payable and accrued liabilities and advances payable as other financial liabilities. | ||
The carrying values of cash, advances receivable from related parties, interest and other amounts, accounts payable and accrued liabilities, and advances payable approximate their fair values due to the short-term maturity of these financial instruments. Investments securities are accounted for at market values. The book value of reclamation deposit approximates its fair value as the stated rate approximates the market rate of interest. | ||
The Company’s risk exposure and the impact on the Company’s financial instruments are summarized below: | ||
| a) | Credit Risk | |
Credit risk is the risk that one party to a financial instrument will cause a financial loss for the other party by failing to discharge an obligation. The Company’s cash is exposed to credit risk. Management considers credit risk on cash to be immaterial because the counterparties are highly rated Canadian banks. | ||
| b) | Liquidity Risk | |
Liquidity risk is the risk that the Company will encounter difficulty in obtaining funds to meet its commitments. The Company’s approach to managing liquidity risk is to provide reasonable assurance that it will have sufficient funds to meet liabilities when due. The Company manages its liquidity risk by forecasting cash flows required by operations and anticipated investing and financing activities. The Company has cash and cash equivalents at January 31, 2009 in the amount of $1,332,316 in order to meet short-term business requirements. At January 31, 2009, the Company had current liabilities of $405,397. All of the Company’s financial liabilities have contractual maturities of less than 30 days and are subject to normal trade terms. | ||
| c) | Market Risk | |
The significant market risks to which the Company is exposed are interest rate risk, foreign exchange risk and other price risk. These are discussed further below: | ||
Interest Rate Risk | ||
Interest rate risk is the risk that the fair value or future cash flows of a financial instrument will fluctuate because of changes in market interest rates. The Company’s reclamation bonds have fixed interest rates therefore exposed to interest rate risk. | ||
68
| CORAL GOLD RESOURCES LTD. (An Exploration Stage Company) |
| Notes to Consolidated Financial Statements |
| For the years ended January 31, 2009, 2008 and 2007 |
| (In Canadian Dollars) |
| 3. | Risk Management and Financial Instruments (Continued) |
c) Market Risk(Continued) | |
Foreign Exchange Risk | |
Foreign exchange risk is the risk that fair value or future cash flows of a financial instrument will fluctuate because of changes in foreign exchange rates. The Company is exposed to foreign exchange fluctuation related to its mineral properties and expenditures thereon, and reclamation bonds held in the US. A significant change in the currency exchange rates between the Canadian dollar relative to the US dollar could have an effect on the Company’s financial position results of operations, and cash flows. As at January 31, 2009, the Company held US cash balances totaling US$7,335 (2008 – US$87,400) and US$389,360 (2008 – US$319,400) in reclamation bonds which will offset the asset retirement obligation US$220,937 (2008 – US$193,934). Based on the above net exposures as at January 31, 2009, a 10% change in Canadian/US exchange rate will impact the Company’s earnings by approximately $18,000. | |
Other Price Risk | |
Other price risk is the risk that the fair or future cash flows of a financial instrument will fluctuate because of changes in market prices, other than those arising from interest rate risk or foreign currency risk. | |
| 4. | Investment Securities |
At January 31, 2009, the Company held shares as follows:
| Accumulated | |||||||||||||
| Number of | Unrealized | ||||||||||||
| Shares | Cost | Gains (losses) | Fair Value | ||||||||||
| Available-for-sale shares: | |||||||||||||
| Levon Resources Ltd. | 967,571 | $ | 77,117 | $ | (19,063 | ) | $ | 58,054 | |||||
| Mill Bay Ventures Inc. | 518,731 | 41,634 | (20,885 | ) | 20,749 | ||||||||
| $ | 118,751 | $ | (39,948 | ) | $ | 78,803 |
At January 31, 2008, the Company held shares as follows:
| Accumulated | |||||||||||||
| Number of | Unrealized | ||||||||||||
| Shares | Cost | Gains (losses) | Fair Value | ||||||||||
| Available-for-sale shares: | |||||||||||||
| Levon Resources Ltd. | 967,571 | $ | 77,117 | $ | 48,667 | $ | 125,784 | ||||||
| Mill Bay Ventures Inc. | 518,731 | 41,634 | (136 | ) | 41,498 | ||||||||
| $ | 118,751 | $ | 48,531 | $ | 167,282 |
Levon Resources Ltd. (“Levon”) and Mill Bay Ventures Inc. (“Mill Bay”) are related tohave common directors with the Company by way of common management and directors. The fair market value of the Mill Bay and Levon common shares as at January 31, 2007 were $41,498 [2006 - $46,688], and $145,136 [2006 - $91,910], respectively.
Cost | Accumulated amortization | Net book value | ||||||||||
| $ | $ | $ | ||||||||||
2007 | ||||||||||||
| Computer hardware | 5,926 | 3,214 | 2,712 | |||||||||
| Equipment | 436 | 240 | 196 | |||||||||
6,362 | 3,454 | 2,908 | ||||||||||
2006 | ||||||||||||
| Computer hardware | 5,926 | 2,536 | 3,390 | |||||||||
| Equipment | 436 | 192 | 244 | |||||||||
| 6,362 | 2,728 | 3,634 | ||||||||||
| Notes to Consolidated Financial Statements |
| For the years ended January 31, |
| (In Canadian Dollars) |
Investment Securities(Continued) | |
During the year ended January 31, 2009, the Company recognized an $88,479 (2008- $19,352) unrealized loss included in other comprehensive income (loss). | |
| 5. | Equipment |
| Accumulated | Net Book | |||||||||
| January 31, 2009 | Cost | Amortization | Value | |||||||
| Computer hardware | $ | 5,926 | $ | 4,190 | $ | 1,736 | ||||
| Equipment | 436 | 310 | 126 | |||||||
| Vehicles | 6,920 | 1,238 | 5,682 | |||||||
| $ | 13,282 | $ | 5,738 | $ | 7,544 | |||||
| Accumulated | Net Book | |||||||||
| January 31, 2008 | Cost | Amortization | Value | |||||||
| Computer hardware | $ | 5,926 | $ | 3,756 | $ | 2,170 | ||||
| Equipment | 436 | 279 | 157 | |||||||
| $ | 6,362 | $ | 4,035 | $ | 2,327 |
70
| For the years ended January 31, 2009, 2008 and 2007 |
| (In Canadian Dollars) |
| 6. | Mineral Properties |
| Ruf and | |||||||||||||
| Robertson | Norma Sass | ||||||||||||
| Property | Property | Other | Total | ||||||||||
| Balance, January 31, 2007 | $ | 11,737,367 | $ | 18,367 | $ | 3 | $ | 11,755,737 | |||||
| Exploration costs incurred during | |||||||||||||
| year: | |||||||||||||
| Acquisition costs | 258,603 | - | - | 258,603 | |||||||||
| Assays | 90,101 | - | - | 90,101 | |||||||||
| Consulting | 390,432 | - | - | 390,432 | |||||||||
| Drilling | 1,081,658 | - | - | 1,081,658 | |||||||||
| Field supplies and services | 981 | - | - | 981 | |||||||||
| Lease payments | 105,241 | - | - | 105,241 | |||||||||
| Mapping | 16,011 | - | - | 16,011 | |||||||||
| Taxes, licenses and permits | 97,806 | 5,478 | - | 103,284 | |||||||||
| Water analysis | 395 | - | - | 395 | |||||||||
| Reclamation | 218,858 | - | - | 218,858 | |||||||||
| Balance, January 31, 2008 | 13,997,453 | 23,845 | 3 | 14,021,301 | |||||||||
| Exploration costs incurred during | |||||||||||||
| year: | |||||||||||||
| Assays | 138,111 | - | - | 138,111 | |||||||||
| Consulting | 372,187 | - | - | 372,187 | |||||||||
| Drilling | 717,177 | - | - | 717,177 | |||||||||
| Field supplies and services | 10,540 | - | - | 10,540 | |||||||||
| Lease payments | 141,893 | - | - | 141,893 | |||||||||
| Mapping | 3,949 | - | - | 3,949 | |||||||||
| Taxes, licenses and permits | 89,131 | - | - | 89,131 | |||||||||
| Water analysis | 833 | - | - | 833 | |||||||||
| Reclamation | 209,791 | - | - | 209,791 | |||||||||
| Balance, January 31, 2009 | $ | 15,681,065 | $ | 23,845 | $ | 3 | $ | 15,704,913 |
Robertson Property
The Company has certain interests in 724 patented and unpatented load mining claims located in the Bullion Mining District, Lander County, Nevada, subject to NSR’sa net smelter return (“NSR”) ranging from 4% to 10%, and which certain leases provide for advance royalty payments. The Robertson group is recorded undercomprised of three separate claimsclaim groups known as the Core Claims (100% owned), the Carve-out Claims (39% carried interest) and the Ruf/Norma Sass/Ruf Claims (66.67% owned).
| (i) | Carve-out Claims | |
By Agreement dated May 16, 1996, the Company granted Amax Gold Exploration Inc. (“Amax”) an option to purchase a 51% interest in 200 claims. Amax exercised the option by paying twice the amount the Company had incurred in exploration expenditures on the property. Under the terms of the Agreement, the Company had its 49% converted to a 39% carried interest. |
| CORAL GOLD RESOURCES LTD. (An Exploration Stage Company) |
| Notes to Consolidated Financial Statements |
| For the years ended January 31, |
| (In Canadian Dollars) |
6. | Mineral Properties(Continued) | |
Robertson | ||
| (i) | Carve-out Claims – 39% carried interest(Continued) | |
The Amax 61% interest was subsequently acquired by Cortez GML and is currently owned by Barrick. | ||
| (ii) | Ruf/Norma |
By an amended Option Agreement dated September 13, 1995, the Company had granted Levon Resources Ltd. (“Levon”), a company related by common directors, an option to purchase a 50% interest in 54 claims known as the Ruf/Norma Sass Claims (the “Property”). On December 31, 2002, the Agreement was amended whereby Levon earned a 33.33% interest in the claims by issuing of 300,000 common shares of Levon to the Company (previously received) and incurring $350,294 in exploration on the Property (incurred during prior years).
A third party holds a 3% net smelter returns royalty on the production from some of these mining claims, up to a limit of US$1,250,000. | ||
By way of an agreement dated September 25, 2008, the Company and Levon granted Barrick Gold (“Barrick”) an option to acquire a 60% interest in the | ||
a) Incur $250,000 on or before December | ||
b) Incur $250,000 on or before December | ||
c) Incur $500,000 on or before December 31, 2011; | ||
d) Incur $500,000 on or before December 31, 2012; | ||
e) Incur $600,000 on or before December 31, 2013; and |
f) Incur $900,000 on or before December 31, 2013. | ||
| (iii) | Marcus Corporation | |
The Company owns 98.49% of |
| (iv) | Fanny Komp/Elwood Wright Lease | |
In the fiscal year ending January 31, |
72
| CORAL GOLD RESOURCES LTD. (An Exploration Stage Company) |
| Notes to Consolidated Financial Statements |
| For the years ended January 31, 2009, 2008 and |
| (In Canadian Dollars) |
6. | Mineral Properties(Continued) | |
Robertson Property(Continued) | |||||
| (v) | June Claims | ||||
During the year ended January 31, 2009, the Company has completed a mineral lease with an option-to- purchase agreement to explore, develop, and exploit six lode mining claims located in Lander County, State of Nevada. The agreement is for an initial term of 4 years in consideration of the | |||||
Realization of | |||||
The investment in and expenditures on mineral property interests comprise a significant portion of the Company’s assets. Realization of the Company’s investment in these assets is dependent upon the establishment of legal ownership, the attainment of successful production from the properties or from the proceeds of their disposal. Resource exploration and development is highly speculative and involves inherent risks. While the rewards if an ore body is discovered can be substantial, few properties that are explored are ultimately developed into producing mines. There can be no assurance that current exploration programs will result in the discovery of economically viable quantities of ore. | |||||
The amounts shown for acquisition costs and deferred exploration expenditures represent costs incurred to date and do not necessarily reflect present or future values. These costs will be depleted over the useful lives of the properties upon commencement of commercial production or written off if the properties are abandoned or the claims allowed to lapse. | |||||
Title to mineral property interests | |||||
Although the Company has taken steps to verify the title to mineral properties in which it has an interest, in accordance with industry standards for the current stage of exploration of such properties, these procedures do not guarantee the Company’s title. Property title may be subject to unregistered prior agreements or transfers and title may be affected by undetected defects. | |||||
Environmental | |||||
The Company is subject to the laws and regulations relating to environmental matters in all jurisdictions in which it operates, including provisions relating to property reclamation, discharge of hazardous material and other matters. The Company may also be held liable should environmental problems be discovered that were caused by former owners and operators of its properties and properties in which it has previously had an interest. The Company conducts its mineral exploration activities in compliance with applicable environmental protection legislation. The Company is not aware of any existing environmental problems related to any of its current or former properties that may result in material liability to the Company. | |||||
Environmental legislation is becoming increasingly stringent and costs and expenses of regulatory compliance are increasing. The impact of new and future environmental legislation on the Company’s operations may cause additional expenses and restrictions. If the restrictions adversely affect the scope of exploration and development on the mineral properties, the potential for production on the property may be diminished or negated. | |||||
| For the years ended January 31, |
| (In Canadian Dollars) |
Reclamation Deposit | ||
Under the Bureau of Land Management, the Company is required to have a reclamation deposit which covers the cost to reclaim the ground disturbed. During the year ended January 31, 2001, the Company decided to defer exploration on the property and to reduce the carrying value to a nominal amount.
| January 31, | ||
Coral Resources, Inc., as principal, placed the funds in trust with a fully secured standby letter of credit lodged as collateral in support of the bond. Interest is accrued on the bond at a monthly weighted average rate of 2.11%. | ||
| 8. | Share Capital | |
| a) | Authorized | |
Unlimited common shares without par value. | ||
| b) | Issued | |
During the year ended January 31, 2008, the Company’s share structure was amended by subdividing every one common share into three common shares. If not stated otherwise, for the current period and | ||
During the year ended January 31, 2008, the Company issued a non-brokered private placement of 4,230,000 units at a price of $1.00 per unit (1,410,000 units at a price of $3.00 per unit before the three-to-one share split), each unit consisting of one common share and one transferable share purchase warrant. Each warrant will entitle the investor to purchase one additional share at an exercise price of $1.17 ($3.50 before three-to-one share split) for one year. The proceeds of the private placement have been bifurcated using on the residual fair value method resulting in $3,369,900 recorded as share capital and $860,100 representing the fair value of the warrants recorded as contributed surplus. The fair value of each warrant has been estimated as of the date of the issuance using the Black-Scholes pricing model with the following assumptions: risk-free interest rate of 4.0%, dividend yield of 0.0%, volatility of 65.77% and expected life of one year. | ||
| c) | Share Purchase Warrants | |
A summary of share purchase warrants transactions for the year ended January 31, 2009 is as follows: | ||
| Number of | Weighted Average | ||||||
| Shares | Exercise Price | ||||||
| Balance outstanding, January 31, 2007 | 313,152 | $0.67 | |||||
| Issued | 4,230,000 | $1.17 | |||||
| Exercised | (20,691 | ) | $0.67 | ||||
| Expired | (292,461 | ) | $0.67 | ||||
| Balance outstanding , January 31, 2008 | |||||||
| and January 31, 2009 | 4,230,000 | $1.17 |
74
| CORAL GOLD RESOURCES LTD. (An Exploration Stage Company) |
| Notes to Consolidated Financial Statements |
| For the years ended January 31, 2009, 2008 and 2007 |
| (In Canadian Dollars) |
Share Capital(Continued) | ||
| c) | Share Purchase Warrants(Continued) | ||
During the year end January 31, 2009, the expiry date of the warrants issued pursuant to a private placement announced on April 20, 2007 | |||
Amount | Deficit | |||||||||||
Shares | $ | $ | ||||||||||
Balance, January 31, 2004 | 4,361,685 | 29,646,238 | (22,126,815 | ) | ||||||||
| 2005 share issuances for cash: | — | |||||||||||
| Private placements | 255,220 | 1,039,464 | — | |||||||||
| Exercise of warrants | 1,600 | 4,960 | — | |||||||||
| Exercise of stock options | 30,400 | 76,000 | — | |||||||||
| Share issuance costs | — | (11,984 | ) | — | ||||||||
| Loss for the period | — | — | (983,665 | ) | ||||||||
Balance, January 31, 2005 | 4,648,905 | 30,754,678 | (23,110,480 | ) | ||||||||
| 2006 share issuances for cash: | — | |||||||||||
| Exercise of warrants | 9,397 | 25,944 | — | |||||||||
| Exercise of stock options | 102,500 | 174,250 | — | |||||||||
| Shares returned to treasury | (2,500 | ) | (11,000 | ) | — | |||||||
| Fair value of stock options exercised | — | 87,560 | — | |||||||||
| Shares issued for Marcus Corp purchase | 347,964 | 528,905 | — | |||||||||
| Loss for the period | — | — | (2,263,288 | ) | ||||||||
Balance, January 31, 2006 | 5,106,266 | 31,560,337 | (25,373,768 | ) | ||||||||
| 2007 share issuances for cash: | — | |||||||||||
| Private placements | 1,500,000 | 4,500,000 | — | |||||||||
| Exercise of warrants | 191,194 | 527,888 | — | |||||||||
| Exercise of stock options | 36,900 | 66,430 | — | |||||||||
| Shares returned to treasury | (2,000 | ) | (11,000 | ) | — | |||||||
| Fair value of stock options exercised | — | 35,147 | — | |||||||||
| Fair value of warrants exercised | — | 44,685 | — | |||||||||
| Share issuance costs | — | (17,009 | ) | — | ||||||||
| Loss for the period | — | — | (2,528,614 | ) | ||||||||
Balance, January 31, 2007 | 6,832,360 | 36,706,478 | (27,902,382 | ) | ||||||||
| the fair value of the amended warrants at the date of the amendment respectively: risk-free interest rates of 2.66% and 2.66%, dividend yield of nil and nil, volatility of 71.39% and 127.29% and an expected life of 0.27 years and 1.27 years. Subsequent to January 31, | ||
As at January 31, |
Number of Shares | ExercisePrice | Weighted Average Remaining Contractual Life (yr) | Expiry Date |
| 268,000 | $1.70 | 2.87 | December 1, 2009 |
| 30,000 | $1.70 | 2.87 | April 12, 2010 |
| 210,500 | $3.55 | 3.87 | December 12, 2010 |
| 280,000 | $3.92 | 4.60 | September 5, 2011 |
| Number of underlying Shares | Exercise Price | Expiry Date | |
| 4,230,000 | $1.17 | May 18, 2009 |
| d) | Stock Options |
The Company has granted founders, directors, officers, consultants and certain employees stock options. StockFor the year ended January 31, 2009 and 2008, stock option activity is summarized as follows:
| Number | Weighted Average | ||||||
| of Options | Exercise Price | ||||||
| Balance,January 31, 2007 | 2,365,500 | $0.99 | |||||
| Granted | 735,000 | $1.00 | |||||
| Exercised | (135,000 | ) | $0.56 | ||||
| Cancelled | (112,500 | ) | $0.96 | ||||
| Expired | (30,000 | ) | $1.29 | ||||
| Balance,January 31, 2008 | 2,823,000 | $1.00 | |||||
| Granted | 634,000 | $1.09 | |||||
| Exercised | (107,000 | ) | $0.56 | ||||
| Cancelled | (629,000 | ) | $1.11 | ||||
| Balance,January 31, 2009 | 2,721,000 | $1.02 |
75
Numberof Shares | Weighted Average Exercise Price $ | |||||||
Balance outstanding, January 31, 2004 | 173,250 | 2.50 | ||||||
| 2005 - Granted | 412,900 | 1.70 | ||||||
| 2005 - Cancelled | (20,250 | ) | 1.71 | |||||
| 2005 - Exercised | (30,400 | ) | 2.50 | |||||
Balance outstanding, January 31, 2005 | 535,500 | 1.91 | ||||||
| 2006 - Granted | 407,500 | 3.36 | ||||||
| 2006 - Expired | (142,600 | ) | 2.50 | |||||
| 2006 - Exercised | (102,500 | ) | 1.70 | |||||
Balance outstanding, January 31, 2006 | 697,900 | 2.67 | ||||||
| 2007 - Granted | 280,000 | 3.92 | ||||||
| 2007 - Cancelled | (152,500 | ) | 3.55 | |||||
| 2007 - Exercised | (36,900 | ) | 1.80 | |||||
Balance outstanding, January 31, 2007 | 788,500 | 2.98 | ||||||
| CORAL GOLD RESOURCES LTD. (An Exploration Stage Company) |
| Notes to Consolidated Financial Statements |
| For the years ended January 31, |
| (In Canadian Dollars) |
Share Capital(Continued) | ||
| Stock Options(Continued) | ||
A summary of stock options outstanding and exercisable as at January 31, 2009 is as follows: | ||
| Weighted | ||||
| Average | ||||
| Remaining | ||||
| Number | Exercise | Contractual | Intrinsic | |
| Outstanding | Price | Life (yrs) | Value | Expiry Date |
| 559,500 | $0.56 | 0.83 | $0.00 | December 1, 2009 |
| 30,000 | $0.56 | 1.19 | $0.00 | April 12, 2010 |
| 631,500 | $1.17 | 1.86 | $0.00 | December 12, 2010 |
| 690,000 | $1.29 | 2.59 | $0.00 | September 5, 2011 |
| 675,000 | $1.00 | 3.65 | $0.00 | September 26, 2012 |
| 100,000 | $1.00 | 4.04 | $0.00 | February 4, 2013 |
| 35,000 | $1.00 | 4.25 | $0.00 | May 1, 2013 |
| 2,721,000 |
A summary of stock options outstanding and exercisable as at January 31, 2005, the Company adopted a2008 is as follows:
| Weighted | ||||
| Average | ||||
| Remaining | ||||
| Number | Exercise | Contractual | Intrinsic | |
| Outstanding | Price | Life (yrs) | Value | Expiry Date |
| 661,500 | $0.56 | 1.84 | $0.23 | December 1, 2009 |
| 45,000 | $0.56 | 2.20 | $0.23 | April 12, 2010 |
| 631,500 | $1.17 | 2.87 | $0.00 | December 12, 2010 |
| 750,000 | $1.29 | 3.60 | $0.00 | September 5, 2011 |
| 735,000 | $1.00 | 4.62 | $0.00 | September 26, 2012 |
| 2,823,000 |
The Company’s stock option plan which provides for the granting of options to directors, officers, employees and consultants for a maximumconsultants. Under the terms of 929,000 shares (representing approximatelythe option plan, options issued will not exceed 20% of the issued share capitaland outstanding shares from time to time. The option price under each option is not less than the discounted market price on the grant date. The expiry date for each option is set by the Board of the Company asDirectors at the datetime of approval ofissue and cannot be more than five years after the Plan by the Board). The Company recorded compensation expense of $748,409 [2006 - $1,056,100; 2005 - $343,533] with respect to stock options granted. The weighted average fair value of the options granted during 2007 was $2.79 per share [2006 - $2.59 per share; 2005 - $0.83 per share].
| CORAL GOLD RESOURCES LTD. (An Exploration Stage Company) |
| Notes to Consolidated Financial Statements |
| For the years ended January 31, 2009, 2008 and 2007 |
| (In Canadian Dollars) |
| 8. | Share Capital(Continued) |
e) Stock-Based Compensation | |
Stock-based compensation expense is determined using the fair value method. The Company estimated this expense using the Black-Scholes option pricing model with the following weighted-average assumptions: |
| 2009 | 2008 | ||||||
| Weighted average risk-free interest rate | 3.36% | 4.50% | |||||
| Expected dividend yield | 0 | 0 | |||||
| Weighted average expected stock price volatility | 113.72% | 92.63% | |||||
| Expected option life in years | 5 | 5 |
During the year ended January 31, 2009, the Company granted stock options to various employees, consultants and investor relations consultants to purchase up to 634,000 (2008 – 735,000; 2007 was estimated- $840,000) common shares at exercise prices of $1.00 and $1.11 pursuant to the dateCompany’s stock option plan. Of this amount, 499,000 stock options were cancelled prior to vesting due to the termination of granting using the Black-Scholes option pricing model with the following assumptions: risk-free interest ratean investor relations agreement. The Company recorded stock-based compensation expense of 4.00%, dividend yield of 0.0%, volatility factor of 89.18%,$255,763 (2008 – $310,246; 2007 – $748,409). The amounts expensed were allocated to directors/officers, employees and a life of 5 years.
| 2009 | 2008 | 2007 | ||||||||
| Directors, officers and employees | $ | 24,902 | $ | 261,998 | $ | 697,856 | ||||
| Investor relations | 35,791 | 33,191 | 22,639 | |||||||
| Consultants | 195,070 | 15,057 | 27,914 | |||||||
| Modification of warrants (Note 8(c)) | 1,513,500 | - | - | |||||||
| $ | 1,769,263 | |||||||||
| $ | 310,246 | $ | 748,409 |
During the year ended January 31, 2006 was estimated at2009, the dateCompany recorded stock-based compensation expense on warrants amended of granting using the Black-Scholes option$1,513,500 (2008 - $nil).
Option pricing model with the following assumptions: risk-free interest rate of 4.09% and 4.42%, dividend yield of 0.0%, volatility factors of 104.23% and 101.41%, and a life of 5 years.
| CORAL GOLD RESOURCES LTD. (An Exploration Stage Company) | ||||
| For the | ||||
| (In Canadian Dollars) |
| 9. | Related Party Transactions | |||
During the year ended January 31, | ||||
| (a) | ||||
$30,000 (2008 – $30,000; 2007 |
Underlying Shares | Weighted Average Exercise Price | |||||||
Balance outstanding, January 31, 2004 | 1,086,766 | $ | 3.57 | |||||
| Issued | 255,220 | $ | 5.21 | |||||
| Exercised | (1,600 | ) | $ | 3.10 | ||||
| Expired | (364,885 | ) | $ | 4.00 | ||||
Balance outstanding, January 31, 2005 | 975,501 | $ | 3.84 | |||||
| Issued | 173,975 | $ | 2.00 | |||||
| Exercised | (9,397 | ) | $ | 2.76 | ||||
| Expired | (17,456 | ) | $ | 3.24 | ||||
| Cancelled | (6,925 | ) | $ | 4.29 | ||||
Balance outstanding, January 31, 2006 | 1,115,698 | $ | 3.57 | |||||
| Exercised | (191,194 | ) | $ | 2.77 | ||||
| Expired | (822,120 | ) | $ | 3.96 | ||||
Balance outstanding, January 31, 2007 | 102,384 | $ | 2.00 | |||||
Number of Shares | Exercise Price | Expiry Date |
| 102,384 | $2.00 | September 15, 2007 |
| officer of the Company; | ||||||||
| (b) | $75,000 (2008 – $75,000; 2007 – $31,250) was paid for management fees to a private company controlled by a director and officer of the | |||||||
| (c) | $30,000 (2008 – $30,000; 2007 – $65,000) was paid for management fees to a private company controlled by an officer of the Company; | |||||||
| (d) | $30,000 (2008 – $nil ; 2007 – $nil) was paid for consulting fees to a private company controlled by an officer of a related Company; | |||||||
| (e) | ||||||||
$186,734 (2008 – $168,983; 2007 |
| (f) | $39,526 (2008 – $15,332; 2007 – $nil) was paid |
| (g) | $35,888 (2008 – $42,661; 2007 – $47,198) was paid for geological consulting services to a private company controlled by a director and officer of the Company; | |
| (h) | $12,000 (2008 – $12,000; 2007 – $62,000) was paid for directors’ fees to the Directors’ of the Company; | |
These charges were measured at the exchange amount, which is the amount | ||
The Company entered into a cost-sharing agreement during 2005 to reimburse | ||
Advances receivable from related parties comprises US$52,891 (2008 – US$52,891) less an allowance for bad debt of US$39,113 (2008 – US$39,113). The advances receivable from related parties is from a public company related by common directors. Amounts due are without stated terms of interest or repayment. | ||
Advances payable to related parties include $12,288 (2008 – $16,662) due to Oniva, $17,000 (2008 – $17,000) due to a director of the Company, and $40,796 (2008 – $2,570) due to two private companies controlled by directors and officers of the Company. Amounts due are without stated terms of interest or repayment. | ||
| For the years ended January 31, 2009, 2008 and 2007 |
| (In Canadian Dollars) |
Asset Retirement Obligation | |
Management has assessed their AROs and the associated liability to be recognized in the current period. Management has estimated that the costs would approximate $270,979 (2008 – $194,361). The Company intends on fulfilling its obligation in fiscal 2010; therefore there is no difference between the present value and undiscounted value of the obligation. The increase of $76,618 in the obligation over fiscal 2008 was the result of a reassessment of new and previously existing reclamation concerns. Management will continue to assess their asset retirement obligations and the associated liability as further information becomes known. | |
| 11. | Capital Management |
The Company’s objectives when managing capital are to safeguard the Company’s ability to continue as a going concern in order to pursue the exploration of its properties and to maintain flexible capital structure for its projects for the benefit of its stakeholders. In the management of capital, the Company includes the components of shareholders’ equity as well as cash and cash equivalents, receivables and current liabilities. | |
The Company manages the capital structure and makes adjustments to it in light of changes in economic conditions and the risk characteristics of the underlying assets. To maintain or adjust the capital structure, the Company may attempt to issue new shares or adjust the amount of cash and cash equivalents. Management reviews the capital structure on a regular basis to ensure that objectives are met. | |
| 12. | Supplementary Cash Flow Information |
| For the | |||||||||||||
| period from | |||||||||||||
| inception on | |||||||||||||
| January 22, | |||||||||||||
| 1981 to | |||||||||||||
| Net changes in non-cash | January 31, | ||||||||||||
| working capital | 2009 | 2009 | 2008 | 2007 | |||||||||
| Advances receivable | $ | (431,342 | ) | $ | (3,091 | ) | $ | 36,634 | $ | 11,916 | |||
| Prepaid expenses | (5,854 | ) | (2,691 | ) | 52,477 | 14,216 | |||||||
| Interest and other amounts | |||||||||||||
| receivable | (9,747 | ) | 45,868 | (24,611 | ) | (97,124 | ) | ||||||
| Accounts payable and accrued | |||||||||||||
| liabilities | 64,334 | (57,034 | ) | (331,071 | ) | (244,371 | ) | ||||||
| Advances payable to related | |||||||||||||
| parties | 29,287 | (7,211 | ) | 18,527 | (43,984 | ) | |||||||
| Asset retirement obligation | (13,202 | ) | 0 | (12,816 | ) | (386 | ) | ||||||
| Cash used in operating | |||||||||||||
| activities | $ | (366,524 | ) | $ | (24,160 | ) | $ | (260,860 | ) | $ | (359,733 | ) |
79
| CORAL GOLD RESOURCES LTD. (An Exploration Stage Company) |
| Notes to Consolidated Financial Statements |
| For the years ended January 31, 2009, 2008 and 2007 |
| (In Canadian Dollars) |
| 13. | Income Taxes |
The reconciliation of the future income tax recovery (expense) rate to the statutory rate is as follows:
2007 | 2006 | 2005 | ||||||||||
| $ | $ | $ | ||||||||||
| Loss before taxes | (2,049,344 | ) | (2,075,412 | ) | (721,390 | ) | ||||||
| Income tax rate | 34.12 | % | 34.75 | % | 35.62 | % | ||||||
Income tax recovery at the statutory rate | 699,236 | 721,206 | 256,959 | |||||||||
| Permanent differences | (299,735 | ) | (384,610 | ) | (136,879 | ) | ||||||
| Losses not benefited | (561,561 | ) | (436,019 | ) | (382,158 | ) | ||||||
| Changes in income tax rates | (317,210 | ) | (88,442 | ) | (197 | ) | ||||||
Net future income tax expense | (479,270 | ) | (187,865 | ) | (262,275 | ) | ||||||
| 2009 | 2008 | 2007 | ||||||||
| Income tax recovery at | ||||||||||
| the statutory rate | $ | 1,012,053 | $ | 236,783 | $ | 699,236 | ||||
| Tax effect of expenses that are | ||||||||||
| not deductible | ||||||||||
| Mineral properties | 488,956 | 581,628 | 486,121 | |||||||
| Foreign exchange | (282,097 | ) | 190,212 | (29,169 | ) | |||||
| Stock-based compensation | (557,318 | ) | (100,069 | ) | (255,357 | ) | ||||
| Changes in valuation allowance | (1,299,262 | ) | (1,950,640 | ) | (1,710,140 | ) | ||||
| Adjustment due to effective rate | ||||||||||
| attributable to income taxes in | ||||||||||
| other countries | 55,774 | 15,376 | 12,829 | |||||||
| Changes in income tax rates and | ||||||||||
| foreign exchange | 48,597 | 406,000 | 317,210 | |||||||
| Net future income tax expense | $ | (533,297 | ) | $ | (620,710 | ) | $ | (479,270 | ) |
The components of the future income tax assets (liabilities) are as follows:
| 2009 | 2008 | ||||||
| (Note 16 | ) | ||||||
| Future income tax assets | |||||||
| Non-capital loss carry-forwards | $ | 4,766,000 | $ | 3,584,000 | |||
| Other | 18,000 | 6,000 | |||||
| 4,784,000 | 3,590,000 | ||||||
| Less: valuation allowance | (4,784,000 | ) | (3,590,000 | ) | |||
| Net future income tax asset | - | - | |||||
| Future income tax liability | |||||||
| Mineral property interests | (4,963,038 | ) | (3,562,808 | ) | |||
| Net future income tax liability | $ | (4,963,038 | ) | $ | (3,562,808 | ) |
The valuation allowance reflects the Company’s estimate that the future tax assets, are not, more likely than not, towill not be realized.
At January 31, 2007,2009, the Company had, for Canadian tax purposes, non-capital losses aggregating approximately $4,482,000.$5,538,000. These losses are available to reduce taxable income earned by the Canadian operations of future years and expire as follows:
| 2010 | $ | 527,000 | ||
| 2011 | 627,000 | |||
| 2015 | 522,000 | |||
| 2026 | 1,231,000 | |||
| 2027 | 1,114,000 | |||
| 2028 | 900,000 | |||
| 2029 | 617,000 | |||
| $ | 5,538,000 |
80
| $ | ||||
| 2008 | 243,000 | |||
| 2009 | 231,000 | |||
| 2010 | 527,000 | |||
| 2011 | 627,000 | |||
| 2015 | 522,000 | |||
| 2026 | 1,231,000 | |||
| 2027 | 1,101,000 | |||
| 4,482,000 |
| CORAL GOLD RESOURCES LTD. (An Exploration Stage Company) |
| Notes to Consolidated Financial Statements |
| For the years ended January 31, 2009, 2008 and 2007 |
| (In Canadian Dollars) |
| 13. | Income Taxes(Continued) |
At January 31, 2009, the Company had, for US tax purposes, non-capital losses aggregating approximately $5,538,000. The net operating losses available to offset future revenues of the US operations are approximately US$3,648,0007,713,000 and expire at various times through 2017.
| 2010 | $ | 118,000 | ||
| 2011 | 81,000 | |||
| 2012 | 130,000 | |||
| 2013 | 58,000 | |||
| 2014 | 364,000 | |||
| 2015 | 99,000 | |||
| 2016 | 220,000 | |||
| 2017 | 167,000 | |||
| 2018 | 596,000 | |||
| 2019 | 335,000 | |||
| 2020 | 627,000 | |||
| 2021 | 513,000 | |||
| 2022 | 1,284,000 | |||
| 2023 | 1,648,000 | |||
| 2024 | 1,473,000 | |||
| $ | 7,713,000 |
The Company is involved in mineral exploration and development activities principally in the United States. The Company is in the developmentexploration stage and, accordingly, has no reportable segment revenues for each of the 2009, 2008 and 2007 2006 and 2005 fiscal year.years. All losses for 2007, 20062009, 2008 and 20052007 are as a result of Canadian head office costs. Costs of USAUS operations are capitalized to mineral properties. The assets of the Company are segmented as follows:
| January 31, 2009 | Canada | US | Total | |||||||
| Current assets | $ | 1,331,702 | $ | 33,114 | $ | 1,364,816 | ||||
| Investment securities | 78,803 | - | 78,803 | |||||||
| Equipment | 1,862 | 5,682 | 7,544 | |||||||
| Mineral properties | - | 15,704,913 | 15,704,913 | |||||||
| Reclamation deposit | - | 477,550 | 477,550 | |||||||
| $ | 1,412,367 | $ | 16,221,259 | $ | 17,633,626 |
Canada | USA | Total | ||||||||||
| $ | $ | $ | ||||||||||
2007 | ||||||||||||
| Current assets | 2,616,989 | 65,808 | 2,682,797 | |||||||||
| Investment in securities | 118,751 | — | 118,751 | |||||||||
| Equipment | 2,908 | — | 2,908 | |||||||||
| Mineral properties | — | 11,755,737 | 11,755,737 | |||||||||
| Reclamation deposit | — | 332,229 | 332,229 | |||||||||
2,738,648 | 12,153,774 | 14,892,422 | ||||||||||
2006 | ||||||||||||
| Current assets | 695,738 | 99,547 | 795,285 | |||||||||
| Investment in securities | 74,833 | 72,575 | 147,408 | |||||||||
| Loan Receivable | 83,000 | — | 83,000 | |||||||||
| Equipment | 3,634 | — | 3,634 | |||||||||
| Mineral properties | — | 10,095,609 | 10,095,609 | |||||||||
| Reclamation deposit | — | 260,976 | 260,976 | |||||||||
| 857,205 | 10,528,707 | 11,385,912 | ||||||||||
| January 31, 2008 | Canada | US | Total | |||||||
| Current assets | $ | 3,642,859 | $ | 31,816 | $ | 3,674,675 | ||||
| Investment securities | 167,282 | - | 167,282 | |||||||
| Equipment | 2,327 | - | 2,327 | |||||||
| Mineral properties | - | 14,021,301 | 14,021,301 | |||||||
| Reclamation deposit | - | 320,103 | 320,103 | |||||||
| $ | 3,812,468 | $ | 14,373,220 | $ | 18,185,688 |
81
| Notes to Consolidated Financial Statements |
| For the years ended January 31, |
| (In Canadian Dollars) |
Commitment | ||||||||
In February 2008, the Company entered into an agreement with an individual to provide investor relations services. In consideration of the services rendered, the Company will pay $1,500 per month for a term of one year unless terminated upon 30 day’s notice by either party. | ||||||||
Comparative Figures | ||||||||
Certain of the comparative figures for 2008 have been reclassified, where applicable, to conform to the presentation adopted for the current year. | ||||||||
Subsequent Event | ||||||||
On April 21, 2009, the Company amended the terms of 4,230,000 warrants issued pursuant to a private placement announced on April 20, 2007. A first amendment extended the expiry date of the warrants from May 18, 2008 to May 18, 2009 (Note 8(c)). The current amendment will extend the expiry date of the warrants from May 18, 2009 to May 18, 2010. All other terms remain the same. | ||
| 18. | Differences between Canadian and United States Generally Accepted Accounting Principles | |
The consolidated financial statements of | ||
2007 | 2006 | 2005 | ||||||||||
| $ | $ | $ | ||||||||||
| Deficit end of year per Canadian GAAP | (27,902,382 | ) | (25,373,768 | ) | (23,110,480 | ) | ||||||
Stock compensation expense [note 9(c)] | (60,000 | ) | (60,000 | ) | (60,000 | ) | ||||||
| Deferred exploration expenditures, net | (10,703,195 | ) | (9,057,135 | ) | (8,472,255 | ) | ||||||
Future income taxes [note 13] | 3,142,569 | 2,573,422 | 2,599,608 | |||||||||
| Deficit end of year per U.S. GAAP | (35,523,008 | ) | (31,917,481 | ) | (29,043,127 | ) | ||||||
The impact of these differences would be as follows: | ||
| a) | Reconciliation of Consolidated |
Year ended January 31, 2007 | Year ended January 31, 2006 | Year ended January 31, 2005 | ||||||||||
| $ | $ | $ | ||||||||||
Loss for the year per Canadian GAAP | (2,528,614 | ) | (2,263,288 | ) | (983,665 | ) | ||||||
| Deferred exploration expenditures | (1,646,060 | ) | (584,880 | ) | (897,908 | ) | ||||||
| Future income taxes | 479,270 | 187,865 | 262,275 | |||||||||
| Foreign exchange (gain) loss | 89,877 | (214,051 | ) | (157,429 | ) | |||||||
Loss for the year per U.S. GAAP | (3,605,527 | ) | (2,874,354 | ) | (1,776,727 | ) | ||||||
| Unrealized gain (loss) on investment | ||||||||||||
| securities | 76,693 | (14,581 | ) | 5,771 | ||||||||
Comprehensive loss for the year | ||||||||||||
per U.S. GAAP | (3,528,834 | ) | (2,888,935 | ) | (1,770,956 | ) | ||||||
Year ended January 31, 2007 | Year ended January 31, 2006 | Year ended January 31, 2005 | ||||||||||
| $ | $ | $ | ||||||||||
| Loss per share - basic and diluted | (0.54 | ) | (0.60 | ) | (0.38 | ) | ||||||
Share Capital | ||||||||||||||||||||||||||||||||
Number of | Amount | Share Subscriptions | Additional Paid In Capital | Comprehensive Income (Loss) | Deficit | Accumulated Other Comprehensive Income (Loss) | Total Shareholders’ Equity | |||||||||||||||||||||||||
Shares | $ | $ | $ | $ | $ | $ | $ | |||||||||||||||||||||||||
| Balance, January 31, 2004 | 4,361,685 | 29,646,238 | 791,720 | 60,000 | — | (27,266,400 | ) | — | 3,231,558 | |||||||||||||||||||||||
| Share subscriptions | — | — | (791,720 | ) | — | — | — | — | (791,720 | ) | ||||||||||||||||||||||
Issuance of shares, net [see note 9(b)] | 287,220 | 1,108,440 | (11,945 | ) | — | — | — | — | 1,096,495 | |||||||||||||||||||||||
| Stock-based compensation expense | — | — | — | 343,533 | — | —— | — | 343,553 | ||||||||||||||||||||||||
| Components of comprehensive loss: | ||||||||||||||||||||||||||||||||
| - net loss | — | — | — | — | (1,776,727 | ) | (1,776,727 | ) | — | (1,776,727 | ) | |||||||||||||||||||||
| - change in unrealized gain (loss) of marketable securities | — | — | — | — | 5,771 | — | 5,771 | 5,771 | ||||||||||||||||||||||||
| (1,770,956 | ) | |||||||||||||||||||||||||||||||
| Balance, January 31, 2005 | 4,648,905 | 30,754,678 | (11,945 | ) | 403,533 | (29,043,127 | ) | 5,771 | 2,108,910 | |||||||||||||||||||||||
Share Capital | ||||||||||||||||||||||||||||||||||||
Number of Shares | Amount $ | Share Subscriptions $ | Warrants $ | Additional Paid in Capital $ | Comprehensive Income (Loss) $ | Deficit $ | Accumulated Other Comprehensive Income (Loss) $ | Total Shareholders' Equity $ | ||||||||||||||||||||||||||||
| Balance, January 31, 2005 | 4,648,905 | 30,754,678 | (11,945 | ) | — | 403,533 | — | (29,043,127 | ) | 5,771 | 2,108,910 | |||||||||||||||||||||||||
| Share subscriptions | — | — | 71,945 | — | — | — | — | — | 71,945 | |||||||||||||||||||||||||||
Issuance of shares, net [see note 9(b)] | 457,361 | 805,659 | — | 116,100 | — | — | — | — | 921,759 | |||||||||||||||||||||||||||
| Stock-based compensation expense | — | — | — | — | 1,056,100 | — | — | — | 1,056,100 | |||||||||||||||||||||||||||
| Fair value of stock option exercises | — | — | — | — | (87,560 | ) | — | — | — | (87,560 | ) | |||||||||||||||||||||||||
| Components of comprehensive loss: | ||||||||||||||||||||||||||||||||||||
| - net loss | — | — | — | — | — | (2,874,354 | ) | (2,874,354 | ) | — | (2,874,354 | ) | ||||||||||||||||||||||||
| - change in unrealized gain (loss) of marketable securities | — | — | — | — | — | (14,581 | ) | — | (14,581 | ) | (14,581 | ) | ||||||||||||||||||||||||
| (2,888,935 | ) | |||||||||||||||||||||||||||||||||||
| Balance, January 31, 2006 | 5,106,266 | 31,560,337 | 60,000 | 116,100 | 1,372,073 | (31,917,481 | ) | (8,810 | ) | 1,182,219 | ||||||||||||||||||||||||||
| Share subscriptions | — | — | (60,000 | ) | — | — | — | — | — | (60,000 | ) | |||||||||||||||||||||||||
Issuance of shares, net [see note 9(b)] | 1,726,094 | 5,146,141 | — | — | — | — | — | — | 5,146,141 | |||||||||||||||||||||||||||
| Stock-based compensation expense | — | — | — | — | 748,409 | — | — | — | 748,409 | |||||||||||||||||||||||||||
| Fair value of stock option exercises | — | — | — | — | (35,147 | ) | — | — | — | (35,147 | ) | |||||||||||||||||||||||||
| Fair value of warrants exercised | — | — | — | (44,685 | ) | — | — | — | — | (44,685 | ) | |||||||||||||||||||||||||
| Components of comprehensive loss: | ||||||||||||||||||||||||||||||||||||
| - net loss | — | — | — | — | — | (3,605,527 | ) | (3,605,527 | ) | — | (3,605,527 | ) | ||||||||||||||||||||||||
| - change in unrealized gain (loss) of marketable securities | — | — | — | — | — | 76,693 | — | 76,693 | 76,693 | |||||||||||||||||||||||||||
| (3,528,834 | ) | |||||||||||||||||||||||||||||||||||
| Balance, January 31, 2007 | 6,832,360 | 36,706,478 | — | 71,415 | 2,085,335 | (35,523,008 | ) | 67,883 | 3,408,103 | |||||||||||||||||||||||||||
| (i) | Reconciliation of |
2007 | 2006 | 2005 | ||||||||||
| $ | $ | $ | ||||||||||
| Cash used in operating activities | ||||||||||||
| per Canadian GAAP | (1,475,288 | ) | (677,443 | ) | (556,184 | ) | ||||||
| Deferred exploration expenditures | (1,646,060 | ) | (584,880 | ) | (897,908 | ) | ||||||
| Cash used in operating activities | ||||||||||||
| per U.S. GAAP | (3,121,348 | ) | (1,262,323 | ) | (1,454,092 | ) | ||||||
2007 | 2006 | 2005 | ||||||||||
| $ | $ | $ | ||||||||||
| Cash used in investing activities | ||||||||||||
| per Canadian GAAP | (1,648,381 | ) | (392,771 | ) | (914,246 | ) | ||||||
| Deferred exploration expenditures | 1,646,060 | 584,880 | 897,908 | |||||||||
| Cash used in investing activities | ||||||||||||
| per U.S. GAAP | (2,321 | ) | 192,109 | (16,338 | ) | |||||||
| 2009 | 2008 | ||||||
| Consolidated balance sheets | |||||||
| Total assets, Canadian GAAP | $ | 17,633,626 | $ | 18,185,688 | |||
| Capitalized mineral expenditures | (14,393,768 | ) | (12,710,156 | ) | |||
| Total assets, US GAAP | $ | 3,239,858 | $ | 5,475,532 | |||
| Total liabilities, Canadian GAAP | $ | 5,378,755 | $ | 3,915,356 | |||
| Future income tax liability | (4,610,376 | ) | (3,210,146 | ) | |||
| Total liabilities, US GAAP | $ | 768,379 | $ | 715,210 |
Mineral Properties
The Company follows the policy of deferring all acquisition and exploration costs relating to the mineral properties held. Under U.S.US GAAP, the deferred exploration expenditures would have been expensedexpenses in the year they were incurred [see note 6[a](see Note 6) and accordingly, there would be no future income tax relating to 6[d]].
| January 31, |
| (In Canadian Dollars) |
Differences between Canadian and United States Generally Accepted Accounting Principles | ||
(Continued) | ||
| a) | Reconciliation of Consolidated Balance Sheet Items(Continued) | |
| (ii) | Reconciliation of Deficit | |
| 2009 | 2008 | ||||||
| Consolidated statements of equity | |||||||
| Deficit end of year, Canadian GAAP | $ | (32,967,732 | ) | $ | (29,221,567 | ) | |
| Stock-based compensation expense | (60,000 | ) | (60,000 | ) | |||
| Deferred exploration expenditures, net | (14,393,768 | ) | (12,710,156 | ) | |||
| Future income taxes | 4,610,376 | 3,210,146 | |||||
| Deficit end of year, US GAAP | $ | (42,811,124 | ) | $ | (38,781,577 | ) |
Stock-based compensation expense
Canadian GAAP and U.S.US GAAP both have the same policy of recording a compensation expense for the estimated fair value of stock options granted except that U.Sin accordance with US GAAP, FAS 123R requires the Company to estimate expected forfeitures at the grant date. Under U.S. GAAP theThe Company adopted the policy of fair value accounting for stock options under US GAAP, FAS 123, a year earlier than it adopted the policy for Canadian GAAP, and at that time,during the one year difference in policy treatment, the Company did not record a stockstock-based compensation charge of $60,000 under Canadian GAAP. Therefore, there is ana permanent adjustment of $60,000 to retained deficit when reconciling from Canadian GAAP to U.S.US GAAP.
FAS 123R was adopted as at February 1, 2007, under the modified prospective method of adoption. The Company’s stock options vest immediately upon granting. Forfeitures are estimated under FAS 123R for options that are not fully vested.vested upon granting. Therefore, the adoption of this standard has no effect on the consolidated financial statements.
For U.S.US GAAP purposes, stock basedstock-based compensation would be included as part of the directors’ fees and a portion would be allocated to salaries and benefits in the consolidated statementstatements of operations and deficit.
| Notes to Consolidated Financial Statements |
| For the years ended January 31, |
| (In Canadian Dollars) |
Differences between Canadian and United States Generally Accepted Accounting Principles | |
(Continued) | |
b) Reconciliation of Consolidated Statement of Operations Items |
| 2009 | 2008 | 2007 | ||||||||
| Consolidated statements of | ||||||||||
| operations | ||||||||||
| Loss for year, Canadian GAAP | $ | (3,746,165 | ) | $ | (1,319,185 | ) | $ | (2,528,614 | ) | |
| Deferred exploration expenditures | (1,683,613 | ) | (2,006,961 | ) | (1,646,060 | ) | ||||
| Future income taxes | 533,297 | 620,710 | 479,270 | |||||||
| Foreign exchange gain (loss) | 866,933 | (553,133 | ) | 89,877 | ||||||
| Net loss for the year, US GAAP | (4,029,548 | ) | (3,258,569 | ) | (3,605,527 | ) | ||||
| Unrealized gain (loss) on | ||||||||||
| investments | - | - | 76,693 | |||||||
| Net comprehensive loss, US GAAP | $ | (4,029,548 | ) | $ | (3,258,569 | ) | $ | (3,528,834 | ) | |
| Loss per share, US GAAP – | ||||||||||
| Basic and diluted | $ | (0.16 | ) | $ | (0.14 | ) | $ | (0.18 | ) |
Investment securities
US GAAP requires investments available for sale to be recorded at fair value. The periodic fluctuation in value is recorded as part of comprehensive income (loss); under US GAAP such fluctuations are not recognized into operation until the FASB issued FAS No. 157, “Fair Value Measurements” (FAS 157”), which defines fair value, establishes a framework for measuring fair value and expands disclosures about fair value measurements. FAS 157 is effective for financial statements issuedinvestments are sold. Effective for fiscal years beginning after November 15,January 31, 2008 the Canadian GAAP treatment is the same, however in fiscal January 31, 2007 such investments were recorded in accordance with Canadian GAAP at the lower of cost and interim periods within those fiscal years,market; long-term investments in marketable securities are written down to market when impairment is considered other than temporary, in which case the written-down value becomes the new cost base, and the impairment is applicable beginning in the first quarter of fiscal 2009. The Company is currently evaluating the impact that FAS 157 will have on its consolidated financial statements.
| CORAL GOLD RESOURCES LTD. (An Exploration Stage Company) |
| Notes to Consolidated Financial Statements |
| For the years ended January 31, 2009, 2008 and 2007 |
| (In Canadian Dollars) |
| 18. | Differences between Canadian and United States Generally Accepted Accounting Principles |
(Continued) | |
c) Reconciliation of Consolidated Statements of Cash Flows |
| 2009 | 2008 | 2007 | ||||||||
| Consolidated statements of cash | ||||||||||
| flows | ||||||||||
| Cash used in operating activities | ||||||||||
| per Canadian GAAP | $ | (557,733 | ) | $ | (1,201,641 | ) | $ | (1,475,288 | ) | |
| Mineral properties expenditures | (1,609,696 | ) | (1,815,398 | ) | (1,646,060 | ) | ||||
| Cash flows used in operating activities | ||||||||||
| per US GAAP | $ | (2,167,429 | ) | $ | (2,660,570 | ) | $ | (3,121,348 | ) | |
| Cash used in investing activities under | ||||||||||
| Canadian GAAP | $ | (1,774,063 | ) | $ | (2,061,875 | ) | $ | (1,648,381 | ) | |
| Mineral properties expenditures | 1,609,696 | 1,815,398 | 1,646,060 | |||||||
| Cash used in investing activities | ||||||||||
| under US GAAP | $ | (164,367 | ) | $ | (246,477 | ) | $ | (2,321 | ) |
d) Recently Adopted Accounting Standards
| (i) | Statement of Financial Accounting Standards (“SFAS”) No. 157, “Fair Value Measurements”. The provisions of this standard are to provide guidance for using fair value to measure assets and liabilities. The standard clarifies methods for measuring items not actively traded and the principles that fair value should be based upon when pricing an asset or liability. The provisions of Statement 157 are effective for financial statements issued for fiscal years beginning after November 15, 2007, and interim periods within those fiscal years. Earlier application is encouraged, provided that the reporting entity has not yet issued financial statements for that fiscal year. There is no impact on the Company’s consolidated financial statements. SFAS 157-2 defers the Statement’s effective date for certain non-financial assets and liabilities to fiscal years beginning after November 15, 2008, and interim periods within those years. The adoption of SFAS 157-2 is not expected to have an impact on the Company’s consolidated financial statements. | |
| (ii) | In February 2007, the Financial Accounting Standards Board (“FASB”) issued SFAS No. 159, “The Fair Value Option for Financial Assets and Financial Liabilities – an Amendment of FASB Statement No. 115”, which permits entities to choose to measure many financial instruments and certain other items at fair value. The fair value option established by SFAS 159 permits all entities to choose to measure eligible items at fair value at specified election dates. A business entity shall report unrealized gains and losses on items for which the fair value option has been elected in earnings at each subsequent reporting date. Adoption is required for fiscal years beginning after November 15, 2007. Early adoption is permitted as of the beginning of the fiscal year that begins on or before November 15, 2007, provided the entity also elects to apply the provisions of SFAS 157. There is no impact on the Company’s consolidated financial statements. |
85
| CORAL GOLD RESOURCES LTD. (An Exploration Stage Company) |
| Notes to Consolidated Financial Statements |
| For the years ended January 31, 2009, 2008 and 2007 |
| (In Canadian Dollars) |
| 18. | Differences between Canadian and United States Generally Accepted Accounting Principles |
(Continued) | |
d) Recently Adopted Accounting Standards |
| (iii) | SFAS No. 141(R), Business Combinations, is to replace SFAS No. 141, “Business Combinations”. The new statement retains the fundamental requirements in SFAS No. 141 that the acquisition method of accounting be used for all business combinations. The new standard defines the acquirer as the entity that obtains control of one or more businesses in the business combination and establishes the acquisition date as the date that the acquirer achieves control. The new statement improves the comparability of the information about business combinations provided in financial reports. SFAS No.141(R) applies prospectively to business combinations for which the acquisition date is on or after the beginning of the first annual reporting period beginning on or after December 15, 2008. The adoption of this statement is not expected to have a significant impact on the Company’s consolidated financial statements. | |
| (iv) | In March 2008, the FASB issued SFAS No. 161, “Disclosure about Derivative Instruments and Hedging Activities” (“SFAS 161”). SFAS 161 changes the disclosure requirements for derivative instruments and hedging activities by requiring enhanced disclosures about how and why an entity uses derivatives instruments, how derivative instruments and related hedged items affect an entity’s operating results, financial position, and cash flows. SFAS 161 is effective for the Company’s 2009 fiscal year. Early adoption is permitted. The Company is currently reviewing the provisions of SFAS 161. However, as the provisions of SFAS 161 are only related to disclosure of derivative and hedging activities, the Company does not believe the adoption of SFAS 161 will have a material impact on its consolidated operating results, financial position or cash flows. | |
| (v) | In May 2008, the FASB issued SFAS No. 162, “The Hierarchy of Generally Accepted Accounting Principles” (“SFAS 162”). The new standard is intended to improve financial reporting by identifying a consistent framework, or hierarchy, for selecting accounting principles to be used in preparing financial statements that are presented in conformity with U.S. generally accepted accounting principles (GAAP) for nongovernmental entities. SFAS 162 is effective 60 days following the Securities and Exchange Commission’s approval of the Public Company Accounting Oversight Board Auditing amendments to AU Section 411, “The Meaning of Present Fairly in Conformity with Generally Accepted Accounting Principles”. The Company is currently evaluating the impact of adoption of SFAS 162 but does not expect adoption to have a material impact on results of operations, cash flows or financial position. |
86
SIGNATURE
The registrant hereby certifies that it meets all of the requirements for filing on Form 20-F and that it has duly caused and authorized the undersigned to sign this annual report on its behalf.
| Dated: August 14, 2009 | CORAL GOLD RESOURCES LTD. | ||
| By: | /s/ Louis Wolfin | ||
| Louis Wolfin, Chief Executive Officer | |||
Exhibit Index
| Exhibit Number | Name |
| 1.1 | Memorandum of Coral Gold Resources Ltd.* |
| Articles of Coral Gold Resources Ltd.* | |
| 8.1 | List of Subsidiaries |
| 12.1 | Certification of the Principal Executive Officer |
| 12.2 | Certification of the Principal Financial Officer |
| 13.1 | Certificate of Principal Executive Officer under the Sarbanes-Oxley Act |
| 13.2 | Certificate of Principal Financial Officer under the Sarbanes-Oxley Act |
| 13.3 | Consent of Expert |
| 13.4 | Consent of |
| 13.5 | Consent of Expert |
| 13.6 | Consent of Expert |
| 15.1 | Geological Report on the Robertson Property* |
| 15.2 | Update of the Geological Report on the Robertson Property* |
_______________________
* Previously filed.
88