SECURITIES AND EXCHANGE COMMISSION
Washington, D.C. 20549
FORM 20-F
| Registration statement pursuant to Section 12(b) or (g) of the Securities Exchange Act of 1934 | |
 | Annual report pursuant to Section 13 or 15(d) of the Securities Exchange Act of 1934 |
| For the fiscal year ended | |
| Transition report pursuant to Section 13 or 15(d) of the Securities Exchange Act of 1934 | |
| For the transition period from ________ to ________. |
Commission file number 0-16945
SIGNET GROUP plc
(Exact name of Registrant as specified in its charter)
ENGLAND
(Jurisdiction of incorporation or organization)
Zenith House
The Hyde
London NW9 6EW
England
(Address of principal executive offices)
Securities registered or to be registered pursuant to Section 12(b) of the Act:
None
None
Securities registered or to be registered pursuant to Section 12(g) of the Act:
American Depositary Shares
Ordinary Shares of 0.5 pence each
Securities for which there is a reporting obligation pursuant to Section 15(d) of the Act:
None
None
Indicate the number of outstanding shares of each of the issuer’s classes of capital or common stock as of the close of the period covered by the annual report:
| Ordinary Shares of 0.5 pence each | ||
| Class A Dollar Deferred Shares of $0.01 each | 0 | |
| Class B Dollar Deferred Shares of $1.00 each | 0 |
Indicate by check mark whether the registrant (1) has filed all reports required to be filed by Section 13 or 15(d) of the Securities Exchange Act of 1934 during the preceding 12 months (or for such shorter period that the registrant was required to file such reports), and (2) has been subject to such filing requirements for the past 90 days.
Yes ![]() No
No ![]()
Indicate by check mark which financial statement item the registrant has elected to follow.
Item 17 ![]() Item 18
Item 18 ![]()
EXPLANATORY NOTE |
![]()
![]()
| 2002/03 Group highlights | ||||||
| Sales | up | 1.9% | (1) | to | £1,608.0m | |
| Operating profit | up | 7.7% | (1) | to | £216.2m | |
| Profit before tax | up | 9.2% | (1) | to | £199.7m | |
| Earnings per share(2) | up | 5.6% | (1) | to | 7.5p | |
| Dividend per share | up | 17.9% | to | 2.11p | ||
| Return on capital employed(2) | up from | 23.3% | to | 23.8% | ||
| Gearing | down from | 29.7% | to | 20.1% | ||

| 2003/04 | ||||||
| Group highlights | ||||||
| reported | at constant | |||||
| basis | exchange rates | |||||
| • | Sales: £1,617.2m | up 0.6% | up 7.3% | |||
| • | Operating profit: £222.3m | up 3.9%(2) | up 11.2% | |||
| • | Profit before | up 6.0%(2) | up 13.0% | |||
| • | Earnings per share | up 6.7%(2) | up 12.7% | |||
| • | Dividend per share: 2.501p | up 18.5% | ||||
| • | Return on capital employed(3) up from 24.1%(2) to 24.8% | |||||
| • | Gearing(3) down from 20.7%(2) to 11.0% | |||||
 | ||||||
| (1) | See page 25 for reconciliation to Generally Accepted Accounting Principles figures. | |
| (2) | 1999/00 to 2002/03 restated for the implementation of FRS 17 – ‘Retirement Benefits’. | |
| (3) | Earnings per share, | |
| (4) | 53 week year. | |
Annual Report & Accounts |
Signet Group plc is an English public limited company, whose shares are listed on the London Stock Exchange (under the symbol “SIG”) and whose American Depositary Shares are quoted on the Nasdaq National Market (under the symbol “SIGY”).
This document comprises the Annual Report & Accounts of the Group in accordance with United Kingdom requirements and the Annual Report on Form 20-F to be filed with the United States Securities and Exchange Commission.requirements.
In this Annual Report, “1998/99”, “1999/00”, “2000/01”, “2001/02”, “2002/03”, “2003/04” and “2003/04”“2004/05”, refer to, as appropriate, the 52 weeks ended 30 January 1999, 29 January 2000, the 52 weeks ended 27 January 2001, the 53 weeks ended 2 February 2002, the 52 weeks ended 1 February 2003, the 52 weeks ended 31 January 2004 and the 52 weeks ending 3129 January 2004.2005.
This Annual Report contains translations of certain pound sterling amounts into US dollars at a rate of $1.64$1.82 = £1.00,£1, which was the noon buying rate in New York City for cable transfers in pounds sterling as certified for customs purposes by the Federal Reserve Bank of New York (the “Noon Buying Rate”) on 3130 January 2003.These2004. These translations should not be construed as representations that the pound sterling amounts actually represent such US dollar amounts or could be converted into US dollars at the rate indicated. On 2624 March 20032004 the Noon Buying Rate was $1.57$1.84 = £1.00.£1.
Cautionary statement regarding forward-looking statements
The Company desires to take advantage of the “safe harbor” provisions of the United States Private Securities Litigation Reform Act of 1995 with respect to the forward-looking statements about its financial performance and objectives in this Annual Report. Readers are referred to “Risk and other factors” on pages 2829 to 32.33.
Contents
Signet Group plc 1
| Signet Group plc Annual Report & Accounts year ended 31 January 2004 | 1 |
Chairman’s statement
Results
Group results
In the 52 weeksyear to 1 February 200331 January 2004 the Group built furthercontinued to build on theits well established growth trend of the last eight years.
Profitrecord. On a reported basis profit before tax rose to £199.7£211.9 million compared to £182.8(2002/03: £199.9 million in the 53 week period last year. This represented a 16.2%restated for FRS 17 – ‘Retirement Benefits’) reflecting an underlying increase on a comparable 52 week basisof 13.0% at constant exchange rates. Earnings per share rosewere 8.0p (2002/03: 7.5p restated), up 6.7% on a reported basis and 12.7% at constant exchange rates. Like for like sales advanced by 4.9% with total sales at £1,617.2 million (2002/03: £1,608.0 million), up 7.3% at constant exchange rates.
The strong underlying performance of the Group and the proven success of its strategies should not be obscured by the effect of the significant weakening in the average US dollar exchange rate from 7.1p$1.53/£1 to 7.5p,$1.68/£1. This adversely impacted the tax rate having increasedtranslation of the US division’s sales and operating profit into pounds sterling, thereby depressing Group results as anticipated from 34.5% to 35.5%. Likereported.
In 2003/04 the US started well with a strong performance during the Valentine’s Day period. However trading during the rest of the first half was adversely affected by the Iraq War. The second half year saw a marked improvement in the retail environment culminating in a particularly strong outcome in the fourth quarter, when like for like sales rose by 5.3%7.2%. The division again outperformed the speciality jewellery sector and totalgained further market share.
The UK business similarly had a good start to the year but was also affected by the geo-political situation in the first half. The division consistently outperformed the general retail sector and enjoyed an excellent Christmas season when like for like sales grewincreased by 6.7%. Ernest Jones continued to £1,608.0outperform with like for like sales for the year up 8.4%.
The Group invested £109.8 million (2001/02 53 weeks: £1,578.1in fixed and working capital during the year. The cash inflow was £42.7 million (2002/03: £33.7 million), a 7.9% increase on a comparable 52 week basis at constant exchange rates.
Net and net debt was reducedfell to £140.1£79.9 million at the year end (2(1 February 2002: £201.72003: £140.1 million), £27.9. £17.5 million of the improvement beingwas accounted for by exchange rate movement.translation. Gearing fell(net debt to 20.1% (2shareholders’ funds) at 31 January 2004 was 11.0% (1 February 2002: 29.7%)2003: 20.7% restated). Interest cover (operating profit divided by net interest cost) was a very comfortable 13.1 times.
Overall these were strong results given comparison with a 53 week period, a weaker US dollar and a softening in the trading environment on both sides of the Atlantic in the last quarter.Dividend
The US business did extremely well in a challenging retail market. The division continued to implement its proven strategy and again outperformed the speciality jewellery sector.
The UK division also had a very encouraging outcome. Like for like sales growth again exceeded that of the general retail market, with Ernest Jones achieving a particularly good result.
PeopleI would again like to thank all management and staff on both sides of the Atlantic for their hard work and professionalism which has contributed to the further progress of the Group during the year.
I am pleased to welcome Russell Walls to the Board. He joined the Group as a non-executive director in August 2002 and will chair the Audit Committee from 1 April 2003.
Ian Dahl resigned from the Board and from his position as Chief Executive of the UK jewellery division with effect from 30 September 2002. The Board thanks him for his contribution to the Group during his period of office.
Richard Miller, Chief Financial Officer of the US division, who has been with the Group for 21 years and has been an alternate director since 1994, will be retiring in April 2003. The Board expresses its appreciation for his contribution to the Group.
Dividend
The Board is pleased to recommend a 20%20.0% increase in the final dividend to 1.80p2.16p per share (2001/02: 1.50p)(2002/03: 1.80p), the total for the year being 2.110p2.501p per share (2001/02: 1.789p)(2002/03: 2.11p). See note 8 regarding dividends to US holders of ordinary shares and ADSs. The full year dividend cover wasis 3.2 times (2002/03: 3.6 times (2001/02: 3.9 times).
Future dividend policy will continue to take into account of earnings, cash flow, gearing and the needs of the business.
People
I would like to thank management and staff for their invaluable contribution to the Group’s success during the past year.
Dale Hilpert joined the Group as a non-executive director in September 2003 and was appointed to the Audit Committee in January 2004. He has wide experience of US retailing and I am sure will make a significant contribution.
Lee Abraham, who joined the Group in 1994 as a non-executive director, retired in January 2004. On behalf of the Board I thank him for his invaluable contribution during his tenure of office and wish him a long and happy retirement.
Current tradingOverall the
The Group has had a generally satisfactoryvery encouraging start to the year. Bothcurrent year, including a particularly strong performance over the Valentine’s Day period. However account must be taken of soft sales comparatives in the early part of last year and the present weakness of the US and the UK businesses had strong Valentine’s Day performances. Subsequent trading has been affected by inclement weather in the US, the timing of Easter and the geopolitical situation.dollar.


James McAdam, Chairman,Chairman2624 March 20032004
2 Signet Group plc
| 2 | Signet Group plc Annual Report & Accounts year ended 31 January 2004 |
Group Chief Executive’s review
IntroductionGroup like for like sales increased by 5.3%, with both the US and UK businesses exceeding the performance of the general retail sector in their respective markets.
Group operating profit rose to £216.2£222.3 million from £200.7£213.9 million (restated), an increase of 7.7% (14.8% on a comparable 52 week basis11.2% at constant exchange rates).Therates (3.9% on a reported basis). The operating margin increased to 13.4% (2001/02: 12.7%)13.7% (2002/03: 13.3% restated), and the return on capital employed (“ROCE”) increased to 23.8% (2001/02: 23.3%)was 24.8% (2002/03: 24.1% restated). The year saw a further strengthening of the balance sheet after investment in fixed and working capital of £121.3 million.
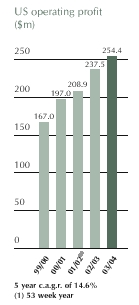
The US business continued to build on its competitive strengths in a fluctuating and uncertain trading environment. Operating profit rose from £145.1 million to £155.2 million, an increase of 7.0% (15.6% increase on a 52 week basis atAt constant exchange rates). Consolidation within the US speciality jewellery sector continues andrates the US division’s share ofoperating profit rose 7.1% but, on a reported basis, the speciality market is estimatedweaker US dollar resulted in a 2.4% decline to have risen over£151.4 million (2002/03: £155.2 million). The compound annual growth in reported operating profit during the last five years has been 14.3%. The continued introduction of well tested initiatives in all areas has enabled the business to circa 6.7% from circa 4.7%build further on its competitive strengths.
In 2003/04 like for like sales rose by 4.6% and total dollar sales by 8.0%. LikeOver the last five years like for like sales have risenincreased at a compound annual growth rate of 6.6%5.5% and total dollar sales by 12.1%. Underpinning this has been the strong performance by both mall stores and Jared, the Group’s off-mall destination concept which now accounts for over 15% of the same period. During last year 6% was addedUS division’s sales. Jared is still relatively immature and should make an increasing contribution to sellingthe like for like sales growth in the future.
Selling space with the increasehas increased over the last five years by some 66% (including the acquisition of 137 Marks & Morgan stores in 2000/01), with just over half accounted for by Jared. In 2003/04 space rose by 7%. This year growth is expected to be some 8%, the majority again being some 64%. A core objective of the US businessattributed to Jared. The longer term target is for space to increase selling space by 6% – 8% per annum the majorityand this would result in an approximate doubling of this being related to expansionUS space over a ten year period.
The US division’s market share of the speciality jewellery sector has increased to some 7.0% (2002/03: circa 6.9%) and there are further opportunities for growth. Supply chain efficiencies continue to be identified enabling the division to offer consumers better value than that provided by our main competitors. Training and motivation of staff remain central to achieving superior customer service and therefore resources devoted to staff development continue to be increased. Kay national television advertising continues to be increased and within two years Jared concept. Inis expected to have sufficient scale to use this medium. Increasing like for like sales and additional space will provide the longer term the potential is for over 200 Jared stores generating sales of over $1 billion. Space growth and improved store productivity should contribute furtheropportunity to leveraging ofleverage both central overhead costs and marketing expenditure. Continued enhancement of customer service is another key aim. It is planned to achieve this throughexpenditure, benefiting results as well as reinforcing the implementation of leading edge operating systems and procedures, which should result in staff spending less time on administrative functions. New merchandising initiatives, including branding programmes, continue to be identified, tested and developed. A continued shift to broadcast advertising is increasing brand name awareness and driving footfall.division’s competitive position.
The UK business took a further significant step forwardachieved an increase of 18.4% in its strategy to increase store productivityoperating profit and make existing space work harder. Operating profit rose by 10.4% (13.2% on a comparable 52 week basis). Like5.5% in like for like sales in the year increased by 5.2%, the compound annual growth rate oversales. Over the last five years being 5.3%. Average
compound annual growth in operating profit was 19.9% and 6.7% in like for like sales.
The UK strategy of driving sales per store duringby increasing the same period increased from £589,000average transaction value, predominantly through greater diamond participation continues to £747,000. The drive to gain market share in diamonds, which is a core objectiveprove successful. Diamond jewellery now accounts for 26% of the division’s sales mix compared with 18% in 1998/99. During that period diamond sales grew 50% faster than the UK diamond market. Further major initiatives to support this strategy are at an early stage of implementation. When developing such initiatives the UK business benefits from its ability to draw on the US division’s best practices particularly in the selling of diamonds. For example the new store format, which is based on US experience, enables greater interaction between the salesperson and the customer. The concept was implemented in a further 35 locations (24 H.Samuel and 11 Ernest Jones) in 2003/04, bringing the total to just under 10% of the portfolio. The performance of the refurbished stores continues to show considerable success.The compound annual growth ratebe encouraging and the increase in diamond sales is significant. It is intended to roll out the new design across the store base as part of the diamond category over the last fivenormal investment cycle.
years was 14.4% per annum, a peformance which was considerably ahead of the 8.9% recorded by the overall diamond market. A range of initiatives being implemented in merchandising, store operations, marketing and real estate will continue to assist the business in achieving its strategic targets, as will the continuing transfer of best practise from the US division.
Signet is committed to managing the social, ethical and environmental risks and responsibilities facing the Group. In 2002/03 the focus was on developing an environmental policy, reviewing the environmental management systems and implementing the Kimberley Process, which regulates the trade in rough diamonds. See pages 97 to 99 for a report on these matters.
US (71%(69% of Group sales)
Details of the US division’s performance are set out below:
| Like | ||||||||||||
| for like | ||||||||||||
| 2002/03 | 2001/02 | Change | change | |||||||||
| £m | £m | % | % | |||||||||
| Sales | 1,134.4 | 1,126.0 | +0.7 | (1) | +5.4 | |||||||
| Operating profit | 155.2 | 145.1 | +7.0 | (2) | ||||||||
| Operating margin % | 13.7 | % | 12.9 | % | ||||||||
| ROCE % | 21.5 | % | 20.4 | % | ||||||||
| 2003/04 | 2002/03 | Change | Like for like change | |||||||
| £m | £m | % | % | |||||||
| Sales | 1,116.2 | 1,134.4 | -1.6 | (1) | +4.6 | |||||
| Operating profit | 151.4 | 155.2 | -2.4 | (2) | ||||||
| Operating margin | 13.6 | % | 13.7 | % | ||||||
| ROCE | 20.5 | % | 21.5 | % | ||||||
| (1) | ||
| (2) |
Costs, gross margin and inventories remained under tight control. Significant benefits were obtained from a number of management initiatives, including the development of the Leo Diamond®and three-stone diamond jewellery ranges, increased levels of staff training, expansion of television advertising and continued investment in real estate.
The increase in operating margin and ROCE reflectedwas broadly in line with last year, reflecting leverage fromof like for like sales growth which more than offsethas largely compensated for the adverse impact of an increase in immature store space.space and the slightly lower gross margin. The gross margin rate was slightly down on last year’s level due tomovement reflects the impact of the anticipated changes in sales mix. Themix and the increase in the pricegold prices offset by a range of gold bullion had limited effect on the year but could have greater impactmanagement initiatives. A similar movement in the current year.gross margin is anticipated in 2004/05. The proportion of sales through the in-house credit card decreased towas broadly similar at 49.3% (2002/03: 49.5% (2001/02: 50.4%).The. The bad debt charge was at the bottom of the range of the last sixeight years at 3.0%2.8% of total sales (2001/02: 3.2%(2002/03: 3.0%).This was before.
The quality of customer service continued to be a $2.2 million one-off benefitcritical factor behind the strong performance, particularly in the fourth quarter. The number of staff benefiting from the better than anticipated performance of the residue of the acquired Marks & Morgan receivables portfolio.central training programmes increased, and in-store training was also expanded.
Signet Group plc 3
| Signet Group plc Annual Report & Accounts year ended 31 January 2004 | 3 |
Group Chief Executive’s review (continued)
Increased staff productivity was achieved through the merchandisemulti-year programme aimed at reducing and simplifying in-store administrative functions.
In mall stores the successful development of major merchandising programmes manysuch as the Leo Diamond® range, three-stone jewellery and solitaire diamonds continued; new initiatives included the “right hand ring” and fashion products featuring gold and multi-colour gemstones; all these will be further expanded in 2004/05. In Jared the development of which have been developed and tested over a number of years. An example was the Leo Diamond range whereand luxury watches including Rolex, Tag Heuer and Omega continued to prove successful; new product tests of branded and designer merchandise such as Hearts On Fire Diamonds and Scott Kay jewellery were encouraging. The Leo Diamond is exclusive to Signet in both the GroupUS and the UK. It has exclusive rights. Leo Diamonds have morea patented cut resulting in greater brilliance than normallya conventionally cut stonesdiamond of similar sizeequal quality. The capability to direct source loose diamonds and quality.The range was first tested in Jared stores during Christmas 2000, rolled out to 300 mall stores in 2001, and by Christmas 2002 it was in allutilise contract manufacturing for some 55% of the division’s stores.Three-stone diamond jewellery merchandise is another exampleremains a significant competitive advantage across the division. Initiatives to increase further the efficiency of a range that has been successfully developed over a number of years.
Staff training was undertaken at a record level in 2002/03, with emphasis on improving product knowledge and selling skills. A longer term programme has also been introduced to reduce and simplify administrative functions carried out in the stores, thereby allowing sales staff more time to serve customers. This programme has already contributed some improvement in stock losses.supply chain are being explored.
Marketing events and promotional activity proved to be particularly successful during critical selling periods such as Valentine’s Day, Mother’s Day and Christmas. BroadcastTelevision advertising was further extendedexpanded and Kay television advertising impressions were increased by 16%7% over the Christmas period.The romanceperiod, with the Leo Diamond range featured strongly. Both research and appreciation basedcustomer feedback about the advertising theme, “Every kiss begins with Kay”, once more proved successfulcontinued to be very positive. Television advertising for Jared was expanded from ten markets to 22 markets, covering about 75% of its sales, and this was reflected in heightening name recognition.the strong sales performance. The Leo Diamond was featured strongly in this advertising.The annual gross marketing spend amounted to 6.4% of sales (2001/02: 6.3%(2002/03: 6.4%), the increase reflecting growth in the number of Jared stores where the advertising spend is higher than for mall stores..
Jared now has sales of over $250$300 million and its like for like sales performance was significantly aheada portfolio of that of the rest of the division.The79 stores, equivalent in space terms to about 340 mall stores. The Jared concept is the primary vehicle for US space growth and in the period a further 12 stores were opened. The chain is still relatively immature with some 45% of stores opened bringingin the total up to 67 suchlast 30 months. The 15 Jared stores that have reached maturity in aggregate achieved the target level of sales and store contribution (set at the endtime of the period. Jared television advertising was expanded from three marketsinvestment) in 2001 to ten markets over Christmas 2002 and will be developed further in 2003. An initiativetheir fifth year of trading. During 2004/05 it is intended to increase salesthe level of luxury watchescentral support so that openings in Jaredfuture years can be increased to 15 – 20 stores was also launched.per annum.
In 2002/032003/04 total fixed and working capital investment in the US business was £33.1$138.3 million (2001/02: £41.0 million, £38.6 million at constant exchange rates).The enhancement(2002/03: $146.6 million). The increase in space of 7% by the year end was as planned, including the trial of ten Kay stores in off-mall locations. This test showed some encouraging results and expansionwill be extended to ten additional sites in 2004/05. The programme of refurbishment and relocation further enhanced the quality of the real estate portfolio continued, although at the lower end of the planned range.This reflected the tightened investment criteria in place to take account of the uncertain trading environment.store portfolio.
The change in store numbers by chain is shown in the following table:
Total | Kay | Regional | Jared | |||||||
| 2 February 2002 | 1,025 | 667 | 303 | 55 | ||||||
| Openings | 48 | 22 | 14 | 12 | ||||||
| Closures | (23 | ) | (13 | ) | (10 | ) | – | |||
| 1 February 2003 | 1,050 | 676 | 307 | 67 | ||||||
| Total | Kay | Regional | Jared | ||||||
| 1 February 2003 | 1,050 | 676 | 307 | 67 | |||||
| Openings | 69 | 49 | (1) | 8 | 12 | ||||
| Closures | (16 | ) | (8 | ) | (8 | ) | – | ||
| 31 January 2004 | 1,103 | 717 | (1) | 307 | 79 | ||||
| (1) | Includes ten off-mall stores. |
In 2003/042004/05 it is planned to refurbishcontinue with the consistent programme of real estate investment, with the refurbishment or relocaterelocation of approximately 90 stores and toan increase in selling space by circa 7%of about 8%. A further 1215 new Jared stores shouldare expected to account for some 65%two-thirds of the increase, the remainder comprising up to 3025 net mall store openings and a trial of up to 10the additional ten Kay stores in outdoor centres.off-mall locations. Total US capital expenditure is expected to be some $80 – $85 million in 2004/05.
UK (29%(31% of Group sales)
Details of the UK division’s performance are set out below:
Like | ||||||||||
for like | ||||||||||
2002/03 | 2001/02 | Change | change | |||||||
£m | £m | % | % | |||||||
| Sales | ||||||||||
| H.Samuel | 279.1 | 277.3 | +0.6 | +2.6 | ||||||
| Ernest Jones | 188.0 | 168.5 | +11.6 | +9.4 | ||||||
| Other | 6.5 | 6.3 | ||||||||
| Total | 473.6 | 452.1 | +4.8 | (1) | +5.2 | |||||
| Operating profit | 67.0 | 60.7 | +10.4 | (2) | ||||||
| Operating margin % | 14.1 | % | 13.4 | % | ||||||
| ROCE % | 38.0 | % | 39.4 | % | ||||||
| 2003/04 | 2002/03(1) | Change | Like for like change | ||||||
| £m | £m | % | % | ||||||
| Sales | |||||||||
| H.Samuel | 285.8 | 279.1 | +2.4 | +3.5 | |||||
| Ernest Jones | 209.4 | 188.0 | +11.4 | +8.4 | |||||
| Other | 5.8 | 6.5 | |||||||
| Total | 501.0 | 473.6 | +5.8 | +5.5 | |||||
| Operating profit | 76.6 | 64.7 | +18.4 | ||||||
| Operating margin | 15.3 | % | 13.7 | % | |||||
| ROCE | 47.1 | % | 41.2 | % | |||||
The strategy to improve store productivity by increasing the average transaction value again proved successful, despite an increasingly challenging trading environment. Benefit was gained from a range of management initiatives.The initial phase of a trial of new store designs was expanded.
The gross margin rate was slightly ahead of last year. Increasedyear, which together with increased store productivity contributed to the improved operating margin while the decrease in ROCE reflected the benefit of the 53rd week in 2001/02 and higher investment in diamond inventory.ROCE. H.Samuel average sales per store rose by 1.5%4.4% to £677,000 (2001/02: £667,000)£707,000 (2002/03: £677,000) and Ernest Jones (including Leslie Davis) by 12.1%6.9% to £1,030,000 (2001/02: £919,000)£1,101,000 (2002/03: £1,030,000).
4 Signet Group plc
The average retail price of items sold increased by 6.5%6.4% to £33 (2001/02: £31)£35.00 (2002/03: £32.91) in H.Samuel and by 9.2%6.9% to £130 (2001/02: £119)£139.24 (2002/03: £130.27) in Ernest Jones. Diamond assortments were further enhanced, withenhanced; three-stone jewellery performed well, the Leo Diamond range being rolled outwas expanded in Ernest Jones and the number of H.Samuel’s stores stocking the Forever Diamonds range being tested in H.Samuel.Diamond increased from 50 to 120. Diamond sales again achievedcontinued to achieve an above average increase and outpaced the growth in the UK diamond market; they now account for 25%26% of the division’s sales mix (18%
| 4 | Signet Group plc Annual Report & Accounts year ended 31 January 2004 |
(19% in H.Samuel and 35%36% in Ernest Jones). This represents a significantan increase on five years agoin diamond sales of nearly 100% since 1998/99 when diamonds accounted for 16%the present strategy was launched.
The quality of the mix (14% in H.Samuel and 28% in Ernest Jones).
Staff training remains a priority, with focus on improving product knowledge, particularly in respect of diamonds. During the year increased training support was given to store managers and a more structured training programme introduced. Progress in improving customer service, wasas monitored throughby a mystery shopper programme.programme, continues to improve and is critical to success in selling diamonds. Training systems were further improved with the implementation of a progressive multi-year programme which has drawn on the experience of the US division and nearly all UK staff were involved in this programme in 2003/04. Further steps were taken to simplify and reduce administrative tasks being carried out in the stores.
In 2002/03 new store formats wereAdditional improvements took place in the design and distribution of catalogues. While they presently remain the major marketing support, television advertising was tested in 17 locations (15for both H.Samuel and 2 Ernest Jones).The new designs enable improved interaction with the customerJones and better presentation of the diamond range by replacing the formerwill be further developed in 2004/05.
In 2003/04 the trial will be extended, with the planned newtotal fixed and refurbished stores utilising the new formats.
Fixedworking capital investment principally in the store portfolio, amounted to £16.4UK business was £27.5 million (2001/02: £18.8(2002/03: £25.5 million). Four newErnest Jones saw five openings and 11 H.Samuel stores were opened and eight closed. Ernest Jones saw eight openings and no closures. At the year end there were 610604 stores (418(407 H.Samuel and 192197 Ernest Jones). In total 42A similar pattern of store openings and closures is planned for 2004/05. It is intended to refurbish up to 80 stores were refurbished in the period compared with 93 in 2001/02. Capital expenditure was atnew store format during 2004/05, and a similar levelnumber the following year. Primarily as a result of the increased programme of refurbishment, total capital expenditure in the UK is expected to last year as more large key stores were refurbished, including 13 under the new format. Some 32 further stores are scheduled for refurbishmentincrease from £18 million to some £30 – £35 million in 2003/04.2004/05.

![]()
Terry Burman,
Group Chief Executive,2624 March 20032004
Signet Group plc 5
| Signet Group plc Annual Report & Accounts year ended 31 January 2004 | 5 |
2002/03 | 2002/03(1) | 2001/02(2) | 2000/01 | 1999/00 | 1998/99 | ||||||||||
£m | $m | £m | £m | £m | £m | ||||||||||
| Sales | 1,608.0 | 2,637.1 | 1,578.1 | 1,387.3 | 1,136.5 | 991.2 | |||||||||
| Operating profit | 216.2 | 354.6 | 200.7 | 178.7 | 139.1 | 102.3 | |||||||||
| Net interest payable | (16.5 | ) | (27.1 | ) | (17.9 | ) | (15.9 | ) | (11.4 | ) | (13.1 | ) | |||
| Profit before tax | 199.7 | 327.5 | 182.8 | 162.8 | 127.7 | 89.2 | |||||||||
| Taxation | (70.8 | ) | (116.1 | ) | (63.1 | ) | (52.1 | ) | (38.3 | ) | (24.0 | ) | |||
| Profit for the period | 128.9 | 211.4 | 119.7 | 110.7 | 89.4 | 65.2 | |||||||||
| Earnings per share(3) | 7.5p | $0.12 | 7.1p | 6.6p | 5.3p | 3.9p | |||||||||
| Dividend per share | 2.110p | $0.0346 | 1.789p | 1.625p | 1.450p | 1.000p | |||||||||
| Capital expenditure | 49.5 | 81.2 | 59.8 | 56.2 | 39.3 | 30.9 | |||||||||
| Investment in fixed and working capital | 121.3 | 198.9 | 108.1 | 132.0 | 83.2 | 56.9 | |||||||||
| Depreciation and amortisation | 37.8 | 62.0 | 34.7 | 30.6 | 27.8 | 27.6 | |||||||||
| Net debt | 140.1 | 229.8 | 201.7 | 229.1 | 91.6 | 111.5 | |||||||||
| Shareholders’ funds (as restated)(4) | 696.5 | 1,142.3 | 679.7 | 565.4 | 448.3 | 379.6 | |||||||||
| Gearing(3) | 20.1% | 29.7% | 40.5% | 20.4% | 29.4% | ||||||||||
| Return on capital employed(3) | 23.8% | 23.3% | 25.2% | 24.1% | 19.5% | ||||||||||
| Store numbers (at end of period): | |||||||||||||||
| US | 1,050 | 1,025 | 999 | 827 | 788 | ||||||||||
| UK | 610 | 606 | 605 | 606 | 606 | ||||||||||
| Percentage increase/(decrease) | |||||||||||||||
| in like for like sales: | |||||||||||||||
| US | 5% | 1% | 6% | 11% | 10% | ||||||||||
| UK | 5% | 9% | 9% | 5% | (1)% | ||||||||||
| Average sales per store (000’s):(5) | |||||||||||||||
| US | 1,088 | 1,665 | 1,125 | 1,117 | 939 | 823 | |||||||||
| UK | 747 | 1,143 | 735 | 665 | 613 | 580 | |||||||||
| Number of employees | |||||||||||||||
| (full-time equivalents) | 14,160 | 13,525 | 12,520 | 11,450 | 10,919 | ||||||||||
Five year financial summary
| 2003/04 | 2003/04 | (1) | 2002/03 | 2001/02 | 2000/01 | 1999/00 | |||||||
| as restated | (2) | as restated | (2)(3) | as restated | (2)(4) | as restated | (2)(4) | ||||||
| £m | $m | £m | £m | £m | £m | ||||||||
| Sales | 1,617.2 | 2,943.3 | 1,608.0 | 1,578.1 | 1,387.3 | 1,136.5 | |||||||
| Operating profit | 222.3 | 404.6 | 213.9 | 198.8 | 176.8 | 137.3 | |||||||
| Net interest payable | (10.4 | ) | (18.9 | ) | (14.0 | ) | (15.0 | ) | (12.7 | ) | (8.7 | ) | |
| Profit before tax | 211.9 | 385.7 | 199.9 | 183.8 | 164.1 | 128.6 | |||||||
| Taxation | (74.7 | ) | (136.0 | ) | (70.8 | ) | (63.4 | ) | (52.5 | ) | (38.6 | ) | |
| Profit for the period | 137.2 | 249.7 | 129.1 | 120.4 | 111.6 | 90.0 | |||||||
| Earnings per share(5) | 8.0p | $0.15 | 7.5p | 7.1p | 6.7p | 5.4p | |||||||
| Dividend per share (£) | 2.501p | 2.110p | 1.789p | 1.625p | 1.450p | ||||||||
| Dividend per share ($) | $0.0420 | $0.0323 | $0.0258 | $0.0242 | $0.0235 | ||||||||
| Capital expenditure | 50.9 | 92.6 | 49.5 | 59.8 | 56.2 | 39.3 | |||||||
| Investment in fixed and working capital | 109.8 | 199.8 | 121.3 | 108.1 | 132.0 | 83.2 | |||||||
| Depreciation and amortisation | 40.4 | 73.5 | 37.8 | 34.7 | 30.6 | 27.8 | |||||||
| Net debt | 79.9 | 145.4 | 140.1 | 201.7 | 229.1 | 91.6 | |||||||
| Shareholders’ funds | 727.6 | 1,324.2 | 678.4 | 683.7 | 583.0 | 470.4 | |||||||
| Shares in issue(million) | 1,726.2 | 1,713.8 | 1,706.0 | 1,685.7 | 1,679.9 | ||||||||
| Gearing(5) | 11.0% | 20.7% | 29.5% | 39.3% | 19.5% | ||||||||
| Return on capital employed(5) | 24.8% | 24.1% | 23.6% | 25.7% | 24.6% | ||||||||
| Store numbers (at end of period): | |||||||||||||
| US | 1,103 | 1,050 | 1,025 | 999 | 827 | ||||||||
| UK | 604 | 610 | 606 | 605 | 606 | ||||||||
| Percentage increase in like for like sales: | |||||||||||||
| US | 5% | 5% | 1% | 6% | 11% | ||||||||
| UK | 6% | 5% | 9% | 9% | 5% | ||||||||
| Average sales per store (£’000s)(6): | |||||||||||||
| US | 1,040 | 1,088 | 1,125 | 1,117 | 939 | ||||||||
| UK | 824 | 747 | 735 | 665 | 613 | ||||||||
| Number of employees | |||||||||||||
| (full-time equivalents) | 14,502 | 14,160 | 13,525 | 12,520 | 11,450 | ||||||||
| (1) | Amounts in pounds sterling are translated into US dollars solely for the convenience of the reader, at a rate of £1.00 to |
| (2) | During 2003/04 the Group adopted FRS17 – ‘Retirement Benefits’. The adoption of the standard resulted in a prior year adjustment (see note 17 on page 75). |
| (3) | 53 week |
| During 2001/02 the Group adopted FRS19 – ‘Deferred Tax’. The adoption of the standard resulted in a prior year adjustment (see note 17 on page 75). | |
| (5) | Earnings per share, gearing and return on capital employed are defined on |
| Including only stores operated for the full financial period. |
The financial data included in the Five year financial summary above has been derived, in part, from the consolidated accounts for such periods included elsewhere in this Annual Report.TheReport. The financial data should be read in conjunction with the accounts, including the notes thereto, and the Financial review included on pages 2221 to 27.28.
Further selected financial data is shown on pages 107115 and 108.The116. The accounts of the Group have been prepared in accordance with UK GAAP, which differ in certain respects from US GAAP. See pages 8894 to 96102 for information on the material differences between UK GAAP and US GAAP that affect the Group’s profit and shareholders’ funds.
| 6 | Signet Group plc Annual Report & Accounts year ended 31 January 2004 |
US operating review
OverviewSignetSignet’s US division is the second largest US speciality retail jeweller in the United States with an approximate market share of 6.7%, operating 1,050 stores in 45 states at 1 February 2003. In 2002/03 total7.0%. Total US sales in the year to 31 January 2004 were $1,736$1,875 million (2001/02: $1,621(2002/03: $1,736 million). At the year end the Group operated 983division had 1,103 stores comprising 1,014 mall jewellery stores and 67as well as 79 destination superstores and ten stores being trialled in off-mall shopping centres. Its mall stores trade nationwide as Kay Jewelers (“Kay”), and regionally under a number of well established and recognised names.Thenames. The destination superstores trade as Jared The Galleria Of Jewelry (“Jared”), the nation’s largest and fastest growing chain of off-mall destination jewellery stores.
In the mediumlonger term it is planned to grow like for like sales, and to increase US space by about 6% to– 8% per annum, and to grow like for like sales, with Jared accounting for a majority of the planned space growth.

Competitive advantages
Management attributes its consistentthe division’s success in the US speciality retail jewellery retail market to a range of competitive advantages in merchandising, store operations, marketing and real estate.Theseestate. These are reflected in the US division’s average sales per store and operating profit margin, both of which are substantially higher than that of other quoted mid-market mallmall-based speciality retail jewellers operating stores of similar size. The principal competitive advantages are summarised below, and all are explained in greater detail on pages 8 to 13.
| • | Merchandising |
| Management believes that in comparison to its competitors Signet has greater capacity and expertise to direct source | |
• Merchandising
diamonds (i.e. to purchase loose polished diamonds which are supplied to contract manufacturers who produce finished merchandise), and this facility allows the Group to provide superior value and quality to the consumer. Diamond jewellery accounts for approximately 70% of total annual merchandise sales. The division’s sophisticated merchandising systems track, forecast and respond to consumer preferences and provide competitive advantage by ensuring high in-stock positions of key merchandise assortments and fast-movingfaster moving items. It is
• Store operations
The salesperson’s
| • | Store operations |
| The sales associate’s ability to communicate and explain the value and quality of the merchandise plays a significant part in a retail jewellery purchase. Therefore, the US division has developed specialised training for its retail personnel, and its size provides leverage of training resources and systems. | |
| • | Marketing |
| Kay is one of a very limited number of US speciality retail jewellery brands with a presence large enough to justify national network television advertising, the most cost effective way to attract customers, enter new markets and increase brand recognition. | |
Following successful trials in 2002/03, the number of Jared TV markets during Christmas 2003 was doubled, from ten markets covering about 35% of the merchandise plays a significant part in a diamond sale.Therefore, the US division has developed specialised training for itschain’s sales associates, and its size allows it to leverage training resources and systems.
• Marketing
Kay is one of only two US speciality jewellery retail brands with a nationwide presence large enough to justify national network television advertising, the most cost effective way to attract customers and increase brand recognition.
• Real estate
Strict criteria are followed when evaluating real estate investment and management believes that the quality22 markets supporting about 75% of its sales.
| • | Real estate |
| Strict criteria are followed when evaluating real estate investment, and management believes that the quality of its store portfolio is superior to that of its competitors. | |
Initiatives in 2003/04
Specific initiatives to that of its competitors.strengthen the Group’s competitive position included:
| • | expansion of the Leo Diamond range, |
| • | expansion of the Jared luxury watch range, |
| • | record level of training, |
| • | further development of systems for greater operational efficiency, |
| • | increased national TV advertising for Kay, |
| • | expansion of Jared TV advertising programme, |
| • | space increase of 7%, and |
| • | test of Kay off-mall store format. |
Market place
Total US jewellery sales, including watches and fashion jewellery, are estimated by the US Department of Commerce to have been $53
| Signet Group plc Annual Report & Accounts year ended 31 January 2004 | 7 |
US operating review (continued)
$54 billion in 2002 (2001:2003 (2002: $51 billion).
In the US total jewellery market sales and have risen at a compound annual growth rate of 6%5.8% over the last 20 years. In 20022003 the market grew by about 4%6%. Management believes that the primary driver ofmajor contributors to the relatively steady market growth in the market has beeninclude the bridal, fashion accessory and gift giving nature of the majority of US jewellery sales.sales to the middle mass market, with the bridal category including engagement rings, wedding rings and anniversary jewellery. Signet has an approximate 3.3%3.5% share of the total US jewellery market (including watches and fashion jewellery).market.
The US speciality retail market in which the division competes is approximately $26$27 billion (2001:(2002: $25 billion). Speciality retail jewellery sales have risen at a compound annual growth rate of 5.6%4.5% from 19971998 to 2002 (US Department2003 (see graph below), outperforming other comparable sectors, and over the last three more challenging years performing in line with the general retail sector. Over the same period Signet’s total US sales (excluding the acquisition of Commerce). Over a similar period total Signet US salesMarks & Morgan) rose at a compound annual growth rate of 12.8%10.3%. Signet has some 6.7%
Growth of the US speciality retail jewellery market.Retail Sales

Management believes that the longer term outlook for jewellery sales is encouraging due togiven the growth in disposable income and the increasing numbers of women in the work place and favourable demographics; the fastest growing segment of the US population is the 45 to 64 year olds, who have
spent more per capita on jewellery than any other segment over the years 1998 to 2002 (US Department of Commerce).force.
The US retail jewellery industry is very competitive and highly fragmented. Management believes that the five largest speciality jewellery retailers account for some 22.5%approximately 22% of speciality jewellery sales, and thesecollectively have gained market share over the past five years. This trend provides significant opportunity for the more competitive businesses in the sector, and it is believed
that Signet is well positioned to gain further market share. In the broader total US retail jewellery market Signet competes against other formats such as department stores, discount outlets, television home shopping and Internet shopping. Management believes that the business also competes with non-jewellery retailers for consumers’ discretionary dollar spend.spending.
The US division’s largest speciality jewellery competitor is Zale Corporation, which has a speciality market share of about 7.9%7.8%. Competition is also encountered from a limited number of large regional retail jewellery chains and smaller regional chains (those operating fewer than 100 stores) andas well as independent retail jewellery stores, which account for over 70% of the speciality market.

Store operations
Signet’s US stores offer a selection of jewellery lines at keypopular price points with an emphasis on fine diamonds,diamond jewellery, which account for some 69%70% of merchandise sales. In 2002/032003/04 the average retail price of all merchandise sold was approximately $267 (2001/02: $257)$288 (2002/03: $267).
Signet conducts its US retail operations through three marketing divisions: Kay, regional chains and Jared. Kay and the regional chains are primarilypredominantly located in regional and super-regional enclosed malls, with approximately 47%75% of the stores being in prime centre court locations.Thelocations. The average mall store contains approximately 1,1551,154 square feet of selling space and 1,4441,442 square feet of total space.Thespace. The design and appearance of stores is standardised within each chain.
Details of recent investment in the store portfolio are set out below:
| Number of stores | ||||||||
2002/03 | 2001/02 | 2000/01 | ||||||
| Store refurbishments | ||||||||
| and relocations | 71 | 91 | 99 | |||||
| New mall stores | 36 | 41 | 40 | |||||
| New Jared stores | 12 | 12 | 15 | |||||
| Fixed capital expenditure | £28m | £37m | £40m | |||||
| Total investment(1) | £63m | £68m | £72m | |||||
| Number of stores | |||||||
| 2003/04 | 2002/03 | 2001/02 | |||||
| Store refurbishments and relocations | 61 | 71 | 91 | ||||
| New mall stores | 47 | 36 | 41 | ||||
| New off-mall stores | |||||||
| – Jared stores | 12 | 12 | 12 | ||||
| – Kay off-mall stores | 10 | – | – | ||||
| Fixed capital expenditure | $42m | $38m | $51m | ||||
| Total investment(1) | $98m | $92m | $96m | ||||
| (1) Fixed and working capital investment in new space and refurbishments/relocations. | |||||||
Management believes that the US division’s prime real estate portfolio, together with its regular investment in mall store refurbishments and relocations, are competitive advantages that help build store traffic. Superior like for like sales growth is normally achieved for a number of years following such investment in a store.Theinvestment. The typical benefits from refurbishments, which
| 8 | Signet Group plc Annual Report & Accounts year ended 31 January 2004 |
normally occur on a ten year cycle, include an increase in linear footage of display cases positioned on the store frontage, improved lighting and better access to the store.
Criteria for investment in real estate remains stringent, reflecting the more difficult trading environment. For mallstringent. Signet seeks sites corner locations with high footfall in superior malls, are targeted.in particularly units located on busy centre court locations.
Jared locations are typically free-standing sites in “power strip” shopping complexes with high visibility and traffic flow, and positioned close to the street and often near a major mall. In addition, thehighway. The retail centres in which Jared stores operate normally contain strong retail co-tenancies,cotenancies, including other destination stores such as Borders Books, Best Buy, Home Depot,Toys “R” Us and Bed, Bath & Beyond. This type of shopping centre is known as a “power strip” mall.
In 2002/032003/04 there was a net increase in storeUS division total selling space of approximately 6%7%, a similar level toin line with the previoustarget of 6% – 8% growth per year.
8 Signet Group plc
In 2003/042004/05 it is planned to open up to 12about 15 Jared stores and up tostores. Some 45 mall stores, the majority of which will be Kay. In addition a trial ofKay in the enclosed mall format, and up to 10ten additional off-mall Kay stores in outdoor centres is planned.locations will
also be opened. Approximately 20 mall stores are planned for closure. PlannedThe programme should result in a net openings should increase in retail space by up to a further 7%of approximately 8% by the end of 2003/04. 2004/05.
Signet may consider selective purchases of mall stores that meet its acquisition criteria regarding location, quality of real estate, customer base and price.return on investment.
Kay
The expansion of Kay as a nationwide chain is an important element of the US growth strategy. Kay, with 676717 primarily mall stores in 4550 states at 131 January 2004 (1 February 2003 (2 February 2002: 6672003: 676 stores), is targeted at the middle income consumer. It is believed that in the longer term there is potential to expand the Kay chain by around 200 mall stores (net of closures). The average retail price of merchandise sold in the Kay chain during 2002/032003/04 was $242 (2001/02: $236). The$257 (2002/03: $242) and average sales per Kay store were $1,490,000 (2001/02: $1,430,000)$1,548,000 (2002/03: $1,490,000).
A test of Kay stores in off-mall shopping centres was commenced in 2003/04 with the opening of ten stores, and it is intended that a further ten will be opened in 2004/05. Kay stores in this format are expected to have a lower capital expenditure and lower
The following table sets out information concerning the US stores operated by Signet during the period indicated:
| 2003/04 | 2002/03 | 2001/02 | ||||
| Number of stores: | ||||||
| Total opened during the year(1) | 69 | 48 | 53 | |||
| Kay(2) | 49 | 22 | 29 | |||
| Regional chains | 8 | 14 | 12 | |||
| Jared | 12 | 12 | 12 | |||
| Total closed during the year | (16 | ) | (23 | ) | (27 | ) |
| Kay | (8 | ) | (13 | ) | (12 | ) |
| Regional chains | (8 | ) | (10 | ) | (15 | ) |
| Jared | – | – | – | |||
| Total open at the end of the year | 1,103 | 1,050 | 1,025 | |||
| Kay(2) | 717 | 676 | 667 | |||
| Regional chains | 307 | 307 | 303 | |||
| Jared | 79 | 67 | 55 | |||
| Increase in space | 7% | 6% | 6% | |||
| Percentage increase in like for like sales | 4.6% | 5.4% | 0.6% | |||
| Average sales per store in thousands (total)(3) | $1,747 | $1,665 | $1,597 | |||
| Average sales per store in thousands (excluding Jared)(3) | $1,549 | $1,511 | $1,475 | |||
| (1) | Figures for stores opened during the year are adjusted for the impact of conversions of format between Kay and regional chains. |
| (2) | Includes test of Kay stores in off-mall shopping centres. |
| (3) | Based upon stores operated for the full financial year. |
| Signet Group plc Annual Report & Accounts year ended 31 January 2004 | 9 |
US operating review (continued)
sales per store at maturity than that of the Kay chain average. Management believes that the off-mall Kay format may present a potential opportunity to grow the chain in new shopping centres that have not been considered previously.
Regional chainsIn order to increase market share in selected geographic areas Signet also operates US mall stores under a variety of established regional trade names:names (see Description of property, page 20). The leading brands include JB Robinson Jewelers, Marks & Morgan Jewelers Belden Jewelers, Friedlander’s Jewelers, Goodman Jewelers, LeRoy’s Jewelers, Osterman Jewelers, Roger’s Jewelers, Shaw’s Jewelers and WeisfieldBelden Jewelers. At 1 February 200331 January 2004 307 regional stores operated in 3031 states (2(1 February 2002: 3032003: 307 stores). The opening of new regional chain stores is considered if real estate satisfying the investment criteria becomes available in their respective trading areas.areas or in adjacent areas where marketing support can be cost effective. The average retail price of merchandise sold in the regional chains during 2002/032003/04 was $265 (2001/02: $263)
$281 (2002/03: $265). The average sales per store in the regional chains were $1,558,000 (2001/02: $1,575,000)$1,550,000 (2002/03: $1,558,000).
Jared
Jared is the leading off-mall destination speciality retail jewellery chain in its sector of the market. Its main competitors are independent operators, with the next largest chain having approximately one-third as many22 stores. If Jared waswere a
The following table sets out information concerning the US stores operated by Signet during the periods indicated:
| 2002/03 | 2001/02 | 2000/01 | ||||||||||
| Number of stores: | ||||||||||||
| Acquired during the year(1) | nil | nil | 137 | |||||||||
| Total opened during the year(2) | 48 | 53 | 55 | |||||||||
| Kay | 22 | 29 | 32 | |||||||||
| Regional chains | 14 | 12 | 8 | |||||||||
| Jared | 12 | 12 | 15 | |||||||||
| Total closed, or sold during the year(2) | (23 | ) | (27 | ) | (20 | ) | ||||||
| Kay | (13 | ) | (12 | ) | (5 | ) | ||||||
| Regional chains | (10 | ) | (15 | ) | (15 | ) | ||||||
| Jared | nil | nil | nil | |||||||||
| Total open at the end of the year | 1,050 | 1,025 | 999 | |||||||||
| Kay | 676 | 667 | 650 | |||||||||
| Regional chains | 307 | 303 | 306 | |||||||||
| Jared | 67 | 55 | 43 | |||||||||
| Increase in space | 6% | 6% | 26% | |||||||||
| Percentage increase in like for like sales | 5.4% | 0.6% | 5.9% | |||||||||
| Average sales per store in thousands (total)(3) | $1,665 | $1,597 | $1,631 | |||||||||
| Average sales per store in thousands (excluding Jared)(3) | $1,511 | $1,475 | $1,526 | |||||||||
Signet Group plc 9
stand-alone operation it would be the eighthseventh largest US speciality jewellery company by sales.
Jared targets an underserved sector at the upper end of the middle market. The customer profile is of a more mature, higher income customer than that of Signet’s US mall stores. An important advantage of a destination store is that the potential customer visits the store with the intention of making a jewellery purchase, whereas in thea mall there is a greater possibility of the intended spend being diverted.diverted to non-jewellery purchases.
EachThe following map shows the number and locations of Kay, regional and Jared is about five times the size, with five times the inventory of a Signet US mall store. stores at 31 January 2004:

| 10 | Signet Group plc Annual Report & Accounts year ended 31 January 2004 |
The typical Jared store ishas about 5,8004,700 square feet.feet of selling space and 5,900 square feet of total space. Its size permits significantly expanded product ranges and enhanced customer services, including in-store repair and custom design facilities. A private viewing room is available for customers when required. There are also complimentary refreshments and a children’s play area.
There were 6779 Jared stores at 131 January 2004 (1 February 2003 (2 February 2002: 552003: 67 stores).The. The average retail price of merchandise sold in Jared stores during 2002/032003/04 was $558 (2001/02: $522)$586 (2002/03: $558), which was more than double that of a Signet US mall store. The average sales per Jared store were $4,310,000 (2001/02: $4,284,000)$4,603,000 (2002/03: $4,310,000).
In the first five years of trading a Jared store is projected to have a faster rate of like for like sales growth than that of a mature mall store.store at maturity. At the end of this period the projected operating margin is expected to have risen to around that of the mature mall stores,store at maturity, with a greater return on capital employed. At 1 February 2003 about one quarter31 January 2004 some 45% of the Jared stores had been open for less than 1830 months and only seven15 had been open for more than five years.
Since the first Jared store opened in 1993, the concept has been continually evaluated, developed and refined. Management believes that the chain enjoys a number of competitive advantages, including benefit from the US division’s economies of scale such as leveraging the home officedivision’s established infrastructure, access to a pool of experienced store management, and availability of capital required to develop and grow the brand.
Management believes that the Jared concept has considerable growth potential and over 100 suitable markets have been identified for future expansion, with many of these markets able to support multiple locations. Accordingly, in the longer term, the chain has the potential to expand nationwide to over 200 stores, nationwide, generating annual sales of over $1 billion.
The following map showsbillion based on the number and locationscurrent performance of Kay, regional stores andexisting Jared stores at 1 February 2003:stores.

10 Signet Group plc
Management, personnel, training and incentives
A retail jewellery sale normally requires face-to-face interaction between the customer and the salesperson,sales associate, during which the items being considered are removed from the display cases and presented one at a time withwhile their qualities being described. It is believed that the quality of store sales staff with the necessary product knowledge to communicate the competitive value of the merchandise is criticalare explained to the success of the business. Furthermore, consumercustomer. Consumer surveys indicate that a key factor in the retail purchase of jewellery is the customer’s confidence in the salesperson.sales associate. In order to allow staff more time for selling and customer service, a series of “World Class Store Systems” initiatives were taken. These have resulted in further
improvements in special orders capabilities and upgrades to point of sale computers to enable improvements in store administration.
It is believed that highly trained store sales staff with the necessary product knowledge to communicate the competitive value of the merchandise are critical to the success of the business. The US division’s substantial training and incentive programmes for all levels of store staff are designed to play an important role in recruiting, educating and retaining qualified store staff. The preferred practice is to promote store managers district managers and regional vice-presidentsof all levels from within the organisation thereby helpingin order to maintain continuity and familiarity with store operations, sales training, selling methods and corporate culture.
Store personnel must complete basic training within 90 days of being employed.There are also in-house sales training seminars for all sales staff and classes for store managers. Supplementing the seminars are in-store computer based training and testing programmes, as well as role-playing workshops conducted to strengthen and reinforce selling skills.company practice.
Retail sales personnel are encouraged to achievebecome Certified Diamontologist statusDiamontologists by graduating from a comprehensive diamond correspondence course provided by the Diamond Council of America. Approximately 50%63% of full time sales staff who have completed their probationary period are Certified Diamontologists or are training to become certified. Employees often continue their professional development through completion of correspondence courses on gemstones.
The US division also devotes substantial resources to training its store managers, and conducts a number of management and career development programmes at its corporate headquarters.These programmes are tailored to address specialised areas such as the managing of high volume mall stores and Jared stores. Additional training is provided at the annual managers’ meeting.
All store personnel are required to meet daily performance standards and establish and commit to goals.The store information system provides a comparisongoals. After completion of actual performance with the previous day’s targets. Individual goals and performance are factored into promotion decisions.
Store employees who have completed basic training, sales staff are paid a commission based on their individual sales performance throughand on meeting monthly incentive programmes designed to promote customer service and operating efficiencies.The commission can increase significantly if the store as a whole achieves certain sales goals for the month.
In addition to sales-based incentives, bonuses based on the profitability of stores are paid to store managers. Bonuses paid to district managers are based on the achievement of certain objectives for the stores under their control, including sales and margin goals, operating cost control, profitability, training and compliance with loss prevention matters. Conteststargets. Sales contests and incentive programmes are frequently run whichalso reward achievement of specific goals with travel or additional cash awards. In 2002/03addition to sales based incentives, bonuses are paid to store managers and district managers based on the achievement of key performance objectives. In 2003/04 approximately 23% (2002/03: 22% (2001/02: 21%) of store personnel remuneration was incentive based.incentive-based.
Management believes that the retention and recruitment of highly qualified and well trainedwell-trained staff in the US divisional headquartershead office in Akron, Ohio are key factors inessential to supporting the storesstores. A comprehensive in-house curriculum supplements specific job training and sales staff.Training of home office personnel includes emphasis onemphasises the importance of the working partnership between stores and headquarters. A comprehensive in-house curriculum supplements specific job training and includes product knowledge, time management, performance management, diversity in the workplace and basic and advanced computer training.
Head office management receives in-house training in motivation, coaching and feedback, creative problem solving, communication, presentation skills and leadership. They may also participate in outside seminars provided by technical organisations or development specialists.
Part of allUS head office performance-based bonuses isare mainly based on the profitabilityperformance of the US division. Alldivision against predetermined annual profit targets. Promotion decisions for all non-management head office personnel must meet ser viceare based on performance against service level and production requirements, and performance against these goals is a significant factor in promotion decisions. Bonuses paid to home officegoals; for managers they are also based on profit targetsannual objectives and performance against individual job requirements.
| Signet Group plc Annual Report & Accounts year ended 31 January 2004 | 11 |
US operating review (continued)
Merchandising and purchasing
It is believed that the selection, availability and value for money of Signet’s merchandise are centralall factors that are critical to its success. The range of merchandise offered and the high level of stock availability are supported in the US business by extensive and continuous research and testing. Best-selling
Signet Group plc 11
products are identified and their rapid replenishment ensured with thoroughthrough analysis of product trials.Thistrials. This approach, along with the direct sourcing of loose polished diamonds, enables the division to deliver a focused assortment of merchandise to maximise sales, minimise discounting and accelerate inventory turn.
Sophisticated inventory management systems enablingfor merchandise testing, assortment planning, allocation and replenishment have been developed and implemented. A model inventory plan is in place for each store and is periodically reviewed and updated. Approximately 70%two-thirds of the merchandise is available for sale incommon to all the US division mall stores, with the remainder allocated to reflect demand in particular markets.
The inventory management team works closely with the marketing team to determine merchandise quantities for promotional events. It is believed that the merchandising and inventory management systems, as well as improvements in the productivity of the centralised distribution centre, have allowed the division to achieve inventory turns superiorcomparable to those of most of its quoted competitors. In 2002/03 the average cost of inventory ascompetitors although it has a percentage of annual sales increased to 36.8% (2001/02: 36.0%), reflecting the immaturity of recently added space.more immature store base.
Programmes have been developed in conjunction with certain vendors for the provision of branded jewellery merchandise. For example, the Leo Diamond range is sold exclusively by Signet in the US and the UK. This diamond has a patented cut resulting in greater brilliance than a conventional diamond of equal colour, clarity and weight, and comes with its own independent certification known as the “Return Of Light”.The Leo Diamond range became available in all US stores during the year, and was also expanded to include a broader selection of cuts and styles. Management believes that the US division’s merchandising process, market share and relationship with suppliers position the business as an ideal partner to launch new branding initiatives.
Other merchandising initiatives offer a distinctive product selection. For example, in Jared an opportunity to increase watch sales and thereby also attract additional customer traffic washas been identified. Therefore a major ongoing initiative has been taken to increase the number of Jared stores that stock premium watch brands, with particular emphasis onincluding Rolex,Tag Heuer, Omega and Omega.Tissot. Another example is the promotion of “right hand rings”, diamond fashion rings intended to be worn on the right hand rather than as bridal jewellery, which is traditionally worn on the left ring finger. De Beers specifically marketed this product in its nationwide print advertising throughout 2003/04, and is expected to continue to do so in 2004/05.
In 2002/032003/04 the bridal category accounted for approximately 43%44% of merchandise sold. This has been a category ofsold, continuing the steady growth in sales over the past fourfive years.
The table below sets out Signet’s US merchandise sales mix as a percentage of sales:
| Merchandise mix | |||||||||
| Percentage of sales | |||||||||
| 2002/03 | 2001/02 | 2000/01 | |||||||
| % | % | % | |||||||
| Diamonds | 69 | 67 | 66 | ||||||
| Gold jewellery | 8 | 10 | 11 | ||||||
| Gemstones | 10 | 10 | 11 | ||||||
| Watches | 6 | 6 | 7 | ||||||
| Repairs | 7 | 7 | 5 | ||||||
| 100 | 100 | 100 | |||||||
| Merchandise mix | |||||||
| Percentage of sales | |||||||
| 2003/04 | 2002/03 | 2001/02 | |||||
| % | % | % | |||||
| Diamonds and diamond jewellery | 70 | 69 | 67 | ||||
| Gold jewellery | 8 | 8 | 10 | ||||
| Gemstone jewellery | 10 | 10 | 10 | ||||
| Watches | 6 | 6 | 6 | ||||
| Repairs | 6 | 7 | 7 | ||||
| 100 | 100 | 100 | |||||
Approximately 55% of US diamond merchandise sold is acquiredsourced through contract manufacturing. Under this approach,manufacturing; Signet purchases loose polished diamonds on the world market and outsources the casting, assembly and finishing operations to third parties. It is believed that this approach results in a competitive cost and quality advantage. Contract casting and the setting of loose diamonds are generally utilised on basic items or programmes with proven non-volatile historical sales patterns that represent a lower risk of over or under purchasing. This purchasing strategy also allows the buyers to gain a detailed understanding of the manufacturing cost structure and improves the prospects of obtainingnegotiating better pricing for the supply of finished products.
Merchandise considered likely to have less predictable sales patterns is purchased complete as finished product. This strategy provides the opportunity to hold shelfreserve stock withheld by vendors and to make supplier returns or exchanges, thereby reducing the risk of over or under purchasing.
Merchandise held on consignment is used to enhance product selection and test new designs. This minimises exposure to changes in fashion trends and obsolescence whilst givingand provides the flexibility to return non-performing merchandise. At 1 February 200331 January 2004 the US division held approximately $116$144 million (2(1 February 2002: $1332003: $116 million) of merchandise on consignment (see note 12 on page 67)72).
In 2002/032003/04 the five largest suppliers collectively accounted for approximately 26% (2002/03: 29% (2001/02: 25%) of total US purchases, with the largest supplier accounting for approximately 10% (2002/03: 13% (2001/02: 9%).
12 Signet Group plc
Marketing and advertising
Store brand name recognition by consumers is believed to be an important factor in jewellery retailing, as the products themselves are predominantly unbranded. Signet continues to strengthen and promote its US brands and build store brand name recognition
| 12 | Signet Group plc Annual Report & Accounts year ended 31 January 2004 |
through a range of media advertising including television, radio, print, catalogues, direct mail, point-of-salepoint of sale signage, in-store displays and the Internet. Established strategic marketing and advertising research programmes provide a strong understanding of jewellery customers and their purchasing profiles.
Gross advertising and marketing expenditure was increased by 9.0%8.6% to $110.4$119.9 million in 2002/03 (2001/02: $101.32003/04 (2002/03: $110.4 million), primarily as a result ofto support total mall sales growth and the continued expansion of the Jared concept and total mall sales growth.concept. Gross expenditure as a percentage of sales was 6.4% (2001/02: 6.3%(2002/03: 6.4%). The total expenditure for advertising and marketing support for Kay and each of the regional brands was approximately 6% of their respective total sales for the year.
Advertising activities are concentrated duringon periods when customers are expected to be most receptive to the marketing message. During the 20022003 Christmas trading period the number of Kay television impressions increased by 16% and radio7%. The proportion of television advertising weights by 8% against the previous Christmas trading period. Over the last four years TV advertising for Kayexpenditure to sales has increased, by two and a half times, and the cost of network television advertising is leveraged as the number of stores increases. The romance and appreciation based theme of its advertising programme continues to beutilise the tag line “Every kiss begins with Kay”, which has improved name recognition of thisthe chain.
Promotional campaigns for Jared and regional chains use cost-effective regional radio advertising supplemented by direct mail as a cost effectivethe primary medium to support and enhance name recognition. AFor the regional chains the campaigns are supported by direct mail. For Jared a regional television advertising test for Jaredprogramme was expanded to ten22 selected markets in 2002/03 from three in 2001/02 in order to gain a better understanding of the dynamics of advertising Jared on television. Whenmarkets. Management believes that when the Jared chain reaches the critical mass to justify national network television advertising, the most efficient and cost effectivecost-effective form of marketing, such a programme would enhance brand name recognition will be enhanced nationwide, and givethus providing improved access to prime store real estate sites in large, high-costhigh cost advertising markets.markets and increased marketing leverage.
Each year the US division produces 11 catalogues that feature a wide selection of merchandise and are prominently displayed in stores. Catalogues are also mailed direct to targeted customers.
Statistical and technology-basedtechnology based systems are employed to support a direct marketing programme that uses a proprietary database of over 1819 million names to
strengthen the relationship with customers.Thecustomers. The programme targets current customers with special savings and merchandise offers during the key trading periods. In addition, invitations to special promotional in-store events hosted in stores are extended throughout the year.
During 2002/03 marketingEach of the US brands now has an informational web site and during 2003/04 the Jared site was enhanced. The expanded web sites for Jared (www.jared.com), J.B.Kay, JB Robinson (www.jbrobinson.com) and Marks & Morgan (www.marksandmorgan.com) were developed and launched, and the web site for Kay (www.kay.com) was upgraded.The web sitesJared display a selection of the stores’ merchandise assortments, includeprovide store locators,locations, and allow for customer registration and the ability to compile a gift “wish list”.credit application on-line.
Credit operationsVarious Signet USManagement regards the provision of an in-house credit programme as a competitive advantage for a number of reasons. It allows management to establish and implement customer service standards in the context of the business. It also provides a database of regular customers and their spending patterns. Investment in systems and management of credit offerings appropriate for the business can also be facilitated in a more cost-efficient manner than if managed by a third party provider. Furthermore it is believed that the various credit programmes offered help to establish long-term relationships with customers and complement the marketing strategy by encouraging additional purchases and higher unit sales. Management regards the provision of an in-house credit programme as a competitive advantage for a number of reasons. It provides opportunities for greater contact with customers. It also allows management to establish and implement customer service standards in the context of the business. It is believed that investment in systems and management of credit offerings appropriate for the business is also facilitated in a more cost-efficient manner than by a third party provider.
The table on page 14below presents data related to the in-house credit business for the past three financial years. TheSince the credit accounts were centralised in 1994 the credit offer and performance hashave been consistent, and despite the credit terms have remained largely unchangedmore recent challenging environment there has been a steady improvement in seven years.performance over the economic cycle. The average outstanding balance at year end was $688 (2001/02: $660)$729 (2002/03: $688). With a stable monthly collection rate of approximately 14.5%, the
The credit portfolio turns approximately every seven months. Bad debt expense in 2002/03 was 6.0% of credit sales before a $2.2 million one-off benefit frommonths and the better than anticipated performance of the residue of the acquired Marks & Morgan receivables portfolio. Itmonthly collection rate has ranged between 6.0%increased to 6.8% of credit sales over the seven year period 1996/97 to 2002/03. In-house credit sales represented 49.5% of total US sales in 2002/03 (50.4% in 2001/02)approximately 14.8%. Certain programmes offer interest-free financing. In most states customers are offered optional third party credit insurance.
Centralised credit authorisation and collection processes are based at the US headquarters in Akron, Ohio. Credit applications are evaluated by the scoring of credit application data and data obtained through on-line access to third party credit bureaux. The centralised system is capable of
Signet Group plc 13
| In-house credit operations | ||||||||||||||||
| 2003/04 | 2002/03 | 2001/02 | ||||||||||||||
| 2002/03 | 2001/02 | 2000/01 | ||||||||||||||
| Credit sales ($m) | 859.6 | 817.2 | 724.0 | 924.3 | 859.6 | 817.2 | ||||||||||
| Credit sales as % of total sales | 49.5% | 50.4% | 49.7% | 49.3% | 49.5% | 50.4% | ||||||||||
| Number of active credit accounts at year end | 798,761 | 799,043 | 793,792 | 807,272 | 798,761 | 799,043 | ||||||||||
| Average outstanding account balance ($) | 688 | 660 | 652 | 729 | 688 | 660 | ||||||||||
| Average monthly collection rates | 14.5% | 13.9% | 13.9% | 14.8% | 14.5% | 13.9% | ||||||||||
| Bad debt as % of total sales | 3.0%(1 | ) | 3.2% | 3.4% | 2.8% | 3.0% | (1) | 3.2% | ||||||||
| Bad debt as % of credit sales | 6.0%(1 | ) | 6.3% | 6.8% | 5.6% | 6.0% | (1) | 6.3% | ||||||||
| (1) | Before a $2.2 million |
| Signet Group plc Annual Report & Accounts year ended 31 January 2004 | 13 |
US operating review (continued)
processingThe bad debt charge for the year, at 5.6% of credit sales, was at the bottom end of the range over the last eight years. In-house credit sales represented 49.3% of total US sales in 2003/04 (2002/03: 49.5%). Certain programmes offer interest-free financing, subject to certain conditions. In most states customers are offered optional third party credit insurance.
Authorisation and approvingcollections are all performed centrally at the US headquarters on an automated basis, rather than by store staff. The majority of credit applications can be processed and approved in less than two minutes after data inputminutes; they can be made via in-store terminals.terminals, through a toll-free phone number or on-line through the marketing web sites. All applications are evaluated by the scoring of credit data and data obtained through third party credit bureaux. Improved scoring models that use statistical methods and support collectioncredit decision systems and strategies have been implemented. During 2002/03 collection strategies and efforts continued to include increased emphasis on contacting accounts at early stages of delinquency.
implemented in 2003/04. In addition to the in-house credit card, the US stores accept major credit cards. Credit card sales are treated as cash sales and accounted for approximately 34%36% of total US sales during 2002/03.the year.
Investment in staff, training and systems to maintain or improve the quality of the credit portfolio continued throughout 2003/04. Collection strategies and efforts continued to include increased emphasis on contacting credit accounts at early stages of delinquency.
Management tools and communications
The US division’s highly integrated and comprehensive information systems provide detailed, timely information to monitor and evaluate virtually every aspect of the business and are designed to decrease the time sales staff spend on administrative tasks and increase their time spent selling.
The US information systems provide daily, weeklyon sales activities. They also support merchandise testing, loss prevention and monthly operating and statistical reports on inventories, sales, gross profit margins, payroll, receivables and operating costs.They also allow for comparison of actual, budgeted and prior year performance for every individual store, and tracking and analysis of product and regional sales trends.inventory control.
All stores are supported by the internally developed Store Information System, (“SIS”).The SISwhich includes electronic point of sale (“EPOS”) processing, in-house credit authorisation and support, a district manager information system and a satellite-based communications system whichthat supports data transmissions and company-wide e-mail in real time. At the end of each day, data captured by thee-mail. The EPOS system is automatically transmitted to headquarters and is used to updateupdates sales, in-house credit and perpetual inventory replenishment systems and to determine inventory replenishmentfrom data captured throughout the day for stores. The merchandise processing system enables management to track automatically each individual item of merchandise from receipt to ultimate sale and to monitor sales, gross margins and inventory levels by store, merchandise category and individual item. The division’s automated paperless merchandise picking system can replenish over 200,000 pieces in a single day. In addition, an automated daily piece counting system is in place in all US stores as an effective loss prevention measure.store.
Regulation
Signet US compliesis required to comply with numerous US federal and state laws and regulations covering areas such as consumer protection, consumer privacy, consumer credit, consumer credit insurance, truth in advertising and employment legislation. Management endeavours to monitor changes in these laws to ensure that its practices comply with appropriate requirements.
14 Signet Group plc
| 14 | Signet Group plc Annual Report & Accounts year ended 31 January 2004 |
UK operating review
Overview
Signet is the largest speciality retailer of fine jewellery in the UK, with 610604 stores and a total market share of approximately 17%. It trades as H.Samuel (17.4%(17.7% of Group sales), targeting the middle market, and Ernest Jones (11.7%(12.9% of Group sales), positioned at the upper end of the middle market.Totalmarket. Total sales during 2002/032003/04 were £473.6£501.0 million (2001/02: £452.1(2002/03: £473.6 million).
At 1 February 200331 January 2004 there were 418407 H.Samuel stores and 192197 Ernest Jones stores (including 16 Leslie Davis stores). Approximately 48%49% of these are found in prime “High Street” locations (main shopping streets with high pedestrian traffic) and 52%51% are located in covered or enclosed shopping malls. The High Street stores accounted for 42% of total UK sales and shopping mall stores for 58%. H.Samuel is the largest chain of speciality retail jewellers in the UK and its stores are located in virtually every medium and large retail centre. Ernest Jones, the second largest speciality retail jewellery chain, is represented in most large retail centres.
The strategy of the UK divisionstrategy is to raiseincrease the average transaction value by focusing on fast growing product categories, particularly diamond jewellery, thereby increasingimproving store productivity. A key feature of the strategy is to make existing space work harder with particular focus on growing the diamond businessproductivity and increasing sales in fashion and luxury watches.achieving operational leverage.

Competitive advantages
Signet believes thatattributes its leading position in the UK division’sspeciality retail market to a range of competitive advantages include its strong, well established brand names; the national coverage of the chains and their complementary socio-demographic coverage; the prime locations of stores; economies of scale in buying,merchandising, store operations, marketing and central administration;real estate, which are summarised below and the capacityexplained in greater detail on pages 16 to contract with jewellery manufacturers to assemble products utilising directly sourced gold and loose polished diamonds, thereby delivering better value to the customer.19.
| • | Merchandising |
| Management believes that the division’s capacity to contract with jewellery manufacturers to assemble products utilising directly sourced loose polished diamonds and gold allows for delivery of better value to the customer. | |
| • | Store operations |
| The sale of diamond jewellery requires increased standards of product knowledge and customer service from sales associates. The division develops and invests in training procedures and materials tailored to its own requirements to help achieve this. In addition it can take advantage of economies of scale in recruitment and store administration. | |
| • | Marketing |
| The UK division has strong and well established brands and leverages them with print and television advertising and marketing catalogues. | |
| • | Real estate |
| The competitive advantage of national coverage for both brands and the prime locations of stores is being enhanced by the rollout of a new format designed to increase the sale of diamonds and fine jewellery, thereby increasing sales per store. | |
The UK business also enjoys a unique competitive advantage due to its close relationship with Signet’s US operations. Synergies are gained by sharing knowledge in merchandising, knowledge, trend information,marketing, operations, best practice procedures and systems.
Initiatives in 2003/04
Specific initiatives taken to strengthen the division’s competitive position include:
| • | development of branded diamonds, |
| • | improvement in visual merchandising, |
| • | test television advertising for H.Samuel and Ernest Jones, |
| • | further development of catalogue design and distribution, |
| • | enhancement of selection and training processes for sales associates and management, |
| • | introduction of enhanced computer systems accessible from all stores, which help automate and standardise processes, facilitate training and improve communication, and |
| • | extension of new store design to an additional 35 stores. |
Market place
Although reliable figures on the size of the UK jewellery market are difficult to obtain, management believes that in calendar year 20022003 the size of the total UK market for fine jewellery, costume jewellery and watches was approximately £3.3£3.5 billion ($5.25.9 billion) (including VAT of 17.5%).The. The market includes speciality retail jewellers and non-specialitynon speciality jewellery retailers such as mail order catalogues, catalogue showrooms and jewellery departments in department stores and mail order catalogues.stores.
The UK retail jewellery industry is very fragmented and competitive, with a substantial number of independent speciality jewellery retailers. Management believes there are in total approximately 7,000 speciality retail jewellery stores in the UK.
In the middle market H.Samuel competes with F Hinds (108 stores), and a large number of independent jewellers.jewellers, the only competitor of significant size being F Hinds (108 stores). Competition at the lower end of the H.Samuel product range also comes from catalogue showroom outlets such as Argos and discount jewellery retailers such as Warren James.
| Signet Group plc Annual Report & Accounts year ended 31 January 2004 | 15 |
UK operating review (continued)
In the upper middle market Ernest Jones’ competition is from independent speciality retailers and a limited number of other upper middle market jewellery groups such as Goldsmiths Group (164(165 stores); Beaverbrooks (48(52 stores); and MW Group (30(35 stores).
ManagementBased on exit surveys introduced during the year, management believes that customers are attracted to H.Samuel and Ernest Jones stores because they areit is perceived to be friendly, unintimidatingapproachable and relaxed, whilst
Signet Group plc 15
delivering experta knowledgeable and efficient service integrity andwith a wide product selection. The performance in the UK over the past five yearsrange. Ernest Jones is illustrated in the following chart:perceived to offer a personalised service with high standards of expertise, integrity and professionalism.


Store operations
As part of the programme to increase sales and store productivity by focusing on the fast growing diamond category, a new store design better suited to the sale of diamonds and fine jewellery has been developed to allow greater interaction between sales associates and customers.
The new format features open frontages which are intended to make the store more accessible and inviting to the customer, as well as improved presentation of the merchandise. The design draws on the Group’s mall store experience in the US, and for mall locations includes display cases on the frontage with the concourse rather than the traditional window presentation. High Street stores have wide floor-to-ceiling windows which provide views directly into the store. The merchandise is displayed in low level units and wall display cases that serve as both counter and display case, and allow the sales associate to present an assortment of merchandise to the customer without having to break away to select additional merchandise from the window displays.
The performance of the new format has continued to be encouraging. The reformatted stores outperformed their peer groups and achieved a rise in both diamond sales and average ticket price. An additional 35 stores, primarily H.Samuel, were trading in the new format at 31 January 2004, bringing the total to 52. A multi-year rollout plan for the new format is being implemented as part of the normal refurbishment cycle. It is planned to refurbish 75 – 85 stores in 2004, the majority being H.Samuel.
Details of recent investment in the store portfolio are set out below:
| Number of stores | ||||||||
| 2003/04 | 2002/03 | 2001/02 | ||||||
| Store refurbishments | ||||||||
| and relocations | 32 | 42 | 93 | |||||
| New H.Samuel stores | – | 4 | 10 | |||||
| New Ernest Jones stores | 5 | 8 | 9 | |||||
| Fixed capital expenditure | £13m | £14m | £15m | |||||
A dedicated store operations management team for each of the H.Samuel and Ernest Jones chains supports and manages their development.
Management believes that the location, quality of real estate and interior fitting of its UK stores are central to its success. Traditionally both chains have employed extensive window displays.This is in contrast to the US where display cabinets of many jewellery stores are situated on the frontage with the mall concourses.
The UK division continues to test and review new store designs and layouts. During the year 17 stores of different types were trialed using a design format intended to be more conducive to the sale of diamonds and fine jewellery. The new designs feature open frontages intended to make the store more accessible and inviting to the customer, together with improved lighting of the merchandise.The trial formats draw on the Group’s mall store experience in the US and include display cases on the frontage with the mall concourse rather than the traditional window presentation.These low-level display units serve as both
counter and display case, allowing the sales associate to present a selection of merchandise to the customer without having to break away from the sale to get additional merchandise from the window display. Details of recent investment in the store portfolio are set out below:
| Number of stores | ||||||||||
| 2002/03 | 2001/02 | 2000/01 | ||||||||
| Store refurbishments | ||||||||||
| and relocations | 42 | 93 | 24 | |||||||
| New H.Samuel stores | 4 | 10 | 9 | |||||||
| New Ernest Jones stores | 8 | 9 | 3 | |||||||
| Fixed capital expenditure | £14m | £15m | £6m | |||||||
H.Samuel
H.Samuel, accounting for 17.4%17.7% of Group sales in 2002/03 (2001/02: 17.6%2003/04 (2002/03: 17.4%), offers a wide range of jewellery, gold, watches and gifts (see page 18, for merchandiseMerchandise mix). In contrast to Ernest Jones, H.Samuel is a high volume business with relatively low transaction values reflecting a lower proportion of diamond jewellery and a higher proportion of gifts in its sales mix. At 1 February 200331 January 2004 the chain had average selling space of 1,1241,125 square feet per store.
The average retail price of items sold in 2002/032003/04 was £33, and£35, reflecting the proportion of gifts in the sales mix, which has been declining over time. This is planned to continue as the percentage of diamond jewellery sales increases. The average retail price has increased at ana compound annual compound growth rate of 5.7%7.0% over the last five years. Average sales per store in 2003/04 were £707,000 having increased at a compound annual growth rate of 4.7% over the last five years. The average sales per store in 2002/03 were £677,000 having increased at an annual compound growth ratenumber of 3.6% over the last five years. Whilst H.Samuel continuesstores is likely to be broadly stable, as there are limited opportunities to open new stores, there is limited opportunitysites and the number of markets with multiple units continues to increase the total number, given the chain’s current nationwide coverage.be rationalised.
| H.Samuel store data | ||||||||||
| 2002/03 | 2001/02 | 2000/01 | ||||||||
| Number of stores | ||||||||||
| Opened during year | 4 | 10 | 9 | |||||||
| Closed during year | (8 | ) | (16 | ) | (8 | ) | ||||
| Open at end of year | 418 | 422 | 428 | |||||||
| Percentage increase in | ||||||||||
| like for like sales | 2.6% | 6.4% | 6.0% | |||||||
| Average retail price of | ||||||||||
| items sold(1) | £33 | £31 | £28 | |||||||
| Average sales per store in | ||||||||||
| thousands (exc.VAT)(2) | £677 | £667 | £609 | |||||||
| H.Samuel store data | |||||||||
| 2003/04 | 2002/03 | 2001/02 | |||||||
| Number of stores | |||||||||
| Opened during year | – | 4 | 10 | ||||||
| Closed during year | (11 | ) | (8 | ) | (16 | ) | |||
| Open at end of year | 407 | 418 | 422 | ||||||
| Percentage increase in like for like sales | 3.5 | % | 2.6 | % | 6.4 | % | |||
| Average retail price of items sold(1) | £35 | £33 | £31 | ||||||
| Average sales per store in thousand (exc. VAT)(2) | £707 | £677 | £667 | ||||||
| (1) Excluding accessories, repairs and warranties. | |||||||||
| (2) Including only stores operated for the full financial year. | |||||||||
16 Signet Group plc
Ernest Jones (including Leslie Davis)
Ernest Jones sales accounted for 11.7%12.9% of Group sales in 2002/03 (2001/02: 10.7%2003/04 (2002/03: 11.7%). Where market size permits the Ernest Jones chain follows a two-site strategy, using the trade names Ernest Jones and Leslie Davis.
The principal product categories are diamonds, branded watches and gold jewellery, all of which are all merchandised and marketed to appeal to the more affluent upper middle market customer (see page 18, for merchandiseMerchandise mix). Ernest Jones retails an extensive range of diamond and gold jewellery and prestige watches such as Rolex, Cartier, Gucci, Raymond Weil,Tag Heuer, Omega Rado and Corum;Rado; contemporary fashion watches such as Emporio Armani, Hugo Boss, DKNY and Calvin Klein; and a traditional range of traditional watches including Rotary, Seiko and Tissot.
At 1 February 200331 January 2004 the chain had an average selling space of 851849 square feet per store.Thestore. The average retail price of items sold in 2002/032003/04 was £130,£139, and has increased at ana compound annual compound growth rate of 4.2%5.0% over the last five years. Over the same period average sales per store increased at an annual compound growth rate of 10.6%12.0% and reached £1,030,000£1,101,000 at 1 February 2003.31 January 2004. Management considers that there is potential to increase the number of Ernest Jones stores to approximately 230.225 as suitable sites and watch agencies become available.
| Ernest Jones store data(1) | ||||||||||
| 2002/03 | 2001/02 | 2000/01 | ||||||||
| Number of stores | ||||||||||
| Opened during year | 8 | 9 | 3 | |||||||
| Closed during year | – | (2 | ) | (5 | ) | |||||
| Open at end of year | 192 | 184 | 177 | |||||||
| Percentage increase in | ||||||||||
| like for like sales | 9.4% | 14.6% | 13.5% | |||||||
| Average retail price of | ||||||||||
| items sold(2) | £130 | £119 | £109 | |||||||
| Average sales per store in | ||||||||||
| thousands (exc.VAT)(3) | £1,030 | £919 | £805 | |||||||
| Ernest Jones store data(1) | ||||||||||
| 2003/04 | 2002/03 | 2001/02 | ||||||||
| Number of stores | ||||||||||
| Opened during year | 5 | 8 | 9 | |||||||
| Closed during year | – | – | (2 | ) | ||||||
| Open at end of year | 197 | 192 | 184 | |||||||
| Percentage increase in like for like sales | 8.4 | % | 9.4 | % | 14.6 | % | ||||
| Average retail price of items sold(2) | £139 | £130 | £119 | |||||||
| Average sales per store in thousand (exc. VAT)(3) | £1,101 | £1,030 | £919 | |||||||
| (1) | Including Leslie Davis stores. | |
| (2) | Excluding accessories, repairs and warranties. | |
| (3) | Including only stores operated for the full financial year. |
Where market size permits the Ernest Jones chain follows a two-site strategy, using the trade names Ernest Jones and Leslie Davis.
Management, personnel, training and incentives
Management believes that customer service is one of the essential elements in the success of its business. During 2003/04 initiatives to improve customer service and raise store standards continued. Training programmes and enhanced incentive schemes have contributed to the improvement ofin the quality and performance of the UK staff, which has helped to increase sales. During 2002/03
Recruitment procedures have been enhanced to ensure that store personnel meet key basic requirements and are motivated to work within the programme to raise store environment. Field and human resources management personnel play an active role in the recruitment, performance review, training and development of sales staff,
thereby ensuring consistency in operating standards and customer service continued.
Newprocedures throughout the business. All new store personnel must complete a “selling skills” learning programme during their probationary period and thereafter undertake additional training in selling, product knowledge and customer care.
During 2003/04 a training programme and framework for measuring standards of capability, the “Signet Jewellery Academy,” was introduced for all store staff. Upon completion of each of the five levels of the Academy, the sales associate normally takes on increasing responsibilities. Personnel are also encouraged to pursue further education through courses such as the National Association of Goldsmiths’ “Jewellers Training Programme”, a two year course leading to certification by examination.
Store managers undergo salesIn conjunction with the Signet Jewellery Academy, training for all tiers of store operations management was also restructured and store management training. Field and human resources management personnel play an active role inenhanced to support the recruitment, performance review, training and development of sales staff, thereby ensuring consistency in operating standards and procedures throughout the business.
initiative to improve customer service. The preferred policy is to promote store managers from within Signet UK.the business. At any given time each chain has a number of sales staff who are qualified to advance to store manager level, thus assuring the availability of newly trained managers familiar with operating standards and procedures.
Various incentive schemes are operated to motivate and reward performance in the stores, and sales-based bonuses are paid to sales associates.Theassociates. The bonus system for store managers and area managers is clearly focusedbased on key controllable performance targets. It is intended thatPerformance-based remuneration tests are being carried out and could result in an increase in the proportion of performance relatedperformance-related payments should increase over time.
Signet Group plc 17
In order to increase staff selling time and to improve efficiency, store operating procedures are routinely reviewed to identify opportunities to improveenhance customer service and reduce in-store administrative tasks. SalesThe Signet Intranet, introduced in all stores during the year, provides a computer based platform for improved communication between stores and head office, with sales floor and back office administrative functions were furtherbeing simplified and standardised and made available on line through EPOS (electronic point of sale) terminals in 2002/03. “Model stores” are used as benchmarks for monitoring, reviewing and testing operating procedures to increase staff productivity in all stores.this medium.
Management also believes that thesuccessful recruitment, training and retention of head office staff are essential to supportmeans of supporting the stores and enhanceenhancing sales performance. Comprehensive recruitment, training and incentive programmes for head office staff members are in place in the offices in Colindale and Birmingham.Birmingham offices. Programmes to provide employees with structured development plans, training and career paths have been implemented. Career advancement is encouraged through the advertisement of all internal vacancies and is supported by
| Signet Group plc Annual Report & Accounts year ended 31 January 2004 | 17 |
UK operating review (continued)
a succession planning process.
Teamwork and service to the stores are encouraged through a performance bonus plan for head office staff, which is based on the UK division’s results. In addition, recognition schemes award those who
Opportunities for improving employment practices were identified through a “Staff Opinion Survey” in 2003. It is believed that the results provide outstanding customer service to internala basis for further improvement in the motivation and external customers.retention of staff.
Merchandising and purchasing
The division retails an extensive range of merchandise including gold and silver jewellery, watches, diamond and gemstone set jewellery and gifts. ConsistentAs with other UK speciality retail jewellers, most gold jewellery carriedsold is 9 carat. However, sales of 18 carat gold jewellery, particularly white gold, have been increasing in line with a rising demand for aspirational products.
The merchandisingmerchandise mix of H.Samuel, and Ernest Jones and the UK division as a whole, is given above.below. In the UK there is a trend toward diamond purchases and Signet’s UK brands are well positioned across the middle market to benefit from this trend. In 2002/032003/04 diamond jewellery sales accounted for 25%26% of total Signet UK sales versus 18%20% five years ago. TheIn line with the strategy of the UK division to increase the percentage of diamonds in the merchandise mix, the compound annual growth rate of Signet UK diamond sales was 14.6%14.1% over the period, while the compound annual growth rate of all UK diamond sales was 8.9%9.1% over the same period (De Beers).
| Merchandise mix | ||||||||||
| Percentage of sales | ||||||||||
| 2002/03 | 2001/02 | 2000/01 | ||||||||
| % | % | % | ||||||||
| Gold and silver jewellery | ||||||||||
| H.Samuel | 36 | 36 | 35 | |||||||
| Ernest Jones | 26 | 27 | 28 | |||||||
| Signet UK | 32 | 33 | 32 | |||||||
| Watches | ||||||||||
| H.Samuel | 24 | 24 | 24 | |||||||
| Ernest Jones | 32 | 34 | 33 | |||||||
| Signet UK | 27 | 28 | 27 | |||||||
| Diamond jewellery | ||||||||||
| H.Samuel | 18 | 17 | 17 | |||||||
| Ernest Jones | 35 | 33 | 30 | |||||||
| Signet UK | 25 | 23 | 22 | |||||||
| Gifts | ||||||||||
| H.Samuel | 14 | 15 | 16 | |||||||
| Ernest Jones | 3 | 3 | 5 | |||||||
| Signet UK | 10 | 10 | 12 | |||||||
| Repairs and accessories | ||||||||||
| H.Samuel | 8 | 8 | 8 | |||||||
| Ernest Jones | 4 | 3 | 4 | |||||||
| Signet UK | 6 | 6 | 7 | |||||||
| 100 | 100 | 100 | ||||||||
Each store periodically receives and displays a range of merchandise that reflects local buying patterns. Display equipment and layouts are constantly reviewed and updated and new display formats, which draw upon the US division’s experience, are being implemented.
| Merchandise mix | |||||||
| Percentage of sales | |||||||
| 2003/04 | 2002/03 | 2001/02 | |||||
| % | % | % | |||||
| Gold and silver jewellery | |||||||
| H.Samuel | 37 | 36 | 36 | ||||
| Ernest Jones | 26 | 26 | 27 | ||||
| Signet UK | 33 | 32 | 33 | ||||
| Watches | |||||||
| H.Samuel | 23 | 24 | 24 | ||||
| Ernest Jones | 31 | 32 | 34 | ||||
| Signet UK | 26 | 27 | 28 | ||||
| Diamond jewellery | |||||||
| H.Samuel | 19 | 18 | 17 | ||||
| Ernest Jones | 36 | 35 | 33 | ||||
| Signet UK | 26 | 25 | 23 | ||||
| Gifts | |||||||
| H.Samuel | 14 | 14 | 15 | ||||
| Ernest Jones | 3 | 3 | 3 | ||||
| Signet UK | 9 | 10 | 10 | ||||
| Repairs and accessories | |||||||
| H.Samuel | 7 | 8 | 8 | ||||
| Ernest Jones | 4 | 4 | 3 | ||||
| Signet UK | 6 | 6 | 6 | ||||
Merchandise is purchased from a range of suppliers and manufacturers. In 2002/032003/04 the five largest of these (all watch
suppliers) together accounted for approximately 19%21% of total UK division purchases, with the largest accounting for approximately 4%6%. Only a small percentage of merchandise is purchased on consignment (see note 12 on page 67)72).
Economies of scale are achieved by combining the volume of purchases for H.Samuel and Ernest Jones. Some 28%24% of the UK business’ gold jewellery is manufactured on a contract basis in Italy through a buying office in Vicenza, thereby eliminating the costs associated with intermediaries.
18 Signet Group plc
Signet UK also employs contract casting for approximately 34%30% of the diamond merchandise sold, providingthereby achieving cost savings to the division.savings. Both H.Samuel and Ernest Jones employ experienced buyers who concentrate on product development, sourcing and supplier management appropriate to their particular needs.
Merchandising teams work in conjunction with the buyers and focus on assortment planning, branch grading, repeat orders, inventory levels and margin management. Product category reviews are regularly carried out with a focus on increasing potential gross margin return.return on investment. Rigorous test marketing procedures are used to trial products, and their subsequent distribution is made strictly against rates of sale.
StepsIn recent years steps have been taken to strengthen the merchandising and purchasing functions, especially for diamonds. The diamond ranges have been rationalised, with greater focus on key items, and offer a wider choice in the most popular categories is offered whilst reducing peripheral merchandising.merchandising is reduced. Branded diamonds exclusive to Signet have been introduced this year.in recent years. The Leo Diamond is now available in all Ernest Jones stores, and the Forever Diamonds range continues to be rolled out in H.Samuel; it was available in 50 stores in 2002/03, 120 in 2003/04 and will be in 200 by the end of 2004/05.
Each store is assigned a range of merchandise that reflects local buying patterns. Display equipment and layouts are constantly reviewed and updated, and new display formats that draw upon the US division’s experience are being tested in H.Samuel.implemented.
Marketing and advertising
Gross expenditure on marketing and advertising amounted to 2.2%2.5% of sales in 2002/03 (2001/2003/04 (2002/03: 2.2% and 2001/02: 2.1% and 2000/01: 1.9%). Marketing campaigns have been tailored to reinforce and develop further the distinct brand identities of H.Samuel as a middle market jewellery chain and Ernest Jones as a more upmarket diamond and watch specialist. Both campaigns aim to expand the overall customer base and improve customer loyalty.
| 18 | Signet Group plc Annual Report & Accounts year ended 31 January 2004 |
The primary marketing and adver tisingadvertising medium employed in 2002/03 was2003/04 consisted of a series of catalogues for each brand, distributed as inser tsinserts in newspapers and magazines and also available in all stores. During 2002/03 the Ernest Jones catalogues had a strong focus on diamonds and branded watches. The quantityquality of both chains’ catalogues was increasedimproved and their distribution was better targeted. Radio adver tisingErnest Jones also benefited from increased catalogue quantities.
Television advertising was tested for both chains during Christmas 2003. It was the first time television advertising had been tested for Ernest Jones, with advertisements running in the London area, comprising about 25% of its store base. For H.Samuel, it was developedthe first large-scale test and expanded. Conceptsran in the Midlands and northern England, representing about 40% of its store base. It is planned to test television adver tising for H.Samuel are under development.continue the advertising trial in 2004.
Public relations support was increased for both brands, resulting in greater coverage inby national and consumer lifestyle media titles. Targeted marketing was increased to support keypublicise special promotional events such as design days at Ernest Jones and collectors’ events at H.Samuel.
During 2002/032003/04 the content and interactivity of the UK marketing web sites (www.hsamuel.co.uk, www.ernestjones.co.uk and www.lesliedavis.co.uk) continued to be developed.Thedeveloped. The sites have seen a substantial increase in visitor numbers and visitor time on line.traffic.
Insurance loss replacement business
Management believes that itSignet is the leading UK jewellery retailer in the insurance loss replacement business, which involves the settlement of insurance claims by product replacement through jewellery stores rather than by cash settlements from the insurance company. Given its nationwide store portfolio, breadth of product range and ability to invest in systems to support the business, the division is well positioned to benefit from insurance companies increasingly settling claims in this manner. H.Samuel and Ernest Jones also benefit from the resulting higher customer traffic in the stores and the opportunity to create and build relationships with new customers. In 2002/03During the year software systems were improved and a new insurance call centre was opened in February 2004, facilitating further investment was made to improve efficiency and customer service inexpansion of this sector of the in-house telephone call centre.UK business.
Credit operations
Whilst the division does not have an in-house credit operation, it does accept major credit cards. Credit card sales are treated as cash transactions and accounted for approximately 33%31% of sales during 2002/03 (2001/02: 31%2003/04 (2002/03: 33%). During the period approximately 2% (2001/02:3% (2002/03: 2%) of sales in the UK were made pursuant to interest-free programmes available for purchases overabove a particular price.Theprice. The receivables for the interest-free programmes are sold at a discount on a limited recourse basis and administered by an unaffiliated company.
Management tools and communications
The administration centre at Colindale in North London is the head office for UK store operations. It alsooperations and houses the division’s core finance, human resources, information technology, payroll, and buying and merchandising functions. The distribution facility, insurance replacement business, call centre, customer services facility and some finance and information technology operations are located in Birmingham.
RetailEPOS equipment, retail management systems, purchase order management systems and merchandise planning processes are in place to support financial management, inventory planning and control, purchase order management,purchasing, merchandising, replenishment and distribution. These package-based systems allow for tracking of performance against budgetdistribution and forecasting of sales, gross margin and inventory by merchandise category and at individual store level.
Signet Group plc 19
A personal computer-based EPOS system enables continual improvements in such areas as store e-mail, access to store operations and display manuals, automation and simplification of back office functions and labour scheduling in key stores. Management expects that these improvements, which will take a number of years to implement fully, will increase the time available to sales staff to concentrate on selling and improve customer service.
Systems to collect data overnight from the EPOS terminals are also in place, enablingcan enable replacement within 24 hours of any merchandise sold in the UK stores.sold. A perpetual inventory process enablesallows store managers to check stock by product category. This also allows for additional focus to be placed on loss prevention in higher risk product categories, earlier identification of stock control issues and enhancement of stock file accuracy. The process is supported by store visits carried out by the internal audit function.
An intranet-based system to support improved communications across the business is currently under development and is scheduled to be put in place in stores during 2003. Its benefits will include better daily contact
between the head office and store staff, increased standardisation of store operational procedures, and enhanced in-store training programmes.
The merchandise planning and buying system was again improved duringDuring the year, hand held terminals were introduced to enhanceall stores to improve significantly the quality, level of detailaccuracy and accuracyspeed of the merchandise planningstock counting process. It now allows for betterEnhancements to all these systems have improved control of shrinkage, fraud prevention, financial analysis of dataretail operations, merchandising and identification of merchandise trends.
Each store receives monthly operating statements detailing its financial performance against budget. The statements monitor sales, store payroll expenditure and other operating expenses, allowing store and area management to concentrate on issues that directly affect the profitability of each store.inventory control.
Regulation
Various laws and regulations affect Signet’s UK operations. These cover areas such as consumer protection, consumer credit, data protection, requirements, health and safety, issues, waste disposal, employment legislation and planning and development standards. Management monitors changes in these laws with a view to ensureensuring that its practices comply with legal requirements.
20 Signet Group plc
| Signet Group plc Annual Report & Accounts year ended 31 January 2004 | 19 |
Group employees
In 2002/03 the average number of full-time equivalent persons employed (including directors) was 14,160 (UK: 4,746; US: 9,414).The Company usually employs a limited number of temporary employees during each Christmas season.
None of Signet’s employees in the UK and less than 1% of Signet’s employees in the US are covered by collective bargaining agreements. Signet considers its relationship with its employees to be excellent.
Signet attributes great importance to the location and appearance of its stores. Accordingly, in both Signet’s US and UK operations, investment decisions on selecting sites and refurbishing stores are made centrally, and strict real estate criteria are applied.
The Company has sufficient distribution capacity to meet its current requirements in the US. It is planned to increase this capacity in 2004 to support future sales growth. In the UK investment is being made to reflect the increase in diamonds in the sales mix.
US
Substantially all of Signet’s US stores are leased. In addition to a minimum annual rental, a significant number of stores will pay additional rent based on sales above a specified base level. Under the terms of the typical lease, the US business is required to conform and maintain its usage to agreed standards, including meeting required advertising expenditures as a percentage of sales, and is responsible for its proportionate share of expenses associated with common area maintenance, utilities and taxes of the mall. The initial term of a mall store lease is generally ten years. At 1 February 200331 January 2004 the average unexpired lease term of US leased premises was six years and some 44%43% of leases had terms expiring within five years. The Jared stores are normally on 20 year leases and rents are not turnover related.
During the past five financial years the US business has been generally successful in renewing its store leases as they expire and has not experienced difficulty in securing suitable locations for its stores. It is not believed that any of the store leases are individually material to the Group’s US operations.
A 337,000 square foot head office facility is leased in Akron, Ohio.
UK
At 1 February 200331 January 2004 Signet UK held seventen freehold premises, 1815 premises where the lease had a remaining term in excess of 25 years and 675671 other leasehold premises. As is typically the case in retailing in the UK, the division’s stores are leased for
terms of up to 25 years, generally under full repairing and insuring leases (equivalent to triple net leases in the US). Wherever possible Signet is shortening the length of new leases that it enters into in order to improve the flexibility of its lease commitments. Rents are usually subject to upward review every five years if market conditions so warrant. An increasing proportion of rents are related to sales of the store, subject to a minimum annual value. At the end of the lease period, subject to certain limited exceptions, leaseholders generally have statutory rights to enter into a new lease of the premises on negotiated terms. At 1 February 200331 January 2004 the average unexpired lease term of Signet’s leased premises in the UK was 1413 years. As current leases expire, Signet believes that it will be able to renew leases, if desired, for present store locations or to obtain leases in equivalent or improved locations in the same general areas. Signet has not experienced difficulty in securing leases for suitable locations for its UK stores. Wherever possible SignetIt is shorteningnot believed that any of the length of newstore leases that it enters into in orderare individually material to improve the flexibility of its lease commitments.Group’s UK operations.
Signet owns a 255,000 square foot warehouse and distribution centre in Birmingham and a 120,000 square foot administration centre at Colindale in North London.
Trademarks and trade names
Signet is not dependent on any material patents or licenses in either the US or the UK; however, it does have several well established trademarks and trade names which are significant in maintaining its reputation and competitive position in the jewellery retailing industry in both the US and the UK. These registered trademarks and trade names include the following in Signet’s US operations: Kay Jewelers; Jared The Galleria Of Jewelry; JB Robinson Jewelers; Marks & Morgan Jewelers; Belden Jewelers; Weisfield Jewelers; Osterman Jewelers; Shaw’s Jewelers; Rogers Jewelers; LeRoy’s Jewelers; Goodman Jewelers; Friedlander’s Jewelers; Every kiss begins with Kay; and Perfect Partner. These trademarks and trade names include the following in Signet’s UK operations: H.Samuel; Ernest Jones; Leslie Davis; and Forever Diamonds.
Group employees
In 2003/04 the average number of full-time equivalent persons employed (including directors) was 14,502 (UK: 4,562; US: 9,940). The Company usually employs a limited number of temporary employees during each Christmas season.
None of Signet’s employees in the UK and less than 1% of Signet’s employees in the US are covered by collective bargaining agreements. Signet Group plc 21considers its relationship with its employees to be excellent.
| 20 | Signet Group plc Annual Report & Accounts year ended 31 January 2004 |
Financial review
for the 52 weeks ended 31 January 2004
| 2003/04 | 2002/03(1) | 2001/02(1) | ||||||||||||
| £m | % | £m | % | £m | % | |||||||||
| Sales: | ||||||||||||||
| US | 1,116.2 | 69.0 | 1,134.4 | 70.5 | 1,126.0 | 71.4 | ||||||||
| UK | 501.0 | 31.0 | 473.6 | 29.5 | 452.1 | 28.6 | ||||||||
| Total | 1,617.2 | 100.0 | 1,608.0 | 100.0 | 1,578.1 | 100.0 | ||||||||
| Operating profit: | ||||||||||||||
| US | 151.4 | 71.4 | 155.2 | 77.6 | 145.1 | 79.0 | ||||||||
| UK | 76.6 | 36.2 | 64.7 | 32.4 | 58.8 | 32.0 | ||||||||
| Group central costs | (5.7 | ) | (2.7 | ) | (6.0 | ) | (3.0 | ) | (5.1 | ) | (2.8 | ) | ||
| 222.3 | 104.9 | 213.9 | 107.0 | 198.8 | 108.2 | |||||||||
| Net interest payable | (10.4 | ) | (4.9 | ) | (14.0 | ) | (7.0 | ) | (15.0 | ) | (8.2 | ) | ||
| Profit before tax | 211.9 | 100.0 | 199.9 | 100.0 | 183.8 | 100.0 | ||||||||
| (1) | Restated for the implementation of FRS 17 – ‘Retirement Benefits’. |
Introduction
The key drivers of operating profitability are the:
| • | rate of sales growth, |
| • | balance between like for like sales growth and sales from new space, |
| • | achieved gross margin, |
| • | level of cost increases experienced by the Group, |
| • | level of net bad debt charge relating to the in-house credit card in the US, and |
| • | movements in the US dollar to pound sterling exchange rate, since the majority of the Group’s profits are generated in the US and the Group reports in pounds sterling. |
Gross margins in retail jewellery are above the average for speciality retailers reflecting the slow inventory turn. Gross margins depend on Signet’s pricing policy and movements in its costs of goods sold. In general, gross margins on gold jewellery are above the Group’s average, while diamond jewellery margins are broadly in line with the Group’s average. The gross margin on watches and gift products is normally below that of diamonds. In addition, the gross margin in a Jared store is slightly below that of a mall store, although at maturity the operating margin for a Jared store is expected to be similar to that of a mall store.
In the US, the growth of the Jared concept and anticipated changes in mix within the diamond category, result in a small downward pressure on the gross margin achieved by the US business each year. In the UK the strategy to increase diamonds has a broadly neutral impact on gross margins.
To maintain the operating profit margin the Group needs to achieve like for like sales growth sufficient to offset any adverse movement in gross margin, the increase in operating costs and the impact of immature selling space. Like for like sales growth above this level allows the Group to achieve leverage of its fixed cost base and improve operating margins; slower sales growth results in reduced operating margins.
Signet’s longer term strategy of 6% – 8% space growth in the US, with minimal net new space in the UK, means lower like for like sales growth is required in the UK than in the US to maintain operating margins.
The impact on operating profits of sales variances (either adverse or favourable) is less in the US division than the UK as certain expense items are more related to sales volumes in the US.
A key factor in driving operating margin is the level of average sales per store, with higher productivity allowing leverage of expenses both in store and in central office functions.
Movements in the US dollar to pound sterling exchange rate impact the reported results of the Group as the US division’s results are translated into pounds sterling. The Board believes it is inappropriate to hedge this exposure as the US division’s sales and costs are dollar denominated and the cash flow from the US division is largely reinvested in the US space expansion or used to pay down US dollar denominated borrowings. The Group therefore would be putting in place a cash exposure to hedge a translation risk.
| Signet Group plc Annual Report & Accounts year ended 31 January 2004 | 21 |
Financial review (continued)
52 weeks ended 31 January 2004
Total Group sales rose to £1,617.2 million (2002/03: £1,608.0 million), up 0.6% on a reported basis and 7.3% at constant exchange rates. Group like for like sales were up 4.9% and new space contributed 2.4% (see table below).
Group operating margin increased to 13.7% (2002/03: 13.3% restated), leverage from like for like sales growth more than offsetting the impact of immature space growth with gross margin little changed. The growth in total sales and the increased operating margin resulted in Group operating profit advancing to £222.3 million (2002/03: £213.9 million restated), up 3.9% on a reported basis and 11.2% at constant exchange rates.
Net interest payable decreased to £10.4 million (2002/03: £14.0 million). £1.5 million of the reduction was due to exchange translation, the balance attributable to lower levels of net debt which more than offset the decrease in net interest credit on the UK defined benefit pension scheme.
Group profit before tax increased to £211.9 million (2002/03: £199.9 million restated), up 6.0% on a reported basis and 13.0% at constant exchange rates. After a tax charge of 35.3% (2002/03: 35.4%) profit for the financial period rose to £137.2 million (2002/03: £129.1 million restated). It is anticipated that the tax charge for 2004/05 will be marginally lower than that for 2003/04. Earnings per share was 8.0p (2002/03: 7.5p restated), up 6.7% on a reported basis and 12.7% at constant exchange rates.
Sales
| 2003/04 sales growth | |||||||
| US % | UK % | Group % | |||||
| Like for like | 4.6 | 5.5 | 4.9 | ||||
| New space | 3.4 | 0.3 | 2.4 | ||||
| Exchange translation | (9.6 | ) | – | (6.7 | ) | ||
| Total sales growth | (1.6 | ) | 5.8 | 0.6 |
US
Like for like sales for the US division increased by 4.6% and total US dollar sales by 8.0%. Trading in the first half was adversely affected by the geo-political situation, however the second half saw a marked improvement in the retail environment culminating in a particularly strong fourth quarter when like for like sales rose by 7.2%. The contribution from new space and the impact of exchange rate movements is shown in the table above.
UK
As in the US, trading in the first half of the year in the UK was also affected by geo-political factors, but the second half saw improved trading with a strong Christmas season when like for like sales rose by 6.7%. For the year as a whole like for like sales increased by 5.5% and total sales by 5.8%.
Operating profit
| Operating margin movement | |||||||
| US % | UK % | Group % | |||||
| 2002/03 margin | 13.7 | 13.7 | (1) | 13.3 | (1) | ||
| Gross margin | (0.4 | ) | 0.8 | – | |||
| Expenses | 0.7 | 0.8 | 0.7 | ||||
| New space | (0.4 | ) | – | (0.3 | ) | ||
| 2003/04 margin | 13.6 | 15.3 | 13.7 | ||||
| (1) Restated for the implementation of FRS 17 – ‘Retirement Benefits’ . | |||||||
US
The operating margin in the US division was little changed at 13.6% (2002/03: 13.7%), with the leverage from like for like sales growth offsetting the impact of slightly lower gross margins and immature store space (see table above). The ratio of net bad debt to sales decreased to 2.8% (2002/03: 3.0%). Operating profit was £151.4 million (2002/03: £155.2 million), down 2.4% on a reported basis but up 7.1% at constant exchange rates reflecting the movement in sales.
UK
An increase in gross margin and leverage from improved store productivity meant that the UK operating margin increased to 15.3% (2002/03: 13.7% restated). Operating profit grew by 18.4% to £76.6 million (2002/03: £64.7 million restated).
Group costs
Group costs amounted to £5.7 million (2002/03: £6.0 million which included a property provision of £0.5 million).
Prior year adjustment
The Group has adopted FRS 17 – ‘Retirement Benefits’ in 2003/04. Under the market-based approach of FRS 17 there was a £6.7 million Group Scheme deficit at 1 February 2003 in comparison to a balance sheet asset of £19.1 million under SSAP 24. Consequently a non-cash charge of £18.1 million, net of deferred tax, has been accounted for by way of a prior year adjustment charged directly to reserves to reflect this change, representing 2.7% of shareholders’ funds at 1 February 2003.
| 22 | Signet Group plc |
Return on capital employed
The Group’s ROCE increased to 24.8% (2002/03: 24.1% restated). In the US the ROCE was 20.5% (2002/03: 21.5%) reflecting the impact of an increased proportion of immature space largely from new Jared stores. In the UK there was an increase to 47.1% (2002/03: 41.2% restated) due to improved store productivity. US capital employed included in-house credit card debtors of £292.6 million at 31 January 2004 (2002/03: £299.2 million at 1 February 2003).
Depreciation and capital expenditure
Depreciation charges were £39.3 million (2002/03: £36.6 million): £23.6 million (2002/03: £24.1 million) in the US and £15.7 million (2002/03: £12.5 million) in the UK. Capital expenditure in the US was £33.1 million (2002/03: £33.1 million) and in the UK was £17.8 million (2002/03: £16.4 million).
Dividends
In November 2003 an interim dividend of 0.341p per share was paid (2002/03: 0.310p). The Board is recommending to shareholders a final dividend of 2.16p (2002/03: 1.80p) per share for 2003/04, which, subject to shareholder approval, is to be paid on 2 July 2004 to those shareholders on the register of members at close of business on 4 June 2004. Future dividends will continue to take account of earnings, cash flow, gearing and the needs of the business.
Liquidity and capital resources
It is the objective of the Group to be broadly cash flow neutral annually, subject to timing differences, after implementing its established 6% – 8% space growth strategy in the US together with the continuing programme of store refurbishments and relocations. Factors which could impact this objective would be if a business was acquired or the Group’s distribution policy to shareholders changed.
The cash flow performance of the Group depends on a number of factors such as the:
| • | operating performance of the business, |
| • | rate of space expansion which influences both fixed and working capital investment, |
| • | level of store refurbishment and relocations, |
| • | level of inventory investment, |
| • | proportion of sales made on the in-house credit card and the average monthly collection rate of the credit balances. |
Investment in new space requires significant investment in working capital, as well as fixed capital investment, due to the slow inventory turn, and the proportion of sales in the US that are made utilising the in-house credit card.
In years when the rate of space expansion in the US is towards the lower end of the planned 6% – 8% range, or the level of store refurbishment and relocation are lower than the normal cycle, the Group will have a reduced levels of investment in fixed and working capital. In the last three years, when the level of investment has been lower than normal, and the trading performance has continued to grow, the Group has reduced its level of net debt.
The Group’s working capital requirements fluctuate during the year as a result of the seasonal nature of its business. As inventory is purchased for the Christmas season there is a working capital outflow which reaches its highest levels in the late autumn. This position then reverses over the key selling period of November and December. The working capital needs of the business are then relatively stable from January to August. The timing of the payment of the final dividend, normally in July, is also material.
The Board considers that the capital resources currently available are sufficient for both its present and near term requirements. The primary borrowing facilities are a $251 million securitisation against the US customer receivables which amortises between December 2005 and October 2006 and a $410 million unsecured multi-currency revolving credit facility which expires in August 2006. Further details of these and other facilities are given below.
Cash generated from operating activities increased to £203.8 million (2002/03: £182.2 million), reflecting the funding of working capital investment from the increase in operating profit. It is anticipated that in 2004/05 there will be a further increase in working capital due to planned store openings. Net financing costs of £11.0 million (2002/03: £16.5 million) and tax of £69.0 million (2002/03: £57.3 million) were paid. Cash flow before investing activities was £123.8 million (2002/03: £108.5 million).
Group capital expenditure was £50.9 million (2002/03: £49.5 million). Disposal proceeds were £0.2 million (2002/03: £1.3 million). The level of capital expenditure was some 1.3 times the depreciation charge. Capital expenditure in 2004/05 is expected to be approximately £80 million, most of which will be store related. Equity dividends of £36.7 million (2002/03: £30.8 million) were paid.
| Signet Group plc Annual Report & Accounts year ended 31 January 2004 | 23 |
| 2002/03 | 2001/02 | 2000/01 | ||||||||||||||||
| £m | % | £m | % | £m | % | |||||||||||||
| Sales: | ||||||||||||||||||
| US | 1,134.4 | 70.5 | 1,126.0 | 71.4 | 978.1 | 70.5 | ||||||||||||
| UK | 473.6 | 29.5 | 452.1 | 28.6 | 409.2 | 29.5 | ||||||||||||
| Total | 1,608.0 | 100.0 | 1,578.1 | 100.0 | 1,387.3 | 100.0 | ||||||||||||
| Operating profit: | ||||||||||||||||||
| US | 155.2 | 71.8 | 145.1 | 72.3 | 132.2 | 74.0 | ||||||||||||
| UK | 67.0 | 31.0 | 60.7 | 30.2 | 50.0 | 28.0 | ||||||||||||
| Group central costs | (6.0 | ) | (2.8 | ) | (5.1 | ) | (2.5 | ) | (3.5 | ) | (2.0 | ) | ||||||
| Total | 216.2 | 100.0 | 200.7 | 100.0 | 178.7 | 100.0 | ||||||||||||
Financial review (continued)
Net debt
Net debt at 31 January 2004 was £79.9 million (1 February 2003: £140.1 million, £122.6 million restated at constant exchange rates). Group gearing (net debt to shareholders’ funds) at the year end was 11.0% (1 February 2003: 20.7%). Under UK GAAP, bank loans and overdrafts at 31 January 2004 include a $251.0 million borrowing secured against the Group’s US customer receivables (1 February 2003: $251.0 million). Excluding this $251.0 million facility net cash was £58.0 million (1 February 2003: net cash £12.9 million).
The Company funds part of its private label credit card receivables programme through a privately placed receivables securitisation. Under this securitisation, interests in the US receivables portfolio held by a trust were sold principally to institutional investors in the form of fixed-rate Class A, Class B and Class C investor certificates. The aggregate outstanding principal amount of the certificates totalled $251.0 million at 31 January 2004 and 24 March 2004. The certificates have a weighted average interest rate of 5.42% and interest is paid monthly in arrears from the finance charges collections generated by the receivables portfolio. The revolving period of the securitisation ends in December 2005, with a final expected principal payment date in November 2006.
In January 2002 the Group entered into a $70 million Conduit securitisation facility (the “Conduit”). Under this securitisation, interests in the US receivables portfolio held by a trust could be sold to Sheffield Receivables Corporation (a US subsidiary of Barclays Capital Inc.) in the form of an unsecured revolving variable rate certificate. The Conduit bears interest at a margin of 0.375% above the cost of funds paid by Sheffield Receivables Corporation. At 31 January 2004 and 24 March 2004 the amount outstanding under the Conduit was $nil.
In August 2001 the Group and certain of its subsidiaries entered into a $410 million unsecured multi-currency five year revolving credit facility agreement (the “Facility Agreement”) under which a syndicate of banks made facilities available to the Group in the form of multi-currency cash advances and sterling acceptance credits on, inter alia, the following terms:
| • | the Facility Agreement bears a maximum margin of 0.85% above LIBOR, though the margin may be lower dependent upon the performance of the Group. Since the commencement of the facility the margin has been 0.65% above LIBOR; and |
| • | the Facility Agreement is guaranteed by the Group’s principal holding and operating subsidiaries. |
The continued availability of the Facility Agreement is conditional upon the Group achieving certain financial performance criteria (see note 16 on page 74). It also has certain provisions which are customary for this type of agreement, including standard “negative pledge” and “pari passu” clauses. At 31 January 2004 and 24 March 2004 the amount outstanding under the Facility Agreement was $nil.
In July 1998 the Group entered into a $60 million unsecured seven year senior note issue (“Loan Note”), bearing a 7.25% fixed coupon. The Loan Note is also guaranteed by the Group’s principal holding and operating subsidiaries. The continued availability of the Loan Note is conditional upon the Group achieving certain financial performance criteria (see note 16 on page 74). The Loan Note also has certain provisions which are customary to this type of agreement, including standard “negative pledge” and “pari passu” clauses. At 31 January 2004 and 24 March 2004 the amount outstanding under the Loan Note was $30 million (1 February 2003: $45 million).
The principal financial covenants on each of these facilities are set out in note 16 on page 74.
It is the policy of the Group to enter into interest rate protection agreements in respect of at least 75% of its forecast US dollar borrowings. At 31 January 2004 the interest rate of forecast US dollar borrowings for 2004/05 was capped effectively at 5.66%.
Pensions
An actuarial valuation of the UK defined benefit pension scheme (“the Group Scheme”) was carried out at 5 April 2003. The market value of the Group Scheme’s assets at that date was £82.2 million, a deficit of £6.7 million on the Group Scheme’s accrued liabilities. As a result of the valuation the Group has recommenced contributions to the Group Scheme and in 2003/04 this amounted to £1.2 million. In 2004/05 contributions are expected to be £3.7 million. The Group has adopted FRS 17 – ‘Retirement Benefits’ and the FRS 17 valuation at 31 January 2004 showed a surplus in the Group Scheme of £1.8 million.
Contingent property liabilities
Approximately 150 UK property leases had been assigned by the Group up to 31 January 2004 (and remained unexpired and occupied by assignees at that date) and approximately 40 additional properties were sub-let at that date. Should the assignees or sub-tenants fail to fulfil any obligations in respect of those leases or any other leases which have at any other time been assigned or sub-let, the Group or one of its UK subsidiaries may be liable for those defaults. The number of such claims arising to date has been small, and the liability, which is charged to the profit and loss account as it arises, has not been material.
| 24 | Signet Group plc Annual Report & Accounts year ended 31 January 2004 |
Contractual obligations
Long term debt comprises borrowings with an original maturity of greater than one year. Purchase obligations comprise contracts entered into for the forward purchase of gold and US dollars with an original maturity of greater than one year. These contracts are
taken out to manage market risks. It is expected that operating commitments will be funded from future operating cash flows and no additional facilities will be required to meet these obligations.
| As at 31 January 2004 | Less than | Between one | Between three | More than | ||||||
| one year | and three years | and five years | five years | Total | ||||||
| £m | £m | £m | £m | £m | ||||||
| Long-term debt obligations | 8.2 | 146.2 | – | – | 154.4 | |||||
| Finance lease obligations | 2.4 | – | – | – | 2.4 | |||||
| Operating lease obligations | 120.4 | 224.9 | 203.2 | 563.9 | 1,112.4 | |||||
| Purchase obligations | 19.3 | 4.1 | – | – | 23.4 | |||||
| Creditors falling due after one year | – | – | – | 11.1 | 11.1 | |||||
| Total | 150.3 | 375.2 | 203.2 | 575.0 | 1,303.7 | |||||
Impact of constant exchange rates
The Group has historically used constant exchange rates to compare period to period changes in certain financial data. This is referred to as “at constant exchange rates” throughout these accounts. The Group considers this to be a useful measure for analysing and explaining changes and trends in the Group’s
results. The impact of the recalculation of sales, operating profit, profit before tax, earnings per share and net debt at constant exchange rates, including a reconciliation to the Group’s GAAP results, is analysed below.
| (1) | ||||||||||||
| 2002/03 | Growth at | |||||||||||
| Growth at | Impact of | at constant | constant | |||||||||
| 2002/03 | actual | exchange rate | exchange rates | exchange rates | ||||||||
| 2003/04 | as restated | exchange rates | movement | (non–GAAP) | (non–GAAP) | |||||||
| £m | £m | % | £m | £m | % | |||||||
| Sales by origin and destination | ||||||||||||
| UK | 501.0 | 473.6 | 5.8 | – | 473.6 | 5.8 | ||||||
| US | 1,116.2 | 1,134.4 | (1.6 | ) | (101.2 | ) | 1,033.2 | 8.0 | ||||
| 1,617.2 | 1,608.0 | 0.6 | (101.2 | ) | 1,506.8 | 7.3 | ||||||
| Operating profit: | ||||||||||||
| UK – Trading | 76.6 | 64.7 | 18.4 | – | 64.7 | 18.4 | ||||||
| – Group central costs | (5.7 | ) | (6.0 | ) | n/a | – | (6.0 | ) | n/a | |||
| 70.9 | 58.7 | n/a | – | 58.7 | n/a | |||||||
| US | 151.4 | 155.2 | (2.4 | ) | (13.9 | ) | 141.3 | 7.1 | ||||
| 222.3 | 213.9 | 3.9 | (13.9 | ) | 200.0 | 11.2 | ||||||
| Profit before tax | 211.9 | 199.9 | 6.0 | (12.4 | ) | 187.5 | 13.0 | |||||
| Earnings per share | 8.0p | 7.5p | 6.7 | (0.4 | )p | 7.1p | 12.7 | |||||
| Impact of | At constant | |||||||
| exchange rate | exchange rates | |||||||
| 31 January 2004 | 1 February 2003 | movement | (non–GAAP) | |||||
| £m | £m | £m | £m | |||||
| Net debt | (79.9) | (140.1) | 17.5 | (122.6) | ||||
| (1) | Restated for the implementation of FRS 17 – ‘Retirement Benefits’ (see note 17). |
| Signet Group plc Annual Report & Accounts year ended 31 January 2004 | 25 |
Financial review (continued)
Critical accounting policies
Critical accounting policies covering areas of greater complexity or those particularly subject to the exercise of judgement are listed below. There are no material off-balance sheet structures under UK GAAP. The principal accounting policies are set out in note 1 on pages 62 to 64.
UK retirement benefits
In 2003/04 the Group implemented FRS 17, resulting in a charge of £18.1 million that has been accounted for as a prior year adjustment charged directly to shareholders’ funds. Full details are given in note 17 on page 75. The surplus or deficit on the Group Scheme that is charged to shareholders’ funds through the Statement of Recognised Gains and Losses is subject to a number of assumptions and uncertainties. A qualified actuary is engaged to calculate the expected liabilities of the Group Scheme based on assumptions regarding salary and pension increases, inflation rates, discount rates and the long term rate of return expected on the Group Scheme’s assets. Details of these assumptions are given in note 22 on page 80. The value of the assets of the Group Scheme is measured as at the balance sheet date, this being particularly dependent on the value of equity investments held by the Group Scheme at that date.
Revenue recognition
Sales represent sales to customers outside the Group, exclusive of VAT and sales tax. Repair revenues are recognised when the service is complete and the merchandise is delivered to the customer. The revenue from the sale of warranties in the US, such as extended service plans on products, is recognised at the date of sale with provision being made for the estimated cost of future claims arising.
Stock valuation
Stock is valued on a first-in, first-out basis and includes appropriate overheads. Where necessary provision is made for obsolete, slow-moving and damaged stock. This provision represents the difference between the cost of the stock and its estimated market value, based upon stock turn rates, market conditions and trends in consumer demand. In the US stock losses are recognised at the mid-year and fiscal year end based on complete physical inventories. In the UK stock losses are estimated for the period from the last stock count date to the end of the financial year on a store by store basis. These estimates are based on the overall divisional stock loss experience since the last stock count.
Foreign currency translation
The results of overseas subsidiary undertakings are translated into pounds sterling at the weighted average rates of exchange,
based on US sales, during the period and their balance sheets and attributable goodwill at the rates at the balance sheet date. Exchange differences arising from the translation of the net assets and attributable goodwill of overseas subsidiary undertakings and matched foreign currency borrowings less deposits are charged or credited to reserves. Other exchange differences arising from foreign currency transactions are included in profit before taxation.
Depreciation and impairment
Depreciation is provided on freehold and long leasehold premises over a useful life not exceeding 50 years. Freehold land is not depreciated. Depreciation is provided on other fixed assets at rates between 10% and 331 /3 %. Shopfit depreciation rates have been set based on the refit cycle for each store fascia and the useful lives of each individual element of the shopfit. Tills and other IT equipment have separately determined depreciation rates.
Where appropriate, provision is made on assets that have a lower economic value than net book value. Additionally, provision is made against tangible fixed assets relating to stores planned for closure where the stores’ return on capital is below the level required. These impairment provisions are made on a store by store basis and updated annually based on actual closures and a review of individual store performance.
Lease costs and incentives
Operating lease costs are charged to the profit and loss account as incurred and amounts payable in respect of turnover leases are charged in the period to which the turnover relates. Premiums paid to acquire short leasehold properties are amortised over their lease period and incentives received relating to leased properties are amortised over the period to the next rent review.
In accordance with FRS 12, where the Group has onerous lease obligations, provision is made for the discounted cash outflow that is expected to arise under the lease. This will take account of any sublet income received or reasonably expected, incentives to be received or paid and the time to lease expiry or reversal of the net cash outflow, whichever is the later.
Receivables
Full provision is made for debts that are 90 days past their due date on a recency basis. A provision is also made based on the historic performance of the receivables portfolio. The bad debt experience of the Group has been relatively stable over the past five years at between 2.8% and 3.4% of sales.
| 26 | Signet Group plc Annual Report & Accounts year ended 31 January 2004 |
Goodwill
Purchased goodwill reflects the acquisition of Marks & Morgan in July 2000. The amortisation period of 20 years is in line with guidance in FRS 10 on the useful economic life of purchased goodwill. Although there is no requirement under FRS 11 for annual impairment reviews where the amortisation period does not exceed 20 years, such a review is performed annually as this is required under US GAAP in place of an amortisation charge. For 2003/04, this review indicated that no impairment charge was required.
Advertising and promotional costs
Advertising costs are expensed as incurred. In accordance with the guidance issued in the US under EITF 02-16, where vendor contributions are received in respect of identifiable promotional events, these are matched against the costs of these promotions. Vendor contributions that are received as general contributions and not against specific promotional events are allocated against stock.
International Accounting Standards
The Group will be required to adopt International Accounting Standards for the first time in 2005/06, the process and disclosures required having been specified in IFRS 1. The Group is actively considering the impact that the initial adoption of International Accounting Standards will have on the format and content of its published accounts.
Prior year review of the 52 weeks ended 1 February 2003
Total Group sales for 2002/03 rose by 1.9% to £1,608.0 million compared with £1,578.1 million in 2001/02 (7.9% on a comparable 52 week basis at constant exchange rates).
Group profit before tax for the year was £199.7£199.9 million (2001/02: £182.8£183.8 million), which represented a 16.2%15.7% increase on a comparable 52 week basis at constant exchange rates. After a tax charge of 35.5%35.4% (2001/02: 34.5%) earnings per share were 7.5p (2001/02: 7.1p), an increase of 5.6%. Operating profit increased by 7.7%7.6% to £216.2£213.9 million (2001/02: £200.7£198.8 million), a 14.8% increase on a comparable 52 week basis.
Sales
US
Like for like sales grew by 5.4%. Significant benefit was obtained from a number of management initiatives in merchandising, staff training, marketing and real estate. During the Christmas season consumer spending was more restrained and like for like sales increased by 4.3% in the fourth quarter, significantly ahead of the main competition. Jared continued to perform particularly well.Totalwell. Total sales for the year grew by 0.7%
to £1,134.4 million (8.6% on a comparable 52 week basis at constant exchange rates).
UK
The UK division had a good year. Particular advantage was derived from the focus on increasing diamond sales. Like for like sales were up by 5.2% and total sales rose to £473.6 million (2001/02: £452.1 million), a 6.1% increase on a comparable 52 week basis. Sales in H.Samuel were £279.1 million (2001/02: £277.3 million), with a like for like increase of 2.6%. Ernest Jones sales rose to £188.0 million (2001/02: £168.5 million) the like for like sales increase being 9.4%. This was a particularly good result given the strong comparatives. Against a background of a slowing in the growth in consumer expenditure, like for like sales
Operating profit
US
The trading environment in 2002/03 was very challenging. Tight control of costs, margins and inventory was maintained. Operating profit rose by 7.0% to £155.2 million (2001/02: £145.1 million). On a comparable 52 week basis at constant exchange rates the increase was 15.6%. Goodwill amortisation of £1.2 million was charged (2001/02: £1.3 million). Operating profit as a percentage of sales increased to 13.7% (2001/02: 12.9%), reflecting leverage from like for like sales growth which more than offset the adverse impact of immature store space. The gross margin rate was slightly down on last year’s level, due to anticipated changes in the sales mix. The increase in the price of gold bullion had limited adverse impact on the year but could have a greater impact in 2003/04. The ratio of bad debts to total sales decreased to 3.0% (2001/02: 3.2%) before a $2.2 million one-off benefit from the better than anticipated performance of the residue of the acquired Marks & Morgan receivables portfolio.
UK
In the UK the strong like for like sales growth underpinned an improvement in operating profit, which increased to 14.1%13.7% of sales (2001/02: 13.4%13.0%). Operating profit grew to £67.0£64.7 million (2001/02: £60.7£58.8 million), an increase of 10.4%10.0%, equivalent to 13.2%12.9% on a comparable 52 week basis.Thisbasis. This resulted from further leverage of the divisional cost base, with gross margin slightly ahead of last year.
Net income
Net income for the year increased by 7.7%7.2% to £128.9£129.1 million (2001/02: £119.7£120.4 million), 14.5%14.0% on a comparable 52 week basis at constant exchange rates.
22 Signet Group plc
| Signet Group plc Annual Report & Accounts year ended 31 January 2004 | 27 |
Financial review (continued)
Return on capital employed (“ROCE”)
The Group’s ROCE increased to 23.8%24.1% (2001/02: 23.3%)23.6). In the US the ROCE rose to 21.5% (2001/02: 20.4%) and in the UK there was a slight fall to 38.0%41.2% (2001/02: 39.4%43.6%). US capital employed included US in-house credit card debtors amounting to £299.2 million at 1 February 2003 (2 February 2002: £327.0 million).
Depreciation and capital expenditure
Depreciation charges were £36.6 million (2001/02: £33.4 million): £24.1 million in the US (2001/02: £23.0 million) and £12.5 million in the UK (2001/02: £10.4 million). Capital expenditure in the US was £33.1 million (2001/02: £41.0 million) and in the UK was £16.4 million (2001/02: £18.8 million).
Group costs
Group central costs amounted to £6.0 million (2001/02: £5.1 million) including a charge of £0.5 million relating to an increase in the provision against an onerous lease of a dormant Group property (2001/02: £nil).
Net interest payable
Net interest payable and similar charges amounted to £16.5£14.0 million (2001/02: £17.9 million, at constant exchange rates the equivalent figure was £16.8£15.0 million).
Taxation
The tax charge of £70.8 million (2001/02: £63.1£63.4 million) represents an effective tax rate of 35.5%35.4% (2001/02: 34.5%). It is anticipated that the effective tax rate for the Group in 2003/04 will remain at approximately the same level as in 2002/03.
Dividends
In November 2002 an interim dividend of 0.310p per share was paid (2001/02: 0.289p).The Board is recommending to shareholders. Additionally, a final dividend of 1.80p (2001/02: 1.50p) per share for 2002/03, which, subject to shareholder approval, is to bewas paid on 14 July 2003 to those shareholders on the register of members at close of business on 6 June 2003. Future dividend policy will continue to take account of earnings, cash flow, gearing and the needs of the business.
Impact of 53rd week
2001/02 was a 53 week financial year.Theyear. The extra week increased total sales by 1.7% (1.8%£22.4 million (£16.5 million in the US and 1.6%£5.9 million in the UK) and contributed £4.0 million to operating profit (£2.5 million in the US and £1.5 million in the UK). Net of additional interest costs of £0.4 million, profit before tax benefited by £3.6 million in 2001/02.
Liquidity and capital resourcesImpact of constant exchange rates
The Group requires significant working capitalhas historically used constant exchange rates to support its inventory requirements.The Group’s working capital requirements fluctuate during the yearcompare period to period changes in certain financial data. This is referred to as a result of the seasonal nature of its business and normally reach their highest levels in the late Autumn in preparation for the Christmas season.
Cash generated from operating activities amounted to £182.2 million (2001/02: £188.0 million).This reflected an increase in operating profit, offset by working capital requirements for stores opened in the period. It is anticipated that in 2003/04 there will be a further increase in working capital due to planned store openings. Net financing costs of £16.5 million (2001/02: £17.9 million) and tax of £57.3 million (2001/02: £57.9 million) were paid. Cash flow before investing activities was £108.5 million (2001/02: £112.2 million).
Group capital expenditure was £49.5 million (2001/02: £60.7 million). Disposal proceeds were £1.3 million (2001/02: £nil). Capital expenditure in 2003/04 is expected to be approximately £65 million, the vast majority relating to store openings, refurbishments and relocations.
Equity dividends of £30.8 million (2001/02: £27.7 million) were paid.
‘at constant exchange rates’ throughout these accounts. The Group considers its currently available capital resources to be sufficientthis a useful measure for its present requirements.
Net debtNet debt at 1 February 2003 was £140.1 million (2 February 2002: £201.7 million, £175.6 million restated at constant exchange rates). Group gearing (that is the ratio of net debt to shareholders’ funds) at the year end was 20.1% (2 February 2002: 29.7%). Under UK GAAP, bank loansanalysing and overdrafts at 1 February 2003 include a $251.0 million borrowing secured againstexplaining changes and trends in the Group’s US customer receivables (2 February 2002: $251.0 million). Excluding this $251.0 million facility net cash was £12.9 million (2 February 2002: net debt £24.9 million).
results. The Company funds part of its private label credit card receivables programme through a privately placed receivables securitisation. Under this securitisation, interests in the US receivables portfolio held by a trust were sold principally to institutional investors in the form of fixed-rate Class A, Class B and Class C investor certificates.The aggregate outstanding principal amountimpact of the certificates totalled $251.0 million at 1 February 2003 and 26 March 2003.The certificates have a weighted average interest rate
Signet Group plc 23
recalculation of 5.42% and interest is paid monthly in arrears from the finance charges collections generated by the receivables portfolio.The revolving period of the securitisation ends in December 2005, with a Final Expected Principal Payment Date in November 2006.This securitisation replaced a previous securitisation facility of $191.5 million, which commenced repayment in December 2000 and was fully repaid in September 2001.
In January 2002 the Group entered into a $70 million Conduit securitisation facility (the “Conduit”). Under this securitisation, interests in the US receivables portfolio held by a trust could be sold to Sheffield Receivables Corporation (a US subsidiary of Barclays Capital Inc.) in the form of an unsecured revolving variable rate certificate. The Conduit bears interest at a margin of 0.375% above the cost of funds paid by Sheffield Receivables Corporation. At 1 February 2003 and 26 March 2003 the amount outstanding under the Conduit was $nil.
In August 2001 the Group and certain of its subsidiaries entered into a $410 million unsecured multi-currency five year revolving credit facility agreement (the “Facility Agreement”) under which a syndicate of banks made facilities available to the Group in the form of multi-currency cash advances and sterling acceptance credits on,inter alia, the following terms:
The continued availability of the Facility Agreement is conditional upon the Group achieving certain financial performance criteria (see note 16 on page 69). It also has certain provisions which are customary for this type of agreement, including standard “negative pledge” and “pari passu” clauses. At 1 February 2003 the amount outstanding under the Facility Agreement was $nil and at 26 March 2003 it was $nil.
In July 1998 the Group entered into a $60 million unsecured seven year senior note issue (“Loan Note”), bearing a 7.25% fixed coupon.The Loan Note is also guaranteed by the Group’s principal holding andsales, operating subsidiaries.The continued availability of the Loan Note is
The principal financial covenants on each of these facilities are set out in note 16 on page 69.
It is the policy of the Group to enter into interest rate protection agreements in respect of at least 75% of its forecast US dollar borrowings. At 1 February 2003 the interest rate (before margin) on 75% of forecast US dollar borrowings for 2003/04 was capped effectively at 5.79%. Further details of the interest rate protection agreements are given in note 26 on page 78.
PensionsIn 2002/03 the Group has continued to account for its UK defined benefit scheme under SSAP 24. Consistent with prior years, the Group has used the most recent actuarial investigation (for 2002/03 as at 5 April 2002) as the basis for the SSAP 24 calculations.
Under this accounting treatment the net pension charge in respect of the UK scheme is £nil (2001/02: £nil).The balance sheet continues to reflect a deferred asset, before deferred tax, of £19.1 million (2001/02: £19.1 million).
Under the transitional arrangements for FRS17 the additional required disclosures are set out in note 22 on page 74. In summary, compliance would have resulted in a net pension credit of £0.2 million in respect of the UK Scheme for 2002/03. As a result of the fall in the value of the UK Scheme’s assets, under FRS17 the market value of those assets compared to the present value of the UK Scheme’s liabilities at 1 February 2003 showed a deficit of £6.7 million before deferred tax, compared to a surplus of £24.9 million at 2 February 2002.
Contingent property liabilitiesApproximately 164 UK property leases had been assigned by the Group up to 1 February 2003 (and remained unexpired and occupied by assignees at that date) and approximately 45 additional stores were sub-let at that date. Should the assignees or sub-tenants fail to fulfil any obligations in respect of those leases or any other leases which have at any other time been assigned or sub-let, the Group or one of its UK subsidiaries may
24 Signet Group plc
Critical accounting policiesCritical accounting policies for Signet include revenue recognition, particularly with regard to special customer programmes such as warranties; stock valuation; accounting for operating leases commitments; fixed asset depreciation and the bad debt provisioning policy relating to the in-house credit operation in the US.There are no material off-balance sheet structures under UK generally accepted accounting principles.The principal accounting policies are set out in note 1 on pages 58 to 60 and are summarised below.
Signet Group plc 25
53 weeks ended 2 February 2002Total Group sales for 2001/02 rose by 13.8% to £1,578.1 million compared with £1,387.3 million in 2000/01.The like for like sales increase of 3.1% was unaffected by the 53rd week.
Group profit before tax for the year was £182.8 million (2000/01: £162.8 million). After a tax charge of 34.5% (2000/01: 32.0%) earnings per share were 7.1p (2000/01: 6.6p), an increase of 7.6%. Operating profit increased by 12.3% to £200.7 million (2000/01: £178.7 million).
SalesUSLike for like sales (including Marks & Morgan from 31 July 2001) grew by 0.6%. Significant benefit was obtained from both merchandising and marketing initiatives, including a further concentration on broadcast media advertising. Like for like sales were down by 2.3% in the first nine months of the year reflecting the challenging trading conditions. During the Christmas season consumer spending improved and like for like sales increased by 4.6% in the fourth quarter, ahead of the main competition. Jared continued to perform particularly well.Total sales for the year grew by 15.1% to £1,126 million (11.3% at constant exchange rates).The acquisition of Marks & Morgan (which was completed on 31 July 2000) contributed sales of £42.0 million (3.7% of annual sales growth) and new space (excluding Marks & Morgan) contributed 5.1%.
UKIn a favourable retail environment the UK division had an excellent year. Advantage was derived from product range improvements, increased marketing activity, enhanced staff incentives and a stepped-up programme of store refurbishments. Like for like sales were up by 9.4% and total sales rose to £452.1 million (2000/01: £409.2 million). Sales in H.Samuel were £277.3 million (2000/01: £259.8 million), with a like for like increase of 6.4%. For Ernest Jones like for like sales increased by 14.6% and sales were £168.5 million (2000/01: £143.9 million). In the fourth quarter like for like sales increased by 9.7% (H.Samuel up by 7.2% and Ernest Jones up by 14.2%), a particularly strong performance given the demanding comparatives.
Operating profitUSThe trading environment in 2001/02 was very challenging. Operating profit rose by 9.8% to £145.1 million (2000/01: £132.2 million) and on a constant exchange rate basis increased by 6.1%. Goodwill amortisation of £1.3 million
UKIn the UK the strong like for like sales growth underpinned an improvement in operating profit, which, as a percentage of sales, increased to 13.4% (2000/01: 12.2%). Operating profit grew to £60.7 million (2000/01: £50.0 million), an increase of 21.4%.This resulted from further leverage of the divisional cost base, with gross margin in line with that of last year.
Net incomeNet income for the year increased by 8.1% to £119.7 millon (2000/01: £110.7 million).
Return on capital employed (“ROCE”)The Group’s ROCE decreased to 23.3% (2000/01: 25.2%), and to 20.4% in the US (2000/01: 23.1%) while ROCE increased to 39.4% in the UK (2000/01: 35.6%). US capital employed included US in-house credit card debtors amounting to £327.0 million at 2 February 2002 (27 January 2001: £314.7 million).
Depreciation and capital expenditureDepreciation charges were £33.4 million (2000/01: £30.0 million): £23.0 million in the US (2000/01: £19.2 million) and £10.4 million in the UK (2000/01: £10.8 million).
Capital expenditure in the US was £41.0 million (2000/01: £46.5 million) and in the UK was £18.7 million (2000/01: £9.7 million).
Group costsGroup central costs amounted to £5.1 million (2000/01: £4.9 million before crediting property gains of £1.4 million).
Net interest payableNet interest payable and similar charges amounted to £17.9 million (2000/01: £15.9 million, at constant exchange rates, £16.5 million).The increase was principally dueincluding a reconciliation to the full year fundingGroup’s GAAP results, is analysed below.
All figures for 2001/02 are stated on a comparable 52 week basis. The impact of the Marks & Morgan acquisition which53rd week is described in the paragraph above.
| 2001/02 | (1) | 2001/02 | Growth at | ||||||||||
| comparable | Growth at | Impact of | at constant | constant | |||||||||
| 2002/03 | 52 week | actual | exchange rate | exchange rates | exchange rates | ||||||||
| as restated | (1) | basis | exchange rates | movement | (non–GAAP) | (non–GAAP) | |||||||
| £m | £m | % | £m | £m | % | ||||||||
| Sales by origin and destination | |||||||||||||
| UK | 473.6 | 446.2 | 6.1 | – | 446.2 | 6.1 | |||||||
| US | 1,134.4 | 1,109.5 | 2.2 | (65.3 | ) | 1,044.2 | 8.6 | ||||||
| 1,608.0 | 1,555.7 | 3.4 | (65.3 | ) | 1,490.4 | 7.9 | |||||||
| Operating profit: | |||||||||||||
| UK | – Trading | 64.7 | 57.3 | 12.9 | – | 57.3 | 12.9 | ||||||
| – Group central costs | (6.0 | ) | (5.1 | ) | n/a | – | (5.1 | ) | n/a | ||||
| 58.7 | 52.2 | n/a | – | 52.2 | n/a | ||||||||
| US | 155.2 | 142.6 | 8.8 | (8.4 | ) | 134.2 | 15.6 | ||||||
| 213.9 | 194.8 | 9.8 | (8.4 | ) | 186.4 | 14.8 | |||||||
| Profit before tax | 199.9 | 180.2 | 10.9 | (7.4 | ) | 172.8 | 15.7 | ||||||
| Net income | 129.1 | 118.1 | 9.3 | (4.9 | ) | 113.2 | 14.0 | ||||||
| (1) | Restated for the implementation of FRS 17 – ‘Retirement Benefits’ (see note 17). |
26 Signet Group plc
| 28 | Signet Group plc Annual Report & Accounts year ended 31 January 2004 |
took place in July 2000, the impact of which was partially offset by the benefit of lower interest rates.
TaxationThe tax charge of £63.1 million (2000/01: £52.1 million) represents an effective tax rate of 34.5% (2000/01: 32.0%).
Impact of 53rd week2001/02 was a 53 week financial year.The extra week increased total sales by 1.7% (1.8% in the USRisk and 1.6% in the UK) and contributed £4.0 million to operating profit (£2.5 million in the US and £1.5 million in the UK). Net of additional interest costs of £0.4 million, profit before tax benefited by £3.6 million.other factors
Prior year adjustmentIn 2001/02 the Group adopted FRS 19 – ‘Deferred Tax’, which requires that deferred tax be provided in respect of all timing differences regardless of the likelihood of the reversal of such timing differences. As a result an additional provision for deferred tax of £6.2 million was accounted for by way of a prior year adjustment charged directly to shareholders’ funds. There is no material effect on the profit and loss account for the year ended 2 February 2002 or the preceding years.
Signet Group plc 27
Forward-looking statements
All statements, other than statements of historical fact included in this document, are or may be deemed to be forward-looking statements within the meaning of the United States Private Securities Litigation Reform Act of 1995. These statements, based upon management’s beliefs as well as on assumptions made by and data currently available to management, appear in a number of places throughout this document. These forward-looking statements are not guarantees of future performance and are subject to a number of risks. Important factors that could cause actual results to differ materially from those discussed in such forward-looking statements include:
| • | adverse trends in the general economy which may impact negatively on discretionary consumer spending, including unemployment levels, the level of consumers’ disposable income, consumer confidence, business conditions, interest rates, consumer debt levels, availability of credit and levels of taxation; |
| • | the Group’s ability to anticipate consumer preferences and the merchandising, pricing and inventory policies it follows; |
| • | the reputation of the Group and its trading names, together with the success of the Group’s marketing and promotional programmes; |
| • | the ability to recruit, train and retain staff; |
| • | the extent and results of the Group’s net store expansion and refurbishment strategy together with the availability of suitable real estate; |
| • | the level of competition in the selling of jewellery and the development of new distribution channels in competition with the Group; |
| • | the level of dependence on particular suppliers of merchandise; |
| • | fluctuations in the supply, price and availability of diamonds, gold and other precious and semi-precious metals and stones as well as the consumer attitude to those and other products; |
| • | the seasonality of the Group’s business, the risk of disruption during the Christmas trading period, and the availability of inventory during the three months leading up to the Christmas season; |
| • | social, ethical and environmental risks; |
| • | the suitability and reliability of the Group’s systems and procedures, including its information technology, warehousing and distribution systems; |
| • | the cost and availability of borrowings and equity capital; and |
Impact of general economic conditions
Jewellery purchases are discretionary and may be particularly affected by adverse trends in the general economy and changes in taste by consumers.economy.
The success of the Group’s operations depends to a significant extent upon a number of factors relating to discretionary consumer spending.Thesespending. These include economic conditions and perceptions of such conditions by consumers, employment, the rate of change in employment, the level of consumers’ disposable income, business conditions, interest rates, consumer debt levels, availability of credit and levels of taxation for the economy as a whole and in regional and local markets where the Group operates.Thereoperates. There can be no assurance that consumer spending on jewellery will not be adversely affected by changes in general economic conditions. However, due to the limited seasonality in the product mix the risk of having to discount inventory in order to be correctly stocked for the next selling season is more limited than for some other retail sectors.
As a substantial proportion of the Group’s US sales are made on credit, any significant deterioration in general economic conditions or consumer debt levels may inhibit consumers’ use of credit and cause a material adverse effect on the Group’s revenues and profitability. Furthermore, any downturn in general or local economic conditions in the markets in which the Group operates may adversely affect its collection of outstanding credit accounts receivable and hence the net bad debt charge. Currently there are all-time high levels of consumer debt in the US.The Group’sUS however the level of net bad debt charge as a percentage of credit sales in 2002/03the Group’s US division in 2003/04 was below that ofthe lowest for the last fiveeight years.
Merchandise selection, pricing, inventory and purchasing
The Group depends on consumer fashions, preferences for jewellery in general and the demand for particular products. Design trends in jewellery normally only change over relatively long periods and there is little seasonality in the merchandise mix.Themix. The ability to predict accurately future changes in taste, respond to changes in consumer preferences, carry the inventory demanded by customers, deliver the appropriate quality, price products correctly and implement effective purchasing procedures, all have an important influence on determining sales performance and achieved gross margin (see pages 1112 and 18 for more details)details of the Group’s merchandising and purchasing procedures).
28 Signet Group plc
| Signet Group plc Annual Report & Accounts year ended 31 January 2004 | 29 |
Risk and other factors (continued)
Market research and theThe Group’s operating experience suggestsuggests that while the price of jewellery is a consideration for consumers it is not among the top three factors in determining where they buy jewellery.Thejewellery. The Group believes these factors to be the level of service provided to the customer, the quality together with the selection of merchandise offered and the reputation of the retailer. Therefore while discounting price may increase sales, it may not increase profit.
Reputation and marketing
Primary factors in determining customer buying decisions in the jewellery sector include customer confidence in the retailer and the merchandise sold, together with the level and quality of customer service.Theservice. The Group carries out quality control and staff training procedures and provides customer service facilities to help protect its reputation. In 2002/03reputation (see page 104 for details of the procedures for resolvingprocesses by which the Group obtains an understanding of customer issues in the stores were enhanced.attitudes).
The ability to differentiate the Group’s stores from competitors by its branding, marketing and advertising programmes is a factor in attracting consumers.Thereforeconsumers. Therefore these programmes are carefully tested and their success monitored by methods such as market research (see pages 1312 and 1918 for more details).
The Diamond Trading Company (“DTC”), a subsidiary of De Beers Consolidated Mines Limited (“De Beers”), promotes diamonds and diamond jewellery in the US and the UK. The level of support provided by the DTC and the success of the promotions influence the size of the total jewellery market in those countries.
The Group’s reputation in the financial markets can influence the availability of capital, the cost of capital and the share price.
Social, ethical and environmental (“SEE”) matters can also influence the Group’s reputation, demand for merchandise by consumers, the ability to recruit staff, relations with suppliers and standing in the financial markets. Using outside consultants, the Group has continued to carry out benchmarking and a risk assessment of its policies, procedures and controls with regard to SEE matters. As with all retailers the greatest risks relate to customer service and to the supply chain (see below). SEE matters are dealt with in more detail on pages 97 to 99 and in the corporate responsibility section onwww.signetgroupplc.com.
Staff
In speciality jewellery retailing the level and quality of customer service is largely determined by the effectiveness of recruitment, training and retention of suitably qualified sales staff and this will help determine sales and profitability. The recruitment, training and retention of suitably qualifiedsupport provided to the Group’s store employees by staff at the divisional head offices and in the corporate functions will also influence the performance of the Group. Consequently the Group has in place
Store portfolio
The future growth of sales is partly dependent on the extent and results of the Group’s net space expansion and refurbishment strategy.Thestrategy. The Group has followed a steady programme of space expansion and refurbishment and has established capital expenditure procedures with investment criteria set by the Board.TheBoard.
The projections used for investment decisions are reviewed and adjusted based on experience and economic conditions.
In particular, the success of the Jared off-mall destination store concept, which accounts for the majority of the Group’s net increase in space, will influence the future performance of the Group. This concept has been tested and developed over a number of years and its performance against the investment model is regularly reviewed. The rate of development is dependent on a number of factors including obtaining suitable real estate, the capital resources of the Group and the availability of appropriate staff and management.
The Group’s results are dependent on a number of factors relating to its stores.Thesestores. These include the availability of property, the location of the mall or shopping centre, the availability of attractive locations within a mall or high street, the terms of leases agreed with landlords and the design and maintenance of the stores. In addition, the Group’s operations, particularly in the US, are dependent upon the continued popularity of malls as a shopping destination and the ability of malls, their tenants and other mall features to attract customers.
Competition
Competitive factors in the jewellery sector are discussed in the US and UK Operatingoperating reviews (see pages 7 to 20)19).
If the Group falls behind competitors with respect to one or more of these factors, the Group’s operating results of operations or financial condition could be adversely affected. In the US the Group has an estimated 6.7%7% market share of the speciality jewellery sector and has only one major national competitor. While another major national brand could develop, the sector is highly fragmented. In the UK the Group has an estimated 17% share of the total jewellery sector and has only limited scope to increase sales by opening new stores.
The channels through which consumers buy jewellery continually evolve and a major non-speciality retailer could
Signet Group plc 29
enter the wider jewellery market. In the US, for example, sales by discount retailers have increased, while those of the department stores have been in relative decline and catalogue retailers have withdrawn from the market. In the UK a number of fashion and general retailers, including a major supermarket chain, have introduced jewellery into their ranges whilst others have reduced their selection. In both the US and the UK Internet retailers sell jewellery and watches. The Group monitors the competitive environment and the development of possible new channels of distribution such as the Internet. As part of this process there are marketing web sites for each of the Group’s major brands, and regular exercises to “shop the competition” take place.
| 30 | Signet Group plc Annual Report & Accounts year ended 31 January 2004 |
Supply chain
During 2002/032003/04 the Group had one supplier that accounted for 9%8% of its merchandise. No other supplier accounted for more than 5% of its merchandise. Although the Group believes that alternative sources of supply are available, the abrupt loss of any significant supplier during the three month period (August to October) leading up to the Christmas season could result in a material adverse effect on the Group’s business. The Group is therefore in regular dialogue with suppliers and uses its merchandising systems to test and predict its future inventory needs.
Raw materials
The jewellery industry generally is affected by fluctuations in the price and supply of diamonds, gold and, to a lesser extent, other precious and semi-precious metals and stones. The Group undertakes limitedsome hedging of its requirement for gold through the use of options, forward contracts and outright commodity purchasing. It does not hedge against fluctuations in the cost of diamonds.Thediamonds. The Group does hedge the exposure of the UK division to the US dollar with regard to diamond and other costs of goods sold. The cost of raw materials is only part of the costs involved in the retail selling price of jewellery with labour costs also being a significant factor.
Diamonds are the largest product category sold by the Group.TheGroup. The supply and price of diamonds in the principal world markets are significantly influenced by a single entity, the Diamond Trading Company (“DTC”), a subsidiary of De Beers Consolidated Mines Limited (“De Beers”).Theentity. The DTC (and its predecessor, the Central Selling Organisation) has traditionallyfor many years controlled the marketing of a substantial majority of the world’s supply of rough diamonds and sells diamonds to diamond cutters in quantities and at prices determined at its sole discretion. In 2000 De Beers announced a change in corporate strategy designed to improve the efficiency of the supply chain and in 2001 there was a change in controlincrease the level of De Beers.To date these changes have not had any material impact on the availability and pricing of, and demandmarketing support for diamonds, but may do so in the future.diamonds.
The availability of diamonds to the DTC and the Group’s suppliers is to some extent dependent on the political situation in diamond producing countries. Until alternative sources can be developed, any sustained interruption in the supply of diamonds from the significant producing countries could adversely affect the Group and the retail jewellery industry as a whole.
An example of an issue that could affect confidence in this way is that of “conflict diamonds”,conflict diamonds, which is the term used for diamonds sold by rebel movements to raise funds for military campaigns.Therecampaigns. There have been a number of United Nations resolutions regarding “conflict diamonds”conflict diamonds and an international agreement, known as the Kimberley Process, was signed in November 2002. This iswas designed to exclude “conflict diamonds”conflict diamonds from the legitimate diamond trade andtrade. During 2003 legislation was due to be implemented with effect from 1 January 2003. Legislation supporting the Kimberley Process became fully effectivepassed in the European Union on 13 February 2003. Inand the United StatesUS implementing the Kimberley Process is currently being implemented by a voluntary industry initiative.TheProcess. The impact of the Kimberley Process and its associated legislation ishas not known.resulted in any disruption to the supply of rough diamonds to date and has helped to improve the integrity of the supply chain.
The Group has reviewed its procedures and documentation for compliance with the Kimberley Process and made appropriate amendments. In addition, staff have beenwere briefed and suppliers have been contacted about the changes. During the year the Group’s internal audit function checked for compliance with the new procedures. See page 98104 for further information on the Supplier Code of Conduct, the Kimberley Process and the Group’s policy on “conflict diamonds”.
SystemsThe Group is dependent on the suitability and reliability of its systems and procedures, including its information technology, warehousing and distribution systems.The Group has emergency procedures and carries out rehearsals to test them.The Group carries out evaluation, planning and implementation analysis before updating or introducing new systems that have an impact on a function critical to the Group.conflict diamonds.
Seasonality
The Group’s business is highly seasonal, with a very significant proportion of its sales and operating profit generated during its fourth quarter, which includes the Christmas season.Theseason. The Group expects to continue to experience a seasonal fluctuation in its sales and profit. Therefore the Group has limited ability to compensate for shortfalls in fourth quarter sales or earnings by changes in its operations and strategies in other quarters, or to recover
30 Signet Group plc
from any extensive disruption due to inclement weather conditions. A significant shortfall in results for the fourth quarter of any financial year would thus be expected to have a material adverse effect on the Group’s annual results of operations. However, due to the limited seasonality in the product mix, the risk of having to discount inventory in order to be correctly stocked for the next selling season is more limited than for some other retail sectors.
Social, ethical and environmental risks
Social, ethical and environmental (“SEE”) matters influence the Group’s reputation, demand for merchandise by consumers, the ability to recruit staff, relations with suppliers and standing in the financial markets. Signet therefore is committed to managing the SEE risks and responsibilities facing the Group. This commitment stems from the understanding that Signet’s success is dependent on the strength and effectiveness of its relationships with its various stakeholders: shareholders, customers, employees and suppliers.
| Signet Group plc Annual Report & Accounts year ended 31 January 2004 | 31 |
Risk and other factors (continued)
In recent years stakeholder expectations of public companies have increased. Managing and responding as a business to these changing expectations, including with regard to SEE issues, is part of the normal responsibilities of corporate management.
The Group regularly carries out SEE risk reviews and benchmarking exercises with the assistance of an external adviser. Such reviews include an assessment of Group policies, procedures and controls in respect of SEE matters. Reports are regularly made to the Group’s Risk Committee and to the Board.
On 21 October 2001 the Association of British Insurers published guidelines on Socially Responsible Investment. In line with that guidance the Board confirms that they have identified and assessed the Group’s SEE risks and that these are being managed.
SEE matters are dealt with in more detail on pages 103 to 106 and in the corporate responsibility section on www.signetgroupplc.com.
Systems
The Group is dependent on the suitability and reliability of its systems and procedures, including its information technology, warehousing and distribution systems. The Group has emergency procedures and carries out rehearsals to test them. The Group carries out evaluation, planning and implementation analysis before updating or introducing new systems that have an impact on a function critical to the Group.
Equity and debt financing
The Group is dependent upon the availability of equity and debt financing to fund its operations and growth. Therefore it prepares annual budgets, medium term plans and headroom models which help to identify the future capital requirements so that appropriate facilities can be put in place on a timely basis. If these models are inaccurate adequate facilities may not be available.
Financial market risks
The Group publishes its consolidated annual accounts in pounds sterling. The Group held approximately 72%64% of its total assets in US dollars at 1 February 200331 January 2004 and generated approximately 71%69% of its sales and 72%68% of its operating profit in US dollars for the financial year then ended. Thus, although the Group’s US operations make substantially all of their sales and incur substantially all of their expenses in US dollars, in translating the results of its US operations, the Group’s results are subject to fluctuations in the exchange rate between the pound sterling and the US dollar. Accordingly, depreciation in the weighted average value of the US dollar against the pound sterling could
decrease reported revenues and operating profit (as was the case in 1997/98, 1998/992002/03 and 2002/03)2003/04), and appreciation in the weighted average value of the US dollar against the pound sterling could increase reported revenues and operating profit (as was the case in 1999/00, 2000/01 and 2001/02). The Board has chosen not to hedge the translation effect of exchange rate movements on the results of the Group given that there is nolittle movement of cash.cash between the Group’s two divisions.
As part of its long-term strategy, the Group seeks to finance its US net assets with borrowings denominated in US dollars as a hedge against the impact of exchange rate fluctuations on its US operating profit. Currently nearly all of the Group’s borrowings are denominated in US dollars. Therefore fluctuations in the exchange rate between the pound sterling and the US dollar affect the amount of the Group’s consolidated borrowings.
In addition, the prices of materials and certain products bought on the international markets by the UK division are denominated in US dollars, and therefore the Group has an exposure to exchange rates on the cost of goods sold which will have an opposite effect to its exposure on US operating profit.Theprofit. The Group does use hedging operations in respect of purchases of US dollars by its UK operating division, within the treasury guidelines approved by the Group’s Board.
Cash dividends paid by the Group in respect of the shares will be in pounds sterling and fluctuations in the exchange rate between the pound sterling and the US dollar will affect the dollar amount received by holders of ADSs upon conversion of such dividends. Moreover, fluctuations in the exchange rate between the pound sterling and the US dollar will affect the US dollar equivalents of the pound sterling price of the shares on the London Stock Exchange and, as a result, are likely to affect the market price of the ADSs in the US.
The table belowon page 33 sets out, for the calendar years indicated, the average, high, low and period end exchange rates for the pound sterling expressed in US dollars per £1.00.£1.
The Group’s policy is to manage financial risk resulting from exposure to currency and interest rate fluctuations. Translation exposure relating to non-pound sterling denominated assets in the US is partially hedged by borrowing in US dollars. Interest rate exposure is managed through the use of swaps, caps and floors.
| Exchange rates between £ sterling and the US dollar | |||||||||
Calendar year | Average(1) | High | Low | At period end | |||||
| 1998 | 1.66 | 1.72 | 1.61 | 1.67 | |||||
| 1999 | 1.62 | 1.68 | 1.55 | 1.62 | |||||
| 2000 | 1.51 | 1.65 | 1.40 | 1.50 | |||||
| 2001 | 1.44 | 1.50 | 1.38 | 1.45 | |||||
| 2002 | 1.51 | 1.61 | 1.41 | 1.61 | |||||
| 2003 (up to 26 March) | 1.59 | 1.65 | 1.56 | 1.57 | |||||
(1) The average of the exchange rates on the last day of each full month during the period.
Signet Group plc 31
A committee of the Board is responsible for the implementation of treasury policies and guidelines which are considered to be
| 32 | Signet Group plc Annual Report & Accounts year ended 31 January 2004 |
Exchange rates between pound sterling and the US dollar(1)
| At period | ||||||||
| Average | High | Low | end | |||||
| Calendar year | ||||||||
| 1999 | 1.62 | 1.68 | 1.55 | 1.62 | ||||
| 2000 | 1.51 | 1.65 | 1.40 | 1.50 | ||||
| 2001 | 1.44 | 1.50 | 1.38 | 1.45 | ||||
| 2002 | 1.51 | 1.61 | 1.41 | 1.61 | ||||
| 2003 | 1.62 | 1.79 | 1.55 | 1.77 | ||||
| 2004 (cumulative to 24 March) | 1.81 | 1.91 | 1.78 | 1.84 | ||||
| Month | ||||||||
| September 2003 | 1.60 | 1.66 | 1.56 | 1.66 | ||||
| October 2003 | 1.67 | 1.71 | 1.65 | 1.70 | ||||
| November 2003 | 1.69 | 1.72 | 1.65 | 1.72 | ||||
| December 2003 | 1.74 | 1.79 | 1.72 | 1.77 | ||||
| January 2004 | 1.81 | 1.86 | 1.78 | 1.82 | ||||
| February 2004 | 1.85 | 1.91 | 1.81 | 1.87 | ||||
| (1) | Based on unweighted data points sourced from Reuters. |
appropriate by the Board for the management of financial risk.Therisk. The Group’s funding, liquidity and exposure to interest rate and exchange rate risks are managed by the Group’s treasury department.Thedepartment. The Group uses derivative instruments for risk management purposes only, and these are transacted by specialist treasury personnel.
For financial instruments held, the Group has used a sensitivity analysis technique that measures the change in the fair value of the Group’s financial instruments from hypothetical changes in market rates and this is shown in the table below.
The amounts generated from the sensitivity analysis are forward-looking estimates of market risk assuming certain adverse market conditions occur. Actual results in the future may differ materially from those projected due to changes in the portfolio of financial instruments held and actual developments in the global financial markets.Thesemarkets. These may cause fluctuations in interest and exchange rates to exceed the hypothetical amounts disclosed in the table below.
The analysis method used by the Group to assess and mitigate risk discussed below should not be considered a projection of likely future events and losses.
events.
The example shown for changes in the fair values of borrowings and associated derivative financial instruments at 1 February 200331 January 2004 is set out in the table below.Thebelow. The fair values of borrowings and derivative financial instruments are estimated by discounting the future cash flows to net present values using appropriate market rates prevailing at the period end.
The estimated changes in fair values for interest rate movements are based on an instantaneous decrease of 1% (100 basis points) in the specific rate of interest applicable to each class of financial instruments from the levels effective at 1 February 200331 January 2004 with all other variables remaining constant.Theconstant. The estimated changes in the fair value for foreign exchange rates are based on an instantaneous 10% weakening of the pound sterling against the US dollar from the levels applicable at 1 February 200331 January 2004 with all other variables remaining constant.
| Fair value changes arising from: | 10% | |||||||||||||||
| Estimated | 1% | weakening in | Estimated | |||||||||||||
| fair value at | decrease in | £ against $ | fair value at | |||||||||||||
| 31 January | interest rates | favourable/ | 1 February | |||||||||||||
Estimated fair value at 1 February 2003 | 1% decrease in interest rates (unfavourable) | 10% weakening in £ against $ favourable/ (unfavourable) | Estimated fair value at 2 February 2002 | 2004 | (unfavourable) | 2003 | ||||||||||
| £m | £m | £m | £m | £m | £m | £m | £m | |||||||||
| Borrowings | (229.4 | ) | (9.0 | ) | (23.9 | ) | (268.1 | ) | (207.9 | ) | (6.8 | ) | (17.2 | ) | (229.4 | ) |
| Foreign currency receivables | 299.2 | – | 33.2 | 327.0 | ||||||||||||
| Foreign currency receivable | 292.9 | – | 32.5 | 299.2 | ||||||||||||
| Foreign exchange contracts | (1.4 | ) | – | 2.9 | – | (2.9 | ) | – | 4.1 | (1.4 | ) | |||||
| Commodity hedging contracts | (2.1 | ) | – | (2.1 | ) | – | ||||||||||
32 Signet Group plc
| Signet Group plc Annual Report & Accounts year ended 31 January 2004 | 33 |
Directors, officers and advisers
Directors
James McAdam CBE CBE, 72,, 73, Chairman, appointed in 1992. He was also Group Chief Executive from 1992 until March 2000. From 31 March 2001, while continuing as Chairman, he ceased to be a full-time executive.
Lee Abraham*, 75, appointed in 1994. He has wide experience Mr. McAdam is the non-executive Chairman of US retailing over many yearsBisley Office Equipment Company Limited, Chairman of the British Clothing Industry Association Limited and is a directorChairman of Salomon Smith Barney Investment Funds. Mr. Abraham served as the lead directorBritish Apparel & Textile Confederation; he devotes approximately 25% of Liz Claibourne Inc. before his retirement in 1997.time to these roles collectively.
Robert Blanchard*, 58,59, appointed in 2000. He was a Group Vice President of Procter & Gamble and President of its Global Skin Care and Cosmetics business until his retirement in 1999. He is a non-executive director of Best Buy Co. Inc. and Bandag Inc. Mr. Blanchard also serves as President of Strategic and Marketing Services, a consulting company he founded upon his retirement from Procter & Gamble.
Walker Boyd, 50,51, appointed Group Finance Director in 1995. He is a member of the Institute of Chartered Accountants of Scotland. From 1992 he was Finance Director of the Group’s UK division. Mr. Boyd was appointed a non-executive director of WH Smith PLC in March 2004.
Terry Burman, 57,58, appointed Group Chief Executive in March 2000. He is also Chief Executive Officer of the Group’s US division. MrMr. Burman was appointed to the Board in 1996. Prior to joining the Group in 1995 he was Chief Executive Officer of Barry’s Jewelers, Inc.
Brook Land*, 54,55, appointed in 1995.1995 and first elected to the Board in 1996. Until 1996 he was a senior partner of, and is now a consultant to, solicitors Nabarro Nathanson. He is also non-executive Chairman of RPS Group plc and Medal Entertainment & Media plc. HeMr. Land was nominated as the senior independent director of Signet in June 2002.
Dale Hilpert*, 61, appointed in September 2003. He was Chief Executive of Williams-Sonoma, Inc. from April 2001 until his retirement in January 2003. Prior to this he was Chairman and Chief Executive of Foot Locker, Inc. (formerly the Venator Group, Inc.) which he joined as President and Chief Operating Officer in 1995.
| * | Non-executive directors, all of whom satisfied the definitions of independence in the revised Combined Code and are viewed as independent by the Board. |
Russell Walls*, 59,60, appointed in August 2002. He was Group Finance Director at BAA plc until his retirement in August 2002. He has been a non-executive2002 and was the senior independent director of Hilton Group plc for seven years but has announced his intention to resign with effect from 16until May 2003. He serves as their senior independent director. Mr. Walls is also a non-executivethe senior independent director of Stagecoach Group plc and Mersey Docks and Harbour Co.plc. He is a Fellow of the Association of Chartered Certified Accountants.
Alternate directorLee Abraham
* retired from the Board with effect from 8 January 2004.
Richard Miller, 58, Executive Vice President and Chief Financial Officer of the Group’s US division. He was appointed in 1994, and has announcedserved as an alternate director until his intention to retire inretirement on 30 April 2003.
Committees
Remuneration Robert Blanchard (Chairman), Lee Abraham,Russell Walls, Brook Land (until 31 March 2003), Russell Walls.2003 and from 7 January 2004) and Lee Abraham until 7 January 2004.
AuditRussell Walls (Chairman from 1 April 2003), Dale Hilpert (from 7 January 2004) and Brook Land (Chairman until 31 March 2003),. Robert Blanchard was a member until 31 March 2003 and Lee Abraham Robert Blanchard (until 31 March 2003), Russell Walls (Chairman from 1 April 2003).was a member until 7 January 2004.
Nomination Brook Land (Chairman), Robert Blanchard and James McAdam. Russell Walls and Lee Abraham (untilwere members until 31 March 2003), Robert Blanchard, James McAdam, Russell Walls (until 31 March 2003).
David Wellings retired from the Board with effect from 13 June 2002. Up until that time he also served on all the above committees and was the senior independent director of Signet.
Ian Dahl resigned from the Board with effect from 30 September 2002.2003.
Under the Company’s Articles of Association, directors appointed by the Board since the last annual general meeting, either to fill a vacancy or as an additional director, must retire at the next annual general meeting.
The Articles also specify that every director is required to retire at the annual general meeting in the third calendar year after he was last elected or re-elected, except for directors over the age of 70 who are required to retire at every annual general meeting, but such directors may, in either circumstance, seek re-election.
Messrs. Abraham, Land,Blanchard, Boyd, Hilpert and McAdam and Walls retire from the Board at the forthcoming annual general meeting. Following consideration by the Board of the recommendations of the Nomination Committee, they offer themselves for re-election.
Signet Group plc 33
| 34 | Signet Group plc Annual Report & Accounts year ended 31 January 2004 |
OfficersStephen CardMark Jenkins, 43, Group Treasurer,46, Company Secretary, appointed in 1999.1 March 2004. He is a barrister. Previously he was Treasury Manager of Nycomed AmershamCompany Secretary at COLT Telecom Group plc and prior to that Group Treasurer of Scapaat Peek plc. He has resigned with effect from 28 March 2003.
Timothy Jackson, 44,45, Company Secretary and Investor Relations Director, appointed in 1998. He is a Fellow of the Association of Chartered Certified Accountants. PriorOn 1 March 2004 he resigned as Company Secretary to joining thefocus on his duties as Investor Relations Director.
Liam O’Sullivan, 32, Group Treasurer, appointed 2 June 2003. Previously he was Company SecretaryGroup Treasury Manager at Rank Group Plc. He is a member of the Institute of Chartered Accountants in England and DirectorWales and a member of Investor Relationsthe Association of Cordiant CommunicationsCorporate Treasurers.
Stephen Card was Group plc.Treasurer until his resignation on 28 March 2003.
No director or officer has any family relationship with any other director or officer.
Advisers
AuditorsAuditors KPMG Audit Plc,
8 Salisbury Square, London EC4Y 8BB.
Financial advisers
Lazard Brothers & Co. Limited, 21 Moorfields,
50 Stratton Street, London EC2P 2HT.W1J 8LL.
Stockbrokers
Deutsche Bank AG,
Winchester House,
1 Great Winchester Street, London EC2N 2DB.
Cazenove & Co. Ltd, 12 Tokenhouse Yard,
20 Moorgate, London EC2R 7AN.6DA
UK lawyers Theodore Goddard, 150 AldersgateHerbert Smith,
Exchange House,
Primrose Street, London EC1A 4EJ.EC2A 2HS.
US lawyers
Weil, Gotshal & Manges,
One South Place, London EC2M 2WG.
Principal bankers
Barclays Bank PLC,
5 The North Colonnade, Canary Wharf, London E14 4BB.
HSBC Bank plc,
8 Canada Square, Canary Wharf, London E14 5HQ.
Royal Bank of Scotland plc,
135 Bishopsgate, London EC2M 3UR.
Registrars
Capita Registrars,
The Registry,
34 Beckenham Road, Beckenham, Kent BR3 4TU.
34 Signet Group plc
| Signet Group plc Annual Report & Accounts year ended 31 January 2004 | 35 |
Report of the directors |
Business review
The principal activity of the Group is the retailing of jewellery, watches and gifts with branches throughout the UK and the US. A review of the Group’s performance during the year, with comments on the financial results and likely future developments, areis set out on pages 7 to 2728 and formforms part of this Report.
Going concern
On the basis of current financial projections and facilities available, the directors have a reasonable expectation that the Group has adequate resources to continue in operational existence for the foreseeable future and, accordingly, consider that it is appropriate to continue to adopt the going concern basis in preparing its annual accounts.
Results and dividends
The results of the Group for the year appear on page 52.56. The directors recommend the payment of a final dividend of 1.80p2.16p per share, to be paid on 142 July 20032004 to shareholders on the register of members at close of business on 64 June 2003.2004. An interim dividend of 0.310p0.341p per share was paid in November 20022003 making a total of 2.110p2.501p for the year (2001/02: 1.789p)(2002/03: 2.110p). See note 8 on page 6569 for waiver of dividend by Signet Group QUEST Limited.
Directors and alternate director
The directors who served during the period were James McAdam (Chairman), Lee Abraham, Robert Blanchard, Walker Boyd, Terry Burman, Ian Dahl,Dale Hilpert, Brook Land and Russell Walls and David Wellings.Walls. Details of the current directors are shown on page 33.34. Richard Miller served as an alternate director.
Directors’ remuneration, service contracts and share interests
Details of directors’ remuneration, service contracts and the interests in the share capital of the Company of the directors and their immediate families at 1 February 200331 January 2004 are given in the Directors’ remuneration report on pages 4042 to 49.53.
Allotment of equity securities
There were no equity securities allotted save in relation to the exercise of options as set out in note 27 on page 80.85.
Social, ethical and environmental matters
Matters relating to these issues, including employees, payment of creditors and charitable and political donations, are set out on pages 97103 to 99.106.
Substantial shareholdings and control of the Company
Details of substantial shareholdings and control of the Company are as set out on page 102.pages 109 and 110.
Purchase of own shares
At 1 February 200331 January 2004 there was outstanding an authority, granted by the shareholders at the annual general meeting in 2002,2003, to purchase, in the market, up to 170,793,336171,400,228 shares of 0.5p each in the Company at a minimum price of 0.5p per share and a maximum price of 105% of the average of the market values derived from the London Stock Exchange Daily Official List for the preceding five business days. During the financial year no purchases were made or proposed to be made and no purchases or options or contracts to make purchases have been made or entered into since the end of the financial year.Theyear. The authority expires at the forthcoming annual general meeting and a resolution to renew it will be proposed at the meeting.
Pension funds
Information about the Group’s pension schemes is set out in note 22 on page 73 in the notes to the accounts.79. Information about pension arrangements for executive directors is set out in the Directors’ remuneration report on pages 4042 to 49.53.
AuditorsAuditor
The auditors,auditor, KPMG Audit Plc, areis willing to continue in office and a resolution for theirits re-appointment as auditorsauditor of the Company will be submitted to the annual general meeting.
Annual general meeting
The annual general meeting is to be held at 2.00 pm12.00 noon on 8 July 20039 June 2004 at The Café Royal, 68 Regent Street, London W1B 5EL. A description of the business to be transacted at the annual general meeting is included with the notice of the meeting.
By order of the Board
T J JacksonMark Jenkins
Secretary2624 March 20032004
Signet Group plc 35
| 36 | Signet Group plc Annual Report & Accounts year ended 31 January 2004 |
Corporate governance statement
The BoardThe Board has as its prime objective the enhancement of business performance and shareholder value over time. It carries the responsibility for determining all major policies, for ensuring that effective strategies are in place, and for reviewing the system of internal control, including those relating to social, ethical and environmental matters (see pages 97 to 99 for details of corporate governance relating to social, ethical and environmental matters). The Board also seeks to present to shareholders, potential investors and other interested parties a balanced and coherent assessment of the Company’s strategy, financial position and prospects.
The Board retains responsibility for a range of specific matters including the approval of the annual report and other documents circulated to shareholders by the Company, annual and quarterly results announcements, other trading statements, dividend policy, acquisitions, disposals, risk management, material agreements, major capital expenditures, budgets, long range plans, senior executive appointments and the setting of social, ethical and environmental policies. The day to day running of the business is delegated to the executive management who report to the Board on a regular basis. Procedures are also in place to enable the Board to monitor the implementation of management decisions and review the performance of executive directors. Certain matters are delegated to Board committees, each with defined terms of reference, procedures, responsibilities and powers.
Application of corporate governance principles
The Board
The Board has as its prime objective the sustainable enhancement of business performance and shareholder value. It carries the responsibility for determining all major policies, for ensuring that effective strategies and management are in place, for assessing the performance of the Group and its senior management and for reviewing the system of internal control, including those relating to social, ethical and environmental matters (see pages 103 to 106). The Board also seeks to present to shareholders, potential investors and other interested parties a balanced and coherent assessment of the Company’s strategy, financial position and prospects. The Board retains responsibility for a range of specific matters including approval of the annual report and other documents circulated to shareholders by the Company; quarterly and annual results announcements; other trading statements; distribution policy; acquisitions, disposals, material agreements and capital expenditures outside predetermined limits set by the Board; risk management; budgets; long range plans; senior executive appointments; succession planning and the setting of social, ethical and environmental policies.
The Board monitors all developments in corporate governance, including the revised Combined Code (the Financial Reporting Council’s “Audit Committees: Combined Code of Governance”, the “Smith Report”) and changes due to the Sarbanes-Oxley Act of 2002 in the US. The Board reviews its performance and procedures in the light of changing expectations regarding best practice and makes amendments where it believes appropriate, to take account of them.
| The formal schedule of matters reserved for the Board was updated in early 2004/05 and the division of responsibilities between the Chairman and the Group Chief Executive was set out in writing and agreed by the Board. In summary, the Chairman is responsible for: | |
| • | the effective running of the Board, including the evaluation of its performance and of the individual directors, the balance of the Board and compliance with corporate governance; |
| • | the review, prior to their presentation to the Board by executive management, of strategy, medium term plans and annual budget; |
| • | reviewing, prior to their presentation to the Remuneration Committee, the recommendations of the Group Chief Executive regarding the remuneration of senior executives and for making a recommendation regarding that of the Group Chief Executive; |
| • | maintaining contact with major shareholders to understand directly their issues and concerns; |
| • | keeping the non-executive directors appropriately informed of developments within the business and shareholders’ attitude to the Group; and |
| • | the reputation of the Group, and representing it both internally and externally. |
| The Chairman is also a member of the Nomination Committee. | |
| In summary, the Group Chief Executive is responsible for: | |
| • | the executive leadership of the Group; |
| • | the development, and presentation to the Chairman and the Board, of strategy, medium term plans and budgets; |
| • | within this framework, for the performance of the business; |
| • | compliance with legal and corporate governance requirements, together with the social, ethical and environmental principles of the Group; and |
| • | making recommendations on the appointment and remuneration of senior executives and management development. |
| The Group Chief Executive is also Chief Executive of the US division. | |
The Board met nine times in 2003/04, including three extended sessions of more than one day. All directors attended all meetings of the Board with the sole exception of a meeting for which one director was unable to attend.
The Board currently consists of seven directors in total:directors: the Chairman, two executive directors (the Group Chief Executive and the Group Finance Director), and four independent non-executive directors, one of whom is nominated as the senior independent director and the Chairman (who is not considered to be independent).director. Incumbents are identified on page 33.
34. Directors are subject to election at the first annual general meeting after appointment and then to re-election by shareholders at no more than three yearly intervals. The Board met eight timesis of the view that fixed term or age limits should not be set for non-executive directors as it considers it important that the particular contribution being made by individual directors be taken into account in 2002/03, including three extended sessionsdeciding their tenure of more than one day. All directors receive written reports in a timely manner prior tooffice and that the performance of each meeting which enables them to make informed decisionsdirector be reviewed annually. Any non-executive director who has served on the corporate and business issues under consideration.Board for nine years since first being elected as a non-executive director must stand for annual re-election; also any director over the age of 70 must stand annually for re-election.
It is believed that the composition of the Board gives an appropriate balance of skills, experience, independence and executive involvement, whilst being small enough for efficient operation. No one individual has unfettered powers
| Signet Group plc Annual Report & Accounts year ended 31 January 2004 | 37 |
The Company Secretary is responsible toCorporate governance statement (continued)
At least once a year the Board for ensuring that Board procedures are followed and allnon-executive directors have access to his advice and service. There ismeet without the executive directors being present. They also a procedure for directors to take independent advice inmeet occasionally without the course of their duties, if considered appropriate, at the Company’s expense.
The Group comprises two separate operating divisions, one for the US and one for the UK, each with a separate executive committee which meets regularly. The Group Chief Executive is also Chief Executive of the Group’s US division.The Group Finance Director and the Chief Executive of the UK division report to the Group Chief Executive.Chairman being present.
On appointment new directors take part in an induction programme and are given an opportunity to familiarise themselves with the Group’s business, procedures and investor perceptions. In addition to meeting with management this process includes briefings from the Group’s external auditors, lawyers, financial advisers and stockbrokers. The Group also makes availableDirectors are kept informed of the opportunity for all directors tolatest developments and best practice in corporate governance and attend relevant courses or receive appropriate training to equip them to carry out their duties asduties. The non-executive directors are given regular opportunities to see the operations of the business and to meet management and staff.
All directors receive written reports in a timely manner prior to each meeting which enables them to make informed decisions on the issues under consideration.
The performance of the Board, its Committees and individual members is rigorously monitored. The Board has agreed a formal written procedure for the evaluation process which is conducted by the Chairman, in conjunction with the senior independent director and the Company Secretary. The performance evaluation of the Chairman is led by the senior independent director and takes into account the views of both the non-executive and executive directors.
DirectorsThe Company Secretary is responsible, through the Chairman, for advising the Board on all governance matters and ensuring that Board procedures are subjectfollowed. All directors have access to electionhis advice and service. There is also a procedure for directors to take independent advice in the course of their duties, if considered appropriate, at the first annual general meeting after appointment and periodic re-election by shareholders thereafter, normally every three years. The Board is of the view that term of office or age limits should not be set for non-executive directors as it considers it important that the particular contribution being made by individual directors be taken into account in deciding when they should retire. However, any director over the age of 70 must stand annually for re-election to the Board.Group’s expense.
Board committeesThe Group operates a numberCertain matters are delegated to Board committees, each with defined terms of committees to which specific tasks are delegated.Thereference, procedures, responsibilities and powers. The principal committees are:are as follows:
The Audit Committee which in 2002/03 consisted of all the non-executive directors, was chaired by Brook Land and met five times. From 1 April 2003 the Committee will consist of Lee Abraham, Brook Land and Russell Walls
36 Signet Group plc
(Chairman). All members of the Audit Committee are independent, one being a “financial expert” as defined by the Securities and Exchange Commission (“SEC”). The only remuneration members of the Audit Committee receive, from the Group, is as directors.
Although foreign private issuers listed on Nasdaq are not currently required to comply with the audit committee requirements of the National Association of Securities Dealers (“NASD”), Signet has chosen to do so voluntarily. The NASD is currently revising its corporate governance standards to comply with provisions of the Sarbanes-Oxley Act of 2002 (“the Sarbanes-Oxley Act”) (which imposes new requirements on companies registered with the SEC in the US), and Signet will undertake a review of its compliance with the corporate governance standards and audit committee requirements once the NASD’s revised rules are finalised in order to ensure Signet’s continued compliance with the NASD’s requirements. The Audit Committee has adopted a clear written charter and has an established channel of direct communication withwhich is available on request from the external auditors who normally attend meetings except in relation to certain aspects of their own appointment, assessment of their independence and determination of their fees.Company Secretary or on the Group’s web site. The Chairman, the executive directors and any other officer of the Group may be invited to attend meetings.The Audit Committee meets at least once a year with the external auditors without executive management being present.charter was updated during 2003/04.
The appointment of the external auditors, the determination of their fees and an assessment of their independence (including consideration of a written disclosure by the external auditors of all relationships that they have with the Company), are matters that are considered by the Audit Committee. The Audit Committee also approves in advance all audit and non-audit work carried out by the external auditors. See page 62 for details of fees paid to the external auditors. The Audit Committee’s responsibilities also include the review of the appropriateness and effectiveness of the Group’s accounting policies and financial procedures and oversight of the external auditors’auditor’s work, including the scope and result of the audit. The Audit Committee also reviews the work of the internal auditors, the Disclosure Control Committee and the Group’s whistleblowing procedures. The review of the whistleblowing procedures includes receiving reports on all matters raised and on actions taken. The Audit Committee reviews, discusses with management and approves for submission to the Board all Group audited accounts, trading statements and selected internal financial reports. It also reviews reports submitted to the Board by the Group’s external auditors.auditor.
Following the introduction of the revised Combined Code, the Audit Committee will review the Group’s internal control and risk management systems and will report to the Board on their effectiveness.
The external auditor’s objectivity and independence is safeguarded by the Audit Committee having primary responsibility for making a recommendation on the appointment of the external auditor, the determination of their fees and making an annual assessment of their independence (including consideration of a written disclosure by the external auditor of all relationships that they have with the Company). The planned rotation of partners and staff of the external auditor, together with a “cooling off” period before anyone from the external auditor joins the Group, also assist in maintaining the independence of the external auditor. The Audit Committee has reviewed and approved a policy for the provision of audit and non-audit services by the auditor. The policy requires that the Audit Committee approves in advance all audit and non-audit work carried out by the external auditor (subject to a de minimus amount, this being then reported to the Audit Committee on a quarterly basis). The approval process requires disclosure of the objectives and scope of services to be performed in addition to the fee structure. The Audit Committee also reviews all approved services and fees at subsequent meetings. See page 66 for details of fees paid to the workexternal auditor.
The Audit Committee has an established channel of direct communication with the external auditor who normally attend meetings except in relation to certain aspects of their own appointment, assessment of their independence and determination of their fees. The Chairman, the Chief Executive, the Finance Director and others attend the meeting by invitation. The Audit Committee meets at least once a year with the external auditor without executive management being present.
| 38 | Signet Group plc Annual Report & Accounts year ended 31 January 2004 |
All members of the internal auditors.Audit Committee are independent, and the only remuneration members of the Audit Committee receive, from the Group, is as directors. Russell Walls succeeded Brook Land as chairman on 1 April 2003, and is an “audit committee financial expert” as defined by the applicable Securities and Exchange Commission regulations. From 7 January 2004 the Audit Committee consisted of Dale Hilpert, Brook Land and Russell Walls. From 1 April 2003 to 7 January 2004 it consisted of Lee Abraham, Brook Land and Russell Walls and from 2 February 2003 to 31 March 2003 Robert Blanchard was also a member. The Audit Committee met six times in 2003/04, including a meeting dedicated to the consideration of corporate governance matters. Two directors were each unable to attend one meeting.
The Nomination Committee whichcharter was revised in 2002/03 consisted of allearly 2004/05 to reflect corporate governance developments in the non-executive directorsUK and the
When the role of the Group Chairman or any matter relating to succession to that role is discussed, the Chairman may be consulted, but the responsibility for preparing a job specification and making any recommendation to the Board rests solely with the independent non-executive directors of the Nomination Committee. The Nomination Committee also reviews a number of other senior appointments within the Group, such as the Company Secretary.
The senior independent director chairs the Nomination Committee. From 1 April 2003 the Nomination Committee consisted of Robert Blanchard, Brook Land and James McAdam and from 2 February 2003 to 31 March 2003 Lee Abraham and
Russell Walls were also members. The Nomination Committee met four times in 2003/04 and there was full attendance at all meetings.
The role of the Remuneration Committee is discussed in the Board report on remuneration on page 40.42.
Further details regarding the chairmen and members of these Committees are set out on page 33.34.
Executive management
The Group comprises two separate operating divisions, one in the US and one in the UK, each with a separate executive committee which meets regularly. The Group Chief Executive is also Chief Executive of the Group’s US division. The Group Finance Director and the Chief Executive of the UK division report to the Group Chief Executive.
The executive management is responsible to the Board for the performance of the Group and its compliance with the internal policies and procedures set by the Board. As part of this responsibility the executive management regularly reports to the Board on the performance of the Group, its competitive environment and its relations with stakeholders.
Business strategies; long range plans; budgets; acquisitions, disposals, material agreements and capital expenditures outside predetermined limits set by the Board; internal policies and procedures are presented to the Board by executive management for consideration. Within this approved framework the executive management is responsible for the day to day running of the business including: merchandising; store operations; human resource management and planning; marketing; real estate; financial reporting; treasury management; risk management; tax management; social, ethical and environmental matters; and communications with investors.
Code of Conduct and Code of Ethics
Signet strives to act in accordance with the laws and customs of each country in which it operates; to adopt proper standards of business practice and procedure; to operate with integrity; and to observe and respect the culture of each country in which it operates. To that end, the Group has adopted a Statement of Social, Ethical and Environmental Principles and supporting policies applicable to all officers and employees of the Group and substantially complies with the requirement of Nasdaq. In addition, it has a policy on business integrity, as well as more detailed guidance and regulations in the Group’s staff induction, training and operational procedures. The Group is
| Signet Group plc Annual Report & Accounts year ended 31 January 2004 | 39 |
Corporate governance statement (continued)
currently reviewing these policies in order to meet the recently revised corporate governance requirements of the Nasdaq National Market, which require a code of business conduct and ethics. This Nasdaq requirement is not currently effective but will take effect after May 2004. A code of ethics meeting the requirements of the Sarbanes-Oxley Act covering the Group Chief Executive, the Group Finance Director and senior financial officers is also in place. These codes are available on request from the Company Secretary or on the Group’s web site.
Relations with shareholders
The Board recognises the importance of relations with shareholders and communicates regularly with shareholdersthem about the Group’s strategy, financial performance and prospectsprospects. It does this through communications sentdocuments distributed to shareholders, stock exchange announcements and general meetings of shareholders. In addition, executive members of the Boardin meetings. Presentations on quarterly and the Company Secretary and Investor Relations Director carry out a programme of meetings with institutional investors.The Chairman and the senior independent non-executive director are also available to meet with investors. Through the use of teleconferences and web casting, presentations on quarterlyannual results and the Christmas trading statement are open to all interested parties, including private shareholders.shareholders, through the use of teleconferences and web casting. Other presentations are available on the Group web site (www.signetgroupplc.com(www.signetgroupplc.com)).
The Board recognises that the prime opportunity for private investors to question the Board is at a general meeting of shareholders. At the annual general meeting the chairmen of the Audit, Nomination and Remuneration Committees, in addition to the Chairman of the Board, are expected to be available for questions relating to the function of their respective Committees.
The Group Chief Executive, the Group Finance Director and the Investor Relations Director carry out an extensive programme of meetings with institutional investors. The Chairman and the senior independent director also meet with investors from time to time. Following the appointment of a new non-executive director, major shareholders will in future be offered an opportunity to meet the individual.
SignetThe Board is kept informed of investment market attitudes to the Group plc 37by receiving regular reports on investor relations, copies of brokers’ research, press cuttings and third party surveys of investor perceptions.
Compliance statement and revised Combined Code
In June 1998 the London Stock Exchange published the Principles of Good Corporate Governance and the Code of Best Practice (“the Combined Code”). The Board of Directors considers that it has complied throughout the year with the provisions of the Combined Code required to be observed by companies. In July 2003 a revised Combined Code was issued that applies for reporting years starting on or after 1 November 2003. During
2003/04 the Board reviewed the revised Combined Code, the Smith Report and corporate governance developments in the US. Based on that review the Board agreed a programme of action that has largely been completed with any remaining actions being scheduled for later in 2004/05.
Internal control
The Combined Code requires that the directors review the effectiveness of the Group’s system of internal control including the following areas:
| • | Financial |
| • | Operational |
| • | Compliance |
| • | Risk management |
Guidance for directors Internal Control: Guidance for Directors on the Combined Code (“the Turnbull guidance”) was published in September 1999. The Board of Directors considers that it has complied with the Turnbull guidance throughout the year and up to the date of approval of this Annual Report.Report & Accounts. In addition, during 2002/032003/04 the Board reviewedcontinued to review the implications of the Sarbanes-Oxley Act and took steps to ensure compliance. The Group Chief Executive and the Group Finance Director intend to sign certifications as required by the Sarbanes-Oxley Act.
The Board exercises ultimate responsibility for the Group’s system of internal controls and for monitoring its effectiveness. The internal control system is designed to safeguard shareholders’ investment and the Group’s assets, both tangible and intangible, including the reputation of the Group with its various stakeholders. Procedures are in place to ensure the maintenance of proper accounting records, the reliability of the financial information used within the business or for publication and the determination of disclosure obligations and of materiality. These procedures also cover disclosure on a timely basis of information to the investment markets. However, such procedures are designed to manage rather than wholly eliminate the risk of failure to achieve business objectives and can provide only reasonable, not absolute, assurance against material misstatement or loss.
Following the passing of the Sarbanes-Oxley Act a review of theSignet’s disclosure control procedures was undertaken and a Disclosure Control Committee was formed as part of the internal control system. The Group’s disclosure control
| 40 | Signet Group plc Annual Report & Accounts year ended 31 January 2004 |
to allow timely decisions to be made regarding required disclosure. The Group’s Disclosure Control Committee consists of the Group Finance Director, the Company Secretary, andthe Investor Relations Director and the Group Financial Controller who consult with the Group’s external advisers and auditors as necessary.
These procedures enable Signet to make timely and accurate public disclosures.
Key procedures that have been established and are designed to provide effective internal control are:
| • | Control environment – control is exercised through an organisational structure with clearly defined levels of responsibility and authority together with appropriate reporting procedures, particularly with respect to financial information, capital expenditure, investment, granting of guarantees and the use of treasury products (see pages |
| • | Reporting and information systems – the Group has a comprehensive budgeting and five year strategic planning system with an annual budget and strategic plan approved by the Board. Monthly trading results and balance sheets |
| • | Risk management – the identification of major business risks is carried out in conjunction with |
| regulations and the activity of the internal audit function. The external auditors receive copies of the papers submitted to the committee. A report from each Risk Management Committee meeting, and any material non-compliance or emerging issue, is considered by the Board in a timely manner. From the start of 2004/05 the Audit Committee will review the effectiveness of the Group’s internal control and risk management procedures and report to the Board on these matters. | |
| • | Control procedures – each operating division maintains documented financial and operating controls as well as procedures appropriate to its own business environment and in conformity with Group guidelines. Each of the operating divisions has an internal audit function which primarily reviews the processes in the store operations but also reviews central service functions. The work of the internal audit function is monitored by senior divisional executives, Group management, the Risk Management Committee and the Audit Committee. |
| • | Reviews of effectiveness |
| annually reviews the effectiveness of the internal control system on the basis of a report submitted to the Risk Management Committee. This report is based on annual written self-certification statements prepared by the operating divisions and head office departments which confirm the extent of their compliance with all material internal financial operating and disclosure controls. These statements are prepared by the divisional finance directors on behalf of each operating division and are reviewed by senior divisional executives, Group management and the Board. |
Based on their review of the Group’s disclosure controls and procedures, as of the end of the period covered by this Annual Report & Accounts, the Group Chief Executive and Group Finance Director have concluded that the Group’s current disclosure controls and procedures are effective in achieving their objective of ensuring that information regarding the Group is recorded, processed, summarised and reported and that the information is accumulated and communicated to management to allow timely decisions regarding required disclosure. They concluded that there have not been any significant changes in the Group’s internal controls over financial reporting during the period covered by this Annual Report that have materially affected, or are reasonably likely to materially affect those controls.
Signet Group plc 39
Directors’ remuneration report
Information contained in sections and figures marked ß has been audited.
1 1. The role of the Remuneration CommitteeIn 2002/03 the Remuneration Committee consisted of Lee Abraham, Robert Blanchard (Chairman from 13 June 2002), Brook Land, Russell Walls (from 3 September 2002) and David Wellings (Chairman until his retirement as a director on 12 June 2002).The Committee met eight times during 2002/03. From 1 April 2003 the Committee will consist of Lee Abraham, Robert Blanchard (Chairman) and Russell Walls.
The prime purpose of the Remuneration Committee is to set the remuneration policy for executive directors and senior managers and to ensure that they are fairly rewarded for their individual contribution to the Group’s overall performance, having due regard to the interests of shareholders, to the financial and commercial health of the Group and to the relevant market place in which recruitment takes place.
All members of the Remuneration Committee are independent non-executive directors and therefore do not have any personal financial interest (other than as shareholders) in matters decided by the Committee. No executive director or senior manager is involved in determining his or her own remuneration.
The Remuneration Committee sets the remuneration of the Chairman of the Board.Board (James McAdam). It also sets that of the Group Chief Executive (Terry Burman) after consultingconsultation with the Chairman (James McAdam).TheChairman. The remuneration of the other executive director and certain senior managers is set by the committeeCommittee based on recommendations made by the Group Chief Executive (Terry Burman) after consultation with the Chairman of the Board. Performance targets are set by the Committee in consultation with the Chairman of the Board and, where appropriate, external professional consultants. Where executive directors are involved in advising and assisting the Remuneration Committee, care is taken to recognise and avoid possible conflicts of interest.
The Remuneration Committee draws on external professional advice on a regular basis and makes use of relevant and reliable independent market surveys. In 2002/03 the Committee reviewed its use of external advisers and appointed Towers Perrin. Previously the Committee had been advised by Andersen Consulting who had been appointed by the Committee. NeitherPerrin as advisers to assist it. Towers Perrin nor Andersen Consulting, wereare not retained in any other capacity within the Group. In addition Addleshaw Goddard (to 8 July 2003), Herbert Smith (from 8 July 2003) and Weil, Gotshal & Manges (on US aspects) advised the Remuneration Committee on legal matters. These firms also provided general legal advice to Signet.
The remuneration of the non-executive directors is not within the remit of the Remuneration Committee. Such remuneration is determined by the Chairman and the executive component of the Board following a recommendation by the Chairman after consideration of, among other factors, external comparisons.comparisons and the time commitment and responsibility of the role.
From 2 February 2003 to 31 March 2003 the Remuneration Committee consisted of Lee Abraham, Brook Land, Robert
Blanchard (Chairman) and Russell Walls. From 1 April 2003 to 7 January 2004 the Committee consisted of Lee Abraham, Robert Blanchard (Chairman) and Russell Walls. Lee Abraham retired and Brook Land rejoined the Remuneration Committee on 7 January 2004. The Committee met nine times during 2003/04 and there was full attendance at all meetings.
2 2. Remuneration policy
The Remuneration Committee believes that the Group’s remuneration policy must be based on sound, clearly stated principles which recognise the long term interests of the Group, its shareholders and employees. After careful consideration during the past year,2002 and 2003, the Remuneration Committee formally adopted a set of six principles. Following a review by the following six principles:Remuneration Committee in early 2004 these principles remain unaltered and they are set out below:
| (i) | Signet’s primary business objective should be to deliver results which should consistently outperform the average of the industry sector. |
| (ii) | It is recognised that to deliver consistently |
| (iii) | It is also recognised that retaining, and where necessary recruiting, senior executives of this calibre will require that the Group provide above industry-average total remuneration. |
| (iv) | Therefore, Signet’s executive directors and other senior executives should be remunerated in a range beginning with the 51st and ending with the 75th percentiles of industry total remuneration, based on current surveys of relevant |
| (v) | Total remuneration for executive directors and other senior executives should be highly geared towards performance with the proportion of “at risk” pay increasing disproportionately according to: a) the level of performance achieved, and b) the seniority of the executive and their ability to influence results. Excluding pensions there should |
| 42 | Signet Group plc Annual Report & Accounts year ended 31 January 2004 |
| be only one element of | |
40 Signet Group plc
| (vi) | Surveys will be undertaken on a regular basis to ensure that total remuneration packages remain in the percentile range described in (iv) above. Recognising that |
The components of total remuneration are:
(a) Base salary
The base pay of each senior executive is intended to reflect the size and scope of that executive’s responsibilities. Base salary is reviewed annually, taking into account factors such as the level of individual performance, experience over time in the post, relevant external comparative data, the geographic location of the post and the general movement of base pay within the Group.
(b) Annual bonus plan
Individual annual bonus targets are set each year to take account of the role of the executive and current business plans. Annual bonus awards for executive directors are based on the achievement of real growth in pre-tax profit in the year.year at a rate above inflation. There is a cap set each year on such awards and a threshold performance below which no payments are made. The bonus rate increases after an intermediate target rate of profit growth, which is set each year, is achieved.
From the start of 2004/05 the growth in pre-tax profits will be measured using constant exchange rates. The Remuneration Committee believes this change to be appropriate as it will avoid subsequent foreign exchange rate movements unjustly rewarding, or unfairly penalising, Group senior management. It will also bring Group senior management bonuses on to the same basis as divisional senior management, whose bonuses are unaffected by exchange rates.
(c) Share option plan
The Remuneration Committee believes that an executive share option plan is necessaryappropriate to execute the remuneration principles
set out on pages 4042 and 41,43, and that a well constructed plan forms an important element in motivating executives to deliver the long term performance needed to generate strong returns to shareholders.
Subject to shareholder approval, it is intended to introduce a new executive share option plan during 2003. It is expected that details of the plan will be set out in a separate circular that will be sent to shareholders in due course.
It is the policy of the Remuneration Committee that all employees, including directors, who satisfy certain qualifying conditions should have the opportunity to participate in the equity of the Company through a savings related share option plan, and annual invitations are normally made. Under the relevant legislation the exercise of these share options is not subject to performance criteria.
(d) Long term incentive plan (“LTIP”)
The Remuneration Committee believes that, in addition to the provision of share options, it is appropriate to operate an LTIP to encourage executive directors, senior members of the divisional executive management committees and certain other senior executives with a similar level of responsibility, to meet long term strategic and financial objectives set by the Board. The policy is to make annual awards subject to the general principles explained in paragraphs 2(iv) and 2(v) above. Vesting is dependent on the achievement of challenging performance conditions set by the Committee at the time the awards are made.made and such awards do not normally vest within three years from the date the award is granted.
(e) Performance criteria
The Remuneration Committee believes that where performance criteria are used they should be:
| • | easily understood, |
| • | able to be directly linked to the performance of the Group or relevant business unit and to be influenced by management’s own actions, |
| • | designed to motivate management to increase profitability significantly beyond the rate of inflation, |
| • | designed to incentivise senior management to make efficient use of capital and to increase shareholder value, |
| • | equity based for long term schemes, and |
| • | consistent with the overall objectives of the Group. |
The criteria used to measure performance are based on the audited results of the Group (subject to minor adjustments that are approved by the Remuneration Committee) so as to provide clarity and objectivity.
(f) Pensions for executive directorsThe Company’s UK based executive director is a memberdirectors are normally members of the Signet Group Pension Scheme (the “Group Scheme”).Scheme.
| Signet Group plc Annual Report & Accounts year ended 31 January 2004 | 43 |
Directors’ remuneration report (continued)
At the present time there is only one such director, the Group Finance Director. The Group Scheme is a funded, Inland Revenue approved, final salary, occupational pension scheme.
scheme and has a separate category of membership for directors. Pensionable salary is the member’s base salary, excluding all bonuses. All Group Scheme benefits are subject to Inland Revenue limits. Where such limitation is due to the Inland Revenue earnings cap the Signet Group Funded Unapproved Retirement Benefit Scheme (the “FURBS”) is used to supplement pension benefits.
The main features of the Group Scheme are:
| (i) | a normal pension age of 60; |
| (ii) | pension at normal pension age of two-thirds of final pensionable salary, subject to completion of 20 years’ service; |
Signet Group plc 41
| (iii) | life assurance cover of four times pensionable salary; and |
| (iv) | spouse’s pension on death. |
The Group Chief Executive receives, proportionately to base salary, equivalent pension contributions to the UK based executive director. These pension benefits are provided through an unfunded, unqualified deferred compensation plan and the Sterling Jewelers Inc. 401(k) Retirement Savings Plan.
Apart from remuneration itself, there are certain other allied policy matters which are the concern of the Remuneration Committee. These are:
(i) Companies used for comparison
In assessing all aspects of pay and benefits, the Remuneration Committee takes account of the packages offered by a range of other retailers and, where appropriate, companies outside the retail sector. Different companies are used for comparison for executives in Group functions, and in the UK and the US divisions.Thesedivisions. These companies are chosen on the basis of turnover, market capitalisation, profits, number of employees and the nature and geographic spread of their operations. There have been no significant changes in the comparator companies used during the year.
(ii) Service contracts
It is the policy of the Remuneration Committee that an executive director’s contract should be a one year rolling contract with the period of notice to terminate the contract to be given by either side not exceeding one year and that, if it is necessary to grant a longer period of notice when recruiting from outside the Group, this should reduce to a maximum of one year after an initial period. No director has a service contract of more than one year.
(iii) Early termination
The Remuneration Committee believes that the circumstances of early termination vary. Only in very exceptional circumstances will explicit terms for compensation for early termination be included in contracts.contracts for new directors. Where no explicit compensation terms are included, departing directors or senior managers are expected to mitigate their loss within the framework of individual circumstances.
(iv) Executive directors – outside appointments
The Group recognises the benefits to the individual and to the Group when executive directors of the Company also act as non-executive directors of other companies not associated with Signet. Subject to certain conditions, executive directors are permitted to accept anone appointment as a non-executive director of another company.Thecompany. The executive director is permitted to retain any fees paid for such service. Unless otherwise
33. Directors’ remunerationInformation contained in sections and figures marked * has been audited.
The total emoluments for directors of the Company and officers of the Group (excluding amounts due under the LTIP), as listed on pages 33 and 34, for services in all capacities was £3,340,000 (2001/02: £3,140,000). The amounts due under the 2000 LTIP for directors of the Company and officers of the Group was £966,000 (2001/02: £520,000). For 2002/03, 50% of the amounts due under the 2000 LTIP are payable in cash and the other 50% consists of the grant of an option to acquire shares in the Company. For 2001/02 the amounts were paid wholly in cash. Details of the directors’ emoluments are given on page 45. The remuneration package of the Group Chief Executive, the highest paid director, is determined with regard to the fact that he is a US citizen, based in the US and running a business that generates somehis remuneration is set in US dollars and not pounds sterling. Some 70% of itsGroup sales and profits are generated in that country.the US.
(a) Salary and benefits
The Remuneration Committee normally reviews the salary and benefits of executive directors annually. Details of the salaries received by executive directors are shown on page 45. Following the 2004 annual reviews the Remuneration Committee increased the Group Chief Executive’s salary from $1,210,000 to $1,283,000 and that of the Group Finance Director from £310,000 to £330,000. The Chairman’s remuneration was increased from £300,000 to £327,000.
(b) Annual bonus plan
In 2003/04 an annual bonus of 23.0% (maximum 100%) of base salary was paid to the Group Chief Executive and 17.2% (maximum 75%) to the Group Finance Director, reflecting the 6.0% increase in reported pre-tax profit. At constant exchange rates the Group achieved a 13.0% increase in pre-tax profit, which would have earned a bonus of 80.0% of base salary for the Group Chief Executive and 60.0% for the Group Finance Director. As the Remuneration Committee believes that these
| 44 | Signet Group plc Annual Report & Accounts year ended 31 January 2004 |
Directors’ emolumentsß
Details of directors’ emoluments for the year to 31 January 2004 were as follows:
| Short term | Termination | |||||||||||||||||||
| Basic salary or fees | Benefits(1) | bonuses | payments(2) | Total | ||||||||||||||||
| 2004 | 2003 | 2004 | 2003 | 2004 | 2003 | 2004 | 2003 | 2004 | 2003 | |||||||||||
| £000 | £000 | £000 | £000 | £000 | £000 | £000 | £000 | £000 | £000 | |||||||||||
| Executive | ||||||||||||||||||||
| James McAdam | ||||||||||||||||||||
| Chairman | 296 | 271 | 23 | 24 | – | – | – | – | 319 | 295 | ||||||||||
| Walker Boyd | ||||||||||||||||||||
| Group Finance Director | 308 | 291 | 22 | 21 | 116 | 131 | – | – | 446 | 443 | ||||||||||
| Terry Burman(3) | ||||||||||||||||||||
| Group Chief Executive | 714 | 743 | 26 | 30 | 360 | 444 | – | – | 1,100 | 1,217 | ||||||||||
| Ian Dahl(4) | ||||||||||||||||||||
| former Chief Executive of | ||||||||||||||||||||
| UK division | – | 184 | – | 15 | – | – | – | 304 | – | 503 | ||||||||||
| Non-executive | ||||||||||||||||||||
| Lee Abraham(5) | 35 | 35 | – | – | – | – | – | – | 35 | 35 | ||||||||||
| Robert Blanchard | 38 | 35 | – | – | – | – | – | – | 38 | 35 | ||||||||||
| Brook Land | 38 | 35 | – | – | – | – | – | – | 38 | 35 | ||||||||||
| Dale Hilpert(6) | 17 | – | – | – | – | – | – | – | 17 | – | ||||||||||
| Russell Walls(7) | 38 | 18 | – | – | – | – | – | – | 38 | 18 | ||||||||||
| David Wellings(8) | – | 13 | – | – | – | – | – | – | – | 13 | ||||||||||
| Total | 1,484 | 1,625 | 71 | 90 | 476 | 575 | – | 304 | 2,031 | 2,594 | ||||||||||
| (1) | Benefits incorporate all benefits arising from employment by the Group, which in the main relate to the provision of a company car and private health insurance. |
| (2) | On 30 September 2002 the former Chief Executive of the UK division, Ian Dahl resigned giving 12 months' notice. The Group opted to make his resignation effective immediately in accordance with the terms of his contract and made a payment in February 2003 of £280,000 in lieu of notice. Signet also agreed to continue providing certain benefits that would have been payable had Ian Dahl remained in employment during his notice period, which amounted to £23,887 in total. No payments were made in respect to pensions. In accordance with the rules of the schemes the Remuneration Committee exercised its discretion to allow 434,211 executive share options, with an exercise price of 57p, to become exercisable in May 2003 and the 2000 LTIP grant to vest in 2003. Under the LTIP grant a payment of £62,222 was paid and an option over 112,619 shares at an exercise price of £1 in total was granted. All other executive options and LTIP awards held by Ian Dahl were forfeited. |
| (3) | Terry Burman's emoluments are specified and paid in US dollars and an average exchange rate of US$1.68 was used (2002/03:US$1.53). |
| (4) | Until his resignation on 30 September 2002. |
| (5) | Until his retirement on 8 January 2004. |
| (6) | From his appointment on 1 September 2003 |
| (7) | From his appointment on 1 August 2002. |
| (8) | Until his retirement on 13 June 2002. |
| The figures above represent emoluments earned as directors during the relevant financial year. Such emoluments are paid in the same financial year with the exception of bonus payments, which are paid in the year following that in which they are earned. | |
executives should not be unfairly benefited or penalised by short term movements in exchange rates, it decided to award discretionary bonuses of 27.0% and 20.3% to the Group Chief Executive and Group Finance Director. These payments took the total bonus payments up to the target level being 50.0% for the Group Chief Executive and 37.5% for the Group Finance Director, set by the Remuneration Committee even though performance at constant exchange rates would have justified a
significantly higher figure. Short term bonus targets will in future use constant exchange rates.
In 2002/032004/05 the annual bonus of the Group Chief Executive wasis capped at 100% of base salary and that of the other executive directorGroup Finance Director at 75% and were basedof base salary. The potential rate of bonus increases on a straight line basis from the increaserate of inflation up to an intermediate target for growth in Group profit before tax for the year. The potential rate of bonus increased on a straight line basis upat
| Signet Group plc Annual Report & Accounts year ended 31 January 2004 | 45 |
Back to a growth target of 10%,Contents
Directors’ remuneration report (continued)
constant exchange rates, then an accelerated rate appliedapplies until the maximum bonus could have beencan be earned at 15% growth.Thegrowth. The minimum bonuses wereare only payable after profits increasedincrease by more than inflation.
(b)(c) Share option and long term incentive plans
Share options granted to directors are set out on page 47.50. See page 4143 for the factors influencing the choice of performance criteria and for the basis of measurement.
(i) Executive share option plans
In July 2003, following consultation with the Association of British Insurers and a significant number of major shareholders, approval was given at an extraordinary general meeting to the Signet Group plc International Share Option Plan 2003, the Signet Group plc UK Inland Revenue Approved Share Option Plan 2003 and the Signet Group plc US Share Option Plan 2003 (“2003 Plans”). Of the votes cast by proxy at the extraordinary general meeting 87% were in favour of the proposal. 1,160,619,434 votes were cast (68% of the issued share capital) and abstentions in respect of 7% of the issued share capital were received.
The conditions set by2003 Plans replace the Remuneration Committee for exercise of options granted in October 1997, April 1998, April 1999, May 2000, May 2001 and April 2002 under theSignet Group plc 1993 Executive Share Option Scheme 1993 were that for vesting to take place a post inflation minimum growth in earnings per share of 10% over any consecutive three year period had to(the “1993 Scheme”), under which no further options may be achieved. This performance condition was chosen asgranted.
The 2003 Plans allow the Remuneration Committee believed itdiscretion to set performance conditions. The performance conditions under the 2003 Plans were set out in the circular to shareholders seeking approval for the 2003 Plan and no significant change in those conditions will be in linemade without prior consultation with market practice.
Thesemajor shareholders. The Remuneration Committee made the 2004 grants on the same basis as the 2003 grants. The conditions have been met in respect of the optionsare set out below:
| UK executives | |
| For UK executives the personal performance of participants will be assessed on each occasion that share option grants take place and will be reflected in the level of the individual awards. | |
| In addition all grants will be subject to exercise conditions as follows: | |
| Level of grant | |||
| Required annual rate of | |||
| compound growth in | |||
| earnings per share | (1) | ||
| above inflation | (2) | ||
| Up to 200% of base salary | +3% | ||
| 201% to 400% of base salary | +4% | ||
| Above 400% of base salary | +5% | ||
| (1) | Normalised earnings per share as defined by the Institute of Investment Management and Research. | |
| (2) | As defined by the UK Retail Price Index. |
| Performance will be measured over three years from the start of the financial year in which the award is made, and may then be measured from the same start point to the end of the fourth and fifth years if not previously satisfied. | |
| US executives For US executives there is a pre-grant test based on both personal and corporate performance. In addition there is a post grant exercise condition that annual compound growth in earnings per share will be more than 3% above inflation. | |
| The post grant performance condition will be measured over three years from the start of the financial year in which the award is made, and may then be measured from the same start point to the end of the fourth and fifth years if not previously satisfied. |
42 Signet Group plc
Directors’ remuneration report (continued)
granted in October 1997, April 1998, April 1999 and May 2000; the performance criteria having been satisfied in each case over the first three year period following the grant of the options. Options granted under the executive share option planplans are normally only exercisable between three and ten years from the date of grant, after which the options lapse.
In July 2003 options of five times salary were awarded to the Group Chief Executive. In 2004 options amounting to five times salary will be awarded to the Group Chief Executive, the grant price to be fixed following the announcement of the preliminary results. The awards to the Group Chief Executive were based on principles 2 (iv), 2 (v), 2 (vi) (set out on pages 42 and 43), a remuneration survey that was undertaken, and reflected the strong performance of both the Group and the executive over the prior three years. In the case of the Group Finance Director, he was awarded options amounting to one and a quarter times salary in July 2003 and will be awarded options amounting to one and a half times salary in 2004.
Certain provisions of all the share option plans may be amended by the Board, but certain basic provisions (and in particular most of the limitations on individual participation, the number of shares and the percentage of share capital that can be issued thereunder) cannot be altered to the advantage of the participants except with the approval of the shareholders of the Company or in accordance with the adjustment provisions in the plans.
(ii) EmployeeAll-employee share plans
In 1998/99 the Group introduced an Inland Revenue approved savings related share option scheme for UK employees (the “Sharesave Scheme”), a US sectionSection 423 Plan (the “Employee Stock Savings Plan”) and a savings related share option scheme for employees in the Republic of Ireland (the “Irish Sharesave Scheme”), together, the “All-employee Schemes”. These schemes give those employees with qualifying service the opportunity to participate in the equity of the Company, with the aim of aligning the interests of employees with those of shareholders.
| 46 | Signet Group plc Annual Report & Accounts year ended 31 January 2004 |
The options granted under the Sharesave Scheme and the Irish Sharesave Scheme are normally exercisable between 36 and 42 months from the date of the relevant savings contract. Options were granted under these plans at a price approximately 20% below the middle market price of the shares on the London Stock Exchange on the dealing day prior to the date that employees were invited to participate in them.
The options granted under the Employee Stock Savings Plan, which is for employees in the US, are normally exercisable between 24 and 27 months from the date of grant, such date being the first business day of any period during which savings may be accumulated under a savings contract. The options under this plan were granted at a price approximately 15% below the middle market price of the shares on the London Stock Exchange on the date of grant. The period of exercise and the discount allowed vary from the UK due to different legal regulations in the US.
(iii) Long term incentive plan
Shareholders gave approval, in June 2000, to the Signet Group plc 2000 Long Term Incentive Plan (“2000 LTIP”).
Awards were made to executive directors and other senior executives in 2000/01, 2001/02, 2002/03 and 2002/03.2003/04. All these awards are subject to fulfilment of minimum performance conditions set at the time of the award as to:
| • | compound annual growth in the profit before tax of the Group using a constant exchange rate (“Profit Growth”) and |
| • | the return on capital employed (“ROCE”) of the Group |
in each case over a fixed period of three successive financial years starting with the one in which the award was made. Nothing is payable under the award unless both minimum performance conditions are achieved.Theachieved. The minimum Profit
Growth is set at a threshold level based onafter taking account of inflation. The conditions were selected to ensure that awards would only vest provided that growth in profits exceeded the rate of inflation and that the business’s targeted ROCE is broadly maintained or improved.achieved.
If the performance conditions are achieved the award will vest and its value will depend on the extent to which the minimum performance conditions are exceeded:
| • | if Profit Growth exceeds the minimum threshold inflation level, the amount of the award will be calculated on a straight line basis from that level up to a specified inflection point, at which point 37.5% of the award will vest, and then at an accelerated rate on a straight line basis up to the maximum set for the particular participant. This maximum is equal to a specified percentage of his base salary at the time at which the award vests. The maximum award for the Group Chief Executive is equal to 70% of base salary at vesting and for the Group Finance Director |
| • | if the minimum threshold inflation level of Profit Growth is achieved but the maximum award has not been earned by reference to Profit Growth, then, in addition to the percentage of base salary which has been earned on the above basis, the amount of the award earned on the basis of Profit Growth may be increased on the basis of the ROCE increase. In the case of the Group Chief Executive, for each 0.5% by which the ROCE exceeds the level specified in the award, the amount of the award would increase by an amount equal to 5% of base salary (at vesting) up to a maximum increase equal to 35% of such base salary. Similarly in the case of the Group Finance Director, for each 0.5% by which the ROCE exceeds the specified level the amount of the award would increase by an amount equal to 3% of such base salary up to a maximum increase equal to 25% of such base salary. In |
Signet Group plc 43
| 2000 LTIP performance criteria | ||||||||
| 2004/05 | 2003/04 | 2002/03 | 2001/02 | |||||
| award | award | award | award | |||||
| Minimum performance for any vesting | ||||||||
| Profit measure | Profit Growth in excess of threshold inflation level | |||||||
| ROCE measure | 22.2% | 21.0% | 20.5% | 20.5% | ||||
| Profit Growth performance measure | ||||||||
| Profit Growth rate inflection point | 10.0% | 10.0% | 10.0% | 10.0% | ||||
| Profit Growth rate required for maximum vesting | 15.0% | 15.0% | 15.0% | 15.0% | ||||
| ROCE performance measure | ||||||||
| Specified ROCE required | 23.2% | 22.0% | 21.5% | 22.5% | ||||
| Signet Group plc Annual Report & Accounts year ended 31 January 2004 | 47 |
Directors’ remuneration report (continued)
The table belowon page 47 shows the percentages and the inflection points which have been specified for the existing awards and indicates the relevant profits and ROCE to be used for measurement in the case of each participant.
When the performance conditions have been satisfied 50% of the amount which vests will be payable in cash and the other 50% will consist of the grant of an option to acquire shares in the Company.TheCompany, the number of shares being determined by using the middle market price on the day preceding the grant of the award. For the 2000/01, 2001/02, and 2002/03 and 2003/04 awards, thethat share price that will be used is 55.25p,was 74.75p, 121.00p and 121.0p83.50p respectively. Due to the deferred equity nature of the share linked element of the award the exercise price of the option is a nominal amount of £1.£1 or $1, as appropriate. The participants can normally exercise their option at any time after vesting, until the tenth anniversary of the grant of the award.
It is anticipated that in 2003/04In 2004/05 awards under the 2000 LTIP will bewere made to the Group Chief Executive and the Group Finance Director at a similar level to that of previous years.years, the share price to be fixed following the announcement of the preliminary results.
(c)(d) Employee trusts
The share option plans may be operated in conjunction with one or more employee share ownership trusts (the Signet Group Employee Share Trust (“ESOT”) or the Signet Group Qualifying Employee Share Trust (“QUEST”)) which may acquire shares in the Company for the purposes of satisfying the exercise of options.
The 2000 LTIP operates in conjunction with the ESOT which may be funded by the Group to acquire shares in the Company for the purposes of meeting the Company’s obligation to provide shares on the exercise of options.
The trustees of the ESOT and QUEST have waived their rights to any dividends declared on shares held in the trusts.
(e) Share Scheme Limits
The executive share option plans are subject to the following limits on the number of shares that may be issued:
| (i) | the maximum number of shares that have been or may be issued pursuant to options granted under the executive share option plans and any other discretionary share option scheme adopted by the Company may not exceed 5% of the shares from time to time in issue in any ten year period; |
| (ii) | the maximum number of shares that have been or may be issued pursuant to options granted under the executive share |
| option plans and any other employees’ share scheme adopted by the Company may not exceed 10% of the shares from time to time in issue in any ten year period; and | |
| (iii) | the maximum of 171,376,839 shares (representing 10% of the issued share capital on 8 July 2003) may be issued pursuant to incentive options granted under the US Plan (the equivalent 10% limit for incentive stock options under the US section of the 1993 Scheme as at 8 June 2000 was 167,996,844 shares). |
In any ten year period not more than 10% of the issued share capital of the Company from time to time may in aggregate be issued or issuable pursuant to options granted under the All-employee Schemes or any other employees’ share schemes adopted by the Company.
The number of shares which may be issued or issuable pursuant to the 2000 LTIP (including to the ESOT), when aggregated with any shares issued or issuable by the Company in the preceding ten years under any employees’ share scheme, participation in which is at the discretion of the Board, is limited to 5% of the Company’s issued share capital from time to time. The number of shares which may be issued or issuable pursuant to the 2000 LTIP (including to the ESOT), when aggregated with all shares issued or issuable by the Company in the preceding ten years under any other employees’ share scheme, is limited to 10% of the Company’s issued share capital from time to time.
No more than 5% of the issued share capital of the Company may be held by the trustee of the ESOT without prior approval of shareholders.
(f) Shareholding guidelines
When the 2003 Plans were introduced shareholding guidelines were set for executive directors and senior executives of the Group. The Group Chief Executive is expected to build a holding of shares equal to at least twice salary and the Group Finance Director to at least one times salary. Until these levels have been achieved, half of any post tax option gains under the 2003 Plans should be held in Signet shares.
(g) Service contracts
The Group Chief Executive has a rolling service contract (dated 20 December 2000) with a US subsidiary which can be terminated on one year’s notice in writing by either party.
The Group Finance Director has a rolling service contract (dated 14 June 1995 and amended on 15 May 2000) with the Company, which can be terminated on one year’s notice in writing by either party and terminates on his 60th birthday. The service contracts for the Group Chief Executive and the Group Finance Director provide for liquidated damages
| 48 | Signet Group plc Annual Report & Accounts year ended 31 January 2004 |
termination payments in the casecases of early termination by the Group or changein the event of certain changes of control. In these circumstances the amount of liquidated damagestermination payments due to the Group Chief Executive would equal, in summary, the aggregate of (i) 100% of his base salary at the time of termination (ii) 25% of his base salary in respect of pension and other benefits, (iii) his outstanding contractual entitlement to a cash bonus under the annual bonus plan referred to on page 4244 in respect of the periodproportion of the fiscal year prior to the effective date of termination and (iv) a further sum equal to a variable percentage (currently 87.8%80.6%) of the next cash bonus to which he would have become entitled under the annual bonus plan.Theplan during the notice period. The amount of liquidated damagestermination payments due to the Group Finance Director would equal, in summary, the aggregate of (i) his annual salary as at the time of termination, (ii) the market value of the contractual benefits in kind (including any pension contribution) to which he would have become entitled during the following 12 months, and (iii) all payments to which he would have become entitled under the annual bonus plan during the same 12 month period. Entitlement to any share options or LTIP awards is governed by the rules of the relevant scheme.Thescheme. The contracts contain confidentiality and non-competition clauses.
The Chairman has a letter of appointment (dated 20 June 2001), with no fixed term, whichterm. The appointment can be terminated in writing by either party on reasonable notice. Each non-executive director has a letter of appointment from the Company which does not have a termination clause and does not provide for compensation for loss of office.
2000 LTIP performance criteria
2002/03 award | 2001/02 award | 2000/01 award | |||||||||||
Group(1) | UK(2) | Group(1) | UK(2) | Group(1) | UK(2) | ||||||||
| Minimum performance for any vesting | |||||||||||||
| Profit measure | Profit Growth in excess of threshold inflation level | ||||||||||||
| ROCE measure | 20.5% | 35.0% | 20.5% | 32.0% | 20.5% | 25.0% | |||||||
| Profit Growth performance measure | |||||||||||||
| Profit Growth rate – inflection point | 10.0% | 10.0% | 10.0% | 10.0% | 10.0% | 10.0% | |||||||
| Profit Growth rate required for | |||||||||||||
| maximum vesting | 15.0% | 15.0% | 15.0% | 15.0% | 15.0% | 15.0% | |||||||
| ROCE performance measure | |||||||||||||
| Specified ROCE required | 21.5% | 37.0% | 22.5% | 34.0% | 22.5% | 27.0% | |||||||
44 Signet Group plc
The letters of appointment are dated as set out below:
| Robert Blanchard | 5 September 2000 | |
| Dale Hilpert | 15 July 2003 | |
| Brook Land | 16 October 1995 | |
| Russell Walls | 29 May 2002 | |
(d)(h) Company pension
The Chairman did not receive any pension provision in
The Group Chief Executive is a member of the Sterling Jewelers Inc. 401(k) Retirement Savings Plan and an unfunded, unqualified deferred compensation plan. Contributions made by Signet’s US division in respect of the Group Chief Executive during the period totalled £1,797* (2001/02: £1,771*£1,786ß (2002/03: £1,797ß) and £145,571* (2001/02: £144,061*£140,091ß (2002/03: £145,571ß) respectively.
Pension benefits in respect of UK based directors are set out below.
(i) Aggregate emoluments
The total emoluments for directors of the Company and officers of the Group (excluding amounts due under the LTIP), as listed on pages 34 and 35, for services in all capacities was 2,403,000 (2002/03: £3,340,000). The amounts due under the 2000 LTIP for directors of the Company and officers of the Group was £760,000 (2002/03: £1,107,000, restated to reflect the market value at vesting). 50% of the amounts due under the 2000 LTIP are payable in cash and the other 50% consists of the grant of an option to acquire shares in the Company. Details of the directors’ emoluments are given on page 46.45.
Directors’ emoluments*
Details of directors’ emoluments for the year to 1 February 2003 were as follows:
| Basic salary or fees | Benefits(1) | Short term bonuses(2) | Termination payments(3) | Total | |||||||||||||||||
2003 | 2002 | 2003 | 2002 | 2003 | 2002 | 2003 | 2002 | 2003 | 2002 | ||||||||||||
£000 | £000 | £000 | £000 | £000 | £000 | £000 | £000 | £000 | £000 | ||||||||||||
Executive | |||||||||||||||||||||
James McAdam Chairman | 271 | 286 | 24 | 22 | – | 270 | – | – | 295 | 578 | |||||||||||
Walker Boyd Group Finance Director | 291 | 268 | 21 | 16 | 131 | 70 | – | – | 443 | 354 | |||||||||||
Terry Burman(4) Group Chief Executive | 743 | 735 | 30 | 32 | 444 | 288 | – | – | 1,217 | 1,055 | |||||||||||
Ian Dahl(5) Former Chief Executive of UK division | 184 | 262 | 15 | 18 | – | 159 | 304 | – | 503 | 439 | |||||||||||
Non-executive | |||||||||||||||||||||
| Lee Abraham | 35 | 31 | – | – | – | – | – | – | 35 | 31 | |||||||||||
| Robert Blanchard | 35 | 31 | – | – | – | – | – | – | 35 | 31 | |||||||||||
| Brook Land | 35 | 31 | – | – | – | – | – | – | 35 | 31 | |||||||||||
Russell Walls(6) | 18 | – | – | – | – | – | – | – | 18 | – | |||||||||||
David Wellings(7) | 13 | 31 | – | – | – | – | – | – | 13 | 31 | |||||||||||
| Total | 1,625 | 1,675 | 90 | 88 | 575 | 787 | 304 | – | 2,594 | 2,550 | |||||||||||
Signet Group plc 45
Pension benefits for UK based executive directors *
| Pension benefits for UK based executive directorsß | |||||||||||||||||
| Ian Dahl | |||||||||||||||||
| Walker Boyd | former Chief Executive of | ||||||||||||||||
| Group Finance Director | the UK division | ||||||||||||||||
Walker Boyd Group Finance Director | Ian Dahl former Chief Executive of the UK division | ||||||||||||||||
| 2003/04 | 2002/03 | 2003/04 | 2002/03 | (1) | |||||||||||||
2002/03 | 2001/02 | 2002/03(1) | 2001/02 | ||||||||||||||
| £ | £ | £ | £ | ||||||||||||||
£ | £ | £ | £ | ||||||||||||||
| Change in accrued benefits during the year (gross of inflation) (A) | 3,814 | 4,222 | 2,295 | 3,330 | 3,934 | 3,814 | – | 2,295 | |||||||||
| Change in accrued benefits during the year (net of inflation) | 3,285 | 3,768 | 2,173 | 3,265 | 2,955 | 3,285 | – | 2,173 | |||||||||
| Accrued benefits at the end of the year | 34,954 | 31,140 | 9,450 | 7,155 | 38,888 | 34,954 | – | 9,450 | |||||||||
| Transfer value of (A)(2) | 37,621 | 39,959 | 36,393 | 46,720 | 35,071 | 37,621 | – | 36,393 | |||||||||
| Transfer value of accrued benefits at the beginning of the year(2) | 336,380 | 322,757 | 104,583 | 57,516 | 400,303 | 336,380 | – | 104,583 | |||||||||
| Transfer value of accrued benefits at the end of the year(2) | 400,303 | 336,380 | 158,266 | 104,583 | 408,530 | 400,303 | – | 158,266 | |||||||||
| Change in transfer value of accrued benefits(2)(3) | 63,923 | 13,623 | 53,683 | 47,067 | 8,227 | 63,923 | – | 53,683 | |||||||||
| Group payments to the FURBS | 38,787 | 34,540 | 30,027 | 33,457 | 41,760 | 38,787 | – | 30,027 | |||||||||
| Life insurance contributions | 2,127 | 1,756 | 4,265 | 3,536 | |||||||||||||
| Life assurance contributions | 2,508 | 2,127 | – | 4,265 | |||||||||||||
| (1) | Until his resignation on 30 September 2002. |
| (2) | No contributions were made by a director. |
| (3) | Calculated in accordance with the Actuarial Guidance Note GN 11. |
| Signet Group plc Annual Report & Accounts year ended 31 January 2004 | 49 |
4 Directors’ interests in shares*remuneration report
(continued)
| 4. | Directors’ interests in sharesß |
| (a) | Directors’ interest in share optionsß |
| Director | Number of shares under option | ||||||||||||||||||
| At 2 | At 31 | Date from | |||||||||||||||||
| February | January | Exercise | which | Expiry | |||||||||||||||
| 2003 | Granted | Forfeited | Exercised | 2004 | price | exercisable | (1) | date | (1) | ||||||||||
| Walker Boyd(2) | |||||||||||||||||||
| 837,037 | – | – | – | 837,037 | 33.75p | 6.10.00 | 5.10.07 | ||||||||||||
| 745,665 | – | – | – | 745,665 | 43.25p | 28.4.01 | 27.4.08 | ||||||||||||
| 429,648 | – | – | – | 429,648 | 49.75p | 10.4.02 | 31.3.09 | ||||||||||||
| 611,842 | – | – | – | 611,842 | 57.00p | 8.5.03 | 7.5.10 | ||||||||||||
| 179,401 | – | – | – | 179,401 | 75.25p | 2.5.04 | 1.5.11 | ||||||||||||
| (3 | ) | 19,000 | – | – | – | 19,000 | 50.00p | 1.1.05 | 30.6.05 | ||||||||||
| 225,000 | – | – | – | 225,000 | 120.00p | 11.4.05 | 10.4.12 | ||||||||||||
| – | 133,484 | – | – | 133,484 | £1 in total | 15.4.03 | 18.7.10 | ||||||||||||
| (4 | ) | – | 397,435 | – | – | 397,435 | 97.50p | 14.7.06 | 13.7.13 | ||||||||||
| Total | 3,047,593 | 530,919 | – | – | 3,578,512 | 55.04p | (5) | ||||||||||||
| Terry Burman(2) | |||||||||||||||||||
| (6 | ) | 1,968,122 | – | – | (1,968,122 | ) | – | $0.72 | – | – | |||||||||
| 1,094,239 | – | – | – | 1,094,239 | $0.80 | 10.4.02 | 31.3.09 | ||||||||||||
| 2,217,280 | – | – | – | 2,217,280 | $0.87 | 8.5.03 | 7.5.10 | ||||||||||||
| 496,289 | – | – | – | 496,289 | $1.08 | 2.5.04 | 1.5.11 | ||||||||||||
| 1,242,019 | – | – | – | 1,242,019 | $1.72 | 11.4.05 | 10.4.12 | ||||||||||||
| (3 | ) | 8,670 | – | – | – | 8,670 | $1.10 | 3.11.04 | 31.1.05 | ||||||||||
| (6 | ) | – | 486,384 | – | (486,384 | ) | – | $1 in total | – | – | |||||||||
| (4 | ) | – | 3,807,426 | – | – | 3,807,426 | $1.59 | 14.7.06 | 13.7.13 | ||||||||||
| Total | 7,026,619 | 4,293,810 | – | (2,454,506 | ) | 8,865,923 | $1.30 | (5) | |||||||||||
| James McAdam | |||||||||||||||||||
| 1,075,145 | – | – | – | 1,075,145 | 43.25p | 28.4.01 | 27.4.08 | ||||||||||||
| 869,347 | – | – | – | 869,347 | 49.75p | 10.4.02 | 31.3.09 | ||||||||||||
| (3 | ) | 19,000 | – | – | – | 19,000 | 50.00p | 1.1.05 | 30.6.05 | ||||||||||
| Total | 1,963,492 | – | – | – | 1,963,492 | 46.19p | (5) | ||||||||||||
| All options were granted to directors while they were directors. The performance conditions for grants made under the 2003 Plans are set out on page 46. The conditions set by the Remuneration Committee for exercise of options granted under the Executive Share Option Scheme 1993 were that for vesting to take place a post inflation minimum growth in earnings per share of 10% over any consecutive three year period had to be achieved. This performance condition was chosen as the Remuneration Committee believed it to be in line with market practice. This condition has been met in respect of the options granted between October 1997 and May 2001; the performance criteria having been satisfied in each case over the first three year period following the grant of the options. The Black-Scholes option-pricing model fair value is given on page 99 for options granted in the last three years. | |
| (1) | The dates from which options are exercisable and the expiry dates are the dates that normally apply. Other dates apply in certain circumstances, such as an option holder ceasing to be employed. |
| (2) | See page 46 regarding awards that will be made in 2004/05. |
| (3) & (4) | The options above were all granted under the 1993 Scheme except those marked (3) which were granted under the terms of the Sharesave Scheme or, in the case of Terry Burman, the Employee Stock Savings Plan, and those marked (4) which were granted under the 2003 Plans. |
| (5) | These are weighted averages of the exercise prices per share for the options held at the year end. |
| (6) | Exercised on 9 September 2003, when the market price was 113.5p. |
| The aggregate amount of gains made by directors on the exercise of options during the year amounted to £1,934,651 (2002/03: £594,191) | |
| 50 | Signet Group plc Annual Report & Accounts year ended 31 January 2004 |
Except as set out in tabletables (a), (b) and (c) on page 49,, or in the notes under these tables, no director nor any member of any director’s immediate family had an interest in, or was granted or exercised any right to subscribe for, shares or debentures of the Company or any subsidiary, nor did any such right to subscribe lapse during the financial year, nor was there any change between the end of the financial year and 2624 March 20032004 in the interests of any director of the Company disclosed to the Company under the provisions of section 324 (duty of directors to disclose shareholdings in own company) as extended by section 328 (extension of section 324 to spouses and children) of the Companies Act 1985 nor in any right to subscribe for shares in, or debentures of, the Company.
At 2 February 2002, 1 February 2003, 31 January 2004 and 2624 March 2003,2004, according to the register kept by the Company under section 325 of the Companies Act 1985, the directors held interests in the shares of the Company as indicated in tables (a), (b) and (c) on pages 4750 to 49.52. As explained on page 4347 the value of the awards that vest under the 2000 LTIP depends upon the extent to which the performance conditions are met. The awards are also capped by reference to a percentage of the recipient’s base salary.
Although the minimum performance conditions for the 2000/012001/02 award have been met,exceeded, vesting will only occur within 60 days of the preliminary results announcement for the year ended February 2003.31 January 2004.
| (b) | Directors’ interests in LTIPsß |
| Awards subject to | Awards where the performance | ||||||||||||||||||
| performance conditions | conditions have been satisfied(1) | ||||||||||||||||||
| Option | Cash and | Cash and | Expiry of | ||||||||||||||||
| Cash | Option | Cash | Option | portion | options total | options | award or | ||||||||||||
| Date of | portion | (2) | portion | (2) | portion | (3) | portion | (3) | (current | (4) | current | (4)(5) | total | (6) | vested | ||||
| award | (grant value) | (number) | (grant value) | (number) | value) | value | vested | option | |||||||||||
| Director | £ | £ | £ | £ | £ | ||||||||||||||
| Walker Boyd(7) | |||||||||||||||||||
| 2000/01 award(8) | 19.7.00 | – | – | – | – | – | – | 176,533 | 18.7.10 | ||||||||||
| 2001/02 award(8) | 4.5.01 | – | – | 65,410 | 87,504 | 94,505 | 159,915 | – | 3.5.11 | ||||||||||
| 2002/03 award(8) | 26.4.02 | 77,500 | 64,049 | – | – | – | 146,673 | – | – | (9) | |||||||||
| 2003/04 award | 2.5.03 | 77,500 | 92,814 | – | – | – | 177,739 | – | – | (9) | |||||||||
| Awards at end of year | 155,000 | 156,863 | 65,410 | 87,504 | 94,505 | 484,327 | 176,533 | ||||||||||||
| Terry Burman(7) | |||||||||||||||||||
| 2000/01 award(8) | 19.7.00 | – | – | – | – | – | – | 630,886 | 18.7.10 | ||||||||||
| 2001/02 award(8) | 4.5.01 | – | – | 201,623 | 344,941 | 372,537 | 574,160 | – | 3.5.11 | ||||||||||
| 2002/03 award(8) | 26.4.02 | 230,163 | 240,005 | – | – | – | 489,369 | – | – | (9) | |||||||||
| 2003/04 award | 2.5.03 | 230,163 | 316,318 | – | – | – | 571,787 | – | – | (9) | |||||||||
| Awards at end of year | 460,326 | 556,323 | 201,623 | 344,941 | 372,537 | 1,635,316 | 630,886 | ||||||||||||
| All grants were made to directors while they were directors and the performance conditions relating to the awards are set out on page 47. | |
| (1) | In respect of the 2001/02 awards the Group performance achieved was a growth in profit before tax of 12.3% per annum and a ROCE of 24.0% . This resulted in 87.6% of the award vesting for the Group Chief Executive and 84.4% for the Group Finance Director. |
| (2) | Assumes maximum performance conditions are satisfied and is calculated using salary at 24 March 2004, a share price at the time of grant in 2002 of 121.0p and in 2003 of 83.5p and in the case of Terry Burman an exchange rate of $1.84. |
| (3) | Calculated using salary at 24 March 2004 and a share price at the time of grant in 2001 of 74.75p. The LTIP payment is made in the year following the last year in respect of which the performance condition was set. |
| (4) | Calculated using share price as at 24 March 2004 of 108p. |
| (5) | Cash portion plus option portion value at 24 March 2004. For awards where the level of performance is currently unknown, no payment, or a reduced payment may be made. In respect of awards where the performance is known the base salary may be different at the date of vesting. |
| (6) | Vesting took place on 15 April 2003 and the cash portion was worth £73,750 and £256,369 respectively for Walker Boyd and Terry Burman. The option interest was over 133,484 shares for Walker Boyd and 486,384 shares for Terry Burman and are included in the table of directors’ interests in share options on page 50. The share price on the day of vesting was 77p. For Terry Burman an exchange rate of $1.57 was used. |
| (7) | The Remuneration Committee approved grants of LTIP awards to Terry Burman (maximum of 70% of salary at vesting) and Walker Boyd (maximum of 50% of salary at vesting) on 23 March 2004. |
| (8) | Awards at start of year. |
| (9) | Expiry dates of awards will be known within 60 days after the announcement of the preliminary results for the last financial year in the performance period. |
| Signet Group plc Annual Report & Accounts year ended 31 January 2004 | 51 |
Directors’ remuneration report (continued)
| (c) | Directors’ interests in sharesß |
| Number of shares | ||||||
| At start | At end | At 24 March | ||||
| Director | of year | of year | 2004 | |||
| Lee Abraham(1) | 75,000 | 75,000 | – | |||
| Robert Blanchard | 6,360 | 6,360 | 6,360 | |||
| Walker Boyd | 433,495 | 433,495 | 433,495 | |||
| Terry Burman | 322,266 | 460,866 | 460,866 | |||
| Dale Hilpert | – | – | – | |||
| Brook Land | 25,000 | 25,000 | 25,000 | |||
| James McAdam(2) | 242,088 | 242,088 | 242,088 | |||
| Russell Walls | 4,000 | 4,000 | 4,000 | |||
| (1) | Until his retirement as a director on 8 January 2004. |
| (2) | 22,000 of those shares held were, at each date, held by James McAdam’s wife in trust for their grandchildren and, while James McAdam is taken to have an interest in them for Companies Act purposes, neither he nor his wife has a beneficial interest in them. |
The Group operates the Signet Qualifying Employee Share Trust (“QUEST”)QUEST which is currently used to facilitatein connection with the Sharesave Scheme, and the Signet Employee Share Ownership Trust (“ESOT”).ESOT. Walker Boyd and James McAdam, at 2 February 2002, 1 February 2003, 31 January 2004 and 2624 March 2003, and Ian Dahl at 2 February 2002 and 30 September 2002,2004, were, in common with all other UK employees of the Group, deemed to have an interest in the shares held by the QUEST and the ESOT. The QUEST held 395,528180 shares on 2 February 2002, 180 on 30 September 2002, 110,8572002,110,857 on 1 February 2003, 41,065 on 31 January 2004 and 125,93035,992 on 2624 March 2003,2004, and the ESOT held nil shares on each of those dates. No director had been granted any specific interest in such shares other than options held by them under a savings-related share option scheme.
The Company’s register of directors’ interests, which is open to inspection at the registered office, contains full details of directors’ shareholdings and share options.
46 Signet Group plc
(a) Directors’ interest in share options*
Director | Number of shares under option | |||||||||||||||||
At start of year | Granted | Forfeited | Exercised | At year end | Exercise price | Date from which exercisable | (1) | Expiry date | (1) | |||||||||
| Walker Boyd | ||||||||||||||||||
| (2) | 1,637,037 | – | – | (800,000 | ) | 837,037 | 33.75 | p | 6.10.00 | 5.10.07 | ||||||||
| 745,665 | – | – | – | 745,665 | 43.25 | p | 28.4.01 | 27.4.08 | ||||||||||
| 429,648 | – | – | – | 429,648 | 49.75 | p | 10.4.02 | 31.3.09 | ||||||||||
| 611,842 | – | – | – | 611,842 | 57.00 | p | 8.5.03 | 7.5.10 | ||||||||||
| 179,401 | – | – | – | 179,401 | 75.25 | p | 2.5.04 | 1.5.11 | ||||||||||
| (3) | 19,000 | – | – | – | 19,000 | 50.00 | p | 1.1.05 | 30.6.05 | |||||||||
| – | 225,000 | – | – | 225,000 | 120.00 | p | 11.4.05 | 10.4.12 | ||||||||||
| 3,622,593 | 225,000 | – | (800,000 | ) | 3,047,593 | 51.91p | (4) | |||||||||||
| Terry Burman | ||||||||||||||||||
| 1,968,122 | – | – | – | 1,968,122 | $0.72 | 28.4.01 | 27.4.08 | |||||||||||
| 1,094,239 | – | – | – | 1,094,239 | $0.80 | 10.4.02 | 31.3.09 | |||||||||||
| 2,217,280 | – | – | – | 2,217,280 | $0.87 | 8.5.03 | 7.5.10 | |||||||||||
| (3)(5) | 14,760 | – | – | (14,760 | ) | – | $0.64 | – | – | |||||||||
| 496,289 | – | – | – | 496,289 | $1.08 | 2.5.04 | 1.5.11 | |||||||||||
| – | 1,242,019 | – | – | 1,242,019 | $1.72 | 11.4.05 | 10.4.12 | |||||||||||
| (3) | – | 8,670 | – | – | 8,670 | $1.10 | 3.11.04 | 31.1.05 | ||||||||||
| 5,790,690 | 1,250,689 | – | (14,760 | ) | 7,026,619 | $0.98 | (4) | |||||||||||
| Ian Dahl | (6) | |||||||||||||||||
| 434,211 | – | – | – | 434,211 | 57.00 | p | 8.5.03 | 7.11.03 | ||||||||||
| 352,159 | – | (352,159 | ) | – | – | – | – | – | ||||||||||
| – | 220,833 | (220,833 | ) | – | – | – | – | – | ||||||||||
| 786,370 | 220,833 | (572,992 | ) | – | 434,211 | 57.00p | (4) | |||||||||||
| James McAdam | ||||||||||||||||||
| 1,075,145 | – | – | – | 1,075,145 | 43.25 | p | 28.4.01 | 27.4.08 | ||||||||||
| (3)(7) | 45,588 | – | – | (45,588 | ) | – | 21.25 | p | – | – | ||||||||
| 869,347 | – | – | – | 869,347 | 49.75 | p | 10.4.02 | 31.3.09 | ||||||||||
| (3) | 19,000 | – | – | – | 19,000 | 50.00 | p | 1.1.05 | 30.6.05 | |||||||||
| 2,009,080 | – | – | (45,588 | ) | 1,963,492 | 46.19p | (4) | |||||||||||
Signet Group plc 47
| Share price |
(b) Directors’ interests in LTIPs*
Awards subject to performance condition | Awards where the performance condition has been satisfied(1) | ||||||||||||||||||
Director | Date of award | Cash value(2) £ | Number of share options | Cash value(3) £ | Number ofshare options(3) | Option interest market value(4)£ | Total current value(5) £ | Vested and paid in year £ | Expiry of award or vested option | ||||||||||
| Walker Boyd | |||||||||||||||||||
| 2000/01 award (6) | 19.7.00 | – | – | 73,750 | 133,484 | 97,110 | 170,860 | – | 18.7.10 | ||||||||||
| 2001/02 award (6) | 4.5.01 | 73,750 | 98,662 | – | – | – | 145,527 | – | (7 | ) | |||||||||
| 2002/03 award | 26.4.02 | 73,750 | 60,950 | – | – | – | 118,091 | – | (7 | ) | |||||||||
| Awards at end of year | 147,500 | 159,612 | 73,750 | 133,484 | 97,110 | 434,478 | |||||||||||||
| Terry Burman | |||||||||||||||||||
| 1999/00 award (6) | 6.4.99 | – | – | – | – | – | – | 520,000 | (8) | ||||||||||
| 2000/01 award (6) | 19.7.00 | – | – | 256,369 | 464,017 | 337,572 | 593,941 | – | 18.7.10 | ||||||||||
| 2001/02 award (6) | 4.5.01 | 256,369 | 342,969 | – | – | – | 505,879 | – | (7 | ) | |||||||||
| 2002/03 award | 26.4.02 | 256,369 | 211,876 | – | – | – | 410,508 | – | (7 | ) | |||||||||
| Awards at end of year | 512,738 | 554,845 | 256,369 | 464,017 | 337,572 | 1,510,328 | |||||||||||||
| Ian Dahl | |||||||||||||||||||
| 2000/01 award (6) | 19.7.00 | – | – | 62,222 | 112,619 | 81,931 | 144,153 | – | 30.9.03 | ||||||||||
| 2001/02 award (6)(9) | 4.5.01 | 70,000 | 93,645 | – | – | – | – | – | forfeited | ||||||||||
| 2002/03 award (9) | 26.4.02 | 70,000 | 57,851 | – | – | – | – | – | forfeited | ||||||||||
| Awards at end of year | – | – | 62,222 | 112,619 | 81,931 | 144,153 | |||||||||||||
48 Signet Group plc
(c) Directors’ interests in shares*
| Number of shares | |||||||
| Director | At start | At end | At 26 March | ||||
| of year | of year | 2003 | |||||
| Lee Abraham | 75,000 | 75,000 | 75,000 | ||||
| Robert Blanchard | 6,360 | 6,360 | 6,360 | ||||
| Walker Boyd | 433,495 | 433,495 | 433,495 | ||||
| Terry Burman | 307,506 | 322,266 | 322,266 | ||||
| Ian Dahl(1) | – | 10,000 | – | ||||
| Brook Land | 25,000 | 25,000 | 25,000 | ||||
| James McAdam(2) | 131,500 | 242,088 | 242,088 | ||||
| Russell Walls(3) | – | 4,000 | 4,000 | ||||
| David Wellings(4) | 32,500 | 32,500 | – | ||||
5Share price
The middle market price of a Signet share on the London Stock Exchange was 75.00p94.5p on 31 January 2004 and was 75.0p on 1 February 2003 and was 103.50p on 2 February 2002.2003. During the 52 weeks ended 1 February 2003,31 January 2004, the middle market prices on the London Stock Exchange ranged between a low of 65.00p66.0p and a high of 132.50p.114.5p. On 2624 March 20032004 the middle market price was 72.75p.108.0p.
| 6. | Total shareholder return (“TSR”) |
6Total shareholder return
The graph belowon page 53 (left) shows the cumulative annual total return (share price movement and dividends) to shareholders of the Group since 1 February 199831 January 1999 based on the 30 day average of value of the share price compared to the FTSE 350 index.Thisindex. This index was chosen as a suitable comparator as it is a major market index of which the Group is a member. Also shown on a similar basis on the graph belowon page 53 (right), is the Group’s performance compared to the FTSE general retail sector.
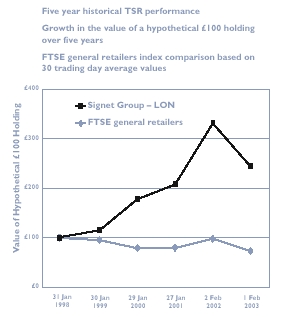 | Signet Group plc Annual Report & Accounts year ended 31 January 2004 |
Five year historical TSR performance
Growth in the value of a hypothetical £100 holding over five years
FTSE 350 (excluding investment trusts) comparison based on 30 trading day average values
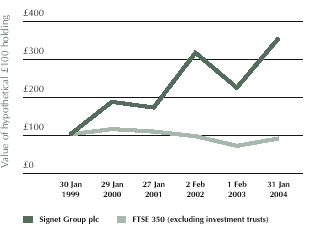
Five year historical TSR performance
Growth in the value of a hypothetical £100 holding over five years
FTSE general retailers index comparison based on 30 trading day average values

The directors’ remuneration report was approved by the Board on 2624 March 2003,2004, and signed on its behalf by:
Robert Blanchard,Chairman, Remuneration Committee
Signet Group plc 49
| Signet Group plc Annual Report & Accounts year ended 31 January 2004 | 53 |
Statement of directors’ responsibilities
The directors are required to prepare accounts for each financial period which give, in accordance with the Companies Act 1985, a true and fair view of the state of affairs of the Company and the Group as at the end of that financial period and of the profit or loss for that period. In preparing those accounts, the directors are required to:
| • | select suitable accounting policies and then apply them consistently; |
| • | make judgements and estimates that are in their opinion reasonable and prudent; and |
| • | state whether applicable accounting standards have been followed, subject to any material departures disclosed and explained in the accounts; and |
| prepare the accounts on a going concern basis unless in their view, based on the information then available to them, that basis of preparation would not be appropriate. |
The directors are responsible for ensuring that the Company complies with the requirements of the Companies Act 1985 in regard to keeping adequate accounting records which disclose with reasonable accuracy, at any time, the financial position of the Company and to enable them to ensure that the accounts comply with the Companies Act 1985.They1985. They have general responsibility for taking such steps as are reasonably open to them to safeguard the assets of the Group and to prevent and detect fraud and other irregularities.
50 Signet Group plc
| 54 | Signet Group plc Annual Report & Accounts year ended 31 January 2004 |
Independent auditor’s report |
To the Board of Directors and shareholders of Signet Group plc
We have audited the accompanying consolidated balance sheets of Signet Group plc and subsidiaries as at 31 January 2004 and 1 February 2003, and the related consolidated profit and loss accounts, consolidated statements of total recognised gains and losses and consolidated cash flow statements for the 52 week period ended 31 January 2004, the 52 week period ended 1 February 2003 and the 53 week period ended 2 February 2002 presented on pages 5256 to 96.
We have also audited102. These consolidated financial statements are the information in the Directors’ Remuneration Report that is described as having been audited.
Respective responsibilities of directors and auditorsThe directors are responsible for preparing the Annual Report and Form 20-F and the Directors’ Remuneration Report. As described on page 50, this includes responsibility for preparing the accounts in accordance with applicable United Kingdom law and accounting standards.The directors have also presented additional information under US requirements. Our responsibilities, as independent auditors, are established in the United Kingdom by statute, auditing standards generally accepted in the United Kingdom and in the United States, the Listing Rules of the United Kingdom Financial Services Authority, the United States Securities and Exchange Commission and by our profession’s ethical guidance.
We reportCompany’s management. Our responsibility is to you our United Kingdom opinion as to whether the accounts give a true and fair view and whether the accounts and the part of the Directors’ Remuneration Report to be audited have been properly prepared in accordance with the Companies Act 1985.We also report to you if, in our opinion, the directors’ report is not consistent with the accounts, if the Company has not kept proper accounting records, if we have not received all the information and explanations we require for our audit, or if information specified by law or the Listing Rules regarding directors’ remuneration and transactions with the Group is not disclosed.
We review whether the statement on page 38 reflects the Company’s compliance with the seven provisions of the Combined Code specified for our review by the Listing Rules, and we report if it does not. We are not required to consider whether the Board’s statements on internal control cover all risks and controls, or formexpress an opinion on the effectiveness of the Group’s corporate governance procedures or its risk and internal control procedures.these consolidated financial statements based on our audits.
We read the other information contained in the Annual Report and Form 20-F, including the corporate governance statement and the unaudited part of the Directors’ Remuneration Report, and consider whether it is consistent with the audited accounts. We consider the implications for our report if we become aware of any apparent misstatements or material inconsistencies with the accounts.
Basis of audit opinion
We conducted our auditaudits in accordance with auditing standards generally accepted in the United KingdomStates of America. Those standards require that we plan and inperform the United States.audit to obtain reasonable assurance about whether the financial statements are free of material misstatement. An audit includes examination,examining, on a test
basis, of evidence relevant tosupporting the amounts and disclosures in the accounts and the part of the Directors’ Remuneration Report to be audited. Itfinancial statements. An audit also includes an assessment ofassessing the accounting principles used and significant estimates and judgements made by the directors in the preparation of the accounts, and of whether the accounting policies are appropriate to the Group’s circumstances, consistently applied and adequately disclosed.
We planned and performed our audit somanagement, as to obtain all the information and explanations which we considered necessary in order to provide us with sufficient evidence to give reasonable assurance that the accounts and the part of the Directors’ Remuneration Report to be audited are free from material misstatement, whether caused by fraud or other irregularity or error. In forming our opinion we also evaluatedwell as evaluating the overall adequacy of the presentation of information in the accounts and the part of the Directors’ Remuneration Report to be audited.
United Kingdom opinionInfinancial statement presentation. We believe that our opinion the accounts giveaudits provide a true and fair view of the state of affairs of the Company and the Group as at 1 February 2003 and of the profit of the Groupreasonable basis for the 52 week period then ended and the accounts and the part of the Directors’ Remumeration Report to be audited have been properly prepared in accordance with the Companies Act 1985.our opinion.
United States opinion
In our opinion, the consolidated accountsfinancial statements referred to above present fairly, in all material respects, the financial position of Signet Group plc and subsidiaries as at 31 January 2004 and 1 February 2003, and the results of operations and cash flows for the 52 week period ended 31 January 2004, the 52 week period ended 1 February 2003 and the 53 week period ended 2 February 2002 in conformity with accounting principles generally accepted in the United States of America.
As discussed in note 17 to the financial statements, the Company adopted FRS 17 – ‘Retirement Benefits’ resulting in the restatement of the financial position of Signet Group plc and subsidiaries as at 1 February 2003 and 2 February 2002 and the results of its operations and its cash flows for the 52 week period ended 1 February 2003 and the 53 week period ended 2 February 2002 and the 52 week period ended 27 January 2001 in conformity with generally accepted accounting principles in the United Kingdom.2002.
Generally accepted accounting principles in the United Kingdom vary in certain significant respects from generally accepted accounting principles in the United States. ApplicationStates of generally accepted accounting principlesAmerica. Information relating to the nature and effect of such differences is presented on pages 94 to 102 in the United States would have affected the results of operations for the 52 week period ended 1 February 2003, and the 53 week period ended 2 February 2002 and the 52 week period ended 27 January 2001 and shareholders’ equity at 1 February 2003 and 2 February 2002 to the extent summarised on pages 88 to 96.consolidated financial statements.
KPMG Audit Plc
Chartered Accountants, Registered Auditor
London
2624 March 2003
2004
Signet Group plc 51
Signet Group plc Annual Report & Accounts year ended 31 January 2004 | 55 |
Consolidated profit and loss account |
for the 52 weeks ended 1 February 200331 January 2004
| 52 weeks ended 1 February 2003 | 53 weeks ended 2 February 2002 | 52 weeks ended 27 January 2001 | Notes | |||||||
| £m | £m | £m | ||||||||
| Sales | 1,608.0 | 1,578.1 | 1,387.3 | 2 | ||||||
| Cost of sales | (1,331.6 | ) | (1,318.3 | ) | (1,158.9 | ) | ||||
| Gross profit | 276.4 | 259.8 | 228.4 | |||||||
| Administrative expenses | (60.2 | ) | (59.1 | ) | (49.7 | ) | ||||
| Operating profit | 216.2 | 200.7 | 178.7 | 2 | ||||||
| Net interest payable and similar charges | (16.5 | ) | (17.9 | ) | (15.9 | ) | 3 | |||
| Profit on ordinary activities before taxation | 199.7 | 182.8 | 162.8 | 4 | ||||||
| Tax on profit on ordinary activities | (70.8 | ) | (63.1 | ) | (52.1 | ) | 7 | |||
| Profit for the financial period | 128.9 | 119.7 | 110.7 | |||||||
| Dividends | (36.1 | ) | (30.5 | ) | (27.4 | ) | 8 | |||
| Retained profit attributable to shareholders | 92.8 | 89.2 | 83.3 | |||||||
| Earnings per share – basic | 7.5 | p | 7.1 | p | 6.6 | p | 9 | |||
| Earnings per share – diluted | 7.5 | p | 7.0 | p | 6.5 | p | 9 | |||
| 52 weeks ended 31 January 2004 | 52 weeks ended 1 February 2003 as restated | (1) | 53 weeks ended 2 February 2002 as restated | (1) | ||||
| £m | £m | £m | Notes | |||||
| Sales | 1,617.2 | 1,608.0 | 1,578.1 | 2 | ||||
| Cost of sales | (1,330.9 | ) | (1,331.6 | ) | (1,318.3 | ) | ||
| Gross profit | 286.3 | 276.4 | 259.8 | |||||
| Administrative expenses | (64.0 | ) | (62.5 | ) | (61.0 | ) | ||
| Operating profit | 222.3 | 213.9 | 198.8 | 2 | ||||
| Net interest payable and similar charges | (10.4 | ) | (14.0 | ) | (15.0 | ) | 3 | |
| Profit on ordinary activities before taxation | 211.9 | 199.9 | 183.8 | 4 | ||||
| Tax on profit on ordinary activities | (74.7 | ) | (70.8 | ) | (63.4 | ) | 7 | |
| Profit for the financial period | 137.2 | 129.1 | 120.4 | |||||
| Dividends | (43.2 | ) | (36.1 | ) | (30.5 | ) | 8 | |
| Retained profit attributable to shareholders | 94.0 | 93.0 | 89.9 | |||||
| Earnings per share – basic | 8.0p | 7.5p | 7.1p | 9 | ||||
| Earnings per share – diluted | 7.9p | 7.5p | 7.1p | 9 | ||||
All of the above relate to continuing activities during the current and previous periods.
The profit impact of the 53rd week in 2001/02 is analysed on page 23.28.
52 Signet Group plc
| (1) | Restated for the implementation of FRS 17 – ‘Retirement Benefits’. |
| 56 | Signet Group plc Annual Report & Accounts year ended 31 January 2004 |
Consolidated balance sheet
at 31 January 2004
| 31 January 2004 | 1 February 2003 as restated | (1) | ||||
| £m | £m | Notes | ||||
| Fixed assets: | ||||||
| Intangible assets | 16.8 | 19.8 | 10 | |||
| Tangible assets | 202.8 | 205.5 | 11 | |||
| 219.6 | 225.3 | |||||
| Current assets: | ||||||
| Stocks | 541.5 | 539.5 | 12 | |||
| Debtors(2) | 339.5 | 345.9 | 13 | |||
| Cash at bank and in hand | 128.0 | 89.2 | 14 | |||
| 1,009.0 | 974.6 | |||||
| Creditors: amounts falling due within one year | (332.0 | ) | (324.9 | ) | 15 | |
| Net current assets(2) | 677.0 | 649.7 | ||||
| Total assets less current liabilities | 896.6 | 875.0 | ||||
| Creditors: amounts falling due after more than one year | (157.2 | ) | (189.1 | ) | 16 | |
| Provisions for liabilities and charges: | ||||||
| Deferred taxation | (5.4 | ) | – | 18 | ||
| Other provisions | (6.4 | ) | (7.5 | ) | 19 | |
| Total net assets | 727.6 | 678.4 | ||||
| Capital and reserves – equity: | ||||||
| Called up share capital | 8.6 | 8.6 | 20 | |||
| Share premium account | 60.7 | 53.9 | 21 | |||
| Revaluation reserve | 3.1 | 3.1 | 21 | |||
| Special reserves | 142.2 | 101.7 | 21 | |||
| Profit and loss account | 513.0 | 511.1 | 21 | |||
| Shareholders’ funds | 727.6 | 678.4 | ||||
| Restated for the implementation of FRS 17 – ‘Retirement Benefits’. | |
| (2) | Debtors and net current assets include amounts recoverable after more than one year of £1.2 million (2003: £5.2 million) (see note 13). |
at 1 February 2003
| 1 February 2003 | 2 February 2002 | Notes | ||||||
| £m | £m | |||||||
| Fixed assets: | ||||||||
| Intangible assets | 19.8 | 24.2 | 10 | |||||
| Tangible assets | 205.5 | 214.1 | 11 | |||||
| 225.3 | 238.3 | |||||||
| Current assets: | ||||||||
| Stocks | 539.5 | 555.5 | 12 | |||||
| Debtors(1) | 359.8 | 380.7 | 13 | |||||
| Cash at bank and in hand | 89.2 | 66.5 | 14 | |||||
| 988.5 | 1,002.7 | |||||||
| Creditors: amounts falling due within one year | (324.9 | ) | (320.5 | ) | 15 | |||
| Net current assets(1) | 663.6 | 682.2 | ||||||
| Total assets less current liabilities | 888.9 | 920.5 | ||||||
| Creditors: amounts falling due after more than one year | (184.4 | ) | (224.6 | ) | 16 | |||
| Provisions for liabilities and charges: | ||||||||
| Deferred taxation | (0.5 | ) | (9.2 | ) | 18 | |||
| Other provisions | (7.5 | ) | (7.0 | ) | 19 | |||
| Total net assets | 696.5 | 679.7 | ||||||
| Capital and reserves – equity: | ||||||||
| Called up share capital | 8.6 | 8.6 | 20 | |||||
| Share premium account | 53.9 | 48.3 | 21 | |||||
| Revaluation reserve | 3.1 | 3.0 | 21 | |||||
| Special reserves | 101.7 | 38.3 | 21 | |||||
| Profit and loss account | 529.2 | 581.5 | 21 | |||||
| Shareholders’ funds | 696.5 | 679.7 | ||||||
(1) Debtors and net current assets include amounts recoverable after more than one year of £19.1 million (2002: £19.1 million) (see note 13).
These accounts were approved by the Board of Directors on 2624 March 2003,2004, and were signed on its behalf by:
James McAdam Director
Walker Boyd Director
Signet Group plc 53
| Signet Group plc Annual Report & Accounts Year Ended 31 January 2004 | 57 |
Company balance sheet
at 31 January 2004
| 31 January 2004 | 1 February 2003 as restated | (1) | ||||
| £m | £m | Notes | ||||
| Fixed assets: | ||||||
| Tangible assets | 53.9 | 51.3 | 30 | (b) | ||
| Investments | 766.8 | 803.4 | 30 | (j) | ||
| 820.7 | 854.7 | |||||
| Current assets: | ||||||
| Debtors(2) | 375.3 | 233.2 | 30 | (c) | ||
| Cash at bank and in hand | 98.3 | 45.0 | 30 | (d) | ||
| 473.6 | 278.2 | |||||
| Creditors: amounts falling due within one year | (536.8 | ) | (456.1 | ) | 30 | (e) |
| Net current liabilities(2) | (63.2 | ) | (177.9 | ) | ||
| Total assets less current liabilities | 757.5 | 676.8 | ||||
| Creditors: amounts falling due after more than one year | (8.3 | ) | (18.3 | ) | 30 | (f) |
| Total net assets | 749.2 | 658.5 | ||||
| Capital and reserves - equity: | ||||||
| Called up share capital | 8.6 | 8.6 | 20 | (g) | ||
| Share premium account | 60.7 | 53.9 | 30 | (g) | ||
| Special reserves | 565.1 | 565.1 | 30 | (g) | ||
| Profit and loss account | 114.8 | 30.9 | 30 | (g) | ||
| Shareholders’ funds | 749.2 | 658.5 | ||||
| Restated for the implementation of FRS 17 - ‘Retirement Benefits’. | |
| (2) | Debtors and net current liabilities include amounts recoverable after more than one year of £2.2 million (2002: £1.5 million) (see note 30(c)). |
at 1 February 2003
| 1 February 2003 | 2 February | ||||||
| Notes | |||||||
£m | £m | ||||||
| Fixed assets: | |||||||
| Tangible assets | 51.3 | 47.8 | 30(b) | ||||
| Investments | 803.4 | 809.1 | 30(j) | ||||
| 854.7 | 856.9 | ||||||
| Current assets: | |||||||
| Debtors(1) | 233.2 | 198.3 | 30(c) | ||||
| Cash at bank and in hand | 45.0 | 9.2 | 30(d) | ||||
| 278.2 | 207.5 | ||||||
| Creditors: amounts falling due within one year | (456.1 | ) | (380.6 | ) | 30(e) | ||
| Net current liabilities(1) | (177.9 | ) | (173.1 | ) | |||
| Total assets less current liabilities | 676.8 | 683.8 | |||||
| Creditors: amounts falling due after more than one year | (18.3 | ) | (31.7 | ) | 30(f) | ||
| Deferred taxation | – | (0.4 | ) | ||||
| Total net assets | 658.5 | 651.7 | |||||
| Capital and reserves – equity: | |||||||
| Called up share capital | 8.6 | 8.6 | 20 | ||||
| Share premium account | 53.9 | 48.3 | 30(g) | ||||
| Special reserves | 565.1 | 565.1 | 30(g) | ||||
| Profit and loss account | 30.9 | 29.7 | 30(g) | ||||
| Shareholders’ funds | 658.5 | 651.7 | |||||
(1) Debtors and net current liabilities include amounts recoverable after more than one year of £1.5 million (2002: £nil) (see note 30(c)).
These accounts were approved by the Board of Directors on 2624 March 2003,2004, and were signed on its behalf by:
James McAdam Director
Walker Boyd Director
54 Signet Group plc
| Signet Group plc Annual Report & Accounts year ended 31 January 2004 |
for the 52 weeks ended 1 February 2003
| 52 weeks ended 1 February 2003 | 53 weeks | 52 weeks ended 27 January 2001 | Notes | ||||||
| £m | £m | £m | |||||||
| 25(a) | |||||||||
| Net cash inflow from operating activities | 182.2 | 188.0 | 132.1 | ||||||
| Returns on investments and servicing of finance: | |||||||||
| Interest received | 1.1 | 1.6 | 3.7 | ||||||
| Interest paid | (17.6 | ) | (19.5 | ) | (19.8 | ) | |||
| Net cash outflow from returns on investments and | |||||||||
| servicing of finance | (16.5 | ) | (17.9 | ) | (16.1 | ) | |||
| Taxation paid | (57.3 | ) | (57.9 | ) | (50.9 | ) | |||
| Capital expenditure: | |||||||||
| Purchase of tangible fixed assets | (49.5 | ) | (60.7 | ) | (56.2 | ) | |||
| Proceeds from sale of tangible fixed assets | 1.3 | – | 2.2 | ||||||
| Net cash outflow from capital expenditure | (48.2 | ) | (60.7 | ) | (54.0 | ) | |||
| Acquisition: | |||||||||
| Purchase of subsidiary undertaking | – | – | (107.5 | ) | |||||
| Equity dividends paid | (30.8 | ) | (27.7 | ) | (24.8 | ) | |||
| Cash inflow/(outflow) before use of liquid | |||||||||
| resources and financing | 29.4 | 23.8 | (121.2 | ) | |||||
| Management of liquid resources: | |||||||||
| (Increase)/decrease in bank deposits | (29.9 | ) | (27.9 | ) | 57.0 | ||||
| Financing: | |||||||||
| Proceeds from issue of shares | 4.3 | 8.9 | 2.0 | ||||||
| (Repayment of)/increase in bank loans | (12.1 | ) | (16.5 | ) | 50.2 | ||||
| Cash (outflow)/inflow from financing | (7.8 | ) | (7.6 | ) | 52.2 | ||||
| Decrease in cash in the period | (8.3 | ) | (11.7 | ) | (12.0 | ) | |||
| 52 weeks ended 1 February 2003 | 53 weeks ended 2 February 2002 | 52 weeks ended 27 January 2001 | Notes | ||||||
| £m | £m | £m | |||||||
| Decrease in cash in the period | (8.3 | ) | (11.7 | ) | (12.0 | ) | |||
| Cash outflow/(inflow) from decrease/(increase) in debt | 12.1 | 16.5 | (50.2 | ) | |||||
| Cash outflow/(inflow) from increase/(decrease) in liquid resources | 29.9 | 27.9 | (57.0 | ) | |||||
| Change in net debt resulting from cash flows | 33.7 | 32.7 | (119.2 | ) | |||||
| Translation difference | 27.9 | (5.3 | ) | (18.3 | ) | ||||
| Movement in net debt in the period | 61.6 | 27.4 | (137.5 | ) | |||||
| Opening net debt | (201.7 | ) | (229.1 | ) | (91.6 | ) | |||
| Closing net debt | (140.1 | ) | (201.7 | ) | (229.1 | ) | 25(b) | ||
Signet Group plc 55
Consolidated cash flow statement |
for the 52 weeks ended 1 February 200331 January 2004
| 52 weeks ended 1 February 2003 | 53 weeks ended 2 February 2002 | 52 weeks ended 27 January 2001 | ||||||
| £m | £m | £m | ||||||
| Profit for the financial period | 128.9 | 119.7 | 110.7 | |||||
| Adjustment to property revaluation | – | 2.1 | – | |||||
| Translation differences (net of £0.7 million tax credit (2002: £0.5 million charge)) | (143.2 | ) | 28.0 | 77.2 | ||||
| Total recognised gains and losses relating to the period | (14.3 | ) | 149.8 | 187.9 | ||||
| Prior year adjustment (note 17) | – | (6.2 | ) | – | ||||
| Total recognised gains and losses since last Annual Report | (14.3 | ) | 143.6 | 187.9 | ||||
| 52 weeks ended | 52 weeks ended | 53 weeks ended | |||||||
| 31 January 2004 | 1 February 2003 | 2 February 2002 | |||||||
| £m | £m | £m | Notes | ||||||
| Net cash inflow from operating activities | 203.8 | 182.2 | 188.0 | 25(a | ) | ||||
| Returns on investments and servicing of finance: | |||||||||
| Interest received | 0.9 | 1.1 | 1.6 | ||||||
| Interest paid | (11.9 | ) | (17.6 | ) | (19.5 | ) | |||
| Net cash outflow from returns on investments and servicing of finance | (11.0 | ) | (16.5 | ) | (17.9 | ) | |||
| Taxation paid | (69.0 | ) | (57.3 | ) | (57.9 | ) | |||
| Capital expenditure: | |||||||||
| Purchase of tangible fixed assets | (50.9 | ) | (49.5 | ) | (60.7 | ) | |||
| Proceeds from sale of tangible fixed assets | 0.2 | 1.3 | – | ||||||
| Net cash outflow from capital expenditure | (50.7 | ) | (48.2 | ) | (60.7 | ) | |||
| Equity dividends paid | (36.7 | ) | (30.8 | ) | (27.7 | ) | |||
| Cash inflow before use of liquid resources and financing | 36.4 | 29.4 | 23.8 | ||||||
| Management of liquid resources: | |||||||||
| Increase in bank deposits | (42.4 | ) | (29.9 | ) | (27.9 | ) | |||
| Financing: | |||||||||
| Proceeds from issue of shares | 6.3 | 4.3 | 8.9 | ||||||
| Repayment of bank loans | (12.1 | ) | (12.1 | ) | (16.5 | ) | |||
| Cash outflow from financing | (5.8 | ) | (7.8 | ) | (7.6 | ) | |||
| Decrease in cash in the period | (11.8 | ) | (8.3 | ) | (11.7 | ) | |||
Reconciliation of net cash flow to movement in net debt
| 52 weeks ended | 52 weeks ended | 53 weeks ended | |||||||
| 31 January 2004 | 1 February 2003 | 2 February 2002 | |||||||
| £m | £m | £m | Notes | ||||||
| Decrease in cash in the period | (11.8 | ) | (8.3 | ) | (11.7 | ) | |||
| Cash outflow from decrease in debt | 12.1 | 12.1 | 16.5 | ||||||
| Cash outflow from increase in liquid resources | 42.4 | 29.9 | 27.9 | ||||||
| Change in net debt resulting from cash flows | 42.7 | 33.7 | 32.7 | ||||||
| Translation difference | 17.5 | 27.9 | (5.3 | ) | |||||
| Movement in net debt in the period | 60.2 | 61.6 | 27.4 | ||||||
| Opening net debt | (140.1 | ) | (201.7 | ) | (229.1 | ) | |||
| Closing net debt | (79.9 | ) | (140.1 | ) | (201.7 | ) | 25(b | ) | |
| Signet Group plc Annual Report & Accounts Year Ended 31 January 2004 | ||
| 52 weeks ended 1 February 2003 | 53 weeks ended 2 February 2002 | 52 weeks ended 27 January 2001 | |||||
| £m | £m | £m | |||||
| Profit on ordinary activities before taxation | 199.7 | 182.8 | 162.8 | ||||
| Realisation of property revaluation deficit | (0.1 | ) | – | – | |||
| Historical cost profit on ordinary activities before taxation | 199.6 | 182.8 | 162.8 | ||||
| Historical cost retained profit attributable to equity shareholders | 92.7 | 89.2 | 83.3 | ||||
56 Signet Group plc
| Ordinary share capital | Deferred share capital | Share premium account | Revaluation reserve | Special reserves | Profit and loss account | Total | ||||||||||||||||
| £m | £m | £m | £m | £m | £m | £m | ||||||||||||||||
| Balance at 29 January 2000 | 8.4 | 0.1 | 36.3 | 0.9 | 96.6 | 306.0 | 448.3 | |||||||||||||||
| Retained profit attributable to | ||||||||||||||||||||||
| equity shareholders | – | – | – | – | – | 83.3 | 83.3 | |||||||||||||||
| Exercise of share options | – | – | 2.0 | – | – | – | 2.0 | |||||||||||||||
| Translation differences | – | – | – | – | (45.4 | ) | 77.2 | 31.8 | ||||||||||||||
| Balance at 27 January 2001 | 8.4 | 0.1 | 38.3 | 0.9 | 51.2 | 466.5 | 565.4 | |||||||||||||||
| Retained profit attributable to | ||||||||||||||||||||||
| equity shareholders | – | – | – | – | – | 89.2 | 89.2 | |||||||||||||||
| Shares issued to QUEST/ESOT | – | – | 2.2 | – | – | (2.2 | ) | – | ||||||||||||||
| Exercise of share options | 0.1 | – | 7.8 | – | – | – | 7.9 | |||||||||||||||
| Property revaluation | – | – | – | 2.1 | – | – | 2.1 | |||||||||||||||
| Translation differences | – | – | – | – | (12.9 | ) | 28.0 | 15.1 | ||||||||||||||
| Balance at 2 February 2002 | 8.5 | 0.1 | 48.3 | 3.0 | 38.3 | 581.5 | 679.7 | |||||||||||||||
| Retained profit attributable to | ||||||||||||||||||||||
| equity shareholders | – | – | – | – | – | 92.8 | 92.8 | |||||||||||||||
| Shares issued to QUEST/ESOT | – | – | 1.9 | – | – | (1.9 | ) | – | ||||||||||||||
| Exercise of share options | 0.1 | – | 3.7 | – | – | – | 3.8 | |||||||||||||||
| Redemption of deferred share capital | – | (0.1 | ) | – | – | – | 0.1 | – | ||||||||||||||
| Transfer on property disposals | – | – | – | 0.1 | – | (0.1 | ) | – | ||||||||||||||
| Translation differences | – | – | – | – | 63.4 | (143.2 | ) | (79.8 | ) | |||||||||||||
| Balance at 1 February 2003(1) | 8.6 | – | 53.9 | 3.1 | 101.7 | 529.2 | 696.5 | |||||||||||||||
Consolidated statement of total recognised gains and losses
for the 52 weeks ended 31 January 2004
| 52 weeks ended | 52 weeks ended | 53 weeks ended | |||||
| 31 January 2004 | 1 February 2003 | 2 February 2002 | |||||
| as restated | (1) | as restated | (1) | ||||
| £m | £m | £m | |||||
| Profit for the financial period | 137.2 | 129.1 | 120.4 | ||||
| Adjustment to property revaluation | – | – | 2.1 | ||||
| Translation differences (net of tax £nil (2003: £0.7 million credit; | |||||||
| 2002: £0.5 million charge)) | (96.7 | ) | (143.2 | ) | 28.0 | ||
| Actuarial profit/(loss) arising on pension asset (net of £2.8 million | |||||||
| tax charge (2003: £9.5 million 2002: £6.1 million credit)) | 6.4 | (22.3 | ) | (14.3 | ) | ||
| Total recognised gains and losses relating to the period | 46.9 | (36.4 | ) | 136.2 | |||
| Prior year adjustments (note 17) - FRS 17 (adopted in 2003/04) | (18.1 | ) | – | – | |||
| Prior year adjustments (note 17) - FRS 19 (adopted in 2001/02) | – | – | (6.2 | ) | |||
| Total recognised gains and losses since last Annual Report | 28.8 | (36.4 | ) | 130.0 | |||
Note of consolidated historical cost profits and losses
| 52 weeks ended | 52 weeks ended | 53 weeks ended | |||||
| 31 January 2004 | 1 February 2003 | 2 February 2002 | |||||
| as restated | (1) | as restated | (1) | ||||
| £m | £m | £m | |||||
| Profit on ordinary activities before taxation | 211.9 | 199.9 | 183.8 | ||||
| Realisation of property revaluation deficit | – | (0.1 | ) | – | |||
| Historical cost profit on ordinary activities before taxation | 211.9 | 199.8 | 183.8 | ||||
| Historical cost retained profit attributable to equity shareholders | 94.0 | 92.9 | 89.9 | ||||
| (1) | Restated for the implementation of |
| 60 | Signet Group plc Annual Report & Accounts Year Ended 31 January 2004 |
Signet Group plc 57
Consolidated shareholders’ funds
| Ordinary | Deferred | Share | Profit | ||||||||||||||||||
| share | share | premium | Revaluation | Special | and loss | ||||||||||||||||
| capital | capital | account | reserve | reserves | account | Total | |||||||||||||||
| £m | £m | £m | £m | £m | £m | £m | |||||||||||||||
| Balance at 27 January 2001 | |||||||||||||||||||||
| – as previously stated | 8.4 | 0.1 | 38.3 | 0.9 | 51.2 | 466.5 | 565.4 | ||||||||||||||
| – prior year adjustment (note 17) | – | – | – | – | – | 17.6 | 17.6 | ||||||||||||||
| – as restated | 8.4 | 0.1 | 38.3 | 0.9 | 51.2 | 484.1 | 583.0 | ||||||||||||||
| Retained profit attributable to equity shareholders | – | – | – | – | – | 89.9 | 89.9 | ||||||||||||||
| Shares issued to QUEST/ESOT | – | – | 2.2 | – | – | (2.2 | ) | – | |||||||||||||
| Exercise of share options | 0.1 | – | 7.8 | – | – | – | 7.9 | ||||||||||||||
| Property revaluation | – | – | – | 2.1 | – | – | 2.1 | ||||||||||||||
| Actuarial loss recognised | – | – | – | – | – | (14.3 | ) | (14.3 | ) | ||||||||||||
| Translation differences | – | – | – | – | (12.9 | ) | 28.0 | 15.1 | |||||||||||||
| Balance at 2 February 2002 | 8.5 | 0.1 | 48.3 | 3.0 | 38.3 | 585.5 | 683.7 | ||||||||||||||
| Retained profit attributable to equity shareholders | – | – | – | – | – | 93.0 | 93.0 | ||||||||||||||
| Shares issued to QUEST/ESOT | – | – | 1.9 | – | – | (1.9 | ) | – | |||||||||||||
| Exercise of share options | 0.1 | – | 3.7 | – | – | – | 3.8 | ||||||||||||||
| Redemption of deferred share capital | – | (0.1 | ) | – | – | – | 0.1 | – | |||||||||||||
| Transfer on property disposals | – | – | – | 0.1 | – | (0.1 | ) | – | |||||||||||||
| Actuarial loss recognised | – | – | – | – | – | (22.3 | ) | (22.3 | ) | ||||||||||||
| Translation differences | – | – | – | – | 63.4 | (143.2 | ) | (79.8 | ) | ||||||||||||
| Balance at 1 February 2003 | 8.6 | – | 53.9 | 3.1 | 101.7 | 511.1 | 678.4 | ||||||||||||||
| Retained profit attributable to equity shareholders | – | – | – | – | – | 94.0 | 94.0 | ||||||||||||||
| Shares issued to QUEST/ESOT | – | – | 1.8 | – | – | (1.8 | ) | – | |||||||||||||
| Exercise of share options | – | – | 5.0 | – | – | – | 5.0 | ||||||||||||||
| Actuarial gain recognised | – | – | – | – | – | 6.4 | 6.4 | ||||||||||||||
| Translation differences | – | – | – | – | 40.5 | (96.7 | ) | (56.2 | ) | ||||||||||||
| Balance at 31 January 2004(1) | 8.6 | – | 60.7 | 3.1 | 142.2 | 513.0 | 727.6 | ||||||||||||||
| (1) | Shareholders’ funds at 31 January 2004 include cumulative losses of £108.0 million (2003: £51.8 million losses, 2002: £28.0 million profits) in respect of translation differences (see note 21, page 79). |
| Signet Group plc Annual Report & Accounts Year Ended 31 January 2004 | 61 |
Notes to the accounts
| Principal accounting policies | |
| The consolidated accounts of Signet Group plc and its subsidiary companies (“the Group”) are prepared in accordance with generally accepted accounting principles in the UK (“UK GAAP”). These principles differ in certain significant respects from generally accepted accounting principles in the US (“US GAAP”). Application of US GAAP would have affected shareholders’ funds and results of operations at and for the 52 weeks ended 31 January 2004, the 52 weeks ended 1 February 2003 and the 53 weeks ended 2 February 2002 to the extent summarised on pages 97 and 98. The following accounting policies are applied consistently in dealing with items which are considered material in relation to the accounts of the Group: | |
1 Principal accounting policiesThe consolidated accounts of Signet Group plc and its subsidiary companies (“the Group”) are prepared in accordance with generally accepted accounting principles in the UK (“UK GAAP”).These principles differ in certain significant respects from generally accepted accounting principles in the US (“US GAAP”). Application of US GAAP would have affected shareholders’ funds and results of operations at and for the 52 weeks ended 1 February 2003, the 53 weeks ended 2 February 2002 and the 52 weeks ended 27 January 2001 to the extent summarised on pages 91 and 92.The following accounting policies are applied consistently in dealing with items which are considered material in relation to the accounts of the Group:
(a) Basis of preparation
The Group is a speciality jewellery retailer in both the UK and the US.
The consolidated accounts have been prepared in accordance with applicable UK accounting standards and under the UK historical cost convention as modified by the revaluation of freehold and long leasehold properties.
The preparation of consolidated accounts in conformity with UK GAAP and US GAAP requires management to make estimates and assumptions that affect the reported amounts of assets and liabilities and disclosure of contingent assets and liabilities at the date of the accounts and the reported amounts of revenues and expenses during the reporting period. Actual results could differ from those estimates.
The consolidated accounts comply with the Accounting Standards issued by the Accounting Standards Board. Since the previous accounts were issued, further transitional rules relating to disclosures required under Financial Reporting Standard (“FRS”)FRS 17 – ‘Retirement Benefits’ havehas been applied (seeimplemented during 2003/04 which has resulted in a prior year adjustment as described in note 22).17.
(b) Consolidation
The Group accounts include the accounts of the Company and its subsidiary undertakings made up for the 52 week period ended 1 February 200331 January 2004 (the comparatives are for the 52 week period ended 1 February 2003 and the 53 week period ended 2 February 2002 and the 52 week period ended 27 January 2001)2002). Unless otherwise stated, the acquisition method of accounting has been adopted. Under this method, the results of subsidiary undertakings acquired or disposed of in the year are included in the consolidated profit and loss account from the date of acquisition or up to the date of disposal.
Under section 230(3) of the Companies Act 1985 the Company is exempt from the requirement to present its own profit and loss account.
(c) Goodwill
Purchased goodwill (representing the excess of the fair value of the consideration given and associated costs over the fair value of the separable net assets acquired) arising on consolidation in respect of acquisitions since 1 February 1998 is capitalised. Positive goodwill is amortised to nil by equal annual instalments over its estimated useful life, normally 20 years.
In the Company’s financial statements,accounts, investments in subsidiary undertakings are stated at cost less any impairment in value.
Impairment reviews are carried out annually to ensure goodwill and intangible assets are not carried at above their recoverable amounts. Wherever events or changes in circumstances indicate that the carrying amount may not be recoverable, the Group performs discounted cash flow analyses to compare discounted estimated future operating cash flows to the net carrying value of goodwill. Any amortisation or impairment write downs identified are charged to the profit and loss account.
(d) Sales
Sales represent sales to customers outside the Group, exclusive of value added and sales taxes. Repair revenues are recognised when the service is complete and the merchandise is delivered to the customer.
Revenue from the sale of warranties in the US, such as extended service plans, is recognised at the date of sale. Provision is made for the estimated cost of future claims arising under these service plans.
58 Signet Group plc
| 62 | Signet Group plc Annual Report & Accounts year ended 31 January 2004 |
(e) Cost of sales
Cost of sales includes the cost of goodwill amortisation, distribution costs and selling costs. Advertising costs are expensed as incurred.
(f) Foreign currency translation
The results of overseas subsidiary undertakings are translated into pounds sterling at the weighted average rates of exchange during the period and their balance sheets and attributable goodwill at the rates at the balance sheet date. Exchange differences arising from the translation of the net assets and attributable goodwill of overseas subsidiary undertakings and matched foreign currency borrowings less deposits are charged or credited to reserves. Other exchange differences arising from foreign currency transactions are included in profit before taxation.
(g) Depreciation and amortisation
Depreciation is provided on freehold and long leasehold retail premises over an estimated useful life not exceeding 50 years. Long leaseholds relate to leases that have an original and unexpired lease term of greater than 25 years. Freehold land is not depreciated.
Premiums paid to acquire short leasehold properties are amortised over their lease periods (up to 25 years) while incentives received are amortised over the period to the first rent review. Provision is made for future net lease obligations in respect of onerous leases of vacant, partially vacant or sublet properties. Depreciation on other fixed assets is provided on a straight line basis at the following annual rates:
Plant, machinery and vehicles – 10%, 20%, 331/1/3%,
Shopfronts, fixtures and fittings – rates up to 331/1/3%.
Where appropriate, provision is made on assets that have a lower economic value than book value. Additionally, provision is made against tangible fixed assets relating to stores planned for closure.
(h) Stocks
Stocks represent goods held for resale and are valued at the lower of cost and net realisable value. Cost is determined using the first-in, first-out method and includes appropriate overheads. Provision is made for obsolete, slow moving or defective items.
(i) Shares in subsidiary undertakings
Shares in subsidiary undertakings are stated at cost, less amounts written off for any impairment in value.
(j) QUEST
LeasesThe investment in the shares subscribed for by the Group’s Qualifying Employee Share Trust (“QUEST”) is recorded at nil value.
(k) Leases
Rentals paid under operating leases are charged to the profit and loss account on a straight line basis over the lease term.as incurred. Amounts payable in respect of turnover leases are recognised in the period to which the turnover relates.
Assets held under finance leases, which are leases where substantially all the risks and rewards of the asset have passed to the Group, are capitalised in the balance sheet and depreciated over their estimated useful lives. Future instalments under such leases, net of finance charges, are included within creditors. Rental payments are apportioned between the finance element, which is charged to the profit and loss account, and the capital element which reduces the outstanding obligation for future instalments.
Signet Group plc 59
| Signet Group plc Annual Report & Accounts year ended 31 January 2004 | 63 |
Notes to the accounts (continued)
(l)(k) Deferred taxation
Deferred taxation is provided on a full provision basis, without discounting, on all timing differences which have arisen but not reversed at the balance sheet date. Except where otherwise required by UK Accounting Standards no timing differences are recognised in respect of:
| (a) | property revaluation surpluses where there is no commitment to sell the asset; | |
| (b) | gains on sale of assets where those assets have been rolled over into replacement assets; and | |
| (c) | additional tax which would arise if profits of overseas subsidiaries were distributed. |
(m)(l) Pension schemes
The Group operates a defined benefit pension scheme in the UK,Scheme, covering one of the executive directors and all participating eligible employees, which provides benefits based on members’ salaries at retirement. The assets are held by the trustees of the schemeGroup Scheme and are completely separate from those of the Group.
The expectedfull service cost of pension provisions relating to the Group’s defined benefit schemeperiod is charged to ‘administrative expenses’ in the profit and loss account so as to spreadaccount. The expected return on the costGroup Scheme’s assets is credited and the interest element of pensions over the remaining service lives of employeesincrease in the scheme. Variations frompresent value of the regular cost are spread overGroup Scheme’s liabilities is charged to ‘net interest payable and similar charges’ in the profit and loss account.
The difference between the market value of the assets of the Group Scheme and the present value of accrued pension liabilities is shown as an asset or liability on the balance sheet, net of deferred tax. The difference between the expected remaining service lives of current employeesreturn on assets and that actually achieved is recognised in the scheme. statement of total recognised gains and losses along with any differences that may arise from experience or assumption changes.
The pension cost is assessed in accordance with the advice of independent qualified actuaries. Where appropriate, supplementary pensions and life assurance benefits for UK directors and senior executives are provided through the Signet Group Funded Unapproved Retirement Benefits Scheme. Cash contributions under the Group’s US defined contribution 401(k) Retirement Savings Plan are expensed incharged to the profit and loss account as incurred.
Differences between the amounts charged in the profit and loss account and payments to pension plans are treated as assets or liabilities. Deferred tax is accounted for on those assets and liabilities.
(n)(m) Net interest payable and similar charges
Premiums paid in respect of the establishment and maintenance of borrowing facilities or purchased interest rate protection agreements are amortised to interest payable and similar charges over the term of the relevant agreement. All such interest rate protection agreements must be related to an asset or liability and must change the character of the interest rate by converting a variable rate to a fixed rate, or vice versa, to qualify for accrual accounting. In addition the term and notional amount of the swap, cap or floor must not exceed the term and principal amount of the debt or asset. Amounts payable or receivable under such agreements are accrued within net interest payable and similar charges in the profit and loss account and recorded as current assets or liabilities on the balance sheet. If the agreements are terminated early, the gain or loss is spread over the shorter of the remaining term of the original investment or the remaining term of the related debt.
(n) Vendor contributions
Where vendor contributions are received in respect of identifiable promotional events, these are matched against the costs of these promotions. Vendor contributions which are received as general contributions and not against specific promotional events are allocated against stocks.
(o) Liquid resources
Liquid resources comprise money market deposits and amounts placed with external fund managers with an original maturity of three months or less, and are carried at cost which approximates to fair value.
60 Signet Group plc
| 64 | Signet Group plc Annual Report & Accounts year ended 31 January 2004 |
2 Segment information
| 2. | Segment information |
The Group’s results derive from one business segment – the retailing of jewellery, watches and gifts.Thegifts. The Group is managed as two operating segments, being the US and UK divisions.
2003 | 2002 | 2001 | |||||||
£m | £m | £m | |||||||
| Sales by origin and destination: | |||||||||
| UK | 473.6 | 452.1 | 409.2 | ||||||
| US | 1,134.4 | 1,126.0 | 978.1 | ||||||
| 1,608.0 | 1,578.1 | 1,387.3 | |||||||
| Operating profit: | |||||||||
| UK – Trading | 67.0 | 60.7 | 50.0 | ||||||
| UK – Group central costs(1) | (6.0 | ) | (5.1 | ) | (3.5 | ) | |||
| 61.0 | 55.6 | 46.5 | |||||||
| US | 155.2 | 145.1 | 132.2 | ||||||
| 216.2 | 200.7 | 178.7 | |||||||
| Depreciation and amortisation: | |||||||||
| UK | 12.5 | 10.4 | 10.8 | ||||||
| US | 25.3 | 24.3 | 19.8 | ||||||
| 37.8 | 34.7 | 30.6 | |||||||
| Net interest payable/(receivable) and similar charges: | |||||||||
| UK | 1.3 | 3.9 | (0.9 | ) | |||||
| US | 15.2 | 14.0 | 16.8 | ||||||
| 16.5 | 17.9 | 15.9 | |||||||
| Additions to tangible fixed assets: | |||||||||
| UK | 16.4 | 18.8 | 9.7 | ||||||
| US | 33.1 | 41.0 | 46.5 | ||||||
| 49.5 | 59.8 | 56.2 | |||||||
| Tangible fixed assets: | |||||||||
| UK | 70.5 | 67.6 | 57.4 | ||||||
| US | 135.0 | 146.5 | 125.5 | ||||||
| 205.5 | 214.1 | 182.9 | |||||||
| Total assets(2): | |||||||||
| UK | 394.4 | 343.2 | 295.1 | ||||||
| US | 819.4 | 897.8 | 838.2 | ||||||
| 1,213.8 | 1,241.0 | 1,133.3 | |||||||
| Net assets(3)(4): | |||||||||
| UK | 144.3 | 136.1 | 125.0 | ||||||
| US | 692.3 | 745.3 | 669.5 | ||||||
| Net debt | (140.1 | ) | (201.7 | ) | (229.1 | ) | |||
| 696.5 | 679.7 | 565.4 | |||||||
Signet Group plc 61
The business is Both divisions are managed by the divisional executive committees in the UK and the US which report through the Group Chief Executive to the Group Board. Each divisional executive committee is responsible for operating decisions within guidelines set by the Group Board.
| 3 Net interest payable and similar charges | |||||||||
2003 | 2002 | 2001 | |||||||
£m | £m | £m | |||||||
| Interest on bank loans and overdrafts | 4.7 | 7.7 | 6.5 | ||||||
| Interest expense of US securitisation facility | 9.0 | 5.9 | 9.1 | ||||||
| Interest on loan notes | 2.5 | 3.0 | 2.6 | ||||||
| Facilities fees and related costs | 1.4 | 2.8 | 1.4 | ||||||
| 17.6 | 19.4 | 19.6 | |||||||
| Interest receivable | (1.1 | ) | (1.5 | ) | (3.7 | ) | |||
| 16.5 | 17.9 | 15.9 | |||||||
| 4 Profit on ordinary activities before taxation | |||||||||
| 2003 | 2002 | 2001 | |||||||
£m | £m | £m | |||||||
| Profit on ordinary activities before taxation is stated after charging: | |||||||||
| Depreciation – owned assets | 34.8 | 30.5 | 27.1 | ||||||
| Depreciation – assets held under finance leases | 1.8 | 2.9 | 2.9 | ||||||
| Goodwill amortisation | 1.2 | 1.3 | 0.6 | ||||||
| Fees payable to KPMG Audit Plc and their associates: | |||||||||
| Audit fees | 0.4 | 0.4 | 0.4 | ||||||
| Audit-related fees(1) | 0.1 | 0.1 | 0.1 | ||||||
| Fees for other services(2) | 0.3 | 0.2 | 0.1 | ||||||
| Advertising | 69.4 | 70.1 | 59.9 | ||||||
| Operating lease rentals – plant, machinery and vehicles | 2.1 | 2.2 | 3.0 | ||||||
| Operating lease rentals – property | 135.5 | 130.6 | 117.8 | ||||||
| 2004 | 2003 | 2002 | ||||||
| £m | £m | £m | ||||||
| Sales by origin and destination: | ||||||||
| UK | 501.0 | 473.6 | 452.1 | |||||
| US | 1,116.2 | 1,134.4 | 1,126.0 | |||||
| 1,617.2 | 1,608.0 | 1,578.1 | ||||||
| Operating profit(1): | ||||||||
| UK | – Trading | 76.6 | 64.7 | 58.8 | ||||
| – Group central costs(2) | (5.7 | ) | (6.0 | ) | (5.1 | ) | ||
| 70.9 | 58.7 | 53.7 | ||||||
| US | 151.4 | 155.2 | 145.1 | |||||
| 222.3 | 213.9 | 198.8 | ||||||
| Depreciation and amortisation: | ||||||||
| UK | 15.7 | 12.5 | 10.4 | |||||
| US | 24.7 | 25.3 | 24.3 | |||||
| 40.4 | 37.8 | 34.7 | ||||||
| Net interest payable/(receivable) and similar charges(1): | ||||||||
| UK | (2.3 | ) | (1.2 | ) | 1.0 | |||
| US | 12.7 | 15.2 | 14.0 | |||||
| 10.4 | 14.0 | 15.0 | ||||||
| Additions to tangible fixed assets: | ||||||||
| UK | 17.8 | 16.4 | 18.8 | |||||
| US | 33.1 | 33.1 | 41.0 | |||||
| 50.9 | 49.5 | 59.8 | ||||||
| Tangible fixed assets: | ||||||||
| UK | 72.6 | 70.5 | 67.6 | |||||
| US | 130.2 | 135.0 | 146.5 | |||||
| 202.8 | 205.5 | 214.1 | ||||||
| Total assets(1)(3): | ||||||||
| UK | 446.3 | 375.3 | 324.1 | |||||
| US | 782.3 | 819.4 | 897.8 | |||||
| 1,228.6 | 1,194.7 | 1,221.9 | ||||||
| Net assets(1)(4): | ||||||||
| UK | 209.9 | 126.2 | 140.1 | |||||
| US | 597.6 | 692.3 | 745.3 | |||||
| Net debt | (79.9 | ) | (140.1 | ) | (201.7 | ) | ||
| 727.6 | 678.4 | 683.7 | ||||||
| (1) | |
| (2) | Group central costs for 2002/03 include a charge of £0.5 million relating to an increase in the provision against an onerous lease of a dormant Group property. |
| (3) | Total assets includes fixed and current assets but excludes current liabilities and debt. |
| (4) | Net debt has been excluded from the two operating segments. |
| Signet Group plc Annual Report & Accounts year ended 31 January 2004 | 65 |
Notes to the accounts (continued)
| 3. | Net interest payable and similar charges |
| 2004 | 2003 | 2002 | |||||
| £m | £m | £m | |||||
| Interest on bank loans and overdrafts | 1.9 | 4.7 | 7.7 | ||||
| Interest expense of US securitisation facility | 8.2 | 9.0 | 5.9 | ||||
| Interest on loan notes | 1.7 | 2.5 | 3.0 | ||||
| Facilities fees and related costs | 0.9 | 1.4 | 2.8 | ||||
| 12.7 | 17.6 | 19.4 | |||||
| Interest receivable | (1.7 | ) | (1.1 | ) | (1.5 | ) | |
| 11.0 | 16.5 | 17.9 | |||||
| Net interest credit on defined benefit pension scheme (note 22) | (0.6 | ) | (2.5 | ) | (2.9 | ) | |
| 10.4 | 14.0 | 15.0 | |||||
| 4. | Profit on ordinary activities before taxation |
| 2004 | 2003 | 2002 | |||||
| £m | £m | £m | |||||
| Profit on ordinary activities before taxation is stated after charging: | |||||||
| Depreciation – owned assets | 37.6 | 34.8 | 30.5 | ||||
| Depreciation – assets held under finance leases | 1.7 | 1.8 | 2.9 | ||||
| Goodwill amortisation | 1.1 | 1.2 | 1.3 | ||||
| Fees payable to KPMG Audit Plc and their associates: | |||||||
| Audit services | 0.4 | 0.4 | 0.4 | ||||
| Further assurance services(1) | 0.1 | 0.1 | 0.1 | ||||
| Tax services | – | 0.3 | 0.2 | ||||
| Other services | – | – | – | ||||
| Advertising | 73.7 | 69.4 | 70.1 | ||||
| Operating lease rentals – plant, machinery and vehicles | 2.2 | 2.1 | 2.2 | ||||
| Operating lease rentals – property | 136.7 | 135.5 | 130.6 | ||||
| (1) | Further assurance services were for work carried out in respect of the quarterly reviews and Christmas trading review. |
| 5. | Foreign currency translation |
| 5 Foreign currency translation | |||||||||
2003 | 2002 | 2001 | |||||||
| The exchange rates used for translation of US dollar transactions and balances | |||||||||
| in these accounts are as follows: | |||||||||
| Profit and loss (average rate) | 1.53 | 1.44 | 1.49 | ||||||
| Balance sheet (year end rate) | 1.64 | 1.42 | 1.46 | ||||||
| 2004 | 2003 | 2002 | |||||
| The exchange rates used for translation of US dollar transactions and balances in these accounts are as follows: | |||||||
| Profit and loss (average rate) | 1.68 | 1.53 | 1.44 | ||||
| Balance sheet (year end rate) | 1.82 | 1.64 | 1.42 | ||||
The effect of translation on foreign currency borrowings less deposits in the period was to decrease the Group’s net borrowings by £17.5 million (2003: £27.9 million (2002:decrease, 2002: £5.3 million increase, 2001: £18.3 million increase).The. The net effect of exchange rate movements on foreign currency investments (excluding goodwill) and foreign currency borrowings less deposits in the period was a loss of £56.2 million (2003: £79.8 million (2002:loss, 2002: £15.1 million gain, 2001: £31.8 million gain).This. This amount has been taken to reserves in accordance with SSAP 20.
62 Signet Group plc
| 66 | Signet Group plc Annual Report & Accounts year ended 31 January 2004 | |
| 6 Directors and employees | |||||||||
2003 | 2002 | 2001 | |||||||
£m | £m | £m | |||||||
| Directors’ emoluments | 2.6 | 2.6 | 3.0 | ||||||
| LTIP(1)– cash | 0.4 | 0.5 | 0.5 | ||||||
| – share options (at market value) | 0.6 | – | – | ||||||
| Contributions to pension scheme | 0.2 | 0.2 | 0.3 | ||||||
| 6. | Directors and employees |
| 2004 | 2003 | 2002 | ||||||
| £m | £m | £m | ||||||
| Directors’ emoluments | 2.0 | 2.6 | 2.6 | |||||
| Directors’ LTIP(1) | – cash | 0.3 | 0.4 | 0.5 | ||||
| – share options (at market value) | 0.5 | 0.6 | – | |||||
| Contributions in respect of Directors’ to pension schemes | 0.2 | 0.2 | 0.2 | |||||
| (1) | For |
Details of directors’ emoluments are shown in the Board report on remuneration on page 45.
The aggregate emoluments (excluding amounts due under the 2000 LTIP) of the highest paid director,Terry Burman, as US Chief Executive and as Group Chief Executive were £1,217,000 (2002: £1,055,000; 2001: £1,285,000)£1,100,000 (2003: £1,217,000; 2002: £1,055,000). The amounts due to him under the 2000 LTIP were £594,000 (2002: £520,000; 2001: £470,000)£574,000 (2003: £631,000, restated). In 2002 under a prior LTIP a payment of £520,000 was made to him wholly in cash. For 2003,2004, 50% of the amount due under the 2000 LTIP is payable in cash (£256,000)201,000; 2003: £256,000) and the other 50% consists of the grant of an option to acquire shares in the Company (market value at 2624 March 2003: £338,000)2004: £373,000). For 2002 and 2001, the amounts were paid wholly in cash. Additionally, pension contributions of £147,000 (2002: £146,000; 2001: £107,000)£142,000 (2003: £147,000; 2002: £146,000) were made to money purchase schemes on his behalf. The gain made by him on the exercise of options in the Group was £4,364 (2002: £2,132,038; 2001: £9,597)£1,934,651 (2003: £4,364; 2002: £2,132,038).
2003 | 2002 | 2001 | |||||||
Number of persons | Number of persons | Number of persons | |||||||
| Retirement benefits are accruing to the following numbers of directors under: | |||||||||
| Money purchase schemes | 1 | 1 | 2 | ||||||
| Defined benefit schemes | 1 | 2 | 2 | ||||||
| The average number of full-time equivalent persons employed | |||||||||
| (including directors) during the period, analysed by category and division, was: | |||||||||
| Total Group: | |||||||||
| Management | 512 | 495 | 463 | ||||||
| Administration | 1,296 | 1,243 | 1,168 | ||||||
| Distribution and sales staff | 12,352 | 11,787 | 10,889 | ||||||
| 14,160 | 13,525 | 12,520 | |||||||
| UK: | |||||||||
| Management | 377 | 363 | 342 | ||||||
| Administration | 240 | 220 | 228 | ||||||
| Distribution and sales staff | 4,129 | 4,023 | 3,944 | ||||||
| 4,746 | 4,606 | 4,514 | |||||||
| US: | |||||||||
| Management | 135 | 132 | 121 | ||||||
| Administration | 1,056 | 1,023 | 940 | ||||||
| Distribution and sales staff | 8,223 | 7,764 | 6,945 | ||||||
| 9,414 | 8,919 | 8,006 | |||||||
| £m | £m | £m | |||||||
| The aggregate Group payroll cost was as follows: | |||||||||
| Wages and salaries | 282.5 | 278.3 | 246.1 | ||||||
| Social security costs | 22.1 | 22.5 | 19.4 | ||||||
| Pension costs | 2.0 | 1.6 | 1.3 | ||||||
| 306.6 | 302.4 | 266.8 | |||||||
Signet Group plc 63
| 2004 | 2003 | 2002 | |||||
| Number of | Number of | Number of | |||||
| persons | persons | persons | |||||
| Retirement benefits are accruing to the following numbers of directors under: | |||||||
| Money purchase schemes | 1 | 1 | 1 | ||||
| Defined benefit schemes | 1 | 1 | 2 | ||||
| The average number of full-time equivalent persons employed (including directors) | |||||||
| during the period, analysed by category and division, was: | |||||||
| Total Group: | |||||||
| Management | 530 | 512 | 495 | ||||
| Administration | 1,314 | 1,296 | 1,243 | ||||
| Distribution and sales staff | 12,658 | 12,352 | 11,787 | ||||
| 14,502 | 14,160 | 13,525 | |||||
| UK: | |||||||
| Management | 389 | 377 | 363 | ||||
| Administration | 231 | 240 | 220 | ||||
| Distribution and sales staff | 3,942 | 4,129 | 4,023 | ||||
| 4,562 | 4,746 | 4,606 | |||||
| US: | |||||||
| Management | 141 | 135 | 132 | ||||
| Administration | 1,083 | 1,056 | 1,023 | ||||
| Distribution and sales staff | 8,716 | 8,223 | 7,764 | ||||
| 9,940 | 9,414 | 8,919 | |||||
| £m | £m | £m | |||||
| The aggregate Group staff costs were as follows: | |||||||
| Wages and salaries | 276.9 | 282.5 | 278.3 | ||||
| Social security costs | 22.5 | 22.1 | 22.5 | ||||
| Pension costs (restated for the implementation of FRS 17 – ‘Retirement Benefits’) | 4.4 | 4.2 | 3.5 | ||||
| 303.8 | 308.8 | 304.3 | |||||
| Signet Group plc Annual Report & Accounts year ended 31 January 2004 | 67 |
Notes to the accounts (continued)
| 7. | Taxation | ||||||
| 2004 | 2003 | (1) | 2002 | (1) | |||
| £m | £m | £m | |||||
| Profit on ordinary activities before taxation: | |||||||
| UK | 73.2 | 59.9 | 52.7 | ||||
| US | 138.7 | 140.0 | 131.1 | ||||
| 211.9 | 199.9 | 183.8 | |||||
| Restated for the | |
| 7 Taxation | |||||||||
2003 | 2002 | 2001 | |||||||
£m | £m | £m | |||||||
| Profit on ordinary activities before taxation: | |||||||||
| UK | 59.7 | 51.7 | 47.4 | ||||||
| US | 140.0 | 131.1 | 115.4 | ||||||
| 199.7 | 182.8 | 162.8 | |||||||
| 2003 | 2002 | 2001 | |||||||
£m | £m | £m | |||||||
| Taxes on profit: | |||||||||
| UK corporation tax payable | 22.6 | 19.5 | 8.8 | ||||||
| US taxes | 55.6 | 36.7 | 46.7 | ||||||
| Deferred taxation: | |||||||||
| UK | (0.7 | ) | 0.3 | 1.0 | |||||
| US | (6.7 | ) | 6.6 | (4.4 | ) | ||||
| 70.8 | 63.1 | 52.1 | |||||||
| 2003 | 2002 | 2001 | |||||||
£m | £m | £m | |||||||
| Sources of deferred taxation are as follows: | |||||||||
| Accelerated capital allowance | 0.1 | 0.2 | 0.3 | ||||||
| Other timing differences | (7.5 | ) | 6.7 | (3.7 | ) | ||||
| (7.4 | ) | 6.9 | (3.4 | ) | |||||
| 2004 | 2003 | 2002 | (1) | ||||
| £m | £m | £m | |||||
| Taxes on profit: | |||||||
| UK corporation tax payable | 26.2 | 22.6 | 19.8 | ||||
| US taxes | 36.2 | 55.6 | 36.7 | ||||
| Deferred taxation: | |||||||
| UK | 0.5 | (0.7 | ) | 0.3 | |||
| US | 11.8 | (6.7 | ) | 6.6 | |||
| 74.7 | 70.8 | 63.4 | |||||
| (1) | Restated for the implementation of FRS 17 – ‘Retirement Benefits’ (see note 17). | ||||||
| 2004 | 2003 | 2002 | ||||
| £m | £m | £m | ||||
| Sources of deferred taxation are as follows: | ||||||
| Accelerated capital allowances | (0.4 | ) | 0.1 | 0.2 | ||
| Other timing differences | 12.7 | (7.5 | ) | 6.7 | ||
| 12.3 | (7.4 | ) | 6.9 | |||
The differences between the standard rate of corporation tax in the UK and the current and effective tax rates for the Group are explained below:
2003 | 2002 | 2001 | 2004 | 2003 | 2002 | ||||||||||
| % | % | ||||||||||||||
% | % | % | |||||||||||||
| UK statutory tax rates | 30.0 | 30.0 | 30.0 | 30.0 | 30.0 | 30.0 | |||||||||
| Expenditure permanently disallowable for tax purposes, net of | |||||||||||||||
| permanent undercharges | 0.8 | – | (0.2 | ) | |||||||||||
| Expenditure permanently disallowable for tax purposes, net of permanent undercharges | 0.4 | 0.7 | – | ||||||||||||
| Differences between UK and US (including state) standard tax rates | 4.9 | 5.6 | 5.6 | 5.3 | 4.9 | 5.6 | |||||||||
| Over provision in respect of previous periods | (0.2 | ) | (1.1 | ) | (3.4 | ) | (0.4 | ) | (0.2 | ) | (1.1 | ) | |||
| Differences between capital allowances and depreciation | (0.1 | ) | (0.1 | ) | (0.2 | ) | 0.2 | (0.1 | ) | (0.1 | ) | ||||
| Other timing differences | 3.8 | (3.7 | ) | 2.3 | (6.0 | ) | 3.8 | (3.7 | ) | ||||||
| Current tax rate | 39.2 | 30.7 | 34.1 | 29.5 | 39.1 | 30.7 | |||||||||
| Deferred tax rate | (3.7 | ) | 3.8 | (2.1 | ) | 5.8 | (3.7 | ) | 3.8 | ||||||
| Effective tax rates in accounts | 35.5 | 34.5 | 32.0 | 35.3 | 35.4 | 34.5 | |||||||||
The effective tax rate for the Group is higher than the UK statutory tax rate due tobecause the significant proportion of the Group’s business which is conducted in the US where the combined federal and state tax rate approaches 40%. The Group’s future effective tax rate is also dependent on the movement in foreign exchange translation rates. It is anticipated that the effective tax rate for the Group in 2003/042004/05 will remain at approximatelybe marginally below the same level as in 2002/03.for 2003/04.
64 Signet Group plc
| 68 | Signet Group plc Annual Report & Accounts year ended 31 January 2004 |
| 8 Dividends | |||||||||
2003 | 2002 | 2001 | |||||||
£m | £m | £m | |||||||
| Interim dividend paid of 0.310p per share (2002: 0.289p; 2001: 0.275p) | 5.3 | 5.0 | 4.6 | ||||||
| Final dividend proposed of 1.80p per share (2002: 1.50p; 2001: 1.35p) | 30.8 | 25.5 | 22.8 | ||||||
| 36.1 | 30.5 | 27.4 | |||||||
| 8. | Dividends | ||||||
| 2004 | 2003 | 2002 | |||||
| £m | £m | £m | |||||
| Interim dividend paid of 0.341p per share (2003: 0.310p; 2002: 0.289p) | 5.9 | 5.3 | 5.0 | ||||
| Final dividend proposed of 2.16p per share (2003: 1.80p; 2002: 1.50p) | 37.3 | 30.8 | 25.5 | ||||
| 43.2 | 36.1 | 30.5 | |||||
The interim dividend was paid on 87 November 2002.2003. Subject to shareholder approval, the proposed final dividend is to be paid on 142 July 20032004 to those shareholders on the register of members at close of business on 64 June 2003.2004.
Signet Group QUEST Limited, the trustee of the Signet Group Qualifying Employee Share Ownership Trust, has waived its right to participate in any dividends declared by the Company in respect of shares held by it in the Company. The interim dividend paid on 87 November 20022003 was not paid in respect of the 17,28045,757 shares then held by the trustee, nor will the final dividend or any future dividend be paid in respect of any shares held by it unless the Company shall have directed the trustee to accept any particular dividend.
| 9 Earnings per share | |||||||||
2003 | 2002 | 2001 | |||||||
£m | £m | £m | |||||||
| Profit for the financial period | 128.9 | 119.7 | 110.7 | ||||||
| 2003 | 2002 | 2001 | |||||||
| Basic weighted average number of shares in issue (million) | 1,710.7 | 1,690.2 | 1,676.8 | ||||||
| Dilutive effect of share options (million) | 16.4 | 12.5 | 13.9 | ||||||
| Diluted weighted average number of shares (million) | 1,727.1 | 1,702.7 | 1,690.7 | ||||||
| Earnings per share – basic | 7.5p | 7.1p | 6.6p | p | |||||
| – diluted | 7.5p | 7.0p | 6.5p | ||||||
Under recently enacted US tax legislation the rate of US federal income tax on dividends received by individual US shareholders from qualified foreign corporations is reduced to 15%. Dividends paid by the Group to individual US holders of shares or ADSs should qualify for this preferential dividend tax treatment. The change in legislation only applies to individuals subject to US federal income taxes and therefore the tax position of UK shareholders is unaffected. Individual US holders are urged to consult their tax advisers regarding the application of this recent US tax legislation to their particular circumstances.
| 9. | Earnings per share | ||||||
| 2004 | 2003 | (1) | 2002 | (1) | |||
| £m | £m | £m | |||||
| Profit for the financial period | 137.2 | 129.1 | 120.4 | ||||
| 2004 | 2003 | 2002 | |||||
| Basic weighted average number of shares in issue (million) | 1,718.4 | 1,710.7 | 1,690.2 | ||||
| Dilutive effect of share options (million) | 12.5 | 16.4 | 12.5 | ||||
| Diluted weighted average number of shares (million) | 1,730.9 | 1,727.1 | 1,702.7 | ||||
| Earnings per share – basic | 8.0p | 7.5p | 7.1p | ||||
| Earnings per share – diluted | 7.9p | 7.5p | 7.1p | ||||
The basic weighted average number of shares in issue excludes those shares held in the QUEST (see note 20).
Signet Group plc 65
| (1) | Restated for the implementation of FRS 17 – ‘Retirement Benefits’ (see note 17). |
| Signet Group plc Annual Report & Accounts year ended 31 January 2004 | 69 |
Notes to the accounts (continued) |
| Intangible fixed assets | ||||
| goodwill | ||||
| £m | ||||
| Cost: | ||||
| At | ||||
| Translation differences | ( | ) | ||
| At | ||||
| Amortisation: | ||||
| At | ||||
| Charged in period | ||||
| Translation differences | (0.3 | ) | ||
| At | ||||
| Net book value: | ||||
| At | ||||
| At | ||||
The purchased goodwill above arose on the acquisition of Marks & Morgan on 31 July 2000 and will be amortised over 20 years. Consequently the amortisation expense is expected to be £1.2£1.1 million for each of the next five financial years to 2007/8.2008/09. This may be affected by movements in exchange rates. An impairment review was performed at 1 February 2003,31 January 2004, concluding that the carrying value of £19.8£16.8 million does not require an impairment adjustment.
| 11 Tangible fixed assets | ||||||||||||||||||
| Land and buildings | ||||||||||||||||||
Freehold | Long leasehold | Short leasehold | Plant, machinery and vehicles | Shopfronts, fixtures and fittings | Total | |||||||||||||
£m | £m | £m | £m | £m | £m | |||||||||||||
| Cost or valuation: | ||||||||||||||||||
| At 2 February 2002 | 17.9 | 2.4 | 129.6 | 56.7 | 235.5 | 442.1 | ||||||||||||
| Additions | – | – | 12.3 | 6.8 | 30.4 | 49.5 | ||||||||||||
| Disposals | (0.5 | ) | – | (2.0 | ) | (0.1 | ) | (3.3 | ) | (5.9 | ) | |||||||
| Transfers | 0.5 | (0.5 | ) | – | – | – | – | |||||||||||
| Translation differences | (0.3 | ) | – | (17.2 | ) | (5.9 | ) | (21.8 | ) | (45.2 | ) | |||||||
| At 1 February 2003 | 17.6 | 1.9 | 122.7 | 57.5 | 240.8 | 440.5 | ||||||||||||
| Depreciation: | ||||||||||||||||||
| At 2 February 2002 | 1.4 | – | 64.2 | 38.9 | 123.5 | 228.0 | ||||||||||||
| Charged in period | 0.1 | – | 9.2 | 6.4 | 20.9 | 36.6 | ||||||||||||
| Disposals | – | – | (1.7 | ) | (0.3 | ) | (2.6 | ) | (4.6 | ) | ||||||||
| Translation differences | – | – | (8.8 | ) | (4.5 | ) | (11.7 | ) | (25.0 | ) | ||||||||
| At 1 February 2003 | 1.5 | – | 62.9 | 40.5 | 130.1 | 235.0 | ||||||||||||
| Net book value: | ||||||||||||||||||
| At 1 February 2003 | 16.1 | 1.9 | 59.8 | 17.0 | 110.7 | 205.5 | ||||||||||||
| At 2 February 2002 | 16.5 | 2.4 | 65.4 | 17.8 | 112.0 | 214.1 | ||||||||||||
66 Signet Group plc
| 70 | Signet Group plc Annual Report & Accounts year ended 31 January 2004 |
11. Tangible fixed assets
| Land and buildings | |||||||||||||||||
| Plant, | Shopfronts, | ||||||||||||||||
| Long | Short | machinery | fixtures and | ||||||||||||||
| Freehold | leasehold | leasehold | and vehicles | fittings | Total | ||||||||||||
| £m | £m | £m | £m | £m | £m | ||||||||||||
| Cost or valuation: | |||||||||||||||||
| At 1 February 2003 | 17.6 | 1.9 | 122.7 | 57.5 | 240.8 | 440.5 | |||||||||||
| Additions | – | – | 12.5 | 7.5 | 30.9 | 50.9 | |||||||||||
| Disposals | – | – | (1.6 | ) | (0.4 | ) | (3.2 | ) | (5.2 | ) | |||||||
| Translation differences | (0.2 | ) | – | (12.4 | ) | (4.4 | ) | (15.7 | ) | (32.7 | ) | ||||||
| At 31 January 2004 | 17.4 | 1.9 | 121.2 | 60.2 | 252.8 | 453.5 | |||||||||||
| Depreciation: | |||||||||||||||||
| At 1 February 2003 | 1.5 | – | 62.9 | 40.5 | 130.1 | 235.0 | |||||||||||
| Charged in period | 0.2 | 0.1 | 9.0 | 6.3 | 23.7 | 39.3 | |||||||||||
| Disposals | – | – | (1.6 | ) | (0.3 | ) | (3.1 | ) | (5.0 | ) | |||||||
| Translation differences | – | – | (6.6 | ) | (3.3 | ) | (8.7 | ) | (18.6 | ) | |||||||
| At 31 January 2004 | 1.7 | 0.1 | 63.7 | 43.2 | 142.0 | 250.7 | |||||||||||
| Net book value: | |||||||||||||||||
| At 31 January 2004 | 15.7 | 1.8 | 57.5 | 17.0 | 110.8 | 202.8 | |||||||||||
| At 1 February 2003 | 16.1 | 1.9 | 59.8 | 17.0 | 110.7 | 205.5 | |||||||||||
Cost or valuationAll fixed assets are stated at cost andwith the exception of all UK freehold and long leasehold properties which are stated on the basis of their latest professional valuation. An external valuation was undertaken by NAI Gooch Webster, Chartered Surveyors, at 2 February 2002.The2002. The valuation was in accordance with the Royal Institute of Chartered Surveyors’ Appraisal and Valuation Manual. Of these properties, aA total of 14 were valued on an existing use basis and are stated at net realisable value, and one was valued on an open market basis and is stated on that basis.
Freehold properties in the consolidated balance sheet include £7.5 million of depreciable assets (2002: £7.6(2003: £7.5 million). The net book value of shopfronts, fixtures and fittings held under finance leases is £8.3£7.5 million (2002: £11.6(2003: £8.3 million).
2003 | 2002 | ||||||||||
| 2004 | 2003 | ||||||||||
£m | £m | £m | £m | ||||||||
| Freehold and long leasehold land and buildings are stated at: | |||||||||||
| Cost | 1.6 | 1.9 | 1.5 | 1.6 | |||||||
| Valuation | 17.9 | 18.4 | 17.8 | 17.9 | |||||||
19.5 | 20.3 | 19.3 | 19.5 | ||||||||
| The net book value of freehold and long leasehold land and buildings on an historical | |||||||||||
| cost basis would be: | |||||||||||
| The net book value of freehold and long leasehold land and buildings on an historical cost basis would be: | |||||||||||
| Cost | 26.2 | 27.0 | 26.0 | 26.2 | |||||||
| Depreciation | (7.5 | ) | (7.2 | ) | (7.7 | ) | (7.5 | ) | |||
18.7 | 19.8 | 18.3 | 18.7 | ||||||||
| Signet Group plc Annual Report & Accounts year ended 31 January 2004 | 71 |
Notes to the accounts (continued)
1212. Stocks
Stocks constitute goods held for resale.
Subsidiary undertakings held £74.4£83.1 million of consignment stocks at 1 February 2003 (2002: £96.131 January 2004 (2003: £74.4 million) which is not recorded on the balance sheet.Thesheet. The principal terms of the consignment agreements, which can generally be terminated by either side, are such that the Group can return any or all of the stocks to the relevant suppliers without financial or commercial penalties and the supplier can vary stock prices.
Stock provisions 52/53 weeks ended | Balance at beginning of period | Acquisition of subsidiary undertaking | Charged to profit | Utilised | Balance at end of period | ||||||||||||||
| Stock provisions | |||||||||||||||||||
| Balance at | |||||||||||||||||||
£m | £m | £m | £m | £m | beginning | ||||||||||||||
| of period | |||||||||||||||||||
| 27 January 2001 | 11.9 | 1.1 | 17.1 | (19.1 | ) | 11.0 | |||||||||||||
| 52/53 weeks ended | £m | ||||||||||||||||||
| 2 February 2002 | 11.0 | – | 20.4 | (23.5 | ) | 7.9 | 11.0 | 20.4 | (23.5 | 7.9 | |||||||||
| 1 February 2003 | 7.9 | – | 19.5 | (21.3 | ) | 6.1 | 7.9 | 19.5 | (21.3 | 6.1 | |||||||||
| 31 January 2004 | 6.1 | 16.8 | (18.4 | 4.5 | |||||||||||||||
Stock provisions have been made for obsolete, slow-moving and damaged stock on a consistent basis.
| 13. Debtors | ||||||
| 2004 | 2003 | (1) | ||||
| £m | £m | |||||
| Trade debtors (net of allowances): | ||||||
| – US receivables programme | 292.9 | 299.2 | ||||
| – Other | 8.7 | 8.3 | ||||
| 301.6 | 307.5 | |||||
| Other debtors | 22.5 | 22.5 | ||||
| Corporation tax recoverable | 0.6 | 0.2 | ||||
| Prepayments and accrued income | 13.6 | 10.5 | ||||
| Debtors recoverable within one year | 338.3 | 340.7 | ||||
| Debtors recoverable after more than one year – deferred taxation (note 18) | – | 5.2 | ||||
| – pension scheme asset (note 22) | 1.2 | – | ||||
| 339.5 | 345.9 | |||||
| (1) | Restated for the implementation of FRS 17 – ‘Retirement Benefits’ (see note 17) |
| Allowances for doubtful debts | ||||||||
| 52/53 weeks ended | Balance at beginning of period | Charged to profit | Balance at end of period | |||||
| Utilised | (1) | |||||||
| £m | £m | £m | £m | |||||
| 2 February 2002 | 27.0 | 45.7 | (46.4 | ) | 26.3 | |||
| 1 February 2003 | 26.3 | 39.1 | (44.1 | ) | 21.3 | |||
| 31 January 2004 | 21.3 | 36.9 | (38.4 | ) | 19.8 | |||
| (1) | Including the impact of foreign exchange translation between opening and closing balance sheet dates. |
| 13 Debtors | ||||||
2003 | 2002 | |||||
£m | £m | |||||
| Trade debtors (net of allowances): | ||||||
| – US receivables programme | 299.2 | 327.0 | ||||
| – Other | 8.3 | 7.4 | ||||
307.5 | 334.4 | |||||
| Other debtors | 22.5 | 20.1 | ||||
| Corporation tax recoverable | 0.2 | – | ||||
| Prepayments and accrued income | 10.5 | 7.1 | ||||
| Debtors recoverable within one year | 340.7 | 361.6 | ||||
| Debtors recoverable after more than one year – Pension fund prepayment | 19.1 | 19.1 | ||||
359.8 | 380.7 | |||||
Signet Group plc 67
| 72 | Signet Group plc Annual Report & Accounts year ended 31 January 2004 |
| Allowances for doubtful debts | |||||||||||||||
52/53 weeks ended | Balance at beginning of period | Acquisition of subsidiary undertaking | Charged to profit | Utilised | Balance at end of period | ||||||||||
£m | £m | £m | £m | £m | |||||||||||
| 27 January 2001 | 16.4 | 4.3 | 41.6 | (35.3 | ) | 27.0 | |||||||||
| 2 February 2002 | 27.0 | – | 45.7 | (46.4 | ) | 26.3 | |||||||||
| 1 February 2003 | 26.3 | – | 39.1 | (44.1 | ) | 21.3 | |||||||||
| 14 Cash at bank and in hand | ||||||
2003 | 2002 | |||||
£m | £m | |||||
| Bank deposits | 88.6 | 65.9 | ||||
| Other cash | 0.6 | 0.6 | ||||
89.2 | 66.5 | |||||
| 15 Creditors: amounts falling due within one year | ||||||
2003 | 2002 | |||||
£m | £m | |||||
| Bank overdrafts | 42.9 | 38.8 | ||||
| Loan notes | 9.1 | 10.6 | ||||
| Obligations under finance leases | 3.3 | 3.5 | ||||
| Trade creditors | 58.7 | 84.0 | ||||
| Corporation tax | 58.8 | 41.4 | ||||
| Social security and PAYE | 1.5 | 1.3 | ||||
| Other taxes | 21.8 | 21.4 | ||||
| Other creditors | 6.7 | 3.7 | ||||
| Accruals and deferred income | 91.3 | 90.2 | ||||
| Proposed dividend | 30.8 | 25.6 | ||||
324.9 | 320.5 | |||||
| 14. Cash at bank and in hand | ||||
| 2004 | 2003 | |||
| £m | £m | |||
| Bank deposits | 127.4 | 88.6 | ||
| Other cash | 0.6 | 0.6 | ||
| 128.0 | 89.2 | |||
| 15. Creditors: amounts falling due within one year | |||||
| 2004 | 2003 | ||||
| £m | £m | ||||
| Bank overdrafts | 51.1 | 42.9 | |||
| Loan notes | 8.2 | 9.1 | |||
| Obligations under finance leases | 2.4 | 3.3 | |||
| Trade creditors | 55.6 | 58.7 | |||
| Corporation tax | 54.2 | 58.8 | |||
| Social security and PAYE | 1.4 | 1.5 | |||
| Other taxes | 23.5 | 21.8 | |||
| Other creditors | 5.3 | 6.7 | |||
| Accruals and deferred income | 93.0 | 91.3 | |||
| Proposed dividend | 37.3 | 30.8 | |||
| 332.0 | 324.9 | ||||
The weighted average interest rate on short-term borrowings at 131 January 2004 was 1.85% (1 February 2003 was2003: 3.48% (2 February 2002: 5.28%).
| 16 Creditors: amounts falling due after more than one year | ||||||
2003 | 2002 | |||||
£m | £m | |||||
| Loan notes falling due between one and two years | 9.1 | 10.6 | ||||
| Loan notes falling due between two and five years | 9.2 | 21.1 | ||||
| Bank loans falling due between two and five years | 153.1 | 176.8 | ||||
| Obligations under finance leases falling due between one and two years | 2.6 | 3.7 | ||||
| Obligations under finance leases falling due between two and five years | – | 3.1 | ||||
| Other creditors | 10.4 | 9.3 | ||||
184.4 | 224.6 | |||||
68 Signet Group plc
| 16. Creditors: amounts falling due after more than one year | |||||
| 2004 | 2003 | (1) | |||
| £m | £m | ||||
| Loan notes falling due between one and two years | 8.3 | 9.1 | |||
| Loan notes falling due between two and five years | – | 9.2 | |||
| Bank loans falling due between one and two years | 137.9 | 153.1 | |||
| Obligations under finance leases falling due between one and two years | – | 2.6 | |||
| Other creditors | 11.0 | 10.4 | |||
| Pension scheme liability (note 22) | – | 4.7 | |||
| 157.2 | 189.1 | ||||
| (1) | Restated for the implementation of FRS 17 – ‘Retirement Benefits’ (see note 17). |
In August 2001 the Group entered into an unsecured $410 million multi-currency revolving credit facility with a syndicate of banks for a period of five years at a variable interest rate at a maximum margin of 0.85% above LIBOR. From commencement, the applicable margin has been 0.65% above LIBOR. At 1 February 200331 January 2004 the amount outstanding under this facility was $nil.
Commitment fees are paid on the undrawn portion of this credit facility at a rate of 50.0% of the applicable margin.
| Signet Group plc Annual Report & Accounts year ended 31 January 2004 | 73 |
Notes to the accounts (continued)
The principal financial covenants on this facility are as follows:
| • | The ratio of Consolidated Net Debt to Consolidated EBITDA (Earnings Before Interest, Tax, Depreciation and Amortisation) shall not exceed 3:1; |
| • | Consolidated Net Worth (total net assets) must not fall below £400 million; and |
| • | The ratio of Consolidated EBITARR (Earnings Before Interest,Tax, Amortisation, Rents, Rates and Operating Lease Expenditure) to Consolidated Net Interest Expenditure plus Rents, Rates and Operating Lease Expenditure shall be equal to or greater than 1.4:1. |
In July 1998 the Group entered into a $60 million seven year unsecured note issue with a fixed interest rate of 7.25%. This note issue is repayable in four equal annual instalments of $15 million, commencingwhich commenced in July 2002. At 1 February 200331 January 2004 the amount outstanding under this note issue was $45$30 million.
The principal financial covenants on this note issue are as follows:
| • | Gearing (net debt, excluding the US receivables funding, expressed as a percentage of total net assets) must not exceed 60.0%; |
| • | Consolidated net worth (total net assets) must not fall below £300 million; and |
| • | Interest cover must not fall below three times. |
In the US, in November 2001, the Company refinanced its private label credit card receivables programme through a privately placed receivables securitisation. Under this securitisation, interests in the US receivables portfolio held by a trust were sold principally to institutional investors in the form of fixed-rate Class A, Class B and Class C investor certificates.Thecertificates. The certificates have a weighted average interest rate of 5.42% and interest is paid monthly in arrears from the finance charges collections generated by the receivables portfolio.Theportfolio. The revolving period of the securitisation ends in December 2005, with a final expected principal payment date in November 2006.This securitisation replaced a previous securitisation facility of $191.5 million, which commenced repayment in December 2000 and was fully repaid in September 2001.The2006. The aggregate outstanding principal amount of the certificates amounted to $251 million at 131 January 2004 (1 February 2003 (2 February 2002:2003: $251 million).
Also in the US, in January 2002, the Group entered into a $70 million Conduit securitisation facility (“Conduit”). Under this securitisation, interests in the US receivables portfolio held by a trust are sold to Sheffield Receivables Corporation (a US subsidiary of Barclays Capital Inc.) in the form of an unsecured revolving variable rate certificate.Thecertificate. The Conduit bears a margin of 0.375% above the cost of funds paid by Sheffield Receivables Corporation. Commitment fees are paid on the undrawn portion of this credit facility at a rate of 0.20%. At 1 February 200331 January 2004 the amount outstanding under the Conduit was $nil (2(1 February 2002:2003: $nil).
Signet Group plc 69Undrawn committed borrowing facilities
| Undrawn committed borrowing facilities | ||||||||||
2003 | 2002 | |||||||||
| 2004 | 2003 | |||||||||
£m | £m | £m | £m | |||||||
| Expiring within one year | 42.7 | 49.3 | 38.5 | 42.7 | ||||||
| Expiring between one and two years | – | – | ||||||||
| Expiring between two and five years | 250.0 | 288.7 | 225.3 | 250.0 | ||||||
292.7 | 338.0 | 263.8 | 292.7 | |||||||
In October 1999 the Group completed a sale and leaseback agreement in the US.ThisUS. This agreement has been treated as a finance lease in accordance with SSAP 21.The21. The nominal interest rate is 8.44% per annum.
| 74 | Signet Group plc Annual Report & Accounts year ended 31 January 2004 |
17. Prior year adjustments
Adoption of FRS 17 – ‘Retirement Benefits’
It was previously the Group’s policy, in compliance with SSAP 24, to spread the pension valuation surplus arising under its UK defined benefit pension scheme (the “Group Scheme”) over the average service life of the employees. In compliance with this standard, a pension scheme prepayment of £19.1 million was included in the balance sheet at 1 February 2003 within debtors falling due after more than one year. An associated deferred tax liability of £5.7 million was also carried on the interest payablebalance sheet at 1 February 2003.
The adoption of FRS 17 – ‘Retirement Benefits’ has led to the write-off of the £19.1 million pension asset previously recognised under SSAP 24 and provision for the deficit of £6.7 million in the Group Scheme as at 1 February 2003. This £6.7 million deficit has been classified as a creditor falling due after more than one year. The £5.7 million deferred tax liability associated with the SSAP 24 pension asset has been written back and a £2.0 million deferred tax asset has been recognised in respect of the deficit provided for under FRS 17 at 1 February 2003. The total net adjustment of £18.1 million arising from the adoption of FRS 17 has been accounted for as a prior year adjustment charged directly to shareholders’ funds as at 1 February 2003.
Shareholders’ funds at 2 February 2002 and at 27 January 2001 (as detailed on page 61) have been restated to reflect the total net surpluses arising at least 75%those dates from the adoption of US dollar borrowings was fixed by Fixed Interest Rate Agreements (see note 26).FRS 17.
The consolidated statement of total recognised gains and losses has been restated for the 52 weeks ended 1 February 2003 and the 53 weeks ended 2 February 2002 to include the actuarial losses on pension assets arising during those periods net of deferred tax, calculated in accordance with FRS 17. These amounted to £22.3 million and £14.3 million respectively.
The profit and loss accounts for the 52 weeks ended 1 February 2003 and for the 53 weeks ended 2 February 2002 have been restated to include the following items, reflecting the requirements of FRS 17.
| 2003 | 2002 | |||
| £m | £m | |||
| Operating profit: | ||||
| As originally reported | 216.2 | 200.7 | ||
| - Net service cost | (2.3 | ) | (1.9 | ) |
| As restated | 213.9 | 198.8 | ||
| Net interest payable and similar charges: | ||||
| As originally reported | (16.5 | ) | (17.9 | ) |
| - Expected return on Group Scheme assets | 7.1 | 7.5 | ||
| - Interest on Group Scheme liabilities | (4.6 | ) | (4.6 | ) |
| As restated | (14.0 | ) | (15.0 | ) |
| Profit on ordinary activities before taxation: | ||||
| As originally reported | 199.7 | 182.8 | ||
| - Net impact of FRS 17 adjustments | 0.2 | 1.0 | ||
| As restated | 199.9 | 183.8 | ||
17 Prior year adjustmentAdoption of FRS 19 – ‘Deferred Tax’
Prior to 2001/02 it was the Group’s policy, in compliance with SSAP 15, to provide for deferred taxation where there was a reasonable probability that a liability would become payable in the foreseeable future. FRS 19 – ‘Deferred Tax’, which the Group adopted in 2001/02, requires that a deferred tax liability should be provided or an asset recognised in respect of all timing differences, regardless of whether it is considered that there is a reasonable probability that such timing differences will reverse.
The impact of the adoption of FRS 19 in 2001/02 led to an additional provision for deferred taxationtax of £6.2 million, which was accounted for as a prior year adjustment charged directly to shareholders’ funds.Therefunds. There was no material effect on the profit and loss account for the period ended 2 February 2002 or the preceding years.
| 18 Deferred taxation | ||||||||||||||||||
| 1 February 2003 | 2 February 2002 | |||||||||||||||||
Assets | (Liabilities) | Total | Assets | (Liabilities) | Total | |||||||||||||
£m | £m | £m | £m | £m | £m | |||||||||||||
| Accelerated capital allowances | 0.7 | – | 0.7 | 0.8 | – | 0.8 | ||||||||||||
| Other timing differences | 18.0 | (19.2 | ) | (1.2 | ) | 17.3 | (27.3 | ) | (10.0 | ) | ||||||||
| UK property related | 1.8 | – | 1.8 | 1.8 | – | 1.8 | ||||||||||||
| Value of UK capital losses | ||||||||||||||||||
| carried forward | 16.3 | – | 16.3 | 16.4 | – | 16.4 | ||||||||||||
| Total deferred tax asset/(liability) | 36.8 | (19.2 | ) | 17.6 | 36.3 | (27.3 | ) | 9.0 | ||||||||||
| Valuation allowance | (18.1 | ) | – | (18.1 | ) | (18.2 | ) | – | (18.2 | ) | ||||||||
| Deferred tax (liability)/asset | 18.7 | (19.2 | ) | (0.5 | ) | 18.1 | (27.3 | ) | (9.2 | ) | ||||||||
| UK | (3.7 | ) | (5.7 | ) | ||||||||||||||
| US | 3.2 | (3.5 | ) | |||||||||||||||
| Deferred tax liability | (0.5 | ) | (9.2 | ) | ||||||||||||||
| Signet Group plc Annual Report & Accounts year ended 31 January 2004 | 75 |
Notes to the accounts (continued)
18. Deferred taxation
| 31 January 2004 | 1 February 2003(1) | ||||||||||||||
| Assets | (Liabilities) | Total | Assets | (Liabilities) | Total | ||||||||||
| £m | £m | £m | £m | £m | £m | ||||||||||
| Accelerated capital allowances | 1.1 | – | 1.1 | 0.7 | – | 0.7 | |||||||||
| Other timing differences | 16.6 | (23.1 | ) | (6.5 | ) | 18.0 | (13.5 | ) | 4.5 | ||||||
| UK property related | 1.9 | – | 1.9 | 1.8 | – | 1.8 | |||||||||
| Value of UK capital losses carried forward | 16.1 | – | 16.1 | 16.3 | – | 16.3 | |||||||||
| Total deferred tax asset/(liability) | 35.7 | (23.1 | ) | 12.6 | 36.8 | (13.5 | ) | 23.3 | |||||||
| Valuation allowance | (18.0 | ) | – | (18.0 | ) | (18.1 | ) | – | (18.1 | ) | |||||
| Deferred tax asset/(liability) | 17.7 | (23.1 | ) | (5.4 | ) | 18.7 | (13.5 | ) | 5.2 | ||||||
| UK | 2.6 | 2.0 | |||||||||||||
| US | (8.0 | ) | 3.2 | ||||||||||||
| Deferred tax (liability)/asset | (5.4 | ) | 5.2 | ||||||||||||
The difference on translation in respect of deferred tax posted directly to reserves in the period ended 1 February 200331 January 2004 was £nil (2002:£0.6 million (2003: £nil).
Movement in deferred tax (liability)/asset:
Total | |||
| £m | |||
| At 1 February 2003(1) | |||
Transfers | 1.1 | ||
| (12.3 | |||
| Difference on translation | 0.6 | ||
| At | ( | ) | |
70 Signet Group plc
| Restated for the implementation of FRS 17 – ‘Retirement Benefits’ (see note 17). | |
19. Other provisions
| Total | |||
| £m | |||
| At | |||
| Charges for the period in the profit and loss account | (0.5 | ) | |
| Utilisation | ( | ) | |
| At | |||
The provision is for onerous leases and includes the discounted cash flows of future net obligations in respect of vacant and partially vacant properties and the rental shortfall on properties which are sublet at below the current rent.
| 20 Share capital | ||||||
| 2003 | 2002 | |||||
| £m | £m | |||||
| Authorised: | ||||||
| 5,929,874,019 Ordinary shares of 0.5p each (2002: 5,929,874,019) | 29.6 | 29.6 | ||||
| Class A Dollar deferred shares of $0.01 each (2003: nil; 2002: 12,320,739) | – | 0.1 | ||||
| Class B Dollar deferred shares of $1 each (2003: nil; 2002: 2,500) | – | – | ||||
| 29.6 | 29.7 | |||||
| 76 | Signet Group plc Annual Report & Accounts year ended 31 January 2004 |
Following the adoption of new articles of association by shareholders on 13 June 2002 the Company only has authorised ordinary shares of 0.5p each.Back to Contents
| Number | £m | |||||
| Allotted, called up and fully paid: | ||||||
| Ordinary shares of 0.5p each | ||||||
| At 2 February 2002 | 1,706,007,484 | 8.5 | ||||
| Shares issued to QUEST | 1,688,035 | – | ||||
| Shares issued to ESOT | 1,850,403 | – | ||||
| Other share options exercised | 4,222,474 | 0.1 | ||||
| At 1 February 2003 total allotted, called up and fully paid (2002: £8.6 million) | 1,713,768,396 | 8.6 | ||||
20. Share capital
| 2004 | 2003 | ||||
| £m | £m | ||||
| Authorised: | |||||
| 5,929,874,019 Ordinary shares of 0.5p each (2003: 5,929,874,019) | 29.6 | 29.6 | |||
| Number of shares | £m | ||||
| Allotted, called up and fully paid: | |||||
| Ordinary shares of 0.5p each | |||||
| At 1 February 2003 | 1,713,768,396 | 8.6 | |||
| Shares issued to QUEST | 226,057 | – | |||
| Shares issued to ESOT | 2,068,812 | – | |||
| Other share options exercised | 10,127,583 | – | |||
| At 31 January 2004 total allotted, called up and fully paid (2003: £8.6 million) | 1,726,190,848 | 8.6 | |||
The consideration received in respect of the 7.812.4 million shares issued during the year was £6.3 million (2003: £4.3 million (2002: £8.9 million).
On 22 April 2002 each of the 12,320,739 Class A Dollar deferred shares of $0.01 each and 2,500 Class B Dollar deferred shares of $1 each (the “deferred shares”) in issue were redeemed by the Company. All the authorised but unissued deferred shares were cancelled by a special resolution passed on 13 June 2002 and the amount of that part of the Company’s share capital which was denominated in dollars was diminished accordingly and extinguished.
The trustee of the QUEST, Signet Group QUEST Limited (a subsidiary of the Company), held 395,528110,857 shares at 21 February 2002.2003. In the year ended 1 February 200331 January 2004 the trustee subscribed in cash for 313,046132,450 shares at 99.25p75.50p per share on 20 February 20023 March 2003 and for 1,374,98993,607 shares at 82.5p87.75p per share on 10 January 2003.These6 June 2003. These subscription prices were the market prices respectively on 31 January2 March 2003 and 9 January5 June 2003, the last business days before the dates on which the respective terms of issue were fixed.Thesefixed. These shares were all subscribed for in order to provide shares to satisfy the exercise of options under the Group’s savings related share option scheme for UK employees. In aggregate the subscription monies amounted to £1,445,064.£182,140. In the year ended 1 February 200331 January 2004 the trustee transferred 1,660,908981,370 shares to holders of savings related options pursuant to the exercise of such options.Theoptions. The trustee held 110,85741,065 shares at 1 February 200331 January 2004 and 125,93035,992 shares at 2624 March 2003.The2004. The aggregate market value of the shares at 131 January 2004 was £0.04 million (1 February 2003 was2003: £0.08 million (2 February 2002: £0.4 million).The. The investment in these shares is recorded as £nil in the Company’s accounts.
Signet Group plc 71
The trustee of the ESOT, Mourant & Co.TrusteesCo. Trustees Limited, did not hold any shares at 21 February 2002.2003. In the year ended 1 February 200331 January 2004 the trustee subscribed in cash for a total of 1,850,4032,068,812 shares at an average price of 118.85p100.00p per share. The subscription prices were the market prices on the last business days before the dates on which the respective terms of issue were fixed and varied between 101.5p85.25p and 132.25p103.75p per share.Theseshare. These shares were all subscribed for in order to provide shares to satisfy the exercise of executive share options granted to UK employees. At 1 February 200331 January 2004 and 2624 March 20032004 the trustee did not hold any shares.
On various dates during the year ended 1 February 200331 January 2004 a total of 4,222,47410,127,583 shares were subscribed for in cash by holders of options, at prices between 21.25p33.75p and 57.00p per share. The subscription prices were the market prices at the various times at which the options were granted. The market prices on the dates of issue varied between 68.25p73.00p and 113.25p114.50p and in aggregate the subscription monies amounted to £2,140,502.£4,645,381. Details of options in respect of shares are shown in note 27 on page 80.85.
| 21 Reserves | ||||||||||||
Share | Revaluation reserve | Special reserves | Profit and loss account | |||||||||
| £m | £m | £m | £m | |||||||||
| At 2 February 2002 | 48.3 | 3.0 | 38.3 | 581.5 | ||||||||
| Retained profit attributable to equity shareholders | – | – | – | 92.8 | ||||||||
| Shares issued to QUEST/ESOT | 1.9 | – | – | (1.9 | ) | |||||||
| Exercise of share options | 3.7 | – | – | – | ||||||||
| Redemption of deferred share capital | – | – | – | 0.1 | ||||||||
| Transfer on disposal of fixed assets | – | 0.1 | – | (0.1 | ) | |||||||
| Translation differences (net of £0.7 million tax credit) | – | – | 63.4 | (143.2 | ) | |||||||
| At 1 February 2003 | 53.9 | 3.1 | 101.7 | 529.2 | ||||||||
| Signet Group plc Annual Report & Accounts year ended 31 January 2004 | 77 |
Notes to the accounts (continued)
| 21. | Reserves |
| Share | |||||||||||
| premium | Revaluation | Special | Profit and | ||||||||
| account | reserve | reserves | loss account | ||||||||
| £m | £m | £m | £m | ||||||||
| At 1 February 2003 – as previously stated | 53.9 | 3.1 | 101.7 | 529.2 | |||||||
| Prior year adjustment (note 17) | – | – | – | (18.1 | ) | ||||||
| At 1 February 2003 | 53.9 | 3.1 | 101.7 | 511.1 | |||||||
| Retained profit attributable to equity shareholders | – | – | – | 94.0 | |||||||
| Shares issued to QUEST/ESOT | 1.8 | – | – | (1.8 | ) | ||||||
| Exercise of share options | 5.0 | – | – | – | |||||||
| Actuarial gain recognised | – | – | – | 6.4 | |||||||
| Translation differences | – | – | 40.5 | (96.7 | ) | ||||||
| At 31 January 2004 | 60.7 | 3.1 | 142.2 | 513.0 | |||||||
The revaluation reserve represents the unrealised surplus arising from revaluing freehold and long leasehold properties.
Exchange gains of £1.6 million (2003: £1.7 million (2002: £1.1 million losses)gains) on foreign currency loans have been offset in reserves against exchange movements on the net investment in overseas subsidiary undertakings.
Following the 1997 capital reduction, the holding company, Signet Group plc, is permitted to make distributions (including dividends, share buy-backs and other transactions classed as distributions) out of profits earned after 2 August 1997, the end of its 1997/98 half year.Theyear. The undertakings given to the High Court at the time of the capital reduction included the requirement that the Company transfer to a new special reserve any dividend paid by a subsidiary from profits earned prior to that date.Thedate. The new special reserve is, for as long as the Company is a public company, treated as a non-distributable reserve for the purposes of section 264 of the Companies Act 1985.
In accordance with undertakings given by the Company to the High Court in connection with previous reductions of the share premium account, an earlier special reserve is available to write-off existing goodwill resulting from acquisitions and otherwise only for purposes permitted in the case of the share premium account. Under English law, dividends can only be paid out of profits available for distribution (generally defined as accumulated realised profits less accumulated realised losses less net unrealised losses) and not out of share capital or share premiumspremium (generally equivalent in US terms to paid-in surplus).
At 1 February 2003,31 January 2004, after taking into account the recommended final dividend of 1.80p2.16p per share, the holding company had distributable reserves of £114.8 million (1 February 2003: £30.9 million (2 February 2002: £29.7 million).There. There are additional potentially distributable reserves held in subsidiary companies.
72 Signet Group plc
Exchange differences arising on the retranslation of purchased goodwill have been written off against the profit and loss account reserve.Thisreserve. This amount has been transferred to the special reserve where the initial purchased goodwill had previously been eliminated. Cumulative goodwill write-offs at underlying foreign currency amounts included in the special reserve amount to £610.3£569.8 million (2(1 February 2002: £673.72003: £610.3 million).
The Group’s total recognised gains and losses differ from the net profit for the period (as set out in the Group profit and loss account) in respect of foreign currency translation adjustments amounting to an aggregate loss of £79.8£56.2 million for the period ended 1 February 2003 (2002: gain of31 January 2004 (2003: £79.8 million loss; 2002: £15.1 million; 2001: gain of £31.8 million).Themillion gain). The foreign currency translation adjustments are set out in the statement of total recognised gains and losses.
| 78 | Signet Group plc Annual Report & Accounts year ended 31 January 2004 |
The cumulative exchange gains and losses on the translation of foreign currency financial statements into pounds sterling are set out in the table below:
| 2003 | 2002 | 2001 | ||||||||||||
| 2004 | 2003 | 2002 | ||||||||||||
| £m | £m | £m | £m | £m | £m | |||||||||
| Balance at end of previous period | 28.0 | 12.9 | (18.9 | ) | (51.8 | ) | 28.0 | 12.9 | ||||||
| Movement in period | (79.8 | ) | 15.1 | 31.8 | (56.2 | ) | (79.8 | ) | 15.1 | |||||
| Balance at end of period | (51.8 | ) | 28.0 | 12.9 | (108.0 | ) | (51.8 | ) | 28.0 | |||||
The cumulative adjustments to property valuations are £6.9 million (2002:(2003: £6.9 million; 2001: £4.82002: £6.9 million).The. The tax effect of the cumulative adjustments to property valuations is £nil.
2222. Pension schemes
The Group operates one defined benefit pension scheme in the UK, the Group Scheme, for all eligible employees who meet minimum age and service requirements, the Signet Group Pension Scheme (the ‘Group Scheme’).Therequirements. The assets of the Group Scheme, which is a funded scheme, are held in a separate trustee administered fund which is independently managed.Themanaged. The trustees of the Group Scheme during the year were Walker Boyd, John Gillum, John Hartwright and The Law Debenture Pension Trust Corporation p.l.c. (independent trustee). Contributions to the Group Scheme, which are assessed in accordance with the advice of independent qualified actuaries primarily using the projected unitattained age method of valuation, are charged to the consolidated profit and loss account so as to spread the cost of pensions over participating employees’ working lives with the Group. Where appropriate, supplementary pension and life assurance for UK directors and senior executives is provided through the Signet Group Funded Unapproved Retirement Benefits Scheme.
An actuarial valuation of the Group Scheme was carried out as at 5 April 2003. The market value of the Group Scheme’s assets at that date was £82.2 million, a deficit of £6.7 million on the Group Scheme’s accrued liabilities. As a result of the valuation, the Group has recommenced contributions to the Group Scheme and in 2003/04 this amounted to £1.2 million.
In the US, the Group sponsors a defined contribution 401(k) retirement savings plan for all eligible employees who meet minimum age and service requirements.Therequirements. The assets of this plan are held in a separate trust managed by KeyBank and under it, the Group matches 25% of up to the first 6% of employee elective salary deferrals.Thedeferrals. The Group has also established, in the US, an unfunded, unqualified deferred compensation plan which permits certain management employees to elect annually to defer all or a portion of their remuneration and earn a guaranteed interest rate on the deferred amounts. The plan also provides for a Group matching contribution based on each participant’s annual remuneration deferral. In connection with this plan, the Group has invested in trust owned life insurance policies.
The most recent actuarial investigation of the Group Scheme was at 5 April 2002 and its results form the basis of the SSAP 24 accounting in 2002/03 in relation to the Group Scheme.The principal actuarial assumptions adopted in the investigation were that the investment returns before and after retirement would be 6.2% per annum and 5.2% per annum respectively, that the increases in pensionable earnings would be 4.25% per annum and that the increases in present and future pensions in payment for the majority of members would be 2.75% per annum. The market value of the Group Scheme’s assets was sufficient to cover 125% of the benefits that had accrued to members at the valuation date, after allowing for expected future increases in earnings and pensions.The market value of the Group Scheme’s assets at 5 April 2002 was £110.0 million.
Signet Group plc 73
| 2004 | 2003 | 2002 | ||||
| £m | £m | £m | ||||
| The Group pension cost for the period comprises: | ||||||
| Charge to operating profit | ||||||
| UK net service cost | (2.5 | ) | (2.3 | ) | (1.9 | ) |
| US retirement savings plan | (1.9 | ) | (1.9 | ) | (1.6 | ) |
| (4.4 | ) | (4.2 | ) | (3.5 | ) | |
| Credit to net interest payable and similar charges | ||||||
| Expected return on Group Scheme assets | 5.3 | 7.1 | 7.5 | |||
| Interest on Group Scheme liabilities | (4.7 | ) | (4.6 | ) | (4.6 | ) |
| (3.8 | ) | (1.7 | ) | (0.6 | ) | |
| Signet Group plc Annual Report & Accounts year ended 31 January 2004 | 79 |
Notes |
In accordance with SSAP 24, previous valuation surpluses arising from the Group Scheme have been included in the consolidated balance sheet as a prepayment and amortised to the consolidated profit and loss account. At 1 February 2003 the resulting prepayment amounted to £19.1 million (2 February 2002: £19.1 million).
| 2003 | 2002 | 2001 | |||||||
| £m | £m | £m | |||||||
| The Group pension cost for the period comprises: | |||||||||
| Normal UK cost under SSAP 24 | (2.5 | ) | (2.2 | ) | (0.7 | ) | |||
| Spreading of additional surplus | 1.5 | 1.2 | (0.3 | ) | |||||
| Interest on UK surpluses | 1.0 | 1.0 | 1.0 | ||||||
| US retirement savings plan | (1.9 | ) | (1.6 | ) | (1.2 | ) | |||
| (1.9 | ) | (1.6 | ) | (1.2 | ) | ||||
FRS 17 disclosureThe pension cost figures used in these accounts comply with the current pension cost accounting standard SSAP 24. A new pension cost accounting standard, FRS 17 – ‘Retirement Benefits’, has to be implemented in full by 2005. However, under transitional arrangements of FRS 17 the Group is required to disclose the following information about the Group Scheme and the figures that would have been shown under FRS 17 in the current balance sheet.(continued)
The Group operates a defined benefit scheme in the UK. A full actuarial valuation was carried out at 5 April 2000 and updated to 1 February 2003 by a qualified independent actuary.
The financial assumptions used by the actuary to calculate the Group Scheme liabilities were:
| 2003 | 2002 | 2004 | 2003 | 2002 | ||||||||
| Rate of increase in salaries | 3.9% | 3.9% | 4.3% | 3.9% | 3.9% | |||||||
| Rate of increase in deferred pensions during deferment | 2.4% | 2.4% | 2.8% | 2.4% | 2.4% | |||||||
| Rate of increase in pensions in payment(1) | 2.4% | 2.4% | 2.8% | 2.4% | 2.4% | |||||||
| Discount rate | 5.4% | 5.6% | 5.6% | 5.4% | 5.6% | |||||||
| Inflation assumption | 2.4% | 2.4% | 2.8% | 2.4% | 2.4% | |||||||
| (1) for the majority of members | ||||||||||||
| (1) | For the majority of members. |
The assets in the Group Scheme and the expected rates of return (net of administration expenses) were:
| Long-term | Long-term | Long-term | ||||||||||||||||||||||||
| rate of return | rate of return | rate of return | ||||||||||||||||||||||||
Long-term rate of return expected 2003 | Value at 2003 | Long-term rate of return expected 2002 | Value at 2002 | expected | Value at | expected | Value at | expected | Value at | |||||||||||||||||
| 2004 | 2003 | 2002 | ||||||||||||||||||||||||
| % | £m | % | £m | % | £m | % | £m | % | £m | |||||||||||||||||
| Equities and property | 7.1 | 65.4 | 7.3 | 85.3 | 7.5 | 70.0 | 7.1 | 65.4 | 7.3 | 85.3 | ||||||||||||||||
| Bonds | 4.5 | 15.3 | 4.7 | 17.4 | 4.9 | 26.3 | 4.5 | 15.3 | 4.7 | 17.4 | ||||||||||||||||
| Cash | 3.6 | 1.5 | 3.8 | 5.4 | 4.0 | 3.4 | 3.6 | 1.5 | 3.8 | 5.4 | ||||||||||||||||
| Total market value of assets | 82.2 | 108.1 | 99.7 | 82.2 | 108.1 | |||||||||||||||||||||
| Present value of Group Scheme liabilities | (88.9 | ) | (83.2) | (97.9 | ) | (88.9 | ) | (83.2 | ) | |||||||||||||||||
| (Deficit)/surplus in the Group Scheme | (6.7 | ) | 24.9 | |||||||||||||||||||||||
| Related deferred tax asset/(liability) | 2.0 | (7.5) | ||||||||||||||||||||||||
| Surplus/(deficit) in the Group Scheme | 1.8 | (6.7 | ) | 24.9 | ||||||||||||||||||||||
| Related deferred tax (liability)/asset | (0.6 | ) | 2.0 | (7.5 | ) | |||||||||||||||||||||
| Net pension (liability)/asset | (4.7 | ) | 17.4 | |||||||||||||||||||||||
| Net pension asset/(liability) | 1.2 | (4.7 | ) | 17.4 | ||||||||||||||||||||||
74 Signet Group plcAnalysis of pension costs charged to operating profit
| 2004 | 2003 | 2002 | ||||
| £m | £m | £m | ||||
| Current service cost | 2.5 | 2.3 | 1.9 | |||
| Past service cost | – | – | – | |||
| Total operating charge | 2.5 | 2.3 | 1.9 | |||
Analysis of amounts included in net interest payable and similar charges
| 2004 | 2003 | 2002 | ||||
| £m | £m | £m | ||||
| Expected return on Group Scheme assets | 5.3 | 7.1 | 7.5 | |||
| Interest on Group Scheme liabilities | (4.7 | ) | (4.6 | ) | (4.6 | ) |
| Net return | 0.6 | 2.5 | 2.9 | |||
| 80 | Signet Group plc Annual Report & Accounts year ended 31 January 2004 |
If the above pension (liability)/asset wasAnalysis of amount recognised in the financial statements,statement of total recognised gains and losses (“STRGL”)
| 2004 | 2003 | 2002 | |||||
| £m | £m | £m | |||||
| Actual return less expected return on Group Scheme assets | 15.3 | (29.0 | ) | (19.7 | ) | ||
| Experience gains and losses arising on Group Scheme liabilities | (3.3 | ) | – | 2.1 | |||
| Changes in assumptions | (2.8 | ) | (2.8 | ) | (2.8 | ) | |
| Actuarial gain/(loss) | 9.2 | (31.8 | ) | (20.4 | ) | ||
| Deferred tax | (2.8 | ) | 9.5 | 6.1 | |||
| Recognised in STRGL | 6.4 | (22.3 | ) | (14.3 | ) | ||
The movement in the Group’s net assets and profit and loss reserve would besurplus/(deficit) during the year was as follows:
| 2003 | 2002 | |||||
| £m | £m | |||||
| Net assets excluding pension (liability)/asset(1) | 683.1 | 666.3 | ||||
| Pension (liability)/asset | (4.7 | ) | 17.4 | |||
| Net assets including pension (liability)/asset | 678.4 | 683.7 | ||||
| 2004 | 2003 | |||
| £m | £m | |||
| (Deficit)/surplus in Group Scheme at beginning of year | (6.7 | ) | 24.9 | |
| Current service cost | (2.5 | ) | (2.3 | ) |
| Contributions paid | 1.2 | – | ||
| Past service cost | – | – | ||
| Interest return | 0.6 | 2.5 | ||
| Actuarial gain/(loss) | 9.2 | (31.8 | ) | |
| Surplus/(deficit) in the Group Scheme at end of year | 1.8 | (6.7 | ) | |
(1) excludes existing SSAP 24 pension fund prepaymentHistory of £19.1 million (2002: £19.1 million),experience gains and the related deferred tax liability of £5.7 million (2002 £5.7 million).losses
| 2003 | 2002 | |||||
| £m | £m | |||||
| Profit and loss reserve excluding pension (liability)/asset(1) | 529.2 | 568.1 | ||||
| Pension (liability)/asset | (4.7 | ) | 17.4 | |||
| Profit and loss reserve | 524.5 | 585.5 | ||||
| 2004 | 2003 | 2002 | |||||
| Difference between expected and actual return on Group Scheme assets (£ million) | 15.3 | (29.0 | ) | (19.7 | ) | ||
| Percentage of Group Scheme assets | 15% | -35% | -18% | ||||
| Experience gains and losses on Group Scheme liabilities (£ million) | (3.3 | ) | – | 2.1 | |||
| Percentage of Group Scheme liabilities | -3% | – | 3% | ||||
| Total amount recognised in statement of total recognised gains and losses – gross (£ million) | 9.2 | (31.8 | ) | (20.4 | ) | ||
| Percentage of Group Scheme liabilities | 9% | -36% | -25% | ||||
(1) excludes existing SSAP 24 pension fund prepayment of £19.1 million (2002: £19.1 million), and the related deferred tax liability of £5.7 million (2002: £5.7 million).
Signet Group plc 75
Notes to the accounts (continued)
The Company did not contribute to the Group Scheme during the year.The Company’s contributions will be assessed at the actuarial valuation as at 5 April 2003.
23 CommitmentsThe Group occupies certain properties and holds plant, machinery and vehicles under operating leases.The property leases usually include renewal options and escalation clauses and in the US generally provide for contingent rentals based on a percentage of lease defined revenues.
The minimum payments in respect of operating leases for the 52 weeks to 3129 January 20042005 to which the Group was committed as at 1 February 200331 January 2004 were as follows:
Plant, machinery & vehicles | Leasehold premises | Total | |||||||
£m | £m | £m | |||||||
| Operating leases which expire: | |||||||||
| Within one year | 0.2 | 5.5 | 5.7 | ||||||
| In the second to fifth years | 2.0 | 25.2 | 27.2 | ||||||
| Over five years | – | 86.3 | 86.3 | ||||||
| At 1 February 2003 | 2.2 | 117.0 | 119.2 | ||||||
| At 2 February 2002 | 2.3 | 120.9 | 123.2 | ||||||
76 Signet Group plc
| Plant, | ||||||||
| machinery | Leasehold | |||||||
| & vehicles | premises | Total | ||||||
| £m | £m | £m | ||||||
| Operating leases which expire: | ||||||||
| Within one year | 0.3 | 4.9 | 5.2 | |||||
| In the second to fifth years | 1.9 | 25.7 | 27.6 | |||||
| Over five years | – | 87.6 | 87.6 | |||||
| At 31 January 2004 | 2.2 | 118.2 | 120.4 | |||||
| At 1 February 2003 | 2.2 | 117.0 | 119.2 | |||||
The future minimum payments for operating leases having initial or non-cancellable terms in excess of one year are as follows:
£m | £m | |||||
| Period ending on or about 31 January: | ||||||
| 2004 | 119.2 | |||||
| 2005 | 112.7 | 120.4 | ||||
| 2006 | 106.4 | 114.9 | ||||
| 2007 | 101.6 | 110.0 | ||||
| 2008 | 95.4 | 104.2 | ||||
| 2009 | 99.0 | |||||
| Thereafter | 564.6 | 563.9 | ||||
| 1,099.9 | 1,112.4 | |||||
Capital commitments at 1 February 200331 January 2004 for which no provision has been made in these consolidated accounts were as follows:
2003 | 2002 | |||||
£m | £m | |||||
| Contracted | 9.8 | 14.3 | ||||
| 2004 | 2003 | |||
| £m | £m | |||
| Contracted | 16.8 | 9.8 | ||
24 Contingent liabilitiesThe Group is not party to any legal proceedings considered to be material to profit, financial position or cash flow including any bankruptcy, receivership or similar proceedings involving the Group or any of its significant subsidiaries. No director, officer or affiliate of the Group or any associate of any such director, officer or affiliate has been a party adverse to the Group or any of its subsidiaries or has a material interest adverse to the Group or any of its subsidiaries.
The Group has assigned or sub-let UK property leases in the normal course of business. Should the assignees or sub-tenants fail to fulfil any obligations in respect of these leases, the Group may be liable for those defaults.The number of such claims arising to date has been small, and the liability, which is charged to the profit and loss account as it arises, has not been material.
The Group’s US operation gives its customers the option of purchasing a lifetime service plan on most of the products sold. Such service plans cover the costs of repair, subject to certain terms and conditions. An accrual has been made to cover the cost of future expected claims under plans sold up to the balance sheet date.
| 25 Notes to the consolidated cash flow statement | |||||||||
| (a) Reconciliation of operating profit to operating cash flows | |||||||||
2003 | 2002 | 2001 | |||||||
£m | £m | £m | |||||||
| Operating profit | 216.2 | 200.7 | 178.7 | ||||||
| Depreciation and amortisation charges | 37.8 | 34.7 | 30.6 | ||||||
| Profit on sale of fixed assets | – | – | (1.4 | ) | |||||
| Increase in stocks(1) | (44.9 | ) | (30.0 | ) | (81.7 | ) | |||
| Increase in debtors(1) | (26.5 | ) | (2.2 | ) | (22.5 | ) | |||
| (Decrease)/increase in creditors(1) | (0.9 | ) | (15.1 | ) | 29.8 | ||||
| Increase/(decrease) in other provisions(1) | 0.5 | (0.1 | ) | (1.4 | ) | ||||
| Net cash inflow from operating activities | 182.2 | 188.0 | 132.1 | ||||||
(1) The change in each year is stated after eliminating the impact of foreign exchange translation between opening and closing balance sheet dates.
Signet Group plc 77
| 82 | Signet Group plc Annual Report & Accounts year ended 31 January 2004 |
| Contingent liabilities | |
| The Group is not party to any legal proceedings considered to be material to profit, financial position or cash flow including any bankruptcy, receivership or similar proceedings involving the Group or any of its significant subsidiaries. No director, officer or affiliate of the Group or any associate of any such director, officer or affiliate has been a party adverse to the | |
| The Group has assigned or sub-let UK property leases in the normal course of business. Should the assignees or sub-tenants fail to fulfil any obligations in respect of these leases, the Group may be liable for those defaults. The number of such claims arising to date has been small, and the liability, which is charged to the profit and loss account as it arises, has not been material. | |
| The Group’s US operation gives its customers the option of purchasing a lifetime service plan on most of the products sold. Such service plans cover the costs of repair, subject to certain terms and conditions. An accrual has been made to cover the cost of future expected claims under plans sold up to the balance sheet date. | |
| 25. | |
Notes to the | |
| (a) | Reconciliation of operating profit to operating cash flows |
| (b) Analysis of net debt | |||||||||||||||
| At 2 February 2002 | Cash flow | Exchange movement | Other movements | At 1 February 2003 | |||||||||||
| £m | £m | £m | £m | £m | |||||||||||
| Cash at bank and in hand | 0.6 | – | – | – | 0.6 | ||||||||||
| Bank overdrafts | (38.8 | ) | (8.3 | ) | 4.2 | – | (42.9 | ) | |||||||
| (38.2 | ) | (8.3 | ) | 4.2 | – | (42.3 | ) | ||||||||
| Debt due after more than one year | (215.3 | ) | – | 28.9 | 12.4 | (174.0 | ) | ||||||||
| Debt due within one year | (14.1 | ) | 12.1 | 2.0 | (12.4 | ) | (12.4 | ) | |||||||
| Bank deposits | 65.9 | 29.9 | (7.2 | ) | – | 88.6 | |||||||||
| (163.5 | ) | 42.0 | 23.7 | – | (97.8 | ) | |||||||||
| Total | (201.7 | ) | 33.7 | 27.9 | – | (140.1 | ) | ||||||||
| 2004 | 2003 | (1) | 2002 | (1) | ||
| £m | £m | £m | ||||
| Operating profit | 222.3 | 213.9 | 198.8 | |||
| Depreciation and amortisation charges | 40.4 | 37.8 | 34.7 | |||
| Increase in stocks(2) | (44.9 | ) | (44.9 | ) | (30.0 | ) |
| Increase in debtors(2) | (31.1 | ) | (26.5 | ) | (2.2 | ) |
| Increase/(decrease) in creditors(2) | 18.2 | 1.4 | (13.2 | ) | ||
| (Decrease)/increase in other provisions(2) | (1.1 | ) | 0.5 | (0.1 | ) | |
| Net cash inflow from operating activities | 203.8 | 182.2 | 188.0 | |||
| (1) | Restated for the implementation of FRS 17 – ‘Retirement Benefits’ (see note 17). |
| (2) | The change in each year is stated after eliminating the impact of foreign exchange translation between opening and closing balance sheet dates. |
| (b) | Analysis of net debt |
| At | At | |||||||||
| 1 February | Cash | Exchange | Other | 31 January | ||||||
| 2003 | flow | movement | movements | 2004 | ||||||
| £m | £m | £m | £m | £m | ||||||
| Cash at bank and in hand | 0.6 | – | – | – | 0.6 | |||||
| Bank overdrafts | (42.9 | ) | (11.8 | ) | 3.6 | – | (51.1 | ) | ||
| (42.3 | ) | (11.8 | ) | 3.6 | – | (50.5 | ) | |||
| Debt due after more than one year | (174.0 | ) | – | 17.2 | 10.6 | (146.2 | ) | |||
| Debt due within one year | (12.4 | ) | 12.1 | 0.3 | (10.6 | ) | (10.6 | ) | ||
| Bank deposits | 88.6 | 42.4 | (3.6 | ) | – | 127.4 | ||||
| (97.8 | ) | 54.5 | 13.9 | – | (29.4 | ) | ||||
| Total | (140.1 | ) | 42.7 | 17.5 | – | (79.9 | ) | |||
| Signet Group plc Annual Report & Accounts year ended 31 January 2004 | 83 |
26 Financial instrumentsThe Group enters into various interest rate protection agreements, particularly interest rate caps and floors, in orderBack to limitContents
Notes to the impact of movements in interest rates on its borrowings. It is the policy of the Group to enter into interest rate protection agreements on at least 75% of its forecast US dollar borrowings.The Group does not hold or issue derivative financial instruments for trading purposes. Details of borrowings are shown in note 16 on page 69.accounts (continued)
The Group also enters into the forward purchase of foreign currencies, principally the US dollar and the Euro, in order to limit the impact of movements in foreign exchange rates on its forecast foreign currency purchases. It is the policy of the Group to ensure that identified foreign currency exposures are hedged to at least the following levels:
100% – for exposures of less than three months;
75% – for exposures of between three and six months; and
50% – for exposures of between six and 12 months.
The weighted average interest rate of the fixed rate financial liabilities is 5.79%. The weighted average period for which interest rates on the fixed rate financial liabilities are fixed is 41 months. There are no interest-free financial liabilities.
| 26. | Financial instruments | |
| The Group may enter into various interest rate protection agreements, particularly interest rate caps and floors, in order to limit the impact of movements in interest rates on its borrowings. It is the policy of the Group to enter into interest rate protection agreements on at least 75% of its forecast US dollar borrowings. The Group does not hold or issue derivative financial instruments for the purpose of trading those instruments. Details of borrowings are shown in note 16 on page 73. | ||
| The weighted average interest rate of the fixed rate financial liabilities is 5.66%. The weighted average period for which interest rates on the fixed rate financial liabilities are fixed is 30 months. There are no interest-free financial liabilities. | ||
| The Group also enters into the forward purchase of foreign currencies, principally the US dollar and the Euro, in order to limit the impact of movements in foreign exchange rates on its forecast foreign currency purchases. It is the policy of the Group to ensure that identified foreign currency exposures are hedged to at least the following levels: | ||
| 100% | – | for exposures of less than three months; |
| 75% | – | for exposures of between three and six months; and |
| 50% | – | for exposures of between six and 12 months. |
Fair value of financial instruments
These financial instruments involve varying degrees of off-balance sheet market risk whereby changes in interest rates, foreign currency exchange rates or market values of the underlying financial instruments may result in changes in the value of the financial instrument.Theinstrument. The Group is exposed to credit-related losses in the event of non-performance by counterparties to financial instruments. It is the policy of the Group only to transact such financial instruments with financial institutions rated ‘A’ or higher, to ensure that the potential for credit-related losses is minimised. Concentrations of credit risk exist due to the Group operating customer receivables programmes in the US as part of its trading strategy. Fair value estimates are made at a specific point in time, based on relevant market information and information about the financial instrument.Theseinstrument. These estimates are subjective in nature and involve uncertainties and matters of significant judgement, and therefore cannot be determined precisely. Changes in assumptions could significantly affect the estimates.Theestimates. The following methods and assumptions were used to estimate the fair value of each class of financial instrument for which it is practicable to estimate that value:
78 Signet Group plc
Back to Contentsvalue.
Forward purchases of foreign currencies and commodities
The fair value of outstanding forward purchases of foreign currencies was estimated to be a liability of £1,367,000£2.9 million at 131 January 2004 (1 February 2003 (2 February 2002: £13,000 asset).The2003: £1.4 million liability). The net carrying amount of these forward purchases at 1 February 200331 January 2004 was £nil (2(1 February 2002:2003: £nil). The fair value of outstanding forward purchases of commodities was estimated to be a liability of £2.1 million on 31 January 2004 (1 February 2003: £nil). The net carrying amount of these forward purchases at 31 January 2004 was £nil (1 February 2003: £nil). Fair values are calculated with reference to the contracted commodity prices or foreign currency exchange rates and those prevailing at the balance sheet date.
Cash at bank and in hand, and trade accounts payable
The carrying amount is considered to approximate to fair value because of the short maturity of these instruments.
Accounts receivable
Accounts receivable primarily represent credit card receivables.Thereceivables. The carrying value of credit card receivables is considered to approximate to fair value because of their short-term nature and the interest rates being used approximating current market origination rates. Other accounts receivables’ carrying amounts are considered to approximate to fair value because of the short maturity of these instruments.
Debt
The fair value of the Group’s debt is considered to approximate to carrying value at 1 February 200331 January 2004 since the rates associated with the debt at that time are consistent with the facilities agreements entered into in August 2001 and January 2002.The2002. The rates in the facilities agreements are deemed to be current market rates.
| 84 | Signet Group plc Annual Report & Accounts year ended 31 January 2004 |
Currency profile
The Group’s net debt includes the following balances denominated in foreign currency:
2003 | 2002 | |||||||||
| 2004 | 2003 | |||||||||
£m | £m | £m | ||||||||
| US dollars – cash | 43.4 | 40.2 | 67.4 | 43.4 | ||||||
| US dollars – debt | (219.9 | ) | (234.6 | ) | (192.9 | ) | (219.9 | ) | ||
Interest rate protection agreements
No interest rate protection agreements were in place at 1 February 200331 January 2004 because more than 75% of the Group’s forecast US dollar borrowings were covered by Fixed Interest Rate Agreements.
At 2 February 2002 the Group was a party to the following interestfixed rate protection agreements:borrowings.
At 31 January 2004 options in respect of 44,717,684 shares were outstanding (including 15,072,944 for directors and officers of the Group) under the Company’s executive share option schemes and sharesave schemes as follows: | ||||||
Signet Group plc 79
27 Share optionsAt 1 February 2003 options in respect of 43,916,620 shares were outstanding (including 14,211,680 for directors and officers of the Group) under the Company’s executive share option schemes and sharesave schemes as follows:
| Number | |||||||||
| Date granted | Number of shares | Exercise price per share | of shares | Exercise price | |||||
| October 1997 | 1,414,814 | 33.75p | 1,266,666 | 33.75 | p | ||||
| October 1997 | 689,762 | $0.55 | 83,598 | $0.55 | |||||
| April 1998 | 2,611,332 | 43.25p | 2,518,846 | 43.25 | p | ||||
| April 1998 | 3,513,207 | $0.72 | 429,924 | $0.72 | |||||
| April 1999 | 2,864,024 | 49.75p | 2,502,214 | 49.75 | p | ||||
| April 1999 | 4,007,201 | $0.80 | 1,610,223 | $0.80 | |||||
| December 1999(1) | 310,435 | 40.00p | |||||||
| December 1999(1) | 5,468 | 40.00p | |||||||
| May 2000 | 2,605,600 | 57.00p | 1,551,597 | 57.00 | p | ||||
| May 2000 | 5,636,057 | $0.87 | 3,091,465 | $0.87 | |||||
| October 2000(1) | 92,100 | $0.64 | |||||||
| November 2000(1) | 1,074,723 | 42.00p | 206,642 | 42.00 | p | ||||
| November 2000(1) | 4,085 | 42.00p | 4,085 | 42.00 | p | ||||
| May 2001 | 1,888,520 | 75.25p | 1,835,366 | 75.25 | p | ||||
| May 2001 | 3,765,969 | $1.08 | 3,699,180 | $1.08 | |||||
| October 2001 | 248,000 | 62.50p | 248,000 | 62.50 | p | ||||
| November 2001(1) | 816,510 | $0.77 | 85,110 | $0.77 | |||||
| November 2001(1) | 2,340,420 | 50.00p | 2,114,016 | 50.00 | p | ||||
| November 2001(1) | 12,723 | 50.00p | 12,723 | 50.00 | p | ||||
| April 2002 | 1,838,923 | 120.00p | 1,784,760 | 120.00 | p | ||||
| April 2002 | 4,454,980 | $1.72 | 4,413,193 | $1.72 | |||||
| November 2002(1) | 843,270 | $1.10 | 746,460 | $1.10 | |||||
| November 2002(1) | 2,852,774 | 67.00p | 2,559,685 | 67.00 | p | ||||
| November 2002(1) | 25,723 | 67.00p | 25,723 | 67.00 | p | ||||
| April 2003 | 2,826,377 | 82.25 | p | ||||||
| April 2003 | 4,626,082 | $1.30 | |||||||
| July 2003 | 397,435 | 97.50 | p | ||||||
| July 2003 | 4,059,156 | $1.59 | |||||||
| November 2003(1) | 778,320 | $1.60 | |||||||
| November 2003(1) | 1,226,802 | 90.00 | p | ||||||
| November 2003(1) | 14,036 | 90.00 | p | ||||||
| 43,916,620 | 44,717,684 | ||||||||
| (1) | The Company has taken advantage of the exception currently permitted under |
| Signet Group plc Annual Report & Accounts year ended 31 January 2004 | 85 |
Notes to the accounts (continued)
The Company’s share option schemes comprise a UKfour executive share option schemeschemes (the “1993 Scheme”), athe “2003 Approved Plan”, the “2003 International Plan” and the “2003 US Plan”, together the “Executive Schemes”) and three all-employee share option schemes (a savings related share option scheme for the UK employees (the “Sharesave Scheme”), a US Section 423 Plan (the “Employee Stock Savings Plan”) and a savings related share option scheme for employees in the Republic of Ireland (the “Irish Sharesave Scheme”), together the “Sharesave Schemes”).
Options granted under the 1993 SchemeExecutive Schemes are generally only exercisable between three and ten years from the date of grant. Performance conditions wereare attached to all the executive options granted under the Executive Schemes. No further options may be granted under the 1993 Scheme.
Options granted under the Sharesave Scheme and the Irish Sharesave Scheme are generally only exercisable between 36 and 42 months of the commencement of the relevant savings contract. Options granted under the Employee Stock Savings Plan are generally only exercisable between 24 and 27 months of the grant date.
The Executive Schemes and Sharesave Schemes may be operated in conjunction with one or more employee share ownership trusts (the “ESOT” or “QUEST”) which may acquire shares in the Company for the purposes of satisfying the exercise of options.
Executive directors and some senior executives have also been granted awards under the Signet Group plc 2000 Long Term Incentive Plan (“2000 LTIP”).The. The vesting of these awards and the extent of vesting depends on the achievement of specified performance conditions. On vesting, 50% of an award is to be made in cash and the other 50% by the grant of an option to acquire shares for a nominal amount. In the event of an award vesting the number of shares to be placed under option would be calculated by dividing 50% of the value of the vested award by the middle market share price on the London Stock Exchange on the dealing day prior to the grant of the award. As the final value of an award cannot be calculated until it vests, the total number of shares over which options might eventually be granted is at present not known and therefore not shown in the above table.
80 Signet The 2000 LTIP operates in conjunction with an employee share ownership trust which may be funded by the Group plcto acquire shares in the Company for the purposes of meeting the Company’s obligation to provide shares on the exercise of options.
Certain provisions of all the share option schemes may be amended by the Board, but certain basic provisions (and in particular most of the limitations on individual participation, the numbers of shares and the percentage of share capital that may be issued thereunder) cannot be altered to the advantage of the participants except with the approval of the shareholders of the Company or in accordance with the adjustment provisions in the schemes.
The following table summarises the status of rights granted under the Company’s share option schemes at 31 January 2004, 1 February 2003 and 2 February 2002, and 27 January 2001, and changes during the years ended on those dates. For the reason explained above the total number of shares which might be placed under option under the 2000 LTIP is not known.
| Shares | Number of shares (million) | ||||||||||||||||
| 2003 | 2002 | 2001 | 2004 | 2003 | 2002 | ||||||||||||
| million | million | million | |||||||||||||||
| Outstanding at beginning of period (at prices from 21.25p to 75.25p) | 43.0 | 59.9 | 56.5 | ||||||||||||||
| Granted at 120.00p, 67.00p, $1.72 and $1.10 (2002: 75.25p, 62.50p, 50.00p, $1.08 and $0.77) | 10.4 | 10.0 | 11.8 | ||||||||||||||
| Outstanding at beginning of period (at prices from 33.75p to 120.00p) | 43.9 | 43.0 | 59.9 | ||||||||||||||
| Granted at 82.25p, 90.00p, 97.50p, $1.31, $1.59 and $1.60 | |||||||||||||||||
| (2003: 120.00p, 67.00p, $1.72 and $1.10) | 14.0 | 10.4 | 10.0 | ||||||||||||||
| Exercised (including through QUEST and ESOT) | Exercised (including through QUEST and ESOT) | (7.7 | ) | (23.7 | ) | (5.9 | ) | (11.8 | ) | (7.7 | ) | (23.7 | ) | ||||
| Lapsed or forfeited | Lapsed or forfeited | (1.8 | ) | (3.2 | ) | (2.5 | ) | (1.4 | ) | (1.8 | ) | (3.2 | ) | ||||
| 43.9 | 43.0 | 59.9 | 44.7 | 43.9 | 43.0 | ||||||||||||
| 86 | Signet Group plc Annual Report & Accounts year ended 31 January 2004 |
Share Scheme limits
The 1993 Scheme isExecutive Schemes are subject to the following limits on the number of shares that may be issued:
| (a) | the maximum number of shares that have been or may be issued pursuant to options granted |
| (b) | the maximum number of shares that have been or may be issued pursuant to options granted under the |
| (c) | a maximum of |
In any 10ten year period not more than 10% of the issued share capital of the Company from time to time may in aggregate be issued or issuable pursuant to rights acquiredoptions granted under the Sharesave Schemes or any other employeeemployees’ share schemes adopted by the Company.
2000 LTIP limits
The 2000 LTIP operates in conjunction with an employee share ownership trust (“ESOT”) which may be funded by the Group to acquire shares in the Company for the purposes of meeting the Company’s obligation to provide shares on the exercise of a share award made under the 2000 LTIP. The number of shares which may be issued or issuable underpursuant to the 2000 LTIP or issued(including to the ESOT,ESOT), when aggregated with any shares issued or issuable by the Company in the preceding ten years under any employeeemployees’ share scheme, participation in which is at the discretion of the Board, is limited to 5% of the Company’s issued share capital from time to time. SuchThe number of shares which may be issued or issuable underpursuant to the 2000 LTIP or issued(including to the ESOT in the preceding ten years,ESOT), when aggregated with all shares issued or issuable by the Company in the preceding ten years under any other employeeemployees’ share scheme, is limited to 10% of the Company’s issued share capital from time to time.
Signet Group plc 81
Outstanding optionsCertainThe following table summarises certain information concerning options outstanding under the Company’s share option schemes as at 1 February 2003 is presented below:31 January 2004:
| Outstanding options | Weighted | ||||||||||||||||
| average | |||||||||||||||||
| Number of | Range of | exercise | Range of | ||||||||||||||
| shares issuable | exercise prices | prices | expiration | ||||||||||||||
| Number of shares issuable upon exercise | Range of exercise prices per share | Weighted average exercise prices per share | Range of Expiration dates | upon exercise | per share | per share | dates | ||||||||||
| 1993 Scheme | 35,538,389 | 33.75p-120.00p | 61.85p | 09/2007-4/2012 | 32,487,491 | 33.75p – 120.00p | 66.59 | 9/2007 – 4/2013 | |||||||||
| $0.55-$1.72 | 09/2007-4/2012 | $0.55 – $1.72 | 9/2007 – 4/2013 | ||||||||||||||
| 2003 Approved Plan | – | – | – | – | |||||||||||||
| 2003 International Plan | 397,435 | 97.50p | 97.50 | 7/2013 | |||||||||||||
| 2003 US Plan | 4,059,156 | $1.59 | $1.59 | 7/2013 | |||||||||||||
| Sharesave Scheme | 6,578,352 | 40.00p-67.00p | 55.59p | 6/2003-6/2006 | 6,107,145 | 42.00p – 90.00p | 64.89 | 6/2004 – 6/2007 | |||||||||
| Employee Stock Savings Plan | 1,751,880 | $0.64-$1.10 | $0.92 | 1/2003-1/2005 | 1,609,890 | $0.77 – $1.60 | $1.32 | 1/2003 – 1/2006 | |||||||||
| Irish Sharesave Scheme | 47,999 | 40.00p-67.00p | 57.29p | 6/2003-6/2006 | 56,567 | 42.00p – 90.00p | 67.08 | 6/2004 – 6/2007 | |||||||||
Signet Group plc Annual Report & Accounts year ended 31 January 2004 | 87 |
Notes to the accounts (continued)
Fixed share option schemes
The Company has three fixed option schemes, which are the Sharesave Schemes.
A summary of the status of the Company’s fixed share option schemes at 31 January 2004, 1 February 2003 and 2 February 2002 and 27 January 2001 and changes during the years ended on those dates is presented below:
| 1 February 2003 | 2 February 2002 | 27 January 2001 | 31 January 2004 | 1 February 2003 | 2 February 2002 | ||||||||||||||||||||||||
Fixed options | Number of shares | Weighted average exercise price | Weighted | Weighted | |||||||||||||||||||||||||
| average | |||||||||||||||||||||||||||||
| Number | exercise | Number | exercise | ||||||||||||||||||||||||||
| Number of shares | Weighted average exercise price | Number of shares | Weighted | Number of shares | Weighted average exercise price | of shares | price | of shares | price | ||||||||||||||||||||
| million | pence | million | pence | million | pence | million | pence | million | pence | million | pence | ||||||||||||||||||
| Outstanding at beginning of period | 8.0 | 44 | 12.5 | 32 | 12.5 | 28 | 8.4 | 56 | 8.0 | 44 | 12.5 | 32 | |||||||||||||||||
| Granted | 3.8 | 67 | 3.5 | 51 | 2.6 | 43 | 2.0 | 89 | 3.8 | 67 | 3.5 | 51 | |||||||||||||||||
| Exercised | (2.6 | ) | 36 | (6.2 | ) | 24 | (1.3 | ) | 26 | (1.8 | ) | 41 | (2.6 | ) | 36 | (6.2 | ) | 24 | |||||||||||
| Lapsed | – | – | (0.3 | ) | 97 | – | – | – | – | – | – | (0.3 | ) | 97 | |||||||||||||||
| Forfeited | (0.8 | ) | 42 | (1.5 | ) | 33 | (1.3 | ) | 30 | (0.8 | ) | 57 | (0.8 | ) | 42 | (1.5 | ) | 33 | |||||||||||
| Outstanding at end of period | 8.4 | 56 | 8.0 | 44 | 12.5 | 32 | 7.8 | 67 | 8.4 | 56 | 8.0 | 44 | |||||||||||||||||
| Options exercisable at end of period | 0.4 | 40 | 0.6 | 21 | 0.5 | 70 | 0.2 | 42 | 0.4 | 40 | 0.6 | 21 | |||||||||||||||||
The following table summarises the information about fixed stock options outstanding at 1 February 2003:31 January 2004:
| Range of exercise prices | Weighted | ||||||||||||
| average | Weighted | ||||||||||||
| remaining | average | ||||||||||||
| Number | contractual | exercise | |||||||||||
| Number of shares | Weighted average remaining contractual life | Weighted average exercise price | of shares | life | price | ||||||||
| million | years | pence | million | years | pence | ||||||||
| 1p to 45p | 1.5 | 1.6 | 41 | 0.3 | 0.2 | 42 | |||||||
| 46p to 70p | 6.9 | 2.6 | 59 | ||||||||||
| 46p to 90p | 7.5 | 1.8 | 68 | ||||||||||
| 1p to 70p | 8.4 | 2.4 | 56 | ||||||||||
| 1p to 90p | 7.8 | 1.7 | 67 | ||||||||||
82 Signet Group plc
| 88 | Signet Group plc Annual Report & Accounts year ended 31 January 2004 |
Performance-based share option schemes
In addition to the 2000 LTIP, the Company has onefour performance-based share option scheme – the 1993 Scheme.schemes (the Executive Schemes).
A summary of the status of the Company’s performance based shareshares options at 31 January 2004, 1 February 2003 and 2 February 2002 and 27 January 2001 and changes during the years ended on those dates is presented below:
| 31 January 2004 | 1 February 2003 | 2 February 2002 | |||||||||||||||||||||||||||
| Weighted | Weighted | Weighted | |||||||||||||||||||||||||||
| 1 February 2003 | 2 February 2002 | 27 January 2001 | average | average | |||||||||||||||||||||||||
| Number | exercise | Number | exercise | Number | exercise | ||||||||||||||||||||||||
| Performance-based options | Number of shares |
| Weighted average exercise price | Number of shares | Weighted average exercise price | Number of shares | Weighted | of shares | price | of shares | price | of shares | price | ||||||||||||||||
| million | pence | million | pence | million | pence | million | pence | million | pence | million | pence | ||||||||||||||||||
| Outstanding at beginning of period | 35.0 | 56 | 47.4 | 46 | 43.9 | 40 | 35.5 | 62 | 35.0 | 56 | 47.4 | 46 | |||||||||||||||||
| Granted | 6.6 | 110 | 6.5 | 75 | 9.2 | 59 | 12.0 | 80 | 6.6 | 110 | 6.5 | 75 | |||||||||||||||||
| Exercised | (5.1 | ) | 45 | (17.5 | ) | 39 | (4.5 | ) | 36 | (10.0 | ) | 44 | (5.1 | ) | 45 | (17.5 | ) | 39 | |||||||||||
| Lapsed | – | – | – | – | – | – | – | – | – | – | – | – | |||||||||||||||||
| Forfeited | (1.0 | ) | 87 | (1.4 | ) | 54 | (1.2 | ) | 49 | (0.6 | ) | 65 | (1.0 | ) | 87 | (1.4 | ) | 54 | |||||||||||
| Outstanding at end of period | 35.5 | 62 | 35.0 | 56 | 47.4 | 46 | 36.9 | 69 | 35.5 | 62 | 35.0 | 56 | |||||||||||||||||
| Options exercisable at end of period | 15.1 | 45 | 10.2 | 44 | 16.1 | 35 | 13.1 | 46 | 15.1 | 45 | 10.2 | 44 | |||||||||||||||||
The following table summarises the information about performance-based share options outstanding at 1 February 2003:31 January 2004:
| Range of exercise prices | Number of shares | Weighted average remaining contractual life | Weighted average exercise price | ||||
| million | years | pence | |||||
| 1p to 60p | 23.3 | 6.2 | 47 | ||||
| 61p to 120p | 12.2 | 8.8 | 89 | ||||
| 1p to 120p | 35.5 | 7.1 | 62 | ||||
Signet Group plc 83
| Weighted | ||||||
| average | Weighted | |||||
| remaining | average | |||||
| Number | contractual | exercise | ||||
| Range of exercise prices | of shares | life | price | |||
| million | years | pence | ||||
| 1p to 60p | 16.7 | 5.7 | 49 | |||
| 61p to 120p | 20.2 | 8.8 | 86 | |||
| 1p to 120p | 36.9 | 7.4 | 69 | |||
| Signet Group plc Annual Report & Accounts year ended 31 January 2004 |
Notes to the accounts (continued)
28. Principal subsidiary undertakings
| Share capital | |||
issued and | |||
fully paid | |||
| £m | |||
| Retail jewellers | |||
| Ernest Jones Limited | 70.8 | ||
| H.Samuel Limited | 23.3 | ||
| Leslie Davis Limited | 14.5 | ||
| Signet Trading Limited | 162.1 | ||
| Sterling | – | ||
| Sterling Jewelers | – | ||
| Sterling Jewelers LLC (US) | – | ||
| Intermediate holding companies | |||
| Signet Holdings Limited | 656.5 | ||
| Signet US Holdings, | 0.5 | ||
| Property holding company | |||
| Checkbury Limited(1) | 16.4 | ||
| (1) | Holds only UK freehold and long leasehold retail and warehouse premises. |
| All these companies are wholly owned subsidiary undertakings and are included in the consolidation. | |
| The information given in this note is only with respect to such undertakings as are described in section 231(5) of the Companies Act 1985. Unless otherwise stated, all companies are domiciled in the UK. | |
(1) Holds only Group UK freehold and long leasehold retail and warehouse premises.
All these companies are wholly owned subsidiary undertakings and are included in the consolidation.The information given in this note is only with respect to such undertakings as are described in section 231(5) of the Companies Act 1985.Unless otherwise stated, all companies are domiciled in the UK.
2929. Related party transactions
There are no related party transactions which require disclosure in these accounts.
84 Signet Group plc
| 90 | Signet Group plc Annual Report & Accounts year ended 31 January 2004 |
30 30. Company balance sheet
(a) Profit for the financial period
The profit attributable to shareholders dealt with in the accounts of the Company is £127.1 million (2003: £37.3 million (2002:million; 2002: £29.4 million; 2001: £34.7 million).The. The profit is stated after foreign exchange lossesgains of £1.7£3.9 million, net of tax, (2002:(2003: £1.7 million losses; 2002: £1.1 million gains; 2001: £3.0 million gains) attributable to intra-Group dollar balances..
| (b) Tangible fixed assets | |||||||||||||
| Short leasehold land and buildings | Plant, machinery and vehicles | Shopfront, fixtures and fittings | Total | ||||||||||
| £m | £m | £m | £m | ||||||||||
| Cost: | |||||||||||||
| At 2 February 2002 | 4.5 | 14.4 | 78.3 | 97.2 | |||||||||
| Additions | 0.3 | 2.4 | 13.2 | 15.9 | |||||||||
| Disposals | (0.3 | ) | (0.1 | ) | (1.0 | ) | (1.4 | ) | |||||
| At 1 February 2003 | 4.5 | 16.7 | 90.5 | 111.7 | |||||||||
| Depreciation and amortisation: | |||||||||||||
| At 2 February 2002 | 1.8 | 7.5 | 40.1 | 49.4 | |||||||||
| Charged in period | 0.2 | 2.8 | 9.0 | 12.0 | |||||||||
| Disposals | (0.2 | ) | (0.1 | ) | (0.7 | ) | (1.0 | ) | |||||
| At 1 February 2003 | 1.8 | 10.2 | 48.4 | 60.4 | |||||||||
| Net book value: | |||||||||||||
| At 1 February 2003 | 2.7 | 6.5 | 42.1 | 51.3 | |||||||||
| At 2 February 2002 | 2.7 | 6.9 | 38.2 | 47.8 | |||||||||
| (c) Debtors | 2003 |
| 2002 |
| |||
| £m | £m | ||||||
| Debtors recoverable within one year – amounts owed by subsidiary undertakings | 231.7 | 198.3 | |||||
| Debtors recoverable after more than one year – deferred taxation | 1.5 | – | |||||
| Total debtors | 233.2 | 198.3 | |||||
| (d) Cash at bank and in hand | |||||||
| 2003 | 2002 | ||||||
| £m | £m | ||||||
| Bank deposits | 45.0 | 9.2 | |||||
Signet Group plc 85(b) Tangible fixed assets
| Short | |||||||||||
| leasehold | Plant, | Shopfront, | |||||||||
| land and | machinery | fixtures and | |||||||||
| buildings | and vehicles | fittings | Total | ||||||||
| £m | £m | £m | £m | ||||||||
| Cost: | |||||||||||
| At 1 February 2003 | 4.5 | 16.7 | 90.5 | 111.7 | |||||||
| Additions | 0.3 | 3.0 | 14.4 | 17.7 | |||||||
| Disposals | (0.5 | ) | (0.2 | ) | (2.0 | ) | (2.7 | ) | |||
| At 31 January 2004 | 4.3 | 19.5 | 102.9 | 126.7 | |||||||
| Depreciation: | |||||||||||
| At 1 February 2003 | 1.8 | 10.2 | 48.4 | 60.4 | |||||||
| Charged in period | 0.3 | 3.1 | 11.7 | 15.1 | |||||||
| Disposals | (0.5 | ) | (0.1 | ) | (2.1 | ) | (2.7 | ) | |||
| At 31 January 2004 | 1.6 | 13.2 | 58.0 | 72.8 | |||||||
| Net book value: | |||||||||||
| At 31 January 2004 | 2.7 | 6.3 | 44.9 | 53.9 | |||||||
| At 1 February 2003 | 2.7 | 6.5 | 42.1 | 51.3 | |||||||
| (c) Debtors | |||||
| 2004 | 2003 | ||||
| £m | £m | ||||
| Debtors recoverable within one year – amounts owed by subsidiary undertakings | 372.6 | 231.7 | |||
| Debtors recoverable within one year – corporation tax recoverable | 0.5 | – | |||
| Debtors recoverable after more than one year – deferred taxation | 2.2 | 1.5 | |||
| 375.3 | 233.2 | ||||
| (d) Cash at bank and in hand | |||||
| 2004 | 2003 | ||||
| £m | £m | ||||
| Bank deposits | 98.3 | 45.0 | |||
| Signet Group plc Annual Report & Accounts year ended 31 January 2004 | 91 |
| (e) Creditors: amounts falling due within one year | ||||||
| 2003 | 2002 | |||||
| £m | £m | |||||
| Bank overdrafts | 11.6 | 2.3 | ||||
| Loan notes | 9.1 | 10.6 | ||||
| Amounts owed to subsidiary undertakings | 401.1 | 337.9 | ||||
| Corporation tax | 3.1 | 3.1 | ||||
| Accruals and deferred income | 0.4 | 1.1 | ||||
| Proposed dividend | 30.8 | 25.6 | ||||
| 456.1 | 380.6 | |||||
Notes to the accounts (continued)
| (e) Creditors: amounts falling due within one year | |||||
| 2004 | 2003 | ||||
| £m | £m | ||||
| Bank overdrafts | 1.6 | 11.6 | |||
| Loan notes | 8.2 | 9.1 | |||
| Amounts owed to subsidiary undertakings | 485.3 | 401.1 | |||
| Corporation tax | 3.1 | 3.1 | |||
| Accruals and deferred income | 1.3 | 0.4 | |||
| Proposed dividend | 37.3 | 30.8 | |||
| 536.8 | 456.1 | ||||
The number of days’ purchases outstanding at 1 February 200331 January 2004 was nil.
| (f) | Creditors: amounts falling due after more than one year | |||||||
| 2003 | 2002 | |||||||
| £m | £m | |||||||
| Loan notes falling due between one and two years | 9.1 | 10.6 | ||||||
| Loan notes falling due between two and five years | 9.2 | 21.1 | ||||||
| 18.3 | 31.7 | |||||||
| Details of loan notes are shown in note 16 on page 69. | ||||||||
| (g) Reserves | |||||||||
| Share | |||||||||
| premium | Special | Profit and | |||||||
| account | reserves | loss account | |||||||
| £m | £m | £m | |||||||
| At 2 February 2002 | 48.3 | 565.1 | 29.7 | ||||||
| Retained profit attributable to equity shareholders | – | – | 1.1 | ||||||
| Shares issued to QUEST/ESOT | 1.9 | – | – | ||||||
| Exercise of share options | 3.7 | – | – | ||||||
| Redemption of deferred share capital | – | – | 0.1 | ||||||
| At 1 February 2003 | 53.9 | 565.1 | 30.9 | ||||||
| (f) Creditors: amounts falling due after more than one year | |||||
| 2004 | 2003 | ||||
| £m | £m | ||||
| Loan notes falling due between one and two years | 8.3 | 9.1 | |||
| Loan notes falling due between two and five years | – | 9.2 | |||
| 8.3 | 18.3 | ||||
Details of loan notes are shown in note 16 on page 73.
| (g) Reserves | ||||||||
| Share | ||||||||
| premium | Special | Profit and | ||||||
| account | reserves | loss account | ||||||
| At 1 February 2003 | 53.9 | 565.1 | 30.9 | |||||
| Retained profit attributable to equity shareholders | – | – | 83.9 | |||||
| Shares issued to QUEST/ESOT | 1.8 | – | – | |||||
| Exercise of share options | 5.0 | – | – | |||||
| At 31 January 2004 | 60.7 | 565.1 | 114.8 | |||||
| 92 | Signet Group plc Annual Report & Accounts year ended 31 January 2004 |
(h) Commitments
The Company does not occupy any property or hold any plant, machinery and vehicles under operating leases.
Capital commitments at 1 February 200331 January 2004 for which no provision has been made in these consolidated accounts were as follows:
| 2003 | 2002 | |||||
| £m | £m | |||||
| Contracted | 1.5 | 2.8 | ||||
86 Signet Group plc
| 2004 | 2003 | ||||
| £m | £m | ||||
| Contracted | 5.4 | 1.5 | |||
(i) Contingent liabilities
The Company is not party to any legal proceedings considered to be material to its profit, financial position or cash flow including any bankruptcy, receivership or similar proceedings involving the Company or any of its significant subsidiaries. No director, officer or affiliate of the Company or any associate of any such director, officer or affiliate has been a party adverse to the Company or any of its subsidiaries or has a material interest adverse to the Company or any of its subsidiaries.
The Company has assigned or sub-let UK property leases in the normal course of business. Should the assignees or sub-tenants fail to fulfil any obligations in respect of these leases, the Company may be liable for those defaults.Thedefaults. The number of such claims arising to date has been small, and the liability, which is charged to the profit and loss account as it arises, has not been material.
(j) Investments
Principal subsidiaries are shown in note 28 on page 90.
The Group’s consolidated accounts are prepared in accordance with generally accepted accounting principles in the United Kingdom In accordance with best practice the differences have been shown as gross of tax with the related taxation shown separately. Cost of sales Goodwill Under US GAAP, prior to the issue of Statement of Financial Accounting Standards (“ Additionally, UK GAAP requires that on subsequent disposal or closure of a previously acquired subsidiary, any goodwill previously taken directly to shareholders’ funds is then charged to the profit and loss account as part of profit or loss on disposal or closure. Under US GAAP the appropriate balance to be written off on the disposal of the business is the remaining unamortised balance for goodwill. For the purposes of calculating the effect of capitalising the goodwill on the consolidated balance sheet and its amortisation through the consolidated profit and loss account, a life of 20 years has been assumed. However, the value of the goodwill is reviewed periodically by comparing the undiscounted cash flows from operating activities with the carrying value of goodwill. An additional charge to the consolidated profit and loss account is made where a permanent diminution in net book value is identified. In the Group’s consolidated balance sheet, goodwill written off on the acquisition of Sterling Jewelers has been calculated based upon consideration valued at $17.00 per share of the US convertible preference shares issued to the shareholders of Sterling Jewelers. Under US GAAP, as the fair value of the consideration received by the shareholders is more clearly evident than the fair value of the consideration given, the former is used for determining fair In the years ended 31 January 2004, 1 February 2003 and 2 February 2002,
At Sale and leaseback transactions
Extended service plans
Pensions
FRS 17 – ‘Retirement Benefits’ Under US GAAP, the Additional disclosures are now required under FAS 132 and included on pages 100 to 102. Under US GAAP, the estimated accumulated benefit obligation of the UK defined benefit pension scheme was higher than the fair value of the assets at 1 February 2003. The difference between the two, plus the balance sheet prepayment as defined under US GAAP, is disclosed as an accrued benefit liability and written off to Other Comprehensive Income. An intangible asset is recognised on the balance sheet under US GAAP, reflecting the unrecognised prior service cost element of the prepaid pension cost. Stock compensation stated exercise price is equal to, or in excess of, the fair value of the underlying shares at the date of grant. Under US GAAP a Group can account for employee stock options in accordance with Accounting Principles Bulletin 25 The Revaluation of properties Upward revaluations are not permitted. Depreciation of properties
Securitised customer receivables
Summary of differences between UK and US generally accepted Deferred taxes Dividends Cash flows . The principal difference between the standards is in respect of classification. Under FRS 1 (Revised), the Group presents its cash flows for (a) operating activities; (b) returns on investments and servicing of finance; (c) taxation; (d) capital expenditure and financial investment; (e) management of liquid resources; and (f) financing activities. Cash flows arising from taxation and returns on investments and servicing of finance under FRS 1 (Revised) would be included as operating activities and cash flows arising from management of liquid resources would be included as cash and cash equivalents under Earnings per share/ADS (“EPS”)
| |||||||||||||||||||||||||||||||||||||||||||||||||||||||||||||||||||||||||||||||||||||||||||||||||||||||||||||||||||||||||||||||||||||||||||||||||||||||||||||||||||||||||||||||||||||||||||||||||||||||||||||||||||||||||||||||||||||||||||||||||||||||||||||||||||||||||||||||||||||||||||||||||||||||||||||||||||||||||||||||||||||||||||||||||||||||||||||||||||||||||||||||||||||||||||||||||||||||||||||||||||||||||||||||||||||||||||||||||||||||||||||||||||||||||||||||||||||||||||||||||||||||||||||||||||||||||||||||||||||||||||||||||||||||||||||||||||||||||||||||||||||||||||||||||||||||||||||||||||||||||||||||||||||||||||||||||||||||||||||||||||||||||||||||||||||||||||||||||||||||||||||||||||||||||||||||||||||||||||||||||||||||||||||||||||||||||||||||||||||||||||||||||||||||||||||||||||||||||||||||||||||||||||||||||||||||||||||||||||||||||||||||||||||||||||||||||||||||||||||||||||||||||||||||||||||||||||||||||||||||||||||||||||||||||||||||||||||||||||||||||||||||||||||||||||||||||||||||||||||||
