SECURITIES AND EXCHANGE COMMISSION
Washington, D.C. 20549
FORM 20-F
| Registration statement pursuant to Section 12(b) or (g) of the Securities Exchange Act of 1934 | |
| Annual report pursuant to Section 13 or 15(d) of the Securities Exchange Act of 1934 | |
| For the fiscal year ended January | |
| Transition report pursuant to Section 13 or 15(d) of the Securities Exchange Act of 1934 | |
For the transition period from ________ to ________.
Commission file number 0-16945
SIGNET GROUP plc
(Exact name of Registrant as specified in its charter)
ENGLAND
(Jurisdiction of incorporation or organization)
Zenith House
The Hyde
London NW9 6EWEnglandEngland
(Address of principal executive offices)
Securities registered or to be registered pursuant to Section 12(b) of the Act:None
| Title of each class | Name of each exchange on which registered |
| Ordinary Shares, nominal value £0.005 each | New York Stock Exchange* |
| American Depositary Shares, | New York Stock Exchange |
| each representing 10 ordinary shares |
| * | Not for trading, but only in connection with the registration of the ADSs pursuant to the requirements of the Securities and Exchange Commission. |
Securities registered or to be registered pursuant to Section 12(g) of the Act:American Depositary SharesOrdinary Shares of 0.5 pence each
Securities for which there is a reporting obligation pursuant to Section 15(d) of the Act:
None
Indicate the number of outstanding shares of each of the issuer’s classes of capital or common stock as of the close of the period covered by the annual report:
| Ordinary Shares of 0.5 pence each | |||
Indicate by check mark whether the registrant (1) has filed all reports required to be filed by Section 13 or 15(d) of the Securities Exchange Act of 1934 during the preceding 12 months (or for such shorter period that the registrant was required to file such reports), and (2) has been subject to such filing requirements for the past 90 days.
![]() Yes
Yes ![]()
![]() No
No ![]()
Indicate by check mark which financial statement item the registrant has elected to follow.
![]() Item 17
Item 17 ![]()
![]() Item 18
Item 18 ![]()
Explanatory Note
This document comprises the annual report on Form 20-F and the annual report to shareholders for the year ended 3129 January 20042005 of Signet Group plc (the “2003/04“2004/05 Form 20-F”). Reference is made to the Cross referenceReference to Form 20-F table beginning on page 124137 hereof (the “Cross referenceReference to Form 20-F table”Table”). Only (i) the information in this document that is referenced in the Cross referenceReference to Form 20-F table,Table, (ii) the cautionary statement concerning forward-looking statements on page 1 and (iii) the Exhibits, shall be deemed to be filed with the Securities and Exchange Commission for any purpose, including incorporation by reference into the Registration Statements on Form S-8 (No. 333-8764, 333-9634 and 333-12304) of Signet Group plc (No. 333-12304, 333-9634, 333-8764 and 033-42119), and any other documents, including documents filed by Signet Group plc pursuant to the Securities Act of 1933, as amended, which purport to incorporate by reference the 2003/042004/05 Form 20-F. Any information herein which is not referenced in the Cross referenceReference to Form 20-F table,Table, or the Exhibits themselves, shall not be deemed to be so incorporated by reference.
![]()

| 2004/05 | |||
Group highlights |
| Reported | At constant | |||||
| basis | ||||||
| exchange rates(1)(2) | ||||||
| up | ||||||
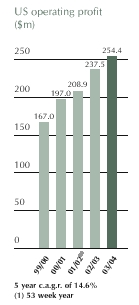
| Sales: | £1,614.4m | up 0.6%(2) | up 7.8% | |||
| Operating profit: | £218.9m | up 4.1%(2) | up 11.3% | |||
| Profit before tax: | £210.3m | up 5.3%(2) | up 12.1% | |||
| Earnings per share(3): | 8.2p | up 9.3%(2) | up 15.5% | |||
| Dividend per share: | 3.0p | up 20.0% | ||||
| 26.5% | up from 25.9%(2) | |||||
| 11.3% | down from11.8%(2) | |||||
 |  | |||||||
 |  |
 | ||||||
| (1) | See page | ||
| (2) | |||
| (3) | Earnings per share, return on capital employed and gearing are defined on page | ||
| (4) | 53 week year. | ||
| Annual Report & Accounts
Chairman’s statement Group results
The UK division also had a particularly strong first quarter but faced a softening trend in the trading environment during the rest of the
The Group continued to utilise its cash flow and strong balance sheet to invest in the growth of the business. £159.1 million was invested
Principles (“GAAP”) being replaced by International Financial Reporting Standards (“IFRS”), and both converging with US GAAP. The process this year has resulted in a restatement relating to the revenue recognition of extended service agreements in the US (see note 17, page 85) and the replacement in 2005/06 of UK GAAP by IFRS as explained in more detail in the Financial review (page 33). Dividend
People
Rob Anderson, Chief Executive of Signet’s UK division, joined the Board as an executive director in
Current trading
James McAdam
Group Chief Executive’s review Introduction
US division
New store space rose by 8% during 2004/05 further Growth in new store space and further development of the division’s competitive strengths in the critical areas of merchandising, store operations and marketing have contributed significantly to the out-performance of the business and remain key elements of future strategy. Given the continuing consolidation in the speciality jewellery sector, there should be opportunities to gain further market share both organically and, if appropriate, by acquisition. The US division is now targeting organic space growth of 7% - 9% in future years (previously 6% - 8%). UK
The Central to selling diamonds is the interaction between the customer and the salesperson. The roll-out of the new store format, which facilitates such interaction, was implemented as part of the store refurbishment cycle in 2004/05. The focus on customer service was also evident in the priority given to staff training. The significant changes taking place in the UK US
The operating margin
Group Chief Executive’s review (continued)
In the jewellery sector superior customer service and product knowledge are important competitive advantages readily identified by the consumer, and the division now has at least one certified diamontologist in every store. Also during 2004/05 all sales staff were coached using the “Ultimate Diamond Presentation” training course. Procedures for recruitment were strengthened and staff retention was also improved. The multi-year In mall stores the Strong marketing programmes again contributed to the
Kay, with a turnover of $1,155.5 million, became the number one speciality jewellery brand by sales during 2004/05 having consistently out-performed its major competitors. Over the last five years the number of Kay stores has increased by almost 200 to a total of 742 and average sales per store have grown to $1.584 million from $1.355 million. Brand name recognition has risen very significantly since the introduction of the “Every kiss begins with Kay” advertising campaign in 2000/01. It is planned to increase Kay’s representation in malls by between 20 and 30 new stores in 2005/06. In addition to mall locations, stores under the Kay brand are currently being opened in lifestyle and power strip centres. Ten such stores were opened in 2004/05 and a similar number are planned in 2005/06. In the current year it is anticipated that up to four stores will be trialled in metropolitan areas. Currently 321 mall stores trade under strong regional brand names. Sales in the year were over $450 million, reflecting average sales per store of $1.533 million. The regional stores could provide the potential to develop a second mall brand of sufficient size to justify the cost of national television advertising. This would require about 550 stores which could be achieved in the medium term by a mixture of store openings and acquisitions. In 2005/06 it is planned that 20-30 new stores will be opened under the regional brand names. Jared now has sales of just over
The change in store numbers by chain is shown in the following table:
In 2004/05 Recent investment in the store portfolio is
UK (32% of Group sales)
The division’s gross margin benefited from the effect of the lower dollar exchange rate on dollar denominated commodity costs. The operating margin at 15.2% was little changed after absorbing a restructuring charge of £1.7 million. Like for like sales were up by 1.9% in H.Samuel, while total sales were similar to last year due to nine net store closures and a significant increase in the number of temporary closures for refurbishment. H.Samuel’s sales per store increased to £0.723 million (2003/04: £0.707 million). Ernest Jones had another strong performance with like for like sales up by 4.5%, total sales increasing by 6.7% and sales per store reaching £1.150 million (2003/04: £1.101 million). Diamond jewellery assortments were enhanced during the year and continued to perform strongly, accounting for 20% of sales in H.Samuel and The outcomes. Particular benefit from improved staff training was gained in Catalogues remain the
In Recent investment in the store portfolio is set out below:
A similar pattern of store
Terry Burman
Five year financial summary
The financial data included in the Five year financial summary above has been derived, in part, from the consolidated accounts for such periods included elsewhere in this Annual Report. The financial data should be read in conjunction with the accounts, including the notes thereto, and the Financial review included on pages Further selected financial data is shown on pages
US operating review
Overview
Competitive advantages • Store operations and personnel
systems. The division now has at least one certified diamontologist in each of its stores. • Real estate • Merchandising
It is anticipated that Jared Initiatives in
US operating review (continued)
Signet’s total US dollar sales rose (excluding the acquisition of Marks & Morgan)
Management believes that the longer term outlook for jewellery sales is encouraging given the growth in disposable The US division competes on the basis of the quality of its personalised customer service, merchandise selection, availability, quality and value. Brand recognition, trust and store locations are also competitive advantages as is the ability to offer private label credit card programmes to customers. The US division holds no material patents, licenses, franchises or concessions but has a range of trading agreements with suppliers, the most important being in regard of the Leo Diamond. The established trademarks and trade names of the division are essential to maintaining its competitive position in the retail jewellery industry. The US retail jewellery industry is very competitive and highly fragmented.
retailer is believed to be Wal-Mart Stores, Inc., which includes a wide assortment of costume jewellery. Management believes that the business also competes with non-jewellery retailers for consumers’ discretionary spending. The US division’s largest speciality jewellery competitor is Zale Corporation, which has a speciality market share of about
sector. Management believes that the
Providing knowledgeable and responsive customer service is a
differentiation. It is believed that highly trained store sales staff with the necessary product knowledge to communicate the competitive value of the merchandise are critical to the success of the business. The US division’s substantial training and incentive programmes for all levels of store staff are designed to play an important role in recruiting, educating and retaining qualified store staff. The preferred practice is to promote managers of all levels from within the organisation in order to maintain continuity and familiarity with Retail sales personnel are encouraged to become America. All store personnel are required to meet daily performance standards and commit to goals. After completion of basic training, sales staff are paid a commission based on their individual sales performance and on meeting monthly store sales targets. Sales contests and incentive programmes also reward the achievement of specific goals with travel or additional cash awards. In addition to sales based incentives, bonuses are paid to store managers and district managers based on the achievement of key performance objectives. In Each store is led by a store manager who is responsible for various store level operations including overall store sales and branch level variable costs; certain personnel matters such as recruitment and training; and customer service. Administrative matters, including purchasing, merchandising, payroll, preparation of training materials, credit operations and divisional operating procedures are consolidated at divisional level. This allows the store manager to focus on those tasks that can be best executed at the store level while enabling the business to benefit from economies of scale in administrative matters and to help ensure consistency of execution across all the stores. Staff recruitment is primarily the responsibility of store and district managers. In 2004/05 the division began to develop a central recruitment facility that supplies field recruiters from the home office, and uses methods such as internet recruitment to provide stores with a larger number of better qualified candidates from which to select new staff. Management believes that the retention and recruitment of highly qualified and well-trained staff in the US head office in Akron, Ohio
US operating review (continued) US head office bonuses are mainly based on the performance of the division against predetermined annual profit targets. Promotion decisions for all non-management head office personnel are based on performance against service level and production goals; for managers they are based on annual objectives and performance against individual job requirements. Real estate Jared locations are typically free-standing sites in shopping complexes with high visibility and traffic flow, and positioned close to major roads. The retail centres in which Jared stores operate normally contain strong retail co-tenants, including other category killer destination stores such as Borders Books, Best Buy, Home Depot and Bed, Bath & Beyond. Details of recent investment in the store portfolio are set out below:
Management believes that the US division’s prime real estate portfolio, together with its regular investment in mall store refurbishments and relocations, are competitive advantages that help build store traffic. Superior like for like sales growth is normally achieved for a number of years following such investment. The typical benefits from mall store refurbishments, which normally occur on a ten year cycle, include an increase in linear footage of display cases positioned on the store frontage, improved lighting and better access to the store. When relocating a store to a better location in a mall, such as a centre court corner site from an in-line location, an increase in like for like sales is expected due to improved visibility to the customers, improved lighting and more display cases being positioned on the lease line between the store and the mall common areas. Criteria for investment in mall real estate remain stringent. Signet seeks sites in superior malls, in particular units located on busy centre court locations. In 2004/05 there was a net increase in the US division’s new store selling space of approximately 8%, at the top end of the target range. In 2005/06 it is planned to open approximately 15-20 Jared stores. 40-50 mall stores, up to ten additional off-mall Kay and up to four metropolitan stores will also be opened. Around 20 mall stores are planned for closure. The programme should result in a net increase in new store space of about 8% by the end of 2005/06. Signet may consider selective purchases of mall stores that meet its acquisition criteria regarding location, quality of real estate, customer base and return on investment for both the Kay and regional brands. Kay The development of Kay stores in suburban off-mall shopping centres, such as “lifestyle” and “power strip” centres, commenced in 2003/04 with the opening of ten stores. A further ten were opened in 2004/05, and it is intended that ten will be opened in 2005/06. A lifestyle centre is an open air shopping centre where the retail mix is biased toward fashion and leisure stores and is also likely to have a large number of restaurants. A power strip centre is also an open air shopping centre but the retail mix is predominantly category killer superstores with some smaller speciality units. Kay stores in these suburban centres are expected to have a lower capital expenditure, lower rents and lower sales per store at maturity than that of the Kay chain average. In 2005/06 up to four Kay stores are planned to be opened in traditional metropolitan locations in cities such as Boston, Chicago, San Francisco and New York. Kay stores in large metropolitan locations are anticipated to have higher capital expenditure, higher rents and higher sales per store at maturity than those of the Kay chain average. Management believes that the expansion of Kay in these new locations
The following table sets out information concerning the US stores operated by Signet during the period indicated:
presents a potential opportunity to reach new customers currently not served, and gain further leverage from its marketing expenditure and the US division’s central overhead. Regional chains In recent years, new regional chain stores have been opened if real estate satisfying the investment criteria becomes available in their respective trading areas or in adjacent areas where marketing support can be cost effective. Areas in which the scale to support cost-effective marketing can be built over a reasonable time span are now also considered for store openings. This is part of a strategy to potentially develop a second mall-based brand of sufficient size to take advantage of national television advertising. This strategy may also include the acquisition of small or large regional chains of speciality jewellery stores that meet the Group’s strict operational and financial criteria. Jared
US operating review
The following map shows the number and locations of Kay, Regional and Jared stores at 29 January 2005.
Jared targets an under-served sector at the upper end of the middle market. The customer profile is of a more mature, higher income customer than that of Signet’s US mall stores. An important advantage of a destination store is that the potential customer visits the store with the intention of making a jewellery purchase, whereas in a mall there is a greater possibility of the intended spend being diverted to non-jewellery purchases. The typical Jared store has about 4,700 square feet of selling space and 5,900 square feet of total space. Its size permits significantly expanded product ranges and enhanced customer services, including in-store repair and custom design facilities. A private viewing room is available for customers when required. There are also complimentary refreshments and a children’s play area. There were 93 Jared stores at 29 January 2005 (31 January 2004: 79 stores). The average retail price of merchandise sold in Jared stores during 2004/05 was $644 (2003/04: $586), which was more than double that of a Signet US mall store. In the first five years of trading a Jared store is projected to have a faster rate of like for like sales growth than that of a mall store
during the same period. At the end of this period the projected operating margin is expected to have risen to around that of the mall store at maturity, with a greater return on capital employed. Excluding the three prototype stores the average sales of the 25 Jared stores that have reached maturity is $5.6 million in their fifth full year. At 29 January 2005 some 70% of the Jared stores had been open for less than five years. The average sales per Jared store opened for the whole of the 2004/05 financial year were $4,975,000 (2003/04: $4,573,000) and reflects the immaturity of Jared. Since the first Jared store opened in 1993, the concept has been continually evaluated, developed and refined. Management believes that in addition to the competitive advantages possessed by the division as a whole, Jared also benefits from leveraging the division’s established infrastructure, access to a pool of experienced store management, and availability of capital required to develop and grow the brand. Management believes that the Jared concept has considerable growth potential and over 100 suitable markets have been identified, with many of these markets able to support multiple locations. Accordingly, in the longer term, the chain has the potential to expand nationwide to over 225 stores, generating annual sales of over $1 billion based on the current performance of existing Jared stores. Some Jared stores are being opened to test new real estate selection criteria that may increase the potential number of sites suitable for a Jared store. These include opening Jared stores nearer to each other in established markets with above-average population density (such as Atlanta, Georgia); entering smaller markets where national television advertising would make marketing support cost-effective (such as Tulsa, Oklahoma); and locating stores attached to the exterior of covered malls (such as Des Moines, Iowa). Merchandising and purchasing Sophisticated inventory management systems for merchandise testing, assortment planning, allocation and replenishment have been developed and implemented. Approximately two-thirds of the merchandise is common to all US division mall stores, with the remainder allocated to reflect demand in particular markets. It is believed that the merchandising and inventory management systems, as well as improvements in the productivity of the centralised distribution centre, have allowed the division to achieve inventory turns comparable to those of most of its quoted competitors although it has a less mature store base and undertakes more Programmes have been developed in conjunction with certain vendors for the provision of branded jewellery merchandise. For example, the Leo Diamond range is sold exclusively by Signet in the US and the UK. Management believes that the US division’s merchandising process, market share and relationship with suppliers position the business as an ideal partner to launch Other merchandising initiatives offer a distinctive product selection. For example, In The table below sets out Signet’s US merchandise sales mix as a percentage of sales:
US operating review (continued) It is believed that the US division has a competitive cost and quality advantage as approximately 55% of Merchandise is purchased complete as a finished product where the manufacturer’s price is more competitive than using direct sourcing, or the complexity of the product is great or the merchandise is considered likely to have a less predictable sales Merchandise held on consignment is used to enhance product selection and test new designs. This minimises exposure to changes in fashion trends and obsolescence and provides the flexibility to return non-performing merchandise. At In Marketing and advertising through percentage of sales was Advertising activities are concentrated on periods when customers are expected to be most receptive to the marketing message. During the
Jared advertising on local radio takes place for most of the
Statistical and technology based systems are employed to support a direct marketing programme that uses a proprietary database of over
key trading periods. In addition, invitations to special promotional in-store events are extended throughout the year. Special catalogues featuring ranges such as luxury watches are produced for Jared.
Credit operations The table below presents data related to the in-house credit business for the past three financial years. Since The credit portfolio turns approximately every seven months and the monthly collection rate
The bad debt charge for the year, at end of the range over the last eight years. In-house credit sales represented Authorisation and collections are all performed centrally at the US headquarters on an automated basis, rather than by store staff. The majority of credit applications can be processed and approved in less than two minutes; they can be made via in-store terminals, through a toll-free phone number or on-line through the marketing web sites. All applications are evaluated by the scoring of credit data and data obtained through third party credit bureaux. Investment in staff, training and systems to maintain or improve the quality of the credit portfolio continued throughout The new system will provide management with increased flexibility to implement and/or modify collection strategies, and a more user-friendly platform. Collection strategies and efforts continued to include increased emphasis on
US operating review (continued) Management tools and communications All stores are supported by the internally developed Store Information System, which includes electronic point of sale (“EPOS”) processing, in-house credit authorisation and support, a district manager information system and a satellite-based communications system that supports data transmissions and company-wide e-mail. The EPOS system updates sales, in-house credit and perpetual inventory replenishment systems from data captured throughout the day for each store. In order to allow staff more time for selling and customer service, further steps in the “World Class Store Systems” initiatives were taken. These have resulted in improvements in special orders and repair services procedures. Regulation
UK operating review
Overview At The UK strategy is to increase the average transaction value by focusing on fast growing product categories, particularly diamond jewellery, thereby improving store productivity and achieving operational leverage. To achieve this the division has a series of initiatives in the key areas of retail execution that are designed to grow the sales of diamonds. Competitive advantages •Store operations and personnel •Real estate •Merchandising •Marketing •Access to US expertise Initiatives in
UK operating review (continued)
The UK retail jewellery In the middle market H.Samuel competes with a large number of independent jewellers, the only competitor of significant size being F Hinds (108 stores). Competition at the lower end of the H.Samuel product range also comes from catalogue showroom outlets such as Argos and discount jewellery retailers such as Warren
In the upper middle market Ernest Jones’ competition is from independent speciality retailers and a limited number of other upper middle market jewellery groups such as Goldsmiths Group (169 stores); Beaverbrooks Based on
Store operations and personnel The new recruitment procedures continue to improve the suitability of new store personnel helping to ensure that they meet key basic requirements and are motivated to work within the jewellery store environment. Field and human resources management are responsible for the recruitment, performance review, training and development of sales staff, thereby ensuring consistency in operating standards and procedures throughout the business. All new store personnel must complete a “selling skills” learning programme during their probationary period and thereafter undertake additional training in selling, product knowledge and customer care. All store personnel have daily performance targets. They are given training and weekly feedback on their performance from store and field management to help them achieve these targets. In conjunction with the Signet Jewellery Academy, training for all tiers of store operations management was developed further last year to support the initiative to improve customer service. In 2004/05 the number of training courses completed nearly doubled. The preferred policy is to promote store managers from within the business; approximately 70% of store management appointed in 2004/05 were promoted from within the organisation. At any given time each chain has a number of sales staff who are qualified to advance to store management level, thus assuring the availability of newly trained managers familiar with operating standards and procedures.
In order to increase staff selling time and to improve efficiency, operating procedures are routinely reviewed to identify opportunities to enhance customer service and reduce in-store administrative tasks. The Signet intranet, introduced in all stores in 2003, provides a computer-based platform for improved communication between stores and head office, with sales floor and back office administrative functions being simplified and standardised through this medium. Various incentive schemes are operated to motivate and reward performance in the stores including bonuses based on key performance targets. In 2004/05 a commission-based remuneration test was carried out designed to increase the proportion of performance-related payments over time. The level of commission paid is dependent on the sales achieved by the individual and the overall sales of the store. During 2005/06 this commission system will be introduced more widely across the division. Management also believes that successful recruitment, training and retention of head office staff is essential. Comprehensive recruitment, training and incentive programmes for head office staff are in place in the Colindale and Birmingham offices. Programmes to provide employees with structured development plans, training and career paths have been implemented. Internal career advancement is encouraged and is supported by a succession planning process. Teamwork and service to the stores are encouraged through a performance bonus plan for head office staff, which is based on the division’s results. Opportunities for improving employment practices were identified through a “Staff Opinion Survey”. It is believed that the results provide a basis for further improvement in the motivation and retention of staff.
The performance of the new format has continued to be encouraging. The increase in sales from the additional investment meets the well established Group investment criteria. The reformatted stores achieved a rise in both diamond sales and average retail price. An additional 90 stores, primarily H.Samuel, were trading in the new format at 29 January 2005, bringing the total to 142, accounting for about 30% of the UK division’s sales. A multi-year rollout plan for the new format is being implemented as part of the normal refurbishment cycle; it is planned to refurbish or relocate 80 to 90 stores in 2005/06, the majority again being H.Samuel. The new format features open frontages which are intended to make the store more accessible and inviting to the customer, as well as improved presentation of the merchandise. The design draws on the Group’s mall store experience in the US, and for mall locations Much of the merchandise is
Details of recent investment in the store portfolio are set out below:
H.Samuel
The average retail price of items sold
UK operating review (continued) Ernest Jones (including Leslie Davis) The principal product categories are diamonds, branded watches and gold jewellery, which are all merchandised and marketed to appeal to the more affluent upper middle market customer (see At
Merchandising and purchasing The merchandise mix of Signet UK diamond sales was
Merchandise is purchased from a range of suppliers and manufacturers. In
Economies of scale Signet UK also employs contract Merchandising teams work in conjunction with the buyers and focus on assortment planning, branch grading, repeat orders, inventory levels and margin management. Product category reviews are regularly carried out with a focus on increasing potential gross margin return on investment. Rigorous test marketing procedures are used to trial products, and their
subsequent distribution is made strictly against rates of sale.
The size and quality of diamond jewellery available to customers was enhanced during the year, with a greater proportion of precious white metals. Branded diamonds exclusive to Signet have been Each store is assigned a range of merchandise that reflects local buying patterns. Display equipment and layouts are constantly reviewed and updated, and new display formats that draw upon the US division’s experience Marketing and advertising The primary marketing and advertising medium employed in
Public relations up to Valentine’s Day and Christmas. During 2004/05 customer relationship marketing was successfully trialled for Ernest Jones and During Insurance loss replacement business Credit operations Management tools and communications EPOS equipment, retail management systems, purchase order management systems and merchandise planning processes are in place to support financial management, inventory planning and control, purchasing, merchandising, replenishment and distribution and can
UK operating review (continued) and debit card fraud. The first phase of an electronic “Business To Business” communications project, developed to improve the efficiency and effectiveness of dealing with suppliers, was implemented. A perpetual inventory process allows store managers to check stock by product category. New systems have been introduced to enhance control over cash banking to support financial management. Major computer hardware upgrades have taken place to improve resilience and capacity, particularly during the peak Christmas season. The administration centre at Colindale in North London is the head office for UK store operations and houses the division’s senior management, financial planning, marketing, and buying and merchandising functions. The facilities for payroll, human resources, information technology, certain finance functions, distribution and customer services, as well as the insurance replacement business and call centre, are located in Birmingham. During 2004/05 various central administrative functions were relocated from Colindale and consolidated in Birmingham to enhance efficiency and should result in future cost savings. Regulation
Description of property & Group employees Signet attributes great importance to the location and appearance of its stores. Accordingly, in both Signet’s US and UK operations, investment decisions on selecting sites and refurbishing stores are made centrally, and strict real estate criteria are applied. The US The US division leases 17% of its store locations from Simon Property Group and 15% from General Growth Management, Inc. Otherwise, the division has no relationship with any lessor relating to 10% or more of its store locations. During the past five financial years the US business has been generally successful in renewing its store leases as they expire and has not experienced difficulty in securing suitable locations for its stores. It is not believed that any of the store leases are individually material to the Group’s US operations. A UK terms of up to 25 years, generally under full repairing and insuring leases (equivalent to triple net leases in the US). Wherever possible Signet is shortening the length of new leases that it enters into in order to improve the flexibility of its lease commitments. Rents are usually subject to upward review every five years if market conditions so warrant. An increasing proportion of rents are related to sales of the store, subject to a minimum annual value. At the end of the lease period, subject to certain limited exceptions, leaseholders generally have statutory rights to enter into a new lease of the premises on negotiated terms. At Signet owns a 255,000 square foot warehouse and distribution centre in Birmingham. Following the relocation and consolidation of certain of the UK division’s central administration functions to Birmingham Trademarks and trade names Group employees
None of Signet’s employees in the UK and less than 1% of Signet’s employees in the US are covered by collective bargaining agreements. Signet considers its relationship with its employees to be excellent.
Financial review
Introduction
In general, gross on the proportion of the merchandise cost accounted for by the value of the diamonds, and the greater the proportion, the lower the gross margin. In addition, the gross margin in a Jared store is slightly below that of a mall store, although at maturity the
division and Group. To maintain the operating profit margin the Group needs to achieve like for like sales growth sufficient to offset any adverse movement in gross margin, the increase in operating costs and the impact of immature selling space. There are not any known trends or uncertainties in future rent or amortisation expenses that could materially affect operating results or cash flows. Like for like sales growth above Signet’s longer term strategy of The impact on operating profits of sales variances (either adverse or favourable) is less in the US division than the UK, as certain expense items are more related to sales volumes in the US. A key factor in driving operating margin is the level of average sales per store, with higher productivity allowing leverage of expenses both in store and in central
Movements in the US dollar to pound sterling exchange rate impact the reported results of the Group as the US division’s results are translated into pounds sterling. The Board believes it is inappropriate to hedge this exposure as the US division’s sales and costs are dollar denominated and the cash flow from the US division is largely reinvested in the US space expansion or used to pay down US dollar denominated borrowings. The Group therefore would be putting in place a cash exposure to hedge a translation risk.
52 weeks ended Group operating margin increased to Net interest payable and similar charges decreased to Group profit before tax increased to
US to 2004/05 with an excellent performance during the UK Operating profit
US UK Group costs
Financial review (continued) Prior year adjustment As a result of this change the Group has restated prior years. Therefore the previously reported 2003/04 results now reflect a decrease in sales of £12.3 million and a reduction in profit before tax of £12.1 million. The difference of £0.2 million represents the movement in the incremental cost provision applied under the previous accounting policy. Consequently, restated profit before tax for the 52 weeks ended 31 January 2004 is £199.8 million. The effect on brought forward reserves at 31 January 2004 is a reduction of £52.7 million net of deferred tax, with shareholders’ funds at 31 January 2004 therefore restated to £674.9 million. The adjustment does not affect cash flows from operations. Return on capital employed Depreciation and capital expenditure Dividends share for Liquidity and capital resources The cash flow performance of the Group depends on a number of factors such as the:
Investment in new space requires significant investment in working capital, as well as fixed capital investment, due to the slow inventory turn, and the In years when the rate of new store space expansion in the US is towards the lower end of the planned The Group’s working capital requirements fluctuate during the year as a result of the seasonal nature of its business. As inventory is purchased for the Christmas season there is a working capital outflow which reaches its highest levels in the late autumn. This position then reverses over the key selling period of November and December. The working capital needs of the business are then relatively stable from January to August. The timing of the payment of the final dividend, normally in July, is also material.
The Board considers that the capital resources currently available are sufficient for both its present and near term requirements. The primary borrowing facilities are a $251 million securitisation against the US customer receivables which amortises between December 2005 and October 2006 and a
Group capital expenditure was £70.5 million (2003/04: £50.9 million,
Net debt The Company funds part of its private label credit card receivables programme through a privately placed receivables securitisation. Under this securitisation, interests in the US receivables portfolio, held by a trust were sold principally to institutional investors in the form of fixed-rate Class A, Class B and Class C investor certificates. The aggregate outstanding principal amount of the certificates totalled $251.0 million at In On 28 September 2004
The continued availability of the Facility Agreement is conditional upon the Group achieving certain financial performance criteria (see note 16 on page In July 1998 the Group entered into a $60 million unsecured seven year senior note issue (“Loan Note”), bearing a 7.25% fixed coupon. The Loan Note is also guaranteed by the Group’s principal holding and operating subsidiaries. The continued availability of the Loan Note is conditional upon the Group achieving certain financial performance criteria (see note 16 on page The principal financial covenants on each of these facilities are set out in note 16 on page It is the policy of the Group to enter into interest rate protection agreements in respect of at least 75% of its forecast US dollar borrowings. At
Financial review (continued) Pensions Contingent property liabilities additional properties were sub-let at that date. Should the assignees or sub-tenants fail to fulfil any obligations in respect of those leases or any other leases which have at any other time been assigned or sub-let, the Group or one of its UK subsidiaries may be liable for those defaults. The number of such claims arising to date has been small, and the liability, which is charged to the profit and loss account as it arises, has not been material. Contractual obligations
Impact of constant exchange rates analysing and explaining changes and trends in the Group’s
Financial review (continued) Prior year review of the 52 weeks ended 31 January 2004 Group operating margin increased to 13.1% (2002/03: 12.5%), with leverage from like for like sales growth more than offsetting the impact of immature space growth with gross margin little changed. The growth in total sales and the increased operating margin resulted in Group operating profit advancing to £210.2 million (2002/03: £199.9 million), up 5.2% on a reported basis and 12.2% at constant exchange rates. Net interest payable decreased to £10.4 million (2002/03: £14.0 million). £1.5 million of the reduction was due to exchange translation, the balance attributable to lower levels of net debt which more than offset the decrease in net interest credit on the UK defined benefit pension scheme. Group profit before tax increased to £199.8 million (2002/03: £185.9 million), up 7.5% on a reported basis and 14.3% at constant exchange rates. After a tax charge of 35.1% (2002/03: 35.3%) profit for the financial period rose to £129.6 million (2002/03: £120.2 million). Earnings per share was 7.5p (2002/03: 7.0p), up 7.1% on a reported basis and 13.6% at constant exchange rates.
Sales US UK like sales rose by 6.7%. For the year as a whole like for like sales increased by 5.5% and total sales by 5.8%. Operating profit US UK
Group costs Prior year adjustment Return on capital employed
Depreciation and capital expenditure Dividends Impact of constant exchange rates
Critical accounting policies
Revenue recognition
Financial review (continued) sale in proportion to anticipated claims arising. This period is based on the historical claims experience of the US business, which has been consistent since these products were launched. The Group reviews the pattern of claims at the end of each year to determine any significant trends that may require changes to revenue recognition rates. The treatment of US extended service Stock valuation Where necessary provision is made for obsolete, slow-moving and damaged stock. This provision represents the difference between the cost of the stock and its estimated market value, based upon stock turn rates, market conditions and trends in consumer demand. For further detail on the provisions for inventory and the amount of reserves recorded each year, refer to note 12 on page 83 in the notes to the accounts. In the US stock losses are recognised at the mid-year and fiscal year end based on complete physical inventories. In the UK stock losses are Foreign currency translation based on US sales, during the period and their balance sheets and attributable goodwill at the rates at the balance sheet date. Exchange differences arising from the translation of the net assets and attributable goodwill of overseas subsidiary undertakings Depreciation and impairment In the UK, there are circumstances where scheduled refurbishments are carried out close to the end of the lease term, such that the expected life of the newly installed leasehold improvements will exceed the lease term. Where the renewal of the lease is reasonably assured, such shopfronts, fixtures and fittings are depreciated over a period equal to the lesser of their economic useful life, or the remaining lease term plus the period of reasonably assured renewal. Reasonable assurance is gained through evaluation of the right to enter into a new lease, the peformance of the store and potential availability of alternative sites. Where appropriate, provision is made on assets that have a lower economic value than net book value. Additionally, Lease costs and incentives In accordance with FRS 12, where the Group has onerous lease obligations, provision is made for the discounted cash outflow that is expected to arise under the lease. The Group policy is to recognise a provision for onerous leases when the leased property ceases to be used by the Group. Receivables
Advertising and promotional costs International
The most significant elements contributing to the change in financial information are:
These changes have no impact on the Group’s historical or future net cash flow, the timing of cash received or the timing of payments. Transitional arrangements
Financial review (continued)
IAS 12 Income tax
These result in an additional charge to the profit and loss account of £3.5 million and a decrease in net assets of £17.9 million before deferred tax. There is no impact on cash flows.
IAS 18 Revenue recognition There are a number of other presentational changes that do not have an impact on the profit or net assets of the Group. Insurance income and
Risk and other factors
Forward-looking statements
• | financial market risks, including fluctuations in exchange rates between the pound sterling and the US dollar which may affect reported revenues, costs, the value of the Group’s consolidated borrowings, and the cost of capital. | | |||||||||||||||||||||||||||||||||||||||||||||||||||||||||||||||||||||||||||||||||||||||||||||||||||||||||||||||||||||||||||||||||||||||||||||||||||||||||||||||||||||||||||||||||||||||||||||||||||||||||||||||||||||||||||||||||||||||||||||||||||||||||||||||||||||||||||||||||||||||||||||||||||||||||||||||||||||||||||||||||||||||||||||||||||||||||||||||||||||||||||||||||||||||||||||||||||||||||||||||||||||||||||||||||||||||||||||||||||||||||||||||||||||||||||||||||||||||||||||||||||||||||||||||||||||||||||||||||||||||||||||||||||||||||||||||||||||||||||||||||||||||||||||||||||||||||||||||||||||||||||||||||||||||||||||||||||||||||||||||||||||||||||||||||||||||||||||||||||||||||||||||||||||||||||||||||||||||||||||||||||||||||||||||||||||||||||||||||||||||||||||||||||||||||||||||||||||||||||||||||||||||||||||||||||||||||||||||||||||||||||||||||||||||||||||||||||||||||||||||||||||||||||||||||||||||||||||||||||||||||||||||||||||||||||||||||||||||||||||||||||||||||||||||||||||||||||||||||||||
Actual results may differ materially from those anticipated in exchange rates between the pound sterling and the US dollar whichsuch forward-looking statements even if experience or future changes make it clear that any projected results expressed or implied therein may affect reported revenues, costs, the value of the Group’s consolidated borrowings, and the cost of capital.not be realised. The Group undertakes no obligation to update or revise any forward-looking statements to reflect subsequent events or circumstances.
Impact of general economic conditions
Jewellery purchases are discretionary and may be particularly affected by adverse trends in the general economy.
The success of the Group’s operations depends to a significant extent upon a number of factors relating to discretionary consumer spending. These include economic conditions and perceptions of such conditions by consumers, employment, the rate of change in employment, the level of consumers’ disposable income, business conditions, interest rates, consumer debt levels, availability of credit and levels of taxation for the economy as a whole and in regional and local markets where the Group operates. There can be no assurance that consumer spending on jewellery will not be adversely affected by changes in general economic conditions. However, due to the limited seasonality in the product mix, the risk of having to discount inventory in order to be correctly stocked for the next selling season is more limited than for some other retail sectors. While the level of consumer expenditure may vary, the occasions when jewellery is purchased – engagements, weddings and events such as Christmas, wedding anniversaries, birthdays, Valentine’s Day and Mothers’ Day – occur on a regular basis.
As a substantial proportion of the Group’s US sales are made on credit, any significant deterioration in general economic conditions or consumer debt levels may inhibit consumers’ use of credit and cause a material adverse effect on the Group’s revenues and profitability. Furthermore, any downturn in general or local economic conditions in the markets in which the Group operates may adversely affect its collection of outstanding credit accounts receivable and hence the net bad debt charge. Currently there are all-time high levels of consumer debt in the US, however, the level of net bad debt charge as a percentage of credit sales in the Group’s US division in 2003/042004/05 was towards the lowest forbottom end of the last eight years.range.
| Signet Group plc Annual Report & Accounts year ended 29 January 2005 | 35 |
Risk and other factors (continued)
Merchandise selection, pricing, inventory and purchasing
The Group depends on consumer fashions, preferences for jewellery in general and the demand for particular products. Design trends in jewellery normally only change over relatively long periods and there is little seasonality in the merchandise mix. The ability to predict accurately future changes in taste, respond to changes in consumer preferences, carry the inventory demanded by customers, deliver the appropriate quality, price products correctly and implement effective purchasing procedures, all have an important influence on determining sales performance and achieved gross margin (see pages 1213 and 1820 for more details of the Group’s merchandising and purchasing procedures).
Risk and other factors (continued)
The Group’s operating experience suggests that while the price of jewellery is a consideration for consumers, it is not among the top three factors in determining where they buy jewellery. The Group believes these factors to be the level of service provided to the customer, the quality, together with the selection, of merchandise offered and the reputation of the retailer. Therefore while discounting price may increase sales, it may not increase profit.
Reputation and marketing
Primary factors in determining customer buying decisions in the jewellery sector include customer confidence in the retailer and the merchandise sold, together with the level and quality of customer service. The Group carries out quality control and staff training procedures and provides customer service facilities to help protect its reputation (see page 104116 for details of the processes by which the Group obtains an understanding of customer attitudes).
The ability to differentiate the Group’s stores from competitors by its branding, marketing and advertising programmes is a factor in attracting consumers. Therefore these programmes are carefully tested and their success monitored by methods such as market research (see pages 1214 and 1821 for more details).
The Diamond Trading Company (“DTC”), a subsidiary of De Beers Consolidated Mines Limited (“De Beers”), promotes diamonds and diamond jewellery in the US and the UK. The level of support provided by the DTC and the success of the promotions influence the size of the total jewellery market in those countries.
The Group’s reputation in the financial markets can influence the availability of capital, the cost of capital and the share price.
Staff
In speciality jewellery retailing, the level and quality of customer service is largely determined by the effectiveness of recruitment, training and retention of suitably qualified sales staff and this will help determine sales and profitability. The support provided to the Group’s store employees by staff at the divisional head offices and in the corporate functions will also influence the performance of the Group. Consequently the Group has in place comprehensive recruitment, training and incentive programmes, and employee attitude surveys (see pages 119 and 1718 for more details).
Store portfolio
The future growth of sales is partly dependent on the extent and results of the Group’s net space expansion and refurbishment strategy. The Group has followed a steady programme of space expansion and refurbishment and has established capital expenditure procedures with investment criteria set by the Board.
The projections used for investment decisions are reviewed and adjusted based on experience and economic conditions.
In particular, the success of the Jared off-mall destination store concept, which accounts for the majority of the Group’s net increase in new store space, will influence the future performance of the Group. This concept has been tested and developed over a number of years and its performance against the investment model is regularly reviewed. The rate of new store development is dependent on a number of factors including obtaining suitable real estate, the capital resources of the Group and the availability of appropriate staff and management.
The Group’s results are dependent on a number of factors relating to its stores. These include the availability of property, the location of the mall or shopping centre, the availability of attractive locations within a mall or high street,High Street, the terms of leases, agreedthe Group’s relationship with major landlords and the design and maintenance of the stores. In addition, the Group’s operations, particularly in the US, are dependent upon the continued popularity of malls as a shopping destination and the ability of malls, their tenants and other mall features to attract customers.
Competition
Competitive factors in the jewellery sector are discussed in the US and UK operating reviews (see pages 7 to 19)22).
If the Group falls behind competitors with respect to one or more of these factors, the Group’s operating results or financial condition could be adversely affected. In the US the Group has an estimated 7%7.2% market share of the speciality jewellery sector
| 36 | Signet Group plc Annual Report & Accounts year ended 29 January 2005 |
and has only one major national competitor. While another major national brand could develop, the sector is highly fragmented. In the UK the Group has an estimated 17% share of the total jewellery sector and has only limited scope to increase sales by opening new stores.
The channels through which consumers buy jewellery continually evolve and a major non-speciality retailer could enter the wider jewellery market. In the US, for example, sales by discount retailers have increased, while those of the department stores have been in relative decline and catalogue retailers have withdrawn from the market. In the UK a number of fashion and general retailers including a major supermarket chain, have introduced jewellery into their ranges whilst others have reduced their selection. In both the US and the UK, Internetinternet retailers sell jewellery and watches. The Group monitors the competitive environment and the development of possible new channels of distribution such as the Internet.internet. As part of this process there are marketing web sites for each of the Group’s major brands, and regular exercises to “shop the competition” take place.
Supply chain
During 2003/042004/05 the Group had one supplier that accounted for 8% of its merchandise. No other supplier accounted for more than 5%4% of its merchandise. Although the Group believes that alternative sources of supply are available, the abrupt loss of any significant supplier during the three month period (August to October) leading up to the Christmas season could result in a material adverse effect on the Group’s business. The Group is therefore in regular dialogue with suppliers and uses its merchandising systems to test and predict its future inventory needs.
Raw materials
The jewellery industry generally is affected by fluctuations in the price and supply of diamonds, gold and, to a lesser extent, other precious and semi-precious metals and stones. The Group undertakes some hedging of its requirement for gold through the use of options, forward contracts and outright commodity purchasing. It does not hedge against fluctuations in the cost of diamonds. The Group does hedge the exposure of the UK division to the US dollar with regard to diamond and other costs of goods sold. The cost of raw materials is only part of the costs involved in the retail selling price of jewellery with labour costs also being a significant factor.
Diamonds are the largest product category sold by the Group. The supply and price of diamonds in the principal world markets are significantly influenced by a single entity. The DTC (and its predecessor, the Central Selling Organisation) has for many years controlled the marketing of a substantial majority of the world’s
supply of rough diamonds and sells diamonds to diamond cutters in quantities and at prices determined at its sole discretion. In 2000 De Beers announced a change in corporate strategy designed to improve the efficiency of the supply chain and increase the level of marketing support for diamonds.
The availability of diamonds to the DTC and the Group’s suppliers is to some extent dependent on the political situation in diamond producing countries. Until alternative sources can be developed, any sustained interruption in the supply of diamonds from the significant producing countries could adversely affect the Group and the retail jewellery industry as a whole.
Consumer confidence in diamonds, gold and other metals and gemstones also influences the level of Group sales. Confidence could be affected by a variety of issues including the availability and consumer awareness of substitute products such as cubic zirconium,zirconia, moisanite and the development of syntheticlaboratory created diamonds; labour conditions in the supply chain; and concern over the source of raw materials. The Group, therefore, has a Supplier Code of Conduct which sets out the Group’s expectations of its suppliers.
An example of an issue that could affect confidence in this way is that of conflict diamonds, which is the term used for diamonds sold by rebel movements to raise funds for military campaigns. There have been a number of United Nations resolutions regarding conflict diamonds and an international agreement, known as the Kimberley Process, was signed in November 2002. This was designed to exclude conflict diamonds from the legitimate diamond trade. During 2003 legislation was passed, in the European Union and the US, implementing the Kimberley Process. The impact of the Kimberley Process and its associated legislation has not resulted in any disruption to the supply of rough diamonds to date and has helped to improve the integrity of the supply chain.
The Group reviewedreviews its procedures and documentation for compliance with the Kimberley Process and mademakes appropriate amendments. In addition, staff wereare briefed and suppliers have been contactedreminded about the changes.procedures. During the year the Group’s internal audit function checkedand mystery shopper programmes check for compliance with the new procedures.compliance. See page 104116 for further information on the Supplier Code of Conduct, the Kimberley Process and the Group’s policy on conflict diamonds.
Seasonality
The Group’s business is highly seasonal, with a very significant proportion of its sales and operating profit generated during its fourth quarter, which includes the Christmas season. The Group expects to continue to experience a seasonal fluctuation in its sales and profit. Therefore the Group has limited ability to compensate for shortfalls in fourth quarter sales or earnings by
| Signet Group plc Annual Report & Accounts year ended 29 January 2005 | 37 |
Risk and other factors (continued)
changes in its operations and strategies in other quarters, or to recover from any extensive disruption, for example due to inclement weather conditions. A significant shortfall in results for the fourth quarter of any financial year would thus be expected to have a material adverse effect on the Group’s annual results of operations. However, due to the limited seasonality in the product mix, the risk of having to discount inventory in order to be correctly stocked for the next selling season is more limited than for some other retail sectors. Disruption at more minor peaks in sales at Valentine’s Day and Mothers’ Day would impact the results of the Group to a lesser extent.
Social, ethical and environmental risks
Social, ethical and environmental (“SEE”) matters influence the Group’s reputation, demand for merchandise by consumers, the ability to recruit staff, relations with suppliers and standing in the financial markets. Signet, therefore, is committed to managing the SEE risks and responsibilities facing the Group. This commitment stems from the understanding that Signet’s success is dependent on the strength and effectiveness of its relationships with its various stakeholders: shareholders, customers, employees and suppliers.
Risk and other factors (continued)
In recent years stakeholder expectations of public companies have increased. Managing and responding as a business to these changing expectations, including with regard to SEE issues, is part of the normal responsibilities of corporate management.
The Group regularly carries out SEE risk reviews and benchmarking exercises with the assistance of an external adviser. Such reviews include an assessment of Group policies, procedures and controls in respect of SEE matters. Reports are regularly made to the Group’s Risk Committee and to the Board. The greatest SEE risks are judged to relate to the integrity of the merchandise and to the SEE standards in the Group’s supply chain.
On 21 October 2001 the Association of British Insurers published guidelines on Socially Responsible Investment. In line with that guidance the Board confirms that they haveit has identified and assessed the Group’s SEE risks and that these are being managed.
SEE matters are dealt with in more detail on pages 103115 to 106119 and in the corporate social responsibility section on www.signetgroupplc.comwww.signetgroupplc.com..
Systems
The Group is dependent on the suitability and reliability of its systems and procedures, including its information technology, warehousing and distribution systems. The Group has emergency procedures and carries out rehearsals to test them.which are regularly tested. The Group carries out evaluation, planning and implementation analysis before
updating or introducing new systems that have an impact on a function critical to the Group.
Regulatory requirements
Regulations govern various areas of business activity and changes in regulations can therefore influence the Group’s performance. For example in the US approximately 50% of sales utilise the Group’s in-house credit programmes therefore any change in the regulations or application of regulations relating to the provision of credit and associated services could affect the Group’s results.
The presentation of the Group’s accounts can also be affected by changes to generally accepted accounting policies, such as the adoption of International Accounting Standards for 2005/06 (see pages 33 to 34 for details). Such changes may influence the valuation of the Group’s shares.
Acquisitions
The Group may in the future make acquisitions and any difficulty integrating an acquisition may result in expected returns and other projected benefits from the acquisition not being realised. A significant acquisition could also disrupt the operation of the Group’s current activities. The Group’s growth strategy does not depend on acquisitions and an acquisition would be intended to accelerate the implementation of that strategy.
Pensions
In the UK the Group operates a defined benefit pension scheme. This Group Scheme was closed to new employees in 2004/05. The valuation of the Group Scheme’s assets and liabilities partly depends on assumptions based on the financial markets as well as longevity rates and staff retention rates. Funding requirements and the profit and loss items relating to this Group Scheme are also influenced by financial market factors. At 29 January 2005 there was a net pension liability of £1.3 million compared with a net asset of £1.2 million at the prior year end (see pages 87 to 89 for more details). In the UK the Group introduced a defined contribution plan which replaced the Group Scheme for new employees. The US also operate a defined contribution plan.
Equity and debt financing
The Group is dependent upon the availability of equity and debt financing to fund its operations and growth. Therefore it prepares annual budgets, medium term plans and headroom models which help to identify the future capital requirements so that appropriate facilities can be put in place on a timely basis. If these models are inaccurate adequate facilities may not be available.
| 38 | Signet Group plc Annual Report & Accounts year ended 29 January 2005 |
Financial market risks
The Group publishes its consolidated annual accounts in pounds sterling. The Group held approximately 64%65% of its total assets in US dollars at 3129 January 20042005 and generated approximately 69%68% of its sales and 68% of its operating profit in US dollars for the financial year then ended. Thus, although the Group’s US operations make substantially all of their sales and incur substantially all of their expenses in US dollars, in translating the results of its US operations, the Group’s results are subject to fluctuations in the exchange rate between the pound sterling and the US dollar. Accordingly, depreciation in the weighted average value of the US dollar against the pound sterling could
decrease reported revenues and operating profit (as was the case in 2002/03, 2003/04 and 2003/04)2004/05), and appreciation in the weighted average value of the US dollar against the pound sterling could increase reported revenues and operating profit (as was the case in 1999/00, 2000/01 and 2001/02). The Board has chosen not to hedge the translation effect of exchange rate movements on the results of the Group given that there is little movement of cash between the Group’s two divisions.
As part of its long-term strategy, the Group seeks to finance its US net assets with borrowings denominated in US dollars as a hedge against the impact of exchange rate fluctuations on its US operating profit. Currently nearly all of the Group’s borrowings are denominated in US dollars. Therefore fluctuations in the exchange rate between the pound sterling and the US dollar affect the amount of the Group’s consolidated borrowings.
In addition, the prices of materials and certain products bought on the international markets by the UK division are denominated in US dollars, and therefore the Group has an exposure to exchange rates on the cost of goods sold which will have an opposite effect to its exposure on US operating profit. The Group does use hedging operations in respect of purchases of US dollars by its UK operating division, within the treasury guidelines approved by the Group’s Board.
Cash dividends paid by the Group in respect of the shares will be in pounds sterling and fluctuations in the exchange rate between the pound sterling and the US dollar will affect the dollar amount received by holders of ADSs upon conversion of such dividends. Moreover, fluctuations in the exchange rate between the pound sterling and the US dollar will affect the US dollar equivalents of the pound sterling price of the shares on the London Stock Exchange and, as a result, are likely to affect the market price of the ADSs in the US.
The table on page 33overleaf sets out, for the calendar years indicated, the average, high, low and period end exchange rates for the pound sterling expressed in US dollars per £1.
The Group’s policy is to manage financial risk resulting from exposure to currency and interest rate fluctuations. Translation exposure relating to non-pound sterling denominated assets in the US is partially hedged by borrowing in US dollars. Interest rate exposure is managed through the use of swaps, caps and floors.
A committee of the Board is responsible for the implementation of treasury policies and guidelines which are considered to be
Exchange rates between pound sterling and the US dollar(1)
| At period | ||||||||
| Average | High | Low | end | |||||
| Calendar year | ||||||||
| 1999 | 1.62 | 1.68 | 1.55 | 1.62 | ||||
| 2000 | 1.51 | 1.65 | 1.40 | 1.50 | ||||
| 2001 | 1.44 | 1.50 | 1.38 | 1.45 | ||||
| 2002 | 1.51 | 1.61 | 1.41 | 1.61 | ||||
| 2003 | 1.62 | 1.79 | 1.55 | 1.77 | ||||
| 2004 (cumulative to 24 March) | 1.81 | 1.91 | 1.78 | 1.84 | ||||
| Month | ||||||||
| September 2003 | 1.60 | 1.66 | 1.56 | 1.66 | ||||
| October 2003 | 1.67 | 1.71 | 1.65 | 1.70 | ||||
| November 2003 | 1.69 | 1.72 | 1.65 | 1.72 | ||||
| December 2003 | 1.74 | 1.79 | 1.72 | 1.77 | ||||
| January 2004 | 1.81 | 1.86 | 1.78 | 1.82 | ||||
| February 2004 | 1.85 | 1.91 | 1.81 | 1.87 | ||||
appropriate by the Board for the management of financial risk. The Group’s funding, liquidity and exposure to interest rate and exchange rate risks are managed by the Group’s treasury department. The Group uses derivative instruments for risk management purposes only, and these are transacted by specialist treasury personnel.
For financial instruments held, the Group has used a sensitivity analysis technique that measures the change in the fair value of the Group’s financial instruments from hypothetical changes in market rates and this is shown in the table below.overleaf.
The amounts generated from the sensitivity analysis are forward-looking estimates of market risk assuming certain adverse market conditions occur. Actual results in the future may differ materially from those projected due to changes in the portfolio of financial instruments held and actual developments in the global financial markets. These may cause fluctuations in interest and exchange rates to exceed the hypothetical amounts disclosed in the table below.overleaf.
| Signet Group plc Annual Report & Accounts year ended 29 January 2005 | 39 |
The analysis below should not be considered a projection of likely future events.Back to Contents
Risk and other factors (continued)
Exchange rates between the pound sterling and the US dollar(1)
| Average | High | Low | At period end | |||||
| Calendar year | ||||||||
| 2000 | 1.51 | 1.65 | 1.40 | 1.50 | ||||
| 2001 | 1.44 | 1.50 | 1.38 | 1.45 | ||||
| 2002 | 1.51 | 1.61 | 1.41 | 1.61 | ||||
| 2003 | 1.62 | 1.79 | 1.55 | 1.77 | ||||
| 2004 | 1.79 | 1.96 | 1.75 | 1.92 | ||||
| 2005 (cumulative to 6 April) | 1.90 | 1.93 | 1.85 | 1.88 | ||||
| Month | ||||||||
| September 2004 | 1.80 | 1.82 | 1.77 | 1.81 | ||||
| October 2004 | 1.81 | 1.84 | 1.77 | 1.84 | ||||
| November 2004 | 1.85 | 1.90 | 1.84 | 1.91 | ||||
| December 2004 | 1.92 | 1.96 | 1.90 | 1.92 | ||||
| January 2005 | 1.89 | 1.89 | 1.85 | 1.88 | ||||
| February 2005 | 1.88 | 1.93 | 1.85 | 1.92 | ||||
| March 2005 | 1.90 | 1.93 | 1.85 | 1.89 | ||||
| (1) | Based on unweighted data points sourced from Reuters. |
The example shown for changes in the fair values of borrowings and associated derivative financial instruments at 3129 January 20042005 is set out in the table below. The fair values of borrowings and derivative financial instruments are estimated by discounting the future cash flows to net present values using appropriate market rates prevailing at the period end.
The estimated changes in fair values for interest rate movements
Fair value changes arising from:
are based on an instantaneous decrease of 1% (100 basis points) in the specific rate of interest applicable to each class of financial instruments from the levels effective at 3129 January 20042005 with all other variables remaining constant. The estimated changes in the fair value for foreign exchange rates are based on an instantaneous 10% weakening of the pound sterling against the US dollar from the levels applicable at 3129 January 20042005 with all other variables remaining constant.
| Estimated fair | 10% weakening | Estimated fair | ||||||
| value at | 1% decrease in | in £ against $ | value at | |||||
| 29 January | interest rates | favourable/ | 31 January | |||||
| 2005 | (unfavourable) | (unfavourable) | 2004 | |||||
| £m | £m | £m | £m | |||||
| Borrowings | (180.3 | ) | (2.4 | ) | (20.1 | ) | (207.9 | ) |
| Foreign currency receivable | 319.0 | – | (35.4 | ) | 292.6 | |||
| Foreign exchange contracts | (0.8 | ) | – | 1.3 | (2.9 | ) | ||
| Commodity hedging contracts | – | – | – | (2.1 | ) | |||
| Fair value changes arising from: | 10% | |||||||
| Estimated | 1% | weakening in | Estimated | |||||
| fair value at | decrease in | £ against $ | fair value at | |||||
| 31 January | interest rates | favourable/ | 1 February | |||||
| 2004 | (unfavourable) | (unfavourable) | 2003 | |||||
| £m | £m | £m | £m | |||||
| Borrowings | (207.9 | ) | (6.8 | ) | (17.2 | ) | (229.4 | ) |
| Foreign currency receivable | 292.9 | – | 32.5 | 299.2 | ||||
| Foreign exchange contracts | (2.9 | ) | – | 4.1 | (1.4 | ) | ||
| Commodity hedging contracts | (2.1 | ) | – | (2.1 | ) | – | ||
The analysis above should not be considered a projection of likely future events.
| 40 | Signet Group plc Annual Report & Accounts year ended |
Directors, officers and advisers
Directors
James McAdam CBE, 73,74, Chairman, appointed in 1992. He was also Group Chief Executive from 1992 until March 2000. From 31 March 2001, while continuing as Chairman, he ceased to be a full-time executive. Mr. McAdam is the non-executive Chairman of Bisley Office Equipment Company Limited, Chairman of the British Clothing Industry Association Limited and Chairman of the British Apparel & Textile Confederation; he devotes approximately 25% of his time to these roles collectively.latter roles. Mr. McAdam has indicated his intention to retire from the Board no later than at the conclusion of the annual general meeting in 2006.
Robert Anderson, 46, appointed in April 2005 (after completion of the period under review). He was appointed Chief Executive of the Group’s UK division in January 2003 having joined the Group as Chief Operating Officer of the UK division in August 2000. Prior to joining the Group Mr. Anderson had worked at Marks & Spencer Plc for 19 years, latterly as Business Unit Director.
Robert Blanchard*, 59,60, appointed in 2000. He was a Group Vice President of Procter & Gamble and President of its Global Skin Care and Cosmetics business until his retirement in 1999. He is a non-executive director of Bandag Inc. and is a non-executive director of Best Buy Co. Inc. and Bandag Inc. Mr. Blanchard also serves as President of Strategic and Marketing Services, a consulting companyalthough he founded uponhas indicated his retirementintention to retire from Procter & Gamble.that board in June 2005.
Walker Boyd, 51,52, appointed Group Finance Director in 1995. He is a member of the Institute of Chartered Accountants of Scotland. From 1992 he was Finance Director of the Group’s UK division. Mr. Boyd was appointed a non-executive director of WH Smith PLC in March 2004.2004 but resigned in January 2005 in order to meet good corporate governance requirements on the appointment of Robert Walker as Chairman of WH Smith PLC.
Terry Burman, 58,59, appointed Group Chief Executive in March 2000. He is also Chief Executive Officer of the Group’s US division. Mr. Burman was appointed to the Board in 1996. Prior to joining the Group in 1995 he was Chief Executive Officer of Barry’s Jewelers, Inc.
Dale Hilpert*, 62, appointed in 2003. He was Chief Executive of Williams-Sonoma, Inc. from April 2001 until his retirement in January 2003. Prior to this he was Chairman and Chief Executive of Foot Locker, Inc. (formerly the Venator Group, Inc.) which he joined as President and Chief Operating Officer in 1995.
| * | Non-executive directors, all of whom satisfied the definitions of independence in the revised Combined Code (“the Combined Code”) and are viewed as independent by the Board. |
Brook Land*, 55,56, appointed in 1995 and first elected to the Board in 1996. Until 1996 he was a senior partner of, and is now a consultant to, solicitors Nabarro Nathanson. He is also non-executive Chairman of RPS Group plc and Medal Entertainment & Media plc. Mr. Land was nominated as the senior independent director of Signet in June 2002.
Dale HilpertRobert Walker*, 60, appointed in November 2004. He was Group Chief Executive of Severn Trent Plc, from August 2000 until his retirement in February 2005. Prior to this Mr. Walker had been a Division President of PepsiCo International and had previously worked for McKinsey and Company and Procter & Gamble. He is non-executive Chairman of WH Smith PLC and Williams Lea Group Limited and a non-executive director of Wolseley Plc. He is also an adviser to Cinven.
Russell Walls*, 61, appointed in September 2003. He was Chief Executive of Williams-Sonoma, Inc. from April 2001 until his retirement in January 2003. Prior to this he was Chairman and Chief Executive of Foot Locker, Inc. (formerly the Venator Group, Inc.) which he joined as President and Chief Operating Officer in 1995.
Russell Walls*, 60, appointed in August 2002. He was Group Finance Director atof BAA plc until his retirement in August 2002 and was the senior independent director of Hilton Group plc until May 2003. Mr. Walls is the senior independent director of Stagecoach Group plc and a non-executive director of Aviva plc. He is a Fellow of the Association of Chartered Certified Accountants.
Lee Abraham* retired from the Board with effect from 8 January 2004.
Richard Miller served as an alternate director until his retirement on 30 April 2003.
Committees
Remuneration Robert Blanchard (Chairman), Russell Walls, Brook Land (until 311 March 20032005) and from 7 January 2004) and Lee Abraham until 7 January 2004.Robert Walker (from 1 March 2005).
Audit Russell Walls (Chairman from 1 April 2003)(Chairman), Dale Hilpert (from 7 January 2004) and Brook Land (Chairman until 31 March 2003). Robert Blanchard was a member until 31 March 2003 and Lee Abraham was a member until 7 January 2004.Land.
Nomination Brook Land (Chairman), Robert Blanchard and James McAdam. Russell Walls and Lee Abraham were members until 31 March 2003.
Under the Company’s Articles of Association, directors appointed by the Board since the last annual general meeting, either to fill a vacancy or as an additional director, must retire at the next annual general meeting.
The Articles also specify that every director is required to retire at the annual general meeting in the third calendar year after he was last elected or re-elected, except for directors over the age of 70 who are required to retire at every annual general meeting, but suchmeeting. Similarly the Combined Code requires non-executive directors who have served longer than nine years; if they are to continue to serve, to do so subject to annual re-election. Such directors may, in either circumstance,these circumstances, seek re-election.
| Signet Group plc Annual Report & Accounts year ended 29 January 2005 | 41 |
Directors, officers and advisers (continued)
Messrs. Blanchard, Boyd, HilpertAnderson, Burman, Land, McAdam and McAdamWalker retire from the Board at the forthcoming annual general meeting. Following consideration by the Board of the recommendations of the Nomination Committee, they offer themselves for re-election.
Officers
Mark Jenkins, 46,47, Group Company Secretary, appointed 1 March 2004. He is a barrister. Previously he was a director and Company Secretary at COLT Telecom Group plc and Group Company Secretary at Peek plc.
Timothy Jackson, 45, Company Secretary and Investor Relations Director, appointed in 1998. He is a Fellow of the Association of Chartered Certified Accountants. On 1 March 2004 he resigned as Company Secretary to focus on his duties as Investor Relations Director.barrister.
Liam O’Sullivan, 32,33, Group Treasurer, appointed 2 June 2003. Previously he was Group Treasury Manager at Rank Group Plc. He is a member of the Institute of Chartered Accountants in England and Wales and a member of the Association of Corporate Treasurers.
Stephen Card Timothy Jacksonwas Group Treasurer until, 46, Investor Relations Director, appointed in 1998. He is a Fellow of the Association of Chartered Certified Accountants. In March 2004 he resigned as Company Secretary to focus on his resignation on 28 March 2003.duties as Investor Relations Director.
No director or officer has any family relationship with any other director or officer.
AdvisersAuditorsAuditor
KPMG Audit Plc,
8 Salisbury Square, London EC4Y 8BB.
Financial advisersadviser
Lazard Brothers & Co. Limited,
50 Stratton Street, London W1JW1 J 8LL.
Stockbrokers
Deutsche Bank AG,
Winchester House,
1 Great Winchester Street, London EC2N 2DB.
JP Morgan Cazenove & Co. Ltd,
20 Moorgate, London EC2R 6DA
UK lawyerslawyer
Herbert Smith LLP,
Exchange House,
Primrose Street, London EC2A 2HS.
US lawyerslawyer
Weil, Gotshal & Manges,
One South Place, London EC2M 2WG.
Principal bankers
Barclays Bank PLC,
5 The North Colonnade, Canary Wharf, London E14 4BB.
HSBC Bank plc,
8 Canada Square, Canary Wharf, London E14 5HQ.
Royal Bank of Scotland plc,
135 Bishopsgate, London EC2M 3UR.
Wachovia Bank N.A.,
London Branch, 3 Bishopsgate, London EC2N 3AB.
RegistrarsRegistrar
Capita Registrars,
The Registry,
34 Beckenham Road, Beckenham, Kent BR3 4TU.
| 42 | Signet Group plc Annual Report & Accounts year ended |
Report of the directors
Business review
The principal activity of the Group is the retailing of jewellery, watches and gifts with branches throughout the UK and the US. A review of the Group’s performance during the year, with comments on the financial results and likely future developments, is set out on pages 7 to 2834 and forms part of this Report.
Going concern
On the basis of current financial projections and facilities available, the directors have a reasonable expectation that the Group has adequate resources to continue in operational existence for the foreseeable future and, accordingly, consider that it is appropriate to continue to adopt the going concern basis in preparing its annual accounts.
Results and dividends
The results of the Group for the year appear on page 56.66. The directors recommend the payment of a final dividend of 2.16p2.625p per share, to be paid on 28 July 20042005 to shareholders on the register of members at close of business on 410 June 2004.2005. An interim dividend of 0.341p0.375p per share was paid in November 20032004 making a total of 2.501p3.000p for the year (2002/03: 2.110p)(2003/04: 2.501p). See note 8 on page 6980 for waiver of dividend by Signet Group QUEST Limited.dividends.
Directors and alternate director
The directors who served during the period were James McAdam (Chairman), Lee Abraham, Robert Blanchard, Walker Boyd, Terry Burman, Dale Hilpert, Brook Land, Robert Walker and Russell Walls. Details of the current directors are shown on page 34. Richard Miller served41.
Independence of non-executive directors
Mr. Land was first elected to the Board as a director in June 1996, and therefore under the terms of the Combined Code maintenance of his “independent” status needs to be re-affirmed from June of this year. The Board has considered Mr. Land’s position and has concluded that he continues to be independent for the following reasons.
Mr. Land has no relationship with the Company, nor with any of the directors, which could impact his ability to remain objective or independent of mind. He does not provide any service to the Company and has no connections or ties to the Company other than in his capacity as a member of the Board.
Having been a practising lawyer Mr. Land comes from a professional background used to taking an alternate director.independent approach. He, where appropriate, challenges and questions
proposals in a positive and constructive way. This is an essential requirement of a strong independent non-executive director and the Board continues to value Mr. Land’s contribution.
Mr. Land will offer himself for re-election to the Board at the forthcoming annual general meeting.
Directors’ remuneration, service contracts and share interests
Details of directors’ remuneration, service contracts and the interests in the share capital of the Company of the directors and their immediate families at 3129 January 20042005 are given in the Directors’ remuneration report on pages 4251 to 53.63.
Allotment of equity securities
There were no equity securities allotted save in relation to the exercise of options as set out in note 27 on page 85.95.
Social, ethical and environmental matters
Matters relating to these issues, including employees, payment of creditors and charitable and political donations, are set out on pages 103115 to 106.119.
Substantial shareholdings and control of the Company
Details of substantial shareholdings and control of the Company are as set out on pages 109122 and 110.123.
Purchase of own shares
At 3129 January 20042005 there was outstanding an authority, granted by the shareholders at the annual general meeting in 2003,2004, to purchase, in the market, up to 171,400,228172,640,523 shares of 0.5p each in the Company at a minimum price of 0.5p per share and a maximum price of 105% of the average of the market values derived from the London Stock Exchange Daily Official List for the preceding five business days. During the financial year no purchases were made under this authority or proposed to be made and no purchases or options or contracts to make purchases have been made or entered into since the end of the financial year. The authority expires at the forthcoming annual general meeting and a resolution to renew it will be proposed at the meeting.
Pension funds
Information about the Group’s pension schemes is set out in note 2220 on page 79.87. Information about pension arrangements for executive directors is set out in the Directors’ remuneration report on pages 4251 to 53.63.
| Signet Group plc Annual Report & Accounts year ended 29 January 2005 | 43 |
Report of the directors (continued)
Auditor
The auditor, KPMG Audit Plc, is willing to continue in office and a resolution for its re-appointment as auditor of the Company will be submitted to the annual general meeting.
New York Stock Exchange (“NYSE”)
The Company’s shares were listed on the NYSE with effect from 16 November 2004 in the form of American Depositary Shares (“ADS”) having been until that date listed on the Nasdaq National Market (“Nasdaq”). Each ADS represents ten ordinary shares. Prior to 18 October 2004, the ratio of ordinary shares per ADS had been 30:1.
Annual general meeting
The annual general meeting is to be held at 12.00 noon11.00 am on 910 June 20042005 at The Café Royal, 68 Regent Street, London W1B 5EL. A description of the business to be transacted at the annual general meeting is included with the notice of the meeting.
By order of the Board
Mark Jenkins
Group Company Secretary24 March 2004
6 April 2005
| Signet Group plc Annual Report & Accounts year ended |
Corporate governance statement
The Board
The Board has as its prime objective the sustainable enhancement of business performance and shareholder value. It carries the responsibility for determining all major policies, for ensuring that effective strategies and management are in place, for assessing the performance of the Group and its senior management and for reviewing the system of internal control,controls, including those relating to social, ethical and environmental matters (see pages 103115 to 106)119). The Board also seeks to present to shareholders, potential investors and other interested parties a balanced and coherent assessment of the Company’s strategy, financial position and prospects. The Board retains responsibility for a range of specific matters including approval of the annual report and other documents circulated to shareholders by the Company; quarterly and annual results announcements; other trading statements; distribution policy; acquisitions, disposals, material agreements and capital expenditures outside predetermined limits set by the Board; risk management; budgets; long range plans; senior executive appointments; succession planningplanning; corporate governance and the setting of social, ethical and environmental policies.
The Board monitors all developments in corporate governance, including the revised Combined Code (the Financial Reporting Council’s “Audit Committees: Combined Code of Governance”, the “Smith Report”) and changes due to the Sarbanes-Oxley Act of 2002 in the US. The Board reviews its performance and procedures in the light of changing expectations regarding best practice and makes amendments, where it believes appropriate, to take account of them.
The formal schedule of matters reserved for the Board was updated in early 2004 and reviewed in 2005, and the division of responsibilities between the Chairman and the Group Chief Executive was set out in writing and agreed by the Board. In summary, the Chairman is responsible for:
| • | the effective running of the Board, including the evaluation of its performance and that of the individual directors, the balance of the Board and the Board’s compliance with corporate governance; |
| • | the review, prior to their presentation to the Board by executive management, of strategy, medium term plans and annual budget; |
| • | reviewing, prior to their presentation to the Remuneration Committee, the recommendations of the Group Chief Executive regarding the remuneration of senior executives and for making a recommendation regarding that of the Group Chief Executive; |
| • | maintaining contact with major shareholders to understand directly their issues and concerns; |
| • | keeping the non-executive directors appropriately informed of |
| developments within the business and shareholders’ attitude to the Group; and | |
| • | the reputation of the Group, and representing it both internally and externally. |
| The Chairman is also a member of the Nomination Committee. | |
In summary, the Group Chief Executive is responsible for:
| • | the executive leadership of the Group; |
| • | the development, and presentation to the Chairman and the Board, of strategy, medium term plans and budgets; |
| • | within this framework, for the performance of the business; |
| • | compliance with legal and corporate governance requirements, together with the social, ethical and environmental principles of the Group; and |
| • | making recommendations on the appointment and remuneration of senior executives and management development. |
The Group Chief Executive is also Chief Executive of the US division.
The Board met nineeight times in 2003/04,2004/05, including three extended sessions of more than one day. All directors attended all meetings of the Board with the sole exception of aone meeting forat which one directorMr. Walls was unable to attend.
The Board currently consists of sevennine directors: the Chairman, twothree executive directors (the Group Chief Executive, and the Group Finance Director)Director and the Chief Executive of the UK division), and fourfive independent non-executive directors, one of whom is nominated as the senior independent director. Incumbents are identified on page 34.41. Directors are subject to election at the first annual general meeting after appointment and then to re-election by shareholders at no more than three yearly intervals. The Board is of the view that fixed term or age limits should not be set for non-executive directors as it considers it important that the particular contribution being made by individual directors be taken into account in deciding their tenure of office and that the performance of each director be reviewed annually. Any non-executive director who has served on the Board for nine years since first being elected as a non-executive director must stand for annual re-election; also any director over the age of 70 must stand annually for re-election.
The mix of skills and business experience of the directors is considered to be appropriate for the proper and efficient functioning of the Board. The terms of reference of the Nomination Committee include the regular review of the composition and balance of the Board. No one individual has unfettered powers of decision and no individual or grouping is in a position to unduly influence the Board’s decision making.
| Signet Group plc Annual Report & Accounts year ended |
Corporate governance statement (continued)
a position to unduly influence the Board’s decision making. At least once a year the non-executive directors meet without the executive directors being present. They also meet occasionally without the Chairman being present.
On appointment new directors take part in an induction programme and are given an opportunity to familiarise themselves with the Group’s business, procedures and investor perceptions. In addition to meeting with management this process includes briefings from the Group’s external auditors, lawyers, financial advisers and stockbrokers. Directors are kept informed of the latest developments and best practice in corporate governance and attend relevant courses or receive appropriate training to equip them to carry out their duties. The non-executive directors are given regular opportunities to see the operations of the business and to meet management and staff.
All directors receive written reports in a timely manner prior to each meeting which enables them to make informed decisions on the issues under consideration.
The performance of the Board, its Committees and individual members is rigorously monitored.monitored to ensure that each director continues to contribute effectively and demonstrate commitment to the role. The Board has agreed a formal written procedure for the evaluation process which is conducted by the Chairman, in conjunction with the senior independent director and the Group Company Secretary. It consists of a structured discussion based upon a number of suggested questions and a questionnaire, completed by directors before the discussion session, designed to help in assessing the future development needs of the Board and the directors. The performance evaluation of the Chairman is led by the senior independent director and takes into account the views of both the non-executive and executive directors.
The Group Company Secretary is responsible, through the Chairman, for advising the Board on all governance matters and ensuring that Board procedures are followed. All directors have access to his advice and service. There is also a procedure for directors to take independent advice in the course of their duties, if considered appropriate, at the Group’s expense.
Board committees
Certain matters are delegated to Board committees, each with defined terms of reference, procedures, responsibilities and powers. The principal committees are as follows:
The Audit Committee has a clear written charterterms of reference which isare available on request from the Group Company Secretary orand on the Group’s web site. The charter wasterms of reference were updated during 2003/04.2003 and further reviewed during 2005.
The Audit Committee’s responsibilities include the review of the appropriateness and effectiveness of the Group’s accounting policies and financial procedures and oversight of the external auditor’s work, including the scope and result of the audit. The Audit Committee also reviews the workeffectiveness of the internal auditors, the Disclosure Control Committee and the Group’s whistleblowing procedures. The review of the whistleblowing procedures includes receiving reports on all matters raised and on actions taken. The Audit Committee also reviews the effectiveness of the Group’s internal control and risk management procedures and reports to the Board on these matters. The Audit Committee reviews, discusses with management and approves for submission to the Board all Group audited accounts, trading statements and selected internal financial reports. It also reviews reports submitted to the Board by the Group’s external auditor.
Following the introduction of the revised Combined Code, the Audit Committee will review the Group’s internal control and risk management systems and will report to the Board on their effectiveness.
The external auditor’s objectivity and independence is safeguardedmonitored by the Audit Committee having primary responsibility for making a recommendation on the appointment of the external auditor, the determination of their fees and making an annual assessment of their independence (including consideration of a written disclosure by the external auditor of all relationships that they have with the Company)Group). The planned rotation of partners and staff of the external auditor, together with a “cooling off” period before anyone from the external auditor joins the Group, also assist in maintaining the independence of the external auditor. The Audit Committee has reviewed and approved a policy for the provision of audit and non-audit services by the auditor.auditor which is compliant with the requirements of the Sarbanes-Oxley Act in relation to non-audit work. The policy requires that the Audit Committee approves in advance all audit and non-audit work carried out by the external auditor (subject to a de minimusminimis amount, this being then reported to the Audit Committee on a quarterly basis). The approval process requires disclosure of the objectives and scope of services to be performed in addition to the fee structure. The Audit Committee also reviews all approved services and fees at subsequent meetings. See page 6677 for details of fees paid to the external auditor.
The Audit Committee has an established channel of direct communication with the external auditor who normally attendattends meetings except in relation to certain aspects of their own appointment, assessment of their independence and determination of their fees. The Chairman, the Group Chief Executive, the Group Finance Director and others attend the meeting by invitation. The Audit Committee meets at least once a year with both the external auditor and internal auditors without executive management being present. The Audit Committee also meets on two occasions during the year for the purpose of being briefed on business and technical developments and to meet with divisional management to assess the risk and
| Signet Group plc Annual Report & Accounts year ended |
internal audit functions of both of the divisions. During 2004 a Business Risk Assurance Manager was appointed who reports to the Committee on the processes in relation to the mitigation and review of business risks.
All members of the Audit Committee are independent, as defined by the Combined Code, the SEC and the NYSE and the only remuneration members of the Audit Committee receive, from the Group, is as directors. Russell Walls succeeded Brook Land as chairman on 1 April 2003,is Chairman and is an “audit committee financial expert” as defined by the applicable Securities and Exchange CommissionSEC regulations. From 7 January 2004During the year the Audit Committee consisted of Dale Hilpert, Brook Land and Russell Walls. From 1 April 2003 to 7 January 2004 it consistedWalls with all having significant financial experience either as a result of Lee Abraham, Brook Land and Russell Walls andpositions held in other companies or from 2 February 2003 to 31 March 2003 Robert Blanchard was also a member.advising on such matters. The Audit Committee met sixnine times in 2003/04,2004/05, including a meeting entirely dedicated to the consideration of corporate governance matters. TwoAll directors were eachattended all Audit Committee meetings except for Mr. Walls who was unable to attend one meeting.
The Nomination Committee charter wasterms of reference were revised in early 2004/052004 to reflect corporate governance developments in the UK and the USUS. The terms of reference were reviewed in 2005 and isare available on request from the Group Company Secretary orand on the Group’s web site. The Nomination Committee has responsibility for reviewing the composition and balance of the Board, as well as Board and senior management succession. It also makes recommendations to the Board on all new Board appointments and nominations for re-election as directors. Once the Nomination Committee has agreed a job specification, the services of external recruitment agencies are used to identify suitable candidates for senior executive posts and for all Board appointments. The Nomination Committee carries out interviews with such individuals. The re-election procedures have been reviewed and formalised, particularly with regard to the performance evaluation procedures for individual directors. The review of any non-executive director, who is serving beyond six years from first being elected to the Board, is considered with particular care. No director is involved in any decision about his own re-appointment. The procedure for the election of directors is laid out on page 34.41.
When the role of the Group Chairman or any matter relating to succession to that role is discussed, the Chairman may be consulted, but the responsibility for preparing a job specification and making any recommendation to the Board rests solely with the independent non-executive directors of the Nomination Committee. The Nomination Committee also reviews a number of other senior appointments within the Group, such as that of the Group Company Secretary.
The senior independent director chairs the Nomination Committee. From 1 April 2003During the year the Nomination Committee consisted of Robert Blanchard, Brook Land, and James McAdam and from 2 February 2003McAdam. The Group Company Secretary acts as secretary to 31 March 2003 Lee Abraham and
Russell Walls were also members.the Nomination Committee. The Nomination Committee met foursix times in 2003/042004/05 and there was full attendance at all meetings.
The role of the Remuneration Committee is discussed in the Board report on remuneration on page 42.51.
Further details regarding the chairmen and members of these Committees are set out on page 34.41.
Executive management
The Group comprises two separate operating divisions, one in the US and one in the UK, each with a separate executive committee which meets regularly. The Group Chief Executive is also Chief Executive of the Group’s US division. The Group Finance Director and the Chief Executive of the UK division report to the Group Chief Executive.
The executive management is responsible to the Board for the performance of the Group and its compliance with the internal policies and procedures set by the Board. As part of this responsibility the executive management regularly reports to the Board on the performance of the Group, itsthe competitive environment and its relations with stakeholders.
Business strategies; long range plans; budgets; acquisitions, disposals, material agreements and capital expenditures outside predetermined limits set by the Board; and internal policies and procedures are presented to the Board by executive management for consideration. Within this approved framework the executive management is responsible for the day to day running of the business including: merchandising; store operations; human resource management and planning; marketing; real estate; financial reporting; treasury management; risk management; tax management; social, ethical and environmental matters; and communications with investors.
Code of Conduct and Code of Ethics
Signet strives to act in accordance with the laws and customs of each country in which it operates; to adopt proper standards of business practice and procedure; to operate with integrity; and to observe and respect the culture of each country in which it operates. To that end, the Group has adopted a Statement of Social, Ethical and Environmental Principles and supporting policies applicable to all officers and employees of the Group and substantially complies with the requirementrequirements of Nasdaq.the NYSE. In
| Signet Group plc Annual Report & Accounts year ended 29 January 2005 | 47 |
Corporate governance statement (continued)
addition, it has a policy on business integrity, as well as more detailed guidance and regulations in the Group’s staff induction, training and operational procedures. TheDuring 2004 the Group is
Corporate governance statement (continued)
currently reviewingreviewed these policies in order to meet the recently revised corporate governance requirements of the Nasdaq, National Market, which requireand implemented a code of business conduct and ethics. This Nasdaq requirementThe Company moved its US listing for its ADSs to the NYSE with effect from 16 November 2004, for which a similar code is not currently effective but will take effect after May 2004. required.
A code of ethics meeting the requirements of the Sarbanes-Oxley Act, covering the Chairman, the Group Chief Executive, the Group Finance Director and senior financial officers, is also in place. These codes are available on request from the Group Company Secretary orand on the Group’s web site.
Relations with shareholders
The Board recognises the importance of relations with shareholders and communicates regularly with them about the Group’s strategy, financial performance and prospects. It does this through documents distributed to shareholders, stock exchange announcements and in meetings. Presentations on quarterly and annual results and the Christmas trading statement are open to all interested parties, including private shareholders, through the use of teleconferences and web casting. Other presentations are available on the Group web site(www.signetgroupplc.com).site.
The Board recognises that the prime opportunity for private investors to question the Board is at a general meeting of shareholders. At the annual general meeting the chairmen of the Audit, Nomination and Remuneration Committees, in addition to the Chairman of the Board, are expectedrequired to be available for questions relating to the function of their respective Committees.Committees and all directors are expected to attend.
The Group Chief Executive, the Group Finance Director and the Investor Relations Director carry out an extensive programme of meetings with institutional investors. The Chairman and the senior independent director are also available to meet with investors from time to time. Following the appointment of a new non-executive director, majorMajor shareholders will in future beare offered an opportunity to meet new non-executive directors following the appointment of the individual.
The Board is kept informed of investment market attitudes to the Group by receiving regular reports on investor relations, copies of brokers’ research, press cuttings and third party surveys of investor perceptions.
Compliance statement and revised Combined Code
In June 1998 the London Stock Exchange published the Principles of Good Corporate Governance and the Code of Best Practice (“July 2003 the Combined Code”). Code was issued that applies for reporting years starting on or after 1 November 2003. During 2003/04 the Board reviewed the Combined Code, the Smith
Report and corporate governance developments in the US. Based on that review the Board agreed a programme of action that was completed during 2004/05. A further review of US requirements was undertaken when the Group moved its US listing for its ADSs to the NYSE from Nasdaq. The NYSE requirements are not mandatory for foreign issuer companies such as Signet, but the Group has chosen in general to comply as a matter of best practice.
In a limited number of areas the Group, as is permitted by the NYSE rules, has elected to defer to the UK corporate governance practices. This is permissible provided significant variations are explained. The explanation of those variations can be found on the Group’s web site.
The Board considers that it has complied throughout the year with the provisions of the Combined Code required to be observed by companies. In July 2003 a revised Combined Code was issued that applies for reporting years starting on or after 1 November 2003. During
2003/04 the Board reviewed the revised Combined Code, the Smith Report and corporate governance developments in the US. Based on that review the Board agreed a programme of action that has largely been completed with any remaining actions being scheduled for later in 2004/05.
Internal controlcontrols
The Combined Code requires that the directors review the effectiveness of the Group’s system of internal controlcontrols including the following areas:
| • | Financial |
| • | Operational |
| • | Compliance |
| • | Risk management |
Guidance for directors Internal Control: Guidance for Directors on the Combined Code(“the Turnbull guidance”) was published in September 1999. The Board of Directors considers that it has complied with the Turnbull guidance throughout the year and up to the date of approval of this Annual Report & Accounts. In addition, during 2003/042004/05 the Board continued to review the implications of the Sarbanes-Oxley Act and took steps to ensure compliance.
The Board exercises ultimate responsibility for the Group’s system of internal controls and for monitoring its effectiveness. The internal controlcontrols system is designed to safeguard shareholders’ investmentinvestments and the Group’s assets, both tangible and intangible, including the reputation of the Group with its various stakeholders. Procedures are in place to ensure the maintenance of proper accounting records, the reliability of the financial information used within the business or for publication and the determination of disclosure obligations and of materiality. These procedures also cover disclosure on a timely
| 48 | Signet Group plc Annual Report & Accounts year ended 29 January 2005 |
basis of information to the investment markets. However, such procedures are designed to manage rather than wholly eliminate the risk of failure to achieve business objectives and can provide only reasonable, not absolute, assurance against material misstatement or loss.
Signet’s disclosure control procedures are designed to help ensure that processes and procedures for information management are in place at all levels of the Group. The disclosure control procedures aim to ensure that any information disclosed by the Group is recorded, processed, and summarised appropriately. The procedures are also designed to ensure that information is accumulated and communicated to management
to allow timely decisions to be made regarding required disclosure. The Group’s Disclosure Control Committee consists of the Group Finance Director, the Group Company Secretary, the Investor Relations Director and the Group Financial Controller who consult with the Group’s external advisers and auditorsauditor, as necessary. These procedures are designed to enable Signet to make timely and accurate public disclosures.
Key procedures designed to provide effective internal controlcontrols are:
| • | Control environment – control is exercised through an organisational structure with clearly defined levels of responsibility and authority together with appropriate reporting procedures, particularly with respect to financial information, capital expenditure, investment, granting of guarantees and the use of treasury products (see |
| • | Reporting and information systems – the Group has a comprehensive budgeting and five year strategic planning system with an annual budget and strategic plan approved by the Board. |
| The Group as part of its ongoing review of procedures has taken steps to strengthen resources committed to meet the |
| increasing demands of corporate governance, to comply with the Sarbanes-Oxley Act, to monitor and address evolving and more complex accounting standards, including changes in the application and interpretation of US GAAP and the transition from UK GAAP to IFRS. Accordingly during the year, the Group has separated the roles of Group Company Secretary and Investor Relations Director. In addition, a Business Risk Assurance Manager was appointed to co-ordinate risk management information and processes; he is responsible for assessing the risk management and internal controls for the Group, ensuring such processes satisfy the applicable standards in both the UK and the US and he reports his findings to the Group Audit Committee. At the divisional level in both the UK and the US, the internal audit functions have been strengthened with particular focus on review of internal control | |
| The Group issues both sales and financial results on a quarterly basis. The external auditor reviews the quarterly and half year statements, and Christmas | |
| • | Risk management – the identification of major business risks is carried out in conjunction with operational management and appropriate steps are taken to monitor and mitigate risks. The Risk Management Committee, whose members include the Group Finance Director, the Business Risk Assurance Manager and senior divisional executives, meets on a regular basis, at least four times a year. Matters considered by the Risk Management Committee include reviews of the Group’s risk register, emerging issues, new |
| regulations and the activity of the internal audit function. The external | |
| • | Control procedures – each operating division maintains documented financial and operating controls as well as procedures appropriate to its own business environment and in conformity with Group guidelines. Each of the operating divisions has an internal audit function which primarily reviews the processes in the store operations but also reviews central service functions. The work of the internal audit function is monitored by senior divisional executives, Group management, the Risk Management Committee and the Audit Committee. |
| Signet Group plc Annual Report & Accounts year ended 29 January 2005 |
Corporate governance statement (continued)
Other than as discussed under “Reporting and Information Systems” above, there have been no changes in the Group’s internal controls over financial reporting during the period covered by this Annual Report & Accounts that have materially affected, or are reasonably likely to materially affect those controls.
Based on their review of the Group’s disclosure controls and procedures, as of the end of the period covered by this Annual Report & Accounts, the Group Chief Executive and Group Finance Director have concluded that the Group’s current disclosure controls and procedures are effective in achieving their objective of ensuring that information regarding the Group is recorded, processed, summarised and reported and that the information is accumulated and communicated to management to allow timely decisions regarding required disclosure.
In reaching the conclusion on effectiveness of disclosure controls, the Group Chief Executive and Group Finance Director considered the disclosure controls in light of the restatement of the US GAAP reconciliation for adjustments for lease accounting and accounting for extended service plans described in note 31 to the financial statements. After considering the materiality, timing and nature of the information relating to restatements they continued to conclude that the disclosure controls were effective as of the evaluation date.
It should be noted that while the Group Chief Executive and Group Finance Director conclude that its disclosure controls and procedures are effective to provide a reasonable level of assurance, they recognise such disclosure controls cannot eliminate all error and fraud. They concludedare designed to provide only reasonable, not absolute, assurance that there have not been any significant changes in the Group’sobjectives of this control system are met.
Sarbanes-Oxley Act of 2002
As a Foreign Private Issuer, Signet is required to comply with Section 404 of the Sarbanes-Oxley Act of 2002 (“the Act”) for fiscal years ending on or after 15 July 2006. The primary requirement of the Act is that management perform appropriate due diligence to conclude on the design and operating effectiveness of internal controls over financial reporting duringreporting. To date, significant effort has been afforded to establish structured project teams within the period coveredUK and US divisions and at the corporate level. The overall project is coordinated by the Business Risk Assurance Manager who communicates closely with the Group Finance Director and manages relationships with the Group adviser Ernst & Young, KPMG as auditor and the Audit Committee on all issues relating to Sarbanes-Oxley.
The initial step of the project was the production of a detailed Risk Assessment and Mapping document, which carefully scoped out the work required based on an analysis of the financial statements for the year ended 2003/04. Following this Annual Reportdetailed scoping assessment, significant individual accounts were linked to relevant process streams that would be documented and assessed going forward.
Consistent with the Group’s structure, the project effort is focused predominantly within the divisions, additional work being required to complete those processes that are unique to the corporate function. In total, 11 key process streams are identified to be within scope in the US division, compared with ten in the UK. The corporate function effort involves three unique key process streams.
The documentation phase is well underway with a significant amount of the documentation required for the key process streams now completed. Key controls have materially affected, or are reasonably likely to materially affect those controls.been identified for each of the process streams involved and these will form the basis of the testing phase of the project following which any identified gaps will be prioritised for remediation on a timely basis.
| 50 | |
| Signet Group plc Annual Report & Accounts year ended |
Directors’ remuneration report
Information contained in sections and figures marked ß has been audited.
1. The role of the Remuneration Committee
The prime purpose of the Remuneration Committee is to set the remuneration policy for executive directors and senior managers and to ensure that they are fairly rewarded for their individual contribution to the Group’s overall performance, having due regard to the interests of shareholders, toand the financial and commercial health of the GroupGroup.
The Company’s remuneration policy seeks, by application of the six principles detailed below, to provide an overall remuneration package to a value within a specific range. The way that each package as a whole is structured, and the components that make it up, may differ. Due to the relevant market placesignificant differences in remuneration practices in the two countries in which recruitment takes place.the Group operates, the level of remuneration is based upon surveys which are undertaken in both the UK and the US.
All members of the Remuneration Committee are independent non-executive directors andwho do not have any personal financial interest (other than as shareholders) in matters decided by the Committee. No executive director or senior manager is involved in determining his or her own remuneration.
The Remuneration Committee sets the remuneration of the Chairman of the Board (James McAdam).Board. It also sets that of the Group Chief Executive (Terry Burman) after consultation with the Chairman. The remuneration of the other executive directordirectors and certain senior managers is set by the Committee based on recommendations made by the Group Chief Executive after consultation with the Chairman of the Board. Performance targets are set by the Committee in consultation with the Chairman of the Board and, where appropriate, external professional consultants. Where executive directors are involved in advising and assisting the Remuneration Committee, care is taken to recognise and avoid possible conflicts of interest.
The Remuneration Committee draws on external professional advice on a regular basis and makes use of relevant and reliable independent market surveys. In 2002/03 theThe Committee appointedhas retained Towers Perrin as advisers to assist it. Towers Perrinit and they are not retained in any other capacity within the Group. In addition Addleshaw Goddard (to 8 July 2003), Herbert Smith (from 8 July 2003)(on UK aspects) and Weil, Gotshal & Manges (on US aspects) advised the Remuneration Committee on legal matters. These firms also providedprovide general legal advice to Signet.
The remuneration of the non-executive directors is not within the remit of the Remuneration Committee. Such remuneration is
determined by the Chairman and the executive componentmembers of the Board following a recommendation by the Chairman after consideration of, among other factors, external comparisons, and the time commitment and responsibility of the role.responsibilities.
From 2 February 2003 to 31 March 2003 theThe Remuneration Committee consistedconsists of Lee Abraham,Robert Blanchard (Chairman), Brook Land Robert
Blanchard (Chairman)(until 1 March 2005), Russell Walls and Russell Walls. FromRobert Walker (from 1 April 2003 to 7 January 2004 the Committee consisted of Lee Abraham, Robert Blanchard (Chairman) and Russell Walls. Lee Abraham retired and Brook Land rejoined the Remuneration Committee on 7 January 2004.March 2005). The Committee met nineeight times during 2003/042004/05 and there was full attendance at all meetings.
The terms of reference for the Remuneration Committee are available on request from the Group Company Secretary and are on the Group’s web site.
2. Remuneration policy
The Remuneration Committee believes that the Group’s remuneration policy must be based on sound, clearly stated principles which recognise the long term interests of the Group, its shareholders and employees. After careful consideration during 2002 and 2003,2002/03, the Remuneration Committee formally adopted a set of six principles. Following a further review by the Remuneration Committee in early 20042005 these principles remain unaltered and they are set out below:
| (i) | Signet’s primary business objective |
| (ii) | It is recognised that to consistently deliver |
| (iii) | It is also recognised that retaining, and where necessary recruiting, senior executives of this calibre will require that the Group provide above |
| (iv) | Therefore, Signet’s executive directors and other senior executives should be remunerated in a range beginning with the 51st and ending with the 75th percentiles of industry total remuneration, based on current surveys of relevant companies appropriate to the executive’s position and geographic location. The remuneration of each executive within this range will be based on performance (both of the Group and the individual executive), potential (i.e. the executive’s potential to grow in responsibility and performance), and scarcity (i.e. the availability of candidates to replace the executive should he/she leave the Group). |
| Signet Group plc Annual Report & Accounts year ended 29 January 2005 | 51 |
Directors’ remuneration report (continued)
| (v) | Total remuneration for executive directors and other senior executives should be highly geared towards performance with the proportion of “at risk” pay increasing disproportionately according to: a) the level of performance achieved, and b) the seniority of the |
| be only one element of guaranteed remuneration; base salary. The performance related portion of total remuneration should reward short term and long term performance separately, with the potential level of payment being heavily weighted in favour of the latter. Short term achievement should be recognised through the annual bonus plan with long term achievement being rewarded through executive share option awards and participation in long term incentive plans. | |
| (vi) | Surveys will be undertaken on a regular basis to ensure that total remuneration packages remain in the percentile range described in (iv) above. Recognising that some 70% of Signet’s sales and profits are generated in the US and that significant differences in remuneration practices exist between the US and the UK, separate surveys will be conducted in each country. |
The components of total remuneration are:
(a) Base salary
The base pay of each senior executive is intended to reflect the size and scope of that executive’s responsibilities. Base salary is reviewed annually, taking into account factors such as the level of individual performance, experience over time in the post, relevant external comparative data, the geographic location of the post and the general movement of base pay within the Group.
(b) Annual bonus plan
Individual annual bonus targets are set each year to take account of the role of the executive and current business plans. Annual bonus awards for executive directors are based on the achievement of growth in pre-tax profit in the year at a rate above inflation.inflation measured using constant exchange rates. There is a cap set each year on such awards and a threshold performance below which no payments are made. The bonus rate increases after an intermediate target rate of profit growth, which is set each year, is achieved.
From the start of 2004/05 the growth in pre-tax profits will be measured using constant exchange rates. The Remuneration Committee believes this change to be appropriate as it will avoid subsequent foreign exchange rate movements unjustly rewarding, or unfairly penalising, Group senior management. It will also bring Group senior management bonuses on to the same basis as divisional senior management, whose bonuses are unaffected by exchange rates.
(c) Share option planplans
The Remuneration Committee believes that an executive share option plan is an appropriate part of the total remuneration package necessary to execute the remuneration principles
set out on pages 4251 and 43,52, and that a well constructed plan forms an
important element in motivating executives to deliver the long term performance needed to generate strong returns to shareholders.
It is the policy of the Remuneration Committee that all employees, including directors, who satisfy certain qualifying conditions, should have the opportunity to participate in the equity of the Company through a savings relatedsavings-related share option plan, and annual invitations are normally made. Under the relevant legislation the exercise of these share options is not subject to performance criteria.
(d) Long term incentive plan (“LTIP”)
The Remuneration Committee believes that, in addition to the provision of share options, it is appropriate to operate an LTIP to encourage executive directors, senior members of the divisional executive management committees and certain other senior executives with a similar level of responsibility, to meet long term strategic and financial objectives set by the Board. The policy is to make annual awards subject to the general principles explained in paragraphs 2(iv) and 2(v) above. Vesting is dependent on the achievement of challenging performance conditions set by the Committee at the time the awards are made and such awards do not normally vest within three years from the date the award is granted.
(e) Performance criteria
The Remuneration Committee believes that where performance criteria are used they should be:
| • | easily understood, |
| • | able to be directly linked to the performance of the Group or relevant business unit and to be influenced by management’s own actions, |
| • | designed to motivate management to increase profitability significantly beyond the rate of inflation, |
| • | designed to incentivise senior management to make efficient use of capital and to increase shareholder value, |
| • | equity based for long term schemes, and |
| • | consistent with the overall objectives of the Group. |
The criteria used to measure performance are based on the results of the Group (subject to minor adjustments that are approved by the Remuneration Committee) so as to provide clarity and objectivity.
(f) Pensions for executive directors
UK based executive directors are normally members of the Group Scheme.
| 52 | |
| Signet Group plc Annual Report & Accounts year ended |
Directors’ remuneration report (continued)
At the present time there is only oneare two such director,directors, the Group Finance Director.Director and the Chief Executive of the UK division. The Group Scheme is a funded, Inland Revenue approved, final salary, occupational pension scheme and has a separate category of membership for directors.directors (although only the Group Finance Director is in this category currently). Pensionable salary is the member’s base salary, excluding all bonuses. All Group Scheme benefits are subject to Inland Revenue limits. Where such limitation is due to the Inland Revenue earnings cap the Signet Group Funded Unapproved Retirement Benefit Scheme (the “FURBS”) is used to supplement pension benefits. This is a defined contribution arrangement.
The main features of the Group Scheme for a director (currently only the Group Finance Director) are:
| (i) | a normal pension age of 60; |
| (ii) | pension at normal pension age of two-thirds of final pensionable salary, subject to completion of 20 years’ service; |
| (iii) | life assurance cover of four times pensionable salary; and |
| (iv) | spouse’s pension on death. |
The Group Chief Executive receives, proportionately to base salary, equivalent pension contributions to the UK based executive director.Group Finance Director. These pension benefits are provided through an unfunded, unqualified deferred compensation plan and the Sterling Jewelers Inc. 401(k) Retirement Savings Plan. This is a defined contribution arrangement.
In the context of impending changes to pension taxation in the UK in 2006, no changes have yet been made to the pension arrangements of executive directors or senior executives. The Remuneration Committee will be consulting with its professional advisers on the appropriateness of any changes which may be proposed for future pension provision in due course.
Apart from remuneration itself, there are certain other allied policy matters which are the concern of the Remuneration Committee. These are:
(i) Companies used for comparison
In assessing all aspects of pay and benefits, the Remuneration Committee takes account of the packages offered by a range of other retailers and, where appropriate, companies outside the retail sector. Different companies are used for comparison for executives in Group functions, and in the UK and the US divisions. These companies are chosen on the basis of turnover, market capitalisation, profits, number of employees and the nature and geographic spread of their operations. There have been no significant changes in the comparator companies used during the year.
(ii) Service contracts
It is the policy of the Remuneration Committee that an executive director’s contract should be a one year rolling contract with the period of notice to terminate the contract to be given by either side not exceeding one year and that, if it is necessary to grant a longer period of notice when recruiting from outside the Group, this should reduce to a maximum of one year after an initial period. No director has a service contract of more than one year.
(iii) Early termination
The Remuneration Committee believes that the circumstances of early termination vary. Only in very exceptional circumstances will explicit terms for compensation for early termination be included in contracts for new directors. Where no explicit compensation terms are included, departing directors or senior managers are expected to mitigate their loss within the framework of individual circumstances.
(iv) Executive directors – outside appointments
The Group recognises the benefits to the individual and to the Group when executive directors of the Company also act as non-executive directors of other companies not associated with Signet. Subject to certain conditions, unless otherwise determined by the Board, executive directors are permitted to accept one appointment as a non-executive director of another company. The executive director is permitted to retain any fees paid for such service. Unless otherwise determined by the Board, executive directors may not normally accept more than one such non-executive directorship. During 2003/04 no executive director had an outside appointment. On 3 March 2004 Walker Boyd became a non-executive director of WH Smith PLC.
3. Directors’ remuneration
The remuneration package of the Group Chief Executive, the highest paid director, is determined with regard to the fact that he is a US citizen, based in the US and his remuneration is set in US dollars and not pounds sterling. Some 70% of Group sales and profits are generated in the US.
(a) Salary and benefits
The Remuneration Committee normally reviews the salary and benefits of executive directors annually. Details of the salaries received by executive directors are shown on page 45.54. Following the 20042005 annual reviews the Remuneration Committee increased the Group Chief Executive’s basic salary from $1,210,000$1,283,000 to $1,283,000$1,354,000 and that of the Group Finance Director from £310,000£330,000 to £330,000.£350,000. The Chairman’s remuneration was increased from £300,000£327,000 to £327,000.£350,000. The basic salary of the Chief Executive of the UK division is £295,000, having been increased from £280,000 as part of the review.
(b) Annual bonus plan
In 2003/042004/05 an annual bonus of 23.0%71.0% (maximum 100%) of base salary was paid to the Group Chief Executive and 17.2%53.3% (maximum 75%) to the Group Finance Director, reflecting the 6.0%12.1% increase in reported pre-tax profit. At constant exchange rates the Group achieved a 13.0% increase in pre-tax profit, which would have earned a bonus of 80.0% of base salary for the Group Chief Executive and 60.0% for the Group Finance Director. As the Remuneration Committee believes that these
| Signet Group plc Annual Report & Accounts year ended | 53 |
Directors’ remuneration report (continued)
Directors’ emolumentsß
Details of directors’ emoluments for the year to 3129 January 20042005 were as follows:
| Short term | Termination | |||||||||||||||||||
| Basic salary or fees | Benefits(1) | bonuses | payments(2) | Total | ||||||||||||||||
| 2004 | 2003 | 2004 | 2003 | 2004 | 2003 | 2004 | 2003 | 2004 | 2003 | |||||||||||
| £000 | £000 | £000 | £000 | £000 | £000 | £000 | £000 | £000 | £000 | |||||||||||
| Executive | ||||||||||||||||||||
| James McAdam | ||||||||||||||||||||
| Chairman | 296 | 271 | 23 | 24 | – | – | – | – | 319 | 295 | ||||||||||
| Walker Boyd | ||||||||||||||||||||
| Group Finance Director | 308 | 291 | 22 | 21 | 116 | 131 | – | – | 446 | 443 | ||||||||||
| Terry Burman(3) | ||||||||||||||||||||
| Group Chief Executive | 714 | 743 | 26 | 30 | 360 | 444 | – | – | 1,100 | 1,217 | ||||||||||
| Ian Dahl(4) | ||||||||||||||||||||
| former Chief Executive of | ||||||||||||||||||||
| UK division | – | 184 | – | 15 | – | – | – | 304 | – | 503 | ||||||||||
| Non-executive | ||||||||||||||||||||
| Lee Abraham(5) | 35 | 35 | – | – | – | – | – | – | 35 | 35 | ||||||||||
| Robert Blanchard | 38 | 35 | – | – | – | – | – | – | 38 | 35 | ||||||||||
| Brook Land | 38 | 35 | – | – | – | – | – | – | 38 | 35 | ||||||||||
| Dale Hilpert(6) | 17 | – | – | – | – | – | – | – | 17 | – | ||||||||||
| Russell Walls(7) | 38 | 18 | – | – | – | – | – | – | 38 | 18 | ||||||||||
| David Wellings(8) | – | 13 | – | – | – | – | – | – | – | 13 | ||||||||||
| Total | 1,484 | 1,625 | 71 | 90 | 476 | 575 | – | 304 | 2,031 | 2,594 | ||||||||||
| Basic salary or fees | Benefits(1) | Short term bonuses | Total | |||||||||||||
| 2005 | 2004 | 2005 | 2004 | 2005 | 2004 | 2005 | 2004 | |||||||||
| £000 | £000 | £000 | £000 | £000 | £000 | £000 | £000 | |||||||||
| Executive:(2) | ||||||||||||||||
| James McAdam Chairman | 323 | 296 | 24 | 23 | – | – | 347 | 319 | ||||||||
| Walker Boyd Group Finance Director | 327 | 308 | 23 | 22 | 176 | 116 | 526 | 446 | ||||||||
| Terry Burman(3) Group Chief Executive | 683 | 714 | 26 | 26 | 490 | 360 | 1,199 | 1,100 | ||||||||
| Non-executive: | ||||||||||||||||
| Lee Abraham(4) | – | 35 | – | – | – | – | – | 35 | ||||||||
| Robert Blanchard | 43 | 38 | – | – | – | – | 43 | 38 | ||||||||
| Brook Land | 44 | 38 | – | – | – | – | 44 | 38 | ||||||||
| Dale Hilpert | 42 | 17 | – | – | – | – | 42 | 17 | ||||||||
| Robert Walker(5) | 12 | – | – | – | – | – | 12 | – | ||||||||
| Russell Walls | 43 | 38 | – | – | – | – | 43 | 38 | ||||||||
| Total | 1,517 | 1,484 | 73 | 71 | 666 | 476 | 2,256 | 2,031 | ||||||||
| (1) | Benefits incorporate all benefits arising from employment by the Group, which in the main relate to the provision of a company car and private health insurance. |
| (2) | |
| (3) | Terry |
| (4) | |
| Until his retirement on 8 January 2004. | |
| From his appointment on | |
| The figures above represent emoluments earned as directors during the relevant financial year. Such emoluments are paid in the same financial year with the exception of bonus payments, which are paid in the year following that in which they are earned. | |
executives should not be unfairly benefited or penalised by short term movements in profit before tax at constant exchange rates, it decided to award discretionary bonuses of 27.0% and 20.3% to the Group Chief Executive and Group Finance Director. These payments took the totalrates. The bonus payments up to the target level being 50.0% for the Group Chief Executive and 37.5% for the Group Finance Director set bywere calculated for 2004/05 on the Remuneration Committee even though performance atbasis of the following formula:
2003/04 pre-tax profit + inflation: 0% of base salary
2003/04 pre-tax profit + 10%: 50% of base salary
2003/04 pre-tax profit + 15%: 100% of base salary.
Increase in pre-tax profit is calculated on a constant exchange rates would have justifiedrate basis and is earned on a
significantly higher figure. Short term bonus targets will in future use constant exchange rates. pro-rata basis for performance between the targets.
In 2004/05 theAn annual bonus of 8.1% (maximum 75%) was paid to the Group Chief Executive is capped at 100% of base salary and that of the Group Finance Director at 75%UK division on the same formula but based on operating profit of base salary. The potential rate of bonus increases on a straight line basis from the rate of inflation up to an intermediate targetUK division.
Bonus targets for growth in Group profit before tax at
Directors’ remuneration report (continued)
constant exchange rates, then an accelerated rate applies until the maximum bonus can be earned at 15% growth. The minimum bonuses2005/06 are only payable after profits increase by more than inflation.unchanged.
(c) Share option and long term incentive plans
Share options grantedoption and long term incentive plan grants to directors are set out on page 50.pages 60 and 61 respectively. See page 4352 for the factors influencing the choice of performance criteria and for the basis of measurement.
(i) Executive share option plans
In July 2003, following consultation with the Association of British Insurers and a significant number of major shareholders, approval was given by shareholders at an extraordinary general meeting to the Signet Group plc International Share Option Plan 2003, the Signet Group plc UK Inland Revenue Approved Share Option Plan 2003 and the Signet Group plc US Share Option Plan 2003 (“2003 Plans”). Of the votes cast by proxy at the extraordinary general meeting 87% were in favour of the proposal. 1,160,619,434 votes were cast (68% of the issued share capital) and abstentions in respect of 7% of the issued share capital were received.
The 2003 Plans replacereplaced the Signet Group plc 1993 Executive Share Option Scheme (the “1993 Scheme”), under which no further options may be granted.
The 2003 Plans allow the Remuneration Committee discretion to set performance conditions. The performance conditions under the 2003 Plans were set out in the circular to shareholders seeking approval for the 2003 PlanPlans and no significant change in those conditions will be made without prior consultation with major shareholders.
| 54 | Signet Group plc Annual Report & Accounts year ended 29 January 2005 |
The Remuneration Committee is fully aware that re-testing of share option performance criteria is increasingly thought not to be UK best practice and has therefore given careful consideration as to how this issue might be addressed.
The present share option plans came into effect less than two years ago, (July 2003) and the Remuneration Committee believes that removal of the re-tests for the Signet 2005/06 grants would be inappropriate at such an early stage. The Committee also believes that account must be taken of the present adverse impact of the US exchange rate on the Group results, which is not within the control of the executives and could well be the sole reason for options failing to vest.
However, the Remuneration Committee concluded that a full review of all aspects of remuneration, including the elimination of re-testing of share options, should be undertaken later this year, following the expiry of the LTIP in June 2005. Major shareholders will of course, be consulted and all shareholders will be able to vote on the new arrangements as appropriate at the 2006 annual general meeting.
The Remuneration Committee made the 20042005/06 option grants on the same basis as in 2003/04 and 2004/05. Options granted under the 2003 grants. executive share option plans that have passed the necessary performance conditions are normally only exercisable between three and ten years from the date of grant, after which the options lapse.
The conditions are set out below:
UK executives
For UK executives the personal performance of participants will be assessed on each occasion that share option grants take place and will be reflected in the level of the individual awards.
In addition, grants are subject to exercise conditions as follows:
| Level of grant | ||||
| Required annual rate of | ||||
| compound growth in earnings | ||||
| Up to 200% of base salary | +3% | |||
| 201% to 400% of base salary | +4% | |||
| Above 400% of base salary | +5% | |||
| (1) | Normalised earnings per share as defined by the Institute of Investment Management and Research. | |
| (2) |
Performance will be measured over three | |
Options granted under the executive share option plans are normally only exercisable between three and ten years from the datestart of grant, afterthe financial year in which the options lapse.grant is made, and may then be measured from the same start point only to the end of the fourth or fifth years if not previously satisfied.
US executives
For US executives there is a pre-grant test based on both personal and corporate performance as described later, as well as a post-grant exercise condition requiring that the annual compound growth in earnings per share be more than 3% above inflation.
The post-grant performance condition will be measured over three years from the start of the financial year in which the award is made, and may then be measured from the same start point only to the end of the fourth or fifth years if not previously satisfied.
In July 2003April 2004 options of five times salary were awarded to the Group Chief Executive. In 2004The Group Finance Director was awarded options amounting to fiveone and a half times salary will be awardedsalary. Awards to the Group Chief Executive the grant price to be fixed following the announcement of the preliminary results. The awards to the Group Chief Executive wereare based on principles 2 (iv)2(iv), 2 (v)2(v), 2 (vi)2(vi) (set out on pages 4251 and 43)52), a comparative remuneration survey that was undertaken, and reflecteda review of the strong performance of both the Group and the executive over the prior three years. In
Before any share option grant is made to the caseGroup Chief Executive, the Remuneration Committee has to satisfy itself that the demanding pre-grant conditions, mentioned above, have been achieved. This requires affirmation: (1) that the Group’s business performance has been superior to that of its industry sector; and (2) that the Group Chief Executive’s personal performance continues to be of the highest standard.
On a divisional basis this business performance review includes a three year comparison of compound like for like as well as total sales growth compared in the US to that of the US quoted jewellery sector and in the UK to the UK quoted general retail sector. Further there is a similar comparison of operating margin compared to the Group’s principal competitors in the US and the UK.
On a Group basis the review includes a comparison of compound three year earnings per share growth, at constant exchange rates, like for like as well as total sales of the UK general retail sector of FTSE 100 companies. Further there is a similar comparison of total shareholder return against that of the FTSE 350 companies (excluding investment trusts) and the FTSE general retailers index.
The Remuneration Committee concluded that the review had confirmed in 2005/06 that the pre-grant conditions had been achieved reflecting performance at the top end of the scale.
On the basis of sustained out-performance and with management achievements acknowledged by industry followers, the Committee concluded that the Group Chief Executive and Group Finance Director continued to merit total remuneration towards the upper end of the range determined by the remuneration
| Signet Group plc Annual Report & Accounts year ended 29 January 2005 | 55 |
Directors’ remuneration report (continued)
principles. Based on the surveys conducted, this indicated a base salary increase as detailed on page 53 and a share option grant equivalent to 5 times base salary, the same level as awarded in the previous year, for the Group Chief Executive. Similar surveys undertaken in the UK indicated a base salary, increase as detailed on page 53 for the Group Finance Director he was awarded options amounting to one and a quarter times salary in July 2003 and will be awarded options amounting to one and a half times salary, the same level as awarded in 2004.the previous year. Similarly the Chief Executive of the UK division was awarded options amounting to one times salary.
Certain provisions of all the share option plans may be amended by the Board, but certain basic provisions (and in particular most of the limitations on individual participation, the number of shares and the percentage of share capital that can be issued thereunder) cannot be altered to the advantage of the participants except with the approval of the shareholders of the Company or in accordance with the adjustment provisions in the 2003 plans.
The Remuneration Committee has approved an amendment to the 2003 Plans (other than the Inland Revenue Approved Plan) to provide that, on exercise, options may be satisfied by the Company providing to the optionholder shares with a value equal only to the gain on exercise, without the requirement of a payment of the exercise price. This does not provide any financial benefit to either the Company or optionholders, but results in less dilution for shareholders.
(ii) All-employee share plans
In 1998/99 the Group introduced an Inland Revenue approved savings related share option scheme for UK employees (the “Sharesave Scheme”), a US Section 423 Plan (the “Employee Stock Savings Plan”) and a savings related share option scheme for employees in the Republic of Ireland (the “Irish Sharesave Scheme”), together,(together, the “All-employee Schemes”). These schemes give those employees with qualifying service the opportunity to participate in the equity of the Company, with the aim of aligning the interests of employees with those of shareholders.
The options granted under the Sharesave Scheme and the Irish Sharesave Scheme are normally exercisable between 36 and 42 months from the date of the relevant savings contract. Options were granted under these plansschemes at a price approximately 20% below the middle market price of the shares on the London Stock Exchange on the dealing day prior to the date that employees were invited to participate in them.
The options granted under the Employee Stock Savings Plan, which is for employees in the US, are normally exercisable between 24 and 27 months from the date of grant, such date being the first business day of any period during which savings may be accumulated under a savings contract. The options under
this plan were granted at a price approximately 15% below the middle market price of the shares on the London Stock Exchange on the date of grant. The period of exercise and the discount allowed vary from the UK due to different legal regulations in the US.
(iii) Long term incentive plan
Shareholders gave approval, in June 2000, to the Signet Group plc 2000 Long Term Incentive Plan (“2000 LTIP”).
Awards were made to executive directors and other senior executives in 2000/01, 2001/02, 2002/03, 2003/04 and 2003/04.2004/05. All these awards are subject to fulfilment of minimum performance conditions set at the time of the award as to:
| • | compound annual growth in the profit before tax of the Group using a constant exchange rate or as in the case of the Chief Executive of the UK division the operating profit of the relevant division as appropriate (“Profit Growth”) and |
| • | the return on capital employed (“ROCE”) of the Group or relevant division as appropriate |
in each case over a fixed period of three successive financial years starting with the one in which the award was made. Nothing is payable under the award unless both minimum performance conditions are achieved. The minimum Profit
Growth is set at a threshold level after taking account of inflation. The conditions were selected to ensure that awards would only vest provided that growth in profits exceeded the rate of inflation and that the business’s targeted ROCE is achieved.
If the performance conditions are achieved the award will vest and its value will depend on the extent to which the minimum performance conditions are exceeded:
| 2000 LTIP performance criteria | ||||||||
| 2004/05 | 2003/04 | 2002/03 | 2001/02 | |||||
| award | award | award | award | |||||
| Minimum performance for any vesting | ||||||||
| Profit measure | Profit Growth in excess of threshold inflation level | |||||||
| ROCE measure | 22.2% | 21.0% | 20.5% | 20.5% | ||||
| Profit Growth performance measure | ||||||||
| Profit Growth rate inflection point | 10.0% | 10.0% | 10.0% | 10.0% | ||||
| Profit Growth rate required for maximum vesting | 15.0% | 15.0% | 15.0% | 15.0% | ||||
| ROCE performance measure | ||||||||
| Specified ROCE required | 23.2% | 22.0% | 21.5% | 22.5% | ||||
| 56 | Signet Group plc Annual Report & Accounts year ended |
Directors’ remuneration report 2000 LTIP performance criteria(continued)
| 2005/06 award(1) | 2004/05 award | 2003/04 award | 2002/03 award | ||||||||||||||
| Group | UK | Group | UK | Group | UK | Group | UK | ||||||||||
| Minimum performance for any vesting: | |||||||||||||||||
| Profit measure | Profit Growth in excess of threshold inflation level | ||||||||||||||||
| ROCE measure | 22.8 | % | 42.3 | % | 22.2 | % | 43.0 | % | 21.0 | % | 35.0 | % | 20.5 | % | 35.0 | % | |
| Profit Growth performance measure: | |||||||||||||||||
| Profit measure | 10.0 | % | 10.0 | % | 10.0 | % | 10.0 | % | 10.0 | % | 10.0 | % | 10.0 | % | 10.0 | % | |
| ROCE measure | 15.0 | % | 15.0 | % | 15.0 | % | 15.0 | % | 15.0 | % | 15.0 | % | 15.0 | % | 15.0 | % | |
| ROCE performance measure: | |||||||||||||||||
| Specified ROCE required | 23.8 | % | 43.3 | % | 23.2 | % | 44.5 | % | 22.0 | % | 36.5 | % | 21.5 | % | 37.0 | % | |
| (1) | 2005/06 award criteria will be reviewed after the adoption of IFRS. | ||||||||||||||||
The table on page 47above shows the percentages and the inflection points which have been specified for the existing awards and indicates the relevant profits and ROCE to be used for measurement in the case of each participant.measurement.
When the performance conditions have been satisfied 50% of the amount which vests will be payable in cash and the other 50% will consist of the grant of an option to acquire shares in the Company, the number of shares being determined by using the middle market price on the day preceding the grant of the award. For the 2001/02, 2002/03, 2003/04 and 2003/042004/05 awards, that share price was 74.75p, 121.00p, 83.50p and 83.50p112.50p respectively. Due to the deferred equity nature of the share linked element of the award, the exercise price of the total option grant is a nominal amount of £1 or $1, as appropriate. The participants can normally exercise their option at any time after vesting, until the tenth anniversary of the grant of the award.
In 2004/052005/06 awards under the 2000 LTIP werehave been made to the Group Chief Executive and the Group Finance Director at a similar level to that of previous years, the share price to be fixed following the announcement of the preliminary results. The Chief Executive of the UK division has also received an award on the same basis the performance criteria being related to the UK division.
(d) Employee trusts
The share option plans may be operated in conjunction with one or more employee share ownership trusts (the Signet Group plc Employee Share Trust (“ESOT”) or, the Signet Group Qualifying Employee Share Trust (“QUEST”) or the Signet Group plc 2004 Employee Share Trust (“2004 ESOT”)) which may acquire shares in the Company for the purposes of satisfying the exercise of options.
The 2000 LTIP operates in conjunction with the ESOT and the 2004 ESOT which may be funded by the Group to acquire shares in the Company for the purposes of meeting the Company’s obligation to provide shares on the exercise of options.
The trustees of the ESOT, QUEST and QUEST2004 ESOT have waived their rights to any dividends declared on shares held in the trusts.
(e) Share Scheme Limitsscheme limits
The executive share option plans are subject to the following limits on the number of shares that may be issued:
| (i) | the maximum number of shares that have been or may be issued pursuant to options granted under the executive share option plans and any other discretionary share option scheme adopted by the Company may not exceed 5% of the shares from time to time in issue in any ten year period; |
| Signet Group plc Annual Report & Accounts year ended 29 January 2005 | 57 |
Directors’ remuneration report (continued)
| (ii) | the maximum number of shares that have been or may be issued pursuant to options granted under the executive share |
| option plans and any other employees’ share scheme adopted by the Company may not exceed 10% of the shares from time to time in issue in any ten year period; and | |
| (iii) | the maximum of 171,376,839 shares (representing 10% of the issued share capital on 8 July 2003) may be issued pursuant to incentive options granted under the US |
In any ten year period not more than 10% of the issued share capital of the Company from time to time may in aggregate be issued or issuable pursuant to options granted under the All-employee Schemes or any other employees’ share schemes adopted by the Company.
The number of shares which may be issued or issuable pursuant to the 2000 LTIP (including to the ESOT and the 2004 ESOT), when aggregated with any shares issued or issuable by the Company in the preceding ten years under any employees’ share scheme, participation in which is at the discretion of the Board, is limited to 5% of the Company’s issued share capital from time to time. The number of shares which may be issued or issuable pursuant to the 2000 LTIP (including to the ESOT and the 2004 ESOT), when aggregated with all shares issued or issuable by the Company in the preceding ten years under any other employees’ share scheme, is limited to 10% of the Company’s issued share capital from time to time.
No more than 5% of the issued share capital of the Company may be held by the trustee of the ESOT or the 2004 ESOT without prior approval of shareholders.
(f) Shareholding guidelines
When the 2003 Plans were introduced, shareholding guidelines were set for executive directors and senior executives of the Group. The Group Chief Executive is expected to build a holding of shares equal to at least twice salary and the Group Finance Director to at least one times salary. Until these levels have been achieved, half of any post tax option gains under the 2003 Plans should be held in Signet shares. Since December 2004 future non-executive directors will be required to build a holding of 10,000 shares within two years of appointment and maintain that holding whilst they remain a director of the Company. Similarly the existing non-executive directors have agreed to adhere to the same shareholding guidelines within the two year period for compliance running from December 2004.
(g) Service contracts
The Group Chief Executive has a rolling service contract (dated 20 December 2000) with a US subsidiary, which can be terminated on one year’s notice in writing by either party. The Group Finance Director has a rolling service contract (dated 14 June 1995 and amended on 15 May 2000) with the Company, which can be terminated on one year’s notice in writing by either party andor terminates on his 60th birthday. The service contracts for the Group Chief Executive and the Group Finance Director provide for
termination payments in the cases of early termination by the Group or in the event of certain changes of control. In these circumstances the amount of termination payments due to the Group Chief Executive would equal, in summary, the aggregate of (i) 100% of his base salary at the time of termination, (ii) 25% of his base salary in respect of pension and other benefits, (iii) his outstanding entitlement to a cash bonus under the annual bonus plan referred to on page 4453 in respect of the proportion of the fiscal year prior to the effective date of termination, and (iv) a sum equal to a variable percentage (currently 80.6%79.6%) of the cash bonus to which he would have become entitled under the annual bonus plan during the notice period. The amount of termination payments due to the Group Finance Director would equal, in summary, the aggregate of (i) his annual salary as at the time of termination, (ii) the market value of the contractual benefits in kind (including any pension contribution) to which he would have become entitled during the following 12 months, and (iii) all payments to which he would have become entitled under the annual bonus plan during the same 12 month period. The Chief Executive of the UK division has a rolling service contract (dated 1 March 2003) with a UK subsidiary which can be terminated on one year’s notice in writing by either party or terminates on his 65th birthday. In the case of early termination, the contract provides for salary to be paid in lieu of notice, or where notice has been given, for any balance of the notice period. Entitlement to any share options or LTIP awards is governed by the rules of the relevant scheme. The contracts contain confidentiality and non-competition clauses.
The Chairman has a letter of appointment (dated 20 June 2001), with no fixed term. The appointment can be terminated in writing by either party on reasonable notice.notice and does not provide for compensation for loss of office. Each non-executive director has a letter of appointment from the Company which does not have a termination clause and does not provide for compensation for loss of office. The duration of any such appointment is subject to the terms of the Articles of Association and normally runs until such director is next required to stand for election or re-election.
The letters of appointment are dated as set out below:
| 58 | Signet Group plc Annual Report & Accounts year ended 29 January 2005 |
| The letters of appointment are dated as set out below: | ||
| Robert Blanchard | 5 September 2000 | |
| Dale Hilpert | 15 July 2003 | |
| Brook Land | 16 October 1995 | |
| Robert Walker | 21 September 2004 | |
| Russell Walls | 29 May 2002 | |
(h) Company pension
The Chairman diddoes not receive any pension provision in 2003/04.provision. The amount paid in respect of life assurance for him in the period was £19,100ß (2002/03:2003/04: £19,100ß).
The Group Chief Executive is a member of the Sterling Jewelers Inc. 401(k) Retirement Savings Plan and an unfunded, unqualified deferred compensation plan. Contributions made by Signet’s US division in respect of the Group Chief Executive
during the period totalled £1,786£1,653ß (2002/03: £1,7972003/04: £1,786ß) and £140,091£134,024ß (2002/03: £145,5712003/04: £140,091ß) respectively.
Pension benefits in respect of the UK based directors are set out below.
(i) Aggregate emoluments
for the year to 29 January 2005
The total emoluments for directors of the Company and officers of the Group (excluding amounts due under the LTIP), as listed on pages 3441 and 35,42, for services in all capacities was 2,403,000 (2002/03: £3,340,000)£2,510,000 (2003/04: £2,403,000). The amounts due under the 2000 LTIP for directors of the Company and officers of the Group was £760,000 (2002/03: £1,107,000,£694,000 (2003/04: £794,000, restated to reflect the market value at vesting). 50% of the amounts due under the 2000 LTIP are payable in cash and the other 50% consists of the grant of an option to acquire shares in the Company. Details of the directors’ emoluments are given on page 45.54.
| Pension benefits for UK based executive directorsß | ||||||||
| Ian Dahl | ||||||||
| Walker Boyd | former Chief Executive of | |||||||
| Group Finance Director | the UK division | |||||||
| 2003/04 | 2002/03 | 2003/04 | 2002/03 | (1) | ||||
| £ | £ | £ | £ | |||||
| Change in accrued benefits during the year (gross of inflation) (A) | 3,934 | 3,814 | – | 2,295 | ||||
| Change in accrued benefits during the year (net of inflation) | 2,955 | 3,285 | – | 2,173 | ||||
| Accrued benefits at the end of the year | 38,888 | 34,954 | – | 9,450 | ||||
| Transfer value of (A)(2) | 35,071 | 37,621 | – | 36,393 | ||||
| Transfer value of accrued benefits at the beginning of the year(2) | 400,303 | 336,380 | – | 104,583 | ||||
| Transfer value of accrued benefits at the end of the year(2) | 408,530 | 400,303 | – | 158,266 | ||||
| Change in transfer value of accrued benefits(2)(3) | 8,227 | 63,923 | – | 53,683 | ||||
| Group payments to the FURBS | 41,760 | 38,787 | – | 30,027 | ||||
| Life assurance contributions | 2,508 | 2,127 | – | 4,265 | ||||
Pension benefits for the UK based executive directorsß
| Robert Anderson | Walker Boyd | |||||||
| Chief Executive UK division | Group Finance Director | |||||||
| 2004/05 | 2003/04 | 2004/05 | 2003/04 | |||||
| Change in accrued benefits during the year (gross of inflation) | 2,245 | 2,067 | 4,564 | 3,934 | ||||
| Change in accrued benefits during the year (net of inflation) | 2,037 | 1,937 | 3,371 | 2,955 | ||||
| Accrued benefits at the end of the year | 9,010 | 6,765 | 43,452 | 38,888 | ||||
| Transfer value of change in accrued pension (net of inflation) | 7,997 | 5,579 | 44,369 | 35,071 | ||||
| Transfer value of accrued benefits at the beginning of the year | 38,707 | 25,773 | 408,530 | 400,303 | ||||
| Transfer value of accrued benefits at the end of the year | 58,367 | 38,707 | 510,434 | 408,530 | ||||
| Change in transfer value of accrued benefits(1) | 14,585 | 7,999 | 101,904 | 8,227 | ||||
| Group payments to the FURBS | 35,200 | 31,010 | 45,033 | 41,760 | ||||
| Life assurance contributions | 858 | 1,197 | 2,582 | 2,508 | ||||
| (1) | |
| Calculated in accordance with the Actuarial Guidance Note GN 11. |
| Signet Group plc Annual Report & Accounts year ended |
Directors’ remuneration report (continued)
| 4. | Directors’ interests in sharesß |
| (a) | Directors’ interest in share optionsß |
| Number of shares under option | ||||||||||||||||||
| At 31 | At 29 | Date from | ||||||||||||||||
| January | January | Exercise | which | Expiry | ||||||||||||||
| Director | 2004 | Granted | Forfeited | Exercised | 2005 | price | exercisable | (1) | date | (1) | ||||||||
| Robert Anderson(2) | 232,558 | – | – | – | 232,558 | 75.25p | 2.5.04 | 1.5.11 | ||||||||||
| (3)(7) | 19,000 | – | – | (19,000 | ) | – | 50.00p | – | – | |||||||||
| 160,416 | – | – | – | 160,416 | 120.00p | 11.4.05 | 10.4.12 | |||||||||||
| 322,188 | – | – | – | 322,188 | 82.25p | 25.4.06 | 24.4.13 | |||||||||||
| (4) | – | 251,685 | – | – | 251,685 | 111.25p | 5.4.07 | 4.4.14 | ||||||||||
| (5) | – | 35,452 | – | – | 35,452 | £1 in total | 15.4.04 | 3.5.11 | ||||||||||
| (3) | – | 10,985 | – | – | 10,985 | 86.25p | 1.1.08 | 30.6.08 | ||||||||||
| Total | 734,162 | 298,122 | – | (19,000 | ) | 1,013,284 | 90.99p | (6) | ||||||||||
| Walker Boyd(2) | (10) | 837,037 | – | – | (837,037 | ) | – | 33.75p | – | – | ||||||||
| (10) | 745,665 | – | – | (745,665 | ) | – | 43.25p | – | – | |||||||||
| 429,648 | – | – | – | 429,648 | 49.75p | 10.4.02 | 31.3.09 | |||||||||||
| 611,842 | – | – | – | 611,842 | 57.00p | 8.5.03 | 7.5.10 | |||||||||||
| 179,401 | – | – | – | 179,401 | 75.25p | 2.5.04 | 1.5.11 | |||||||||||
| (3)(8) | 19,000 | – | – | (19,000 | ) | – | 50.00p | – | – | |||||||||
| 225,000 | – | – | – | 225,000 | 120.00p | 11.4.05 | 10.4.12 | |||||||||||
| (5) | 133,484 | – | – | – | 133,484 | £1 in total | 15.4.03 | 18.7.10 | ||||||||||
| (4) | 397,435 | – | – | – | 397,435 | 97.50p | 14.7.06 | 13.7.13 | ||||||||||
| (4) | – | 444,943 | – | – | 444,943 | 111.25p | 5.4.07 | 4.4.14 | ||||||||||
| (3) | – | 10,985 | – | – | 10,985 | 86.25p | 1.1.08 | 30.6.08 | ||||||||||
| (5) | – | 87,505 | – | �� | 87,505 | £1 in total | 15.4.04 | 3.5.11 | ||||||||||
| Total | 3,578,512 | 543,433 | – | (1,601,702 | ) | 2,520,243 | 73.78p | (6) | ||||||||||
| Terry Burman(2) | (9) | 1,094,239 | – | – | (1,094,239 | ) | – | $0.80 | – | – | ||||||||
| (9) | 2,217,280 | – | – | (2,217,280 | ) | – | $0.87 | – | – | |||||||||
| 496,289 | – | – | – | 496,289 | $1.08 | 2.5.04 | 1.5.11 | |||||||||||
| 1,242,019 | – | – | – | 1,242,019 | $1.72 | 11.4.05 | 10.4.12 | |||||||||||
| (3)(8) | 8,670 | – | – | (8,670 | ) | – | $1.10 | – | – | |||||||||
| (4) | 3,807,426 | – | – | – | 3,807,426 | $1.59 | 14.7.06 | 13.7.13 | ||||||||||
| (4) | – | 3,129,267 | – | – | 3,129,267 | $2.05 | 5.4.07 | 4.4.14 | ||||||||||
| (3) | – | 5,850 | – | – | 5,850 | $1.64 | 1.11.06 | 31.1.07 | ||||||||||
| (5) | – | 344,829 | – | – | 344,829 | $1 in total | 15.4.04 | 3.5.11 | ||||||||||
| Total | 8,865,923 | 3,479,946 | – | (3,320,189 | ) | 9,025,680 | $1.68 | (6) | ||||||||||
| James McAdam | (10) | 1,075,145 | – | – | (1,075,145 | ) | – | 43.25p | – | – | ||||||||
| 869,347 | – | – | – | 869,347 | 49.75p | 10.4.02 | 31.3.09 | |||||||||||
| (3)(8) | 19,000 | – | – | (19,000 | ) | – | 50.00p | – | – | |||||||||
| (3) | – | 10,985 | – | – | 10,985 | 86.25p | 1.1.08 | 30.6.08 | ||||||||||
| Total | 1,963,492 | 10,985 | – | (1,094,145 | ) | 880,332 | 50.21p | (6) | ||||||||||
| Director | Number of shares under option | ||||||||||||||||||
| At 2 | At 31 | Date from | |||||||||||||||||
| February | January | Exercise | which | Expiry | |||||||||||||||
| 2003 | Granted | Forfeited | Exercised | 2004 | price | exercisable | (1) | date | (1) | ||||||||||
| Walker Boyd(2) | |||||||||||||||||||
| 837,037 | – | – | – | 837,037 | 33.75p | 6.10.00 | 5.10.07 | ||||||||||||
| 745,665 | – | – | – | 745,665 | 43.25p | 28.4.01 | 27.4.08 | ||||||||||||
| 429,648 | – | – | – | 429,648 | 49.75p | 10.4.02 | 31.3.09 | ||||||||||||
| 611,842 | – | – | – | 611,842 | 57.00p | 8.5.03 | 7.5.10 | ||||||||||||
| 179,401 | – | – | – | 179,401 | 75.25p | 2.5.04 | 1.5.11 | ||||||||||||
| (3 | ) | 19,000 | – | – | – | 19,000 | 50.00p | 1.1.05 | 30.6.05 | ||||||||||
| 225,000 | – | – | – | 225,000 | 120.00p | 11.4.05 | 10.4.12 | ||||||||||||
| – | 133,484 | – | – | 133,484 | £1 in total | 15.4.03 | 18.7.10 | ||||||||||||
| (4 | ) | – | 397,435 | – | – | 397,435 | 97.50p | 14.7.06 | 13.7.13 | ||||||||||
| Total | 3,047,593 | 530,919 | – | – | 3,578,512 | 55.04p | (5) | ||||||||||||
| Terry Burman(2) | |||||||||||||||||||
| (6 | ) | 1,968,122 | – | – | (1,968,122 | ) | – | $0.72 | – | – | |||||||||
| 1,094,239 | – | – | – | 1,094,239 | $0.80 | 10.4.02 | 31.3.09 | ||||||||||||
| 2,217,280 | – | – | – | 2,217,280 | $0.87 | 8.5.03 | 7.5.10 | ||||||||||||
| 496,289 | – | – | – | 496,289 | $1.08 | 2.5.04 | 1.5.11 | ||||||||||||
| 1,242,019 | – | – | – | 1,242,019 | $1.72 | 11.4.05 | 10.4.12 | ||||||||||||
| (3 | ) | 8,670 | – | – | – | 8,670 | $1.10 | 3.11.04 | 31.1.05 | ||||||||||
| (6 | ) | – | 486,384 | – | (486,384 | ) | – | $1 in total | – | – | |||||||||
| (4 | ) | – | 3,807,426 | – | – | 3,807,426 | $1.59 | 14.7.06 | 13.7.13 | ||||||||||
| Total | 7,026,619 | 4,293,810 | – | (2,454,506 | ) | 8,865,923 | $1.30 | (5) | |||||||||||
| James McAdam | |||||||||||||||||||
| 1,075,145 | – | – | – | 1,075,145 | 43.25p | 28.4.01 | 27.4.08 | ||||||||||||
| 869,347 | – | – | – | 869,347 | 49.75p | 10.4.02 | 31.3.09 | ||||||||||||
| (3 | ) | 19,000 | – | – | – | 19,000 | 50.00p | 1.1.05 | 30.6.05 | ||||||||||
| Total | 1,963,492 | – | – | – | 1,963,492 | 46.19p | (5) | ||||||||||||
| All options were granted to directors while they were The Black-Scholes option-pricing model fair value is given on page | |
| (1) | The dates from which options are exercisable and the expiry dates are the dates that normally apply. Other dates apply in certain circumstances, such as an option holder ceasing to be employed. |
| (2) | See page |
| (3) | & (5) The options above were all granted under the 1993 Scheme except those marked (3) which were granted under the terms of the Sharesave Scheme or, in the case of Terry Burman, the Employee Stock Savings Plan, (the 8,670 shares granted under this Plan that became exercisable in November 2004 increased to 8,690 shares as a result of a rounding difference, as the shares were delivered as ADRs and the ADR ratio changing from 30:1 to 10:1), those marked (4) which were granted under the 2003 |
| These are weighted averages of the exercise prices per share for the options held at the year end. | |
| Exercised on | |
| (8) | Exercised on 17 January 2005, when the market price was 110.00p. |
| (9) | Exercised on 30 March 2004, when the market price was 109.25p. |
| (10) | Exercised on 15 June 2004, when the market price was 112.75p. |
| The aggregate amount of gains made by directors on the exercise of options during the year amounted to | |
| Signet Group plc Annual Report & Accounts year ended |
Except as set out in tables (a), (b) and (c), on pages 60 to 62, or in the notes under these tables, no director nor any member of any director’s immediate family had an interest in, or was granted or exercised any right to subscribe for, shares or debentures of the Company or any subsidiary, nor did any such right to subscribe lapse during the financial year, nor was there any change between the end of the financial year and 24 March 20046 April 2005 in the interests of any director of the Company disclosed to the Company under the provisions of section 324 (duty of directors to disclose shareholdings in own company) as extended by section 328 (extension of section 324 to spouses and children) of
the Companies Act 1985 nor in any right to subscribe for shares in, or debentures of, the Company.
At 1 February 2003, 312004, 29 January 20042005 and 24 March 2004,6 April 2005, according to the register kept by the Company under section 325 of the Companies Act 1985, the directors held interests in the shares of the Company as indicated in tables (a), (b) and (c) on pages 5060 to 52.62. As explained on page 4757 the value of the awards that vest under the 2000 LTIP depends upon the extent to which the performance conditions are met. The awards are also capped by reference to a percentage of the recipient’s base salary.
Although the minimum performance conditions for the 2001/02 award have been exceeded, vesting will only occur within 60 days of the preliminary results announcement for the year ended 31 January 2004.
| b) Directors’ interests in LTIPsß | |
| Awards subject to | Awards where the performance | Awards subject to | Awards where the performance | ||||||||||||||||||||||||||||||||||
| performance conditions | conditions have been satisfied(1) | performance conditions | conditions have been satisfied(1) | ||||||||||||||||||||||||||||||||||
| Option | Cash and | Cash and | Expiry of | Option | Cash and | Cash and | Expiry of | ||||||||||||||||||||||||||||||
| Cash | Option | Cash | Option | portion | options total | options | award or | Cash | Option | Cash | Option | portion | options total | options | award or | ||||||||||||||||||||||
| Date of | portion | (2) | portion | (2) | portion | (3) | portion | (3) | (current | (4) | current | (4)(5) | total | (6) | vested | Date of | portion | portion | portion | portion | (current | current | total | vested | |||||||||||||
| award | (grant value) | (number) | (grant value) | (number) | value) | value | vested | option | award | (grant value) | (2) | (number) | (2) | (grant value) | (3) | (number) | (3) | value) | (4) | value | (4)(5) | vested | (6) | option | |||||||||||||
| Director | £ | £ | £ | £ | £ | £ | £ | £ | £ | £ | |||||||||||||||||||||||||||
| Robert Anderson(7) | |||||||||||||||||||||||||||||||||||||
| 2001/02 award(8) | 4.5.01 | – | – | – | – | – | – | 67,004 | 3.5.11 | ||||||||||||||||||||||||||||
| 2002/03 award(8) | 26.4.02 | – | – | 28,000 | 23,140 | 26,554 | 54,554 | – | 25.4.12 | ||||||||||||||||||||||||||||
| 2003/04 award(8) | 30.4.03 | 70,000 | 83,832 | – | – | – | 166,197 | – | – | (9) | |||||||||||||||||||||||||||
| 2004/05 award | 5.4.04 | 70,000 | 62,222 | – | – | – | 141,400 | – | – | (9) | |||||||||||||||||||||||||||
| Awards at end of year | 140,000 | 146,054 | 28,000 | 23,140 | 26,554 | 362,151 | 67,004 | ||||||||||||||||||||||||||||||
| Walker Boyd(7) | |||||||||||||||||||||||||||||||||||||
| 2000/01 award(8) | 19.7.00 | – | – | – | – | – | – | 176,533 | 18.7.10 | ||||||||||||||||||||||||||||
| 2001/02 award(8) | 4.5.01 | – | – | 65,410 | 87,504 | 94,505 | 159,915 | – | 3.5.11 | 4.5.01 | – | – | – | – | – | – | 165,384 | 3.5.11 | |||||||||||||||||||
| 2002/03 award(8) | 26.4.02 | 77,500 | 64,049 | – | – | – | 146,673 | – | – | (9) | 26.4.02 | – | – | 82,500 | 68,182 | 78,239 | 160,739 | – | 25.4.12 | ||||||||||||||||||
| 2003/04 award | 2.5.03 | 77,500 | 92,814 | – | – | – | 177,739 | – | – | (9) | |||||||||||||||||||||||||||
| 2003/04 award(8) | 30.4.03 | 82,500 | 98,802 | – | – | – | 195,875 | – | – | (9) | |||||||||||||||||||||||||||
| 2004/05 award | 5.4.04 | 82,500 | 73,333 | – | – | – | 166,650 | – | – | (9) | |||||||||||||||||||||||||||
| Awards at end of year | 155,000 | 156,863 | 65,410 | 87,504 | 94,505 | 484,327 | 176,533 | 165,000 | 172,135 | 82,500 | 68,182 | 78,239 | 523,264 | 165,384 | |||||||||||||||||||||||
| Terry Burman(7) | |||||||||||||||||||||||||||||||||||||
| 2000/01 award(8) | 19.7.00 | – | – | – | – | – | – | 630,886 | 18.7.10 | ||||||||||||||||||||||||||||
| 2001/02 award(8) | 4.5.01 | – | – | 201,623 | 344,941 | 372,537 | 574,160 | – | 3.5.11 | 4.5.01 | – | – | – | – | – | – | 600,761 | 3.5.11 | |||||||||||||||||||
| 2002/03 award(8) | 26.4.02 | 230,163 | 240,005 | – | – | – | 489,369 | – | – | (9) | 26.4.02 | – | – | 238,856 | 254,485 | 292,022 | 530,878 | – | 25.4.12 | ||||||||||||||||||
| 2003/04 award | 2.5.03 | 230,163 | 316,318 | – | – | – | 571,787 | – | – | (9) | |||||||||||||||||||||||||||
| 2003/04 award(8) | 30.4.03 | 238,856 | 335,403 | – | – | – | 623,731 | – | – | (9) | |||||||||||||||||||||||||||
| 2004/05 award | 5.4.04 | 238,856 | 217,903 | – | – | – | 488,901 | – | – | (9) | |||||||||||||||||||||||||||
| Awards at end of year | 460,326 | 556,323 | 201,623 | 344,941 | 372,537 | 1,635,316 | 630,886 | 477,712 | 553,306 | 238,856 | 254,485 | 292,022 | 1,643,510 | 600,761 | |||||||||||||||||||||||
| All grants were made to directors while they were directors, apart from Mr Anderson who was appointed on 6 April 2005, and the performance conditions relating to the awards are set out on page | |
| (1) | In respect of the |
| (2) | Assumes maximum performance conditions are satisfied and is calculated using salary at |
| (3) | Calculated using salary at 28 February 2005 and a share price at the time of grant in 2002 of |
| (4) | Calculated using share price as at |
| (5) | Cash portion plus option portion value at |
| (6) | Vesting took place on 15 April |
| (7) | The Remuneration Committee approved grants of LTIP awards to Terry Burman (maximum of 70% of salary at vesting), both Walker Boyd and |
| (8) | Awards at start of year. |
| (9) | Expiry dates of awards will be known within 60 days after the announcement of the preliminary results for the last financial year in the performance period. |
| Signet Group plc Annual Report & Accounts year ended |
Directors’ remuneration report (continued)
c) Directors’ interests in sharesß
| Number of shares | Number of shares | |||||||||||
| At start | At end | At 24 March | At start | At end | At 6 April | |||||||
| Director | of year | of year | 2004 | of year | of year | 2005 | ||||||
| Lee Abraham(1) | 75,000 | 75,000 | – | |||||||||
| Robert Anderson(1) | – | 19,000 | 19,000 | |||||||||
| Robert Blanchard | 6,360 | 6,360 | 6,360 | 6,360 | 6,360 | 6,360 | ||||||
| Walker Boyd | 433,495 | 433,495 | 433,495 | 433,495 | 452,495 | 452,495 | ||||||
| Terry Burman | 322,266 | 460,866 | 460,866 | 460,866 | 710,601 | 710,601 | ||||||
| Dale Hilpert | – | – | – | – | 20,000 | 20,000 | ||||||
| Brook Land | 25,000 | 25,000 | 25,000 | 25,000 | 25,000 | 25,000 | ||||||
| James McAdam(2) | 242,088 | 242,088 | 242,088 | 242,088 | 261,088 | 261,088 | ||||||
| Robert Walker | – | – | – | |||||||||
| Russell Walls | 4,000 | 4,000 | 4,000 | 4,000 | 4,000 | 4,000 | ||||||
| (1) | |
| (2) | 22,000 of those shares held were, at each date, held by |
Although the minimum performance conditions for the 2002/03 award have been exceeded, vesting will only occur within 60 days of the preliminary results announcement for the year ended 29 January 2005.
The Group operates the QUEST, which is currently used in connection with the Sharesave Scheme, the ESOT and the 2004 ESOT. Robert Anderson, Walker Boyd, Terry Burman and James McAdam, at 1 February 2003, 312004, 29 January 20042005 and 24 March 2004,6 April 2005, were, in common with all other UK employees of the Group, deemed to have an interest in the shares held by the QUEST, the ESOT and the 2004 ESOT. The QUEST held 180110,857 shares on 30 September 2002,110,857 on 1 February 2003, 41,065 on 31 January 2004, nil on 29 January 2005 and 35,992nil on 24 March 2004, and the6 April 2005. The ESOT held nil shares on each of those dates.1 February 2003, nil on 31 January 2004, 4,610,839 on 29 January 2005 and 4,443,869 on 6 April 2005. The 2004 ESOT held nil shares on 29 January 2005 and nil shares on 6 April 2005. No director had been granted any specific interest in such shares other than options held by them under a savings-related share option scheme.shares.
The Company’s register of directors’ interests, which is open to inspection at the registered office, contains full details of directors’ shareholdings and share options.
|
The middle market price of a Signet share on the London Stock Exchange was 94.5p109.75p on 29 January 2005 and was 94.50p on 31 January 2004 and was 75.0p on 1 February 2003.2004. During the 52 weeks ended 3129 January 2004,2005, the middle market prices on the London Stock Exchange ranged between a low of 66.0p93.75p and a high of 114.5p.119.75p. On 24 March 20046 April 2005 the middle market price was 108.0p.114.75p.
6. Total shareholder return (“TSR”)6.Total shareholder return (“TSR”)
The graph on page 5363 (left) shows the cumulative annual total return (share price movement and dividends) to shareholders of the Group since 3129 January 19992000 based on the 30 day average of value of the share price compared to the FTSE 350 index. This index was chosen as a suitable comparator as it is a major market index of which the Group is a member. Also shown on a similar basis on the graph on page 5363 (right), is the Group’s performance compared to the FTSE general retail sector.
| Signet Group plc Annual Report & Accounts year ended |
Five year historical TSR performance
Growth in the value of a hypothetical £100 holding over five years
FTSE 350 (excluding investment trusts) comparison based on 30 trading day average values
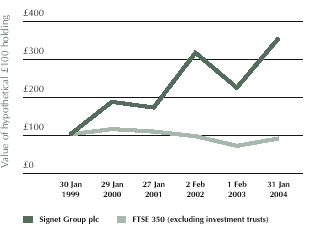

Five year historical TSR performance
Growth in the value of a hypothetical £100 holding over five years
FTSE general retailers index comparison based on 30 trading day average values

The directors’ remuneration report was approved by the Board on 24 March 2004,6 April 2005, and signed on its behalf by:
Robert Blanchard, Chairman, Remuneration Committee
| Signet Group plc Annual Report & Accounts year ended |
Statement of directors’ responsibilities
The directors are required to prepare accounts for each financial period which give, in accordance with the Companies Act 1985, a true and fair view of the state of affairs of the Company and the Group as at the end of that financial period and of the profit or loss of the Group for that period. In preparing those accounts, the directors are required to:
| • | select suitable accounting policies and then apply them consistently; |
| • | make judgements and estimates that are in their opinion reasonable and prudent; and |
| • | state whether applicable accounting standards have been followed, subject to any material departures disclosed and explained in the accounts; and prepare the accounts on a going concern basis unless in their view, based on the information then available to them, that basis of preparation would not be appropriate. |
The directors are responsible for ensuring that the Company complies with the requirements of the Companies Act 1985 in regard to keeping adequate accounting records which disclose with reasonable accuracy, at any time, the financial position of the Company and to enable them to ensure that the accounts comply with the Companies Act 1985. They have general responsibility for taking such steps as are reasonably open to them to safeguard the assets of the Group and to prevent and detect fraud and other irregularities.
| Signet Group plc Annual Report & Accounts year ended |
Report of Independent auditor’s reportRegistered Public Accounting Firm
To theThe Board of Directors and shareholders of Signet Group plc
We have audited the accompanying consolidated balance sheets of Signet Group plc and subsidiaries as at 29 January 2005 and 31 January 2004, and 1 February 2003, and the related consolidated profit and loss accounts, consolidated cash flow statements, consolidated statements of total recognised gains and losses and consolidated cash flow statementsshareholders’ funds statement for the 52 week period ended 29 January 2005, the 52 week period ended 31 January 2004, and the 52 week period ended 1 February 2003 and the 53 week period ended 2 February 2002 presented on pages 5666 to 102.114. These consolidated financial statements are the responsibility of the Company’s management. Our responsibility is to express an opinion on these consolidated financial statements based on our audits.
We conducted our audits in accordance with auditingthe standards generally accepted inof the United States of America.Public Company Accounting Oversight Board (United States). Those standards require that we plan and perform the audit to obtain reasonable assurance about whether the financial statements are free of material misstatement. An audit includes examining, on a test basis, evidence supporting the amounts and disclosures in the financial statements. An audit also includes assessing the accounting principles used and significant estimates made by management, as well as evaluating the overall financial statement presentation. We believe that our audits provide a reasonable basis for our opinion.
In our opinion, the consolidated financial statements referred to above present fairly, in all material respects, the financial position of Signet Group plc and subsidiaries as atof 29 January 2005 and 31 January 2004, and the results of their operations and their cash flows for 52 week period ended 29 January 2005, the 52 week period ended 31 January 2004, and the 52 week period ended 1 February 2003 in conformity with generally accepted accounting principles in the United Kingdom.
As discussed in note 17 to the consolidated financial statements, the Company has adopted Application Note (G) of FRS 5 ‘Reporting the Substance of Transactions’ resulting in the restatement of the financial position of Signet Group plc and subsidiaries as at 31 January 2004 and the results of operations and cash flows for the 52 week period ended 31 January 2004 and the 52 week period ended 1 February 2003 and the 53 week period ended 2 February 2002 in conformity with accounting2003.
Accounting principles generally accepted in the United States of America.
As discussed in note 17 to the financial statements, the Company adopted FRS 17 – ‘Retirement Benefits’ resulting in the restatement of the financial position of Signet Group plc and subsidiaries as at 1 February 2003 and the results of operations and cash flows for the 52 week period ended 1 February 2003 and the 53 week period ended 2 February 2002.
Generally accepted accounting principles in the United Kingdom vary in certain significant respects from accounting principles generally accepted accounting principles in the United States of America. Information relating to the nature and effect of such differences is presented on pages 94in note 31 to 102 in the consolidated financial statements.
As discussed in note 31 to the consolidated financial statements, the US GAAP information as at 31 January 2004 and 1 February 2003 and for the 52 week periods ended 31 January 2004 and 1 February 2003 has been restated for corrections related to revenue recognition attributable to extended service agreements and lease accounting.
KPMG Audit Plc
Chartered Accountants Registered Auditor
London, England
24 March 20046 April 2005
Signet Group plc Annual Report & Accounts year ended |
Consolidated profit and loss account
for the 52 weeks ended 3129 January 20042005
| 52 weeks ended | 52 weeks ended | 52 weeks ended | ||||||||||||||
| 29 January 2005 | 31 January 2004 | 1 February 2003 | ||||||||||||||
| as restated(1) | as restated(1) | |||||||||||||||
| 52 weeks ended 31 January 2004 | 52 weeks ended 1 February 2003 as restated | (1) | 53 weeks ended 2 February 2002 as restated | (1) | £m | £m | £m | Notes | ||||||||
| £m | £m | £m | Notes | |||||||||||||
| Sales | 1,617.2 | 1,608.0 | 1,578.1 | 2 | 1,614.4 | 1,604.9 | 1,593.6 | 2 | ||||||||
| Cost of sales | (1,330.9 | ) | (1,331.6 | ) | (1,318.3 | ) | (1,329.6 | ) | (1,330.7 | ) | (1,331.2 | ) | ||||
| Gross profit | 286.3 | 276.4 | 259.8 | 284.8 | 274.2 | 262.4 | ||||||||||
| Administrative expenses | (64.0 | ) | (62.5 | ) | (61.0 | ) | (65.9 | ) | (64.0 | ) | (62.5 | ) | ||||
| Operating profit | 222.3 | 213.9 | 198.8 | 2 | 218.9 | 210.2 | 199.9 | 2 | ||||||||
| Net interest payable and similar charges | (10.4 | ) | (14.0 | ) | (15.0 | ) | 3 | (8.6 | ) | (10.4 | ) | (14.0 | ) | 3 | ||
| Profit on ordinary activities before taxation | 211.9 | 199.9 | 183.8 | 4 | 210.3 | 199.8 | 185.9 | 4 | ||||||||
| Tax on profit on ordinary activities | (74.7 | ) | (70.8 | ) | (63.4 | ) | 7 | (69.1 | ) | (70.2 | ) | (65.7 | ) | 7 | ||
| Profit for the financial period | 137.2 | 129.1 | 120.4 | 141.2 | 129.6 | 120.2 | ||||||||||
| Dividends | (43.2 | ) | (36.1 | ) | (30.5 | ) | 8 | (52.0 | ) | (43.2 | ) | (36.1 | ) | 8 | ||
| Retained profit attributable to shareholders | 94.0 | 93.0 | 89.9 | 89.2 | 86.4 | 84.1 | ||||||||||
| Earnings per share – basic | 8.0p | 7.5p | 7.1p | 9 | 8.2p | 7.5p | 7.0p | 9 | ||||||||
| Earnings per share – diluted | 7.9p | 7.5p | 7.1p | 9 | 8.1p | 7.5p | 7.0p | 9 | ||||||||
All of the above relate to continuing activities during the current and previous periods.
The profit impact of the 53rd week in 2001/02 is analysed on page 28.
| (1) | Restated for the implementation of the amendment to FRS |
| Signet Group plc Annual Report & Accounts year ended |
Consolidated balance sheet
at 3129 January 20042005
| 29 January 2005 | 31 January 2004 | |||||||||||
| 31 January 2004 | 1 February 2003 as restated | (1) | as restated(1) | |||||||||
| £m | £m | Notes | £m | £m | Notes | |||||||
| Fixed assets: | ||||||||||||
| Intangible assets | 16.8 | 19.8 | 10 | 15.2 | 16.8 | 10 | ||||||
| Tangible assets | 202.8 | 205.5 | 11 | 226.8 | 202.8 | 11 | ||||||
| 219.6 | 225.3 | 242.0 | 219.6 | |||||||||
| Current assets: | ||||||||||||
| Stocks | 541.5 | 539.5 | 12 | 578.3 | 541.5 | 12 | ||||||
| Debtors(2) | 339.5 | 345.9 | 13 | 375.3 | 365.2 | 13 | ||||||
| Cash at bank and in hand | 128.0 | 89.2 | 14 | 102.4 | 128.0 | 14 | ||||||
| 1,009.0 | 974.6 | 1,056.0 | 1,034.7 | |||||||||
| Creditors: amounts falling due within one year | (332.0 | ) | (324.9 | ) | 15 | (351.6 | ) | (365.6 | ) | 15 | ||
| Net current assets(2) | 677.0 | 649.7 | 704.4 | 669.1 | ||||||||
| Total assets less current liabilities | 896.6 | 875.0 | 946.4 | 888.7 | ||||||||
| Creditors: amounts falling due after more than one year | (157.2 | ) | (189.1 | ) | 16 | (200.2 | ) | (208.6 | ) | 16 | ||
| Provisions for liabilities and charges: | ||||||||||||
| Deferred taxation | (5.4 | ) | – | 18 | ||||||||
| Other provisions | (6.4 | ) | (7.5 | ) | 19 | |||||||
| Provisions for liabilities and charges: other provisions | (5.8 | ) | (6.4 | ) | 19 | |||||||
| Pension (liability)/asset | (1.3 | ) | 1.2 | 20 | ||||||||
| Total net assets | 727.6 | 678.4 | 739.1 | 674.9 | ||||||||
| Capital and reserves – equity: | ||||||||||||
| Called up share capital | 8.6 | 8.6 | 20 | 8.7 | 8.6 | 21 | ||||||
| Share premium account | 60.7 | 53.9 | 21 | 68.0 | 60.7 | 22 | ||||||
| Revaluation reserve | 3.1 | 3.1 | 21 | 4.3 | 3.1 | 22 | ||||||
| Special reserves | 142.2 | 101.7 | 21 | 155.9 | 142.2 | 22 | ||||||
| Profit and loss account | 513.0 | 511.1 | 21 | 502.2 | 460.3 | 22 | ||||||
| Shareholders’ funds | 727.6 | 678.4 | 739.1 | 674.9 | ||||||||
| (1) | Restated for the implementation of the amendment to FRS |
| (2) | Debtors and net current assets include amounts recoverable after more than one year of |
These accounts were approved by the Board of Directors on 24 March 2004,6 April 2005, and were signed on its behalf by:
James McAdam Director
Walker Boyd Director
| Signet Group plc Annual Report & Accounts |
Company balance sheet
at 3129 January 20042005
| 31 January 2004 | 1 February 2003 as restated | (1) | ||||
| £m | £m | Notes | ||||
| Fixed assets: | ||||||
| Tangible assets | 53.9 | 51.3 | 30 | (b) | ||
| Investments | 766.8 | 803.4 | 30 | (j) | ||
| 820.7 | 854.7 | |||||
| Current assets: | ||||||
| Debtors(2) | 375.3 | 233.2 | 30 | (c) | ||
| Cash at bank and in hand | 98.3 | 45.0 | 30 | (d) | ||
| 473.6 | 278.2 | |||||
| Creditors: amounts falling due within one year | (536.8 | ) | (456.1 | ) | 30 | (e) |
| Net current liabilities(2) | (63.2 | ) | (177.9 | ) | ||
| Total assets less current liabilities | 757.5 | 676.8 | ||||
| Creditors: amounts falling due after more than one year | (8.3 | ) | (18.3 | ) | 30 | (f) |
| Total net assets | 749.2 | 658.5 | ||||
| Capital and reserves - equity: | ||||||
| Called up share capital | 8.6 | 8.6 | 20 | (g) | ||
| Share premium account | 60.7 | 53.9 | 30 | (g) | ||
| Special reserves | 565.1 | 565.1 | 30 | (g) | ||
| Profit and loss account | 114.8 | 30.9 | 30 | (g) | ||
| Shareholders’ funds | 749.2 | 658.5 | ||||
| 29 January 2005 | 31 January 2004 | |||||
| £m | £m | Notes | ||||
| Fixed assets: | ||||||
| Tangible assets | 65.4 | 53.9 | 30(b) | |||
| Investments | 766.8 | 766.8 | 30(j) | |||
| 832.2 | 820.7 | |||||
| Current assets: | ||||||
| Debtors(1) | 425.5 | 375.3 | 30(c) | |||
| Cash at bank and in hand | 100.2 | 98.3 | 30(d) | |||
| 525.7 | 473.6 | |||||
| Creditors: amounts falling due within one year | (600.1 | ) | (536.8 | ) | 30(e) | |
| Net current liabilities(1) | (74.4 | ) | (63.2 | ) | ||
| Total assets less current liabilities | 757.8 | 757.5 | ||||
| Creditors: amounts falling due after more than one year | – | (8.3 | ) | 30(f) | ||
| Total net assets | 757.8 | 749.2 | ||||
| Capital and reserves – equity: | ||||||
| Called up share capital | 8.7 | 8.6 | 21(g) | |||
| Share premium account | 68.0 | 60.7 | 30(g) | |||
| Special reserves | 565.1 | 565.1 | 30(g) | |||
| Profit and loss account | 116.0 | 114.8 | 30(g) | |||
| Shareholders’ funds | 757.8 | 749.2 | ||||
| (1) | |
| Debtors and net current liabilities include amounts recoverable after more than one year of |
These accounts were approved by the Board of Directors on 24 March 2004,6 April 2005, and were signed on its behalf by:
James McAdam Director
Walker Boyd Director
| Signet Group plc Annual Report & Accounts year ended |
Consolidated cash flow statement
for the 52 weeks ended 3129 January 20042005
| 52 weeks ended | 52 weeks ended | 53 weeks ended | 52 weeks ended | 52 weeks ended | 52 weeks ended | ||||||||||||
| 31 January 2004 | 1 February 2003 | 2 February 2002 | 29 January 2005 | 31 January 2004 | 1 February 2003 | ||||||||||||
| £m | £m | Notes | £m | £m | £m | Notes | |||||||||||
| Net cash inflow from operating activities | 203.8 | 182.2 | 188.0 | 25(a | ) | 172.6 | 203.8 | 182.2 | 25(a) | ||||||||
| Returns on investments and servicing of finance: | |||||||||||||||||
| Returns on investments and servicing of finance | |||||||||||||||||
| Interest received | 0.9 | 1.1 | 1.6 | 1.8 | 0.9 | 1.1 | |||||||||||
| Interest paid | (11.9 | ) | (17.6 | ) | (19.5 | ) | (11.6 | ) | (11.9 | ) | (17.6 | ) | |||||
| Net cash outflow from returns on investments and servicing of finance | (11.0 | ) | (16.5 | ) | (17.9 | ) | (9.8 | ) | (11.0 | ) | (16.5 | ) | |||||
| Taxation paid | (69.0 | ) | (57.3 | ) | (57.9 | ) | (56.5 | ) | (69.0 | ) | (57.3 | ) | |||||
| Capital expenditure: | |||||||||||||||||
| Purchase of tangible fixed assets | (50.9 | ) | (49.5 | ) | (60.7 | ) | (70.5 | ) | (50.9 | ) | (49.5 | ) | |||||
| Proceeds from sale of tangible fixed assets | 0.2 | 1.3 | – | 0.2 | 0.2 | 1.3 | |||||||||||
| Net cash outflow from capital expenditure | (50.7 | ) | (48.2 | ) | (60.7 | ) | (70.3 | ) | (50.7 | ) | (48.2 | ) | |||||
| Equity dividends paid | (36.7 | ) | (30.8 | ) | (27.7 | ) | (43.8 | ) | (36.7 | ) | (30.8 | ) | |||||
| Cash inflow before use of liquid resources and financing | 36.4 | 29.4 | 23.8 | ||||||||||||||
| Cash (outflow)/inflow before use of liquid resources and financing | (7.8 | ) | 36.4 | 29.4 | |||||||||||||
| Management of liquid resources: | |||||||||||||||||
| Increase in bank deposits | (42.4 | ) | (29.9 | ) | (27.9 | ) | |||||||||||
| Decrease/(increase) in bank deposits | 24.5 | (42.4 | ) | (29.9 | ) | ||||||||||||
| Financing: | |||||||||||||||||
| Proceeds from issue of shares | 6.3 | 4.3 | 8.9 | 7.3 | 6.3 | 4.3 | |||||||||||
| Purchase of own shares by ESOT | (9.5 | ) | – | – | |||||||||||||
| Repayment of bank loans | (12.1 | ) | (12.1 | ) | (16.5 | ) | (8.1 | ) | (12.1 | ) | (12.1 | ) | |||||
| Cash outflow from financing | (5.8 | ) | (7.8 | ) | (7.6 | ) | (10.3 | ) | (5.8 | ) | (7.8 | ) | |||||
| Decrease in cash in the period | (11.8 | ) | (8.3 | ) | (11.7 | ) | |||||||||||
| Increase/(decrease) in cash in the period | 6.4 | (11.8 | ) | (8.3 | ) | ||||||||||||
Reconciliation of net cash flow to movement in net debt
| 52 weeks ended | 52 weeks ended | 53 weeks ended | 52 weeks ended | 52 weeks ended | 52 weeks ended | ||||||||||||
| 31 January 2004 | 1 February 2003 | 2 February 2002 | 29 January 2005 | 31 January 2004 | 1 February 2003 | ||||||||||||
| £m | £m | Notes | £m | £m | £m | Notes | |||||||||||
| Decrease in cash in the period | (11.8 | ) | (8.3 | ) | (11.7 | ) | |||||||||||
| Increase/(decrease) in cash in the period | 6.4 | (11.8 | ) | (8.3 | ) | ||||||||||||
| Cash outflow from decrease in debt | 12.1 | 12.1 | 16.5 | 8.1 | 12.1 | 12.1 | |||||||||||
| Cash outflow from increase in liquid resources | 42.4 | 29.9 | 27.9 | ||||||||||||||
| Cash (inflow)/outflow from (decrease)/increase in liquid resources | (24.5 | ) | 42.4 | 29.9 | |||||||||||||
| Change in net debt resulting from cash flows | 42.7 | 33.7 | 32.7 | (10.0 | ) | 42.7 | 33.7 | ||||||||||
| Translation difference | 17.5 | 27.9 | (5.3 | ) | 6.4 | 17.5 | 27.9 | ||||||||||
| Movement in net debt in the period | 60.2 | 61.6 | 27.4 | (3.6 | ) | 60.2 | 61.6 | ||||||||||
| Opening net debt | (140.1 | ) | (201.7 | ) | (229.1 | ) | (79.9 | ) | (140.1 | ) | (201.7 | ) | |||||
| Closing net debt | (79.9 | ) | (140.1 | ) | (201.7 | ) | 25(b | ) | (83.5 | ) | (79.9 | ) | (140.1 | ) | 25(b) | ||
| Signet Group plc Annual Report & Accounts |
Consolidated statement of total recognised gains and losses
for the 52 weeks ended 3129 January 20042005
| 52 weeks ended | 52 weeks ended | 53 weeks ended | |||||
| 31 January 2004 | 1 February 2003 | 2 February 2002 | |||||
| as restated | (1) | as restated | (1) | ||||
| £m | £m | £m | |||||
| Profit for the financial period | 137.2 | 129.1 | 120.4 | ||||
| Adjustment to property revaluation | – | – | 2.1 | ||||
| Translation differences (net of tax £nil (2003: £0.7 million credit; | |||||||
| 2002: £0.5 million charge)) | (96.7 | ) | (143.2 | ) | 28.0 | ||
| Actuarial profit/(loss) arising on pension asset (net of £2.8 million | |||||||
| tax charge (2003: £9.5 million 2002: £6.1 million credit)) | 6.4 | (22.3 | ) | (14.3 | ) | ||
| Total recognised gains and losses relating to the period | 46.9 | (36.4 | ) | 136.2 | |||
| Prior year adjustments (note 17) - FRS 17 (adopted in 2003/04) | (18.1 | ) | – | – | |||
| Prior year adjustments (note 17) - FRS 19 (adopted in 2001/02) | – | – | (6.2 | ) | |||
| Total recognised gains and losses since last Annual Report | 28.8 | (36.4 | ) | 130.0 | |||
| 52 weeks ended | 52 weeks ended | 52 weeks ended | |||||
| 29 January 2005 | 31 January 2004 | 1 February 2003 | |||||
| as restated | (1) | as restated | (1) | ||||
| £m | £m | £m | |||||
| Profit for the financial period | 141.2 | 129.6 | 120.2 | ||||
| Translation differences (net of £0.3 million tax charge (2004: £nil; 2003: £0.7 million credit)) | (33.0 | ) | (91.0 | ) | (135.8 | ) | |
| Actuarial (loss)/gain arising on pension asset (net of £1.7 million tax credit | |||||||
| (2004: £2.8 million charge; 2003: £9.5 million credit)) | (3.9 | ) | 6.4 | (22.3 | ) | ||
| Total recognised gains and losses relating to the period | 104.3 | 45.0 | (37.9 | ) | |||
| Prior year adjustments (note 17) | – amendment to FRS 5 (adopted in 2004/05) | (52.7 | ) | – | – | ||
| – FRS 17 (adopted in 2003/04) | – | (18.1 | ) | – | |||
| Total recognised gains and losses since last Annual Report | 51.6 | 26.9 | (37.9 | ) | |||
Note of consolidated historical cost profits and losses
| 52 weeks ended | 52 weeks ended | 53 weeks ended | 52 weeks ended | 52 weeks ended | 52 weeks ended | ||||||||
| 31 January 2004 | 1 February 2003 | 2 February 2002 | 29 January 2005 | 31 January 2004 | 1 February 2003 | ||||||||
| as restated | (1) | as restated | (1) | as restated | (1) | as restated | (1) | ||||||
| £m | £m | £m | £m | £m | £m | ||||||||
| Profit on ordinary activities before taxation | 211.9 | 199.9 | 183.8 | 210.3 | 199.8 | 185.9 | |||||||
| Realisation of property revaluation deficit | – | (0.1 | ) | – | – | – | (0.1 | ) | |||||
| Historical cost profit on ordinary activities before taxation | 211.9 | 199.8 | 183.8 | 210.3 | 199.8 | 185.8 | |||||||
| Historical cost retained profit attributable to equity shareholders | 94.0 | 92.9 | 89.9 | 89.2 | 86.4 | 84.0 | |||||||
| (1) | Restated for the implementation of the amendment to FRS |
| Signet Group plc Annual Report & Accounts |
Consolidated shareholders’ funds
| Ordinary | Deferred | Share | Profit | Ordinary | Deferred | Share | Profit | ||||||||||||||||||||||||||||||||||
| share | premium | Revaluation | Special | and loss | share | share | premium | Revaluation | Special | and loss | |||||||||||||||||||||||||||||||
| capital | account | reserve | reserves | account | Total | capital | capital | account | reserve | reserves | account | Total | |||||||||||||||||||||||||||||
| £m | £m | £m | £m | £m | £m | £m | £m | ||||||||||||||||||||||||||||||||||
| Balance at 27 January 2001 | |||||||||||||||||||||||||||||||||||||||||
| Balance at 2 February 2002 | |||||||||||||||||||||||||||||||||||||||||
| – as previously stated | 8.4 | 0.1 | 38.3 | 0.9 | 51.2 | 466.5 | 565.4 | 8.5 | 0.1 | 48.3 | 3.0 | 38.3 | 585.5 | 683.7 | |||||||||||||||||||||||||||
| – prior year adjustment (note 17) | – | – | – | – | – | 17.6 | 17.6 | – | – | – | – | – | (49.3 | ) | (49.3 | ) | |||||||||||||||||||||||||
| – as restated | 8.4 | 0.1 | 38.3 | 0.9 | 51.2 | 484.1 | 583.0 | 8.5 | 0.1 | 48.3 | 3.0 | 38.3 | 536.2 | 634.4 | |||||||||||||||||||||||||||
| Retained profit attributable to equity shareholders | – | – | – | – | – | 89.9 | 89.9 | ||||||||||||||||||||||||||||||||||
| Shares issued to QUEST/ESOT | – | – | 2.2 | – | – | (2.2 | ) | – | |||||||||||||||||||||||||||||||||
| Exercise of share options | 0.1 | – | 7.8 | – | – | – | 7.9 | ||||||||||||||||||||||||||||||||||
| Property revaluation | – | – | – | 2.1 | – | – | 2.1 | ||||||||||||||||||||||||||||||||||
| Actuarial loss recognised | – | – | – | – | – | (14.3 | ) | (14.3 | ) | ||||||||||||||||||||||||||||||||
| Translation differences | – | – | – | – | (12.9 | ) | 28.0 | 15.1 | |||||||||||||||||||||||||||||||||
| Balance at 2 February 2002 | 8.5 | 0.1 | 48.3 | 3.0 | 38.3 | 585.5 | 683.7 | ||||||||||||||||||||||||||||||||||
| Retained profit attributable to equity shareholders | – | – | – | – | – | 93.0 | 93.0 | – | – | – | – | – | 84.1 | 84.1 | |||||||||||||||||||||||||||
| Shares issued to QUEST/ESOT | – | – | 1.9 | – | – | (1.9 | ) | – | – | – | 1.9 | – | – | (1.9 | ) | – | |||||||||||||||||||||||||
| Exercise of share options | 0.1 | – | 3.7 | – | – | – | 3.8 | 0.1 | – | 3.7 | – | – | – | 3.8 | |||||||||||||||||||||||||||
| Redemption of deferred share capital | – | (0.1 | ) | – | – | – | 0.1 | – | – | (0.1 | ) | – | – | – | 0.1 | – | |||||||||||||||||||||||||
| Transfer on property disposals | – | – | – | 0.1 | – | (0.1 | ) | – | – | – | – | 0.1 | – | (0.1 | ) | – | |||||||||||||||||||||||||
| Actuarial loss recognised | – | – | – | – | – | (22.3 | ) | (22.3 | ) | – | – | – | – | – | (22.3 | ) | (22.3 | ) | |||||||||||||||||||||||
| Translation differences | – | – | – | – | 63.4 | (143.2 | ) | (79.8 | ) | – | – | – | – | 63.4 | (135.8 | ) | (72.4 | ) | |||||||||||||||||||||||
| Balance at 1 February 2003 | 8.6 | – | 53.9 | 3.1 | 101.7 | 511.1 | 678.4 | 8.6 | – | 53.9 | 3.1 | 101.7 | 460.3 | 627.6 | |||||||||||||||||||||||||||
| Retained profit attributable to equity shareholders | – | – | – | – | – | 94.0 | 94.0 | – | – | – | – | – | 86.4 | 86.4 | |||||||||||||||||||||||||||
| Shares issued to QUEST/ESOT | – | – | 1.8 | – | – | (1.8 | ) | – | – | – | 1.8 | – | – | (1.8 | ) | – | |||||||||||||||||||||||||
| Exercise of share options | – | – | 5.0 | – | – | – | 5.0 | – | – | 5.0 | – | – | – | 5.0 | |||||||||||||||||||||||||||
| Actuarial gain recognised | – | – | – | – | – | 6.4 | 6.4 | – | – | – | – | – | 6.4 | 6.4 | |||||||||||||||||||||||||||
| Translation differences | – | – | – | – | 40.5 | (96.7 | ) | (56.2 | ) | – | – | – | – | 40.5 | (91.0 | ) | (50.5 | ) | |||||||||||||||||||||||
| Balance at 31 January 2004(1) | 8.6 | – | 60.7 | 3.1 | 142.2 | 513.0 | 727.6 | ||||||||||||||||||||||||||||||||||
| Balance at 31 January 2004 | 8.6 | – | 60.7 | 3.1 | 142.2 | 460.3 | 674.9 | ||||||||||||||||||||||||||||||||||
| Retained profit attributable to equity shareholders | – | – | – | – | – | 89.2 | 89.2 | ||||||||||||||||||||||||||||||||||
| Shares issued to QUEST/ESOTs | – | – | 2.5 | – | – | (2.5 | ) | – | |||||||||||||||||||||||||||||||||
| Exercise of share options | 0.1 | – | 4.8 | – | – | 1.6 | 6.5 | ||||||||||||||||||||||||||||||||||
| Purchase of own shares by ESOT | – | – | – | – | – | (9.5 | ) | (9.5 | ) | ||||||||||||||||||||||||||||||||
| Transfer on property disposals | – | – | – | 1.2 | – | – | 1.2 | ||||||||||||||||||||||||||||||||||
| Actuarial loss recognised | – | – | – | – | – | (3.9 | ) | (3.9 | ) | ||||||||||||||||||||||||||||||||
| Translation differences | – | – | – | – | 13.7 | (33.0 | ) | (19.3 | ) | ||||||||||||||||||||||||||||||||
| Balance at 29 January 2005(1) | 8.7 | – | 68.0 | 4.3 | 155.9 | 502.2 | 739.1 | ||||||||||||||||||||||||||||||||||
| (1) | Shareholders’ funds at |
| Signet Group plc Annual Report & Accounts |
Notes to the accounts
1. Principal accounting policies
The consolidated accounts of Signet Group plc and its subsidiary companies (“the Group”) are prepared in accordance with generally accepted accounting principles in the UK (“UK GAAP”). These principles differ in certain significant respects from generally accepted accounting principles in the US (“US GAAP”). Application of US GAAP would have affected shareholders’ funds and results of operations at and for the 52 weeks ended 29 January 2005, the 52 weeks ended 31 January 2004 and the 52 weeks ended 1 February 2003 to the extent summarised in note 31. The following accounting policies are applied consistently in dealing with items which are considered material in relation to the accounts of the Group:
(a) Basis of preparation
The Group is a speciality jewellery retailer in both the UK and the US.
The consolidated accounts have been prepared in accordance with applicable UK accounting standards and under the UK historical cost convention as modified by the revaluation of freehold and long leasehold properties.
The preparation of consolidated accounts in conformity with UK GAAP and US GAAP requires management to make estimates and assumptions that affect the reported amounts of assets and liabilities and disclosure of contingent assets and liabilities at the date of the accounts and the reported amounts of revenues and expenses during the reporting period. Actual results could differ from those estimates.
The consolidated accounts comply with the Accounting Standards issued by the Accounting Standards Board. The amendment to FRS 175, ‘Application Note G – ‘Retirement Benefits’Revenue Recognition’ has been implemented during 2003/042004/05 which has resulted in a prior year adjustment as described in note 17.
(b) Consolidation
The Group accounts include the accounts of the Company and its subsidiary undertakings made up for the 52 week period ended 3129 January 20042005 (the comparatives are for the 52 week period ended 1 February 200331 January 2004 and the 5352 week period ended 21 February 2002)2003). Unless otherwise stated, the acquisition method of accounting has been adopted. Under this method, the results of subsidiary undertakings acquired or disposed of in the year are included in the consolidated profit and loss account from the date of acquisition or up to the date of disposal.
Under section 230(3) of the Companies Act 1985 the Company is exempt from the requirement to present its own profit and loss account.
(c) Goodwill
Purchased goodwill (representing the excess of the fair value of the consideration given and associated costs over the fair value of the separable net assets acquired) arising on consolidation in respect of acquisitions since 1 February 1998 is capitalised. Positive goodwill is amortised to nil by equal annual instalments over its estimated useful life, normally 20 years.
In the Company’s accounts, investments in subsidiary undertakings are stated at cost less any impairment in value.
Impairment reviews are carried out annually to ensure goodwill and intangible assets are not carried at above their recoverable amounts. Wherever events or changes in circumstances indicate that the carrying amount may not be recoverable, the Group performs discounted cash flow analyses to compare discounted estimated future operating cash flows to the net carrying value of goodwill. Any amortisation or impairment write downs identified are charged to the profit and loss account.
(d) Sales
Sales represent sales to customers outside the Group, exclusive of value added and sales taxes. Repair revenues are recognised when the service is complete and the merchandise is delivered to the customer.
Revenue from the sale of warranties in the US, such as extended service plans, is recognised at the date of sale. Provision is made for the estimated cost of future claims arising under these service plans.
| Signet Group plc Annual Report & Accounts year ended |
Revenue from the sale of extended service agreements in the US is deferred and recognised, net of incremental costs arising from the initial sale, in proportion to anticipated claims arising. This period is based on the historical claims experience of the US business, which has been consistent since these products were launched. The Group reviews the pattern of claims at the end of each year to determine any significant trends that may require changes to revenue recognition rates.
Prior to the adoption of the amendment to FRS 5, ‘Application Note G – Revenue Recognition’ in 2004/05, the Group recognised the revenue from such extended service agreements at the date of sale, with provision being made for the estimated cost of future claims arising.
(e) Cost of sales
Cost of sales includes all costs incurred in the costpurchase, processing and distribution of goodwill amortisation, distributionthe merchandise and all costs directly incurred in the operation and sellingsupport of the retail outlets. This includes inbound freight charges, purchasing and receiving costs, inspection and internal transfer costs. Advertising costs are expensed as incurred.
(f) Foreign currency translation
The results of overseas subsidiary undertakings are translated into pounds sterling at the weighted average rates of exchange during the period and their balance sheets and attributable goodwill at the rates at the balance sheet date. Exchange differences arising from the translation of the net assets and attributable goodwill of overseas subsidiary undertakings and matched foreign currency borrowings less deposits are charged or credited to reserves. Other exchange differences arising from foreign currency transactions are included in profit before taxation.
(g) Depreciation and amortisation
Depreciation is provided on freehold and long leasehold retail premises over an estimated useful life not exceeding 50 years. Long leaseholds relate to leases that have an original and unexpired lease term of greater than 25 years. Freehold land is not depreciated.
Premiums paid to acquire short leasehold properties are amortised over their lease periods (up to 25 years) while incentives received are amortised over the period to the first rent review. Provision is made for future net lease obligations in respect of onerous leases of vacant, partially vacant or sublet properties. Depreciation on other fixed assets is provided on a straight line basis at the following annual rates:
Plant, machinery and vehicles – 10%, 20%, 331/3%,
Shopfronts, fixtures and fittings – rates up to 331/3%.
Where the renewal of a lease is reasonably assured, the depreciation period for shopfronts, fixtures and fittings may exceed the remaining lease term.
Where appropriate, provision is made on assets that have a lower economic value than book value. Potentially impaired assets are identified by reviewing the cash contribution of individual stores where trading since the initial opening of the store has reached a mature stage. Where such stores deliver a low or negative cash contribution, the related store assets are considered for impairment by reference to the higher of net realisable value and value in use. Additionally, provision is made against tangible fixed assets relating to stores planned for closure.
(h) Stocks
Stocks represent goods held for resale and are valued at the lower of cost and net realisable value. Cost is determined using the first-in, first-out method and includes appropriate overheads.overheads directly related to bringing stocks to their present location and condition. These include relevant warehousing, distribution and certain buying, security and data processing costs. Provision is made for obsolete, slow moving or defective items.
(i) Vendor contributions
Where vendor contributions are received in respect of identifiable promotional events, these are matched against the costs of these promotions. Vendor contributions which are received as general contributions and not against specific promotional events are allocated against stocks.
| Signet Group plc Annual Report & Accounts year ended 29 January 2005 | 73 |
Notes to the accounts (continued)
(j) Debtors
Full provision is made for debts that are 90 days past their due date on a recency basis. A provision is also made based on the historical performance of the receivables portfolio.
(k) Shares in subsidiary undertakings
Shares in subsidiary undertakings are stated at cost, less amounts written off for any impairment in value.
(j)(l) Leases
Rentals paid under operating leases are charged to the profit and loss account as incurred. Predetermined rent increases are recognised when they fall due, reflecting that these are generally intended to compensate for the expected cost of inflation. Amounts payable in respect of turnover leases are recognised in the period to which the turnover relates.
Assets held under finance leases, which are leases where substantially all the risks and rewards of the asset have passed to the Group, are capitalised in the balance sheet and depreciated over their estimated useful lives. Future instalments under such leases, net of finance charges, are included within creditors. Rental payments are apportioned between the finance element, which is charged to the profit and loss account, and the capital element which reduces the outstanding obligation for future instalments.
Notes to the accounts (continued)
(k)(m) Deferred taxation
Deferred taxation is provided on a full provision basis, without discounting, on all timing differences which have arisen but not reversed at the balance sheet date. Except where otherwise required by UK Accounting Standards no timing differences are recognised in respect of:
| (a) | property revaluation surpluses where there is no commitment to sell the asset; and | |
| (b) | ||
| additional tax which would arise if profits of overseas subsidiaries were distributed. |
(l)(n) Pension schemes
The Group Scheme, covering one of the executive directors and all participating eligible employees, which provides benefits based on members’ salaries at retirement. The Group Scheme’s assets are held by the trustees of the Group Scheme and are completely separate from those of the Group.
The full service cost of pension provisions relating to the period is charged to ‘administrative expenses’ in the profit and loss account. The expected return on the Group Scheme’s assets is credited and the interest element of the increase in the present value of the Group Scheme’s liabilities is charged to ‘net interest payable and similar charges’ in the profit and loss account.
The difference between the market value of the assets of the Group Scheme and the present value of accrued pension liabilities is shown as an asset or liability on the balance sheet, net of deferred tax. The difference between the expected return on assets and that actually achieved is recognised in the statement of total recognised gains and losses along with any differences that may arise from experience or assumption changes.
The pension cost is assessed in accordance with the advice of independent qualified actuaries. Where appropriate, supplementary pensions and life assurance benefits for UK directors and senior executives are provided through the Signet Group Funded Unapproved Retirement Benefits Scheme. Cash contributions under the Group’s US defined contribution 401(k) Retirement Savings Planplans are charged to the profit and loss account as incurred.
(m)(o) Net interest payable and similar chargesPremiums paid in respect of the establishment and maintenance of borrowing facilities or purchasedPurchased interest rate protection agreements are amortised to interest payable and similar charges over the term of the relevant agreement. All such interest rate protection agreements must be related to an asset or liability and must change the character of the interest rate by converting a variable rate to a fixed rate, or vice versa, to qualify for accrual accounting. In addition the term and notional amount of the swap, cap or floor must not exceed the term and principal amount of the debt or asset. Amounts payable or receivable under such agreements are accrued within net interest payable and similar charges in the profit and loss account and recorded as current assets or liabilities on the balance sheet. If the agreements are terminated early, the gain or loss is spread over the shorter of the remaining term of the original investment or the remaining term of the related debt.
| 74 | Signet Group plc Annual Report & Accounts year ended 29 January 2005 |
(n) Vendor contributionsWhere vendor contributions are received in respect of identifiable promotional events, these are matched against the costs of these promotions. Vendor contributions which are received as general contributions and not against specific promotional events are allocated against stocks.
(o)(p) Liquid resources
Liquid resources comprise money market deposits and amounts placed with external fund managers with an original maturity of three months or less, and are carried at cost which approximates to fair value.
(q) Foreign exchange risk management
The Group enters into forward purchases of foreign currencies, principally the US dollar and the Euro in order to limit the impact of movements in foreign exchange rates on its forecast foreign currency purchases.
The forward currency purchases are recognised on the balance sheet when the contracts mature. They are accounted for in line with the forward asset underlining the hedged transition, whereby the gain or loss is recognised within the profit and loss account only when the future transaction is also accounted for through the profit and loss account.
(r) Commodity risk management
In order to ensure that values of assets and revenue protection should not be unnecessarily exposed to significant movements in the price of underlining precious metal raw material, the Group may enter into forward purchase contracts for commodities.
The overall amount and duration of such forward commodity contracts are dependent on the underlying buying needs of the operating companies and prevailing commodity prices. The forward commodity purchases are recognised on the balance sheet when the contracts mature. They are accounted for in line with the forward asset underlying the hedged transaction, whereby the gain or loss is recognised within the profit and loss account only when the future transaction is also accounted for through the profit and loss account.
(s) Share schemes
Options granted to employees to subscribe for the Group’s shares where the exercise price of the option is linked to performance, do not result in any compensation costs being recorded by the Group if the stated exercise price is equal to, or in excess of, the fair value of the underlying shares at the date of grant. The cost of the cash and share award elements of the Long Term Incentive Plan is charged to the profit and loss account evenly over the period from the award date to vesting, based on the level of award that is expected to be achieved.
| Signet Group plc Annual Report & Accounts year ended | 75 |
Notes to the accounts (continued) 2. Segment information |
The Group’s results derive from one business segment – the retailing of jewellery, watches and gifts. The Group is managed as two operating segments, being the US and UK divisions. Both divisions are managed by executive committees, which report through the Group Chief Executive to the Group Board. Each divisional executive committee is responsible for operating decisions within guidelines set by the Group Board.
| 2004 | 2003 | 2002 | 2005 | 2004 | 2003 | |||||||||
| £m | £m | £m | £m | £m | ||||||||||
| Sales by origin and destination: | ||||||||||||||
| Sales by origin and destination(1): | ||||||||||||||
| UK | UK | 501.0 | 473.6 | 452.1 | 514.4 | 501.0 | 473.6 | |||||||
| US | US | 1,116.2 | 1,134.4 | 1,126.0 | 1,100.0 | 1,103.9 | 1,120.0 | |||||||
| 1,617.2 | 1,608.0 | 1,578.1 | 1,614.4 | 1,604.9 | 1,593.6 | |||||||||
| Operating profit(1): | Operating profit(1): | |||||||||||||
| UK | – Trading | 76.6 | 64.7 | 58.8 | ||||||||||
| – Group central costs(2) | (5.7 | ) | (6.0 | ) | (5.1 | ) | ||||||||
| UK – Trading | 78.2 | 76.6 | 64.7 | |||||||||||
| – Group central costs(2) | (6.6 | ) | (5.7 | ) | (6.0 | ) | ||||||||
| 70.9 | 58.7 | 53.7 | 71.6 | 70.9 | 58.7 | |||||||||
| US | US | 151.4 | 155.2 | 145.1 | 147.3 | 139.3 | 141.2 | |||||||
| 222.3 | 213.9 | 198.8 | 218.9 | 210.2 | 199.9 | |||||||||
| Depreciation and amortisation: | Depreciation and amortisation: | |||||||||||||
| UK | UK | 15.7 | 12.5 | 10.4 | 17.4 | 15.7 | 12.5 | |||||||
| US | US | 24.7 | 25.3 | 24.3 | 24.9 | 24.7 | 25.3 | |||||||
| 40.4 | 37.8 | 34.7 | 42.3 | 40.4 | 37.8 | |||||||||
| Net interest payable/(receivable) and similar charges(1): | ||||||||||||||
| Net interest payable/(receivable) and similar charges: | ||||||||||||||
| UK | UK | (2.3 | ) | (1.2 | ) | 1.0 | (5.6 | ) | (2.3 | ) | (1.2 | ) | ||
| US | US | 12.7 | 15.2 | 14.0 | 14.2 | 12.7 | 15.2 | |||||||
| 10.4 | 14.0 | 15.0 | 8.6 | 10.4 | 14.0 | |||||||||
| Additions to tangible fixed assets: | Additions to tangible fixed assets: | |||||||||||||
| UK | UK | 17.8 | 16.4 | 18.8 | 28.8 | 17.8 | 16.4 | |||||||
| US | US | 33.1 | 33.1 | 41.0 | 41.7 | 33.1 | 33.1 | |||||||
| 50.9 | 49.5 | 59.8 | 70.5 | 50.9 | 49.5 | |||||||||
| Tangible fixed assets: | Tangible fixed assets: | |||||||||||||
| UK | UK | 72.6 | 70.5 | 67.6 | 84.1 | 72.6 | 70.5 | |||||||
| US | US | 130.2 | 135.0 | 146.5 | 142.7 | 130.2 | 135.0 | |||||||
| 202.8 | 205.5 | 214.1 | 226.8 | 202.8 | 205.5 | |||||||||
| Total assets(1)(3): | ||||||||||||||
| Total assets(3): | ||||||||||||||
| UK | UK | 446.3 | 375.3 | 324.1 | 449.8 | 446.3 | 375.3 | |||||||
| US | US | 782.3 | 819.4 | 897.8 | 843.9 | 782.3 | 819.4 | |||||||
| 1,228.6 | 1,194.7 | 1,221.9 | 1,293.7 | 1,228.6 | 1,194.7 | |||||||||
| Net assets(1)(4): | Net assets(1)(4): | |||||||||||||
| UK | UK | 209.9 | 126.2 | 140.1 | 222.9 | 209.9 | 126.2 | |||||||
| US | US | 597.6 | 692.3 | 745.3 | 599.7 | 544.9 | 641.5 | |||||||
| Net debt | Net debt | (79.9 | ) | (140.1 | ) | (201.7 | ) | (83.5 | ) | (79.9 | ) | (140.1 | ) | |
| 727.6 | 678.4 | 683.7 | 739.1 | 674.9 | 627.6 | |||||||||
| (1) | |
| (2) | Group central costs for |
| (3) | Total assets includes fixed and current assets but excludes current liabilities and debt. |
| (4) | Net debt has been excluded from the two operating segments. |
| 76 | Signet Group plc Annual Report & Accounts year ended |
Notes to the accounts 3. Net interest payable and similar charges
| 2005 | 2004 | 2003 | ||||
| £m | £m | £m | ||||
| Interest on bank loans and overdrafts | 2.1 | 1.9 | 4.7 | |||
| Interest expense of US securitisation facility | 7.4 | 8.2 | 9.0 | |||
| Interest on loan notes | 0.9 | 1.7 | 2.5 | |||
| Facilities fees and related costs | 1.2 | 0.9 | 1.4 | |||
| 11.6 | 12.7 | 17.6 | ||||
| Interest receivable | (1.8 | ) | (1.7 | ) | (1.1 | ) |
| 9.8 | 11.0 | 16.5 | ||||
| Net interest credit on defined benefit pension scheme (note 20) | (1.2 | ) | (0.6 | ) | (2.5 | ) |
| 8.6 | 10.4 | 14.0 | ||||
(continued)4. Profit on ordinary activities before taxation
| 2005 | 2004 | 2003 | ||||
| £m | £m | £m | ||||
| Profit on ordinary activities before taxation is stated after charging: | ||||||
| Depreciation – owned assets | 41.3 | 37.6 | 34.8 | |||
| Depreciation – assets held under finance leases | – | 1.7 | 1.8 | |||
| Goodwill amortisation | 1.0 | 1.1 | 1.2 | |||
| Fees payable to KPMG Audit Plc and their associates: | ||||||
| Audit services(1) | 0.4 | 0.4 | 0.4 | |||
| Further assurance services(2) | 0.3 | 0.1 | 0.1 | |||
| Tax services | – | – | 0.3 | |||
| Other services | – | – | – | |||
| Advertising | 78.0 | 73.7 | 69.4 | |||
| UK restructuring cost | 1.7 | – | – | |||
| Operating lease rentals – plant, machinery and vehicles | 2.1 | 2.2 | 2.1 | |||
| Operating lease rentals – property | 133.9 | 136.7 | 135.5 | |||
| 2004 | 2003 | 2002 | |||||
| £m | £m | £m | |||||
| Interest on bank loans and overdrafts | 1.9 | 4.7 | 7.7 | ||||
| Interest expense of US securitisation facility | 8.2 | 9.0 | 5.9 | ||||
| Interest on loan notes | 1.7 | 2.5 | 3.0 | ||||
| Facilities fees and related costs | 0.9 | 1.4 | 2.8 | ||||
| 12.7 | 17.6 | 19.4 | |||||
| Interest receivable | (1.7 | ) | (1.1 | ) | (1.5 | ) | |
| 11.0 | 16.5 | 17.9 | |||||
| Net interest credit on defined benefit pension scheme (note 22) | (0.6 | ) | (2.5 | ) | (2.9 | ) | |
| 10.4 | 14.0 | 15.0 | |||||
| of its subsidiaries. | |
| 2004 | 2003 | 2002 | |||||
| £m | £m | £m | |||||
| Profit on ordinary activities before taxation is stated after charging: | |||||||
| Depreciation – owned assets | 37.6 | 34.8 | 30.5 | ||||
| Depreciation – assets held under finance leases | 1.7 | 1.8 | 2.9 | ||||
| Goodwill amortisation | 1.1 | 1.2 | 1.3 | ||||
| Fees payable to KPMG Audit Plc and their associates: | |||||||
| Audit services | 0.4 | 0.4 | 0.4 | ||||
| Further assurance services(1) | 0.1 | 0.1 | 0.1 | ||||
| Tax services | – | 0.3 | 0.2 | ||||
| Other services | – | – | – | ||||
| Advertising | 73.7 | 69.4 | 70.1 | ||||
| Operating lease rentals – plant, machinery and vehicles | 2.2 | 2.1 | 2.2 | ||||
| Operating lease rentals – property | 136.7 | 135.5 | 130.6 | ||||
| Further assurance services were for work carried out in respect of the quarterly reviews and Christmas trading | |
| 2004 | 2003 | 2002 | |||||
| The exchange rates used for translation of US dollar transactions and balances in these accounts are as follows: | |||||||
| Profit and loss (average rate) | 1.68 | 1.53 | 1.44 | ||||
| Balance sheet (year end rate) | 1.82 | 1.64 | 1.42 | ||||
5. Foreign currency translation
The exchange rates used for translation of US dollar transactions and balances in these accounts are as follows:
| 2005 | 2004 | 2003 | ||||
| Profit and loss (average rate) | 1.86 | 1.68 | 1.53 | |||
| Balance sheet (year end rate) | 1.89 | 1.82 | 1.64 | |||
The effect of translation on foreign currency borrowings less deposits in the period was to decrease the Group’s net borrowings by £6.4 million (2004: £17.5 million (2003:decrease, 2003: £27.9 million decrease, 2002: £5.3 million increase)decrease). The net effect of exchange rate movements on foreign currency investments (excluding goodwill) and foreign currency borrowings less deposits in the period was a loss of £56.2£19.3 million (2003: £79.8(2004: £50.5 million loss, 2002: £15.12003: £72.4 million gain)loss). This amount has been taken to reserves in accordance with SSAP 20.
| Signet Group plc Annual Report & Accounts year ended | 77 | ||
| 2004 | 2003 | 2002 | ||||||
| £m | £m | £m | ||||||
| Directors’ emoluments | 2.0 | 2.6 | 2.6 | |||||
| Directors’ LTIP(1) | – cash | 0.3 | 0.4 | 0.5 | ||||
| – share options (at market value) | 0.5 | 0.6 | – | |||||
| Contributions in respect of Directors’ to pension schemes | 0.2 | 0.2 | 0.2 | |||||
Notes to the accounts (continued)
6. Directors and employees
| 2005 | 2004 | 2003 | ||||
| £m | £m | £m | ||||
| Directors’ emoluments | 2.3 | 2.0 | 2.6 | |||
| Directors’ LTIP – cash | 0.3 | 0.3 | 0.4 | |||
| Directors’ LTIP(1) – share options (at market value) | 0.4 | 0.5 | 0.6 | |||
| Contributions to pension schemes in respect of directors | 0.2 | 0.2 | 0.2 | |||
| (1) |
Details of directors’ emoluments are shown in the Board report on remuneration on page 45.54.
The aggregate emoluments (excluding amounts due under the 2000 LTIP) of the highest paid director, Terry Burman, as US Chief Executive and as Group Chief Executive were £1,100,000 (2003: £1,217,000; 2002: £1,055,000)£1,199,000 (2004: £1,100,000; 2003: £1,217,000). The amounts due to him under the 2000 LTIP were £574,000 (2003: £631,000, restated)£531,000 (2004: £601,000, restated; 2003: £631,000). In 2002 under a prior LTIP a payment of £520,000 was made to him wholly in cash. For 2004,2005, 50% of the amount due under the 2000 LTIP, £239,000, is payable in cash (£201,000;(2004: £201,000; 2003: £256,000) and the other 50% consists of the grant of an option to acquire shares in the Company (market value at 24 March 2004: £373,000)6 April 2005: £292,000). Additionally, pension contributions of £142,000 (2003: £147,000; 2002: £146,000)£136,000 (2004: £142,000; 2003: £147,000) were made to money purchase schemes on his behalf. The gain made by him on the exercise of options in the Group was £1,934,651 (2003: £4,364; 2002: £2,132,038)£2,090,959 (2004: £1,934,651; 2003: £4,364).
| 2004 | 2003 | 2002 | 2005 | 2004 | 2003 | ||||||||
| Number of | Number of | Number | Number | Number | |||||||||
| persons | persons | of persons | of persons | of persons | |||||||||
| Retirement benefits are accruing to the following numbers of directors under: | |||||||||||||
| Money purchase schemes | 1 | 1 | 1 | 1 | 1 | 1 | |||||||
| Defined benefit schemes | 1 | 1 | 2 | 1 | 1 | 1 | |||||||
| The average number of full-time equivalent persons employed (including directors) | |||||||||||||
| during the period, analysed by category and division, was: | |||||||||||||
| Total Group: | |||||||||||||
| Management | 530 | 512 | 495 | 562 | 530 | 512 | |||||||
| Administration | 1,314 | 1,296 | 1,243 | 1,391 | 1,314 | 1,296 | |||||||
| Distribution and sales staff | 12,658 | 12,352 | 11,787 | 13,192 | 12,658 | 12,352 | |||||||
| 14,502 | 14,160 | 13,525 | 15,145 | 14,502 | 14,160 | ||||||||
| UK: | |||||||||||||
| Management | 389 | 377 | 363 | 418 | 389 | 377 | |||||||
| Administration | 231 | 240 | 220 | 210 | 231 | 240 | |||||||
| Distribution and sales staff | 3,942 | 4,129 | 4,023 | 3,849 | 3,942 | 4,129 | |||||||
| 4,562 | 4,746 | 4,606 | 4,477 | 4,562 | 4,746 | ||||||||
| US: | |||||||||||||
| Management | 141 | 135 | 132 | 144 | 141 | 135 | |||||||
| Administration | 1,083 | 1,056 | 1,023 | 1,181 | 1,083 | 1,056 | |||||||
| Distribution and sales staff | 8,716 | 8,223 | 7,764 | 9,343 | 8,716 | 8,223 | |||||||
| 9,940 | 9,414 | 8,919 | 10,668 | 9,940 | 9,414 | ||||||||
| £m | £m | £m | £m | £m | £m | ||||||||
| The aggregate Group staff costs were as follows: | |||||||||||||
| Wages and salaries | 276.9 | 282.5 | 278.3 | 281.4 | 276.9 | 282.5 | |||||||
| Social security costs | 22.5 | 22.1 | 22.5 | 23.2 | 22.5 | 22.1 | |||||||
| Pension costs (restated for the implementation of FRS 17 – ‘Retirement Benefits’) | 4.4 | 4.2 | 3.5 | ||||||||||
| Pension costs | 4.7 | 4.4 | 4.2 | ||||||||||
| 303.8 | 308.8 | 304.3 | 309.3 | 303.8 | 308.8 | ||||||||
| 78 | Signet Group plc Annual Report & Accounts year ended |
Notes to the accounts 7. Taxation(continued)
| 7. | Taxation | ||||||
| 2004 | 2003 | (1) | 2002 | (1) | |||
| £m | £m | £m | |||||
| Profit on ordinary activities before taxation: | |||||||
| UK | 73.2 | 59.9 | 52.7 | ||||
| US | 138.7 | 140.0 | 131.1 | ||||
| 211.9 | 199.9 | 183.8 | |||||
| 2004 | 2003 | 2002 | (1) | ||||
| £m | £m | £m | |||||
| Taxes on profit: | |||||||
| UK corporation tax payable | 26.2 | 22.6 | 19.8 | ||||
| US taxes | 36.2 | 55.6 | 36.7 | ||||
| Deferred taxation: | |||||||
| UK | 0.5 | (0.7 | ) | 0.3 | |||
| US | 11.8 | (6.7 | ) | 6.6 | |||
| 74.7 | 70.8 | 63.4 | |||||
| (1) | Restated for the implementation of FRS 17 – ‘Retirement Benefits’ (see note 17). | ||||||
| 2004 | 2003 | 2002 | ||||
| £m | £m | £m | ||||
| Sources of deferred taxation are as follows: | ||||||
| Accelerated capital allowances | (0.4 | ) | 0.1 | 0.2 | ||
| Other timing differences | 12.7 | (7.5 | ) | 6.7 | ||
| 12.3 | (7.4 | ) | 6.9 | |||
| 2005 | 2004 | (1) | 2003 | (1) | ||
| £m | £m | £m | ||||
| Profit on ordinary activities before taxation: | ||||||
| UK | 77.2 | 73.2 | 59.9 | |||
| US | 133.1 | 126.6 | 126.0 | |||
| 210.3 | 199.8 | 185.9 | ||||
| 2005 | 2004 | (1) | 2003 | (1) | ||
| £m | £m | £m | ||||
| Taxes on profit: | ||||||
| UK corporation tax payable | 19.8 | 26.2 | 22.6 | |||
| US taxes | 25.9 | 36.2 | 55.6 | |||
| Deferred taxation: | ||||||
| UK | 0.5 | 0.5 | (0.7 | ) | ||
| US | 22.9 | 7.3 | (11.8 | ) | ||
| 69.1 | 70.2 | 65.7 | ||||
| 2005 | 2004 | (1) | 2003 | (1) | ||
| £m | £m | £m | ||||
| Sources of deferred taxation are as follows: | ||||||
| UK fixed assets (capital allowances) | 0.4 | (0.4 | ) | 0.1 | ||
| US fixed assets | 4.1 | 7.7 | (3.9 | ) | ||
| Stock valuation | 2.5 | 4.3 | (0.5 | ) | ||
| Allowances for doubtful debts | (1.0 | ) | (0.3 | ) | – | |
| Revenue deferral (extended service agreements) | 13.3 | (4.5 | ) | (5.1 | ) | |
| Other timing differences | 4.1 | 1.0 | (3.1 | ) | ||
| 23.4 | 7.8 | (12.5 | ) | |||
The differences between the standard rate of corporation tax in the UK and the current and effective tax rates for the Group are explained below:
| 2004 | 2003 | 2002 | ||||||||||
| % | % | 2005 | 2004 | (1) | 2003 | (1) | ||||||
| % | % | % | ||||||||||
| UK statutory tax rates | 30.0 | 30.0 | 30.0 | 30.0 | 30.0 | 30.0 | ||||||
| Expenditure permanently disallowable for tax purposes, net of permanent undercharges | 0.4 | 0.7 | – | 0.2 | 0.4 | 0.8 | ||||||
| Differences between UK and US (including state) standard tax rates | 5.3 | 4.9 | 5.6 | 4.8 | 5.2 | 4.7 | ||||||
| Over provision in respect of previous periods | (0.4 | ) | (0.2 | ) | (1.1 | ) | (2.1 | ) | (0.4 | ) | (0.2 | ) |
| Differences between capital allowances and depreciation | 0.2 | (0.1 | ) | (0.1 | ) | |||||||
| UK fixed assets (capital allowances) | (0.2 | ) | 0.2 | (0.1 | ) | |||||||
| US fixed assets | (1.9 | ) | (3.9 | ) | 2.1 | |||||||
| Stock valuation | (1.2 | ) | (2.2 | ) | 0.3 | |||||||
| Allowances for doubtful debts | 0.4 | 0.2 | – | |||||||||
| Revenue deferral (extended service agreements) | (6.3 | ) | 2.2 | 2.7 | ||||||||
| Other timing differences | (6.0 | ) | 3.8 | (3.7 | ) | (1.9 | ) | (0.5 | ) | 1.7 | ||
| Current tax rate | 29.5 | 39.1 | 30.7 | 21.8 | 31.2 | 42.0 | ||||||
| Deferred tax rate | 5.8 | (3.7 | ) | 3.8 | 11.1 | 3.9 | (6.7 | ) | ||||
| Effective tax rates in accounts | 35.3 | 35.4 | 34.5 | |||||||||
| 32.9 | 35.1 | 35.3 | ||||||||||
| (1) | Restated for the implementation of the amendment to FRS 5, ‘Application Note G – Revenue Recognition’ (see note 17). |
| Signet Group plc Annual Report & Accounts year ended 29 January 2005 | 79 |
Notes to the accounts (continued)
The effective tax rate for the Group is higher than the UK statutory tax rate because the significant proportion of the Group’s business is conducted in the US where the combined federal and state tax rate approaches 40%. The Group’s future effective tax rate is also dependent on the movement in foreign exchange translation rates. It is anticipated that the effective tax rate for the Group in 2004/052005/06 will be marginally below the level for 2003/04.approximately 34%.
Back to Contents8. Dividends
| 8. | Dividends | ||||||
| 2004 | 2003 | 2002 | |||||
| £m | £m | £m | |||||
| Interim dividend paid of 0.341p per share (2003: 0.310p; 2002: 0.289p) | 5.9 | 5.3 | 5.0 | ||||
| Final dividend proposed of 2.16p per share (2003: 1.80p; 2002: 1.50p) | 37.3 | 30.8 | 25.5 | ||||
| 43.2 | 36.1 | 30.5 | |||||
| 2005 | 2004 | 2003 | ||||
| £m | £m | £m | ||||
| Interim dividend paid of 0.375p per share (2004: 0.341p; 2003: 0.310p) | 6.5 | 5.9 | 5.3 | |||
| Final dividend proposed of 2.625p per share (2004: 2.160p; 2003: 1.800p) | 45.5 | 37.3 | 30.8 | |||
| 52.0 | 43.2 | 36.1 | ||||
The interim dividend was paid on 75 November 2003.2004. Subject to shareholder approval, the proposed final dividend is to be paid on 28 July 20042005 to those shareholders on the register of members at close of business on 410 June 2004.2005.
Signet Group QUEST Limited, the trustee of the Signet Group Qualifying Employee Share Trust, has waived its right to participate in any dividends declared by the Company in respect of shares held by it in the Company. The interimtrustee has not held any shares since 16 July 2004 and no future dividend paid on 7 November 2003 was not paid in respect of the 45,757 shares then held by the trustee, nor will the final dividend or any future dividend be paid in respect of any shares held by it unless the Company shall have directed the trustee to accept any particular dividend.
Under recently enacted US tax legislation the rate of US federal income tax on dividendsDividends received by individual US shareholders from qualified foreign corporations isare subject to US federal income tax at a reduced torate of 15%. Dividends paid by the Group to individual US holders of shares or ADSs should qualify for this preferential dividend tax treatment. The change inThis US tax legislation only applies to individuals subject to US federal income taxes and therefore the tax position of UK shareholders is unaffected. Individual US holders of shares or ADSs are urged to consult their tax advisers regarding the application of this recent US tax legislation to their particular circumstances.
| 9. | Earnings per share | ||||||
| 2004 | 2003 | (1) | 2002 | (1) | |||
| £m | £m | £m | |||||
| Profit for the financial period | 137.2 | 129.1 | 120.4 | ||||
| 2004 | 2003 | 2002 | |||||
| Basic weighted average number of shares in issue (million) | 1,718.4 | 1,710.7 | 1,690.2 | ||||
| Dilutive effect of share options (million) | 12.5 | 16.4 | 12.5 | ||||
| Diluted weighted average number of shares (million) | 1,730.9 | 1,727.1 | 1,702.7 | ||||
| Earnings per share – basic | 8.0p | 7.5p | 7.1p | ||||
| Earnings per share – diluted | 7.9p | 7.5p | 7.1p | ||||
9. Earnings per share
| 2005 | 2004 | (1) | 2003 | (1) | ||
| Profit for the financial period (£m) | 141.2 | 129.6 | 120.2 | |||
| Basic weighted average number of shares in issue (million) | 1,731.6 | 1,718.4 | 1,710.7 | |||
| Dilutive effect of share options (million) | 6.0 | 12.5 | 16.4 | |||
| Diluted weighted average number of shares (million) | 1,737.6 | 1,730.9 | 1,727.1 | |||
| Earnings per share – basic | 8.2 | p | 7.5 | p | 7.0 | p |
| Earnings per share – diluted | 8.1 | p | 7.5 | p | 7.0 | p |
The basic weighted average number of shares in issue excludes those shares held in the QUEST (see note 20)21).
| (1) | Restated for the implementation of the amendment to FRS |
| 80 | |
| Signet Group plc Annual Report & Accounts year ended |
Notes to the accounts 10. Intangible fixed assets(continued)
| Purchased | |||
| goodwill | |||
| £m | |||
| Cost: | |||
| At | |||
| Translation differences | ( | ) | |
| At | |||
| Amortisation: | |||
| At | |||
| Charged in period | |||
| Translation differences | ( | ) | |
| At | |||
| Net book value: | |||
| At | |||
| At | |||
The purchased goodwill above arose on the acquisition of Marks & Morgan on 31 July 2000 and will be amortised over 20 years. Consequently, under current UK GAAP, the amortisation expense iswould be expected to be £1.1£1.0 million for each of the next fivesubsequent financial years to 2008/09.2019/20. This may be affected by movements in exchange rates. An impairment review was performed at 3129 January 2004,2005, concluding that the carrying value of £16.8£15.2 million does not require an impairment adjustment.
| Signet Group plc Annual Report & Accounts year ended | 81 |
Notes to the accounts (continued)
11. Tangible fixed assets
| Land and buildings | ||||||||||||||||||||||||||||||||||
| Plant, | Shopfronts, | Land and buildings | Plant, | Shopfronts | ||||||||||||||||||||||||||||||
| Long | Short | machinery | fixtures and | |||||||||||||||||||||||||||||||
| Freehold | leasehold | Total | Freehold | Long leasehold | Short leasehold | and vehicles | fittings | Total | ||||||||||||||||||||||||||
| £m | £m | £m | £m | £m | ||||||||||||||||||||||||||||||
| Cost or valuation: | ||||||||||||||||||||||||||||||||||
| At 1 February 2003 | 17.6 | 1.9 | 122.7 | 57.5 | ||||||||||||||||||||||||||||||
| At 31 January 2004 | 17.4 | 1.9 | 121.2 | 60.2 | 252.8 | 453.5 | ||||||||||||||||||||||||||||
| Additions | – | – | 12.5 | 7.5 | 30.9 | 50.9 | – | – | 14.2 | 11.7 | 44.6 | 70.5 | ||||||||||||||||||||||
| Disposals | – | – | (1.6 | ) | (0.4 | ) | (3.2 | ) | (5.2 | ) | – | – | (1.2 | ) | (0.4 | ) | (3.2 | ) | (4.8 | ) | ||||||||||||||
| Translation differences | (0.2 | ) | – | (12.4 | ) | (4.4 | ) | (15.7 | ) | (32.7 | ) | – | – | (4.5 | ) | (1.6 | ) | (5.7 | ) | (11.8 | ) | |||||||||||||
| At 29 January 2005 | 17.4 | 1.9 | 129.7 | 69.9 | 288.5 | 507.4 | ||||||||||||||||||||||||||||
| Amortisation: | ||||||||||||||||||||||||||||||||||
| At 31 January 2004 | 17.4 | 1.9 | 121.2 | 60.2 | 252.8 | 453.5 | 1.7 | 0.1 | 63.7 | 43.2 | 142.0 | 250.7 | ||||||||||||||||||||||
| Depreciation: | ||||||||||||||||||||||||||||||||||
| At 1 February 2003 | 1.5 | – | 62.9 | 40.5 | 130.1 | 235.0 | ||||||||||||||||||||||||||||
| Charged in period | 0.2 | 0.1 | 9.0 | 6.3 | 23.7 | 39.3 | 0.2 | – | 9.2 | 6.2 | 25.7 | 41.3 | ||||||||||||||||||||||
| Disposals | – | – | (1.6 | ) | (0.3 | ) | (3.1 | ) | (5.0 | ) | – | – | (1.2 | ) | (0.3 | ) | (3.1 | ) | (4.6 | ) | ||||||||||||||
| Translation differences | – | – | (6.6 | ) | (3.3 | ) | (8.7 | ) | (18.6 | ) | – | – | (2.4 | ) | (1.3 | ) | (3.1 | ) | (6.8 | ) | ||||||||||||||
| At 31 January 2004 | 1.7 | 0.1 | 63.7 | 43.2 | 142.0 | 250.7 | ||||||||||||||||||||||||||||
| At 29 January 2005 | 1.9 | 0.1 | 69.3 | 47.8 | 161.5 | 280.6 | ||||||||||||||||||||||||||||
| Net book value: | ||||||||||||||||||||||||||||||||||
| At 29 January 2005 | 15.5 | 1.8 | 60.4 | 22.1 | 127.0 | 226.8 | ||||||||||||||||||||||||||||
| At 31 January 2004 | 15.7 | 1.8 | 57.5 | 17.0 | 110.8 | 202.8 | 15.7 | 1.8 | 57.5 | 17.0 | 110.8 | 202.8 | ||||||||||||||||||||||
| At 1 February 2003 | 16.1 | 1.9 | 59.8 | 17.0 | 110.7 | 205.5 | ||||||||||||||||||||||||||||
Cost or valuation All fixed assets are stated at cost with the exception of all UK freehold and long leasehold properties which are stated on the basis of their latest professional valuation. An external valuation was undertaken by NAI Gooch Webster, Chartered Surveyors, at 2 February 2002. The valuation was in accordance with the Royal Institute of Chartered Surveyors’ Appraisal and Valuation Manual. A total of 14 were valued on an existing use basis and are stated at net realisable value, and one was valued on an open market basis and is stated on that basis. At 29 January 2005, an internal interim valuation was carried out by a professionally qualified surveyor. The valuation was in accordance with the Royal Institute of Chartered Surveyors’ Appraisal and Valuation Manual. The results of the valuation show no significant differences to the 2002 valuation.
Freehold properties in the consolidated balance sheet include £7.5£7.4 million of depreciable assets (2003:(2004: £7.5 million). The net book value of shopfronts, fixtures and fittings held under finance leases is £nil (2004: £7.5 million (2003: £8.3 million).
| 2004 | 2003 | 2005 | 2004 | |||||||
| £m | £m | £m | £m | |||||||
| Freehold and long leasehold land and buildings are stated at: | ||||||||||
| Cost | 1.5 | 1.6 | 1.5 | 1.5 | ||||||
| Valuation | 17.8 | 17.9 | 17.8 | 17.8 | ||||||
| 19.3 | 19.5 | 19.3 | 19.3 | |||||||
| The net book value of freehold and long leasehold land and buildings on an historical cost basis would be: | ||||||||||
| Cost | 26.0 | 26.2 | 26.0 | 26.0 | ||||||
| Depreciation | (7.7 | ) | (7.5 | ) | (7.9 | ) | (7.7 | ) | ||
| 18.3 | 18.7 | 18.1 | 18.3 | |||||||
| 82 | Signet Group plc Annual Report & Accounts year ended |
Notes to the accounts (continued)
12. Stocks
Stocks constitute goods held for resale.
Subsidiary undertakings held £83.1£87.2 million of consignment stocks at 3129 January 2004 (2003: £74.42005 (2004: £83.1 million) which is not recorded on the balance sheet. The principal terms of the consignment agreements, which can generally be terminated by either side, are such that the Group can return any or all of the stocks to the relevant suppliers without financial or commercial penalties and the supplier can vary stock prices.
| Stock provisions | ||||||||
| Balance at | Balance at | |||||||
| beginning | Charged to | end of | ||||||
| of period | profit | Utilised | period | |||||
| 52/53 weeks ended | £m | £m | £m | £m | ||||
| 2 February 2002 | 11.0 | 20.4 | (23.5 | ) | 7.9 | |||
| 1 February 2003 | 7.9 | 19.5 | (21.3 | ) | 6.1 | |||
| 31 January 2004 | 6.1 | 16.8 | (18.4 | ) | 4.5 | |||
| Stock provisions | ||||||||
| Balance at | Balance at | |||||||
| beginning of | Charged to | |||||||
| period | profit | Utilised | end of period | |||||
| 52 weeks ended | £m | £m | £m | £m | ||||
| 1 February 2003 | 7.9 | 19.5 | (21.3 | ) | 6.1 | |||
| 31 January 2004 | 6.1 | 16.8 | (18.4 | ) | 4.5 | |||
| 29 January 2005 | 4.5 | 18.4 | (18.0 | ) | 4.9 | |||
Stock provisions have been made for obsolete, slow-moving and damaged stock on a consistent basis.
| 13. Debtors | ||||||
| 2004 | 2003 | (1) | ||||
| £m | £m | |||||
| Trade debtors (net of allowances): | ||||||
| – US receivables programme | 292.9 | 299.2 | ||||
| – Other | 8.7 | 8.3 | ||||
| 301.6 | 307.5 | |||||
| Other debtors | 22.5 | 22.5 | ||||
| Corporation tax recoverable | 0.6 | 0.2 | ||||
| Prepayments and accrued income | 13.6 | 10.5 | ||||
| Debtors recoverable within one year | 338.3 | 340.7 | ||||
| Debtors recoverable after more than one year – deferred taxation (note 18) | – | 5.2 | ||||
| – pension scheme asset (note 22) | 1.2 | – | ||||
| 339.5 | 345.9 | |||||
13. Debtors
| 2005 | 2004 | |||
| £m | £m | |||
| Trade debtors (net of allowances): | ||||
| – US receivables programme | 319.0 | 292.9 | ||
| – Other | 10.8 | 8.7 | ||
| 329.8 | 301.6 | |||
| Other debtors | 25.4 | 22.5 | ||
| Corporation tax recoverable | 1.1 | 0.6 | ||
| Prepayments and accrued income | 14.7 | 13.6 | ||
| Debtors recoverable within one year | 371.0 | 338.3 | ||
| Debtors recoverable after more than one year(1) – deferred taxation (note 18) | 4.3 | 26.9 | ||
| 375.3 | 365.2 | |||
| (1) | |
| . |
| Allowances for doubtful debts | ||||||||
| 52/53 weeks ended | Balance at beginning of period | Charged to profit | Balance at end of period | |||||
| Utilised | (1) | |||||||
| £m | £m | £m | £m | |||||
| 2 February 2002 | 27.0 | 45.7 | (46.4 | ) | 26.3 | |||
| 1 February 2003 | 26.3 | 39.1 | (44.1 | ) | 21.3 | |||
| 31 January 2004 | 21.3 | 36.9 | (38.4 | ) | 19.8 | |||
Allowances for doubtful debts 52 weeks ended Balance at
beginning of
period
£m Charged to
profit
£m Utilised
£m
(1)Balance at
end of period
£m 1 February 2003 26.3 39.1 (44.1 ) 21.3 31 January 2004 21.3 36.9 (38.4 ) 19.8 29 January 2005 19.8 37.4 (35.6 ) 21.6
| (1) | Including the impact of foreign exchange translation between opening and closing balance sheet dates. |
| Signet Group plc Annual Report & Accounts year ended | 83 |
| 14. Cash at bank and in hand | ||||
| 2004 | 2003 | |||
| £m | £m | |||
| Bank deposits | 127.4 | 88.6 | ||
| Other cash | 0.6 | 0.6 | ||
| 128.0 | 89.2 | |||
| 15. Creditors: amounts falling due within one year | |||||
| 2004 | 2003 | ||||
| £m | £m | ||||
| Bank overdrafts | 51.1 | 42.9 | |||
| Loan notes | 8.2 | 9.1 | |||
| Obligations under finance leases | 2.4 | 3.3 | |||
| Trade creditors | 55.6 | 58.7 | |||
| Corporation tax | 54.2 | 58.8 | |||
| Social security and PAYE | 1.4 | 1.5 | |||
| Other taxes | 23.5 | 21.8 | |||
| Other creditors | 5.3 | 6.7 | |||
| Accruals and deferred income | 93.0 | 91.3 | |||
| Proposed dividend | 37.3 | 30.8 | |||
| 332.0 | 324.9 | ||||
Notes to the accounts (continued)
14. Cash at bank and in hand
| 2005 | 2004 | |||
| £m | £m | |||
| Bank deposits | 101.8 | 127.4 | ||
| Other cash | 0.6 | 0.6 | ||
| 102.4 | 128.0 | |||
15. Creditors: amounts falling due within one year
| 2005 £m | 2004 as restated £m | (1) | ||
| Bank overdrafts | 42.8 | 51.1 | ||
| Bank loans falling due within one year | 2.4 | – | ||
| Loan notes | 7.9 | 8.2 | ||
| Obligations under finance leases | – | 2.4 | ||
| Trade creditors | 41.4 | 55.6 | ||
| Corporation tax | 43.8 | 54.2 | ||
| Social security and PAYE | 2.8 | 1.4 | ||
| Other taxes | 22.1 | 23.5 | ||
| Deferred income from extended service agreements | 42.1 | 38.8 | ||
| Other creditors | 4.1 | 5.3 | ||
| Accruals and other deferred income | 96.7 | 87.8 | ||
| Proposed dividend | 45.5 | 37.3 | ||
| 351.6 | 365.6 | |||
| (1) | Restated for the implementation of the amendment to FRS 5, ‘Application Note G – Revenue Recognition’ (see note 17). |
The weighted average interest rate on short-term borrowings at 3129 January 20042005 was 2.39% (31 January 2004: 1.85% (1 February 2003: 3.48%).
| 16. Creditors: amounts falling due after more than one year | |||||
| 2004 | 2003 | (1) | |||
| £m | £m | ||||
| Loan notes falling due between one and two years | 8.3 | 9.1 | |||
| Loan notes falling due between two and five years | – | 9.2 | |||
| Bank loans falling due between one and two years | 137.9 | 153.1 | |||
| Obligations under finance leases falling due between one and two years | – | 2.6 | |||
| Other creditors | 11.0 | 10.4 | |||
| Pension scheme liability (note 22) | – | 4.7 | |||
| 157.2 | 189.1 | ||||
16. Creditors: amounts falling due after more than one year
| 2005 £m | 2004 as restated £m | (1) | ||
| Loan notes falling due between one and two years | – | 8.3 | ||
| Bank loans falling due between one and two years | 132.8 | 137.9 | ||
| Deferred income from extended service agreements | 55.1 | 51.4 | ||
| Other creditors | 12.3 | 11.0 | ||
| 200.2 | 208.6 | |||
| (1) | Restated for the implementation of the amendment to FRS |
In August 2001September 2004 the Group entered into an unsecured $410$390 million multi-currency revolving credit facility with a syndicate of banks for a period of five years at a variable interest rate at a maximum margin of 0.85%0.55% above LIBOR. The facility replaced the $410 million facility that was due to expire August 2006. From commencement, the applicable margin has been 0.65%0.40% above LIBOR. At 3129 January 20042005 the amount outstanding under this facility was $nil.
Commitment fees are paid on the undrawn portion of this credit facility at a rate of 50.0%40.0% of the applicable margin.
| 84 | Signet Group plc Annual Report & Accounts year ended |
Notes to the accounts (continued)
The principal financial covenants on this facility are as follows:
In July 1998 the Group entered into a $60 million seven year unsecured note issue with a fixed interest rate of 7.25%. This note issue is repayable in four equal annual instalments of $15 million, which commenced in July 2002. At
In the US, in November 2001, the Company refinanced its private label credit card receivables programme through a privately placed receivables securitisation. Under this securitisation, interests in the US receivables portfolio held by a trust were sold principally to institutional investors in the form of fixed-rate Class A, Class B and Class C investor certificates. The certificates have a weighted average interest rate of 5.42% and interest is paid monthly in arrears from the finance charges collections generated by the receivables portfolio. The revolving period of the securitisation ends in December 2005, with a final expected principal payment date in November 2006. The aggregate outstanding principal amount of the certificates amounted to $251 million at
As a result of the
Notes to the accounts (continued)
The adoption of FRS 17 – ‘Retirement Benefits’
The consolidated statement of total recognised gains and losses has been restated for the 52 weeks ended 1 February 2003 The profit and loss
18. Deferred taxation
Movement in deferred tax
19.
The provision is for onerous leases and includes the discounted cash flows of future net obligations in respect of vacant 20. Pension schemes An actuarial valuation of the Group Scheme was carried out as at 5 April 2003. Results of that valuation have been updated to January 2005 by an independent qualified actuary. As the Group Scheme is closed to new entrants, under the projected unit method the current service cost will increase as a percentage of salaries as its members approach retirement. In the US, the Group sponsors a defined contribution 401(k) retirement savings plan for all eligible employees who meet minimum age and service requirements. The assets of this plan are held in a separate trust managed by KeyBank and under it, the Group matches 25% of up to the first 6% of employee elective salary deferrals. The Group has also established, in the US, an unfunded, unqualified deferred compensation plan which permits certain management employees to elect annually to defer all or a portion of their remuneration and earn a guaranteed interest rate on the deferred amounts. The plan also provides for a Group matching contribution based on each participant’s annual remuneration deferral. In connection with this plan, the Group has invested in trust owned life insurance policies. In June 2004 the Group introduced a defined contribution plan which replaced the Group Scheme for new UK employees.
Notes to the accounts (continued)
The financial assumptions used by the actuary to calculate the Group Scheme liabilities were:
The assets in the Group Scheme and the expected rates of return (net of administration expenses) were:
Analysis of pension costs charged to operating profit
Notes to the accounts (continued)
The consideration received in respect of the The trustee of the QUEST, Signet Group QUEST Limited (a subsidiary of the Company), held
In the year ended 29 January On various dates during the year ended The trustee of the ESOTs, Mourant & Co. Trustees Limited, did not hold any shares at 31 January 2004. In the year ended 29 January 2005 the trustee subscribed in cash for a total of eight million shares at an average price of 118p per share. These shares were all purchased in the market in order to provide shares to satisfy the exercise of executive share options granted to UK employees. In the year ended 29 January 2005 the trustee transferred 3,389,161 shares to holders of such options. At 29 January 2005 the trustee held 4,610,839 shares and 4,443,869 at 6 April 2005.
The revaluation reserve represents the unrealised surplus arising from revaluing freehold and long leasehold properties. Exchange gains of £0.3 million (2004: £1.6 million Following the 1997 capital reduction, the holding company, Signet Group plc, is permitted to make distributions (including dividends, share buy-backs and other transactions classed as distributions) out of profits earned after 2 August 1997, the end of its 1997/98 half year. The undertakings given to the High Court at the time of the capital reduction included the requirement that the Company transfer to a new special reserve any dividend paid by a subsidiary from profits earned prior to that date. The new special reserve is, for as long as the Company is a public company, treated as a non-distributable reserve for the purposes of section 264 of the Companies Act 1985. In accordance with undertakings given by the Company to the High Court in connection with previous reductions of the share premium account, an earlier special reserve is available to write-off existing goodwill resulting from acquisitions and otherwise only for purposes permitted in the case of the share premium account. Under English law, dividends can only be paid out of profits available for distribution (generally defined as accumulated realised profits less accumulated realised losses less net unrealised losses) and not out of share capital or share premium (generally equivalent in US terms to paid-in surplus). At Exchange differences arising on the retranslation of purchased goodwill have been written off against the profit and loss account reserve. This amount has been transferred to the special reserve where the initial purchased goodwill had previously been eliminated. Cumulative goodwill write-offs at underlying foreign currency amounts included in the special reserve amount to The Group’s total recognised gains and losses differ from the net profit for the period (as set out in the Group profit and loss account) in respect of foreign currency translation adjustments amounting to an aggregate loss of
Notes to the accounts (continued) The cumulative exchange gains and losses on the translation of foreign currency financial statements into pounds sterling are set out in the table below:
The cumulative adjustments to property valuations are
The minimum payments in respect of operating leases for the 52 weeks to
The future minimum payments for operating leases having initial or non-cancellable terms in excess of one year are as follows:
Capital commitments at
24. Contingent liabilities The Group has assigned or sub-let UK property leases in the normal course of business. Should the assignees or sub-tenants fail to fulfil any obligations in respect of these leases, the Group may be liable for those defaults. The number of such claims arising to date has been small, and the liability, which is charged to the profit and loss account as it arises, has not been material. The Group’s US operation gives its customers the option of purchasing a lifetime service plan on most of the products sold. Such service plans cover the costs of repair, subject to certain terms and conditions. 25.Notes to the consolidated cash flow statement
(b) Analysis of net debt
Notes to the accounts (continued) 26. Financial instruments The weighted average interest rate of the fixed rate financial liabilities is 5.5%. The weighted average period for which interest rates on the fixed rate financial liabilities are fixed is 1.7 months. There are no interest-free financial liabilities.
The Group also enters into the forward purchase of foreign currencies, principally the US dollar and the Euro, in order to limit the impact of movements in foreign exchange rates on its forecast foreign currency purchases. It is the policy of the Group to ensure that identified foreign currency exposures are hedged to at least the following levels: 100% – for exposures of less than three months; The Group also enters into forward purchase contracts for commodities in order to ensure that values of assets and revenue protection should not be unnecessarily exposed to significant movements in the price of underlying precious metal raw material. The overall amount and duration of such forward commodity contracts are dependent on the underlying buying needs of the operating companies and prevailing commodity prices. Fair value of financial instruments Forward purchases of foreign currencies and commodities Cash at bank and in hand, and trade accounts payable Accounts receivable
Debt Currency profile
Interest rate protection agreements 27. Share options
Notes to the accounts (continued)
The Company’s share option schemes comprise four executive share option schemes (the “1993 Scheme”, the “2003 Approved Plan”, the Options granted under the Executive Schemes are generally only exercisable between three and ten years from the date of grant. Performance conditions are attached to all the executive options granted under the Executive Schemes. No further options may be granted under the 1993 Scheme. Options granted under the Sharesave Scheme and the Irish Sharesave Scheme are generally only exercisable between 36 and 42 months of the commencement of the relevant savings contract. Options granted under the Employee Stock Savings Plan are generally only exercisable between 24 and 27 months of the grant date. The Executive Schemes and Sharesave Schemes may be operated in conjunction with one or more employee share ownership trusts (the Executive directors and some senior executives have also been granted awards under the Signet Group plc 2000 Long Term Incentive Plan (“ Certain provisions of all the share option schemes may be amended by the Board, but certain basic provisions (and in particular most of the limitations on individual participation, the numbers of shares and the percentage of share capital that may be issued thereunder) cannot be altered to the advantage of the participants except with the approval of the shareholders of the Company or in accordance with the adjustment provisions in the schemes. The following table summarises the status of rights granted under the Company’s share option schemes at 29 January 2005, 31 January 2004 and 1 February 2003,
Share
In any ten year period not more than 10% of the issued share capital of the Company from time to time may in aggregate be issued or issuable pursuant to options granted under the Sharesave Schemes or any other employees’ share schemes adopted by the Company. 2000 LTIP limits Outstanding options
Performance criteria (i) Executive share option schemes Performance will be measured over three years from the start of the financial year in which the award is made, and may then be measured from the same start point to the end of the fourth and fifth years if not previously satisfied.
Notes to the accounts (continued) – US executives
in each case over a fixed period of three successive financial years starting with the one in which the award was made. Nothing is payable under the award unless both minimum performance conditions are achieved. The minimum Profit Growth is set at threshold level after taking account of inflation. The conditions were selected to ensure that awards would only vest provided that growth in profits exceeded the rate of inflation and that the business’s targeted ROCE is achieved. Fixed share option schemes A summary of the status of the Company’s fixed share option schemes at 29 January 2005, 31 January 2004 and 1 February 2003
The following table summarises the information about fixed stock options outstanding at
Performance-based share option schemes A summary of the status of the Company’s
The following table summarises the information about performance-based share options outstanding at
Notes to the accounts (continued)
Audit and non-audit fees are
Notes to the accounts (continued)
Details of loan notes are shown in note 16 on page
31. Summary of differences between UK and US generally
Cost of sales Goodwill Under US GAAP, prior to the issue of Statement of Financial Accounting Standards (“FAS”) 142, such goodwill was capitalised and amortised through the consolidated profit and loss account over its estimated useful life (not to exceed 40 years). FAS 142, effective for the Group from 3 February 2002, requires that goodwill be tested annually for impairment in lieu of amortisation. Additionally, UK GAAP requires that on subsequent disposal or closure of a previously acquired subsidiary, any goodwill previously taken directly to shareholders’ funds is then charged to the profit and loss account as part of profit or loss on disposal or closure. Under US GAAP the appropriate balance to be written off on the disposal of the business is the remaining unamortised balance for goodwill.
In the years ended 29 January 2005, 31 January 2004 and 1 February 2003, At Sale and leaseback transactions
Notes to the accounts (continued) Extended service agreements Following the adoption of the above, under UK GAAP revenue from the sale of extended service agreements in the US is now deferred and recognised, net of incremental costs arising from the initial sale, in proportion to anticipated claims arising. This period is based on the historical claims experience of the US business, which has been consistent since these products were launched. The Group reviews the pattern of claims at the end of each year to determine any significant trends that may require changes to revenue recognition rates. Under US GAAP, the Group historically recognised revenue immediately on a proportion of contracts where analysis of past experience showed that no claim or cost arose, and deferred the balance of revenue over the estimated period of future claims. The Group’s US GAAP policy has now been corrected so that the policies applied under UK and US GAAP are now consistent, with no future GAAP differences expected to arise. Pensions Movements in Under US GAAP, the pension cost for the period is determined based on an actuarial valuation at the start of the financial period. The current service cost, the interest cost and the expected return on assets (based on a smoothed market value of assets) are all included within operating profit. The cumulative amounts arising from changes in actuarial assumptions and those arising between the actual and expected return on An unrecognised prior service cost arises from the 15% and 5% benefit increases granted in November 1996 and November 1999 respectively. The cost is being amortised on a straight line basis over the average remaining employee service life which was 10.76 years at 29 January 2005. Additional disclosures are now required under FAS 132 and are included on pages Under US GAAP, the estimated accumulated benefit obligation of the As set out in note 20 on page 87, the Group has established, in the US, an unfunded, unqualified deferred compensation plan. Under US GAAP the plan is accounted for as a defined contribution plan in accordance with SFAS 87, ‘Employers’ Accounting for Pensions’. The accounting for the deferred compensation plan is consistent under both UK and US GAAP. Recognition of lease expense
Under UK GAAP predetermined rent increases are recognised when they fall due, reflecting that these are generally intended to compensate for the expected cost of inflation and are equivalent to UK periodic rent reviews. Stock compensation Under US GAAP, The Group’s share option plans are described in note 27 on page Revaluation of properties Depreciation of properties Securitised customer receivables Under US GAAP these amounts As defined in the Transfer and Servicing Agreement, the Group may, through the exercise by the Transferor of a Return on Accounts Provision, remove random accounts from the trust on a restricted basis. This ability is limited to one removal per month and the amount of accounts that can be removed is restricted to the principal amount of the total Transferor’s Interest that is in excess of the Required Transferor Interest. The Group receives servicing fees of £2.9 million (2004: £3.1 million; 2003 £3.4 million) which offset its costs of fulfilling its servicing responsibilities to the trust. The main commercial terms of the securitisation are disclosed in summary within the Financial Review and in note 16 on page 85.
Dividends Earnings per share (“EPS”)/ADS Effect on profit for the financial period of differences between UK and US GAAP
Effect on shareholders’ funds of differences between UK and US GAAP
Prior year restatements
Notes to the accounts (continued) Impact on profit attributable to shareholders
Impact on earnings per ADS – basic
Impact on earnings per ADS – diluted
Impact on shareholders’ funds
Revenue recognition
Impact on profit and loss account US GAAP differences
The policies applied under UK and US GAAP are now consistent and no future GAAP differences are expected to arise. There is no impact on cash flow. Lease accounting Impact on profit and loss account US GAAP differences
The Group did not amend its previously filed Annual Report on Form 20-F or its Form 6-K containing interim financial information, and the financial statements and related financial information contained in those reports should no longer be relied upon. Cash flows liquid resources; and (f) financing activities. FAS 95 requires only three categories of cash flow activity (a) operating; (b) investing; and (c) financing. Cash flows arising from taxation and returns on investments and servicing of finance under FRS 1 (Revised) would be included as operating activities and cash flows arising from management of liquid resources would be included as cash and cash equivalents under FAS 95. In addition, under FRS 1 (Revised) cash includes only cash in hand plus deposits repayable on demand, less overdrafts repayable on demand. Under FAS 95 cash and cash equivalents include all highly liquid short term investments with original maturities of three months or less.
Employee share schemes For the year ended
These pro forma amounts may not be representative of future results as they are subjective in nature and involve uncertainties and matters of judgement, and therefore cannot be determined precisely. Changes in assumptions could affect the estimates.
The fair value of options granted which, in determining the pro forma impact, is assumed to be amortised in the profit and loss account over the option vesting period, is estimated on the date of grant using the Black-Scholes option-pricing model using the following weighted average assumptions for the financial periods ended 29 January 2005, 31 January 2004 and 1 February
Post employment benefits
Notes to the accounts (continued)
The accumulated benefit obligation of the Group Scheme at The components of pension expense which arise under FAS 87 for the Group’s pension plans are estimated to be as follows:
The composition of the assets in the Group Scheme was as follows:
The Trustees’ investment strategy is set out in their Statement of Investment Principles. To guide them in their management of the assets and control of the risks to which the Group Scheme is exposed, the Trustees have adopted the following objectives:
To develop the long term rate of return on assets assumption, the Trustees considered the historical returns and the future expected returns for each asset class, as well as the target asset allocation of the pension portfolio. This resulted in the selection of the 6.9% per annum long term rate of return on assets assumption from 2 February 2003, and 7.0% per annum from 1 February 2004. The Group expects to make contributions of
See note New US accounting standards not yet adopted FAS
Notes to the accounts (continued) FAS 153 ‘Exchanges of Non-monetary Assets – an amendment of APB Opinion No. 29’. This statement eliminates the exception for non-monetary exchanges of similar productive assets and replaces it with a general exception for exchanges of non-monetary assets that do not have commercial substance. This statement is effective for fiscal years beginning after 15 June 2005. The Group believes that the adoption of FAS 153 will not have a significant effect on its consolidated accounts. FAS 123 (revised 2004), ‘Share-Based Payment’ requires that the compensation cost relating to share-based payment transactions be recognised in financial statements. That cost will be measured based on the fair value of the equity or liability instruments issued. The impact on the Group’s US GAAP financial statements is not expected to be material, but the adoption of IFRS reporting in the UK is expected to reduce the stock compensation adjustment from the UK/US GAAP reconciliation. This statement is effective for fiscal years beginning after 15 June 2005.
Social, ethical and environmental matters Introduction Governance of SEE matters A SEE Committee, chaired by the Group Company Secretary, Matters for which the SEE Committee has responsibility include:
The procedures for SEE risk management are embedded within the management structure of the Group. SEE risks are discussed on pages Signet has important relationships with a wide range of different stakeholders, including shareholders, customers, employees, suppliers and service facilities, employee attitude surveys, supplier relationship management systems, Principles and policies framework
The Group Signet’s principles and policies are intended to provide a framework with which the divisional policies and procedures conform. They do not replace
Social, ethical and environmental matters (continued)
Developments in 2004/05
The Group has continued to work closely with Jewelers of America to establish industry working groups, where the Group believes it can be most effective considering environmental and supply chain issues and with other industry constituents to promote responsible business practices in order to maintain customer confidence and the integrity of the product. Our stakeholders Shareholders Customers The Group’s policy is that all customers should be treated with respect and warmth. Sales training programmes include modules on treating all customers with Employees Signet considers its relationship with its employees to be excellent and values honest, open and constructive incentive payment schemes and savings-related share option schemes which cover all Group employees subject to minimum employment requirements. The Group does not restrict or discriminate against employees who wish to be covered by collective bargaining agreements. The Group’s policy is not to tolerate any form of unlawful discrimination on any grounds or at any level. In respect of people with disabilities, full and fair consideration is given to employment, opportunities for training, career development and promotion according to their skills and capacity. The services of any existing employees who become disabled are, where possible, retained and appropriate training is arranged for them wherever possible. The Group assigns responsibility for human resource matters, including health and safety, to the divisional executive management committees. Both the UK and US operations have established systems which include the provision of training and development opportunities at all levels of the organisation. See pages Suppliers
regularly discusses its implementation with them. Those suppliers and agents are encouraged to ensure that this Supplier Code is communicated throughout the supply chain. Most of the raw and processed materials for the merchandise sold by Signet are traded on commodity exchanges or through multiple brokers and traders making the original source difficult to trace. Signet believes that SEE risks at the mining, trading and secondary processing phases of the supply chain are more effectively managed through Signet is also working, where appropriate, with other trade bodies such as the Jewelers Vigilance Committee to be better able to respond to SEE issues at an industry level. One of the specific issues facing the Group and the diamond sector is conflict diamonds, which are diamonds Following the adoption of the KPCS process, Signet Since the formal adoption of the KPCS in November 2002,
In 2004 over 40 countries (including the European Union as a single entity) were participants in the KPCS and participants accounted for over 99% of world diamond production. While the overwhelming trade in rough diamonds was between participants in the KPCS, it is difficult to assess the precise level of participation. However anecdotal evidence suggests that the unscrupulous diamond dealers are finding it increasingly difficult to sell non-certified stones. The first voluntary peer review visit took place in March 2004 annual reports having been received from all participants and by the end of 2004 review visits were made covering nearly two thirds of global rough diamond production, more than 80% of global exports and more than 90% of global imports. The Republic of Congo (Congo-Brazzaville) was suspended from membership in 2004 following the visit by a special review mission, and the Kimberley Process Participation Committee addressed issues relating to three other countries. A comprehensive statistical database is now available and general baselines for the identification of anomalies have been established. While the quality of data has substantially improved, further progress needs to be made and steps to do so are being implemented.
Social, ethical and environmental matters (continued) While Signet is the world’s largest speciality jeweller, its share of the worldwide jewellery and watch market amounts only to about 2% of the total. Therefore it is the Group’s belief that it can be most effective in influencing improvements to the supply chain by working together with other industry representatives, who together can by concentration into a single industry voice be representative of many aspects of the supply chain, and use their combined influence in working to improve it as a whole. During the year the Group worked actively with other companies representative of the industry and was one of the signatories to a Statement of Intent that formed the basis of an agreement for further co-operation to promote increased consumer confidence and integrity in the product by promoting responsible business practices throughout the industry. In respect of supplier payment, Group policy is that the operating businesses are responsible for agreeing the terms and conditions under which business transactions with their suppliers are conducted, rather than following any particular code or standard on payment practice (see note 30(e) on page Environment
During 2003/04 Signet
For 2005/06 the Board has endorsed environmental performance targets for the UK and US divisions and approved the following environmental
Further, Signet will continue to work with Jewelers of America who are currently exploring ways in which the jewellery industry can use its influence to improve environmental performance related to mining of minerals, in particular of gold. The Group will also continue with the work commenced in 2004/05 to enhance consumer confidence and credibility of the product working together with industry constituents, through the initiatives described above. Community
The Group is committed to the support of charitable organisations. Signet believes it is best to give support to a small number of specific charities rather than fragment its charitable giving. In the US support is primarily given to The United Way, St. Jude Children’s Research Hospital and The Jeweler’s Charity Fund. In the UK the Group primarily supports the Princess Royal Trust for Carers. During the period the Group made provision for total charitable givings of US administrative and distribution centre in Northeast Ohio, such as United Disabilities Services, Mature Services and the Urban League. No political donations were made in the US or the UK by the Group in the period Human rights
Shareholder information History on 10 September 1993 to Signet Group the
Nature of trading market The table below sets out, for the calendar years and quarters indicated, (i) the reported high and low middle market quotations for the shares of the Company based on the Daily Official List of the London Stock Exchange and (ii) the reported high and low closing sales prices of the ADSs on the Nasdaq Datastream. At
Shareholder information (continued) Dividends In order to make further distributions in excess of this figure, the holding company would first need to receive dividends from its subsidiaries. In addition to restrictions imposed at the time of the 1997 capital reduction on the distribution of dividends received from subsidiaries, the payments of dividends from other tax jurisdictions, such as the US, may not be tax efficient. Furthermore, there may be other reasons why dividends may not be paid by subsidiaries to the holding company. If declared by the Board (and, in the case of a final dividend, if approved by shareholders in general meeting) dividends are paid to holders of shares as at record dates that are decided by the Board. Substantial shareholdings and control of the Company As at The Company’s major shareholders as listed in the table on page The following shareholders had significant changes in their percentage ownership of the Company’s issued share capital since
At The Company does not know of any arrangements, the operation of which, might result in a change of control of the Company.
Exchange controls and other limitations affecting Subject to those exceptions, under English law and the Company’s Memorandum and Articles of Association, persons who are neither residents nor nationals of the UK may freely hold, vote and transfer shares (or other securities) in the same manner as UK residents or nationals. The Articles of Association provide that a shareholder with a registered address outside the UK is not entitled to receive notice of any general meeting of the Company unless the shareholder has provided the Company with a UK address, or (in the case of any notice issued electronically) an appropriate electronic address, at which notices may be delivered. Taxation As used herein, a US holder means a beneficial owner of the Company’s shares or ADSs that is: a citizen or resident of the US; a corporation (or other entity taxable as a corporation for US federal income tax purposes) created or organised in or under the laws of the US, or any state thereof; an estate whose income is includible in gross income for US federal income tax purposes regardless of its source; or a trust, if a court within the US is able to exercise primary supervision over the administration of the trust and one or more US persons have the authority to control all substantial decisions of the trust. This summary deals only with shares and ADSs held as capital assets and does not address any special tax consequences that may be applicable to US holders who are subject to special treatment under Prospective investors are advised to consult their tax advisers with respect to the tax consequences of the purchase, ownership and disposition of shares or ADSs, including specifically the consequences under state and local tax laws. The statements regarding US and UK tax laws set out below are based on US federal and UK tax laws and UK Inland Revenue practice in force on the date of this Annual Report and are subject to change after that date. This summary does not address the tax consequences to partnerships, other pass-through entities or persons who hold shares or ADSs through a partnership or other pass-through entity. US holders of ADSs will be treated as the owners of the underlying shares for purposes of the double taxation conventions relating to income and estate and gift taxes between the US and the UK and for the purposes of the US Internal Revenue Code of 1986, as amended.
Shareholder information (continued) In addition, the following summary assumes that US holders are residents of the US for purposes of the Taxation of dividends
Any dividend paid by the Company will generally be included in the gross income of a US holder as dividend income for US federal income tax purposes to the extent made from the Company’s current or accumulated earnings and profits, as determined under US federal income tax principles. Distributions in excess of such current and accumulated earnings and profits will be applied against and will reduce the US holder’s tax basis in the shares or ADSs and to the extent in excess of such tax basis will be treated as a gain from the sale or exchange of the shares or ADSs. The amount of any dividend paid in pounds sterling will equal the US dollar value of the pounds sterling received calculated by reference to the exchange rate in effect on the day that the dividend is received by the US holder, in the case of shares, or by the Depositary (or its Custodian), in the case of ADSs, regardless of whether the dividend payment is converted into US dollars. Foreign currency exchange gain or loss, if any, realised on a subsequent sale or other disposition of pounds generally will be treated as US source ordinary income or loss to the US holder. Dividends received on the shares or ADSs generally will be foreign source passive income for US foreign tax credit purposes and generally will not be eligible for the dividends received deduction allowed to US corporations under Section 243 of the US Internal Revenue Code.
Convention is satisfactory for this purpose. Dividends will not however qualify for the reduced rate if such corporation is treated for the tax year in which dividends are paid (or in the prior year) as a “foreign investment company”, a “foreign personal holding company”, or a “passive foreign investment company” for US federal income tax purposes. Based on the nature of the Company’s operations and/or its ownership, the Company does not believe that it would be treated as a foreign investment company or a foreign personal holding company. In addition, the Company does not believe it is a passive foreign investment company. Accordingly, dividend distributions with respect to the Company’s shares or ADSs should be treated as qualified dividend income and, subject to the US holder’s satisfaction of the requirements described below, should be eligible for the reduced 15% US federal income tax rate. A US holder will not be entitled to the reduced rate: (a) if the US holder has not held the shares or ADSs for at least 61 days of the The UK does not currently apply a withholding tax on dividends under its internal laws. If the UK were to impose a withholding tax, as permitted under the A US holder will be denied a foreign tax credit (and instead allowed a deduction) for foreign taxes imposed on a dividend if the US holder has not held the shares or ADSs for at least 16 days in the
Taxation of capital gains If the shares or ADSs are publicly traded, a disposition of such shares or ADSs will be considered to occur on the “trade date”, regardless of the US holder’s method of accounting. A US holder that uses the cash method of accounting calculates the US dollar value of the proceeds received on the sale on the date that the sale settles. However, a US holder that uses the accrual method of accounting is required to calculate the value of the proceeds of the sale on the “trade date” and, therefore, may realise a foreign currency gain or loss, unless such US holder has elected to use the settlement date to determine its proceeds of sale for purposes of calculating such foreign currency gain or loss. In addition, a US holder that receives foreign currency upon the sale or exchange of the shares or ADSs and converts the foreign currency into US dollars subsequent to receipt will have a foreign exchange gain or loss based on any appreciation or depreciation in the value of the foreign currency against the US dollar. A foreign exchange gain or loss will generally be US source ordinary income or loss. Generally a US holder who is neither resident nor ordinarily resident for tax purposes in the UK will not be liable for UK tax on capital gains realised on the sale or other disposal of shares or ADSs unless, in the year of assessment in which the gain accrues to such holder, that US holder has a permanent establishment in the UK and the shares or ADSs are or have been used by, held by, or acquired for use by, or for the purpose of, such permanent establishment. However, a US holder who has been resident in the UK for at least four years and held shares or ADSs at that time may, in certain circumstances, become liable to UK capital gains tax on his return to the UK following a disposal of such shares or ADSs. Any US holders whose circumstances are such that they may fall within such provisions are advised to consult their tax adviser.
Under the
US information reporting and US backup withholding tax US holders can avoid the imposition of backup withholding tax by reporting their taxpayer identification number to their broker or paying agent on US Internal Revenue Service Form W-9. Non-US holders can avoid the imposition of backup withholding tax by providing a duly completed US Internal Revenue Service Form W-8BEN, W-8ECI or W-8IMY, as appropriate, to their broker or paying agent. Any amounts withheld under the backup withholding rules from a payment to a holder will be Inheritance tax The convention generally provides a credit for the amount of any tax paid in the UK against the US federal tax liability in a case where the shares or ADSs are subject both to UK inheritance tax and to US federal gift or estate tax. However, the terms of the US/UK estate and gift tax convention are currently being
Shareholder information (continued) reviewed and possibly renegotiated. Further advice should be sought by any holder who is likely to need to rely upon the provisions of the convention. UK stamp duty and stamp duty reserve tax
No UK stamp duty will be payable on transfer of an ADS, provided that the ADS (and any separate instrument of transfer) is executed and retained at all times outside the UK. A transfer of an ADS in the US will not give rise to UK stamp duty provided the instrument of transfer is not brought into the UK. A transfer of an ADS in the UK may attract stamp duty at a rate of 0.5% of the consideration. Any transfer (which will include a transfer from the Depositary to an ADS holder) of the shares, including shares underlying an ADS, may result in a stamp duty liability at the rate of 0.5% of the consideration. There is no charge to ad valorem stamp duty on gifts. On a transfer of shares from a nominee to the beneficial owner (the nominee having at all times held the shares on behalf of the transferee) under which no beneficial interest passes and which is neither on sale, nor arises under or following a contract of sale, nor is in contemplation of sale, a fixed stamp duty of £5 will be payable. Stamp duty reserve tax generally at a rate of 0.5% of the consideration is currently payable on any agreement to transfer shares or any interest therein unless: (i) an instrument transferring the shares is executed; (ii) stamp duty, generally at a rate of 0.5%, is paid; and (iii) generally the instrument is stamped on or before the accountable date for stamp duty reserve tax. The duty will, however, be refundable if within six years the agreement is completed by an instrument which has been duly stamped, generally at the rate of 0.5%. Stamp duty reserve tax will not be payable on any agreement to transfer ADSs which represent interests in depositary receipts.
Selected financial data
Explanatory notes referred to in the above table are on page
Selected financial data (continued) The selected consolidated financial data set out on the preceding page for The accounts of the Group have been prepared in accordance with UK GAAP which differ in certain respects from US GAAP. See pages Results of operations
Quarterly results (unaudited) For the 52 week period ended
Definitions
Glossary of terms
Terms used in Annual Report & Accounts Accounts Allotted Called up share capital Capital allowances Cash at bank Creditors Debtors Finance lease Freehold Interest receivable Interest payable Like for like sales Loans Net asset value Profit Profit and loss account Profit and loss account reserve Profit attributable to shareholders Share capital Share option Shareholders’ funds Share premium account Shares in issue Stocks Tangible fixed assets Value Added Tax (VAT) US equivalent or brief description Financial statements Issued Shares, issued and fully paid Tax term equivalent to US tax depreciation allowances Cash Payables Receivables Capital lease Ownership with absolute rights in perpetuity Interest income Interest expense Same store sales at constant exchange rates Long-term debt Book value Income Income statements Retained earnings Net income Capital stock or common stock Stock option Shareholders’ equity/net assets Additional paid-up capital or paid-in surplus (not distributable) Shares outstanding Inventories Property and equipment UK sales tax
Shareholder contacts
UK shareholders Capita Registrars
ADS information Deutsche Bank Trust Company Americas The Company is subject to the regulations of the SEC as they apply to foreign private issuers and files with the SEC its Annual Report on Form 20-F and other information as required. Registered office Investor Relations Group Company Secretary Corporate web site Unsolicited mail Mailing Preference Service Documents on display
Printed on Revive Special Silk,
Index
Signatures The registrant hereby certifies that it meets all of the requirements for filing on Form 20-F and that it has duly caused and
Date: May 3, 2005 Exhibits *Incorporated by reference.
*Incorporated by reference. | |||||||||||||||||||||||||||||||||||||||||||||||||||||||||||||||||||||||||||||||||||||||||||||||||||||||||||||||||||||||||||||||||||||||||||||||||||||||||||||||||||||||||||||||||||||||||||||||||||||||||||||||||||||||||||||||||||||||||||||||||||||||||||||||||||||||||||||||||||||||||||||||||||||||||||||||||||||||||||||||||||||||||||||||||||||||||||||||||||||||||||||||||||||||||||||||||||||||||||||||||||||||||||||||||||||||||||||||||||||||||||||||||||||||||||||||||||||||||||||||||||||||||||||||||||||||||||||||||||||||||||||||||||||||||||||||||||||||||||||||||||||||||||||||||||||||||||||||||||||||||||||||||||||||||||||||||||||||||||||||||||||||||||||||||||||||||||||||||||||||||||||||||||||||||||||||||||||||||||||||||||||||||||||||||||||||||||||||||||||||||||||||||||||||||||||||||||||||||||||||||||||||||||||||||||||||||||||||||||||||||||||||||||||||||||||||||||||||||||||||||||||||||||||||||||||||||||||||||||||||||||||||||||||||||||||||||||||||||||||||||||||||||||||||||||||||||||||||||||||||
Cross reference to Form 20-F
The information in this document that is referenced in the following table shall be deemed to be part of the Annual Report on Form 20-F for the financial year ended 3129 January 20042005 and to be filed with the Securities and Exchange Commission.
| Item | Page | Item | Page | |||
| 1 | Identity of directors, | Description of property | 23 | |||
management and | Financial review | 24 | ||||
Advisors | Risk and other factors - | |||||
| Not applicable | - | Raw Materials | 37 | |||
| Risk and other factors - | ||||||
| 2 | Offer statistics and | Seasonality | 37 | |||
| expected timetable | Shareholder information | 120 | ||||
| Not applicable | - | Note to the accounts – Note 2 | ||||
| (Segment information) | 76 | |||||
| 3A | Key information - | Note to the accounts – Note 28 | ||||
| Selected financial data | (Principal subsidiary undertakings) | 100 | ||||
| Five year financial summary | 6 | |||||
| Risk and other factors | 5 | Operating and financial review | ||||
| - Financial market risks | 39 | and prospects | ||||
| Risk and other Factors - | US Operating review | 7 | ||||
| Exchange Rates | 40 | UK Operating review | 17 | |||
| Selected financial data | 127 | Financial review | 24 | |||
| Risk and other factors - | ||||||
| 3B | Key information - | Financial market risks | 39 | |||
| Capitalisation and | Note to the accounts – Note 26 | |||||
| Indebtedness | (Financial instruments) | 94 | ||||
| Not applicable | - | |||||
| 6 | Directors, senior management | |||||
| 3C | Key information - | and employees | ||||
| Reasons for the offer | Group employees | 23 | ||||
| and use of proceeds | Social, ethical and | |||||
| Not applicable | - | environmental matters - | ||||
| Employees | 116 | |||||
| 3D | Key information - | Directors, officers and advisers | 41 | |||
| Risk factors | Directors’ remuneration report | 51 | ||||
| Risk and other factors | 35 | Corporate governance statement | 45 | |||
| 4 | Information on the Company | 7A | Major shareholders | |||
| Chairman’s statement | 2 | Shareholder information - | ||||
| Group Chief Executive’s | Nature of trading market | 121 | ||||
| Review | 3 | Shareholder information - | ||||
| US Operating review | 7 | Substantial shareholdings and | ||||
| UK Operating review | 17 | control of the Company | 122 |
| Item | Page | Item | Page | |||
| 7B | Related party | 9F | Expenses of the Issuer | |||
| Transactions | Not applicable | - | ||||
| Note to the accounts - | ||||||
| Note 29 (Related party | 10A | Additional information – | ||||
| transactions) | 100 | Share capital | ||||
| Not applicable | - | |||||
| 7C | Interest of experts and | |||||
| Counsel | 10B | Additional information - | ||||
| Not applicable | - | Memorandum and Articles | ||||
| of Association | ||||||
| 8 | Financial information | Shareholder information | 120 | |||
| Consolidated balance sheet | 67 | |||||
| Consolidated cash flow | 10C | Additional information - | ||||
| statement | 69 | Material contracts | ||||
| Consolidated statement | Financial review – Liquidity | |||||
| of total recognised gains | and Capital resources | 26 | ||||
| and losses | 70 | |||||
| Note of consolidated | 10D | Additional information - | ||||
| historical cost profits | Exchange controls | |||||
| and losses | 70 | Shareholder information - | ||||
| Note to the accounts - | Dividends | 122 | ||||
| Note 24 (Contingent – | ||||||
| liabilities) | 93 | 10E | Additional information - | |||
| Note to the accounts - | Taxation | |||||
| Note 25 (Notes to the | Shareholder information - | |||||
| consolidated cash flow | Taxation | 123 | ||||
| statement) | 93 | |||||
| 10F | Additional information - | |||||
| 9A | Offer and listing details | |||||
| Shareholder information | Dividends and paying agents | |||||
| - Nature of trading market | 121 | Not applicable | - | |||
| 9B | Plan of distribution | 10G | Additional information - | |||
| Not applicable | - | Statement by experts | ||||
| Not applicable | - | |||||
| 9C | Markets | |||||
| Shareholder information | 10H | Additional information - | ||||
| - Nature of trading market | 121 | Documents on display | ||||
| Shareholder contacts - | ||||||
| 9D | Selling shareholders | Documents on display | 132 | |||
| Not applicable | - | |||||
| 10I | Additional information - | |||||
| 9E | Dilution | Subsidiary information | ||||
| Not applicable | - | Not applicable | - |
Cross reference to Form 20-F (continued)
| Item | Page | ||
| 12 | Description of securities other than | ||
| equity securities | |||
| Not applicable | – | ||
| 13 | Defaults, dividend arrears and delinquencies | ||
| None | – | ||
| 14 | Material modifications to the rights of | ||
| securities holders and use of proceeds | |||
| None | – | ||
| 15 | Controls and procedures | ||
| Corporate governance statement – Internal control | 40 | ||
| 16A | Audit Committee Financial Expert | ||
| Corporate governance statement | |||
| – The Audit Committee | 38 | ||
| 16B | Code of ethics | ||
| Corporate governance statement – Code of | |||
| Conduct and Code of Ethics | 39 | ||
| 17 | Financial Statements | ||
| Independent auditor’s report | 55 | ||
| Consolidated profit and loss account | 56 | ||
| Consolidated balance sheet | 57 | ||
| Company balance sheet | 58 | ||
| Consolidated cash flow statement | 59 | ||
| Consolidated statement of total recognised | |||
| gains and losses | 60 | ||
| Consolidated shareholders’ funds | 61 | ||
| 18 | Financial Statements | ||
| Not applicable | – | ||
| 19 | Exhibits | 123 |
www.signetgroupplc.com
| Item | Page | Item | Page | |||
| 11 | Quantitative and | 16C | Principal Accountant | |||
| qualitative disclosures | Fees and Services | |||||
| about market risk | Note to the accounts - | |||||
| Financial review | 24 | Note 4 (Profit on ordinary | ||||
| Note to the accounts - | activities before transaction-Fees | |||||
| Note 26 (Financial | payable to KPMG Audit plc and | |||||
| instruments) | 94 | their associates) | 77 | |||
| 12 | Description of securities | 16D | Exemptions from the Listing | |||
| other than equity | Standards for Audit | |||||
| securities | Committees | - | ||||
| Note applicable | - | Not Applicable | ||||
| 13 | Defaults, dividend | 16E | Purchase of Equity Securities | |||
| arrears and | by the Issuer and Affiliated | |||||
| delinquencies | Purchasers | |||||
| None | - | Not applicable | - | |||
| 14 | Material modifications | 17 | Financial Statements | |||
| to the rights of | Report of Independent Registered | |||||
| securities holders and | Public Accounting Firm | 65 | ||||
| use of proceeds | Consolidated profit and loss | |||||
| None | - | account | 66 | |||
| Consolidated balance sheet | 67 | |||||
| 15 | Controls and procedures | Company balance sheet | 68 | |||
| Corporate governance | Consolidated cash flow | |||||
| statement – Internal | statement | 69 | ||||
| control | 48 | Consolidated statement of total | ||||
| recognised gains and losses | 70 | |||||
| 16A | Audit Committee | Consolidated shareholders’ | ||||
| Financial Expert | funds | 71 | ||||
| Corporate governance | Note to the accounts – | |||||
| statement – The Audit | Note 31 (Summary of | |||||
| Committee | 46 | differences between UK and US | ||||
| generally accepted accounting | ||||||
| 16B | Code of ethics | principles) | 103 | |||
| Corporate governance | ||||||
| statement – Code of | 18 | Financial Statements | ||||
| Conduct and Code of | Not applicable | - | ||||
| Ethics | 47 | |||||
| 19 | Exhibits | 134 | ||||
Exhibits
| Description of Exhibit | ||||
| 1.1* | Articles of Association of Signet Group plc, adopted by Special Resolution passed on June 13, | |||
| 4.1* | $410 million Multicurrency Revolving Facilities Agreement, dated as of August 30, | |||
| 4.2* | $60 million Senior Unsecured Loan Notes Agency Agreement, dated as of July 27, | |||
| 4.3* | Deed of Guarantee, dated as of August 12, | |||
| 4.4* | Letter of NIB Capital Bank to Signet Group plc, dated as of November 24, | |||
| Transfer and Servicing Agreement, dated as of November 2, 2001, between Sterling Receivables Corp., Sterling Jewelers Inc., and Sterling Jewelers Receivables Master Note | Trust (incorporated herein by reference to the Company’s Annual Report on Form 20-F, as filed with the Securities and Exchange Commission on April 22, 2004) (File No. 0-16945)). | |||
| 4.6* | Executive Service Agreement, dated as of June 14, |
| Number | Description of Exhibit | |||
| 4.7 * | Amended and Restated Employment Agreement, dated as of December 20, | |||
| Signet Group plc | 2000 Long-Term Incentive Plan (incorporated herein by reference to the Company’s Registration Statement on Form S-8, as filed with the Securities and Exchange Commission on July 17, 2000 (File No. 333-12304)). | |||
| Signet Group plc Employee Stock Savings Plan (incorporated herein by reference to the Company’s Registration Statement on Form S-8, as filed with the Securities and Exchange Commission on November 18, 1998 (File No. 333-9634)). | ||||
| Signet Group plc 1993 Executive Share Option Scheme (incorporated herein by reference to the Company’s Registration Statement on Form S-8, as filed with the Securities and Exchange Commission on June 17, 1998 (File No. 333-8764)). | ||||
| Ratners Group Executive Share Option Scheme for Residents of the United States of America (incorporated herein by reference to the Company’s Registration Statement on Form S-8, as filed with the Securities and Exchange Commission on August 6, 1991 (File No. 033-42119)). | ||||
| 4.12 | $390 million Multicurrency Revolving Facilities Agreement, dated as of September 28, 2004, among Signet Group plc, Barclays Capital, HSBC Bank plc, The Royal Bank of Scotland plc and Wachovia Bank, N.A. | |||
| 4.13 | Employment Agreement between Signet Trading Limited and Robert Anderson dated March 1, 2003 | |||
| 8.1* | List of Significant Subsidiaries of Signet Group plc (incorporated herein by reference to the Company’s Annual Report on Form 20-F, as filed with the Securities and Exchange Commission on April 22, 2004) (File No. 0-16945)). | |||
| 12.1 | Section 302 Certification of Walker Boyd | |||
| 12.2 | Section 302 Certification of Terry Burman | |||
| 13.1 | Certification of Walker Boyd pursuant to 18 U.S.C. Section 1350, as adopted by Section 906 of the Sarbanes-Oxley Act of 2002 | |||
| 13.2 | Certification of Terry Burman pursuant to 18 U.S.C. Section 1350, as adopted by Section 906 of the Sarbanes-Oxley Act of 2002 | |||
| 14.1 | Consent of KPMG Audit plc | |||