As filed with the Securities and Exchange Commission on April 7, 200328, 2004
UNITED STATES
SECURITIES AND EXCHANGE COMMISSION
Washington, D.C. 20549
FORM 20-F
(Mark One)
|
or
For the fiscal year ended December 31, 20022003
or
Commission file number: 1-8382
AKTIEBOLAGET SVENSK EXPORTKREDIT
(SWEDISH EXPORT CREDIT CORPORATION)
(Exact name of Registrant as Specified in Its Charter)
Kingdom of Sweden
(Jurisdiction of incorporation or organization)
Västra Trädgårdsgatan 11 B, Stockholm, Sweden
(Address of principal executive offices)
Securities registered or to be registered pursuant to Section 12(b) of the Act:
None
(Title of Class)
Securities registered or to be registered pursuant to Section 12 (g) of the Act:
None
(Title of Class)
Securities for which there is a reporting obligation pursuant to Section 15(d) of the Act:NoneMedium-Term Notes, Series B
(Title of Class)
Indicate the number of outstanding shares of each of the issuer's classes of capital or common stock as of the close of the period covered by the annual report:
| Class A shares | 640,000 | |
| Class B shares | 350,000 |
Indicate by check mark whether the registrant: (1) has filed all reports required to be filed by Section 13 or 15(d) of the Securities Exchange Act of 1934 during the preceding 12 months (or for such shorter period that the registrant was required to file such reports), and (2) has been subject to such filing requirements for the past 90 days:
Yesý Noo
Indicate by check mark which financial statement item the registrant has elected to follow:
Item 17o Item 18ý
| PART I | 1 | ||||
ITEM 1. | IDENTITY OF DIRECTORS, SENIOR MANAGEMENT AND ADVISORS | 1 | |||
| ITEM 2. | OFFER STATISTICS AND EXPECTED TIMETABLE | 1 | |||
| ITEM 3. | KEY INFORMATION | ||||
| ITEM 4. | INFORMATION ON THE COMPANY | 4 | |||
| ITEM 5. | OPERATING AND FINANCIAL REVIEW AND PROSPECTS | ||||
| ITEM 6. | DIRECTORS, SENIOR MANAGEMENT AND EMPLOYEES | ||||
| ITEM 7. | MAJOR SHAREHOLDERS AND RELATED PARTY TRANSACTIONS | ||||
| ITEM 8. | FINANCIAL INFORMATION | ||||
| ITEM 9. | THE OFFER AND LISTING | ||||
| ITEM 10. | ADDITIONAL INFORMATION | ||||
| ITEM 11. | QUANTITATIVE AND QUALITATIVE | ||||
| ITEM 12. | DESCRIPTION OF SECURITIES OTHER THAN | ||||
PART II | |||||
ITEM 13. | DEFAULTS, DIVIDEND ARREARAGES AND DELINQUENCIES | ||||
| ITEM 14. | MATERIAL MODIFICATIONS TO THE RIGHTS OF SECURITY HOLDERS AND USE OF PROCEEDS | ||||
| ITEM 15. | CONTROLS AND PROCEDURES | ||||
| ITEM | |||||
| ITEM 16B. | CODE OF ETHICS | 46 | |||
| ITEM 16C. | PRINCIPAL ACCOUNTANT FEES AND SERVICES | 46 | |||
PART III | 47 | ||||
ITEM 17. | FINANCIAL STATEMENTS | 47 | |||
| ITEM 18. | FINANCIAL STATEMENTS | 47 | |||
| ITEM 19. | EXHIBITS | 49 | |||
i
In this Report, unless otherwise specified, all amounts are expressed in Swedish kronor ("Skr"). See Item 3, "Key Information", for a description of historical exchange rates and other matters relating to the Swedish kronor. On April 3, 2003,26, 2004, the exchange rate for U.S. dollars into Swedish kronor based on the noon buying rate in New York City for cable transfers in foreign currencies as certified for customs purposes by the Federal Reserve Bank of New York was 8.56507.6960 Skr per U.S. dollar. No representation is made that Swedish kronor amounts have been, could have been or could be converted into U.S. dollars at that rate.
In this Report, unless otherwise indicated, all descriptions and financial information relate to Aktiebolaget Svensk Exportkredit (Swedish Export Credit Corporation) ("SEK" or the "Company") as a whole, and include both the "Market Rate System" (the "M-system") and the "State Support System" (the "S-system"), each of which is described in detail herein. In certain instances, information relating to the S-system on a stand-alone basis is provided separately. References herein to "SEK excluding the S-system" mean the same as references to the "Market Rate System".
SEK is a "public company" according to the Swedish Companies Act. A Swedish company, even if its shares are not listed on an exchange and are not publicly traded, may choose to declare itself a "public company". Only public debt companies are allowed to raise funds from the public through the issuance of debt instruments. In certain cases, a public company is required to add the denotation "publ" to its name.
This Report contains forward-looking statements. In addition, the Company may make forward-looking statements in its periodic reports to the U.S. Securities and Exchange Commission (the "SEC") on Form 6-K, in its annual and interim reports, offering circulars and prospectuses, press releases and other written information. OurThe Board of Directors, officers and employees may also make oral forward-looking statements to third parties, including financial analysts. Forward-looking statements are statements that are not historical facts. Examples of forward-looking statements include:
Forward-looking statements generally are identified by the words "expect", "anticipate", "believe", "intend", "estimate", "should", and similar expressions.
Forward-looking statements are based on current plans, estimates and projections, and therefore you should not place too much reliance on them. Forward-looking statements speak only as of the date they are made, and we undertakethe Company undertakes no obligation to update any forward-looking statement in light of new information or future events, although we intendthe Company intends to continue to meet ourits ongoing disclosure obligations under the U.S. securities laws (such as ourthe obligations to file annual reports on Form 20-F and reports on Form 6-K) and under other applicable laws. Forward-looking statements involve inherent risks and uncertainties, most of which are difficult to predict and generally beyond ourthe Company's control. We caution youYou are cautioned that a number of important factors could cause
ii
actual results or outcomes to differ materially from those expressed in, or implied by, the forward-looking statements. These factors include, among others, the following:
iiiii
Item 1. Identity of Directors, Senior Management and Advisors
Not required as this 20-F is filed as an Annual Report.
Item 2. Offer Statistics and Expected Timetable
Not required as this 20-F is filed as an Annual Report.
SelectedThe following selected financial data at and for the years ended December 31, 2003, 2002, 2001, 2000, 1999, and 19981999 have been derived from theSEK's consolidated financial statements prepared in accordance with generally accepted accounting principles in Sweden (Swedish GAAP). SEK prepares its accounts in accordance with Swedish GAAP, which differs in significant respects from generally accepted accounting principles in the United States (U.S. GAAP). For a discussionInformation relating to the nature and effect of significantsuch differences between Swedish GAAP and U.S. GAAP, and the reconciliation of the Company's net profit and shareholders' funds if U.S. GAAP were applied, seeis presented in Note 33 to the Consolidated Financial Statements.
On January 1, 2001, SFAS No. 133, Accounting for Derivative Instruments and Hedging Activities, and SFAS No. 138, Accounting for Certain Derivative Instruments and Certain Hedging Activities, became applicable to SEK. SEK did not achieve hedge accounting under U.S. GAAP for any of its instruments at the inception of SFAS 133. Although SEK structured a substantial portion of its transactions to qualify for hedge accounting treatment under these rules beginning in July 2002, certain transactions for which SEK is economically hedged continue not to qualify for hedge accounting treatment under U.S. GAAP. For these reasons, from January 1, 2001 and going forward there have been and are expected to continue to be significant differences between SEK's net profit and shareholders' funds calculated under Swedish GAAP as compared to these items calculated under U.S. GAAP. These differences arise primarily from the requirements of U.S. GAAP that (1) changes in the fair value of derivatives that are not part of a qualifying fair value hedge relationship are required to be recognized currently in the income statement while the contract which the derivative is economically hedging is carried at amortized cost and (2) changes in currency exchange rates affecting the fair value of foreign-currency instruments in the available-for-sale portfolio that are not eligible for hedge accounting are reported only as increases or decreases in shareholders' funds, while the largely offsetting changes in the Swedish kronor position of the related funding must be recognized currently in the income statement. Based on its experience and knowledge of the functioning of SEK's economic hedging, management believes Swedish GAAP better reflects the effects of the economic hedge relationships on net income and shareholders' funds.
The following information should be read in conjunction with the more detailed discussion contained in Item 5 "Operating and Financial Review and Prospects".
Selected Financial Data
| | Year Ended December 31, | |||||||||||
|---|---|---|---|---|---|---|---|---|---|---|---|---|
| | 2002 | 2001 | 2000 | 1999 | 1998 | |||||||
| | (In millions of Skr unless otherwise stated) | |||||||||||
| INCOME STATEMENT DATA | ||||||||||||
| Net interest revenues/(expenses): | ||||||||||||
| SEK excluding the S-system | 798.2 | 830.7 | 895.5 | 904.0 | 1,007.9 | |||||||
| S-system(A) | (193.9 | ) | (230.6 | ) | (334.1 | ) | (297.8 | ) | (326.7 | ) | ||
| Operating profit | 664.4 | 729.0 | 829.9 | 826.8 | 921.5 | |||||||
| Net profit (Swedish GAAP)(B) | 479.7 | 540.7 | 601.8 | 600.4 | 667.9 | |||||||
| After-tax return on equity (%) | 14.0 | % | 16.2 | % | 15.9 | % | 14.0 | % | 15.6 | % | ||
| Earnings per share (Swedish GAAP) (Skr) | 485 | 546 | 712 | 858 | 954 | |||||||
| Dividend per share (Skr) | 364 | 405 | 2,041 | 953 | 1,013 | |||||||
| Net profit (loss) (U.S. GAAP)(C)(D)(H) | 2,613.4 | (312.3 | ) | 608.7 | 600.2 | 621.0 | ||||||
| Comprehensive income (loss) (U.S.GAAP)(E) | 429.5 | 1,587.9 | 488.1 | (353.1 | ) | 1,056.2 | ||||||
| Ratios of earnings to Fixed Charges (Swedish GAAP)(F) | 1.16 | 1.12 | 1.13 | 1.16 | 1.17 | |||||||
| Ratios of earnings to Fixed Charges (U.S. GAAP)(F) | 1.96 | 0.91 | 1.13 | 1.16 | 1.16 | |||||||
| Earnings (loss) per share (U.S. GAAP) (Skr) | 2,639.8 | (315 | ) | 720 | 857 | 887 | ||||||
At December 31, | |||||||||||
|---|---|---|---|---|---|---|---|---|---|---|---|
| | 2002 | 2001 | 2000 | 1999 | 1998 | ||||||
| | (In millions of Skr) | ||||||||||
| BALANCE SHEET DATA | |||||||||||
| Total credits outstanding(G) | 65,470.1 | 70,361.1 | 60,855.6 | 60,314.4 | 60,625.3 | ||||||
| Of which S-system(G) | 11,481.2 | 15,454.4 | 14,081.0 | 14,298.0 | 15,811.4 | ||||||
| Total assets | 132,538.5 | 149,540.8 | 169,804.1 | 149,476.6 | 138,963.5 | ||||||
| Total debt | 114,838.2 | 128,039.0 | 145,652.9 | 129,534.2 | 119,623.0 | ||||||
| of which subordinated debt | 2,224.6 | 4,738.0 | 4,256.9 | 3,410.0 | 3,226.0 | ||||||
| Deferred taxes related to untaxed reserves | 380.8 | 385.0 | 390.4 | 434.5 | 421.0 | ||||||
| Shareholders' funds (Swedish GAAP) | 3,764.7 | 3,645.4 | 3,505.7 | 4,629.0 | 4,695.7 | ||||||
| Total liabilities and shareholders' funds | 132,538.5 | 149,540.8 | 169,804.1 | 149,476.6 | 138,963.4 | ||||||
| Shareholders' funds (U.S. GAAP)(C)(D) | 5,048.7 | 4,979.7 | 3,792.7 | 5,029.7 | 6,044.4 | ||||||
| | Year Ended December 31, | |||||||||||
|---|---|---|---|---|---|---|---|---|---|---|---|---|
| | 2003 | 2002 | 2001 | 2000 | 1999 | |||||||
| | (In Skr million, unless otherwise stated) | |||||||||||
| INCOME STATEMENT DATA | ||||||||||||
Net interest revenues/(expenses): | ||||||||||||
| SEK excluding the S-system | 757.5 | 798.2 | 830.7 | 895.5 | 904.0 | |||||||
| S-system(A) | (67.5 | ) | (193.9 | ) | (230.6 | ) | (334.1 | ) | (297.8 | ) | ||
Operating profit | 595.3 | 664.4 | 729.0 | 829.9 | 826.8 | |||||||
Net profit (Swedish GAAP) | 427.5 | 479.7 | 540.7 | 601.8 | 600.4 | |||||||
After-tax return on equity (%) | 13.6 | % | 14.0 | % | 16.2 | % | 15.9 | % | 14.0 | % | ||
| Earnings per share (Swedish GAAP) (Skr) | 432 | 485 | 546 | 712 | 858 | |||||||
| Dividend per share (Skr)(C) | 1,252 | 364 | 405 | 2,041 | 953 | |||||||
Net profit (loss) (U.S. GAAP)(D)(E) | 643.2 | 2,613.4 | (312.3 | ) | 608.7 | 600.2 | ||||||
Comprehensive income (loss) (U.S. GAAP)(F) | 70.9 | 429.5 | 1,587.9 | 488.1 | (353.1 | ) | ||||||
Ratios of earnings to fixed charges (Swedish GAAP)(G) | 1.16 | 1.16 | 1.12 | 1.13 | 1.16 | |||||||
Ratios of earnings to fixed charges (U.S. GAAP)(G) | 1.22 | 1.96 | 0.91 | 1.13 | 1.16 | |||||||
Earnings (loss) per share (U.S. GAAP) (Skr) | 650 | 2,640 | (315 | ) | 720 | 857 | ||||||
| | At December 31, | ||||||||||
|---|---|---|---|---|---|---|---|---|---|---|---|
| | 2003 | 2002 | 2001 | 2000 | 1999 | ||||||
| | (Skr million) | ||||||||||
| BALANCE SHEET DATA | |||||||||||
| Total credits outstanding(H) | 60,870.5 | 65,470.1 | 70,361.1 | 60,855.6 | 60,314.4 | ||||||
| of which SEK excluding the S-system(H) | 53,140.5 | 53,988.9 | 54,906.7 | 46,774.6 | 46,016.4 | ||||||
| of which S-system(H) | 7,730.0 | 11,481.2 | 15,454.4 | 14,081.0 | 14,298.0 | ||||||
| Total assets | 151,800.5 | 132,538.5 | 149,540.8 | 169,804.1 | 149,476.6 | ||||||
| Total debt | 135,565.9 | 114,838.2 | 128,039.0 | 145,652.9 | 129,534.2 | ||||||
| of which subordinated debt | 3,001.0 | 2,224.6 | 4,738.0 | 4,256.9 | 3,410.0 | ||||||
| Deferred taxes related to untaxed reserves(B) | 376.5 | 380.8 | 385.0 | 390.4 | 434.5 | ||||||
| Shareholders' funds (Swedish GAAP) | 2,952.2 | 3,764.7 | 3,645.4 | 3,505.7 | 4,629.0 | ||||||
| Total liabilities and shareholders' funds | 151,800.5 | 132,538.5 | 149,540.8 | 169,804.1 | 149,476.6 | ||||||
| Shareholders' funds (U.S. GAAP)(C)(D)(E) | 3,879.6 | 5,048.7 | 4,979.7 | 3,792.7 | 5,029.7 | ||||||
2
taxes, reported as one component of allocations. (See Note 25 to the Consolidated Financial Statements.)
3
Foreign Exchange Rates
The Company publishes its financial statements in Swedish kronor ("Skr"). The following table sets forth for the years indicated certain information concerning the exchange rate for Swedish kronor as against the U.S. dollar ("USD") based on the noon buying rate in New York City for cable transfers in foreign currencies as certified for customs purposes by the Federal Reserve Bank of New York.
| Calendar Period | High | Low | Average(A) | Period End | ||||||||||||
|---|---|---|---|---|---|---|---|---|---|---|---|---|---|---|---|---|
| 2003 (through April 3) | 8.7920 | 8.3670 | 8.5393 | 8.5650 | ||||||||||||
| Calendar Year | High | Low | Average(A) | Period End | ||||||||||||
| 2004 (through April 26) | 7.7510 | 7.0850 | 7.5228 | 7.6960 | ||||||||||||
| 2003 | 8.7920 | 7.1950 | 8.0351 | 7.1950 | ||||||||||||
| 2002 | 10.7290 | 8.6950 | 9.6571 | 8.6950 | 10.7290 | 8.6950 | 9.6571 | 8.6950 | ||||||||
| 2001 | 11.0270 | 9.3250 | 10.4328 | 10.4571 | 11.0270 | 9.3250 | 10.4328 | 10.4571 | ||||||||
| 2000 | 10.0400 | 8.635 | 9.225 | 9.4440 | 10.3600 | 8.3530 | 9.2251 | 9.4440 | ||||||||
| 1999 | 8.6500 | 7.7060 | 8.3001 | 8.5050 | 8.6500 | 7.7060 | 8.3001 | 8.5050 | ||||||||
| 1998 | 8.3350 | 7.5800 | 7.9658 | 8.1030 | ||||||||||||
The following table sets forth for the months indicated certain information concerning the exchange rate for Swedish kronor as against the U.S. dollar based on the noon buying rate in New York City for cable transfers in foreign currencies as certified for customs purposes by the Federal Reserve Bank of New York.
| Period Ended | High | Low | ||
|---|---|---|---|---|
| April 3, 2003 | 8.5850 | 8.4830 | ||
| March 31, 2003 | 8.7030 | 8.3670 | ||
| February 28, 2003 | 8.5650 | 8.4100 | ||
| January 31, 2003 | 8.7920 | 8.4750 | ||
| December 31, 2002 | 9.0750 | 8.6950 | ||
| November 30, 2002 | 9.1670 | 8.9708 | ||
| October 31, 2002 | 9.3850 | 9.1885 |
| One-Month Period Ended | High | Low | ||
|---|---|---|---|---|
| April 2004 (through April 26) | 7.7510 | 7.4650 | ||
| March 31, 2004 | 7.6620 | 7.3660 | ||
| February 28, 2004 | 7.4330 | 7.1295 | ||
| January 31, 2004 | 7.4120 | 7.0850 | ||
| December 31, 2003 | 7.5420 | 7.1950 | ||
| November 30, 2003 | 7.9150 | 7.5200 | ||
| October 31, 2003 | 7.8140 | 7.5970 | ||
| September 30, 2003 | 8.4345 | 7.7040 |
The noon buying rate on April 3, 200326, 2004 was U.S.$USD 1 = Skr 8.56507.6960.
No representation is made that Swedish kronor amounts have been, could have been or could be converted into U.S. dollars at the foregoing rates on any of the dates indicated.
Item 4. Information on the Company
Swedish Export Credit Corporation ("SEK" or the "Company")SEK is a public stock corporation ownedwholly-owned by the Swedish State through the Ministry of Foreign Affairs ("Sweden" or the "State") (approximately 65 percent) and ABB Structured Finance Investment AB ("ABB"), a subsidiary of ABB Ltd, the global technology company headquartered in Zürich, Switzerland (approximately 35 percent).
SEK was founded in 1962 in order to strengthen the competitiveness of the Swedish export industry by meeting the need for long-term credits. SEK's objective is to engage in financing activities in accordance with the Swedish Financing Business Act and in connection therewith primarily to promote the development of Swedish commerce and industry as well as otherwise engagingengage in Swedish and international financing activities on commercial grounds.
SEK aims to be a strong financial partner for both customers and investors. With the Nordic region as its base and home market, SEK provides long-term financial solutions tailored for the private and public sectors. Business activities include export credits, lending, project financing, leasing, capital
4
market products and financial advisory services. SEK extends credits, or loans, under two principal lending systems. Credits on commercial terms at prevailing fixed or floating market rates of interest are
provided under the "Market Rate System" (the "M-system"), and credits on State-supported terms at fixed rates of interest that may be lower than prevailing fixed market rates are provided under the "State Support System" (the "S-system"). The S-system is administered on behalf of the State by SEK against compensation.
During 2002, ABB announced its intention to sell its holding in SEK in conjunction with ABB's divestment of its structured finance business. The majority owner, the Swedish State, which has a long-term commitment to SEK, has declared that SEK's operations will continue to be conducted in accordance with current strategies. In view of the pending sale, S&P's placed SEK's rating (AA+) on negative outlook.
From its roots and base in export credits, SEK's product range has continuously expanded to promote the development of Swedish commerce and industry and the Swedish export industry. Over the years, SEK has been a pioneeractive in the creation of innovativenew financial solutions. SEK's independent position, with clear niche specialization in long-term financial products, combined with its considerable financial capacity and flexible organization, are key factors forin the successmanagement of its operations. SEK's borrowing activities in the international capital markets have given SEK extensive expertise in financial instruments, an expertise that has earned prestigious international awards from financial publications on several occasions. This experience, together with maintaining credit quality and strong credit ratings (as of March 2003:April 2004: AA+ negativestable outlook from Standard & Poors and Aa2Aa1 from Moody's Investors Service), has allowed usSEK to offer ourits customers tailored products and what we believeSEK believes are highly competitive terms.
SEK has intensified the broadening of both its range of services and customer base in recent years in response to changes in demand and the opportunities created by the development of new forms of cooperation and financial instruments. Among other things SEK has greatly increased its businessfinancing of infrastructure projects with Swedish regional and local authorities, with the aim of supporting the development and competitiveness of Swedish commerce and industry. SEK has also to a greater extent become involved as a financial advisor for international projects. The expansion of SEK's services and customer base means that SEK is more clearly taking on the role ofreflects SEK's efforts to become a broader-range finance house with specialists withinin a number of areas.areas, while continuing to emphasize its traditional role as a long-term lender.
The increasing integration of business in the Nordic countries means that SEK is moving towards itsconsistent with SEK's goal of having a leading position in the Nordic countries within its niche: long-term financial solutions. The establishment in 2002 of SEK's representative office in Helsinki, with its focus on major Finnish companies and local authorities, furthers this development. The operations in Helsinki are important for strengthening SEK's position in the Nordic market.
SEK has been actively involved in Sweden's fast-growing trade with the countries in the Baltic region since the early 1990s. The overall goal is to contribute to a continued positive economic development in the region, while strengthening the presence of Swedish and Nordic business. Within the framework of these activities there are also links to the business opportunities that can be created by the prospective enlargement in 2004 of the European Union to include new members from the Baltic region and Eastern Europe.
SEK's extensive relationship with national, Nordic and other international investors and partners strengthen its ability to develop financial solutions which meet its customers' requirements. This extensive network enables SEK to participate in co-financing solutions and advisory assignments, as well as in benchmarking and cooperation in areas such as risk management and business systems.
5 The address of the Company's principal executive office is AB Svensk Exportkredit (Swedish Export Credit Corporation), Västra Trädgårdsgatan 11B, Stockholm, Sweden, and the Company's telephone number is 011-46-8-613-8300. The Company's authorized representative in the United States is the Consulate General of Sweden, One Dag Hammarskjöld Plaza, 885 Second Avenue, New York, NY 10017, and the telephone number is (212) 583-2550.
The following table summarizes SEK's credits outstanding and debt outstanding at December 31, 2003, 2002, 2001, and 2000:2001:
| | | At December 31, | | At December 31, | ||||||||||
|---|---|---|---|---|---|---|---|---|---|---|---|---|---|---|
| | | 2002 | 2001 | 2000 | | 2003 | 2002 | 2001 | ||||||
| | | (In millions of Skr) | | (Skr million) | ||||||||||
| Total credits outstanding (old format)(A) | Total credits outstanding (old format)(A) | 65,470 | 70,361 | 60,855 | Total credits outstanding (old format)(A) | 60,871 | 65,470 | 70,361 | ||||||
| Of which S-system | 11,481 | 15,454 | 14,081 | Of which S-system | 7,730 | 11,481 | 15,454 | |||||||
| Total debt outstanding | Total debt outstanding | 114,838 | 128,039 | 145,653 | Total debt outstanding | 135,566 | 114,838 | 128,039 | ||||||
| Of which S-system | 3,179 | 5,171 | 5,131 | Of which S-system | 554 | 3,179 | 5,171 | |||||||
The following table sets forth certain data regarding the Company's lending operations during the five-year period ended December 31, 2002:2003:
| | | At and for the Year Ended December 31, | | At December 31, | ||||||||||||||||||||
|---|---|---|---|---|---|---|---|---|---|---|---|---|---|---|---|---|---|---|---|---|---|---|---|---|
| | | 2002 | 2001 | 2000 | 1999 | 1998 | | 2003 | 2002 | 2001 | 2000 | 1999 | ||||||||||||
| | | (In millions of Skr) | | (Skr million) | ||||||||||||||||||||
| Offers of long-term credits accepted(A) | Offers of long-term credits accepted(A) | 13,365 | 20,245 | 20,665 | 15,495 | 14,684 | Offers of long-term credits accepted(A) | 18,960 | 13,365 | 20,245 | 20,665 | 15,495 | ||||||||||||
| Of which S-system | 172 | 743 | 10,103 | 3,881 | 180 | Of which S-system(B) | 1,939 | 172 | 743 | 10,103 | 3,881 | |||||||||||||
| Total credit disbursements | Total credit disbursements | 7,896 | 17,576 | 7,760 | 6,380 | 5,795 | Total credit disbursements | 9,954 | 7,896 | 17,576 | 7,760 | 6,380 | ||||||||||||
| Of which S-system | 1,377 | 3,324 | 1,573 | 955 | 2,181 | Of which S-system | 1,032 | 1,377 | 3,324 | 1,573 | 955 | |||||||||||||
| Total credit repayments, including effects of currency translations | Total credit repayments, including effects of currency translations | 14,599 | 17,563 | 3,567 | 6,134 | 4,155 | Total credit repayments, including effects of currency translations | 17,334 | 14,599 | 17,563 | 3,567 | 6,134 | ||||||||||||
| Of which S-system | 5,357 | 1,951 | 1,774 | 2,454 | 2,734 | Of which S-system | 4,784 | 5,357 | 1,951 | 1,774 | 2,454 | |||||||||||||
| Total net increase / (decrease) in credits outstanding | Total net increase / (decrease) in credits outstanding | (6,478 | ) | (2,156 | ) | 4,042 | (370 | ) | 4,405 | Total net increase / (decrease) in credits outstanding | 1,739 | (6,478 | ) | (2,156 | ) | 4,042 | (370 | ) | ||||||
| Of which S-system | (3,981 | ) | 1,354 | (201 | ) | (1,499 | ) | (552 | ) | Of which S-system | (3,238 | ) | (3,981 | ) | 1,354 | (201 | ) | (1,499 | ) | |||||
| Credits outstanding at December 31: | Credits outstanding at December 31: | Credits outstanding at December 31: | ||||||||||||||||||||||
| Credits outstanding (old format)(A) | Credits outstanding (old format)(A) | 65,470 | 70,361 | 60,856 | 60,314 | 60,625 | Credits outstanding (old format)(A) | 60,870 | 65,470 | 70,361 | 60,856 | 60,314 | ||||||||||||
| Credits outstanding (new format)(A) | Credits outstanding (new format)(A) | 39,033 | 45,511 | 47,667 | 43,625 | 43,995 | Credits outstanding (new format)(A) | 40,772 | 39,033 | 45,511 | 47,667 | 43,625 | ||||||||||||
| Of which S-system | 11,502 | 15,482 | 14,128 | 14,329 | 15,828 | Of which S-system | 8,264 | 11,502 | 15,482 | 14,128 | 14,329 | |||||||||||||
| Total credit commitments outstanding at December 31 | Total credit commitments outstanding at December 31 | 11,849 | 16,444 | 19,145 | 7,838 | 4,171 | Total credit commitments outstanding at December 31 | 14,358 | 11,849 | 16,444 | 19,145 | 7,838 | ||||||||||||
| Of which S-system | 10,124 | 12,088 | 13,456 | 4,445 | 1,476 | Of which S-system | 10,025 | 10,124 | 12,088 | 13,456 | 4,445 | |||||||||||||
6
described below under "—S-system", the OECD Consensus stipulates that credit offers will be valid for acceptance during a period of not more than four months. The attractiveness of an S-system credit offer is, therefore, dependent on the general movement of interest rates during the relevant four month period which is, in turn, a significant factor contributing to the year-to-year differences in offers of long-term credits accepted in the S-system.
Most of the credits granted by SEK are related to Swedish exports. Measured by revenues, the largest markets for the export of goods from Sweden are Western Europe and North America. However, exports to other, including less developed, markets are also important. Accordingly, the need for export financing may be related to transactions involving buyers in many different countries, with varying levels of creditworthiness. Pursuant to its counterparty risk exposure policy, SEK is selective in accepting any type of risk exposure. This policy seeks to ensure that SEK is not dependent on the creditworthiness of individual buyers of Swedish goods and services, nor on the countries in which they are domiciled, but on the creditworthiness of individual counterparties to whom SEK accepts counterparty risk exposure.
The following tables show the geographic distribution of SEK's credits outstanding (including credits granted against documentation in the form of interest-bearing securities) by domicile of borrower at the dates indicated. The tables further show, by domicile and category, the related risk counterparties to whom SEK's counterparty risk exposures are allocated when taking into account prevailing guarantees and collateral.
| | | At December 31, 2003 Domicile and category of the related counterparties, to whose risk SEK is exposed | ||||||||||||||||||||||||
|---|---|---|---|---|---|---|---|---|---|---|---|---|---|---|---|---|---|---|---|---|---|---|---|---|---|---|
| | | Sweden | Other Nordic Area | Other Western Europe & U.S. | ||||||||||||||||||||||
| Domicile of borrowers | Total amount | Sum | Govern- ment & Munici- palities | Bank | Corpo- ration | Sum | Govern- ment | Bank | Corpo- ration | Sum | Govern- ment | Bank | Corpo- ration | |||||||||||||
| | | (Skr billions) | ||||||||||||||||||||||||
| Africa | 1.4 | 1.4 | 1.3 | 0.1 | ||||||||||||||||||||||
| Asia | 8.1 | 6.1 | 5.8 | 0.2 | 0.1 | 0.8 | 0.7 | 0.1 | 1.2 | 0.3 | 0.9 | |||||||||||||||
| Latin America | 5.6 | 4.5 | 4.1 | 0.3 | 0.1 | 0.1 | 0.1 | 1.0 | 0.3 | 0.5 | 0.2 | |||||||||||||||
| North America | 1.1 | 0.5 | 0.3 | 0.2 | 0.6 | 0.2 | 0.4 | |||||||||||||||||||
| Sweden | 31.5 | 26.1 | 10.0 | 8.5 | 7.6 | 5.4 | 5.4 | |||||||||||||||||||
| Other Nordic Area | 9.1 | 6.8 | 1.6 | 1.7 | 3.5 | 2.3 | 2.3 | |||||||||||||||||||
| Other Western Europe | 3.3 | 0.1 | 0.1 | 3.2 | 3.2 | |||||||||||||||||||||
| Baltic Area | 0.1 | 0.1 | 0.1 | |||||||||||||||||||||||
| Other Eastern Europe | 0.7 | 0.2 | 0.2 | 0.5 | 0.5 | |||||||||||||||||||||
| Total | 60.9 | 38.9 | 21.8 | 9.0 | 8.1 | 7.7 | 2.3 | 1.9 | 3.5 | 14.3 | 0.6 | 13.0 | 0.7 | |||||||||||||
| | | At December 31, 2002 Domicile and category of the related counterparties, to whose risk SEK is exposed | ||||||||||||||||||||||||
|---|---|---|---|---|---|---|---|---|---|---|---|---|---|---|---|---|---|---|---|---|---|---|---|---|---|---|
| | | Sweden | Other Nordic Area | Other Western Europe & U.S. | ||||||||||||||||||||||
| Domicile of borrowers | Total amount | Sum | Govern- ment & Munici- palities | Bank | Corpo- ration | Sum | Govern- ment | Bank | Corpo- ration | Sum | Govern- ment | Bank | Corpo- ration | |||||||||||||
| | | (Skr billions) | ||||||||||||||||||||||||
| Africa | 1.4 | 1.3 | 1.3 | 0.1 | 0.1 | 0.0 | ||||||||||||||||||||
| Asia | 12.0 | 9.2 | 8.7 | 0.4 | 0.1 | 1.1 | 1.0 | 0.1 | 1.7 | 0.4 | 1.3 | |||||||||||||||
| Pacific | ||||||||||||||||||||||||||
| Latin America | 7.2 | 6.2 | 5.7 | 0.4 | 0.1 | 0.1 | 0.1 | 0.9 | 0.4 | 0.5 | ||||||||||||||||
| North America | 6.3 | 0.2 | 0.2 | 6.1 | 5.2 | 0.9 | ||||||||||||||||||||
| Sweden | 25.3 | 25.1 | 7.3 | 9.1 | 8.7 | 0.2 | 0.2 | |||||||||||||||||||
| Other Nordic Area | 6.7 | 6.7 | 1.2 | 1.2 | 4.3 | |||||||||||||||||||||
| Other Western Europe | 6.1 | 0.2 | 0.1 | 0.1 | 0.0 | 5.9 | 4.7 | 1.2 | ||||||||||||||||||
| Baltic Area | 0.1 | 0.1 | 0.1 | 0.0 | ||||||||||||||||||||||
| Other Eastern Europe | 0.4 | 0.4 | 0.3 | 0.1 | ||||||||||||||||||||||
| Total | 65.5 | 42.7 | 23.7 | 10.0 | 9.0 | 8.1 | 2.2 | 1.4 | 4.5 | 14.7 | 0.9 | 11.7 | 2.1 | |||||||||||||
| | | At December 31, 2001 Domicile and category of the related counterparties, to whose risk SEK is exposed | ||||||||||||||||||||||||
|---|---|---|---|---|---|---|---|---|---|---|---|---|---|---|---|---|---|---|---|---|---|---|---|---|---|---|
| | | Sweden | Other Nordic Area | Other Western Europe & U.S. | ||||||||||||||||||||||
| Domicile of borrowers | Total amount | Sum | Govern- ment & Munici- palities | Bank | Corpo- ration | Sum | Govern- ment | Bank | Corpo- ration | Sum | Govern- ment | Bank | Corpo- ration | |||||||||||||
| | | (Skr billions) | ||||||||||||||||||||||||
| Africa | 1.9 | 1.8 | 1.7 | 0.1 | 0.0 | 0.0 | 0.0 | 0.0 | 0.1 | 0.1 | 0.0 | |||||||||||||||
| Asia | 16.0 | 12.4 | 11.7 | 0.6 | 0.1 | 1.6 | 1.5 | 0.1 | 0.0 | 2.0 | 0.1 | 1.9 | ||||||||||||||
| Latin America | 10.0 | 8.6 | 8.0 | 0.6 | 0.0 | 0.1 | 0.1 | 0.0 | 1.3 | 0.5 | 0.8 | 0.0 | ||||||||||||||
| North America | 4.7 | 0.2 | 0.1 | 0.0 | 0.1 | 4.5 | 3.7 | 0.8 | ||||||||||||||||||
| Sweden | 25.9 | 25.6 | 5.2 | 11.7 | 8.7 | 0.3 | 0.3 | |||||||||||||||||||
| Other Nordic Area | 7.2 | 7.2 | 2.0 | 1.2 | 4.0 | |||||||||||||||||||||
| Other Western Europe | 3.8 | 0.2 | 0.2 | 0.0 | 0.0 | 0.0 | 0.0 | 3.6 | 3.2 | 0.4 | ||||||||||||||||
| Baltic Area | 0.2 | 0.2 | 0.2 | 0.0 | 0.0 | 0.0 | 0.0 | |||||||||||||||||||
| Other Eastern Europe | 0.7 | 0.7 | 0.3 | 0.0 | 0.4 | |||||||||||||||||||||
| Total | 70.4 | 49.7 | 27.4 | 13.0 | 9.3 | 9.2 | 3.5 | 1.4 | 4.3 | 11.5 | 0.7 | 9.6 | 1.2 | |||||||||||||
As most credits are supported by elements from more than one category, resulting in more than one party being responsible for the same payments to SEK, the above tables reflect the counterparty (either borrower or guarantor) that SEK believes to be the stronger credit.
SEK reports credits in the M-System in the following categories:
SEK's lending also includes financing in co-operationcooperation with intergovernmental organizations and foreign export credit agencies. (These credits are included under the relevant underlying type of credit).
The Company also extends export financing by establishing credit lines or protocols, principally with countries in Eastern Europe and Asia. (These credits are included under the relevant underlying type of credit).
Under the regulations of the Swedish Financial Supervisory Authority, as described in Note 1 to the Consolidated Financial Statements, credits granted against documentation in the form of interest-bearing securities, as opposed to traditional credit agreements, are reported on the balance sheet as one component of securities classified as fixed financial assets. However, deposits with banks and repurchase agreements are reported as credits.
Credits outstanding in the M-system at December 31, 2003, 2002 2001 and 20002001 were distributed among SEK's differentvarious categories of credits as follows:
| Credits outstanding, type of credits | 2002 | 2001 | 2000 | |||
|---|---|---|---|---|---|---|
| | (In millions of Skr) | |||||
| Deposits and repurchase agreements | — | — | — | |||
| Financing of capital goods exports | 12,699 | 17,074 | 10,308 | |||
| Continuous-flow financing of exports | 12,750 | 15,550 | 20,805 | |||
| Infrastructure | 20,296 | 11,979 | 6,299 | |||
| Refinancing of export leasing agreements | 626 | 718 | 145 | |||
| Market investment credits | 7,477 | 9,425 | 8,671 | |||
| G-24 loans | 141 | 161 | 547 | |||
| Total | 53,989 | 54,906 | 46,775 | |||
| Credits outstanding, type of credits | 2003 | 2002 | 2001 | |||
|---|---|---|---|---|---|---|
| | (Skr million) | |||||
| Financing of capital goods exports | 10,919 | 12,699 | 17,074 | |||
| Other export related credits | 17,212 | 20,994 | 25,854 | |||
| Infrastructure | 25,009 | 20,296 | 11,979 | |||
| Total | 53,140 | 53,989 | 54,906 | |||
7
Offers granted by the Company for credits that were accepted by borrowers inunder the M-system that borrowers accepted during the years ended December 31, 2003, 2002 2001 and 20002001 were distributed among SEK's differentvarious categories of credits as follows:
| Offers accepted, type of credit | 2002 | 2001 | 2000 | 2003 | 2002 | 2001 | ||||||
|---|---|---|---|---|---|---|---|---|---|---|---|---|
| | (In millions of Skr) | (Skr million) | ||||||||||
| Financing of capital goods exports | 701 | 5,634 | 5,161 | 4,148 | 701 | 5,634 | ||||||
| Other export related credits | 8,447 | 12,448 | 4,867 | 7,863 | 8,447 | 12,448 | ||||||
| Infrastructure | 4,045 | 1,421 | 534 | 5,010 | 4,045 | 1,421 | ||||||
| Total | 13,193 | 19,503 | 10,562 | 17,021 | 13,193 | 19,503 | ||||||
The reduction over the last three years in credits attributable to the financing of export transactions directly and indirectly through continuous flow financing reflects several factors. One of the more important is the general business downturn that reduced capital expenditures, especially in the private sector.
A more long-term relevant trend has been the reduction in importance of the financing of traditional capital goods in Sweden's export industry. SEK's services have therefore changed over time to meet customers' needs. This means that a credit granted could be either in the form of capital goods export financing or another category of export related credits. In addition, export financing has become more competitive, especially in the recent low interest-rate environment, as financial markets have been deregulated and more exporting companies finance their own sales to gain additional revenue and enhance their competitive position. As SEK is a relatively small player in the market, the changes in volumes from year to year are more the effect of specific business opportunities than the effect of fluctuation in the overall volume of the markets for export credits.
The growth in infrastructure credits reflects the decision in 1996 to broaden SEK's mandate to include infrastructure financing that directly or indirectly enhances the Swedish export industry. In that connection municipalities and other public authorities in Sweden and elsewhere in the Nordic region have become an increasingly important sector of business that SEK targets.
Export financing credits in the M-system are made at prevailing market rates of interest. The Company normally makes credit offers at a quoted interest rate that is subject to change prior to acceptance of the credit offer (an "indicative credit offer"). However, credit offers can also be made at a fixedbinding interest rate (a "firm credit offer"), but such credit offers have up until now rarely been made in the M-system and are then only valid for short periods. When a borrower accepts an indicative credit offer, is accepted, the interest rate is set and a binding credit commitment by the Company arises. Before the Company makes any credit commitment, it attempts to ensureensures that the currency in which the credit is to be funded willis expected to be available for the entire credit period at an interest rate that, as of the day the commitment is made, results in a margin that the Company deems sufficient. Except for the portion of the Company's credits in Swedish kronor that are financed by the Company's shareholders' funds and untaxed reserves, the Company typically borrows, on an aggregate basis, at maturities corresponding to or exceeding those of prospective credits. The Company may accordingly decide not to fundhedge for movements in interest rate risk particular credit commitments until some time after they are made. Interest rate risks associated with such uncovered commitments are monitored on a daily basis. Losses associated with suchclosely and may not exceed interest rate risks have not been significant.
Creditslimits established by the Board of Directors. The Company's policies with regard to counterparty exposures are described in the M-system normally carry a rate of interest that reflects a premium of at least 0.25 percent per annum in excess of the Company's cost of funds. The Company charges a standard commitment fee of 0.25 percent per annum on outstanding commitments for credits at fixed interest rates. The commitment fee for credits at floating interest rates is individually set for each credit.Item 11.a "Quantitative and Qualitative Disclosures about Market Risk—Risk Management—Credit or Counterparty Risks".
The Company's initial credit offer and subsequent credit commitment set forth the maximum principal amount of the credit, the currency in which the credit will be denominated, the repayment schedule and the disbursement schedule.
The following table shows the currency breakdown of credit offers accepted in the M-system for credits with maturities exceeding one year for each year in the three-year period ended December 31, 2002.2003.
| | Percentage of credit offers accepted | Percentage of credit offers accepted | ||||||||||||
|---|---|---|---|---|---|---|---|---|---|---|---|---|---|---|
| Currency in which credit is denominated | ||||||||||||||
| 2002 | 2001 | 2000 | 2003 | 2002 | 2001 | |||||||||
| Swedish kronor | 47 | % | 23 | % | 27 | % | 36 | % | 47 | % | 23 | % | ||
| Euro | 47 | % | 34 | % | 18 | % | 40 | % | 47 | % | 34 | % | ||
| U.S. dollars | 5 | % | 40 | % | 48 | % | 17 | % | 5 | % | 40 | % | ||
| Other | 1 | % | 3 | % | 7 | % | 7 | % | 1 | % | 3 | % | ||
| Total | 100 | % | 100 | % | 100 | % | 100 | % | 100 | % | 100 | % | ||
S-system
The S-system was established by the State on July 1, 1978, as a State-sponsored export financing program designed to maintain the competitive position of Swedish exporters of capital goods and
8
services in world markets. After a trial period, in April 1984 the Swedish Parliament extended the S-system indefinitely. The S-system today comprises the normal export financing program and a tied aid credit program. Pursuant to arrangements established in 1978 and amended from time to time thereafter, the Company administers the S-system on behalf of the State against compensation.compensation based mainly on outstanding credit volumes.
Pursuant to agreements between SEK and the State, as long as any credits or borrowings remain outstanding under the S-system, the difference between interest revenues and net commission revenues related to lending and liquid assets under the S-system, on the one hand, and interest expenses related to borrowing, all financing costs and any net foreign exchange losses incurred by SEK under the S-system, on the other hand, are reimbursed by the State. SEK treats the S-system as a separate operation for accounting purposes, with its own income statement. Although the deficits (surpluses) of programs under the S-system are reimbursed by (paid to) the State, any credit losses that would be incurred under such programs are not reimbursed by the State. Accordingly, SEK has to obtain appropriate credit support for these credits as well, all of which are reported on SEK's balance sheet.
The S-system is designed to comply with the Arrangement on Guidelines for Officially Supported Export Credits of the Organization for Economic Cooperation and Development (the "OECD Consensus"), of which Sweden is a member, pursuant to whichmember. The OECD Consensus establishes minimum interest rates, required down payments and maximum credit periods are established for government-supported export credit programs. Terms vary according to the per capita income of the importing country.
Financing is offeredSEK offers S-system financing at CIRR (Commercial Interest Reference Rate) rates. The CIRR-rates for new credits are subject to periodic review and adjustment by the OECD. The OECD Consensus stipulates that credit offers will be valid for acceptance during a period of not more than four months.
Effective September 1, 2002, certain new conditions were introduced for CIRR-based credits. Firstly, the commitment fee of 0.25 percent was removed. Secondly, a compensation of 0.25 percent per annum, based on outstanding credit amount was introduced to the benefit of the bank or financial institution leading the credit, to cover the costs of arranging and managing the facility. In addition, the conditions have been amended to permit the applicant to submit the application to the Swedish Export Credits Guarantee Board (EKN)(the "EKN"), as an alternative to SEK. Regardless, SEK will be responsible for the administration and funding of all transactions.
The OECD Consensus also strengthens the rules for tied or partially untiedtied concessionary credits. In principle, during 2003 such credits maywere not permitted to be extended to countries whose per capita
GNP for the year 2002 was greater than USD 2,995 in 2002.2,935. Tied or partially untiedtied concessionary credits to other countries maywere not permitted to be extended to finance public or private projects that normally would be commercially viable if financed on market or OECD Consensus terms.
SEK participates with government agencies in a State-sponsored export financing program (the "Concessionary Credit Program") for exports to certain developing countries, presently incorporating a foreign aid element of at least 35 percent. The foreign aid element is granted in the form of lower rates of interest and/or deferred repayment schedules, and the State reimburses SEK in the S-system for the costs incurred as a result of SEK's participation in such program. In general, credits under the program are made with State guarantees administered by the Swedish Export Credits Guarantee Board (EKN).EKN. All such credits granted by SEK must also undergo SEK's customary approval process.
9
The following table sets forth the volumes of offers accepted, undisbursed credits at year end, new credits disbursed and credits outstanding at year end under the differentvarious programs in the S-system for each year in the three-year period ended December 31, 2002.2003.
| | Concessionary Credit Program | CIRR-credits | Total | Concessionary Credit Program | CIRR-credits | Total | ||||||||||||||||||||||||||||||
|---|---|---|---|---|---|---|---|---|---|---|---|---|---|---|---|---|---|---|---|---|---|---|---|---|---|---|---|---|---|---|---|---|---|---|---|---|
| | 2002 | 2001 | 2000 | 2002 | 2001 | 2000 | 2002 | 2001 | 2000 | 2003 | 2002 | 2001 | 2003 | 2002 | 2001 | 2003 | 2002 | 2001 | ||||||||||||||||||
| | (In millions of Skr) | (Skr million) | ||||||||||||||||||||||||||||||||||
| Offers accepted | 172 | 279 | 259 | 0 | 464 | 9,844 | 172 | 743 | 10,103 | 47 | 172 | 279 | 1,892 | 0 | 464 | 1,939 | 172 | 743 | ||||||||||||||||||
| Undisbursed credits at year end | 253 | 316 | 233 | 9,871 | 11,772 | 13,223 | 10,124 | 12,088 | 13,456 | 67 | 253 | 316 | 9,957 | 9,871 | 11,772 | 10,025 | 10,124 | 12,088 | ||||||||||||||||||
| New credits disbursed | 204 | 208 | 556 | 1,173 | 3,116 | 1,017 | 1,377 | 3,324 | 1,573 | 148 | 204 | 208 | 884 | 1,173 | 3,116 | 1,032 | 1,377 | 3,324 | ||||||||||||||||||
| Credits outstanding at year-end | 3,990 | 5,699 | 6,361 | 7,491 | 9,755 | 7,720 | 11,481 | 15,454 | 14,081 | 2,106 | 3,990 | 5,699 | 5,624 | 7,491 | 9,755 | 7,730 | 11,481 | 15,454 | ||||||||||||||||||
Credit Support for Outstanding Credits
The Company's policies with regard to counterparty exposures are described in Item 5. "Operating11.a "Quantitative and Financial Review and Prospects—Qualitative Disclosures about Market Risk—Risk management—Management—Credit or Counterparty Risks".
The following table shows the credit support by category for the Company's outstanding credits for the five-year period ended December 31, 2002 (most2003. As most credits are supported by elements from more than one category, resulting in more than one party being responsible for the same payments to SEK):SEK, this table reflects the counterparty (either borrower or guarantor) that SEK believes to be the stronger credit.
| | Percentage Total Credits Outstanding at December 31, | ||||||||||
|---|---|---|---|---|---|---|---|---|---|---|---|
| | 2002 | 2001 | 2000 | 1999 | 1998 | ||||||
| Credits with State guarantees via National Debt Office(A) | 3 | % | 3 | % | 5 | % | 5 | % | 6 | % | |
| Credits with State guarantees via EKN(B) | 26 | % | 33 | % | 29 | % | 31 | % | 33 | % | |
| Credits with State guarantees (total)(C) | 29 | % | 36 | % | 34 | % | 36 | % | 39 | % | |
| Credits to or guaranteed by Swedish credit institutions(D) | 15 | % | 18 | % | 30 | % | 33 | % | 36 | % | |
| Credits to or guaranteed by foreign bank groups or governments(E) | 25 | % | 22 | % | 13 | % | 14 | % | 9 | % | |
| Credits to or guaranteed by other Swedish counterparties, primarily corporations(F) | 21 | % | 13 | % | 15 | % | 12 | % | 11 | % | |
| Credits to or guaranteed by other foreign counterparties, primarily corporations | 10 | % | 11 | % | 8 | % | 5 | % | 5 | % | |
| Total | 100 | % | 100 | % | 100 | % | 100 | % | 100 | % | |
| | Percentage of Total Credits Outstanding at December 31, | ||||||||||
|---|---|---|---|---|---|---|---|---|---|---|---|
| | 2003 | 2002 | 2001 | 2000 | 1999 | ||||||
| Credits with State guarantees via | |||||||||||
| National Debt Office(A) | 3 | % | 3 | % | 3 | % | 5 | % | 5 | % | |
| Credits with State guarantees via EKN(B) | 20 | % | 26 | % | 33 | % | 29 | % | 31 | % | |
| Credits with State guarantees (total) | 23 | % | 29 | % | 36 | % | 34 | % | 36 | % | |
| Credits to or guaranteed by Swedish credit institutions(C) | 15 | % | 15 | % | 18 | % | 30 | % | 33 | % | |
| Credits to or guaranteed by foreign bank groups or governments(D) | 28 | % | 25 | % | 22 | % | 13 | % | 14 | % | |
| Credits to or guaranteed by other Swedish counterparties, primarily corporations(E) | 10 | % | 14 | % | 10 | % | 13 | % | 10 | % | |
| Credits to or guaranteed by Municipalities | 14 | % | 7 | % | 3 | % | 2 | % | 2 | % | |
| Credits to or guaranteed by other foreign counterparties, primarily corporations | 10 | % | 10 | % | 11 | % | 8 | % | 5 | % | |
| Total | 100 | % | 100 | % | 100 | % | 100 | % | 100 | % | |
See "—Lending Operations—General" for information on the geographical distribution of borrowers.
Generally, an EKN guarantee covers 85-90 percent of losses incurred due to covered risks. Disputed claims must be supportedresolved by a court judgementjudgment or arbitral award, unless otherwise agreed by EKN. In the case of a governmental borrower or buyer, the coverage provided by EKN guarantees is effectively as broad. In the table above, only the percentages guaranteed have been included.
10
EKN is a State agency whose obligations are backed by the full faith and credit of Sweden.
The Company funds its lending primarily through publicdecline in credits guaranteed by the Swedish Government and private offerings of debt securitiescredit institutions and the increase in the international capitalcredits guaranteed by foreign governments and money markets. In many cases SEK has been willing to provide "tailor-made" structures responding to the needs of the investors.
The Companyinstitutions is actively involved in making interest rate and currency swaps with selected counterparties, principally large commercial financial institutions. From time to time the Company funds non-U.S. dollar commitments with U.S. dollar borrowings with a view to swapping into the required currency on or prior to the loan disbursement date. The Company has not experienced any losses to date as a result of SEK's diversification strategy. Under this strategy, SEK's intention is to reduce the credit risks related to such currency and interest rate swaps.
Total new borrowings with maturities exceeding one year during the year ended December 31, 2002, were equivalent to approximately Skr 44.9 billion, compared with Skr 38.0 billion and Skr 18.4 billion for the years ended December 31, 2001 and 2000, respectively. New borrowings in 2002 comprised 281 transactions (2001: 337), primarily structured private placements. For a descriptionrelative proportion of the Company's outstanding debt, see Notes 22 and 26 to the Consolidated Financial Statements. The outstanding volume of debt with original maturitites of one year or less increased in 2002. However, as a result of substantial net repayments of long-term debt in 2002, at December 31, 2002 outstanding debt with remaining maturities of one year or less had declined to Skr 15,591.1 million from Skr 37,419.6 million at December 31, 2001 and the average maturity of SEK's senior debt had increased to 8.14 years from 7.46 years at December 31, 2001. See "Consolidated Statements of Cash Flows" in the Consolidated Financial Statements and Note 29 to the Consolidated Financial Statements.its risk exposure towards Swedish counterparties.
SEK organizes its activities into two main business areas: Corporate & Structured Finance, and Capital Markets.
Corporate & Structured Finance. The Corporate & Structured Finance group is responsible for all activities in general lending, export credits, project finance, leasing and other structured finance projects, as well as origination and advisory services. Corporate has overall responsibility for SEK's relationships with its customers. As a complement to SEK's lending activity, advisory services offers independent consulting services to both the private and public sectors based on SEK's experience in various areas, especially export credits and project finance, risk management and capital markets.
Capital Markets. The Capital Markets group comprises twothree sub-functions and one wholly-owned limited company. The twothree sub-functions are Treasury, and Syndication, and theCredit Investments. The limited company is AB SEK Securities. Treasury is responsible for managing SEK's borrowing program and the investment of its liquidity portfolio. See Item 5, "Operating and Financial Review and Prospects—Liquidity, Capital Resources and Funding—Liquidity". Syndication handles risk syndication and risk cover solutions andsolutions. Credit Investments handles corporate bond investment and trading. To facilitate its capital markets activities, in 2002 SEK established AB SEK Securities is a wholly-owned subsidiary with a license from the Swedish Financial Supervisory Authority
to conduct a
11
securities business. AB SEK Securities intermediates capital markets products for its clients principally in the primary market via private placements.
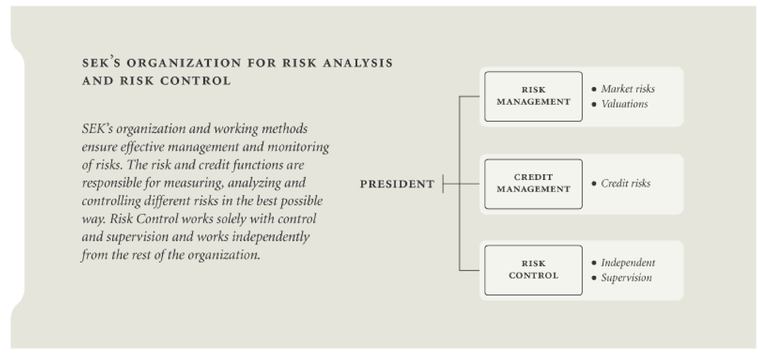
In addition, SEK maintains a risk control unit that operates independently of the business areas. See Item 5. "Operating11, "Quantitative and Financial Review and Prospects—Qualitative Disclosures About Market Risk—Risk management—Management—Risk Control".
The Company operates as a credit market companyinstitution within the meaning of the Swedish Financing Business Act (1992:1610) (the "Act"). As such, it is subject to supervision and regulation by the Swedish Financial Supervisory Authority (the "Supervisory Authority"), an arm of the Ministry of Finance, which licenses and monitors the activities of credit market companies to ensure their compliance with the Act and regulations thereunder and their corporate charters.
Among other things, the Swedish Financial Supervisory Authority requires SEK to submit reports on a three-month, six-month and twelve-month basis and may conduct periodic inspections. The Supervisory Authority also may (and currently does) appoint an external auditor to participate with SEK's independent auditors in examining the Company's financial statements and the management of the Company.
As a credit market institution, SEK is also subject to regulation of its capital adequacy and limits on credit to a single customer pursuant to the Capital Adequacy and Large Exposures (Credit Institutions and Securities Companies) Act, (1994:2004), as amended.
The capital adequacy requirements under Swedish law comply with international guidelines, including the recommendations issued by the BasleBasel Committee on Banking Regulation and Supervisory Practices at the Bank for International Settlements. The principal measure of capital adequacy is a capital to risk asset ratio, which compares the capital base to the total of assets and off-balance sheet items. CapitalThe capital base is divided into two components, one of them being "core" or "Tier 1" capital, which includes equity capital and, with certain limitations, non-cumulative preferred shares and similar instruments. Non-cumulative preferred shares and similar instruments may not be included in Tier 1 capital to the extent they exceed 15% of the Tier 1 capital other than non-cumulative preferred shares and similar instruments. The other component in the capital base is "supplementary" or "Tier 2" capital, which includes non-cumulative preferred shares and similar instruments and "supplementary" or "Tier 2"not included in core capital, comprisingplus subordinated obligations with an original term of at least five years (but with(with a deduction of 20% for each of the last five years prior to maturity). Assets are assigned a weighting based on relative credit risk (0%, 20%, 50% or 100%) depending on the debtor or the type of collateral, if any, securing the assets. The minimum capital ratio requirement is 8%, and not more than 50% of an institution's regulatory capital may comprise supplementary capital. SEK's policy is to maintain a strong capital base, well in excess of the regulatory minimum. At December 31, 2002,2003, SEK's total regulatory capital ratio was 17%16.6% and its Tier 1 ratio was 9.5%. See also Item 5, "Operating and Financial Review and Prospects—Liquidity, Capital Resources and Funding—Capital Adequacy."
Under the regulatory rules for large exposure rules, in general the value of SEK'sexposures, a "large exposure" is defined as an (risk-weighted) exposure to a single customer or groupcounterparty (or counterparty group) that exceeds 10 percent of customersthe institution's regulatory total capital base. These rules state that no individual large exposure may exceed 25 percent of the regulatory total capital base of the institution, and that the aggregate amount of large exposures may not exceed 25%800 percent of the institution's regulatory total capital base. The aggregate amount of SEK's large exposures on December 31, 2003, was less than 150 percent of SEK's regulatory capital. The total valuecapital base, and consisted of SEK's "large exposures" (exposuresrisk-weighted exposures to a single customer or groupten different counterparties (or counterparty groups). These counterparties (or counterparty groups) were all rated by at least one of customers that exceed 10%the major rating agencies, Moody's and Standard & Poor's, with ratings of its capital base) may not in the aggregate, exceed 8 times its capital base.lower than investment grade.
The Company's newly established subsidiary, AB SEK Securities, has been licensed to conduct a securities business and as such will beis regulated by the Swedish Financial Supervisory Authority under the Securities Operations Act (1991:981).Act.
SEK is the only institution authorized by the State to make export financing credits under the S-system. In that connection, and with support from the Swedish State, SEK competes with the export credit agencies of other OECD member countries in providing government-supported export credits. Lending in the M-system faces competition from other Swedish and foreign financial institutions.institutions, as well as from direct or indirect financing programs of exporters themselves. Deregulation and globalization of the word's financial markets have resulted in an increasingly competitive environment for financial institutions, including SEK, for both lending opportunities and funding sources.
The Company owns, through its wholly-owned subsidiary AB SEKTIONEN, an office building in the City of Stockholm. The major part of the building is used by the Company as its headquarters.
Item 5. Operating and Financial Review and Prospects
Substantially all of SEK's revenues and net income derive from the net interest revenues earned on its credits and interest-bearing securities. Funding for these assets comes from shareholders' funds and debt securities issued in the international capital markets. Accordingly, key elements in SEK's profits from year to year are the spread, or difference, between the rate of interest earned on its debt-financed assets and the cost of that debt, the rate of interest earned on the investment of its shareholders' funds and the outstanding volumes of credits and interest-bearing securities in the balance sheet, as well as the relative proportions of its assets funded by debt and shareholders' funds.
In recent years SEK's net profit under Swedish GAAP has been declining. This reflects several factors, including (1) reductions in shareholders' funds in 2000 and 2003 in connection with changes in SEK's ownership, resulting in a higher proportion of SEK's assets being funded through debt financing, and (2) the lower interest rate environment in recent years that has resulted in maturing investments of the Company's shareholders' funds being reinvested at lower interest rates.
The Company expects to rebuild shareholders' funds through retained earnings and a restrictive dividend policy. In recent years SEK has also expanded into business areas that may produce non-interest revenue, although commission income has not thus far made a material contribution to SEK's revenues and profits.
Critical Accounting Policies and Estimates under Swedish GAAP
The Company has identified as critical accounting policies forthose accounting policies regarding the Company are theapplication of hedge accounting according to Swedish GAAP. For accounting policies regarding hedge accounting and measurements of fair values according to Swedish and U.S. GAAP respectively. (Seesee below and Note 1(j), 1(q), and Note 33Note1(q) to the Consolidated Financial Statements.)
In the management's opinion, the profit based on hedge accounting, as reported by the Company under its reporting practice following Swedish GAAP, correctly reflects the profit of the Company. Under Swedish GAAP, SEK applies hedge accounting for all transactions that are economically hedged. SuchThe Company's lending and investing transactions are hedged on-balance sheet or off-balance sheet by transactions with matching principal or notional amounts, interest rates, currencies, and other relevant factors, such that the Company's exposure to changes in net fair values of such transactions due to movements in interest and/or exchange rates is hedged. Under Swedish GAAP, SEK applies hedge accounting for all transactions that are economically hedged.
SEK accounts for derivatives under U.S. GAAP in accordance with Statement of Financial Accounting Standards (SFAS) No. 133 "Accounting for Derivative InstrumentsFor transactions without matched and Hedging Activities". SFAS No. 133 requires the recognition of derivatives in theoffsetting balance sheet and the measurement of those instruments at fair value. Changes in the fair value of derivatives are recorded in earnings. If fair value hedge accounting is applicable, changes in the fair value of the underlying assets or liabilities are also recorded in earnings.
Certain assets, liabilities, and designated derivatives have qualified for hedge accounting under previous U.S. GAAP standards. These hedging relationships did not on January 1, 2001, nor on December 31, 2001, despite the fact that the Company was effectively hedged through these relationships, qualify for hedge accounting under the new accounting standards imposed by SFAS 133. Therefore, the adoption of the new accounting standards increased the volatility of reported earnings under U.S. GAAP until June 30, 2002. From July 1, 2002, certain assets, liabilities, and designated derivatives have been designed to qualify for hedge accounting under the new accounting standards and thereby the volatility in earnings has been reduced.
positions, SEK enters into derivative transactions, in its ordinary course of business, in order to be economically hedged.achieve an effective economic hedge. These instruments include interest-rate related, currency related and other agreements that SEK uses for the purpose of hedging or eliminating mainly interest rate and currency exchange rate exposures.
SEK has designated, documented and assessedaccounts for derivatives in accordance with hedge accounting rules under Swedish GAAP. If hedge relationships that resultedaccounting is applicable, changes in fair value hedges that require SEK to recordthe amortized cost of the derivative is recorded in earnings which
corresponds to a similar but opposite change in the amortized cost of the underlying assets or liabilities at their fair value on the balance sheet with an offset in earnings. Hedge ineffectiveness is also recorded in earnings.
Although For the amountsmajor part of transactions on- or off balance sheet, both derivatives and underlying instruments are recorded at amortized cost or both derivatives and underlying instruments are marked-to-market, meaning that ultimately would be recognizedthe economic purpose of holding the derivative is always reflected in the income statement over the term of the derivatives are the sameaccounting treatment under any method used, it is the timing of the recognition of these amount that is the main difference in methods. The determination of fair value is dependent on certain assumptions and judgments. In the cases where quoted market values for the relevant items are available, such market values have been used. However, it should be noted that for a large portion of the items there are no such quoted market values. In those cases, the fair values have been estimated or derived. The process of estimating or deriving such values naturally involves a high degree of uncertainty.
13
In the process of estimating or deriving fair values, certain simplifying assumptions have been made. For instance, the fair values of assets, liabilities or derivatives with fixed or floating interest rates have been calculated based on estimated market interest rates that would have been applicable at the end of each relevant period. The fair value of the derivative will be estimated using discounted cash flow analysis. The discount factors will be derived from the zero coupon curve, based on the swap curve, for each currency. If an asset, liability or derivative inherits embedded derivatives, the fair value of the embedded derivative has been derived using certain simplifying assumptions.Swedish GAAP.
In reporting the amounts of its assets, liabilities, derivatives, and its revenues and expenses, generally and especially in determinations related to hedge accounting under U.S. GAAP, the Company must make significant assumptions and estimates in assessing the fair value of itscertain assets, liabilities, and liabilities,derivatives especially where unquoted or illiquid securities or other debt instruments are involved. If the conditions underlying these assumptions and estimates were to change, the amounts reported could be materially different. However, under Swedish GAAP, when applying hedge accounting, the net of revenues and expenses would be substantially unchanged. The same should be the case for assets, liabilities, and designated derivatives that qualify for hedge accounting under U.S. GAAP.
Changes in amounts reported will beare reflected in the net carrying value of the securities where they are carried at fair value. Where the securities are carried at amortized cost, changes in their estimated fair values, arising from changes in management's assessment of the underlying assumptions, may result in the recording of a permanent diminution in their value. In such case, it would also be necessary for SEK's management to exercise judgment as to whether or not changes in the underlying valuation assumptions are only temporary. SEK monitors on an ongoing basis the validity of such assumptions.
SEK is economically hedged regarding foreign currency exchange revaluation effects related to revaluation of balance sheet components. A major part of its assets, liabilities, and related derivatives is denominated in foreign currency. Under Swedish GAAP both the assets and the liabilities are translated at closing exchange rates and the differences between historical book value and current value are reflected inas foreign exchange effects in earnings,revenues and expenses, where they offset each other. This reflects the economic substance of holding currency assets financed by liabilities denominated in, or hedged, into the same currency.
Critical Accounting Policies in Reconciliation to U.S. GAAP SFAS 133 (Derivatives
The Company has also identified as critical accounting policies those accounting policies regarding the application of hedge accounting according to U.S GAAP. For accounting policies regarding hedge accounting and hedging activities) came into effect onmeasurements of fair values according to U.S. GAAP see Note 1(j), 1(q), and Note 33.
On January 1, 2001. In addition,2001, SFAS 115 stipulatesNo. 133, Accounting for Derivative Instruments and Hedging Activities, and SFAS No. 138, Accounting for Certain Derivative Instruments and Certain Hedging Activities, became applicable to SEK. SEK did not achieve hedge accounting under U.S. GAAP for any of its instruments at the inception of SFAS 133. Although SEK structured a substantial portion of its transactions to qualify for hedge accounting treatment under these rules beginning in July 2002, certain transactions for securities held in the categories trading, available-for-sale, and held-to-maturity. SFAS 133 nullified a consensus contained in an earlier EITF Abstract (Issue No. 96-15) titled "Accountingwhich SEK is economically hedged continue not to qualify for the Effects of Changes in Foreign Currency Exchange Rates on Foreign Currency Denominated Available-for Sale Debt Securities".
As a result of this nullification, ashedge accounting treatment under U.S. GAAP. For these reasons, from January 1, 2001 it is required that for non-derivative hedged available-for-sale securities the currency exchange effects shall affect onlyand going forward there have been and are expected to continue to be significant differences between SEK's net profit and shareholders' funds not net profit. However, becausecalculated under Swedish GAAP as compared to these items calculated under U.S. GAAP. These differences arise primarily from the effectrequirements of currency exchangeU.S. GAAP that (1) changes in the borrowings funding these securities isfair value of derivatives that are not part of a qualifying fair value hedge relationship are required under U.S. GAAP to be reflectedrecognized currently in the income statement this increasedwhile the volatilitycontract which the derivative is economically hedging is carried at amortized cost and (2) changes in currency exchange rates affecting the fair value of foreign-currency instruments in the available-for-sale portfolio that are not eligible for hedge accounting are reported earningsonly as increases or decreases in shareholders' funds, while the largely offsetting changes in the Swedish kronor position of the related funding must be recognized currently in the income statement. Based on its experience and knowledge of the functioning of SEK's economic hedging, management believes Swedish GAAP better reflects the effects of the economic hedge relationships on net income and shareholders' funds.
For a more detailed description of critical accounting policies and estimates under U.S. GAAP, as from 2001.see Note 33 to the Consolidated Financial Statements.
Total Assets
SEK's total assets decreased to Skr 132.5 billion at December 31, 2002 (2001: 149.5)2003, increased to Skr 151.8 billion (2002: 132.5). The main components of the net change in total assets were a decrease in the credit portfolio (approximatelyan increase by Skr 5 billion) and a decrease20.6 billion in the portfolio of interest-bearing securities, (approximatelyand a decrease by Skr 10 billion).4.6 billion in the credit portfolio. Currency exchange effects negatively affected the year-end book valuevalues of the aforementioned portfolios by approximately Skr 5.36.2 billion and Skr 4.0 billion, respectively. Such effects were offset byrespectively, primarily as a
14
corresponding decrease in result of the volumedepreciation of debt.the U.S. dollar. Credits outstanding represented Skr 65.560.9 billion (2001: 70.4)(2002: 65.5) of total assets, while interest-bearing securities represented Skr 59.079.6 billion (2001: 68.5)(2002: 59.0).
In addition to the revenue-generating assets, the balance sheet at year-end 2003 also included Skr 3.4 billion (2001: 4.0)(2002: 3.4) representing accrued and prepaid items, Skr 0.2 billion (2001: 0.1)(2002: 0.2) representing non-financial assets, and Skr 4.57.7 billion (2001: 6.5)(2002: 4.5) representing other assets. The main component of the latter item is the aggregate net value of derivative instruments with positive values (see Note 1 (q) to the Consolidated Financial Statements). The approximate month-end average volume of total assets during the year was Skr 140.0139.3 billion (2001: 160.2)(2002: 140.0).
SEK experienced a lower cost of funding after the change in ownership in June 2003, although there was no change in responsibility for SEK's obligations. This resulted in increased borrowing activities during the latter part of the year and, in turn, the significant growth in interest-bearing securities by year-end. The increase in borrowed funds from such activities has and will be used to fund credits committed though not yet disbursed as well as offers accepted. The volume of credits committed though not yet disbursed increased during the year.
SEK continues to have a high level of liquid assets and a low funding risk. TheAt December 31, 2003, the aggregate volume of funds borrowed and shareholders' funds exceeded the aggregate volume of credits outstanding and credits committed though not yet disbursed at all maturities. See also the graph "Development over Time of SEK's Available Funds" in "—under Item 11, "Quantitative and Qualitative Disclosures About Market Risks—Risk management—Management—Funding and Liquidity Risks". SEK's current policy is to invest its surplus liquidity in instruments with maturities not exceeding three years and ratings of at least AA3 from Moody's and AA- from Standard & Poor's.
Business Volume
In 2003 SEK reached a total volume of new customer-related financial transactions amounting to Skr 17.923.2 billion (2001: 24.9, 2000: 22.3)(2002: 17.9). New direct long-term credit offers acceptedcredits granted totaled Skr 13.419.0 billion (2001: 20.2, 2000: 20.7). The total volume(2002: 13.4) and SEK's share of syndicated customer transactions wastotaled Skr 4.54.2 billion (2001: 4.7, 2000: 1.6)(2002: 4.5). The declineincrease in new business volumeduring the year was achieved in 2002, reflectsspite of the weak international economic downturn that has affected SEK's markets.development.
Of the direct lending to customers, export credits represented Skr 6.1 billion (2002: 0.9) of new credits, infrastructure credits Skr 5.0 billion (2002: 4.0) and other direct lending Skr 7.9 billion (2002: 8.5).
Skr 1.9 billion (2002: 0.2) of these credits was granted under the S-system.
Syndicated customer transactions were partly provided by AB SEK Securities ("SEK Securities"), a wholly-owned subsidiary established in 2002. SEK Securities offers SEKs' customers financing via the capital market, primarily in private placement transactions.
The aggregate amount of credits outstanding and credits committed though not yet disbursed at year-end was Skr 77.374.4 billion (2001: 86.8)(2002: 77.3), of which Skr 65.560.9 billion (2001: 70.4)(2002: 65.5) represented credits outstanding. Of the aggregate amount of Skr 77.3 billion (2001: 86.8) of credits outstanding and credits committed at December 31, 2003, Skr 21.617.8 billion (2001: 27.5)(2002: 21.6) was related to the S-system, of which Skr 11.57.7 billion (2001: 15.5)(2002: 11.5) represented credits outstanding. The decrease in credits outstanding mainly reflects currency exchange effects due to the weakening of the U.S. dollar during the year. In addition, repayments of credits (including currency exchange effects) exceeded disbursements of credits by Skr 6.7 billion during 2002. Simultaneously,
At the same time, the aggregate amount of outstanding offers for new credits increasedat year-end decreased to Skr 59.730.7 billion (2001: 53.9)(2002: 59.7). The decrease was due to the fact that a few large offers expired during 2003.
Volume Development, Lending
| | Total | Of which S-system | Total | Of which S-system | ||||||||||||||||||||
|---|---|---|---|---|---|---|---|---|---|---|---|---|---|---|---|---|---|---|---|---|---|---|---|---|
| | 2002 | | Total | | | | | Total | Of which | |||||||||||||||
| | | CIRR- credits 2002 | Concessionary credits 2002 | 2003 | 2002 | 2003 | 2002 | CIRR-credits 2003 | Concessionary credits 2003 | |||||||||||||||
| | 2001 | 2002 | 2001 | (Skr million) | ||||||||||||||||||||
| | (Skr million) | |||||||||||||||||||||||
| Offers of long-term credits accepted(A) | 13,365 | 20,245 | 172 | 743 | — | 172 | ||||||||||||||||||
| Offers of direct long-term credits accepted(A) | 18,960 | 13,365 | 1,939 | 172 | 1,892 | 47 | ||||||||||||||||||
| Syndicated customer transactions | 4,227 | 4,558 | — | — | — | — | ||||||||||||||||||
| Total customer-related financial transactions | 23,238 | 17,923 | 1,939 | 172 | 1,892 | 47 | ||||||||||||||||||
| Undisbursed credits at year-end(A) | 11,849 | 16,444 | 10,124 | 12,088 | 9,871 | 253 | 13,494 | 11,849 | 10,025 | 10,124 | 9,957 | 67 | ||||||||||||
| Credits outstanding at year-end (old format)(A) | 65,470 | 70,361 | 11,481 | 15,454 | 7,491 | 3,990 | 60,870 | 65,470 | 7,730 | 11,481 | 5,624 | 2,106 | ||||||||||||
| Credits outstanding at year-end (new format)(A) | 39,033 | 45,511 | 11,502 | 15,482 | 7,512 | 3,990 | 40,772 | 39,033 | 8,264 | 11,502 | 6,158 | 2,106 | ||||||||||||
15
During the year, the volume of new long-term borrowings, i.e., borrowings with original maturities exceeding one year, reached the equivalent of Skr 44.9 billion (2001: 38.0). Asia, including Japan and Europe have been the most important markets.
A three-year USD 500 million benchmark issue, targeted mainly towards Asian and European institutional investors as well as European retail investors, has been executed. The issue has been increased, resulting in an outstanding amount of USD 850 million.
TheSEK aims to maintain its asset quality of SEK's assets remains high.at a high level. The table "Total Counterparty"Counterparty Risk Exposures" in "—Item 11.a, "Quantitative and Qualitative Disclosures About Market Risk—Risk management—Management—Credit or Counterparty Risk Exposures"Risks" shows the distribution of risk exposures to the various categories of counterparties of SEK's on-balance sheet assets and off-balance sheet items. TheOf the total risk exposure against OECD States amounted to 2718 percent (2001: 38) of total exposures. Further, of the total exposures, 56 percent (2001: 50)(2002: 27) was against highly rated OECD states; 6 percent (2002: 4) was against local and regional authorities; 65 percent (2002: 56) was against banks, mortgage institutions and other financial institutions while 17and 11 percent (2001: 12)(2002: 13) was against corporations.corporations and others.
SEK is a party to financial instruments with off-balance sheet exposures in its ordinary course of business. The amounts of such exposures are shown in the table "Capital Base and Required Capital" inunder "—Liquidity, Capital Resources and Capital Resources—Funding—Capital Adequacy". These instruments include interest-rate related, currency related and other agreements that SEK uses for the purpose of hedging or eliminating mainly interest rate and currency exchange rate exposures. The accounting policies applied to such instruments are described in Note 1 (q) to the Consolidated Financial Statements. It can be noted that certainCertain values related to derivativederivatives and other financial instruments, traditionally denoted "off-balance sheet instruments", are accounted for as on-balance sheet items included in the items "Other assets" and "Other liabilities".
SEK has maintained, and expects to continueintends to maintain, a conservative policy as regards counterparty exposures arising from its credit portfolio and from other assets as well as from derivative instruments and other financial instruments traditionally accounted for as off-balance sheet instruments.
SEK excluding the S-system
Operating profit in 2003 was Skr 595.3 million (2002: 664.4, 2001:729.0). The operatingdecrease in profit was due mainly to the impact of the change in ownership in, which resulted in a reduction in shareholders' funds and the issuance of new hybrid capital (see "—Liquidity, Capital Resources and Funding—Funding"), as well as to increases in administrative expenses and depreciation of non-financial assets. Costs related to the change in ownership negatively affected net interest revenues by approximately Skr 664.4 million (2001: 729.0, 2000: 829.9). The return on equity was 19.5 percent (2001: 22.5, 2000: 22.0) before taxes, and 14.0 percent (2001: 16.2, 2000: 15.9) after taxes, respectively.48 million.
Net interest earnings weretotaled Skr 757.5 million (2002: 798.2, million (2001: 830.7, 2000: 895.5)2001: 830.7). Net interest earnings include net margins from debt-financed assets, on the one hand, and revenues from the investment portfolio (i.e., the long-term fixed-rate assets financed byrepresenting the investment of SEK's equity), on the other hand. For the financial year 2002,2003, the contribution to net interest earnings from debt-financed assets decreased towas Skr 447.2 million (2002: 465.9, million (2001: 489.1, 2000: 471.6)2001: 489.1). The underlying month-end average volume of such debt-financed assets was Skr 114.5 billion (2002: 111.7, billion (2001: 126.9, 2000: 129.9)2001: 126.9), with an increased average margin of 0.39 percent p.a. (2002: 0.42, percent (2001: 0.39, 2000: 0.36)2001: 0.39). SEK has experienced increased margins on new credits, which have been partly offset by increased margins on borrowed funds.The decline in average margin in 2003 was due mainly to the interest cost of the hybrid capital raised in connection with the change in ownership. The amount of hybrid capital outstanding at year-end was USD 150 million higher than at December 31, 2002. This additional amount, raised in 2003, had carried a negative margin during 2003, before being economically hedged during the latter part of 2003 and beginning of 2004. The increase in average margin was due also toin 2002 reflected an increase in margins on new credits that year as well as a reduction in the average proportion of debt-financed assets represented bycomprising the liquidity portfolio, where the average margin is less than that of the credit portfolio. The average volumemargin remained at 0.42 percent p.a. for the first six months of 2003 prior to the liquidity portfolio, whose average margin is lower than that of the credit portfolio, decreased significantly. The declinechange in debt financed assets at December 31, 2002 from the prior year reflected the international downturn that has affected SEK's business volume during the year.ownership.
The contribution to net interest earnings from the investment portfolio was Skr 310.3 million (2002: 332.3, million (2001: 341.6, 2000: 423.9)2001: 341.6). The decreasesdecrease in 2003 was due mainly to the last two years reflectdividend and the resulting decrease in equity for the second half of the year; the decrease in 2002 reflected the reinvestment of partspart of
16
SEK's the investment portfolio at lower interest rates. The decrease in 2001 was also attributable to the reduction in SEK's capital in 2000.
Commissions earned were Skr 13.0 million in 2003, compared to commissions earned of Skr 18.5 million (2001:in 2002 and Skr 12.8 2000: 1.5).million in 2001. The improvementdecline in commissions earned between 2002 and 2003 was due mainly to lower demand for commission-generating business due to weak demand in many markets. The increase in commissions earned between 2001 and 2002 was due to increased activities relatedSEK's ambition to capital market products that produced revenues ofwiden its income base and earn commissions in other areas than traditional lending.
Operating profit in 2003 includes Skr 4.529.7 million in 2002 (2001: —, 2000: —). In addition, in 2002 SEK earned Skr 8.8 million (2001: 10.1, 2000: —) from other commission earned, mainly commissions related to lending transactions. After commissions incurred, primarily the Skr 6 million paid by SEK each year for maintaining the guarantee fund (see "—Liquidity and Capital Resources—Capital Adequacy"), net commission revenues in 2002 were Skr 12.0 million (2001:5.1, 2000:(5.1))
In addition, Skr(2002: 33.0, million (2001: 36.7, 2000:2001: 36.7) representing remuneration from the S-system, based mainly based on outstanding volumes of credits. The outstanding volume of S-system credits has been includeddecreased by Skr 3.8 billion in the operating profit.2003 and Skr 4.0 billion in 2002.
Administrative expenses in 2003 increased to Skr 189.5 million (2002: 166.4, 2001: 150.7). The increase each year was related to higher personnel expenses. The increase is related to investments made in order to strengthen and broaden business activities in respond to market needs. The total number of employees at year-end 2003 was 140 (2002: 123, 2001: 107). The average number of employees increased to 124 in 2003 (2002: 113, 2001: 98).
Operating profit in 2003 also benefited from a net gain from financial transactions of Skr 11.7 million, (2001: 150.7, 2000: 125.7). Of the increasescompared to a net loss of Skr 0.7 million in 2002 and 2001,a net gain of Skr 17.26.0 million in 2001.
Depreciation of non-financial assets increased to Skr 15.5 million in 2003 (2002: 7.5, 2001: 6.3). The increase reflected depreciation of intangible and 16.8 million, respectively, weretangible assets placed in service in 2003 as the first phase implementation of an IT-project begun in 2002 to replace SEK's business system. Expenditures related to increases in salaries, pensions and social insurance expenses, due mainly to the hiring of additional employees to support the ongoing widening of the business activities. Furthermore, Skr 3.6 million (2001: 6.9, 2000: —) of the net increase was related to a IT project, started during the year 2001, aiming at replacing SEK's current business system. The total costs, excluding personnel expenses, for the project during the year were Skr 10.5 million (2001: 6.9, 2000: —). Additionally, expenditures for the projectIT-project amounting to Skr 43.437.0 million have been capitalized(2002: 43.4) were booked as investments, of which Skr 40.136.9 million are computer software(2002: 40.1) represent intangible assets and Skr 3.30.1 million are computer hardware. In 2002 administrative expenses did not include any(2002: 3.3) represent tangible assets.
The result in 2003 was affected by a Skr 1.4 million (2002: 0.0, 2001:10.2) provision under SEK's general incentive system for its staff (2001: 10.2, 2000: 5.8).staff. In addition to thesuch general incentive system, also individual, performance-related remuneration agreements also exist.
Therefore, the declines in operating profit in 2002 and 2001 from the prior yearNo credit losses were due primarily to the reductions in net interest earnings and the increases in administrative expenses in each of those years.incurred.
The netNet profit for the year2003 was Skr 427.5 million (2002: 479.7, million (2001: 540.7, 2000: 601.8)2001: 540.7), after charges for taxes amounting to Skr 167.8 million (2002: 184.7, million (2001: 188.3, 2000: 228.1)2001: 188.3). The increase in the effective tax rate for 2003 was 28.2 percent (2002: 27.8, 2001: 25.8). The effective rates in 2003 and 2002 corresponded more closely to 27.8 percent (2001: 25.8, 2000: 27.5) mainly reflects thatthe nominal rate of 28% than in 2001 when the Company benefited from more tax-exempt income, i.e., a permanent difference, was lowerfewer non-deductible costs and changes in 2002 than in 2001. Variations in permanent differences also explain most of the change in effective tax rate in 2001 compared to 2000.deferred taxation.
The net profit for 2002,2003, reconciled to U.S. GAAP, reached Skr 2,613.4643.2 million, compared to a net profit of Skr 2,613.4 million in 2002 and a net loss of Skr 312.3 million in 2001 and a net profit of Skr 608.7 million in 2000.2001. The aggregate U.S. GAAP adjustments, net of the related tax effect, produced a positive adjustment of Skr 215.7 in 2003, compared to a positive adjustment of Skr 2,133.7 million in 2002 compared toand a negative adjustment of Skr 853.0 million in 2001 and a positive adjustment of Skr 6.9 million in 2000.2001.
These substantially higher adjustments in 2002 and 2001during the three year period presented above, when compared to prior periods, were primarily the result of the application, beginning in 2001, of Statement of Financial Accounting Standard 133 (SFAS 133), which has increased the volatility of SEK's U.S. GAAP net income and shareholders' equity. SFAS 133 requires, among other things, that changes in the fair value of derivatives that are not part of a qualifying fair value hedge relationship must be recognized currently in the income statement. PositiveNegative adjustments to U.S. GAAP income for derivatives and hedging activities, before related tax effects, declinedamounted to Skr 210.3177.8 million in 2003, compared to positive adjustments in 2002 from Skr 1,242.9 million in(Skr 359.8 million) and 2001 in part because(Skr 1,392.4 million). Because a substantial portion of the Company's assets, liabilities and derivatives were structured to qualify for hedge accounting under SFAS 133 from July 1, 2002.2002, after that date there is a substantial reduction in volatility in U.S. GAAP income. This effect is observed in the latter part of 2002 and the full year 2003. A main component of the remaining volatility in income for derivatives and hedging activities during 2002 and 2003 is related to derivatives in the portfolio of held-to-maturity securities for which hedge accounting is not permitted under U.S. GAAP. Another main component of the remaining volatility is related to derivatives that are used to hedge perpetual subordinated debt but which do not yet qualify for hedge accounting. It should be noted that SEK is economically hedged for transactions on which hedge accounting is applicable under Swedish GAAP but not under U.S. GAAP. For this reason, management believes Swedish GAAP better reflects the effects of the economic hedge relationships on net income and shareholders' funds related to transactions that qualify for hedge accounting under Swedish GAAP but not under U.S. GAAP.
Related to this development is the impact of adjustments under U.S. GAAP for changes in currency exchange rates affecting the fair value of foreign currency denominated instruments in SEK's
17
available-for-sale portfolio that are not eligible for hedge accounting under SFAS 133 and the carrying value of their related funding. The effect of changes in exchange rates on the instruments themselves are reported only as increases or decreases in shareholders' equity, but the largely offsetting changes in the Swedish kronakronor position of the related funding must be recognized currently in the income statement. As a result, during 2001 when the Swedish kronakronor depreciated against certain currencies in which these assets were match funded, the reconciliation of SEK's income statementnet profit to U.S. GAAP led to a negative adjustment for foreign exchange differences, before related tax effects, of Skr 2,458.9 million.million (with a corresponding positive adjustment of Skr 2,458.9 million to other comprehensive income, which is a part of equity). This adjustment was the reason the total adjustments in the 2001 reconciliation to U.S. GAAP income statement reached a negative Skr 853.0 million amount. Conversely, in 2002 when the Swedish kronakronor appreciated against these funding currencies, SEK reported a positive adjustment to net profit for foreign exchange differences, before related tax effects, of Skr 2,695.9 million.million (with a corresponding negative adjustment of Skr 2,695.9 million to other comprehensive income). As a result of the continuing appreciation of the Swedish kronor against funding currencies during 2003, SEK reported another positive adjustment to net profit for foreign exchange differences, before related tax effects, of Skr 720.4 million (with a corresponding negative adjustment of Skr 720.4 million to other comprehensive income); however, because a substantial portion of the Company's assets, liabilities and derivatives had been structured to qualify for hedge accounting under SFAS 133 from July 1, 2002, the amount of the adjustments was reduced. It should be noted that SEK is economically hedged regardingagainst the foreign currency exchange revaluation effects related toof the revaluation of balance sheet components. For this reason, management believes Swedish GAAP better reflects the effects of the economic hedge relationships on net income related to foreign currency denominated instruments in the available-for-sale portfolio.
The reconciliation of SEK's net income to U.S. GAAP was also positivelynegatively affected in each of the past three years2003 by gainsa loss from the repurchase of its own debt, which under U.S. GAAP is recognized immediately in the income statement and amounted to Skr 55.7 million in 2003. These were corresponding positive adjustments amounting to Skr 51.4 million in 2002 (2001:and Skr 56.9 and 2000: 22.6).million in 2001.
See Note 33 to the Consolidated Financial Statements.
The S-system
CIRR-credits, which representCIRR credits, one of the two types of credits in the S-system, contributed to the S-system results with a surplus of Skr 112.9120.0 million (2001: 168.8, 2000: 93.1)in 2003 (2002: 112.7, 2001: 168.4).
Net costs related to concessionary credits, which represent the othersecond type of creditscredit in the S-system, were Skr 209.8 million in 2003 (2002: 337.0, million (2001: 449.0, 2000: 471.7)2001: 448.6).
The S-system paid a net compensation to SEK amounting to Skr 29.7 million in 2003 (2002: 33.0, million (2001: 36.7, 2000:2001: 36.7), being compensation paid to SEK for carrying the S-system credits and the related credit risks inon SEK's balance sheets. The lower amountState also reimbursed SEK an additional Skr 60.1 million in 2002 was due2003 (2002: 191.3, 2001: 243.5) to reduced assets level.
Thecover negative net deficit of both types of credits in the S-system is fully reimbursed by the State. The distribution of results is shown in the table on the following page.interest and foreign exchange expense.
The net deficit of the S-system, taking into account the net result of both types of credit, is fully reimbursed by the State. The distribution of results is shown in the in the table below.
Results in the S-System by Type of Credit
| | CIRR-credits | Concessionary credits | Net result for S-system | |||||||||||||||
|---|---|---|---|---|---|---|---|---|---|---|---|---|---|---|---|---|---|---|
| | 2002 | 2001 | 2000 | 2002 | 2001 | 2000 | 2002 | 2001 | 2000 | |||||||||
| | (Skr million) | |||||||||||||||||
| Net interest earnings | +131 | +203 | +121 | -325 | -433 | -455 | -194 | -231 | -334 | |||||||||
| Remuneration to SEK | -21 | -21 | -20 | -12 | -16 | -17 | -33 | -37 | -37 | |||||||||
| Foreign exchange differences | +3 | -13 | -8 | — | — | — | 3 | -13 | -8 | |||||||||
| Total | +113 | +169 | +93 | -337 | -449 | -472 | -224 | -280 | -379 | |||||||||
Every year during the period from the year after the implementation of the S-system (1978) until 1989, the result of the CIRR-based export credits under such system was negative. The aggregateSince 1990, however, the result has been positive result forin the period 1990 through 2002 was approximately Skr 1.7 billion, with an average year-end volume of credits outstanding amounting to Skr 7.8 billion.aggregate.
18
| | | | | | | | Net result for S-system | ||||||||||||
|---|---|---|---|---|---|---|---|---|---|---|---|---|---|---|---|---|---|---|---|
| | CIRR credits | Concessionary credits | |||||||||||||||||
| Results in the S-System by Type of Credit | |||||||||||||||||||
| 2003 | 2002 | 2001 | 2003 | 2002 | 2001 | 2003 | 2002 | 2001 | |||||||||||
| | (Skr million) | ||||||||||||||||||
| Interest revenues/(expenses) | 134.3 | 131.1 | 201.8 | (201.8 | ) | (325.0 | ) | (432.4 | ) | (67.5 | ) | (193.9 | ) | (230.6 | ) | ||||
| Remuneration to SEK | (21.7 | ) | (21.0 | ) | (20.5 | ) | (8.0 | ) | (12.0 | ) | (16.2 | ) | (29.7 | ) | (33.0 | ) | (36.7 | ) | |
| Foreign exchange differences | 7.4 | 2.6 | (12.9 | ) | — | — | — | 7.4 | 2.6 | (12.9 | ) | ||||||||
| Total | 120.0 | 112.7 | 168.4 | (209.8 | ) | (337.0 | ) | (448.6 | ) | (89.8 | ) | (224.3 | ) | (280.2 | ) | ||||
Liquidity
In accordance with SEK's funding and liquidity policies, at December 31, 2002,2003 the aggregate volume of funds borrowed and shareholders' funds exceeded the aggregate volume of credits outstanding and credits committed though not yet disbursed at all maturities. See also the graph "Development over Time of SEK's Available Funds" shown below in "—Item 11, "Quantitative and Qualitative Disclosures About Market Risk—Risk management—Management—Funding and Liquidity Risk".
SEK endeavors to take advantage of borrowing opportunities that arise and, where SEK deems it advantageous, to pre-fund its credits. Its interest-bearing securities, other than credits, were Skr 68.6 billion at December 31, 2003 (2002:55.5), an increase of 23.7% compared to 2002. The increase in these investment securities reflected SEK's increased borrowing activities in the second half of the year in response to the lower funding costs experienced after the change in ownership.
SEK's policy is to maintain a high degree of liquidity in its portfolio of interest-bearing securities. At December 31, 2002,2003, the book value of its interest-bearing securities with maturities of one year or less was Skr 27.030.7 billion (2001: 40.7)(2002: 27.0). In addition, at that date the aggregate of SEK's credits and interest-bearing securities with maturities of one year or less exceeded its total senior debt with such maturities by Skr 23.430.4 billion (2001: 15.1)(2002: 23.4).
The following tables set forth as of December 31, 2003 the maturity profile of SEK's contractual cash obligations.
| | At December 31, 2003 Payments Due by Period | ||||||||||
|---|---|---|---|---|---|---|---|---|---|---|---|
| Contractual Cash Obligations | Total | Less than 1 year | 1-3 years | 4-5 years | After 5 years | ||||||
| | (Skr million) | ||||||||||
| Senior debt | 132,564.9 | 15,193.7 | 49,577.9 | 28,470.3 | 39,323.0 | ||||||
| Subordinated debt | 3,001.0 | — | — | — | 3,001.0 | (1) | |||||
| Capital lease obligations | — | — | — | — | — | ||||||
| Operating leases | — | — | — | — | — | ||||||
| Purchase obligations(2) | — | — | — | — | — | ||||||
| Other long-term obligations | 17.9 | 0.7 | 2.4 | 1.4 | 13.4 | ||||||
| Total contractual cash obligations | 135,583.8 | 15,194.4 | 49,580.3 | 28,471.7 | 42,337.4 | ||||||
See also "—Funding" for additional information on the maturities of SEK's debt.
The following table sets forth the maturity profile of credits outstanding as of December 31, 2003.
| | At December 31, 2003 Amount of Credits Outstanding Expiration Per Period | |||||||||
|---|---|---|---|---|---|---|---|---|---|---|
| Credits outstanding | Total Amounts Committed | Less than 1 year | 1-3 years | 4-5 years | After 5 years | |||||
| | (Skr million) | |||||||||
| Credits outstanding | 60,870.5 | 14,324.8 | 22,808.4 | 16,088.8 | 7,648.5 | |||||
The following table sets forth the maturity profile of SEK's commercial commitments as of December 31, 2003, all of which represented committed undisbursed credits:
| | At December 31, 2003 Amount of Commitment Expiration Per Period | |||||||||
|---|---|---|---|---|---|---|---|---|---|---|
| Commercial Commitments | Total Amounts Committed | Less than 1 year | 1-3 years | 4-5 years | After 5 years | |||||
| | (Skr million) | |||||||||
| Commercial commitments | 14,358.3 | 4,687.7 | 4,328.9 | 4,201.4 | 1,140.3 | |||||
For further information about funding and liquidity risk see Item 11.a "Quantitative and Qualitative Disclosures About Market Risk—Risk Management—Funding and Liquidity Risk". The reductionfigures above in short-termthe table are in the diagram "Development over Time of SEK's Available Funds" in Item 11a.
Funding
The Company funds its lending primarily through public and private offerings of debt securities in the international capital and money markets. In many cases SEK has been willing to provide "tailor-made" structures responding to the needs of the investors. SEK also maintains a number of borrowing programs that allow it to respond quickly to borrowing opportunities or the need to fund a credit quickly.
During the year ended December 31, 2003, total new borrowings with maturities exceeding one year were equivalent to approximately Skr 62.0 billion, compared with Skr 44.9 billion and Skr 38.0 billion for the years ended December 31, 2002 and 2001, respectively. New borrowings in 2003 comprised 440 transactions (2002: 281), primarily structured private placements in the Japanese, European and U.S. markets. SEK also launched a USD 1 billion global offering in November 2003, issued simultaneously in Europe, Asia and the United States. Two series of hybrid capital offerings added USD 150 million to SEK's capital base in addition to refinancing USD 200 million of existing hybrid capital at lower interest bearing securitiesrates. For a description of the Company's outstanding debt, see Notes 22 and 26 to the Consolidated Financial Statements.
The outstanding volume of debt with original maturities of one year or less decreased in 2003. At December 31, 2003 outstanding debt with remaining maturities of one year or less was Skr 15,193.7 million, compared with Skr 15,591.1 million at December 31, 2002 from2002. However, the prior year reflected a lower business activity during the year related to the international downturn that has affected the developmentaverage maturity of SEK's volume during the year.senior debt at December 31, 2003, had decreased to 7.29 from 8.14 years at December 31, 2002. See "Consolidated Statements of Cash Flows" in the Consolidated Financial Statements and Note 29 to the Consolidated Financial Statements.
SEK has experienced improved rating and lower cost of funding after the change in ownership. Moody's has upgraded SEK's senior debt rating to Aa1 (from Aa2) and Standard & Poor's has changed its outlook for SEK's senior debt rating (AA+) to stable (from negative). The following table sets forth assuccess of December 31, 2002 the maturity profile of contractual cash obligations (all of which comprised long-term debt):
Contractual Obligations
| | Year Ended December 31, 2002 Payments Due by Period | ||||||||||
|---|---|---|---|---|---|---|---|---|---|---|---|
| Contractual Obligations | Total | Less than 1 year | 1-5 years | 5-10 years | After 10 years | ||||||
| | (In millions of Skr) | ||||||||||
| Senior Debt | 112,613.6 | 15,591,1 | 57,792.6 | 9,924.0 | 29,305.9 | ||||||
| Subordinated Debt | 2,224.6 | — | — | 459.6 | (1) | 1,765.0 | (2) | ||||
| Capital Lease Obligations | — | — | — | — | — | ||||||
| Operating Leases | — | — | — | — | — | ||||||
| Unconditional Purchase Obligations | — | — | — | — | — | ||||||
| Other Long-Term Obligations | — | — | — | — | — | ||||||
| Total Contractual Cash Obligations | 114,838.2 | 15,591,1 | 57,792.6 | 10,383.6 | 31,070.9 | ||||||
See also "Informationa significant degree on the Company—Borrowing operations" for additional information on the maturitiesmaintenance of SEK's debt.
19
The following table sets forth the maturity profile of other commercial commitments, i.e. commitments regarding committed undisbursed credits as of December 31, 2002:
Other Commercial Commitments
| | Year Ended December 31, 2002 Amount of Commitment Expiration Per Period | |||||||||
|---|---|---|---|---|---|---|---|---|---|---|
| Contractual Obligations | Total Amounts Committed | Less than 1 year | 1-3 years | 3-5 years | After 5 years | |||||
| | (In millions of Skr) | |||||||||
| Committed Undisbursed Credits | 11,848.6 | 3,075.7 | 3,234.2 | 3,623.1 | 1,915.6 | |||||
| Standby Letters of Credit | — | — | — | — | — | |||||
| Guarantees | — | — | — | — | — | |||||
| Standby Repurchase Obligations | — | — | — | — | — | |||||
| Other Commercial Commitments | — | — | — | — | — | |||||
| Total Commercial Commitments | 11,848.6 | 3,075.7 | 3,234.2 | 3,623.1 | 1,915.6 | |||||
It should be noted that the figures above in the table "Contractual Obligations" and "Other Commercial Commitments" are represented in the diagram "Development over Time of SEK's Available Funds. For further information about funding and liquidity risk see "—Risk Management—Funding and Liquidity Risk".strong debt ratings.
Capital Adequacy
The capital base as well as the minimum capital that SEK is required to maintain are determined in accordance with the capital adequacy requirements under Swedish law that are applicable to all credit institutions and securities companies supervised by the Swedish Financial Supervisory Authority.
SEK has a capital adequacy ratio that is well above the minimum required by law. At December 31, 2002,2003, the regulatory total capital adequacy ratio was 17.016.6 percent (2001: 18.5)(2002: 17.0), which is more than two times as large as required under Swedish law. Of the regulatory total ratio, the Tier-1 ratio represented 11.99.5 percent (2001:at December 31, 2003 (2002: 11.9). SEK also computescalculates adjusted capital adequacy ratios calculated with inclusion in the Tier-1 capital base of SEK's guarantee fund capital of Skr 600 million in addition to the regulatory capital base. The adjusted total capital adequacy ratio was 18.818.3 percent (2001: 20.4)at December 31, 2003 (2002: 18.8), of which 13.711.1 percent (2001: 13.8)(2002: 13.7) represented adjusted Tier-1.
SEK's regulatory capital base at December 31, 2002 was Skr 5,671 million (2001: 5,889), of which the Tier-1 related amount was Skr 3,963 million (2001: 3,778). The adjusted capital base was Skr 6,271 million (2001: 6,489), of which the Tier-1 related amount was Skr 4,563 million (2001: 4,378). Risk-weighted claims at year-end amounted to Skr 33,426 million (2001: 31,812). Accordingly, the minimum capital required to satisfy the statutory 8 percent standard was Skr 2,674 million (2001: 2,545).
See also the table "Capital Base and Required Capital" on the following page.
The guarantee fund permits SEK to demand additional capital of up to Skr 600 million from the Swedish State and ABB Structured Finance Investment AB, eachif SEK finds it necessary in order to be able to fulfill its obligations.
SEK's regulatory capital base was Skr 5,953 million at December 31, 2003 (2002: 5,671), of which is obligated to contribute upthe Tier-1 related amount was Skr 3,395 million (2002: 3,963). The adjusted capital base was Skr 6,553 million (2002: 6,271), of which the Tier-1 related amount was Skr 3,995 million (2002: 4,563). Risk-weighted claims at year-end amounted to Skr 300 million.35,854 million (2002: 33,426). Accordingly, the minimum capital required to satisfy the statutory 8 percent standard was Skr 2,868 million at December 31, 2003 (2002: 2,674).
The guarantee fundreductions during 2003 in SEK's Tier 1 ratio and capital is included only when calculatingbase on both a regulatory and adjusted basis reflect the adjusted capital adequacy ratios, notdividend paid in 2003, which led to a reduction of Skr 813 million in shareholders' funds at December 31, 2003 compared to the prior year-end. SEK augmented its regulatory capital adequacy ratios. Information concerning ABB's parent company, ABB Ltd, and its subsidiaries appears in filingsbase by ABB Ltd underincreasing the Securities Exchange Actamount of 1934, copieshybrid capital, only some of which can be reviewed at the public reference facilities of the Securities and Exchange Commission in Washington, D.C. and at certain of its regional offices and are also available through the New York Stock Exchange, Inc.qualified as Tier-1 capital.
Capital The table "Capital Base and Required Capital
According to Capital Adequacy Requirements under Swedish Law, which are in Compliance with International Guidelines. However,Capital" on the adjusted capital adequacy ratios shown below, are calculated with inclusion in the Tier-1 capital base ofnext page includes additional information on SEK's guarantee fund capital of Skr 600 million in addition to the regulatory approved capital base.capital.
| Capital Base and Required Capital According to Capital Adequacy Requirements under Swedish law, which are in compliance with international guidelines. The adjusted capital adequacy ratios shown below are calculated with inclusion in the Tier-1 capital base of SEK's guarantee capital of Skr 600 million in addition to the regulatory approved capital base. (Skr million) | ||||||||||||||||||||||||
|---|---|---|---|---|---|---|---|---|---|---|---|---|---|---|---|---|---|---|---|---|---|---|---|---|
| | Consolidated Group | Parent Company | ||||||||||||||||||||||
| | December 31, 2003 | December 31, 2002 | December 31, 2003 | December 31, 2002 | ||||||||||||||||||||
| I. Capital requirement | Claims | Weighted claims | Required capital | Claims | Weighted claims | Required capital | Claims | Weighted claims | Required capital | Claims | Weighted claims | Required capital | ||||||||||||
| On-balance sheet items. | 151,800 | 31,682 | 2,534 | 132,538 | 30,447 | 2,436 | 151,869 | 31,752 | 2,540 | 132,590 | 30,510 | 2,441 | ||||||||||||
| Off-balance sheet items | 21,171 | 4,172 | 334 | 16,231 | 2,979 | 238 | 21,171 | 4,172 | 334 | 16,231 | 2,979 | 238 | ||||||||||||
| Other exposures | n.a. | 0 | 0 | n.a. | 0 | 0 | n.a. | 0 | 0 | n.a. | 0 | 0 | ||||||||||||
| Total | 172,971 | 35,854 | 2,868 | 148,769 | 33,426 | 2,674 | 173,040 | 35,924 | 2,874 | 148,821 | 33,489 | 2,679 | ||||||||||||
| Breakdown by category: | ||||||||||||||||||||||||
| A. Riskweight 0% | 49,546 | — | — | 51,078 | — | — | 49,546 | — | — | 51,067 | — | — | ||||||||||||
| B. Riskweight 20% | 96,053 | 19,211 | 1,537 | 70,346 | 14,069 | 1,126 | 96,051 | 19,210 | 1,537 | 70,346 | 14,069 | 1,126 | ||||||||||||
| C. Riskweight 50% | 2,284 | 1,142 | 91 | 2,481 | 1,241 | 99 | 2,284 | 1,142 | 91 | 2,481 | 1,241 | 99 | ||||||||||||
| D. Riskweight 100% | 14,203 | 14,203 | 1,136 | 17,031 | 17,031 | 1,362 | 14,274 | 14,274 | 1,142 | 17,094 | 17,094 | 1,367 | ||||||||||||
| E. Market exposures | 10,885 | 1,298 | 104 | 7,833 | 1,085 | 87 | 10,885 | 1,298 | 104 | 7,833 | 1,085 | 87 | ||||||||||||
| Total | 172,971 | 35,854 | 2,868 | 148,769 | 33,426 | 2,674 | 173,040 | 35,924 | 2,874 | 148,821 | 33,489 | 2,679 | ||||||||||||
| | Consolidated Group | Parent Company | |||||||
|---|---|---|---|---|---|---|---|---|---|
| II. Capital base(A) | |||||||||
| 12/2003 | 12/2002 | 12/2003 | 12/2002 | ||||||
| Tier-1 capital | 3,395 | 3,963 | 3,423 | 3,987 | |||||
| Tier-2 capital | 2,558 | 1,708 | 2,554 | 1,705 | |||||
| Of which: | |||||||||
| Upper Tier-2 | 2,103 | 1,248 | 2,100 | 1,245 | |||||
| Lower Tier-2 | 455 | 460 | 454 | 460 | |||||
| Total | 5,953 | 5,671 | 5,977 | 5,692 | |||||
Adjusted Tier-1 capital | 3,995 | 4,563 | 4,023 | 4,587 | |||||
I. Capital requirement
| | Consolidated Group | Parent Company | ||||||||||||||||||||||
|---|---|---|---|---|---|---|---|---|---|---|---|---|---|---|---|---|---|---|---|---|---|---|---|---|
| | December 31, 2002 | December 31, 2001 | December 31, 2002 | December 31, 2001 | ||||||||||||||||||||
| | Claims | Weighted claims | Required capital | Claims | Weighted claims | Required capital | Claims | Weighted claims | Required capital | Claims | Weighted claims | Required capital | ||||||||||||
| On-balance sheet items | 132,538 | 30,447 | 2,436 | 149,541 | 28,627 | 2,290 | 132,590 | 30,510 | 2,441 | 149,563 | 28,649 | 2,292 | ||||||||||||
| Off-balance sheet items | 16,231 | 2,979 | 238 | 20,134 | 3,184 | 255 | 16,231 | 2,979 | 238 | 20,134 | 3,184 | 255 | ||||||||||||
| Other exposures | n.a. | 0 | 0 | n.a. | 1 | 0 | n.a. | 0 | 0 | n.a. | 1 | 0 | ||||||||||||
| Total | 148,769 | 33,426 | 2,674 | 169,675 | 31,812 | 2,545 | 148,821 | 33,489 | 2,679 | 169,697 | 31,834 | 2,547 | ||||||||||||
| Breakdown by category: | ||||||||||||||||||||||||
| A. Riskweight 0% | 51,078 | — | — | 73,077 | — | — | 51,067 | — | — | 73,077 | — | — | ||||||||||||
| B. Riskweight 20% | 70,346 | 14,069 | 1,126 | 74,465 | 14,893 | 1,191 | 70,346 | 14,069 | 1,126 | 74,465 | 14,893 | 1,191 | ||||||||||||
| C. Riskweight 50% | 2,481 | 1,241 | 99 | 2,147 | 1,074 | 86 | 2,481 | 1,241 | 99 | 2,147 | 1,074 | 86 | ||||||||||||
| D. Riskweight 100% | 17,031 | 17,031 | 1,362 | 15,065 | 15,065 | 1,205 | 17,094 | 17,094 | 1,367 | 15,087 | 15,087 | 1,207 | ||||||||||||
| E. Market exposures | 7,833 | 1,085 | 87 | 4,921 | 780 | 63 | 7,833 | 1,085 | 87 | 4,921 | 780 | 63 | ||||||||||||
| Total | 148,769 | 33,426 | 2,674 | 169,675 | 31,812 | 2,545 | 148,821 | 33,489 | 2,679 | 169,697 | 31,834 | 2,547 | ||||||||||||
II. Capital base (A)
| | Consolidated Group | Parent Company | |||||||
|---|---|---|---|---|---|---|---|---|---|
| | 12/2002 | 12/2001 | 12/2002 | 12/2001 | |||||
| Tier-1 capital | 3,963 | 3,778 | 3,987 | 3,801 | |||||
| Tier-2 capital | 1,708 | 2,111 | 1,705 | 2,109 | |||||
| Of which: | |||||||||
| Upper Tier-2 | 1,248 | 1,640 | 1,245 | 1,638 | |||||
| Lower Tier-2 | 460 | 471 | 460 | 471 | |||||
| Total | 5,671 | 5,889 | 5,692 | 5,910 | |||||
| Adjusted Tier-1 capital | 4,563 | 4,378 | 4,587 | 4,401 | |||||
| Adjusted Total | 6,271 | 6,489 | 6,292 | 6,510 | |||||
III. Capital Adequacy Ratio
| | Consolidated Group | Parent Company | |||||||||
|---|---|---|---|---|---|---|---|---|---|---|---|
| | 12/2002 | 12/2001 | 12/2002 | 12/2001 | |||||||
| Total | 17.0 | % | 18.5 | % | 17.0 | % | 18.5 | % | |||
| Of which: | |||||||||||
| Tier-1 ratio | 11.9 | % | 11.9 | % | 11.9 | % | 11.9 | % | |||
| Tier-2 ratio | 5.1 | % | 6.6 | % | 5.1 | % | 6.6 | % | |||
| Of which: | |||||||||||
| Upper Tier-2 ratio | 3.7 | % | 5.1 | % | 3.7 | % | 5.1 | % | |||
| Lower Tier-2 ratio | 1.4 | % | 1.5 | % | 1.4 | % | 1.5 | % | |||
| Adjusted Total | 18.8 | % | 20.4 | % | 18.8 | % | 20.4 | % | |||
| Of which: Adj. Tier-1 ratio | 13.7 | % | 13.8 | % | 13.7 | % | 13.8 | % | |||
21
| Adjusted Total | 6,553 | 6,271 | 6,577 | 6,292 | |||||
| | Consolidated Group | Parent Company | |||||||||
|---|---|---|---|---|---|---|---|---|---|---|---|
| III. Capital Adequacy Ratio | |||||||||||
| 12/2003 | 12/2002 | 12/2003 | 12/2002 | ||||||||
| Total | 16.6 | % | 17.0 | % | 16.6 | % | 17.0 | % | |||
| Of which: | |||||||||||
| Tier-1 ratio | 9.5 | % | 11.9 | % | 9.5 | % | 11.9 | % | |||
| Tier-2 ratio | 7.1 | % | 5.1 | % | 7.1 | % | 5.1 | % | |||
| Of which: | |||||||||||
| Upper Tier-2 ratio | 5.8 | % | 3.7 | % | 5.8 | % | 3.7 | % | |||
| Lower Tier-2 ratio | 1.3 | % | 1.4 | % | 1.3 | % | 1.4 | % | |||
| Adjusted Total | 18.3 | % | 18.8 | % | 18.3 | % | 18.8 | % | |||
| Of which: Adj. Tier-1 ratio | 11.1 | % | 13.7 | % | 11.1 | % | 13.7 | % | |||
IV. Specification of off-balance sheet items (B) (C)
Consolidated Group and Parent Company:
| | | | | | | | Book value on-balance sheet | | | | | | | Book value on-balance sheet | ||||||||||||||||||||||||||
|---|---|---|---|---|---|---|---|---|---|---|---|---|---|---|---|---|---|---|---|---|---|---|---|---|---|---|---|---|---|---|---|---|---|---|---|---|---|---|---|---|
| | Of which: | Related to derivative contracts with positive real exposures: | Related to derivative contracts with negative real exposures: | Of which: | Related to derivative contracts with positive real exposures: | Related to derivative contracts with negative real exposures: | ||||||||||||||||||||||||||||||||||
| December 31, 2002 | Nominal amounts | Converted claims | Positive real exposures | Potential exposures | Negative real exposures | Weighted claims | Positive book values | Negative book values | Positive book values | Negative book values | ||||||||||||||||||||||||||||||
| December 31, 2003 | Nominal amounts | Converted claims | Positive real exposures | Potential exposures | Negative real exposures | Weighted claims | Positive book values | Negative book values | Positive book values | Negative book values | ||||||||||||||||||||||||||||||
| Derivative financial contracts: | ||||||||||||||||||||||||||||||||||||||||
| Currency related agreements | 117,542 | 5,751 | 2,709 | 3,042 | 3,693 | 1,559 | 322 | 1,498 | 1,605 | 2,912 | 114,627 | 7,492 | 3,499 | 3,993 | 5,117 | 1,818 | 937 | 1,515 | 3,826 | 1,775 | ||||||||||||||||||||
| Interest rate related contracts | 104,318 | 1,971 | 1,588 | 383 | 4,993 | 584 | 25 | 1,743 | 367 | 51 | 117,311 | 2,209 | 1,439 | 770 | 7,043 | 529 | 17 | 3,772 | 816 | 33 | ||||||||||||||||||||
| Equity related contracts | 21,425 | 2,255 | 644 | 1,611 | 267 | 590 | 345 | 10 | 10 | 416 | 38,984 | 4,026 | 703 | 3,323 | 1,242 | 983 | 3 | 551 | 438 | 5 | ||||||||||||||||||||
| Commodity related contracts, etc | 0 | 0 | 0 | 0 | 0 | 0 | — | — | — | — | 1,706 | 156 | 20 | 136 | 154 | 78 | — | — | — | — | ||||||||||||||||||||
| Total derivative contracts | 243,285 | 9,977 | 4,941 | 5,036 | 8,953 | 2,733 | 692 | 3,251 | 1,982 | 3,379 | 272,628 | 13,883 | 5,661 | 8,222 | 13,556 | 3,408 | 957 | 5,838 | 5,080 | 1,813 | ||||||||||||||||||||
| Other off-balance sheet contracts and commitments: | ||||||||||||||||||||||||||||||||||||||||
| Repurchase agreements etc. (repos) | 330 | 330 | — | 330 | — | — | 109 | 109 | — | 109 | — | — | ||||||||||||||||||||||||||||
| Undisbursed credits | 11,849 | 5,924 | — | 5,924 | — | 246 | 14,358 | 7,179 | — | 7,179 | — | 764 | ||||||||||||||||||||||||||||
| Total | 255,464 | 16,231 | 4,941 | 11,290 | 8,953 | 2,979 | 287,095 | 21,171 | 5,661 | 15,510 | 13,556 | 4,172 | ||||||||||||||||||||||||||||
December 31, 2001 | ||||||||||||||||||||||||||||||||||||||||
December 31, 2002 | ||||||||||||||||||||||||||||||||||||||||
| Derivative financial contracts: | ||||||||||||||||||||||||||||||||||||||||
| Currency related agreements | 120,310 | 6,245 | 2,480 | 3,765 | 6,268 | 1,584 | 745 | 5,891 | 1,066 | 2,793 | 117,542 | 5,751 | 2,709 | 3,042 | 3,693 | 1,559 | 322 | 1,498 | 1,605 | 2,912 | ||||||||||||||||||||
| Interest rate related contracts | 103,836 | 2,901 | 2,477 | 424 | 3,024 | 742 | 205 | 414 | 1,923 | 24 | 104,318 | 1,971 | 1,588 | 383 | 4,993 | 584 | 25 | 1,743 | 367 | 51 | ||||||||||||||||||||
| Equity related contracts | 19,462 | 2,613 | 1,021 | 1,592 | 992 | 605 | 25 | 111 | 269 | 644 | 21,425 | 2,255 | 644 | 1,611 | 267 | 590 | 345 | 10 | 10 | 416 | ||||||||||||||||||||
| Commodity related contracts, etc | 357 | 44 | 23 | 21 | 48 | 10 | — | — | — | — | 0 | 0 | 0 | 0 | 0 | 0 | — | — | — | — | ||||||||||||||||||||
| Total derivative contracts | 243,965 | 11,803 | 6,001 | 5,802 | 10,332 | 2,941 | 975 | 6,416 | 3,258 | 3,461 | 243,285 | 9,977 | 4,941 | 5,036 | 8,953 | 2,733 | 692 | 3,251 | 1,982 | 3,379 | ||||||||||||||||||||
| Other off-balance sheet contracts and commitments: | ||||||||||||||||||||||||||||||||||||||||
| Repurchase agreements etc. (repos) | 109 | 109 | — | 109 | — | — | ||||||||||||||||||||||||||||||||||
| Repurchase agreements etc (repos) | 330 | 330 | — | 330 | — | — | ||||||||||||||||||||||||||||||||||
| Undisbursed credits | 16,444 | 8,222 | — | 8,222 | — | 243 | 11,849 | 5,924 | — | 5,924 | — | 246 | ||||||||||||||||||||||||||||
| Total | 260,518 | 20,134 | 6,001 | 14,133 | 10,332 | 3,184 | 255,464 | 16,231 | 4,941 | 11,290 | 8,953 | 2,979 | ||||||||||||||||||||||||||||
In the ordinary course of business SEK is a party to financial instruments with off-balance sheet exposure. The amounts of such exposures are shown in the table above. These instruments include primarily interest rate related and currency related agreements.
22
The success of an exporter often depends on access to long-term financing. In order to meet the demand for such financing, SEK grants medium and long-term credits. Credits are often at fixed interest rates, although credits at floating interest rates are also granted. The total time from the start of a credit agreement until final payment can be as long as twenty years. Such long-term contracts require special attention to the management of the inherent risk exposures.
In addition to its own business, SEK administers the Swedish Government's system for state-supported export credits and its concessionary credits program. Any deficits or surpluses from these programs are reimbursed by or paid to the State. Any credit losses incurred under the programs, however, are not reimbursed by the State. SEK must therefore demand adequate collateral for credits granted under these programs just as it does for its own credits. All credits are reported in SEK's balance sheet.
SEK funds its activities primarily by public issues and private placements in the international capital markets. Most borrowing is at fixed interest rates. In its funding operations SEK makes use of traditional borrowing structures as well as more complicated structures, many of which are tailored to suit the needs of investors. In its borrowing, lending and investment of liquid assets, SEK uses various financial instruments such as interest rate swaps, currency swaps, futures, credit derivatives and options. These instruments are mainly used to hedge or reduce exposures.
SEK's basic policies
SEK's Board of Directors has adopted four basic policies which are designed to give its shareholders a competitive long-term return on equity. These basic policies are then broken down into policies for managing different types of risk exposure.
The basic policies are:
23
Credit or Counterparty Risks
A credit or counterparty risk represents the risk of the loss that would occur if a borrower and its guarantors are unable to perform in accordance with the terms and conditions of a contract. SEK manages counterparty risks with the aid of a system which includes routines for credit rating, limits, risk classifications and monitoring procedures. The system takes into account differences between exposures to different countries, sectors, groups of counterparties and individual counterparties, as well as between different types of risk. For example, SEK has an internal rating system for counterparties that are not rated by any of the international rating agencies.
SEK's policy limits companies and states to which it is prepared to assume risk exposure to the following:
In 1997, SEK's Board of Directors decided to allow exposure to credit risks other than traditional types. However, this is subject to the provision that SEK's conservative credit risk policy is unchanged in order to safeguard SEK's high creditworthiness. SEK's Board of Directors has decided that in certain cases SEK may grant credits for project financing, i.e. credits for which repayment depends entirely on the cash flow generated by the project. A conservative credit risk policy is also applied within this area. The Board has currently restricted the total volume of project financing to Skr 1 billion. At year-end 2002 the volume of such credits outstanding was Skr 153 million (2001:165).
In order to reduce counterparty risk exposures that may arise from derivative contracts, SEK strives to obtain collateral or mark-to-market agreements from its counterparties before entering into derivative contracts. These agreements oblige SEK's counterparties to provide collateral to SEK in the
24
form of first-class securities and blocked funds. The contracts can also be adjusted if the market values of the contracts exceed set levels or if the counterparty's rating falls below a certain set level. These levels are determined individually and agreed with each counterparty.
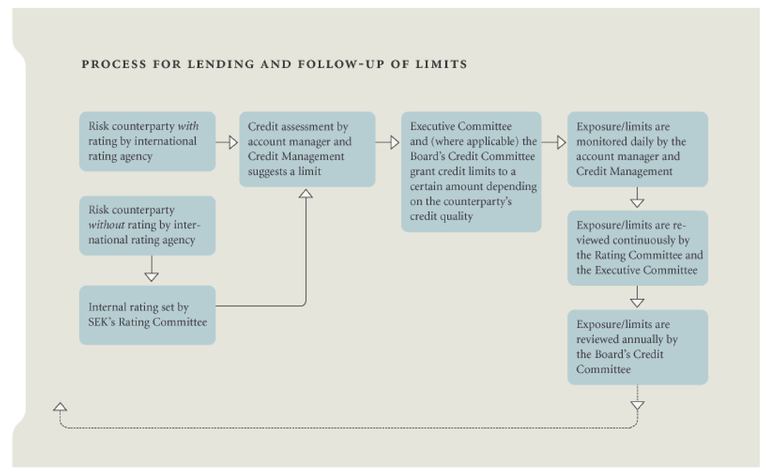
One key aspect of counterparty exposure is duration (See diagram, "Development of Counterparty Risk Exposures related to Long-Term Credits").
The majority of credits granted by SEK comprise long-term financing which supports Swedish exports. Measured in revenues, the largest Swedish export markets are Western Europe and North America. However, exports to other more or less developed markets are also important. Consequently, there is a financing need for transactions which involve buyers in many different countries with varying credit quality. Since SEK applies a conservative counterparty risk policy and is therefore selective in its acceptance of counterparties, SEK is not dependent on the individual buyers of Swedish goods and services nor on the countries in which they are domiciled. Dependence is instead on the counterparties who have guaranteed the credits, which are often separate from the buyers and have a higher creditworthiness. Counterparty risk exposures are shown in the tables "Total Counterparty Risk Exposures" and "Credits Outstanding".
A specific type of counterparty risk is known as settlement risk. Settlement risk is the risk of loss if a counterparty who has completed a deal defaults before fulfilling its part of the transaction. Separate settlement limits have been set for certain counterparties. Such limits have been set not only for the traditional types of counterparties, but also for certain smaller institutions. For these smaller institutions, the individual limits may amount to only some ten millions of Swedish kronor.
25
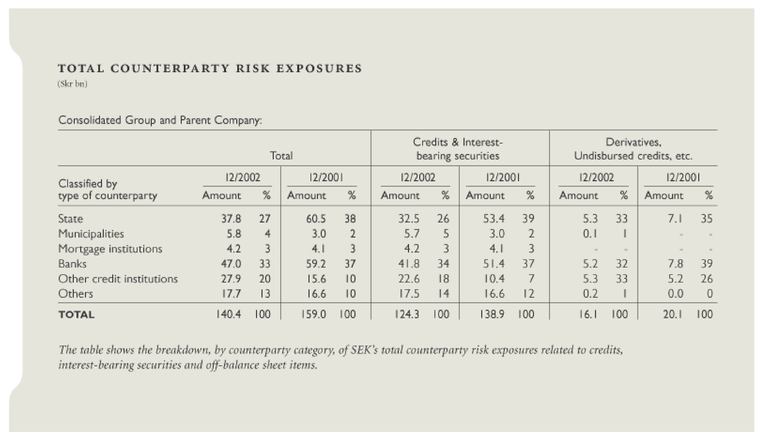
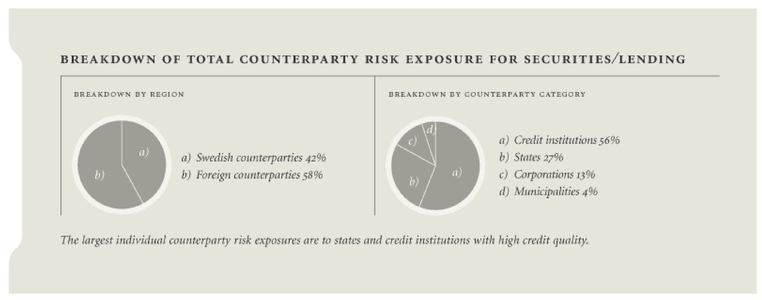
26
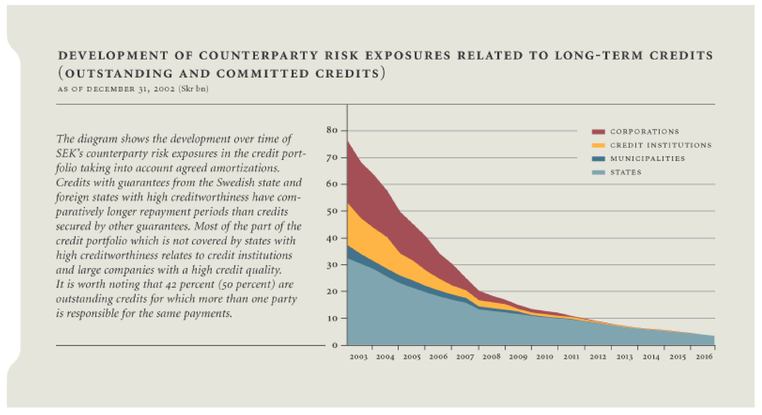

Market Risks
A market risk represents the risk of loss that would occur if the value of a contract should change due to changes in market conditions, such as interest rates or exchange rates.
All individual financial instruments are subject to market risk. A change in the market value of an instrument also changes the counterparty risk of that instrument.
In principle, the longer the remaining maturity of an instrument, the greater its potential market risk. However, maturity is only one factor that effects market risk. SEK's potential market risk related to individual contracts and counterparties is large since SEK's business is focused on long-term transactions and its lending is denominated in a number of currencies and mostly carries fixed interest rates. However, the majority of these individual market risks are hedged by transactions which offset each other.
Proposal For New Capital Adequacy Rules
The Basel Committee for Bank Supervision has headed a review of capital adequacy regulations. The Basel Committee issued its first consultative paper in 1999 and the New Basel Capital Accord, Basel II, is expected to adopted in its entirety in mid-2004. Changes to several key points were announced on January 15, 2004. The regulations are expected to come into force on December 31, 2006. In parallel, the European Commission has worked on a proposal to reflect the new rules in an amended EU capital adequacy directive (CAD III). The Swedish Financial Supervisory Authority together with the financial sector is making preparations and has issued a number of reports on how they expect to handle these rules. SEK uses sophisticated techniquesis also taking steps to manageassess the impact that these new rules may have on it.
The purpose of this review of the regulatory framework for capital adequacy is to harmonize and coordinate the development of methods for quantifying risks and their inherent risk based capital requirement. The aim of the work of the Basel Committee is to adapt the capital adequacy rules so that the capital adequacy requirement reflects actual risk-taking better than today. In addition to the capital requirements for credit and market risks which are designed to facilitate assessment of these risks. For example, SEK takes effects due to changescontained in the portfolios into account.
SEK funds its activities in all majorpresent regulations, there will be a capital markets. Pending on-lending of borrowed funds, which normally have long maturities and fixed interest rates,requirement for operational risks. According to the funds are swapped into liquid assets at floating interest rates. Later, when credits are granted, these liquid assets are sold and in most cases new swaps are entered into or the swaps are unwound. Since SEK uses complicated techniques and borrowing structures, that may include imbedded options and formulas to determine repayment amounts, SEK is party to a large number of interest-rate related and currency-related contracts as well as equity-related and commodity-related contracts. Theproposal, capital adequacy table on pages 21 and 22 shows amounts with respect to off-balance sheet contracts at year-end 2002.
It is worth noting that off-balance sheet contracts with positive values and negative values respectively, are reported on-balance sheet as one component of other assets and other liabilities respectively. See Note 1(q) torequirements, following approval from the Financial Statements.
Credit Spread Risks
In line with SEK's efforts to develop its business while still maintaining a good control of risks, a portfolio was established in 2000 for investments with market valuation of credit spreads. The Board of Directors has set a limit for the market risk in credit spreadssupervisory authority, can be based on the assumptionfinancial institutions' internal systems and assessment. A number of an immediate shiftstrict requirements have to be met in order to qualify for this alternative. In addition to these spreads and where current exposuresmethods there are divided into different categories depending onstandard rules similar to the rating and sector of the risk counterparty and the duration of the exposure. The credit spread risk may not exceed Skr 100 million. At year-end 2002 the credit spread risk was Skr 14 million.present regulatory framework.
Currency RisksCertain Off-Balance Sheet Arrangements
SEK grants credits in all major currencies and matches thesehas not entered into any transactions, agreements or other contractual arrangements with borrowing in the same currencies. SEK does not take currency risksany unconsolidated entities under which it has any obligations arising (1) under a guarantee contract with the exception of short-term risks resulting from earnings generated by credits and liquid assets in foreign currencies. The Board of Directors has established a limit for currency risks measured as the change in value of foreign currency positions resulting from a 10 percent change in the exchange rate for the Swedish krona. The aggregate currency risk must not exceed Skr 40 million. At year-end 2002, the aggregate currency risk was Skr 10.6 million.
Interest Rate Risks
SEK takes certain interest rate risks in order to provide competitive, fixed rate credits in all maturities. Since SEK continually grants new credits at varying amounts with different disbursement periods and maturities, it is cost effective for SEK to run books in the various currencies. Consequently, there are varying, although limited, amounts that are exposed to interest rate risk.
The Board of Directors has established the following limits for interest rate risks:
—The risk may not exceed the highest valueany of the risk from a parallel shiftcharacteristics specified in the yield curve, based on the assumptionFASB Interpretation No. 45 paragraph 3, (2) out of a one percentage pointvariable interest rate change on all maturities,
—and the risk fromin an unconsolidated entity referred to in FASB Interpretation No. 46, or (3) under a rotation of the yield curve based on the assumption that interest rates changedemonstrative instrument in different directions for different maturities.
28
SEK's interest rate risks related to shifts in the yield curve in the fixed-interest portfolio of committed credits in foreign currency amounted to Skr 80.9 million at year-end, of which Skr 5.1 million was related to 2003. This is based on an assumed shift in interest rates of one percentage point on all maturities. The total periodassets or to which the risk is attributable exceeds ten years. The major part of this exposure pertains to USD and EUR.
The interest rate risk related to changes in the yield curve in Swedish kronor amounted to Skr 38.6 million, of which Skr 24.9 million was related to 2003. This is based on an increase in interest rates of one percentage point. The exposure is related to fixed-interest lending and so on. Theit has transferred assets in which shareholders' funds and untaxed reserves are invested are excluded from the calculation of the above interest rate risks.
At year-end 2002, SEK's shareholders' funds and untaxed reserves were invested in fixed income assets for a total of Skr 3.8 billion (lending and securities) and SEK's office building, Skr 0.1 billion.
SEK's policy is to invest equity in medium-term maturities in order to ensure a stable, long-term return on shareholders' funds. The average remaining maturity on the above-named investments, which total Skr 3.9 billion, is approximately three years.
Funding and Liquidity Risks
A funding and liquidity risk represents the risk of loss that would occur if commitments could not be met duesubject to a deficit in borrowingretained or contingent interest or similar arrangement that serves as credit liquidity so-called cash flow mismatches.
SEK's policy is to fund all lending commitments throughout their duration. This allows SEK to grant new credits whenever needed. Equally, SEK can avoid taking up new borrowing in the capital market over long periods if the terms offered are considered unfavorable. Although SEK's policy means that SEK is never forced to borrow to meet its commitments, SEK has established a large number of long-term as well as short-term borrowing programs all over the world. These programs reduce dependence on individual markets and their liquidity. In addition, SEK also has access to certain back-up credit facilities for its short-term borrowing programs.
The development over time of SEK's available funds, and of its outstanding and committed credits at year-end 2002 is shown in the diagram "Development over time of SEK's available funds."
29
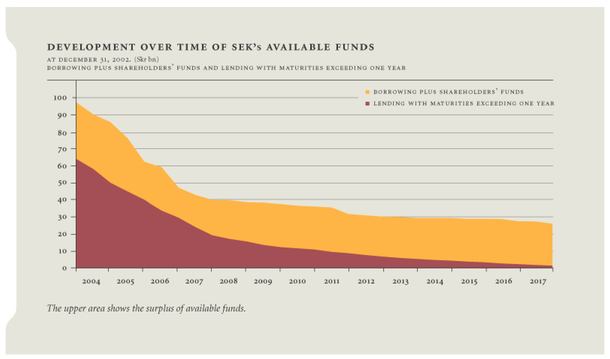
Operational Risks
A legal risk represents the risk of loss that would occur if a transaction could not be completed as planned due to some legal obstacle, such as inaccurate documentation or non-enforceability of certain conditions.
Legal risks are reduced by involving experienced internal decision makers, in-house and external lawyers, and administrative staff. Knowledge development and a high level of integrity are encouraged among the staff.
The complexity of the documentation for a transaction usually varies with the complexity of the underlying transaction. However, SEK tries as far as possible to use standardized terms and conditions in all agreements. Strict policies apply in this regard.
In recent years there has been a trend for major borrowers with their own public borrowing programs based on standard documentation to require the use of such documentation when raising traditional loans. Provided such documentation meets SEK's requirements, SEK is prepared to accept this.
Operations and Systems Risks
Operations and systems risks represent the risk of loss if human error or fraud should occur or if a system should fail to operate as intended.
Internal instructions regarding decision-making processes and control procedures are established by the Board of Directors or by the President. Transactions and risks are reported using set forms and by departments other than those carrying out the transactions.
SEK develops and maintains its own computer systems, but with some maintenance and development agreements with external parties. Strict back-up routines are applied in the IT Department in order to reduce the risk of loss of information. The IT Department also strives to have access to external hardware back-up in the event of damage to SEK's equipment.
30
Risk Control
The objective of Risk Control is to further improve the quality and control of all risk reporting to the Board of Directors and to improve control of the conformity and functionality of internal instructions and authorizations. Risk Control works independently from the rest of the organization and functions as an extra level of control over and above other internal control systems. Risk Control works solely with control and supervision.
The unit reports directly to the President, and in certain cases is obliged to report to the Chairman of the Board and the auditors. Risk Control works in a systematic manner in accordance with a plan adopted by the Board of Directors on a yearly basis.
The plan also specifies the formats and regularity of reporting to the President, the Board of Directors and the auditors. An overall identification of all types of risks associated with SEK's business is required so that these objectives can be met. The intention is to be able to assess different types of risks, their relative importance, and the quality and accuracy of the routines, measurements and reports used in risk management. The risk areas monitored are primarily counterparty risk and market risk but SEK also controls legal risk, operational risk, systems risk andsupport to some extent liquidity risk.such entity.
Risk Control also examines and evaluates SEK's organization, routines and internal control. Good internal control means that the business is organized so that it is conducted in compliance with applicable law and regulations and is in accordance with adopted policies and instructions.
A high level of internal control is maintained by:
Risk Control also participates, on its own initiative, in the process of maintaining and developing relevant reports and instructions in order to ensure that these are appropriate, reliable and accurate. This is always carried out in close cooperation with the employees responsible for day-to-day business in order to raise awareness of and understanding for such activities.
Risk Control is also tasked with examining agreements entered into by SEK, credit and borrowing agreements as well as other types of agreements and commitments. The main purpose of such control is to verify that the agreements are formulated in line with SEK's established policies.
In everyday financial language, the expressions "exposure(s)" and "risk(s)" are sometimes used synonymsly. More precisely, however, the expression "exposure" refers to the position (of assets/liabilities) that is exposed to a certain type of risk (which can also be called "risk exposure"), while "risk" refers to the risk of loss (quantified as an amount) that the underlying, risk-exposed position generates.
31
f.Other—Recent Accounting Pronouncements Issued
A number of new or revised Swedish accounting pronouncementspronouncement came into effect as from January 1, 2003.
The Swedish Financial Accounting Standards Council has issued a number of new or revised standards effective 2003, or later:
RR 22generally based on IAS 1 Presentation of Financial StatementsRR 24 based on IAS 40 Investment PropertyRR 25 based on IAS 14 Segment ReportingRR 26 based on IAS 10 Events After the Balance Sheet DateRR 27 based on IAS 32 Financial Instruments: Disclosure and PresentationRR 28 based on IAS 20 Accounting for Government Grants and Disclosure of Government Assistance, andRR 29 based on IAS 19 Employee Benefits.
All these new or revised standards are effective for fiscal years beginning on or after January 1, 2003 except RR 29, which comes into effect only in 2004.
None of these new or revised standards is expected tointernational accounting standards. These changes did not materially affect SEK's financial reports other than to the extent that they increase disclosure requirements.
RR 22 will, accordingly, require that changes in equity be presented in a basic financial report rather thanrequirements were extended. They have been applied in the note format. RR 25Consolidated Financial Statements.
As from January 1, 2004, a new standard for pension accounting (RR 29 based on IAS 19 Employee Benefits) comes into effect. As disclosed in the financial reports, Note 1 (r), SEK is not applicable toin the Company. SEK already providesprocess of ascertaining the information required by RR 25effects, if any, that this standard will have on segments. RR 26 codifies current Swedish accounting practice related to subsequent events and is not expected to affect the Company's financial reports. SEK generally provides the disclosures required by RR 27 on risk management policies, interest rate risk, credit risk and fair value, and about terms, conditions and accounting policies for the various classes of its financial assets, financial liabilities and equity instruments. RR 28 is not expected to affect the Company's financial reporting. Given the character of SEK's pension arrangements, RR 29 is mainly expected to increase disclosure requirements.pensions.
In June 2001, FASB issued SFAS No. 143, Accounting for Asset Retirement Obligations. SFAS No. 143 requires the Company to record the fair value of an asset retirement obligation as a liability in the period in which it incurs a legal obligation associated with the retirement of tangible long-lived assets that result from the acquisition, construction, development, and/or normal use of the assets. The Company also records a corresponding asset that is depreciated over the life of the asset. Subsequent to the initial measurement of the asset retirement obligation, the obligation will be adjusted at the end of each period to reflect the passage of time and changes in the estimated future cash flows underlying the obligation. The Company is requiredalso preparing for the implementation of International Financial Reporting Standards in their entirety, expected to adopt SFAS No. 143apply to SEK as from January 1, 2007. For a further description of these changes refer to Note 1 to the Consolidated Financial Statements.
A number of new standards and interpretations issued by the FASB also came into effect on January 1, 2003. The adoption of SFAS No. 143 is not expected to haveFASB has in addition issued standards with a material effect on the Company's consolidated financial statements.
In April 2002, the FASB issued SFAS No. 145, Rescission of FASB Statements No. 4, 44 and 64, Amendment of FASB Statement No. 13, and Technical Corrections. SFAS No. 145 amends existing guidance on reporting gains and losses on the extinguishment of debt to prohibit the classification of the gain or loss as extraordinary, as the use of such extinguishments have become part of the risk management strategy of many companies. SFAS No. 145 also amends SFAS No. 13 to require sale leaseback accounting for certain lease modifications that have economic effects similar to sale leaseback transactions. The provisions of the Statement relatedlater effective date. These are further described in Note 33 to the rescission of Statement No. 4 are applied in fiscal years beginning after May 15, 2002. Earlier application of these provisions is encouraged. The provisions of the Statement related to Statement No. 13 were effective for transactions occurring after May 15, 2002, with early application encouraged. The adoption of SFAS No. 145 is not expected to have a material effect on the Company's consolidated financial statements.Consolidated Financial Statements.
32
In June 2002, the FASB issued SFAS No. 146, Accounting for Costs Associated with Exit or Disposal Activities. SFAS No. 146 addresses financial accounting and reporting for costs associated with exit or disposal activities and nullifies Emerging Issues Task Force (EITF) Issue 94 3, Liability Recognition for Certain Employee Termination Benefits and Other Costs to Exit an Activity. The provisions of this Statement are effective for exit or disposal activities that are initiated after December 31, 2002, with early application encouraged. The adoption of SFAS No. 146 is not expected to have a material effect on the Company's consolidated financial statements.
In November 2002, the FASB issued Interpretation No. 45, Guarantor's Accounting and Disclosure Requirements for Guarantees, Including Indirect Guarantees of Indebtedness to Others, an interpretation of FASB Statements No. 5, 57 and 107 and a rescission of FASB Interpretation No. 34. This Interpretation elaborates on the disclosures to be made by a guarantor in its interim and annual consolidated financial statements about its obligations under guarantees issued. The Interpretation also clarifies that a guarantor is required to recognize, at inception of a guarantee, a liability for the fair value of the obligation undertaken. The initial recognition and measurement provisions of the Interpretation are applicable to guarantees issued or modified after December 31, 2002 and are not expected to have a material effect on the Company's consolidated financial statements. The disclosure requirements are effective for consolidated financial statements of interim and annual periods ending after December 31, 2002.
In December 2002, the FASB issued SFAS No. 148, Accounting for Stock Based Compensation—Transition and Disclosure, an amendment of FASB Statement No. 123. This Statement amends FASB Statement No. 123, Accounting for Stock Based Compensation, to provide alternative methods of transition for a voluntary change to the fair value method of accounting for stock based employee compensation. In addition, this Statement amends the disclosure requirements of Statement No. 123 to require prominent disclosures in both annual and interim consolidated financial statements. Certain of the disclosure modifications are required for fiscal years ending after December 15, 2002 and are included in the notes to these consolidated financial statements. The adoption of SFAS No. 148 is not expected to have an effect on the Company's consolidated financial statements.
In January 2003, the FASB issued Interpretation No. 46, Consolidation of Variable Interest Entities, an interpretation of ARB No. 51. This Interpretation addresses the consolidation by business enterprises of variable interest entities as defined in the Interpretation. The Interpretation applies immediately to variable interests in variable interest entities created after January 31, 2003, and to variable interests in variable interest entities obtained after January 31, 2003. The application of this Interpretation is not expected to have a material effect on the Company's consolidated financial statements. The Interpretation requires certain disclosures in consolidated financial statements issued after January 31, 2003 if it is reasonably possible that the Company will consolidate or disclose information about variable interest entities when the Interpretation becomes effective. The adoption of FIN 46 is not expected to have an impact on the Company's consolidated financial statements.
Item 6. Directors, Senior Management and Employees
The Board of Directors is responsible for the management of the Company.
The Company's Articles of Association currently provide that the Board of Directors shall consist of six directors and not more than four deputy directors. The State, as holder of all the Class A shares, elects four directors and may elect two deputy directors, and as holder of the Class B shares, elects two directors and may elect two deputy directors. The Government appoints the Chairman of the Board of Directors, is responsible forand the managementdirectors elected by the holder of the Company.Class B shares may elect a Vice Chairman of the Board of Directors from among the directors.
The Board of Directors convenes at least six times a year. A deputy director does not have the right to vote at meetings of the Board of Directors unless a director is absent and the deputy director has taken his or her place.
The State, which holds all of the Class A shares, elects four directors and two deputy directors. ABB, which hold all of the Class B shares, elect two directors and two deputy directors. The directors and deputy directors are elected annually. The Government appoints the Chairman of the Board, and the directors elected by the holders of the Class B shares elect a Vice Chairman of the Board of Directors from among the directors. The Board of Directors convenes at least six times a year.
The directors and deputy directors of the Board of Directors are elected at the annual general meeting to serve for the period until the end of the next annual general meeting. The annual general meeting is required to be held not later than June 30 of each year. The members of the Executive Committeeofficers are appointed by the Board of Directors to serve for a non-fixed period.
33
At the annual general meeting held on April 26, 2004, the State, as shareholder, approved amendments to the Company's Articles of Association. These amendments will become effective upon approval by the Government. Under the amended Articles of Association, the Board will consist of six to eight directors, as determined at each annual general meeting, and not more than four deputy directors. The Class A and Class B shareholders will jointly elect all directors and deputy directors, if any.
Certain information with respect to the Company's directors, deputy directors and executive officers is set forth below. Unless otherwise indicated, such information is given as of the date of this Report.
Board of Directors and Executive Officers
| Name | Age* | Position | ||
|---|---|---|---|---|
| Björn Wolrath | Chairman of the Board and Director | |||
| Vice Chairman of the Board and Director | ||||
| Director | ||||
| 46 | Director | |||
| Claes de Neergaard | 54 | Director | ||
| Anders | 57 | |||
| Per Östensson | Deputy Director | |||
Peter Yngwe | President | |||
| Lars Grönlund | 56 | Executive Director, Credit Management | ||
| Måns Höglund | Executive Director, Corporate & Structured Finance | |||
| Jakob Nordin | Executive Director, Financial Control | |||
| Sven-Olof Söderlund | Executive Director, Strategic Analysis & Planning | |||
| Per Åkerlind | Executive Director, Capital Markets & Chief Financial Officer |
Biographical Details
�� Mr. Wolrath was appointed Chairman of the Board by the Government and directorDirector by the State in September 1998. In 1997 he set up the company Momentum AB in which he is Chairman. From 1981 and until 1997 he was President ofat Skandia. He is chairman of the Boardboard of Directorsdirectors of Stiftelsen för Respekt, Telia Pensionsstiftelse Skattebetalarnas Förening and Com.hem.Countermine Technologies AB. He is also a director of Rederi AB Gotland and Samhall AB.AB, Transcom Int. SA and Codan A/S.
Mr. CarlssonMrs. Liffner was appointed directorDirector by ABBthe State in June 2000. He2003 and Vice Chairman in 2004. She has been President ofserved in various executive capacities at AssiDomän AB, ABB Financial ServicesAtom AB, Asea AB and Surahammars Bruks AB since 1997. Prior to that he was President of ABB Treasury Center (Sweden) AB from 1988. He1979. She is chairman of the boardsboard of ABB Treasury Centers ScandinaviaSvensk Adressändring AB, Svenska Endometriosföreningen and deputy chairman of Swedish Athletic Association. She is a director of Sirius International FörsäkringsSveaskog AB, as well as a number of ABB companiesV & S Vin & Sprit AB, Third Swedish National Pension Fund and Södra CellSkandinaviska Jour & Rekryteringsbyrån AB. He
Mrs. Apelman was appointed Director by the State in June 2003. She is alsoChief Financial Officer at Luftfartsverket since 2001. Prior to that she has served in various executive capacities at Saab Aircraft Leasing and Scandinavian Airlines. She is a director of the Local Executive ForumThe Swedish Export Credits Guarantee Board and A-Banan Projekt AB and deputy director of ABB Sweden and a member of the Stockholm Chamber of Commerce delegates.Nordic Airport Properties AB.
Mr. CederlundMrs. Levander was appointed director by the State in April 1986 after having2004. She is Partner and Chairman of the Board of Nordic Investor Services AB. Prior to that she has served asin various executive capacities at Neonet AB, Odin Forvaltning AS and Nordbanken Asset Management. She is a director of SBAB, Bure Equity AB and Gant AB.
Mr. de Neergaard was appointed Director by the State in June 2003. He is Non-Executive Director, Advisor and Management Consultant. He has served in various executive and supervisory capacities at European Investment Bank, European Bank for Reconstruction and Development, Nordbanken and PKbanken. He is chairman of the board of Nordic Investment Bank, Third Swedish National Pension Fund and GuarantCo Ltd. He is first deputy chairman of the Swedish Export Credits Guarantee Board and a member of the boards of Kaupthing Bank Sweden, Emerging Africa Infrastructure Fund and Access Capital Partners SA.
Mr. Silander was appointed director since 1980.by the State in April 2004, with his term of office to begin upon approval by the Government of the amendment to the Articles of Association increasing the authorized size of the Board. He is a private investor and has previously served in various executive capacities at Alfred Berg Nordic Group, UBS Warburg (Stockholm), Goldman Sachs (London), Handelsbanken (Stockholm and London) and Citibank (Stockholm). He is a director of NetOnNet, Telelogic, Trygg-Stiftelsen and Lenta.
Mr. Wenström was appointed Director by the State in June 2003. He is Director Senior Advisor ofat the Ministry of Industry, Employment and Communications andfor Foreign Affairs since August 2001. Since 1996 he has served in executive capacities at the Ministry during the past six years. He is a director of AB Svensk Bilprovning, Svenska Rymdaktiebolaget, Sveaskog ABcovering, inter alia, Nordic co-operation and Stattum Holding.trade promotion affairs.
Mr. JohanssonÖstensson was appointed directorDeputy Director by the State in April 2001. He has been Director at the Ministry for Foreign Affairs since September 1999. From 1983 to 1999 he served at the Ministry for Foreign Affairs in Hong Kong, Taipei, Peking and Shanghai.
Mrs. Nivert was appointed director by the State in June 2000. She was President and CEO of Telia AB from October 2000 until September 2002. Prior to that she had served in various executive capacities at Telia since 1963. She is a director of SSAB, Beijer-Alma AB, Posten AB,
34
Systembolaget AB, Fjärde AP-fonden, Huddinge Universitetssjukhus AB, Lennart Wallenstam Byggnads AB, Stiftelsen Chalmers Tekniska Högskola, Studieförbundet Näringsliv och Samhälle (SNS) and is a member of Förtroendekommissionen appointed by the Government.
Mr. Thorstensson was appointed director by ABB in December 2002. He is President and CEO of Sirius International Insurance Corporation, a wholly-owned subsidiary of ABB AB, and has served in executive capacities within that company during the past thirteen years. He is director of Sirius America Insurance Company, New York, Scandinavian Reinsurance Company Limited, Hamilton, Bermuda, International Medical Group, Indianapolis, ABB Insurance Limited, Guernsey and Sirius Rückversicherungs Service GmbH, Hamburg.
Mrs. Hedengran was appointed deputy director by ABB in June 2000. She is a lawyer presently employed by Advokatfirman Lindahl KB. Prior to that she served as General Counsel, Head of legal department, at ABB Financial Services AB until 1999, and as legal counsel at ABB Financial Services from 1991. Prior to 1991 she served as Judge's Assistant at Stockholm City Court and legal counsel at Gunnar Lindh Lawfirm.
Mr. Hedenström was appointed deputy director by the State in June 2000 after having served as a director since May 1994 appointed by the then shareholding banks. Since September 2000 he has been Senior Advisor of Rederi AB Soya. Prior to that he has served as President of Rederi AB Soya, Executive Vice President, Deputy Chief Executive Officer at Walleniusrederierna AB, Deputy Group Chief Executive and Chief Operating Officer, Enskilda Corporate Division and in executive capacities at Skandinaviska Enskilda Banken. He is a director of Stockholms Travsällskap and several companies within the Soya-group.
Mr. Inestam was appointed deputy director by ABB in December 2002. He has been assistant to the Head of Group Function Finance Northern Europe at ABB Norden Holding AB since December 1, 2002. Prior to that he was employed by the Corporate Finance Department at the ABB Head Office in Zürich for 21/2 years, and by Business Control at ABB Sweden.
Mr. Östensson was appointed deputy director by the State in April 2001. He has been Senior AdvisorAdviser at the Ministry of Finance since 1998. Prior to that he has served at the Ministry for Foreign Affairs, Allgon Antenn Australia and the Swedish Trade Commission in Sydney.
Mr. Yngwe has been President since April 1997. Since March 1991 he had been CFOTreasurer and Head of the Finance Department of the Company. From 1988 until then, he served as Treasurer, Treasury and Trading Division of the Company, and prior to that, he served at the Finance Department of the Company in various capacities beginning in 1984.
Mr. Grönlund has been Executive Director, Credit Management since April 2003. Prior to that he served as Group Senior Vice President at ABB in Zürich.
Mr. Höglund has been Executive Director, Corporate & Structured Finance since January 2002. Prior to that he served as Head of Private Banking Sweden at Nordea since 2000, Managing Director at Unibank, Sweden Branch since 1999 and before that he served inheld executive capacities at FöreningsSparbanken/Sparbankernas Bank (Swedbank), Gotabanken, Stockholm, Götabanken, London and Hambros Bank, London.Bank.
Mr. Nordin has been Executive Director, Financial Control since August 2000. Prior to that he served as General Manager and Head of Finance at Postgirot Bank AB since May 1994. He is a member of the board of Postens Pensionsstiftelse since 1996.
Mr. Söderlund has been Executive Director, Strategic Analysis and Planning since December 1999. Prior to that he has been Executive Director of Risk & Credit Management since January 1998 and Controller of the Company since 1988.
Mr. Åkerlind has been Executive Director, CFOChief Financial Officer and Head of Capital Markets since June 2002. Prior to that he served as Executive Director, Treasurer and Head of Debt Capital Markets since September 2000 and2000. Prior to that he served as Executive Director & Treasurer since April 1997. From 1995 until then he has
35
served as Deputy Treasurer and prior to that, he served at the Finance Department of the Company in various capacities beginning in 1990.
Compensation of Directors and Officers.Officers
The aggregate direct remuneration of all directors and officers as a group paid or accrued in 20022003 was Skr 14.7 million (2002: 13.7, million (2001:2001: 9.4), all of which was in the form of salaries and bonuses, in the case of officers, and in the case of directors consisted of fees that were nominal in amount. The employees of the Company are covered by various national social service programs to which the Company contributes. The Company also maintains a pension plan with an insurance company to which the Company contributed approximately Skr 4.15.6 million in 2002 (2001: 2.5)2003 on behalf of all officers as a group.
The total amount of the pension obligations related to certain key officers (including those listed above), charged to results and reported as an allocation, was Skr 18.217.9 million at December 31, 2002, compared with Skr 18.4 million at December 31, 2001, and Skr 19.5 million at December 31, 2000.2003.
The Chairman of the Board received Skr 0.2 million in remuneration in 2002 (2001: 0.2, 2000: 0.1).2003.
The President's remuneration and other benefits in 20022003 totaled Skr 3.23.7 million, (2001: 3.0, 2000: 2.8), of which a bonus comprised Skr 0.8 million (2001: 0.6, 2000: 0.4).million. The bonus is related to targets in the Company's business plan approved by the Board of Directors. HeOf the total remuneration to the President, Skr 3.5 million is qualifying income for pension purposes. The President is entitled to annual pension benefits upon retirement at age 60 equal to 75 percent of his terminal pay up tountil age 65 years after which it reduces.is reduced. Such commitments are covered by insurance.
Remuneration to other key executive officers of the companyCompany in 20022003 totaled Skr 8.69.9 million of which Skr 1.3 million represented bonuses. The bonuses relate to individual set targets and targets defined in the Company's business plan. Certain key executive officers of the Company (including those listed above) have employment contracts providing, in the event such contract is terminated by the Company, certain compensation during the subsequent two-year period subject to deduction for any salary received in new employment. None of the Directors have contracts with the Company providing for benefits upon termination of service.
See also Note 10 to the Consolidated Financial Statements.
Certain Committees
The Board of Directors currently doesis not required to have an audit committee or a remuneration committee. So long as the Company's Preferred Capital Securities arecommittee under either Swedish law or, because it does not have securities listed on the New York Stock Exchange, the Company will be requireda U.S. national securities exchange, by the Sarbanes-Oxley Act of 2002 and the regulations thereunderthereunder.
As from 2004, the Board of Directors has established a remuneration committee. The task of the Remuneration Committee is to establish an audit committee by July 2005.investigate on behalf of the Board of Directors the issue of variable remuneration for employees and to report to the Board considerations made in the course of this task. The Remuneration Committee consists of Chairman of the Board and Director Björn Wolrath, Director Claes de Neergaard and Director Marianne Nivert. Through the end of March 2004, the Remuneration Committee had convened on one occasion.
Employee Relations
During the year, the number of employees averaged 124 (2002: 113, (2001: 98, 2000: 85)2001: 98), of which 59 (2002: 54 (2001: 45 and 2000: 38)2001: 45) were female and 65 (2002: 59, (2001: 53, 2000: 47)2001: 53) were male. The number of employees is small in relation to the volume of lending because the number of lending transactions is relatively few and the administration and documentation of credits is normallyin many cases handled by the banks participating in the transactions. The Company has not experienced any strikestrikes or labor disputedisputes and considers its employee relations to be good.
Item 7. Major Shareholders and Related Party Transactions
Under its Articles of Association, the shares of the Company are divided into Class A and Class B shares, each class having equal voting rights except that the Articles of Association give the holder of the Class A shares the right to electelects four directors and the holders of Class B shares the right to elect
36
two directors. The State owns all of the Class A shares, and ABB owns allholder of the Class B shares.shares elects two directors. Under the Articles of Association, holders of shares of the Company have a right of pre-emptionpreemption in the event of a transfer of shares of the Company to a person who is not previously a holder of shares of the same class in the Company.
On June 30, 2003, the Kingdom of Sweden became the sole (100 percent) owner of SEK. The State owns all of the Class A shares and all of the Class B shares.
The following table sets forth the current share ownership of the Company:
| Shareholder | Ownership % | Number of shares | |||||||||
|---|---|---|---|---|---|---|---|---|---|---|---|
| Kingdom of Sweden | Appr. 64.65 | % | 640,000 | Class A Shares | |||||||
| | Ownership | Number of shares | | ||||||||
| Kingdom of Sweden | Appr. 64.65 | % | 640,000 | Class A Shares | Appr. 35.35 | % | 350,000 | Class B Shares | |||
| ABB Structured Finance Investment AB | Appr. 35.35 | % | 350,000 | Class B Shares | |||||||
| 100.00 | % | 990,000 | Shares | ||||||||
| 100.00 | % | 990,000 | Shares | ||||||||
The current share ownership has been in place sinceDuring the three year period from June 2000.2000 to June 2003 the State held 64.65% of the Company's voting shares, with the other 35.35% held by ABB Structured Finance Investment AB. Prior to that date, the State contributedheld 50 percent of the Company's voting shares, with the other 50 percent held by major commercial banks in Sweden. ABB has announced its intention to sell its interest in SEK. See Item 4. "Information on the Company—General".
Transactions with ShareholdersRelated Parties
The Swedish State owns approximately 65 percent of the Company's share capital. At December 31, 2002, the Company ownedheld interest bearing securities issued by the State and entities partially or wholly controlled by the State totaling Skr 2,331.6 million.2,257.6 million at December 31, 2003 and Skr 1,857.1 million at March 31, 2004. By means of direct guarantees extended by the National Debt Office and by EKN, carrying by the full faith and credit of Sweden, 2923 percent of the Company's outstanding loans at December 31, 20022003 were supported by the State. In addition, under the S-system the difference between interest revenues, net commission revenues and any foreign exchange gains related to lending, on the one hand, and interest expenses related to borrowing, all financing costs, any foreign exchange losses, and compensation paid to SEK for handling the S-system, on the other hand, are reimbursed by the State.
The remaining 35 percent ofState pays also compensation to SEK for administering the share capital ofS-system. See Item 4, "Information on the Company is controlled by ABB. In the ordinary course of its export financing business, the Company extends credits to or through, and borrows money from, and engages in currency and interest rate swap transactions with members of the ABB Group. Such transactions are negotiated on an arm's-length basis and entered into on commercial terms that the Company believes are non-preferential. ABB also acts as a guarantor for credits to an amount less than 1 percent of the total credits outstanding.Company—Lending Operations—General—S-system".
The Company enters into transactions in the ordinary course of business with entities that are partially or wholly owned or controlled by the State, as well as with members of the ABB Group.State. The Company may also extendsextend export loans (in the form of direct or pass-through loans) to entities related to the State and to members of the ABB Group.although no such loans were outstanding at December 31, 2003 or at March 31, 2004. Transactions with such parties are conducted on the same terms (including interest rates and repayment schedules) as transactions with unrelated parties.
The aggregate amount of loans to ABB Group members outstanding as of December 31, 2002, was EUR 23.6 million, and the largest aggregate amount of loans to the members of the ABB Group outstanding at any time during the year 2002 was EUR 35.8 million. The weighted average interest rate on loans to ABB Group members outstanding as of December 31, 2002 was approximately 3.5 percent. These loans relate to refinancing of lease transactions.
See also Note 32 to the Notes31 to the Consolidated Financial Statements.
37
Consolidated Financial Statements
See Item 18, "Financial Statements".
Legal Proceedings
There are no material pending or, to the Company's knowledge, threatened legal or governmental proceedings to which the Company is or would be a party or to which any of its property is or would be subject.
Dividend Policy
SEK's dividend policy in paying dividends on its share capital is to strivestrives to provide its shareholdersshareholder with a competitive long-term return on equity consistent with maintaining a risk capital adequacy ratio that is well above the minimum required by law.regulatory requirements. In respectconnection with the ownership change in 2003, the Swedish State has stated that SEK will have a restrictive dividend policy given the decrease of fiscal year 2002core capital resulting from the BoardSkr 1,240 million dividend paid to ABB Structured Finance Investment AB, the former holder of Directors has proposed that 67 percent of consolidated net income should be paid by the Company during 2003. In respect of fiscal years 2001 and 2000, the Company has paid dividends that represented 67 percent of its consolidated net income for those years.Class B Shares.
Nature of Trading Market
The Company's 7.375% Exchangeable Preferred Capital Securities which were issued on September 1, 1993, and Exchangeable Preferred Capital Securities, Series B, which were issued on December 5, 1997 (collectively,redeemed and delisted from the "Preferred Capital Securities")New York Stock Exchange in 2003. The Company's 2.875% Global Notes due January 26, 2007, which are listed on the New YorkLuxembourg Stock Exchange. AllExchange, are the only issue of the Preferred Capital SecuritiesCompany's Medium Term Notes, Series B (the "Medium Term Notes") listed on any exchange. Other issues of Medium Term Notes are traded in registered form and are held by one U.S. record holder.
38
Set forth below for each series of Preferred Capital Securities are the annual high and low market prices for each of the last five years, the high and low market prices for each full financial quarter since January 2001 and the high and low market prices for each of the last six months:over-the-counter market.
7.375% Exchangeable Preferred Capital Securities
| | High | Low | ||
|---|---|---|---|---|
| 1998 | 26.75 | 24.59 | ||
| 1999 | 26.56 | 20.63 | ||
| 2000 | 23.75 | 19.00 | ||
| 2001 | 25.94 | 23.63 | ||
| 2002 | 26.25 | 24.62 | ||
January through March 2001 | 23.25 | 23.75 | ||
| April through June 2001 | 25.16 | 24.63 | ||
| July through September 2001 | 25.59 | 24.30 | ||
| October through December 2001 | 25.63 | 24.91 | ||
| January through March 2002 | 25.93 | 24.90 | ||
| April through June 2002 | 25.75 | 24.62 | ||
| July through September 2002 | 25.90 | 25.18 | ||
| October through December 2002 | 26.25 | 25.22 | ||
| January through March 2003 | 25.95 | 25.12 | ||
October 2002 | 26.25 | 25.60 | ||
| November 2002 | 25.90 | 25.20 | ||
| December 2002 | 25.60 | 25.23 | ||
| January 2003 | 25.82 | 25.40 | ||
| February 2003 | 25.85 | 25.25 | ||
| March 2003 | 25.95 | 25.12 |
39
Exchangeable Preferred Capital Securities, Series B
| | High | Low | ||
|---|---|---|---|---|
| 1998 | 26.13 | 25.63 | ||
| 1999 | 26.38 | 20.75 | ||
| 2000 | 23.25 | 19.31 | ||
| 2001 | 25.16 | 23.13 | ||
| 2002 | 25.43 | 24.52 | ||
January through March 2001 | 25.48 | 23.38 | ||
| April through June 2001 | 24.84 | 24.25 | ||
| July through September 2001 | 25.00 | 24.41 | ||
| October through December 2001 | 25.16 | 24.50 | ||
| January through March 2002 | 25.32 | 24.70 | ||
| April through June 2002 | 25.05 | 24.52 | ||
| July through September 2002 | 25.30 | 24.82 | ||
| October through December 2002 | 25.43 | 24.91 | ||
| January through March 2003 | 25.70 | 25.07 | ||
October 2002 | 25.33 | 25.05 | ||
| November 2002 | 25.43 | 24.91 | ||
| December 2002 | 25.30 | 25.00 | ||
| January 2003 | 25.70 | 25.14 | ||
| February 2003 | 25.70 | 25.14 | ||
| March 2003 | 25.62 | 25.07 |
Item 10. Additional Information
Exchange Controls and Other Limitations Affecting Security Holders
There are currently no Swedish exchange control laws or laws restricting the import or export of capital. No approvals are necessary under Swedish law to enable the Company, at the times and in the manner provided in the Company's debt securities preferred capital securities and warrants and the indentures warrant agreements or other instruments pursuant to which such securities have been issued, to acquire and transfer out of Sweden all the amounts necessary to pay in full the principal of and/or interest or settlement amount on such securities, and any additional amounts payable with respect thereto, and no external approval would be required for any form of prepayment of such securities.
Under Swedish law and the Company's Articles of Association, there are no limitations on the right of non-resident or foreign owners to hold debt securities issued by the Preferred Capital Securities.Company.
Memorandum and Articles of Association
Set forth below is a brief summary of certain significant provisions of the Company's Articles of Association and Swedish law. This description does not purport to be complete and is qualified by reference to the Articles of Association, which have beenare filed as an exhibit to this Annual Report.
Registration
The Company's registry number with the Swedish Company Registry (Sw. bolagsregistret) held by the National Patent and Registrations Office (Sw. Patent- och registreringsverket) is 556084-0315.
The Company is a credit market company and as such under the supervision of the Financial Supervisory Authority (Sw. Finansinspektionen).
Under Article 2 of the Articles of Association, the Company's objective is to engage in financing activities in accordance with the Financing Business Act (1992:1610) and in connection therewith primarily promote the development of Swedish commerce and industry and Swedish export industry as well as otherwise engaging in Swedish and international financing activities on commercial grounds. SEK's financing activities include, but are not limited to: (i) the borrowing of funds through the issuance of bonds and other debt instruments, (ii) the granting of credits, (iii) the granting of credit guarantees, and (iv) holding of and conduct of trading in securities.
Certain Powers of Directors
Under the Swedish Companies Act (Sw. Aktiebolagslagen) (1975:1385), the boardBoard of directorsDirectors is ultimately responsible for the Company's organization and the management of its affairs.
A resolution of the boardBoard of directorsDirectors requires the approval of a majority of the members of the board. However, the boardBoard of directorsDirectors may delegate the authority to borrow and lend funds on behalf of the Company to the managing director/CEO or another employee, acting singly or jointly, provided that such financing transaction does not implicate the fundamental policy of the Company or otherwise is of great significance to the Company. There are no requirements on any member of the Board of Directors to own shares in the Company or to retire at a certain age.
Although the Articles of Association do not address voting by directors on matters in which they are interested, under the Companies Act, a director may not take part in the following:
Under the Companies Act, the Company may not lend funds to shareholders or the directors.
Under Swedish law, the managing director and at least half of the board members must be resident in a European Economic Area country unless exempted by the Swedish Patent and Registration Office. Under Swedish law, a director's term of office may not be more than four years, but is normallythe Company's Articles of Association require one year.year terms. A director may, however, serve any number of consecutive terms. Directors elected at the general meeting of the shareholders may be removed from office by a general meeting of the shareholders, and vacancies on the board, except when filled by a deputy director, may only be filled by a resolution of shareholders. Each year, if not otherwise stipulated in the Company's Articles of Association, one director is elected chairmanChairman of the board
Board by resolution of the boardBoard (unless elected by the shareholders) at the first meeting following its appointment.
Description of the Shares
The share capital of the Company shall be not less than Skr 700 million and not more than Skr 2,800 million. Shares may be issued in two Classes, Class A and Class B, respectively. Class A and Class B shares enjoy the same rights to dividends and rights to surplus in event of liquidation. Holders of Class A and Class B shares have a preferential right to subscribe for new shares of their respective Class in proportion to the number of shares of the same Class previously held by the shareholder. Further, all shareholders have a preferential right to subscribe for any shares remaining in any Class of shares as a result of one or more shareholders not having exercised their respective preferential right in
41
whole or in part. No shareholder is obliged to make additional capital contributions in the Company solely as a result of it being a shareholder.
Shareholder's rights may only be changed by a majority (and in certain cases a qualified majority) of the shares represented at a general meeting of the shareholders. However, all resolutions passed by a general meeting of the shareholders are subject to mandatory provisions of Swedish law, for practical purposes primarily the Swedish Companies Act. In particular, there are rules protecting minority shareholders and there is a general principle that all shares and shareholders shall be treated equally. Further, the Articles of Association of the Company may not be amended without the approval of the Swedish Government.
Annual General Meeting
The Annual General Meeting is held once a year within 6 months after the end of the preceding fiscal year. Holders of Class A and Class B shares alternate in electing the Chairman of each Annual General Meeting. Each person entitled to vote at the Annual General Meeting shall have the right to vote all the shares owned and represented by him. There are no restrictions on the rights of foreignersnon-Swedish nationals to own shares or vote their shares at the Annual General Meeting.
Swedish law provides that, in matters other than elections, resolutions are passed by a simple majority of the votes cast, except in certain circumstances provided by law, including:
In elections, the person receiving the most votes is deemed to have been elected.
Sweden
Article 11 of the Sweden and United States tax treaty signed September 1, 1994, which came into force on January 1, 1996, provides that interest on debt-claims of every kind arising in a contracting state, which is derived and beneficially owned by a resident of the other contracting state, not having a permanent establishment or a fixed base in the first mentioned state, shall be taxable only in that other state.
Under the aforementioned treaty, as well as Swedish law and regulations as currently in effect, no deduction or withholding in respect of any withholding taxes, levies, imposts and charges imposed by or for the account of Sweden or any political subdivision thereof or taxing authority therein would be applicable to any interest paid by SEK on the Preferred Capital Securities.
42
In the event the Company exercises its option to exchange Preferred Capital Securities for preference shares (for which changes in Swedish legislation and the Company's Articles of Association would be required), dividends on the preference shares paid to non-Swedish persons would be subject to Swedish withholding tax at the statutory rate, currently 30 percent, or a lower treaty rate, if applicable. Under the aforementioned Sweden-United States treaty the rate for eligible holders is reduced to 15 percent.
United StatesTaxation
The following is a summary outlines certain Swedish tax consequences relating to holders of certain United States federal incomeSEK's debt securities that are not considered to be Swedish residents for Swedish tax considerations that may be relevant to a holder of Preferred Capital Securities or,purposes, if the Company exercises its exchange option, preference shares ("Preference Shares") that is an individual resident or citizen of the United States, a corporation created or organized under the laws of the United States or any State thereof or thatnot otherwise is subject to United States federal income taxation on a net income basis in respect of a Security (a "United States holder").stated. The summary is based on the laws regulations, rulings and decisions nowof the Kingdom of Sweden as currently in effect, all of which are subject to change. This summary deals only with United States holders that will hold Preferred Capital Securities or Preference Shares as capital assets, and does not address tax considerations applicable to investors that may be subject to special tax rules, such as banks, insurance companies, dealers in securities or currencies, persons that will hold Preferred Capital Securities or Preference Shares as part of an integrated investment (including a "straddle") comprising a Preferred Capital Security or Preference Share and one or more other positions, or persons that have a "functional currency" other than the U.S. dollar.
effect. Investors should consult their ownprofessional tax advisors in determiningregarding the Swedish tax and other tax consequences to them(including the applicability and effect of holding Preferred Capital Securities or Preference Shares, including the application todouble taxation treaties) of acquiring, owning and disposing of debt securities in their particular situationcircumstances.
Payments of any principal amount or interest to the tax considerations discussed below, as well as the applicationholder of state, local, foreign or other tax laws.
For purposes of the United States Internal Revenue Code of 1986, as amended (the "Code"), and the U.S.-Swedenany debt security should not be subject to Swedish income tax, convention, owners of American Depositary Shares ("ADSs") representing Preference Shares will be treated as the owners of preference shares represented by those ADSs.
General. Although no authority existsprovided that addresses instruments having terms analogous to those of the Preferred Capital Securities, the Preferred Capital Securities should be treated as equity of the Companysuch holder is not resident in Sweden for United States federal income tax purposes. The Company intends to treat the Preferred Capital Securities as equity for U.S. federal incomeSwedish tax purposes and the following discussion assumesprovided that such treatment will be respected byholder does not have a permanent establishment or fixed base in Sweden to which the Internal Revenue Service ("IRS"). Accordingly, subject to the application of the "passive foreign investment company" rules discussed below, payments made on the Preferred Capital Securities, as well as on the Preference Shares, will be treated as dividends for United States federal income tax purposes to the extent paid out of the Company's current or accumulated earnings and profits. These dividends will be treated as foreign source income for U.S. foreign tax credit purposes and will not be eligible for the dividends received deduction generally allowed to corporations. Thus, thedebt securities are effectively connected.
Swedish withholding tax, or Swedish tax deduction, is not imposed on Preference Sharespayments of any principal amount or interest to a holder, except on certain payments of interest to a private individual (or an estate of a deceased individual) with residence in Sweden for tax purposes.
Generally, for Swedish corporations and private individuals (and estates of deceased individuals) with residence in Sweden for tax purposes, all capital income (e.g., interest and capital gain on a debt security) will be eligible for credit or, at the United States holder's election, deduction, subject to generally applicable limitations.
United States holders of Preferred Capital Securities or Preference Shares also will be subject to United States federal incometaxable. Specific tax with respect to any gain recognized on the sale, exchange, redemption or other disposition of Preferred Capital Securities or Preference Shares. Subject to the "passive foreign investment company" rules discussed below, such gain will be capital gain if a United States holder holds the Preferred Capital Securities or Preference Shares as a capital asset, and will be long-term capital gain if the Preferred Capital Securities or Preference Shares, as the caseconsequences, however, may be were held for more than one year. Gain realized by a United States holder on the sale, exchange,
43
redemption or other disposition of Preferred Capital Securities or Preference Shares generally will be treated as U.S. source income.
The exchange by a United States holder of Preferred Capital Securities for Preference Shares pursuant to the Company's exercise of its exchange option generally will not be a taxable event for U.S. federal income tax purposes. A United States holder's basis in the Preference Shares received in the exchange generally will be the same as the holder's basis in the Preferred Capital Securities surrendered in the exchange and its holding period for the Preference Shares received in the exchange generally will include the holding period for the Preferred Capital Securities exchanged therefor.
Passive Foreign Investment Company Status. It is expected that the Company will be a "passive foreign investment company" ("PFIC") within the meaning of the Code. However, as explained below, because the Preferred Capital Securities and Preference Shares provide for a fixed return and are not common (or participating) stock, United States holders that make a QEF election (as defined below) should not be adversely affected by the application of the PFIC rules to the Preferred Capital Securities and the Preference Shares.
If a United States holder elects to have the Company treated, with respect to such United States holder, as a "qualified electing fund" (hereinafter referred to as a "QEF election"), the electing United States holder would be required to include annually in gross income that United States holder's pro rata share of the Company's ordinary earnings. This amount generally should be the amount the United States holder would have received if all required distributions on the Preferred Capital Securities or Preference Shares for the taxable year were made. A United States holder that has made a QEF election and that sells Preferred Capital Securities or Preference Shares between dividend payment dates will be required to include in gross income its proportionate share of such earnings through the time of sale even though such shareholder will not receive the next dividend. Such shareholder will, however, increase its basis for the amount required to be included in income. Any amounts distributed by the Company out of earnings previously included in the income of a United States holder under the qualified electing fund rules generally would not be treated as a taxable dividend for United States federal income tax purposes. The Company intends to comply with all reporting requirements necessary for a United States holder to make a QEF election and will provide to registered holders of Preferred Capital Securities or Preference Shares that are United States holders such information as may be required to make such a QEF election effective. For any year that the Company is a PFIC, each United States holder who beneficially owns Preferred Capital Securities or Preference Shares during such year (regardless of whether or not it makes a QEF election) must file IRS Form 8621.
If a United States holder that holds Preferred Capital Securities or Preference Shares does not make a QEF election, that United States holder will be subject to special rules with respect to (i) any "excess distribution" by the Company to the United States holder (generally, any distributions received by the United States holder on the Preferred Capital Securities or Preference Shares in a taxable year that are greater than 125 percent of the average annual distributions received by the United States holder in the three preceding taxable years, or the United States holder's holding period for the Preferred Capital Securities or Preference Shares, if shorter) and (ii) any gain realized on the sale or other disposition of the Preferred Capital Securities or Preference Shares. Under these rules (hereinafter referred to as the "interest charge rules"), (i) the excess distribution or gain would be allocated ratably over the United States holder's holding period for the Preferred Capital Securities or Preference Shares, (ii) the amount allocated to the current taxable year would be treated as ordinary income, and (iii) the amount allocated to each prior year would be subject to tax at the highest tax rate in effect for that year and the interest charge generally applicable to underpaymentscertain categories of tax would be imposed with respect to the resulting tax attributable to each such prior year. For purposes of the foregoing rules, a United States holder that uses Preferred Capital Securities or Preference Shares as
44
security for a loan will be treated as having disposed of such Preferred Capital Securities or Preference Shares.
Because the Preferred Capital Securities or Preference Shares provide for dividends at a fixed rate, an "excess distribution" would be unlikely to occur unless dividends on the Preferred Capital Securities or Preference Shares were suspended during all or a portion of a taxable yearcorporations, e.g., investment companies and resumed in a subsequent taxable year. In addition, because the Preferred Capital Securities or Preference Shares provide for fixed dividends, it is unlikely that a United States holder would recognize gain on the sale or other disposition of Preferred Capital Securities or Preference Shares unless there was a decline in prevailing rates on comparable securities. In any event, a United States holder can avoid the consequence of the interest charge rules by making a QEF election.
Holders of "marketable stock" in a company that is a PFIC also may be able to avoid the interest charge rules by making an election to be taxed currently on a mark-to-market basis on annual increases or decreases in the market value of such stock. United States holders may wish to consult with their tax advisors as to the availability and desirability of making such a mark-to-market election.
State and Local Taxes. United States holders may be liable for state and local taxes on income or gain with respect to the Preferred Capital Securities or Preference Shares. Prospective investors are advised to consult with their own tax advisors concerning the state, local and any other tax consequences of the purchase, ownership and disposition of Preferred Capital Securities or Preference Shares.
Information Reporting and Backup Withholding. Dividends and payments of the proceeds on a sale of Preferred Capital Securities or ADSs representing Preference Shares, paid within the United States or through certain U.S.-related financial intermediaries, are subject to information reporting and may be subject to backup withholding unless the holder (1) is a corporation or other exempt recipient or (2) provides a taxpayer identification number and certifies (on IRS Form W-9) that no loss of exemption from backup withholding has occurred.life insurance companies.
Documents on Display
The Company files reports and other information with the SEC. You can request copies of these documents, upon payment of a duplicating fee, by writing to the SEC. You may also read and copy these documents at the SEC's public reference room in Washington, D.C.:
Room 1024, Judiciary Plaza
450 Fifth Street, N.W.
Washington, D.C. 20549
Please call the SEC at 1-800-SEC-0330 for further information on its public reference rooms, including those in New York and Chicago. Some of the Company's filings are also available on the SEC's website athttp; http://www.sec.gov.
Item 11. Quantitative and Qualitative InformationDisclosures About Market Risk
SEK's assignment is to promote the development and international competitiveness of trade and industry by providing long-term, sustainable financing solutions. To fulfil this assignment SEK grants medium and long-term credits. Credits are often at fixed interest rates, although credits at floating rates are also granted. The total time from the start of a credit agreement until final repayment can be as long as twenty years. Such long-term contracts require special attention to the management of the inherent risk exposures.
In addition to its own business, SEK administers the Swedish State's program for state-supported export credits and its concessionary credits program. Any deficits or surpluses from these programs are reimbursed by or paid to the State. Credit losses from these programs are not reimbursed by the State. SEK must therefore demand adequate collateral for credits granted under these programs just as it does for other credits. All credits are reported on SEK's balance sheet.
SEK funds its activities primarily by public issues and private placements in the international capital markets. Most borrowing is at fixed interest rates. In its funding operations SEK makes use of
traditional borrowing structures as well as more complicated structures, many of which are tailored to suit the needs of investors. In its borrowing, lending and investment of liquid assets, SEK uses various financial instruments, such as interest rate swaps, currency swaps, futures, credit derivatives and options. These instruments are mainly used to hedge or reduce exposures.
SEK's Basic Policies
SEK's Board of Directors has adopted the following basic policies, which are designed to give its shareholder a competitive long-term return on equity. These basic policies are then broken down into policies for managing different types of risk exposure.
The basic policies are:
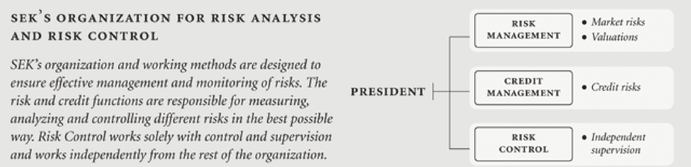
Credit or Counterparty Risks
A credit or counterparty risk represents the risk of loss that would occur if a borrower and its guarantors are unable to perform in accordance with the terms and conditions of a contract. SEK manages counterparty risks with the aid of a system which includes routines for credit rating, limits, risk classification and monitoring procedures. The system takes into account differences between exposures to different countries, sectors, groups of counterparties and individual counterparties, as well as between different types of risk. Most of SEK's counterparties are rated by one or more recognized international rating agencies. SEK has an internal rating system for counterparties that lack such a rating. SEK's executive committee may establish counterparty exposure limits up to certain levels approved by the Board of Directors. Limits above these levels can only be established by the Board of Directors or the Credit Committee whose members are from the Board of Directors and the Executive Committee.
SEK's credit policy limits the companies and states to which it is prepared to assume risk exposure to the following:
In 1997, SEK's Board of Directors decided to allow exposure to credit risks of other than traditional types. This means that SEK, within the framework of its credit risk policy, in certain cases may grant credits for project financing, i.e., credits for which repayment depends entirely on the cash flow generated by the project. At year-end 2003 the volume of such credits outstanding was Skr 173 million (2002: 153). In addition, such credits committed but not yet disbursed amounted to Skr 129 million (2002: 5).
In order to reduce the counterparty risk exposures that may arise from derivative contracts, SEK strives to obtain collateral or mark-to-market agreements from its counterparties before entering into derivative contracts. These agreements oblige SEK's counterparties to provide collateral to SEK in the form of first-class securities and blocked funds. The contracts can also be adjusted if the market values of the contracts exceed set levels or if the counterparty's rating falls below a certain set level. These levels are determined individually and agreed with each counterparty.
One key aspect of counterparty exposure is duration, as shown in the following graph:
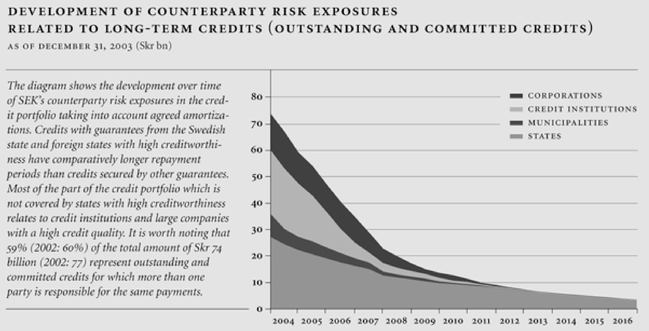
The majority of credits granted by SEK comprise long-term financing which supports Swedish exports. Measured by revenues, the largest markets for the export of goods from Sweden are Western Europe and North America. However, exports to other, more or less developed, markets are also important. Consequently, there is a financing need for transactions which involve buyers in many different countries with varying credit quality. Pursuant to its counterparty risk policy, SEK is selective in accepting any type of risk exposure. This policy seeks to ensure that SEK is not dependent on the creditworthiness of individual buyers of Swedish goods and services nor on the countries in which they are domiciled. Dependence is instead on the creditworthiness of other counterparties, which have assumed responsibility, for example by guaranteeing repayment of the credit. These counterparties are
often other than the buyers and have a higher creditworthiness. Counterparty risk exposures are shown in the two following tables:
COUNTERPARTY RISK EXPOSURES
(Skr bn)
Consolidated Group and Parent Company:
| | Total | Credits & Interest-bearing securities | Derivatives, Undisbursed credits, etc. | |||||||||||||||||||||
|---|---|---|---|---|---|---|---|---|---|---|---|---|---|---|---|---|---|---|---|---|---|---|---|---|
| | 12/2003 | 12/2002 | 12/2003 | 12/2002 | 12/2003 | 12/2002 | ||||||||||||||||||
| Classified by type of counterparty | ||||||||||||||||||||||||
| Amount | % | Amount | % | Amount | % | Amount | % | Amount | % | Amount | % | |||||||||||||
| State | 29.7 | 18 | 37.8 | 27 | 24.2 | 17 | 32.5 | 26 | 5.5 | 26 | 5.3 | 33 | ||||||||||||
| Municipalities | 9.5 | 6 | 5.8 | 4 | 9.3 | 6 | 5.7 | 5 | 0.2 | 1 | 0.1 | 1 | ||||||||||||
| Mortgage institutions | 5.2 | 3 | 4.2 | 3 | 5.2 | 4 | 4.2 | 3 | — | — | — | — | ||||||||||||
| Banks | 58.5 | 36 | 47.0 | 33 | 50.3 | 36 | 41.8 | 34 | 8.2 | 39 | 5.2 | 32 | ||||||||||||
| Other credit institutions | 41.6 | 26 | 27.9 | 20 | 35.1 | 25 | 22.6 | 18 | 6.5 | 31 | 5.3 | 33 | ||||||||||||
| Others | 17.1 | 11 | 17.7 | 13 | 16.4 | 12 | 17.5 | 14 | 0.7 | 3 | 0.2 | 1 | ||||||||||||
| TOTAL | 161.6 | 100 | 140.4 | 100 | 140.5 | 100 | 124.3 | 100 | 21.1 | 100 | 16.1 | 100 | ||||||||||||
The table shows the breakdown, by counterparty category, of SEK's total counterparty risk expenses related to credits, interest-bearing securities and off-balance sheet items.
CREDITS OUTSTANDING (INCL. COMMITTED CREDITS)
BORROWERS (PRIMARY OBLIGERS) BY REGION AND RELATED RISK COUNTERPARTIES
(TAKING INTO ACCOUNT GAURANTEES AND OTHER COLLATERAL) BY REGION AND CATEGORY.
| | | At December 31, 2003 Domicile and category of the related counterparties, to whose risk SEK is exposed | ||||||||||||||||||||||||
|---|---|---|---|---|---|---|---|---|---|---|---|---|---|---|---|---|---|---|---|---|---|---|---|---|---|---|
| | | Sweden | Other Nordic Area | Other Western Europe & U.S. | ||||||||||||||||||||||
| Domicile of borrowers | Total amount | Sum | Govern- ment & Munici- palities | Bank | Corpo- ration | Sum | Govern- ment | Bank | Corpo- ration | Sum | Govern- ment | Bank | Corpo- ration | |||||||||||||
| | | (Skr billions) | ||||||||||||||||||||||||
| Africa | 1.4 | 1.4 | 1.3 | 0.1 | ||||||||||||||||||||||
| Asia | 8.1 | 6.1 | 5.8 | 0.2 | 0.1 | 0.8 | 0.7 | 0.1 | 1.2 | 0.3 | 0.9 | |||||||||||||||
| Latin America | 5.6 | 4.5 | 4.1 | 0.3 | 0.1 | 0.1 | 0.1 | 1.0 | 0.3 | 0.5 | 0.2 | |||||||||||||||
| North America | 1.1 | 0.5 | 0.3 | 0.2 | 0.6 | 0.2 | 0.4 | |||||||||||||||||||
| Sweden | 31.5 | 26.1 | 10.0 | 8.5 | 7.6 | 5.4 | 5.4 | |||||||||||||||||||
| Other Nordic Area | 9.1 | 6.8 | 1.6 | 1.7 | 3.5 | 2.3 | 2.3 | |||||||||||||||||||
| Other Western Europe | 3.3 | 0.1 | 0.1 | 3.2 | 3.2 | |||||||||||||||||||||
| Baltic Area | 0.1 | 0.1 | 0.1 | |||||||||||||||||||||||
| Other Eastern Europe | 0.7 | 0.2 | 0.2 | 0.5 | 0.5 | |||||||||||||||||||||
| Total | 60.9 | 38.9 | 21.8 | 9.0 | 8.1 | 7.7 | 2.3 | 1.9 | 3.5 | 14.3 | 0.6 | 13.0 | 0.7 | |||||||||||||
A specific type of counterparty risk is known as settlement risk. Settlement risk is the risk of loss corresponding to the change in market value if a counterparty who has completed a deal defaults before fulfilling its part of the transaction. Separate settlement limits have been set for certain counterparties. Such limits have been set not only for the traditional types of counterparties, but also for certain smaller institutions. For these smaller institutions, the individual limits may amount to only some ten million Swedish kronor.
Market Risks
A market risk represents the risk of loss that would occur if the value of a contract should change due to changes in market conditions, such as interest rates or exchange rates.
All individual financial instruments are subject to market risk. A change in the market value of an instrument also changes the counterparty risk of that instrument.
In principle, the longer the remaining maturity of an instrument, the greater its potential market risk. However, maturity is only one factor that affects market risk. SEK's potential market risk related to individual contracts and counterparties is large since SEK's business is focused on long-term transactions and its lending is denominated in a number of currencies and mostly carries fixed interest rates. However, the majority of these individual market risks are hedged by offsetting transactions.
SEK uses various techniques to assess and manage market risks which are designed to provide a clear picture and good control of such risks.
SEK funds its activities in all major capital markets.
Pending on-lending of borrowed funds, which normally have long maturities and fixed interest rates, the funds are swapped into liquid assets at floating interest rates. Later, when credits are granted, these liquid assets are sold and in most cases new swaps are entered into or the swaps are unwound. Since SEK uses complicated techniques and borrowing structures, which may include embedded options and formulas to determine repayment amounts, SEK is party to a large number of interest-rate related and currency-related contracts as well as equity-related and commodity-related contracts. Figures for derivative items are shown under Item 5, "Operating and Financial Review and Prospects—Liquidity, Capital Resources and Funding" in the table entitled "Capital Base and Required Capital".
Derivative contracts with positive values and negative values respectively, are reported on-balance sheet as one component of other assets and other liabilities respectively. See Note 1(q) to the Consolidated Financial Statements.
Credit Spread Risks
In line with SEK's efforts to develop its business while still maintaining a good control of risks, a portfolio was established in 2000 for investments exposed to market value changes due to changes in credit risk spreads ("credit spread market risk") in the underlying assets. The Board of Directors has set a limit for the credit spread market risk in this portfolio—measured as the change in market value, based on the assumption of immediate shifts in the relevant credit spreads. Different changes—dependent on counterparty category, rating and sector, as well as duration for the individual assets—are assumed in the risk calculation. The credit spread market risk may not exceed Skr 100 million. At year-end 2003 the credit spread market risk was Skr 5.7 million.
Currency Risks
SEK grants credits in all major currencies and matches these with borrowings in the same currencies. SEK does not take currency risks, with the exception of short-term risks resulting from earnings generated by interest margins in foreign currencies. The Board of Directors has established a limit for currency risks, measured as the change in value of foreign currency positions resulting from a 10 percent change in the exchange rate for the Swedish kronor. The aggregate currency risk may not exceed Skr 40 million. At year-end 2003 the aggregate currency risk was Skr 2.5 million (2002: 10.6).
Interest Rate Risks
SEK takes certain interest rate risks in order to provide competitive, fixed rate credits in all maturities. Since SEK continually grants new credits at varying amounts with different disbursement periods and maturities, it is cost effective for SEK to manage the interest rate risk on a portfolio level in the various currencies. Consequently, there are varying, although limited, amounts that are exposed to interest rate risk.
The Board of Directors has established the following limits for interest rate risks:
SEK's interest rate risks, as defined above, related to shifts in the yield curve for foreign currencies amounted to Skr 28.0 million at year-end 2003, of which Skr 6.2 million was related to 2004. The total
period to which the risk is attributable exceeds ten years. The major part of this risk pertains to U.S. dollars, euros and Swiss francs.
The interest rate risk, as defined above, related to changes in the yield curve for Swedish kronor amounted to Skr 19.2 million at year-end 2003, of which Skr 16.5 million was related to 2004.
Perpetual subordinated debt with related hedging transactions, as well as the assets in which shareholders' funds and untaxed reserves are invested, are excluded from the calculation of these interest rate risks.
At year-end 2003, SEK's shareholders' funds and untaxed reserves were invested in fixed income assets representing lending and securities Skr 3.8 billion, and SEK's office building Skr 0.1 billion.
SEK's policy is to invest equity in assets with medium-term maturities, in order to ensure a stable, long-term return on shareholders' funds. The average remaining maturity on the above-mentioned investments, which total Skr 3.8 billion, is two years.
At year-end 2003, SEK had Skr 2,546 million of perpetual subordinated debt outstanding. The interest rate risk related to Skr 1,085 million of this volume was hedged with interest rate swaps with maturities between 2019 and 2023.
Funding and Liquidity Risks
A funding and liquidity risk represents the risk of loss that would occur if commitments could not be met due to a deficit in borrowing or liquidity, so-called cash flow mismatches.
SEK's policy is to fund all lending commitments throughout their maturity. This allows SEK to grant new credits whenever needed. Equally, SEK can avoid taking up new borrowing in the capital markets over long periods if the terms offered are considered unfavorable. Although SEK's policy means that SEK should never be forced to raise new borrowings to meet its commitments, SEK has established a large number of long-term as well as short-term borrowing programs all over the world. These programs reduce dependence on individual markets and their liquidity. In addition, SEK also has access to certain back-up credit facilities for its short-term borrowing programs.
The development over time of SEK's available funds, and of its outstanding and committed credits at year-end 2003, is shown in the following diagram:
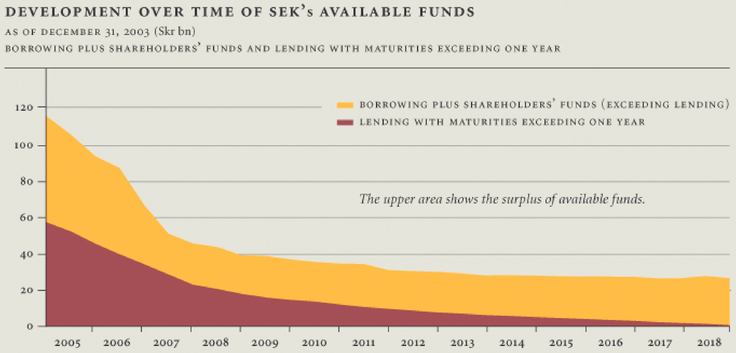
Legal Risks
A legal risk represents the risk of loss that would occur if a transaction could not be completed as planned due to some legal obstacle, such as inaccurate documentation or non-enforceability of certain conditions.
Legal risks are reduced by involving experienced internal decision makers, in-house and external legal advisors, and administrative staff. Knowledge development and a high level of integrity are encouraged among the staff.
The complexity of the documentation for a transaction usually varies with the complexity of the underlying transaction. However, SEK tries as far as possible to use standardized terms and conditions in all agreements. Strict policies apply in this regard.
In recent years there has been a trend for major borrowers with their own public borrowing programs based on standard documentation to require the use of such documentation when raising traditional loans. Provided such documentation meets SEK's requirements, SEK is prepared to accept this.
Operations and Systems Risks
Operations and systems risks represent the risk of loss if human error or fraud should occur or if a system should fail to operate as intended.
Internal instructions regarding decision-making processes and control procedures are established by the Board of Directors or by the President. Transactions and risks are reported using set forms and by departments other than those carrying out the transactions.
SEK does not develop its own computer systems, with the exception of some applications and interfaces that are specially adapted for SEK's operations. Further, SEK rents its new main treasury system from an external supplier. There are maintenance and development agreements with external parties. Strict back-up routines are applied in the IT Function in order to reduce the risk of loss of information. The IT Function also have access to external hardware back-up in the event of damage to SEK's equipment.
Risk Control
The objective of Risk Control is to further improve the quality and control of all risk reporting to the Board of Directors and to improve control of the conformity and functionality of internal instructions and authorizations. Risk Control works independently from the rest of the organization and functions as an extra level of control over and above other internal control systems. Risk Control works solely with control and supervision.
The unit reports directly to the President, and in certain cases is obliged to report to the Chairman of the Board and the auditors. Risk Control works in a systematic manner in accordance with a plan adopted by the Board of Directors on a yearly basis.
The plan also specifies the formats and regularity of reporting to the President, the Board of Directors and the auditors. An overall identification of all types of risks associated with SEK's business is required so that these objectives can be met. The intention is to be able to assess different types of risks, their relative importance, and the quality and accuracy of the routines, measurements and reports used in risk management. The risk areas monitored are primarily counterparty risk and market risk, but Risk Control also controls legal risk, operational risk, systems risk and to some extent liquidity risk.
Risk Control also examines and evaluates SEK's organization, routines and internal control. Good internal control means that the business is organized so that it is conducted in compliance with applicable law and regulations and is in accordance with adopted policies and instructions.
A high level of internal control is maintained by:
Risk Control has the task of checking compliance with changes in decision-making rules, routines, reporting and risk management. These controls are always carried out in close cooperation with the employees responsible for day-to-day business in order to raise awareness of and understanding for such activities.
Risk Control is also tasked with examining agreements entered into by SEK, primarily credit and borrowing agreements. Other types of agreements and commitments are also examined. The main purpose of such control is to verify that the agreements are formulated in line with SEK's established policies.
Quantitative information about market risk inherent in derivative financial instruments, other financial instruments, and derivative commodity instruments
| | | | As of December 31, | | | As of December 31, | ||||||||||
|---|---|---|---|---|---|---|---|---|---|---|---|---|---|---|---|---|
| | | | 2002 | 2001 | | | 2003 | 2002 | ||||||||
| | | | (In millions of Skr) | | | (Skr million) | ||||||||||
| Trading | a) | Interest Rate Risk | — | — | a | ) | Interest Rate Risk | — | — | |||||||
| Swedish kronor | — | — | Swedish kronor | — | — | |||||||||||
| Other currencies | — | — | Other currencies. | — | — | |||||||||||
| b) | Foreign Currency Exchange Risk | — | — | b | ) | Foreign Currency Exchange Risk | — | — | ||||||||
| c) | Commodity Price Risk | — | — | c | ) | Commodity Price Risk | — | — | ||||||||
| d) | Other Relevant Market Risk | — | — | d | ) | Other Relevant Market Risk | — | — | ||||||||
Other Than Trading | a) | Interest Rate Risk | — | — | a | ) | Interest Rate Risk | — | — | |||||||
| Swedish kronor | 39 | 43 | Swedish kronor | 19 | 39 | |||||||||||
| Other currencies | 81 | 51 | Other currencies | 28 | 81 | |||||||||||
| b) | Foreign Currency Exchange Risk | 11 | 24 | b | ) | Foreign Currency Exchange Risk | 3 | 11 | ||||||||
| c) | Commodity Price Risk | — | — | c | ) | Commodity Price Risk | — | — | ||||||||
| d) | Other Relevant Market Risk | 14 | 11 | d | ) | Other Relevant Market Risk | 6 | 14 | ||||||||
Definitions
General Method
The method that has been chosen for representing market risk in derivative financial instruments is a sensitivity analysis expressing the potential loss in fair values from selected hypothetical changes in market rates and prices. The changes are chosen as to reflect reasonably possible—near-term—changes in those rates and prices. The changes are not less than ten percent of end of period market rates or prices.
Interest Rate Risk
The risk is defined as the higher of (i) the parallel-shift interest rate-change risk, calculated based on the assumption of a one-percentage point interest rate-change at all maturities, and (ii) the twist/directional interest rate-change risk, calculated based on the assumption of changes of the interest-rates in different directions at different maturities. Interest rate risk is calculated for items reported on or off balance sheet.
Foreign Currency Exchange Risk
Foreign currency exchange risk is defined as the change in fair values for items reported, on or off balance sheet, which would be the result of a change in the value of the Swedish kronakronor by ten percent.
Instruments included in the calculation
All relevant instruments that have inherit market risk have been included in the calculation. This includeincludes derivative financial instruments, other financial instruments and derivative commodity instruments to the extent such instruments are not derivative financial instruments.
46
SEK funds its activities primarily by public issues and private placements in the international capital markets. The majority of the financing is obtained at fixed interest rates. SEK's funding makes use of traditional structures as well as more complicated structures, many of which are tailored to suit the needs of the investors.
In connection with its borrowing, lending, and placement of liquidity, SEK uses a variety of financial instruments, such as interest rate swaps, currency swaps, futures, and options. These instruments are used mainly to hedge or reduce exposures.
With regard to market risk exposures, see Item 5. "Operating and Financial Review and Prospects—Risk Management—Market Risks".
Item 12. Description of Securities Other than EquitiesEquity Securities
Not applicable.
Item 13. Defaults, Dividend Arrearages and Delinquencies
None.
Item 14. Material Modifications to the Rights of Security Holders and Use of Proceeds
None.
Item 15. Controls and Procedures
WithinAs of the 90 days prior toend of the date ofperiod covered by this report, the Company carried out an evaluation under the supervision and with the participation of the Company's management, including the President, the Chief Financial Officer and the Executive Director, Financial Control,Chief Accounting Officer, of the effectiveness of the design and operation of the Company's disclosure controls and procedures. There are inherent limitations to the effectiveness of any system of disclosure controls and procedures, including the possibility of human error and the circumvention or overriding of the controls and procedures. Accordingly, even effective disclosure controls and procedures can only provide reasonable assurance of achieving their control objectives. Based upon and as of the date of the Company's evaluation, the President, the Chief Financial Officer and the Executive Director, Financial ControlChief Accounting Officer concluded that the disclosure controls and procedures are effective in all material respects to ensure that information required to be disclosed in the reports the Company files and submits under the Securities Exchange Act of 1934 is recorded, processed, summarized and reported as and when required. There have been no significant changes in the Company's internal controls or in other factors that could significantlymaterially affect internal controls subsequent toduring the date of the evaluation.period covered by this report. Therefore, no corrective actions have been taken.
Item 16. [Reserved]16A. Audit Committee Financial Expert
The Company currently is not required to, and does not, have an audit committee. While certain members of the Board of Directors have varying degrees of financial and accounting experience, the Board has not concluded that any of its members is an audit committee financial expert within the meaning of the regulations adopted under the Sarbanes-Oxley Act of 2002.
In this context, it should be noted that the Company is under the supervision of the Swedish Financial Supervisory Authority. In addition to the auditors elected by the Annual General Meeting, the Swedish Financial Supervisory Authority appoints an independent accountant to audit on its behalf the Company's financial statements. Accordingly, the Company believes that there is a meaningful independent review of its financial statements beyond that performed by the independent auditors elected by the Annual General Meeting.
Item 16B. Code of Ethics
The Company has in place ethical guidelines that apply to all employees including all executive officers. The guidelines are consistent with and also in some aspects more restrictive than Swedish regulations. The ethical guidelines are designed to deter wrongdoing and promote:
Although these ethical guidelines do not meet the definition of "code of ethics" in the regulations adopted pursuant to the Sarbanes-Oxley Act of 2002, primarily because they do not specifically address matters relating to the Company's disclosure in reports and documents filed with the SEC and in other public communications, the Company believes that its ethical guidelines are sufficient for their stated purpose and to comply with Swedish regulations and guidelines.
Item 16C. Principal Accountant Fees and Services
The following table sets forth for the years ending December 31, 2003, and 2002, the costs related to aggregate fees by the principal independent auditors, KPMG.
Aggregated fees billed by the Company's independent auditors by category:
| | 2003 | 2002 | ||
|---|---|---|---|---|
| | (Skr million) | |||
| Audit fee | 5.5 | 4.1 | ||
| Audit-related fee | 1.1 | 3.6 | ||
| Tax fee | 0.2 | 0.2 | ||
| All other fee | 0.3 | 0.1 | ||
| Total fee | 7.1 | 8.0 | ||
"Audit fee" comprises the aggregate fees in relation with audit of consolidated and annual financial statements, reviews of interim financial statements and attestation services that are provided in connection with statutory, regulatory and stock exchange filings or engagements, and services provided in connection with issuances of senior debt. It should be noted that for 2003 certain costs related to audit of 2002 financial statements is included. "Audit-related fee" comprises fees charged for assurance and related services that are reasonably related to the performance of the audit or review of the financial statements. The major part of the audit-related fees is related to the examination of the reconciliation to U.S. GAAP, especially with regard to SFAS 133, Accounting for Certain Derivative Instruments and Certain Hedging Activities. "Tax fee" comprises fees for professional services rendered by the principal independent auditors for tax compliance and tax advice. "All other fees" comprises fees mainly related to the preparation for adoption of International Financial Reporting Standards as described in Note 1 to the Consolidated Financial Statements.
Not applicable.
The Company's consolidated and parent company financial statements for the fiscal year ended December 31, 2002,2003, prepared in accordance with Item 18 of Form 20-F, begin on page F-1 of this Report.
47
Consolidated Financial Statements
| Independent Auditors' Report | F-1 | |
| Consolidated and Parent Company Statements of Income | F-2 | |
| Statement of Income of the S-system | F-2 | |
| Consolidated and Parent Company Balance Sheets | F-3 | |
| Consolidated and Parent Company Statements of Cash Flows | F-4 | |
| Notes to the Consolidated Financial Statements | F-5 |
48
Exhibits
Documents filed as exhibits to this Annual Report.
1.1 | Articles of Association (incorporated by reference to the Form 6-K filed by the Company on January 22, 2001, file no. 1-8382). | |
2.1 | ||
2.2 | Deed of Covenant dated May 28, 2003 relating to up to Euro 25,000,000,000 aggregate principal amount of securities of SEK authorized to be issued under | |
2.3 | Fiscal Agency Agreement dated August 21, 1997 relating to securities other than Yen-denominated securities to be issued under the | |
2.4 | Deed of Covenant dated August 21, 1997 relating to securities other than Yen-denominated securities to be issued under the | |
2.5 | Agreement with Commissioned Companies for Bondholders dated October 28, 1997 relating to up to Yen 500,000,000,000 aggregate principal amount of securities of SEK | |
2.6 | Indenture, dated as of August 15, 1991, between the Company and the First National Bank of Chicago, as Trustee, relating to the | |
7.1 | Calculation of Ratios of Earnings to Fixed | |
7.2 | Calculation of Ratios of Earnings to Fixed | |
8.1 | ||
Certifications pursuant to Rule 13a-14(a) or Rule 15d-14(a). | ||
13.1 | Certifications Pursuant to 18 U.S.C Section 1350, as Adopted Pursuant to Section 906 of the Sarbanes-Oxley Act of 2002. | |
Consent of the Independent Auditors. | ||
49
To the Board of Directors of
AB Svensk Exportkredit:
We have audited the accompanying consolidated and parent company balance sheets of AB Svensk Exportkredit (Swedish Export Credit Corporation) (the "Company") as of December 31, 20022003 and 2001,2002, and the related consolidated and parent company statements of income and of cash flows for each of the years in the three-year period ended December 31, 2002.2003. These financial statements are the responsibility of the Company's management. Our responsibility is to express an opinion on these financial statements based on our audits.
We conducted our audits in accordance with auditing standards generally accepted in the United States of America. Those standards require that we plan and perform the audit to obtain reasonable assurance about whether the financial statements are free of material misstatement. An audit includes examining, on a test basis, evidence supporting the amounts and disclosures in the financial statements. An audit also includes assessing the accounting principles used and significant estimates made by management, as well as evaluating the overall financial statement presentation. We believe that our audits provide a reasonable basis for our opinion.
In our opinion, the consolidated and parent company financial statements referred to above present fairly, in all material respects, the respective financial position of the Company at December 31, 2003 and 2002, and 2001, and the respective results of operations and of cash flows for each of the years in the three-year period ended December 31, 2002,2003, in conformity with generally accepted accounting principles in Sweden.
Accounting principles generally accepted in Sweden vary in certain significant respects from accounting principles generally accepted in the United States of America. Application of accounting principles generally accepted in the United States of America would have affected consolidated results of operations for each of the years in the three-year period ended December 31, 2002 and consolidated shareholders' funds as of December 31, 2002 and 2001,Information related to the extent summarizednature and effect of such differences is presented in Note 33 to the consolidated financial statements. As more fully described in Note 33 to the consolidated financial statements, the originally reported amount of net income for the year ended December 31, 2001 under U.S GAAP has been restated.
| KPMG BOHLINS AB | |||
By: | /s/ Anders Linér Authorized Public Accountant | ||
Stockholm, Sweden
February 20, 20032004 except Note 3231 and
Note 33 which are as of March 31, 2003April 14, 2004
F-1
AB SVENSK EXPORTKREDIT
(Swedish Export Credit Corporation)
CONSOLIDATED STATEMENTS OF INCOME
| SEK (exclusive of the S-system) | 2002 | 2001 | 2000 | |||||||||
|---|---|---|---|---|---|---|---|---|---|---|---|---|
| | Consolidated Group | Parent Company | Consolidated Group | Parent Company | Consolidated Group | Parent Company | ||||||
| | (Skr m) | |||||||||||
| Interest revenues | 4,838.4 | 4,843.8 | 6,911.7 | 6,917.5 | 7,347.1 | 7,353.1 | ||||||
| Interest expenses | -4,040.2 | -4,040.2 | -6,081.0 | -6,081.2 | -6,451.6 | -6,452.1 | ||||||
| Net interest revenues(Notes 4, 5) | 798.2 | 803.6 | 830.7 | 836.3 | 895.5 | 901.0 | ||||||
| Commissions earned(Note 6) | 18.5 | 14.0 | 12.8 | 12.8 | 1.5 | 1.5 | ||||||
| Commissions incurred(Note 6) | -6.5 | -6.5 | -7.7 | -7.7 | -6.6 | -6.6 | ||||||
| Remuneration from the S-system | 33.0 | 33.0 | 36.7 | 36.7 | 36.7 | 36.7 | ||||||
| Net results of financial transactions(Notes 7, 8) | -0.7 | -0.7 | 6.0 | 6.0 | 18.6 | 18.6 | ||||||
| Other operating income(Note 9) | 0.9 | 1.8 | 8.2 | 8.1 | 16.8 | 16.8 | ||||||
| Administrative expenses(Note 10) | -166.4 | -170.4 | -150.7 | -157.0 | -125.7 | -132.0 | ||||||
| Depreciations of non-financial assets(Notes 11, 12, 13) | -7.5 | -5.4 | -6.3 | -4.2 | -5.6 | -3.4 | ||||||
| Other operating expenses(Note 9) | -5.1 | -4.3 | -0.7 | 0.0 | -1.3 | -0.7 | ||||||
| Operating profit | 664.4 | 665.1 | 729.0 | 731.0 | 829.9 | 831.9 | ||||||
Changes in untaxed reserves(Note 15) | n.a. | 15.0 | n.a. | 19.3 | n.a. | 157.4 | ||||||
Taxes(Note 16) | - -184.7 | - -188.5 | - -188.3 | - -193.7 | - -228.1 | - -272.2 | ||||||
| NET PROFIT FOR THE YEAR | 479.7 | 491.6 | 540.7 | 556.6 | 601.8 | 717.1 | ||||||
| SEK(exclusive of the S-system) | 2003 | 2002 | 2001 | |||||||||
|---|---|---|---|---|---|---|---|---|---|---|---|---|
| | Consolidated Group | Parent Company | Consolidated Group | Parent Company | Consolidated Group | Parent Company | ||||||
| | (Skr million) | |||||||||||
| Interest revenues | 4,432.9 | 4,438.5 | 4,838.4 | 4,843.8 | 6,911.7 | 6,917.5 | ||||||
| Interest expenses | -3,675.4 | -3,675.5 | -4,040.2 | -4,040.2 | -6,081.0 | -6,081.2 | ||||||
| Net interest revenues(Notes 4, 5) | 757.5 | 763.0 | 798.2 | 803.6 | 830.7 | 836.3 | ||||||
| Commissions earned (Note 6) | 13.0 | 9.1 | 18.5 | 14.0 | 12.8 | 12.8 | ||||||
| Commissions incurred (Note 6) | -17.1 | -17.1 | -6.5 | -6.5 | -7.7 | -7.7 | ||||||
| Remuneration from the S-system | 29.7 | 29.7 | 33.0 | 33.0 | 36.7 | 36.7 | ||||||
| Net results of financial transactions (Notes 7, 8) | 11.7 | 11.7 | -0.7 | -0.7 | 6.0 | 6.0 | ||||||
| Other operating income (Note 9) | 6.4 | 7.6 | 0.9 | 1.8 | 8.2 | 8.1 | ||||||
| Administrative expenses (Note 10) | -189.5 | -191.9 | -166.4 | -170.4 | -150.7 | -157.0 | ||||||
| Depreciations of non-financial assets (Notes 11, 12, 13) | -15.5 | -13.4 | -7.5 | -5.4 | -6.3 | -4.2 | ||||||
| Other operating expenses (Note 9) | -0.9 | 0.0 | -5.1 | -4.3 | -0.7 | 0.0 | ||||||
| Operating profit | 595.3 | 598.7 | 664.4 | 665.1 | 729.0 | 731.0 | ||||||
Changes in untaxed reserves (Note 15) | n.a. | 15.4 | n.a. | 15.0 | n.a. | 19.3 | ||||||
Taxes (Note 16) | - -167.8 | - -172.5 | - -184.7 | - -188.5 | - -188.3 | - -193.7 | ||||||
| NET PROFIT FOR THE YEAR | 427.5 | 441.6 | 479.7 | 491.6 | 540.7 | 556.6 | ||||||
The above income statements do not include the S-system,
the results of which are shown below.
S-system
| | 2002 | 2001 | 2000 | |||||||||
|---|---|---|---|---|---|---|---|---|---|---|---|---|
| S-system | 2003 | 2002 | 2001 | |||||||||
| | (Skr m) | (Skr million) | ||||||||||
| Interest revenues | 592.5 | 622.7 | 584.9 | 443.4 | 592.5 | 622.7 | ||||||
| Interest expenses | -786.4 | -853.3 | -919.0 | -510.9 | -786.4 | -853.3 | ||||||
| Net interest expenses (Notes 4, 5) | -193.9 | -230.6 | -334.1 | -67.5 | -193.9 | -230.6 | ||||||
| Remuneration to SEK | -33.0 | -36.7 | -36.7 | -29.7 | -33.0 | -36.7 | ||||||
| Foreign exchange effects(Note 7) | 2.6 | -12.9 | -7.8 | 7.4 | 2.6 | -12.9 | ||||||
| Reimbursement from the State | 224.3 | 280.2 | 378.6 | 89.8 | 224.3 | 280.2 | ||||||
| Net | 0.0 | 0.0 | 0.0 | 0.0 | 0.0 | 0.0 | ||||||
See accompanying notes to the consolidated financial statements.
F-2
AB SVENSK EXPORTKREDIT
(Swedish Export Credit Corporation)
| | | December 31, 2002 | December 31, 2001 | December 31, 2003 | December 31, 2002 | |||||||||||||||||||||||
|---|---|---|---|---|---|---|---|---|---|---|---|---|---|---|---|---|---|---|---|---|---|---|---|---|---|---|---|---|
| | | Consolidated Group | Parent Company | Of which S-system | Consolidated Group | Parent Company | Of which S-system | Consolidated Group | Parent Company | Of which S-system | Consolidated Group | Parent Company | Of which S-system | |||||||||||||||
| | | (Skr m) | (Skr million) | |||||||||||||||||||||||||
| ASSETS | ASSETS | |||||||||||||||||||||||||||
| Cash in hand | Cash in hand | 0.0 | 0.0 | 0.0 | 0.0 | 0.0 | 0.0 | 0.0 | 0.0 | 0.0 | 0.0 | 0.0 | 0.0 | |||||||||||||||
| Treasuries/government bonds (Note 18) | Treasuries/government bonds (Note 18) | 6,008.5 | 6,008.5 | 75.3 | 17,599.1 | 17,599.1 | 73.4 | 4,458.5 | 4,458.5 | 57.4 | 6,008.5 | 6,008.5 | 75.3 | |||||||||||||||
| Of which current assets | (5,031.2 | ) | (5,031.2 | ) | (75.3 | ) | (16,510.3 | ) | (16,510.3 | ) | (73.4 | ) | ||||||||||||||||
| Of which fixed assets | (977.3 | ) | (977.3 | ) | — | (1,088.8 | ) | (1,088.8 | ) | — | ||||||||||||||||||
| Of which current assets | (3,645.8 | ) | (3,645.8 | ) | (57.4 | ) | (5,031.2 | ) | (5,031.2 | ) | (75.3 | ) | ||||||||||||||||
| Of which fixed assets | (812.7 | ) | (812.7 | ) | — | (977.3 | ) | (977.3 | ) | — | ||||||||||||||||||
| Credits to credit institutions (Note 17) | Credits to credit institutions (Note 17) | 12,984.7 | 12,973.6 | 6,537.5 | 15,361.8 | 15,361.7 | 8,480.8 | 17,569.6 | 17,567.7 | 4,789.8 | 12,984.7 | 12,973.6 | 6,537.5 | |||||||||||||||
| Credits to the public (Note 17) | Credits to the public (Note 17) | 26,048.2 | 26,048.2 | 4,964.2 | 30,149.2 | 30,149.2 | 7,001.5 | 23,202.4 | 23,202.4 | 3,474.1 | 26,048.2 | 26,048.2 | 4,964.2 | |||||||||||||||
| Other interest-bearing securities (Note 18) | Other interest-bearing securities (Note 18) | 79,393.7 | 79,393.7 | — | 75,819.5 | 75,819.5 | — | 95,298.6 | 95,298.6 | — | 79,393.7 | 79,393.7 | — | |||||||||||||||
| Of which current assets | (49,001.9 | ) | (49,001.9 | ) | — | (47,479.0 | ) | (47,479.0 | ) | — | ||||||||||||||||||
| Of which fixed assets | (30,391.8 | ) | (30,391.8 | ) | — | (28,340.5 | ) | (28,340.5 | ) | — | ||||||||||||||||||
| Of which credits | (29,912.1 | ) | (29,912.1 | ) | — | (28,074.2 | ) | (28,074.2 | ) | — | ||||||||||||||||||
| Of which current assets | (63,752.0 | ) | (63,752.0 | ) | — | (49,001.9 | ) | (49,001.9 | ) | — | ||||||||||||||||||
| Of which fixed assets | (31,546.6 | ) | (31,546.6 | ) | — | (30,391.8 | ) | (30,391.8 | ) | — | ||||||||||||||||||
| Of which credits | (31,111.6 | ) | (31,111.6 | ) | — | (29,912.1 | ) | (29,912.1 | ) | — | ||||||||||||||||||
| Shares in subsidiaries (Note 19) | Shares in subsidiaries (Note 19) | n.a. | 113.5 | — | n.a. | 103.6 | — | n.a. | 113.5 | — | n.a. | 113.5 | — | |||||||||||||||
| Non-financial assets (Note 11, 12, 13) | Non-financial assets (Note 11, 12, 13) | 178.0 | 59.8 | — | 139.3 | 18.9 | — | 201.7 | 85.7 | — | 178.0 | 59.8 | — | |||||||||||||||
| Other assets (Note 20) | Other assets (Note 20) | 4,526.0 | 4,593.6 | 160.9 | 6,498.1 | 6,537.3 | 190.2 | 7,678.3 | 7,751.6 | 96.9 | 4,526.0 | 4,593.6 | 160.9 | |||||||||||||||
| Prepaid expenses and accrued revenues (Note 21) | Prepaid expenses and accrued revenues (Note 21) | 3,399.4 | 3,399.2 | 139.9 | 3,973.8 | 3,973.8 | 232.9 | 3,391.4 | 3,391.3 | 93.7 | 3,399.4 | 3,399.2 | 139.9 | |||||||||||||||
| Total assets | Total assets | 132,538.5 | 132,590.1 | 11,877.8 | 149,540.8 | 149,563.1 | 15,978.8 | 151,800.5 | 151,869.3 | 8,511.9 | 132,538.5 | 132,590.1 | 11,877.8 | |||||||||||||||
LIABILITIES, ALLOCATIONS AND SHAREHOLDERS' FUNDS | LIABILITIES, ALLOCATIONS AND SHAREHOLDERS' FUNDS | |||||||||||||||||||||||||||
| Borrowing from credit institutions (Note 22) | Borrowing from credit institutions (Note 22) | 611.9 | 611.9 | 8.6 | 1,510.6 | 1,510.6 | 12.5 | 2,545.8 | 2,555.8 | 1.2 | 611.9 | 611.9 | 8.6 | |||||||||||||||
| Borrowing from the public (Note 22) | Borrowing from the public (Note 22) | 33.4 | 33.4 | 0.0 | 92.9 | 92.9 | 0.0 | 28.7 | 28.7 | 0.0 | 33.4 | 33.4 | 0.0 | |||||||||||||||
| Senior securities issued (Note 22) | Senior securities issued (Note 22) | 111,968.3 | 111,968.3 | 3,170.1 | 121,697.5 | 121,697.5 | 5,158.6 | 129,990.4 | 129,990.4 | 552.5 | 111,968.3 | 111,968.3 | 3,170.1 | |||||||||||||||
| Other liabilities (Note 23) | Other liabilities (Note 23) | 10,547.8 | 10,578.3 | 65.0 | 13,887.4 | 13,889.6 | 292.5 | 9,979.3 | 10,014.7 | 147.5 | 10,547.8 | 10,578.3 | 65.0 | |||||||||||||||
| Lending/(borrowing) between SEK and the S-system | Lending/(borrowing) between SEK and the S-system | — | — | 8,393.0 | — | — | 10,186.4 | — | — | 7,697.0 | — | — | 8,393.0 | |||||||||||||||
| Accrued expenses and prepaid revenues (Note 24) | Accrued expenses and prepaid revenues (Note 24) | 2,988.8 | 2,988.4 | 241.1 | 3,565.6 | 3,565.3 | 328.8 | 2,908.7 | 2,908.3 | 113.7 | 2,988.8 | 2,988.4 | 241.1 | |||||||||||||||
| Allocations (Note 25) | Allocations (Note 25) | 399.0 | 18.2 | — | 403.4 | 18.4 | — | 394.4 | 17.9 | — | 399.0 | 18.2 | — | |||||||||||||||
| Subordinated securities issued (Note 26) | Subordinated securities issued (Note 26) | 2,224.6 | 2,224.6 | — | 4,738.0 | 4,738.0 | — | 3,001.0 | 3,001.0 | — | 2,224.6 | 2,224.6 | — | |||||||||||||||
| Total liabilities and allocations | Total liabilities and allocations | 128,773.8 | 128,423.1 | 11,877.8 | 145,895.4 | 145,512.3 | 15,978.8 | 148,848.3 | 148,516.8 | 8,511.9 | 128,773.8 | 128,423.1 | 11,877.8 | |||||||||||||||
| Untaxed reserves (Note 15) | Untaxed reserves (Note 15) | n.a. | 1,360.0 | — | n.a. | 1,375.0 | — | n.a. | 1,344.6 | — | n.a. | 1,360.0 | — | |||||||||||||||
| Share capital | Share capital | 990.0 | 990.0 | — | 990.0 | 990.0 | — | 990.0 | 990.0 | — | 990.0 | 990.0 | — | |||||||||||||||
| Non-distributable reserves | Non-distributable reserves | 1,132.7 | 140.0 | — | 1,129.9 | 140.0 | — | 1,117.6 | 149.3 | — | 1,132.7 | 140.0 | — | |||||||||||||||
| Total non-distributable capital | Total non-distributable capital | 2,122.7 | 1,130.0 | — | 2,119.9 | 1,130.0 | — | 2,107.6 | 1,139.3 | — | 2,122.7 | 1,130.0 | — | |||||||||||||||
| Profit carried forward | Profit carried forward | 1,162.3 | 1,185.4 | — | 984.8 | 989.2 | — | 417.1 | 427.0 | — | 1,162.3 | 1,185.4 | — | |||||||||||||||
| Net profit for the year | Net profit for the year | 479.7 | 491.6 | — | 540.7 | 556.6 | — | 427.5 | 441.6 | — | 479.7 | 491.6 | — | |||||||||||||||
| Total distributable capital | Total distributable capital | 1,642.0 | 1,677.0 | — | 1,525.5 | 1,545.8 | — | 844.6 | 868.6 | — | 1,642.0 | 1,677.0 | — | |||||||||||||||
| Total shareholders' funds (Note 27) | Total shareholders' funds (Note 27) | 3,764.7 | 2,807.0 | — | 3,645.4 | 2,675.8 | — | 2,952.2 | 2,007.9 | — | 3,764.7 | 2,807.0 | — | |||||||||||||||
| Total liabilities, allocations and shareholders' funds | Total liabilities, allocations and shareholders' funds | 132,538.5 | 132,590.1 | 11,877.8 | 149,540.8 | 149,563.1 | 15,978.8 | 151,800.5 | 151,869.3 | 8,511.9 | 132,538.5 | 132,590.1 | 11,877.8 | |||||||||||||||
| COLLATERAL PROVIDED | COLLATERAL PROVIDED | |||||||||||||||||||||||||||
| Collateral provided | Collateral provided | None | None | None | None | None | None | None | None | None | None | None | None | |||||||||||||||
| Interest-bearing securities (Note 1 (l)). | ||||||||||||||||||||||||||||
| Subject to lending | 329.6 | 329.6 | — | 109.4 | 109.4 | — | ||||||||||||||||||||||
CONTINGENT LIABILITIES (Note 28). | None | None | None | None | None | None | ||||||||||||||||||||||
| Interest-bearing securities (Note 1 (l)) | ||||||||||||||||||||||||||||
| Subject to lending | 108.9 | 108.9 | — | 329.6 | 329.6 | — | ||||||||||||||||||||||
CONTINGENT LIABILITIES (Note 28) | None | None | None | None | None | None | ||||||||||||||||||||||
COMMITMENTS | COMMITMENTS | |||||||||||||||||||||||||||
| Committed undisbursed credits (Note 28) | Committed undisbursed credits (Note 28) | 11,848.6 | 11,848.6 | 10,124.1 | 16,443.9 | 16,443.9 | 12,087.6 | 14,358.3 | 14,358.3 | 10,024.6 | 11,848.6 | 11,848.6 | 10,124.1 | |||||||||||||||
Specification of Change in Shareholders' Funds
Consolidated Group
| | 2003 | 2002 | |||
|---|---|---|---|---|---|
| | (Skr million) | ||||
| Opening balance of shareholders' funds | 3,764.7 | 3,645.4 | |||
| Dividend paid | (1,240.0 | ) | (360.4 | ) | |
| Net profit for the period | 427.5 | 479.7 | |||
| Closing balance of shareholders' funds (Note 27) | 2,952.2 | 3,764.7 | |||
See accompanying notes to the consolidated financial statements.
F-3
AB SVENSK EXPORTKREDIT
(Swedish Export Credit Corporation)
CONSOLIDATED STATEMENTS OF CASH FLOWS
| | 2002 | 2001 | 2000 | 2003 | 2002 | 2001 | ||||||||||||||||||
|---|---|---|---|---|---|---|---|---|---|---|---|---|---|---|---|---|---|---|---|---|---|---|---|---|
| (A) | Consolidated Group | Parent Company | Consolidated Group | Parent Company | Consolidated Group | Parent Company | Consolidated Group | Parent Company | Consolidated Group | Parent Company | Consolidated Group | Parent Company | ||||||||||||
| | (Skr m) | (Skr million) | ||||||||||||||||||||||
| Cash flows from operating activities | ||||||||||||||||||||||||
Net profit for the year | 479.7 | 491.6 | 540.7 | 556.6 | 601.8 | 717.1 | 427.5 | 441.6 | 479.7 | 491.6 | 540.7 | 556.6 | ||||||||||||
| Adjustments to reconcile net profit to net cash provided by operating activities: | ||||||||||||||||||||||||
| Changes in untaxed reserves | n.a | -15.0 | n.a. | -19.3 | n.a. | -157.4 | n.a | -15.4 | n.a | -15.0 | n.a. | -19.3 | ||||||||||||
| Increase(+)/decrease(-) in deferred taxes | -4.2 | 0.0 | -10.5 | -5.1 | -44.1 | n.a. | -4.3 | — | -4.2 | — | -10.5 | -5.1 | ||||||||||||
| Depreciations | 7.5 | 5.4 | 6.3 | 4.2 | 5.6 | 3.4 | 15.5 | 13.4 | 7.5 | 5.4 | 6.3 | 4.2 | ||||||||||||
| Increase(-)/decrease(+) in prepaid expenses and accrued revenues | 574.6 | 574.6 | 531.0 | 531.0 | -102.3 | -102.3 | 8.0 | 8.0 | 574.6 | 574.6 | 531.0 | 531.0 | ||||||||||||
| Decrease(-)/increase(+) in accrued expenses and prepaid revenues | -576.9 | -577.0 | -944.1 | -943.7 | 286.5 | 286.4 | -80.1 | -80.0 | -576.9 | -577.0 | -944.1 | -943.7 | ||||||||||||
| Decrease(+)/increase(-) in derivative instruments with positive or negative values | -1,691.5 | -1,691.5 | -188.6 | -188.6 | 11,078.1 | 11,078.1 | ||||||||||||||||||
| Decrease(+)/increase(-) in derivative instruments | ||||||||||||||||||||||||
| with positive or negative values | -2,342.3 | -2,342.3 | -1,691.5 | -1,691.5 | -188.6 | -188.6 | ||||||||||||||||||
| Other changes—net | 323.7 | 323.7 | -1,589.0 | -1,725.1 | -283.0 | -278.1 | -1,378.7 | -1,380.5 | 323.7 | 323.7 | -1,589.0 | -1,725.1 | ||||||||||||
| Disbursements of credits (B) | -7,896.4 | -7,896.4 | -17,576.0 | -17,576.0 | -7,759.8 | -7,759.8 | ||||||||||||||||||
| Disbursements of credits(B) | -9,953.8 | -9,953.8 | -7,896.4 | -7,896.4 | -17,576.0 | -17,576.0 | ||||||||||||||||||
| Repayments of credits, including effects of currency translations | 14,598.7 | 14,598.6 | 17,562.7 | 17,562.8 | 3,567.2 | 3,567.2 | 17,333.7 | 17,333.7 | 14,598.7 | 14,598.6 | 17,562.7 | 17,562.8 | ||||||||||||
| Net increase(-)/decrease(+) in bonds and securities held (C) | 8,016.4 | 8,016.5 | 17,517.9 | 17,517.9 | -21,887.7 | -21,887.7 | ||||||||||||||||||
| Other changes related to credits—net (B) | -224.2 | -213.1 | 2,169.5 | 2,169.5 | 150.6 | 150.6 | ||||||||||||||||||
| Net increase(-)/decrease(+) in bonds and securities held(C) | -14,354.8 | -14,354.9 | 8,016.4 | 8,016.5 | 17,517.9 | 17,517.9 | ||||||||||||||||||
| Other changes related to credits—net(B) | -9,119.0 | -9,128.3 | -224.2 | -213.1 | 2,169.5 | 2,169.5 | ||||||||||||||||||
| Net cash (used in)/provided by operating activities | 13,607.4 | 13,617.4 | 18,019.9 | 17,884.2 | -14,387.1 | -14,382.5 | -19,448.3 | -19,458.5 | 13,607.4 | 13,617.4 | 18,019.9 | 17,884.2 | ||||||||||||
| Cash flows from investing activities | ||||||||||||||||||||||||
Capital expenditures | - -46.2 | - -56.2 | - -5.0 | - -5.1 | - -6.5 | - -6.5 | -39.3 | -39.3 | -46.2 | -56.2 | -5.0 | -5.1 | ||||||||||||
| Net cash (used in)/provided by investing activities | -46.2 | -56.2 | -5.0 | -5.1 | -6.5 | -6.5 | -39.3 | -39.3 | -46.2 | -56.2 | -5.0 | -5.1 | ||||||||||||
| Cash flows from financing activities | ||||||||||||||||||||||||
| Net decrease (-)/increase (+) in originally short-term debt | 5,968.8 | 5,968.8 | -41,809.8 | -41,809.8 | 21,777.3 | 21,777.3 | -5,972.9 | -5,972.9 | 5,968.8 | 5,968.8 | -41,809.8 | -41,809.8 | ||||||||||||
| Proceeds from issuance of long-term senior debt | 44,926.5 | 44,926.5 | 37,957.0 | 37,957.0 | 18,416.5 | 18,416.5 | 61,929.3 | 61,929.3 | 44,926.5 | 44,926.5 | 37,957.0 | 37,957.0 | ||||||||||||
| Proceeds from issuance of long-term subordinated debt | — | — | — | — | 442.9 | 442.9 | 2,546.3 | 2,546.3 | 1,323.8 | 1,323.8 | — | — | ||||||||||||
| Repayments of long-term senior subordinated debt | -2,513.4 | -2,513.4 | — | — | — | — | -1,765.0 | -1,765.0 | -3,733.7 | -3,733.7 | — | — | ||||||||||||
| Repayments of long-term senior debt, including effects of currency translations on all debt | -67,592.3 | -67,592.3 | -11,655.7 | -11,519.9 | -25,912.8 | -25,917.4 | ||||||||||||||||||
| Adjustment of long-term subordinated debt due to currency translations | -4.9 | -4.9 | -103.5 | -103.5 | — | — | ||||||||||||||||||
| Repayments of long-term senior debt, including effects of currency translations | -48,742.6 | -48,732.4 | -67,592.3 | -67,592.3 | -11,655.7 | -11,519.9 | ||||||||||||||||||
| Dividend paid | -360.4 | -360.4 | -401.0 | -401.0 | -1,725.1 | -1,725.1 | -1,240.0 | -1,240.0 | -360.4 | -360.4 | -401.0 | -401.0 | ||||||||||||
| Own long-term debt repurchased, net change | 6,009.6 | 6,009.6 | -2,105.4 | -2,105.4 | 1,394.8 | 1,394.8 | 12,737.4 | 12,737.4 | 6,009.6 | 6,009.6 | -2,105.4 | -2,105.4 | ||||||||||||
| Net cash (used in)/provided by financing activities | -13,561.2 | -13,561.2 | -18,014.9 | -17,879.1 | 14,393.6 | 14,389.0 | 19,487.6 | 19,497.8 | -13,561.2 | -13,561.2 | -18,014.9 | -17,879.1 | ||||||||||||
| Net increase(+)/decrease(-) in cash and cash equivalents | 0.0 | 0.0 | 0.0 | 0.0 | 0.0 | 0.0 | 0.0 | 0.0 | 0.0 | 0.0 | 0.0 | 0.0 | ||||||||||||
| Cash and cash equivalents at beginning of period | 0.0 | 0.0 | 0.0 | 0.0 | 0.0 | 0.0 | 0.0 | 0.0 | 0.0 | 0.0 | 0.0 | 0.0 | ||||||||||||
| Cash and cash equivalents at end of period (B) | 0.0 | 0.0 | 0.0 | 0.0 | 0.0 | 0.0 | ||||||||||||||||||
| Cash and cash equivalents at end of period(B) | 0.0 | 0.0 | 0.0 | 0.0 | 0.0 | 0.0 | ||||||||||||||||||
See accompanying notes to the consolidated financial statements.
F-4
AB SVENSK EXPORTKREDIT
(Swedish Export Credit Corporation)
NOTES TO CONSOLIDATED FINANCIAL STATEMENTS
All amounts are in Skr million, unless otherwise indicated.
Swedish Financial Supervisory Authority's regulations regarding Annual Reports
This annual report has been prepared in compliance with regulations of the Swedish Financial Supervisory Authority regarding annual reports for Credit Institutions and Securities Companies and the Swedish Financial Accounting Standards Council's recommendations.
Introductory Note
The Parent Company compared with the Consolidated Group
AB Svensk Exportkredit ("the Company")The Company reports separate Income Statements and Balance Sheet Statements for the Consolidated Group and the Parent Company.
The Consolidated Group (the "Consolidated Group" or the "Group") comprises SEK (the "Parent Company") and its wholly ownedwholly-owned subsidiaries AB SEKTIONEN and AB SEK Securities (the "Subsidiaries)"Subsidiaries"). AB SEKTIONEN's most material asset is its building, serving as SEK's headquarters, and it does not presently operate any business other than renting its building to SEK. AB SEK Securities is a securitessecurities company under the supervision of the Swedish Financial Supervisory Authority. AB SEK Securities was established duringin 2002.
The information in the following notes represents, unless otherwise stated, both the Consolidated Group and the Parent Company.
Note 1. Accounting principles applied
Introduction
Swedish accounting legislation, as well as the related accounting regulations of the Swedish Financial Supervisory Authority, have beenis adapted to applicable EU directives. The regulations apply to Swedish credit institutions, including SEK.
The regulations include, among other things, specific rules for "hedge accounting". Hedge accounting enables reporting based on common valuation principles for financial assets and financial liabilities which, acquired for that purpose, together hedge the holder against unfavorable changes in the net values of the same. Hedge accounting also has been applied also in prior years.
Implementation of International Financial Reporting Standards
According to the EU-regulation on the application of international accounting standards, consolidated accounts of companies with debt or equity instruments publicly traded should be prepared in conformity with the international accounting standards ("IAS") that have been endorsed for application in the EU from January 1, 2005. However, according to article 9 of the regulation, EU member states may decide that companies that have issued listed debt securities but not issued listed equity instruments on a regulated market in the EU may start the application of international accounting standards from January 1, 2007. It is suggested that this possibility is implemented in Swedish law. Since SEK will be subject to these transitional provisions, due to the fact that SEK has issued listed debt securities but not issued listed equity instruments, the application of international accounting standards will not be compulsory for SEK until January 1, 2007.
SEK has identified the accounting rules for financial instruments that are contained in IAS 39 and IAS 32 as the area where the implementation of IAS will have the highest impact compared to present accounting policies. In specific it is the detailed rules for "hedge accounting" in IAS 39 that are anticipated to create the most significant amendments to the present accounting policies of SEK. The present rules for hedge accounting according to Swedish GAAP differ significantly from the rules in IAS 39.
SEK has during 2003 started a conversion project for applying International Financial Reporting Standards ("IFRS"). The conversion project is still in an assessment phase, and there are no quantitative impact studies finalized.
The following accounting policies have been applied:
(a)Consolidation. The consolidated financial statements have been drawn up, in accordance with The Swedish Financial Accounting Standards Council's recommendation number 1:00, Consolidated Accounts, based on the purchase method. Thus, in the consolidation, the acquisition price of the shares of the Subsidiaries and the equity of the Subsidiaries, at the date of the acquisition, have been eliminated. The difference (surplus value) between the two amounts relates wholly to the building owned by the AB SEKTIONEN and is consolidated accordingly. Thus, the Consolidated Balance Sheet principally reflects the same situation as would have been the case if the Parent Company had directly owned the building. All intercompanyinter-company accounts and transactions have been eliminated in consolidation.
No untaxed reserves are reported in the Consolidated Balance Sheet, nor are revenues and expenses, including taxes, related to untaxed reserves reported in the Consolidated Income Statement. Instead, in the Consolidated Balance Sheet, the untaxed reserves are broken down by
F-5
(i) an after-tax portion, reported as one component of non-distributable reserves,capital, and (ii) a portion representing deferred taxes, reported as one component of "allocations"of"allocations". Any changes in the untaxed reserves are reported as adjustments to the relevant items in the Consolidated Balance Sheet. However, untaxed reserves are disclosed in the Balance Sheet of the Parent Company as are changes in untaxed reserves in the Income Statement of the Parent Company. Accordingly, some line items in the Balance Sheets and Income Statements are applicable only to the Parent Company or the Consolidated Group, as the case may be. For line items that are not applicable, the abbreviation "n.a." has been used.
(b)S-system. SEK administers, against compensation, the State's export credit support system, and the State's tied aid credit program (the "S-system"). Pursuant to agreements between SEK and the State, as long as any credits or borrowings remain outstanding, all interest differentials, financing costs and net foreign exchange losses under the S-system will be reimbursed by the State. Settlements of such are made in arrears for certain programs every four months and for other programs every three months. Claims for reimbursement from the State (and liabilities for reimbursement to the State) are reported as "Due from the State" (see also Note 20) until settled.
| Results in the S-System by Type of Credit | |||||||||||||||||||
|---|---|---|---|---|---|---|---|---|---|---|---|---|---|---|---|---|---|---|---|
| | CIRR credits | Concessionary credits | Net result for S-system | ||||||||||||||||
| | 2003 | 2002 | 2001 | 2003 | 2002 | 2001 | 2003 | 2002 | 2001 | ||||||||||
| | (Skr million) | ||||||||||||||||||
| Interest Revenues/(expenses) | 134.3 | 131.1 | 201.8 | (201.8 | ) | (325.0 | ) | (432.4 | ) | (67.5 | ) | (193.9 | ) | (230.6 | ) | ||||
| Remuneration to SEK | (21.7 | ) | (21.0 | ) | (20.5 | ) | (8.0 | ) | (12.0 | ) | (16.2 | ) | (29.7 | ) | (33.0 | ) | (36.7 | ) | |
| Foreign exchange differences | 7.4 | 2.6 | (12.9 | ) | — | — | — | 7.4 | 2.6 | (12.9 | ) | ||||||||
| Total | 120.0 | 112.7 | 168.4 | (209.8 | ) | (337.0 | ) | (448.6 | ) | (89.8 | ) | (224.3 | ) | (280.2 | ) | ||||
(c)S-system statements. Separate income statements are shown for the S-system. Amounts included in such income statements are not included in income statements of the Consolidated Group and the Parent Company.
With regard to balance-sheet statements, all amounts related to the S-system are included in the relevant amounts shown for the Consolidated Group and the Parent Company. However, in the balance-sheet statements are also included columns with the heading "Of which S-system", where the S-system-related items are shown separately.
Assets and liabilities related to the administration of the S-system are assets and liabilities, respectively, of SEK. However, the results under such system are settled between SEK and the State as described in Note 1 (b)1(b).
(d)Accrual basis accounting. The SEK-group applies the accrual basis of accounting. However, in the S-system certain items are reported on cash basis in compliance with an agreement between SEK and the State (see also Note 1(b)).
(e)Payment Settlement or business daytrade date reporting. The reporting on the balance sheet is based on business transaction days,trade date, however, in the case of credits and debt, on paymentsettlement days.
(f)Gross basis reporting. The reporting of all interest revenues and interest expenses is made on a gross basis with the exception of interest revenues and interest expenses related to derivative instruments. In accordance with the regulations of the Swedish Financial Supervisory Authority, interest revenues and interest expenses related to derivative instruments are reported on a net basis.
(g)Current and fixed financial assets. Financial assets are classified as "current financial assets" or "fixed financial assets".
(h)Untaxed reserves.reserves. In accordance with Swedish tax law, the Parent Company maintains certain untaxed reserves. (See also Note 1(a).)
(i)Currency translation. Assets and liabilities in foreign currencies have been translated to Swedish kronor at the year-end exchange rates (see Note 2). Currency exchange effects are included as one component of "net results of financial transactions".
Revenues and expenses denominated in foreign currencies are translated to Swedish kronor at the current exchange rate as of the respective day of accrual. Any changes in the currency
F-6
exchange rates between the relevant currencies and Swedish kronor related to the period between the day of accrual and the day of settlement are reported as currency exchange effects.
(j)Securities. The following principles have been applied with regard to interest-bearing securities ("securities" or "interest-bearing securities"):
Securities acquired with the purpose of hedging the return on SEK's equity during the tenor of the securities, and aimed to be held to maturity ("held-to-maturity account securities"), are classified as fixed financial assets and reported at amortized cost.
Securities included in interest-rate and currency-exchange-rate hedged transactions ("hedge account securities") are classified as current financial assets and reported—in accordance with the hedge accounting rules—at amortized cost. Hedge account securities are offset mainly by other items, mostly liabilities, with matching principal or notional amounts, interest rates and currencies, such that the Company's exposure to changes in net values of the same due to movements in interest and exchange rates is hedged.
Securities in the Trading Portfolio ("trading accountaccounts securities" or "Trading Securities"), as defined by the regulations of the Swedish Financial Supervisory Authority, are classified as current financial assets and reported at market value. (It should be noted that, in accordance with the Company's policies, only limited exposures to interest rates and/or currency fluctuations are allowed.) The difference between market value and amortized cost (unrealized net gains or losses) of Trading Securities is reported as one component of net results of financial transactions in accordance with the Swedish Financial Supervisory Authority's regulations.
Realized gains and losses in connection with sales of hedge account securities are deferred and amortized as one component of interest revenues or interest expenses, as the case may be, while such gains and losses in connection with sales of other securities are reported as one component of net results of financial transactions.
Credits granted against documentation in the form of interest-bearing securities, as opposed to traditional credit agreements, are reported on the balance sheet as one component of securities classified as fixed financial assets.
The reporting of securities will, according to regulations of the Swedish Financial Supervisory Authority, be broken down by two component categories, namely (i) "Treasuries,"Treasuries, etc., eligible for refinancing with central banks", and (ii) "Other interest-bearing securities". Since SEK has no legal right to refinance any securities with the Swedish Central Bank, the first heading may, inaccording to SEK's opinion, confuse the reader of the relevant statement. To avoid such confusion, SEK has determined to instead use the term "Treasuries/government bonds". All the above statements in this Note 1 (j) apply to both categories of securities, i.e., to "Treasuries/government bonds" and to "Other interest-bearing securities".
(k)Deposits. Under the regulations of the Swedish Financial Supervisory Authority, deposits with banks are reported as one component of "credits to credit institutions".
(l)Repurchase agreements and bond Bond lending. Repurchase agreements are reported as financial transactions on the balance sheet. Securities lent to other parties are reported as securities on the balance sheet. However, according to regulations of the Swedish Financial Supervisory Authority, securities/assets sold subject to repurchase agreements and securities/assets lent to other parties will—although not formally representing collateral—be reported under the heading "Collateralheading"Collateral Provided".
(m)Past-due credits and problematic credits. Past-due credits are credits or other assets on which interest or principal has been contractually past-due for more than 60 days. Problematic credits are doubtful credits (or other assets), and restructured credits (or other assets). Doubtful
F-7
credits (or other assets) are credits (or other assets) that are past due or where the payments most likely will not be fulfilled according to the terms of agreement. Restructured credits (or other assets) are credits (or other assets) on which the interest-rate has been reduced to below commercial levels.
(n)Provisions for probable credit losses. Provisions for potential credit losses are made if and when SEK determines that the obligor under a credit, or another asset held, and the existing guarantee or collateral are likely to fail to cover SEK's full claim. Such determinations are made for each individual credit/asset. No such provisions were made in 2002, 2001 nor 2000.2003. There has been no need to make any provision in groups for individually valued claims.
(o)Depreciation and amortization. Office equipment is depreciated "accordingon the straight-line method over an estimated useful life of 5 years. Buildings and building equipment, including fair value adjustments relating to plan"the building held by the acquired subsidiary AB SEKTIONEN, are also depreciated on the straight-line method over an estimated useful life of 67 years. Intangible assets, i.e. capitalized IT software investments, are amortized by 20 percent per annum of acquisition cost. Buildings and building equipment are depreciated at the highest amounts allowable for tax purposes. Further, additional non tax-deductible depreciations are made on the consolidated acquisition cost of the building held by AB SEKTIONEN, such that the annual consolidated depreciation on that building is 1.5 percent of the acquisition cost. Intangible assets consisting of computer systems and software are depreciated by 20 percent per annum, which represents the estimated useful life,year from the point in time whendate the new systems will be used in production.asset is available for use. (See also Note 1(s).)
(p)Reacquired debt. SEK from time to time reacquires its debt instruments. The nominal value of reacquired debt is deducted from the corresponding liability on the balance sheet. Unless the instrument has been repurchased with the intention of cancellation, any discount or premium in connection with the repurchase is amortized during the remaining contractual tenor of the instrument.
(q)Derivative instruments. In its normal course of business, SEK uses, and is a party to, different types of derivative instruments, mostly interest-rate related and currency-exchange-rate related instruments, exclusively for the purpose of hedging or eliminating SEK's interest-rate and currency-exchange-rate exposures.
Such instruments are reported, in accordance with the hedge accounting rules, at amortized cost.
Net receivables or liabilities related to individual currency-exchange-rate related instruments are reported on the balance sheet as one component of "other assets" or "other liabilities", as the case may be. The amounts included in "other assets" or "other liabilities", related to such instruments, only reflect the differences between the nominal value of the receivable or asset constituent, on the one hand, and the liability constituent, on the other hand, of each such instrument held.
Counterparty exposures in derivative instruments and off-balance sheet contracts are calculated and included in the reporting of capital adequacy in accordance with the Swedish Financial Supervisory Authority's regulations.
(r)Pension obligations. The Company's compulsoryCompany sponsors a defined benefit multiemployer pension plan covering all employees. All contributions paid or payable to the plan have been expensed. In addition, the Company has supplementary pension obligations to certain key employees. The benefits currently earned are covered by insurance. However,annuity contracts, the cost of which has been expensed. A one-off pension liability to former employees is carried in the balance sheet at the actuarially calculated present value of the obligation.
The Company will in 2004 adopt a new Swedish accounting standard based on IAS 19 Employee Benefits. Such standard mandates defined benefit accounting also for arrangements with multiemployer plans provided sufficient information will be made available to allow the Company also has certain additional contractual pension obligations. These are non-tax-deductible when providedto account for its proportionate share of the defined benefit obligations, plan assets and are reported as one component of "allocations".costs associated with the plan.
See information regarding additional contractual pensions obligations, Note 10.
(s)Intangible assets.assets. The Swedish Financial Accounting Standards Council's recommendation number 15, Intangible Assets, has been applied from the financial year 2002 regarding the capitalized part of the investment in the IT-system in progress. Such recommendation has earlier not been applicableAs regard to IT-system, the capitalized part includes expenses that are considered to be related to the intangible asset, for SEK. The basisexample consultant fees and expenses for capitalization is externalown personnel contributing in producing the intangible asset.
F-8
direct costs of materials, services utilized in developing or obtaining internal-use computer software, and pay-roll related costs for employees directly associated with an internal-use computer software project.
(t)Income tax.tax. Income tax for the profit or loss for the year comprises current and deferred taxes. Current tax is the expected tax payable on the taxable income for the financial year. Deferred tax includes deferred tax in the untaxed reserves of the individual Group companies and deferred taxes on taxable temporary differences.
(u)Certain references. In certain cases, references are made in the "Notes to the Consolidated Financial Statements"income statements, balance sheets, and statements of cash-flows" to information included in item 5.e "Operating and Financial Review and Prospects—Risk Management" including subsections "Credit or Counterparty Risks", "Market Risks" and "Funding and Liquidity Risks", and in item 5.d "Operating and Financial Review and Prospects—Liquidity and Capital Resources—Capital Adequacy" elsewhere inother sections of this annual report. Such information shall be deemed to be included herein by reference.
(v) Recent accounting pronouncements. The Swedish Financial Accounting Standards Council has issued a number of new or revised standards effective 2004 or later:
RR 29 based on IAS 19 Employee Benefits. Given the character of SEK?s pension arrangements, RR 29 will not have any material impact on financial reporting during 2004, except for increased disclosure requirements. See also Note 1(r).
Note 2. Currency exchange rates
Assets, liabilities and off-balance sheet contracts denominated in foreign currencies (i.e., other currencies than Swedish kronor) have been translated to Swedish kronor at the year-end exchange rates between such currencies and Swedish kronor.
The relevant exchange rates for the currencies representing the largest portions of SEK's in the balance sheet reported net assets and liabilities were the following (expressed in Swedish kronor per unit of each foreign currency):
| | 2002 | 2001 | 2000 | 2003 | 2002 | 2001 | ||||||||||||||||||||
|---|---|---|---|---|---|---|---|---|---|---|---|---|---|---|---|---|---|---|---|---|---|---|---|---|---|---|
| Currency | Exchange rate | Portion at year-end | Exchange rate | Portion at year-end | Exchange rate | Portion at year-end | Exchange rate | Portion at year-end | Exchange rate | Portion at year-end | Exchange rate | Portion at year-end | ||||||||||||||
| EUR | 9.1925 | 26.7 | % | 9.419 | 16.8 | % | 8.8570 | 22.8 | % | 9.0940 | 29.9 | % | 9.1925 | 26.7 | % | 9.419 | 16.8 | % | ||||||||
| USD | 7.275 | 28.1 | % | 8.825 | 21.0 | % | 10.6675 | 42.8 | % | |||||||||||||||||
| JPY | 0.07395 | 22.2 | % | 0.08125 | 19.9 | % | 0.08315 | 29.6 | % | 0.06800 | 15.9 | % | 0.07395 | 22.2 | % | 0.08125 | 19.9 | % | ||||||||
| USD | 8.825 | 21.0 | % | 10.6675 | 42.8 | % | 9.535 | 26.2 | % | |||||||||||||||||
| SKR | 1.00 | 14.8 | % | 1.00 | 10.9 | % | 1.00 | 14.7 | % | 1.00 | 12.4 | % | 1.00 | 14.8 | % | 1.00 | 10.9 | % | ||||||||
| AUD | 5.4325 | 5.1 | % | 4.975 | — | — | — | |||||||||||||||||||
| CHF | 6.3235 | 4.1 | % | 6.3600 | 2.2 | % | 5.8135 | 1.7 | % | 5.8285 | 2.3 | % | 6.3235 | 4.1 | % | 6.3600 | 2.2 | % | ||||||||
| ZAR | 1.01 | 3.2 | % | — | — | — | — | |||||||||||||||||||
| Others | — | 8.0 | % | — | 7.4 | % | — | 5.0 | % | — | 6.3 | % | — | 11.2 | % | — | 7.4 | % | ||||||||
Note 3. Assets, liabilities and off-balance sheet contracts denominated in foreign currencies
Assets, liabilities and off-balance sheet contracts denominated in foreign currencies are included in the total amount of assets, liabilities and off-balance sheet contracts reported by the following amounts (expressed in millions of Swedish kronor).
| | 2002 | 2001 | ||||||||||
|---|---|---|---|---|---|---|---|---|---|---|---|---|
| | Consolidated Group | Parent Company | Of which S-system | Consolidated Group | Parent Company | Of which S-system | ||||||
| Total assets | 132,538.5 | 132,590.1 | 11,877.8 | 149,540.8 | 149,563.1 | 15,978.8 | ||||||
| Of which denominated in foreign currencies | 102,092.8 | 102,091.9 | 11,037.3 | 119,077.1 | 119,054.2 | 14,949.6 | ||||||
| Total liabilities | 128,773.7 | 128,423.1 | 11,877.8 | 145,895.3 | 145,512.3 | 15,978.8 | ||||||
| Of which denominated in foreign currencies | 117,928.3 | 117,929.2 | 11,120.4 | 134,875.4 | 134,875.4 | 14,960.4 | ||||||
F-9
| | 2003 | 2002 | ||||||||||||||||||
|---|---|---|---|---|---|---|---|---|---|---|---|---|---|---|---|---|---|---|---|---|
| | Consolidated Group | Parent Company | Of which S-system | Consolidated Group | Parent Company | Of which S-system | ||||||||||||||
| Total assets | 151,800.5 | 151,869.3 | 8,511.9 | 132,538.5 | 132,590.1 | 11,877.8 | ||||||||||||||
| Of which denominated in foreign currencies | 124,934.1 | 124,887.3 | 7,868.2 | 102,092.8 | 102,091.9 | 11,037.3 | ||||||||||||||
| Total liabilities | 148,848.3 | 148,516.8 | 8,511.9 | 128,773.7 | 128,423.1 | 11,877.8 | ||||||||||||||
| Of which denominated in foreign currencies | 124,862.6 | 124,820.4 | 7,814.4 | 117,928.3 | 117,929.2 | 11,120.4 | ||||||||||||||
2002 | 2001 | 2003 | | 2002 | | |||||||||||||||
| | Consolidated Group | Parent Company | Consolidated Group | Parent Company | Consolidated Group | Parent Company | | Consolidated Group | Parent Company | | ||||||||||
| Total nominal amount of off-balance sheet contracts and commitments | 255,462.9 | 255,462.9 | 260,518.1 | 260,518.1 | 287,095.3 | 287,095.3 | 255,462.9 | 255,462.9 | ||||||||||||
| Of which denominated in foreign currencies | 236,557.3 | 236,557.3 | 241,803.6 | 241,803.6 | 264,846.0 | 264,846.0 | 236,557.3 | 236,557.3 | ||||||||||||
In the case of off-balance sheet contracts, individual contracts that include both an asset-constituent and a liability-constituent have been included in the category "ofcategory"of which denominated in foreign currencies" if at least one constituent of the contract is denominated in a foreign currency. Although large gross amounts of assets and liabilities are denominated in foreign currencies, only limited net currency exchange exposures are allowed under SEK's policy with regard to foreign currency exposures. See Item 5.e "Operating and Financial Review and Prospects—Risk management—Currency Risks".Note 32.
If the translation from foreign currencies to Swedish kronor would have been made at the end of year 20022003 with the translation rates that were applicable at the end of the year 2001,2002, the volume of total assets at the end of year 20022003 would have been Skr 141.8162.0 billion, i.e., Skr 9.310.2 billion more than actually reported. Of that amount, Skr 5.34.0 billion relates to lending and Skr 4.06.2 billion relates to interest-bearing securities.
| | 2002 | 2001 | 2000 | |||||||||||||||
|---|---|---|---|---|---|---|---|---|---|---|---|---|---|---|---|---|---|---|
| | Consolidated Group | Parent Company | S-system | Consolidated Group | Parent Company | S-system | Consolidated Group | Parent Company | S-system | |||||||||
| Interest revenues were related to: | ||||||||||||||||||
| Credits to credit institutions | 599.4 | 598.9 | 375.0 | 975.4 | 967.6 | 384.5 | 1,194.8 | 1,187.5 | 340.3 | |||||||||
| Credits to the public | 720.6 | 720.6 | 207.2 | 944.3 | 944.3 | 220.6 | 1,037.3 | 1,037.3 | 218.4 | |||||||||
| Interest-bearing securities | 3,528.1 | 3,528.1 | 7.6 | 4,977.5 | 4,977.5 | 9.7 | 5,110.5 | 5,110.5 | 14.6 | |||||||||
| Other items | -9.7 | -3.8 | 2.7 | 14.5 | 28.1 | 7.9 | 4.5 | 17.8 | 11.6 | |||||||||
| Total interest revenues | 4,838.4 | 4,843.8 | 592.5 | 6,911.7 | 6,917.5 | 622.7 | 7,347.1 | 7,353.1 | 584.9 | |||||||||
| Interest expenses were related to: | ||||||||||||||||||
| Borrowings from credit institutions | 112.0 | 111.8 | 215.1 | 214.0 | 206.3 | 448.2 | 244.2 | 236.9 | 499.0 | |||||||||
| Borrowings from the public | 11.2 | 11.2 | 3.2 | 18.8 | 18.8 | 11.8 | 10.9 | 10.9 | 0.0 | |||||||||
| Senior securities issued | 4,147.9 | 4,147.9 | 362.6 | 3,481.7 | 3,481.7 | 384.0 | 7,000.6 | 7,000.7 | 594.1 | |||||||||
| Subordinated securities issued | 247.4 | 247.4 | — | 291.5 | 291.5 | — | 268.4 | 268.3 | — | |||||||||
| Derivative instruments | -514.8 | -514.8 | 204.8 | 2,065.7 | 2,065.7 | 9.1 | -1,080.8 | -1,080.8 | -174.1 | |||||||||
| Other items | 36.5 | 36.7 | 0.7 | 9.3 | 17.2 | 0.2 | 8.3 | 16.1 | 0.0 | |||||||||
| Total interest expenses | 4,040.2 | 4,040.2 | 786.4 | 6,081.0 | 6,081.2 | 853.3 | 6,451.6 | 6,452.1 | 919.0 | |||||||||
Net interest revenues | 798.2 | 803.6 | - -193.9 | 830.7 | 836.3 | - -230.6 | 895.5 | 901.0 | - -334.1 | |||||||||
F-10
| | 2003 | 2002 | 2001 | |||||||||||||||
|---|---|---|---|---|---|---|---|---|---|---|---|---|---|---|---|---|---|---|
| | Consolidated Group | Parent Company | S-system | Consolidated Group | Parent Company | S-system | Consolidated Group | Parent Company | S-system | |||||||||
| Interest revenues were related to: | ||||||||||||||||||
| Credits to credit institutions | 381.0 | 380.8 | 282.5 | 599.4 | 598.9 | 375.0 | 975.4 | 967.6 | 384.5 | |||||||||
| Credits to the public | 722.5 | 722.5 | 142.8 | 720.6 | 720.6 | 207.2 | 944.3 | 944.3 | 220.6 | |||||||||
| Interest-bearing securities | 3,296.6 | 3,296.6 | 6.4 | 3,528.1 | 3,528.1 | 7.6 | 4,977.5 | 4,977.5 | 9.7 | |||||||||
| Other items | 32.9 | 38.7 | 11.8 | -9.7 | -3.8 | 2.7 | 14.5 | 28.1 | 7.9 | |||||||||
| Total interest revenues | 4,432.9 | 4,438.5 | 443.4 | 4,838.4 | 4,843.8 | 592.5 | 6,911.7 | 6,917.5 | 622.7 | |||||||||
Interest expenses were related to: | ||||||||||||||||||
| Borrowings from credit institutions | 40.3 | 40.4 | 128.8 | 112.0 | 111.8 | 215.1 | 214.0 | 206.3 | 448.2 | |||||||||
| Borrowings from the public | 2.7 | 2.7 | 0.0 | 11.2 | 11.2 | 3.2 | 18.8 | 18.8 | 11.8 | |||||||||
| Senior securities issued | 4,303.3 | 4,303.4 | 135.4 | 4,147.9 | 4,147.9 | 362.6 | 3,481.7 | 3,481.7 | 384.0 | |||||||||
| Subordinated securities issued | 168.3 | 168.2 | — | 247.4 | 247.4 | — | 291.5 | 291.5 | — | |||||||||
| Derivative instruments | -836.7 | -836.7 | 244.1 | -514.8 | -514.8 | 204.8 | 2,065.7 | 2,065.7 | 9.1 | |||||||||
| Other items | -2.5 | -2.5 | 2.6 | 36.5 | 36.7 | 0.7 | 9.3 | 17.2 | 0.2 | |||||||||
| Total interest expenses | 3,675.4 | 3,675.5 | 510.9 | 4,040.2 | 4,040.2 | 786.4 | 6,081.0 | 6,081.2 | 853.3 | |||||||||
Net interest revenues | 757.5 | 763.0 | - -67.5 | 798.2 | 803.6 | - -193.9 | 830.7 | 836.3 | - -230.6 | |||||||||
SEK's policy with regard to counterparty exposures states that SEK will be selective in accepting counterparty exposures. See Item 5.e "Operating and Financial Review and Prospects—Risk management—Credit or Counterparty Risks".
Interest revenues related to derivative instruments are deducted from interest expenses since the derivative instruments, in most cases, are hedging securities issued.Note 32.
The average interest rate on credits outstanding under the category "credits to the public" at year-end was 3.2 percent (2002: 3.8, percent (2001: 3.8, 2000: 3.4)2001: 3.8) under the M-system and 3.9 percent (2002: 3.2, percent (2001: 3.3, 2000: 3.7)2001: 3.3) under the S-system. It should be noted that such interest rates represent aggregated information related to fixed-rate as well as floating-rate credits denominated in varying currencies with varying maturities.
Net interest revenues include Skr 0.2 million of net earnings related to financial leasing objects. See also Note 17.
Note 5. Interest-rate exposures
See Item 5.e "Operating and Financial Review and Prospects—Risk management—Market Risks—Interest Rate Risks"Note 32 for information about SEK's policy with regard to interest-rate exposures and SEK's interest-rate exposures at year-end.
Note 6. Net commission revenues
| | 2002 | 2001 | 2000 | |||||||||||||||
|---|---|---|---|---|---|---|---|---|---|---|---|---|---|---|---|---|---|---|
| | Consolidated Group | Parent Company | S-system | Consolidated Group | Parent Company | S-system | Consolidated Group | Parent Company | S-system | |||||||||
| Commissions earned were related to: | ||||||||||||||||||
| Financial consultant commissions | 5.2 | 5.2 | — | 2.7 | 2.7 | — | 1.5 | 1.5 | — | |||||||||
| Other commissions earned | 8.8 | 8.8 | — | 10.1 | 10.1 | — | — | — | — | |||||||||
| Capital market commissions | 4.5 | — | — | — | — | — | — | — | — | |||||||||
| —Total commissions earned | 18.5 | 14.0 | — | 12.8 | 12.8 | — | 1.5 | 1.5 | — | |||||||||
| Commissions incurred were related to: | ||||||||||||||||||
| Risk capital guarantee from shareholders | 6.0 | 6.0 | — | 6.0 | 6.0 | — | 6.0 | 6.0 | — | |||||||||
| Financial consultant commissions | 0.5 | 0.5 | — | 1.7 | 1.7 | — | 0.6 | 0.6 | — | |||||||||
| —Total commissions incurred | 6.5 | 6.5 | — | 7.7 | 7.7 | — | 6.6 | 6.6 | — | |||||||||
Net commission revenues | 12.0 | 7.5 | — | 5.1 | 5.1 | — | - -5.1 | - -5.1 | — | |||||||||
F-11
| | 2003 | 2002 | 2001 | ||||||||||||||||
|---|---|---|---|---|---|---|---|---|---|---|---|---|---|---|---|---|---|---|---|
| | Consolidated Group | Parent Company | S-system | Consolidated Group | Parent Company | S-system | Consolidated Group | Parent Company | S-system | ||||||||||
| Commissions earned were related to: | |||||||||||||||||||
| Financial consultant commissions | 7.2 | 7.2 | — | 5.2 | 5.2 | — | 2.7 | 2.7 | — | ||||||||||
| Other commissions earned | 1.9 | 1.9 | — | 8.8 | 8.8 | — | 10.1 | 10.1 | — | ||||||||||
| Capital market commissions | 3.9 | — | — | 4.5 | — | — | — | — | — | ||||||||||
| Total commissions earned | 13.0 | 9.1 | — | 18.5 | 14.0 | — | 12.8 | 12.8 | — | ||||||||||
| Commissions incurred were related to: | |||||||||||||||||||
| Risk capital guarantee from shareholders | 5.3 | 5.3 | — | 6.0 | 6.0 | — | 6.0 | 6.0 | — | ||||||||||
| Financial consultant commissions | 1.4 | 1.4 | — | 0.5 | 0.5 | — | 1.7 | 1.7 | — | ||||||||||
| Other commissions incurred | 10.4 | 10.4 | — | — | — | — | — | — | — | ||||||||||
| Total commissions incurred | 17.1 | 17.1 | — | 6.5 | 6.5 | — | 7.7 | 7.7 | — | ||||||||||
Net commission revenues | - -4.1 | - -8.0 | — | 12.0 | 7.5 | — | 5.1 | 5.1 | — | ||||||||||
Note 7. Net results of financial transactions
| | 2002 | 2001 | 2000 | |||||||||||||||
|---|---|---|---|---|---|---|---|---|---|---|---|---|---|---|---|---|---|---|
| | Consolidated Group | Parent Company | S-system | Consolidated Group | Parent Company | S-system | Consolidated Group | Parent Company | S-system | |||||||||
| Net results of financial transactions were related to: | ||||||||||||||||||
| Currency exchange effects | -5.4 | -5.4 | 2.6 | 12.6 | 12.6 | -12.9 | -16.5 | -16.5 | -7.8 | |||||||||
| Unrealized losses related to interest-bearing securities and other financial instruments | -2.2 | -2.2 | — | -4.6 | -4.6 | — | -7.9 | -7.9 | — | |||||||||
| Realized profits(+)/losses(-) related to interest-bearing securities and other financial instruments | 6.9 | 6.9 | — | -2.0 | -2.0 | — | 41.1 | 41.1 | — | |||||||||
| Realized profit related to shares held | — | — | — | — | — | — | 1.9 | 1.9 | — | |||||||||
| Total results of financial transactions | -0.7 | -0.7 | 2.6 | 6.0 | 6.0 | -12.9 | 18.6 | 18.6 | -7.8 | |||||||||
| | 2003 | 2002 | 2001 | ||||||||||||||||
|---|---|---|---|---|---|---|---|---|---|---|---|---|---|---|---|---|---|---|---|
| | Consolidated Group | Parent Company | S-system | Consolidated Group | Parent Company | S-system | Consolidated Group | Parent Company | S-system | ||||||||||
| Net results of financial transactions were related to: | |||||||||||||||||||
| Currency exchange effects | -6.1 | -6.1 | 7.4 | -5.4 | -5.4 | 2.6 | 12.6 | 12.6 | -12.9 | ||||||||||
| Unrealized profits/losses related to interest-bearing securities and other financial instruments | 15.9 | 15.9 | — | -2.2 | -2.2 | — | -4.6 | -4.6 | — | ||||||||||
| Realized profits/losses related to interest-bearing securities and other financial instruments | 1.9 | 1.9 | — | 6.9 | 6.9 | — | -2.0 | -2.0 | — | ||||||||||
| Total results of financial transactions | 11.7 | 11.7 | 7.4 | -0.7 | -0.7 | 2.6 | 6.0 | 6.0 | -12.9 | ||||||||||
Note 8. Currency exchange exposures
See Item 5.e "Operating and Financial Review and Prospects—Risk management—Market Risks—Currency Risks"Note 32 for information about SEK's policy with regard to currency exchange exposures and SEK's currency exchange exposures at year-end.exchange.
Note 9. Other operating income and expenses
| | 2002 | 2001 | 2000 | |||||||||||||||
|---|---|---|---|---|---|---|---|---|---|---|---|---|---|---|---|---|---|---|
| | Consolidated Group | Parent Company | S-system | Consolidated Group | Parent Company | S-system | Consolidated Group | Parent Company | S-system | |||||||||
| Other operating income: | ||||||||||||||||||
| Remuneration related to excess funds to the benefit of policyholders of certain pension insurance companies | — | — | — | 6.3 | 6.3 | — | 16.7 | 16.7 | — | |||||||||
| Effects related to compensation from S-system | — | — | — | 1.1 | 1.1 | — | — | — | — | |||||||||
| Other | 0.9 | 1.8 | — | 0.8 | 0.8 | — | 0.1 | 0.1 | — | |||||||||
| Total other operating income | 0.9 | 1.8 | — | 8.2 | 8.2 | — | 16.8 | 16.8 | — | |||||||||
F-12
| | 2003 | 2002 | 2001 | |||||||||||||||
|---|---|---|---|---|---|---|---|---|---|---|---|---|---|---|---|---|---|---|
| | Consolidated Group | Parent Company | S-system | Consolidated Group | Parent Company | S-system | Consolidated Group | Parent Company | S-system | |||||||||
| Other operating income | ||||||||||||||||||
| Remuneration related to excess funds to the benefit of policyholders of certain pension insurance companies | 6.1 | 6.1 | — | — | — | — | 6.3 | 6.3 | — | |||||||||
| Effects related to compensation from S-system | 0.0 | 0.0 | — | — | — | — | 1.1 | 1.1 | — | |||||||||
| Other | 0.3 | 1.5 | — | 0.9 | 1.8 | — | 0.8 | 0.7 | — | |||||||||
| Total other operating income | 6.4 | 7.6 | — | 0.9 | 1.8 | — | 8.2 | 8.1 | — | |||||||||
| | 2003 | 2002 | 2001 | |||||||||||||||
|---|---|---|---|---|---|---|---|---|---|---|---|---|---|---|---|---|---|---|
| | Consolidated Group | Parent Company | S-system | Consolidated Group | Parent Company | S-system | Consolidated Group | Parent Company | S-system | |||||||||
| Other operating expenses | ||||||||||||||||||
| Value adjustment of claims for policyholders of certain pension insurance companies | — | — | — | 3.5 | 3.5 | — | — | — | — | |||||||||
| Effects related to compensation to S-system | — | — | — | 0.7 | 0.7 | — | — | — | — | |||||||||
| Other | 0.9 | 0.0 | — | 0.9 | 0.1 | — | 0.7 | — | — | |||||||||
| Total other operating expenses | 0.9 | 0.0 | — | 5.1 | 4.3 | — | 0.7 | — | — | |||||||||
2002 | 2001 | 2000 | ||||||||||||||||
|---|---|---|---|---|---|---|---|---|---|---|---|---|---|---|---|---|---|---|
| | Consolidated Group | Parent Company | S-system | Consolidated Group | Parent Company | S-system | Consolidated Group | Parent Company | S-system | |||||||||
| Other operating expenses: | ||||||||||||||||||
| Value adjustment of claims for policyholders of certain pension insurance companies | 3.5 | 3.5 | — | — | — | — | — | — | — | |||||||||
| Effects related to compensation to S-system | 0.7 | 0.7 | — | — | — | — | 0.7 | 0.7 | — | |||||||||
| Other | 0.9 | 0.1 | — | 0.7 | — | — | 0.6 | — | — | |||||||||
| Total other operating expenses | 5.1 | 4.3 | — | 0.7 | — | — | 1.3 | 0.7 | — | |||||||||
Note 10. Administrative expenses
| | 2002 | 2001 | 2000 | ||||||||||
|---|---|---|---|---|---|---|---|---|---|---|---|---|---|
| | Consolidated Group | Parent Company | Consolidated Group | Parent Company | Consolidated Group | Parent Company | |||||||
| Administrative expenses were related to: | |||||||||||||
| Personnel expenses: | |||||||||||||
| Salaries and remuneration to the Board of Directors and the President(1) | 4.0 | 4.0 | 5.0 | 5.0 | 4.5 | 4.5 | |||||||
| Salaries | 56.4 | 55.0 | 47.4 | 47.4 | 38.7 | 38.7 | |||||||
| Pensions(2) | 19.2 | 18.7 | 13.2 | 13.2 | 9.5 | 9.5 | |||||||
| Social insurance | 21.7 | 21.3 | 18.5 | 18.5 | 14.6 | 14.6 | |||||||
| Other personnel expenses | 8.2 | 8.2 | 14.1 | 14.1 | 10.7 | 10.7 | |||||||
| Total personnel expenses | 109.5 | 107.2 | 98.2 | 98.2 | 78.0 | 78.0 | |||||||
Other administrative expenses: | |||||||||||||
| The company's real estate and premises | 3.8 | 10.6 | 2.9 | 9.2 | 3.6 | 9.9 | |||||||
| Other expenses | 53.1 | 52.6 | 49.6 | 49.6 | 44.1 | 44.1 | |||||||
| — Total other administrative expenses | 56.9 | 63.2 | 52.5 | 58.8 | 47.7 | 54.0 | |||||||
Total administrative expenses | 166.4 | 170.4 | 150.7 | 157.0 | 125.7 | 132.0 | |||||||
(1) 2001 and 2000 included salaries and remunerations to the previous Executive Vice President | |||||||||||||
| (2) Of which: Calculated pension expenses | 1.2 | 1.2 | 2.2 | 2.2 | 2.2 | 2.2 | |||||||
| Pension premium expenses (3) | 18.0 | 17.5 | 11.0 | 11.0 | 7.3 | 7.3 | |||||||
| (3) Of which Skr 1.2 million relates to the President and of which Skr 1.0 million in excess of what is tax-deductible. Skr 2.8 million pertains to other key officers included in senior management, of which Skr 1.5 million is in excess of what is tax-deductible. | |||||||||||||
F-13
| | 2003 | 2002 | 2001 | ||||||||||
|---|---|---|---|---|---|---|---|---|---|---|---|---|---|
| | Consolidated Group | Parent Company | Consolidated Group | Parent Company | Consolidated Group | Parent Company | |||||||
| Administrative expenses were related to: | |||||||||||||
| Personnel expenses: | |||||||||||||
| Salaries and remuneration to the Board of Directors and the President(1) | 5.8 | 4.5 | 4.0 | 4.0 | 5.0 | 5.0 | |||||||
| Salaries and remuneration to other employees | 66.0 | 64.9 | 56.4 | 55.0 | 47.4 | 47.4 | |||||||
| Pensions(2) | 23.8 | 23.1 | 19.2 | 18.7 | 13.2 | 13.2 | |||||||
| Social insurance | 25.8 | 25.2 | 21.7 | 21.3 | 18.5 | 18.5 | |||||||
| Other personnel expenses | 6.1 | 5.9 | 8.2 | 8.2 | 14.1 | 14.1 | |||||||
| Total personnel expenses | 127.5 | 123.6 | 109.5 | 107.2 | 98.2 | 98.2 | |||||||
Other administrative expenses: | |||||||||||||
| The company's real estate and premises | 5.1 | 12.1 | 3.8 | 10.6 | 2.9 | 9.2 | |||||||
| Other expenses | 56.9 | 56.2 | 53.1 | 52.6 | 49.6 | 49.6 | |||||||
| Total other administrative expenses | 62.0 | 68.3 | 56.9 | 63.2 | 52.5 | 58.8 | |||||||
Total administrative expenses | 189.5 | 191.9 | 166.4 | 170.4 | 150.7 | 157.0 | |||||||
| (1) 2001 included salaries and remunerations to the previous Executive Vice President | |||||||||||||
(2) Of which: Calculated pension expenses | 1.0 | 1.0 | 1.2 | 1.2 | 2.2 | 2.2 | |||||||
| Pension premium expenses(3) | 22.8 | 22.1 | 18.0 | 17.5 | 11.0 | 11.0 | |||||||
(3) Of which Skr 2.0 million (2002: 1.2, 2001: 1.2) relates to the President and of which Skr 1.4 million (2002: 1.0, 2001:1.0) in excess of what is tax-deductible. Skr 3.5 million (2002: 2.8) pertains to other key officers included in senior management, of which Skr 2.0 million (2002: 1.5) is in excess of what is tax-deductible. | |||||||||||||
In addition to the information in the Report of Directors and in Note 1 (r), which is prepared on the basis of the provisions of the Swedish Act on Annual Accounts, theThe following information about certain officers and directors is provided in accordance with a recommendation of the Swedish Industry and Commerce Stock Exchange Committee:
The Chairman of the Board of Directors received Skr 0.2 million for 2002 (2001:2003 (2002: 0.2, 2000: 0.1)2001: 0.2) in remuneration.
The President's remuneration consists of basic salary, bonus and other benefits. The President received in total Skr 3.23.7 million for 2002 (2001: 3.0, 2000: 2.8)2003 (2002: 3.2, 2001:3.0) in remuneration, of which bonus Skr 0.8 million (2001: 0.6, 2000: 0.4)(2002: 0.8, 2001: 0.6). The bonus is related to targets in the company's business plan approved by the Board of Directors. Of the total remuneration to the President, Skr 3.5 million (2002: 3.0, million (2001: 3.0, 2000: 2.8)2001: 3.0) is qualifying income for pension purposes. His retirement age is 60 years, with a pension, to the benefit of himself, of 75 percent of his final salary up to 65 years after which it reduces. Such commitment is covered by insurance and includes survivors' pension.
The remuneration to other key officers included in the senior management consists of basic salary, bonus and other benefits. The amount of the remuneration to other key officers in the senior management was Skr 8.69.9 million (2002: 8.6), of which Skr 1.3 million (2002: 1.3) was bonus. The bonus relates to individual set targets and targets defined in the business plan. Of the total remuneration to the key officers Skr 7.67.7 million (2002: 7.6) is qualifying income for pension purposes. For certain key officers in the senior management, if their employment contracts are terminated by the Company, there is an agreement to pay such officers compensation during a two-year period, although any salary received in new employment will be deducted. Key officers included in the senior management have a retirement age between 60 and 65 years. The pension commitments are covered by insurance, are defined benefit and include survivors' pension.
As from 2004, the Board of Directors has established a remuneration committee.
During 2003 the Swedish Act on Annual Accounts was amended as to require certain information regarding employees sick leave time as recorded by the company.
The information is required to be disclosed in the Annual Report and should reported for the first time for the six-month period starting July 1, 2003. The following information is based on statistics from the payroll system which also has been the base for the accounting records. For the six-month period period starting July 1, 2003, total sick leave for all employees was 2.8 percent of total regular hours of work. Total sick leave for women was 3.8 percent and for men 1.7 percent. The proportion of total sick leave that was related to sick leave of 60 days or more was 46 percent. Breakdown of total sick leave by age:
| –29 years | 1.8 | % | |
| 30 - 49 years | 3.9 | % | |
| 50 years– | 0.6 | % |
Remuneration to the auditors and related audit companies
| | 2002 | 2001 | 2000 | |||||||||
|---|---|---|---|---|---|---|---|---|---|---|---|---|
| | Audit fee | Consultant fee | Audit fee | Consultant fee | Audit fee | Consultant fee | ||||||
| Audit company | ||||||||||||
| Deloitte & Touche | 0.1 | — | — | — | — | — | ||||||
| Ernst & Young AB | 0.2 | 1.1 | 0.2 | — | 0.2 | — | ||||||
| KPMG | 4.1 | 3.9 | 3.4 | 5.0 | 2.0 | 0.4 | ||||||
| Öhrlings PricewaterhouseCoopers | 0.1 | — | 0.1 | — | 0.2 | — | ||||||
| Total remuneration | 4.5 | 5.0 | 3.7 | 5.0 | 2.4 | 0.4 | ||||||
(remuneration may for accounting purposes be included in other items than administrative expenses):
| | 2003 | 2002 | 2001 | |||||||||
|---|---|---|---|---|---|---|---|---|---|---|---|---|
| | Audit fee | Other fee | Audit fee | Other fee | Audit fee | Other fee | ||||||
| Audit company | ||||||||||||
| Deloitte & Touche | 0.3 | — | 0.1 | — | — | — | ||||||
| Ernst & Young AB | — | — | 0.2 | 1.1 | 0.2 | — | ||||||
| KPMG | 5.5 | 1.6 | 4.1 | 3.9 | 3.4 | 5.0 | ||||||
| Öhrlings PricewaterhouseCoopers | 0.1 | 0.0 | 0.1 | — | 0.1 | — | ||||||
| Total remuneration | 5.9 | 1.6 | 4.5 | 5.0 | 3.7 | 5.0 | ||||||
Audit fee includes also auditing of stock exchange reporting and issue prospectus.
Note 11. Office and building equipment
| | 2002 | 2001 | 2000 | 2003 | 2002 | 2001 | ||||||||||||||||||||
|---|---|---|---|---|---|---|---|---|---|---|---|---|---|---|---|---|---|---|---|---|---|---|---|---|---|---|
| | Consolidated Group | Parent Company | Consolidated Group | Parent Company | Consolidated Group | Parent Company | Consolidated Group | Parent Company | Consolidated Group | Parent Company | Consolidated Group | Parent Company | ||||||||||||||
| Acquisition cost | 33.6 | 33.6 | 41.3 | 41.3 | 36.7 | 36.7 | 32.4 | 32.4 | 33.6 | 33.6 | 41.3 | 41.3 | ||||||||||||||
| Accumulated depreciation at year-end | -13.4 | -13.4 | -22.9 | -22.9 | -19.0 | -19.0 | ||||||||||||||||||||
| Accumulated depreciations at year-end | -14.2 | -14.2 | -13.4 | -13.4 | -22.9 | -22.9 | ||||||||||||||||||||
| Of which made during the year | (-4.4 | ) | (-4.4 | ) | (-4.2 | ) | (-4.2 | ) | (-3.4 | ) | (-3.4 | ) | (-4.4 | ) | (-4.4 | ) | (-4.4 | ) | (-4.4 | ) | (-4.2 | ) | (-4.2 | ) | ||
| Book value | 20.2 | 20.2 | 18.4 | 18.4 | 17.7 | 17.7 | 18.2 | 18.2 | 20.2 | 20.2 | 18.4 | 18.4 | ||||||||||||||
See also Note 1 (o). | ||||||||||||||||||||||||||
F-14 See also Note 1 (o).
Note 12. Buildings and landIntangible assets
| | 2002 | 2001 | 2000 | |||||||||||
|---|---|---|---|---|---|---|---|---|---|---|---|---|---|---|
| | Consolidated Group | Parent Company | Consolidated Group | Parent Company | Consolidated Group | Parent Company | ||||||||
| Buildings: | ||||||||||||||
| Acquisition cost | 142.8 | 0.7 | 142.8 | 0.7 | 142.8 | 0.7 | ||||||||
| Accumulated depreciation at year-end | -24.2 | -0.3 | -22.0 | -0.3 | -20.0 | -0.2 | ||||||||
| Of which made during the year | (-2.1 | ) | (0.0 | ) | (-2.1 | ) | (0.0 | ) | (-2.2 | ) | (0.0 | ) | ||
| Book value | 118.6 | 0.4 | 120.8 | 0.4 | 122.8 | 0.5 | ||||||||
| Taxable value | 46.9 | 0.4 | 37.2 | 0.3 | 32.5 | 0.3 | ||||||||
Land: | ||||||||||||||
| Acquisition cost | 0.1 | 0.1 | 0.1 | 0.1 | 0.1 | 0.1 | ||||||||
| Accumulated depreciation at year-end | — | — | — | — | — | — | ||||||||
| Of which made during the year | (— | ) | (— | ) | (— | ) | (— | ) | (— | ) | (— | ) | ||
| Book value | 0.1 | 0.1 | 0.1 | 0.1 | 0.1 | 0.1 | ||||||||
| Taxable value | 37.7 | 0.2 | 29.9 | 0.2 | 26.2 | 0.2 | ||||||||
Buildings and land: | ||||||||||||||
| Total acquisition cost | 142.9 | 0.8 | 142.9 | 0.8 | 142.9 | 0.8 | ||||||||
| Total accumulated depreciation at year-end | -24.2 | -0.3 | -22.0 | -0.3 | -20.0 | -0.2 | ||||||||
| Of which made during the year | (-2.1 | ) | (0.0 | ) | (-2.1 | ) | (0.0 | ) | (-2.2 | ) | (0.0 | ) | ||
| Total book value | 118.7 | 0.5 | 120.9 | 0.5 | 122.9 | 0.6 | ||||||||
| Total taxable value | 84.6 | 0.6 | 67.2 | 0.5 | 58.7 | 0.5 | ||||||||
See also Note 1 (o). | ||||||||||||||
| | 2003 | 2002 | 2001 | ||||||||||
|---|---|---|---|---|---|---|---|---|---|---|---|---|---|
| | Consolidated Group | Parent Company | Consolidated Group | Parent Company | Consolidated Group | Parent Company | |||||||
| Acquisition cost | 77.0 | 77.0 | 40.1 | 40.1 | — | — | |||||||
| Accumulated depreciations at year-end | -10.0 | -10.0 | -1.0 | -1.0 | — | — | |||||||
| Of which made during the year | (-9.0 | ) | (-9.0 | ) | (-1.0 | ) | (-1.0 | ) | (— | ) | (— | ) | |
| Book value | 67.0 | 67.0 | 39.1 | 39.1 | — | — | |||||||
See also Note 1 (s).
Note 13. Intangible assetsBuildings and land
| | 2002 | 2001 | 2000 | ||||||||||
|---|---|---|---|---|---|---|---|---|---|---|---|---|---|
| | Consolidated Group | Parent Company | Consolidated Group | Parent Company | Consolidated Group | Parent Company | |||||||
| Acquisition cost | 40.1 | 40.1 | — | — | — | — | |||||||
| Accumulated amortization at year-end | -1.0 | -1.0 | — | — | — | — | |||||||
| Of which made during the year | (-1.0 | ) | (-1.0 | ) | (— | ) | (— | ) | (— | ) | (— | ) | |
| Book value | 39.1 | 39.1 | — | — | — | — | |||||||
See also Note 1 (s). | |||||||||||||
| | 2003 | 2002 | 2001 | |||||||||||
|---|---|---|---|---|---|---|---|---|---|---|---|---|---|---|
| | Consolidated Group | Parent Company | Consolidated Group | Parent Company | Consolidated Group | Parent Company | ||||||||
| Buildings: | ||||||||||||||
| Acquisition cost | 142.8 | 0.7 | 142.8 | 0.7 | 142.8 | 0.7 | ||||||||
| Accumulated depreciations at year-end | -26.4 | -0.3 | -24.2 | -0.3 | -22.0 | -0.3 | ||||||||
| Of which made during the year | (-2.1 | ) | (0.0 | ) | (-2.1 | ) | (0.0 | ) | (-2.1 | ) | (0.0 | ) | ||
| Book value | 116.4 | 0.4 | 118.6 | 0.4 | 120.8 | 0.4 | ||||||||
| Taxable value | 48.8 | 0.4 | 46.9 | 0.4 | 37.2 | 0.3 | ||||||||
Land: | ||||||||||||||
| Acquisition cost | 0.1 | 0.1 | 0.1 | 0.1 | 0.1 | 0.1 | ||||||||
| Accumulated depreciations at year-end | — | — | — | — | — | — | ||||||||
| Of which made during the year | (— | ) | (— | ) | (— | ) | (— | ) | (— | ) | (— | ) | ||
| Book value | 0.1 | 0.1 | 0.1 | 0.1 | 0.1 | 0.1 | ||||||||
| Taxable value | 39.2 | 0.3 | 37.7 | 0.2 | 29.9 | 0.2 | ||||||||
Buildings and land: | ||||||||||||||
| Total acquisition cost | 142.9 | 0.8 | 142.9 | 0.8 | 142.9 | 0.8 | ||||||||
| Total accumulated depreciations at year-end | -26.4 | -0.3 | -24.2 | -0.3 | -22.0 | -0.3 | ||||||||
| Of which made during the year | (-2.1 | ) | (0.0 | ) | (-2.1 | ) | (0.0 | ) | (-2.1 | ) | (0.0 | ) | ||
| Total book value | 116.5 | 0.5 | 118.7 | 0.5 | 120.9 | 0.5 | ||||||||
| Total taxable value | 88.0 | 0.7 | 84.6 | 0.6 | 67.2 | 0.5 | ||||||||
See also Note 1 (o).
Note 14. Counterparty risk exposures
SEK's policy with regard to counterparty risk exposures is described in Note 32. Further, included in in Item 5.e "Operating11.a "Quantitative and Financial Review and Prospects— Qualitative Disclosures About Market Risk—Risk management—Management—Credit or Counterparty Risks". Further, included in the specified section is the table "Total Counterparty Risk Exposures" showingis shown SEK's counterparty exposures, broken down by different categories of contracts, at year-end.
F-15
Note 15. Untaxed reserves
| | | 2002 | 2001 | 2000 | | 2003 | 2002 | 2001 | ||||||||
|---|---|---|---|---|---|---|---|---|---|---|---|---|---|---|---|---|
| | Parent Company | Parent Company | Parent Company | |||||||||||||
| Tax equalization reserve: | ||||||||||||||||
| Opening balance | — | — | 147.4 | |||||||||||||
| Dissolution during the year | — | — | -147.4 | |||||||||||||
| Closing balance | — | — | — | |||||||||||||
| | Parent Company | Parent Company | Parent Company | |||||||||||||
Tax allocation reserve: | Tax allocation reserve: | Tax allocation reserve: | ||||||||||||||
| Opening balance | Opening balance | 1,375.0 | 1,394.3 | 1,404.3 | Opening balance | 1,360.0 | 1,375.0 | 1,394.3 | ||||||||
| Dissolution during the year | Dissolution during the year | -245.2 | -263.6 | -262.3 | Dissolution during the year | -219.1 | -245.2 | -263.6 | ||||||||
| Allocation during the year | Allocation during the year | 230.2 | 244.3 | 252.3 | Allocation during the year | 203.7 | 230.2 | 244.3 | ||||||||
| Closing balance | Closing balance | 1,360.0 | 1,375.0 | 1,394.3 | Closing balance | 1,344.6 | 1,360.0 | 1,375.0 | ||||||||
| Of which: | Of which: | |||||||||||||||
| 1995 Tax allocation reserve | — | — | 263.6 | 1996 Tax allocation reserve | — | — | 245.2 | |||||||||
| 1996 Tax allocation reserve | — | 245.2 | 245.2 | 1997 Tax allocation reserve | — | 219.1 | 219.2 | |||||||||
| 1997 Tax allocation reserve | 219.2 | 219.2 | 219.2 | 1998 Tax allocation reserve | 218.5 | 218.5 | 218.5 | |||||||||
| 1998 Tax allocation reserve | 218.5 | 218.5 | 218.5 | 1999 Tax allocation reserve | 195.5 | 195.5 | 195.5 | |||||||||
| 1999 Tax allocation reserve | 195.5 | 195.5 | 195.5 | 2000 Tax allocation reserve | 252.3 | 252.3 | 252.3 | |||||||||
| 2000 Tax allocation reserve | 252.3 | 252.3 | 252.3 | 2001 Tax allocation reserve | 244.4 | 244.4 | 244.3 | |||||||||
| 2001 Tax allocation reserve | 244.3 | 244.3 | — | 2002 Tax allocation reserve | 230.2 | 230.2 | — | |||||||||
| 2002 Tax allocation reserve | 230.2 | — | — | 2003 Tax allocation reserve | 203.7 | — | — | |||||||||
In the financial statements of the Consolidated Group, the untaxed reserves of the Group companies are allocated by 72 percent to "non-distributable reserves"shareholders' funds" and by 28 percent to deferred taxes (related to untaxed reserves), included as one component of "allocations", in the Balance Sheet. Changes in the amounts reported as deferred taxes are included in "taxes" in the Income Statement.
F-16
Income Statement. Accordingly, the amounts related to the Group companies' untaxed reserves are included in the statements of the Consolidated Group as shown below:
| | 2002 | 2001 | 2000 | 2003 | 2002 | 2001 | ||||||
|---|---|---|---|---|---|---|---|---|---|---|---|---|
| | Consolidated Group | Consolidated Group | Consolidated Group | Consolidated Group | Consolidated Group | Consolidated Group | ||||||
| Balance sheet: | ||||||||||||
| Opening balance included in "non-distributable reserves" | 989.9 | 1,003.8 | 1,117.1 | |||||||||
| Opening balance included in "non-distributable shareholders' funds | 979.4 | 990.0 | 1,003.8 | |||||||||
| Net change during the year | -10.6 | -13.9 | -113.3 | -11.1 | -10.6 | -13.9 | ||||||
| Closing balance included in "non-distributable reserves" | 979.3 | 989.9 | 1,003.8 | |||||||||
| Closing balance included in "non-distributable shareholders' funds" | 968.3 | 979.4 | 989.9 | |||||||||
Opening balance reported as "deferred taxes" (included in "allocations") | 385.0 | 390.4 | 434.5 | 380.8 | 385.0 | 390.4 | ||||||
| Net change during the year | -4.2 | -5.4 | -44.1 | -4.3 | -4.2 | -5.4 | ||||||
| Closing balance reported as "deferred taxes" (included in "allocations") | 380.8 | 385.0 | 390.4 | 376.5 | 380.8 | 385.0 | ||||||
Total opening balance included in "allocations" and "non-distributable reserves" | 1,375.0 | 1,394.3 | 1,551.7 | |||||||||
Total opening balance included in "allocations" and "non-distributable shareholders' funds" | 1,360.2 | 1,375.0 | 1,394.3 | |||||||||
| Total net change during the year | -14.8 | -19.3 | -157.4 | -15.4 | -14.8 | -19.3 | ||||||
| Total closing balance included in "allocations" and "non-distributable reserves" | 1,360.2 | 1,375.0 | 1,394.3 | |||||||||
| Total closing balance included in "allocations" and "non-distributable shareholders' funds" | 1,344.8 | 1,360.2 | 1,375.0 | |||||||||
Income statement: | ||||||||||||
| Amount included in "taxes" related to net change during the year in "deferred taxes" | -4.2 | -5.4 | -44.1 | -4.3 | -4.2 | -5.4 | ||||||
Note 16. Taxes
| | 2002 | 2001 | 2000 | 2003 | 2002 | 2001 | ||||||||||||||||||
|---|---|---|---|---|---|---|---|---|---|---|---|---|---|---|---|---|---|---|---|---|---|---|---|---|
| | Consolidated Group | Parent Company | Consolidated Group | Parent Company | Consolidated Group | Parent Company | Consolidated Group | Parent Company | Consolidated Group | Parent Company | Consolidated Group | Parent Company | ||||||||||||
| Provision for taxes for the year | 191.2 | 190.8 | 205.2 | 205.2 | 282.7 | 282.7 | 171.2 | 171.6 | 191.2 | 190.8 | 205.2 | 205.2 | ||||||||||||
| Less: Credit for foreign taxes | -0.8 | -0.8 | -6.4 | -6.4 | -10.5 | -10.5 | -0.8 | -0.8 | -0.8 | -0.8 | -6.4 | -6.4 | ||||||||||||
| Change in deferred taxes related to other assets | -1.6 | -1.6 | — | — | — | — | 1.6 | 1.6 | -1.6 | -1.6 | — | — | ||||||||||||
| Change in deferred taxes related to allocations | 0.1 | 0.1 | -5.1 | -5.1 | — | — | 0.1 | 0.1 | 0.1 | 0.1 | -5.1 | -5.1 | ||||||||||||
| Change in deferred taxes related to untaxed reserves | -4.2 | n.a | -5.4 | n.a | -44.1 | n.a. | -4.3 | n.a | -4.2 | n.a | -5.4 | n.a | ||||||||||||
| Net amount of taxes | 184.7 | 188.5 | 188.3 | 193.7 | 228.1 | 272.2 | 167.8 | 172.5 | 184.7 | 188.5 | 188.3 | 193.7 | ||||||||||||
As from year 2001 deferredDeferred taxes are accounted for in accordance with the Swedish Financial Accounting Standards Council's recommendation number 9—Income Taxes.
The nominal tax rate amounts to 28 percent (2001:(2002: 28, 2000:2001: 28) and the effective tax rate amounts to 28.2 percent (2002: 27.8, percent (2001: 25.8, 2000: 27.5)2001: 25.8).
F-17
Difference between nominal and effective tax rate
| | 2002 | 2001 | 2000 | 2003 | 2002 | 2001 | ||||||
|---|---|---|---|---|---|---|---|---|---|---|---|---|
| % | Consolidated Group | Consolidated Group | Consolidated Group | Consolidated Group | Consolidated Group | Consolidated Group | ||||||
| Nominal income tax rate | 28.0 | 28.0 | 28.0 | 28.0 | 28.0 | 28.0 | ||||||
| Depreciation on consolidated surplus value | 0.1 | 0.1 | 0.1 | 0.1 | 0.1 | 0.1 | ||||||
| Other non tax-deductible costs | 0.2 | 0.0 | 0.5 | 0.2 | 0.2 | 0.0 | ||||||
| Credit for foreign taxes | -0.1 | -0.6 | -1.1 | 0.0 | -0.1 | -0.6 | ||||||
| Non-taxable income | 0.0 | -1.2 | 0.0 | 0.0 | 0.0 | -1.2 | ||||||
| Change in deferred taxes related to allocations | 0.0 | -0.7 | 0.0 | 0.0 | 0.0 | -0.7 | ||||||
| Other items | -0.4 | 0.2 | 0.0 | -0.1 | -0.4 | 0.2 | ||||||
| Effective tax rate | 27.8 | 25.8 | 27.5 | 28.2 | 27.8 | 25.8 |
Deferred taxes are calculated based on nominal tax rates. Exceptions from that rule are only made in the case of acquisitions based on net worthvalue when the tax effects have been an important part of the business transaction. In that case the deferred taxes are calculated based on the acquisition cost. If the deferred taxes instead should have been calculated based on the nominal tax rate an accumulated deferred tax liability amounting to Skr 31.9 million (2002: 32.5, million (2001: 33.1, 2000: 33.6)2001: 33.1) would have been posted to the balance sheet.
| | 2002 | 2001 | 2003 | 2002 | ||||||||||||||||||||
|---|---|---|---|---|---|---|---|---|---|---|---|---|---|---|---|---|---|---|---|---|---|---|---|---|
| | Consolidated Group | Parent Company | Of which S-system | Consolidated Group | Parent Company | Of which S-system | Consolidated Group | Parent Company | Of which S-system | Consolidated Group | Parent Company | Of which S-system | ||||||||||||
| Credits to credit institutions | 12,984.7 | 12,973.6 | 6,537.5 | 15,361.8 | 15,361.7 | 8,480.8 | 17,569.6 | 17,567.7 | 4,789.8 | 12,984.7 | 12,973.6 | 6,537.5 | ||||||||||||
| Credits to the public | 26,048.2 | 26,048.2 | 4,964.2 | 30,149.2 | 30,149.2 | 7,001.5 | 23,202.4 | 23,202.4 | 3,474.1 | 26,048.2 | 26,048.2 | 4,964.2 | ||||||||||||
| Total credits outstanding | 39,032.9 | 39,021.8 | 11,501.7 | 45,511.0 | 45,510.9 | 15,482.3 | 40,772.0 | 40,770.1 | 8,263.9 | 39,032.9 | 39,021.8 | 11,501.7 | ||||||||||||
| Of which denominated in: | ||||||||||||||||||||||||
| Swedish kronor | 11,526.6 | 11,515.5 | 694.2 | 21,397.3 | 21,397.2 | 893.6 | 11,141.9 | 11,140.1 | 489.0 | 11,526.6 | 11,515.5 | 694.2 | ||||||||||||
| Foreign currencies | 27,506.3 | 27,506.3 | 10,807.5 | 24,113.7 | 24,113.7 | 14,588.7 | 29,630.0 | 29,630.0 | 7,774.9 | 27,506.3 | 27,506.3 | 10,807.5 | ||||||||||||
| Deposits with banks included in "credits to credit institutions", repurchase agreements and cash on demand | -3,474.9 | -3,463.8 | -20.5 | -3,224.1 | -3,224.0 | -27.9 | ||||||||||||||||||
| Credits reported as interest-bearing securities (A) | 29,912.1 | 29,912.1 | — | 28,074.2 | 28,074.2 | — | ||||||||||||||||||
Deposits with banks and states, repurchase agreements and cash on demand | - -10,967.5 | - -10,965.7 | - -533.9 | - -3,474.9 | - -3,463.8 | - -20.5 | ||||||||||||||||||
| Credits reported as interest-bearing securities(A) | 31,066.1 | 31,066.1 | — | 29,912.1 | 29,912.1 | — | ||||||||||||||||||
| Total credits outstanding, including credits reported as interest-bearing securities, but excluding deposits with banks | 65,470.1 | 65,470.1 | 11,481.2 | 70,361.1 | 70,361.1 | 15,454.4 | 60,870.5 | 60,870.5 | 7,730.0 | 65,470.1 | 65,470.1 | 11,481.2 | ||||||||||||
Credits outstanding are classified as fixed financial assets.
During 2003, SEK, in its ordinary course of business, acquired leasing objects which were classified as financial leasing objects (as opposed to operational leasing objects) in accordance with the Swedish Financial Accounting Standards Council's Recommendation number 6:99—Leasing Agreements. When making such classification all aspects regarding the leasing contract, including third party guarantees, should be taken into account. The counterparty exposures relatedacquisition price of the leasing objects amounted to credits outstanding are shown in Item 5.e "OperatingSkr 380.2 million (—), and Financial Review and Prospects—Risk management—Credit or Counterparty Risks" in the table "Total Counterpart Risk Exposures"book value of at year-end amounted to Skr 310.1 million (—).
The maturity profile of SEK's credit portfolio, i.e., credits outstanding and credits committed, is included as one component of the graph "Development over Time of SEK's Available Funds" shown in 5.e "Operating and Financial Review and Prospects—Risk management—Funding and Liquidity Risks".
The following information with regard to past-due credits outstanding is included inIn accordance with regulations of Swedish Financial Supervisory Authority. See also NotesAuthority past-due credits and problematic credits will be reported.
In addition to the following information see notes 1(m) and 1(n).
Past-due credits and Problematic credits at year-endyear-end:
| | 2002 | 2001 | | 2003 | 2002 | ||||||||||||||||||||
|---|---|---|---|---|---|---|---|---|---|---|---|---|---|---|---|---|---|---|---|---|---|---|---|---|---|
| | Consolidated Group | Parent Company | Of which S-system | Consolidated Group | Parent Company | Of which S-system | | Consolidated Group | Parent Company | Of which S-system | Consolidateed Group | Parent Company | Of which S-system | ||||||||||||
| Past-due credits(B): | Past-due credits(B): | ||||||||||||||||||||||||
| Aggregate amount of principal and interest past-due | 64.3 | 64.3 | 1.4 | 43.7 | 43.7 | 3.1 | Aggregate amount of principal and interest past-due | 47.5 | 47.5 | 6.3 | 64.3 | 64.3 | 1.4 | ||||||||||||
| of which covered by adequate guarantees | 47.5 | 47.5 | 6.3 | 64.3 | 64.3 | 1.4 | |||||||||||||||||||
| Principal amount not past-due on such credits | 622.1 | 622.1 | 27.1 | 106.2 | 106.2 | 8.4 | Principal amount not past-due on such credits | 433.1 | 433.1 | 52.4 | 622.1 | 622.1 | 27.1 | ||||||||||||
| of which covered by adequate guarantees | 433.1 | 433.1 | 52.4 | 622.1 | 622.1 | 27.1 | |||||||||||||||||||
The average interest rate on credits outstanding at year-end 20022003 under the category "Past-duecategory"Past-due credits" was 3.92.0 percent.
F-19
Note 18. Interest-bearing securities
Under the regulations, credits granted against documentation in the form of interest-bearing securities, as opposed to traditional credit agreements, are reported on the balance sheet as one component of securities classified as fixed financial assets. Such credits are included by Skr 29,912.131,111.6 million (28,074.2)(29,912.1) in the amount of other interest-bearing securities, classified as fixed financial assets, reported.
The counterparty exposures related to interest-bearing securities are shown in Item 5.e "Operating and Financial Review and Prospects—Risk management—Credit or Counterparty Risks" in the table "Total Counterparty Risk Exposures".
The following table includes aggregated book values and fair values of securities held at year-end.
Securities held at year-end. Aggregated book values and fair values
| | 2002 | 2001 | 2003 | 2002 | ||||||||||||
|---|---|---|---|---|---|---|---|---|---|---|---|---|---|---|---|---|
| | Aggregated Book Value | Aggregated Fair Value | Aggregated Book Value | Aggregated Fair Value | Aggregated Book Value | Aggregated Fair Value | Aggregated Book Value | Aggregated Fair Value | ||||||||
| Security account | ||||||||||||||||
| Held-to-maturity | 31,369.2 | 31,978.3 | 29,429.3 | 29,819.5 | ||||||||||||
| Held-to-Maturity | 32,359.3 | 32,966.9 | 31,369.2 | 31,978.3 | ||||||||||||
| Hedge | 45,919.8 | 46,577.0 | 58,878.7 | 59,262.3 | 55,990.3 | 57,669.0 | 45,919.8 | 46,577.0 | ||||||||
| Trading | 8,113.2 | 8,113.2 | 5,110.6 | 5,110.6 | 11,407.5 | 11,407.5 | 8,113.2 | 8,113.2 | ||||||||
| Total | 85,402.2 | 86,668.5 | 93,418.6 | 94,192.4 | 99,757.1 | 102,043.4 | 85,402.2 | 86,668.5 | ||||||||
Of the total book value, Skr 48,642.564,469.4 million was related to securities whose book value exceeded the nominal value and Skr 36,759.835,287.7 million was related to securities whose book value was below the nominal value. The nominal values for these two categories amounted to Skr 47,297.264,197.7 million and Skr 38,060.035,395.5 million, respectively.
F-20 The following table shows gross unrealized losses and fair value, aggregated by investment category, and length of time that individual securities have been in a continuous unrealized loss position at December 31, 2003.
| | Less Than 12 Months | 12 Months or More | Total | |||||||||
|---|---|---|---|---|---|---|---|---|---|---|---|---|
| | Fair Value | Unrealised Losses | Fair Value | Unrealised Losses | Fair Value | Unrealised Losses | ||||||
| Security account | ||||||||||||
| Held-to-Maturity | 5,630.4 | 23.6 | 4,341.3 | 53.2 | 9,971.7 | 76.8 | ||||||
| Hedge | 10,117.9 | 36.9 | 2,348.3 | 5.0 | 12,466.2 | 41.9 | ||||||
| Total | 15,748.3 | 60.5 | 6,689.6 | 58.2 | 22,437.9 | 118.7 | ||||||
The unrealized losses are related to changes in general market conditions, for example interest rate level, and there is no evidence of that there is a probabilitiy of non-collection of nominal or interest amount. SEK has the intention and the ability to hold the held-to-maturity securities to maturity. Securities in the hedge category are hedged with derivatives which carry equal, but offsetting, unrealized gains.
Interest-bearing securities
| | As of December 31, 2002 | |||||||||||||
|---|---|---|---|---|---|---|---|---|---|---|---|---|---|---|
| | Treasuries & government bonds etc | Other interest bearing securities | ||||||||||||
| | Book Value | Fair value | Surplus/Deficit | Book Value | Fair value | Surplus/Deficit | ||||||||
| Current financial assets: | ||||||||||||||
| — Government debt, Swedish | 1,469.0 | 1,565.1 | 96.1 | |||||||||||
| — Municipalities, Swedish | 240.0* | 239.8* | -0.2* | |||||||||||
| — Mortgage institutions, Swedish | 4,091.8 | 4,090.7 | -1.1 | |||||||||||
| — Other Swedish issuers: | ||||||||||||||
| — Banking groups | 1,350.6 | 1,360.4 | 9.8 | |||||||||||
| — Other financial corporations | 1,267.4 | 1,276.9 | 9.5 | |||||||||||
| — Other corporations | 6,358.2 | 6,486.9 | 128.6 | |||||||||||
| — Goverment debt, foreign | 3,128.9 | 3,191.5 | 62.6 | |||||||||||
| — Municipalities and provinces, foreign | 380.4 | 390.4 | 10.0 | |||||||||||
| — Other foreign issuers: | ||||||||||||||
| — Banking groups of which subordinated | 19,775.6 | 19,963.0 | 187.4 | |||||||||||
| — Other financial corporations | 53.0 | 54.6 | 1.6 | 13,686.4 | 13,742.0 | 55.5 | ||||||||
| — Other corporations | 2,231.9 | 2,329.0 | 97.1 | |||||||||||
| Subtotal | 5,031.2 | 5,201.6 | 170.4 | 49,001.9 | 49,488.7 | 486.8 | ||||||||
| Fixed financial assets: | ||||||||||||||
| — Government debt, Swedish | 862.6 | 981.7 | 119.1 | |||||||||||
| — Municipalities, Swedish | 595.0 | * | 611.1 | * | 16.1 | * | ||||||||
| — Mortgage institutions, Swedish | 132.9 | 147.0 | 14.1 | |||||||||||
| —Other Swedish issuers: | ||||||||||||||
| — Banking groups | 5,929.1 | 5,947.5 | 18.4 | |||||||||||
| — Other financial corporations | 1,282.4 | 1,284.8 | 2.4 | |||||||||||
| — Other corporations | 12,848.1 | 13,087.4 | 239.3 | |||||||||||
| — Goverment debt, foreign | 114.7 | 125.8 | 11.1 | |||||||||||
| — Municipalities and provinces, foreign | ||||||||||||||
| — Other foreign issuers: | ||||||||||||||
| — Banking groups | 950.7 | 939.1 | -11.6 | |||||||||||
| — Other financial corporations | 1,451.6 | 1,503.4 | 51.8 | |||||||||||
| — Other corporations | 7,201.9 | 7,350.3 | 148.4 | |||||||||||
| Subtotal | 977.3 | 1,107.5 | 130.2 | 30,391.8 | 30,870.7 | 479.0 | ||||||||
| *—of which issued by public authorities | 595.0 | * | 611.1 | * | 16.1 | * | ||||||||
| Total of current and fixed financial assets: | ||||||||||||||
| — Government debt, Swedish | 2,331.6 | 2,546.8 | 215.2 | |||||||||||
| — Municipalities, Swedish | 835.0 | * | 850.9 | * | 15.9 | * | ||||||||
| — Mortgage institutions, Swedish | 4,224.7 | 4,237.7 | 13.0 | |||||||||||
| — Other Swedish issuers: | ||||||||||||||
| — Banking groups | 7,279.8 | 7,307.9 | 28.1 | |||||||||||
| — Other financial corporations | 2,549.8 | 2,561.7 | 12.0 | |||||||||||
| — Other corporations | 19,206.4 | 19,574.3 | 368.0 | |||||||||||
| — Goverment debt, foreign | 3,243.6 | 3,317.2 | 73.6 | |||||||||||
| — Municipalities and provinces, foreign | 380.4 | 390.4 | 10.0 | |||||||||||
| — Other foreign issuers: | ||||||||||||||
| — Banking groups of which subordinated | 0.0 | 0.0 | 0.0 | 20,726.2 | 20,902.1 | 175.9 | ||||||||
| — Other financial corporation | 53.0 | 54.6 | 1.6 | 15,138.0 | 15,245.5 | 107.4 | ||||||||
| — Other corporations | 9,433.8 | 9,679.3 | 245.5 | |||||||||||
| Grand total | 6,008.5 | 6,309.1 | 300.4 | 79,393.7 | 80,359.4 | 965.7 | ||||||||
| *-of which issued by public authorities | 835.0 | * | 850.9 | * | 15.9 | * | ||||||||
| Of which: | ||||||||||||||
| S-system | 75.3 | 83.1 | 7.8 | |||||||||||
| Securities subject to hedge accounting | 15,643.6 | 15,894.7 | 251.1 | 48,522.6 | 49,014.9 | 492.3 | ||||||||
| Securities with market values quoted on an exhange | 6,100.1 | 6,324.6 | 224.5 | 37,745.5 | 38,227.9 | 482.4 | ||||||||
F-21
| | Treasuries & government bonds etc. | Other interest bearing securities | |||||||||||||
|---|---|---|---|---|---|---|---|---|---|---|---|---|---|---|---|
| | Book Value | Fair value | Surplus/Deficit | Book Value | Fair value | Surplus/Deficit | |||||||||
| Current financial assets: | |||||||||||||||
— Government debt, Swedish | 1,539.5 | 1,638.3 | 98.8 | ||||||||||||
| — Municipalities, Swedish | 240.0 | * | 239.8 | * | -0.2 | * | |||||||||
| — Mortgage institutions, Swedish | 5,031.6 | 5,032.1 | 0.5 | ||||||||||||
| — Other Swedish issuers: | |||||||||||||||
| — Banking groups | |||||||||||||||
| — Other financial corporations | 2,534.3 | 2,771.1 | 236.8 | ||||||||||||
| — Other corporations | 6,874.7 | 6,837.3 | -37.4 | ||||||||||||
| — Goverment debt, foreign | 1,992.8 | 2,035.5 | 42.7 | ||||||||||||
| — Municipalities and provinces, foreign | |||||||||||||||
| — Other foreign issuers: | |||||||||||||||
| — Banking groups | 21,354.0 | 21,555.5 | 201.5 | ||||||||||||
| of which subordinated | |||||||||||||||
| — Other financial corporations | 113.5 | 113.9 | 0.4 | 17,854.9 | 18,368.1 | 513.2 | |||||||||
| — Other corporations | 9,862.5 | 10,484.9 | 622.4 | ||||||||||||
Subtotal | 3,645.8 | 3,787.7 | 141.9 | 63,752.0 | 65,288.8 | 1,536.8 | |||||||||
| *-of which issued by public authorities | 240.0 | * | 239.8 | * | -0.2 | * | |||||||||
Fixed financial assets: | |||||||||||||||
— Government debt, Swedish | 718.1 | 831.0 | 112.9 | ||||||||||||
| — Municipalities, Swedish | 1,332.1 | * | 1,350.3 | * | 18.2 | * | |||||||||
| — Mortgage institutions, Swedish | 137.6 | 142.9 | 5.3 | ||||||||||||
| — Other Swedish issuers: | |||||||||||||||
| — Banking groups | 6,465.5 | 6,454.1 | -11.4 | ||||||||||||
| — Other financial corporations | 3,012.7 | 3,007.9 | -4.8 | ||||||||||||
| — Other corporations | 9,826.7 | 10,025.8 | 199.1 | ||||||||||||
| — Goverment debt, foreign | 94.6 | 98.8 | 4.2 | ||||||||||||
| — Municipalities and provinces, foreign | |||||||||||||||
— Other foreign issuers: | |||||||||||||||
| — Banking groups | 1,593.0 | 1,591.5 | -1.5 | ||||||||||||
| — Other financial corporations | 1,874.3 | 1,925.3 | 51.0 | ||||||||||||
| — Other corporations | 7,304.7 | 7,539.3 | 234.6 | ||||||||||||
| Subtotal | 812.7 | 929.8 | 117.1 | 31,546.6 | 32,037.1 | 490.5 | |||||||||
| *-of which issued by public authorities | 1,332.1 | * | 1,350.3 | * | 18.2 | * | |||||||||
Total of current and fixed financial assets: | |||||||||||||||
— Government debt, Swedish | 2,257.6 | 2,469.3 | 211.7 | ||||||||||||
| — Municipalities, Swedish | 1,572.1 | * | 1,590.1 | * | 18.0 | * | |||||||||
| — Mortgage institutions, Swedish | 5,169.2 | 5,175.0 | 5.8 | ||||||||||||
| — Other Swedish issuers: | |||||||||||||||
| — Banking groups | 6,465.5 | 6,454.1 | -11.4 | ||||||||||||
| — Other financial corporations | 5,547.0 | 5,779.0 | 232.0 | ||||||||||||
| — Other corporations | 16,701.4 | 16,863.1 | 161.7 | ||||||||||||
| — Goverment debt, foreign | 2,087.4 | 2,134.3 | 46.9 | ||||||||||||
| — Municipalities and provinces, foreign | 0.0 | 0.0 | 0.0 | ||||||||||||
— Other foreign issuers: | |||||||||||||||
| — Banking groups | 0.0 | 0.0 | 0.0 | 22,947.0 | 23,147.0 | 200.0 | |||||||||
| of which subordinated | |||||||||||||||
| — Other financial corporations | 113.5 | 113.9 | 0.4 | 19,729.2 | 20,293.4 | 564.2 | |||||||||
| — Other corporations | 17,167.2 | 18,024.2 | 857.0 | ||||||||||||
Grand total | 4,458.5 | 4,717.5 | 259.0 | 95,298.6 | 97,325.9 | 2,027.3 | |||||||||
| *-of which issued by public authorities | 1,572.1 | * | 1,590.1 | * | 18.0 | * | |||||||||
Of which: S-system | 57.4 | 62.0 | 4.6 | ||||||||||||
| Securities subject to hedge accounting | 2,169.3 | 2,220.6 | 51.3 | 29,691.8 | 31,214.3 | 1,522.5 | |||||||||
| Securities with market values quoted on an exhange | 3,686.1 | 3,932.2 | 246.1 | 84,228.5 | 86,134.3 | 1,905.8 | |||||||||
| | Total as of December 31, 2002 | Total as of December 31, 2001 | ||||||||||||
|---|---|---|---|---|---|---|---|---|---|---|---|---|---|---|
| | Book Value | Fair value | Surplus/ Deficit | Book Value | Fair value | Surplus/ Deficit | ||||||||
| Current financial assets: | ||||||||||||||
| — Government debt, Swedish | 1,469.0 | 1,565.1 | 96.1 | 1,872.2 | 1,889.2 | 17.0 | ||||||||
| — Municipalities, Swedish | 240.0 | * | 239.8 | * | -0.2 | * | ||||||||
| — Mortgage institutions, Swedish | 4,091.8 | 4,090.7 | -1.1 | 3,870.4 | 3,884.8 | 14.4 | ||||||||
| — Other Swedish issuers: | ||||||||||||||
| — Banking groups | 1,350.6 | 1,360.4 | 9.7 | 2,606.1 | 2,619.3 | 13.2 | ||||||||
| — Other financial corporations | 1,267.4 | 1,276.9 | 9.5 | 1,143.3 | 1,155.2 | 11.9 | ||||||||
| — Other corporations | 6,358.2 | 6,486.9 | 128.7 | 4,267.4 | 4,276.5 | 9.1 | ||||||||
| — Goverment debt, foreign | 3,128.9 | 3,191.5 | 62.5 | 14,311.6 | 14,351.7 | 40.1 | ||||||||
| — Municipalities and provinces, foreign | 380.4 | 390.4 | 10.0 | 326.4 | 335.6 | 9.2 | ||||||||
| — Other foreign issuers: | ||||||||||||||
| — Banking groups of which subordinated | 19,775.6 | 19,963.0 | 187.4 | 27,862.2 | 28,050.8 | 188.6 | ||||||||
| — Other financial corporations | 13,739.4 | 13,796.6 | 57.3 | 4,568.0 | 4,606.0 | 38.0 | ||||||||
| — Other corporations | 2,231.9 | 2,329.0 | 97.1 | 3,161.6 | 3,203.8 | 42.2 | ||||||||
| Subtotal | 54,033.1 | 54,690.3 | 657.2 | 63,989.2 | 64,372.9 | 383.7 | ||||||||
| Fixed financial assets: | ||||||||||||||
| — Government debt, Swedish | 862.6 | 981.7 | 119.1 | 950.2 | 1,134.3 | 184.1 | ||||||||
| — Municipalities, Swedish | 595.0 | * | 611.1 | * | 16.1 | * | 475.0 | * | 478.8 | * | 3.8 | * | ||
| — Mortgage institutions,Swedish | 132.9 | 147.0 | 14.1 | 266.4 | 290.4 | 24.0 | ||||||||
| — Other Swedish issuers: | ||||||||||||||
| — Banking groups | 5,929.1 | 5,947.5 | 18.4 | 8,632.6 | 8,528.5 | -104.1 | ||||||||
| — Other financial corporations | 1,282.4 | 1,284.8 | 2.4 | 700.2 | 672.0 | -28.2 | ||||||||
| — Other corporations | 12,848.1 | 13,087.4 | 239.3 | 11,282.6 | 11,573.3 | 290.7 | ||||||||
| — Goverment debt, foreign | 114.7 | 125.8 | 11.1 | 138.6 | 151.5 | 12.9 | ||||||||
| — Municipalities and provinces, foreign | ||||||||||||||
| — Other foreign issuers: | ||||||||||||||
| — Banking groups | 950.7 | 939.1 | -11.5 | 470.5 | 466.0 | -4.5 | ||||||||
| — Other financial corporations | 1,451.6 | 1,503.4 | 51.8 | 0.0 | 0.0 | 0.0 | ||||||||
| — Other corporations | 7,201.9 | 7,350.3 | 148.4 | 6,513.2 | 6,524.7 | 11.5 | ||||||||
| Subtotal | 31,369.2 | 31,978.4 | 609.2 | 29,429.3 | 29,819.5 | 390.2 | ||||||||
| *-of which issued by public authorities | 835.0 | * | 850.9 | * | 15.9 | * | 475.0 | * | 478.8 | * | 3.8 | * | ||
| Total of current and fixed financial assets: | ||||||||||||||
| — Government debt, Swedish | 2,331.6 | 2,546.8 | 215.2 | 2,822.4 | 3,023.5 | 201.1 | ||||||||
| — Municipalities, Swedish | 835.0 | * | 850.9 | * | 15.9 | * | 475.0 | * | 478.8 | * | 3.8 | * | ||
| — Mortgage institutions,Swedish | 4,224.7 | 4,237.7 | 13.0 | 4,136.8 | 4,175.2 | 38.4 | ||||||||
| — Other Swedish issuers: | ||||||||||||||
| — Banking groups | 7,279.8 | 7,307.9 | 28.1 | 11,238.7 | 11,147.8 | -90.9 | ||||||||
| — Other financial corporations | 2,549.8 | 2,561.7 | 11.9 | 1,843.5 | 1,827.2 | -16.3 | ||||||||
| — Other corporations | 19,206.4 | 19,574.3 | 368.0 | 15,550.0 | 15,849.8 | 299.8 | ||||||||
| — Goverment debt, foreign | 3,243.6 | 3,317.2 | 73.6 | 14,450.2 | 14,503.2 | 53.0 | ||||||||
| — Municipalities and provinces, foreign | 380.4 | 390.4 | 10.0 | 326.5 | 335.6 | 9.1 | ||||||||
| — Other foreign issuers: | ||||||||||||||
| — Banking groups of which subordinated | 20,726.2 | 20,902.2 | 176.0 | 28,332.8 | 28,516.8 | 184.0 | ||||||||
| — Other financial corporations | 15,191.0 | 15,300.1 | 109.1 | 4,568.0 | 4,606.0 | 38.0 | ||||||||
| — Other corporations | 9,433.8 | 9,679.3 | 245.5 | 9,674.7 | 9,728.4 | 53.7 | ||||||||
| Grand total | 85,402.2 | 86,668.5 | 1,266.3 | 93,418.6 | 94,192.4 | 773.8 | ||||||||
| *-of which issued by public authorities | 835.0 | * | 850.9 | * | 15.9 | * | 475.0 | * | 478.8 | * | 3.8 | * | ||
| Of which: | ||||||||||||||
| S-system | 75.3 | 83.1 | 7.8 | 73.4 | 83.6 | 10.2 | ||||||||
| Securities subject to hedge accounting | 64,166.2 | 64,909.6 | 743.4 | 63,981.7 | 64,372.9 | 391.2 | ||||||||
| Securities with market values quoted on an exchange | 43,845.6 | 44,552.5 | 706.9 | 51,848.6 | 52,527.7 | 679.1 | ||||||||
F-22
| | | Total 2003 | | | Total 2002 | | |||||||||
|---|---|---|---|---|---|---|---|---|---|---|---|---|---|---|---|
| | Book Value | | Book Value | | |||||||||||
| | Fair value | Surplus/Deficit | Fair value | Surplus/Deficit | |||||||||||
| Current financial assets: | |||||||||||||||
— Government debt, Swedish | 1,539.5 | 1,638.3 | 98.8 | 1,469.0 | 1,565.1 | 96.1 | |||||||||
| — Municipalities, Swedish | 240.0 | * | 239.8 | * | -0.2 | 240.0 | * | 239.8 | * | -0.2 | * | ||||
| — Mortgage institutions, Swedish | 5,031.6 | 5,032.1 | 0.5 | 4,091.8 | 4,090.7 | -1.1 | |||||||||
| — Other Swedish issuers: | |||||||||||||||
| — Banking groups | 0.0 | 0.0 | 0.0 | 1,350.6 | 1,360.4 | 9.7 | |||||||||
| — Other financial corporations | 2,534.3 | 2,771.1 | 236.8 | 1,267.4 | 1,276.9 | 9.5 | |||||||||
| — Other corporations | 6,874.7 | 6,837.3 | -37.4 | 6,358.2 | 6,486.9 | 128.7 | |||||||||
| — Goverment debt, foreign | 1,992.8 | 2,035.5 | 42.7 | 3,128.9 | 3,191.5 | 62.5 | |||||||||
| — Municipalities and provinces, foreign | 0.0 | 0.0 | 0.0 | 380.4 | 390.4 | 10.0 | |||||||||
| — Other foreign issuers: | |||||||||||||||
| — Banking groups | 21,354.0 | 21,555.5 | 201.5 | 19,775.6 | 19,963.0 | 187.4 | |||||||||
| of which subordinated | |||||||||||||||
| — Other financial corporations | 17,968.4 | 18,482.0 | 513.6 | 13,739.4 | 13,796.6 | 57.3 | |||||||||
| — Other corporations | 9,862.5 | 10,484.9 | 622.4 | 2,231.9 | 2,329.0 | 97.1 | |||||||||
Subtotal | 67,397.8 | 69,076.5 | 1,678.7 | 54,033.1 | 54,690.3 | 657.2 | |||||||||
| *-of which issued by public authorities | 240.0 | * | 239.8 | * | -0.2 | * | 240.0 | * | 239.8 | * | -0.2 | * | |||
Fixed financial assets: | |||||||||||||||
— Government debt, Swedish | 718.1 | 831.0 | 112.9 | 862.6 | 981.7 | 119.1 | |||||||||
| — Municipalities, Swedish | 1,332.1 | * | 1,350.3 | * | 18.2 | * | 595.0 | * | 611.1 | * | 16.1 | * | |||
| — Mortgage institutions,Swedish | 137.6 | 142.9 | 5.3 | 132.9 | 147.0 | 14.1 | |||||||||
| — Other Swedish issuers: | |||||||||||||||
| — Banking groups | 6,465.5 | 6,454.1 | -11.4 | 5,929.1 | 5,947.5 | 18.4 | |||||||||
| — Other financial corporations | 3,012.7 | 3,007.9 | -4.8 | 1,282.4 | 1,284.8 | 2.4 | |||||||||
| — Other corporations | 9,826.7 | 10,025.8 | 199.1 | 12,848.1 | 13,087.4 | 239.3 | |||||||||
| — Goverment debt, foreign | 94.6 | 98.8 | 4.2 | 114.7 | 125.8 | 11.1 | |||||||||
| — Municipalities and provinces, foreign | |||||||||||||||
— Other foreign issuers: | |||||||||||||||
| — Banking groups | 1,593.0 | 1,591.5 | -1.5 | 950.7 | 939.1 | -11.5 | |||||||||
| — Other financial corporations | 1,874.3 | 1,925.3 | 51.0 | 1,451.6 | 1,503.4 | 51.8 | |||||||||
| — Other corporations | 7,304.7 | 7,539.3 | 234.6 | 7,201.9 | 7,350.3 | 148.4 | |||||||||
| Subtotal | 32,359.3 | 32,966.9 | 607.6 | 31,369.2 | 31,978.4 | 609.2 | |||||||||
| *-of which issued by public authorities | 1,332.1 | * | 1,350.3 | * | 18.2 | * | 595.0 | * | 611.1 | * | 16.1 | * | |||
Total of current and fixed financial assets: | |||||||||||||||
— Government debt, Swedish | 2,257.6 | 2,469.3 | 211.7 | 2,331.6 | 2,546.8 | 215.2 | |||||||||
| — Municipalities, Swedish | 1,572.1 | * | 1,590.1 | * | 18.0 | * | 835.0 | * | 850.9 | * | 15.9 | * | |||
| — Mortgage institutions,Swedish | 5,169.2 | 5,175.0 | 5.8 | 4,224.7 | 4,237.7 | 13.0 | |||||||||
| — Other Swedish issuers: | |||||||||||||||
| — Banking groups | 6,465.5 | 6,454.1 | -11.4 | 7,279.8 | 7,307.9 | 28.1 | |||||||||
| — Other financial corporations | 5,547.0 | 5,779.0 | 232.0 | 2,549.8 | 2,561.7 | 11.9 | |||||||||
| — Other corporations | 16,701.4 | 16,863.1 | 161.7 | 19,206.4 | 19,574.3 | 368.0 | |||||||||
| — Goverment debt, foreign | 2,087.4 | 2,134.3 | 46.9 | 3,243.6 | 3,317.2 | 73.6 | |||||||||
| — Municipalities and provinces, foreign | 0.0 | 0.0 | 0.0 | 380.4 | 390.4 | 10.0 | |||||||||
— Other foreign issuers: | |||||||||||||||
| — Banking groups | 22,947.0 | 23,147.0 | 200.0 | 20,726.2 | 20,902.2 | 176.0 | |||||||||
| of which subordinated | |||||||||||||||
| — Other financial corporations | 19,842.7 | 20,407.3 | 564.6 | 15,191.0 | 15,300.1 | 109.1 | |||||||||
| — Other corporations | 17,167.2 | 18,024.2 | 857.0 | 9,433.8 | 9,679.3 | 245.5 | |||||||||
Grand total | 99,757.1 | 102,043.4 | 2,286.3 | 85,402.2 | 86,668.5 | 1,266.3 | |||||||||
| *-of which issued by public authorities | 1,572.1 | * | 1,590.1 | * | 18.0 | * | 835.0 | * | 850.9 | * | 15.9 | * | |||
Of which: S-system | 57.4 | 62.0 | 4.6 | 75.3 | 83.1 | 7.8 | |||||||||
| Securities subject to hedge accounting | 31,861.1 | 33,435.0 | 1,573.8 | 64,166.2 | 64,909.6 | 743.4 | |||||||||
| Securities with market values quoted on an exchange | 87,914.6 | 90,066.5 | 2,151.9 | 43,845.6 | 44,552.5 | 706.9 | |||||||||
Note 19. Shares in subsidiaries
| | 2002 | 2001 | ||||||||||
|---|---|---|---|---|---|---|---|---|---|---|---|---|
| | Consolidated Group | Parent Company | Of which S-system | Consolidated Group | Parent Company | Of which S-system | ||||||
| Shares in subsidiary (SEKTIONEN) (A) | n.a. | 103.5 | — | n.a | 103.5 | — | ||||||
| Shares in subsidiary (SEK Securities) (B) | n.a. | 10.0 | — | n.a | 0.1 | — | ||||||
| Total | — | 113.5 | — | — | 103.6 | — | ||||||
| | 2003 | 2002 | ||||||||||
|---|---|---|---|---|---|---|---|---|---|---|---|---|
| | Consolidated Group | Parent Company | Of which S-system | Consolidated Group | Parent Company | Of which S-system | ||||||
| Shares in subsidiary (AB SEKTIONEN)(A) | n.a. | 103.5 | — | n.a | 103.5 | — | ||||||
| Shares in subsidiary (AB SEK Securities)(B) | n.a. | 10.0 | — | n.a | 10.0 | — | ||||||
| Total | — | 113.5 | — | — | 113.5 | — | ||||||
The net result of the Subsidiaries for the year 20022003 was Skr 0.5-0.8 million (0.0)(0.5).
Note 20. Other assets
| | 2002 | 2001 | 2003 | 2002 | ||||||||||||||||||||
|---|---|---|---|---|---|---|---|---|---|---|---|---|---|---|---|---|---|---|---|---|---|---|---|---|
| | Consolidated Group | Parent Company | Of which S-system | Consolidated Group | Parent Company | Of which S-system | Consolidated Group | Parent Company | Of which S-system | Consolidated Group | Parent Company | Of which S-system | ||||||||||||
| Due from the State | 65.7 | 65.7 | 65.7 | 51.7 | 51.7 | 14.0 | 0.5 | 0.5 | -2.7 | 65.7 | 65.7 | 65.7 | ||||||||||||
| Claim on subsidiary | n.a. | 67.6 | — | n.a. | 39.2 | — | n.a. | 73.4 | — | n.a. | 67.6 | — | ||||||||||||
| Balanced premiums and discounts and corresponding items related to assets and liabilities, respectively (balanced as assets) | 337.7 | 337.7 | — | 250.0 | 250.0 | — | ||||||||||||||||||
| Derivative contracts with positive values | 2,674.0 | 2,674.0 | 0.2 | 4,233.3 | 4,233.3 | 0.8 | 6,037.7 | 6,037.7 | 2.7 | 2,674.0 | 2,674.0 | 0.2 | ||||||||||||
| Debt for which value has not yet been received | 454.8 | 454.8 | — | 1,306.0 | 1,306.0 | — | 1,157.8 | 1,157.8 | — | 454.8 | 454.8 | — | ||||||||||||
| Claims for assets sold though not yet delivered and paid for | 479.8 | 479.8 | — | 101.0 | 101.0 | — | — | — | 479.8 | 479.8 | — | |||||||||||||
| Other | 514.0 | 514.0 | 95.0 | 556.1 | 556.1 | 175.4 | 482.3 | 482.2 | 96.9 | 851.7 | 851.7 | 95.0 | ||||||||||||
| Total | 4,526.0 | 4,593.6 | 160.9 | 6,498.1 | 6,537.3 | 190.2 | 7,678.3 | 7,751.6 | 96.9 | 4,526.0 | 4,593.6 | 160.9 | ||||||||||||
Note 21. Prepaid expenses and accrued revenues
| | 2002 | 2001 | ||||||||||
|---|---|---|---|---|---|---|---|---|---|---|---|---|
| | Consolidated Group | Parent Company | Of which S-system | Consolidated Group | Parent Company | Of which S-system | ||||||
| Interest revenues accrued | 3,394.7 | 3,394.7 | 139.9 | 3,970.0 | 3,970.0 | 232.9 | ||||||
| Prepaid expenses and other accrued revenues | 4.7 | 4.5 | — | 3.8 | 3.8 | — | ||||||
| Total | 3,399.4 | 3,399.2 | 139.9 | 3,973.8 | 3,973.8 | 232.9 | ||||||
F-23
2003 2002 Consolidated
Group Parent
Company Of which
S-system Consolidated
Group Parent
Company Of which
S-systemInterest revenues accrued 3,387.1 3,387.1 93.7 3,394.7 3,394.7 139.9 Prepaid expenses and other accrued revenues 4.3 4.2 — 4.7 4.5 — Total 3,391.4 3,391.3 93.7 3,399.4 3,399.2 139.9
Note 22. Senior debt
| | 2002 | 2001 | 2003 | 2002 | ||||||||||||||||||||
|---|---|---|---|---|---|---|---|---|---|---|---|---|---|---|---|---|---|---|---|---|---|---|---|---|
| | Consolidated Group | Parent Company | Of which S-system | Consolidated Group | Parent Company | Of which S-system | Consolidated Group | Parent Company | Of which S-system | Consolidated Group | Parent Company | Of which S-system | ||||||||||||
| Total senior borrowings exclusive of senior securities issued | 645.3 | 645.3 | 8.6 | 1,603.5 | 1,603.5 | 12.5 | 2,574.5 | 2,584.5 | 1.2 | 645.3 | 645.3 | 8.6 | ||||||||||||
| Total senior securities issued | 111,968.3 | 111,968.3 | 3,170.1 | 121,697.5 | 121,697.5 | 5,158.6 | 129,990.4 | 129,990.4 | 552.5 | 111,968.3 | 111,968.3 | 3,170.1 | ||||||||||||
| Total senior debt outstanding | 112,613.6 | 112,613.6 | 3,178.7 | 123,301.0 | 123,301.0 | 5,171.1 | 132,564.9 | 132,574.9 | 553.7 | 112,613.6 | 112,613.6 | 3,178.7 | ||||||||||||
Of which denominated in: | ||||||||||||||||||||||||
| Swedish kronor | 6,557.2 | 6,557.2 | 202.2 | 6,538.5 | 6,538.5 | 423.3 | 8,331.2 | 8,128.5 | 202.8 | 6,557.2 | 6,557.2 | 202.2 | ||||||||||||
| Foreign currencies | 106,056.4 | 106,056.4 | 2,796.5 | 116,762.5 | 116,762.5 | 4,747.8 | 124,233.7 | 124,446.4 | 350.9 | 106,056.4 | 106,056.4 | 2,976.5 | ||||||||||||
The reported amount of total senior debt outstanding has been affected (reduced) by the following amounts, representing own debt repurchased | - -6,325.5 | - -6,325.5 | — | - -14,105.7 | - -14,105.7 | — | - -4,783.4 | - -4,783.4 | — | - -6,325.5 | - -6,325.5 | — | ||||||||||||
The maturity profile of SEK'sSEK senior debt is included as one componentobtained through private and public offerings of debt securities in the graph "Development over Timeinternational capital and money markets. Debt securities is issued with different currencies, different interest rates (fixed, floating, or with a formula), different payment terms and maturity dates, and different conversion or redemption features.
Total senior debt at December 31, 2003, had the following maturities and weigthed average rates:
| | Consolidated Group | Range of Maturities | Weighted Average Coupon | ||||
|---|---|---|---|---|---|---|---|
| Senior debt with floating rate coupon | 15,444.7 | 2004-2034 | n.a. | (a) | |||
| Senior debt with coupon based on formula | 25,838.7 | 2004-2034 | n.a. | (b) | |||
| Senior debt in the form of a zero coupon bond | 8,971.4 | 2004-2028 | 0.0 | %(c) | |||
| Senior debt with fixed rate coupon | 82,310.0 | 2004-2026 | 4.1 | %(d) | |||
| Total senior debt outstanding | 132,564.8 |
No collateral are posted for any senior debt. Senior debt include transactions which has call- or put-options which in Item 5.e "Operating and Financial Review and Prospects—Risk management—Funding and Liquidity Risks".the case where there is a swap hedging the individual debt, the swap has equal, but opposite, features.
Note 23. Other liabilities
| | 2002 | 2001 | 2003 | 2002 | ||||||||||||||||||||
|---|---|---|---|---|---|---|---|---|---|---|---|---|---|---|---|---|---|---|---|---|---|---|---|---|
| | Consolidated Group | Parent Company | Of which S-system | Consolidated Group | Parent Company | Of which S-system | Consolidated Group | Parent Company | Of which S-system | Consolidated Group | Parent Company | Of which S-system | ||||||||||||
| Liability to subsidiaries | n.a. | 30.8 | — | n.a. | 2.2 | — | n.a. | 35.5 | — | n.a. | 30.8 | — | ||||||||||||
| Tax liability | 11.5 | 11.2 | — | — | — | — | 0.1 | 0.0 | — | 11.5 | 11.2 | — | ||||||||||||
| Balanced premiums and discounts and corresponding items related to liabilities and assets, respectively (balanced as liabilities) | 143.0 | 143.0 | 1.5 | 81.2 | 81.2 | 3.7 | ||||||||||||||||||
| Derivative contracts with negative values | 6,630.0 | 6,630.0 | 4.0 | 9,880.7 | 9,880.7 | 227.1 | 7,651.4 | 7,651.4 | 2.2 | 6,630.0 | 6,630.0 | 4.0 | ||||||||||||
| Liabilities related to assets acquired though not yet delivered and paid for | — | — | — | 169.5 | 169.5 | — | 45.5 | 45.5 | — | — | — | — | ||||||||||||
| Other | 3,763.3 | 3,763.3 | 59.5 | 3,756.0 | 3,756.0 | 61.7 | 2,282.3 | 2,282.3 | 145.3 | 3,906.3 | 3,906.3 | 61.0 | ||||||||||||
| Total | 10,547.8 | 10,578.3 | 65.0 | 13,887.4 | 13,889.6 | 292.5 | 9,979.3 | 10,014.7 | 147.5 | 10,547.8 | 10,578.3 | 65.0 | ||||||||||||
Note 24. Accrued expenses and prepaid revenues
| | 2002 | 2001 | ||||||||||
|---|---|---|---|---|---|---|---|---|---|---|---|---|
| | Consolidated Group | Parent Company | Of which S-system | Consolidated Group | Parent Company | Of which S-system | ||||||
| Interest expenses accrued | 2,923.9 | 2,923.9 | 241.1 | 3,503.7 | 3,503.7 | 328.8 | ||||||
| Prepaid revenues and other accrued expenses | 64.9 | 64.5 | 0.0 | 61.9 | 61.6 | 0.0 | ||||||
| Total | 2,988.8 | 2,988.4 | 241.1 | 3,565.6 | 3,565.3 | 328.8 | ||||||
F-24
| | 2003 | 2002 | ||||||||||
|---|---|---|---|---|---|---|---|---|---|---|---|---|
| | Consolidated Group | Parent Company | Of which S-system | Consolidated Group | Parent Company | Of which S-system | ||||||
| Interest expenses accrued | 2,855.7 | 2,855.6 | 113.7 | 2,923.9 | 2,923.9 | 241.1 | ||||||
| Prepaid revenues and other accrued expenses | 53.0 | 52.7 | 0.0 | 64.9 | 64.5 | 0.0 | ||||||
| Total | 2,908.7 | 2,908.3 | 113.7 | 2,988.8 | 2,988.4 | 241.1 | ||||||
Note 25. Allocations
| | 2002 | 2001 | 2003 | 2002 | ||||||||||||||||||||
|---|---|---|---|---|---|---|---|---|---|---|---|---|---|---|---|---|---|---|---|---|---|---|---|---|
| | Consolidated Group | Parent Company | Of which S-system | Consolidated Group | Parent Company | Of which S-system | Consolidated Group | Parent Company | Of which S-system | Consolidated Group | Parent Company | Of which S-system | ||||||||||||
| Pension liabilities | 18.2 | 18.2 | — | 18.4 | 18.4 | — | 17.9 | 17.9 | — | 18.2 | 18.2 | — | ||||||||||||
| Deferred taxes related to untaxed reserves | 380.8 | n.a. | — | 385.0 | n.a. | — | 376.5 | n.a. | — | 380.8 | n.a. | — | ||||||||||||
| Total | 399.0 | 18.2 | — | 403.4 | 18.4 | — | 394.4 | 17.9 | — | 399.0 | 18.2 | — | ||||||||||||
Note 26. Subordinated debt
| | 2002 | 2001 | 2003 | 2002 | ||||||||||||||||||||
|---|---|---|---|---|---|---|---|---|---|---|---|---|---|---|---|---|---|---|---|---|---|---|---|---|
| | Consolidated Group | Parent Company | Of which S-system | Consolidated Group | Parent Company | Of which S-system | Consolidated Group | Parent Company | Of which S-system | Consolidated Group | Parent Company | Of which S-system | ||||||||||||
| Perpetual, non-cumulative subordinated loan, foreign currency (A),(B) | 1,765.0 | 1,765.0 | — | 2,133.5 | 2,133.5 | — | ||||||||||||||||||
| Perpetual, non-cumulative subordinated loan, foreign currency (2003(A),(B)) (2002(C),(D)) | 2,546.3 | 2,546.3 | — | 1,765.0 | 1,765.0 | — | ||||||||||||||||||
| Non-perpetual, cumulative subordinated loan, foreign currency | 459.6 | 459.6 | — | 2,604.5 | 2,604.5 | — | 454.7 | 454.7 | — | 459.6 | 459.6 | — | ||||||||||||
| Total subordinated debt outstanding | 2,224.6 | 2,224.6 | — | 4,738.0 | 4,738.0 | — | 3,001.0 | 3,001.0 | — | 2,224.6 | 2,224.6 | — | ||||||||||||
Of which denominated in: | ||||||||||||||||||||||||
| Swedish kronor | — | — | — | — | — | — | — | — | — | — | — | — | ||||||||||||
| Foreign currencies | 2,224.6 | 2,224.6 | — | 4,738.0 | 4,738.0 | — | 3,001.0 | 3,001.0 | — | 2,224.6 | 2,224.6 | — | ||||||||||||
(A): Nominal value USD 150 million. Interest payments quarterly in arrears at a rate of 7.375 percent per annum provided that (i) SEK pays a dividend to its shareholders, or (ii) the Annual General Meeting has expressly approved such interest payments. Convertible, at SEK's option, into non-cumulative preference shares. Redeemable, at SEK's option, on or after September 1, 2003, at 100 percent of the nominal value. Redemption requires the prior approval of the Swedish Financial Supervisory Authority.
(B): Nominal value USD 50 million. Interest payments quarterly in arrears at a rate of 7.2 percent per annum provided that (i) SEK pays a dividend to its shareholders, or (ii) the Annual General Meeting has. expressly approved such interest payments. Convertible, at SEK's option, into non-cumulative preference shares. Redeemable, at SEK's option, on or after December 5, 2002, at 100 percent of the nominal value. Redemption requires the prior approval of the Swedish Financial Supervisory Authority.
(C): Nominal value EUR 50 million. Matures on June 21, 2010. Interest payments quarterly in arrears at a rate of Euribor plus 0.43 percent. Callable, at SEK's option, on or after June 21, 2005, at 100 percent of the nominal value. Redemption requires the prior approval of the Swedish Financial Supervisory Authority. If not called coupon will step up to Euribor plus 1.43 percent.
| (A) | Nominal value USD 200 million. Interest payments quarterly in arrears at a rate of 5.40 percent per annum. Redeemable, at SEK's option, on or after December 27, 2008, at 100 percent of the nominal value. Redemption requires the prior approval of the Swedish Financial Supervisory Authority. | |
| (B) | Nominal value USD 150 million. Interest payments quarterly in arrears at a rate of 6.375 percent per annum. Redeemable, at SEK's option, on or after December 27, 2008, at 100 percent of the nominal value. Redemption requires the prior approval of the Swedish Financial Supervisory Authority. | |
| (C): | Nominal value USD 150 million. Interest payments quarterly in arrears at a rate of 7.375 percent per annum provided that (i) SEK pays a dividend to its shareholders, or (ii) the Annual General Meeting has expressly approved such interest payments. Convertible, at SEK's option, into non-cumulative preference shares. Redeemable, at SEK's option, on or after September 1, 2003, at 100 percent of the nominal value. Redemption requires the prior approval of the Swedish Financial Supervisory Authority. Redemption was made on November 3, 2003. | |
| (D): | Nominal value USD 50 million. Interest payments quarterly in arrears at a rate of 7.2 percent per annum provided that (i) SEK pays a dividend to its shareholders, or (ii) the Annual General Meeting has expressly approved such interest payments. Convertible, at SEK's option, into non-cumulative preference shares. Redeemable, at SEK's option, on or after December 5, 2002, at 100 percent of the nominal value. Redemption requires the prior approval of the Swedish Financial Supervisory Authority. Redemption was made on July 15, 2003. | |
| (E): | Nominal value EUR 50 million. Matures on June 21, 2010. Interest payments quarterly in arrears at a rate of Euribor plus 0.43 percent. Redeemable, at SEK's option, on or after June 21, 2005, at 100 percent of the nominal value. Redemption requires the prior approval of the Swedish Financial Supervisory Authority. If not redeemed coupon will step up to Euribor plus 1.43 percent. |
The accrued interest related to the subordinated debt, at year-end 2003 Skr 10.81.5 million (27.3)(year-end 2002: 10.8), has been included in the item "Accrueditem"Accrued expenses and prepaid revenues".
F-25
| | Share capital(A) and Legal reserve | Other non- distributable capital | Total non- distributable capital | Undistributed profits | Net profit for the year | Total distributable capital | TOTAL | |||||||
|---|---|---|---|---|---|---|---|---|---|---|---|---|---|---|
| Consolidated Group 2002: | ||||||||||||||
| Opening balance | 1,130.0 | 989.9 | 2,119.9 | 1,525.5 | 1,525.5 | 3,645.4 | ||||||||
| Dividend paid during the year | -360.4 | -360.4 | -360.4 | |||||||||||
| Transfer between distributable and nondistributable shareholders' funds | 2.8 | 2.8 | -2.8 | -2.8 | ||||||||||
| Net profit for the year | 479.7 | 479.7 | 479.7 | |||||||||||
| Closing balance | 1,130.0 | 992.7 | 2,122.7 | 1,162.3 | 479.7 | 1,642.0 | 3,764.7 | |||||||
| Parent Company 2002: | ||||||||||||||
| Opening balance | 1,130.0 | 1,130.0 | 1,545.8 | 1,545.8 | 2,675.8 | |||||||||
| Dividend paid during the year | -360.4 | -360.4 | -360.4 | |||||||||||
| Net profit for the year | 491.6 | 491.6 | 491.6 | |||||||||||
| Closing balance | 1,130.0 | 1,130.0 | 1,185.4 | 491.6 | 1,677.0 | 2,807.0 | ||||||||
| Consolidated Group 2001: | ||||||||||||||
| Opening balance | 1,130.0 | 1,003.8 | 2,133.8 | 1,371.9 | 1,371.9 | 3,505.7 | ||||||||
| Dividend paid during the year | -401.0 | -401.0 | -401.0 | |||||||||||
| Transfer between distributable and nondistributable shareholders' funds | -13.9 | -13.9 | 13.9 | 13.9 | ||||||||||
| Net profit for the year | 540.7 | 540.7 | 540.7 | |||||||||||
| Closing balance | 1,130.0 | 989.9 | 2,119.9 | 984.8 | 540.7 | 1,525.5 | 3,645.4 | |||||||
| Parent Company 2001: | ||||||||||||||
| Opening balance | 1,130.0 | 1,130.0 | 1,390.2 | 1,390.2 | 2,520.2 | |||||||||
| Dividend paid during the year | -401.0 | -401.0 | -401.0 | |||||||||||
| Net profit for the year | 556.6 | 556.6 | 556.6 | |||||||||||
| Closing balance | 1,130.0 | 1,130.0 | 989.2 | 556.6 | 1,545.8 | 2,675.8 |
| Share capital(A) and Legal reserve | Other non- distributable capital | Total non- distributable capital | Undis- tributed profits | Net profit for the year | Total distributable capital | TOTAL |
| Consolidated Group 2003: | ||||||||||||||
| Opening balance | 1,130.0 | 992.7 | 2,122.7 | 1,642.0 | 1,642.0 | 3,764.7 | ||||||||
| Dividend paid during the year | -1,240.0 | -1,240.0 | -1,240.0 | |||||||||||
| Allocation to fund for unrealized gains | 9.3 | 9.3 | -9.3 | -9.3 | ||||||||||
| Transfer between distributable and non-distributable capital | -24.4 | -24.4 | 24.4 | 24.4 | ||||||||||
| Net profit for the year | 427.5 | 427.5 | 427.5 | |||||||||||
| Closing balance | 1,130.0 | 977.6 | 2,107.6 | 417.1 | 427.5 | 844.6 | 2,952.2 | |||||||
Parent Company 2003: | ||||||||||||||
| Opening balance | 1,130.0 | 1,130.0 | 1,677.0 | 1,677.0 | 2,807.0 | |||||||||
| Dividend paid during the year | -1,240.0 | -1,240.0 | -1,240.0 | |||||||||||
| Allocation to fund for unrealized gains | 9.3 | 9.3 | -9.3 | -9.3 | ||||||||||
| Group contribution | -0.7 | -0.7 | -0.7 | |||||||||||
| Net profit for the year | 441.6 | 441.6 | 441.6 | |||||||||||
| Closing balance | 1,130.0 | 9.3 | 1,139.3 | 427.0 | 441.6 | 868.6 | 2,007.9 | |||||||
Consolidated Group 2002: | ||||||||||||||
| Opening balance | 1,130.0 | 989.9 | 2,119.9 | 1,525.5 | 1,525.5 | 3,645.4 | ||||||||
| Dividend paid during the year | -360.4 | -360.4 | -360.4 | |||||||||||
| Transfer between distributable and non-distributable capital | 2.8 | 2.8 | -2.8 | -2.8 | ||||||||||
| Net profit for the year | 479.7 | 479.7 | 479.7 | |||||||||||
| Closing balance | 1,130.0 | 992.7 | 2,122.7 | 1,162.3 | 479.7 | 1,642.0 | 3,764.7 | |||||||
Parent Company 2002: | ||||||||||||||
| Opening balance | 1,130.0 | 1,130.0 | 1,545.8 | 1,545.8 | 2,675.8 | |||||||||
| Dividend paid during the year | -360.4 | -360.4 | -360.4 | |||||||||||
| Net profit for the year | 491.6 | 491.6 | 491.6 | |||||||||||
| Closing balance | 1,130.0 | 1,130.0 | 1,185.4 | 491.6 | 1,677.0 | 2,807.0 |
(A): The share capital amounts to Skr 990 million (990,000 shares at Skr 1,000 each) and the legal reserve amounts to Skr 140 million. All line items in the column "Share capital and Legal reserve" include these two components.
| (A): | The share capital amounts to Skr 990 million (990,000 shares at Skr 1,000 each) and the legal reserve amounts to Skr 140 million. All line items in the column "Share capital and Legal reserve" include these two components. |
The Swedish Government's ownership share in SEK is approximately 65 percent and ABB's ownership share is approximately 35100 percent.
The ownership of the Swedish State is managed by the Ministry for Foreign Affairs, whileAffairs.
On June 30, 2003, the Swedish State became the sole (100 percent) owner of SEK. In connection with the change in ownership a total dividend of Skr 1,240.0 million was paid out. Simultaneously, SEK increased its outstanding Hybrid Capital (which is Tier-1-Eligible) by USD 150 million in order to retain the ABB Group is held by ABB Structured Finance Investment AB.risk capital base at approximately the same level.
It is the intention of the shareholdersshareholder and of the Company that SEK will always have risk capital that is well above the regulatory requirements.
The Government and ABB established, in connection with the ownership change in June 2000, a guarantee fund of callable capital, amounting to Skr 600 million in total (Skr 300 million from each)each shareholder) in favor of SEK. The guarantee fund has been replaced by a new guarantee issued by the Swedish State.
SEK may call on capital under the guarantee fund if SEK finds it necessary in order to be able to fulfill its obligations.
PROPOSAL FOR THE DISTRIBUTION OF PROFITS
All amounts are in Skr million, unless otherwise indicated.
The results of the Company's operations during the year and its financial position at December 31, 2003, can be seen in the Income Statements, Balance Sheets, Statements of Cash Flows and related Notes for the Consolidated Group and the Parent Company. The following proposal regarding distribution of profits relates to the Parent Company. Total distributable capital in the Consolidated Group as of December 31, 2003, was 844.6. In the Consolidated Group 58.0 is transferred from distributable capital to non-distributable capital.
| After the payment of a dividend of 1,240.0 to the shareholders as approved by the 2003 Annual General Meeting, the remaining profit carried forward is | 427.0 | |
| Add profit for the year after appropriations and taxes | 441.6 | |
| At the disposal of the Annual General Meeting | 868.6 | |
The Board of Directors and the President propose that the Annual General Meeting dispose of these funds as follows: | ||
| — Dividend | — | |
| — Allocation to legal reserve | 58.0 | |
| — Remaining disposable funds to be carried forward | 810.6 | |
| 868.6 | ||
Note 28. Contingent liabilites and commitments
Contingent liabilities and commitments are reported in connection with the balance sheet. Further, the amounts are also specified in the section IV "Specification of off-balance items" of the table "Capital Base and Required Capital", which is located in Item 5.d5.f "Operating and Financial Review and Prospects—Liquidity, Capital Resources and Capital Resources—Funding—Capital Adequacy".
In accordance with SEK's policies with regard to counterparty, interest rate, and currency exchange exposures, SEK uses, and is a party to, different kinds of off-balance sheet financial instruments, mostly
F-26
various interest rate related and currency exchange related contracts (swaps, etc.). It is worth noting that the nominal amounts of such derivative instruments do not reflect real exposures, but merely constitute the basis from which the exposures (converted claims) are derived. In the table "Capital Base and Required Capital" in Item 5.d5.f "Operating and Financial Review and Prospects—Liquidity, Capital Resources and Capital Resources—Funding—Capital Adequacy" section IV "Specification of off-balance items", are included derivative instruments to a nominal value amounting to Skr 243,285272,628 million (243,965)(243,285). Credit derivatives issued are included in this amount with Skr 318.3 million (358.2).
Note 29. Certain assets and liabilities
Break-downBreakdown by maturity, 20022003
| | Total book value | Maturity on demand | Maturity <= 3 months | 3 months < Maturity <=1 year | 1 year< Maturity <=5 years | 5 years< Maturity <=10 years | Maturity >10 years | Average Maturity (in days) | Total book value | Maturity on demand | Maturity <= 3 months | 3 months < Maturity <= 1 year | >1 year < Maturity <= 5 years | >5 years < Maturity <= 10 years | >Maturity > 10 years | Average Maturity (in days) | ||||||||||||||||
|---|---|---|---|---|---|---|---|---|---|---|---|---|---|---|---|---|---|---|---|---|---|---|---|---|---|---|---|---|---|---|---|---|
| Total credits outstanding | 39,032.9 | 106.3 | 5,386.6 | 6,466.5 | 21,396.2 | 4,938.1 | 739.2 | 1,022 | 40,772.0 | 565.0 | 12,415.0 | 1,912.3 | 16,669.9 | 8,313.3 | 896.5 | 1,174 | ||||||||||||||||
| Interest-bearing securities | 85,402.2 | — | 7,200.3 | 19,806.3 | 50,246.4 | 7,473.9 | 675.3 | 465 | 99,757.1 | — | 11,049.6 | 19,641.6 | 58,193.9 | 9,841.5 | 1,030.5 | 844 | ||||||||||||||||
| Total assets | 124,435.1 | 106.3 | 12,586.9 | 26,272.8 | 71,642.6 | 12,412.0 | 1,414.5 | 140,529.1 | 565.0 | 23,464.6 | 21,553.9 | 74,863.8 | 18,154.8 | 1,927.0 | ||||||||||||||||||
| Borrowing from credit institutions | 611.9 | 44.6 | 181.7 | 14.5 | 371.1 | — | — | 352 | 2,545.8 | 543.0 | 1,661.7 | 340.0 | 1.1 | — | — | 20 | ||||||||||||||||
| Borrowing from the public | 33.4 | — | 20.7 | 9.3 | 2.7 | 0.7 | — | 247 | 28.7 | — | 21.8 | — | 5.7 | 1.2 | — | 258 | ||||||||||||||||
| Senior securities issued | 111,968.3 | — | 5,629.1 | 9,691.2 | 57,418.8 | 9,923.3 | 29,305.9 | 2,986 | 129,990.4 | — | 3,375.9 | 9,251.3 | 78,041.4 | 12,099.4 | 27,222.4 | 2,713 | ||||||||||||||||
| Total senior debt | 112,613.6 | 44.6 | 5,831.5 | 9,715.0 | 57,792.6 | 9,924.0 | 29,305.9 | 2,972 | 132,564.9 | 543.0 | 5,059.4 | 9,591.3 | 78,048.2 | 12,100.6 | 27,222.4 | 2,661 | ||||||||||||||||
| Net | 11,821.5 | 61.7 | 6,755.4 | 16,557.8 | 13,850.0 | 2,488.0 | -27,891.4 | 7,964.2 | 22.0 | 18,405.2 | 11,962.6 | - -3,184.4 | 6,054.2 | - -25,295.4 |
Break-downBreakdown by interest-term maturity, 20022003
| | Total book value | Maturity on demand | Maturity <= 3 months | 3 months < Maturity <=1 year | 1 year< Maturity <=5 years | 5 years< Maturity <=10 years | Maturity >10 years | Average Maturity (in days) | Total book value | Maturity on demand | Maturity <= 3 months | 3 months < Maturity <= 1 year | >1 year < Maturity <= 5 years | >5 years < Maturity <= 10 years | >Maturity > 10 years | Average Maturity (in days) | ||||||||||||||||
|---|---|---|---|---|---|---|---|---|---|---|---|---|---|---|---|---|---|---|---|---|---|---|---|---|---|---|---|---|---|---|---|---|
| Total credits outstanding | 39,032.9 | 106.3 | 13,657.4 | 10,872.2 | 9,977.3 | 3,940.4 | 479.3 | 639 | 40,772.0 | 565.0 | 18,626.5 | 7,794.8 | 6,434.2 | 6,866.3 | 485.2 | 755 | ||||||||||||||||
| Interest-bearing securities | 85,402.2 | — | 48,882.9 | 8,521.4 | 22,237.1 | 5,737.5 | 23.3 | 281 | 99,757.1 | — | 56,000.0 | 8,405.2 | 27,372.6 | 7,922.2 | 57.1 | 504 | ||||||||||||||||
| Total assets | 124,435.1 | 106.3 | 62,540.3 | 19,393.6 | 32,214.4 | 9,677.9 | 502.6 | 140,529.1 | 565.0 | 74,626.5 | 16,200.0 | 33,806.8 | 14,788.5 | 542.3 | ||||||||||||||||||
| Borrowing from credit institutions | 611.9 | 44.6 | 181.7 | 14.5 | 371.1 | — | — | 352 | 2,545.8 | 543.0 | 1,661.7 | 340.0 | 1.1 | — | — | 20 | ||||||||||||||||
| Borrowing from the public | 33.4 | — | 20.7 | 9.3 | 2.7 | 0.7 | — | 247 | 28.7 | — | 21.8 | — | 5.7 | 1.2 | — | 258 | ||||||||||||||||
| Senior securities issued | 111,968.3 | — | 15,073.4 | 21,817.8 | 60,386.6 | 7,804.1 | 6,886.4 | 1,291 | 129,990.4 | — | 25,632.0 | 25,348.1 | 69,135.5 | 7,659.1 | 2,215.7 | 862 | ||||||||||||||||
| Total senior debt | 112,613.6 | 44.6 | 15,275.8 | 21,841.6 | 60,760.4 | 7,804.8 | 6,886.4 | 1,285 | 132,564.9 | 543.0 | 27,315.5 | 25,688.1 | 69,142.3 | 7,660.3 | 2,215.7 | 846 | ||||||||||||||||
| Net | 11,821.5 | 61.7 | 47,264.5 | -2,448.0 | -28,546.0 | 1,873.1 | -6,383.8 | 7,964.2 | 22.0 | 47,311.0 | - -9,488.1 | - -35,335.5 | 7,128.2 | - -1,673.4 |
Note 30. Comparison of book values and fair values
Although, as a consequence of the policies applied with regard to interest-rate and currency exchange exposures, the net value of the Company's assets (with exception for assets held to hedge the return on the Company's equity), liabilities and off-balance sheet instruments generally is not materially affected by changes in interest-rates and currency exchange rates, the Company has determined—solely for the purpose of satisfying the regulations in effect—to report fair values of its assets, liabilities and other contracts at year-end. The Company has—with exception of the S-system, the results of which are settled by the State according to agreements between SEK and the State (see also Note 1 (b)— - (c))— - positive margins between the yield on its assets and the yield on its liabilities. These margins are reported on an accrual basis over the maturity of the underlying contracts. Accordingly, the fair value of the liabilities of SEK (i.e., SEK exclusive of the S-system) does not exceed the difference between, on the one hand, the aggregate fair value of SEK's assets and derivative contracts and, on the other
hand, the book value of SEK's shareholders' funds. The following table includes book values and fair
F-27
values (however, see below) for items reported, on or off balance sheet, in the cases when book values and fair values, according to the Company's calculations, differ.
In the cases where quoted market values for the relevant items are available (which is the case for certain interest-bearing securities), such market values, calculated based on bid prices, have been used. However, it should be noted that for a large portion of the items there are no such quoted market values. In those cases, the fair values have been estimated or derived. The process of estimating or deriving such values naturally involves a high degree of uncertainty.
In the process of estimating or deriving fair values, certain simplifying assumptions have been made. For instance, the fair values of credits with fixed interest rates have been calculated based on estimated market interest rates that would have been applicable if the credits had been granted on December 31, 2002,2003, other things being equal. Similarly, the fair values of borrowings with fixed interest rates have been calculated based on estimated market interest rates that would have been applicable if the borrowings had been made on December 31, 2002,2003, other things being equal. Further, the fair values of assets, liabilities, and other contracts with floating interest rates with resets no less frequent than every six months have, in accordance with the regulations, been approximated to be equal to the nominal amount of these contracts. The Company estimates the fair values of "Prepaid expenses and accrued revenues" and "Accrued expenses and prepaid revenues" to be approximately the same as their book values.
Accordingly, the fair values reported do to a large extent represent values that have been estimated by the Company.
No representation is made that the fair values reported herein reflect realactual market values.values that would have been realized through liquidation of holdings as of year-end.
With regard to the S-system, it should be noted that the results under such system are settled by the State according to agreements between SEK and the State. See also Notes 1(b)-(c).
Due to the large uncertainty about the fair values, the values in the following table are stated in billions of Swedish kronor.
It should be noted that certain business contracts of the Company may include components that are included in various items, reported on- or off-balance sheet.
| 2002 (Skr billion) | Cons. Group and Parent Company Book value | Of which S-system Book value | Cons. Group and Parent Company Fair value | Of which S-system Fair value | Cons. Group and Parent Company Surplus/Deficit value | Of which S-system Surplus/Deficit value | ||||||
|---|---|---|---|---|---|---|---|---|---|---|---|---|
| Treasuries/government bonds | 6.0 | 0.1 | 6.3 | 0.1 | 0.3 | 0.0 | ||||||
| Other interest-bearing securities | 79.4 | — | 80.4 | — | 1.0 | — | ||||||
| Credits to credit institutions | 13.0 | 6.5 | 12.9 | 7.0 | -0.1 | 0.5 | ||||||
| Credits to the public | 26.0 | 5.0 | 26.3 | 5.1 | 0.3 | 0.1 | ||||||
| Derivative contracts with positive values (net assets) | 2.7 | — | -0.6 | — | -3.3 | — | ||||||
| Borrowing from credit institutions | -0.6 | 0.0 | -0.5 | 0.0 | 0.1 | 0.0 | ||||||
| Borrowing from the public | 0.0 | 0.0 | 0.0 | 0.0 | 0.0 | 0.0 | ||||||
| Senior securities issued | -112.0 | -3.2 | -113.8 | -3.4 | -1.8 | -0.2 | ||||||
| Derivative contracts with negative values (net liabilities (-)) | -6.6 | — | -3.5 | — | 3.1 | — | ||||||
| Subordinated securities issued | -2.2 | — | -3.0 | — | -0.8 | — |
F-28
Note 31. PROPOSAL FOR THE DISTRIBUTION OF PROFITS
All amounts are in Skr million, unless otherwise indicated.
The results of the Company's operations during the year and its financial position at December 31, 2002 can be seen in the Income Statements, Balance Sheets, Statements of Cash Flows and related Notes for the Consolidated Group and the Parent Company. The following proposal regarding distribution of profits relates to the Parent Company. Total distributable capital in the Consolidated Group as of December 31, 2002 was 1,642.0. Transfer to non-distributable capital in the Consolidated Group amounts to 0.1.
| 2003 (Skr billion) | Consolidated Group and Parent Company Book value | Of which S-system Book value | Consolidated Group and Parent Company Fair value | Of which S-system Fair value | Consolidated Group and Parent Company Surplus/Deficit value | Of which S-system Surplus/Deficit value | ||||||
|---|---|---|---|---|---|---|---|---|---|---|---|---|
| Treasuries/government bonds | 4.5 | 0.1 | 4.7 | 0.1 | 0.2 | 0.0 | ||||||
| Other interest-bearing securities | 95.3 | — | 97.3 | — | 2.0 | — | ||||||
| Credits to credit institutions | 17.6 | 4.8 | 17.3 | 5.0 | -0.3 | 0.2 | ||||||
| Credits to the public | 23.2 | 3.5 | 24.2 | 3.6 | 1.0 | 0.1 | ||||||
| Derivative contracts with positive values (net assets) | 6.0 | 0.0 | -4.9 | 0.0 | -10.9 | 0.0 | ||||||
| Borrowing from credit institutions | -2.5 | 0.0 | -0.7 | 0.0 | -1.8 | 0.0 | ||||||
| Borrowing from the public | 0.0 | 0.0 | 0.0 | 0.0 | 0.0 | 0.0 | ||||||
| Senior securities issued | -130.0 | -0.6 | -132.0 | -0.6 | -2.0 | 0.0 | ||||||
| Derivative contracts with negative values (net liabilities (-)) | -7.6 | 0.0 | 4.8 | 0.0 | 12.4 | 0.0 | ||||||
| Subordinated securities issued | -3.0 | — | -3.5 | — | -0.5 | — |
Note 32.31. Transactions with Related Parties
The Company enters into transactions in the ordinary course of business with entities that are partially or wholly owned or controlled by the State, as well as with the other shareholder(s). Such transactions may include borrowings as well as extensions of credits (in the form of direct or pass-through credits). Transactions with such parties are conducted on the same terms (including interest rates and repayment schedules) as transactions with unrelated parties.
The amounts of assets and liabilities in respect of related parties outstanding at December 31, 2003, 2002, and 2001, and 2000,respectively, and selected other information regarding transactions with related parties during the three-year period ended December 31, 2002,2003, are as follows:
| | December 31, | December 31, | ||||||||||
|---|---|---|---|---|---|---|---|---|---|---|---|---|
| | 2002 | 2001 | 2000 | 2003 | 2002 | 2001 | ||||||
| | (In millions of Skr) | (In millions of Skr) | ||||||||||
| Interest-bearing Securities | 2,331.6 | 2,822.4 | 3,404.0 | 2,257.6 | 2,331.6 | 2,822.4 | ||||||
| Outstanding Credits(1) | 217.1 | 336.7 | 482.3 | |||||||||
| Outstanding Credits 1) | — | 217.1 | 336.7 | |||||||||
| Outstanding Senior Debt | 85.2 | 45.6 | 30.2 | 24.5 | 85.2 | 45.6 | ||||||
| Outstanding Subordinated Debt | — | — | — | — | — | — | ||||||
| | Year Ended December 31, | Year Ended December 31, | ||||||||||||
|---|---|---|---|---|---|---|---|---|---|---|---|---|---|---|
| | 2002 | 2001 | 2000 | 2003 | 2002 | 2001 | ||||||||
| | (In millions of Skr) | (In millions of Skr) | ||||||||||||
| Net interest revenues(2) | 31.1 | 52.6 | 866.6 | |||||||||||
| Net interest revenues 2) | 103.2 | 31.1 | 52.6 | |||||||||||
| Net commission expenses | (6.0 | ) | (6.0 | ) | (6.0 | ) | (5.6 | ) | (6.0 | ) | (6.0 | ) | ||
F-29Note 32. Risk Exposures
The following information is summarized quantitative and qualitative information about the Company's risk management policies and risk exposures.
SEK's Board of Directors has established the following basic policies which are designed with the intent to give its shareholder a competitive long-term return on equity. These basic policies are then broken down into policies for managing different types of risk exposure.
The basic policies are:
Credit or Counterparty Risks
A credit or counterparty risk represents the risk of loss that would occur if a borrower and its guarantors are unable to perform in accordance with the terms and conditions of a contract.
The table "Counterparty Risk Exposures" in the Item 11.a "Quantitative and Qualitative Disclosures About Market Risk- Risk Management—Credit or Counterparty Risks" shows the distribution, by category of counterparty, of SEK's total counterparty risk exposures related to credits, interest-bearing securities and off-balance sheet items. In paragraphs 1 and 2 under the caption "Credit or Counterparty Risks" is also described the procedures for establishing limits and monitoring counterparty exposures.
Market Risks
A market risk represents the risk of loss that would occur if the value of a contract should change due to changes in market conditions, such as interest rates or exchange rates. Market risks comprise credit spread risks, currency risks and interest rate risks.
Credit Spread Risks
The Board of Directors has set a limit for the market risk in credit spreads for certain assets based on the assumption of an immediate shift in these spreads and where current exposures are divided into different categories depending on the rating and sector of the risk counterparty and the duration of the exposure. The credit spread risk may not exceed Skr 100 million. At year end 2003, the credit spread market risk was Skr 5.7 million with regard to securities in the trading portfolio.
Currency Risks
The Board of Directors has established a limit for currency risks measured as the change in value of foreign currency positions resulting from a 10 percent change in the exchange rate for the Swedish krona. The aggregate currency risk must not exceed Skr 40 million. At year-end 2003 the aggregate currency risk was Skr 2.5 million.
Interest Rate Risks
The Board of Directors has established the following limits for interest rate risks:
The net interest rate risk related to shifts in the yield curve in each individual currency may not exceed the highest value of:
The aggregate net interest rate risk related to changes in the yield curve may not exceed the equivalent of Skr 190 million, of which a maximum of Skr 50 million may be attributable to the next twelve-month period.
Sub-limits are established for the different currencies based on their relative importance to SEK.
Differences in the interest rate basis for different currencies (basis risk) may not at any time exceed the equivalent of Skr 190 million. These risks are calculated based on internally established standard differentials.
SEK's interest rate risks, as defined above, related to shifts in the yield curve in foreign currency amounted to Skr 28.0 million at year-end, of which Skr 6.2 million was related to 2004.
The interest rate risk, as defined above, related to changes in the yield curve in Swedish kronor amounted to Skr 19.2 million, of which Skr 16.5 million was related to 2004.
Perpetual subordinated debt with related economically hedging transactions, as well as the assets in which shareholders' funds and untaxed reserves are invested, are excluded from the calculation of the these interest rate risks.
At year-end 2003, SEK's shareholders' funds and untaxed reserves were invested in fixed income assets representing lending and securities (Skr 3.8 billion), and SEK's office building (Skr 0.1 billion).
At year-end 2003 SEK had Skr 2,546 million of perpetual subordinated debt outstanding. The interest rate risk related to Skr 1,085 million of this volume was economically hedged with interest rate swaps with maturities between 2019 and 2023.
Funding/Liquidity Risk
A funding/liquidity risk represents the risk of loss that would occur if commitments could not be met due to a deficit in borrowing or liquidity, so-called cash flow mismatches.
SEK's policy is to fund all lending commitments throughout their maturity. This allows SEK to grant new credits whenever needed. Equally, SEK can avoid taking up new borrowing in the capital market over long periods, if the terms offered are considered unfavorable. Although SEK's policy means that SEK should never be forced to raise new borrowings to meet its commitments, SEK has established a large number of long-term as well as short-term borrowing programs all over the world. These programs reduce dependence on individual markets and their liquidity. In addition, SEK also has access to certain back-up credit facilities for its short-term borrowing programs.
Note 33. Reconciliation to accounting principals generally accepted in the United States
Swedish generally accepted accounting principles vary in certain respects from U.S. GAAP. The significant variations with respect to SEK excluding the S-system are:
Deferred taxation—U.S. GAAP requires the recognition of a deferred tax liability on all taxable temporary differences in full. A deferred tax asset is recognized for temporary differences that will result in deductible amounts in the future tofuture. To the extent that it is more likely than not that the benefita recorded deferred tax asset will not be realized.realized, an offsetting valuation allowance is recorded. Such comprehensive tax accounting has only been required also in Sweden since 2001 when IAS 12, with some modifications, was adopted as from January 1, 2001 with the implementation of the provisions of IAS 12. Accordingly, certainSwedish GAAP.
Thus, under Swedish GAAP a net deferred tax assets have not been recognized in SEK financial statements throughliability of Skr 371.5 million is reported at December 31 2000.2003, comprising a liability of Skr 376.5 million relating to untaxed reserves (see Note 26) and a deferred tax asset of Skr 5.0 million relating to pension liabilities not yet allowed at the taxation (note 26). In the US GAAP reconciliation, additional deferred tax liabilities of Skr 31.9 million are recognized relating to property (see Note 16) and a deferred tax asset of Skr 5.6 million relating to other temporary differences (not counting the tax effects of other reconciling U.S. GAAP adjustments).
Own debt repurchased—Under U.S. GAAP, any gain or loss incurred in connection with reacquisition of the Company's debt instruments would be recognized immediately together with gains or losses on early termination of related derivatives. SeSee Note 1 (p) for the Swedish GAAP treatment.
Debt Securities—The Company holds a large hedge account in securities which under Swedish GAAP are reported on an amortized-cost basis (see Note 1(j)). The Company has determined to treat all of its securities held in the hedge account as "Available-for-Sale-Securities" under U.S. GAAP and, accordingly, to recognize related unrealised gains or losses, net of tax, as comprehensive income.
As of January 1, 1996, the Company transferred certain debt securities which were reported as trading-securities under USU.S. GAAP to held-to-maturity-securities. The excess of the market value over
par value, previously recorded in income, at the date of such transfer is amortized over the remaining life of the security.
Derivatives—Statement of Financial Accounting Standard (SFAS) No. 133, Accounting for Derivative Instruments and Hedging Activities, and SFAS No. 138, Accounting for Certain Derivative Instruments and Certain Hedging Activities, were effective for the Company as of January 1, 2001. SFAS 133 and SFAS 138 require that an entity recognizes all derivatives as either assets or liabilities measured at fair value. The accounting for changes in the fair value of a derivative depends on the use of the derivative. Derivatives that are not designated as part of a hedging relationship must be adjusted to fair value through income. If a derivative is a hedge, depending on the nature of the hedge, the effective portion of the hedge derivative's change in fair value is either (i) offset against the change in fair value of the hedged asset, liability or firm commitment for the risk being hedged through income, or (ii) held in equity until the hedged item is recognized through income. The ineffective portion of a hedge derivatives' change in fair value is recognized immediately in income.
Certain assets, liabilities and designated derivatives had qualified for hedge accounting under previous U.S. GAAP standards. These hedging relationships did not on January 1, 2001, nor on December 31, 2001, qualify for hedge accounting under the new accounting standards. Therefore, the adoption of the new accounting standards increased the volatility of reported earnings under U.S. GAAP until June 30, 2002. From July 1, 2002, certain assets, liabilities and designated derivatives qualified for hedge accounting under the new accounting standards and thereby the volatility in the item "Derivatives and hedging activities" in earnings has been reduced.
The remaining volatility in earnings in the item "Derivatives and hedging activities" is related to derivatives that under U.S. GAAP do not qualify for hedge accounting even though they have been acquired or written for the purpose of economically hedging assets or liabilities. One main component of the remaining volatility is related to derivatives in the portfolio of held-to-maturity securities where according to U.S. GAAP hedge accounting is not allowed. Another main component of the remaining volatility is related to derivatives hedging perpetual subordinated debt where hedge accounting has not yet been achieved. Such changes in fair value is included in "derivatives and hedging activities" in the summary of significant adjustments tables which follow.
Adoption of these new accounting standards has resulted in the Company recording a cumulative after-tax increase in other comprehensive income of Skr 181 million (net of related income tax of Skr 71 million) at January 1, 2001. Also at January 1, 2001, the carrying value of certain assets and liabilities and designated derivatives that qualified for hedge accounting under previous U.S. GAAP standards and were deemed fair value hedges was adjusted by Skr 1,645 million with no impact on net income. Because such hedging relationships did not qualify for hedge accounting under the new accounting standards, changes in the fair value of the previously designated derivatives are being recognized in income while the adjustment to the carrying value of the assets and liabilities is being
F-30
accreted to income on a straight line basis over eleven years, which is estimated to approximate the application of a level yield basismethod over an estimated averagethe contractual life of eleven years. Suchhedged assets and liabilities. The Company monitors changes in fair valuethe amount and accretion are included in "derivativescomposition of hedged accounts and hedging activities" in the summary of significantwill make adjustments tables which follow.deemed necessary to maintain an approximate level yield amortization method.
Foreign exchange differences on investment securities—SEK holds securities in a number of different currencies which are classified as available for sale for U.S. GAAP purposes. No foreign exchange exposures arise from these, because, although the value of the assets in Swedish krona terms changes according to the relevant exchange rates, there is ana substantially identical offsetting change in the Swedish krona value of the related funding. Under Swedish GAAP both the assets and the liabilities are translated at closing exchange rates and the differences between historical book value and current value are reflected in foreign exchange effects in earnings, where they offset each other. This reflects
the economic substance of holding currency assets financed by liabilities denominated in, or hedged into, the same currency.
However, under U.S. GAAP after the adoption of SFAS No. 133, the valuation effects of changes in currency exchange rates in value of the investments classified as available for sale and not otherwise hedged by a derivative in a fair value hedging relationship is taken directly to equity whereas the offsetting changes in Swedish krona terms of the borrowing is taken to earnings. This leads to an accounting result which does not reflect either the underlying risk position or the economicsa mismatch between recognition of the transactions.income statement impact of changes in currency exchange rates, with exchange rate changes impacting funding liabilities reported in current earnings whereas exchange rate changes impacting the carrying amount of available for sale securities are reported as a component of other comprehensive earnings.
The result of the foregoing is that for the year 20022003 SEK's U.S. GAAP profits are increased by Skr 2,695.9720.4 million compared to Swedish GAAP profits, and for the yearyears 2002 and 2001 SEK's U.S. GAAP profits are increased by 2,695.9 million and reduced by Skr 2,458.9 million respectively compared to Swedish GAAP profits, in each case before tax effects. There is no difference in total shareholders' funds between Swedish GAAP and U.S. GAAP as a result of this treatment (even though there are differences in individual components of shareholders' funds). The significant offsetting adjustments to net profit and shareholders' funds relating to this item have been applied from 2002. The numbers for 2001 as originally reported did not reflect these adjustments, in error, but have now been restated accordingly.
Other—Other items include refunds of surplus from a multiemployer pension plan not yet collected recognized under Swedish GAAP but to be recognized on a cash basis under U.S. GAAP.
Earnings per share—Earnings per share (Swedish GAAP) and earnings per share (U.S. GAAP) are calculated as, respectively, net profit (Swedish GAAP) per share and net profit (U.S. GAAP) per share. The total number of shares at December 31, 2003, 2002 and 2001, was 990,000 (2001: 990,000, 2000: 990,000, 1999: 700,000). In connection with the ownership change in 2000, a bonus issue of 290,000 shares was made in favor of the Swedish Government resulting in a total number of 990,000 outstanding shares in SEK. Therefore, the earnings per share (Swedish GAAP) and earnings per share (U.S. GAAP) in 2000 were calculated on the average number of shares that year.990,000.
No reconciliation of significant material variations between Swedish accounting principles and U.S. GAAP has been made with respect to the S-system because any such variations that affected the Company's net profit would be offset by an adjustment in the amount reimbursed by the State. (See Note 1(b) and (c), Note 1(c)). Due to the retention of some credit risk on loans extended by the Company within the S-system, under U.S GAAP SEK would be required to account for all effects related to the income statement of the S-system as gross revenues or costs for SEK; such presentation would not however result in an adjustment to reported net income or shareholders' funds under U.S. GAAP.
F-31
The following is a summary of the significant adjustments to net profit andthat would be required if U.S. GAAP were to be applied instead of Swedish GAAP:
| | Year Ended December 31, | ||||||
|---|---|---|---|---|---|---|---|
| | 2003 | 2002 | 2001 | ||||
| | (In millions of Skr unless otherwise stated) | ||||||
| Net profit for the period under Swedish GAAP | 427.5 | 479.7 | 540.7 | ||||
| Amortization of unrealized gains on securities transferred into the held-to-maturity category in 1996 | (6.4 | ) | (7.1 | ) | (7.9 | ) | |
| Gains/(losses) in connection with repurchases of own-debt | (55.7 | ) | 51.4 | 56.9 | |||
| Derivatives and hedging activities | (177.8 | ) | 359.8 | 1,392.4 | |||
| Accretion of discount on liabilities and amortization of premiums on assets that qualified for hedge accounting before adoption of SFAS 133 | (182.5 | ) | (149.5 | ) | (149.5 | ) | |
| Foreign exchange differences on available-for-sale securities | 720.4 | 2,695.9 | (2,458.9 | ) | |||
| Other | — | 13.0 | (0.3 | ) | |||
| Tax effect of U.S. GAAP adjustments | (83.5 | ) | (829.8 | ) | 326.8 | ||
| Deferred taxation | 1.2 | — | (12.5 | ) | |||
| Net adjustments | 215.7 | 2,133.7 | (853.0 | ) | |||
| Net profit for the period under U.S. GAAP | 643.2 | 2,613.4 | (312.3 | ) | |||
| Earnings (loss) per share under U.S. GAAP (Skr) | 649.7 | 2,639.8 | (315.4 | ) | |||
The following is a summary of the significant adjustments to Comprehensive Income that would be required if U.S. GAAP were to be applied instead of Swedish GAAP:
| | Year Ended December 31, | ||||||
|---|---|---|---|---|---|---|---|
| | 2003 | 2002 | 2001 | ||||
| | (In millions of Skr unless otherwise stated) | ||||||
| Net profit for the period under U.S. GAAP | 643.2 | 2,613.4 | (312.3 | ) | |||
| Other comprehensive income: | |||||||
| Difference between fair value and book value of available-for-sale securities (exclusive of foreign exchange differences)* | (7.2 | ) | (273.6 | ) | 1.0 | ||
| Difference between fair value and book value of available-for-sale securities solely related to foreign exchange differences** | (720.4 | ) | (2,695.9 | ) | 2,458.9 | ||
| Fair value of derivatives recognized upon adoption of SFAS 133 related to cash flow type hedges | (67.3 | ) | (63.8 | ) | 179.3 | ||
| Tax effect on other comprehensive income | 222.6 | 849.4 | (739.0 | ) | |||
| Total other comprehensive income | (572.3 | ) | (2,183.9 | ) | 1,900.2 | ||
| Comprehensive income under U.S. GAAP | 70.9 | 429.4 | 1,587.9 | ||||
The following is a summary of the significant adjustments to shareholders' funds that would be required if U.S. GAAP were to be applied instead of Swedish GAAP:
| | Year Ended December 31, | ||||||
|---|---|---|---|---|---|---|---|
| | 2002 | 2001(1) | 2000 | ||||
| | (In millions of Skr unless otherwise stated) | ||||||
| Net profit for the year under Swedish GAAP | 479.7 | 540.7 | 601.8 | ||||
| After-tax effects of amortization of unrealised gains on securities transferred into the held-to-maturity category in 1996 | (5.1 | ) | (5.7 | ) | (18.3 | ) | |
| Gains/(losses) in connection with repurchases of own-debt | 51.4 | 56.9 | 22.6 | ||||
| Transition adjustment related to adoption of SFAS 133 | — | — | n.a. | ||||
| Derivatives and hedging activities | 210.3 | 1,242.9 | n.a. | ||||
| Foreign exchange differences on available-for-sale securities | 2,695.9 | (2,458.9 | ) | n.a. | |||
| Other | 13.0 | (0.3 | ) | (12.7 | ) | ||
| Tax effect of U.S. GAAP adjustments | (831.8 | ) | 324.6 | (2.8 | ) | ||
| Deferred taxation | 0 | (12.5 | ) | 18.1 | |||
| Net adjustments | 2,133.7 | (853.0 | ) | 6.9 | |||
| Net profit (loss) for the year under U.S. GAAP | 2,613.4 | (312.3 | ) | 608.7 | |||
Earnings (loss) per share under U.S. GAAP (Skr) | 2,639.8 | (315 | ) | 720 | |||
| | December 31, | December 31, | ||||||||
|---|---|---|---|---|---|---|---|---|---|---|
| | 2002 | 2001 | 2003 | 2002 | ||||||
| | (In millions of Skr) | (In millions of Skr) | ||||||||
| Shareholders' funds under Swedish GAAP | 3,764.7 | 3,645.4 | 2,952.2 | 3,764.7 | ||||||
| Unamortized gains on securities transferred to held to maturity securities in 1996 on an after-tax basis | 22.3 | 27.4 | ||||||||
| After-tax difference between fair value and book value in available-for-sale securities | 79.3 | 276.3 | ||||||||
| Transition adjustment related to adoption of SFAS 133 resulting in an after-tax increase in other comprehensive income | 181.5 | 181.5 | ||||||||
| Amortization of transition adjustment on an after-tax basis | (98.3 | ) | (52.4 | ) | ||||||
| Unamortized gains on securities transferred to held to maturity securities in 1996 | 24.6 | 31.0 | ||||||||
| Difference between fair value and book value in available-for-sale securities | 102.9 | 110.1 | ||||||||
| Fair value of derivatives recognized upon adoption of SFAS 133 related to cash flow type hedges | 48.2 | 115.6 | ||||||||
| Derivatives and hedging activities | 1,453.2 | 1,242.9 | (70.6 | ) | 107.2 | |||||
| Accretion of discount on liabilities and amortization of premium on assets that qualified for hedge accounting prior to adoption of SFAS 133 | 1,163.5 | 1,346.0 | ||||||||
| Gains/(losses) in connection with repurchases of own-debt | 65.7 | 14.3 | 10.0 | 65.7 | ||||||
| Other | — | (13.0 | ) | 33.1 | — | |||||
| Tax effect of U.S. GAAP adjustments | (425.3 | ) | (348.3 | ) | (358.0 | ) | (497.2 | ) | ||
| Deferred taxation | 5.6 | 5.6 | (26.3 | ) | 5.6 | |||||
| Net adjustments | 1,284.0 | 1,334.3 | 927.4 | 1,284.0 | ||||||
| Shareholders' funds under U.S. GAAP | 5,048.7 | 4,979.7 | 3,879.6 | 5,048.7 | ||||||
Reportable segments of SEK's operations under SFAS No. 131 "Disclosures about Segments of an Enterprise and Related Information" are the M-system and the S-system, both reported separately in the consolidated income statement with additional information in Note 1(b), Note 1(c), and Note 1(c).4.
The holding gains on available-for-sale securities, including foreign exchange difference adjusted from net profit, would under U.S. GAAP be reported with "Comprehensive Income" under SFAS No. 130 "Reporting Comprehensive Income". The following is a summary of the significant adjustments to Comprehensive Income that would be required if U.S. GAAP were to be applied instead of Swedish GAAP:
| | Year Ended December 31 | ||||||
|---|---|---|---|---|---|---|---|
| | 2002 | 2001 | 2000 | ||||
| | (In Skr million unless otherwise stated) | ||||||
| Net profit (loss) for the year under U.S. GAAP | 2,613.4 | (312.3 | ) | 608.7 | |||
| Other comprehensive income: | |||||||
| After-tax difference between fair value and book value of available-for-sale securities (exclusive of foreign exchange differences) | (197.0 | ) | 0.7 | (120.6 | ) | ||
| After-tax difference between fair value and book value of available-for-sale securities solely related to foreign exchange differences | (1,941.0 | ) | 1,770.4 | — | |||
| After-tax effect of transition adjustment related to adoption of SFAS 133 | — | 181.5 | — | ||||
| After-tax effect of amortization of SFAS 133 transition adjustment | (45.9 | ) | (52.4 | ) | — | ||
| Total other comprehensive income | (2,183.9 | ) | 1,900.2 | (120.6 | ) | ||
| Comprehensive income under U.S. GAAP | 429.5 | 1,587.9 | 488.1 | ||||
Accounting for derivative instruments and hedging activities—SFAS 133 "Accounting for Derivative Instruments and Hedging Activities," as amended by SFAS 138 (the "Standard") is the foundation of a set of U.S. GAAP requirements for accounting for derivatives. The Standard requires that all derivative instruments be recorded on the balance sheet at fair value; the accounting for changes in fair value of the derivative depends on whether the derivative qualifies as a hedge. If the derivative instrument does not qualify as a hedge, changes in fair value are reported in earnings when they occur. However, if the derivative qualifies as a hedge, the accounting varies based on the type of risk being hedged (see previous discussion herein of accounting for derivatives in designated hedging relationships).
In the hedging relationship of a financial asset or liability, SEK designates the risk being hedged as one of the following:
If the risk designated as being hedged is not the risk in (1) in the paragraph above, SEK may designate one or more of the other risks (interest rate risk, foreign currency exchange risk and credit risk) as the hedged risk. The benchmark interest rate being hedged in a hedge of interest rate risk will be specifically identified as part of the designation and documentation at the inception of the hedging relationship.
As SEK currently hedges the risk of fair value changes in its loans or investments, the transactions are accounted for according to the fair value hedge model pursuant to SFAS 133.
There are currently four different strategies used within SEK to hedge changes in fair value.
F-33
Both at inception of the hedge and on an ongoing basis, SEK's hedging relationships are expected to be highly effective in offsetting changes in fair values attributable to the hedged risks.
The fair value of the derivative will be estimated using discounted cash flow analysis. The discount factors will be derived from the zero coupon curve, based on the swap curve, for each currency.
Embedded features, such as options, futures or forwards will be valued using the best accessible market data and best practice valuation models. A valuation from an external counterparty may also be used. Using a market price for the transaction in question or for a similar transaction will derive the fair value of the option, future or forward contracts. The fair value may also be delivered from an external counterparty.
Quantitative disclosures about ineffectiveness—Net gain or loss recognized in earnings representing (a) the amount of hedge ineffectiveness in fair value hedges, and (b) the component of the derivative instruments' gain or loss, if any, excluded from the assessment of hedge effectiveness is reported as one component of "Derivatives and hedging activities" in the statement of significant adjustments to net profit that would be required if U.S. GAAP were to be applied instead of Swedish GAAP. For the year ended December 31, 2003, net gains amounting to Skr 20.5 million related to the amount of hedge ineffectiveness in fair value hedges were reported as one component of the item "Derivatives and hedging activities".
Recent Accounting Matters
In April 2003 the FASB issued Statement of Financial Accounting Standard No. 149, "Amendment of Statement 133 on Derivative Instruments and Hedging Activities" (SFAS 149). SFAS 149 amends and clarifies financial accounting and reporting for derivative instruments, including certain derivative instruments embedded in other contracts (collectively referred to as derivatives) and for hedging activities under FASB Statement 133. SFAS 149 amends statement 133 to reflect decisions of the Derivatives Implementation Group since its formation and also updates Statement 133 for decisions of the Board relating to its financial instruments project. As many of the amendments reflect formalization of interpretations that have been applied historically in the Company's application of US GAAP the adoption and transition provisions of this statement do not have any impact on the Company's financial statements or related disclosures.
In April 2003 the FASB issued Statement of Financial Accounting Standard No. 150, "Accounting for Certain Financial Instruments with Characteristics of Both Liabilities and Equity" (SFAS 150). SFAS 150 establishes standards for how an issuer classifies and measures certain financial instruments with characteristics of both liabilities and equity. It requires that an issuer classify a financial instrument that is within its scope as a liability (or an asset in some circumstances). The requirements of this Statement apply to issuers' classification and measurement of freestanding financial instruments, including those that comprise more than one option or forward contract. This Statement does not apply to features that are embedded in a financial instrument that is not a derivative in its entirety. The Company does not write or purchase instruments indexed to its common stock nor does it report in permanent equity any instrument that is subject to mandatory redemption and accordingly adoption of the provisions of SFAS 150 have not had any effect on the Company's financial statements.
In November 2002, the FASB issued Financial Interpretation No. 45, "Guarantor's Accounting and Disclosure Requirements for Guarantees, Including Indirect Guarantees of Indebtedness of Others" (FIN 45). FIN 45 elaborates on the existing disclosure requirements for most guarantees, including loan guarantees such as standby letters of credit and indemnifications. It also clarifies that at the time a company issues a guarantee, the company must recognize an initial liability for the fair or market value of the obligations it assumes under that guarantee and must disclose that information in its interim and annual financial statements. The provisions related to recognizing a liability at inception of the guarantee for the fair value of the guarantor's obligations would not apply to guarantees accounted for as derivatives, nor does it apply to the accounting for commercial letters of credit and loan commitments. The initial recognition and measurement provisions apply on a prospective basis to guarantees issued or modified after December 31, 2002. The adoption of FIN 45 did not result in any recognition of liabilities.
In January 2003, the FASB issued Financial Interpretation No. 46 (FIN 46), "Consolidation of Variable Interest Entities'. FIN 46 applies to the accounting for certain entities, the investors in which are identified as not possessing the normal characteristics of a controlled financial interest, or which lack sufficient equity to finance its activities without additional support from other parties. Such entities are referred to in FIN 46 as Variable Interest Entities and refers to parties with equity, certain contractual or other financial interest as variable interest holders. FIN 46 establishes a framework for defining a primary beneficiary and requires consolidation of VIEs in which the Company is the primary beneficiary. FIN 46 also requires specific disclosures about VIEs in which the Company is the primary beneficiary or in which it holds a significant variable interest. Accounting requirements of FIN 46 were immediately applicable to any VIE created after January 31, 2003 and for all others the company is required to evaluate its structures to determine whether it is reasonably likely that the Company would be required to consolidate or disclose information about each VIE's nature, purpose, size and activities, together with the Company's maximum exposure to loss. For those VIEs created prior to February 1, 2003, the Company will be required to adopt the accounting provisions of FIN 46 commencing January 1, 2004 although earlier adoption is allowed.
The Company does not engage in asset securitization or carry out business in entities which are not included within the company's consolidated financial statements. The Company does however provide project finance or other credit products which may result in credit exposure or fee interest with the counterparty that meet the definition of a variable interest in a variable interest entity. At year-end 2003 the volume of such credits outstanding was Skr 173 million (2002: 153). In addition, credits committed but not yet disbursed amounted to Skr 129 million. This involvement would not be sufficient to result in SEK being the primary beneficiary in a Variable Interest Entity as defined in FIN 46. Accordingly, adoption of the provisions of FIN 46 is not anticipated to have any effect on the Company's financial statements.
The Company hereby certifies that it meets all requirements for filing on Form 20-F and that it has duly caused and authorized the undersigned to sign this Annual Report on its behalf.
| AKTIEBOLAGET SVENSK EXPORTKREDIT (Swedish Export Credit Corporation) | ||||
By | /s/ PETER YNGWE Peter Yngwe, President | |||
I, Peter Yngwe, certify that:
Date: April 28, 2004
I, Jakob Nordin, certify that:
Exhibits
Documents filed as exhibits to this Annual Report.
| 1.1 | Articles of Association (incorporated by reference to the Form 6-K filed by the Company on January 22, 2001, file no. 1-8382). | |
2.1 | ||
2.2 | Deed of Covenant dated May 28, 2003 relating to up to Euro 25,000,000,000 aggregate principal amount of securities of SEK authorized to be issued under | |
2.3 | Fiscal Agency Agreement dated August 21, 1997 relating to securities other than Yen-denominated securities to be issued under the | |
2.4 | Deed of Covenant dated August 21, 1997 relating to securities other than Yen-denominated securities to be issued under the | |
2.5 | Agreement with Commissioned Companies for Bondholders dated October 28, 1997 relating to up to Yen 500,000,000,000 aggregate principal amount of securities of SEK | |
2.6 | Indenture, dated as of August 15, 1991, between the Company and the First National Bank of Chicago, as Trustee, relating to the | |
7.1 | Calculation of Ratios | |
7.2 | Calculation of Ratios | |
8.1 | ||
Certifications pursuant to Rule 13a-14(a) or Rule 15d-14(a). | ||
13.1 | Certifications Pursuant to 18 U.S.C Section 1350, as Adopted Pursuant to Section 906 of the Sarbanes-Oxley Act of 2002. | |
Consent of the Independent Auditors. | ||