
Use these links to rapidly review the document
TABLE OF CONTENTS
INDEX OF FINANCIAL STATEMENTS
UNITED STATES
SECURITIES AND EXCHANGE COMMISSION
Washington, D.C. 20549
FORM 20-F
| (Mark One) | ||
o | REGISTRATION STATEMENT PURSUANT TO SECTION 12(b) OR (g) OF THE SECURITIES EXCHANGE ACT OF 1934 | |
or | ||
ý | ANNUAL REPORT PURSUANT TO SECTION 13 OR 15(d) OF THE SECURITIES EXCHANGE ACT OF 1934 | |
For the fiscal year ended December 31, | ||
or | ||
o | TRANSITION REPORT PURSUANT TO SECTION 13 OR 15(d) OF THE SECURITIES EXCHANGE ACT OF 1934 | |
For the transition period from to | ||
or | ||
o | SHELL COMPANY REPORT PURSUANT TO SECTION 13 OR 15(d) OF THE SECURITIES EXCHANGE ACT OF 1934 | |
Date of event requiring this shell company report | ||
Commission file number 001-32749
FRESENIUS MEDICAL CARE AG & Co. KGaA
(Exact name of Registrant as specified in its charter)
FRESENIUS MEDICAL CARE AG & Co. KGaA
(Translation of Registrant's name into English)
Germany
(Jurisdiction of incorporation or organization)
Else-Kröner Strasse 1, 61352 Bad Homburg, Germany
(Address of principal executive offices)
Josef Dinger, +49 6172 608 2522, Josef.Dinger@FMC-AG.com,
Else-Kröner Strasse 1, 61352 Bad Homburg, Germany
(Name, Telephone, E-mail and/or Facsimile number and Address of Company Contact Person)
Securities registered or to be registered pursuant to Section 12(b) of the Act:
| Title of each class | Name of each exchange on which registered | |
|---|---|---|
| American Depositary Shares representing Ordinary Shares | New York Stock Exchange | |
| Ordinary Shares, no par value | New York Stock Exchange(1) |
Securities registered or to be registered pursuant to Section 12(g) of the Act:None
Securities for which there is a reporting obligation pursuant to Section 15(d) of the Act:67/8% Senior Notes due 2017
Indicate the number of outstanding shares of each of the issuer's classes of capital or common stock as of the close of the period covered by the annual report:
Ordinary Shares, no par value: 301,446,779306,221,840
Indicate by check mark if the registrant is a well-known seasoned issuer, as defined in Rule 405 of the Security Act. ý Yes o No
If this report is an annual or transition report, indicate by check mark if the registrant is not required to file reports pursuant to Section 13 or 15(d) of the Securities Exchange Act of 1934. o Yes ý No
Note – Checking the box above will not relieve any registrant required to file reports pursuant to Section 13 or 15(d) of the Securities Exchange Act of 1934 from their obligations under those Sections.
Indicate by check mark whether the registrant (1) has filed all reports required to be filed by Section 13 or 15(d) of the Securities Exchange Act of 1934 during the preceding 12 months (or for such shorter period that the registrant was required to file such reports) and (2) has been subject to such filing requirements for the past 90 days. ý Yes o No
Indicate by check mark whether the registrant has submitted electronically and posted on its corporate Web site, if any, every Interactive Date File required to be submitted and posted pursuant to Rule 405 of Regulation S-T (§232.405 of this chapter) during the preceding 12 months (or for such shorter period that the registrant was required to submit and post such files). ý Yes o No
Indicate by check mark whether the registrant is a large accelerated filer, an accelerated filer, or a non-accelerated filer. See definition of "accelerated filer and large accelerated filer" in Rule 12b-2 of the Exchange Act. (Check one):
| Large accelerated filerý | Accelerated filero | Non-accelerated filero |
Indicate by check mark which basis of accounting the registrant has used to prepare the financial statements included in this filing:
ý U.S. GAAP o International Financial Reporting Standards as issued by o Other
the International Accounting Standards Board
If "Other" has been checked in response to the previous question, indicate by check mark which financial statement item the registrant has elected to follow:
o Item 17 o Item 18
If this is an annual report, indicate by check mark whether the registrant is a shell company (as defined in Rule 12b-2 of the Exchange Act).
o Yes ý No
| | | | Page | |||||
|---|---|---|---|---|---|---|---|---|
INTRODUCTION | ||||||||
PART I |
| |||||||
Item 1. | N/A | Identity of Directors, Senior Management and Advisors | ||||||
Item 2. | N/A | Other Statistics and Expected Timetable | ||||||
Item 3. | Key Information | |||||||
Item 4. | Information on the Company | |||||||
Item 4A. | N/A | Unresolved Staff Comments | ||||||
Item 5. | Operating and Financial Review and Prospects | |||||||
Item 6. | Directors, Senior Management and Employees | |||||||
Item 7. | Major Shareholders and Related Party Transactions | |||||||
Item 8. | Financial Information | |||||||
Item 9. | The Offer and Listing Details | |||||||
Item 10. | Additional Information | |||||||
Item 11. | Quantitative and Qualitative Disclosures About Market Risk | |||||||
Item 12. | Description of Securities other than Equity Securities | |||||||
PART II |
| |||||||
Item 13. | N/A | Defaults, Dividend Arrearages and Delinquencies | ||||||
Item 14. | Material Modifications to the Rights of Security Holders and Use of Proceeds | |||||||
Item 15A. | Disclosure Controls and Procedures | |||||||
Item 15B. | Management's annual report on internal control over financial reporting | |||||||
Item 15C. | Attestation report of the registered public accounting firm | |||||||
Item 15D. | Changes in Internal Control over Financial Reporting | |||||||
Item 16A. | Audit Committee Financial Expert | |||||||
Item 16B. | Code of Ethics | |||||||
Item 16C. | Principal Accountant Fees and Services | |||||||
Item 16D. | N/A | Exemptions from the Listing Standards for Audit Committees | ||||||
Item 16E. | Purchase of Equity Securities by the Issuer and Affiliated Purchaser | |||||||
Item 16F. | N/A | Change in Registrant's Certifying Accountant | ||||||
Item 16G. | Corporate Governance | |||||||
PART III |
| |||||||
Item 17. | N/A | Financial Statements | ||||||
Item 18. | Financial Statements | |||||||
Item 19. | Exhibits | |||||||
i
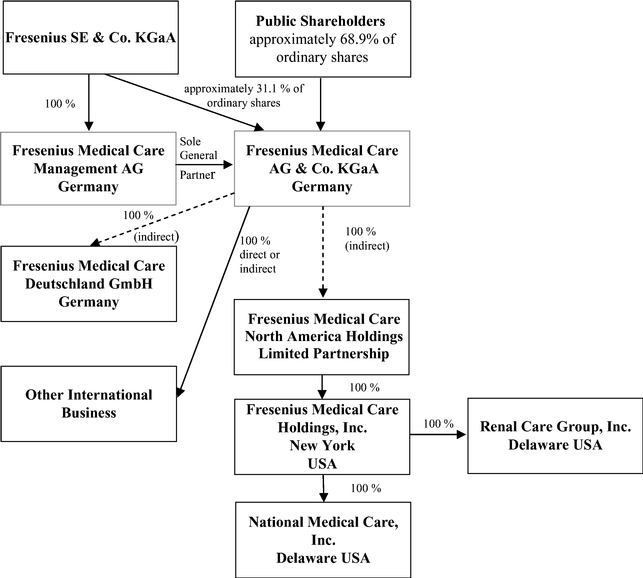
In this report, (1) the "Company" refers to both Fresenius Medical Care AG prior to the transformation of legal form discussed in Item 4.A, "Information on the Company – History and Development of the Company – History" below and to Fresenius Medical Care AG & Co. KGaA after the transformation; (2) "we", "us" and "our" refersrefer either to the Company or the Company and its subsidiaries on a consolidated basis both before and after the transformation, as the context requires; (3) "Fresenius Medical Care AG" and "FMC-AG" refersrefer to the Company as a German stock corporation before the transformation of legal form and "FMC-AG & Co. KGaA" refers to the Company as a German partnership limited by shares after the transformation and (4) "FMCH" and "D-GmbH" refer, respectively, to Fresenius Medical Care Holdings, Inc., the holding company for our North American operations and to Fresenius Medical Care Deutschland GmbH, one of our German subsidiaries. In addition, "Fresenius SE" and "Fresenius SE & Co. KGaA" refersrefer to Fresenius SE & Co. KGaA, a German partnership limited by shares resulting from the change of legal form of Fresenius SE (effective as of January 2011), a European Company (Societas Europaea) previously called Fresenius AG, a German stock corporation. Fresenius SE owns 100% of the share capital of our general partner and 94,380,382 of our ordinary shares as of February 18, 2015, 31.1%16, 2017, 30.82% based on 303,636,122306,221,840 outstanding shares, as reported herein (prior to the transformation of our legal form, it held approximately 51.8% of our voting shares).herein. In this report, we use Fresenius SE to refer to that company as a partnership limited by shares, effective on and after January 28, 2011, as well as both before and after the conversion of Fresenius AG from a stock corporation into a European Company on July 13, 2007. The phrase "Fresenius SE and its subsidiaries" refers to Fresenius SE and all of the companies of the Fresenius SE group, other than FMC-AG & Co. KGaA and the subsidiaries of FMC-AG & Co. KGaA. Each of "Management AG", "FMC Management AG" and the "General Partner" refers to Fresenius Medical Care Management AG, FMC-AG & Co. KGaA's general partner and a wholly owned subsidiary of Fresenius SE. "Management Board" and "our Management Board" refer to the members of the management board of Management AG and, except as otherwise specified, "Supervisory Board" and "our Supervisory Board" refer to the supervisory board of FMC-AG & Co. KGaA. "Ordinary shares" refers to the ordinary shares prior to the conversion in 2013 of our preference shares into ordinary shares. Following the conversion, we refer to our ordinary shares as "shares." The term "North America Segment" refers to our North America operating segment. Thesegment; the term "International"EMEA Segment" refers to the Europe, Middle East and Africa operating segment, the term "Asia-Pacific Segment" refers to our combined EMEALA (Europe, Middle East, Africa,Asia-Pacific operating segment, and the term "Latin America Segment" refers to our Latin America) and AP (Asia-Pacific)America operating segments.segment. The term "Corporate" includes certain headquarters' overhead charges, including accounting and finance, centrally managed production, asset management, quality management and procurement within our Global Manufacturing Operations& Quality and research and development.Global Research & Development departments. All references in this report to the notes to our financial statements are to the Notes to Consolidated Financial Statements included in this report.
This report contains forward-looking statements within the meaning of Section 27A of the Securities Act of 1933, as amended, and Section 21E of the Securities Exchange Act of 1934, as amended (the "Exchange Act"). When used in this report, the words "outlook," "expects," "anticipates," "intends," "plans," "believes," "seeks," "estimates" and similar expressions are generally intended to identify forward looking statements. Although we believe that the expectations reflected in such forward-looking statements are reasonable, forward-looking statements are inherently subject to risks and uncertainties, many of which cannot be predicted with accuracy and some of which might not even be anticipated, and future events and actual results, financial and otherwise, could differ materially from those set forth in or contemplated by the forward-looking statements contained elsewhere in this report. We have based these forward-looking statements on current estimates and assumptions made to the best of our knowledge. By their nature, such forward-looking statements involve risks, uncertainties, assumptions and other factors which could cause actual results, including our financial condition and profitability, to differ materially positively or negatively relative to the results expressly or implicitly described in or suggested by these statements. Moreover, forward-looking estimates or predictions derived from third parties' studies or information may prove to be inaccurate. Consequently, we cannot give any assurance regarding the future accuracy of the opinions set forth in this report or the actual occurrence of the projected developments described herein. In addition, even if our future results meet the expectations expressed here, those results may not be indicative of our performance in future periods.
These risks, uncertainties, assumptions, and other factors that could cause actual results to differ from our projected results include, among others, the following:
Important factors that could contribute to such differences are noted in Item 3D, "Key Information – Risk Factors" in Item 4, "Information on the Company," under "Business Overview," in Item 5, "Operating and Financial Review and Prospects" and in Note 2018 of the Notes to Consolidated Financial Statements, "Commitments and Contingencies" included in this report.
Our business is also subject to other risks and uncertainties that we describe from time to time in our public filings. Developments in any of these areas could cause our results to differ materially from the results that we or others have projected or may project.
Our reported financial condition and results of operations are sensitive to accounting methods, assumptions and estimates that are the basis of our financial statements. The actual accounting policies, the judgments made in the selection and application of these policies, and the sensitivities of reported results to changes in accounting policies, assumptions and estimates, are factors to be considered along with our financial statements and the discussion under "Results of Operations" in Item 5 below, "Operating and Financial Review and Prospects." For a discussion of our critical accounting policies, see Item 5, "Operating and Financial Review and Prospects – Critical Accounting Policies" below in this report.
Except as otherwise specified herein, all patient and market data in this report have been derived using our internal information tool called "Market & Competitor Survey" ("MCS"). See Item 4.B, "Information on the Company – Business Overview – Renal Industry Overview.Major Markets and Competitive Position."
Item 1. Identity of Directors, Senior Management and Advisors
Not applicable
Item 2. Other Statistics and Expected Timetable
Not applicable
A. Selected Financial Data
The following table summarizes the consolidated financial information for our business for each of the years 2014 through 2010.in the five-year period ended December 31, 2016. We derived the selected financial information from our consolidated financial statements. We prepared our financial statements in accordance with accounting principles generally accepted in the United States of America and KPMG AG Wirtschaftsprüfungsgesellschaft ("KPMG"), an independent registered public accounting firm, audited these financial statements. All American Depositary Share ("ADS") and per ADS data reflect the two-for-one split of the ADSs representing our ordinary sharesOrdinary Shares and the ADSs representing our previously outstanding preference shares, which was effective December 3, 2012. As a result of the split of our ADSs, the ratio of each class of ADSs was changed from one ADS representing one share to two ADSs representing one share. (See Item4.A,Item 4.A, "Information on the Company – History and Development of the Company – History"). All per ADS amounts in the table have been restated to reflect the ADS splits. You should read this information together with our consolidated financial statements and the notes to those statements appearing elsewhere in this report and the information under Item 5, "Operating and Financial Review and Prospects." On December 1, 2016, we announced that commencing with our quarterly report to be filed for the first quarter of 2017, such financial statements and financial information will be prepared in accordance with IFRS, using the euro as our reporting currency. Please refer to our website for the historical financial data prepared in accordance with International Financial Reporting Standards ("IFRS") for the years 2012 through 2015 (http:/ /www.freseniusmedicalcare.com/en/news/details/title/fresenius-medical-care-will-focus-on-ifrs-reporting-and-discontinue-us-gaap-financial-statements/). In furnishing our web site address in this report, however, we do not intend to incorporate this or any other information on our web site into this report, and any information on our web site should not be considered to be part of this report.
| | 2014 | 2013 | 2012 | 2011 | 2010 | 2016 | 2015 | 2014 | 2013 | 2012 | ||||||||||||||||||||||
|---|---|---|---|---|---|---|---|---|---|---|---|---|---|---|---|---|---|---|---|---|---|---|---|---|---|---|---|---|---|---|---|---|
| | (in millions except share and per share amounts) | (in millions except share and per share amounts) | ||||||||||||||||||||||||||||||
Statement of Operations Data: | ||||||||||||||||||||||||||||||||
Net revenues(a) | $ | 15,832 | $ | 14,610 | $ | 13,800 | $ | 12,570 | $ | 11,844 | ||||||||||||||||||||||
Revenue | $ | 17,911 | $ | 16,738 | $ | 15,832 | $ | 14,610 | $ | 13,800 | ||||||||||||||||||||||
Cost of revenues | 10,836 | 9,872 | 9,199 | 8,418 | 8,009 | 12,131 | 11,407 | 10,836 | 9,872 | 9,199 | ||||||||||||||||||||||
| | | | | | | | | | | | | | | | | | | | | | | | | | | | | | | | | |
Gross profit | 4,996 | 4,738 | 4,601 | 4,152 | 3,835 | 5,780 | 5,331 | 4,996 | 4,738 | 4,601 | ||||||||||||||||||||||
Selling, general and administrative | 2,645 | 2,391 | 2,223 | 2,002 | 1,823 | 3,045 | 2,895 | 2,644 | 2,382 | 2,187 | ||||||||||||||||||||||
Gain on sale of dialysis clinics | (1 | ) | (9 | ) | (36 | ) | (5 | ) | — | |||||||||||||||||||||||
Research and development | 122 | 126 | 112 | 111 | 97 | 162 | 140 | 122 | 126 | 112 | ||||||||||||||||||||||
Income from equity method investees | (25 | ) | (26 | ) | (17 | ) | (31 | ) | (9 | ) | (65 | ) | (31 | ) | (25 | ) | (26 | ) | (17 | ) | ||||||||||||
Other operating expenses | — | — | 100 | — | — | — | — | — | — | 100 | ||||||||||||||||||||||
| | | | | | | | | | | | | | | | | | | | | | | | | | | | | | | | | |
Operating income | 2,255 | 2,256 | 2,219 | 2,075 | 1,924 | 2,638 | 2,327 | 2,255 | 2,256 | 2,219 | ||||||||||||||||||||||
Investment gain | — | — | 140 | — | — | — | — | — | — | 140 | ||||||||||||||||||||||
Interest expense, net | 411 | 409 | 426 | 297 | 280 | 406 | 391 | 411 | 409 | 426 | ||||||||||||||||||||||
| | | | | | | | | | | | | | | | | | | | | | | | | | | | | | | | ��� | |
Income before income taxes | 1,844 | 1,847 | 1,933 | 1,778 | 1,644 | 2,232 | 1,936 | 1,844 | 1,847 | 1,933 | ||||||||||||||||||||||
Net income attributable to shareholders of FMC-AG & Co. KGaA | $ | 1,045 | $ | 1,110 | $ | 1,187 | $ | 1,071 | $ | 979 | $ | 1,243 | $ | 1,029 | $ | 1,045 | $ | 1,110 | $ | 1,187 | ||||||||||||
| | | | | | | | | | | | | | | | | | | | | | | | | | | | | | | | | | |
| | | | | | | | | | | | | | | | | | | | | | | | | | | | | | | | | |
Weighted average ordinary shares outstanding | 302,339,124 | 301,877,304 | 301,139,652 | 299,012,744 | 296,808,978 | |||||||||||||||||||||||||||
Basic earnings per Ordinary share | $ | 3.46 | $ | 3.65 | $ | 3.89 | $ | 3.54 | $ | 3.25 | ||||||||||||||||||||||
Basic earnings per Ordinary ADS(b) | 1.73 | 1.83 | 1.94 | 1.77 | 1.62 | |||||||||||||||||||||||||||
Fully diluted earnings per Ordinary share | 3.45 | 3.65 | 3.87 | 3.51 | 3.24 | |||||||||||||||||||||||||||
Fully diluted earnings per Ordinary ADS(b) | 1.73 | 1.83 | 1.93 | 1.75 | 1.62 | |||||||||||||||||||||||||||
Dividends declared and paid per Ordinary share (€)(c) | 0.77 | 0.75 | 0.69 | 0.65 | 0.61 | |||||||||||||||||||||||||||
Dividends declared and paid per Ordinary share ($)(c) | 0.93 | 1.03 | 0.89 | 0.93 | 0.77 | |||||||||||||||||||||||||||
Weighted average shares outstanding | 305,748,381 | 304,440,184 | 302,339,124 | 301,877,304 | 301,139,652 | |||||||||||||||||||||||||||
Basic earnings per share | $ | 4.07 | $ | 3.38 | $ | 3.46 | $ | 3.65 | $ | 3.89 | ||||||||||||||||||||||
Basic earnings per ADS | 2.04 | 1.69 | 1.73 | 1.83 | 1.94 | |||||||||||||||||||||||||||
Fully diluted earnings per share | 4.06 | 3.38 | 3.45 | 3.65 | 3.87 | |||||||||||||||||||||||||||
Fully diluted earnings per ADS | 2.03 | 1.69 | 1.73 | 1.83 | 1.93 | |||||||||||||||||||||||||||
Dividends declared and paid per share (€)(b) | 0.80 | 0.78 | 0.77 | 0.75 | 0.69 | |||||||||||||||||||||||||||
Dividends declared and paid per share ($)(b) | 0.91 | 0.87 | 0.93 | 1.03 | 0.89 | |||||||||||||||||||||||||||
| | 2014 | 2013 | 2012 | 2011 | 2010 | 2016 | 2015 | 2014 | 2013 | 2012 | ||||||||||||||||||||||
|---|---|---|---|---|---|---|---|---|---|---|---|---|---|---|---|---|---|---|---|---|---|---|---|---|---|---|---|---|---|---|---|---|
| | (in millions except share and per share amounts) | (in millions except share and per share amounts) | ||||||||||||||||||||||||||||||
Balance Sheet Data at December 31: | ||||||||||||||||||||||||||||||||
Working capital | $ | 3,247 | $ | 2,733 | $ | 2,957 | $ | 1,432 | $ | 1,363 | $ | 2,214 | $ | 2,619 | $ | 3,030 | $ | 2,481 | $ | 2,713 | ||||||||||||
Total assets | 25,447 | 23,120 | 22,326 | 19,533 | 17,095 | 26,934 | 25,365 | 25,170 | 22,799 | 21,998 | ||||||||||||||||||||||
Total long-term debt (excluding current portion) | 9,080 | 7,747 | 7,842 | 5,495 | 4,310 | 7,203 | 7,853 | 9,014 | 7,681 | 7,709 | ||||||||||||||||||||||
Shareholders' equity | 10,028 | 9,485 | 9,207 | 8,061 | 7,524 | 11,457 | 10,496 | 10,028 | 9,485 | 9,207 | ||||||||||||||||||||||
Capital Stock – Preference shares – Nominal Value | — | — | 4 | 4 | 4 | — | — | — | — | 4 | ||||||||||||||||||||||
Capital Stock – Ordinary shares – Nominal Value | 385 | 382 | 375 | 372 | 369 | |||||||||||||||||||||||||||
Capital Stock – Nominal Value | 380 | 387 | 385 | 382 | 375 | |||||||||||||||||||||||||||
We conduct our business on a global basis in various currencies, although our operations are located principally in the United States ("U.S")U.S. and Germany. We prepare our consolidated financial statements, from which we derived the selected financial data above, utilizing the U.S. dollar as our reporting currency. We have converted the balance sheets of our non-U.S. dollar denominated operations into U.S. dollars at the exchange rates prevailing at the balance sheet date. Revenues and expenses are translated at the average exchange rates for the respective period, as shown. For information regarding the exchange rates used in preparing our consolidated financial statements, see Item 11, "Quantitative and Qualitative Disclosures About Market Risk – Management of Foreign Exchange and Interest Rate Risks – Foreign Exchange Risks."
D. Risk Factors
Before you invest in our securities, you should be aware that the occurrence of any of the events described in the following risk factors or elsewhere in this report, and other events that we have not predicted or assessed could have a material adverse effect on our results of operations, financial condition and business. If the events described below or other unpredicted events occur, then the trading price of our securities could decline and you may lose all or part of your investment.
Risks Relating to Regulatory Matters.
A changeWe operate in a highly regulated industry such that the potential for legislative reform provides uncertainty and potential threats to our operating models and results.
The delivery of healthcare services and products is highly regulated in most of the countries in which we operate. Proposals for legislative reform in these countries are often introduced to improve access to care, address quality of care issues and manage costs of the healthcare system. In the U.S. government, the Trump Administration and the 115th Congress have publicly announced their intention to pursue, and may enact, significant changes to existing health care programs. Certain health insurance provisions of ACA, if not many more ACA provisions, are likely targets for change. Changes of this nature could have significant effects on our businesses, both positive and negative, but the outcomes are impossible to predict.
Changes in reimbursement and/or governmental regulations for dialysishealth care could materially decrease our revenues and operating profit.
We receive reimbursement for our healthcare services from both public, government-sponsored payors and private, commercial payors. A large portion of our businesses is reimbursed by government payors, in particular the Medicare and Medicaid program in the U.S. For the year ended December 31, 2014,2016, approximately 31%32% of our consolidated revenues resulted from Medicare and Medicaid reimbursement. Legislative changes or changes in government reimbursement practice may affect the reimbursement rates for the services we provide, as well as the scope ofThe Medicare and Medicaid coverage. A decreaseprograms change their payment methodologies and funding from time to time in ways that are driven by changes in statute, economic conditions, or policy. For example, a 2% reduction to Medicare or Medicaid reimbursement rates or covered services could havepayments due to the Budget Control Act of 2011 ("BCA") and
subsequent activity in Congress, a material adverse$1.2 trillion sequester (across-the-board spending cuts) in discretionary programs, took effect on April 1, 2013 and continues in force. In addition, options to restructure the Medicare program in the direction of a defined-contribution, "premium support" model and to shift Medicaid funding to a block grant or per capita arrangement, with greater flexibility for the states, are also likely to be considered. Changes in payment methodologies and funding or payment requirements of (without limitation) the End-Stage Renal Disease Prospective Payment System, the Physician Fee Schedule, the Clinical Laboratory Fee Schedule, and the Ambulatory Surgical Center Payment System may have material effects on our business, financial condition and resultsoperating results. We have very little opportunity to influence or predict the magnitude of operations.those changes. For further information regarding Medicare and Medicaid reimbursement, see Item 4B, "Information on the Company – Business Overview – Regulatory and Legal Matters – Reimbursement" and Item 5, "Operating and Financial Review and Prospects – Overview."
The utilization Government reimbursement programs generally pay less than private insurance. As a result, the payments we receive from private payors generate a substantial portion of ESAs could materially impactthe profits we report. In 2016, approximately43% of our consolidated Health Care revenues were attributable to private payors and hospitals in the North America Segment. Therefore, if the private payors in the North America Segment reduce their payments for our services, or if we experience a material shift in our revenue mix toward Medicare or Medicaid reimbursement, then our revenue, cash flow and operating profit. An interruption of supply orearnings would materially decrease. Over the last few years, we have generally been able to implement modest annual price increases for private insurers and integrated care organizations, but. there can be no assurance that we can achieve future price increases from private insurers and integrated care organizations offering private insurance coverage to our inability to obtain satisfactory terms for ESAs could reduce our revenues and operating profit.
Erythropoietin stimulating agents, or ESAs, are sold in the U.S. by Amgen Inc., under the brand names Epogen® (epoeitin alfa) and Aranesp® (darbepoetin alfa). Our current non-exclusive ESA sourcing and supply contract with Amgen covers the period from January 1, 2015 to December 31, 2018. In addition, limited quantities of Mircera® (epoetin beta) are available to us for the purpose of performing a
commercial pilot of this FDA-approved ESA manufactured by Hoffmann-La Roche. Under the Medicare end stage renal disease ("ESRD") prospective payment system ("ESRD PPS") effective January 1, 2011, payment for ESAs is generally included in the bundled rate; previously, it was reimbursed separately.patients. Any of the following developmentsevents, among others, could materially adversely affecthave a material adverse effect on our operating results:
If we do not comply with the many governmental regulations applicable to our business, we could be excluded from government healthcare reimbursement programs or our authority to conduct business could be terminated, either of which would result in a material decrease in our revenue.
Our operations in both our health care services business and our products business are subject to extensive governmental regulation in virtually every country in which we operate. We are also subject to other laws of general applicability, including antitrust laws. The applicable regulations, which differ from country to country, cover areas that include:
Failure to comply with one or more of these laws or regulations may give rise to a number of legal consequences. These include, in particular, loss or suspension of federal certifications, loss or suspension of licenses under the laws of any state or governmental authority from which we generate substantial revenues, monetary and administrative penalties, increased costs for compliance with government orders, complete or partial exclusion from government reimbursement programs, refunds of payments received from government payors and government health care program beneficiaries due to failures to meet applicable requirements or complete or partial curtailment of our authority to conduct business. Any of these consequences could have a material adverse impact on our business, financial condition and results of operations.
The Company's medical devices and drug products are subject to detailed, rigorous and frequently changing regulation by the U.S. Food and Drug Administration ("FDA"), and numerous other national, supranational, federal and state authorities. These regulations include, among other things, regulations regarding product approvals, manufacturing practices, product labeling and promotion, quality control, quality assurance, and post-marketing safety reporting, including adverse event reporting and reporting of certain field actions. We cannot assure that all necessary regulatory approvals for new products or product improvements will be granted on a timely basis or at all. In addition, the Company's facilities and procedures and those of its suppliers are subject to periodic inspection by the FDA and other regulatory authorities. The FDA and comparable regulatory authorities outside the U.S. may suspend, revoke, or adversely amend the authority necessary for manufacture, marketing, or sale of our products and those of our suppliers. The Company and its suppliers must incur expense and spend time and effort to ensure compliance with these complex regulations, and if such compliance is not maintained, they could be subject to significant adverse administrative and judicial enforcement actions in the future. These possible enforcement actions could include warning letters, injunctions, civil penalties, seizures of the Company's products, and criminal prosecutions as well as dissemination of information to the public about such enforcement actions. These actions could result in, among other things, substantial modifications to the Company's business practices and operations; refunds; a total or partial shutdown of production while the alleged violation is remedied; and withdrawals or suspensions of current products from the market. Any of these events, in combination or alone, could disrupt the Company's business and have a material adverse effect on the Company's business, financial condition and results of operations. For a discussion of open FDA warning letters, see "Regulatory and Legal Matters – Regulatory Overview – Product Regulation – Medical Devices.FDA Warning Letters."
We rely upon the Company's management structure, regulatory and legal resources and the effective operation of our compliance programs to direct, manage and monitor our operations to comply with government regulations. If employees were to deliberately, recklessly or inadvertently fail to adhere to these regulations, then our authority to conduct business could be terminated and our operations could be
significantly curtailed. Any such terminations or reductions could materially reduce our sales. If we fail to identify in our diligence process or to promptly remediate any non-compliant business practices in companies that we acquire, we could be subject to penalties, claims for repayment or other sanctions. Any such terminations or reductions could materially reduce our sales, with a resulting material adverse effect on our business, financial condition and results of operations.
By virtue of this regulatory environment, our business activities and practices are subject to extensive review by regulatory authorities and private parties, and continuing audits, subpoenas, other inquiries, claims and litigation relating to the Company's compliance with applicable laws and regulations. We may not always be aware that an inquiry or action has begun, particularly in the case of "qui tam" or "whistle blower""whistle-blower" actions brought by private plaintiffs under the False Claims Act, which are initially filed under seal. We are the subject of a number of governmental inquiries and civil suits by the federal government and private plaintiffs. For information about certain of these pending investigations and lawsuits, see Note 2018 of the Notes to our Consolidated Financial Statements, "Commitments and Contingencies – Other Litigation and Potential Exposures.Exposures," included in this report.
In addition, there may be future legislative or regulatory changes that affect FDA procedures or decision making for approving medical device or drug products. Any such legislation or regulations, if enacted or promulgated, could result in a delay or denial of regulatory approval for our products. If any of our products do not receive regulatory approval, or there is a delay in obtaining approval, this also could have a material adverse effect on our business, financial condition and results of operations.
If we are unable to protect our information technology security systems against cyber-attacks or prevent other privacy or data security incidents that result in security breaches that disrupt our operations or result in the unintended dissemination of sensitive personal information or proprietary or confidential information, we could be exposed to significant regulatory fines or penalties, liability or reputational damage, or experience a material adverse effect on our results of operations, financial position, and cash flows.
We routinely process, store and transmit large amounts of data in our operations, including sensitive personal information as well as proprietary or confidential information relating to our business or third-parties. We may be subject to breaches of the information technology security systems we use.
A cyber-attack may penetrate our security controls and misappropriate or compromise sensitive personal information or proprietary or confidential information, including such information which is stored or transmitted on the systems used by certain of our products, to create system disruptions, cause shutdowns, or deploy viruses, worms, and other malicious software programs that attack our systems. Any failure to keep our information technology systems and our patients' and customers' sensitive information secure from attack, damage, loss or unauthorized disclosure or access, whether as a result of our action or inaction or that of our business associates or vendors, could adversely affect our reputation and operations and also expose us to mandatory public disclosure requirements, litigation and governmental enforcement proceedings, material fines, penalties and/or remediation costs, and compensatory, special, punitive and statutory damages, consent orders and other adverse actions, any of which could adversely affect our business, results of operations, financial condition or liquidity.
As we increase the amount of personal information that we store and share digitally, our exposure to these data security and related cyber-attack risks increases, including the risk of undetected attacks, damage, loss or unauthorized disclosure or access, and the cost of attempting to protect against these risks also increases. We have implemented security technologies, processes and procedures to protect our confidential data; however, there are no assurances that such measures will be effective against all types of breaches.
We operate in many different jurisdictions and we could be adversely affected by violations of the U.S. Foreign Corrupt Practices Act and similar worldwide anti-corruption laws.
The U.S. Foreign Corrupt Practices Act ("FCPA") and similar worldwide anti-corruption laws generally prohibit companies and their intermediaries from making improper payments to public officials for the purpose of obtaining or retaining business. Our internal policies mandate compliance with these anti-corruption laws. We operate many facilities throughout the United States and other parts of the world. Our decentralized system has thousands of persons employed by many affiliated companies, and we rely on our management structure, regulatory and legal resources and effective operation of our compliance program to direct, manage and monitor the activities of these employees. Despite our training, oversight and compliance programs, we cannot assure you that our internal control policies and procedures always will protect us from deliberate, reckless or inadvertent acts of our employees or agents that contravene the Company's compliance policies or violate applicable laws. Our continued expansion, including in developing countries, could increase the risk of such violations in the future. Violations of these laws, or allegations of such violations, could disrupt our business and result in a material adverse effect on our results of operations or financial condition. The Company has received communications alleging conduct in countries outside the U.S. and Germany that may violate the FCPA or other anti-bribery laws. The Audit and Corporate Governance Committee of the Company's Supervisory Board is conducting an investigationinvestigations with the assistance of independent counsel. The Company voluntarily advised the U.S. Securities and Exchange Commission ("SEC") and the U.S. Department of Justice ("DOJ"). The Company's investigationinvestigations and dialogue with the SEC and DOJ are ongoing. The Company has received a subpoena from the SEC requesting additional documents and a request from the DOJ for copies of the documents provided to the SEC. The Company is cooperating with the requests. Conduct has been identified that may result in monetary penalties or other sanctions under the FCPA or other anti-bribery laws. In addition, the Company's ability to conduct business in certain jurisdictions could be negatively impacted. The Company has previously recorded a non-material accrual for an identified matter. Given the current status of the investigations and remediation activities, the Company cannot reasonably estimate the range of possible loss that may result from identified matters or from the final outcome of the investigations or remediation activities. See "Item 15B. Management's annual report on internal control over financial reporting" and Note 2018 of the Notes to our Consolidated Financial Statements, "Commitments and Contingencies – Other Litigation and Potential Exposures.Exposures," included in this report.
If our joint ventures violate the law, our business could be adversely affected.
A number of the dialysis clinics and health care centers that we operate are owned, or managed, by joint ventures in which one or more hospitals, physicians or physician practice groups hold an interest. Physician owners, who are usually nephrologists, may also provide medical director services and physician owners may refer patients to those centers or other centers we own and operate or to other physicians who refer patients to those centers or other centers we own and operate. WhileBecause our relationships with physicians are governed by the federal and state anti-kickback statutes, we have structured our joint venturesventure arrangements to comply with many of the criteria for safe harbor protection under the U.S. Federal Anti- Kickback Statute,Anti-Kickback Statute; however, our investments in these joint venture arrangements do not satisfy all elements of such safe harbor. While we have established comprehensive compliance policies, procedures and programs to ensure ethical and compliant joint venture business operations, if one or more of our joint ventures were found to be in violation of the Anti-Kickback Statute, the Stark Law or other similar laws worldwide, we could be required to restructure or terminate them. We also could be required to repay to Medicare amounts received by the joint ventures pursuant to any prohibited referrals, and we could be subject to criminal and monetary penalties and exclusion from Medicare, Medicaid and other U.S. federal and state healthcare programs. Imposition of any of these penalties could have a material adverse effect on our business, financial condition and results of operations. In 2015, we received subpoenas from the U.S. Attorneys for Colorado and New York requesting information pertaining to certain of our joint venture dialysis facilities. See Note 18 of the Notes to our Consolidated Financial Statements, "Commitments and Contingencies – Other Litigation and Potential Exposures," included in this report.
Table of ContentsRisks Relating to Our Business
ProposalsThe utilization of ESAs could materially impact our operating profit. An interruption of supply or our inability to obtain satisfactory terms for healthcare reform, or relating to regulatory approvals,ESAs could decreasereduce our revenues and operating profit.
ManyErythropoietin stimulating agents ("ESAs") are synthetically engineered hormones that stimulate the production of the countriesred blood cells used to treat anemia in which we operate have been considering proposals to modify their current healthcare systems to improve access to health care and to control costs. Policymakersdialysis patients. ESAs are manufactured for sale in the U.S. by Amgen Inc., under the brand names Epogen® (epoeitin alfa) and elsewhere are also considering reforms thatAranesp® (darbepoetin alfa) and Hoffmann-La Roche under the brand name Mircera®.
Any of the following developments could change the methodology used to reimburse providers of health care services. We cannot predict whether and when these reform proposals will be adopted in countries in which we operate or what impact they might have on us. In the U.S., automatic across-the-board spending cuts over nine fiscal years (2013-2021), projected to total $1.2 trillion for all Federal government programs went into effect on March 1, 2013. Medicare payments to providers and suppliers are subject to these reductions, but these reductions are limited to one adjustment of no more than 2 percent through 2021. Any decrease in spending or other significant changes in state funding in countries in which we operate, particularly significant changes in the U.S. Medicare and Medicaid programs, could reduce our sales and profitability and have a material adverse effect onmaterially adversely affect our business, financial condition and results of operations.operations: (i) a reduction of the current overfill amount in ESA vials that we currently use (liquid medications, including certain ESAs in vial containers, typically include a small overfill amount to ensure that the fill volume can be extracted from the vial as administered to the patient), (ii) an interruption of supply of ESAs, or (iii) material increases in the utilization of ESAs for patients for whom the cost of EPO is included in a bundled reimbursement rate.
If we fail to estimate, price for and manage our medical costs in an effective manner, the profitability of our value-based products and services could decline and could materially and adversely affect our results of operations, financial position and cash flows.
Through our value-based agreements and health insurance products, we assume the risk of both medical and administrative costs for certain patients in return for fixed periodic payments from governmental and commercial insurers. We currently participate in various value-based programs, including (i) CMS's Bundled Payments for Care Improvement ("BPCI") program and Comprehensive End-Stage Renal Disease ("ESRD") Care initiative, (ii) Medicare Advantage chronic special needs plans and (iii) capitation agreements with commercial insurers in which FMCH receives a fixed fee to cover all or a defined portion of the medical costs of a defined population of patients. See Item 4, "Information on the Company – Business Overview – Regulatory and Legal Matters – Reimbursement" and "– Healthcare reform:" and Item 5, "Operating and Financial Review and Prospects – Financial Condition and Results of Operations – Overview" for information regardingadditional information.
BPCI program, in whole or in part. CMS relied on our business, our efforts to mitigate some of its effects, and the anticipated effects ofauthority granted by the Patient Protection and Affordable Care Act (Pub.L. 111-148), as amended by the Health Care and Education Reconciliation Act (Pub.L. 111-152) (collectively, "ACA") to implement this project. Congress is expected to consider repeal or revision of ACA, and the posture of CMS in the Trump Administration toward projects of this sort may differ from that of the Obama Administration. Such changes may affect the project's future prospects in ways which we currently cannot quantify or predict.
In addition, there may be legislative or regulatory proposals that could affect FDA procedures or decision-making for approving medical device or drug products. Any such legislation or regulations, if enacted or promulgated, could result in a delay or denial of regulatory approval for our products. If any ofinsured population characteristics. Failure to adequately price our products do not receive regulatory approval, or there is a delayestimate the costs of providing benefits to our beneficiaries, or effectively manage our operating expenses, may result in obtaining approval, this also could have a material adverse effect on our results of operations, financial position, and cash flows. There is also the possibility that Medicare Advantage Special Needs plans will not be re-authorized by Congress. Without Congressional action, these plans will expire on December 31, 2018. If the Special Needs plans are not re-authorized, our insurance business financial condition and results of operations.
In the United States, the ACA authorized state and federal health care exchanges to provide greater access to private health insurance coverage. These exchanges went into effect in 2014, and it is not yet known how the insurance coverage available through the exchanges will impact reimbursement for health care services, if at all. There cancould be no assurance that we can achieve future price increases from private insurers and managed care organizations offering coverage through the federal and state health care exchanges that are comparable to those we have historically received. Any reductions in reimbursement from private insurers and managed care organizations could materially and adversely impact our operating results.
Moreover, further changes in the U.S. healthcare reforms may be debated by Congress. Whether significant changes in policy will resultimpacted.
Risks Relating to Our Business
A significant portion of our North America Segment profits is dependent on the servicesestablished. If we provide to a minority of our patients who are covered by private insurance.
Government reimbursement programs generally paycomplete care for less than private insurance. Medicare only pays us 80%the baseline, we retain the difference. If the cost of complete care exceeds the Medicare allowable amount (the patient, Medicaid or secondary insurance being responsible forbaseline, we owe the remaining 20%), and Medicaid rates are comparable. As a result,payor the payments we receive from private payors generate a substantial portion of the profits we report. We estimate that Medicare and Medicaid are the primary payors for approximately 77% of the patients to whom we provide care in North America but that for 2014, we derived 51% of our North America Segment Health Care net revenues (amounting to 31% of our worldwide revenue) from Medicare and Medicaid. Therefore, if the private payors who pay for the care of the other 23% of our North America segment's patients reduce their payments for our services, or if we experience a material shift in our revenue mix toward Medicare or Medicaid reimbursement, then our revenue, cash flow and earnings would materially decrease.
Over the last few years, we have generally been able to implement modest annual price increases for private insurers and managed care organizations, but government reimbursement has remained flat or has been increased at rates below typical consumer price index ("CPI") increases. On November 6, 2014 the Centers for Medicare and Medicaid Service ("CMS") issued the final rule updating the ESRD PPS for 2015, pursuant to which the base rate was revised from $239.02 for 2014 to $239.43 for 2015. This change reflects a wage index budget-neutrality adjustment factor of 1.001729. See "Item 4. Information on the Company – Regulatory and Legal Matters – Reimbursement – U.S. – Budget Control Act and American Taxpayer Relief Act". There can be no assuranceThe reserves that we can achieve future price increases from private insurersestablish for health insurance policy benefits and managed care organizations comparable to those we have historically received. With increased governmental reformother contractual rights and regulatory activity, reimbursement from private insurers may be subject to downward pressurebenefits are based upon assumptions and judgments concerning a number of factors, including trends in the coming years. The advent of the federal and state health care exchanges may also negatively impact reimbursement from private insurance. Any reductionscosts, expenses, general economic conditions and other factors. To the extent the actual claims experience is less favorable than estimated based on our underlying assumptions, our incurred losses would increase and future earnings could be adversely affected.
Our profitability is dependent in reimbursement from private insurers and managed care organizations could materially and adversely impact our operating results. Any reduction inpart upon our ability to attract private pay patients to utilize ourcontract on favorable terms with hospitals, physicians and other health care services relativeproviders. The failure to historical levelsmaintain or to secure cost-effective health care provider contracts may result in a loss of beneficiaries or higher medical costs, which could adversely impactaffect our operating results. Any of the following events, among others, could have a material adverse effect on our operating results:business.
We are exposed to product liability, patent infringement and other claims which could result in significant costs and liability which we may not be able to insure on acceptable terms in the future.
Healthcare companies are typically subject to claims alleging negligence, product liability, breach of warranty, malpractice and other legal theories that may involve large claims and significant defense costs whether or not liability is ultimately imposed. Healthcare products may also be subject to recalls and patent infringement claims which, in addition to monetary penalties, may restrict our ability to sell or use our products. We cannot assure that such claims will not be asserted against us; for example, that significant adverse verdicts will not be reached against us for patent infringements or that large scale recalls of our products will not become necessary. In addition, the laws of some of the countries in which we operate provide legal rights to users of pharmaceutical products that could increase the risk of product liability claims. Product liability and patent infringement claims, other actions for negligence or breach of contract and product recalls or related sanctions could result in significant costs. These costs could have a material adverse effect on our business, financial condition and results of operations. See Note 2018 of the Notes to Consolidated Financial Statements, "Commitments and Contingencies.Contingencies," included in this report.
While we have been able to obtain liability insurance in the past to partially cover our business risks, we cannot assure that such insurance will be available in the future either on acceptable terms or at all.all, or that our insurance carriers will not dispute their coverage obligations. In addition, FMCH, our largest subsidiary, is partially self-insured for professional, product and general liability, auto liability and worker's compensation claims, up to pre-determined levels above which our third-party insurance applies. A successful claim in excess of the limits of our insurance coverage could have a material adverse effect on our business, results of operations and financial condition. Liability claims, regardless of their merit or eventual outcome, also may have a material adverse effect on our business and reputation, which could in turn reduce our sales and profitability.
The Company is vigorously defending a patent infringement lawsuit and certain wrongful death and personal injury lawsuits alleging inadequate labeling and warnings for certain of our dialysate concentrate products. See Note 20 of the Notes to Consolidated Financial Statements, "Legal and Regulatory Matters – Commercial Litigation". While we believe we have valid defenses to these claims, an adverse determination in any of these matters could have a material adverse effect on the Company's business, financial condition and results of operations.
Our growth depends, in part, on our ability to continue to make acquisitions.
The healthcare industry has experienced significant consolidation in recent years, particularly in the dialysis services sector. Our ability to make future acquisitions depends, in part, on our available financial resources and could be limited by restrictions imposed by the United States or other countries' competition laws or under our credit documents. If we make future acquisitions, we may need to incur additional debt or assume significant liabilities, either of which might increase our financial leverage and cause the prices
of our debt securities to decline. In addition, any financing that we might need for future acquisitions might be available to us only on terms that restrict our business. Acquisitions that we complete are also subject to risks relating to, among other matters, integration of the acquired businesses (including combining the acquired company's infrastructure and management information systems with ours, harmonization of its marketing, patient service and logistical procedures with ours and, potentially, reconciling divergent corporate and management cultures), possible non-realization of anticipated synergies from the combination, potential loss of key personnel or customers of the acquired companies, and the risk of assuming unknown liabilities not disclosed by the seller or not uncovered during due diligence. If we are not able to effect acquisitions on reasonable terms, there could be an adverse effect on our business, financial condition and results of operations.
We also compete with other health care companies in seeking suitable acquisition targets. The continuing consolidation of dialysis providers and combinations of dialysis providers with dialysis product manufacturers and other consolidation in the health care industry generally could affect future growth, including growth of our product sales. If we are not able to continue to effect acquisitions on reasonable terms, especially in the international area, this could have an adverse effect on our business, financial condition and results of operations.
We face specific risks from international operations.
We operate dialysis clinics in more than 45 countries and sell a range of products and services to customers in more than 120 countries. Our international operations are subject to a number of risks, including but not limited to the following:
International growth and expansion into emerging markets such as China, Eastern Europe, the Middle East and Africa, could cause us difficulty due to greater regulatory barriers than in the United States or Western Europe, the necessity of adapting to new regulatory systems, and problems related to entering new markets with different economic, social, legal and political systems and conditions. For example, unstable political conditions or civil unrest could negatively impact our operations and sales in a region or our ability to collect receivables or reimbursements or operate or execute projects in a region.
Any one or more of these or other factors could increase our costs, reduce our revenues, or disrupt our operations, with possible material adverse effects on our business, financial condition and results of operations.
We could be adversely affected if we experience shortages of components or material price increases from our suppliers.
The Company'sOur purchasing strategy is aimed at developing partnerships with strategic suppliers through long-term contracts and at the same time ensuring, where reasonably practicable, that it haswe have at least two sources for all supply and price-critical primary products (dual sourcing, multiple sourcing). To prevent loss of suppliers, we monitor our supplier relationships on a regular basis. Suppliers which are integral to our procurement functions are subject to performance and risk analyses. Through constant market analyses, a
demands-based design of supplier relationships and contracts, as well as the use of financial instruments, we seek to mitigate disruptive component shortages and potential price increases. If the Company is unable to counteract the risk of bottleneck situations at times of limited availability of components and other materials in spite of its purchasing strategy in combination with ongoing monitoring of market developments, this could result in delays in production and hence have an adverse effect on the Company's results of operations. Similarly, material price increases by suppliers could also adversely affect the Company's result of operations.
If physicians and other referral sources cease referring patients to our dialysishealth care service businesses and clinics or cease purchasing or prescribing our dialysis products, our revenues would decrease.
In providing dialysis services within our health care business, we depend upon patientspatients' choosing our clinicshealth care facilities as the location for their treatments.care. Patients may select a clinic based, in whole or in part, on the recommendation of their physician. We believe that physicians and other clinicians typically consider a number of factors when recommending a particular dialysis facility, pharmacy, physician practice, vascular surgery center or vascular accessurgent care center to an ESRD patient, including, but not limited to, the quality of care at a clinic, the competency of a clinic's staff, convenient scheduling, and a clinic's location and physical condition. Physicians may change their facility recommendations at any time, which may result in the movement of new or existing patients to competing clinics, including clinics established by the physicians themselves. At most of our clinics, a relatively small number of physicians often account for the referral of all or a significant portion of the patient base. Our dialysis business also depends on recommendations by hospitals, managed care plans and other healthcare institutions. If a significant number of physicians, hospitals or other healthcare institutions cease referring their patients to our clinics;clinics, this would reduce our health care revenue and could materially adversely affect our overall operations.
The decision to purchase or prescribe our dialysis products and other services or competing dialysis products and other services will be made in some instances by medical directors and other referring physicians at our dialysis clinics and by the managing medical personnel and referring physicians at other dialysis clinics, subject to applicable regulatory requirements. A decline in physician recommendations or recommendations from other sources for purchases of our products or ancillary services would reduce our dialysis product and other services revenue, and would materially adversely affect our business, financial condition and results of operations.
Our pharmaceutical product business could lose sales to generic drug manufacturers or new branded drugs.
Our branded pharmaceutical product business is subject to significant risk as a result of competition from manufacturers of generic drugs and other new competing medicines or therapies. Through the end of 2013, we were obligated to make certain minimum annual royalty payments under certain of our pharmaceutical product license agreements, regardless of our annual sales of the licensed products. Thereafter, the Company is required to determine their minimum purchase requirements for the subsequent year on a yearly basis. Any of the expiration or loss of patent protection for one of our products, the "at-risk" launch by a generic manufacturer of a generic version of one of our branded pharmaceutical products or the launch of new branded drugs that compete with one or more of our products could result in the loss of a major portion of sales of that branded pharmaceutical product in a very short time period, which could materially and adversely affect our business, financial condition and results of operations.
Our competitors could develop superior technology or otherwise impact our sales.
We face numerous competitors in both our health care services business and our dialysis products business, some of which may possess substantial financial, marketing or research and development resources. Competition and especially new competitive developments could materially adversely affect the future pricing and sale of our products and services. In particular, technological innovation has historically been a significant competitive factor in the dialysis products business. The introduction of new products by competitors could render one or more of our products or services less competitive or even obsolete.
Global economic conditions as well as further disruptions in financial markets may have an adverse effect on our businesses.
Although there has been some improvement in the global economyCurrent and financial markets since the market deterioration of the global economy and tightening of the financial markets, the overall global economic outlook remains uncertain and currentfuture economic conditions could adversely affect our business and our profitability. Among other things, the potential decline in federal and state revenues that may result from such conditions may create additional pressures to contain or reduce reimbursements for our services from public payors around the world, including Medicare, Medicaid in the United States and other government sponsored programs in the United States and other countries around the world.
Job losses or slow improvement in the unemployment rate in the United States may result in a smaller percentage of our patients being covered by an employer group health plan and a larger percentage being covered by lower paying Medicare and Medicaid programs. Employers and individuals who obtain insurance through exchanges established under the ACA might also begin to select more restrictive commercial plans with lower reimbursement rates. To the extent that payors are negatively impacted by a decline in the economy, we may experience further pressure on commercial rates, a further slowdown in collections and a reduction in the amounts we expect to collect.
We depend on the financial markets for access to capital, as do our renal product customers and commercial healthcare insurers. Limited or expensive access to capital could make it more difficult for these customers to do business with us, or to do business generally, which could adversely affect our businesses.
In addition, uncertainty in the financial markets could adversely affect the variable interest rates payable under our credit facilities or could make it more difficult to obtain or renew such facilities or to obtain other forms of financing in the future. Any or all of these factors, or other consequences of the continuation, or worsening, of domestic and global economic conditions which cannot currently be predicted, could continue to adversely affect our businesses and results of operations.
Any material disruption in federal government operations and funding could have a material adverse effect on our revenues, earnings, cash flows and financial condition.
A substantial portion of our revenues is dependent on federal healthcare program reimbursement, and any disruptions in federal government operations could have a material adverse effect on our revenues, earnings and cash flows. If the U.S. government defaults on its debt, there could be broad macroeconomic effects that could raise our cost of borrowing funds, and delay or prevent our future growth and expansion. Any future federal government shutdown, U.S. government default on its debt and/or failure of the U.S. government to enact annual appropriations could have a material adverse effect on our revenues, earnings and cash flows. Additionally, disruptions in federal government operations may negatively impact regulatory approvals and guidance that are important to our operations, and create uncertainty about the pace of upcoming health care regulatory developments.
If we are unable to attract and retain skilled medical, technical and engineering personnel, we may be unable to manage our growth or continue our technological development.
Our continued growth in the health care business will depend upon our ability to attract and retain skilled employees, such as highly skilled nurses and other medical personnel. Competition for those employees is intense. Moreover, we believe that future success in the provider business will be significantly dependent on our ability to attract and retain qualified physicians to serve as employees of or consultants to our health care services businesses. If we are unable to achieve that goal or if doing so requires us to bear increased costs this could adversely impact our growth and results of operations.
Our dialysis products business depends on the development of new products, technologies and treatment concepts to be competitive. Competition is also intense for skilled engineers and other technical research and development personnel. If we are unable to obtain and retain the services of key personnel, the ability of our officers and key employees to manage our growth would suffer and our operations could suffer in other respects. These factors could preclude us from integrating acquired companies into our operations, which could increase our costs and prevent us from realizing synergies from acquisitions. Lack of skilled research and development personnel could impair our technological development, which would increase our costs and impair our reputation for production of technologically advanced products.
Diverging views of fiscal authorities could require us to make additional tax payments.
We are subject to ongoing tax audits in the U.S., Germany and other jurisdictions. We could potentially receive notices of unfavorable adjustments and disallowances in connection with certain of these audits. If we are unsuccessful in contesting unfavorable determinations we could be required to make additional tax payments, which could have a material adverse impact on our results of operations and
operating cash flow in the relevant reporting period. See Item 5, "Operating and Financial Review and Prospects – B.IV. Liquidity and Capital Resources – Liquidity" as well as Note 20 of the Notes to Consolidated Financial Statements, "Commitments and Contingencies – Legal and Regulatory Matters.Resources."
Risks Relating to our Securities
Our indebtedness may limit our ability to pay dividends or implement certain elements of our business strategy.
At December 31, 2014,2016, we had consolidated debt of $9,532$8,572 million and consolidated total shareholders' equity of $10,028$11,457 million. Our debt could have significant consequences to our operations and our financial condition. For example, it could require us to dedicate a substantial portion of our cash flow from operations, as well as the proceeds of certain financings and asset dispositions, to payments on our indebtedness, thereby reducing the availability of our cash flow and such proceeds to fund working capital, capital expenditures and for other general corporate purposes.
In October 2012, we entered into a syndicated Credit Agreement, which was amended in November 2014 (the "Amended 2012 Credit Agreement"). Our Amended 2012 Credit Agreement, the indentures relating to our senior notes ("Senior NotesNotes") and our accounts receivable securitization program (the "A/R Facility") include covenants that require us to maintain certain financial ratios or meet other financial tests. Under our Amended 2012 Credit Agreement and the A/R Facility, we are obligated to maintain a maximumour consolidated leverage at or below an established maximum ratio (ratio of consolidated net funded debt to consolidated EBITDA) as these terms are defined in the respective financing agreements.
Our Amended 2012 Credit Agreement and the indentures related to our Senior Notes include other covenants which, among other things, restrict or could have the effect of restricting our ability to dispose of assets, incur debt, pay dividends and other restricted payments, create liens or make investments or acquisitions. These covenants may otherwise limit our activities. The breach of any of the covenants could result in a default and acceleration of the indebtedness under the credit agreement or the indentures, which could, in turn, create additional defaults and acceleration of the indebtedness under the agreements relating to our other long-term indebtedness which would have an adverse effect on our business, financial condition and results of operations.
Fresenius SE owns 100% of the shares in the General Partner of our Company and is able to exercise management control of FMC-AG & Co. KGaA.
Fresenius SE owns approximately 31.1%30.82% of our outstanding ordinary shares, excluding treasury shares we held, as of February 18, 2015.16, 2017. Fresenius SE also owns 100% of the outstanding shares of Management AG, the General Partner of the Company. As the sole shareholder of the General Partner, Fresenius SE has the sole right to elect the supervisory board of the General Partner which, in turn, appoints the General Partner's Management Board. The Management Board of the General Partner is responsible for the management of the Company. Through its ownership of the General Partner, Fresenius SE is able to exercise de facto management control of FMC-AG & Co. KGaA, even though it owns less than a majority of our outstanding voting shares. Such de facto control limits public shareholder influence on management of the Company and precludes a takeover or change of control of the Company without Fresenius SE's consent, either or both of which could adversely affect the price of our shares.
Because we are not organized under U.S. law, we are subject to certain less detailed disclosure requirements under U.S. federal securities laws.
Under the pooling agreement that we have entered into for the benefit of non-relatedpublic holders of our Ordinary shares (including, in each case, holders of American Depositary Receipts representing beneficial ownership of such shares), we have agreed to file quarterly reports with the SEC to prepare annual and quarterly financial statements in accordance with U.S. generally accepted accounting principles ("G.A.A.P."), and to file information with the SEC with respect to annual and general meetings of our shareholders. The pooling agreement originally required that we prepare our annual and quarterly financial statements filed with the SEC in accordance with U.S. generally accepted accounting principles ("U.S. GAAP"). It was amended in June 2016 to provide that we may prepare such financial statements in accordance with U.S. GAAP or IFRS and, commencing with our report for the first quarter of 2017, we will prepare such financial statements in accordance with IFRS with the euro as our reporting currency. The pooling agreement also requires that the supervisory board of Management AG, our General Partner, include at least two members who do not have any substantial business or professional relationship with Fresenius SE, Management AG or FMC-AG & Co. KGaA and its affiliates and requires the consent of those independent directors to certain transactions between us and Fresenius SE and its affiliates.
We are a "foreign private issuer," as defined in the SEC's regulations, and consequently we are not subject to all of the same disclosure requirements applicable to domestic companies. We are exempt from the SEC's proxy rules, and our annual reports contain less detailed disclosure than reports of domestic
issuers regarding such matters as management, executive compensation and outstanding options, beneficial ownership of our securities and certain related party transactions. Also, our officers, directors and beneficial owners of more than 10% of our equity securities are exempt from the reporting requirements and short – swing profit recovery provisions of Section 16 of the Exchange Act. We are also generally exempt from most of the governance rules applicable to companies listed on the New York Stock Exchange (including("NYSE"), including the obligation to maintain a compensation committee of independent directors),directors, other than the obligation to maintain an audit committee in accordance with Rule 10A – 3 under the Exchange Act and to provide an annual affirmation(and, if required, quarterly) affirmations of our compliance. These limits on available information about our company and exemptionsWe must, however, disclose the significant ways in which the governance standards that we follow differ from those applicable to U.S. companies under the NYSE governance rules. Exemptions from many governance rules applicable to U.S. domestic issuers may adversely affect the market prices for our securities. See Item 16G, "Corporate Governance."
Item 4. Information on the Company
A. History and Development of the Company
General
Fresenius Medical Care AG & Co. KGaA, ("FMC-AG & Co. KGaA" or the "Company"), is a partnership limited by shares (Kommanditgesellschaft auf Aktien or "KGaA"), formerly known as Fresenius Medical Care AG, ("FMC-AG"), a German stock corporation (Aktiengesellschaft or "AG") organized under the laws of Germany.
The Company was originally incorporated on August 5, 1996 as a stock corporation and transformed into a partnership limited by shares upon registration on February 10, 2006. FMC-AG & Co. KGaA is registered with the commercial register of the local court (Amtsgericht) of Hof an der Saale, Germany, under the registration number HRB 4019. Our registered office (Sitz)(Sitz) is Hof an der Saale, Germany. Our registered business address is Else-Kröner-Strasse 1, 61352 Bad Homburg, Germany, telephone +49-6172-609-0.
History
On September 30, 1996, we completed a series of transactions to consummate an Agreement and Plan of Reorganization entered into on February 4, 1996 by Fresenius SE (then Fresenius AG) and W.R. Grace & Co. which we refer to as the "Merger" elsewhere in this report. Pursuant to that agreement, Fresenius SE contributed Fresenius Worldwide Dialysis, its global dialysis business, including its controlling interest in Fresenius USA, Inc., in exchange for 105,630,000 FMC-AG Ordinary shares.Shares. Thereafter, we acquired:
On February 10, 2006, the Company completed the transformation of its legal form under German law as approved by its shareholders during the Extraordinary General Meeting ("EGM") held on August 30, 2005. Upon registration of the transformation of legal form in the commercial register of the local court in Hof an der Saale, on February 10, 2006, Fresenius Medical Care AG's legal form was changed from a German AG to a KGaA with the name Fresenius Medical Care AG & Co. KGaA. The Company as a KGaA is the same legal entity under German law, rather than a successor to the stock corporation. Management AG, a subsidiary of Fresenius SE, which was the majority voting shareholder of FMC-AG prior to the transformation, is the general partner of FMC-AG & Co. KGaA. Shareholders in FMC-AG & Co. KGaA participated in all economic respects, including profits and capital, to the same extent and (except as modified by the first share conversion described below) with the same number of shares in FMC-AG & Co. KGaA as they held in FMC-AG prior to the transformation. Upon effectiveness of the transformation of legal form, the share capital of FMC-AG became the share capital of FMC-AG & Co. KGaA, and persons who were shareholders of FMC-AG became shareholders of the Company in its new legal form.
Prior to the effectiveness of the transformation, and as approved by the EGM and by a separate vote of FMC-AG's former preference shareholders, the Company offered holders of its non-voting Preference shares (including preference shares represented by American Depositary Shares (ADSs)) the opportunity to convert their shares into Ordinary shares, which was accepted by the holders of approximately 96% of the outstanding Preference shares. Preference shares that were not converted remained outstanding and became Preference shares of FMC-AG & Co. KGaA in the transformation.
Effective December 3, 2012,In March, 2006, we completed a two-for-one split of the ADSs representing our Ordinary shares and the ADSs representing our Preference shares. As a result of the ADSs split, the ratio of our ADSs to our Ordinary shares and Preference shares was changed from one ADS representing one share to one ADS representing one-half of a share. All ADS and per ADS amounts in the consolidated financial statements, the related notes and elsewhere in this report have been restated to reflect the ADS splits.
On May 16, 2013, the Company's annual general meeting ("AGM") and a separate Preference shareholder meeting adopted resolutions for the mandatory conversion of our Preference shares into Ordinary shares. The amendments to the Company's articles of association ("Articles of Association") effecting the conversion were registered with the commercial register at the local court in Hof an der Saale on June 28, 2013. All outstanding Preference shares were converted on a 1:1 basis to Ordinary shares and all remaining options to acquire Preference shares were converted into options to acquire Ordinary shares. On July 5, 2013, the Company received a €27.0 million ($34.8 million) premium from the largest former preference shareholder, a financial institution located outside the United States, for the conversion of their preference shares to ordinary shares. In connection with the Preference share conversion, the listing of the Preference shares at the Frankfurt Stock Exchange was terminated and the New York Stock Exchange delisted the ADSs representing our Preference shares.
On May 20, 2013 we commenced and on August 14, 2013, we completed a share buy-back program. We purchased a total of 7,548,951 Ordinary shares on the Frankfurt Stock Exchange at a total cost of approximately €350 million (approximately US $500 million). The program was financed from cash flow and existing credit facilities. The repurchased shares have either been cancelled, thereby reducing our registered share capital, or used to satisfy our share delivery obligations upon exercise of stock options.
Part of the Company's stated strategy is to expand and complement its existing business through acquisitions. See Item 4B, "Information on the Company – Business Overview – Our Strategy and Competitive Strengths." On March 31, 2006, the Company completed the acquisition of Renal Care Group, Inc. ("the RCG Acquisition"RCG"), a Delaware corporation with principal offices in Nashville, Tennessee, for an all cash purchase price, netTennessee. RCG was the fourth largest dialysis care
We have also expanded the renal pharmaceuticals portion of our product business starting in 2006provider when we acquired Phoslo®,purchased it. RCG added additional clinics and services to our operations and continues to operate as a phosphate binder.subsidiary. Please see Item 4C, "Information on the Company – Organizational Structure."
In 2008, we entered into two separate and independent license and distribution agreements, one for certain countries in Europe and the Middle East (with Galenica AG and Vifor (International) AG) and one for the U.S. (with Luitpold Pharmaceuticals Inc. and American Regent, Inc.), to market and distribute intravenous iron products, such as Venofer® (iron sucrose) and Ferinject® (ferric carboxymaltose) (outside of the U.S.) for dialysis treatment.. In December 2010, we formedannounced the expansion of our agreements with Galenica by forming a new renal pharmaceutical company, with one of the licensors, Galenica Ltd. "Galenica", named Vifor Fresenius Medical Care Renal Pharma, Ltd. ("VFMCRP"), with the intention to develop and distribute products to treat iron deficiency anemia and bone mineral metabolism for pre-dialysis and dialysis patients. We ownFMC-AG & Co. KGaA owns 45% of the shares of VFMCRP. Seecompany which is headquartered in Switzerland. With VFMCRP, we have licenses for:
For more information on our pharmaceutical licenses and distribution agreements. Please see Item 4B, "Information on the discussion of "Renal Pharmaceuticals" below.Company – Business Overview – Renal Pharmaceuticals."
In 2010, we acquired Asia Renal Care Ltd, a largeLtd., the second largest dialysis and related services provider in ourthe Asia-Pacific region,Region with more than 80 clinics treating about 5,300 patients, Kraevoy Nefrologocheskiy Centr, a private operator of dialysis clinics in Russia's Krasnodar region treating approximately 1,000 patients in 5 clinics, and Gambro AB's worldwide peritoneal dialysis business.business, serving over 4,000 patients in more than 25 countries.
In 2011, we acquired IDC,International Dialysis Centers, the dialysis service business of Euromedic International, with over 8,200 hemodialysis patients and 70 clinics in nine countries, principally in Central and Eastern Europe and, American Access Centers, which operates 28 free-standing vascular access centers, in the U.S., which provided us with critical mass in our vascular access business.
In 2012, we acquired 100% of the equity of Liberty Dialysis Holdings, Inc. ("Liberty Dialysis"), a Delaware corporation with principal offices in Mercer Island, Washington and the owner of all of the business ofWashington. Liberty Dialysis Inc. and 51% of Renal Advantage, Inc., for total cash consideration of $2,182 million consisting of $1,697 million cash, net of cash acquired and $485 million non-cash consideration (the "Liberty Acquisition"). Prior to entering into the merger agreement for the Liberty Acquisition, we owned 49% of Renal Advantage, Inc., and we also had a loan receivable from Renal Advantage Partners, LLC of $280 million which was retired as part of the transaction. Liberty Dialysis
mainly provided dialysis services in the United States through the 263 clinics it operated (the "Acquired Clinics"). Liberty Dialysis's results have been includedoperated.
In 2013, Spectra, our laboratory testing for others in the Company's Consolidated Statement of Income since February 29, 2012.U.S., acquired Shiel Laboratories ("Shiel"). In addition to providing blood, urine and other bodily fluid testing services to determine the appropriate individual dialysis therapy for a patient and to assist physicians in determining whether a dialysis patient's therapy regimen, diet and medicines remain optimal, Shiel expanded our laboratory services to include clinical anatomic pathology and molecular testing in the New York region.
OnIn July 1, 2014, we made an investment for a majority interest in Sound, Inpatient Physicians, Inc. ("Sound"), a physician services organization focused on hospitalist and post-acute care services, furthering our strategic investments and expanding the health care services we offer,offer. In May 2014, the Company acquired MedSpring Urgent Care Centers ("MedSpring") with operations in Illinois and in November 2014, Sound acquired Cogent Healthcare ("Cogent"), expanding Sound to serve over 180 hospitals in 35 states with more than 1,750 providers. OnTexas. MedSpring's 14 urgent care centers provide convenient, consistent, high-quality primary care and customer service. In October 21, 2014 we acquired Laurus Healthcare L.P., which does business under the trade name National Cardiovascular Partners ("NCP"). NCP is the leading operator of outpatient cardiac catheterization and vascular laboratories in the U.S. In November 2014, Sound acquired Cogent Healthcare Cogent, expanding Sound to serve over 180 hospitals in 35 states with more than 1,750 providers.
ForIn November 2016, we acquired Xenios AG, a medical technology company focusing on minimally invasive treatment of lung and cardiac failure.
The consolidated financial statements and other financial information regardingcontained in this report have been prepared and are presented in accordance with U.S. GAAP, as required by our capital expenditures duringpooling agreement, using the past three years, see 4B, "Information onU.S. dollar as our reporting currency. In accordance with the Company – Business Overview – Capital Expenditures.authorization provided by our shareholders at our AGM held May 12, 2016, in June 2016, we amended the pooling agreement to permit us to prepare the financial statements and other financial information in our reports filed with or furnished to the SEC in accordance with IFRS. See Item 16G, Corporate Governance, "Description of the Pooling Arrangements." On December 1, 2016, we announced that commencing with our quarterly report to be filed for the first quarter of 2017, such financial statements and financial information will be prepared in accordance with IFRS, using the euro as our reporting currency.
B. Business Overview
Our Business
We are the world's largest kidney dialysis company.company, based on publicly reported sales and number of patients treated. We provide dialysis care and related services related to the dialysis treatment a patient with end-stage renal disease ("ESRD") receivespersons who suffer from ESRD as well as other health care services. We describe our other health care services as "Care Coordination." Care Coordination services include pharmacy services, vascular, cardiovascular and endovascular specialty services, non-dialysis laboratory testing services, physician services, hospitalist and intensivist services, health plan services and urgent care services, which, together with dialysis care services represent our health care services. We also develop and manufacture a full range of dialysis machines, systems and disposable products, which we sell to customers in more than 120 countries.countries and also use in our internal health care service operations. Our dialysis business is therefore vertically integrated. We describe our other health care services as Care Coordination. Care Coordination currently includes coordinated delivery of pharmacy services, vascular, cardiovascular and endovascular specialty services, non-dialysis laboratory testing services, physician services, hospitalist and intensivist services, health plan services, ambulatory surgery center services and urgent care services, which, together with dialysis care services represent our health care services. A visualsummary representation of our services and products is as followsfollows:
| | Health Care | | | Dialysis Products | | |||||||
|---|---|---|---|---|---|---|---|---|---|---|---|---|
| Dialysis Care services | Care Coordination services | Major product groups | ||||||||||
| • ESRD-related treatments | •
| • Hemodialysis machines and peritoneal dialysis cyclers | |||||||||
| • ESRD-related laboratory testing services | •
| • Dialyzers | |||||||||
| • Acute dialysis services | •
| • Peritoneal dialysis solutions | |||||||||
| •
| • Hemodialysis concentrates, solutions and granulates | ||||||||||
| •
| • Bloodlines | ||||||||||
| •
| • Systems for water treatment
| ||||||||||
| •
| • Renal pharmaceuticals | ||||||||||
• Other equipment & medical devices | ||||||||||||
Our dialysis business is vertically integrated, providing dialysis treatment at our own dialysis clinics and supplying these clinics with a broad range of products. In addition, we sell dialysis products to other dialysis service providers. Based on publicly reported sales and number of patients treated, our health care operations in dialysis services and dialysis products make us the world's largest kidney dialysis company. At December 31, 2014, we provided dialysis treatment to 286,312 patients in 3,361 clinics worldwide, located in more than 45 countries. In the U.S. we also provide inpatient dialysis services and other services under contract to hospitals. In 2014, we provided 42,744,977 million dialysis treatments, an increase of approximately 6% compared to 2013. For further discussion of revenues relating to Care Coordination, see Item 5.A, "Operating and Financial Review and Prospects – Results of Operations – Year ended
December 31, 2014 Compared to Year Ended December 31, 2013." For further discussion of the Company's services, see Item 4, "Information on the Company – Business Overview – Health Care"). For the year ended December 31, 2014,2016, we had net revenues of $15.8$17.9 billion, an 8%a 7% increase (10%(8% in constant currency, see itemItem 5, "Operating and Financial Review and Prospects – Non U.S. GAAP Measures for Presentation – Constant Currency") over 20132015 revenues. WeIn 2016, we derived 66%72% of our revenues in 2014 from our North America Segment, and 34%15% from our InternationalEMEA Segment, which include9% from our operations in Europe (20%),Asia-Pacific Segment and 4% from our Latin America (5%) and Asia-Pacific (9%).Segment.
Our Ordinary shares are listed on the Frankfurt Stock Exchange and American Depositary Receipts evidencing our Ordinary shares on the New York Stock Exchange, and on February 18, 2015,At December 31, 2016, we had a market capitalization of $22.2 billion.
We use the insight we gain when treatingprovided dialysis treatment to 308,471 patients in developing new and improved products. We believe that our size, our activities3,624 clinics worldwide, located in both health care services andmore than 45 countries. In 2016, we provided 46,529,154 dialysis products as well as our concentration in specific geographic areas allow us to operate more cost-effectively than many of our competitors.
We estimate the volume of the global dialysis market was approximately $77 billion for 2014,treatments, an increase of 1%4% compared to the previous year (4% increase in constant currency terms). Approximately $63 billion represents dialysis services, including the administration2015.
The following table summarizes net revenues for our North America Segment, EMEA Segment, Asia-Pacific Segment and our InternationalLatin America Segment in our major categories of activity, health care services and dialysis products for the three years ended December 31, 2014, 20132016, 2015 and 2012.2014.
| | 2014 | 2013 | 2012 | 2016 | 2015 | 2014 | ||||||||||||||
|---|---|---|---|---|---|---|---|---|---|---|---|---|---|---|---|---|---|---|---|---|
| | (in millions) | (in millions) | ||||||||||||||||||
North America | ||||||||||||||||||||
North America Segment | ||||||||||||||||||||
Health Care | $ | 9,655 | $ | 8,772 | $ | 8,230 | $ | 11,982 | $ | 10,932 | $ | 9,655 | ||||||||
Dialysis Products | 845 | 834 | 801 | 904 | 881 | 845 | ||||||||||||||
| | | | | | | | | | | | | | | | | | | | | |
| 10,500 | 9,606 | 9,031 | 12,886 | 11,813 | 10,500 | |||||||||||||||
International | ||||||||||||||||||||
EMEA Segment | ||||||||||||||||||||
Health Care | 2,595 | 2,358 | 2,262 | $ | 1,294 | 1,226 | 1,438 | |||||||||||||
Dialysis Products | 2,670 | 2,612 | 2,478 | 1,373 | 1,403 | 1,634 | ||||||||||||||
| | | | | | | | | | | | | | | | | | | | | |
| 5,265 | 4,970 | 4,740 | 2,667 | 2,629 | 3,072 | |||||||||||||||
Asia-Pacific Segment | ||||||||||||||||||||
Health Care | $ | 730 | $ | 667 | $ | 569 | ||||||||||||||
Dialysis Products | 902 | 835 | 788 | |||||||||||||||||
| | | | | | | | | | | | ||||||||||
| 1,632 | 1,502 | 1,357 | ||||||||||||||||||
Latin America Segment | ||||||||||||||||||||
Health Care | $ | 513 | $ | 567 | $ | 588 | ||||||||||||||
Dialysis Products | 199 | 199 | 248 | |||||||||||||||||
| | | | | | | | | | | | ||||||||||
| 712 | 766 | 836 | ||||||||||||||||||
We receive a substantial portion of our North America segment revenue from the U.S. Medicare program and other government sources. The following table provides information for the years ended December 31, 2016, 2015 and 2014 regarding the percentage of our U.S. patient service revenue (net of contractual allowance and discounts but before patient service bad debt provision), included in our Health Care Services – Renal Industry Overview
revenue from: (a) the Medicare program, (b) private/alternative payors, such as commercial insurance and private funds, (c) Medicaid and other government sources and (d) hospitals.
| | Year Ended December 31, | |||||||||
|---|---|---|---|---|---|---|---|---|---|---|
| | 2016 | 2015 | 2014 | |||||||
Medicare program | 43.6 | % | 44.6 | % | 47.5 | % | ||||
Private / alternative payors | 43.2 | % | 42.6 | % | 43.1 | % | ||||
Medicaid and other government sources | 5.0 | % | 4.7 | % | 3.5 | % | ||||
Hospitals | 8.2 | % | 8.1 | % | 5.9 | % | ||||
| | | | | | | | | | | |
Total | 100.0 | % | 100.0 | % | 100.0 | % | ||||
| | | | | | | | | | | |
| | | | | | | | | | | |
| | | | | | | | | | | |
We offer life-maintaining and life-savingUnder the Medicare program, Medicare reimburses dialysis services and dialysis products in a market which is characterized by favorable demographic development. As a global market leader in dialysis products and dialysis care services, FMC-AG & Co. KGaA considers it important to possess accurate and current information on the status and development of the global, regional and national markets.
To obtain and manage this information, FMC-AG & Co. KGaA has developed an internal information tool called Market & Competitor Survey ("MCS"). The MCS is used within the Company as a tool to collect, analyze and communicate current and essential information on the dialysis market, developing trends, the market position of FMC-AG & Co. KGaA and those of its competitors. Country – by – country surveys are performed at the end of each calendar year which focus on the total number of patients treatedproviders for ESRD, the treatment modality selected, products used, treatment location and the structure of ESRD patient care providers. The survey has been refined over the years to facilitate access to more detailed information and to reflect changes in the development of therapies and products as well as changes to the structure of our competitive environment. The questionnaires are distributed to professionals in the field of dialysiscertain individuals who are in a position to provide ESRD-relevant country specific information themselvesdiagnosed as having ESRD, regardless of age or who can coordinate appropriate input from contacts with the relevant know-how in each country. The surveys are then centrally validatedfinancial circumstances. See "Regulatory and checked for consistency by cross-referencing them with the most recent sources of national ESRD information (e.g. registry data or publications if available) and with the results of surveys performed in previous years. All information received is consolidated at a global and regional level and analyzed and reported together with publicly available information published by our competitors. While we believe the information contained in our surveys and competitor publications to be reliable, we have not independently verified the data or any assumptions from which our MCS is derived or on which the estimates they contain are based, and we do not make any representation as to the accuracy of such information.
Except as otherwise specified below, all patient and market data in this report have been derived using our MCS.Legal Matters – Reimbursement."
End-Stage Renal DiseaseOur Services, Products and Business Processes
ESRD is the stage of advanced chronic kidney disease characterized by the irreversible loss of kidney function and requires regular dialysis treatment or kidney transplantation to sustain life. A normally functioning human kidney removes waste products and excess water from the blood, which prevents toxin buildup, water overload and the eventual poisoning of the body. Most patients suffering from ESRD must rely on dialysis, which is the removal of toxic waste products and excess fluids from the body by artificial means. A number of conditions – diabetes, hypertension, glomerulonephritis and inherited diseases – can cause chronic kidney disease. The majority of people with ESRD acquire the disease as a complication of one or more of these primary conditions.
There are currently only two methods for treating ESRD: dialysis and kidney transplantation. ScarcityDue to the scarcity of compatible kidneys limits transplants. Therefore,for transplant, most patients suffering from ESRD rely on dialysis.
We estimate that atAt the end of 2014, there were approximately 3.372016, about 3.0 million ESRD patients worldwide, of which approximately 706,000 were living with a transplanted kidney.regularly underwent dialysis worldwide. For many years the number of donated organs worldwide has continued to be significantly lower than the number of patients on transplant waiting lists. Despite ongoing efforts by many regional initiatives to increase awareness of and willingness for kidney donation, the distribution of patientsdialysis treatment, we distinguish between the various treatment modes has remained nearly unchanged over the past ten years. In the U.S., approximately 32% of all ESRD patients live with a functioning kidney transplant and in Germany approximately 29% of all ESRD patients live with a functioning kidney transplant.
There are two major dialysis methods commonly used today,types: hemodialysis ("HD") and peritoneal dialysis ("PD"). These are described below under "Dialysis Treatment Options for ESRD." OfIn HD, a hemodialysis machine controls the estimated 2.67 million dialysis patients treated in 2014, approximately 2.38 million received HD and about 289,000 received PD. Generally, an ESRD patient's physician, in consultation withflow of blood from the patient, chooses the patient treatment method, whichblood is based on the patient's medical conditions and needs. The numbercleansed by means of dialysis patients grew by approximately 6% in 2014.a
The present annual patient growth rate in North America, the largest dialysis market, is approximately 4% per year, while in the International Segment we see average annual growth rates of approximately 6%. We believe that worldwide patient growth will continue at around 6% per year. At the end of 2014, there were approximately 596,000 patients in North America (including Mexico), approximately 666,000 patients in Europe, the Middle East and Africa, approximately 265,000 patients in Latin America (excluding Mexico), and approximately 1,138,000 patients in Asia.
In recent years, the gap between patient numbers and patient number growth rates reported by the two leading U.S. data sources has widened, accompanied by a significant time lag in reporting this data. The Company is currently analyzing this situation to determine if its methods for accumulating current U.S. market patient number estimates and projections should be refined. This could lead to a restatement of both reported patient numbers as well as growth rates for the North American market in the future. This will not impact the patients treated in the Company's facilities or the number of treatments performed by the Company.
Dialysis patient growth rates vary significantly from region to region. The U.S. and parts of Asia, as well as Western and Central Europe, where patients with terminal kidney failure have had readily available access to treatment, usually dialysis, for many years, all experience below average increases in the number of patients. In contrast, growth rates in the economically weaker regions were above average, reaching double digit figures in some cases. This indicates that accessibility to treatment is still somewhat limited in these countries, but is gradually improving.
We estimate that about 22% of worldwide patients are treated in North America and around 25% in Europe, the Middle East and Africa, approximately 10% in Latin America and approximately 43% in Asia-Pacific.
We believe that the continuing growth in the number of dialysis patients is principally attributable to:
specially designed filter known as a dialyzer and then pumped back into the body. With PD, the patient introduces a dialysis solution into his or her abdominal cavity and the patient's peritoneum is used as a dialyzing membrane. We provide dialysis services and products for both therapy methods. As a leading global healthcare company, we offer health care services and products in more than 120 countries around the world with a focus on the following areas:
Dialysis Treatment Options for ESRD
Hemodialysis. Hemodialysis removes toxins and excess fluids from the blood in a process in which the blood flows outside the body through plastic tubes known as bloodlines into a specially designed filter, called a dialyzer. The dialyzer separates waste products and excess water from the blood. Dialysis solution flowing through the dialyzer carries away the waste products and excess water, and supplements the blood with solutes which must be added due to renal failure. The treated blood is returned to the patient. The hemodialysis machine pumps blood, adds anti-coagulants, regulates the purification process and controls the mixing of dialysis solution and the rate of its flow through the system. This machine can also monitor and record the patient's vital signs.
The majority of hemodialysis patients receive treatment at outpatient dialysis clinics, such as ours, where hemodialysis treatments are performed with the assistance of a nurse or dialysis technician under the general supervision of a physician. Hemodialysis patients generally receive treatment three times per week, typically for three to five hours per treatment.
Patients can receive treatment at a clinic run by (1) a public center (government or government subsidiary owned/run), (2) a healthcare organization (non-profit organizations for public benefit purposes), (3) a private center (owned or run by individual doctors or a group of doctors) or (4) a company-owned clinic, including multi-clinic providers (owned or run by a company such as FMC-AG & Co. KGaA). The organization of the centers also differs significantly depending on whether the healthcare system in the relevant country is mainly state-run or privately operated. There were approximately 6,900 clinics in North America in 2014 with approximately 18% of patients receiving care in public centers. In 2014, there were approximately 10,600 dialysis clinics in Europe, the Middle East and Africa treating dialysis patients, where approximately 60% of dialysis patients received care through public centers, approximately 23% through private centers and approximately 17% through company-owned clinics, such as ours. In Latin America, there were 2,400 clinics where approximately 16% of all dialysis patients received care through public centers, 22% received care through company owned clinics and 62% received care through private centers. In Asia-Pacific, there were approximately 16,800 clinics where approximately 51% of all dialysis patients received care through public centers, 6% received care through company owned clinics and 43% received care through private centers.
Among company-owned clinics, the two largest providers are FMC-AG & Co. KGaA, caring for approximately 285,000 patients and DaVita, caring for approximately 178,000 patients at the end of 2014. All other company-owned clinics care for approximately 30,000 or less patients each.
Of the approximately 2.67 million patients who received dialysis care in 2014, more than 89% were treated with hemodialysis. Hemodialysis patients represented about 92% of all dialysis patients in the U.S., 92% in the E.U. and 88% in the rest of the world. Based on these data, it is clear that hemodialysis is the dominant therapy method worldwide.
Peritoneal Dialysis. Peritoneal dialysis removes toxins from the blood using the peritoneum, the membrane lining covering the internal organs located in the abdominal area, as a filter. Most peritoneal dialysis patients administer their own treatments in their own homes and workplaces, either by a treatment known as continuous ambulatory peritoneal dialysis ("CAPD") or automated peritoneal dialysis ("APD"), or by a treatment known as continuous cycling peritoneal dialysis ("CCPD"), also called automated peritoneal dialysis ("APD"). In both of these treatments, a surgically implanted catheter provides access to the peritoneal cavity. Using this catheter, the patient introduces a sterile dialysis solution from a solution bag through a tube into the peritoneal cavity. The peritoneum operates as the filtering membrane and, after a specified dwell time, the solution is drained and disposed. A typical CAPD peritoneal dialysis program involves the introduction and disposal of dialysis solution four times a day. With CCPD, a machine pumps or "cycles" solution to and from the patient's peritoneal cavity while the patient sleeps. During the day, one and a half to two liters of dialysis solution remain in the abdominal cavity of the patient. The human peritoneum can be used as a dialyzer only for a limited period of time, ideally only if the kidneys are still functioning to some extent.
Our Strategy and Competitive Strengths
Company Strategy
We focus our business activities on our patients' health and hence on the quality of treatment and our products with the objective of improving their quality of life and raising their life expectancy. Our aim is to maintain our position as the world's leading provider of dialysis treatment and products and to use that position as a basis for sustainable, profitable growth. In this way, we seek to continuously increase the enterprise value of the Company and create added value for patients, healthcare systems and investors worldwide.
Our strategy takes into account concrete, measurable growth targets as well as long-term trend forecasts in the dialysis market. The Management Board uses a number of different tools and indicators to evaluate our business performance, develop our strategy and make investment decisions. See Item 5, "Operating and Financial Review and Prospects." We expect not only the number of patients to increase but also the quality of services provided and of the products available to become even more important in the future with improved access to medical care. We believe comprehensive care, a more holistic approach to address the needs of our kidney patients, is another area that will continue to grow in the future. In response to this, we will not only focus our business on individual services or dialysis products, but also on combining the different areas of application related to dialysis, such as combining treatment concepts with dialysis drugs.
Pillars for Strategic Growth
We rely upon four strategic operational pillars that govern the Company's primary strategy and activities and position us to achieve our growth and profitability objectives. Our four strategic pillars are described below:
(1) Continuous Growth and Expansion
We are committed to shaping the development of the dialysis industry by giving more people access to life-saving dialysis treatment, as well as developing innovative products and therapies that improve our patients' quality of life. This includes our execution of strategic alliances with various healthcare institutions, which help to shape the development of the industry, while benefitting from the global growth of the market. To strengthen our market position, we have developed various approaches ranging from organic growth to the continuous assessment of acquisitions and partnerships that create synergies with our existing products and services.
To accomplish lasting, profitable growth we are also steering our business activities towards attractive future markets. This includes expanding our presence through public private partnerships ("PPP") in the dialysis business. We are already involved in several PPP initiatives in Europe, Africa, Asia and Australia with the intent to further expand these strategic alliances in the future.
(2) Development of New Business Areas
Our main focus continues to be on comprehensive care for dialysis patients and dialysis-related treatments. In many regions, in addition to our products and dialysis treatments, we offer an increasing amount of additional health care services which have been aligned in 2014 under the title Care Coordination, as described above. We continue to develop other services to meet the growing demand for the care of patients with chronic kidney disease. Care Coordination will also allow us to expand into new business areas and meet the growing demand for quality health care services, in general.
(3) Enhancing Products and Services
Our sustainable growth strategy includes the development of innovative products and continuous improvement for dialysis treatments. We benefit from the vertically-integrated structure of our Company, which enables our Research & Development division to apply our experience as the world's largest provider of dialysis treatments to product development, and our technical department benefits from our daily practical experience as a provider of dialysis treatment and being directly in-touch with doctors, nurses and patients to keep track of and meet customer and patient needs.
Chronic kidney failure is a global problem, with demand for improved, high-quality yet cost-efficient products growing worldwide. Our Global Research and Development department was reorganized in 2013.
The reorganization has leveraged synergies for product development that will allow us to address this global need. Our research also focuses on the vital aspects of the quality and safety of our products and services. This continued focus on quality makes us a reliable partner for patients, doctors, and care staff alike. We continue to operate local research and development sites in our global network which provides us with an advantage to familiarize ourselves with local requirements and respond to them quickly.
(4) Fostering Operational Excellence
In a challenging economic environment, we also place importance on enhancing our profitability in the long term, while positioning and managing the Company more efficiently. We consider this as we optimize and modernize our administrative structures and processes and make greater use of synergies, building on the benefits realized through the establishment of our Global Manufacturing Operations and Global Research & Development divisions. This will enable us to meet the increased demand for our products and services and create a flexible environment which fosters rapid response to changes in the dialysis market. At the same time, we have benefited, and will continue to benefit, from our decentralized structure, allowing us to remain a reliable local partner in patient treatment by providing quick responses to customer specific needs, and changes to local market and regulatory environment. We believe this flexibility coupled with our localized decision making structure helps us to gain access to new markets. Additionally, we launched a global efficiency program in 2013 with the aim of gaining Company-wide cost reductions. We expect these efficiencies to result in $300 million per year of sustained savings before tax beginning in 2017.
Vision 2020
Based on this strategic focus, we set new long-term targets in April 2014 and announced our growth strategy for 2020. This strategy aims to increase the Company's revenues to $28 billion by fiscal year 2020, corresponding to an average annual growth rate of approximately 10%. In addition to the growth of our core ESRD business, we expect this growth in revenue to be driven by Care Coordination. The percentage share of the Company's total net revenue attributable to Care Coordination is expected to rise from 7% in 2014 to approximately 18% in 2020. Overall growth in net revenue will be driven by both organic growth and through acquisitions.
Health Care Services – Dialysis Care
Dialysis Services
We provide dialysis treatment and related laboratory and diagnostic services through our global network of 3,361more than 3,600 outpatient dialysis clinics, 2,162 of which are in the North America Segment (including Mexico) and 1,199 of which are in more than 45 countries outside of North America. Our operations within the North America Segment generated 79% of our 2014 health care revenue and our operations outside the North America Segment generated 21%. Our dialysis clinics are generally concentrated in areas of high population density. In 2014, we acquired a total of 95 existing clinics, opened 79 new clinics and sold or consolidated 63 clinics. The number of patients we treat at our clinics worldwide increased by about 6%, from 270,122 at December 31, 2013 to 286,312 at December 31, 2014. For 2014, health care services accounted for 77% of our total revenue.
With our large patient population, we have developed proprietary patient statistical databases which enable us to improve dialysis treatment outcomes, and further improve the quality and effectiveness of dialysis products. We believe that local physicians, hospitals and managed care plans refer their ESRD patients to our clinics for treatment due to:
At our clinics, we provide hemodialysis treatments at individual stations through the use of dialysis machines and disposable products. AIn hemodialysis treatment, a nurse attachesconnects the patient to the dialysis machine with the necessary tubing, to the patient and the dialysis machineknown as bloodlines, and monitors the dialysis equipment and the patient's vital signs. The capacity of a clinic is a function of the number of stations and additional factors such factors as type of treatment, patient requirements, length of time per treatment, and local operating practices and ordinances regulating hours of operation.
Each of our dialysis clinics is under the general supervision of a physician medical director. (See "Patients, Physician and Other Relationships.") Each dialysis clinic also has an administrator or clinical manager who supervises the day-to-day operations of the facility and the staff. The staff typically consists of registered nurses and licensed practical nurses. Our North America Segment clinics also employ patient care technicians, a social worker, a registered dietician, a unit clerk and biomedical technicians, while in some countries within our International Segment, the staff also includes technicians, social workers and dieticians.
As part of the dialysis therapy, we provide a variety of services to ESRD patients at our dialysis clinics in the U.S. These services include administering erythropoietin stimulating agents, or ESAs, which are synthetic engineered hormones that stimulate the production of red blood cells. ESAs are used to treat anemia, a medical complication that ESRD patients frequently experience. We administer ESAs to most of our patients in the U.S. Any interruption in supply of ESAs could materially adversely affect our business, financial condition and results of operations. A material increase in our utilization or acquisition cost for EPOESAs without an increase in the Medicare ESRD PPSprospective payment system ("ESRD PPS") bundled reimbursement rate, could materially adversely affect our financial condition and results of operations.
Our clinics also offer services for home dialysis patients, the majority of whom receive peritonealPD dialysis treatment. For thosethese patients, we provide materials, training and patient support services, including clinical monitoring, follow-up assistance and arranging for delivery of the supplies to the patient's residence. (See "– Regulatory and Legal Matters – Reimbursement – U.S." for a discussion of the ESRD PPS and billing for these products and services.)
We also provide dialysis services under contract to hospitals in the U.S. on an "as needed" basis for hospitalized ESRD patients and for patients suffering from acute kidney failure. Acute kidney failure can result from trauma, or similar causes, and requires dialysis until the patient's kidneys recover their normal function. We serviceprovide services to these patients either at their bedside, using portable dialysis equipment, or at the hospital's dialysis site. Contracts with hospitals provide for payment at negotiated rates that are generally higher than the Medicare reimbursement rates for chronic in-clinic outpatient treatments.
Dialysis Products
Based on internal estimates prepared using our MCS (see "Major Markets and Competitive Position," below), publicly available market data and our data of significant competitors, we are the world's largest manufacturer and distributor of equipment and related products for hemodialysis and the second largest manufacturer and distributer of peritoneal dialysis products, measured by publicly reported revenues. We employsupply dialysis products to our dialysis clinics and we also sell our dialysis products directly and through distributors in more than 120 countries. Most of our customers are dialysis clinics. For the year 2016, dialysis products accounted for 19% of our total revenue.
We produce and distribute a centralized approachwide range of machines and disposables for HD, PD and acute dialysis. The following table shows the breakdown of our dialysis product revenues into sales of HD products, PD dialysis products and other dialysis products. The following amounts exclude intercompany product sales:
| | Year Ended December 31, | ||||||||||||||||||
|---|---|---|---|---|---|---|---|---|---|---|---|---|---|---|---|---|---|---|---|
| | 2016 | 2015 | 2014 | ||||||||||||||||
| | Total Product Revenues | % of Total | Total Product Revenues | % of Total | Total Product Revenues | % of Total | |||||||||||||
| | (in millions) | ||||||||||||||||||
Hemodialysis Products | $ | 2,790 | 82 | $ | 2,722 | 81 | $ | 2,904 | 81 | ||||||||||
Peritoneal Dialysis Products | 385 | 11 | 385 | 12 | 427 | 12 | |||||||||||||
Other | 217 | 7 | 239 | 7 | 251 | 7 | |||||||||||||
| | | | | | | | | | | | | | | | | | | | |
Total | $ | 3,392 | 100 | $ | 3,346 | 100 | $ | 3,582 | 100 | ||||||||||
| | | | | | | | | | | | | | | | | | | | |
| | | | | | | | | | | | | | | | | | | | |
| | | | | | | | | | | | | | | | | | | | |
Hemodialysis Products
Our advanced line of hemodialysis machines includes three series. We developed the 4008 and 5008 Series for our markets outside of North America and the 2008 Series for the North American market. In 2016, we introduced the series 6008 with the launch of our 6008 CAREsystem (see Item 5.VII, "Operating and Financial Review and Prospects – Research and Development"). Our various models of these machine series utilize our latest research and development efforts to improve the dialysis process for our patients. Examples of these improvements include the addition of Clinical Data eXchange™ (CDX), which allows the clinician to access MIS (Medical Information System) data directly from the dialysis station. In addition, the 2008K@home Wet Alert option provides a wireless wetness detector for the identification of blood leakage during dialysis.
Other features of our dialysis machines include:
Dialyzers
Dialyzers are specialized filters that remove waste products, toxins and excess water from the blood during dialysis. We estimate that we are the leading worldwide producer of polysulfone dialyzers. We manufacture our F-Series and premium FX class® series of dialyzers and our Optiflux® polysulfone single-use dialyzer using hollow fiber Fresenius Polysulfone® and Helixone® membranes from synthetic materials. Our FX CorDiax dialyzer contains the Helixone®plus high performance membrane. The Helixone®plus membrane selectively filters out toxins such as phosphates to reduce the risk of cardiovascular disease.
Peritoneal Dialysis Products
We offer a full line of peritoneal dialysis systems and solutions for both CAPD and APD treatments.
CAPD Therapy: The stay·safe® system has been specifically designed to help patients with their daily self-care CAPD treatment in a safe and convenient way. Our CAPD products have a number of advantages for patients including:
APD Therapy: The effectiveness of APD therapy depends on the solution dwell time in the abdomen, the composition of the solution used, the volume of solution and the duration of the treatment, usually 8 - 10 hours. APD using our product line, which includes oursleep·safe cycler, sleep·safe harmony cycler and Liberty® cycler, offers a number of benefits to PD patients:
Renal Pharmaceuticals
We continue to develop, acquire and in-license renal pharmaceuticals to improve dialysis treatment for our patients. Below are the primary renal pharmaceuticals we have developed or for which we have obtained licenses for use:
PhosLo®
In November 2006, we acquired PhosLo®, a calcium-based phosphate binder. We have received approval of PhosLo® in selected European countries. In October 2008, a competitive generic phosphate binder was introduced in the U.S. with respectmarket, which reduced our PhosLo® sales in 2009. In October 2009, we launched an authorized generic version of PhosLo® to certain administrative functions commoncompete in the generic calcium acetate market. In April 2011, the FDA approved our New Drug Application (NDA) for Phoslyra®, a liquid formulation of PhosLo®, and we continue to our operations. For example, each dialysis clinic uses our proprietary manuals containing our standardized operatingcommercialize this product in the U.S. market.
Venofer® and billing procedures. We believe that centralizing and standardizing these functions enhance our ability to perform services on a cost-effective basis.Ferinject®
The mannerIn 2008, we entered into two separate and independent license and distribution agreements, one for certain countries in which each clinic conducts its business depends, in large part, upon applicable laws, rulesEurope and regulationsthe Middle East (with Galenica AG and Vifor (International) AG) and one for the U.S. (with Luitpold Pharmaceuticals Inc. and American Regent, Inc.), to market and distribute intravenous iron products, such as Venofer® (iron sucrose) and Ferinject® (ferric carboxymaltose) (outside of the jurisdiction in which the clinic is located,U.S.). Both drugs are used to treat iron deficiency anemia experienced by non-dialysis CKD (chronic kidney disease) patients as well as dialysis patients. Venofer® is the leading intravenous iron product worldwide. The first agreement concerns all commercialization activities for these intravenous iron products in the field of dialysis and became effective on January 1, 2009. In North America, a separate license agreement effective November 1, 2008 provides our clinical policies. However,subsidiary Fresenius USA Manufacturing Inc. ("FUSA") with exclusive rights to manufacture and distribute Venofer® to freestanding (non-hospital based) U.S. dialysis facilities and, in addition, grants FUSA similar rights for certain new formulations of the drug. The U.S. license agreement has a patient's attending physician, who may be the clinic's medical director or an unaffiliated physician with staff privileges at the clinic,term of ten years and includes FUSA extension options. The international agreement has medical discretion to prescribe the particular treatment modality and medications for that patient. Similarly, the attending physician has discretion in prescribing particular medical products, although the clinic typically purchases equipment, regardlessa term of brand, in consultation with its medical director.20 years.
In December 2010, we announced the more than 45 countriesexpansion of our agreements with Galenica by forming a new renal pharmaceutical company, VFMCRP, with the intention to develop and distribute products to treat iron deficiency anemia and bone mineral metabolism for pre-dialysis and dialysis patients. FMC-AG & Co. KGaA owns 45% of the company which is headquartered in Switzerland. Galenica contributed licenses (or the commercial benefit in the U.S.) to its Venofer® and Ferinject® products for use in the dialysis and pre-dialysis market (CKD stages III to V). Vifor Pharma, the pharmaceutical division of Galenica and its existing key affiliates or partners retain the responsibility for commercialization of both of these products outside the renal field.
Velphoro®
As part of the agreement to create VFMCRP, Galenica also contributed to the new company the asset (excluding Japan) Velphoro®, a novel iron-based phosphate binder. Fresenius Medical Care North America ("FMCNA") markets the product on behalf of VFMCRP in which we currently operate or manage dialysis clinics we face legal, regulatorythe U.S. and economic environments varying significantly from country to country. These individual environments can affect all aspectscommercial sales of providing dialysis services including our legal status,Velphoro® commenced in the extent to which we can provide dialysis services,first quarter of 2014 in the way we have to organize these servicesU.S. market. The product for the U.S. market is supplied by an FDA approved, Vifor manufacturing facility in Switzerland and the system under which we are reimbursed. (See "– Regulatory and Legal Matters – Reimbursement – International (Including Germany and Other Non-U.S.)" for further discussion of reimbursement.) Our approach to managing this complexity utilizes local management to ensure the strict adherence to the individual country rules and regulations and international functional departments supporting country management with processes and guidelines enabling the delivery of the highest possible quality level of dialysis treatment. We believe that with this bi-dimensional organization we will be able to provide superior care to dialysis patients under the varying local frameworks leading to improved patient well-being and to lower social cost.an FDA approved contract
manufacturer also located in Switzerland. Velphoro has also been approved in Europe via the central approval process and has been commercially launched in Germany, the United Kingdom, Sweden, Denmark, the Netherlands, Belgium and Switzerland. Velphoro has also been approved in France, Italy and Spain. The VFMCRP partner Kissei also received approval from the Ministry of Health, Labour and Welfare in Japan during 2015 for the product which is marketed in Japan under the brand name P-TOL.
OsvaRen® and Phosphosorb®
In June 2015, we further developed our joint venture, VFMCRP, with Galenica. In addition to the iron replacement products Ferinject® and Venofer® for use in nephrology indications as well as the phosphate binder Velphoro® in our shared product portfolio, VFMCRP acquired nephrology medicines commercialized by us, including the phosphate binders OsvaRen® and Phosphosorb®. The transfer of the marketing rights was largely completed during the fourth quarter of 2015, allowing the joint venture to further develop its sales and marketing in key European markets.Other Health For more information on the transfer please see Note 2 in the Notes to the Consolidated Financial Statements, "Related Party Transactions," included in this report.
Care ServicesCoordination
Laboratory Services
Through Spectra Laboratories ("Spectra") and Shiel Laboratories ("Shiel") weWe provide full service laboratories that support the needs of our patients in the U.S. and we also provide laboratory testing for others in the U.S. Spectra provides blood, urine and other bodily fluid testing services to determine the appropriate individual dialysis therapy for a patient and to assist physicians in determining whether a dialysis patient's therapy regimen, diet and medicines remain optimal. Shiel expands our laboratory services to include general testing, clinical anatomic pathology and molecular testing for health care providers in the New York region.
Pharmacy Services
We offer pharmacy services, mainly in the U.S. These services include deliveringproviding renal medications and supplies to the homes of patients or to their dialysis clinic directly from renal pharmacists who are specially trained in treating and counseling patients living with kidney disease. We also actively support education and compliance with phosphate binders and other medications for bone and mineral metabolism.
Vascular, Cardiovascular and Endovascular Specialty Services
We haveoperate vascular access centers mainly in the U.S. but we also operate clinics in Portugal and Taiwan. Dialysis requires access to the bloodstream, which is accomplished by catheters, grafts, or arteriovenous fistulas. Patients receiving hemodialysis need to have a vascular access site put inimplanted before their dialysis therapy starts in order forto enable their blood to exit their bodies to our dialysis machines for cleansing and to filter their blood and return the newly cleaned blood into their bodies. Vascular access is necessary because human veins are too small; the surgery usually joins together an artery and a vein to create a vein strong enough to receive the hemodialysis needles. In addition, the vascular access centers provide services to address peripheral artery disease, which is common in dialysis patients. As a result of an acquisition in 2014, we expandedAdditionally, our vascular access services toinclude both cardiovascular and endovascular specialty services. Cardiovascular procedures are similar to the vascular access procedures discussed above with a focus on treatment for heart disease, while endovascular surgical procedures are minimally invasive and designed to access many regions of the body via major blood vessels and assist in both the maintenance of hemodialysis accesses and other non-dialysis medical operations.
HospitalistDialysis Products
Based on internal estimates prepared using our MCS (see "Major Markets and Intensivist ServicesCompetitive Position," below), publicly available market data and our data of significant competitors, we are the world's largest manufacturer and distributor of equipment and related products for hemodialysis and the second largest manufacturer and distributer of peritoneal dialysis products, measured by publicly reported revenues. We supply dialysis products to our dialysis clinics and we also sell our dialysis products directly and through distributors in more than 120 countries. Most of our customers are dialysis clinics. For the year 2016, dialysis products accounted for 19% of our total revenue.
We produce and distribute a wide range of machines and disposables for HD, PD and acute dialysis. The following table shows the breakdown of our dialysis product revenues into sales of HD products, PD dialysis products and other dialysis products. The following amounts exclude intercompany product sales:
| | Year Ended December 31, | ||||||||||||||||||
|---|---|---|---|---|---|---|---|---|---|---|---|---|---|---|---|---|---|---|---|
| | 2016 | 2015 | 2014 | ||||||||||||||||
| | Total Product Revenues | % of Total | Total Product Revenues | % of Total | Total Product Revenues | % of Total | |||||||||||||
| | (in millions) | ||||||||||||||||||
Hemodialysis Products | $ | 2,790 | 82 | $ | 2,722 | 81 | $ | 2,904 | 81 | ||||||||||
Peritoneal Dialysis Products | 385 | 11 | 385 | 12 | 427 | 12 | |||||||||||||
Other | 217 | 7 | 239 | 7 | 251 | 7 | |||||||||||||
| | | | | | | | | | | | | | | | | | | | |
Total | $ | 3,392 | 100 | $ | 3,346 | 100 | $ | 3,582 | 100 | ||||||||||
| | | | | | | | | | | | | | | | | | | | |
| | | | | | | | | | | | | | | | | | | | |
| | | | | | | | | | | | | | | | | | | | |
Hemodialysis Products
Our advanced line of hemodialysis machines includes three series. We developed the 4008 and 5008 Series for our markets outside of North America and the 2008 Series for the North American market. In 2016, we introduced the series 6008 with the launch of our 6008 CAREsystem (see Item 5.VII, "Operating and Financial Review and Prospects – Research and Development"). Our various models of these machine series utilize our latest research and development efforts to improve the dialysis process for our patients. Examples of these improvements include the addition of Clinical Data eXchange™ (CDX), which allows the clinician to access MIS (Medical Information System) data directly from the dialysis station. In addition, the 2008K@home Wet Alert option provides a wireless wetness detector for the identification of blood leakage during dialysis.
Other features of our dialysis machines include:
Dialyzers
Dialyzers are specialized filters that remove waste products, toxins and excess water from the blood during dialysis. We estimate that we are the leading worldwide producer of polysulfone dialyzers. We manufacture our F-Series and premium FX class® series of dialyzers and our Optiflux® polysulfone single-use dialyzer using hollow fiber Fresenius Polysulfone® and Helixone® membranes from synthetic materials. Our FX CorDiax dialyzer contains the Helixone®plus high performance membrane. The Helixone®plus membrane selectively filters out toxins such as phosphates to reduce the risk of cardiovascular disease.
Peritoneal Dialysis Products
We offer a full line of peritoneal dialysis systems and solutions for both CAPD and APD treatments.
CAPD Therapy: The stay·safe® system has been specifically designed to help patients with their daily self-care CAPD treatment in a safe and convenient way. Our CAPD products have a number of advantages for patients including:
APD Therapy: The effectiveness of APD therapy depends on the solution dwell time in the abdomen, the composition of the solution used, the volume of solution and the duration of the treatment, usually 8 - 10 hours. APD using our product line, which includes oursleep·safe cycler, sleep·safe harmony cycler and Liberty® cycler, offers a number of benefits to PD patients:
Renal Pharmaceuticals
We continue to develop, acquire and in-license renal pharmaceuticals to improve dialysis treatment for our patients. Below are the primary renal pharmaceuticals we have developed or for which we have obtained licenses for use:
PhosLo®
In November 2006, we acquired PhosLo®, a calcium-based phosphate binder. We have received approval of PhosLo® in selected European countries. In October 2008, a competitive generic phosphate binder was introduced in the U.S. through acquisitions mademarket, which reduced our PhosLo® sales in 2014, including2009. In October 2009, we launched an authorized generic version of PhosLo® to compete in the generic calcium acetate market. In April 2011, the FDA approved our acquisitionNew Drug Application (NDA) for Phoslyra®, a liquid formulation of PhosLo®, and we continue to commercialize this product in the U.S. market.
Venofer® and Ferinject®
In 2008, we entered into two separate and independent license and distribution agreements, one for certain countries in Europe and the Middle East (with Galenica AG and Vifor (International) AG) and one for the U.S. (with Luitpold Pharmaceuticals Inc. and American Regent, Inc.), to market and distribute intravenous iron products, such as Venofer® (iron sucrose) and Ferinject® (ferric carboxymaltose) (outside of the U.S.). Both drugs are used to treat iron deficiency anemia experienced by non-dialysis CKD (chronic kidney disease) patients as well as dialysis patients. Venofer® is the leading intravenous iron product worldwide. The first agreement concerns all commercialization activities for these intravenous iron products in the field of dialysis and became effective on January 1, 2009. In North America, a controlling interestseparate license agreement effective November 1, 2008 provides our subsidiary Fresenius USA Manufacturing Inc. ("FUSA") with exclusive rights to manufacture and distribute Venofer® to freestanding (non-hospital based) U.S. dialysis facilities and, in Sound. Sound works with physician partners providing care in hospitalsaddition, grants FUSA similar rights for certain new formulations of the drug. The U.S. license agreement has a term of ten years and post-acute care centers acrossincludes FUSA extension options. The international agreement has a term of 20 years.
In December 2010, we announced the United States. It has pioneered a consistent, patient-centered approach that relies on experienced physician leadership and a web-based workflow platform. On November 21, 2014, Sound acquired Cogent. This acquisition expands our hospitalist services and further positions us to leverage our network of health care centers, renal pharmacy and full service and specialty laboratories to help us better address the full spectrumexpansion of our patients' health care needs. The acquisitionagreements with Galenica by forming a new renal pharmaceutical company, VFMCRP, with the intention to develop and distribute products to treat iron deficiency anemia and bone mineral metabolism for pre-dialysis and dialysis patients. FMC-AG & Co. KGaA owns 45% of Cogent incorporates more than 650 providers who offer hospitalist and intensivist services to more than 80 hospitals throughout the United States. Combined,company which is headquartered in Switzerland. Galenica contributed licenses (or the expanded Sound Physicians organization will now serve over 180 hospitals in 35 states with more than 1,750 providers including physicians and advanced care practitioners focusing on the general medical care of hospitalized patients and the care of critically ill patients, usuallycommercial benefit in the intensive care unit (ICU)U.S.) to its Venofer® and Ferinject® products for use in the caredialysis and pre-dialysis market (CKD stages III to V). Vifor Pharma, the pharmaceutical division of patientsGalenica and its existing key affiliates or partners retain the responsibility for commercialization of both of these products outside the renal field.
Velphoro®
As part of the agreement to create VFMCRP, Galenica also contributed to the new company the asset (excluding Japan) Velphoro®, a novel iron-based phosphate binder. Fresenius Medical Care North America ("FMCNA") markets the product on behalf of VFMCRP in post-acute centers.the U.S. and commercial sales of Velphoro® commenced in the first quarter of 2014 in the U.S. market. The product for the U.S. market is supplied by an FDA approved, Vifor manufacturing facility in Switzerland and an FDA approved contract
manufacturer also located in Switzerland. Velphoro has also been approved in Europe via the central approval process and has been commercially launched in Germany, the United Kingdom, Sweden, Denmark, the Netherlands, Belgium and Switzerland. Velphoro has also been approved in France, Italy and Spain. The VFMCRP partner Kissei also received approval from the Ministry of Health, Labour and Welfare in Japan during 2015 for the product which is marketed in Japan under the brand name P-TOL.
Capital ExpendituresOsvaRen® and Phosphosorb®
We invested, In June 2015, we further developed our joint venture, VFMCRP, with Galenica. In addition to the iron replacement products Ferinject® and Venofer® for use in nephrology indications as well as the phosphate binder Velphoro® in our shared product portfolio, VFMCRP acquired nephrology medicines commercialized by operating segmentus, including the phosphate binders OsvaRen® and Corporate,Phosphosorb®. The transfer of the gross amounts shown in the table belowmarketing rights was largely completed during the twelve month periods ended December 31, 2014, 2013,fourth quarter of 2015, allowing the joint venture to further develop its sales and 2012.
| | Actual | |||||||||
|---|---|---|---|---|---|---|---|---|---|---|
| | 2014 | 2013 | 2012 | |||||||
| | (in millions) | |||||||||
Capital expenditures for property, plant and equipment | ||||||||||
North America | $ | 404 | $ | 377 | $ | 299 | ||||
International | 238 | 205 | 203 | |||||||
Corporate | 290 | 166 | 173 | |||||||
| | | | | | | | | | | |
Total Capital Expenditures | $ | 932 | $ | 748 | $ | 675 | ||||
| | | | | | | | | | | |
| | | | | | | | | | | |
| | | | | | | | | | | |
Acquisitions and Investments | ||||||||||
North America | $ | 1,638 | $ | 461 | $ | 1,849 | ||||
International | 347 | 100 | 35 | |||||||
Corporate | 2 | 2 | 2 | |||||||
| | | | | | | | | | | |
Total Acquisitions and Investments | $ | 1,987 | $ | 563 | $ | 1,886 | ||||
| | | | | | | | | | | |
| | | | | | | | | | | |
| | | | | | | | | | | |
For additionalmarketing in key European markets.For more information regarding our capital expenditures,on the transfer please see Item 4. B, "Business Overview – Acquisitions and Investments" and Item 5.B, "Operating and Financial Review and Prospects – Liquidity and Capital Resources"
Acquisitions and Investments
A significant factor in the growth in our revenue and operating earnings in prior years has been our ability to acquire healthcare businesses, particularly dialysis clinics, on reasonable terms. Worldwide, physicians own many dialysis clinics that are potential acquisition candidates for us. In the U.S., doctors might decide to sell their clinics to obtain relief from day-to-day administrative responsibilities and changing governmental regulations, to focus on patient care and to realize a return on their investment. Outside of the U.S., doctors might determine to sell to us and/or enter into joint ventures or other relationships with us to achieve the same goals and to gain a partner with extensive expertise in dialysis products and services. Privatization of health care in Eastern Europe and Asia could present additional acquisition opportunities. We believe we are also viewed as a valuable strategic health care partner outside the dialysis business due to our experience in managing chronic disease for dialysis patients and our record of improving quality and patient satisfaction and reducing the overall cost of care, and our leadership in advancing innovation and improvement in health care.
During 2014 and 2013, we had total cash and non-cash acquisitions and investments of $1,987 million and $563 million, respectively. Of the total 2014 acquisitions and investments, we completed investments to become majority shareholder of Sound, which itself acquired Cogent to expand further into hospitalist and intensivist services, and we acquired NCP to expand our services into cardiovascular and endovascular specialty services, (see "– Other Health Care Services" and Note 2 ofin the Notes to the Consolidated Financial Statements, "Acquisitions, Investments"Related Party Transactions," included in this report.
Care Coordination
Laboratory Services
We provide general testing, clinical anatomic pathology and Purchases of Intangible Assets").molecular testing for health care providers in the New York region.
Pharmacy Services
We acquired urgent care centersoffer pharmacy services, mainly in the U.S. These services include providing renal medications and continuedsupplies to enhance our presence outsidethe homes of patients or to their dialysis clinic directly from renal pharmacists who are specially trained in treating and counseling patients living with kidney disease.
Vascular, Cardiovascular and Endovascular Specialty Services
We operate vascular access centers mainly in the U.S. In 2013,Patients receiving hemodialysis need to have a vascular access site implanted before their dialysis therapy starts to enable their blood to exit their bodies to our investments primarily consisted of an investment-type loan granteddialysis machines for cleansing and to a middle market dialysis provider (see Note 8 ofreturn the Notesnewly cleaned blood into their bodies. Additionally, our vascular access services include both cardiovascular and endovascular specialty services. Cardiovascular procedures are similar to the Consolidated Financial Statements, "Other Assets and Notes Receivables"). For further discussion of our 2014 acquisitions and investments, see "Information on the Company – History and Development of the Company – History,"vascular access procedures discussed above and "– Our Strategy and Competitive Strengths – Pillars for Strategic Growth- (1) Continuous Growth and Expansion" above.
Quality Assurance and Quality Management in Dialysis Care
Our clinics work in conformance with the generally accepted quality standards of the industry, particularly the KDOQI (Kidney Disease Outcomes Quality Initiative) guidelines from the United States, the European ERBP standard (European Renal Best Practice) and increasingly, the KDIGO (Kidney Disease: Improving Global Outcomes), an industry initiative for global clinical practice guidelines. Clinical data management systems are used to routinely collect certain medical parameters, which we evaluate in anonymized form in compliance with these guidelines.
To evaluate the quality of our dialysis treatments, we use quality parameters that are generally recognized by the dialysis industry, such as hemoglobin values. In cooperation with responsible nephrologists, we aim to achieve a defined hemoglobin level for our patients. The kt/v value, which represents the volume of fluid completely cleared of urea during a single treatment divided by the volume of water a patient's body contains, gives an indication of the filtering performance of a treatment by establishing the ratio of the length of treatment and the filtration rate of certain toxic molecules. Albumin, a protein, is one quality parameter used to monitor a patient's general nutritional condition. Hospitalization days are another important indicator of the treatment quality, as a reduction of days hospitalized is viewed as an increase in the quality of care.
In our EMEA region our quality management activities are primarily focused on comprehensive development and implementation of a Healthcare Services Quality Management System as part of an Integrated Management System ("IMS"). Our goals in this area include meeting quality requirements for our dialysis clinics and environmental concerns. This approach results in an IMS structure that closely reflects existing corporate processes. We are also able to use the IMS to fulfill many legal and normative regulations covering service lines. In addition, the IMS standard offers a highly flexible structure that allows us to adapt to future regulations. Our IMS fulfills the ISO-Norm 9001:2008 requirements for quality management systems and links it with the ISO-Norm 14001:2004 for environmental management systems. At the same time, the IMS conforms to the medical devices requirements of ISO-Norm 13485:2003.
Our dialysis clinics' processes and documentation are regularly inspected by internal auditors and external parties. The underlying quality management system is certified and found to be in compliance with relevant regulations, requirements and company policies. Currently, dialysis clinics in 17 countries within our European region have quality management systems which are certified according to the quality management standard ISO 9001:2008.
Additionally, we have a comprehensive program, NephroCare Excellence, in our European region. NephroCare is our service that provides complete life-saving treatments for renal failure at the point of care using advanced technologies and listening to and understanding our patients' needs to enable the best therapies, ensure a high-quality of care and empower patients. Our NephroCare Excellence program brings together in one comprehensive program all of our quality and efficiency standards as well as proven best practices from different countries. The program is designed to support more than 30 individual countries in introducing NephroCare's quality standards and tools to all clinics efficiently, systematically and within a defined timeframe. Our goal is to harmonize the routines in our network of clinics, to make sure that clinic employees identify with the values of NephroCare, and to foster awareness of the NephroCare brand and of our commitment to enabling affordable renal replacement therapy for the different healthcare authorities worldwide.
The UltraCare® program of our North America Segment dialysis services group represents our commitment to deliver excellent care to patients through innovative programs, state-of-the art technology, continuous quality improvement and a focus on superior patient service. It combines our latest product technology with our highly trainedtreatment for heart disease, while endovascular surgical procedures are minimally invasive and skilled staffdesigned to offer our patients what we believe is a superior levelaccess many regions of care. The basis for this form of treatment is the Optiflux® polysulfone single-use dialyzer. Optiflux® single use dialyzers are combined with our 2008™ Hemodialysis Delivery System series, which has advanced online patient monitoringbody via major blood vessels and Ultra Pure Dialysate, all of which we feel improve mortality rates and increase the quality of patient care. The UltraCare® program also utilizes several systems to allow the tailoring of treatment to meet individual patient needs. Among the other capabilities of this system, staff will be alerted if toxin clearance is less than the target prescribed for the patient, and treatment can be adjusted accordingly. The UltraCare® program also includes an annual training program for staff recertification. Additionally, the UltraCare® at Home™ emphasizes patient-centered care: offering the full range of treatment modalities coupled with superior customer service for patients desiring care in the home setting.
At each of our North America Segment dialysis clinics, a quality assurance committee is responsible for reviewing quality of care data, setting goals for quality enhancement and monitoring the progress of quality assurance initiatives. We believe that we enjoy a reputation of providing high quality care to dialysis patients. In 2014, we continued to develop and implement programs to assist in achieving our quality goals. Our Access Intervention Management Program detects and corrects arteriovenous access failure inboth the maintenance of hemodialysis treatment and the percentage of patients who use catheters, which is the major cause of hospitalization and morbidity.
Our principal focus of our research and development activities is the development of new products, technologies and treatment concepts to optimize treatment quality and safety for dialysis patients. See Item 5.C, "Operating and Financial Review and Prospects – Research and Development."
The Medicare Improvements for Patients and Providers Act of 2008 ("MIPPA") created the ESRD quality incentive program under which dialysis facilities that fail to achieve quality standards established by CMS could have payments reduced by up to 2%. See Item 5, "Operating and Financial Review and Prospects – Overview."
Sources of U.S. Patient Services Net Revenue
The following table provides information for the years ended December 31, 2014, 2013 and 2012 regarding the percentage of our U.S. patient service net revenues from (a) the Medicare ESRD program, (b) private/alternative payors, such as commercial insurance and private funds, (c) Medicaidaccesses and other government sources and (d) hospitals.
| | Year Ended December 31, | |||||||||
|---|---|---|---|---|---|---|---|---|---|---|
| | 2014 | 2013 | 2012 | |||||||
Medicare program | 47.5% | 49.4% | 48.0% | |||||||
Private / alternative payors | 43.1% | 42.6% | 42.6% | |||||||
Medicaid and other government sources | 3.5% | 3.3% | 4.5% | |||||||
Hospitals | 5.9% | 4.7% | 4.9% | |||||||
| | | | | | | | | | | |
Total | 100.0% | 100.0% | 100.0% | |||||||
| | | | | | | | | | | |
| | | | | | | | | | | |
| | | | | | | | | | | |
Under the Medicare ESRD program, Medicare reimburses dialysis providers for the treatment of certain individuals who are diagnosed as having ESRD, regardless of age or financial circumstances. See "Regulatory and Legal Matters – Reimbursement."non-dialysis medical operations.
Patient, Physician and Other Relationships
We believe that our success in establishing and maintaining health care centers, both in the U.S. and in other countries depends significantly on our ability to obtain the acceptance of and referrals from local physicians, hospitals and managed care plans. In nearly all our dialysis clinics, local doctors, who specialize in the treatment of renal patients (nephrologists) act as practitioners. A dialysis patient generally seeks treatment at a conveniently located clinic at which the patient's nephrologist has staff privileges. Our ability to provide high-quality dialysis care and to fulfill the requirements of patients and doctors depends significantly on our ability to enlist nephrologists for our dialysis clinics and receive referrals from nephrologists, hospitals and general practitioners.
Medicare ESRD program reimbursement regulations require that a medical director generally supervise treatment at a dialysis clinic. Generally, the medical director must be board certified or board eligible in internal medicine or pediatrics, have completed a board-approved training program in nephrology and have at least twelve months of experience providing care to patients undergoing dialysis. Our medical directors also generally maintain their own private practices. We have entered into written agreements with physicians who serve as medical directors in our clinics. In the North America Segment, these agreements generally have an initial term between five to ten years. The compensation of our medical directors and other contracted physicians is negotiated individually and depends in general on local factors such as competition, the professional qualification of the physicians, the physicians' experience and tasks as well as the size and the offered services of the clinic. The total annual compensation of the medical directors and the other contracted physicians is stipulated at least one year in advance and the medical directors agree to seek to continue to improve efficiency and quality. We believe that the compensation of our medical directors is in line with the market.
Almost all contracts we enter into with our medical directors in the United States, as well as the typical contracts which we obtain when acquiring existing clinics, contain non-competition clauses concerning certain activities in defined areas for a defined period to time. These clauses do not enjoin the physicians from performing patient services directly at other locations/areas or referring patients to other facilities. We do not require physicians to send patients to us or to specific clinics.
In addition to the dialysis clinics, a number of our other health care centers employ or contract with physicians to provide professional services. We have financial relationships with these physicians in the
form of compensation arrangements for the services rendered. These contractual arrangements are designed to comply with federal and state laws applicable to financial relationships with physicians, such as the Stark Law and the Anti-Kickback Statute. In addition to these legal requirements, we face competition from other communities and facilities for these physicians, which continues while the physician is practicing at one of our centers.
A number of the dialysis clinics and other health care centers we operate are owned, or managed, by joint ventures in which we hold a controlling interest and one or more hospitals, physicians or physician practice groups hold a minority interest. We also have agreements with physicians to provide management and administrative services at health care centers in which physicians or physicians groups hold an ownership interest and agreements with physicians to provide professional services at such health care centers. While we have structured our joint ventures to comply with many of the criteria for safe harbor protection under the U.S. Federal Anti-Kickback Statute, our investments in these joint venture arrangements and administrative service agreements do not satisfy all the elements of such safe harbors.
Competition
Health Care Services. Our largest competitors in the North America Segment are DaVita HealthCare Partners, Inc., and US Renal Care, Inc. and, in our International Segment, our largest competitors are Diaverum and Kuratorium für Heimdialyse in Europe and Showai-Kai in Asia-Pacific, and Baxter International Inc. and Diaverum in Latin America. Ownership of dialysis clinics in the U.S. consists of a small number of larger company-owned, multi-clinic providers who own the majority of U.S. clinics, of which the Company and DaVita HealthCare Partners are the largest and a large number of company-owned clinic providers, each owning ten or fewer clinics. Over the last decade the dialysis industry has been characterized by ongoing consolidations. Internationally, the dialysis services market is much more fragmented, with a higher degree of public ownership in many countries.
Many of our clinics are in urban areas, where there frequently are many competing clinics in proximity to our clinics. We experience direct competition from time to time from former medical directors, former employees or referring physicians who establish their own clinics. Furthermore, other health care providers or product manufacturers, some of which have significant operations, may decide to enter the dialysis business in the future.
Because in the U.S. government programs are the primary source of reimbursement for services to the majority of patients, competition for patients in the U.S. is based primarily on quality and accessibility of service and the ability to obtain admissions from physicians with privileges at the facilities. However, the extension of periods during which commercial insurers are primarily responsible for reimbursement and the growth of managed care have placed greater emphasis on service costs for patients insured with private insurance.
In most countries other than the U.S., we compete primarily against individual freestanding clinics and hospital-based clinics. In many of these countries, especially the developed countries, governments directly or indirectly regulate prices and the opening of new clinics. Providers compete in all countries primarily on the basis of quality and availability of service and the development and maintenance of relationships with referring physicians.
Laboratory Services. Spectra competes in the U.S. with large nationwide laboratories, dedicated dialysis laboratories and numerous local and regional laboratories, including hospital laboratories. In the laboratory services market, companies compete on the basis of performance, including quality of laboratory testing, timeliness of reporting test results and cost-effectiveness. We believe that our services are competitive in these areas.
Dialysis Products
Based on internal estimates prepared using our MCS (see "Major Markets and Competitive Position," below), publicly available market data and our data of significant competitors, we are the world's largest manufacturer and distributor of equipment and related products for hemodialysis and the second largest manufacturer and distributer of peritoneal dialysis products, measured by publicly reported revenues. We supply dialysis products to our dialysis clinics and we also sell our dialysis products directly and through distributors in more than 120 countries. Most of our customers are dialysis clinics. For the year 2014,2016, dialysis products accounted for 23%19% of our total revenue.
We produce and distribute a wide range of machines and disposables for HD, PD and acute dialysis:
Our product business also includes adsorbers, which are specialized filters used in other extracorporeal therapies. In addition we sell products from other producers, including specific instruments for vascular access as well as other supplies, such as bandages, clamps and injections. We also include our PhosLo®, Phoslyra®, Velphoro® and Venofer® pharmaceuticals and sales of other renal pharmaceutical products as part of our dialysis product revenues. Our Body Composition Monitor is also sold as part of both our peritoneal and hemodialysis products. The Body Composition Monitor is used for home dialysis to determine a patient's body composition (water, body mass and fat) which assesses a patient's hydration state to assist in determining the patient's therapy
The markets in which we sell our dialysis products are highly competitive. The two largest manufacturers of dialysis products accounted for approximately 63% of the worldwide market in 2014. As the market leader in dialysis products, we had an approximately 34% market share. We estimate that in 2014, we supplied approximately 44% of global dialyzer production and approximately 50% of all HD machines sold worldwide. We estimate that our market share for PD products sold worldwide in 2014 was 21%.
Overview
dialysis. The following table shows the breakdown of our dialysis product revenues into sales of hemodialysisHD products, peritonealPD dialysis products and other dialysis products. The following amounts are exclusive ofexclude intercompany product sales:
| | Year Ended December 31, | Year Ended December 31, | ||||||||||||||||||||||||||||||||||||
|---|---|---|---|---|---|---|---|---|---|---|---|---|---|---|---|---|---|---|---|---|---|---|---|---|---|---|---|---|---|---|---|---|---|---|---|---|---|---|
| | 2014 | 2013 | 2012 | 2016 | 2015 | 2014 | ||||||||||||||||||||||||||||||||
| | Total Product Revenues | % of Total | Total Product Revenues | % of Total | Total Product Revenues | % of Total | Total Product Revenues | % of Total | Total Product Revenues | % of Total | Total Product Revenues | % of Total | ||||||||||||||||||||||||||
| | (in millions) | (in millions) | ||||||||||||||||||||||||||||||||||||
Hemodialysis Products | $ | 2,904 | 81 | $ | 2,813 | 81 | $ | 2,649 | 80 | $ | 2,790 | 82 | $ | 2,722 | 81 | $ | 2,904 | 81 | ||||||||||||||||||||
Peritoneal Dialysis Products | 427 | 12 | 424 | 12 | 415 | 13 | 385 | 11 | 385 | 12 | 427 | 12 | ||||||||||||||||||||||||||
Other | 251 | 7 | 243 | 7 | 245 | 7 | 217 | 7 | 239 | 7 | 251 | 7 | ||||||||||||||||||||||||||
| | | | | | | | | | | | | | | | | | | | | | | | | | | | | | | | | | | | | | | |
Total | $ | 3,582 | 100 | $ | 3,480 | 100 | $ | 3,309 | 100 | $ | 3,392 | 100 | $ | 3,346 | 100 | $ | 3,582 | 100 | ||||||||||||||||||||
| | | | | | | | | | | | | | | | | | | | | | | | | | | | | | | | | | | | | | | | |
| | | | | | | | | | | | | | | | | | | | | | | | | | | | | | | | | | | | | | | |
Hemodialysis Products
The reductionOur advanced line of risk factorshemodialysis machines includes three series. We developed the 4008 and 5008 Series for cardiovascular diseases is coreour markets outside of North America and the 2008 Series for the North American market. In 2016, we introduced the series 6008 with the launch of our 6008 CAREsystem (see Item 5.VII, "Operating and Financial Review and Prospects – Research and Development"). Our various models of these machine series utilize our latest research and development efforts to the development of dialysis systems and products at FMC-AG & Co. KGaA. Taking this challenge into account, we offer a comprehensive hemodialysis product line, including HD machines, modular components for dialysis machines, Polysulfone dialyzers, bloodlines, HD solutions and concentrates, needles, connectors, machines for water treatment, data administration systems, dialysis chairs, PhosLo® and Phoslyra® phosphate binders, Venofer® iron products, and other renal drug products. We continually strive to expand and improve the capabilitiesdialysis process for our patients. Examples of our hemodialysis systems to offer an advanced treatment mode at reasonable cost.
Dialysis Machines. We sell our 4008, 5008, and 5008S Series HD dialysis machines in EMEALA and AP. In North America, we sell our 2008® Series machines, modeled onthese improvements include the 4008 Series. The 4008/2008 series is the most widely sold machine for hemodialysis treatment. Our 2008T is the only hemodialysis machine currently available with theaddition of Clinical Data eXchangeTM ("CDX") feature. CDXeXchange™ (CDX), which allows machine usersthe clinician to toggle their 2008T monitor view to provide access to their medical information system andMIS (Medical Information System) data directly from the dialysis screen.station. In 2011 in North America,addition, the 2008K@home hemodialysis machine was introduced, which features user interface enhancements and the WetAlertTMWet Alert option provides a wireless wetness detector for the identification of blood
Table of Contents leakage during dialysis.
leaks. In our International Segment, the 4008S classic machine is a basic dialysis machine for performing conventional HD treatments with limited therapy options for budget-focused customers. Following the successful launch of the 5008 series, we concentrated on the continued improvement of the reliable operation Other features of our model 5008 dialysis machine in clinical use and under increasingly varied conditions in international applications. These efforts for improvement have taken into account considerable feedback from our own dialysis clinics as well as from other customers while focusing on therapeutic, technical, and economic aspects of the machine. The 5008 series is intended to gradually replace most of the 4008 series in the coming years. The successor 5008 contains a number of newly developed technical components for revised and improved dialysis processes and offers the most efficient therapy modality, ONLINE-Hemodiafiltration ("ONLINE HDF"), as a standard feature. Our latest machine software upgrades the Therapy System product line of the 5008 machines to the CorDiax product line for use with our FX CorDiax dialyzers. Significant advances in the field of electronics enable highly complex treatment procedures to be controlled and monitored safely and clearly through dedicated interfaces. Our dialysis machines offer the following features and advantages:include:
Dialyzers.Dialyzers
Dialyzers are specialized filters that remove waste products, toxins and excess water from the blood during dialysis. We estimate that we are the leading worldwide producer of polysulfone dialyzers. We manufacture our F-Series and premium FX class® series of dialyzers and our Optiflux® polysulfone single-use dialyzer using hollow fiber Fresenius Polysulfone® and Helixone® membranes from synthetic materials. We estimate that we are the leading worldwide producer of polysulfone dialyzers. In 2011, we introduced the newOur FX CorDiax dialyzer which contains the Helixone®plus high performance membrane. The Helixone®plus membrane selectively filters out toxins such as phosphates to reduce the risk of cardiovascular disease. It was improved in 2011 with the addition of improved performance characteristics and is characterized by a very high permeability to enable an increased removal of uremic toxins in the middle molecular weight range.
We believe that Polysulfone offers the following superior performance characteristics compared to other materials used in dialyzers:
Other Dialysis Products. We manufacture and/or distribute arterial, venous, single needle and pediatric bloodlines. We produce both liquid and dry dialysate concentrates. Liquid dialysate concentrate is mixed with purified water by the hemodialysis machine to produce dialysis solution, which removes the toxins and excess water from the patient's blood during dialysis. Dry concentrate, developed more recently, is less labor-intensive to use, requires less storage space and may be less prone to bacterial growth than liquid solutions. We also produce dialysis solutions in bags, including solutions for priming and rinsing hemodialysis bloodlines, as well as connection systems for central concentrate supplies and devices for mixing dialysis solutions and supplying them to hemodialysis machines. Other products include solutions for disinfecting and decalcifying hemodialysis machines, fistula needles, hemodialysis catheters, and products for acute renal treatment.
Peritoneal Dialysis Products
We offer a full line of peritoneal dialysis systems and solutions which includefor both continuous ambulatory peritoneal dialysis ("CAPD")CAPD and continuous cycling peritoneal dialysis ("CCPD") also called automated peritoneal dialysis ("APD").APD treatments.
CAPD Therapy: We manufacture both systemsThe stay·safe® system has been specifically designed to help patients with their daily self-care CAPD treatment in a safe and solutions forconvenient way. Our CAPD therapy. Our product range hasproducts have a number of advantages for patients including:
APD Therapy: We have been at the forefront of the development of automated peritoneal dialysis machines since 1980. APD therapy differs from CAPD in that fluid is infused into the patient's peritoneal cavity while the patient sleeps. The effectiveness of theAPD therapy is dependentdepends on the solution dwell time in the abdomen, the composition of the solution used, the volume of solution and the timeduration of the treatment, usually 8 - 10 hours. APD using our product line, which includes oursleep·safe cycler, sleep·safe harmony cycler and Liberty® cycler, offers a number of benefits to PD patients:
Our automated peritoneal dialysis equipment incorporates microprocessor technology. This offers physicians the opportunity to program specific prescriptions for individual patients. Our APD equipment product line includes:
Renal Pharmaceuticals
Excess serum phosphorus levels,We continue to develop, acquire and in-license renal pharmaceuticals to improve dialysis treatment for our patients. Below are the primary renal pharmaceuticals we have developed or for which are ordinarily controlled by healthy kidneys, can cause bone and heart problems. Through various mechanisms of action, phosphate binders reduce phosphate absorption in chronic kidney disease ("CKD") patients on dialysis. Wewe have obtained licenses for use:
PhosLo®
In November 2006, we acquired the rights to PhosLo®, a calcium-based phosphate binder, in November 2006.binder. We have received approval of PhosLo® in selected European
countries. In October 2008, a competitive generic phosphate binder was introduced in the U.S. market, which reduced our PhosLo® sales in 2009. In October 2009, we launched an authorized generic version of PhosLo® to compete in the generic calcium acetate market. In April 2014,2011, the FDA approved our New Drug Application (NDA) for Phoslyra®, a liquid formulation of PhosLo®, and we continue to commercialize this product in the U.S. market.
Venofer® and Ferinject®
In 2008, we entered into two separate and independent license and distribution agreements, one for certain countries in Europe and the Middle East (with Galenica AG and Vifor (International) AG) and one for the U.S. (with Luitpold Pharmaceuticals Inc. and American Regent, Inc.), to market and distribute intravenous iron products, such as Venofer® (iron sucrose) and Ferinject® (ferric carboxymaltose) (outside of the U.S.). Both drugs are used to treat iron deficiency anemia experienced by non-dialysis CKD (chronic kidney disease) patients as well as dialysis patients. Venofer® is the leading intravenous iron product worldwide. The first agreement concerns all commercialization activities for these intravenous iron products in the field of dialysis and became effective on January 1, 2009. In North America, a separate license agreement effective November 1, 2008 provides our subsidiary Fresenius USA Manufacturing Inc. ("FUSA") with exclusive rights to manufacture and distribute Venofer® to freestanding (non-hospital based) U.S. dialysis facilities and, in addition, grants FUSA similar rights for certain new formulations of the drug. The U.S. license agreement has a term of ten years and includes FUSA extension options. The international agreement has a term of 20 years. In 2012, FUSA renegotiated and further amended the contract originally signed in 2008 with Luitpold Pharmaceuticals, Inc. The original term length of the agreement remained the same.
In 2009, we entered into separate agreements with AMGEN International to purchase Aranesp and Mimpara and to jointly communicate selected scientific and promotional topics to the physician community. Our current non-exclusive ESA sourcing and supply contract with Amgen covers the period from January 1, 2015 to December 31, 2018. Together with Amgen, we are working to foster new scientific understanding of CKD through the evaluation of our research database with the help of renowned academic advisory committees.
In December 2010, we announced the expansion of our agreements with Galenica by forming a new renal pharmaceutical company, Vifor Fresenius Medical Care Renal Pharma, ("VFMCRP"),VFMCRP, with the intention to develop and distribute products to treat iron deficiency anemia and bone mineral metabolism for pre-dialysis and dialysis patients. FMC-AG & Co. KGaA owns 45% of the company which is headquartered in Switzerland. Galenica contributed licenses (or the commercial benefit in the U.S.) to its Venofer® and Ferinject® products for use in the dialysis and pre-dialysis market (CKD stages III to V). Commercialization of both of these products outside the renal field will remain fully the responsibility of Vifor Pharma, the pharmaceutical division of Galenica and its existing key affiliates or partners.partners retain the responsibility for commercialization of both of these products outside the renal field.
Velphoro®
As part of the agreement to create VFMCRP, Galenica also contributed to the new company exclusive worldwide rightsthe asset (excluding Japan) for Velphoro®, a novel iron-based phosphate binder. Fresenius Medical Care North America ("FMCNA") markets the product on behalf of VFMCRP in the U.S. and commercial sales of Velphoro® commenced in the first quarter of 2014 in the USU.S. market. The product for the U.S. market is supplied by an FDA approved, Vifor manufacturing facility in Switzerland and an FDA approved contract
manufacturer also located in Switzerland. Velphoro has also been approved in Europe via the central approval process and has been commercially launched in Germany, the United Kingdom, Sweden, Denmark, the Netherlands, Belgium and Switzerland. Velphoro has also been approved in France, Italy and Spain. The expansionVFMCRP partner Kissei also received approval from the Ministry of Health, Labour and Welfare in Japan during 2015 for the product which is marketed in Japan under the brand name P-TOL.
OsvaRen® and Phosphosorb®
In June 2015, we further developed our joint venture, VFMCRP, with Galenica. In addition to the iron replacement products Ferinject® and Venofer® for use in nephrology indications as well as the phosphate binder Velphoro® in our shared product portfolio, VFMCRP acquired nephrology medicines commercialized by us, including the phosphate binders OsvaRen® and Phosphosorb®. The transfer of the marketing rights was largely completed during the fourth quarter of 2015, allowing the joint venture to further develop its sales and marketing in key European markets.For more information on the transfer please see Note 2 in the Notes to the Consolidated Financial Statements, "Related Party Transactions," included in this report.
Care Coordination
Laboratory Services
We provide general testing, clinical anatomic pathology and molecular testing for health care providers in the New York region.
Pharmacy Services
We offer pharmacy services, mainly in the U.S. These services include providing renal medications and supplies to the homes of patients or to their dialysis clinic directly from renal pharmacists who are specially trained in treating and counseling patients living with kidney disease.
Vascular, Cardiovascular and Endovascular Specialty Services
We operate vascular access centers mainly in the U.S. Patients receiving hemodialysis need to have a vascular access site implanted before their dialysis therapy starts to enable their blood to exit their bodies to our dialysis machines for cleansing and to return the newly cleaned blood into their bodies. Additionally, our vascular access services include both cardiovascular and endovascular specialty services. Cardiovascular procedures are similar to the vascular access procedures discussed above with a focus on treatment for heart disease, while endovascular surgical procedures are minimally invasive and designed to access many regions of the body via major blood vessels and assist in both the maintenance of hemodialysis accesses and other non-dialysis medical operations.
Hospitalist and Intensivist Services
We employ physicians providing care in hospitals and post-acute care centers across the United States. Our hospitalist services utilize a consistent, patient-centered approach that relies on experienced physician leadership and a web-based workflow platform. We also provide intensivist services, which focus on the general medical care of hospitalized patients and the care of critically ill patients, usually in the intensive care unit (ICU), and the care of patients in post-acute centers.
Medical Cost Management
We are continuing to expand our activities in value-based healthcare contracting. Value based contracting includes shared savings arrangements in which private payors or government programs share the savings from reductions in the overall medical spend of a population under management assuming that certain quality thresholds are also met. Such contacting also includes capitated arrangements in which private payors or government programs pay us a fixed amount per member under management to fund beneficiary medical expenses. Since capitation arrangements often can be recognized as premium revenue and the full medical premium for ESRD beneficiaries generally is very large, capitation programs can drive significant revenue and, when costs are effectively managed, profit opportunities.
Major Markets and Competitive Position
To obtain and manage information on the status and development of global, regional and national markets we have developed our Market & Competitor Survey, or MCS. We use the MCS within the Company as a tool to collect, analyze and communicate current and essential information on the dialysis market, developing trends, our market position those of our agreement in December 2010 allowed Galenicacompetitors. Country – by – country surveys are performed at the end of each calendar year which focus on the total number of patients treated for ESRD, the treatment modality selected, products used, treatment location and the Companystructure of ESRD patient care providers. The survey has been refined since inception to work togetherfacilitate access to more detailed information and to reflect changes in the development of therapies and commercializationproducts as well as changes to the structure of renal pharmaceuticalsour competitive environment. The questionnaires are distributed to professionals in the field of dialysis who are in a position to provide ESRD-relevant country specific information themselves or who can coordinate appropriate input from contacts with the relevant know-how in each country. The surveys are then centrally validated and checked for CKD stages IIIconsistency by cross-referencing them with the most recent sources of national ESRD information (e.g. registry data or publications if available) and with the results of surveys performed in previous years. All information received is consolidated at a global and regional level and analyzed and reported together with publicly available information published by our competitors. While we believe the information contained in our surveys and competitor publications to Vbe reliable, we have not independently verified the data or any assumptions from which our MCS is derived or on which the estimates they contain are based, and we do not make any representation as to the accuracy of such information. Except as otherwise specified herein, all patient and market data in this report have been derived using our MCS.
We estimate that the volume of the global dialysis market was $76 billion in 2016 comprising approximately $14 billion of dialysis products and approximately $62 billion of dialysis services (including administration of dialysis drugs). The currency-adjusted growth rate amounted to 4% during the last year.
We are the world's leading provider of dialysis services with a market share of about 10% based on the number of treated patients. In addition to providing services to the largest number of dialysis patients of any health care company, we also operate more dialysis clinics than any of our competitors: at the end of 2016, we had 3,624 (2015: 3,418) clinics worldwide. We treated 61% of our patients in North America, 19% in Europe, 10% in Latin America and 10% in the Asia-Pacific region.
We are also the market leader in dialysis products with a 35% worldwide dialysis product market share. Dialyzers represent the largest product group in the worldwide dialysis market. In 2016, the worldwide dialyzer market had a sales volume of more than 280 million units including approximately 120 million units which we produced. Dialysis machines also represent a substantial dialysis product market. In 2016, we produced more than half of the 87,000 machines sold worldwide. The U.S. is our largest sales market for dialysis machines. In 2016, we manufactured more than 93% of the dialysis machines sold in the U.S. Our 2008 machine series is the leading dialysis system in the U.S. with more than 122,000 units in use. In 2015, we also held approximately 34% of the worldwide dialysis product market. Our share of the global dialyzer market was approximately 44% and our share of the dialysis machines market was approximately 50%.
Our competitive environment is described in more detail below:
Health Care Services: Over the last decade the dialysis industry has been characterized by ongoing consolidations. Internationally, the dialysis services market is much more fragmented, with a higher degree of public ownership in many countries. Our largest competitors are DaVita HealthCare Partners, Inc. and U.S. Renal Care, Inc. in the North America Segment, Diaverum S.à r.l. and Kuratorium für Heimdialyse in the EMEA Segment, B. Braun and Showa-Kai in the Asia-Pacific Segment, and Baxter International Inc. and DaVita in the Latin America Segment.
U.S. government programs are the primary source of reimbursement for services to the majority of patients and, as such, competition for patients in the U.S. is based primarily on quality and accessibility of service and the ability to obtain admissions from physicians with privileges at the facilities. However, the extension of periods during which commercial insurers are primarily responsible for reimbursement and the growth of managed care have placed greater emphasis on service costs for patients insured with private insurance.
In most countries other than the U.S., we compete primarily against individual freestanding clinics and hospital-based clinics. In many of these countries, especially the developed countries, governments directly or indirectly regulate prices and the opening of new clinics. Providers compete in all countries primarily on the basis of quality and availability of service and the development and maintenance of relationships with referring physicians.
Laboratory Services: Spectra, our dialysis laboratory subsidiary, competes in the U.S. with large nationwide laboratories, dedicated dialysis laboratories and numerous local and regional laboratories, including hospital laboratories. In the laboratory services market, companies compete on the basis of performance, including quality of laboratory testing, timeliness of reporting test results and cost-effectiveness. We believe that our services are competitive in these areas.
Products: We compete globally in the product market which is largely segmented between hemodialysis and peritoneal dialysis. Our competitors include Baxter International Inc., Asahi Kasei Medical Co. Ltd., Medtronic Plc., B. Braun Melsungen AG, Nipro Corporation, Nikkiso Co., Ltd., NxStage Medical, Inc., Terumo Corporation, Kawasumi Laboratories Inc., Fuso Pharmaceuticals Industries Ltd., and Toray Industries, Inc. We have invested significantly in developing proprietary processes, technologies and manufacturing equipment which we believe provide a competitive advantage in manufacturing our products.
Our Strategy and Competitive Strengths
Company Strategy
We focus our business activities on our patients' health through the quality of both our treatments and products with the objective of improving their quality of life and raising their life expectancy. Our aim is to maintain our position as the world's leading provider of dialysis treatment and products and to use that position as a basis for sustainable, profitable growth. Moreover, we are expanding our range of dialysis-related medical services within our Care Coordination division to continuously increase our enterprise value and create added value for patients, health care systems, employees, and investors worldwide. Our financial stability enables us to benefit from corporate financing on attractive terms and a degree of flexibility that we intend to uphold. Over the next few years, we will continue to pursue our aim of strengthening our leading position in a financially responsible manner.
Our strategy takes into account concrete, measurable growth targets as well as long-term trend forecasts in the dialysis market. The Management Board uses a number of different tools and indicators to evaluate our business performance, develop our strategy and make investment decisions. See Item 5, "Operating and Financial Review and Prospects." We expect not only the number of dialysis patients to increase, but also the quality of services provided and the products available to become even more important in the future with improved access to medical care. We believe comprehensive care, a more holistic approach to address the needs of our kidney patients, is another area that will continue to grow in the future. In response to these trends, we will not only focus our business on individual services or dialysis products, but also on combining the different areas of application related to dialysis, such as combining treatment concepts with dialysis pharmaceuticals.
Our strategy is based on an in-depth analysis of the major trends affecting Fresenius Medical Care:
Our corporate strategy in the coming years will pursue the following four strategic objectives:
(1) Growing continuously and Expanding our Global Presence
We are committed to actively shaping the development of the industry while benefiting from the global growth of the market. This will be achieved by enabling more and more people to access life-saving dialysis treatment and developing innovative products and therapies that improve our patients' quality of life.
To strengthen our market position, we have developed various approaches ranging from organic growth to continuously assessing suitable acquisitions. A further requirement for lasting, profitable growth is aligning our business activities to attractive future markets. One option for tapping into new markets is through public-private partnerships in the dialysis business. The public sector benefits from a high-quality dialysis infrastructure, which allows it to care for patients more effectively and at a lower cost. In the Care Coordination market, we believe there is growth potential through acquisitions in the U.S. and international markets.
(2) Tapping into new business areas
We consider our main focus to continue their collaborationbe the holistic care of dialysis patients and dialysis-related treatments. In addition to our products and dialysis treatment, we are increasingly offering additional services for patient care. In the past years, we have expanded our laboratory testing services and services related to vascular access which are essential aspects of dialysis treatments for our patients. In many regions, in CKD stage V in selected other countries. European antitrust authorities granted approval in October 2011, which allowed VFMCRPaddition to proceedour products and dialysis treatments, we offer an increasing range of additional health care services through our Care Coordination business. Care Coordination will also allow us to expand into new business areas and meet the growing overall demand for quality health care services. It also enables us to integrate the individual treatment steps more effectively with the targeted expansionaim of itsfurther improving the quality of care for our patients in a cost-effective manner that can ease the strain on health care systems. See "Business Overview – Our Services, Products and Business Processes."
(3) Enhancing products and treatments
Developing innovative products and continuously improving our dialysis treatments are an inherent part of our strategy of sustainable growth. We have a global operations on November 1, 2011.network of research and development centers which enable us to become familiar with local requirements and respond quickly. Additionally, chronic kidney failure is increasingly becoming a global problem, causing a growth in demand for improved, high-quality yet cost-efficient products. This approval broughtgives rise to fruition an agreement that superseded an earlier agreement for certain countries in Europe and the Middle East.
In an increasing number of countries,synergies in the area of product development, which we are required by health care systems and reimbursement requirements to supply pharmaceuticals for many conditions as part of comprehensive treatment packages. See "Regulatory and Legal Matters – Reimbursement." We intend to leverage further in the future. For further information, see our Research and Development discussion in Item 5, "Operating and Financial Review and Prospects"–VII. "Research and Development."
The quality and safety of our products and services are given top priority. We consider them to be synonymous with our patients' quality of life. Trust in the quality of our products and services makes us a reliable partner for patients, physicians and care staff alike.
(4) Expanding operational excellence and flexibility
Another key aspect of our strategy is improving and sustaining our profitability as well as managing our company more efficiently. We will continue to pursue developmentoptimize and commercialization partnershipsmodernize administrative structures and processes in the future. We aim to meet the growth in demand and create the conditions to be able to respond more flexibly to changes in the market.
Additionally, we will use our regional structure in the future to be a strong, reliable local partner, to react quickly to specific customer needs or changes in our markets or in the regulatory environment and to further improve access to new markets.
In 2013, we launched our Global Efficiency Program with suppliersthe aim of brandedenhancing the performance of the entire organization and unbrandedboosting its competitiveness and investment capacity. We set ourselves the target of achieving long-term efficiency gains of $300 million a year before tax by the end of 2016, a goal we have exceeded.
Vision 2020
Based on this strategic focus, we set long-term targets in 2014 and announced our growth strategy for 2020. This strategy aims to increase the Company's revenues to $28 billion by fiscal year 2020, corresponding to an average annual growth rate of approximately 10% compared to 2013 revenue of $15 billion. Concurrently, we expect high quality pharmaceutical substances to cover this requirement.single-digit annual growth in net income. In addition to the growth of our core ESRD business, we expect this growth in revenue to be driven by Care Coordination. The percentage share of the Company's total net revenue attributable to Care Coordination is expected to more than double by 2020 from 7% in 2014. Overall growth in net revenue will increasingly work toward the development of proprietary innovative pharmaceutical solutions that offer additional medical value to dialysis patients.be driven by both organic growth and through acquisitions.
Customers, Marketing, Distribution and Service
We sell most of our products to clinics, hospitals and specialized treatment clinics. With our comprehensive product line and years of experience in dialysis, we believe that we have been able to establish and maintain very close relationships with our global clinic customer base. Close interaction between our Salessales and Marketingmarketing as well as research and Research and Developmentdevelopment ("R&D") personnel enables us to
integrate concepts and ideas that originate in the field into product development. We maintain a direct sales force of trained salespersons engaged in the sale of both hemodialysis and peritoneal dialysis products. Sales and Marketing engages in direct promotional efforts, including visits to physicians, clinical specialists, hospitals, clinics and dialysis clinics, and represents us at industry trade shows. We also sponsor medical conferences and scientific symposia in accordance with company guidelines and compliance policies as a means for disseminating scientific or technical information. Our clinical nurses provide clinical support, training and assistance to customers and assist our sales force. We also use outside distributors to provide sales coverageoffer customer service, training and education in countries that our internal sales force does not service.the applicable local language, and technical support such as field service, repair shops, maintenance, and warranty regulation for each country in which we sell dialysis products.
In our basic distribution system, we ship products from factories to central warehouses which are frequently located near the factories. From these central warehouses, we distribute our dialysis products to regional warehouses. We also distribute home hemodialysis and peritoneal dialysis products to the patientpatients at home, and ship hemodialysis products directly to dialysis clinics and other customers. LocalAdditionally, local sales forces, independent distributors, dealers and sales agents sell all our products.
Patient, Physician and Other Relationships
We offer customer service, trainingbelieve that our success in establishing and educationmaintaining health care centers, both in the applicableU.S. and in other countries depends significantly on our ability to obtain the acceptance of and referrals from local language,physicians, hospitals and technical supportmanaged care plans. Our ability to provide high-quality dialysis care and to fulfill the requirements of patients and doctors depends significantly on our ability to enlist nephrologists for our dialysis clinics and receive referrals from nephrologists, hospitals and general practitioners.
Medicare program reimbursement regulations require that a medical director generally supervise treatment at a dialysis clinic. Generally, the medical director must be board certified or board eligible in internal medicine or pediatrics, have completed a board-approved training program in nephrology and have at least twelve months of experience providing care to patients undergoing dialysis. We have engaged physicians or groups of physicians to serve as medical directors for our outpatient dialysis centers and inpatient dialysis service relationships with hospitals. The compensation of our medical directors and other contracted physicians is negotiated individually and depends in general on local factors such as field service, repair shops, maintenance,competition, the professional qualification of the physicians, the physicians' experience and warranty regulationtasks as well as the size and the offered services of the clinic. The total annual compensation of the medical directors and the other contracted physicians is stipulated at least one year in advance and the medical directors agree to seek to continue to improve efficiency and quality. We believe that the compensation of our medical directors is in line with the fair market value of their services.
Almost all contracts we enter into with our medical directors in the United States, as well as the typical contracts which we obtain when acquiring existing clinics, contain non-competition clauses concerning certain activities in defined areas for each countrya defined period of time. These non-compete agreements restrict the physicians from owning or providing medical director services to other outpatient dialysis centers, but these clauses do not restrict the physicians from performing patient services directly at other locations/areas or referring patients to other facilities. We do not require physicians to send patients to us or to specific clinics.
In addition to our dialysis clinics, a number of our other health care centers employ or contract with physicians to provide professional services. We have financial relationships with these physicians in the form of compensation arrangements for the services rendered. These contractual arrangements are
designed to comply with federal and state laws applicable to financial relationships with physicians, such as the Stark Law and the Anti-Kickback Statute. In addition to these legal requirements, we face competition from other communities and facilities for these physicians, which continues while the physician is practicing at one of our centers.
A number of the dialysis clinics and other health care centers we operate are owned, or managed, by joint ventures in which we sell dialysis products.hold a controlling interest and one or more hospitals, physicians or physician practice groups hold a minority interest. We also have agreements with physicians to provide training sessions onmanagement and administrative services at health care centers in which physicians or physicians groups hold an ownership interest and agreements with physicians to provide professional services at such health care centers. Our relationships with physicians and other referral sources relating to these joint ventures must comply with the federal Anti-Kickback Statute. Although there is a safe harbor for certain investment interests in small entities, our equipment at our facilities in Schweinfurt, Germany, Waukegan, Illinois, Coppell, Texasjoint ventures do not satisfy all of the requirements for safe harbor protection. Failure to comply with a safe harbor does not render an arrangement illegal under the federal Anti-Kickback Statute and, Manila, Philippines and we also maintain regional service centerstherefore, physician joint ventures that fall outside the safe harbors are responsible for day-to-day international service support.not, by definition, prohibited by law. Our joint ventures have been designed to comply with the federal Stark Law.
Manufacturing OperationsCapital Expenditures
We invested, by operating segment and Corporate, the gross amounts shown in the table below during the twelve month periods ended December 31, 2016, 2015, and 2014.
| | Actual | |||||||||
|---|---|---|---|---|---|---|---|---|---|---|
| | 2016 | 2015 | 2014 | |||||||
| | (in millions) | |||||||||
Capital expenditures for property, plant and equipment | ||||||||||
North America | $ | 569 | $ | 481 | $ | 404 | ||||
EMEA | 127 | 121 | 163 | |||||||
Asia-Pacific | 39 | 36 | 37 | |||||||
Latin America | 37 | 49 | 38 | |||||||
Corporate | 258 | 266 | 290 | |||||||
| | | | | | | | | | | |
Total Capital Expenditures | $ | 1,030 | $ | 953 | $ | 932 | ||||
| | | | | | | | | | | |
| | | | | | | | | | | |
| | | | | | | | | | | |
Acquisitions and Investments | ||||||||||
North America | $ | 370 | $ | 235 | $ | 1,638 | ||||
EMEA | 419 | 95 | 51 | |||||||
Asia-Pacific | 23 | 49 | 255 | |||||||
Latin America | 14 | 2 | 41 | |||||||
Corporate | 31 | 46 | 2 | |||||||
| | | | | | | | | | | |
Total Acquisitions and Investments | $ | 857 | $ | 427 | $ | 1,987 | ||||
| | | | | | | | | | | |
| | | | | | | | | | | |
| | | | | | | | | | | |
For additional information regarding our capital expenditures, see Item 4. B, "Business Overview – Acquisitions and Investments" and Item 5.IV, "Operating and Financial Review and Prospects – Liquidity and Capital Resources"
Acquisitions and Investments
A significant factor in the growth in our revenue and operating earnings in prior years has been our ability to acquire healthcare businesses, particularly dialysis clinics, on reasonable terms. In the U.S., doctors might decide to sell their clinics to obtain relief from day-to-day administrative responsibilities and changing governmental regulations, to focus on patient care and to realize a return on their investment. Outside of the U.S., doctors might determine to sell to us and/or enter into joint ventures or other relationships with us to achieve the same goals and to gain a partner with extensive expertise in dialysis products and services. Privatization of health care in Eastern Europe and Asia could present additional acquisition opportunities. We believe we are also viewed as a valuable strategic health care partner outside the dialysis business due to our experience in managing chronic disease for dialysis patients and our record of improving quality and patient satisfaction and reducing the overall cost of care, and our leadership in advancing innovation and improvement in health care.
For a discussion of our 2016 and 2015 acquisitions and investments, see Item 5, "Operating and Financial Review and Prospects – Liquidity and Capital Resources – Net Cash Provided By (Used in) Investing Activities."
Procurement and Production
We operate state-of-the-art production facilities worldwide to meet the demand for machines, cyclers, dialyzers, solutions, concentrates, bloodlines, and disposable tubing assemblies and equipment for water treatment in dialysis clinics. We have invested significantly in developing proprietary processes, technologies and manufacturing equipment which we believe provide a competitive advantage in manufacturing our products. Our strategically located production and distribution centers help to reduce transport costs. We are using our facilities in St. Wendel, Germany and Ogden, Utah as centers of competence for development and manufacturing.
We produce and assemble hemodialysis machines and CCPD cyclers in our Schweinfurt, Germany and our Concord, California facilities. We also maintain facilities at our service and local distribution centers in Argentina, Egypt, France, The Netherlands, China, Brazil, and Russia for testing and calibrating dialysis machines manufactured or assembled elsewhere, to meet local end user market needs. We manufacture and assemble dialyzers and polysulfone membranes in our Ogden, U.S., St. Wendel, Germany, L'Arbresle, France, Vrsac, Serbia, Buzen, Japan and Jiangsu,Changshu, China facilities and at production facilities of our joint venturesventure in Belarus and Japan. At our Ogden, Utah facilities, we manufacture and assemble dialyzers and polysulfone membranes and manufacture PD solutions. We manufacture hemodialysis concentrate at various facilities worldwide, including France, Italy,Germany, Great Britain, Spain, Turkey, Serbia, Morocco, Argentina, Brazil, Columbia, Australia, Malaysia, Germany, Canada, Mexico and the U.S. We manufacture PD products in North America, Europe, Latin America, and Asia, with two of our largest plants for production of PD products in Germany and the U.S. In 2013, operations for two new PD production lines in Germany and the U.S. started. We are also pursuing the approval process for the manufacturing of PD solutions as well as hemodialysis concentrates in Jiangsu, China. Additionally, we produce bloodlines in Mexico, China, Italy, Turkey and Serbia. Our plant in Reynosa, Mexico is the world's largest (by volume) bloodline manufacturing facility.
We operate a comprehensiveThe Global Manufacturing and Quality (GMQ) division manages all of Fresenius Medical Care's activities in purchasing of raw materials and semi-finished goods used in manufacturing activities, production including quality management, systemand distribution in North America. This centralized approach enables us to
With a focus on quality, costs and availability, GMQ has introduced a state-of-the-art infrastructure with corresponding efficient processes and systems in the production of solutions are subjected to infra-red and ultra-violet testinglast few years, as well as physicalbundling and chemical analysis to ensure their quality and consistency. During the production cycle, sampling and testing take place in accordance with applicable quality control measures to assure sterility, safety and effectiveness of the finished products. All process parameters e.g., pressure, temperature and time, required for the various processes are monitored to ensure consistency of unfinished products during the production process. Through monitoring of environmental conditions, particle and bacterial content are kept below permitted limits. We provide regular ongoing training for our employees in the areas of quality control and proper production practice.optimizing existing structures. All production sites follow the Lean Manufacturing approach which in North America and our Schweinfurt plant includes the "Lean Six Sigma" management system. The focus of Lean Manufacturing and Six Sigma is continuous improvement of all manufacturing processes to achieve a very low error rate resulting in better quality production while shortening manufacturing time. Our IMS fulfils ISO 9001:2008 requirements for quality control systems in
combination with the ISO norm 14001:2009 for environmental control systems. At the same time, our IMS conforms to the requirements for medical devices of ISO norm 13485:2001 and of the Medical Device Directive 93/42/EEC. We have implemented our IMSInformation Management System ("IMS"), which fulfills ISO 9001:2008 for quality control in combination with ISO norm 14001:2009, in all our European production sites. We are preparing the timely adoption of the new ISO 9001:2015. (See also "Regulatory and Legal Matters – Facilities and Operational Regulations"Regulation" below). All of our production facilities have undergone annual ISO 13485:201213485 Quality Systems inspections, maintaining all certifications, with no major non-conformances affecting our established management system being noted. Our Quality Management System ("QMS") in the Latin America Segment has been established and implemented based upon local or international regulations. At a minimum, each country must comply with the local regulation which provides the specific certification for production. The QMS of each country is reviewed through periodic management review, internal and corporate audits. In the Asia-Pacific Segment, every plant for medical devices or pharmaceutical products has a local QMS that is either ISO 13485:2003 and/or ISO 9001:2008 certified. The update of ISO 9001:2015 will be implemented in required plants in accordance with the standard. Where applicable, each plant also complies to the standard being noted.Medical Device Directive 93/42/EEC. As there are additional requirements on QMSs in most of the countries in the Asia-Pacific Segment for medical device or pharmaceutical manufacturing, additional requirements are based upon target markets and countries of production. All plants have successfully passed the annual ISO 13485/ISO 9001 QMS inspections for maintaining their required certifications.
Our procurement policy combines worldwide sourcing of high-quality materials with the establishment of long-term supplier relationships. Additionally, we carefully assess the reliability of all materials purchased to ensure that they comply with the rigorous quality and safety standards required for our dialysis products. We outsource only if we have confirmed that a supplier can meet or exceed our internal standards. An interactive information system connects all our global procurement activities to ensure standardized processes and constant monitoring of our projects.
We focus on further optimizing procurement logistics and reducing total purchasing costs. Supplemental raw material contracts for all manufacturers of semi-finished goods will enable us to improve purchasing terms for our complete network. We are continuously intensifying, where appropriate, our use of internet-based procurement tools to increase agility and global transparency. Our sophisticated routing software enables us to distribute our supplies to best accommodate customer requests while maintaining operational efficiency. Additionally we have an automated replenishment control in our national warehouses that allows the warehouses to be refilled when their inventory reaches a preset defined minimum level and allows us to continue to improve our operational efficiency.
Quality Assurance and Quality Management in Dialysis Care
Our clinics work in conformance with the generally accepted quality standards of the industry, particularly the KDOQI (Kidney Disease Outcomes Quality Initiative) guidelines from the United States, the European ERBP standard (European Renal Best Practice) and increasingly, the KDIGO (Kidney Disease: Improving Global Outcomes), an industry initiative for global clinical practice guidelines. Clinical data management systems are used to routinely collect certain medical parameters, which we evaluate in anonymized form in compliance with these guidelines.
In our EMEA Segment, our quality management activities are primarily focused on comprehensive development and implementation of a Healthcare Services QMS as part of an IMS. Our goals in this area include meeting quality requirements for our dialysis clinics and environmental concerns. This approach results in an IMS structure that closely reflects existing corporate processes. We are also able to use the IMS to fulfill many legal and normative regulations covering service lines. In addition, the IMS standard offers a highly flexible structure that allows us to adapt to future regulations. Our IMS fulfills the ISO-Norm 9001:2008 requirements for QMSs and links it with the ISO-Norm 14001:2004 for environmental management systems. At the same time, the IMS conforms to the medical devices requirements of ISO-Norm 13485:2012 and of the Medical Device Directive 93/42/EEC. Currently, dialysis clinics in 17 countries within our EMEA region have QMSs which are certified according to the quality management standard ISO 9001:2008.
Additionally, we have a comprehensive program, NephroCare Excellence, in our EMEA region. NephroCare is our service that provides complete life-saving treatments for renal failure at the point of care using advanced technologies and listening to and understanding our patients' needs to enable the best therapies, ensure a high-quality of care and empower patients.
At each of our North America Segment dialysis clinics, a quality assurance committee is responsible for reviewing quality of care data, setting goals for quality enhancement and monitoring the progress of quality assurance initiatives. We believe that we enjoy a reputation of providing high quality care to dialysis patients. In 2016, we continued to develop and implement programs to assist in achieving our quality goals. Our Access Intervention Management Program detects and corrects arteriovenous access failure in hemodialysis treatment and the percentage of patients who use catheters, which is the major cause of hospitalization and morbidity.
The UltraCare® program of our North America Segment dialysis services group represents our commitment to deliver excellent care to patients through innovative programs, state-of-the art technology, continuous quality improvement and a focus on superior patient service. It combines our latest product technology with our highly trained and skilled staff to offer our patients what we believe is a superior level of care.
Our principal focus of our research and development activities is the development of new products, technologies and treatment concepts to optimize treatment quality and safety for dialysis patients and for the reduction in the costs of providing care. See Item 5.C, "Operating and Financial Review and Prospects – Research and Development."
The Medicare Improvements for Patients and Providers Act of 2008 ("MIPPA") created the ESRD quality incentive program under which dialysis facilities that fail to achieve annual quality standards
established by the Centers for Medicare and Medicaid Service ("CMS") could have payments reduced in a subsequent year by up to 2%. See Item 5, "Operating and Financial Review and Prospects – Overview."
Environmental Management
We have integrated environmental protection targets into our operations. To reach these goals, our IMS has been in use at our production facilities as well as at a number of dialysis clinics. IMS fulfilsfulfills the requirements of quality management systemsQMSs as well as environmental management. Environmental goals are set, adhered to and monitored during all stages of the lives of our products, from their development to their disposal.
We continually seek to improve our production processes for environmental compatibility, which frequently generates cost savings. Our environmentally certified production plants, dialysis clinics and research and development in the European region participate in the Corporate Environment Program, the purpose of which is to improve environmental awareness and ecological efficiency, comply with new environmental regulations and expand the number of units certified under the environmental management standard ISO 14001:2004.
In some of our dialysis facilities, we establish, depending on the particular facility and circumstance, a priority environmental protection target on which our dialysis clinics concentrate for at least one year. Environmental performance in other dialysis facilities is used as the basis for comparisons and targets. Improvements are implemented on a site-by-site basis after evaluation of the site's performance.
In our European clinics, we continue to introduce our environmental management system in dialysis clinics and we continue to monitor and assess the management system performance in clinics where it was previously implemented. Currently, dialysis clinics in 1314 countries in our European region are certified according to the environmental management standard ISO 14001:2004. We achieved ISO 14001:2004 certification for our firsttwo dialysis clinic and manufacturing locationclinics in North America at the endas of 2013.December 31, 2015. We also conduct EHS regulatory audits of our manufacturing, distribution and laboratories annually and as needed. We continued to roll out the integrated software solution e-con 5 for the management of eco-controlling data in over 700 clinics.clinics in the EMEA Segment and the Latin America Segment. This software is intended to reduce environmental management working time while increasing the eco-controlling data quality and possibilities for data analysis at the place of origin.
In our North America Segment dialysis clinics, we implemented recycling programs for corrugated materials and hemodialysis machines. Use of heat exchangers enables us to obtain residual heat from water used for industrial purposes, which we use to heat fresh water for dialysis treatment. Targeted environmental performance criteria in other locations include fresh water consumption and improved separation of waste.
Sources of Supply
Our purchasing policy combines worldwide sourcing of high-quality materials with the establishment of long-term relationships with our suppliers. Additionally, we carefully assess the reliability of all materials purchased to ensure that they comply with the rigorous quality and safety standards required for our dialysis products and we outsource only if we believe that a supplier can exceed our own quality standards. An interactive information system links all our global projects to ensure that they are standardized and constantly monitored.
We focus on further optimizing procurement logistics and reducing purchasing costs. Supplemental raw material contracts for all manufacturers of semi-finished goods will enable us to improve purchasing terms for our complete network. We are continuously intensifying, where appropriate, our use of internet-based procurement tools by purchasing raw materials through special on-line auctions. Our sophisticated routing software enables us to distribute our supplies to best accommodate customer requests while maintaining operational efficiency. Additionally we have an automated replenishment control in our national warehouses that allows the warehouses to be refilled when their inventory reaches a preset defined minimum level and allows us to continue to improve our operational efficiency.
Patents and Licenses
As the owner of patents or licensee under patents throughout the world, we currently hold rights in 6,133over 7,700 patents and patent applications in major markets. Patented technologies that relate to dialyzers include our generation of DiaSafeplus® filters and FX® dialyzers which are the subject of patents and pending patent applications.
The 5008 biBag connector, a substantial part of the connector container system, is covered by a number of patents and pending patent applications with expiry dates beyond 2020.
Additional patentsPatents and pending patent applications relate to components of the more recentour 5008 dialysis equipment series, including, for example, the pump technology, extracorporeal blood pressure measurement and the connector system for a modifiedour proprietary biBag bicarbonate concentrate container.
Our new 6008 therapy system by itself is protected by more than 80 patent families that protect the disposable, the machine or the entire system. A number of applications are pending or were recently issued for the North American 2008T HD machine including, for example, the CDX system for the display of medical information directly on the 2008T screen, a wireless wet detector for sensing line disconnect, an improved Crit-Line hematocrit measuring system and a U. S. version of the biBag filling system.
Applications are also pending or were recently issued relating to our new Liberty®next generation peritoneal dialysis cycler which has a number of innovative attributes such as its multi-channel disposable cassette, dual piston pumpgreatly reduced size and pneumatically locking door. Finally,an innovative pumping system. Additionally, a large number of new patent applications have been filed related to our new table top portable HD machine, and wearable kidney deviceswhich is in development.an advanced development stage that utilizes sorbent technology to greatly reduce water usage.
In 2011 we acquired Hema Metrics LLC's assets related to noninvasive optical measurement of absolute blood parameters (the CRIT-LINE system). We filed several new patent applications for improved blood chambers and related software developed since the acquisition.
For PD, we hold protective rightsPatents for our polyolefine film, Biofine®, which is suitable for packaging intravenous and peritoneal dialysis fluids. Patentsfluids, have been granted in Australia, Brazil, Canada, Germany, Europe, South Korea, Belarus and the United States. A further patent family describesStates and parts of Europe, including Germany and Belarus.
Patents have also been granted in Brazil, Japan, South Korea, the United States and parts of Europe, including Germany, for claims related to a special film for a peelable, non-PVC, multi chambermulti-chamber bag for peritoneal dialysis solutions. These patents have been granted in Brazil, Europe, Germany, Japan, South Korea and the United States. However, oppositions against the patents in parts of Europe remain pending.
We believe that our success will continue to depend significantly on our technology. As a standard practice, we obtain the legal protections we believe are appropriate for our intellectual property. Nevertheless, we are in a position to successfully market a material number of products for which patent protection has lapsed or where only particular features are patented. We believe that even after the expiration of some of our patents, our proprietary know how for the manufacturing of our products and our continuous efforts in obtaining targeted patent protection for newly developed upgraded products will continue to provide us with a competitive advantage. From time to time our patents may be infringed by third parties and in such case we will assert and enforce our rights. Initially registered patents may also be subject to invalidation or infringement claims made by competitors in formal proceedings (oppositions, trials, re-examinations, etc.) either in part or in whole. For information regarding patent-related legal proceedings, see Note 20, "Commitments and Contingencies – Legal and Regulatory Matters – Commercial Litigation" in our Consolidated Financial Statements. In addition, technological developments could suddenly and unexpectedly reduce the value of some of our existing intellectual property.
Trademarks
Our principal trademarks are the name "Fresenius" and the "F" logo, for which we hold a perpetual, royalty-free license from Fresenius SE, our major shareholder and the sole shareholder of our general partner. See Item 7.B, "Related Party Transactions – Trademarks."
Competition
Our competitors in the sale of hemodialysis and peritoneal dialysis products include Baxter International Inc. (which acquired the hemodialysis product business of Gambro AB in 2013), Asahi Kasei Medical Co. Ltd., Bellco S.r.l., B. Braun Melsungen AG, Nipro Corporation, Nikkiso Co., Ltd., NxStage Medical, Inc., Terumo Corporation, Kawasumi Laboratories Inc., Fuso Pharmaceuticals Industries Ltd., and Toray Industries, Inc.
We see risk management as the ongoing task of determining, analyzing and evaluating the spectrum of potential and actual risks in the Company and its environment and, where possible, taking pre-emptive and corrective measures.action. Our risk management system, which is described in more detail below, provides us with a basis for doing so. It enables management to identify at an early stage risks that could jeopardize our growth or going concern, and to take steps to minimize any negative impact. As such, it is an important component of the Company's management and governance.
Risk management is part of our integrated management system. The main objective is to identify potential risks as early as possible to assess their impact on business activities and to enable us, where necessary, to take appropriate countermeasures. As internal and external requirements and conditions are continually changing, we are constantly adapting our risk management system.
The design of the internal risk monitoring system is based on the Enterprise Risk Management Integrated Framework issued by the Committee of Sponsoring Organziations of the Treadway Commission. Opportunities are not covered by the implemented risk management system. The two pillars of our risk management are the corporate controlling function, which is used for the identification and steering of short-term risks, and the internal risk monitoring system, which is typically used for the identification and steering of mid- to long-term risks.
In the monitoring system, regional risk managers are responsible for identifying, assessing,coordinators within the regions and managingin selected functions coordinate risk management activities utilizing risk management software. These activities address potential as well as existing industry- and market-related risks in their region and reporting themshort-term as well as mid-term risks. Risk coordinators are also responsible for the communication of risk reports to the regional and functional chief financial officers. Twice a year,Semiannually, the regional chief financial officers send their aggregatedcorporate risk management team gathers the risk reports tofrom regions and functions, analyzes them and communicates the central risk management coordinator who consolidates the reports and presents themcompiled results to the Management Board. The main focus lies with material risks that haveabove a total negative impact of €25 milliondefined threshold.
Risks classified as high, whether newly identified or morealready known risks which changed their status to high in relationthe period, are promptly reported to operating income. Thethe Management Board and to corporate risk management reports contain further information on potential risks. Our Management Board is informed directlyto ensure an adequate response and immediatelymitigation of any newly identified significant risks.the risk. The effectiveness of the risk management system is monitored by the Audit and Corporate Governance Committee of the Supervisory Board.
In addition to risk reporting, traditional reporting to management is an important tool for managing and controlling risks, as well as for taking preventive measures in a timely manner. Therefore, our Management Board is informed on a monthly basis about the industry situation, our operating and non-operating business and the outcome of analyses of our earnings and financial position, as well as of our assets position on a quarterly basis. In addition to risk reporting, traditional reporting to management is an important tool for managing and controlling risks, as well as for taking preventive measures in a timely manner. Therefore, our Management Board is informed on a monthly basis about the industry situation, our operating and non-operating business and the outcome of analyses of our earnings and financial position, as well as of our assets position on a quarterly basis.
Part of our risk management system is the Global Internal Audit department. The Global Internal Audit department is regularly informed about the results of the risk management system. This department determines risk focus areas and audits a selected number of departments and subsidiaries worldwide each year. The department works according to the internationally accepted standards of the Institute of Internal
Auditors. The scope of internal auditing is widespread and involves, among other activities, periodic assessment of the effectiveness of controls (including legal compliance controls) over business processes, the reliability of financial reporting and compliance with accounting regulations and internal policies. The Company's locations and units to be audited are determined annually on the basis of a selection model taking various risks into consideration. This annual audit plan is reviewed and approved by the Management Board and approved by the Audit and Corporate Governance Committee of the Supervisory Board. All audit reports with material observations are presented to the Management Board.
The Global Internal Audit department is also responsible for monitoring the implementation of measures documented in the reports. The Management Board is informed about the implementation status on a quarterly basis. The Audit and Corporate Governance Committee of the Supervisory Board is also informed of the audit results. In 2014,2016, a total of 5049 audits were carried out.
As a company required to file reports under the Exchange Act, we are subject to the provisions of the Sarbanes-Oxley Act of 2002 and related listing rules of the New York Stock Exchange applicable to foreign private issuers. For further information on this requirement,these requirements, see Items 15.A. and 15.B, "Disclosure Controls and Procedures" and "Management's annual report on internal control over financial reporting."
Regulatory and Compliance Overview
Our operations are subject to extensive governmental regulation by virtually every country in which we operate including, most notably, in the U.S., at the federal, state and local levels. Although these regulations differ from country to country, in general, non-U.S. regulations are designed to accomplish the same objectives as U.S. regulations governing the operation of health care centers, laboratories and manufacturing facilities, the provision of high quality health care for patients, compliance with labor and employment laws, the maintenance of occupational, health, safety and environmental standards and the
provision of accurate reporting and billing for governmental payments and/or reimbursement. In the U.S., some states establish regulatory processes that must be satisfied prior to the establishment of new health care centers. Outside the U.S., each country has its own payment and reimbursement rules and procedures, and some countries prohibit ownership of healthcare providers or establish other regulatory barriers to direct ownership by foreign companies. In such jurisdictions, we may establish alternative contractual arrangements to provide services to those facilities.
Any of the following matters could have a material adverse effect on our business, financial condition and results of operations:
We must comply with all U.S., German and other legal and regulatory requirements under which we operate, including the U.S. federal Medicare and Medicaid Fraud and Abuse Amendments of 1977, as amended, generally referred to as the "Anti-Kickback Statute", the federal False Claims Act, the federal restrictions on certain physician referrals, commonly known as the "Stark Law", the U.S. Civil Monetary Penalties Law, including the prohibition on inducements to patients to select a particular healthcare provider, U.S. federal rules protecting the privacy and security of patient medical information, as promulgated under the Health Insurance Portability and Accountability Act of 1996 ("HIPAA") and, as amended by the Health Information Technology for Economic and Clinical Health ("HITECH") Act (enacted
(enacted as part of the American Recovery and Reinvestment Act of 2009), and other fraud and abuse laws and similar state statutes, as well as similar laws in other countries.
A number of states in which we operate have laws that prohibit business entities, such as our Company and our subsidiaries, from practicing medicine, employing physicians to practice medicine or exercising control over medical decisions by physicians (known collectively as the corporate practice of medicine prohibition). These states also prohibit entities from engaging in certain arrangements, such as fee-splitting, with physicians. Additional state and local laws and regulations require us to maintain certain licenses and certifications to operate our facilities and/or manufacture and distribute our products and services.
The Patient Protection and Affordable Care Act (Pub.L. 111-148), as amended by the Health Care and Education Reconciliation Act (Pub.L. 111-152) (collectively, "ACA") enacted in the U.S. in 2010 and other recent laws expanded the reach of many of these laws and expanded federal enforcement authority. Moreover, there can be no assurance that applicable laws, or the regulations thereunder, will not be amended, or that enforcement agencies or the courts will not make interpretations inconsistent with our own, any one of which could have a material adverse effect on our business, reputation, financial condition and operating results. Sanctions for violations of these statutes may include criminal or civil penalties, such as imprisonment, fines or forfeitures, denial of payments, and suspension or exclusion from the Medicare and Medicaid programs. In the U.S., some of these laws have been broadly interpreted by a number of courts, and significant government funds and personnel have been devoted to their enforcement because such enforcement has become a high priority for the federal government and some states. Our company, and the healthcare industry in general, will continue to be subject to extensive federal, state and foreign regulation, the full scope of which cannot be predicted. In addition, the U.S. Congress and federal and state regulatory agencies continue to consider modifications to healthcare laws that may create further restrictions. In particular, the Trump Administration has publicly announced its intention to pursue significant changes to existing health care insurance programs. In addition, proposals to restructure the Medicare program in the direction of a defined-contribution, "premium support" model and to shift Medicaid funding to a block grant or per capita arrangement, with greater flexibility for the states, may also be considered. Changes of this nature could have significant effects on our businesses, but, due to the continued uncertainty about the implementation of the ACA, including potential further legal challenges to or significant modifications to or repeal of that legislation, the outcomes and impact of such changes on our business, financial condition and results of operations are currently impossible to quantify or predict.
We maintain a comprehensive worldwide compliance program under the overall supervision of our chief compliance officer. The program includes a compliance staff, a written code of conduct applicable worldwide, training programs, regulatory compliance policies and procedures including corrective action for failure to follow policies, provisions for anonymous reporting of suspected violations of applicable laws or Company policies, and periodic internal audits of our compliance procedures. Nevertheless, weWe operate many facilities throughout the United States and other countries in which we do business. In such a decentralized system, it is often difficult to maintain the desired level of oversight and control over the thousands of individuals employed by many affiliated companies. We rely on our management structure, regulatory and legal resources, and the effective operation of our compliance program to direct, manage and monitor the activities of these employees. If our employees, deliberately or inadvertently, were to submit inadequate or incorrect billings to any federally-funded healthcare program, or engage in impermissibleunlawful conduct with physicians or other referral sources or vendors with which we do business, the
actions of such persons could subject us and our subsidiaries to liability under the Federal Food, Drug, and Cosmetic Act, Anti-Kickback Statute, the Stark Law, the False Claims Act or the FCPA,Foreign Corrupt Practices Act, among other laws. See Note 20, "Legal18, "Commitments and Regulatory MattersContingencies – Other Litigation and Potential Exposures" of the Notes to our audited consolidated financial statements.statements, included in this report.
Product Regulation
U.S. Pharmaceuticals
In the U.S. numerous regulatory bodies, including the Food and Drug Administration ("FDA")FDA and comparable state regulatory agencies impose requirements on certain of our subsidiaries as a manufacturer, distributor and a seller of medical devices and drug products under their jurisdiction.
Pharmaceuticals. Some of the products our subsidiaries manufacture and/or distribute are subject to regulation under the Federal Food, Drug, and Cosmetic Act of 1938, as amended ("FDCA") and FDA's implementing regulations. They include our peritoneal dialysis and saline solutions, PhosLo® (calcium acetate), Phoslyra® (calcium acetate oral solution), Venofer® (iron sucrose injection, USP), and
Velphoro (sucroferric oxyhydroxide),. Many of these requirements are similar to those for devices, as described below. We are required to register as an establishment with the FDA, submit listings for drug products in commercial distribution and comply with regulatory requirements governing product approvals, drug manufacturing, labelling, promotion, distribution, post market safety reporting and recordkeeping and werecordkeeping. We are subject to periodic inspections by the FDA and other authorities for compliance with theseinspections as well as with CMS sales price reporting, medical rebate and other requirements. Our pharmaceutical products must be manufactured in accordance with current Good Manufacturing Practices ("cGMP"). We are required to provide information to the FDA whenever we become aware of a report of an adverse drug experience associated with the use of one of our drug products that is both serious and unexpected, as defined in FDA regulations and guidance. In addition, as with the marketing of our medical devices, in order to obtain marketing approval of our drug products we must satisfy mandatory procedures and safety and efficacy requirements. Furthermore, the FDA prohibits our products division from promoting our pharmaceutical products in a false or misleading manner or for unapproved indications and from otherwise misbranding or adulterating them. Finally, if the FDA believes that a company is not in compliance with applicable drug regulations, it has similar enforcement authorities as those discussed below with respect to medical devices, including under the administrative, civil, and criminal penalty provisions of the FDCA. Other state and federal regulatory and enforcement agencies have authority to enforce related fraud, consumer protection, privacy, and other laws. The Trump Administration has announced its intention to simplify and accelerate the process for approval of new drugs. We cannot predict whether or when any such changes will be adopted, or what they will accomplish.
Pharmaceuticals Outside the U.S.
Some of our products, such as peritoneal dialysis solutions and PhosLo® and Phoslyra®, are considered medicinal products subject to the specific drug law provisions in various countries. The European Union has issued a directive on medicinal products for human use, No. 2001/83/EC (November 6, 2001), as amended. Each member of the European Union is responsible for conforming its law to comply with this directive. In Germany, the German Drug Law (Arzneimittelgesetz) ("AMG"), which implements European Union requirements, is the primary regulation applicable to medicinal products.
The provisions of the German Drug Law are comparable with the legal standards in other European countries. As in many other countries, the AMG provides that a medicinal product may only be placed on the market if it has been granted a corresponding marketing authorization. Such marketing authorization is granted by the licensing authorities only if the quality, efficacy and safety of the medicinal product have been scientifically proven. Medicinal products marketed on the basis of a corresponding marketing authorization are subject to ongoing control by the competent authorities. The marketing authorization may also be subsequently restricted or made subject to specific requirements.
The production of medicinal products requires a corresponding manufacturing license which is granted by the competent authorities of the relevant EU Member State for a specific manufacturing facility and for specific medicinal products and forms of medicinal products. The manufacturing license is granted only if the manufacturing facility, production techniques and production processes comply with the national drug law requirements, with the principles and guidelines of EU-Good Manufacturing Practice ("EU-GMP") as well as the terms of the particular marketing authorization. International guidelines also govern the manufacture of medicinal products and, in many cases, overlap with national requirements. Material regulations concerning manufacture and registration related to medicinal products have been issued by the European Commission and the International Conference on Harmonization of Technical Requirements for Human Use ("ICH"). In particular, the Pharmaceutical Inspection Co-operation Scheme ("PIC/S"), an international treaty, contains rules binding many countries in which medicinal products are manufactured. Among other things, the European Commission, PIC/S and ICH establish requirements for GMP which are then adopted at the national level. Another international standard, which is non-binding for medicinal products, is the ISO9001:2008 system for assuring quality management system requirements. This system has a broader platform than EU-GMP, which is more detailed and is primarily acknowledged outside the field of medicinal products, e.g., with respect to medical devices.
U.S. Medical Devices.Devices
Our subsidiaries engaged in the manufacture of medical devices are required to register with the FDA as device manufacturers and submit listing information for devices in commercial distribution. As a manufacturer of medical devices, we are subject to requirements governing premarket approval and clearance, labelling, promotion, clinical research, medical device adverse event reporting, manufacturing practices, reporting of corrections and removals, and recordkeeping, and we are subject to periodic inspection by the FDA for compliance with these requirements. With respect to manufacturing, we are subject to FDA's Quality System Regulation (21 C.F.R. Part 820), and related FDA guidance, which requires us to manufacture products in accordance with cGMP, including standards governing product design. The medical device reporting regulations and guidance require that we report to the FDA whenever we receive or become aware of information that reasonably suggests that a device may have caused or contributed to a death or serious injury, or that a device has malfunctioned and a device or similar device would be likely to cause or contribute to a death or serious injury if the malfunction were to recur. In addition, the FDA prohibits our products division from promoting our manufactured products for unapproved or uncleared indications or in an otherwisea false or misleading manner.
In order We are also prohibited from promoting unapproved or uncleared drugs or devices more generally. Finally, as with our pharmaceutical products, states impose additional requirements on our drug and device manufacturing and distribution activities, including requiring additional state licenses. We are subject to clinically test, produce and market certain medical products and other disposables (including hemodialysis and peritoneal dialysis equipment, dialyzers, bloodlines and other disposables) for human use, we must also satisfy mandatory procedures and safety and efficacy requirements establishedperiodic inspections by the FDA or comparable foreign governmental agencies. Inand other authorities for compliance with these requirements.
Medical Devices Outside the U.S., unless 510(k)-exempt, medical devices generally require approval of a Premarket Approval Application ("PMA") or clearance of a Section 510(k) Premarket Notification ("510(k)") prior to commercial marketing. After approval or clearance to market is given, the FDA, upon the occurrence of certain events, has the authority to withdraw the approval or clearance or require changes to a device, its manufacturing process, or its labelling or may require additional proof that regulatory requirements have been met. Such rules generally require that products be approved or cleared by the FDA as safe and effective for their intended use prior to being marketed.
PMA approval is based on a determination by FDA that the PMA contains sufficient valid scientific evidence to assure that the device is safe and effective for its intended use(s). Many medical devices do not
require PMA approval by the FDA, but rather require 510(k) premarket clearance. For these devices, which are usually deemed to pose a moderate risk to patients, in order to obtain marketing clearance, the applicant must demonstrate that the device is as safe and effective or "substantially equivalent" to a legally marketed "predicate" device. Moreover, FDA regulations also require prior approval or clearance for certain modifications to a legally marketed device. In recent years, concerns have been raised that the 510(k) process cannot adequately ensure that medical devices cleared for marketing are safe and effective. At the same time, others have raised concerns that the 510(k) process and the FDA's device premarket review programs generally, are inefficient and unpredictable, and are stifling innovation. Since 2010, the FDA has been evaluating and making improvements to its device premarket review programs, in particular the 510(k) clearance process. The stated goal of these improvements is to achieve regulation that promotes both safety/effectiveness and innovation. Substantially, all of the dialysis products that we manufacture or distribute in the U.S., other than peritoneal dialysis solutions and renal pharmaceuticals, are marketed on the basis of 510(k) clearances. At the present time, regulatory and legislative changes to the 510(k) clearance process continue to be proposed, and we cannot predict whether or to what extent the 510(k) process will be significantly modified or what the effects, if any, of a modified review process for medical devices would be on our dialysis products business.
If the FDA believes that a company is not in compliance with applicable laws and regulations, it can pursue various regulatory and enforcement actions, including, for example, issuing a warning letter mandating a recall, initiating seizure or seeking injunction or consent decree. On September 15, 2010, the FDA issued a warning letter to us citing several cGMP deficiencies, in response to which we have been taking corrective action and are subject to re-inspections by the FDA. In any re-inspection the FDA is not limited to reviewing only the processes and procedures that triggered the re-inspection. We are engaged in ongoing remediation efforts and continued dialogue with the FDA regarding remediation.
On April 6, 2011 the FDA issued to us a warning letter alleging that we marketed certain blood tubing sets without required premarket 510(k) clearance, in response to which we ceased marketing and distributing those blood tubing sets that were the subject of a January 2011 recall. We received 510(k) clearance of the blood tubing set product from the FDA on June 15, 2012 and subsequently recommenced marketing and distribution of these products. In addition, we have completed a comprehensive review of our 510(k) filings and submitted our findings to the FDA, and we continue to work with the FDA regarding effective submission strategies for certain product lines.
On March 29, 2012, we issued an urgent product notification regarding our NaturaLyte® Liquid and Granuflo® acid concentrate products that are used as one component of dialysate. The notification, which was also incorporated into revised product labels, reflected a memorandum issued by the Fresenius Medical Services Chief Medical Office in November 2011 and cautioned clinicians about possible risks for acid-base management in patients associated with inappropriate prescription of these products. The FDA subsequently classified the notification and related labeling revisions as a Class I recall, and issued its own Safety Communication warning physicians about the need to prescribe all acid concentrate products currently available on the market appropriately.
After reconsideration of the November 2011 memorandum, the FDA in May 2014 permitted the Company to withdraw the March 29, 2012 notification and to revise its product labels consistently with that withdrawal. The FDA has not requested any change in the composition of the Company's acid concentrate products, nor has it requested any return or removal of products in connection with the controversy surrounding the November 2011 memorandum. The FDA's Safety Communication directed at all dialysate products remains in effect. Wrongful death and personal injury litigation predicated on the November 2011 memorandum continues. See Note 20 of the Notes to Consolidated Financial Statements, "Commitments and Contingencies – Commercial Litigation" included in this report.
On March 6, 2013, the FDA issued a warning letter following a two week inspection of the Ogden, Utah facility. The warning letter alleges two violations of cGMP requirements. First, the FDA asserts FMCNA did not conduct adequate design verification studies related to electron beam (E-Beam) sterilized polysulfone dialyzers. Second, the FDA alleges the corresponding design validation of these dialyzers is incomplete. FMCNA has responded to these allegations and is actively working with the FDA to resolve any issues.
We cannot assure that all necessary regulatory clearances or approvals, including those for new products or product improvements, will be granted on a timely basis, if at all. Delays in or failure to receive clearance or approval, delays in or failures to carry out product recalls or corrective actions under warning letters or other regulatory enforcement actions may materially adversely affect operating results.
International (Including Germany and Other Non-U.S)
The Company sells its dialysis products in over 120 countries. Most countries maintain different regulatory regimes for medicinal products and for medical devices. In almost every country, there are rules regarding the quality, effectiveness, and safety of products and regulating their testing, production, and distribution. Treaties or other international law and standards and guidelines under treaties or laws may supplement or supersede individual country regulations.
Pharmaceuticals. Some of our products, such as peritoneal dialysis solutions and PhosLo® and Phoslyra®, are considered medicinal products and are, therefore subject to the specific drug law provisions in the various countries. The European Union has issued a directive on medicinal products, No. 65/65/EWG (January 26, 1965), as amended. Each member of the European Union is responsible for conforming its law to comply with this directive. In Germany the German Drug Law (Arzneimittelgesetz) ("AMG"), which implements European Union requirements, is the primary regulation applicable to medicinal products.
The provisions of the German Drug Law are comparable with the legal standards in other European countries. As in many other countries, the AMG provides that a medicinal product may only be placed on the market if it has been granted a corresponding marketing authorization. Such marketing authorization is granted by the licensing authorities only if the quality, efficacy and safety of the medicinal product has been scientifically proven. Medicinal products marketed on the basis of a corresponding marketing authorization are subject to ongoing control by the competent authorities. The marketing authorization may also be subsequently restricted or made subject to specific requirements. It may be withdrawn or revoked if there was a reason for the refusal of the marketing authorization upon its grant or such a reason arises subsequently, or if the medicinal product is not an effective therapy or its therapeutic effect has been insufficiently proven according to the relevant state of scientific knowledge. Such a reason for refusal is, inter alia, found to exist if there is a well-founded suspicion that the medicinal product has not been sufficiently examined in accordance with the current state of scientific knowledge, that the medicinal product does not show the appropriate quality, or that the medicinal product, when properly used as intended, produces detrimental effects going beyond the extent justifiable according to the current state of knowledge of medicinal science. The marketing authorization can also be withdrawn or revoked in the case of incorrect or incomplete information supplied in the authorization documents, if the quality checks prescribed for the medicinal product were insufficient or have not been sufficiently carried out, or if the withdrawal or revocation is required to comply with a decision made by the European Commission or the Council of the European Union. Instead of a withdrawal or revocation, the suspension of the marketing authorization may be ordered for a limited period.
The provisions of the AMG and a statutory order, Arzneimittel- und Wirkstoffherstellungsverordnung, also contain special requirements for the manufacture of medicinal products. The production of medicinal products requires a corresponding manufacturing license which is granted by the competent authorities of the relevant Member State for a specific manufacturing facility and for specific medicinal products and forms of medicinal products. The manufacturing license is granted only if the manufacturing facility, production techniques and production processes comply with the national drug law requirements, with the principles and guidelines of EU-good manufacturing practice ("EU-GMP") as well as the terms of the particular marketing authorization. A manufacturer of medicinal products must, inter alia, employ pharmacists, chemists, biologists, or physicians responsible for the quality, safety and efficacy of the medicinal products. The manufacturer must name several responsible persons: a Qualified Person (QP) for the release of the medicinal product into the market possessing the expert knowledge specified by the AMG, a head of production, a head of quality control, and, if the manufacturer markets the medicinal products itself, a commissioner for the so-called graduated plan (Stufenplanbeauftragter for Germany, a Qualified Person for Pharmacovigilance (QPP) for the European Union) and an information officer. It is the responsibility of the QP to ensure that each batch of the medicinal products is produced and examined in compliance with the statutory provisions of the AMG. The QPP must, among other things, collect and assess any reported risks associated with the medicinal products and coordinate any necessary measures according to German Drug Law. The QPP, residing within the European Economic Area, is responsible for pharmacovigilance and the establishment of a system for handling of all suspected adverse reactions that need to be reported. The information officer is in charge of the scientific information relating to the medicinal products. All these persons may be held personally liable under German criminal law for any breach of the AMG.
International guidelines also govern the manufacture of medicinal products and, in many cases, overlap with national requirements. Material regulations concerning manufacture and registration related to medicinal products have been issued by the European Commission and the International Conference on Harmonization of Technical Requirements for Human Use ("ICH"). In particular, the Pharmaceutical Inspection Co-operation Scheme ("PIC/S") an international treaty, contains rules binding many countries in which medicinal products are manufactured. Among other things, the European Commission, PIC/S and ICH establish requirements for GMP which are then adopted at the national level. Another international standard, which is non-binding for medicinal products, is the ISO9001:2008 system for assuring quality management system requirements. This system has a broader platform than EU-GMP, which is more detailed and is primarily acknowledged outside the field of medicinal products, e.g., with respect to medical devices.
Medical Devices. In the past, medical devices were subject to less stringent regulation than medicinal products in some countries. In the last decade, however, statutory requirements have been increased. In the EU, the requirements to be satisfied by medical devices are laid down in three European directives to be observed by all Member States and all Member States of the European Economic Area ("EEA"), as well as all future accession states: (1) Directive 90/385/EEC of June 20, 1990 relating to active implantable medical devices ("AIMDs"), as last amended ("AIMD Directive"), (2) Directive 93/42/EEC of June 14, 1993 relating to medical devices, as last amended ("MD Directive"), and (3) Directive 98/79/EC of October 27, 1998 relating to in vitro diagnostic medical devices as last amended ("IVD Directive"). In addition, Directive 2001/95/EC of December 3, 2001, as last amended, concerning product safety should be noted. The MD Directive, has been amended, 2007/47/EC, with the intention to achieve improvements, including in the following areas: clinical assessment by specification of the requirements in more detail; monitoring of the devices after their placing on the market; and decision making by enabling the Commission to make binding decisions in case of contradictory opinions of states regarding the classification of a product as a medical device. In the future, the industry will face increasing requirements for medical devices. In September 2012, the first draft of a new regulation on medical devices, Medical Device Regulation ("MDR"), was published by the European Commission. In October 2013, this draft, supplemented by additional amendments, was voted on by the European Parliament and subsequently published. It provided for further tightening of regulations for the manufacture of medical devices, as it applies to both manufacturers and accredited organizations within the EU ("Notified Bodies") that examine the conformity evaluation of the production process completed on behalf of the manufacturers. In October 2015, the European Commission, Parliament and Council met to form a consolidated opinion for assessing product standards.the MDR. The final regulation was published in June. Currently, work is ongoing to translate the final text in all the EU official languages and to correct technical inconsistencies. The MDR is expected to replaceenter into force in the MD Directive by approximately 2015/2016.second quarter of 2017 with a transition period of three years.
According to the EU directives relating to medical devices, the CE mark (the abbreviation of Conformité Européenne signifying that the device complies with all applicable requirements) shall serve as a general product passport for all Member States of the EU and the EEA. Upon receipt of a CE certificate for a product according to the applicable conformity assessment procedure, e.g. a certified full quality management system for medical devices according to ISO13485:2012,2015, and the documented declaration and proof of conformity of our products to the harmonized European norms (Declaration of Conformity), we as the legal manufacturer are able to mark products as being in compliance with the European Community ("EC") requirements. If able to do so, the manufacturer must place a "CE" mark on the products. Medical devices that do not bear the "CE" mark cannot be imported, sold or distributed within the EC.
The right to affixFDA Enforcement Action
If the CE markFDA believes that a regulated company is granted to any manufacturer who has observed the conformity assessment procedure prescribed for the relevant medical devicenot in compliance with applicable laws and submitted the EC declaration of conformity before placing the medical device on the market. The conformity assessment procedures were standardized by Council Decision 93/465/EEC of July 22, 1993, which established modules for theregulations, it can pursue various phases of the conformity assessment procedures intended to be used in the technical harmonization normsadministrative and the rules for the affixing and use of the CE conformity mark. The conformity assessment modules to be used differ depending on the risk class of the medical device to be placed on the market. The classification rules for medical devices are, as a general rule, based upon the potential risk of causing harm to the human body. Annex IX to the MD Directive (making a distinction between four product classes I, IIa, IIb, and III) and Annex II to the IVD Directive (including a list of the products from lists A and B) contain classification criteria for products and product lists that are, in turn, assigned to specific conformity assessment modules. AIMDs represent a product class of their own and are subject to the separate AIMD Directive. Special rules apply,enforcement actions, including, for example, to custom-made medical devices, medical devices manufactured in-house, medical devices intended for clinical investigationissuing an untitled or in vitro diagnostic medical devices intended for performance evaluation, as well as for diagnostic medical devices for in-house use ("lay use"), combination devices and accessories to medical devices.warning letter, initiating a seizure action, or seeking an injunction. Among other things,
The conformity assessment procedures for Class I devices with a low degree of invasivenessthese actions can result in the human body (e.g. devices without a measuring function that are not subjectassessment of administrative penalties, product recalls, and civil or criminal enforcement. Such actions could also lead to any sterilization requirements), can be made under the sole responsibility of the manufactureradditional enforcement by submitting an EC declaration of conformity (a self-certificationother state or self-declaration). For Class IIa devices, the participation of a Notified Body is mandatory for the production phase. Devices of classes IIb and III involving a high risk potential are subject to inspection by the Notified Body not only in relation to their manufacture (as for class IIa devices), but also in relation to their specifications and design. Class III is reserved for the most critical devices the marketing of which is subject to an explicit prior authorization with regard to their conformity. In risk categories IIa, IIb and III, the manufacturer can make use of several different conformity assessment modules.
To maintain the high quality standards and performance of our operations, we have subjected our entire European business to the most comprehensive procedural module, which is also the fastest way to launch a new product in the European Union. This module requires the certification of a full quality management system by a Notified Body charged with supervising the quality management system from design, manufacture, and distribution, to after sales service.
Our Series 5008 and 4008 dialysis machines, their accessories and devices and their therapy modifications, our Sleep-safe cycler for automated PD treatment, the multiFiltrate system, and our other active medical devices distributed in the European market,federal government agencies as well as law suits by patients or shareholders.
On April 6, 2011 the FDA issued to us a warning letter alleging that we marketed certain blood tubing sets without required premarket 510(k) clearance, in response to which we ceased marketing and distributing those blood tubing sets that were the subject of a January 2011 recall. We received 510(k) clearance for the blood tubing set product from the FDA on June 15, 2012 and subsequently recommenced marketing and distribution of these products. In addition, we have completed a comprehensive review of our dialysis filters510(k) filings and dialysis tubing systemssubmitted our findings to the FDA, and accessories, all bear the "CE" mark. We expect towe continue to obtain additional certificateswork with the FDA regarding effective submission strategies for newly developedcertain product lines.
On March 29, 2012, we issued an urgent product notification regarding our NaturaLyte® Liquid and Granuflo® acid concentrate products that are used as one component of dialysate. The notification, which was also incorporated into revised product labels, reflected a memorandum issued by the Fresenius Medical Services Chief Medical Office in November 2011 and cautioned clinicians about possible risks for acid-base management in patients associated with inappropriate prescription of these products. The FDA subsequently classified the notification and related labelling revisions as a Class I recall, and issued its own Safety Communication warning to physicians about the need to prescribe all acid concentrate products currently available on the market appropriately.
After reconsideration of the November 2011 memorandum, the FDA in May 2014 permitted the Company to withdraw the March 29, 2012 notification and to revise its product labels consistently with that withdrawal. The FDA has not requested any change in the composition of the Company's acid concentrate products, nor has it requested any return or removal of products in connection with the controversy surrounding the November 2011 memorandum. The FDA's Safety Communication directed at all dialysate products remains in effect. Wrongful death, personal injury, and other litigation predicated on the November 2011 memorandum continues. See Note 18 of the Notes to Consolidated Financial Statements, "Commitments and Contingencies – Commercial Litigation" included in this report.
We cannot assure that all necessary regulatory clearances or approvals, including those for new products or product groups.improvements, will be granted on a timely basis, if at all. Delays in or failure to receive clearance or approval or delays in or failures to carry out product recalls may result in liability and reputational harm and may materially adversely affect our operating results. If at any time the FDA believes we are not in compliance with applicable laws and regulations, the FDA could take administrative, civil, or criminal enforcement action, resulting in liability and reputational harm, which could materially affect our operating results.
Sales of Dialysis Products to Iran.Iran
The Company actively employs comprehensive policies, procedures and systems to ensure compliance with applicable controls and economic sanctions laws. The Company has allocated resources to design, implement and maintain a compliance program specific to the Company's U.S. and non-U.S. activities. At the same time, the Company's dedication to providing its life-saving dialysis products to patients and sufferers of end-stage renal disease extends worldwide, including conducting humanitarian-related business with distributors in Iran in compliance with applicable law. In particular, the Company's product sales to Iran from Germany are not subject to the EU's restrictive measures against Iran established by EU Council Implementing Regulation (EU) No. 1202/2014267/2012 of November 7, 2014,March 23, 2012, as last amended by the EU Council Regulation No. 42/2014(EU) 2016/31 of January 20, 2014,14, 2016, as the Company's products sold to Iran do not fall within the scope of the EU sanctions and none of the end users or any other person or organization involved is listed on the relevant EU sanctions lists. Because the Company's sales to Iran were and are made solely by its German subsidiaries, the sales are not subject to the Iranian Transactions and Sanctions Regulations, 31 C.F.R Part 560 ("ITSR"), and are not eligible for licenses from the U.S. Treasury Department's Office of Foreign Assets Control ("OFAC") pursuant to the Trade Sanctions Reform and Export Enhancement Act of 2000. Also, ITSR § 560.215(a) is not applicable in the present case because the Company does not have a U.S. parent company and is not in any other way owned or controlled by a United States person, and the Company's affiliates involved in Iran-related transactions are not owned or controlled by a United States person. That the Company has a U.S. subsidiary does not cause the ITSR to apply to the Company's Iran-related transactions (because the sales by the Company's non-U.S. affiliates are outside the scope of ITSR §560.215(a)). In any case, OFAC's public guidance provides that sales of medical devices to Iran by non-U.S. companies are generally subject to humanitarian exceptions under U.S. sanctions targeting Iran.
During the year ended December 31, 2014,2016, the Company sold approximately $11.5$12.5 million of dialysis products to independent Iranian distributors and other foreign distributors for resale, processing and assembling in Iran. The products included fibre bundles, hemodialysis concentrates, dialysis machines and parts, and related disposable supplies. The sales of these products generated approximately $7$8.1 million in operating income. During 2014,2016, we also paid approximately $32$2 thousand in transportation costs most of which were reimbursed by the distributors. All such sales were made by the Company's German subsidiaries. Based on information available to the Company, the Company believes that most if not all products were eventually sold to hospitals in Iran through state purchasing organizations affiliated with the Iranian Ministry of Health and were therefore sales to the "Government of Iran" as defined in ITSR § 560.304. The Company's 20142016 sales to Iran represent 0.10%0.06% of its total revenues. The Company has no subsidiaries, affiliates or offices, nor does it have any direct investment or own any assets, in Iran. In light of the humanitarian nature of its products and the patient communities that benefit from our products, the Company expects to continue selling dialysis products to Iran, provided such sales continue to be permissible under applicable export control and economic sanctions laws and regulations.
Potential Changes Impacting our Private Payors
Table On December 14, 2016, CMS published an Interim Final Rule (IFR) titled "Medicare Program; Conditions for Coverage for End-Stage Renal Disease Facilities-Third Party Payment" that would amend the Conditions for Coverage for dialysis providers, like FMCNA. The IFR would have effectively enabled insurers to reject premium payments made by patients who received grants for individual market coverage from the American Kidney Foundation ("AKF") and therefore, could have resulted in those patients losing their individual market coverage. The loss of Contentsindividual market coverage for these patients would have had a material and adverse impact on the revenues and earnings of FMCNA. On January 25, 2017, a federal district court in Texas, responding to litigation initiated by a patient advocacy group and dialysis providers including FMCNA, preliminarily enjoined CMS from implementing the IFR. Dialysis Patient Citizens v. Burwell (E.D. Texas, Sherman Div.). The preliminary injunction is based on CMS' failure to follow appropriate notice-and-comment procedures in adopting the IFR. The preliminary injunction will remain in place in the absence of a contrary ruling by the district or appellate courts. At this time, the extent to which CMS will continue to contest the preliminary injunction is unclear. It is also unclear whether CMS will elect to pursue, through notice and comment, another rule related to this topic. The operation of charitable assistance programs is also receiving increased attention by state regulators, including State Departments of Insurance. The result may be a regulatory framework that differs from state to state. Even in the absence of the IFR or similar administrative actions, insurers are expected to continue to take steps to thwart the premium assistance provided to our patients for individual market plans as well as other insurance coverages.
Environmental Regulation
We are subject to a broad range of federal, foreign, state and local laws and regulations relating to pollution and the protection of the environment. These laws regulate, among other things, the discharge of materials into the environment, the handling and disposal of wastes, remediation of contaminated sites and other matters relating to worker, public and consumer health, and safety andas well as to the protection of the environment. In addition, the Company uses substances regulated under U.S. and EuropeanEU environmental laws, primarily in product design as well as manufacturing and sterilization processes. Noncompliance with these regulations can result in significant fines or penalties or limitations on our operations. The applicable environmental, health and safety laws and regulations, and any changes to them or their enforcement, may require us to make material expenditures with respect to ongoing compliance with or remediation under these laws and regulations or require that we modify our products or processes in a manner that increases our costs or reduces revenues.
An Environmental Management System ("EMS") based on ISO 14001:2004 has been established in our main European production plants and in a high number of dialysis clinics in the European region. Compliance with environmental laws and regulations is a core objective of our EMS. Internal and external audits are organized and performed to verify compliance with the EMS requirements and applicable environmental laws and regulations. For additional information, see "– Environmental Management," above.
Facilities and Operational Regulation
U.S.
Federal, state and local regulations (implemented by CMS, FDA, the Occupational Health and Safety Administration ("OSHA"), the Drug Enforcement Administration, and state departments or boards of public health, public welfare, medicine, nursing, pharmacy, and medical assistance, among others) require us to meet various standards relating to, among other things, the management, licensing, safety, security and operation of facilities (including, e.g., laboratories, pharmacies, and clinics), personnel qualifications and licensing, the maintenance of proper records, equipment, and quality assurance programs, and the dispensing, storage, and administration of controlled substances. All of our operations in the U.S. are subject to periodic inspection by federal, state and local agencies to determine if the operations, premises, equipment, personnel and patient care meet applicable standards. To receive Medicare/Medicaid reimbursement, our health care centers, renal diagnostic support business and laboratories must be certified by CMS. While all of our entities that furnish Medicare or Medicaid services maintain and renew the required certifications, it is possible that any such entity could lose or be delayed in renewing a certification, which could have a material adverse effect on our business, financial condition, and results of operations.
Certain of our facilities and certain employees are also subject to state licensing statutes and regulations. These statutes and regulations are in addition to federal and state rules and standards that must be met to qualify for payments under Medicare, Medicaid and other government reimbursement programs. Licenses and approvals to operate these centers and conduct certain professional activities are customarily subject to periodic renewal and to revocation upon failure to comply with the conditions under which they were granted.
The Clinical Laboratory Improvement Amendments of 1988 ("CLIA") subjects virtually all clinical laboratory testing facilities, including ours, to the jurisdiction of the Department of Health and Human Services ("HHS"). CLIA establishes national standards for assuring the quality of laboratories based upon the complexity of testing performed by a laboratory. Certain of our operations are also subject to federal laws governing the repackaging and dispensing of drugs and the maintenance and tracking of certain life sustaining and life-supporting equipment.
Our operations are subject to various U.S. Department of Transportation, Nuclear Regulatory Commission, Environmental Protection Agency, and OSHA requirements and other federal, state and local hazardous and medical waste disposal laws. As currently in effect, laws governing the disposal of hazardous waste do not classify most of the waste produced in connection with the provision of our health care services as hazardous, although disposal of nonhazardousnon-hazardous medical waste is subject to specific state regulation. Our operations are also subject to various air emission and wastewater discharge regulations.
OSHA regulations require employers to provide employees who work with bloodA few states have certificate of need programs regulating the establishment or other potentially infectious materials with prescribed protections against blood-borne and air-borne pathogens. These regulatory requirements apply to allexpansion of healthcare facilities, including dialysis clinics and other health care
Tablecenters. We believe that we have obtained all necessary approvals for the operation of Contents
centers and laboratories, and require employers to make a determination as to which employees may be exposed to blood or other potentially infectious materials and to haveour healthcare facilities in effect a written exposure control plan. In addition, employers are required to provide hepatitis B vaccinations, personal protective equipment, blood-borne pathogens training, post-exposure evaluation and follow-up, waste disposal techniques and procedures, engineering and work practice controls and other OSHA-mandated programs for blood-borne and air-borne pathogens.
Some states in which we operate haveaccordance with all applicable state certificate of need ("CON") laws that require any person or entity seeking to establish a new healthcare service or to expand an existing service to apply for and receive an administrative determination that the service is needed. Several states in which we operate, as well as the District of Columbia and Puerto Rico have CON laws applicable to our health care centers. These requirements could, as a result of a state's internal determination of its dialysis service needs, prevent entry to new companies seeking to provide services in these states, and could constrain our ability to expand our operations in these states.laws.
International (Including Germany and Other Non-U.S.)
Most countries outside of the U.S. regulate operating conditions of dialysis clinics and hospitals and the manufacturing of dialysis products, medicinal products and medical devices.
We are subject to a broad spectrum of regulation in almost all countries. Our operations must comply with various environmental and transportation regulations in the various countries in which we operate. Our manufacturing facilities and dialysis clinics are also subject to various standards relating to, among other things, facilities, management, personnel qualifications and licensing, maintenance of proper records, equipment, quality assurance programs, the operation of pharmacies, the protection of workers from blood-borne diseases and the dispensing of controlled substances. All of our operations may be subject to periodic inspection by various governmental authorities to determine if the operations, premises, equipment, personnel and patient care meet applicable standards. Our dialysis clinic operations and our related activities generally require licenses, which may be subject to periodic renewal and may be revoked for violation of applicable regulatory requirements.
In addition, many countries impose various investment restrictions on foreign companies. For instance, government approval may be required to enter into a joint venture with a local partner. Some countries do not permit foreign investors to own a majority interest in local companies or require that companies organized under their laws have at least one local shareholder. Investment restrictions therefore affect the corporate structure, operating procedures and other characteristics of our subsidiaries and joint ventures in these and other countries.
We believe our facilities are currently in compliance in all material respects with the applicable national and local requirements in the jurisdictions in which they operate.
Reimbursement
As a global company delivering health care and dialysis products, we are represented in more than 120 countries worldwide. Consequently, we face the challenge of addressing the needs of a wide variety of stakeholders, such as patients, customers, payors and legislators in very different economic environments and healthcare systems.
Healthcare systems and reimbursement structures for ESRD treatment vary significantly by country. In general, the government (in some countries in coordination with private insurers) or social insurance programs pay for health care. Funding is achieved through taxes and other sources of government income, from social security contributions, or a combination of those sources. However, not all healthcare systems provide for dialysis treatment. In some developing countries, only limited subsidies from government, social insurances or charitable institutions are available, and typically dialysis patients must personally finance all or a substantial share of the treatment cost. Irrespective of the funding structure, in some countries patients in need of dialysis do not receive treatment on a regular basis but rather when the financial resources allow it.
U.S.
Health Care Services. Our dialysis clinics provide outpatient hemodialysis treatment and related services for ESRD patients. In addition, some of the Company's clinics offer services for the provision of peritoneal dialysis and hemodialysis treatment at home, and dialysis for hospitalized patients.
The Medicare and Medicaid programs are the largest single source of health care services revenues from dialysis treatment. Approximately 51% of North America Segment health care services revenues for 2014 (amounting to 31% of our worldwide revenue) were for services rendered patients covered by Medicare's ESRD program and Medicaid. In order to be eligible for reimbursement by Medicare, ESRD facilities must meet conditions for coverage established by CMS.
U.S., Medicare pays as the primary insurer for Medicare-eligible individuals under some circumstances. For details, see "– Coordination of Benefits" below. For Medicare-primary patients, Medicare pays 80% of the prospective payment amount for the ESRD PPS items and services. The beneficiary or third-party insurance payors (including employer-sponsored health insurance plans, commercial insurance carriers and the Medicaid program) on behalf of the beneficiary are responsible for paying the beneficiary's cost-sharing obligations (typically thean annual deductible and 20% co-insurance), subject to the specific coverage policies of such payors. Each third-party payor, including Medicaid, makes payment under contractual or regulatory reimbursement provisions that may or may not cover the full 20% co-payment or annual deductible. Where the beneficiary has no third-party insurance or the third-party insurance does not fully cover the co-payment or deductible, the beneficiary is responsible for paying the co-payments or the deductible, which we frequently cannot fully collect despite collection efforts. In some states, Medicaid doesMedicare Advantage plans are required to pay to their out-of-network providers at least the rate applicable in the traditional Medicare fee-for-service program. As a result, Medicare Advantage plans with which we do not fully cover the cost-sharing obligations of Medicare-Medicaid dually eligible individuals, and we are precluded from collecting directly from these beneficiaries. Under an advisory opinion from the Officehave a contract will pay at least 80% of the Inspector Generalprospective payment amount for the ESRD PPS items and services we provide their members. We have also entered into network contracts with several Medicare Advantage plans pursuant to which we may be entitled to higher reimbursement than traditional Medicare rates.
Medicare's ESRD Prospective Payment System. Under the ESRD PPS, CMS reimburses dialysis facilities with a single payment for each dialysis treatment, inclusive of (i) all items and services included in the former composite rate, (ii) oral vitamin D analogues, oral levocarnitine (an amino acid derivative) and all ESAs and other pharmaceuticals (other than vaccines) furnished to ESRD patients that were previously reimbursed separately under Part B of the DepartmentMedicare program, (iii) most dialysis-related diagnostic laboratory tests and (iv) certain other items and services furnished to individuals for the treatment of ESRD.
The base ESRD PPS payment is subject to case mix adjustments that take into account individual patient characteristics (e.g., age, body surface area, body mass, time on dialysis) and certain co-morbidities. The base payment is also adjusted for (i) certain high cost patient outliers due to unusual variations in medically necessary care, (ii) disparately high costs incurred by low volume facilities relative to other facilities, (iii) provision of home dialysis training and (iv) wage-related costs in the geographic area in which the provider is located.
The Protecting Access to Medicare Act of 2014 ("PAMA") provides that rates will be updated by the market basket rate of increase net of the multifactor productivity adjustment. PAMA further specified that reductions of 1.25 percentage points in each of 2016 and 2017 and a 1.0 percentage point reduction in 2018. In addition, the law mandates that ESRD-related drugs with only an oral form, including PhosLo®, are expected to be reimbursed under the ESRD PPS in the future with an adjusted payment amount to be determined by the Secretary of Health and Human Services subject to specified conditions, wereflect the additional cost to dialysis facilities of providing these medications. Subsequently, the Achieving a Better Life Experience Act of 2014 delayed inclusion of such drugs, which are referred to as "oral-only" drugs, in the ESRD PPS until January 1, 2025. At present only phosphate binders and calcimimetics are considered "oral-only" drugs.
On November 4, 2016, the CMS issued the final rule updating the ESRD PPS rate for 2017. Large dialysis organizations will experience a 0.7% increase in payments. The base rate per treatment is $231.55, 0.5% above the 2016 base rate of $230.39. The 2016 final rule reflects a net payment rate update of 0.55% (2.1% less a 1.25% PAMA reduction and 0.3% productivity adjustment), application of a wage index budget-neutrality adjustment factor of 0.999781 and application of a training budget-neutrality adjustment factor of 0.999737.
On November 6, 2015, CMS published the final ruling regarding the ESRD PPS rate for 2016. The base rate per treatment was $230.39, which represents an approximate reduction of 4%, net, from the 2015 base rate. The 2016 final ruling reflected a net market basket increase of 0.15% (2% less 1.25% PAMA reduction and 0.6% productivity adjustment), application of a wage index budget-neutrality adjustment factor of 1.000495 and application of a refinement budget-neutrality adjustment factor of 0.960319. However, the approximate 4% reduction was almost completely offset with CMS case mix adjustments based upon their analysis of the fiscal years 2012 and 2013.
Sequestration of Medicare Payments. On August 2, 2011, the U.S. Budget Control Act of 2011 ("BCA") was enacted, raising the U.S. debt ceiling and putting into effect a series of actions for deficit reduction. The BCA, in effect, required automatic across-the-board spending cuts for most government programs over nine fiscal years (2013-2021); these cuts were projected to total $1.2 trillion. The first cuts for Medicare payments to providers and suppliers were implemented on April 1, 2013. The Bipartisan Budget Act of 2013 extended the cuts to mandatory spending programs, including Medicare, for an additional two years. The reduction in Medicare payments to providers and suppliers (the "U.S. Sequestration") is limited to one adjustment of no more than 2 percent in each year through 2022, rising to 2.9 percent for the first half of FY 2023 and dropping to 1.11 percent for the second half of FY 2023. As mandated by PAMA, the reductions pursuant to U.S. Sequestration for the first six months of 2024 will be 4 percent, and there will be no reductions for the second six months of 2024. The Medicare sequestration reimbursement reduction is independent of annual inflation update mechanisms, such as the market basket update pursuant to the ESRD PPS.
On October 29, 2015, CMS issued a final rule to update payment policies and rates under the ESRD PPS for renal dialysis services furnished on or after January 1, 2016. In this final rule, CMS clarified that once any non-oral drug in a category previously considered "oral only" is approved by the FDA, such category of drugs will cease to be considered oral only. At such time, CMS will include both the oral and any non-oral version of the drug in the ESRD PPS. However, for at least two years after FDA approval, CMS will pay for both oral and non-oral versions of the drug using a transition drug add-on payment adjustment, such as average sales price plus 6%, or some other similarly situated providers may make contributions to a non-profit organization that has created a program to subsidize premiummechanism set in accordance with Section 1847A of the Social Security Act. During this transition period, CMS will not pay outlier payments for supplemental medical insurance and/these drugs, but will collect data reflecting utilization of both the oral and injectable or "Medigap" insurance on behalfintravenous forms of indigentthe drugs, as well as payment patterns, in order to more accurately determine the appropriate payment rate to be included in the ESRD patients, including somePPS for these drugs. At the end of this transition period, CMS will add payment for the oral and non-oral versions of the drug into the ESRD PPS through a public rulemaking process similar to that used to set annual ESRD PPS rates. On February 7, 2017, the FDA approved an intravenous calcimimetic, Parsabiv. Once Parsabiv is assigned a healthcare common procedure coding system code, CMS will issue a change request and billing guidance to transition both intravenous Parsabiv and oral cinacalcet, Sensipar, into the ESRD PPS bundle to be paid under the transitional add-on adjustment methodology for at least two years as described above. Once CMS assigns an effective date of the change, Sensipar will no longer be reimbursed under Medicare Part D for ESRD Medicare beneficiaries and will be reimbursed under Medicare Part B as an add-on adjustment for at least two years.
Revisions to Medicare's physician fee schedule. The Medicare and CHIP Reauthorization Act of 2015 ("MACRA") removed the periodic threat of substantial reductions in payment rates under the Physician Fee Schedule ("PFS") that could have, if they had been permitted to take effect, significantly affected our businesses and those of our patients.affiliated physicians. MACRA permanently removed the "sustainable growth rate" provision and in its place specified modest increases in PFS payment rates for the next several years. MACRA creates an elaborate scheme of incentive payments and penalty adjustments starting in 2019 based on 2017 physician performance as reflected in various measures of cost, use of health information technology, practice improvement activities, and quality of care and on possible participation in "advanced alternative payment models," such as some accountable care organizations. We cannot predict whether this scheme is likely to have material effects on our revenues and profitability in our nephrology, urgent care, vascular, cardiovascular and endovascular speciality services or in our hospitalist business. Through an annual rule-making cycle, CMS revises PFS payment rates to account for across-the-board updates as well as, from time to time, changes in the evaluation of physician work and practice expenses used to set rates for individual services paid under the PFS. While impacts of large changes are usually spread out over several years, such changes have the potential to affect the rates for specific services that are extensively furnished in our physician businesses and hence to affect materially the revenues of those businesses.
Vascular Care. Dialysis requires On November 15, 2016, CMS issued a final rule entitled CY 2017 Revisions to Payment Policies under the Physician Fee Schedule and Other Revisions to Part B in which it substantially reduced the reimbursement rate for certain vascular access services provided in the physician office setting. Given the range of procedures provided in a vascular access center, these cuts represent an average reduction of 20.5% compared to the bloodstream, which is accomplished by catheters, grafts, or arteriovenious fistulas. Our subsidiaries,prior year. For the most common ESRD access related procedures, the cuts represent an average reduction of 32.2% compared to the prior year. Fresenius Vascular Care Inc. ("FVC")is shifting its facility operating model to an ambulatory surgery center. This more regulated place of service allows Fresenius Vascular Care to enhance its coordination of care efforts and NCP, own and/or manageexpand services while offering a numbermore specialized and less costly site of outpatient vascular accessservice as compared to an inpatient setting. Converting facilities to ambulatory surgical centers locatedwill require capital, take time and be subject to applicable federal and state regulations, some of which require certificates of need. Although converting will also be beneficial for reimbursement purposes, Fresenius Vascular Care will likely not be able to fully offset the impact of the reduction in the U.S.physician fee schedules in 2017.
ESRD PPS quality incentive program. The ESRD PPS's quality incentive program ("QIP"), which provide interventional servicesaffects Medicare payments based on performance of each facility on a set of quality measures. Dialysis facilities that fail to achieve the established quality standards have payments for a particular year reduced by up to 2 percent, based on a prior year's performance. CMS updates the maintenanceset of ESRD patients' vascular access. Maintainingquality measures each year, adding, revising or retiring measures. The 2017 QIP payment adjustment is based on each facility's performance in 2015 on a set of measures that focus on anemia management, dialysis adequacy, reporting of dialysis events to the patencyCenters for Disease Control and Prevention ("CDC"), administration of patient satisfaction surveys and monthly reporting of mineral metabolism. For payment year 2017, CMS continued the 2016 QIP measures with the exception of the retirement of one measure of hemoglobin adequacy and added a measure of hospital readmissions in order to assess coordinated care. For payment year 2018, CMS will add two new clinical measures (standardized transfusion ratio and pediatric peritoneal dialysis adequacy) and three new reporting measures (pain assessment and follow-up, clinical depression screening and follow-up and influenza vaccination of healthcare personnel). For payment year 2019, CMS will replace four separate measures of dialysis adequacy with a single comprehensive dialysis adequacy clinical measure. In addition, CMS will make changes to the technical specifications of the hypercalcemia clinical measure, reintroduce a dialysis event reporting measure, and make changes relating to QIP scoring, including introduction of a patient's vascular access is an ongoing challengenew Safety Measure Domain. For payment year 2020, CMS will replace a mineral metabolism reporting measure with a new serum phosphorous reporting measure and may occasionally require arthroplasty or other interventional services. In addition,adopt two new measures: the vascular access centers provide services to address peripheral artery disease, which is common in dialysis patients. For Medicare patients, who comprisestandardized hospitalization ratio clinical measure and the largest patient group served by FVC, these services are paid under Medicare's physician fee schedule. CMS, usually acting in response to recommendations from the American Medical Association's Relative Value Scale Update Committee, may revise the relative value units (a measure of the cost, complexityultrafiltration rate reporting measure.
The Patient Protection and risk of providing a specific healthcare service) and hence the payment rates of services paid under this fee schedule. In addition, all payment amounts under this fee schedule are subject to updates determined in partAffordable Care Act, as amended by the Medicare program sustainable growth rate ("SGR") provision. The SGR seeksHealth Care and Education Reconciliation Act of 2010 implements broad healthcare system reforms, including (i) provisions to limit annual increases in Medicare program costsfacilitate access to no more than the annual increase in the nation's gross domestic product.
Medicaid Rebate Program and Other Government Drug Pricing Program Requirements. Manufacturersaffordable health insurance for all Americans, (ii) expansion of certain drugs that are covered by the Medicaid program, or(iii) an industry fee on pharmaceutical companies starting in 2011 based on sales of brand name pharmaceuticals to government healthcare programs, (iv) increases in Medicaid prescription drug rebates effective January 1, 2010, (v) commercial insurance market reforms that are reimbursedprotect consumers, such as bans on lifetime and annual limits, coverage of pre-existing conditions, and limits on waiting periods, (vi) provisions encouraging integrated care, efficiency and coordination among providers (vii) provisions for reduction of healthcare program waste and fraud and (viii) a 2.3% excise tax on manufacturers' medical device sales starting in 2013, However, pursuant to the Consolidated Appropriations Act of 2016, which was signed into law on December 18, 2015, the medical device excise tax has been suspended for all sales of such devices in 2016 and 2017. (ACA's dialysis provision was subsequently amended by the Medicare program are subject to various price determination and reporting requirements under federal statutes, including the Medicaid and Medicare statutes as well as the Public Health ServiceAmerican Taxpayer Relief Act of 2013 ("PHSA"ATRA") and then by PAMA, as noted above.) Congress is anticipated to consider and pass legislation to "repeal and replace" ACA, but we cannot predict what provisions will be affected and what changes will result. Further, the Veterans Health Care Act ("VHCA"). Compliance withTrump Administration may take various administrative actions that could materially affect how ACA provisions are implemented. We cannot predict the Medicaid rebate statute, the VHCA, the Medicare statute, and Section 340Bnature, extent, or impact of the PHSA requires us to calculate and/or report a number of different pricing metrics (any such actions.
e.g. Pharmaceuticals., Average Manufacturer Price ("AMP"), Best Price ("BP"), Average Sales Price ("ASP"), Federal Ceiling Price ("FCP"), non-federal average manufacturer price ("Non-FAMP"), and 340B ceiling price) to federal authorities responsible for monitoring and enforcing drug manufacturer compliance with federal law and policy.
We participate in the federal Medicaid rebate program established by the Omnibus Budget Reconciliation Act of 1990, as well as several state supplemental rebate programs. We make our pharmaceutical products available to authorized users of the Federal Supply Schedule ("FSS") of the General Services Administration under an FSS contract negotiated by the departmentDepartment of Veterans Affairs ("VA"). Under our license to market and distribute the IV Iron medication Venofer® to freestanding dialysis clinics, we also are considered, for statutory price reporting purposes, to be the manufacturer of Venofer® (when sold by us under one of our national drug codes ("NDCs")), which is reimbursed under
Part B of the Medicare program. Our products also are subject to a federal requirement that any company participating in the Medicaid rebate or Medicare program extend discountscharge prices comparable to the rebates paid
to State Medicaid agencies to qualified purchaserson purchases under the Public Health Services ("PHS") pharmaceutical pricing program managed by HHSthe Department of Health and Human Services ("HHS") (also known as the "340B program" by virtue of the section of the PHSAPublic Health Service Act ("PHSA") that created the program). The PHS pricing program extends these deep discounts on outpatient drugs to a variety of community health clinics and other entities that receive health services grants from the PHS, certain "look alikes," as well as hospitals that serve a disproportionate share of poor Medicare and Medicaid beneficiaries.various other providers. ACA expanded the 340B program to include additional providers.
Under the Medicaid rebate program, we pay a rebate to each state Medicaid program based upon sales of our covered outpatient drugs that are separately reimbursed by those programs. The ACA increased the minimum federal Medicare rebate percentages, effective January 1, 2010. Rebate calculations and price reporting rules are complex and, in certain respects, subject to interpretations of law, regulation, or policy guidance by us, government or regulatory agencies and the courts. The Medicaid rebate amount is computed each quarter based on our submission to CMS of our current AMPAverage Manufacturer Price ("AMP") and BPBest Price for our pharmaceutical products. The VHCAVeterans Health Care Act imposes a requirement that the prices we charge to certain federal entities under the FSS must be no greater than the FCP,Federal Ceiling Price, which is determined by applying a statutory discount to the non-FAMPaverage price charged to non-federal customers.customers through wholesalers. Because the amount the government pays to reimburse the cost of a drug under Part B of the Medicare program is ordinarily based on the drug's ASP,average sales price ("ASP"), additional price calculation and reporting obligations are imposed on the manufacturers of Part B drugs under that program.program (to the extent these manufacturers participate in the Medicaid rebate program, from which an obligation to report Part B drug prices flows). Since Venofer® is a Part B drug (i.e., one ordinarily administered incident to a physician service), we are responsible for compiling and utilizing a wide range of sales data elements to determine the ASP of Venofer® marketed under our NDC, and reporting it to CMS. We are subject to specific ASP reporting obligations with respect to our Venofer® sales under a consent order issued by the Federal Trade Commission in October 2008 in connection with establishment of our licensing and distribution arrangements with Galenica and Luitpold (File No. 081-0146) described under "Business"B. Business Overview – Dialysis Products – Renal Pharmaceuticals." The Medicare ESRD PPS system incorporatedincorporates payment for Venofer® at most dialysis facilities starting January 1, 2011.facilities.
Government agencies may make changes in program interpretations, requirements or conditions of participation, and retain the right to audit the accuracy of our computations of rebates and pricing, some of which may result in implications (such as recoupment) for amounts previously estimated or paid which may have a material adverse effect on the Company's revenues, profitability and financial condition.our operating results.
Laboratory Tests. Spectra obtains a portion of its net revenue from Medicare, which pays for clinical laboratory services provided to dialysis patients in two ways.
First, payment Payment for most tests is included in the ESRD PPS bundled rate paid to dialysis clinics. The centersdialysis clinics obtain the laboratory services from laboratories and pay the laboratories for the services. In accordance with industry practice, Spectra usually provides such testing services under capitation agreements with its customers pursuant to which it bills a fixed amount per patient per month to cover the laboratory tests included in the ESRD PPS rate at the frequencies designated in the capitation agreement.
Second, laboratory tests provided by our Care Coordination subsidiary, Shiel Laboratory, and the few laboratory tests performed by Spectra for Medicare beneficiaries that are not included in the ESRD PPS bundled rate are billed separately to Medicare. Such tests are paid at 100%100 percent of the Medicare clinical laboratory fee schedulepayment amounts whichon Medicare's Clinical Laboratory Fee Schedule ("CLFS"); these amounts vary across different geographic areas but which cannot exceed national ceilings on payment rates, called national limitation amounts ("NLAs"). Medicare updates the payment rates to reflect inflation by the change in consumer price index, subject to certain reductions.
PAMA requires CMS to substantially revise how payment rates are determined under the CLFS. Through regulations, CMS delayed the effective date of the new payment rates from January 1, 2017 (as required by PAMA) to January 1, 2018. The ACA imposed a 1.75 percentage point reduction fromnew rates will be determined based on the ratemedian of changerates paid by private payors for these tests in the consumer price indexperiod before the new rates take effect. The new rates will be effective for calendar years 2011 to 2015 togethermost tests for a three-year period, with a "productivity adjustment,"no updates during that period for inflation or other factors. CMS is establishing the detailed parameters for reporting of private rates by laboratories and for the calculation of rates. Reliable estimates of the effects of the new rate-setting system on CLFS payment amounts are not yet available, but in general payment rates for most tests are expected to be slightly above 1 percentage point, applicable (with some restrictions) for years starting with 2011. In addition, the Middle Class Tax Relief and Job Creation Act of 2012 rebased payment amounts under the clinical laboratory fee schedule, reducing them by two percent effective January 1, 2013, and the sequester resulting from the Budget Control Act of 2011 produced an additional cut of two percent effective April 1, 2013.
Erythropoietin stimulating agents. ESAs, including Epogen®, and Aranesp® are used for management of anemia in patients with renal disease. ESAs are included in the bundled payment under the ESRD PPS.
The amount of ESA that is appropriate for a patient varies by several factors, including the severity of the patient's anemia and the patient's clinical response to the ESA. Anemia severity is commonly monitored by measuring a patient's hematocrit, an indicator of the proportion of red blood cells in a patient's whole blood, or by evaluating a patient's hemoglobin level. The FDA recommends initiating ESA treatment when the patient's hemoglobin level is less than 10 g/dcl and to reduce or interrupt the dose ofdecline.
ESA if the patient's hemoglobin level approaches or exceeds 11 g/dcl. The recommendation, which was added to the "black-box" warning on ESA packages and the package insert, states that for each patient, therapy should be individualized, using the lowest ESA dose possible to reduce the need for red blood cell transfusions.
Any of the following changes relating to ESAs could adversely affect our business, and results of operations, possibly materially:
Medicare's ESRD Prospective Payment System. With the enactment of MIPPA in 2008, Congress mandated the development of an expanded ESRD bundled payment system for services furnished on or after January 1, 2011. Under the ESRD PPS, CMS reimburses dialysis facilities with a single payment for each dialysis treatment, inclusive of (i) all items and services included in the former composite rate, (ii) oral vitamin D analogues, oral levocarnitine (an amino acid derivative) and all ESAs and other pharmaceuticals (other than vaccines) furnished to ESRD patients that were previously reimbursed separately under Part B of the Medicare program, (iii) most diagnostic laboratory tests and (iv) certain other items and services furnished to individuals for the treatment of ESRD. ESRD-related drugs with only an oral form, including PhosLo®, are expected to be reimbursed under the ESRD PPS in the future with an adjusted payment amount to be determined by the Secretary of Health and Human Services to reflect the additional cost to dialysis facilities of providing these medications. On April 1, 2014, the Protecting Access to Medicare Act of 2014 ("PAMA") was signed into law. This law modifies ATRA such that dialysis reimbursement for 2015 is intended to equal that for 2014. In addition, the reimbursement reductions mandated by ATRA for 2016 and 2017 have been eliminated. Instead, the market basket updates net of the productivity adjustment for each of 2016 and 2017 have been reinstated, though they will be reduced by 1.25 percent each year. For 2018, the market basket update net of the productivity adjustment will be reduced by 1 percent. In addition, the law mandates that ESRD-related drugs with only an oral form, including PhosLo®, are expected to be reimbursed under the ESRD PPS in the future with an adjusted payment amount to be determined by the Secretary of Health and Human Services to reflect the additional cost to dialysis facilities of providing these medications. Subsequently, the Achieving a Better Life Experience Act of 2014 ("ABLE") delayed inclusion of such drugs in the ESRD PPS until January 1, 2025. The base ESRD PPS payment is subject to case mix adjustments that take into account individual patient characteristics (e.g., age, body surface area, body mass, time on dialysis) and certain co-morbidities. The base payment is also adjusted for (i) certain high cost patient outliers due to unusual variations in medically necessary care, (ii) disparately high costs incurred by low volume facilities relative to other facilities, (iii) provision of home dialysis training and (iv) wage-related costs in the geographic area in which the provider is located.
The ESRD PPS payment amounts are subject to annual adjustment based on increases in the costs of a "market basket" of certain healthcare items and services less a productivity adjustment. On November 6, 2014, CMS issued the final rule updating the ESRD PPS for 2015, pursuant to which the base rate was revised from $239.02 for 2014 to $239.43 for 2015. This change reflects a wage index budget neutrality adjustment factor of 1.001729.
In addition, payments to Medicare providers, including dialysis clinics and other health care centers, are subject to automatic across-the-board spending cuts, or sequestration, for years 2013 to 2023, pursuant to the Budget Control Act of 2011, as amended by the Bipartisan Budget Act of 2013, unless Congress changes the law. For Medicare, sequestration is limited to two percent of Medicare's payments, except in FY 2023 when the cap will be raised to 2.9 percent for the first half of the year and lowered to 1.11 percent for the second half of the year.
The ESRD PPS's quality incentive program ("QIP"), affects Medicare payments based on performance of each facility on a set of quality measures. Dialysis facilities that fail to achieve the established quality standards have payments for a particular year reduced by up to 2 percent, based on a prior year's performance. CMS updates the set of quality measures each year, adding, revising or retiring measures. The 2014 QIP payment adjustment is based on each facility's performance in 2012 on a set of measures that focus on anemia management, dialysis adequacy, reporting of dialysis events to the Centers for Disease Control and Prevention ("CDC"), administration of patient satisfaction surveys and monthly
reporting of mineral metabolism. For payment year 2015, CMS continued all of the 2014 QIP measures except urea reduction ratio or URR (a measure of dialysis adequacy), expanded the scope of infection reporting and mineral metabolism reporting, and added four new measures. New payment year 2015 measures consist of three clinical measures (hemodialysis adequacy (adult patients), hemodialysis adequacy (pediatric patients) and peritoneal dialysis adequacy), and one new reporting measure (anemia management reporting). Payment year 2015 payment adjustments, following the pattern previously established, will be based on performance in 2013. For payment year 2016, CMS continued all of the 2015 QIP measures and added two new clinical measures (proportion of patients with hypercalcemia and dialysis-related infections reported to the CDC's National Health Safety Network. For payment year 2017, CMS will retire one measure of hemoglobin adequacy and add a measure of hospital readmissions in order to assess coordinated care. For payment year 2018, CMS will add two new clinical measures (standardized transfusion ratio and pediatric peritoneal dialysis adequacy) and three new reporting measures (pain assessment and follow-up, clinical depression screening and follow-up and influenza vaccination of healthcare personnel).
The Patient Protection and Affordable Care Act, as amended by the Health Care and Education Reconciliation Act of 2010 implements broad healthcare system reforms, including (i) provisions to facilitate access to affordable health insurance for all Americans, (ii) expansion of the Medicaid program, (iii) an industry fee on pharmaceutical companies that began in 2011 based on sales of brand name pharmaceuticals to government healthcare programs, (iv) a 2.3 percent excise tax on manufacturers' medical device sales starting in 2013, (v) increases in Medicaid prescription drug rebates effective January 1, 2010, (vi) commercial insurance market reforms that protect consumers, such as bans on lifetime and annual limits, coverage of pre-existing conditions, limits on administrative costs, and limits on waiting periods, (vii) provisions encouraging integrated care, efficiency and coordination among providers and (viii) provisions for reduction of healthcare program waste and fraud. ACA does not modify the dialysis reimbursement provisions of MIPPA, except to change the annual update provision by substituting a productivity adjustment to the market basket rate of increase for a MIPPA provision that specified a one percentage point reduction in the market basket rate of increase.
The ESRD PPS has resulted in a lower Medicare reimbursement rate on average at nearly all of our U.S. dialysis facilities than would have been the case under the payment system it replaced. We mitigated the impact of the ESRD PPS with two broad measures. First, we worked with medical directors and treating physicians to make clinical protocol changes used in treating patients consistent with the QIP and good clinical practices, and we negotiated pharmaceutical acquisition cost savings. In addition, we have achieved greater efficiencies and better patient outcomes by introducing new initiatives to improve patient care upon initiation of dialysis, increase the percentage of patients using home therapies and achieve additional cost reductions in our clinics. For information regarding the impact of ESRD PPS and the above implementation plan on our business, see the discussion of our North America Segment in Item 5, "Operating and Financial Review and Prospects – Financial Condition and Results of Operations."
Any significant decreases in Medicare reimbursement rates could have material adverse effects on our provider business and, because the demand for products is affected by Medicare reimbursement, on our products business. To the extent that increases in operating costs that are affected by inflation, such as labor and supply costs, are not fully reflected in a compensating increase in reimbursement rates, our business and results of operations may be adversely affected.
Working with healthcare provider groups comprised of dialysis clinics and nephrologists, CMS plans to test a new Comprehensive ESRD Care Model, also known as ESRD Seamless Care Organizations ("ESCOs"), for payment and care delivery that seeks to deliver better health outcomes for ESRD patients while lowering CMS's costs. ESCOs that achieve the program's minimum quality thresholds and generate reductions in CMS's cost of care above certain thresholds for the ESRD patients covered by the ESCO will receive a share of the cost savings. ESCOs that include dialysis chains with more than 200 facilities are required to share in the risk of cost increases and reimburse CMS a share of any such increases. Organizations must apply and be approved by CMS to participate in the program. In 2013, CMS announced and then abandoned an initial round of applications for this demonstration. CMS revised the parameters and in May 2014 announced a new request for applications. We submitted seven applications to participate in the revised demonstration. CMS had hoped to launch the ESCO program in January 2015, but recently announced that the commencement date will be July 2015.
Coordination of Benefits. Medicare entitlement begins for most patients at least three months after the initiation of chronic dialysis treatment at a dialysis center. During the first three months, considered to
be a waiting period, the patient or patient's insurance, Medicaid or a state renal program is generally responsible for payment.
Patients who are covered by Medicare and are also covered by an employer group health plan ("EGHP") are subject to a 30-month coordination period during which the EGHP is the primary payor and Medicare the secondary payor. During this coordination period the EGHP pays a negotiated rate or in the absence of such a rate, our standard rate or a rate defined by its plan documents. The EGHP payments are generally higher than the Medicare payment. EGHP insurance, when available, will therefore generally cover as the primary payor a total of 33 months, the 3-month waiting period plus the 30-month coordination period. Any significant decreases in EGHP reimbursement rates could have material adverse effects on our provider business and, because the demand for products is affected by provider reimbursement, on our products business.
Budget Control Act and American Taxpayer Relief Act.Participation in new Medicare payment arrangements. On August 2, 2011,Twenty-four of our dialysis organizations participate in CMS's Comprehensive ESRD Care Model, which involves ESRD Seamless Care Organizations, or "ESCOs." This Model seeks to deliver better health outcomes for ESRD patients while lowering Medicare's costs. ESCOs that achieve the U.S. Budget Control Actprogram's minimum quality thresholds and generate reductions in CMS's cost of 2011 ("Budget Control Act") was enacted, raisingcare above certain thresholds for the U.S. debt ceilingESRD patients covered by the ESCO will receive a share of the cost savings. Our ESCOs also share in the risk of cost increases and putting into effectare obligated to reimburse CMS for a seriesshare of actionsany such increases if actual costs rise above set thresholds. For six of our ESCOs, the Model commenced on October 1, 2015, and for deficit reduction. Pursuant to the BCA, automatic across-the-board spending cuts over nine fiscal years (2013-2021), projected to total $1.2 trillionother eighteen ESCOs, the Model commenced on January 1, 2017. The initial agreement period for all U.S. Federal government programs required underESCOs participating in the BCA became effective asModel lasts through 2018. As originally specified, CMS and an ESCO would then have the option of March 1, 2013 and were implemented on April 1, 2013 for CMS reimbursement to providers. The Bipartisan Budget Act of 2013 extendedextending the cuts to mandatory spending programs such as MedicareESCO's agreement for an additional two years.years based on the ESCO's performance. CMS relied on authority granted by ACA to implement this project. Congress is expected to consider repeal or revision of ACA, and the posture of CMS in the Trump Administration toward projects of this sort may differ from that of the Obama Administration. Such changes may affect the project's future prospects in ways which we cannot predict.
The reductionBPCI initiative is a CMS three-year pilot initiative involving bundled payments for the individual services, including acute inpatient hospital services, physician services, and post-acute services, furnished to Medicare beneficiaries during a single episode of illness or course of treatment. Our majority-owned subsidiary, Sound, commenced participation under BPCI in April 2015 in several markets. Under the BPCI, Sound has the ability to receive additional payments from CMS if its physicians are able to deliver quality care at a cost that is lower than certain established benchmarks, but it also has the risk of incurring financial penalties if it is unsuccessful. Should Sound fail to perform as required under its BCPI agreement, CMS may terminate Sound's participation in the BPCI program, in whole or in part. This project was also implemented under ACA authority and is subject to the same caveats and uncertainties noted above.
We have entered into various arrangements which involve taking risk for the complete care of certain ESRD patients in exchange for set payments. CMS approved our application to offer MA-CSNPs in five states as of January 1, 2017. MA-CSNPs are Medicare paymentsAdvantage health plans offered by private companies that contract with Medicare to providers and suppliersprovide patients with Medicare benefits. Enrollment in these plans is limited to one adjustment of no more than 2 percent through 2022 (the "U.S. Sequestration"), rising to 2.9 percentspecial needs individuals with specific severe or disabling chronic conditions, such as ESRD. Our MA-CSNPs will provide services, including Care Coordination services, and receive capitated payments from Medicare for the first halfcomplete care of FY 2023enrolled ESRD patients.
We have also entered into sub-capitation and dropping to 1.11 percent for the second half of FY 2023. Pursuant to PAMA, the reductions pursuant to U.S. Sequestration for the first six months of 2024 will be 4 percent, and there will be no reductions for the second six months of 2024. Theother shared savings arrangements with certain Medicare sequestration reimbursement reduction is independent of annual inflation update mechanisms, such as the market basket update pursuantAdvantage plans under which we assume risk in providing care to the plans' ESRD PPS.
In addition to delayingpatients (those patients that develop ESRD while they are plan members) while paid on a per patient per month basis. The 21st Century Cures Act, enacted December 13, 2016, removes the Budget Control Act's automatic spending reductionsprohibition that previously barred individuals that already have ESRD from enrolling in a Medicare Advantage plan beginning 2021. We anticipate that this provision may present us with an expanded business opportunity, but we cannot assess our likely success in securing further business at advantageous rates. Since certain Medicare Advantage plans currently reimburse us for several months, the American Taxpayer Relief Act also directed CMS to reduce the ESRD PPS payment rate, effective January 1, 2014, to account for changes in the utilization of certain drugsdialysis products and biologicals that are included in the ESRD PPS. In making such reduction, the law requires CMS to use the most recently available pricing data for such drugs and biologicals. PAMA subsequently directed CMS to adjust the market basket update for the ESRD PPS to partially mitigate the impact of the American Taxpayer Relief Act. On November 6, 2014, CMS issued the final rule updating the ESRD PPS rate for 2015. The base rate per treatment was revised from $239.02 for 2014 to $239.43 for 2015. This change reflectsservices at more favorable rates than traditional, core Medicare programs, this provision may provide a wage index budget neutrality factor of 1.001729.
Possiblemodest future legislation. In the current legislative environment, increases in government spending may need to be accompanied by corresponding offsets. For example, several recent laws have successively delayed reductions in physician payments mandated by the sustainable growth rate ("SGR"). A delay enacted in PAMA expires on March 31, 2015. A cut of approximately 21 percent in physician fees will ensue unless Congress acts, as it has in the past, to prevent it. In order to reduce or eliminate SGR physician payment reductions and not adversely affect the deficit, Congress would have to reduce other spending (or raise revenues). In addition, budget and debt ceiling deliberations may result in further reductions in spending. We cannot predict whether other reductions in Medicare or Medicaid spending would be required. Material reductions in physician payments could materially and adversely affect our revenues and profitabilityimprovement in our vascular, cardiovascular and endovascular specialty services and hospitalist businesses.results of operations beginning in 2021.
Possible Changes in Statutes or Regulations. Further legislation or regulations may be enacted in the future that could substantially modify or reduce the amounts paid for services and products offered by us and our subsidiaries. It is also possible that statutes may be adopted or regulations may be promulgated in the future that impose additional eligibility requirements for participation in the federal and state healthcare programs. Such new legislation or regulations could, depending upon the detail of the provisions, have positive or adverse effects, possibly material, on our businesses and results of operations. See "Risk Factors – Risks Relating to Litigation and Regulatory Matters – Proposals"We operate in a highly regulated industry such that the potential for legislative reform provides uncertainty and potential threats to our operating models and results" and "Changes in reimbursement for dialysis and other healthcare reformservices could decreasematerially impact our revenues and operating profit,results," andas well as "– Healthcare Reform" below.
International (Including Germany and Other Non-U.S.)
As a global company delivering health care and dialysis products in more than 120 countries worldwide, we face the challenge of addressing the needs of patients and customers in widely varying economic and healthcare environments. A country's approach to reimbursement and market pricing is markedly influenced by the type of healthcare funding system it employs. National insurance systems have been characterized by greater decentralisation and generally a more widespread use of 'fee-for-service' agreements.
In the major European and British Commonwealth countries, healthcare systems are generally based on one of two funding models. The "Bismarck system", is based on mandatory employer and employee contributions dedicated to healthcare financing. The "Beveridge system", provides a national healthcare system financed by taxes. The healthcare systems of countries such as Germany, France, Belgium, Austria, Czech Republic, Poland, Hungary, Turkey and the Netherlands are based on the Bismarck-type system.system, which is based on mandatory employer and employee contributions dedicated to health care financing. Countries such as the United Kingdom, Canada, Denmark, Finland, Portugal, Sweden and Italy established their national health services using the Beveridge-type system. For information on the distribution of clinic ownership in various countries insystem, which we operate, see "Renal Industry Overview – Dialysis Treatment Options for ESRD," above.provides a national health care system financed by taxes. However, during the last decade, healthcare financing under many social security systems has also been significantly subsidized with tax money.
In Asia-Pacific, tax-based funding is available inAsia Pacific, countries such as Australia, New Zealand, Hong Kong, Macau, Malaysia, South Korea, Taiwan, and Thailand. JapanThailand have a tax-based healthcare funding system which implies universal health provision coverage, but also renders governments with more direct levers to control expenditures. Japan's and the Philippines run a Bismarck-style system,Philippines's healthcare is financed through premiums paid into funds, while Indonesia has announced its intentionis working to establishachieve universal coverage in such a comparable system by 2019. Singaporeans contribute to a mandatory medical savings plan that can be used to cover hospital costs and may receive a limited amount of tax-based subsidies to cover catastrophic illnesses. China aims for universal coverage by 2020 by enrolling patients in various mixed social insurance and taxation-based schemes. Most other
In Latin America, health care systems are funded by public payors, private payors or a combination of both. For countries provide littlesuch as Argentina, Brazil, Chile, Colombia, Curaçao, Ecuador and Peru, Universal Health Care ("UHC") covers ESRD for all citizens, funded by employers as well as individual compulsory contributions. In Peru, UHC is not yet fully implemented. Private insurers complement health care coverage, particularly in Argentina, Brazil and Colombia, and may be preferred by patients for a better quality of treatment or no fundingconvenience. For those countries in Latin America in which we operate, with the exception of Chile, Curaçao, Ecuador and Peru where rates may vary depending upon payors, reimbursement rates are independent of treatment modality. Each payor (public or private) defines its own tariff, subject to a yearly revision to restore the value eroded by inflation. In Colombia, competition bids for ESRD patients.lower prices without regard to adjusted tariffs and in Brazil, where public payors represent more than 60% of the share, inflation has not been recognized in recent history.
Remuneration for ESRD treatmenttreatments widely differs between countries. Therecountries but there are three mainbroad types of reimbursement modalities: nationalglobal budget, allocation,fee-for-service reimbursement based on fee-for-service and a flat periodic rate.bundled payment or capitation rate paid at predetermined periods. In some cases, the reimbursement modalities may also vary within the same country depending on the type of healthcare provider (public or private). Budget allocation is a reimbursement modality used mainly for public providers in most of the European countries where the funding is based on taxation and in some of the countries where it is based on social security. Fee for service, is stillwhich used to be the most common reimbursement modality for private providers in all European and Asia-PacificAsia Pacific countries, (with exceptions, such as Germany, whereis increasingly being replaced by periodic reimbursement to private providers is based on a weekly flat rate) and for public providers in countries where the funding system is based on social security payments.
Treatmentbundles. These include different components included in the base reimbursement rate may vary from country-to-country or even within countries, depending on the structure and cost allocation principles. In the highly integrated reimbursement models for dialysis, also often referred to as "bundled" reimbursement, (applicable e.g., in Portugal, Ukraine, Taiwan and South Korea) the dialysis reimbursement rate covers all – or almost all – treatment-related components, including the dialysis session, laboratory services and ESAs. Under such reimbursement models, the amount of reimbursement can depend on the fulfilment of specified treatment results and quality control parameters. In such systems, the therapeutic goals include, among others, the adequacy of dialysis, targets for hemoglobin levels, bone metabolism status, water quality as well as outcome measures such as mortality rate and hospitalization days. Countries with a relatively low integration of the ESRD treatment componentsand level of payment is linked to certain quality parameters.
Generally, in the baseEuropean countries with established dialysis programs, reimbursements range from $100 to more than $400 per treatment. In Asia-Pacific and Latin America, reimbursement (such as the Czech Republic, the United Kingdom and Germany) dedicate correspondently diverse additional payments for other services rendered to dialysis patients arising from different budgets (or payment streams), depending on the national healthcare regulations.
rates can be significantly lower. Where treatment is reimbursed on a fee-for-service basis, reimbursement rates are sometimes allocated in accordance with the type of treatment performed. We believe that it is difficult to judge reimbursement based on an average global reimbursement amountHowever, because the services and costs for which reimbursement is provided in any suchthat are reimbursed differ widely between countries, calculation of an average global reimbursement amount would likely bear little relation to the actual reimbursement system in any one country. Generally, in European countries with established dialysis programs, reimbursements range from $100 to more than $400 per treatment. In Asia-Pacific, reimbursement rates canHence, country comparison will be significantly lower. However, a comparison from country to country would not be meaningfulrelevant only if made in the absence of a detailedit includes an analysis of the cost components reimbursed,included, services rendered and the structure of the dialysis clinic in each countrythe countries being compared.
Healthcare expenditures are consuming an ever-increasing portion of gross domestic product worldwide. In the developed economies of Europe, Asia and Latin America, healthcare spending is in the range of 5%-15% of gross domestic product. In many countries, dialysis costs consume a
disproportionately high portion of the healthcare budget. In South Korea and Japan, patients contribute co-payments of up to 10 percent of the treatment costs unless they live below the poverty line. Other countries, such as Hong Kong and Thailand, have adopted "Peritoneal Dialysis First" policies to reduce dialysis treatment costs. In times of increasing financial constraints, e.g., the Eurozone financial crisis, these costs among others may be considered a target for implementation of cost containment measures.
However, past experiences have shown that legislators are often willing to combine austerity measures with reforms of healthcare regulation. This offers significant chances for industrialized integrated medical service providers to take up more responsibilities in the care cycle towards coordinated care services and outcome-based reimbursement models.
Today, there is increasing legislator/payor awareness of the correlation between the quality of care delivered in the dialysis unit (including coordination with other health care specialties) and the total healthcare expenses incurred by the dialysis patient. Accordingly, developments in reimbursement policies might include higher reimbursement rates for practices and holistic treatment pathways which are believed to improve the overall state of health of the ESRD patient and reduce the need for additional medical treatment – thereby reducing overall healthcare costs for dialysis patients. There can be no assurance, however, that any such value-based reimbursement models will be readily adopted.
Anti-Kickback Statutes, False Claims Act, Health Insurance Portability and Accountability Act of 1996, Civil Monetary Penalties Law, Stark Law and Other Fraud and Abuse Laws in the United States
Some of our operations are subject to federal and state statutes and regulations governing financial relationships between healthcare providers and potential referral sources and reimbursement for services and items provided to Medicare and Medicaid patients. Such laws include the Anti-Kickback Statute, the False Claims Act, the Stark Law, and other federal healthcare fraud and abuse laws and similar state laws.
The U.S. Government, many individual states and private third-party risk insurers have devoted increasing resources to combat fraud, waste, and abuse in the healthcare sector.
The Office of the Inspector General of HHS ("OIG"), state Medicaid fraud control units, and other enforcement agencies have dedicated substantial resources to their efforts to detect agreements between physicians and service providers that may violate fraud and abuse laws. In its most recent Work Plan for Fiscal Year 2014, the OIG has scheduled an ESRD-related review of Medicare payments for and utilization of renal dialysis services and related drugs under the ESRD PPS to determine how the acquisition costs for certain drugs have changed in comparison to inflation-adjusted government estimates.
Recent health reform legislation has also enhanced the government's ability to pursue actions against potential violators, by expanding the government's investigative authority, expanding criminal and administrative penalties, by increasing funding for enforcement and providing the government with expanded opportunities to pursue actions under the federal Anti-Kickback Statute, the False Claims Act, and the Stark Law. For example, ACA narrowed the public disclosure bar under the False Claims Act, allowing increased opportunities for whistleblower litigation. In addition, the legislation modified the intent standard under the federal Anti-Kickback Statute, making it easier for prosecutors to prove that alleged violators had met the requisite knowledge requirement. ACA and implementing regulations also requiresrequire providers and suppliers to report any Medicare or Medicaid overpayment and return the overpayment on the later of 60 days of identification of the overpayment or the date the cost report is due (if applicable), or all claims associated with the overpayment will become false claims. The ACA also provides that any claim submitted from an arrangement that violates the Anti-Kickback Statute is a false claim.
Anti-Kickback Statutes
We are subject to the federal Anti-Kickback Statute, which establishes criminal prohibitions against and civil penalties for the knowing and willful solicitation, receipt, offer or payment of any remuneration, whether direct or indirect, in return for or to induce the referral of patients or the ordering or purchasing of items or services payable in whole or in part under Medicare, Medicaid or other federal healthcare programs. Sanctions for violations of the Anti-Kickback Statute include criminal and civil penalties, such as imprisonment and/or criminal fines of up to $25,000 per violation, and civil penalties of up to $50,000 per violation and up to three times the amount received from the healthcare program, and exclusion from the Medicare or Medicaid programs and other federal programs.
The OIG has the authority to promulgate regulations referred to as "safe harbors" that define certain business relationships and arrangements that would not be subject to civil sanction or criminal
enforcement under the Anti-Kickback Statute. Failure to comply with a safe harbor provision does not make the activity illegal. Rather, the safe harbors set forth specific criteria that, if fully met, will assure the entities involved of not being prosecuted criminally or civilly for the arrangement under the Anti-Kickback Statute.
Many states also have enacted statutes similar to the Anti-Kickback Statute, which may include criminal penalties, applicable to referrals of patients regardless of payor source, and may contain exceptions different from state to state and from those contained in the federal Anti-Kickback Statute.
False Claims Act and Related Civil Provisions
The federal False Claims Act (the "False Claims Act") imposes treble damages and civil penalties for knowingly making or causing to be made false claims with respect to governmental programs, such as Medicare and Medicaid, for services billed but not rendered, or for misrepresenting actual services rendered, in order to obtain higher reimbursement. In addition, ACA requires that overpayments be reported and returned within 60 days after the overpayment is identified or the corresponding cost report was due. Failure to report and return the overpayment creates the basis for Federal False Claims Act liability. The ACA makes clear that a claim that includes items or services resulting from a violation of the Anti-Kickback Statute constitutes a false claim or fraudulent claim for purposes of the False Claims Act. Under the interpretation of certain courts, claims submitted for services furnished in violation of the Stark Law could also violate the False Claims Act. Moreover, private individuals may bring whistleblower suits against providers under the False Claims Act, which authorizes the payment of 15-30% of any recovery to the individual bringing suit. Such actions are initially required to be filed under seal pending their review by the Department of Justice. The False Claims Act generally provides for the imposition of civil penalties of $5,500 to $11,000 per claim and for treble damages, resulting in the possibility of substantial financial penalties for small billing errors that are replicated in a large number of claims, as each individual claim could be deemed to be a separate violation of the False Claims Act. Some states also have enacted statutes similar to the False Claims Act which may include criminal penalties, substantial fines, and treble damages.
The Health Insurance Portability and Accountability Act of 1996 ("HIPAA")
HIPAA, which was enacted in August 1996, expanded federal fraud and abuse laws by increasing their reach to all federal healthcare programs, establishing new bases for exclusions and mandating minimum exclusion terms, creating an additional statutory exception to the Anti-Kickback Statute for risk-sharing arrangements, requiring the Secretary of HHS to issue advisory opinions, increasing civil money penalties to $10,000 per item or service and assessments to three times the amount claimed, creating a specific healthcare fraud offense and related health fraud crimes, and expanding investigative authority and sanctions applicable to healthcare fraud. HIPAA also prohibits a provider from offering anything of value which the provider knows or should know would be likely to induce a federal healthcare program beneficiary to select or continue with the provider.
HIPAA includes a healthcare fraud provision prohibiting knowingly and wilfully executing a scheme or artifice to defraud any "healthcare benefit program," which includes any public or private plan or contract affecting commerce under which any medical benefit, item, or service is provided to any individual, and includes any individual or entity who is providing a medical benefit, item, or service for which payment may be made under the plan or contract. Penalties for violating this statute include criminal penalties, exclusion from the Medicare and Medicaid programs, freezing of assets and forfeiture of property traceable to commission of a healthcare fraud.
Pursuant to HIPAA, HHS has promulgated regulations that (1) establish national standards for certain electronic healthcare transactions, (2) restrict the use and disclosure of certain individually identifiable patient health information, termed "protected health information" ("PHI"), and (3) regulate the security of the electronic systems maintaining such information (collectively, the "HIPAA Regulations"). Health insurance payers and healthcare providers like us must comply with the HIPAA Regulations. Violations of the HIPAA Regulations may result in civil monetary penalties and criminal sanctions. Penalties are tiered and range from $100 to $50,000 per violation with an annual cap for the same violation of $25,000 to $1,500,000.
The Health Information Technology for Economic and Clinical Health Act ("HITECH Act"), enacted as part of the American Recovery and Reinvestment Act of 2009 ("ARRA"), required changes to the HIPAA Regulations, and HHS promulgated a revised version of the Regulations in early 2013. Under the HIPAA Regulations as so revised, we are additionally required, among other things, to (i) provide patients
(as well as HHS and in some cases the media) with notifications in the event of a breach in the security of their "unsecured" PHI; (ii) more strictly limit uses of PHI for marketing purposes; (iii) decline payment in exchange for PHI except in limited circumstances; (iv) grant individual requests to restrict disclosures of PHI relating to medical care to insurers when a patient has paid out-of-pocket for that care in full; (v) and provide individuals, upon request, with electronic versions of their PHI that we hold in electronic form (dating back six years).
The HITECH Act also provides that HHS shall issue regulations that would require us to provide patients with an accounting of all of our disclosures (within the past 3 years) of PHI for purposes of payment, treatment, and healthcare operations. (Currently we are required to provide accountings of disclosures made for other purposes, but not for these three most common purposes.) HHS has delayed issuing those regulations, but may issue them in proposed form in the coming year.
The HHS Office for Civil Rights ("OCR") has increased enforcement activities and has recently levied large penalties for violations. In addition, as mandated by the HITECH Act, OCR has been conducting audits to assess compliance by covered entities and their business associates with the HIPAA Privacy and Security Rules and the security breach notification standards.
Many U.S. states also have enacted healthcare privacy and data security breach laws governing patient information, medical records and personal information, including sensitive information such as financial and identity data. The HIPAA Regulations pre-empt conflicting U.S. state laws, but they do not pre-empt U.S. state laws that are more protective of individual privacy or the security of PHI. Thus, where such more protective state laws exist, we must comply with both the HIPAA Regulations and U.S. state privacy law. In addition, almost all U.S. states now require notification to affected individuals and state authorities, as well as the media in certain cases, in the event of a breach of the security of personal information (including personal health information in a few states), often with significant financial penalties for noncompliance. In general, the body of regulation of personal information, including but not limited to personal health information, is growing and merits close monitoring.
Civil Monetary Penalties Law
Individuals or entities who have, among other things, (1) directly submitted, or caused to be submitted, claims which are improper or false; (2) arranged or contracted with an individual or entity that the person knows or should know is excluded from participation in federal healthcare programs; or (3) offered or transferred remuneration to an individual to influence such individual in order to receive healthcare services from a particular healthcare provider; or (4) offered or received kickbacks may be subject to monetary penalties or exclusion under the Civil Monetary Penalties Law ("CMPL") at the discretion of the OIG. Penalties are generally not more than $10,000 for each item or service. However, under the CMPL, violators of the federal Anti-Kickback Statute provisions may also be subject to additional civil money penalties of $50,000 per violation. Violators are also subject to an assessment of up to three times the amount claimed for each item or service in lieu of damages sustained by the United States or a state agency because of such claim, or damages of up to three times the total amount of remuneration offered, paid, solicited, or received. In addition, any person or entity who violates this section may be excluded from participation in the federal or state healthcare programs.
Stark Law
Our contractual arrangements with physicians may implicate the federal physician self-referral statute commonly known as the Stark Law ("Stark Law"). The Stark Law prohibits the referral of Medicare and Medicaid beneficiaries for any "designated health services" to an entity if the physician or a member of such physician's immediate family has a "financial relationship" with the entity, unless an exception in the Stark Law or regulations applies.
The term "Designated Health Services" includes clinical laboratory services, physical therapy, occupational therapy and speech language pathology services; radiology and certain other imaging services; radiation therapy services and supplies; durable medical equipment and supplies; parenteral and enteral nutrients, equipment and supplies; prosthetics, orthotics, and prosthetic devices and supplies; home health services; outpatient prescription drugs; and inpatient and outpatient hospital services. Services reimbursed by Medicare to a dialysis facility under the ESRD composite rate are excluded from the definition of designated health services and an exception for Epogen® and certain other dialysis-related outpatient prescription drugs furnished in or by an ESRD facility under many circumstances.
The Stark Law provides that the entity that renders the "designated health services" may not present or cause to be presented a claim for "designated health services" furnished pursuant to a prohibited referral. Sanctions for violations of the Stark Law may include denial of payment, refund obligations, civil monetary penalties and exclusion of the provider from the Medicare and Medicaid programs. Certain of our healthcare facilities bill for Designated Health Services and those providers' financial arrangements with referring physicians are subject to the Stark Law.
In addition, the term "financial relationship" is broadly defined to include any direct or indirect ownership or investment interest or compensation arrangement. There are a number of exceptions to the Stark Law including exceptions for employment contracts, professional services agreements, indirect compensation arrangements, and other arrangements customary between physicians and healthcare entities.
Since the Stark law was enacted, there has been an evolving body of regulations. CMS continues to address the Stark Law as part of its annual rulemaking process for reimbursement under the Medicare Part B Physician Fee Schedule or under the Inpatient Prospective Payment System.
Many states in which we operate have enacted self-referral statutes similar to the Stark Law. Such state self-referral laws may apply to referrals of patients regardless of payor source and may contain exceptions different from each other and from those contained in the Stark Law.
Physician Payment Sunshine Act
ACA contains Physician Payment Sunshine Act (section 6002) ("PPSA"). On February 8, 2013, CMS issued final regulations under the PPSA that require applicable pharmaceutical, medical device, biological, and medical supply manufacturers, including the Company, to record and report annually to the Secretary of Health and Human Services ("HHS") certain "payments or other transfers of value" to physicians and teaching hospitals. The PPSA also requires applicable manufacturers to report certain information regarding the ownership or investment interests held by physicians or the immediate family members of physicians in such entities.
Other Fraud and Abuse Laws
Our operations are also subject to a variety of other federal and state fraud and abuse laws, principally designed to ensure that claims for payment to be made with public funds are complete, accurate and fully comply with all applicable program rules, and to prevent remuneration in exchange for referrals or purchases of items which may be reimbursed by the government or which may lead to overutilization, corruption of healthcare provider judgment, or a lack of transparency in costs or charges. In addition, our hospitalist business performs services at hospitals, and other healthcare facilities, we and our affiliated providers may be subject to the laws that are applicable to those entities. For example, our operations are impacted by the Emergency Medical Treatment and Labor Act that prohibits "patient dumping" by requiring Medicare-participating hospitals and hospital emergency room physicians or hospital urgent care center physicians to provide a medical screening examination to any patient presented to the hospital's emergency department or urgent care center, regardless of the patient's ability to pay, legal status or citizenship. In addition, if it is determined that the individual has an emergency medical condition, the facility must provide stabilizing treatment within its capabilities or provide for an appropriate transfer of the individual. Many states in which we operate have similar state law provisions concerning patient dumping. Failure to remain in compliance with any of these rules by any of our subject businesses could result in a material adverse effect on our business, financial condition or results of operations.
In response to increases in health care costs in recent years, there have been, and continue to be, proposals by the federal government, state governments, regulators and third-party payors to control these costs and reform the U.S. healthcare system. ACA contains broad healthcare system reforms, including (i) provisions to facilitate access to affordable health insurance for all Americans, (ii) expansion of the Medicaid program, (iii) an industry fee on pharmaceutical companies starting in 2011 based on sales of brand name pharmaceuticals to government healthcare programs, (iv) a 2.3% excise tax on manufacturers' medical device sales starting in 2013, (v) increases in Medicaid prescription drug rebates effective January 1, 2010, (vi)(v) commercial insurance market reforms that protect consumers, such as bans on lifetime and annual limits, coverage of pre-existing conditions, and limits on waiting periods, (vii)(vi) provisions encouraging integrated care, efficiency and coordination among providers and (viii)(vii) provisions for reduction of healthcare program waste and fraud. ACA'sfraud and (viii) a 2.3% excise tax on manufacturers' medical device sales starting in 2013, However, pursuant to the Consolidated Appropriations Act of 2016, which was signed into law on December 18, 2015, the medical device excise tax Medicaid drug rebate increaseshas been suspended for all sales of such devices in 2016 and annual pharmaceutical industry fees will adversely impact our product business earnings and cash flows. We expect modest favorable impact from ACA's integrated care and commercial insurance consumer protection provisions.
The ACA provides voluntary opportunities for2017. In early 2017, the new Trump Administration has taken public positions on the desire to change the direction of health care providers, to enter into risk-based partnerships designed to encourage participants to assume financial accountability for outcomesreform, with potential repeal and to work together to better coordinate care for patients, including when patients arereplacement of the ACA. The outcome of changes in the hospital and after they are discharged. These initiatives include the CMS Bundled Payments for Care Improvement initiative ("BPCI"). The BPCI is a CMS three year pilot initiative with bundled payments for the individual services furnished to Medicare beneficiaries during a single episode of illness or course of treatment, including acute inpatient hospital services, physician services, and post-acute services. On January 31, 2013, CMS announced the initial health care organizations selectedpolicy and law is difficult to participate in BPCI, which includepredict, and while there may be changes that are both favorable and unfavorable to us, it is possible that the overall impact of certain changes could be materially adverse to our subsidiary, Sound Inpatient Physicians, Inc. Sound Physicians is currently planning and preparing to commence participation under BPCI in 2015 in several markets. Under the BPCI, we have the ability to receive additional payments if we are able to deliver quality care at a cost that is lower than certain established benchmarks, but also have the riskbusiness.
InNational Federation of incurring financial penalties if we are not successful in doing so. Should we fail to perform as required under the BPCI initiative and our agreement with CMS, CMS may, among other remedies, terminate our right to participate in the BPCI program, in whole or in part.
Although the constitutionality of ACA was, in large part, upheld byIndependent Business v. Sebelius, the U.S. Supreme Court in June 2012, the law has continued to be subject to further challenges in the courts and strongly opposed by many members of Congress. Proposals have been advanced in Congress to repeal ACA in whole or in part, to reduce its scope and scale, to delay it, or to defund it. We cannot predict which Congressional proposals, if any, will be adopted or, if any proposals are adopted, what the effect would be. Likewise, we cannot predict the outcomes or possible effects of legal challenges.
The U.S. Supreme Court decision affirmed the right of individual states to elect to participate or not in ACA's Medicaid expansion. Almost halfAs of December 2016, thirty-two states (including the statesDistrict of Columbia) elected not to expand their programs, at least initially.programs. As a result, the decrease in the number of uninsured individuals will be smallermore than originally expected.expected when the ACA was passed. We cannot predict whether additional states will agree to participate in the expansion in future years. TheInKing v.
Burwell, the U.S Supreme Court has agreed to hear arguments in a case challengingruled that federal tax credits are available for health insurance purchased through federally-operated insurance exchanges in states that have not established their own exchanges. AThis ruling that such credits are not permissible couldencourages individual participation in federally-operated insurance exchanges and may lead to a further limit the decrease in the number of uninsured individuals.
The Trump Administration has indicated its desire to repeal or substantially restructure ACA, particularly with respect to health insurance reforms. Further, as a result of the Trump Administration's changes in the leadership of CMS and the Department of Health and Human Services, are continuingrevisions to implementregulations and sub-regulatory guidance relating to implementation of various provisions of ACA. As a result,ACA, with or without changes in statute, may occur. In addition, further regulations may be promulgated in the future that could substantially change the Medicare and Medicaid reimbursement systems, or that could impose additional eligibility requirements for participation in the federal and state healthcare programs. Moreover, such regulations could alter the current responsibilities of third-party insurance payors (including employer-sponsored health insurance plans, commercial insurance carriers and the Medicaid program) including, without limitation, with respect to cost-sharing obligations. Such new regulationscost-sharing. Changes of this nature could depending upon the detail of the provisions, have positive or adversesignificant effects possibly material, on our businesses, but, due to the continued uncertainty about the implementation of the ACA, including potential further legal challenges to or significant modifications to or repeal of that legislation, the outcomes and impact of such changes on our business, financial condition and results of operations.
Table of Contentsoperations are impossible to quantify or predict.
C. Organizational Structure
The following chart shows our organizational structure and our significant subsidiaries as of December 31, 2014.2016. Fresenius Medical Care Holdings, Inc. conducts its business as "Fresenius Medical Care North America."
D. Property, plant and equipment
Property
The table below describes our principal facilities. We do not own the land and buildings comprising our principal facilities in Germany. Rather, we lease those facilities on a long-term basis from Fresenius SE or one of its affiliates. These leases are described under "Item 7.B. Related Party Transactions – Real Property Lease."
| Location | Floor Area (Approximate Square Meters) | Currently Owned or Leased by Fresenius Medical Care | Lease Expiration | Use | |||||
|---|---|---|---|---|---|---|---|---|---|
| owned | Manufacture polysulfone membranes and dialyzers and peritoneal dialysis solutions; research and development | |||||||
St. Wendel, Germany | 92,107 | leased | December | Manufacture of polysulfone membranes, dialyzers and peritoneal dialysis solutions; research and development | |||||
Suzhou, China (Changshu Plant) | 83,808 | owned | Manufacture of hemodialysis bloodline sets | ||||||
| owned | Manufacture of polysulfone | |||||||
Schweinfurt, Germany | 38,100 | leased | December | Manufacture of hemodialysis machines and peritoneal dialysis cyclers; research and development | |||||
Fukuoka, Japan (Buzen Plant) | 37,092 | owned | Manufacture of peritoneal dialysis bags and dialyzers | ||||||
Cota, Colombia | 37,000 | owned | Manufacture of dry and liquid concentrates, CAPD and APD bags, Intravenous solutions, empty Biofine bags. | ||||||
Waltham, Massachusetts | 33,688 | leased | April 2029 | Corporate headquarters and administration - North America | |||||
Biebesheim, Germany | 33,500 | leased | December 2023 | Central distribution Europe, Asia Pacific and Latin America | |||||
| |||||||||
Fukuoka, Japan (Buzen Plant) – Site Area for future expansion | 27,943 | owned | Manufacture of peritoneal dialysis bags and dialyzers | ||||||
Knoxville, Tennessee | 25,734 | owned | Manufacture peritoneal dialysis solutions | ||||||
Guadalajara, México | owned | Manufacture of peritoneal dialysis bags | |||||||
| |||||||||
Palazzo Pignano, Italy | 21,440 | owned | Manufacture of bloodlines and tubing, office | ||||||
| |||||||||
| Location | Floor Area (Approximate Square Meters) | Currently Owned or Leased by Fresenius Medical Care | Lease Expiration | Use | |||||
|---|---|---|---|---|---|---|---|---|---|
Buenos Aires, Argentina | 20,000 | owned | Manufacture of hemodialysis concentrate solutions, dry hemodialysis concentrates and desinfectants | ||||||
Rockleigh, New Jersey | 19,974 | leased | Clinical laboratory testing | ||||||
| |||||||||
| |||||||||
Concord, California | 17,015 | leased | October 2028 | Manufacture of Hemodialysis machines and peritoneal dialysis cyclers; research and development; warehouse space | |||||
São Paulo, Brazil | 16,992 | owned | Manufacture of hemodialysis concentrate solutions, dry hemodialysis concentrates, peritoneal dialysis bags, intravenous solutions bags, peritoneal dialysis and blood lines sets and | ||||||
Bad Homburg, Germany | 15,970 | leased | September 2017 | Corporate headquarters and administration | |||||
Reynosa, Mexico | 15,746 | leased | April 2021 | Manufacture of bloodlines | |||||
Vrsac, Serbia | 15,365 | owned | |||||||
Bad Homburg (OE), Germany | 10,304 | leased | Manufacture of hemodialysis concentrate solutions / | ||||||
We lease most of our dialysis clinics, manufacturing, laboratory, warehousing and distribution and administrative and sales facilities in the U.S. and other countries on terms which we believe are customary in the industry. We own those dialysis clinics and manufacturing facilities that we do not lease.
For information regarding plans to expand our facilities and related capital expenditures, see "Item 4.A. History and Development of the Company4.B. Business Overview – Capital Expenditures."
Item 4A. Unresolved Staff Comments
Not applicable.None.
Item 5. Operating and Financial Review and Prospects
You should read the following discussion and analysis of the results of operations of Fresenius Medical Care AG & Co. KGaA and its subsidiaries in conjunction with our historical consolidated financial statements and related notes contained elsewhere in this report. Some of the statements contained below, including those concerning future revenue, costs and capital expenditures and possible changes in our industry and competition and financial conditions include forward-looking statements. We made these forward-looking statements based on the expectations and beliefs of the management of the Company's General Partner concerning future events which may affect us, but we cannot assure that such events will occur or that the results will be as anticipated. Because such statements involve risks and uncertainties, actual results may differ materially from the results which the forward-looking statements express or imply. Such statements include the matters and are subject to the uncertainties that we described in the discussion in this report entitled "Introduction – Forward-Looking Statements." See also Item 3.D., "Key Information – Risk Factors."
Our business is also subject to other risks and uncertainties that we describe from time to time in our public filings. Developments in any of these areas could cause our results to differ materially from the results that we or others have projected or may project.
I. Critical Accounting Policies
The Company's reported financial condition and results of operations are sensitive to accounting methods, assumptions and estimates that are the basis for our financial statements. The critical accounting policies, the judgments made in the creation and application of these policies, and the sensitivities of reported results to changes in accounting policies, assumptions and estimates are factors to be considered along with the Company's financial statements, and the discussion below in "Results of Operations."
a) Recoverability of Goodwill and Intangible Assets
The growth of our business through acquisitions has created a significant amount of intangible assets, including goodwill and other non-amortizable intangible assets such as trade names and management contracts. At December 31, 2014,2016, the carrying amount of goodwill amounted to $13,082$13,666 million and non-amortizable intangible assets amounted to $217$213 million representing in total approximately 52% of our total assets.
In accordance with current accounting standards, weWe perform an impairment test of goodwill and non-amortizable intangible assets at least once a year for each reporting unit or more frequently if we become aware of events that occur or if circumstances change that would indicate the carrying value mightmay not be impaired.recoverable. See also Note 1e) in the Notes to Consolidated Financial Statements.
As we are also subject to the International Financial Reporting Standards requirements, which utilize the two-step approach, we do not follow the qualitative assessment within ASC 350-20-35. To comply with the provisions of the accounting standards for impairment testing, the fair value of the reporting unit is first compared to the reporting unit's carrying amount. As we are subject to the International Financial Reporting Standards requirements, which utilizes the two-step approach, we do not follow the qualitative assessment within ASC 350-20-35. We estimate the fair value of each reporting unit using estimated future cash flows for the unit discounted by aan after-tax weighted average cost of capital ("WACC") specific to that reporting unit. Estimating the future cash flows involves significant assumptions, especially regarding future reimbursement rates and sales prices, treatments and sales volumes and costs. In determining cash flows, the Company utilizes for every reporting unit, its three-year budget, projections for years 4 to 10 and a representative growth rate for all remaining years. Projections for up to ten years are possible due to the non-discretionary nature of the healthcare services we provide, the need for products utilized to provide such services and the availability of government reimbursement for a substantial portion of our services. The reporting units' average revenue growth for the ten year planning period is within a mid-single digit range for the North America Segment, EMEA Segment and the Latin America Segment, whereas for the Asia-Pacific Segment the average revenue growth is in the high single-digits. A substantial portion of our profit is generated in the North America Segment. We expect a stable operating income margin with a higher margin in dialysis business compensating a lower margin in Care Coordination. The reporting units' respective expected growth rates for the period beyond ten years are: the North America Segment 1%, the EMEA Segment 0%, the Asia-Pacific Segment 4% and the Latin America Segment 3.5%. The discount factor is determined by the WACC of the respective reporting unit. The Company's WACC consisted of a basic rate of 6.01%5.14% for 2014.2016. This basic rate is then adjusted by a weighted average country risk rate and, if appropriate, by a factor to reflect higher risks associated with the cash flows from recent material acquisitions until they are appropriately integrated within each reporting unit.
If the fair value of the reporting unit is less than its carrying value, a second step would be performed which compares the implied fair value of the reporting unit's goodwill to the carrying value of its goodwill. If the fair value of the goodwill is less than its carrying value, the difference is recorded as an impairment.
To evaluate the recoverability of intangible assets with indefinite useful lives, we compare the fair values of intangible assets with their carrying values and intangible asset's fair value is determined using a discounted cash flow approach or other methods, if appropriate.
A prolonged downturn in the healthcare industry with lower than expected increases in reimbursement rates and/or higher than expected costs for providing healthcare services and for procuring and selling products could adversely affect our estimated future cash flows. Future adverse changes in a reporting unit's economic environment could affect the country-specific rate and therefore the discount rate. An increase in interest rates could impact the basic rate and accordingly our WACC. These changes could result in impairment charges to goodwill and other intangible assets which could materially and adversely affect our future financial position and operating results.
b) Legal Contingencies
We are party to litigation and subject to investigations relating to a number of matters as described in Note 2018 of the Notes to Consolidated Financial Statements, "Commitments and Contingencies.Contingencies," included in this report. The outcome of these matters may have a material effect on our financial position, results of operations or cash flows.
We regularly analyze current information including, as applicable, our defenses and we provide accruals for probable contingent losses including the estimated legal expenses to resolve the matters. We use the resources of our internal legal department as well as external lawyers for the assessment. In making the decision regarding the need for loss accrual, we consider the degree of probability of an unfavorable outcome and our ability to make a reasonable estimate of the amount of loss.
The filing of a suit or formal assertion of a claim or assessment, or the disclosure of any such suit or assertion, does not automatically indicate that accrual of a loss may be appropriate.
c) Accounts Receivable and Allowance for Doubtful Accounts
Trade accounts receivable are a substantial asset of ours and the allowance for doubtful accounts is based upon a significant estimate made by management. Trade accounts receivable were $3,204$3,524 million and $3,037$3,285 million at December 31, 20142016 and 2013,2015, respectively, net of allowances for doubtful accounts of $419$509 million and $413$466 million, respectively.
We sell dialysis products directly or through distributors in more than 120 countries and we provide health care services in more than 45 countries. Most payors are government institutions or government-sponsored programs with significant variations between the countries and even between payors within one country in local payment and collection practices.
Receivables are recognized and billed at amounts estimated to be collectable under government reimbursement programs and reimbursement arrangements with third party payors. U.S. Medicare and Medicaid government programs are billed at pre-determined net realizable rates per treatment that are established by statute or regulation. Revenues for non-governmental payors with which we have contracts or letters of agreement in place are recognized at the prevailing contract rates. The remaining non-governmental payors are billed at our standard rates for services and, in our North America Segment, a contractual adjustment is recorded to recognize revenues based on historic reimbursement. The contractual adjustment and the allowance for doubtful accounts are reviewed quarterly for their adequacy. No material changes in estimates were recorded for the contractual allowance in the periods presented. The collectability of accounts receivable is reviewed locally on a regular basis, generally monthly.
In our U.S. operations, the collection process is usually initiated 30 days after service is provided or upon the expiration of the time provided by contract. For Medicare and Medicaid, once the services are approved for payment, the collection process begins upon the expiration of a period of time based upon experience with Medicare and Medicaid. In all cases where co-payment is required the collection process usually begins within 30 days after service has been provided. In those cases where claims are approved for amounts less than anticipated or if claims are denied, the collection process usually begins upon notice of approval of the lesser amounts or upon denial of the claim. The collection process can be confined to internal efforts, including the accounting and sales staffs and, where appropriate, local management staff. If appropriate, external collection agencies may be engaged.
Public health institutions in a number of countries outside the U.S. require a significant amount of time until payment is made because a substantial number of payors are government entities whose payments are often determined by local laws and regulations and budget constraints. Depending on local facts and circumstances, the period of time to collect can be quite lengthy. In those instances where there are commercial payors, the same type of collection process is initiated as in the U.S.
Due to the number of our subsidiaries and different countries that we operate in, our policy of determining when a valuation allowance is required considers the appropriate individual local facts and circumstances that apply to an account. While payment and collection practices vary significantly between countries and even agencies within one country, government payors usually represent low to moderate credit risks. It is our policy to determine when receivables should be classified as bad debt on a local basis taking into account local payment practices and local collection experience. A valuation allowance is calculated locally if specific circumstances indicate that amounts will not be collectible.
In our InternationalEMEA Segment, Asia-Pacific Segment and Latin America Segment as well as our North America Segment product division, for receivables overdue by more than one year, an additional valuation allowance is recorded based on an individual country risk, since we believe that the length of time to collect does indicate an increased credit risk.
When all efforts to collect a receivable, including the use of outside sources where required and allowed, have been exhausted, and after appropriate management review, a receivable deemed to be uncollectible is considered a bad debt and written off.
In the Consolidated StatementStatements of Income, expenses from our allowance for doubtful accounts is presented either as a deduction from revenue or as operating expense depending on the source of the receivable. For our health care business, we determine an allowance for patient services provided where all or a portion of the amounts billed or billable cannot be determined to be collectible at the time services are performed, e.g., when we provide treatment to a patient when such treatment is not covered by an
insurance program or a reimbursement arrangement regardless of the patient's ability to pay. This allowance is shown as a reduction to our Consolidated Statements of Income line item Health Care. All of our other receivables are evaluated with the changes in the allowance for doubtful accounts recorded as an operating expense.
Write offs are taken on a claim-by-claim basis when the collection efforts are exhausted. Due to the fact that a large portion of our reimbursement is provided by public health care organizations and private insurers, we expect that most of our accounts receivable will be collectible, albeit potentially more slowly inoutside of the International Segment in the immediate future.North America Segment. See "B."IV. Liquidity and Capital Resources, – Operations," below, for a discussion of days sales outstanding developments in 2014.2016. A significant change in our collection experience, deterioration in the aging of receivables and collection difficulties could require that we increase our estimate of the allowance for doubtful accounts. Any such additional bad debt charges could materially and adversely affect our future operating results.
If, in addition to our existing allowances, 1% of the gross amount of our trade accounts receivable as of December 31, 20142016 were uncollectible through either a change in our estimated contractual adjustment or as bad debt, our operating income for 20142016 would have been reduced by approximately 1.6%1.5%.
The following tables show the portion and aging of trade accounts receivable of major debtors or debtor groups at December 31, 20142016 and 2013.2015. No single debtor other than U.S. Medicaid and Medicare accounted for more than 5% of total trade accounts receivable in either year. Amounts pending approval from third party payors represented less than 3% at December 31, 2014.2016.
Aging of Net Trade Accounts Receivable by Major Payor Groups:
| | At December 31, 2014 | At December 31, 2016 | ||||||||||||||||||||||||||||||||||||||||||
|---|---|---|---|---|---|---|---|---|---|---|---|---|---|---|---|---|---|---|---|---|---|---|---|---|---|---|---|---|---|---|---|---|---|---|---|---|---|---|---|---|---|---|---|---|
| | current | overdue by up to 3 months | overdue more than 3 months up to 6 months | overdue more than 6 months up to 1 year | overdue by more than 1 year | Total | % of net trade A/R | current | overdue by up to 3 months | overdue more than 3 months up to 6 months | overdue more than 6 months up to 1 year | overdue by more than 1 year | Total | % of net trade A/R | ||||||||||||||||||||||||||||||
| | (in millions) | (in millions) | ||||||||||||||||||||||||||||||||||||||||||
U.S. Government health care programs | $ | 543 | $ | 115 | $ | 56 | $ | 51 | $ | 108 | $ | 873 | 27 | $ | 583 | $ | 150 | $ | 80 | $ | 50 | $ | 113 | $ | 976 | 28 | ||||||||||||||||||
U.S. commercial payors | 246 | 145 | 41 | 41 | 19 | 492 | 16 | 277 | 169 | 48 | 40 | 34 | 568 | 16 | ||||||||||||||||||||||||||||||
U.S. hospitals | 110 | 43 | 4 | 2 | 2 | 161 | 5 | 201 | 79 | 17 | 6 | 2 | 305 | 9 | ||||||||||||||||||||||||||||||
Self-pay of U.S. patients | 5 | 11 | 9 | 4 | 2 | 31 | 1 | 3 | 34 | 33 | 9 | 2 | 81 | 2 | ||||||||||||||||||||||||||||||
Other North America | 3 | 1 | 1 | 0 | 0 | 5 | 0 | |||||||||||||||||||||||||||||||||||||
International product customers and health care payors | 918 | 325 | 136 | 105 | 158 | 1,642 | 51 | |||||||||||||||||||||||||||||||||||||
Other North America Segment payors | 4 | 39 | 8 | 2 | 0 | 53 | 1 | |||||||||||||||||||||||||||||||||||||
Product customers and health care payors outside the North America Segment | 918 | 318 | 121 | 69 | 115 | 1,541 | 44 | |||||||||||||||||||||||||||||||||||||
| | | | | | | | | | | | | | | | | | | | | | | | | | | | | | | | | | | | | | | | | | | | | |
Total | $ | 1,825 | $ | 640 | $ | 247 | $ | 203 | $ | 289 | $ | 3,204 | 100 | $ | 1,986 | $ | 789 | $ | 307 | $ | 176 | $ | 266 | $ | 3,524 | 100 | ||||||||||||||||||
| | | | | | | | | | | | | | | | | | | | | | | | | | | | | | | | | | | | | | | | | | | | | | |
| | | | | | | | | | | | | | | | | | | | | | | | | | | | | | | | | | | | | | | | | | | | | |
| | At December 31, 2013 | At December 31, 2015 | ||||||||||||||||||||||||||||||||||||||||||
|---|---|---|---|---|---|---|---|---|---|---|---|---|---|---|---|---|---|---|---|---|---|---|---|---|---|---|---|---|---|---|---|---|---|---|---|---|---|---|---|---|---|---|---|---|
| | current | overdue by up to 3 months | overdue more than 3 months up to 6 months | overdue more than 6 months up to 1 year | overdue by more than 1 year | Total | % of net trade A/R | current | overdue by up to 3 months | overdue more than 3 months up to 6 months | overdue more than 6 months up to 1 year | overdue by more than 1 year | Total | % of net trade A/R | ||||||||||||||||||||||||||||||
| | (in millions) | (in millions) | ||||||||||||||||||||||||||||||||||||||||||
U.S. Government health care programs | $ | 534 | $ | 106 | $ | 45 | $ | 118 | $ | 13 | $ | 816 | 27 | $ | 535 | $ | 125 | $ | 55 | $ | 38 | $ | 119 | $ | 872 | 27 | ||||||||||||||||||
U.S. commercial payors | 239 | 140 | 41 | 36 | 13 | 469 | 16 | 264 | 161 | 50 | 41 | 30 | 546 | 17 | ||||||||||||||||||||||||||||||
U.S. hospitals | 87 | 34 | 3 | 3 | 3 | 130 | 4 | 186 | 81 | 34 | 7 | 0 | 308 | 9 | ||||||||||||||||||||||||||||||
Self-pay of U.S. patients | 1 | 4 | 0 | 1 | 1 | 7 | 0 | 1 | 5 | 4 | 3 | 2 | 15 | 0 | ||||||||||||||||||||||||||||||
Other North America | 6 | 0 | 0 | 0 | 0 | 6 | 0 | |||||||||||||||||||||||||||||||||||||
International product customers and health care payors | 953 | 266 | 120 | 136 | 134 | 1,609 | 53 | |||||||||||||||||||||||||||||||||||||
Other North America Segment payors | 3 | 29 | 5 | 1 | 0 | 38 | 1 | |||||||||||||||||||||||||||||||||||||
Product customers and health care payors outside the North America Segment | 845 | 311 | 124 | 98 | 128 | 1,506 | 46 | |||||||||||||||||||||||||||||||||||||
| | | | | | | | | | | | | | | | | | | | | | | | | | | | | | | | | | | | | | | | | | | | | |
Total | $ | 1,820 | $ | 550 | $ | 209 | $ | 294 | $ | 164 | $ | 3,037 | 100 | $ | 1,834 | $ | 712 | $ | 272 | $ | 188 | $ | 279 | $ | 3,285 | 100 | ||||||||||||||||||
| | | | | | | | | | | | | | | | | | | | | | | | | | | | | | | | | | | | | | | | | | | | | | |
| | | | | | | | | | | | | | | | | | | | | | | | | | | | | | | | | | | | | | | | | | | | | |
d) Self-Insurance Programs
Under theits insurance programs for professional, product and general liability, auto liability, and worker's compensation and medical malpractice claims, FMCH, our largest subsidiary, is partially self-insured for professional liability claims. For all other coverages we assume responsibility for incurred claims up to predetermined
amounts above which third party insurance applies. Reported liabilities for the year represent estimated future payments of the anticipated expense for claims incurred (both reported and incurred but not reported) based on historical experience and existing claim activity. This experience includes both the rate of claims incidence (number) and claim severity (cost) and is combined with individual claim expectations to estimate the reported amounts.
e) Noncontrolling Interests Subject to Put Provisions
The methodology we utilize to estimate the fair value is described in further detail in Note 11 of the Notes to Consolidated Financial Statements, "Noncontrolling Interest Subject to Put Provisions and Other Temporary Equity," included in this report.
II. Financial Key Performance Indicators used for Internal Management
TheUntil now, the Management Board oversees our Company by setting strategic and operational targets and measuring various financial key performance indicators used for internal management determined in U.S. dollars based on accounting principles generally accepted in the U.S. ("U.S. GAAP").GAAP. These key performance indicators do not differ between the operating segments. Each operating segment is evaluated based on target figures that reflect revenue and expenses the operating segments control. See "Financial Condition and Results of Operations- Overview"Operations-Overview" below for a discussion of exclusion of certain costs from operating segment results. Starting in 2017, the financial key performance indicators used for internal management are no longer determined in U.S. dollar based on U.S. GAAP. Instead, the indicators are determined in euro based on IFRS. To reflect this upcoming change, Item 5, "Operating and Financial Review and Prospects – IV. Liquidity and Capital Resources – Outlook" contains figures determined in euro based on IFRS. As such, in 2017 the segment reporting in the Notes to the Consolidated Financial Statements and in the group management report the operating segments are based on IFRS and determined in euro. Due to increased impacts of exchange rate fluctuations on the financial key performance indicators in euro, the growth rates will also be calculated at constant exchange rates in 2017.
a) U.S. GAAP-based measures
GAAP-Based Measures Utilized as Financial Key Performance Indicators
i) Revenue
For our operating segments, revenue is a financial key performance indicator. The number of treatments performed each year is an indicator of revenue generation. For further information regarding revenue recognition and measurement, refer to Note 11h of the Notes to Consolidated Financial Statements, "The Company and Basis of Presentation – Summary of Significant Accounting Policies – Revenue Recognition and Allowance for Doubtful Accounts".Accounts," included in this report. Revenue is also benchmarked based on movement at Constant Exchange Rates. See the "Non-U.S. GAAP Measures" below.
ii) Operating Income
Operating income is used to measure the profitability of the operating segments and therefore is also a financial key performance indicator.
iii) Operating Income Margin
Operating income margin, the ratio of operating income to revenue, represents the percentage of operating income earned on revenue generated and is another financial key performance indicator for each segment.
iv) Growth in Net Income
On a consolidated level, the percentage growth in net income (net income attributable to shareholders of FMC-AG & Co. KGaA), which compares current period to prior period net income, is an additional financial key performance indicator used for our internal management of the Company.management.
v) Growth in Basic Earnings per Share
Percentage growth in basic earnings per share is a financial key performance indicator to evaluate our profitability. This indicator helps to manage our overall performance. Basic earnings per share is calculated by dividing net income attributable to shareholders by the weighted-average number of ordinary shares outstanding during the year. Prior to the conversion of preference shares to ordinary shares during the second quarter of 2013, basic earnings per share was computed according to the "two-class method" by dividing net income attributable to shareholders, less preference amounts, by the weighted average number of ordinary and preference shares outstanding during the year. Additionally, we compute a percentage growth in adjusted basic earnings per share for use in our management incentive program targets.targets under the FMC AG & Co. KGaA Long- Term Incentive Program 2011.
vi) Net cash provided by (used in) operating activities in % of revenue
Our consolidated statement of cash flows indicates how we generated and used cash and cash equivalents. When used in conjunction with the other primary financial statements, it provides information that helps us evaluate the changes of our net assets and our financial structure (including our liquidity and solvency). Net cash provided by (used in) operating activities is used to assess whether a business can generate the cash required to make replacement and expansion investments. Net cash provided by (used in) operating activities is impacted by the profitability of our business and the development of working capital, principally receivables. The indicator net cash provided by (used in) operating activities in % of revenue shows the percent of our revenue that is available in terms of financial resources. This is an indicator for our operative financial strength.
vii) Capital Expenditures
Capital expenditures for property, plant, and equipment is an indicator used by our internal management. We manage our capital expenditures using a detailed coordination and evaluation process. The Management Board sets this capital expenditures budget. Before capital expenditures projects are approved, our internal Acquisition Investment Committee examines the individual projects and measures the potential return on these expenditures and their expected yield. The capital expenditures projects are
evaluated based on commonly used methods such as the net present value and internal interest rate methods, as well as payback periods.
b) Non-U.S. GAAP Based Measures
Utilized as Financial Key Performance Indicators
i) EBITDA
EBITDA (earnings before interest, tax, depreciation and amortization expenses) was approximately $3,413 million, 19.1% of revenues for 2016, $3,044 million, 18.2% of revenues for 2015 and $2,954 million, 18.7% of revenues for 2014, $2,904 million, 19.9% of revenues for 2013 and $2,821 million, 20.4% of revenues for 2012.2014. EBITDA is the basis for determining compliance with certain covenants contained in our Amended 2012 Credit Agreement, the A/R Facility, and the indentures relating to our senior notes. You should not consider EBITDA to be an alternative to net earnings determined in accordance with U.S. GAAP or to cash flow from operations, investing activities or financing activities. In addition, not all funds depicted by EBITDA are available for management's discretionary use. For example, a substantial portion of such funds are subject to contractual restrictions and functional requirements for debt service, to fund necessary capital expenditures and to meet other commitments from time to time as described in more detail elsewhere in this report. EBITDA, as calculated, may not be comparable to similarly titled measures reported by other companies. A reconciliation of EBITDA to cash flow provided
by (used in) operating activities, which we believe to be the most directly comparable U.S. GAAP financial measure, is calculated as follows:
Reconciliation of EBITDA to net cash provided by (used in) operating activities
| | For the years ended December 31, | For the years ended December 31, | ||||||||||||||||||
|---|---|---|---|---|---|---|---|---|---|---|---|---|---|---|---|---|---|---|---|---|
| | 2014 | 2013 | 2012 | 2016 | 2015 | 2014 | ||||||||||||||
| | (in millions) | (in millions) | ||||||||||||||||||
Total EBITDA | $ | 2,954 | $ | 2,904 | $ | 2,821 | $ | 3,413 | $ | 3,044 | $ | 2,954 | ||||||||
Interest expense (net of interest income) | (411 | ) | (409 | ) | (426 | ) | (406 | ) | (391 | ) | (411 | ) | ||||||||
Income tax expense, net | (584 | ) | (592 | ) | (605 | ) | (683 | ) | (623 | ) | (584 | ) | ||||||||
Change in deferred taxes, net | 114 | 16 | 75 | (6 | ) | (45 | ) | 114 | ||||||||||||
Changes in operating assets and liabilities | (246 | ) | 137 | 169 | (148 | ) | (17 | ) | (246 | ) | ||||||||||
Stock compensation expense | 9 | 14 | 26 | 30 | 12 | 9 | ||||||||||||||
Other items, net | 26 | (35 | ) | (21 | ) | (60 | ) | (20 | ) | 26 | ||||||||||
| | | | | | | | | | | | | | | | | | | | | |
Net cash provided by (used in) operating activities | $ | 1,861 | $ | 2,035 | $ | 2,039 | $ | 2,140 | $ | 1,960 | $ | 1,861 | ||||||||
| | | | | | | | | | | | | | | | | | | | | | |
| | | | | | | | | | | | | | | | | | | | | |
The ratio of debt to EBITDA is a key financial performance indicator used for overseeing the Company. To determine the total debt to EBITDA ratio, financial liabilities aredebt is compared to EBITDA (adjusted for otheracquisitions with a purchase price above a certain threshold and non-cash charges and largest acquisitions)charges). We believe this ratio provides more reliable information regarding the extent to which we are able to meet our payment obligations than considering only the total amount of financial liabilities.
ii) Free Cash flow measuresFlow in Percent of Revenue
Our consolidated statementConsolidated Statements of cash flows indicatesCash Flows indicate how we generated and used cash and cash equivalents. When used in conjunction with the other primary financial statements, it provides information that helps us evaluate the changes in our net assets and our financial structure (including our liquidity and solvency). The net cash provided by (used in) operating activities is used to assess whether our business can generate the cash required to make replacement and expansion investments. Net cash provided by (used in) operating activities is impacted by the profitability of our business and development of working capital, principally receivables. The financial key performance indicator of net cash provided by (used in) operating activities in percentage of revenue shows the percentage of our revenue that is available in terms of financial resources.
Free cash flow is the cash flow provided by (used in) operating activities after capital expenditures for property, plant and equipment but before acquisitions and investments. The key performance indicator used by management is free cash flow in percentage of revenue. This represents the percentage of revenue that is available for acquisitions, dividends to shareholders, or the reduction of debt financing.
Table of Contents The following table shows the significant cash flow key performance indicators:
Significant Cash Flow key performance indicators
| | For the years ended December 31, | For the years ended December 31, | ||||||||||||||||||
|---|---|---|---|---|---|---|---|---|---|---|---|---|---|---|---|---|---|---|---|---|
| | 2014 | 2013 | 2012 | 2016 | 2015 | 2014 | ||||||||||||||
| | (in millions) | (in millions) | ||||||||||||||||||
Revenue | $ | 15,832 | $ | 14,610 | $ | 13,800 | $ | 17,911 | $ | 16,738 | $ | 15,832 | ||||||||
Net cash provided by (used in) operating activities | 1,861 | 2,035 | 2,039 | 2,140 | 1,960 | 1,861 | ||||||||||||||
Capital expenditures | (932 | ) | (748 | ) | (675 | ) | (1,030 | ) | (953 | ) | (932 | ) | ||||||||
Proceeds from sale of property, plant and equipment | 12 | 20 | 9 | 18 | 18 | 12 | ||||||||||||||
Capital expenditures, net | (920 | ) | (728 | ) | (666 | ) | (1,012 | ) | (935 | ) | (920 | ) | ||||||||
Free cash flow | 941 | 1,307 | 1,373 | 1,128 | 1,025 | 941 | ||||||||||||||
Net cash provided by (used in) operating activities in % of revenue | 11.8 | % | 13.9 | % | 14.8 | % | 11.9 | % | 11.7 | % | 11.8 | % | ||||||||
Free cash flow in % of revenue | 5.9 | % | 8.9 | % | 10.0 | % | 6.3 | % | 6.1 | % | 5.9 | % | ||||||||
iii) Delivered EBIT
As a result of the significance of noncontrolling interest holders in our operations, we believe a measure that is meaningful to investors is operating income less noncontrolling interests ("Delivered
EBIT"). Delivered EBIT approximates the operating income attributable to the shareholders of FMC-AG & Co. KGaA. As such, we believe that operating income, or EBIT, is the closest comparable U.S. GAAP measure. Below is a table showing the reconciliation of Delivered EBIT to Operating Income for each of our reporting segments:
| | For the years ended December 31, | |||||||||
|---|---|---|---|---|---|---|---|---|---|---|
| | 2016 | 2015 | 2014 | |||||||
| | (in millions) | |||||||||
Total | ||||||||||
Operating income (EBIT) | $ | 2,638 | $ | 2,327 | $ | 2,255 | ||||
less noncontrolling interests | (306 | ) | (284 | ) | (215 | ) | ||||
| | | | | | | | | | | |
Delivered EBIT | 2,332 | 2,043 | 2,040 | |||||||
North America | ||||||||||
Operating income (EBIT) | 2,119 | 1,798 | 1,643 | |||||||
less noncontrolling interests | (295 | ) | (274 | ) | (207 | ) | ||||
| | | | | | | | | | | |
Delivered EBIT | 1,824 | 1,524 | 1,436 | |||||||
Dialysis | ||||||||||
Operating income (EBIT) | 2,060 | 1,701 | 1,566 | |||||||
less noncontrolling interests | (270 | ) | (234 | ) | (187 | ) | ||||
| | | | | | | | | | | |
Delivered EBIT | 1,790 | 1,467 | 1,379 | |||||||
Care Coordination | ||||||||||
Operating income (EBIT) | 59 | 97 | 77 | |||||||
less noncontrolling interests | (25 | ) | (40 | ) | (20 | ) | ||||
| | | | | | | | | | | |
Delivered EBIT | 34 | 57 | 57 | |||||||
EMEA | ||||||||||
Operating income (EBIT) | 524 | 577 | 590 | |||||||
less noncontrolling interests | (4 | ) | (3 | ) | (3 | ) | ||||
| | | | | | | | | | | |
Delivered EBIT | 520 | 574 | 587 | |||||||
Asia-Pacific | ||||||||||
Operating income (EBIT) | 319 | 298 | 279 | |||||||
less noncontrolling interests | (7 | ) | (7 | ) | (5 | ) | ||||
| | | | | | | | | | | |
Delivered EBIT | 312 | 291 | 274 | |||||||
Latin America | ||||||||||
Operating income (EBIT) | 66 | 48 | 101 | |||||||
less noncontrolling interests | 0 | 0 | 0 | |||||||
| | | | | | | | | | | |
Delivered EBIT | $ | 66 | $ | 48 | $ | 101 | ||||
Non-U.S. GAAP Based Measures Utilized as Financial Key Performance Indicators – Updates to Key Performance Indicators
iv) Return on invested capital ("ROIC")
With the development of Vision 2020 we communicated improvements in ROIC. Therefore, we implemented ROIC improvement on group level in 2016 as a key performance measure in association with the FMC-AG & Co. KGaA Long-Term Incentive Plan 2016 ("LTIP 2016") to measure our performance. ROIC is determined according to IFRS in euro based on full year results. ROIC is the ratio of operating income after tax (adjusted for noncontrolling interests in the North America Segment) to average invested capital of the last five balance sheet dates and expresses how efficiently we allocate the capital under our control or how well we employ our capital with regard to a specific investment project. The following table presents a reconciliation of invested capital to the IFRS measure total assets, which we believe to be the most directly comparable IFRS financial measure, at December 31, 2016 and 2015. ROIC is determined from our financial statements prepared in accordance with IFRS because ROIC is one of the measures used to determine the achievement of pre-defined performance targets under our LTIP 2016, which
requires that such determinations be made from our financial statements prepared in accordance with IFRS.
Reconciliation of Average Invested Capital and ROIC
in $ million, except ROIC
2016 | December 31, 2016 | September 30, 2016(5) | June 30, 2016(5) | March 31, 2016(5) | December 31, 2015(5) | |||||||||||
|---|---|---|---|---|---|---|---|---|---|---|---|---|---|---|---|---|
| | (in IFRS) | (in IFRS) | (in IFRS) | (in IFRS) | (in IFRS) | |||||||||||
Total assets(3) | $ | 26,883 | $ | 26,869 | $ | 26,765 | $ | 26,483 | $ | 25,780 | ||||||
Plus: Cumulative goodwill amortization(3) | 468 | 471 | 471 | 471 | 469 | |||||||||||
Minus: Cash and cash equivalents(3) | (747 | ) | (632 | ) | (725 | ) | (530 | ) | (562 | ) | ||||||
Minus: Loans to related parties(3) | (210 | ) | (161 | ) | (168 | ) | (224 | ) | (198 | ) | ||||||
Minus: Deferred tax assets(3) | (307 | ) | (293 | ) | (276 | ) | (279 | ) | (284 | ) | ||||||
Minus: Accounts payable(3) | (607 | ) | (528 | ) | (575 | ) | (564 | ) | (637 | ) | ||||||
Minus: Accounts payable to related parties(3) | (278 | ) | (258 | ) | (218 | ) | (237 | ) | (153 | ) | ||||||
Minus: Provisions and other current liabilities(1),(3) | (3,011 | ) | (2,871 | ) | (2,867 | ) | (2,666 | ) | (2,689 | ) | ||||||
Minus: Income tax payable(3) | (255 | ) | (254 | ) | (254 | ) | (279 | ) | (235 | ) | ||||||
| | | | | | | | | | | | | | | | | |
Invested capital(3) | $ | 21,936 | $ | 22,343 | $ | 22,153 | $ | 22,175 | $ | 21,491 | ||||||
| | | | | | | | | | | | | | | | | |
| | | | | | | | | | | | | | | | | |
| | | | | | | | | | | | | | | | | |
Average invested capital as of December 31, 2016(3) | $ | 22,020 | ||||||||||||||
Operating income(4),(5) | $ | 2,654 | ||||||||||||||
Income tax expense(2),(4) | $ | (930 | ) | |||||||||||||
| | | | | | | | | | | | | | | | | |
Net operating profit after-tax(4) | $ | 1,724 | ||||||||||||||
| | | | | | | | | | | | | | | | | |
| | | | | | | | | | | | | | | | | |
| | | | | | | | | | | | | | | | | |
ROIC in % | 7.8 | % | ||||||||||||||
2015 | December 31, 2015 | September 30, 2015 | June 30, 2015 | March 31, 2015 | December 31, 2014 | |||||||||||
|---|---|---|---|---|---|---|---|---|---|---|---|---|---|---|---|---|
| | (in IFRS) | (in IFRS) | (in IFRS) | (in IFRS) | (in IFRS) | |||||||||||
Total assets(3) | $ | 25,308 | $ | 25,087 | $ | 25,100 | $ | 24,745 | $ | 25,099 | ||||||
Plus: Cumulative goodwill amortization(3) | 469 | 470 | 471 | 470 | 473 | |||||||||||
Minus: Cash and cash equivalents(3) | (550 | ) | (621 | ) | (582 | ) | (623 | ) | (634 | ) | ||||||
Minus: Loans to related parties(3) | (198 | ) | (159 | ) | (118 | ) | (146 | ) | (171 | ) | ||||||
Minus: Deferred tax assets(3) | (279 | ) | (254 | ) | (253 | ) | (236 | ) | (258 | ) | ||||||
Minus: Accounts payable(3) | (628 | ) | (583 | ) | (537 | ) | (583 | ) | (573 | ) | ||||||
Minus: Accounts payable to related parties(3) | (153 | ) | (200 | ) | (179 | ) | (137 | ) | (141 | ) | ||||||
Minus: Provisions and other current liabilities(3) | (2,655 | ) | (2,456 | ) | (2,471 | ) | (2,386 | ) | (2,311 | ) | ||||||
Minus: Income tax payable(3) | (235 | ) | (225 | ) | (221 | ) | (224 | ) | (257 | ) | ||||||
| | | | | | | | | | | | | | | | | |
Invested capital(3) | $ | 21,079 | $ | 21,059 | $ | 21,210 | $ | 20,880 | $ | 21,227 | ||||||
| | | | | | | | | | | | | | | | | |
| | | | | | | | | | | | | | | | | |
| | | | | | | | | | | | | | | | | |
Average invested capital as of December 31, 2015(3) | $ | 21,091 | ||||||||||||||
Operating income(4) | $ | 2,362 | ||||||||||||||
Income tax expense(2),(4) | $ | (872 | ) | |||||||||||||
| | | | | | | | | | | | | | | | | |
Net operating profit after-tax(4) | $ | 1,490 | ||||||||||||||
| | | | | | | | | | | | | | | | | |
| | | | | | | | | | | | | | | | | |
| | | | | | | | | | | | | | | | | |
ROIC in % | 7.1 | % | ||||||||||||||
c) Business Metrics for Care Coordination
The measures for our North America Segment discussed below include current and future programs that we will be participating in and will be reflected in the discussion of our business within the North America Segment. Currently, the sub-capitation, capitation arrangements under physician practice services, BPCI, ESCO programs and other shared savings programs are included within the Member Months and Medical Cost Under Management calculations below. In the future, there may be other programs that could be included in the following metrics. These metrics may be developed further in future periods. Note that due to the timing required by CMS to review the BPCI program data that we provide, estimates have been used in order to report these metrics in a timely manner.
i) Member Months Under Medical Cost Management
Member months under medical cost management is calculated by multiplying the number of members who are included in value-based reimbursement programs, such as Medicare Advantage plans or other value-based programs in the U.S., by the corresponding number of months these members participate in those programs ("Member Months"). In the aforementioned programs, we are assuming the risk of generating savings. The financial results will be recorded in earnings as our performance is determined. The membership offerings within Care Coordination are sub-capitation arrangements, MA-CSNPs, ESCO and BPCI programs as well as other shared savings programs. An increase in patient membership may indicate future earnings or losses as our performance is determined through these managed care programs.
ii) Medical Cost Under Management
Medical cost under management represents the management of medical costs associated with our patient membership in value-based programs. For ESCO, BPCI and other shared savings programs, this is calculated by multiplying the Member Months in each program by the benchmark of expected medical cost per member per month. The sub-capitation and MA-CSNPs calculation multiplies the premium per member of the program per month by the number of Member Months associated with the plan, as noted above.
iii) Care Coordination Patient Encounters
Care Coordination patient encounters represents the total patient encounters and procedures conducted by certain of our Care Coordination activities. Specifically, Care Coordination patient encounters is the sum of all encounters and procedures completed during the period by Sound, MedSpring Urgent Care, Fresenius Vascular Care, and National Cardiovascular Partners as well as patients in our Rx BMM program.
d) Non-U.S. GAAP Based Measures for Presentation
i) Constant Currency
Changes in revenue include the impact of changes in foreign currency exchange rates. We use the non-GAAP financial measure at Constant Exchange Rates or Constant Currency in our filings to show changes in our revenue without giving effect to period-to-period currency fluctuations. Under U.S. GAAP, revenues received in local (non-U.S. dollar) currency are translated into U.S. dollars at the average exchange rate for the period presented. Once we translate the current period local currency revenues for the Constant Currency, we then calculate the change, as a percentage, of the current period revenues using the prior period exchange rates versus the prior period revenues. This resulting percentage is a non-GAAP measure referring to a percentage change at Constant Currency.
We believe that revenue growth is a key indication of how a company is progressing from period to period and that the non-GAAP financial measure Constant Currency is useful to investors, lenders, and other creditors because such information enables them to gauge the impact of currency fluctuations on a company's revenue from period to period. However, we also believe that the usefulness of data on Constant Currency period-over-period changes is subject to limitations, particularly if the currency effects that are eliminated constitute a significant element of our revenue and significantly impact our performance. We therefore limit our use of Constant Currency period-over-period changes to a measure for the impact of currency fluctuations on the translation of local currency revenue into U.S. dollars. We do
not evaluate our results and performance without considering both Constant Currency period-over-period changes in non-U.S. GAAP revenue on the one hand and changes in revenue prepared in accordance with U.S. GAAP on the other. We caution the readers of this report to follow a similar approach by considering data on Constant Currency period-over-period changes only in addition to, and not as a substitute for or superior to, changes in revenue prepared in accordance with U.S. GAAP. We present the fluctuation derived from U.S. GAAP revenue next to the fluctuation derived from non-GAAP revenue. Because the reconciliation of non-GAAP to U.S. GAAP measures is inherent in the disclosure, we believe that a separate reconciliation would not provide any additional benefit.
III. Financial Condition and Results of Operations
Overview, legislation and growth
Overview
We are the world's largest kidney dialysis company.company, based on publicly reported sales and number of patients treated. We provide dialysis care and related services related to the dialysis treatment a patient withpersons who suffer from ESRD receives as well as other health care services. We describe our other health care services as "Care Coordination." Care Coordination services include pharmacy services, vascular, cardiovascular and endovascular specialty services, non-dialysis laboratory testing services, physician services, hospitalist and intensivist services, health plan services and urgent care services, which, together with dialysis care services represent our health care services. We also develop and manufacture a full range of dialysis machines, systems and disposable products, which we sell to customers in more than 120 countries.countries and also use in our internal health care service operations. Our dialysis business is therefore vertically integrated, providingintegrated. We describe our other health care services as Care Coordination. Care Coordination currently includes coordinated delivery of pharmacy services, vascular, cardiovascular and endovascular specialty services, non-dialysis laboratory testing services, physician services, hospitalist and intensivist services, health plan services, ambulatory surgery center services and urgent care services, which, together with dialysis treatment at our own dialysis clinics and supplying these clinics with a broad range of products. In addition, we sell dialysis products to other dialysis service providers. Based on publicly reported sales and number of patients treated,care services represent our health care operations in dialysis services and dialysis products make us the world's largest kidney dialysis company.services. We estimateestimated the volume of the global dialysis market was approximately $77$76 billion for 2014, an increase of 1% comparedin 2016. Due to the previous year (4% increase in constant currency terms).complexity of the types of services provided within Care Coordination, we are currently unable to estimate the volume of this market. Dialysis patient
growth results from factors such as the aging population and increased life expectancies; shortage of donor organs for kidney transplants; increasing incidence of kidney disease and better treatment of and survival of patients with diabetes, hypertension and other illnesses, which frequently lead to the onset of chronic kidney disease; improvements in treatment quality, which prolong patient life; and improving standards of living in developing countries, which make life-saving dialysis treatment available. Key
As a global company delivering health care services and dialysis products, we face the challenge of addressing the needs of a wide variety of stakeholders, such as patients, customers, payors, regulators and legislators in many different economic environments and health care systems. In general, government-funded programs (in some countries in coordination with private insurers) pay for certain health care items and services provided to continued growththeir citizens. Not all health care systems provide for dialysis treatment. Therefore, the reimbursement systems in revenue is our ability to attract new patients in order to increase the number of treatments performed each year. For that reason, we believe the number of treatments performed each year is a strong indicator of continued revenue growth and success.
In addition, the reimbursementvarious countries and ancillary services utilization environment significantly influencesinfluence our business.
The majority of treatmentshealth care services we provide are paid for by governmental institutionsinstitutions. Approximately 32% of our consolidated revenues are attributable to U.S. federally-funded health care benefit programs, such as Medicare and Medicaid reimbursement, under which reimbursement rates are set by the CentersCMS. Legislative changes could affect Medicare reimbursement rates for Medicare & Medicaid Services ("CMS")a significant portion of the services we provide. To date, while we have generally experienced stable reimbursement globally, the stability of reimbursement in the United States.U.S. has been affected by the following legislative developments:
Significant Legislative Impacts on U.S. Reimbursement
There is presently considerable uncertainty regarding possible future changes in health care regulation, including the regulation of reimbursement for dialysis services. See "Risk Factors – We operate in a highly regulated industry such that the potential for legislative reform provides uncertainty and potential threats to our operating models and results."
Significant Administrative Impacts on U.S. Reimbursement
On October 29, 2015, CMS issued a final rule to update payment policies and rates under the ESRD PPS for renal dialysis services furnished on or after January 1, 2016. In this final rule, CMS clarified that once any non-oral drug in a category previously considered "oral only" is approved by the FDA, such category of drugs will cease to be considered oral only. At such time, CMS will include both the oral and any non-oral version of the drug in the ESRD PPS. However, for at least two years after FDA approval, CMS will pay for both oral and non-oral versions of the drug using a transition drug add-on payment adjustment, such as average sales price plus 6%, or some other mechanism set in accordance with Section 1847A of the Social Security Act. During this transition period, CMS will not pay outlier payments for these drugs, but will collect data reflecting utilization of both the oral and injectable or intravenous forms of the drugs, as well as payment patterns, in order to more accurately determine the appropriate payment rate to be included in the ESRD PPS for these drugs. At the end of this transition period, CMS will add payment for the oral and non-oral versions of the drug into the ESRD PPS through public rulemaking process similar to that used to set annual ESRD PPS rates. Please see the discussion under "Reimbursement" in Item 4.B above, "Information on the Company – B. Business Overview" for more information.
Premium Assistance Programs
On August 18, 2016, CMS issued an RFI seeking public comment on concerns about providers' steering patients inappropriately to individual plans offered on the Patient Protection and Affordable Care Act individual market plans. We and other dialysis providers, commercial insurers and other industry participants responded to the RFI, and in that response, we reported that we do not engage in such steering. On December 14, 2016, CMS published an IFR titled "Medicare Program; Conditions for Coverage for End-Stage Renal Disease Facilities-Third Party Payment" that would amend the Conditions for Coverage for dialysis providers, like FMCNA. The IFR would have effectively enabled insurers to reject premium payments made by patients who received grants for individual market coverage from the AKF and therefore, could have resulted in those patients losing their individual market coverage. The loss of individual market coverage for these patients would have had a material and adverse impact on our results of operations. On January 25, 2017, a federal district court in Texas, responding to litigation initiated by a patient advocacy group and dialysis providers including FMCNA, preliminarily enjoined CMS from implementing the IFR. Dialysis Patient Citizens v. Burwell (E.D. Texas, Sherman Div.). The preliminary injunction is based on CMS' failure to follow appropriate notice-and-comment procedures in adopting the IFR. The preliminary injunction will remain in place in the absence of a contrary ruling by the district or appellate courts. For more information on the interim final rule as well as the subsequent challenge in the U.S. District Court for the Eastern District of Texas, please see "Reimbursement" in Item 4.B above, "Information on the Company – B. Business Overview."
Recent CMS ESRD PPS Payment Rates
For a discussion of CMS ESRD PPS payment rates for 2016 and 2017, please see the discussion under "Reimbursement" in Item 4.B above, "Information on the Company – B. Business Overview."
Reimbursement Expectation
As a consequence of the pressure to decrease health care costs, government reimbursement rate increases in the U.S. have historically been historicallylimited and are expected to continue in the future to be limited. While wethis fashion. We have generally experienced stable reimbursement globally, including the balancing of unfavorable reimbursement changes in certain countries with favorable changes in other countries, the stability of reimbursement in the U.S. has been affected by (i) the implementation of the ESRD prospective payment system ("ESRD PPS") in the U.S. in January 2011, (ii) the U.S. federal government across the board spending cuts in payments to Medicare providers commonly referred to as U.S. Sequestration (as defined below), (iii) commencing on January 1, 2014, the reduction to the ESRD PPS rate to account for the decline in utilization of certain drugs and biologicals associated with dialysis (see discussion of the American Taxpayer Relief Act of 2012 ("ATRA") below) and (iv) the enactment of PAMA (see discussion below). In the future we expect to experience generally stable reimbursements for dialysis services globally.
With the enactment in the U.S. of the Medicare Improvements for Patients and Providers Act of 2008 ("MIPPA"), Congress created the ESRD PPS pursuant to which CMS reimburses dialysis facilities with a single payment for each dialysis treatment, inclusive of (i) all items and services included in the pre-2011 ESRD composite rate, (ii) oral vitamin D analogues, oral levocarnitine (an amino acid derivative) and all erythropoietin stimulating agents ("ESAs") and other pharmaceuticals (other than vaccines and certain other oral drugs) furnished to ESRD patients that were previously reimbursed separately under Part B of the Medicare program, (iii) most diagnostic laboratory tests and (iv) certain other items and services furnished to individuals for the treatment of ESRD. The base ESRD PPS payment is subject to case mix adjustments that take into account individual patient characteristics (e.g., age, body surface area, body mass, time on dialysis) and certain co-morbidities. The base payment is also adjusted for (i) certain high cost patient outliers due to unusual variations in medically necessary care, (ii) disparately high costs incurred by low volume facilities relative to other facilities, (iii) provision of home dialysis training and (iv) wage-related costs in the geographic area in which the provider is located.
The ESRD PPS payment amount is also subject to annual adjustment based on increases in the costs of a "market basket" of certain healthcare items and services less a productivity adjustment.
In addition to creating the ESRD PPS, MIPPA also created the ESRD quality incentive program ("QIP") which began affecting payments starting January 1, 2012. Dialysis facilities that fail to achieve quality standards established by CMS could have payments reduced by up to 2 percent. Performance on specified measures in a fiscal year affects payments two fiscal years later. For instance, the payments we receive during 2014 will be affected by our performance measures from 2012. Based on our performance from 2010 through 2012, the QIP's impact on our results through 2014 is immaterial. The initial QIP measures for 2010 and 2011 focused on anemia management (measured by hemoglobin level) and dialysis adequacy (measured by URR). For payment year 2014, CMS adopted four additional measures: prevalence of catheter and A/V fistula use, reporting of infections to the Centers for Disease Control and Prevention, administration of patient satisfaction surveys and monthly monitoring of phosphorus and calcium levels. For payment year 2015, CMS will continue all of the 2014 QIP measures except URR dialysis adequacy, expand the scope of infection reporting and mineral metabolism reporting, and add four new measures. Payment year 2015 added measures consist of three new clinical measures (hemodialysis adequacy for adult patients, hemodialysis adequacy for pediatric patients and peritoneal dialysis adequacy for adult patients), and one new reporting measure (anemia management reporting). Payment year 2015 payment adjustments, following the pattern previously established, will be based on performance in 2013. For payment year 2016, CMS continued all of the 2015 QIP measures and add two new clinical measures (proportion of patients with hypercalcemia and dialysis-related infections reported to the Center for Disease Control and Prevention's National Health Safety Network). For payment year 2017, CMS will retire one measure of hemoglobin adequacy and add a measure of hospital readmissions in order to assess
coordinated care. For payment year 2018, CMS will add two new clinical measures (standardized transfusion ratio and pediatric peritoneal dialysis adequacy) and three new reporting measures (pain assessment and follow-up, clinical depression screening and follow-up and influenza vaccination of healthcare personnel).
The Patient Protection and Affordable Care Act, as amended by the Health Care and Education Reconciliation Act of 2010 (collectively, "ACA") implements broad healthcare system reforms, including (i) provisions to facilitate access to affordable health insurance for all Americans, (ii) expansion of the Medicaid program, (iii) an industry fee on pharmaceutical companies that began in 2011 based on sales of brand name pharmaceuticals to government healthcare programs, (iv) a 2.3 percent excise tax on manufacturers' medical device sales starting in 2013, (v) increases in Medicaid prescription drug rebates effective January 1, 2010, (vi) commercial insurance market reforms that protect consumers, such as bans on lifetime and annual limits, coverage of pre-existing conditions, limits on administrative costs, and limits on waiting periods, (vii) provisions encouraging integrated care, efficiency and coordination among providers and (viii) provisions for reduction of healthcare program waste and fraud. ACA does not modify the dialysis reimbursement provisions of MIPPA, except to change the annual update provision by substituting a productivity adjustment to the market basket rate of increase for a MIPPA provision that specified a one percentage point reduction in the market basket rate of increase.
On August 2, 2011, the Budget Control Act ("BCA") was enacted, raising the U.S. debt ceiling and putting into effect a series of actions for deficit reduction. Pursuant to the BCA, automatic across-the-board spending cuts over nine fiscal years (2013-2021), projected to total $1.2 trillion for all U.S. Federal government programs required under the BCA became effective as of March 1, 2013 and were implemented on April 1, 2013 for CMS reimbursement to providers. The Bipartisan Budget Act of 2013 extended the cuts to mandatory spending programs such as Medicare for an additional two years. The reduction in Medicare payments to providers and suppliers is limited to one adjustment of no more than 2 percent through 2022, U.S. Sequestration, rising to 2.9 percent for the first half of FY 2023 and dropping to 1.11 percent for the second half of FY 2023. Pursuant to PAMA, the reductions pursuant to U.S. Sequestration for the first six months of 2024 will be 4 percent, and there will be no reductions for the second six months of 2024. The Medicare sequestration reimbursement reduction is independent of annual inflation update mechanisms, such as the market basket update pursuant to the ESRD PPS.
ATRA directed CMS to reduce the ESRD PPS payment rate, effective January 1, 2014, to account for changes in the utilization of certain drugs and biologicals that are included in the ESRD PPS. In making such reduction, the law requires CMS to use the most recently available pricing data for such drugs and biologicals. On November 6, 2014, CMS issued the final rule regarding the ESRD PPS rate for 2015. The base rate per treatment was revised from $239.02 for 2014 to $239.43 for 2015. This change reflected a wage index budget-neutrality adjustment factor of 1.001729.
On April 1, 2014, PAMA was signed into law. This law modifies ATRA such that dialysis reimbursement for 2015 is intended to equal that for 2014. In addition, the reimbursement reductions mandated by ATRA for 2016 and 2017 have been eliminated. Instead, the market basket updates net of the productivity adjustment for each of 2016 and 2017 have been reinstated, though they will be reduced by 1.25 percent each year. For 2018, the market basket update net of the productivity adjustment will be reduced by 1 percent. In addition, the law mandates that ESRD-related drugs with only an oral form, including PhosLo®, are expected to be reimbursed under the ESRD PPS in the future with an adjusted payment amount to be determined by the Secretary of Health and Human Services to reflect the additional cost to dialysis facilities of providing these medications.countries. However, PAMA delayed inclusion of these "oral-only" drugs in the ESRD PPS until January 1, 2024 and ABLE subsequently delayed inclusion of such drugs in the ESRD PPS until January 1, 2025.
Anyany significant decreases in Medicare or commercial reimbursement rates or patient access to commercial insurance plans could have material adverse effects on our providerhealth care services business and, because the demand for dialysis products is affected by Medicare reimbursement, on our products business. To the extent that increases in operating costs that are affected by inflation, such as labor and supply costs, are not fully reflected in a compensating increase in reimbursement rates, our business and results of operations may be adversely affected.
Working with healthcare provider groups comprised of dialysis clinics and nephrologists, CMS plans to test aParticipation in new Comprehensive ESRD Care Model, also known as ESRD Seamless Care Organizations, ESCOs, for payment and care delivery that seeks to deliver better health outcomes for ESRD patients while lowering CMS's costs. ESCOs that achieve the program's minimum quality thresholds and generate reductions in CMS's cost of care above certain thresholds for the ESRD patients covered by the ESCO will
Table of ContentsMedicare Payment Arrangements
receive a share of the cost savings. ESCOs that include dialysis chains with more than 200 facilities are required to share in the risk of cost increases and reimburse CMS a share of any such increases. Organizations must apply and be approved by CMS to We also participate in the program. In 2013, CMS announcedfollowing programs, initiatives and then abandoned an initial round of applications for this demonstration. CMS revised the parameters and in May 2014 announced a new request for applications. We submitted seven applications to participatearrangements, each with specific reimbursement models as described in the revised demonstration. CMS had hopeddiscussion under "Reimbursement" in Item 4.B above, "Information on the Company – B. Business Overview."
Company Structure
In 2015, we increased our operating segments from three to launch the ESCO programfour segments in January 2015, but recently announced that the commencement date will be July 2015.
The Bundled Payments for Care Improvement initiative ("BPCI") isconjunction with a CMS three year pilot initiative with bundled payments for the individual services furnished to Medicare beneficiaries during a single episode of illness or course of treatment, including acute inpatient hospital services, physician services, and post-acute services. On January 31, 2013, CMS announced the health care organizations selected to participate in BPCI, which include our subsidiary, Sound Inpatient Physicians, Inc. Sound Physicians is currently planning and preparing to commence participation under BPCI in 2015 in several markets. Under the BPCI, we have the ability to receive additional payments if we are able to deliver quality care at a cost that is lower than certain established benchmarks, but also have the risk of incurring financial penalties if we are not successful in doing so. Should we fail to perform as required under the BPCI initiative and our agreement with CMS, CMS may, among other remedies, terminate our right to participatechange in the BPCI program, in whole or in part.
We have identified three operating segments, North America Segment, EMEALA, and Asia-Pacific, which were determined based uponstructure of how we manage our businesses. All segments are primarily engaged in providing health care services as well as distributing products and equipment for the treatment of ESRD. For reporting purposes, we have aggregated the EMEALA and Asia-Pacificbusiness. Our operating segments as the "International Segment." The segments are aggregated due to their similar characteristics such as the same services provided and products sold, the same type of patient population and similar methods of distribution of products and services. Our General Partner's management board member responsible for the profitability and cash flow of each segment's various businesses supervises the management of each operating segment. The accounting policies of the segments are the same as those we applyNorth America Segment, the EMEA Segment, the Asia-Pacific Segment and the Latin America Segment. Accordingly, the two reporting segments disclosed in preparing our consolidated financial statements using accounting principles generally accepted inprior years (the North America Segment and the United StatesInternational Segment, which was comprised of America ("U.S. GAAP").
EMEA, Asia-Pacific and Latin America) were reclassified into four reporting segments noted above during 2015. Our management evaluates each segment using measures that reflect all of the segment's controllable revenues and expenses. With respect to the performance of business operations, our management believes that the most appropriate U.S. GAAP measures are revenue, operating income and operating income margin. Management also uses certain non-U.S. GAAP measures as financial key performance indicators. See " – Non-U.S. GAAP Based Measures Utilized as Financial Key Performance Indicators," above. We do not include income taxes as we believe this is outside the segments' control. Financing is a corporate function which our segments do not control. Therefore, we do not include interest expense relating to financing as a segment measurement. Similarly, we do not allocate certain costs which relate primarily to certain headquartersheadquarters' overhead charges, including accounting and finance, Corporate, because we believe that these costs are also not within the control of the individual segments. Production of products, production asset management, quality management and procurement related to production are centrally managed at Corporate by Global Manufacturing Operations. The Company´sCorporate. Our global research and development is also centrally managed at Corporate. These Corporate activities do not fulfill the definition of a segment. Products are transferred to the segments at cost; therefore no internal profit is generated. The associated internal revenues for the product transfers and their elimination are recorded as Corporate activities (See Note 2422 of the Notes to Consolidated Financial Statements "Segment and Corporate Information" found elsewhere in this report). Capital expenditures for production are based on the expected demand of the segments and consolidated profitability considerations. In addition, certain revenues, investments and intangible assets, as well as any related expenses, are not allocated to a segment but accounted for as Corporate. Accordingly, all of these items are excluded from our analysis of segment results and are discussed below in our consolidated results of operations.
A. Results of Operations
The following tables summarize our financial performance and certain operating results by principal reporting segment and Corporate for the periods indicated. Inter-segment revenues primarily reflect sales of medical equipment and supplies. We prepared the information using a management approach, consistent with the basis and manner in which our management internally disaggregates financial information to assist in making internal operating decisions and evaluating management performance. See the table below for the years ended December 31:
| | 2014 | 2013 | 2012 | 2016 | 2015 | 2014 | ||||||||||||||
|---|---|---|---|---|---|---|---|---|---|---|---|---|---|---|---|---|---|---|---|---|
| | (in millions) | |||||||||||||||||||
Total revenue | ||||||||||||||||||||
Total revenue(1) | ||||||||||||||||||||
North America | $ | 10,509 | $ | 9,613 | $ | 9,041 | $ | 12,886 | $ | 11,813 | $ | 10,500 | ||||||||
International | 5,265 | 4,970 | 4,740 | |||||||||||||||||
Corporate | 67 | 34 | 29 | |||||||||||||||||
| | | | | | | | | | | |||||||||||
Total | 15,841 | 14,617 | 13,810 | |||||||||||||||||
| | | | | | | | | | | |||||||||||
Inter-segment revenue | ||||||||||||||||||||
North America | 9 | 7 | 10 | |||||||||||||||||
International | — | — | — | |||||||||||||||||
| | | | | | | | | | | |||||||||||
Total | 9 | 7 | 10 | |||||||||||||||||
| | | | | | | | | | | |||||||||||
Total net revenue | ||||||||||||||||||||
North America | 10,500 | 9,606 | 9,031 | |||||||||||||||||
International | 5,265 | 4,970 | 4,740 | |||||||||||||||||
EMEA | 2,667 | 2,629 | 3,072 | |||||||||||||||||
Asia-Pacific | 1,632 | 1,502 | 1,357 | |||||||||||||||||
Latin America | 712 | 766 | 836 | |||||||||||||||||
Corporate | 67 | 34 | 29 | 14 | 28 | 67 | ||||||||||||||
| | | | | | | | | | | | | | | | | | | | | |
Total | 15,832 | 14,610 | 13,800 | 17,911 | 16,738 | 15,832 | ||||||||||||||
| | | | | | | | | | | | | | | | | | | | | |
Operating income | ||||||||||||||||||||
North America | 1,643 | 1,623 | 1,598 | 2,119 | 1,798 | 1,643 | ||||||||||||||
International | 970 | 897 | 841 | |||||||||||||||||
EMEA | 524 | 577 | 590 | |||||||||||||||||
Asia-Pacific | 319 | 298 | 279 | |||||||||||||||||
Latin America | 66 | 48 | 101 | |||||||||||||||||
Corporate | (358 | ) | (264 | ) | (220 | ) | (390 | ) | (394 | ) | (358 | ) | ||||||||
| | | | | | | | | | | | | | | | | | | | | |
Total | 2,255 | 2,256 | 2,219 | 2,638 | 2,327 | 2,255 | ||||||||||||||
| | | | | | | | | | | | | | | | | | | | | |
Investment gain | — | — | 140 | |||||||||||||||||
Interest income | 84 | 39 | 44 | 47 | 117 | 84 | ||||||||||||||
Interest expense | (495 | ) | (448 | ) | (470 | ) | (453 | ) | (508 | ) | (495 | ) | ||||||||
Income tax expense | (584 | ) | (592 | ) | (605 | ) | (683 | ) | (623 | ) | (584 | ) | ||||||||
Net Income | 1,260 | 1,255 | 1,328 | 1,549 | 1,313 | 1,260 | ||||||||||||||
Less: Net Income attributable to Noncontrolling interests | (215 | ) | (145 | ) | (141 | ) | ||||||||||||||
Less: Net Income attributable to noncontrolling interests | (306 | ) | (284 | ) | (215 | ) | ||||||||||||||
| | | | | | | | | | | | | | | | | | | | | |
Net Income attributable to shareholders of FMC-AG & Co. KGaA | $ | 1,045 | $ | 1,110 | $ | 1,187 | $ | 1,243 | $ | 1,029 | $ | 1,045 | ||||||||
| | | | | | | | | | | | | | | | | | | | | | |
| | | | | | | | | | | | | | | | | | | | | |
Year ended December 31, 20142016 compared to year ended December 31, 20132015
RevenuesRevenue increased by 8%7% to $15,832$17,911 million (10%(8% increase at constant exchange rates) mainly due to contributions from acquisitions (5%) and increases in organic revenue (5%(7%) and contributions from acquisitions (1%), partially offset by the negative impact of exchange rate fluctuations (2%(1%).
In 2014, we successfully completed acquisitionsNet income attributable to expandshareholders of FMC-AG & Co. KGaA for the year ended December 31, 2016 increased by 21% to $1,243 million from $1,029 million for the same period in 2015. Excluding the impacts of (i) accrued net expense of $60 million ("Net Settlement Expense"), $36.3 million after tax, for consummation of the settlement, including legal fees and other anticipated costs related to the agreement in principle with a committee for all plaintiffs in regards to the GranuFlo® and NaturaLyte® multidistrict litigation (for further information, see Note 18 of the Notes to the Consolidated Financial Statements, "Commitments and Contingencies," included in this report), (ii) the 2015 after tax loss, $26.9 million, from the divestiture of our services withindialysis service business in Venezuela, and (iii) the 2015 realized portion of the after tax gain, $11.1 million, from the sale of our European marketing rights for certain renal pharmaceuticals to our joint venture, Vifor Fresenius Medical Care Coordination, we renegotiatedRenal Pharma, net income attributable to FMC-AG & Co. KGaA increased by 15%.
For further discussion on our credit facilities and issued senior notes and convertible debt.net income attributable to shareholders of FMC-AG & Co. KGaA, see the consolidated key financial performance indicators discussed below.
| Key Indicators for Consolidated Financial Statements | Key Indicators for Consolidated Financial Statements | Key Indicators for Consolidated Financial Statements | |||||||||||||||||||||
|---|---|---|---|---|---|---|---|---|---|---|---|---|---|---|---|---|---|---|---|---|---|---|---|
| | | | Change in % | | | Change in % | |||||||||||||||||
| | 2014 | 2013 | as reported | at Constant Exchange Rates(1) | 2016 | 2015 | as reported | at Constant Exchange Rates(1) | |||||||||||||||
Revenue in $ million | 15,832 | 14,610 | 8 | % | 10 | % | 17,911 | 16,738 | 7% | 8% | |||||||||||||
Number of treatments | 42,744,977 | 40,456,900 | 6 | % | |||||||||||||||||||
Health Care(2) | 14,519 | 13,392 | 8% | 9% | |||||||||||||||||||
Dialysis Products | 3,392 | 3,346 | 1% | 4% | |||||||||||||||||||
Number of dialysis treatments | 46,529,154 | 44,596,446 | 4% | ||||||||||||||||||||
Same market treatment growth in % | 3.7 | % | 3.6 | % | 3.2 | % | 4.3 | % | |||||||||||||||
Gross profit as a % of revenue | 31.6 | % | 32.4 | % | 32.3 | % | 31.9 | % | |||||||||||||||
Selling, general and administrative costs as a % of revenue | 16.7 | % | 16.4 | % | 17.0 | % | 17.3 | % | |||||||||||||||
Operating income in $ million | 2,255 | 2,256 | 0 | % | 2,638 | 2,327 | 13% | ||||||||||||||||
Operating income margin in % | 14.2 | % | 15.4 | % | 14.7 | % | 13.9 | % | |||||||||||||||
Delivered EBIT in $ million(3) | 2,332 | 2,043 | 14% | ||||||||||||||||||||
Net income attributable to shareholders of FMC-AG & Co. KGaA in $ million | 1,045 | 1,110 | (6 | %) | 1,243 | 1,029 | 21% | ||||||||||||||||
Basic earnings per share in $ | 3.46 | 3.65 | (5 | %) | 4.07 | 3.38 | 20% | ||||||||||||||||
Net health careHealth Care revenue increased by 10%8% to $12,250$14,519 million (12%(9% increase at Constant Exchange Rates) for the year ended December 31, 20142016 from $11,130$13,392 million in the same period of 2013,2015, mainly due to contributions from acquisitions (6%increases in organic revenue per treatment (5%), growth in same market treatments (4%(3%) and increases in organic revenue per treatmentcontributions from acquisitions (2%), partially offset by the negative impacteffect of exchange rate fluctuations (2%(1%) and the effect of closed or sold clinics (1%). Included in our net health care revenue is Care Coordination revenue in the U.S. of $1,039 million and $528 million for the years ended December 31, 2014 and 2013, respectively.
TreatmentsDialysis treatments increased by 6%4% for the year ended December 31, 20142016 as compared to the same period in 2013.2015. The increase is due to same market treatment growth (4%(3%) and contributions from acquisitions (3%(2%), partially offset by the effect of closed or sold clinics (1%).
At December 31, 2014,2016, we owned, operated or managed (excluding those managed but not consolidated in the U.S.) 3,3613,624 dialysis clinics compared to 3,2503,418 dialysis clinics at December 31, 2013.2015. For the year ended December 31, 2014,2016, we acquired 95136 clinics, opened 79122 clinics and combined, closed or sold 6352 clinics. The number of patients treated in clinics that we own, operate or manage (excluding patients of clinics managed but not consolidated in the U.S.) increased by 6%5% to 286,312308,471 at December 31, 20142016 from 270,122294,381 at December 31, 2013.2015.
Dialysis product revenue for the year ended December 31, 2016 increased by 3%1% (4% increase at Constant Exchange Rates) to $3,582$3,392 million as compared to $3,480$3,346 million in the same period of 2013.2015. The 4% increase at Constant Exchange Rates was driven by increased sales of dialyzers, machines, bloodlines, products for acute care treatments, hemodialysis solutions and concentrates and devices manufactured under a five-year contract with a Fresenius SE company,peritoneal dialysis products, partially offset by lower sales of machines.renal pharmaceuticals.
The decreaseincrease in gross profit margin to 31.6%32.3% from 32.4%31.9% primarily reflects a decreaseincreases in the North America Segment partially offset by an increase inand the InternationalAsia-Pacific Segment. The decreaseincrease in the North America Segment was mainly due to lower costs for health care supplies and a higher volume of dialysis treatments with commercial payors as well as a release of bad debt reserves, partially offset by higher personnel expense the impact from ATRA reductions on the ESRD PPS payment rate, growth in lower margin Care Coordinationrelated to dialysis services higher costs as a result of FDA remediation, an unfavorable impact from the U.S. Sequestration and higher costs for freight and distribution, partially offset by a favorable impact from the ESRD PPS market basket update and a favorable impact from commercial payors. The increase in the International Segment was due to organic growth in Asia-Pacific, partially offset by unfavorable foreign currency exchange effects and an unfavorable impact from manufacturingCare Coordination services largely driven by the higher costscost of revenue in our pharmacy services business, increased bad debt reserves for laborhospitalist and lower volumesintensivists as well as the prior year impact of peritoneal dialysis bags.reimbursement for BPCI costs. The increase in the Asia-Pacific Segment was predominantly driven by business growth.
Selling, general and administrative ("SG&A") expenses increased to $2,645$3,045 million for the year ended December 31, 20142016 from $2,391$2,895 million in the same period of 2013.2015. SG&A expenses as a percentage of sales increaseddecreased to 16.7%17.0% for the year of 2014ended December 31, 2016 in comparison with 16.4%17.3% in the same period of 20132015 due to an increasedecreases in the North America Segment, Latin America Segment and at Corporate, partially offset by aincreases in the EMEA Segment and the Asia-Pacific Segment. The decrease in the International Segment. The increase at CorporateNorth America Segment was mainly driven by higher legal and consulting expenses relateddue to the compliance
Tableprior year impact from the Net Settlement Expense of Contents
investigation we are conducting (see$60 million (for further information, see Item 15B. "Management's annual report on internal control over financial reporting" and Note 2018 of the Notes to the Consolidated Financial Statements, "Commitments and Contingencies," included in this report), higherlower legal expenses excluding Net Settlement Expense legal costs related to the changes in the Management Board, costs related to the closing of manufacturing plants and higher acquisition related costs. The decrease in the International Segment was due to a lower bad debt expense, favorable foreign exchange effectsabove, and a favorable impact from acquisitions,Care Coordination services due to proportionately higher sales as compared to SG&A expenses, partially offset by a cost impact related to the vesting of long term incentive plan grants and higher personnel expense. The decrease in the Latin America Segment was mainly due to the prior year loss related to the divestment of the dialysis service business in Venezuela as well as the impact from proportionately higher sales as compared to SG&A expenses, partially offset by higher bad debt expense and increased costs related to inflation. The decrease at Corporate was mainly driven by lower legal and consulting expenses related to compliance investigations we are conducting (for further information, see Note 18 of the Notes to the Consolidated Financial Statements, "Commitments and Contingencies," included in this report). The increase in the EMEA Segment was driven by the prior year impact from a gain onfrom the sale of real estateour European marketing rights for certain renal pharmaceuticals (see Note 2 of the Notes to Consolidated Financial Statements, "Related Party Transactions," included in Colombiathis report) and higher bad debt expense and higher IT project costs. The increase in 2013, an accrualthe Asia-Pacific Segment was mainly due to increased costs related to further sales development, unfavorable foreign exchange effects and costs associated with changes in the compliance investigation noted above and an increased level of spending to support the business growth in Asia-Pacific.Management Board.
Research and development ("R&D") decreased&D expenses increased to $122$162 million for the year ended December 31, 20142016 from $126$140 million for the same period of 2013.
For2015. This increase was driven by higher personnel expense and project costs related to an expansion of our project portfolio. Currently, we have certain R&D projects which are at the year ended December 31, 2014 we had a $1 million gain from the salepeak of FMC-AG & Co. KGaA dialysis clinics as compared to a $9 million gain from the sale of dialysis clinics for the year ended December 31, 2013.their cost consumption.
Income from equity method investees decreasedincreased to $25$65 million for the year ended December 31, 20142016 from $26$31 million for the same period of 2013.2015. This increase is primarily related to higher income from the Vifor Fresenius Medical Care Renal Pharma Ltd. joint venture due to increased revenue resulting from the expansion of its product portfolio partially offset by increased product development costs.
Operating income decreased slightlyincreased to $2,255$2,638 million for the year ended December 31, 20142016 from $2,256$2,327 million for the same period in 2013.2015. Operating income margin decreasedincreased to 14.2%14.7% for the year ended December 31, 20142016 as compared to 15.4%13.9% for the same period in 20132015 as a result of a decrease inincreased gross profit margin, and highera decrease in SG&A as a percentage of revenue as discussed above.and increased income from equity method investees.
Interest expenseDelivered EBIT increased 11% to $495$ 2,332 million for the year ended December 31, 2014 as compared to $4482016 from $2,043 million for the same period in 20132015 as a result of the increased operating income, partially offset by increased noncontrolling interests driven by higher operating income of our joint ventures involving dialysis clinics.
Interest expense decreased by 11% to $453 million for the year ended December 31, 2016 as compared to $508 million for the same period in 2015 due to the lower impact of the valuation of the embedded derivative related to the equity-neutral convertible debtbonds issued in September 2014 an increase("Convertible Bonds") and the related call option on our shares (see Note 9 of the Notes to Consolidated Financial Statements, "Long-term Debt and Capital Lease Obligations," included in the averagethis report) as well as due to a reduction in our overall debt level during the year and one-time costs related to the Amended 2012 Credit Agreement, partially offset by a higher portion of debt with lower interest rates.level. Interest income increaseddecreased to $84$47 million for the year ended December 31, 20142016 from $39$117 million for the same period in 2013 mainly as a result2015 due to the lower impact of the valuation of the derivative embedded in the Convertible Bonds and the related call option on the Company'sour shares related the issuance of equity-neutral convertible bonds, which fully offsets the increase in interest expense due to the valuation(see Note 9 of the embedded derivative noted above,Notes to Consolidated Financial Statements, "Long-term Debt and Capital Lease Obligations," included in this report) as well as higherthe repayment of interest income from interest-bearingbearing notes receivables.receivables in the fourth quarter of 2015.
Income tax expense decreasedincreased to $584$683 million for the year ended December 31, 20142016 from $592$623 million for the same period in 2013.2015. The effective tax rate decreased to 31.7%30.6% from 32.0%32.1% for the same period of 2013. The2015, mainly driven by lower tax rate forexpense as a result of released tax liabilities and a prior year impact from the year ended December 31, 2014 was affected favorably bynon-tax deductible loss from the resolutiondivestiture of challenged deductions for civil settlement payments takenour dialysis service business in prior years, resulting in a net tax benefit of $23 million. This benefit hasVenezuela, partially been offset by a lower portion of tax court decision against another company on a similar transaction for a tax position we took on a prior year's transaction which resulted in $18 million of additional expense in the second quarter of 2014.free income attributable to noncontrolling interests compared to income before taxes. The effective tax rate is also impacted by tax rate differentials which are determined by calculating the difference between the applicable tax rate in each jurisdiction in which we operate and the combined German tax rate (a corporate tax rate, which includes a solidarity surcharge, and a trade tax rate). This difference is then applied to the taxable income generated in each of the jurisdictions. The significant rate differential for 20142016 (see Note 18, "Income Taxes,"16 of the Notes to Consolidated Financial Statements)Statements, "Income Taxes," included in this report) is the result of the U.S. effective tax rate being significantly higher than the German tax rates – 39.5% compared to the combined German tax rate of 29.2%29.6%. The U.S. effective tax rate is comprised of the U.S. federal corporate tax rate of 35% adjusted for the impact of the various tax rates in the states in which we do business. The North America Segment is still and is expected to be in the future the main driver for this significant tax differential.
Net income attributable to noncontrolling interests for the year ended December 31, 20142016 increased to $215$306 million from $145$284 million for the same period of 20132015 primarily driven by the creationhigher operating income of new joint ventures with dialysis clinics, partially offset by decreased noncontrolling interest expense related to Care Coordination, both in the North America Segment.
Net income attributable to shareholders of FMC-AG & Co. KGaA for the year ended December 31, 2014 decreased2016 increased by 6%21% to $1,045$1,243 million from $1,110$1,029 million for the same period in 20132015 as a result of the combined effects of the items discussed above. Excluding the impacts of (i) the 2015 after tax loss, $36.3 million, related to the Net Settlement Expense (for further information, see Note 18 of the Notes to the Consolidated Financial Statements, "Commitments and Contingencies," included in this report), (ii) the 2015 after tax loss, $26.9 million, from the divestiture of our dialysis service business in Venezuela, and (iii) the 2015 realized portion of the after tax gain, $11.1 million, from the sale of our European marketing rights for certain renal pharmaceuticals to our joint venture, Vifor Fresenius Medical Care Renal Pharma , net income attributable to FMC-AG & Co. KGaA increased by 15%.
Basic earnings per share increased by 20% for the year ended December 31, 2016 to $4.07 as compared with $3.38 in 2015 due to the increase in net income attributable to shareholders of FMC-AG & Co. KGaA above. The weighted average number of shares outstanding for the period was approximately 305.7 million in 2016 (304.4 million in 2015). The increase in the weighted average number of shares outstanding was the result of stock options exercised.
We employed 109,319 people (full-time equivalents) as of December 31, 2016 compared to 104,033 as of December 31, 2015, an increase of 5%, primarily due to organic growth in our business and acquisitions.
The following discussions pertain to the North America Segment, the EMEA Segment, the Asia-Pacific Segment and the Latin America Segment as well as the measures we use to manage these segments.
North America Segment
| Key Indicators and Business Metrics for North America Segment | ||||||||||
|---|---|---|---|---|---|---|---|---|---|---|
| | 2016 | 2015 | Change in % | |||||||
Total North America Segment | ||||||||||
Revenue in $ million(1) | 12,886 | 11,813 | 9 | % | ||||||
Health Care(1) | 11,982 | 10,932 | 10 | % | ||||||
Dialysis Products | 904 | 881 | 3 | % | ||||||
Operating income in $ million | 2,119 | 1,798 | 18 | % | ||||||
Operating income margin in % | 16.4 | % | 15.2 | % | ||||||
Delivered EBIT in $ million(2) | 1,824 | 1,524 | 20 | % | ||||||
Dialysis | ||||||||||
Revenue in $ million(1) | 10,579 | 9,931 | 7 | % | ||||||
Number of dialysis treatments | 28,882,107 | 27,686,877 | 4 | % | ||||||
Same market treatment growth in % | 3.1 | % | 4.1 | % | ||||||
Operating income in $ million | 2,060 | 1,701 | 21 | % | ||||||
Operating income margin in % | 19.5 | % | 17.1 | % | ||||||
Delivered EBIT in $ million(2) | 1,790 | 1,467 | 22 | % | ||||||
Care Coordination | ||||||||||
Revenue in $ million(1) | 2,307 | 1,882 | 23 | % | ||||||
Operating income in $ million | 59 | 97 | (39 | %) | ||||||
Operating income margin in % | 2.6 | % | 5.2 | % | ||||||
Delivered EBIT in $ million(2) | 34 | 57 | (41 | %) | ||||||
Member Months Under Medical Cost Management(3),(4) | 387,244 | 208,933 | 85 | % | ||||||
Medical Cost Under Management in $ million(3),(4) | 2,814 | 1,660 | 70 | % | ||||||
Care Coordination Patient Encounters(3) | 5,539,703 | 5,005,695 | 11 | % | ||||||
Revenue
Dialysis revenue increased for the year ended December 31, 2016 by 7% to $10,579 million from $9,931 million in the same period of 2015.
Dialysis Care revenue increased for the year ended December 31, 2016 by 7% to $9,675 million from $9,050 million in the same period of 2015. This increase was driven by same market treatment growth (3%), increases in organic revenue per treatment (2%), an increase in dialysis days (1%) and contributions from acquisitions (1%).
Dialysis treatments increased by 4% for the year ended December 31, 2016 as compared to the same period in 2015 primarily due to same market treatment growth (3%) and contributions from acquisitions (1%). At December 31, 2016, 188,987 patients (3% increase over December 31, 2015) were being treated in the 2,306 dialysis clinics that we own or operate in the North America Segment, compared to 182,852 patients treated in 2,210 dialysis clinics at December 31, 2015.
In the U.S., the average revenue per treatment was $351 for the year ended December 31, 2016 and $346 for the same period in 2015. The increase was mainly attributable to a higher volume of dialysis treatments with commercial payors.
Cost per treatment in the U.S. decreased to $278 for the year ended December 31, 2016 from $279 in the same period of 2015. This decrease was largely driven by a favorable impact from lower cost for health care supplies and decreased bad debt, partially offset by higher personnel expense and various cost increases including rent expense and administration costs.
Dialysis product revenue for the year ended December 31, 2016 increased by 3% to $904 million compared to $881 million in the same period in 2015. This was driven by higher sales of machines, dialyzers and peritoneal dialysis products, partially offset by lower sales of renal pharmaceuticals and bloodlines.
Operating Income
Dialysis operating income increased to $2,060 million for the year ended December 31, 2016 as compared to $1,701 million in the same period in 2015. Operating income margin increased to 19.5% for the year ended December 31, 2016 from 17.1% for the same period in 2015, due to lower costs from health care supplies, a higher volume of dialysis treatments with commercial payors, the prior year impact from the Net Settlement Expense, a release of bad debt reserves, higher income from equity method investees and lower legal expenses excluding Net Settlement Expense legal costs noted above, partially offset by higher personnel expense and a cost impact related to the vesting of long term incentive plan grants.
Delivered EBIT
Dialysis delivered EBIT increased by 22% to $1,790 million for the year ended December 31, 2016 from $1,467 million for the same period of 2015, mainly as a result of increased operating income, partially offset by increased noncontrolling interests driven by higher operating income of our joint ventures involving dialysis clinics.
Revenue
Care Coordination revenue increased by 23% to $2,307 million for the year ended December 31, 2016 from $1,882 million for the same period of 2015. This increase was driven by increases in organic revenue growth (20%) and contributions from acquisitions (3%).
Operating Income
Care Coordination operating income decreased to $59 million for the year ended December 31, 2016 from $97 million for the same period of 2015. The operating income margin decreased to 2.6% for the year ended December 31, 2016 from 5.2% mainly driven by increased costs related to bad debt reserves for hospitalist and intensivist services and the prior year impact of reimbursement for BPCI costs as well as higher costs for physician practice services due to infrastructure development, partially offset by a favorable impact from vascular, cardiovascular and endovascular specialty services.
Delivered EBIT
Care Coordination delivered EBIT decreased by 41% to $34 million for the year ended December 31, 2016 from $57 million as compared to the same period of 2015 mainly as the result of decreased operating income, partially offset by decreased noncontrolling interests effects.
Member Months Under Medical Cost Management
Care Coordination's member months under medical cost management for the year ended December 31, 2016 was 387,244 months as compared to 208,933 months for the same period of 2015. The increase in membership volume was largely attributable to furthered enrollment in our ESCOs, BPCI development, growth in our sub-capitation and other shared savings arrangements as well as the continued contribution from MA-CSNPs which commenced in the first quarter of 2016. See note 4 to the table "Key Indicators and Business Metrics for North America Segment," above.
Medical Cost Under Management
Care Coordination's medical cost under management for the year ended December 31, 2016 was $2,814 million as compared to $1,660 million for the same period of 2015. The increase in medical cost under management was largely attributable to furthered enrollment in our ESCOs, BPCI development, growth in our other shared savings and sub-capitation arrangements as well as the continued contribution from MA-CSNPs which commenced in the first quarter of 2016. See note 4 to the table "Key Indicators and Business Metrics for North America Segment," above.
Care Coordination Patient Encounters
Care Coordination's patient encounters for the year ended December 31, 2016 was 5,539,703 encounters and procedures as compared to 5,005,695 encounters and procedures for the same period of 2015. The increase was driven by patient encounters and procedures provided by hospitalist and intensivist services, Rx BMM program, urgent care centers, vascular procedures as well as cardiovascular and endovascular services. See note 4 to the table "Key Indicators and Business Metrics for North America Segment," above.
EMEA Segment
| Key Indicators for EMEA Segment | ||||||||||
|---|---|---|---|---|---|---|---|---|---|---|
| | | | Change in % | |||||||
| | 2016 | 2015 | as reported | at Constant Exchange Rates(1) | ||||||
Revenue in $ million(2) | 2,667 | 2,629 | 1% | 4% | ||||||
Health Care(2) | 1,294 | 1,226 | 6% | 9% | ||||||
Dialysis Products | 1,373 | 1,403 | (2%) | 0% | ||||||
Number of dialysis treatments | 8,872,231 | 8,211,464 | 8% | |||||||
Same market treatment growth in % | 3.6 | % | 3.8 | % | ||||||
Operating income in $ million | 524 | 577 | (9%) | |||||||
Operating income margin in % | 19.7 | % | 21.9 | % | ||||||
Delivered EBIT in $ million(3) | 520 | 574 | (9%) | |||||||
Revenue
Total revenue for the EMEA Segment increased by 1% (4% increase at Constant Exchange Rates) to $2,667 million for the year ended December 31, 2016 as compared to $2,629 million for the same period of 2015. Health Care service revenue for the EMEA Segment increased during the year ended December 31, 2016 by 6% (9% increase at Constant Exchange Rates) to $1,294 million from $1,226 million in the same period of 2015. This increase is a result of contributions from acquisitions (6%), same market treatment growth (4%), and an increase in dialysis days (1%), partially offset by the negative impact of exchange rate fluctuations (3%), the effect of closed or sold clinics (1%) and decreases in organic revenue growth per treatment (1%). Dialysis treatments increased by 8% for the year ended December 31, 2016 over the same period in 2015 mainly due to contributions from acquisitions (5%) and same market treatment growth (4%), partially offset by the effect of closed or sold clinics (1%). As of December 31, 2016, we had 59,767 patients (9% increase over December 31, 2015) being treated at the 711 dialysis clinics that we own, operate or manage in the EMEA Segment compared to 54,857 patients treated at 659 clinics at December 31, 2015.
Dialysis product revenue for the year ended December 31, 2016 decreased by 2% (remained unchanged at Constant Exchange Rates) to $1,373 million compared to $1,403 million in the same period of 2015. Dialysis product revenue was largely static at Constant Exchange Rates due to lower sales of renal
pharmaceuticals, dialyzers and machines, mostly offset by increased sales of bloodlines, products for acute care treatments, peritoneal dialysis products and hemodialysis solutions and concentrates.
Operating Income
Operating income decreased by 9% to $524 million for the year ended December 31, 2016 as compared to $577 million for the same period in 2015. Operating income margin decreased to 19.7% for the year ended December 31, 2016 from 21.9% for the same period in 2015 mainly due to the prior year impact from a gain from the sale of our European marketing rights for certain renal pharmaceuticals, higher bad debt expense, lower income from equity method investees due to product development costs and unfavorable foreign exchange effects, partially offset by fixed costs leverage of higher sales.
Delivered EBIT
Delivered EBIT decreased by 9% to $520 million for the year ended December 31, 2016 as compared to $574 million for the same period in 2015 primarily due to decreased operating income coupled with increased noncontrolling interests effects.
Asia-Pacific Segment
| Key Indicators for Asia-Pacific Segment | ||||||||||
|---|---|---|---|---|---|---|---|---|---|---|
| | | | Change in % | |||||||
| | 2016 | 2015 | as reported | at Constant Exchange Rates(1) | ||||||
Revenue in $ million(2) | 1,632 | 1,502 | 9% | 8% | ||||||
Health Care(2) | 730 | 667 | 9% | 3% | ||||||
Dialysis Products | 902 | 835 | 8% | 12% | ||||||
Number of dialysis treatments | 4,003,957 | 3,790,924 | 6% | |||||||
Same market treatment growth in % | 4.7 | % | 3.8 | % | ||||||
Operating income in $ million | 319 | 298 | 7% | |||||||
Operating income margin in % | 19.6 | % | 19.8 | % | ||||||
Delivered EBIT in $ million(3) | 312 | 291 | 7% | |||||||
Revenue
Total revenue for the Asia-Pacific Segment increased by 9% (8% increase at Constant Exchange Rates) to $1,632 million for the year ended December 31, 2016 as compared to $1,502 million for the same period of 2015. Health Care service revenue for the Asia-Pacific Segment increased during the year ended December 31, 2016 by 9% (3% increase at Constant Exchange Rates) to $730 million from $667 million in the same period of 2015. This increase is a result of exchange rate fluctuations (6%) and same market treatment growth (5%), partially offset by decreases in organic revenue growth per treatment (1%) and the effect of closed or sold clinics (1%). Dialysis treatments increased by 6% for the year ended December 31, 2016 over the same period in 2015 mainly due to same market treatment growth (5%) and contributions from acquisitions (2%), partially offset by the effect of closed or sold clinics (1%). As of December 31, 2016, we had 29,328 patients (an 11% increase over December 31, 2015) being treated at the 374 dialysis clinics that we own, operate or manage in the Asia-Pacific Segment compared to 26,472 patients treated at 320 clinics at December 31, 2015.
Dialysis product revenue for the year ended December 31, 2016 increased by 8% (12% increase at Constant Exchange Rates) to $902 million compared to $835 million in the same period of 2015. The 12% increase at Constant Exchange Rates was driven by increased sales of machines, dialyzers, bloodlines,
products for acute care treatments, peritoneal dialysis products and hemodialysis solutions and concentrates.
Operating Income
Operating income increased by 7% to $319 million for the year ended December 31, 2016 as compared to $298 million for the same period in 2015. Operating income margin decreased to 19.6% for the year ended December 31, 2016 from 19.8% for the same period in 2015 due to unfavorable foreign exchange effects and costs associated with changes in the Management Board, partially offset by a favorable effect of prior year costs related to customs duty receivables in India.
Delivered EBIT
Delivered EBIT increased by 7% to $312 million for the year ended December 31, 2016 as compared to $291 million for the same period in 2015 due to increased operating income.
Latin America Segment
| Key Indicators for Latin America Segment | ||||||||||
|---|---|---|---|---|---|---|---|---|---|---|
| | | | Change in % | |||||||
| | 2016 | 2015 | as reported | at Constant Exchange Rates(1) | ||||||
Revenue in $ million(2) | 712 | 766 | (7%) | 13% | ||||||
Health Care(2) | 513 | 567 | (9%) | 15% | ||||||
Dialysis Products | 199 | 199 | 0% | 7% | ||||||
Number of dialysis treatments | 4,770,859 | 4,907,181 | (3%) | |||||||
Same market treatment growth in % | 1.9 | % | 6.5 | % | ||||||
Operating income in $ million | 66 | 48 | 37% | |||||||
Operating income margin in % | 9.2 | % | 6.3 | % | ||||||
Delivered EBIT in $ million(3) | 66 | 48 | 37% | |||||||
Revenue
Total revenue for the Latin America Segment decreased by 7% (13% increase at Constant Exchange Rates) to $712 million for the year ended December 31, 2016 as compared to $766 million for the same period of 2015. Health Care service revenue for the Latin America Segment decreased by 9% (15% increase at Constant Exchange Rates) during the year ended December 31, 2016 to $513 million as compared to $567 million for the same period of 2015. Health Care service revenue decreased as a result of the negative effect of exchange rate fluctuations (24%) and the effect of closed or sold clinics (mainly in Venezuela and Brazil) (7%), partially offset by increases in organic revenue per treatment (18%), growth in same market treatments (2%) and contributions from acquisitions (2%). Dialysis treatments decreased by 3% for the year ended December 31, 2016 over the same period in 2015 mainly due to the effect of closed or sold clinics (mainly in Venezuela and Brazil) (7%), partially offset by same market treatment growth (2%), contributions from acquisitions (2%). As of December 31, 2016, we had 30,389 patients (a 1% increase over December 31, 2015) being treated at the 233 dialysis clinics that we own, operate or manage in the Latin America Segment compared to 30,200 patients treated at 229 clinics at December 31, 2015.
Dialysis product revenue for the year ended December 31, 2016 remained unchanged at $199 million as compared to the same period of 2015. At Constant Exchange Rates, dialysis product revenue increased by 7% driven by increased sales of dialyzers, hemodialysis solutions and concentrates as well as bloodlines, partially offset by lower sales of peritoneal dialysis products and machines.
Operating Income
Operating income increased by 37% to $66 million for the year ended December 31, 2016 as compared to $48 million for the same period in 2015. Operating income margin increased to 9.2% for the year ended December 31, 2016 from 6.3% for the same period in 2015 mainly due the prior year loss from the divestment of the dialysis service business in Venezuela and the impact from higher revenue in the region primarily from reimbursement increases, partially offset by higher bad debt expense, an unfavorable impact from manufacturing production costs driven by (i) unfavorable foreign exchange effects and (ii) higher costs for quality development, as well as unfavorable foreign exchange effects and higher costs mainly related to inflation.
Delivered EBIT
Delivered EBIT increased by 37% to $66 million for the year ended December 31, 2016 as compared to $48 million for the same period in 2015 due to increased operating income noted above.
Year ended December 31, 2015 compared to year ended December 31, 2014
Highlights
Revenue increased by 6% to $16,738 million (11% increase at constant exchange rates) mainly due to contributions from acquisitions (6%) and increases in organic revenue (6%), partially offset by the negative impact of exchange rate fluctuations (5%) and the effect of closed or sold clinics (1%).
Net income attributable to shareholders of FMC-AG & Co. KGaA for the year ended December 31, 2015 decreased by 2% to $1,029 million from $1,045 million for the same period in 2014. This development was driven by the following:
For further discussion on our net income attributable to shareholders of FMC-AG & Co. KGaA, see the consolidated key financial performance indicators discussed below.
Consolidated Financials
| Key Indicators for Consolidated Financial Statements | ||||||||||
|---|---|---|---|---|---|---|---|---|---|---|
| | | | Change in % | |||||||
| | 2015 | 2014 | as reported | at Constant Exchange Rates(1) | ||||||
Revenue in $ million(2) | 16,738 | 15,832 | 6% | 11% | ||||||
Health Care(2) | 13,392 | 12,250 | 9% | 13% | ||||||
Dialysis Products | 3,346 | 3,582 | (7%) | 4% | ||||||
Number of dialysis treatments | 44,596,446 | 42,744,977 | 4% | |||||||
Same market treatment growth in % | 4.3% | 3.7% | ||||||||
Gross profit as a % of revenue | 31.9% | 31.6% | ||||||||
Selling, general and administrative costs as a % of revenue | 17.3% | 16.7% | ||||||||
Operating income in $ million | 2,327 | 2,255 | 3% | |||||||
Operating income margin in % | 13.9% | 14.2% | ||||||||
Delivered EBIT in $ million(3) | 2,043 | 2,040 | 0% | |||||||
Net income attributable to shareholders of FMC-AG & Co. KGaA in $ million | 1,029 | 1,045 | (2%) | |||||||
Basic earnings per share in $ | 3.38 | 3.46 | (2%) | |||||||
Health Care revenue increased by 9% to $13,392 million (13% increase at Constant Exchange Rates) for the year ended December 31, 2015 from $12,250 million in the same period of 2014, mainly due to contributions from acquisitions (7%), growth in same market treatments (4%) and increases in organic revenue per treatment (3%), partially offset by the negative impact of exchange rate fluctuations (4%) and the effect of closed or sold clinics (1%).
Dialysis treatments increased by 4% for the year ended December 31, 2015 as compared to the same period in 2014. The increase is due to same market treatment growth (4%) and acquisitions (1%), partially offset by the effect of closed or sold clinics (1%).
At December 31, 2015, we owned, operated or managed (excluding those managed but not consolidated in the U.S.) 3,418 clinics compared to 3,361 clinics at December 31, 2014. For the year ended December 31, 2015, we acquired 31 clinics, opened 83 clinics and combined, closed or sold 57 clinics. The number of patients treated in clinics that we own, operate or manage (excluding patients of clinics managed but not consolidated in the U.S.) increased by 3% to 294,381 at December 31, 2015 from 286,312 at December 31, 2014.
Dialysis product revenue for the year ended December 31, 2015 decreased by 7% (4% increase at Constant Exchange Rates) to $3,346 million as compared to $3,582 million in the same period of 2014. The 4% increase at Constant Exchange Rates was driven by increased sales of machines, dialyzers, hemodialysis solutions and concentrates, peritoneal dialysis products, bloodlines, products for acute care treatments and renal pharmaceuticals.
The increase in gross profit margin to 31.9% from 31.6% primarily reflects increases in the North America Segment, EMEA Segment and the Asia-Pacific Segment, partially offset by an unfavorable impact of varying margins across our four reporting segments as well as a decrease in the Latin America Segment. The increase in the North America Segment was mainly due to lower costs for health care supplies, particularly due to cost decreases in ESAs, a favorable impact from a higher volume of commercial payors and a positive impact from manufacturing primarily driven by beneficial foreign exchange effects on purchases from intercompany production sites outside the U.S., partially offset by generally lower gross profit margins for hospitalist and intensivist services (including the effects of
acquisition integration costs), higher personnel expense related to dialysis services and stronger growth in pharmacy services at lower than average margins. The increase in the EMEA Segment was driven by a favorable impact from volume and efficiency improvements on manufacturing costs. The increase in the Asia-Pacific Segment was largely due to favorable foreign exchange effects and a positive impact from acquisitions, partially offset by a write-off of a customs duty receivable in India. The decrease in the Latin America Segment was as a result of an unfavorable impact from inflationary driven manufacturing costs and higher costs related to inflation, partially offset by favorable foreign exchange effects.
SG&A expenses increased to $2,895 million for the year ended December 31, 2015 from $2,644 million in the same period of 2014. SG&A expenses as a percentage of sales increased to 17.3% for the year ended December 31, 2015 in comparison with 16.7% in the same period of 2014 due to increases in the North America Segment, the Latin America Segment and the Asia-Pacific Segment, partially offset by a decrease in the EMEA Segment and favorable impact of varying margins across our four reporting segments. The increase in the North America Segment was mainly driven by the Net Settlement Expense, higher legal and consulting expenses, higher costs for employee benefit plans and an unfavorable impact from hospitalist and intensivist services. The increase in the Latin America Segment was driven by the impact of the loss from the divestment of the dialysis service business in Venezuela, higher costs related to inflation and increased bad debt expense, partially offset by higher reimbursement in part of the region. The increase in the Asia Pacific Segment was due to unfavorable foreign exchange effects, increased costs related to furthered sales development and higher consulting expense, partially offset by a favorable impact from acquisitions. The decrease in the EMEA Segment was largely due to a gain from the sale of our European marketing rights for certain renal pharmaceuticals, lower expenses related to compliance investigations we are conducting (See Note 18 of the Notes to the Consolidated Financial Statements, "Commitments and Contingencies," included in this report) and lower IT project costs.
R&D expenses increased to $140 million for the year ended December 31, 2015 from $122 million for the same period of 2014.
Income from equity method investees increased to $31 million for the year ended December 31, 2015 from $25 million for the same period of 2014. This increase is primarily related to higher income from the joint venture with Vifor due to expansion of activities.
Operating income increased to $2,327 million for the year ended December 31, 2015 from $2,255 million for the same period in 2014. Operating income margin decreased to 13.9% for the year ended December 31, 2015 as compared to 14.2% for the same period in 2014 as a result of higher SG&A as a percentage of revenue, partially offset by an increase in gross profit margin, as discussed above.
Delivered EBIT increased to $ 2,043 million for the year ended December 31, 2015 from $2,040 million for the same period in 2014 as a result of the increased operating income partially offset by increased noncontrolling interests driven by higher operating income of the joint ventures with dialysis clinics, Care Coordination acquisitions in 2014 and the creation of new joint ventures with dialysis clinics the North America Segment.
Interest expense increased by 3% to $508 million for the year ended December 31, 2015 as compared to $495 million for the same period in 2014 due to a higher impact from the valuation of the embedded derivative related to the Convertible Bonds issued in September 2014 (see Note 9 of the Notes to Consolidated Financial Statements, "Long-term Debt and Capital Lease Obligations," included in this report) and an increase in the average debt level during the year, partially offset by a favorable impact from the translation of interest expense on euro-denominated bonds and the impact of amendments to our Amended 2012 Credit Agreement in 2014. Interest income increased to $117 million for the year ended December 31, 2015 from $84 million for the same period in 2014 mainly as a result of the higher impact from the valuation of the call option on the Company's shares related the issuance of Convertible Bonds issued in September 2014 (see Note 9 of the Notes to Consolidated Financial Statements, "Long-term Debt and Capital Lease Obligations," included in this report), which fully offsets the increase in interest expense due to the valuation of the embedded derivative noted above, as well as higher interest income as a result of the early repayment of interest-bearing notes receivables.
Income tax expense increased to $623 million for the year ended December 31, 2015 from $584 million for the same period in 2014. The effective tax rate increased to 32.1% from 31.7% for the same period of 2014. The change in tax rate for the year ended December 31, 2015, as compared to the same period in 2014, was affected negatively by the positive impact of the resolution of challenged deductions for civil settlement payments taken in prior years on our 2014 tax rate and the negative effect
from the non-tax deductible loss from the sale of the dialysis service business in Venezuela, partially offset by higher non-taxable noncontrolling interest expense. The effective tax rate is also impacted by tax rate differentials which are determined by calculating the difference between the applicable tax rate in each jurisdiction in which we operate and the combined German tax rate (a corporate tax rate, which includes a solidarity surcharge, and a trade tax rate). This difference is then applied to the taxable income generated in each of the jurisdictions. The significant rate differential for 2015 (see Note 16 of the Notes to Consolidated Financial Statements, "Income Taxes," included in this report) is the result of the U.S. effective tax rate being significantly higher than the German tax rates –39.5% compared to the combined German tax rate of 29.6%. The U.S. effective tax rate is comprised of the U.S. federal corporate tax rate of 35% adjusted for the impact of the various tax rates in the states in which we do business. The North America Segment is still and is expected to be in the future the main driver for this significant tax differential.
Net income attributable to noncontrolling interests for the year ended December 31, 2015 increased to $284 million from $215 million for the same period of 2014 primarily driven by increased operating income of the joint ventures with dialysis clinics, Care Coordination acquisitions in 2014 and the creation of new joint ventures with dialysis clinics the North America Segment.
Net income attributable to shareholders of FMC-AG & Co. KGaA for the year ended December 31, 2015 decreased by 2% to $1,029 million from $1,045 million for the same period in 2014 as a result of the combined effects of the items discussed above. Excluding (i) the after tax loss related to the Net Settlement Expense, (ii) the after tax loss from the divestiture of our dialysis service business in Venezuela and (iii) the realized portion of the after tax gain from the sale of our European marketing rights for certain renal pharmaceuticals to our joint venture, Vifor Fresenius Medical Care Renal Pharma, in 2015, as well as (iv) the after tax loss, $13.1 million, related to the closing of manufacturing plants in 2014, net income attributable to FMC-AG & Co. KGaA increased by 2%.
Basic earnings per share decreased by 5%2% for the year ended December 31, 20142015 to $3.46$3.38 as compared with $3.65$3.46 in 20132014 due to the decrease in net income attributable to shareholders of FMC-AG & Co. KGaA above. The average weighted number of shares outstanding for the period was approximately 302.3304.4 million in 2014 (303.82015 (302.3 million in 2013)2014). The decreaseincrease in the number of shares outstanding was the
result of the share buyback program completed during the third quarter of 2013, partially offset by stock options exercised.
We employed 99,895104,033 people (full-time equivalents) as of December 31, 20142015 compared to 90,69099,895 as of December 31, 2013,2014, an increase of 10%4%, primarily due to acquisitions and overall growth in our business.business and acquisitions.
The following discussions pertain to the North America Segment, the EMEA Segment, the Asia-Pacific Segment and the InternationalLatin America Segment andas well as the measures we use to manage these segments.
North America Segment
| Key Indicators and Business Metrics for North America Segment | ||||||||
|---|---|---|---|---|---|---|---|---|
| | 2015 | 2014 | Change in % | |||||
Total North America Segment | ||||||||
Revenue in $ million(1) | 11,813 | 10,500 | 13% | |||||
Health Care(1) | 10,932 | 9,655 | 13% | |||||
Dialysis Products | 881 | 845 | 4% | |||||
Operating income in $ million | 1,798 | 1,643 | 9% | |||||
Operating income margin in % | 15.2% | 15.6% | ||||||
Delivered EBIT in $ million(2) | 1,524 | 1,436 | 6% | |||||
Dialysis | ||||||||
Revenue in $ million(1) | 9,931 | 9,461 | 5% | |||||
Number of dialysis treatments | 27,686,877 | 26,610,624 | 4% | |||||
Same market treatment growth in % | 4.1% | 3.5% | ||||||
Operating income in $ million | 1,701 | 1,566 | 9% | |||||
Operating income margin in % | 17.1% | 16.5% | ||||||
Delivered EBIT in $ million(2) | 1,467 | 1,379 | 6% | |||||
Care Coordination | ||||||||
Revenue in $ million(1) | 1,882 | 1,039 | 81% | |||||
Operating income in $ million | 97 | 77 | 26% | |||||
Operating income margin in % | 5.2% | 7.4% | ||||||
Delivered EBIT in $ million(2) | 57 | 57 | 1% | |||||
Member Months Under Medical Cost Management(3),(4) | 208,933 | 15,853 | 1218% | |||||
Medical Cost Under Management in $ million(3),(4) | 1,660 | 122 | 1255% | |||||
Care Coordination Patient Encounters(3) | 5,005,695 | 1,818,170 | 175% | |||||
North America Segment revenue is driven by our dialysis business as well as by Care Coordination. Our dialysis business comprises both products and services while Care Coordination incorporates services only. The discussion of the North America Segment is focused on our dialysis business and on Care Coordination. Reporting our health care services revenue separately for our dialysis business and Care Coordination has the effect of reducing average revenue per treatment and cost per treatment compared to amounts reported in prior years. In the discussion below, average revenue per treatment and cost per treatment for the year ended December 31, 2014, has been adjusted to conform to the current presentation.
| Key Indicators for North America Segment | ||||||||||
|---|---|---|---|---|---|---|---|---|---|---|
| | 2014 | 2013 | Change in % | |||||||
Revenue in $ million | 10,500 | 9,606 | 9 | % | ||||||
Number of treatments | 26,610,624 | 25,656,357 | 4 | % | ||||||
Same market treatment growth in % | 3.5 | % | 3.5 | % | ||||||
Operating income in $ million | 1,643 | 1,623 | 1 | % | ||||||
Operating income margin in % | 15.6 | % | 16.9 | % | ||||||
Revenue
Net health careDialysis revenue increased for the year ended December 31, 20142015 by 10%5% to $9,655$9,931 million from $8,772$9,461 million in the same period of 2013.2014.
Dialysis Care revenue increased for the year ended December 31, 2015 by 5% to $9,050 million from $8,616 million in the same period of 2014. This increase was driven by contributions from acquisitions (5%),growth in same market treatment growth (3%treatments (4%) and increases in organic revenue per treatment (2%(1%). Included in our net health care revenue is Care Coordination revenue in the U.S.
TreatmentsDialysis treatments increased by 4% for the year ended December 31, 20142015 as compared to the same period in 2013 mainly2014 primarily due to same market treatment growth (3%) and contributions from acquisitions (1%(4%). At December 31, 2014, 176,2032015, 182,852 patients (a 3%(4% increase over December 31, 2013)2014) were being treated in the 2,1622,210 dialysis clinics that we own or operate in the North America Segment, compared to 171,440176,203 patients treated in 2,1332,162 dialysis clinics at December 31, 2013. Average revenue per treatment includes certain amounts related to Care Coordination, specifically attributable to pharmacy services, laboratory services and vascular access services. Average North America Segment revenue per treatment, which includes Canada and Mexico, before bad debt expense, was $360 for the year ended December 31, 2014 and $352 in the same period in 2013.2014.
In the U.S., the average revenue per treatment was $368$346 for the year ended December 31, 20142015 and $359$342 for the same period in 2013.2014. The increase in the U.S. was mainly attributable to increased revenue related to pharmacy and laboratory testing services, a favorable impact from higher volume with commercial payors.
Cost per treatment in the ESRD PPS market basket updateU.S. decreased to $279 for the year ended December 31, 2015 from $280 in the same period of 2014. This decrease was mainly due to a favorable impact from health care supplies, partially offset by higher personnel expense, higher property expense and increased bad debt provisions.
Dialysis product revenue for the year ended December 31, 2015 increased by 4% to $881 million compared to $845 million in the same period in 2014. This was driven by higher sales of machines, renal pharmaceuticals and dialyzers.
Operating Income
Dialysis operating income increased to $1,701 million for the year ended December 31, 2015 as compared to $1,566 million in the same period in 2014. Operating income margin increased to 17.1% for the year ended December 31, 2015 from 16.5% for the same period in 2014, due to lower costs for health care supplies and a favorable impact from commercial payors, partially offset by impact from ATRA reductions onhigher personnel expense, the ESRD PPS payment rate, decreased revenue for renal pharmaceuticalsNet Settlement Expense and the impact from the U.S. Sequestration.increased consulting and legal expenses.
Delivered EBIT
Dialysis product revenuedelivered EBIT increased for the year ended December 31, 2014 by 1%6% to $845 million from $834 million in the same period of 2013. This increase was driven by higher sales of dialyzers, renal pharmaceuticals and peritoneal dialysis products, partially offset by lower sales of machines.
Operating Income
Operating income increased to $1,643$1,467 million for the year ended December 31, 20142015 from $1,623$1,379 million for the same period in 2013. Operatingof 2014, mainly as a result of increased operating income, margin decreasedpartially offset by increased noncontrolling interests driven by higher operating income of the joint ventures with dialysis clinics and the creation of new joint ventures with dialysis clinics.
Revenue
Care Coordination revenue increased by 81% to 15.6%$1,882 million for the year ended December 31, 20142015 from 16.9%$1,039 million for the same period of 2014. This increase is primarily driven by contributions from acquisitions (56%) and increases in 2013, dueorganic revenue growth (25%).
Operating Income
Care Coordination operating income increased to $97 million for the year ended December 31, 2015 from $77 million for the same period of 2014. The operating income margin decreased to 5.2% for the year ended December 31, 2015 from 7.4% mainly driven by higher costs and lower margin hospitalist and intensivists services (including the effects of acquisition integration costs for Cogent Healthcare), an unfavorable impact from ATRA reductions on the ESRD PPS payment rate,laboratory services driven by higher personnel expense, growth in lower margin Care Coordination services, higher legal and consulting expense, higher costs as a result of FDA remediation and an unfavorable impact from the U.S. Sequestration,urgent care services driven by operational losses, partially offset by a favorable impact from the ESRD PPS market basket updatecardiovascular and a favorable impact from commercial payors. Cost per treatment for the North America Segment increased to $297endovascular specialty services as well as pharmacy services.
Delivered EBIT
Care Coordination delivered EBIT remained relatively flat at $57 million for the year ended December 31, 20142015 as compared to $287 for the same period of 2013.2014 mainly as the result of increased operating income, fully offset by noncontrolling interests effects associated with Care Coordination acquisitions in 2014.
Member Months Under Medical Cost per treatment in the U.S. increased to $303Management
Care Coordination's member months under medical cost management for the year ended December 31, 2014 from $293 in2015 was 208,933 months as compared to 15,853 months for the same period of 2013.2014. The increase in membership volume was attributable to the inclusion of BPCI amounts beginning in the second quarter of 2015 and ESCOs in the fourth quarter of 2015.
Care Coordination's medical cost under management for the year ended December 31, 2015 was $1,660 million as compared to $122 million for the same period of 2014. The increase in medical cost under management was attributable to the inclusion of BPCI amounts beginning in the second quarter of 2015 and ESCOs in the fourth quarter of 2015.
Care Coordination Patient Encounters
Care Coordination's patient encounters for the year ended December 31, 2015 was 5,005,695 encounters and procedures as compared to 1,818,170 encounters and procedures for the same period of 2014. The increase was driven by patient encounters and procedures provided by hospitalist and intensivist services, urgent care centers, the BMM program, cardiovascular and endovascular services as well as vascular procedures.
InternationalEMEA Segment
| Key Indicators for International Segment | |||||||||||||||||||||||
|---|---|---|---|---|---|---|---|---|---|---|---|---|---|---|---|---|---|---|---|---|---|---|---|
| Key Indicators for EMEA Segment | Key Indicators for EMEA Segment | ||||||||||||||||||||||
| | | | Change in % | | | Change in % | |||||||||||||||||
| | 2014 | 2013 | as reported | at Constant Exchange Rates(1) | 2015 | 2014 | as reported | at Constant Exchange Rates(1) | |||||||||||||||
Revenue in $ million | 5,265 | 4,970 | 6 | % | 11 | % | 2,629 | 3,072 | (14%) | 3% | |||||||||||||
Number of treatments | 16,134,353 | 14,800,543 | 9 | % | |||||||||||||||||||
Health Care(2) | 1,226 | 1,438 | (15%) | 3% | |||||||||||||||||||
Dialysis Products | 1,403 | 1,634 | (14%) | 3% | |||||||||||||||||||
Number of dialysis treatments | 8,211,464 | 8,053,633 | 2% | ||||||||||||||||||||
Same market treatment growth in % | 4.3 | % | 3.8 | % | 3.8% | 4.7% | |||||||||||||||||
Operating income in $ million | 970 | 897 | 8 | % | 577 | 590 | (2%) | ||||||||||||||||
Operating income margin in % | 18.4 | % | 18.1 | % | 21.9% | 19.2% | |||||||||||||||||
Delivered EBIT in $ million(3) | 574 | 587 | (2%) | ||||||||||||||||||||
Revenue
IncludingTotal revenue for the effects of acquisitions, European region revenue increased 2% (4%EMEA Segment decreased by 14% (3% increase at Constant Exchange Rates) to $2,629 million for the year ended December 31, 2015 as compared to $3,072 million Latin America regionfor the same period of 2014. Health Care service revenue for the EMEA Segment decreased 1% (16%during the year ended December 31, 2015 by 15% (3% increase at Constant Exchange Rates) to $836 million, and Asia-Pacific region revenue increased 23% (26% increase at Constant Exchange Rates due to acquisitions of approximately 20%, net of divested clinics, and organic growth of approximately 6%) to $1,357 million.
Net health care revenue for the International Segment increased during the year ended December 31, 2014 by 10% (18% at Constant Exchange Rates) to $2,595$1,226 million from $2,358$1,438 million in the same period of 2013.2014. This increasedecrease is a result of contributions from acquisitions (11%), same market treatment growth (4%) and increases in organic revenue per treatment (4%), partially offset by the negative effectimpact of exchange rate fluctuations (8%(18%) and the effect of closed or sold clinics (1%).
Treatments increased by 9% for the year ended December 31, 2014 over the same period in 2013 mainly due to contributions from acquisitions (6%) and same market treatment growth (4%), partially offset by the effect of closed or sold clinics (1%). As of December 31, 2014, we had 110,109 patients (a 12% increase over December 31, 2013) being treated at the 1,199 clinics that we own, operate or manage in the International Segment compared to 98,682 patients treated at 1,117 clinics at December 31, 2013. Average revenue per treatment for the year ended December 31, 2014 increased to $161 from $159 in comparison with the same period of 2013 due to increased reimbursement rates and changes in country mix ($14), partially offset by weakening of local currencies against the U.S. dollar ($12).
Dialysis product revenue for the year ended December 31, 2014 increased by 2% (4% increase at Constant Exchange Rates) to $2,670 million compared to $2,612 million in the same period of 2013. The increase at Constant Exchange Rates was driven by increased sales of dialyzers, bloodlines, products for acute care treatments, hemodialysis solutions and concentrates and peritoneal dialysis products, partially offset by decreased sales of machines.
Operating Income
Operating income increased to $970 million for the year ended December 31, 2014 as compared to $897 million for the same period in 2013. Operating income margin increased to 18.4% for the year ended December 31, 2014 from 18.1% for the same period in 2013 mainly due to lower bad debt expense, favorable foreign exchange effects and business growth in Asia-Pacific, partially offset by the impact from a gain on the sale of real estate in Colombia in 2013 and an accrued provision related to the compliance investigation we are conducting (see Note 20 of the Notes to the Consolidated Financial Statements, "Commitments and Contingencies," included in this report). The net impact of the devaluation of the Russian Ruble during 2014 has been more than offset by currency fluctuations in other countries.
Year ended December 31, 2013 compared to year ended December 31, 2012
Revenues increased by 6% to $14,610 million (6% at constant exchange rates) mainly due to organic growth of 5% and contributions from acquisitions of 2%, partially offset by the effect of closed or sold clinics of 1%.
Operating income increased 2%.
Net income attributable to shareholders of FMC-AG & Co. KGaA decreased by 6% to $1,110 million. However excluding the 2012 investment gain of $140 million related to the Liberty Acquisition, net income attributable to shareholders of FMC-AG & Co. KGaA increased 6% from $1,047 in 2012.
| Key Indicators for Consolidated Financial Statements | |||||||||||||
|---|---|---|---|---|---|---|---|---|---|---|---|---|---|
| | | | Change in % | ||||||||||
| | 2013 | 2012 | as reported | at Constant Exchange Rates(1) | |||||||||
Revenue in $ million | 14,610 | 13,800 | 6 | % | 6 | % | |||||||
Number of treatments | 40,456,900 | 38,588,184 | 5 | % | |||||||||
Same market treatment growth in % | 3.6 | % | 3.8 | % | |||||||||
Gross profit as a % of revenue | 32.4 | % | 33.3 | % | |||||||||
Selling, general and administrative costs as a % of revenue | 16.4 | % | 16.1 | % | |||||||||
Operating income in $ million | 2,256 | 2,219 | 2 | % | |||||||||
Operating income margin in % | 15.4 | % | 16.1 | % | |||||||||
Net income attributable to shareholders of FMC-AG & Co. KGaA in $ million | 1,110 | 1,187 | (6 | %) | |||||||||
Basic earnings per share in $ | 3.65 | 3.89 | (6 | %) | |||||||||
Net health care revenue increased by 6% to $11,130 million (7% at Constant Exchange Rates) for the year ended December 31, 2013 from $10,492 million in the same period of 2012, mainly due to growth in same market treatments (4%), contributions from acquisitions (3%), and increases in organic revenue per treatment (1%), partially offset by the effect of closed or sold clinics (1%) and the negative impact of exchange rate fluctuations (1%). Included in our net health care revenue is Care Coordination revenue in the U.S. of $528 million and $276 million for the year ended December 31, 2013 and 2012, respectively.
Treatments increased by 5% for the twelve months ended December 31, 2013 as compared to the same period in 2012. The increase is due to same market treatment growth (4%) and acquisitions (3%), partially offset by the effect of closed or sold clinics (2%).
At December 31, 2013, we own, operate or manage (excluding those managed but not consolidated in the U.S.) 3,250 clinics compared to 3,160 clinics at December 31, 2012. During 2013, we acquired 50 clinics, opened 80 clinics and combined or closed 40 clinics. The number of patients treated in clinics that we owned or operated increased by 5% to 270,122 at December 31, 2013 from 257,916 at December 31, 2012.
Dialysis product revenue increased by 5% (5% increase at Constant Exchange Rates) to $3,480 million as compared to $3,308 million in the same period of 2012. The increase was driven by increased sales of hemodialysis products, especially of dialyzers, machines, solutions and concentrates, and bloodlines as well as products for acute care and peritoneal dialysis products, partially offset by lower sales of renal pharmaceuticals. There was no material impact from foreign exchange effects.
The decrease in gross profit margin to 32.4% from 33.3% reflects a decrease in the North America Segment, partially offset by an increase in the International Segment. The decrease in the North America Segment was due to higher personnel expense, the 2012 impact of special collection efforts in the prior year, lower commercial payor mix coupled with price reductions from commercial contracting, increased revenue in the Expanded Services at lower than average margins, and the impact of the U.S. Sequestration. These decreases were partially offset by reduced pharmaceutical utilization and the updated Medicare reimbursement rate which came into effect in 2013. The increase in the International Segment was due to favorable foreign currency exchange effects and lower manufacturing costs driven by decreases in labor costs, facilities operating costs and cost for raw materials, partially offset by price pressure on products and business growth in China, however at lower margins.
SG&A expenses increased to $2,391 million in the year ended December 31, 2013 from $2,223 million in the same period of 2012. SG&A expenses as a percentage of sales increased to 16.4% for the twelve months of 2013 in comparison with 16.1% in the same period of 2012 due to an increase in the International Segment an unfavorable impact from Corporate and a slight increase in the North America Segment. The increase in the International Segment was mainly driven by higher bad debt expense in Asia-Pacific, unfavorable foreign exchange effects including devaluation of the Venezuelan Bolivar due to a hyperinflationary economy and various cost increases, partially offset by a gain on the sale of real estate in Colombia. The increase at Corporate was due to increased legal and consulting expenses attributable in significant part to the internal investigation we are conducting (see Note 20 of the Notes to Consolidated Financial Statements).
For the twelve months ended 2013, we had an $8 million gain from the sale of FMC-AG & Co. KGaA dialysis clinics in our North America Segment and a $1 million gain in the International Segment as compared to a $36 million gain in the same period of the prior year mainly in connection with divestitures required for regulatory clearance of the Liberty Acquisition, which occurred in the first quarter of 2012.
Research and development ("R&D") expenses increased to $126 million for the year ended December 31, 2013 as compared to $112 million in the same period in 2012. This increase was driven by major product developments as well as the expansion of strategic projects during the year.
Income from equity method investees increased to $26 million for the twelve months ended December 31, 2013 from $17 million for the same period of 2012 due to increased income from the VFMCRP renal pharmaceuticals joint venture.
In 2012, other operating expense was $100 million due to charges incurred in connection with the amendment of our agreement with Luitpold Pharmaceuticals and American Regent, Inc. regarding Venofer®.
Operating income increased to $2,256 million for the year ended December 31, 2013 from $2,219 million for the same period in 2012. Operating income margin decreased to 15.4% for the year ended December 31, 2013 as compared to 16.1% for the same period in 2012 as a result of the decrease in gross profit margin, higher SG&A as a percentage of revenue and a lower gain on the sale of FMC-AG & Co. KGaA clinics, partially offset by the effect of the other operating expense in 2012, all as discussed above.
The non-taxable investment gain for 2012 of $140 million was due to the fair valuation of our investment in Renal Advantage Partners, LLC at the time of the 2012 Liberty Acquisition.
Interest expense decreased by 5% to $448 million for the twelve months ended December 31, 2013 from $470 million for the same period in 2012 due to a decrease in the average debt level during the year, lower interest rates due to the expiration of interest rates swaps at the end of the first quarter of 2012, as well as the 2012 effect of one-time costs related to the new Credit Agreement. Interest income decreased to $39 million for the twelve months ended December 31, 2013 from $44 million for the same period in 2012 mainly as a result of lower interest income from high interest-bearing notes receivables.
Income tax expense decreased to $592 million for the year ended December 31, 2013 from $605 million for the same period in 2012. The effective tax rate increased to 32.0% from 31.3% for the same period of 2012, as a result of a non-taxable investment gain in 2012.
Net income attributable to noncontrolling interests for the twelve months ended December 31, 2013 increased to $145 million from $141 million for the same period of 2012 primarily due to losses attributable to noncontrolling interests in the International Segment in 2012.
Net income attributable to shareholders of FMC-AG & Co. KGaA for the twelve months ended December 31, 2013 decreased 6% to $1,110 million from $1,187 million for the same period in 2012 as a result of the combined effects of the items discussed above. Excluding the investment gain in the amount of $140 million as noted above the net income attributable to shareholders of FMC-AG & Co. KGaA for the twelve months ended December 31, 2013 increased 6% to $1,110 million from $1,047 million for the same period in 2012.
Basic earnings per share decreased by 6% for the twelve months ended December 31, 2013 to $3.65 as compared with $3.89 in 2012 due to the decrease in net income attributable to shareholders of FMC-AG & Co. KGaA above. The average weighted number of shares outstanding for the period was approximately 303.8 million in 2013 (305.1 million in 2012). The decrease in the number of shares outstanding was the result the share buyback program completed during the year, partially offset by stock options exercised.
We employed 90,690 people (full-time equivalents) as of December 31, 2013 compared to 86,153 as of December 31, 2012, an increase of 5%, primarily due to overall growth in our business and acquisitions.
The following discussions pertain to the North America Segment and the International Segment and the measures we use to manage these segments.
| Key Indicators for North America Segment | ||||||||||
|---|---|---|---|---|---|---|---|---|---|---|
| | 2013 | 2012 | Change in % | |||||||
Revenue in $ million | 9,606 | 9,031 | 6 | % | ||||||
Number of treatments | 25,656,357 | 24,412,416 | 5 | % | ||||||
Same market treatment growth in % | 3.5 | % | 3.6 | % | ||||||
Operating income in $ million | 1,623 | 1,598 | 2 | % | ||||||
Operating income margin in % | 16.9 | % | 17.7 | % | ||||||
Revenue
Net health care revenue increased for the year ended December 31, 2013 by 7% to $8,772 million from $8,230 million in the same period of 2012. This increase was driven by same market treatment growth (4%) and contributions from acquisitions (3%(2%). Included in our net health care revenue is Care Coordination revenue in the U.S. of $528 millionDialysis treatments increased by 2% for the year ended December 31, 2013.
Treatments increased by 5% for the year ended December 31, 2013 as compared to the same period in 2012 mostly due to same market treatment growth (4%) and acquisitions (2%), partially offset by the effect of closed or sold clinics (1%). At December 31, 2013, 171,440 patients (a 4% increase over December 31, 2012) were being treated in the 2,133 clinics that we own or operate in the North America Segment, compared to 164,554 patients treated in 2,082 clinics at December 31, 2012. Average North America Segment revenue per treatment, which includes Canada and Mexico, before bad debt expense, was $352 for the year ended December 31, 2013 and $348 in the same period in 2012. In the U.S., the average revenue per treatment was $359 for the year ended December 31, 2013 and $355 for the same period in 2012. The increase in the U.S. was mainly attributable to further development of our Expanded Services and the updated Medicare reimbursement rate which came into effect in 2013, partially offset by the effects of the 2012 increase in revenue from special collection efforts for services performed in prior years, the unfavorable impact of the U.S. Sequestration, and unfavorable commercial payor mix coupled with price reductions from commercial contracting.
Dialysis product revenue increased for the year ended December 31, 2013 by 4% to $834 million from $801 million in the first twelve months of 2012. This increase was driven by higher sales of dialyzers, partially offset by lower sales of peritoneal dialysis products and machines.
Operating Income
Operating income increased to $1,623 million for the year ended December 31, 2013 from $1,598 million for the same period in 2012. Operating income margin decreased to 16.9% for the year ended December 31, 2013 from 17.7% for the same period in 2012, due to higher personnel expense, the effects of the 2012 impact of special collection efforts in prior years, the impact of the U.S. Sequestration, a lower commercial payor mix coupled with price reductions from commercial contracting, and increased revenue in the Expanded Services at lower than average margins. Further, the margin was impacted by the lower gain on the sale of FMC-AG & Co. KGaA clinics related to the Liberty Acquisition resulting from fewer clinics sold in 2013 as compared to 2012 and increased legal costs. These effects were partially offset by the effects of 2012 charges incurred in connection with the amendment of our agreement with Luitpold Pharmaceuticals and American Regent, Inc. regarding Venofer®, the updated Medicare reimbursement rate which came into effect in 2013, reduced pharmaceutical utilization, and the effect of one-time costs
related to the Liberty Acquisition. Cost per treatment for the North America Segment increased to $287 for the year ended December 31, 2013 as compared to $278 the same period of 2012. Cost per treatment in the U.S. increased to $293 for the year ended December 31, 2013 from $283 in the same period of 2012.
| Key Indicators for International Segment | |||||||||||||
|---|---|---|---|---|---|---|---|---|---|---|---|---|---|
| | | | Change in % | ||||||||||
| | 2013 | 2012 | as reported | at Constant Exchange Rates(1) | |||||||||
Revenue in $ million | 4,970 | 4,740 | 5 | % | 6 | % | |||||||
Number of treatments | 14,800,543 | 14,175,768 | 4 | % | |||||||||
Same market treatment growth in % | 3.8 | % | 4.0 | % | |||||||||
Operating income in $ million | 897 | 841 | 7 | % | |||||||||
Operating income margin in % | 18.1 | % | 17.7 | % | |||||||||
Revenue
Including the effects of acquisitions, European region revenue increased 5% (3% at Constant Exchange Rates) to $3,023 million, Latin America region revenue increased 5% (15% at Constant Exchange Rates) to $843 million, and Asia-Pacific region revenue increased 6% (8% at Constant Exchange Rates) to $1,104 million.
Net health care revenue for the International Segment increased during the year ended December 31, 2013 by 4% (7% at Constant Exchange Rates) to $2,358 million from $2,262 million in the same period of 2012. This increase is a result of same market treatment growth (4%), contributions from acquisitions (3%) and increases in organic revenue per treatment (2%), partially offset by the negative effect of exchange rate fluctuations (3%) and the effect of closed or sold clinics (2%).
Treatments increased by 4% for the year ended December 31, 20132015 over the same period in 20122014 mainly due to same market treatment growth (4%) and contributions from acquisitions (2%), partially offset by the effect of closed or sold clinics (2%(4%). As of December 31, 2013,2015, we had 98,68254,857 patients (a 6%(4% increase over December 31, 2012)2014) being treated at the 1,117659 dialysis clinics that we own, operate or operatemanage in the InternationalEMEA Segment compared to 93,36252,848 patients treated at 1,078635 clinics at December 31, 2012. Average revenue per treatment for the year ended December 31, 2013 decreased to $159 from $160 in comparison with the same period of 2012 due to increased reimbursement rates and changes in country mix ($4), offset by weakening of local currencies against the U.S. dollar ($5).2014.
Dialysis product revenue for the year ended December 31, 2013 increased2015 decreased by 5% (5%14% (3% increase at Constant Exchange Rates) to $2,612$1,403 million compared to $2,478$1,634 million in the same period of 2012.2014. The 5%3% increase in product revenueat Constant Exchange Rates was driven by increased sales of hemodialysis products, especially of machines, solutions and concentrates, dialyzers, and bloodlines as well as products for acute care treatments, and peritoneal dialysis products, and hemodialysis solutions and concentrates, partially offset by lower sales of machines and renal pharmaceuticals.
Operating Income
Operating income increaseddecreased by 2% to $897$577 million for the year ended December 31, 20132015 as compared to $841$590 million for the same period in 2012.2014. Operating income margin increased to 18.1%21.9% for the year ended December 31, 20132015 from 17.7%19.2% for the same period in 20122014 mainly due to a gain on the sale of real estateour European marketing rights of certain renal pharmaceuticals, a favorable impact from volume and efficiency improvements on manufacturing costs, lower expenses related to compliance investigations we are conducting (see Note 18 of the Notes to the Consolidated Financial Statements, "Commitments and Contingencies," included in Colombia,this report) and lower manufacturing costs drivenIT project costs.
Delivered EBIT
Delivered EBIT decreased by decreases2% to $574 million for the year ended December 31, 2015 as compared to $587 million for the same period in labor costs, facilities2014 primarily due to decreased operating costsincome coupled with a slight increase in noncontrolling interests.
Asia-Pacific Segment
| Key Indicators for Asia-Pacific Segment | ||||||||||
|---|---|---|---|---|---|---|---|---|---|---|
| | | | Change in % | |||||||
| | 2015 | 2014 | as reported | at Constant Exchange Rates(1) | ||||||
Revenue in $ million(2) | 1,502 | 1,357 | 11% | 20% | ||||||
Health Care(2) | 667 | 569 | 17% | 30% | ||||||
Dialysis Products | 835 | 788 | 6% | 13% | ||||||
Number of dialysis treatments | 3,790,924 | 3,269,080 | 16% | |||||||
Same market treatment growth in % | 3.8% | 3.3% | ||||||||
Operating income in $ million | 298 | 279 | 7% | |||||||
Operating income margin in % | 19.8% | 20.6% | ||||||||
Delivered EBIT in $ million(3) | 291 | 274 | 6% | |||||||
Revenue
Total revenue for the Asia-Pacific Segment increased by 11% (20% increase at Constant Exchange Rates) to $1,502 million for the year ended December 31, 2015 as compared to $1,357 million for the same period of 2014. Health Care service revenue for the Asia-Pacific Segment increased during the year ended December 31, 2015 by 17% (30% increase at Constant Exchange Rates) to $667 million from $569 million in the same period of 2014. This increase is a result of contributions from acquisitions (27%), same market treatment growth (4%) and cost for raw materials,increases in organic revenue per treatment (1%), partially offset by higher bad debt expensethe negative effect of exchange rate fluctuations (13%) and the effect of closed or sold clinics (2%). Dialysis treatments increased by 16% for the year ended December 31, 2015 over the same period in Asia-Pacific.
Inflationary Accounting
As we are subject2014 mainly due to foreign exchange risk, we monitor the economic conditions of the countries in which we operate. Venezuela has been considered a hyperinflationary economy since 2010, most recently reaffirmedcontributions from acquisitions (13%) and same market treatment growth (4%), partially offset by the International Practices Task Forceeffect of closed or sold clinics (1%). As of December 31, 2015, we had 26,472 patients (a 5% increase over December 31, 2014) being treated at the 320 dialysis clinics that we own, operate or manage in May 2013. Effective January 1, 2013 our operationsthe Asia-Pacific Segment compared to 25,278 patients treated at 317 clinics at December 31, 2014.
Dialysis product revenue for the year ended December 31, 2015 increased by 6% (13% increase at Constant Exchange Rates) to $835 million compared to $788 million in Venezuela were still considered to be operating in a hyperinflationary economy, as the Venezuelan economy had a three-year cumulative inflation ratesame period of approximately 100%. We used a blend2014. The 13% increase at Constant Exchange Rates was driven by increased sales of themachines, dialyzers, hemodialysis solutions and concentrates, peritoneal dialysis products and bloodlines.
National Consumer Price Index and the Consumer Price IndexOperating Income
Operating income increased by 7% to determine whether Venezuela is a hyperinflationary economy. As a result, the financial statements of our subsidiaries operating in Venezuela continue to use the U.S. dollar as their functional currency. However, in 2013, the Venezuelan government revalued the Bolivar. Consequently, we recorded a pre-tax loss of $15$298 million for the twelve monthsyear ended December 31, 2013.2015 as compared to $279 million for the same period in 2014. Operating income margin decreased to 19.8% for the year ended December 31, 2015 from 20.6% for the same period in 2014 mainly due to increased costs related to furthered sales development, a write-off of a customs duty receivable in India, unfavorable foreign exchange effects and an unfavorable impact from manufacturing costs, partially offset by a positive impact from acquisitions and a favorable revenue rate impact in Taiwan.
B.Delivered EBIT
Delivered EBIT increased by 6% to $291 million for the year ended December 31, 2015 as compared to $274 million for the same period in 2014 due to increased operating income partially offset by increased noncontrolling interests associated with certain management contracts.
Latin America Segment
| Key Indicators for Latin America Segment | ||||||||||
|---|---|---|---|---|---|---|---|---|---|---|
| | | | Change in % | |||||||
| | 2015 | 2014 | as reported | at Constant Exchange Rates(1) | ||||||
Revenue in $ million(2) | 766 | 836 | (8%) | 13% | ||||||
Health Care(2) | 567 | 588 | (4%) | 17% | ||||||
Dialysis Products | 199 | 248 | (19%) | 4% | ||||||
Number of dialysis treatments | 4,907,181 | 4,811,640 | 2% | |||||||
Same market treatment growth in % | 6.5% | 4.1% | ||||||||
Operating income in $ million | 48 | 101 | (52%) | |||||||
Operating income margin in % | 6.3% | 12.1% | ||||||||
Delivered EBIT in $ million(3) | 48 | 101 | (53%) | |||||||
Revenue
Total revenue for the Latin America Segment decreased by 8% (13% increase at Constant Exchange Rates) to $766 million for the year ended December 31, 2015 as compared to $836 million for the same period of 2014. Health Care service revenue for the Latin America Segment decreased by 4% (17% increase at Constant Exchange Rates) during the year ended December 31, 2015 at $567 million as compared $588 for the same period of 2014. Health Care service revenue decreased as a result of the negative effect of exchange rate fluctuations (21%) and the effect of closed or sold clinics mainly in Venezuela (5%), partially offset by increases in organic revenue per treatment (14%), growth in same market treatments (6%) and contributions from acquisitions (2%). Dialysis treatments increased by 2% for the year ended December 31, 2015 over the same period in 2014 mainly due to same market treatment growth (6%), partially offset by the effect of closed or sold clinics (4%). As of December 31, 2015, we had 30,200 patients (a 6% decrease over December 31, 2014) being treated at the 229 dialysis clinics that we own, operate or manage in the Latin America Segment compared to 31,983 patients treated at 247 clinics at December 31, 2014.
Dialysis product revenue for the year ended December 31, 2015 decreased by 19% (4% increase at Constant Exchange Rates) to $199 million compared to $248 million in the same period of 2014. The 4% increase at Constant Exchange Rates was driven by increased sales of dialyzers, hemodialysis solutions and concentrates as well as peritoneal dialysis products.
Operating Income
Operating income decreased by 52% to $48 million for the year ended December 31, 2015 as compared to $101 million for the same period in 2014. Operating income margin decreased to 6.3% for the year ended December 31, 2015 from 12.1% for the same period in 2014 mainly due to the divestiture of the dialysis service business in Venezuela, an unfavorable impact from inflationary driven manufacturing costs, increased costs related to inflation and higher bad debt expense, partially offset by favorable foreign exchange effects and a higher reimbursement rate in part of the region.
Delivered EBIT
Delivered EBIT decreased by 53% to $48 million for the year ended December 31, 2015 as compared to $101 million for the same period in 2014 due to decreased operating income with virtually no change in noncontrolling interests.
IV. Liquidity and Capital Resources
Our primary sources of liquidity are typically cash provided by operating activities, and cash provided by short-term borrowingsdebt from third parties and related parties, as well as proceeds from the issuance of long-term debt and equity securities. We require this capital primarily to finance working capital needs, fund acquisitions and joint ventures, develop free-standing renal dialysis clinics and other health care facilities, purchase equipment for existing or new renal dialysis clinics and production sites, repay debt toand pay dividends and, in 2013, to repurchase shares (see 'Net"Net Cash Provided By (Used In) Investing Activities" and "Net Cash Provided By (Used In) Financing Activities" below).
At December 31, 2014,2016, we had cash and cash equivalents of $634$747 million. For information regarding utilization and availability of cash under our principal credit facility,the Amended 2012 Credit Agreement, see Note 119 of the Notes to Consolidated Financial Statements, "Long-term Debt and Capital Lease Obligations – Amended 2012 Credit Agreement, and "– Accounts Receivable Facility"" included in this report.
Net Cash Provided By (Used In) Operating Activities
During 2014, 20132016, 2015 and 2012,2014, we generated net cash provided by operating activities of $1,861$2,140 million, $2,035$1,960 million and $2,039,$1,861, respectively. Cash provided by operating activities is impacted by the profitability of our business, the development of our working capital, principally inventories, receivables and cash outflows that occur due to a number of specific items as discussed below. The decreaseincrease in 20142016 versus 20132015 was mainly a result of the $115 million payment for the W.R. Grace bankruptcy settlement, a tax paymentdecreased volume of health care supplies, particularly due to erythropoietin-stimulating agents as a result of a tax audit in Germany for fiscal years 2002 through 2005, which had been previously provided for, of $101 million, a lower decrease of Days Sales Outstanding ("DSO") andwell as increased inventory,earnings, partially offset by a favorable development inunfavorable effects from other working capital.capital items and a $100 million discretionary contribution to pension plan assets in the United States.
The profitability of our business depends significantly on reimbursement rates. Approximately 77%81% of our revenues are generated by providing health care services, a major portion of which is reimbursed by either public health care organizations or private insurers. For the year ended December 31, 2014, approximately 31% of our consolidated revenues were attributable to U.S. federal health care benefit programs, such as Medicare and Medicaid reimbursement. Legislative changes could affect Medicare reimbursement rates for a significant portion of the services we provide, as well as the scope of Medicare coverage. A decrease in reimbursement rates or the scope of coverage could have a material adverse effect on our business, financial condition and results of operations and thus on our capacity to generate cash flow. While we have generally experienced stable reimbursement globally, including the balancingSee "Financial Condition and Results of unfavorable reimbursement changes in certain countries with favorable changes in other countries, the stability of reimbursement in the U.S. has been affected by (i) the implementation of the ESRD PPS in the U.S. in January 2011, (ii) the U.S. federal government Sequestration cuts, (iii) commencing January 1, 2014, the reductions to the ESRD PPS rate to account for the decline in utilization of certain drugsOperations – "Overview, Legislation and biologicals associated with dialysis and (iv) the enactment of PAMA (see discussion above). In the future, we expect to experience generally stable reimbursements for dialysis services globally.Growth," above.
Our working capital, which is defined as current assets less current liabilities, was $3,247$2,277 million at December 31, 20142016 which increaseddecreased from $2,733$2,619 million at December 31, 2013.2015. The change is primarily the result of an increaseincreased short-term debt due to issuance of short-term notes under our commercial paper program (see Note 8 of the Notes to Consolidated Financial Statements, "Short-Term Debt and Short-Term Debt from Related Parties," included in prepaidthis report), the reclassification of our dollar-denominated senior notes to current liabilities as these notes mature during the third quarter of 2017, increased accrued expenses and other current assetsliabilities as a result of investments in available for sale financial assets; an increase in taxes receivable; the repayment of the European Investment Bank ("EIB") Agreements in February of 2014; an increase in our tradewell as increased accounts receivable as a result of an acquisition and growth in our business; the payment for the W.R. Grace bankruptcy settlement; a decrease in income taxes payable and a decrease in short-term borrowings fromto related parties, partially offset by the repayment of euro-denominated Senior Notes that matured in the third and fourth quarter of 2016, increased accrued expenses, a decrease intrade accounts receivable, and increased cash due to investments made in available for sale financial assets and an increase in short-term borrowings.cash equivalents. Our ratio of current assets to current liabilities was 1.931.45 and 1.771.63 at December 31, 20142016 and December 31, 2013,2015, respectively.
We intend to continue to address our current cash and financing requirements using cash provided by operating activities, our existing and future credit agreements, issuances under the Commercial Paper
Program (See Note 8 of the Notes to the Consolidated Financial Statements, "Short-Term Debt and Short-Term Debt from Related Parties," included in this report) as well as the issuance of debt securities. In addition, when funds are required for acquisitions or to meet other needs, we expect to successfully
complete long-term financing arrangements, such as the issuance of senior notes, see "Net Cash Provided By (Used In) Financing Activities" below.notes. We aim to preserve financial resources with a minimum of $300 to $500 million of committed and unutilized credit facilities.
Cash provided by operating activities depends on the collection of accounts receivable. Commercial customers and governments generally have different payment cycles. A lengthening of their payment cycles could have a material adverse effect on our capacity to generate cash flow. In addition, we could face difficulties in enforcing and collecting accounts receivable under some countries' legal systems and due to the economic conditions in some countries. Accounts receivable balances, at December 31, 2014 and December 31, 2013, net of valuation allowances, represented DSODays Sales Outstanding ("DSO") of approximately 72 and 73, respectively.70 at December 31, 2016, a decrease as compared to 71 at December 31, 2015.
DSO by segment is calculated by dividing the segment's accounts receivable, as converted to U.S. dollars using the average exchange rate for the period presented, less any value added tax included in the receivables, by the average daily sales for the last twelve months of that segment, as converted to U.S. dollars using the average exchange rate for the period. Receivables and sales are adjusted for amounts related to significant acquisitions made duringwithin the periods presented.reporting period with a purchase price above a $50 million threshold as defined in the Amended 2012 Credit Agreement. The development of DSO by reporting segment is shown in the table below:
| | December 31, 2014 | December 31, 2013 | 2016 | 2015 | ||||||||||
|---|---|---|---|---|---|---|---|---|---|---|---|---|---|---|
North America Segment days sales outstanding | 50 | 53 | ||||||||||||
North America days sales outstanding | 54 | 53 | ||||||||||||
| | | | | | | | | | | | | | | | |
| | | | | | | | | | | | | | | |
International Segment days sales outstanding | 114 | 110 | ||||||||||||
EMEA days sales outstanding | 101 | 104 | ||||||||||||
| | | | | | | | | |||||||
| | | | | | | |||||||||
| | | | | | | | | |||||||
Asia-Pacific days sales outstanding | 105 | 113 | ||||||||||||
| | | | | | | | | |||||||
| | | | | | | |||||||||
| | | | | | | | | |||||||
Latin America days sales outstanding | 143 | 141 | ||||||||||||
| | | | | | | | | | | | | | | | |
| | | | | | | | | | | | | | | |
FMC-AG & Co. KGaA average days sales outstanding | 72 | 73 | 70 | 71 | ||||||||||
| | | | | | | | | | | | | | | | |
| | | | | | | | | | | | | | | |
The decreaseDSO increase in the North America Segment is largely due to a large extent was drivenrelease of bad debt reserves in our dialysis business, which is partially offset by increased bad debt reserves in our Care Coordination business. The EMEA Segment's DSO decrease reflects increased sales in the positive impactregion coupled with fluctuations in payments of the resolutionpublic health care organizations. The Asia-Pacific Segment's DSO decrease reflects an improvement of payment delays which were caused by changescollections in ownership of certain U.S. clinics which resulted from the creation of joint ventures as well as strong collections during the year.China. The InternationalLatin America Segment's DSO increase reflects longerperiodic delays in payment terms, payment delays for servicesof public health care organizations in certain countries and strong business growth during the second half of 2014, partially offset by an Asia-Pacific acquisition contributing much lower DSO than the average for the region.countries.
Due to the fact that a large portion of our reimbursement is provided by public health care organizations and private insurers, we expect that most of our accounts receivable will be collectible, albeit slightly more slowly in the International Segment in the immediate future.collectible.
We are subject to ongoing and future tax audits in the U.S., Germany and other jurisdictions. We have received notices of unfavorable adjustments and disallowances in connection with certain of the audits. We are contesting, including appealing, certain of these unfavorable determinations. If our objections and any final audit appeals are unsuccessful, we could be required to make additional tax payments, including payments to state tax authorities reflecting the adjustments made in our federal tax returns in the U.S. With respect to other potential adjustments and disallowances of tax matters currently under review, we do not anticipate that an unfavorable ruling could have a material impact on our results of operations. We are not currently able to determine the timing of these potential additional tax payments.
Net Cash Provided By (Used In) Investing Activities
We used net cash of $2,690$1,379 million, $1,206$1,001 million and $2,281$2,690 million in investing activities duringin the years ended December 31, 2016, 2015 and 2014, 2013 and 2012, respectively.
Capital expenditures for property, plant and equipment, net of proceeds from sales of property, plant and equipment were $920$1,012 million, $728$935 million and $666$920 million for the years ended 2014, 2013December 31, 2016, 2015 and 2012,2014, respectively. During 2014,2016, capital expenditures were $568 million in the North America Segment, $253 million at Corporate, $119 million for the EMEA Segment, $38 million for the Asia-Pacific Segment and $34 million for the Latin America Segment. Capital expenditures during 2015 were $480 million in the North America Segment, $261 million at Corporate, $112 million for the EMEA
Segment, $46 million for the Latin America Segment and $36 million for the Asia-Pacific Segment. Capital expenditures during 2014 were $403 million in the North America Segment, $285 million at Corporate, $232$161 million for the International Segment. During 2013, capital expenditures were $374 million in the North AmericaEMEA Segment, $189$37 million for the InternationalAsia-Pacific Segment and $165 million at Corporate. During 2012, Capital expenditures were $298 million in the North America Segment, $195$34 million for the International Segment and $173 million at Corporate.Latin America Segment. The majority of our capital expenditures waswere used for maintaining existing clinics, equipping new clinics, maintenance and expansion of production facilities primarily(primarily in Germany, the North America Segment, France, ColombiaGermany and SerbiaFrance) and capitalization of machines provided to our customers primarily in the International
Segment. In 2014,and for Care Coordination. Capital expenditures were approximatelyremained stable at 6% of total revenue as compared to 5% in 20132016, 2015 and 2012.2014.
In addition to the capital expenditures discussed above, we invested approximately $578 million during 2016, approximately $347 million in the North America Segment, $183 million in the EMEA Segment, $24 million at Corporate, $15 million in the Asia-Pacific Segment and $9 million in the Latin America Segment. The investment during 2016 is primarily related to acquisitions of dialysis clinics, available for sale financial assets, acquisitions in our hospitalist and intensivist business, and a loan provided to an equity method investee in the North America Segment. In the EMEA Segment, we acquired a medical technology company focusing on the treatment of lung and cardiac failure as well as dialysis clinics. In the Asia-Pacific Segment and Latin America Segment, we acquired dialysis clinics. During 2016, we received $211 million from divestitures, mainly related to available for sale financial assets of approximately $129 million and a repayment of unsecured loans provided to an equity method investee in 2015 and 2016 of approximately $80 million. During 2015, we invested approximately $317 million, approximately $229 million in the North America Segment, $54 million in the EMEA Segment, $20 million at Corporate, $13 million in the Asia-Pacific Segment and $1 million in the Latin America Segment. The investment in the North America Segment was mainly driven by available for sale financial assets, the acquisition of dialysis clinics and notes receivables related to an equity method investee. The investment in the EMEA Segment largely relates to the acquisition of dialysis clinics and the contribution to an equity method investee. The investment in the Asia-Pacific Segment was mainly driven by the takeover of a distributor. During 2015, we received $251 million from divestitures, primarily driven by a $180 million repayment of an investment in the form of subordinated notes, $32 million related to the sale of our European marketing rights for certain renal pharmaceuticals, $21 million repayment of an unsecured loan provided to an equity method investee in 2014 as well as $9 million from the sale of our plasma collection device manufacturing business to Fresenius Kabi USA, Inc. (See Note 2 of the Notes to the Consolidated Financial Statements, "Related Party Transactions," included in this report). During 2014, we invested approximately $1,779 million cash, during 2014, $1,602 million in the North America Segment, $175$91 million in the InternationalAsia-Pacific Segment, $48 million in the EMEA Segment, $36 million in the Latin America Segment and $2 million atin Corporate. The investment in the North American Segment was mainly driven by acquisitions completed to expand our services within Care Coordination, available for sale financial assets, deferred acquisition payments related to an equity method investee, notes receivables related to an equity method investee and other acquisitions. The investmentinvestments in the InternationalEMEA Segment, Asia-Pacific Segment and Latin America Segment largely relatesrelate to acquisitions of clinics and deferred acquisition payments related to an equity method investee. During 2013, we invested approximately $496 million cash, $412 million in the North America Segment, $82 million in the International Segment and $2 million at Corporate. In the North America Segment this included an investment-type loan made by FMCH granting a $200 million credit facility to a middle market dialysis provider in the third quarter of 2013 (of which $170 million was drawn as of December 31, 2013, as well as the acquisition of a full-service clinical laboratory. In the International Segment this mainly included acquisitions of dialysis clinics. During 2012, we invested approximately $1,879 in cash, $1,849 million in the North America Segment, primarily through the $1,697 million ($1,466 million net of divestitures) acquisition of Liberty Dialysis Holdings, $28 million in the International Segment and $2 million at Corporate.
We anticipate capital expenditures of approximately $1.0€1.1 to €1.2 billion and expect to make acquisitions of approximately $0.4€0.75 billion in 2015.2017. See "Outlook" below.
Net Cash Provided By (Used In) Financing Activities
Net cash provided byused in financing activities was $805$585 million during 20142016 compared to net cash used in financing activities of $808$1,008 million during 20132015 and net cash provided by financing activities of $468$805 million during 2012, respectively.2014.
During 2016, cash was mainly used for the repayments of long-term debt and capital lease obligations, repayments of short-term debt, distributions to noncontrolling interests as well as payment of dividends, partially offset by proceeds from short-term debt and the increase in the utilization of our A/R Facility. During 2015, cash was mainly used for repayments of long-term debt, repayments of short-term debt, a reduction in the A/R Facility, distributions to noncontrolling interests and the payment of dividends, partially offset by proceeds from short-term debt, proceeds from the exercise of stock options, contributions from noncontrolling interests, and proceeds from short-term debt from related parties. During 2014, cash was mainly provided by proceeds from the issuance of senior notes and equity-neutral convertible bonds,Convertible Bonds, proceeds from the issuance of other long-term debt and short-term borrowingsdebt including drawing under the revolving credit facility, proceeds from the exercise of stock options and contributions from noncontrolling interests, partially offset by repayment of portions of long-term debt and short term borrowings, debt,
the repayment for the EIB Agreements, payment of dividends as well as distributions to noncontrolling interests. During 2013, cash was used in the purchase of our shares through the share buyback program, the repayment of portions of long-term debt and short-term borrowings, the payment of dividends and distributions to noncontrolling interests, partially offset by proceeds from long-term debt and short-term borrowings, proceeds from the draw down under our A/R Facility, proceeds from the exercise of stock options and proceeds of a premium paid for the conversion of preference shares into ordinary shares by the largest holder of former preference shares, a financial institution located outside the United States. During 2012, cash was provided by the issuance of senior notes, refinancing of the then-current Amended 2006 Senior Credit Agreement by the 2012 Credit Agreement, exercises of stock options, proceeds from short-term borrowings and short term borrowings from related parties as well as contributions from noncontrolling interests, partially offset by the repayment of long-term debt, reduction of the amount outstanding under our accounts receivable securitization program, the payment of dividends, distributions to noncontrolling interests as well as the repayment of short-term borrowings and short-term borrowings from related parties.
On May 16, 2014,13, 2016, we paid a dividend with respect to 20132015 of €0.77€0.80 per ordinary share (for 20122014 paid in 2013: €0.75,2015 €0.78, for 20112013 paid in 2012: €0.69). Due to the conversion of preference shares into ordinary shares in 2013, there was no preference share dividend payment in 2014 (for 2012 paid in 2013: €0.77, for 2011 paid in 2012: €0.71)€0.77). The total dividend payment was €244 million ($277 million), €237 million ($263 million) and €232 million ($318 million), €230 million ($296 million) in 2016, 2015, and €210 million ($272 million) in 2014, 2013 and 2012, respectively.
The following table summarizes the Company's available sources of liquidity at December 31, 2014:2016:
| | | Expiration per period of | | Expiration per period of | ||||||||||||||||||||||||||||
|---|---|---|---|---|---|---|---|---|---|---|---|---|---|---|---|---|---|---|---|---|---|---|---|---|---|---|---|---|---|---|---|---|
Available Sources of Liquidity in millions | Total | less than 1 Year | 1 - 3 Years | 3 - 5 Years | Over 5 Years | Total | less than 1 Year | 1 - 3 Years | 3 - 5 Years | Over 5 Years | ||||||||||||||||||||||
Accounts receivable facility(a) | $ | 392 | $ | — | $ | 392 | $ | — | $ | — | ||||||||||||||||||||||
Accounts Receivable Facility(a) | $ | 609 | $ | — | $ | 609 | $ | — | $ | — | ||||||||||||||||||||||
Revolving Credit Facility of the Amended 2012 Credit Agreement(b) | 1,443 | — | — | 1,443 | — | 1,408 | — | 1,408 | — | — | ||||||||||||||||||||||
Other Unused Lines of Credit | 248 | 248 | — | — | — | 242 | 242 | — | — | — | ||||||||||||||||||||||
| | | | | | | | | | | | | | | | | | | | | | | | | | | | | | | | | |
| $ | 2,083 | $ | 248 | $ | 392 | $ | 1,443 | $ | — | $ | 2,259 | $ | 242 | $ | 2,017 | $ | — | $ | — | |||||||||||||
| | | | | | | | | | | | | | | | | | | | | | | | | | | | | | | | | | |
| | | | | | | | | | | | | | | | | | | | | | | | | | | | | | | | | |
An additional source of liquidity is our Commercial Paper Program (the "CP Program") under which up to €1,000 million of short-term notes can be issued on a flexible and continuous basis. The maturity of the notes issued may not exceed two years less one day. As of December 31, 2016, €476 ($502) million was outstanding under the CP Program.
The amount of guarantees and other commercial commitments at December 31, 20142016 was not significant.
At December 31, 2014,2016, we had short-term borrowings,debt, excluding the current portion of long-term debt other financial liabilities and short-term borrowingsdebt from related parties in the total amount of $138$606 million.
The following table summarizes, as of December 31, 2014,2016, our obligations and commitments to make future payments under our long-term debt and other long-term obligations, and our commitments and obligations under lines of credit and letters of credit.
| | | Payments due by period of | | Payments due by period of | ||||||||||||||||||||||||||||
|---|---|---|---|---|---|---|---|---|---|---|---|---|---|---|---|---|---|---|---|---|---|---|---|---|---|---|---|---|---|---|---|---|
Contractual Obligations and Commitments (a) in millions | Total | less than 1 Year | 1 - 3 Years | 3 - 5 Years | Over 5 Years | |||||||||||||||||||||||||||
Contractual Obligations and Commitments in millions(a) | Total | less than 1 Year | 1 - 3 Years | 3 - 5 Years | Over 5 Years | |||||||||||||||||||||||||||
Long-term Debt(b) | $ | 11,289 | $ | 668 | $ | 2,482 | $ | 4,729 | $ | 3,410 | $ | 9,144 | $ | 1,087 | $ | 4,756 | $ | 2,119 | $ | 1,182 | ||||||||||||
Capital Lease Obligations | 43 | 9 | 14 | 5 | 15 | 57 | 13 | 17 | 10 | 17 | ||||||||||||||||||||||
Operating Leases | 3,579 | 661 | 1,061 | 727 | 1,130 | 4,174 | 740 | 1,201 | 872 | 1,361 | ||||||||||||||||||||||
Unconditional Purchase Obligations for inventory | 444 | 206 | 159 | 60 | 19 | 442 | 213 | 191 | 38 | — | ||||||||||||||||||||||
Other Long-term Obligations(c) | 294 | 201 | 80 | 9 | 4 | 187 | 108 | 73 | 6 | — | ||||||||||||||||||||||
Letters of Credit | 74 | — | 67 | 7 | — | 19 | — | 19 | — | — | ||||||||||||||||||||||
| | | | | | | | | | | | | | | | | | | | | | | | | | | | | | | | | |
| $ | 15,723 | $ | 1,745 | $ | 3,863 | $ | 5,537 | $ | 4,578 | $ | 14,023 | $ | 2,161 | $ | 6,257 | $ | 3,045 | $ | 2,560 | |||||||||||||
| | | | | | | | | | | | | | | | | | | | | | | | | | | | | | | | | | |
| | | | | | | | | | | | | | | | | | | | | | | | | | | | | | | | | |
Our Amended 2012 Credit Agreement, Senior Notes and the A/R Facility include covenants that require us to maintain certain financial ratios or meet other financial tests. Under our Amended 2012 Credit Agreement and A/R Facility, we are subject to a maximum consolidated leverage ratio (ratio of consolidated funded debt less cash and cash equivalents to consolidated EBITDA) as these terms are defined in these financing agreements. Other covenants in one or more of each of these agreements restrict or have the effect of restricting our ability to dispose of assets, incur debt, pay dividends create liens or engage in sale-lease backs.
The breach of any of the covenants in any of the instruments or agreements governing our long-term debt – the Amended 2012 Credit Agreement, Senior Notes or the A/R Facility – could, in turn, create
additional defaults under one or more of the other instruments or agreements. In default, the outstanding balance under the Amended 2012 Credit Agreement becomes due at the option of the lenders under that agreement, and the "cross default" provisions in our other long-term debt permit the lenders to accelerate the maturity of the other debt upon such a default as well. As of December 31, 2014,2016, we were in compliance with all covenants under the Amended 2012 Credit Agreement and our other financing agreements. For information regarding our Amended 2012 Credit Agreement, Senior Notes and the A/R Facility, see Note 119 of the Notes to Consolidated Financial Statements, "Long-Term Debt and Capital Lease Obligations, and Long-Term Debt from Related Parties." included in this report.
Although, we are not immune from the global financial crisis,current and future economic conditions could adversely affect our business and our profitability, we believe that we are well positioned to continue to grow our business while meeting our financial obligations as they come due. Due to the non-discretionary nature of the health care services we provide, the need for products utilized to provide such services and the availability of government reimbursement for a substantial portion of our services, our business is generally not cyclical. A substantial portion of our accounts receivable are generated by governmental payers.payors. While payment and collection practices vary significantly between countries and even between agencies within one country, government payors usually represent low to moderate, credit risks. However, limited or expensive access to capital could make it more difficult for our customers to do business with us, or to do business generally, which could adversely affect our business by causing our customers to reduce or delay their purchases of our dialysis products. See "Results of Operations" above. If the current conditions in the credit and equity markets continue, or worsen, they could also increase our financing costs and limit our financial flexibility.
Our General Partner's Management Board will propose to the shareholders at the Annual General meetingour AGM on May 19, 2015,11, 2017, a dividend with respect to 20142016 and payable in 2015,2017, of €0.78€0.96 per ordinary share (for 20132015 paid in 2014: €0.77)2016: €0.80). The total expected dividend payment is approximately €237€294 million (approximately $287$310 million based upon the December 31, 20142016 spot rate) compared to dividends of €232€244 million ($320277 million) paid in 20142016 with respect to 2013.2015. The Amended 2012 Credit Agreement provides for a limitation on dividends and other restricted payments which is €360€440 million ($437464 million based upon the December 31, 20142016 spot rate) for dividends to be paid in 2015,2017, and increases in subsequent years. Additional dividends and other restricted payments may be made subject to the maintenance of a maximum leverage ratio.
Our 20152017 principal financing needs are the repayment of Senior Notes as well as quarterly payments under our Amended 2012 Credit Agreement Term Loan facilities.Loans. These payments as well as our dividend payment of approximately $287$310 million in May 2015,2017, and the anticipated capital expenditures, and acquisition payments are expected to be covered by our cash flows, by using existing credit facilities and, if required, by additional debt financing. We currently have sufficient flexibility under our debt covenants to meet our financing needs in the near future. Generally, we believe that we will have sufficient financing to achieve our goals in the future and to continue to promote our growth.
V. Balance Sheet Structure
Total assets as of December 31, 2016 increased to $26.9 billion from $25.4 billion as compared to December 31, 2015. Current assets as a percent of total assets remained stable at 27% at December 31, 2016 as compared to December 31, 2015. The equity ratio, the ratio of our equity divided by total liabilities and shareholders' equity, increased to 43% at December 31, 2016 as compared to 41% at December 31, 2015. The U.S. GAAP ROIC increased to 7.8% at December 31, 2016 as compared to 7.0% at December 31, 2015. Goodwill had a significant impact on the calculation of the ROIC. In 2016, our ROIC substantially exceeded our cost of capital. The Weighted Average Cost of Capital was 5.5%.
VI. Outlook
Below is a table showing our growth outlook for 2015.2017 which is determined by reference to target results determined in accordance with IFRS and presented in euro. We have presented our outlook in this manner because the financial statements included in our SEC reports will be prepared in accordance with IFRS commencing in 2017, using the euro as our reporting currency. The outlook for 2015 and the growth rates indicated for 20162017 are basedcalculated and presented at Constant Exchange Rates with reliance on Item 10(e)(1)(i)(B) of SEC Regulation S-K as it is impossible to predict currency exchange movements over the course of an entire year.
Vision 2020
Our growth strategy for 2020 noted above in 4B, "Information on the Company -Business Overview – Our Strategy and Competitive Strengths" is presented in U.S. dollars and in accordance with U.S. GAAP.
This growth strategy expressed a goal to increase revenues to $28 billion, in accordance with U.S. GAAP, by fiscal year 2020. In accordance with IFRS in euro, this revenue goal would be €21 billion by fiscal year 2020 utilizing the currency exchange rates at the time Vision 2020 was presented in April 2014. At currency rates prevailing at the beginning of 2015:2017, this vision represents revenue of €24 billion in 2020. In addition, we indicated average annual revenue growth of approximately 10% and average annual growth of net income attributable to shareholders of FMC-AG & Co. KGaA in the high single-digits, these goals are unchanged.
| | Results 2016 | Results 2016 | Targets 2017 | |||
|---|---|---|---|---|---|---|
| | Prepared in accordance with U.S. GAAP | Prepared in accordance with IFRS | Prepared in accordance with IFRS | |||
| | in $ | in € | in € | |||
Revenue(1),(2) | $17.9 billion | €16.6 billion | Growth 8 - 10% (at Constant Exchange Rates) | |||
Operating income(2) | $2.6 billion | €2.4 billion | Growth³ revenue growth | |||
Delivered EBIT(2) | $2.3 billion(3) | €2.1 billion | Growth ~ revenue growth | |||
Net income(4) | $1.2 billion | €1.1 billion | ||||
Net income growth(2),(4), | 7 - 9% (at Constant Exchange Rates) | |||||
Basic earnings per share growth(2),(4), | based on development of net income | |||||
Capital Expenditures | $1.0 billion | €0.9 billion | €1.1 - 1.2 billion | |||
Acquisitions and investments | $0.4 billion | €0.3 billion | ~ €0.75 billion | |||
Net cash provided by (used in) operating activities in % of revenue | 11.9% | 11.7% | > 10% | |||
Free cash flow in % of revenue | 6.3%(3) | 6.1% | > 4% | |||
Debt/EBITDA Ratio | 2.4 | 2.6 | < 2.5 | |||
ROIC | 7.8% | 7.8% | ³ 8.0% | |||
Employees(5) | 109,319 | 109,319 | > 117,000 | |||
Research and development expenses | $162 million | €147 million | €150 - 160 million |
Delivered EBIT and free cash flow in % of revenue are non-IFRS key performance indicators used in the Outlook above. Presented below is a reconciliation of these key performance indicators to the most directly comparable IFRS financial measures:
Significant Cash Flow Key Performance Indicators
| | Reconciliation | ||||
|---|---|---|---|---|---|
December 31, 2016 | |||||
| (in € millions) | |||||
Revenue | |||||
| |||||
| 16,570 | ||||
Net | 1,932 | ||||
| |||||
Capital | (931 | ||||
| 16 | ||||
Capital expenditures, net | (915 | ) | |||
Free cash flow | 1,017 | ||||
Net cash provided by (used in) operating activities in % of revenue | 12 | ||||
Free cash flow in % of revenue | 6 | ||||
Delivered EBIT Reconciliation
| IFRS Reconciliation | |||||
|---|---|---|---|---|---|
| For the year ended December 31, 2016 | |||||
| (in € millions) | |||||
| 2,409 | ||||
| (276 | ||||
| | | | | | |
| 2,133 | ||||
| | | | | ||
| | | | | | |
| | | | | | |
For the year 2016 we expect an acceleration of growth to achieve our mid-term targets with increases of revenue of 9 to 12% and net income attributable to shareholders of FMC AG & Co. KGaA growing by 15 to 20%.
In addition to the consolidated financial statements prepared in accordance with U.S. GAAP included in this report, we are subject to home country reporting requirements in Germany. These require that we provide an assessment of the probability and impact of certain risks and uncertainties that could materially affect our outlook. A summary of such risk assessment is set forth below.
Although we believe our fiscal year 20152017 outlook is based on reasonable assumptions, it is subject to risks and uncertainties that may materially impact the achievement of the outlook. In the following table, we have listed certain risks and the corresponding risk factor (or other discussion of such risks) within this report as well as our assessment of the reasonable probability and potential impact of these known risks on our 2015 results.results for the fiscal year 2017. The risks and their related risk factors or other disclosure headings have been paired together to provide further information on the risks as well as provide an indication of their location in this report. The assessment below should be read together with the discussions of such risks and uncertainties contained in Item 3, Key Information – D. "Risk Factors" and Item 11, Quantitative and Qualitative Disclosures About Market Risk – "Management of Foreign Exchange and Interest Rate Risks." Our Litigation risk represents an assessment of material litigation currently known or threatened and is discussed in Note 2018 of the Notes to Consolidated Financial Statements, "Commitments and Contingencies" found elsewhere in this report. These assessments by their nature do not purport to be a prediction or assurance as to the eventual resolution of such risks. As with all forward-looking statements, actual results may vary materially. See "Forward-looking Statements" immediately following the Table of Contents to this report. Other risks discussed in Item 3, Key Information – D. ``Risk Factors" that are not included in the table below were deemed to have a medium to long-term potential effect on our business, financial condition and results of operations.
Risk to our | Risk Factor (or other related disclosure) within the report | Probability(1) | Impact(2) | |||
|---|---|---|---|---|---|---|
Regulatory Environment | If we do not comply with the many governmental regulations applicable to our business, we could be excluded from government healthcare reimbursement programs or our authority to conduct business could be terminated, either of which would result in a material decrease in our revenue. | |||||
Quality | If we do not comply with the many governmental regulations applicable to our business, we could be excluded from government healthcare reimbursement programs or our authority to conduct business could be terminated, either of which would result in a material decrease in our revenue. |
| Medium | |||
U.S. Federal health care programs | Changes in reimbursement and/or governmental regulations for health care could materially decrease our revenues and operating profit. | Possible | Medium | |||
Erythropoietin stimulating agents (ESAs) | The utilization of ESAs could materially impact our |
| Medium | |||
Reimbursement by private insurers |
|
| Medium | |||
|
|
| Medium | |||
Competition | Our competitors could develop superior technology or otherwise impact our sales | Possible | Low | |||
Corruption | We operate in many different jurisdictions and we could be adversely affected by violations of the U.S. Foreign Corrupt Practices Act and similar worldwide anti-corruption | Likely | Major | |||
Information Technology | If we are unable to protect our information technology security systems against cyber-attacks or prevent other privacy or data security incidents that result in security breaches that disrupt our operations or result in the unintended dissemination of sensitive personal information or proprietary or confidential information, we could be exposed to significant regulatory fines or penalties, liability or reputational damage, or experience a material adverse effect on our results of operations, financial position, and cash flows | Possible | Medium | |||
Liquidity and Financing | Our indebtedness may limit our ability to pay dividends or implement certain elements of our business strategy | Unlikely | Medium | |||
Currencies and interests | Foreign currency and interest rate exposure. See Item 11, Quantitative and Qualitative Disclosures About Market Risk – "Management of Foreign Exchange and Interest Rate Risks" |
| Medium | |||
Litigation | Legal and Regulatory Matters (See Note |
|
| |||
Taxes | Diverging views of fiscal authorities could require us to make additional tax |
| Low | |||
U.S. Import Duties | Forward-looking Statements | Possible | Severe | |||
Global economic conditions and disruptions in financial markets | We face specific risks from international operations | Possible | Major |
Total assets as of December 31, 2014 increased to $25.4 billion from $23.1 billion as compared to December 31, 2013. Current assets as a percent of total assets decreased to 26% at December 31, 2014 as compared to 27% at December 31, 2013. The equity ratio,We classify the ratio of our equity divided by total liabilitiespotential probability into four categories: Almost certain (> 90%), Likely(> 50% but£ 90%), Possible (> 10% but£ 50%), and shareholders' equity, decreased to 39% at December 31, 2014 as compared to 41% at December 31, 2013.
Unlikely (C. Research£ 10%)
We focus our R&D strategyLow (small negative impact on three essential objectives: first, to continuously enhance the quality of life of patients with chronic kidney disease using innovative products and treatment concepts; second, to offer our patients and purchasers of our products high-quality services while keeping our prices as low as possible; and third, to continue to expand our position as the dialysis market leader. Due to our vertical
integration, our researchVII. Research and development departmentDevelopment
Global R&D Strategy
Health care systems are currently facing major financial challenges and expect this to continue well into the future. We address these challenges by developing innovative products that are not only of the highest quality, but are also affordable so that caregivers and patients can applybenefit from them. Based on our experience in operating our own dialysis clinics, we know that these are congruous goals.
R&D is centrally managed as the world's largest provider of dialysis treatments to product development,Global Research and our technical department benefits from our daily practical experience as a provider of dialysis treatment and being directly in-touch with doctors, nurses and patients to keep track of and meet customer and patient needs. In addition, research and development units are located at key production sites, enabling direct exchange of ideas with our production staff. We conduct annual internal R&D conferences every year. In addition, our employees visit research events worldwide and participate actively in scientific discourse.Development division. This not only enables them to inject new concepts into their work, but also strengthens our reputation in the international professional community. We also maintain close contacts with universities and research institutions. We are cooperating closely with the University of Michigan (on a longitudinal study of chronic kidney patients), Danube University Krems in Krems, Austria (on extracorporeal methods), and our subsidiary, the Renal Research Institute ("RRI") in the United States. RRI was founded in 1997 to research fundamental issues of dialysis treatment, including the causes that lead to kidney failure, the particular features of treating children with ESRD and issues such as the mineralization of dialysis patients' bones and the effects of kidney diseases on the natural acid-base balance in the human body.
During 2013, we restructured our research and development activities with a global focus. This included expanding the Management Board to include a member responsible for global research and development activities. This continued focus enables us to accelerate development timelines, promoterespond even better to the global rise in demand for improved, high-quality yet cost-efficient treatment methods. In doing so, we also take regional market conditions into account and offer an exchange of knowledgeappropriately differentiated product range. In future, we intend to deliver innovative, competitive products in a timelier manner and technology, enhancestrengthen our process efficiency and better manage risks andfocus on developing countries. To achieve these goals, we have identified six core areas as the related costs.
The taskfocal points of our research and development group, which employs approximately 599 full time equivalents, is to continually develop and improve our products and treatments. Our largest research and development department is in our European region with approximately 370 employees, most of whom work at our Schweinfurt and Bad Homburg locations. Smaller teams also work in St. Wendel, Germany, in Krems, specializing in sorbent technology, and in Bucharest, Romania, where an R&D competency center specializing in software development has been established. Apart from R&D in Europe, we have research and development departments in the North America and the Asia-Pacific regions. All of these units are closely connected and cooperate on many projects.
Six trends for our continued strategic development
activities.
To maintain our position as market leader, we aim to regularly and sustainably offer innovative technologies, products, and features that put us ahead of leadership into the future.
competition. We also want to improve our processes, manufacturing, services and, most importantly, the quality of life and medical outcomes for our patients.
R&D analyzes and improves therapy systems as well as processes in our dialysis clinics using lean principles supported by technology. As we are a vertically integrated company, our R&D benefits from direct access to develop high-quality innovations that are affordablethe opinions and experience of patients and clinical staff at our own dialysis centers. This helps us to our patients. By leveragingenhance the expertiseusability and features of our various departments, we canproducts in such a way as to further optimize and automate our products while simplifyingprocesses in the clinics and streamlining the work steps required.
simplify operations.
We manage and individualcontrol our global product portfolio to enable us to quickly identify synergies between different product families. By exploiting these synergies, we can improve R&D efficiency and speed up time to market. Different markets have different requirements. Our platform architecture and modular system components of our therapy systems internationally. The aim isallow us to reduce development times, achieve economies of scale in purchasing, and bundlefurther pool our R&D resources.
Worldwide, the number of people suffering from chronic kidney failure continues to increase. This increases the cost burden for health care systems; at the same time, the availability of trained personnel for dialysis centers is limited. As a result, demand for home therapy systems is on the rise around the world. Home dialysis and its associated technologies and products are therefore another key focal point of our R&D activities.
Many dialysis patients in emerging markets still do not have reliable access to treatment. The potential in these areas is accordingly high. With this in mind, we are developing a dedicated product portfolio for these regions and expanding our local presence. As one of the larger emerging markets, China is a key priority. We have a dedicated development resources. Ourcenter in this country. While the focus is currently on peritoneal dialysis products and dialysis machines, the aim is to develop a complete product portfolio management also includes the standardization of process and control structures and supports quality initiatives within the Company.
especially for this market.
To ensure growth in the medium and enhance our products to offer safer and better treatments for our patients. In 2014,long term, we introduced twonot only work on new products sleep.safe harmonythat are about to be launched, but also develop innovative technologies and Liberty PDx, simplifyingapplications. A stringent and expanding therapy options in PD.systematic portfolio management approach ensures transparency across all projects and new ideas.
In hemodialysis,addition to the R&D activities carried out within our company, we have launchedcollaborate with external partners to create a new version of the Critline system to monitor blood volumecomprehensive innovation and regulate fluid removal from patients. We have also launched a system for our 5008-series dialysis machines which allows the machine to independently automate sodium balances during dialysis treatment.
institutions, such as research institutes at renowned universities in the U.S. Another partner is the Renal Research Institute ("RRI") in New York. This subsidiary of Fresenius Medical Care North America is a leading institution in the field of clinical research into chronic kidney failure. Together, we are working on fundamental issues relating to dialysis treatment. We are increasingly working with start-ups to encourage an open culture that promotes innovation and to gain access to the latest technologies both in our core business as well as in adjacent areas that are of future strategic interest to us.
In 2016, we formed Fresenius Medical Care Ventures ("FMCV") to allow us to participate in young start-ups as a strategic investor. FMCV is another element of our innovation strategy. Our first FMCV investment is in a company that develops extracorporeal treatment for bloodstream infections.
Also in 2016, we launched Unicyte AG, a wholly-owned subsidiary of Fresenius Medical Care. Unicyte evolved from the long-standing research partnership between Fresenius Medical Care and the University of Turin and aims to translate projects in the areas of regenerative medicine, adult stem cells, and nanoscale extracellular vesicles (the smallest membrane particles that can transfer a complex set of information from one cell to another) into clinical programs. The new organizational structure will allow us to involve additional partners.
Clinical Research
Innovations in 2016
During 2014, we performed clinical studies to examineWe launched a new therapy system last year. The 6008 CARESystem optimizes dialysis treatment while minimizing the automatic regulationnumber of operating steps required. Operation of the electrolyte balancedialysis system is simplified further by a new, all-in-one disposable with pre-connected blood tubes for all treatment modalities. As well as being cost-efficient, the 6008 CAREsystem is environmentally friendly, generating less waste during dialysis than other systems.
In 2016, we also gathered the first clinical data from a new dialyzer. Its hollow fibers have a modified inner wall that allows blood to pass more effectively, thereby reducing the need for heparin in standard dialysis treatments. Heparin slows down blood clotting and prevents the patient's blood from coagulating in the tubes of the human body, whichdialysis machine.
Ethical standards in R&D
As part of our innovation culture, we also strive to carry out R&D responsibly. Whenever we launch a new medical device or pharmaceutical product, we are legally required to prove and extensively document its effectiveness and safety. This can result in the need for clinical studies. Our industry is importantsubject to extensive guidelines and laws intended to ensure that no ethical principles are violated during such studies, that physicians and institutions carrying out studies on companies' behalf have been carefully selected based on their qualifications, and that scientifically accepted methods are applied. They include, for example, the functioningdeclaration of the entire body.World Medical Association, which prescribes basic ethical principles for clinical research, EU directives on pharmaceuticals (such as Directive 536/2014/EU), the MD Directive, and ISO standard 14155, which defines the criteria for clinical investigation and reporting in clinical research. Fresenius Medical Care carries out its clinical research in accordance with these regulations. In addition, we observe national laws and regulations such as the AMG and the Medical Devices Act in Germany, or the FDA regulations. Fresenius Medical Care's own Standard Operating Procedures for employees combine these regulations with internal rules to ensure that clinical investigations commissioned by us are focusing on PDcarried out and overhydration, proving that active fluid managementdocumented properly. Before an investigation can increase a patient's survival rate, reduceeven begin, ethics committees in the number and duration of hospital stays, and improve the maintenance of the residual renal function. In hemodialysis, where dialysis solution is continuously being produced by a dialysis machine, it is possible to influence these processes favorably by adapting the dialysis solution accordingly. Our Body Composition Monitor ("BCM") analysis system enables us to determine the fluid status and body composition of each patient. Based upon our studies, BCM can also be used to improve fluid management in PD patients, increasing life expectancy.relevant countries must approve its implementation.
Expenditures
Research and development expenditures amounted to $162 million in 2016, compared to $140 million and $122 million in 2014, compared to $126 million2015 and $112 million in 2013 and 2012,2014, respectively. Our 20142016 expenditures focused on continuously enhancingwere driven by higher personnel expense and improvingproject costs related to an expansion of our products and treatment concepts for our patients and users, implementing further technological developments, and remaining activeproject portfolio which has a number of key projects currently in relevant areasthe peak of clinical research such as chronic kidney failure.their resource consumption.
We intend to continue investingare expanding our product range in the Asia-Pacific region by developing new products and solutions for CAPD and manufacturing them locally. We are also currently developing a whole portfolio of state-of-the-art PD technologies together with our partners. The new product platform will offer newly designed peritoneal dialysis cyclers for APD therapy, the most common home therapy for treating
end-stage renal disease. The new cyclers are small, lightweight and compact, making them ideal for home treatment. This new generation of PD cyclers will provide greater flexibility for dialysis patients. We continually invest in developing and improving life-sustaining products and treatment concepts in the years to come, thus improving the quality of life for as many patients as possible with financially viable, environmentally-friendly innovations based on strategic technology platforms. We plan to spend approximately $140€150 to €160 million on research and development in 2015.2017.
D. Trend information
For information regarding significant trends in our business see Item 5.A, "Operating Financial Review and Prospects."
F.IX. Tabular Disclosure of contractual obligations
The information required by this item may be found underin Item 5B "–under the caption " – Liquidity and Capital Resources – Financing.Net Cash Provided By (Used In) Financing Activities."
Item 6. Directors, Senior Management and Employees
A. Directors and senior management
General
As a partnership limited by shares, under the German Stock Corporation Act (Aktiengesetz or) AktG), our corporate bodies are our General Partner, our Supervisory Board and our general meeting of shareholders. Our sole General Partner is Management AG, a wholly-owned subsidiary of Fresenius SE. Management AG is required to devote itself exclusively to the management of Fresenius Medical Care AG & Co. KGaA.
For a detailed discussion of the legal and management structure of Fresenius Medical Care AG & Co. KGaA, including the more limited powers and functions of the Supervisory Board compared to those of the general partner, see Item 16.G, below, "Governance – The Legal Structure of Fresenius Medical Care AG & Co. KGaA."
Our General Partner has a supervisory board and a management board. These two boards are separate and no individual may simultaneously be a member of both boards. A person may, however, serve on both the supervisory board of our General Partner and on our Supervisory Board.
The General Partner's Supervisory Board
The supervisory board of Management AG presently consists of sixfive members who are elected by Fresenius SE (acting through its general partner, Fresenius Management SE), the sole shareholder of Management AG. Currently, one position is vacant on the supervisory board of Management AG. Pursuant to a pooling agreement for the benefit of the public holders of our shares, at least one-third (but no fewer than two) of the members of the General Partner's supervisory board are required to be independent directors as defined in the pooling agreement, i.e., persons with no substantial business or professional relationship with us, Fresenius SE, the general partner,General Partner, or any affiliate of any of them.
Unless resolved otherwise by Fresenius SE in the general meeting of shareholders of Management AG, the terms of each of the members of the supervisory board of Management AG will expire at the end of the general meeting of shareholders held during the fourth fiscal year following the year in which the Management AG supervisory board member was elected by Fresenius SE, but not counting the fiscal year in which such member's term begins. Fresenius SE, as the sole shareholder of Management AG, is at any time entitled to re-appoint members of the Management AG supervisory board. The most recent election of members of the General Partner's supervisory board took place in July 2011.May 2016. Members of the General Partner's supervisory board may be removed only by a resolution of Fresenius SE in its capacity as sole shareholder of the General Partner. Neither our shareholders nor theour separate Supervisory Board of FMC AG & Co. KGaA has any influence on the appointment of the supervisory board of the General Partner.
The General Partner's supervisory board ordinarily acts by simple majority vote and the Chairman has a tie-breaking vote in case of any deadlock. The principal function of the general partner'sGeneral Partner's supervisory board is to appoint and to supervise the General Partner's management board in its management of the Company, and to approve mid-term planning, dividend payments and matters which are not in the ordinary course of business and are of fundamental importance to us.
The table below provides the names of the current members of the supervisory board of Management AG and their ages asages. Except for Mr. Sturm, each of January 1, 2015.such persons is also a member of the Supervisory Board of FMC AG & Co. KGaA.
Name | Current Age | |||
|---|---|---|---|---|
| ||||
Dr. Dieter Schenk, Vice Chairman(1)(4) | ||||
Dr. Gerd Krick(1)(2) | ||||
Mr. Rolf A. Classon(1)(2)(3)(4) | ||||
| ||||
Mr. William P. Johnston(1)(2)(3)(4) | ||||
DR. ULF M. SCHNEIDER has been Chairman of the Supervisory Board of Management AG, the Company's General Partner, since April 2005. He is alsoMR. STEPHAN STURM became Chairman of the Management Board of Fresenius Management SE the general partner ofon July 1, 2016, after serving for over 11 years as Fresenius SE & Co. KGaA, and Chairman or member of the Board of a number of otherSE's Chief Financial Officer. Prior to joining Fresenius SE group companies. Additionally,in 2005, he was Group Financea Managing Director of Credit Suisse First Boston ("CSFB"), from 2000 as Head of Investment Banking for Gehe UK plc.,Germany and Austria, and also served on CSFB's European Management Committee. During his more than 13 years in investment banking, Stephan Sturm held various executive positions with BHF-Bank, Union Bank of Switzerland and CSFB in Frankfurt and London. Prior to entering investment banking in 1991, he was a pharmaceutical wholesalemanagement consultant at McKinsey & Co in Duesseldorf and retail distributor,Frankfurt. Mr. Stephan Sturm holds a degree in Coventry, United Kingdom. He has also held several senior executive and financial positions since 1989 with Gehe's majority shareholder, Franz Haniel & Cie. GmbH, Duisburg, a diversified German multinational company. Dr. Schneider also serves on the Board of Directors of E.I. Du Pont de Nemours and Company, USA.Business from Mannheim University.
DR. DIETER SCHENK has been Vice Chairman of the Supervisory Boardsupervisory board of Management AG since 2005 and is also Vice Chairman of theour Supervisory Board of FMC AG & Co. KGaA and a memberVice Chairman of the Supervisory Boardsupervisory board of Fresenius Management SE. He is an attorney and tax advisor and has been a partner in the law firm of Noerr LLP (formerly Nörr Stiefenhofer Lutz) since 1986. Additionally, he also serves as the Chairman of the Supervisory Boardsupervisory board of Gabor Shoes AG, Bank Schilling & Co. AG and TOPTICA Photonics AG and as a Vice-Chairman of the Supervisory Boardsupervisory board of Greiffenberger AG. Dr. Schenk is also Chairman of the AdvisoryFoundation Board of Else Kröner-Fresenius-Stiftung, the sole shareholder of Fresenius Management SE, which is the sole general partner of Fresenius SE & Co. KGaA.
DR. GERD KRICK has been a member of the Supervisory Boardsupervisory board of Management AG since December 2005 and the Chairman of the Company'sour Supervisory Board since February 2006. He is the Chairman of the Supervisory Boardsupervisory board of Fresenius Management SE and of Fresenius SE & Co. KGaA and is also Chairman of the Board of Vamed AG, Austria.
MR. ROLF A. CLASSON has been a member of the Supervisory Boardsupervisory board of Management AG since July 7, 2011 and a member of the Company'sour Supervisory Board since May 12, 2011. Mr. Classon is the Chairman of the Board of Directors for Tecan Group Ltd. Additionally, Mr. Classon is the Chairman of
the Board of Directors for Hill-Rom Holdings, Inc. Mr. Classon also serves on the Board of Directors of Catalent Inc..
DR. WALTER L. WEISMAN has been a member of the Supervisory Board of Management AG since December 2005 and also serves on the Company's Supervisory Board. Additionally, he is the former Chairman and Chief Executive Officer of American Medical International, Inc., and was a member of the Board of Directors of Occidental Petroleum Corporation until May 4, 2012. He is also a Senior Trustee of the Board of Trustees for the California Institute of Technology, a Life Trustee of the Board of Trustees of the Los Angeles County Museum of Art, a Trustee of the Oregon Shakespeare Festival and Chairman Emeritus of the Board of Trustees of the Sundance Institute.
MR. WILLIAM P. JOHNSTON has been a member of the Supervisory Boardsupervisory board of Management AG since August 2006 and also serves on the Company'sour Supervisory Board. Mr. Johnston has been an Operating Executive of The Carlyle Group since June 2006. He is also Chairman of the Board of The Hartford Mutual Funds, Inc. and a member of the Board of Directors of The Hartford Mutual Funds, Inc. and HCR-Manor Care, Inc.
The General Partner's Management Board
Each member of the Management Board of Management AG is appointed by the Supervisory Boardsupervisory board of Management AG for a maximum term of five years and is eligible for reappointment thereafter. Their terms of office expire in the years listed below.
The table below provides names, positions and terms of office of the current members of the Management Board of Management AG and their ages as of January 1, 2015.ages:
Name | Age as of January 1, 2015 | Position | Year term expires | Current Age | Position | Year term expires | ||||||||||||
|---|---|---|---|---|---|---|---|---|---|---|---|---|---|---|---|---|---|---|
| Rice Powell | 59 | Chief Executive Officer and Chairman of the Management Board | 2017 | 61 | Chief Executive Officer and Chairman of the Management Board | 2017 | ||||||||||||
| Michael Brosnan | 59 | Chief Financial Officer | 2017 | 61 | Chief Financial Officer | 2017 | ||||||||||||
| Roberto Fusté | 62 | Chief Executive Officer for Asia Pacific | 2016 | |||||||||||||||
| Ronald Kuerbitz | 55 | Chief Executive Officer, Fresenius Medical Care North America | 2015 | |||||||||||||||
| William Valle | 56 | Chief Executive Officer for North America | 2020 | |||||||||||||||
| Dr. Olaf Schermeier | 42 | Chief Officer of Global Research & Development | 2017 | 44 | Chief Officer of Global Research & Development | 2021 | ||||||||||||
| Kent Wanzek | 55 | Head of Global Manufacturing Operations | 2017 | 57 | Head of Global Manufacturing Operations | 2017 | ||||||||||||
| Dominik Wehner | 46 | Chief Executive Officer for Europe, Middle East and Africa | 2017 | 48 | Chief Executive Officer for Europe, Middle East and Africa | 2022 | ||||||||||||
| Harry de Wit | 54 | Chief Executive Officer for the Asia-Pacific | 2018 | |||||||||||||||
RICE POWELL has been with the Company since 1997. He became Chairman and Chief Executive Officer of the Management Board of Management AG effective January 1, 2013. HeMr. Powell is also a member of the Board of Administration of Vifor Fresenius Medical Care Renal Pharma, Ltd., Switzerland. HeMr. Powell was the Chief Executive Officer and director of Fresenius Medical Care North America until December 31, 2012. Mr. Powell has over 30 years of experience in the healthcare industry, which includes various positions with Baxter International Inc., Biogen Inc., and Ergo Sciences Inc.
MICHAEL BROSNAN has been with the Company since 1998. HeMr. Brosnan is a member of the Management Board and Chief Financial Officer of Management AG. HeMr. Brosnan is also a member of the Board of Administration of Vifor Fresenius Medical Care Renal Pharma, Ltd., Switzerland. HeMr. Brosnan was a member of the Board of Directors of Fresenius Medical Care North America. Prior to joining Fresenius Medical Care, Mr. Brosnan held senior financial positions at Polaroid Corporation and was an audit partner at KPMG.
ROBERTO FUSTÉ has been with the Company since 1991 and his present positions include member of the Management Board of Management AG andWILLIAM VALLE was appointed Chief Executive Officer for Asia Pacific. Additionally, he founded the company Nephrocontrol S.A. in 1983. In 1991, Nephrocontrol was acquired by the Fresenius Group, where Mr. Fusté has since worked. Mr. Fusté has also held several senior positions within the Company in EuropeFMCNA effective January 2017 and the Asia Pacific region.
RONALD KUERBITZ has been with the Company since 1997. He became a member of the Management Board of Management AG on February 17, 2017. Prior to that, Mr. William Valle was executive vice president responsible for the dialysis service business and Chief Executive Officervascular access business of Fresenius Medical Care North America on January 1, 2013.FMCNA from 2014 to 2017. Mr. Kuerbitz is a member of the board of directors for Fresenius Medical Care Holdings, Inc.Valle joined FMCNA in 2009 and member of the board of directors for Specialty Care Services Group, LLC. Mr. Kuerbitz has more than 20nearly 30 years of experience in the health care field, having helddialysis industry, holding executive positions in law, compliance,sales, marketing and business development government affairs and operations.at several dialysis companies including Gambro Healthcare, Inc.
DR OLAF SCHERMEIER was appointed Chief Executive Officer for Global Research and Development on March 1, 2013. Previously, heDr. Schermeier served on the supervisory board of Fiagon AG from December 21, 2015 until October 6, 2016. Prior to FMC-AG & Co. KGaA, Dr. Schermeier served as President of Global Research and Development for Draeger Medical, Lübeck, Germany. Dr. Schermeier has many years of experience in various areas of the health care industry, among others at Charite-clinic and Biotronik, Germany.
KENT WANZEK has been with the Company since 2003. HeMr. Wanzek is a member of the Management Board of Management AG with responsibility for Global Manufacturing Operationsand Quality and prior to joining the Management Board was in charge of North American Operations for the Renal Therapies Group at Fresenius Medical Care North America since 2004. Additionally, Mr. Wanzek held several senior executive positions with companies in the healthcare industry, including Philips Medical Systems, Perkin-Elmer, Inc. and Baxter Healthcare Corporation.
DOMINIK WEHNER was appointed Chief Executive Officer for Europe, Middle East and Aftica ("EMEA")the EMEA Segment on April 1, 2014. HeMr. Wehner began his career at Fresenius Medical Care in 1994 as Junior Sales Manager and served recently as Executive Vice President responsible for the regions Eastern Europe, Middle East and Africa as well as Renal Pharma EMEALA and People, Organizational Change and ImplemetntationImplementation EMEALA. HeMr. Wehner also serves on the Vifor Fresenius Medical Care Renal Pharma Ltd. Board of Directors.
HARRY DE WIT assumed the role of Chief Executive Officer for the Asia-Pacific Segment on April 1, 2016. Mr. de Wit has worked in the medical device industry for 25 years. Mr. de Wit holds a master's degree in Medicine from the VU University of Amsterdam in the Netherlands and a bachelor's of Science in Physiotherapy from the School of Physiotherapy of Den Bosch in the Netherlands.
The business address of all members of our Management Board and Supervisory Board is Else-Kröner-Strasse 1, 61352 Bad Homburg, Germany.
The Supervisory Board of FMC-AG & Co. KGaA
TheOur Supervisory Board of FMC-AG & Co. KGaA consists of six members who are elected by the shareholders of FMC-AG & Co. KGaA in a general meeting. The most recent Supervisory Board elections occurred in May of 2011.2016. The next elections will take place during 2021. Fresenius SE, as the sole shareholder of Management AG, the general partner, is barred from voting for election of the Supervisory Board, of FMC-AG & Co. KGaA, but it nevertheless has and will retain significant influence over the membership of the FMC-AG & Co. KGaA Supervisory Board in the foreseeable future. See Item 16.G, below, "Governance – The Legal Structure of FMC-AG & Co. KGaA."
The current Supervisory Board of FMC-AG & Co. KGaA consists of six persons, fivefour of whom – Messrs. Krick (Chairman), Schenk (Vice-Chairman), Classon, Johnston, and WeismanJohnston – are also members of the supervisory board of our General Partner. For information regarding those members of the Supervisory Board of FMC-AG & Co. KGaA,supervisory board, see "The General Partner's Supervisory Board," above. The sixth member of the Supervisory Board of FMC-AG & Co. KGaA is Prof. Dr. Bernd Fahrholz. Information regarding his age, term of office and business experience is as follows:
PROF. DR. BERND FAHRHOLZ, age 67 was a member of the Supervisory Board of Management AG from April 2005 until August 2006 and was a member of the Supervisory Board of FMC-AG from 1998 until the transformation of legal form to KGaA andDEBORAH DOYLE McWHINNEY, 61, has been a member of the Supervisory Board since May 12, 2016. Ms. McWhinney is a non-executive director of FMC-AG & Co. KGaA sinceLloyds Banking Group, IAS Markit, and Fluor, Inc. She is also a trustee for the transformation. HeInstitute of Defense Analyses and the California Institute of Technology. Ms. McWhinney is Vice Chairmanthe former Chief Executive Officer and Chief Operating Officer of ourCiti Enterprise Payments. Ms: McWhinney also held various executive positions in the financial services and media industries. She is a member of the Audit and Corporate Governance Committee.Committee of FMC AG & Co. KGaA.
PASCALE WITZ, 50, has been a member of the Supervisory Board since May 12, 2016. Ms. Witz was the Executive Vice President of Global Diabetes and Cardiovascular of Sanofi S.A. as well as on Sanofi's executive committee (equivalent to management board), prior to which she held other executive positions in Sanofi S.A. and with GE Healthcare and Becton Dickinson. Ms. Witz serves on the board of Savencia S.A. since April 20, 2016.
The terms of office of the aforesaid members of the Supervisory Board of FMC-AG & Co. KGaA will expire at the end of the general meeting of shareholders of FMC-AG & Co. KGaA, in which the shareholders discharge the Supervisory Board held during the fourth fiscal year following the year in which they were elected, but not counting the fiscal year in which such member's term begins. The most recent election of members of the Supervisory Board took place in May 2016. Fresenius SE, as sole shareholder of our general partner, does not participate in the vote on discharge of the Supervisory Board. MembersBefore the expiration of their term, members of the FMC-AG & Co. KGaA Supervisory Board may be removed only by a resolution of the shareholders of FMC-AG & Co. KGaA with a majority of three quarters of the votes cast at such general meeting. Fresenius SE is barred from voting on such resolutions. The Supervisory Board of FMC-AG & Co. KGaA ordinarily acts by simple majority vote and the Chairman has a tie-breaking vote in case of any deadlock.
The principal function of the Supervisory Board of FMC-AG & Co. KGaA is to oversee the management of the Company but, in this function, the supervisory board of a partnership limited by shares has less power and scope for influence than the supervisory board of a stock corporation. The Supervisory Board of FMC-AG & Co. KGaA is not entitled to appoint the General Partner or its executive bodies, nor may it subject the general partner's management measures to its consent or issue rules of procedure for the general partner. Only the supervisory board of Management AG, elected solely by Fresenius SE, has the authority to appoint or remove members of the General Partner's Management Board. See Item 16.G, below, "Governance – The Legal Structure of FMC-AG & Co. KGaA." Among other matters, the Supervisory Board of FMC-AG & Co. KGaA will, together with the general partner, fix the agenda for the AGM and make recommendations with respect to approval of the Company's financial statements and dividend proposals. The Supervisory Board of FMC-AG & Co. KGaA will also propose nominees for election as members of its Supervisory Board. The Audit and Corporate Governance Committee also recommends to the Supervisory Board a candidate as the Company's auditors to audit our German statutory financial statements to be proposed by the Supervisory Board to our shareholders for approval and, as required by the SEC and NYSE audit committee rules, retains the services of our independent auditors to audit our U.S. GAAP financial statements.
B. Compensation
Report of the Management Board of Management AG, our General Partner
The compensation report of FMC-AG & Co. KGaA summarizes the main elements of the compensation system for the members of the Management Board of Fresenius Medical Care Management AG, the general partnerGeneral Partner of FMC-AG & Co. KGaA, and in this regard notably explains the amounts and structure of the compensation paid to the Management Board. Furthermore, the principles and the amount of the remuneration of the Supervisory Boardsupervisory board of Fresenius Medical Care Management AG are described. The compensation reportCompensation Report is part of the management report ofManagement Report on the annual financial statements and the annual consolidated group financial statements of FMC-AG & Co. KGaA as of December 31, 2014.2016. The compensation reportCompensation Report is prepared on the basis of the recommendations of the German Corporate Governance Code and also includes the disclosures as required pursuant to the applicable statutory regulations, notably in accordance with the German Commercial Code (HGB).
Compensation of the Management Board
The entire Supervisory Boardsupervisory board of Fresenius Medical Care Management AG is responsible for determining the compensation of the Management Board. The Supervisory Boardsupervisory board of Fresenius Medical Care Management AG is assisted in this task by a personnel committee, the Human Resources Committee. InCommittee, a committee which is created from among the fiscal year, thesupervisory board of Fresenius Medical Care Management AG's members. The Human Resources Committee wasis composed of Dr. Ulf M. SchneiderMr. Stephan Sturm (Chairman), Dr. Gerd Krick (Vice Chairman), Mr. William P. Johnston, Dr. Dieter Schenk and Dr. Walter L. Weisman.Mr.Rolf A. Classon.
The current Management Board compensation system was last approved by resolution of the General Meeting of FMC-AG & Co. KGaA on May 12, 2011 with a majority of 99.71% of the votes cast. Furthermore, this compensation system2016, and is reviewed by an independent external compensation expert at the beginning of each fiscal year.
on a regular basis. The objective of the compensation system is to enable the members of the Management Board to participate reasonably in the sustainable development of the Company'sour business and to reward them based on their duties and performance as well as their success in managing the Company'sour economic and financial position giving due regard to the peer environment.
The amount of the total compensation of the members of the Management Board is measured taking particular account of relevant reference valuesa horizontal comparison with the compensation of management board members of other DAX-listed companies and similar companies of comparable size and performance in the relevant industry sector. Furthermore, the relation of the overall compensation of the members of the Management Board and that of the senior management as well as the staff overall, as determined by way of a vertical comparison, is taken into account.
The compensation of the Management Board is, as a whole, performance-based and consisted of three componentselements in the fiscal year:
Table of ContentsI. Fixed compensation
The individual components are designed on the basis of the following criteria:
Management Board members receive a fixed amount as basic compensation. In the fiscal year, the fixed compensation paid in Germany or Hong Kong, as the case may be, was dividedthe fixed compensation is paid in twelve equal instalments andmonthly installments. To the extent the fixed compensation is paid to members of the Management Board in the U.S. was divided, payment is made in accordance with local customs in twenty-four equal instalments, in each case as base salary.instalments.
Moreover, the members of the Management Board received additional benefits consisting mainly of payment for insurance premiums, the private use of company cars and special payments such as rent supplements, school fees, rent and relocation supplements, reimbursement of fees for the preparation of tax returns and reimbursement of certain other charges, and additional contributions to pension and health insurance.insurance as well as tax burden compensation due to varying tax rates applicable in Germany and the U.S. (net compensation) and other benefits, also in case accruals have been set up therefore.
II. Performance-based compensation
Performance-based compensation will also beis awarded for the fiscal year as a short-term cash component (one-year variable compensation) and as components with long-term incentive effects (stock options and share-based(share-based compensations with cash settlement). The share-based compensations with cash settlement consist of phantom stocks andthe so-called "Share Based Award," resulting as a deferral amount from the one-year variable compensation, as well as of performance shares, which are granted in the context of the so-called"Fresenius Medical Care Long-Term Incentive Plan 2016" ("LTIP 2016"). In addition, the supervisory board of Management AG may grant a discretionary bonus for extraordinary performances.
One-year variable compensation and Share Based Award.Award
The amount of the one-year variable compensation and of the Share Based Awardshare based award depends on the achievement of the following individual and common targets:
The level of achievement of these targets is derived from the comparison of target amounts and actual results. Furthermore, targets are divided into Group level targets and those to be achieved in individual regions. Lastly, the various target parameters are weighted differently by their relative share in the aggregate amount of variable compensation depending on the respective (regional and/department of the Management Board or sectoral) areasits functions. In the case of responsibility assumed byMessrs. Rice Powell and Michael Brosnan (both with corporate group functions) as well as Dr. Olaf Schermeier (Research & Development), the net income growth is weighted with 80%. In the case of Messrs. Roberto Fusté (Management Board member until March 31, 2016), Ronald Kuerbitz, Dominik Wehner and Harry de Wit (Management Board member since April 1, 2016) (Management Board members with regional responsibility) as well as Mr. Kent Wanzek (Global Manufacturing & Quality), the net income growth is weighted with 60%. In the case of the members of the Management Board last named, the valuation of the operating margins contributes another 20%. The target free cash flow as a percentage of the sales revenues is uniformly measured with 20% for all members of the Management Board.
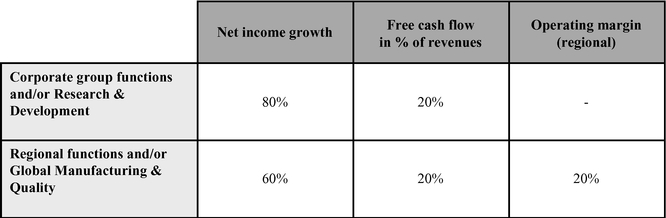
The respective minimum leveldegree of Netthe achievement of the specific targets (target achievement) is determined by comparing the actual values with the target values to be achieved.
The net income growth to be achieved was at least 6% for the fiscal year, with the maximum bonus payable upon achievementis taken into account up to a growth rate of Net income growth of 15%10%. Furthermore, the members of the Management Board wereare also evaluated by reference to the development of free cash flow within the Group or, with respect to members ofas the Management Board with regional responsibilities,case may be, in the relevant regions, respectively, during the fiscal year, with the targets being within a range of rates between 3% and 6% of the respective free cash flow in percent of revenue. For the benefit of Management Board members without Group functions,with regional responsibilities as well as for the benefit of the Management Board member responsible for Global Manufacturing & Quality, growth of regional operating income
margins within the fiscal year wasis compensated within individual targets ranging between 13% and 18.5%, individually reflecting the particularities of the respective Boardregions and responsibilities.
The targets are, as a rule, weighted differently depending on whether the Management Board member exercises Group functions – in the fiscal year, these are Mr. Rice Powell, Mr. Michael Brosnan and Dr. Rainer Runte1 – or whether the Management Board member is responsible for regional earnings – in the fiscal year, these are Mr. Roberto Fusté, Prof. Emanuele Gatti1, Mr. Ronald Kuerbitz and Mr. Dominik Wehner2 – or have taken on specific Management Board responsibilities without Group functions – such as Mr. Kent Wanzek for Global Manufacturing Operations and Dr. Olaf Schermeier for Research & Development. For members of the Management Board with Group functions, Net income growth accounts for 80% and is thus weighted higher than for the other members of the Management Board, where Net income growth accounts for 60%. For members of the Management Board without Group functions, a further 20% is based upon the evaluation of the operating income margin. Achievement of the target for free cash flow in percent of revenue is weighted for all members of the Management Board equally at 20%.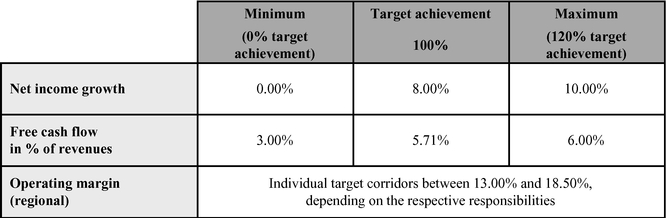
Multiplying the level of the respective overall target achievement by the respective fixed compensation and another fixed multiplier provides aresults in the total amount, of which a 75% share is paid out in cash to the Management Board members (one-yearas a one-year variable compensation)compensation after approval of the annual financial statements of FMC-AG & Co. KGaA for the previousrespective fiscal year. Since the maximum level of target achievement is set at 120%, the Management Board's maximum achievable one-year variable compensation is limited as regards to specific amounts.
| | Amount of Cash Payments | ||||||||||||||||||||||||
|---|---|---|---|---|---|---|---|---|---|---|---|---|---|---|---|---|---|---|---|---|---|---|---|---|---|
| | Non-performance related compensation | Short-term performance related compensation | Cash compensation (without long-term incentive components) | ||||||||||||||||||||||
| | Fixed compensation | Other benefits(1) | Bonus | | | ||||||||||||||||||||
| | 2016 | 2015(2) | 2016 | 2015(2) | 2016 | 2015(2),(3) | 2016 | 2015(2) | |||||||||||||||||
| | (in thousands) | (in thousands) | (in thousands) | (in thousands) | |||||||||||||||||||||
Management board members serving as of December 31, 2016 | |||||||||||||||||||||||||
Rice Powell | $ | 1,375 | $ | 1,375 | $ | 133 | $ | 379 | $ | 2,659 | $ | 1,145 | $ | 4,167 | $ | 2,899 | |||||||||
Michael Brosnan | 770 | 770 | 215 | 592 | 1,439 | 645 | 2,424 | 2,007 | |||||||||||||||||
Ronald Kuerbitz | 935 | 935 | 21 | 31 | 1,634 | 870 | 2,590 | 1,836 | |||||||||||||||||
Dr. Olaf Schermeier | 498 | 499 | 92 | 704 | (4) | 986 | 423 | 1,576 | 1,626 | ||||||||||||||||
Kent Wanzek | 597 | 597 | 124 | 124 | 1,167 | 659 | 1,888 | 1,380 | |||||||||||||||||
Dominik Wehner | 450 | 388 | 41 | 41 | 890 | 438 | 1,381 | 867 | |||||||||||||||||
Harry de Wit(5) | 398 | — | 235 | — | 789 | — | 1,422 | — | |||||||||||||||||
Former member of the management board who resigned March 31, 2016 | |||||||||||||||||||||||||
Roberto Fusté(6) | 161 | 644 | 80 | 535 | (7) | — | 720 | 241 | 1,899 | ||||||||||||||||
| | | | | | | | | | | | | | | | | | | | | | | | | | |
Total | $ | 5,184 | $ | 5,208 | $ | 941 | $ | 2,406 | $ | 9,564 | $ | 4,900 | $ | 15,689 | $ | 12,514 | |||||||||
| | | | | | | | | | | | | | | | | | | | | | | | | | |
| | | | | | | | | | | | | | | | | | | | | | | | | | |
| | | | | | | | | | | | | | | | | | | | | | | | | | |
The remaining share, amounting to 25% of the total amount calculated according to the key data above, is granted to the members of the Management Board in the form of the so-called Share Based Award, which is included in the compensation components with long-term incentive effects. The Share Based Award is subject to a three-year waiting period, although a shorter period may apply in special cases (e.g. professional incapacity, entry into retirement, our non-renewal by the Company of expired service agreements). The amount of the cash payment of the Share Based Award is based on the share price of FMC-AG & Co. KGaA shares upon exercise after the three-year waiting period.
In determiningaccordance with the variable compensation, it is ensured that performance-based components with long-term incentive effects (i.e.targets achieved in the Share Based Award as well asfiscal year, the stock option and phantom stock components described below) are granted in amounts which constitute at least 50%members of the sum of all one- and multi-year variable components for the respective fiscal year. Should this turn out not to be the case mathematically, the Management Board members' contracts provide thatwho were members of the portionManagement Board on December 31 of variable compensation payablethe fiscal year acquired entitlements to Share Based Awards valued at $3.632 million (2015: $891,000). Based on the already fixed value, the allocation of the specific number of virtual shares made by the supervisory board of Fresenius Medical Care Management AG takes place no sooner than March of the following year on the basis of the then current price conditions of the shares of FMC-AG & Co. KGaA. This number will then serve as one-year variable compensation shall be reduceda multiplier for the share price on the relevant exercise date and, the portion payablethus, as the Share Based Award correspondingly increased, in order to meet this requirement.basis for the determination of the payment of the relevant stock-based compensation after the end of the three-year waiting period.
The components with long-term incentive effects also contain a limitation possibilitylimit option for casesthe case of extraordinary developments.
Performance Shares
In addition to the Share Based Award, the members of the Management Board were also granted so-called "Performance Shares" on the basis of the LTIP 2016, as further performance-related components with a long-term incentive effect in the fiscal year. The Supervisory Board may also grant a discretionary bonus for extraordinary performance. ForLTIP 2016 was approved in the fiscal year by the Supervisory Board has granted such discretionary bonus to Mr. Rice Powell, Mr. Michael Brosnansupervisory board of Fresenius Medical Care Management AG upon recommendation of the Human Resources Committee and Mr. Ronald Kuerbitz inreplaces the total amountLTIP 2011. As of $1 million.
For the fiscal year andend of the previous year no further stock options may be granted under the LTIP 2011. Performance shares are virtual remuneration instruments not backed by equity. These may provide entitlement to a cash payment depending on the achievement of the performance targets described below and the development of our share price. The LTIP 2016 stipulates that the Management Board members will be granted Performance Shares once or twice a year in the years 2016 to 2018. For the members of the Management Board, the supervisory board of Fresenius Medical Care Management AG determines, after due consideration and taking into account the responsibilities and performances of the respective members of the Management Board, the so-called "grant value", as the initial amount of cash compensation paymentsfor each grant to be made to members of the Management Board without components with long-term incentive effects consistedBoard. This grant value is divided by the applicable fair value of a Performance Share at the following:
| | Amount of Cash Payments | ||||||||||||||||||||||||
|---|---|---|---|---|---|---|---|---|---|---|---|---|---|---|---|---|---|---|---|---|---|---|---|---|---|
| | Non-Performance Related Compensation | Short-term Performance Related Compensation | Cash Compensation (without long-term Incentive Components) | ||||||||||||||||||||||
| | Fixed Compensation | Other Benefits(1) | Bonus(2) | | | ||||||||||||||||||||
| | 2014 | 2013 | 2014 | 2013 | 2014 | 2013 | 2014 | 2013 | |||||||||||||||||
| | (in thousands) | (in thousands) | (in thousands) | (in thousands) | |||||||||||||||||||||
Managing board members serving as of December 31, 2014 | |||||||||||||||||||||||||
Rice Powell | $ | 1,250 | $ | 1,250 | $ | 201 | $ | 224 | $ | 980 | (2) | $ | 495 | $ | 2,431 | $ | 1,969 | ||||||||
Michael Brosnan | 725 | 725 | 196 | 193 | 528 | (2) | 287 | 1,449 | 1,205 | ||||||||||||||||
Roberto Fusté | 731 | 730 | 3,946 | (3) | 400 | 450 | 370 | 5,127 | 1,500 | ||||||||||||||||
Ronald Kuerbitz | 850 | 850 | 25 | 35 | 669 | (2) | 668 | 1,544 | 1,553 | ||||||||||||||||
Dr. Olaf Schermeier | 531 | 442 | 310 | 92 | 204 | 175 | 1,045 | 709 | |||||||||||||||||
Kent Wanzek | 540 | 521 | 98 | 70 | 391 | 403 | 1,029 | 994 | |||||||||||||||||
Dominik Wehner | 349 | — | 26 | — | 276 | — | 651 | — | |||||||||||||||||
Former members of the management board who resigned March 31, 2014 | |||||||||||||||||||||||||
Prof. Emanuele Gatti(4) | 249 | 973 | 39 | 165 | — | 702 | 288 | 1,840 | |||||||||||||||||
Dr. Rainer Runte(5) | 146 | 584 | 13 | 58 | — | 231 | 159 | 873 | |||||||||||||||||
| | | | | | | | | | | | | | | | | | | | | | | | | | |
Total | $ | 5,371 | $ | 6,075 | $ | 4,854 | $ | 1,237 | $ | 3,498 | $ | 3,331 | $ | 13,723 | $ | 10,643 | |||||||||
| | | | | | | | | | | | | | | | | | | | | | | | | | |
| | | | | | | | | | | | | | | | | | | | | | | | | | |
| | | | | | | | | | | | | | | | | | | | | | | | | | |
The degree of $438, other benefits in the amounttotal target achievement during the three-year performance period is determined on the basis of $41the three performance targets (i) revenue growth, (ii) annual growth of the net income attributable to the shareholders of FMC-AG & Co. KGaA ("net income growth") as well as a short-term performance related compensation(iii) increase
of the return on invested capital (Return on Invested Capital "ROIC" improvement). The target corridors and targets are as set out in the amounttable below:
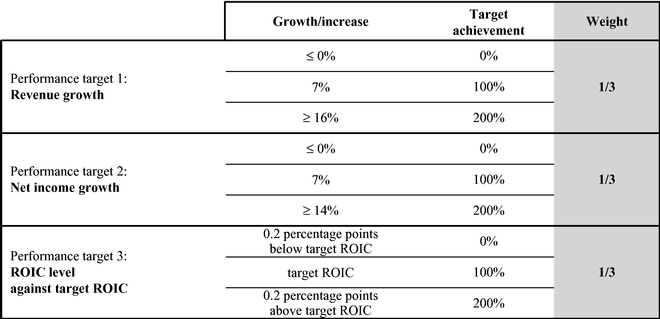
The ROIC target for the year 2016 is set at 7.3% and increases by 0.2 percentage points each year, that is, to 7.5% (2017), 7.7% (2018), 7.9% (2019) and 8,1% (2020). For each revenue growth and/or any net income growth and ROIC level within the range of $299,the values presented above, the degree of target achievement is linearly interpolated. If the target achievement in relation to the ROIC-target in the third year of an assessment period is higher than or equal to the target achievement in each of the two previous years, the ROIC target achievement for the third year applies to all years of the respective assessment period.
Each of these three performance targets accounts for one-third in the calculation of the yearly target achievement, which is calculated for each year of the three-year performance period. The overall target achievement at the end of the three-year performance period is determined by the mean of these three average yearly target achievements. The overall target achievement can lie in a corridor between 0% and 200%.
The number of Performance Shares granted to the Management Board members at the beginning of the performance period is multiplied by the overall target achievement in order to determine the final number of Performance Shares that form the basis of the cash compensations under the LTIP 2016 as described above.
In the course of the fiscal year, 642,349 Performance Shares were granted under the LTIP 2016. This includes 79,888 Performance Shares with a total value of $6.774 million, which were however, only allocatedgranted to Dr. Runte after his retirement fromthe members of the Management Board.
In additionFor the fiscal year, the value of the share-based compensations with cash settlement issued to the Share Based Award, stock options under the Company's Stock Option Plan 2011 and phantom stock awards under the Phantom Stock Plan 2011 were granted to members of the Management Board in each case, is shown respectively compared to the previous year, in the following table.
| | Components with Long-term Incentive Effect | ||||||||||||||||||||||||
|---|---|---|---|---|---|---|---|---|---|---|---|---|---|---|---|---|---|---|---|---|---|---|---|---|---|
| | Stock Options | Share-based compensation with cash settlement | Total | ||||||||||||||||||||||
| | 2016 | 2015 | 2016 | 2015 | 2016(1) | 2015(2),(3) | 2016 | 2015 | |||||||||||||||||
| | Number | (in thousands) | (in thousands) | (in thousands) | |||||||||||||||||||||
Management board members serving as of December 31, 2016 | |||||||||||||||||||||||||
Rice Powell | — | 149,400 | $ | — | $ | 2,481 | $ | 2,659 | $ | 1,041 | $ | 2,659 | $ | 3,522 | |||||||||||
Michael Brosnan | — | 74,700 | — | 1,241 | 1,439 | 531 | 1,439 | 1,772 | |||||||||||||||||
Ronald Kuerbitz | — | 49,800 | — | 827 | 1,634 | 982 | 1,634 | 1,809 | |||||||||||||||||
Dr. Olaf Schermeier | — | 49,800 | — | 827 | 1,179 | 925 | 1,179 | 1,752 | |||||||||||||||||
Kent Wanzek | — | 69,720 | — | 1,158 | 1,233 | 660 | 1,233 | 1,818 | |||||||||||||||||
Dominik Wehner | — | 49,800 | — | 827 | 1,147 | 962 | 1,147 | 1,789 | |||||||||||||||||
Harry de Wit | — | — | — | — | 1,114 | — | 1,114 | — | |||||||||||||||||
Former member of the management board who resigned March 31, 2016 | |||||||||||||||||||||||||
Roberto Fusté(4) | — | 59,760 | — | 993 | — | 857 | — | 1,850 | |||||||||||||||||
| | | | | | | | | | | | | | | | | | | | | | | | | | |
Total | — | 502,980 | $ | — | $ | 8,354 | $ | 10,405 | $ | 5,958 | $ | 10,405 | $ | 14,312 | |||||||||||
| | | | | | | | | | | | | | | | | | | | | | | | | | |
| | | | | | | | | | | | | | | | | | | | | | | | | | |
| | | | | | | | | | | | | | | | | | | | | | | | | | |
The components with long-term incentive effect entitle to a cash payment or can be exercised only after the expiration of predefined waiting- and/or vesting periods. Their value is distributed over the waiting periods and is proportionally accounted for as an expense in the respective fiscal year.
The expenses pertaining to components with long-term incentive effects for the fiscal year and for the previous year, in which the stock options and phantom stock illustrated below were issued, are set out in the following table:
| | Expenses for Long-term Incentive Components | ||||||||||||||||||
|---|---|---|---|---|---|---|---|---|---|---|---|---|---|---|---|---|---|---|---|
| | Stock Options | Share-based compensation with cash settlement | Share-based compensation | ||||||||||||||||
| | 2016 | 2015 | 2016 | 2015 | 2016 | 2015 | |||||||||||||
| | (in thousands) | (in thousands) | (in thousands) | ||||||||||||||||
Management board members serving as of December 31, 2016 | |||||||||||||||||||
Rice Powell | $ | 657 | $ | 418 | $ | 739 | $ | 776 | $ | 1,396 | $ | 1,194 | |||||||
Michael Brosnan | 670 | 207 | 803 | 499 | 1,473 | 706 | |||||||||||||
Ronald Kuerbitz | 211 | 170 | 547 | 290 | 758 | 460 | |||||||||||||
Dr. Olaf Schermeier | 211 | 170 | 444 | 196 | 655 | 366 | |||||||||||||
Kent Wanzek | 319 | 168 | 440 | 549 | 759 | 717 | |||||||||||||
Dominik Wehner | 188 | 180 | 416 | 168 | 604 | 348 | |||||||||||||
Harry de Wit | — | — | 136 | — | 136 | — | |||||||||||||
Former member of the management board who resigned March 31, 2016 | |||||||||||||||||||
Roberto Fusté(1) | 982 | 150 | 1,122 | 523 | 2,104 | 673 | |||||||||||||
| | | | | | | | | | | | | | | | | | | | |
Total | $ | 3,238 | $ | 1,463 | $ | 4,647 | $ | 3,001 | $ | 7,885 | $ | 4,464 | |||||||
| | | | | | | | | | | | | | | | | | | | |
| | | | | | | | | | | | | | | | | | | | |
| | | | | | | | | | | | | | | | | | | | |
Focus on sustainable corporate development
To the extent the portion of the performance-based components with long-term incentive effects (i.e. Performance Shares and Share Based Award) does not reach 50% of the sum of all variable compensation components for the respective fiscal year, it has been contractually provided that the one-year variable compensation shall be reduced accordingly. The Share Based Award is increased correspondingly. This shall ensure that the compensation structure is always oriented towards a sustainable corporate development.
Stock Option Plan 2011, together withoptions and phantom stock
Until the Phantom Stock Plan 2011, formsend of the fiscal year 2015, grants under the Long Term Incentive Program 2011 (LTIP 2011).
In addition to the Members("LTIP 2011"), which consisted of the management boards2011 Stock Option Plan and the 2011 Phantom Stock Plan, constituted an essential component of affiliated companies, managerial staffthe compensation system for the members of the Company andManagement Board. As of certain affiliated companiesthe end of the fiscal year 2015 grants under the LTIP 2011 are no longer possible. However, the members of the Management Board are entitledmay exercise stock options or phantom stock, which have already been granted, taking into consideration the blackout periods applicable to participatethe exercise of such instruments, the achievement of defined performance targets as well as, subject to deviating stipulations in LTIP 2011.the individual case, the continuation of the service- and/or employment relationship.
Under the LTIP 2011 a combination of stock options and phantom stock awards arewas granted to the participants. Stock options and phantom stock awards will be granted on specified grant days, no more than twice each fiscal year during the term of the LTIP 2011. The number of stock options and phantom stock awards to be granted to the members of the Management Board iswas determined by the Supervisory Boardsupervisory board of Fresenius Medical Care Management AG in its reasonable discretion. In principle all members of the Management Board arewere entitled to receive the same number of stock options and phantom stock awards, whereas the Chairman of the Management Board is entitled to receive double the granted quantity. At the time of the grant, the members of the Management Board canwere entitled to choose a ratio based on the value of the stock options vs. the value of phantom stock awards in a range between 75:25 and 50:50. The exercise of stock options and phantom stock awards is subject to several conditions, including the expiration of a four year waiting period, the consideration of black-out periods, the achievement of a defined success target and, subject to agreements to the contrary in individual cases, the existence of a service or employment relationship.
Stock options may be exercised within four years and phantom stock awards within one year after the expiration of the waiting period. For Management Board members who are U.S. taxpayers specific conditions apply with respect to the exercise period of phantom stock awards.
The success target for the members of the Management Boardstock options and phantom stock is achieved in each case if, during the waiting period, either the adjusted basic income per share increases by at least eight per cent8% per annum in comparison to the previous year in each case or – if this is not the case – the compounded annual growth rate of the adjusted basic income per share during the four years of the waiting period reflects an increase of at least eight8% per cent per annum. Deviating from this, the success target for phantom stock granted in the fiscal year 2015 is also achieved if under the global efficiency program an amount of $200 million has been saved until the end of the fiscal year and, until the end of the fiscal years 2016 to 2018, an amount of $300 million is saved, each in comparison to January 1, 2013, and also the respective group target for fiscal years 2015 to 2018 – each as expected and communicated – have been achieved and confirmed by the auditor. If with regard to any reference year or more than one of the four reference years within the waiting period neither the adjusted basic income per share increases by at least eight per cent8% per annum in comparison to the previous year nor the compounded annual growth rate of the adjusted basic income per share during the four years of the waiting period reflects an increase of at least eight per cent8% per annum, the stock options and phantom stock awards subject to such waiting period are cancelled to such proportion to which the success target was not achieved within the waiting period, i.e. in the proportion of 25% for each year in which the target is not achieved within the waiting period, up to 100%.
Additional information regarding the basic principles; this principle of the LTIP 2011 and of the other employee participation programs in place at the beginning of the fiscal year and secured by conditional capital, which entitled their participants to convertible bonds or stock options (from which, however, in the past fiscal year no further options could be issued), are described in more detail in Note 17, "Stock Options," in the Notesproportional cancelation also applies to the Consolidated Financial Statements included in this report, in Item 6.E below, "Directors, Senioradditional success target for phantom stock as resolved by the supervisory board of Fresenius Medical Care Management and Employees – Share Ownership – Options to Purchase Our Securities" and in Item 10.B below, "Additional Information – Articles of Association – General Information Regarding Our Share Capital – Conditional Capital."
Under Stock Option Plan 2011AG in the fiscal year 1,677,360 stock options were granted in total (2013: 2,141,076), with 273,900 stock options (2013: 328,680) granted to the Management Board members. Moreover, in the fiscal year 299,547 (2013: 186,392) phantom stock awards were granted under the Phantom Stock Plan 2011, of which 24,950 awards (2013: 25,006) were granted to Management Board members.
For the fiscal year, the number and value of stock options issued to members of the Management Board and the value of the share-based compensations with cash settlement paid to them, each as compared to the previous year, are shown individually in the following table:
| | Components with Long-term Incentive Effect | ||||||||||||||||||||||||
|---|---|---|---|---|---|---|---|---|---|---|---|---|---|---|---|---|---|---|---|---|---|---|---|---|---|
| | Stock Options | Share-based Compensation with Cash Settlement(1) | Total | ||||||||||||||||||||||
| | 2014 | 2013 | 2014 | 2013 | 2014 | 2013 | 2014 | 2013 | |||||||||||||||||
| | Number | (in thousands) | (in thousands) | (in thousands) | |||||||||||||||||||||
Managing board members serving as of December 31, 2014 | |||||||||||||||||||||||||
Rice Powell | 74,700 | 74,700 | $ | 904 | $ | 884 | $ | 470 | $ | 476 | $ | 1,374 | $ | 1,360 | |||||||||||
Michael Brosnan | 37,350 | 37,350 | 452 | 442 | 248 | 251 | 700 | 693 | |||||||||||||||||
Roberto Fusté | 24,900 | 37,350 | 301 | 442 | 460 | 278 | 761 | 720 | |||||||||||||||||
Ronald Kuerbitz | 37,350 | 37,350 | 452 | 442 | 295 | 378 | 747 | 820 | |||||||||||||||||
Dr. Olaf Schermeier | 37,350 | 37,350 | 452 | 442 | 223 | 214 | 675 | 656 | |||||||||||||||||
Kent Wanzek | 24,900 | 37,350 | 301 | 442 | 440 | 290 | 741 | 732 | |||||||||||||||||
Dominik Wehner | 37,350 | — | 452 | — | 247 | — | 699 | — | |||||||||||||||||
Former members of the management board who resigned March 31, 2014 | |||||||||||||||||||||||||
Prof. Emanuele Gatti(2) | — | 29,880 | — | 354 | — | 482 | — | 836 | |||||||||||||||||
Dr. Rainer Runte(3) | — | 37,350 | — | 442 | — | 232 | — | 674 | |||||||||||||||||
| | | | | | | | | | | | | | | | | | | | | | | | | | |
Total | 273,900 | 328,680 | $ | 3,314 | $ | 3,890 | $ | 2,383 | $ | 2,601 | $ | 5,697 | $ | 6,491 | |||||||||||
| | | | | | | | | | | | | | | | | | | | | | | | | | |
| | | | | | | | | | | | | | | | | | | | | | | | | | |
| | | | | | | | | | | | | | | | | | | | | | | | | | |
The stated values of the stock options granted to the members of the Management Board in the fiscal year correspond to their fair value at the time of grant, namely a value of $12.10 (€9.01) (2013: $11.84/€8.92) per stock option. The exercise price for the stock options granted is $67.07 (€49.93) (2013: $66.03/€49.76). At the day of the grant, the relevant fair value of the phantom stocks issued in July of the fiscal year amounted to $62.14 (€46.26) (in July 2013: $59.62/€44.93).2015.
At the end of the fiscal year the members of the Management Board held a total of 1,485,0761,010,784 stock options and convertible bonds (collectively referred(2015: 1,565,195) originating from previous compensation programs with long-term incentive effects secured by conditional capital, which entitled their participants to as "stock options"; 2013: 1,993,305 stock options). Also, theyoptions. Moreover, the Management Board members held, by the end of the fiscal year, a total of 66,96081,019 phantom stocks (2013: 77,886).
Table of Contentsstock (2015: 118,703) pursuant to the Phantom Stock Plan 2011.
The development and status of stock options of the members of the Management Board serving as perat December 31 of the fiscal year in the fiscal year are shown in more detail in the following table:
| | Development and status of the stock options | Development and Status of the Stock Options | ||||||||||||||||||||||||||||||||||||||||||||||||
|---|---|---|---|---|---|---|---|---|---|---|---|---|---|---|---|---|---|---|---|---|---|---|---|---|---|---|---|---|---|---|---|---|---|---|---|---|---|---|---|---|---|---|---|---|---|---|---|---|---|---|
| | Rice Powell | Michael Brosnan | Roberto Fusté | Ronald Kuerbitz | Dr. Olaf Schermeier | Kent Wanzek | Dominik Wehner | Total | Rice Powell | Michael Brosnan | Ronald Kuerbitz | Dr. Olaf Schermeier | Kent Wanzek | Dominik Wehner | Harry de Wit | Total | ||||||||||||||||||||||||||||||||||
Options outstanding at January 1, 2014 | ||||||||||||||||||||||||||||||||||||||||||||||||||
Number | 361,050 | 330,984 | 346,719 | 221,352 | 37,350 | 197,850 | 65,529 | 1,560,834 | ||||||||||||||||||||||||||||||||||||||||||
Weighted average exercise price in $ | 55.20 | 47.85 | 48.50 | 53.34 | 60.41 | 57.06 | 52.26 | 52.13 | ||||||||||||||||||||||||||||||||||||||||||
Options granted during the fiscal year | ||||||||||||||||||||||||||||||||||||||||||||||||||
Options outstanding at January 1, 2016 | ||||||||||||||||||||||||||||||||||||||||||||||||||
Number | 74,700 | 37,350 | 24,900 | 37,350 | 37,350 | 24,900 | 37,350 | 273,900 | 465,318 | 260,212 | 157,002 | 124,500 | 209,782 | 123,759 | — | 1,340,573 | ||||||||||||||||||||||||||||||||||
Weighted average exercise price in $ | 60.62 | 60.62 | 60.62 | 60.62 | 60.62 | 60.62 | 60.62 | 60.62 | 58.90 | 57.40 | 61.78 | 63.99 | 60.85 | 62.50 | — | 60.06 | ||||||||||||||||||||||||||||||||||
Options exercised during the fiscal year | ||||||||||||||||||||||||||||||||||||||||||||||||||
Number | — | 58,641 | 85,269 | 66,000 | — | 36,000 | — | 245,910 | 64,500 | 33,000 | — | — | 49,800 | 7,350 | — | 154,650 | ||||||||||||||||||||||||||||||||||
Weighted average exercise price in $ | — | 33.92 | 34.28 | 42.13 | — | 40.95 | — | 37.28 | 36.27 | 33.70 | — | — | 44.99 | 33.70 | — | 38.41 | ||||||||||||||||||||||||||||||||||
Weighted average share price in $ | — | 57.29 | 60.85 | 62.52 | — | 66.52 | — | 61.28 | 76.94 | 81.81 | — | — | 87.31 | 78.97 | — | 81.41 | ||||||||||||||||||||||||||||||||||
Options forfeited during the fiscal year | ||||||||||||||||||||||||||||||||||||||||||||||||||
Number | 28,013 | 18,675 | 18,675 | 15,000 | — | 18,675 | 4,710 | 103,748 | 56,025 | 28,012 | 28,012 | 28,012 | 28,013 | 7,065 | — | 175,139 | ||||||||||||||||||||||||||||||||||
Weighted average exercise price in $ | 63.72 | 63.72 | 63.72 | 63.72 | — | 63.72 | 63.72 | 63.72 | 52.45 | 52.45 | 52.45 | 52.45 | 52.45 | 52.45 | — | 52.45 | ||||||||||||||||||||||||||||||||||
Options outstanding at December 31, 2014 | ||||||||||||||||||||||||||||||||||||||||||||||||||
Options outstanding at December 31, 2016 | ||||||||||||||||||||||||||||||||||||||||||||||||||
Number | 407,737 | 291,018 | 267,675 | 177,702 | 74,700 | 168,075 | 98,169 | 1,485,076 | 344,793 | 199,200 | 128,990 | 96,488 | 131,969 | 109,344 | — | 1,010,784 | ||||||||||||||||||||||||||||||||||
Weighted average exercise price in $ | 55.61 | 51.28 | 53.10 | 58.16 | 60.52 | 60.30 | 54.89 | 55.34 | 64.19 | 62.02 | 63.80 | 67.34 | 68.62 | 65.09 | — | 64.69 | ||||||||||||||||||||||||||||||||||
Weighted average remaining contractual life in years | 4.41 | 3.61 | 3.60 | 5.04 | 7.08 | 5.09 | 4.89 | 4.43 | 4.76 | 4.27 | 5.03 | 5.99 | 5.46 | 5.27 | — | 4.96 | ||||||||||||||||||||||||||||||||||
Range of exercise price in $ | 38.81 - 69.57 | 29.02 - 69.57 | 38.81 - 69.57 | 38.81 - 69.57 | 60.41 - 60.62 | 51.82 - 69.57 | 29.02 - 69.57 | 29.02 - 69.57 | 44.99 - 81.16 | 44.99 - 81.16 | 44.99 - 81.16 | 52.45 - 81.16 | 52.45 - 81.16 | 44.99 - 81.16 | — | 44.99 - 81.16 | ||||||||||||||||||||||||||||||||||
Options exercisable at December 31, 2014 | ||||||||||||||||||||||||||||||||||||||||||||||||||
Options exercisable at December 31, 2016 | ||||||||||||||||||||||||||||||||||||||||||||||||||
Number | 174,300 | 160,293 | 149,400 | 58,002 | — | 49,800 | 36,189 | 627,984 | 102,018 | 77,812 | 32,502 | — | 28,012 | 19,839 | — | 260,183 | ||||||||||||||||||||||||||||||||||
Weighted average exercise price in $ | 45.61 | 41.26 | 44.57 | 47.78 | — | 51.82 | 42.13 | 44.74 | 49.94 | 49.32 | 53.31 | — | 57.01 | 49.71 | — | 50.92 | ||||||||||||||||||||||||||||||||||
III. Total Compensation
�� Based on the targets achieved in the fiscal year, members of the Management Board serving as per December 31 of the fiscal year also earned entitlements to Share Based Awards totalling $833,000 (2013: $1.110 million). On the basis of that value, determination of the specific number of virtual shares will not be made by the Supervisory Board until March of the following year, based on the then current price of the shares of FMC-AG & Co. KGaA. This number will then serve as a multiplier for the share price on the relevant exercise day and as a base for calculation of the payment of this respective share-based compensation after expiry of the three-year waiting period.
Phantom stocks with a total value of $1.550 million (2013: $1.491 million) were granted to the Management Board members under the Company's Phantom Stock Plan 2011 in July of the fiscal year as further share-based compensation components with cash settlement.
Therefore, theThe amount of the total compensation of the Management Board for the fiscal year and for the previous year is as shown in the following table:
| | Total Compensation | Total Compensation | ||||||||||||||||||||||||||||||||||||
|---|---|---|---|---|---|---|---|---|---|---|---|---|---|---|---|---|---|---|---|---|---|---|---|---|---|---|---|---|---|---|---|---|---|---|---|---|---|---|
| | Cash Compensation (without long-term Incentive components) | Components with long-term Incentive Effect | Total Compensation (including long-term Incentive Components) | Cash compensation (without long-term incentive components) | Components with long-term incentive effect | Total compensation (including long-term incentive components) | ||||||||||||||||||||||||||||||||
| | 2014 | 2013 | 2014 | 2013 | 2014 | 2013 | 2016 | 2015(1) | 2016 | 2015(1) | 2016 | 2015(1) | ||||||||||||||||||||||||||
| | (in thousands) | (in thousands) | (in thousands) | (in thousands) | (in thousands) | (in thousands) | ||||||||||||||||||||||||||||||||
Managing board members serving as of December 31, 2014 | ||||||||||||||||||||||||||||||||||||||
Management board members serving as of December 31, 2016 | ||||||||||||||||||||||||||||||||||||||
Rice Powell | $ | 2,431 | $ | 1,969 | $ | 1,374 | $ | 1,360 | $ | 3,805 | $ | 3,329 | $ | 4,167 | $ | 2,899 | $ | 2,659 | $ | 3,522 | $ | 6,826 | $ | 6,421 | ||||||||||||||
Michael Brosnan | 1,449 | 1,205 | 700 | 693 | 2,149 | 1,898 | 2,424 | 2,007 | 1,439 | 1,772 | 3,863 | 3,779 | ||||||||||||||||||||||||||
Roberto Fusté | 5,127 | 1,500 | 761 | 720 | 5,888 | 2,220 | ||||||||||||||||||||||||||||||||
Ronald Kuerbitz | 1,544 | 1,553 | 747 | 820 | 2,291 | 2,373 | 2,590 | 1,836 | 1,634 | 1,809 | 4,224 | 3,645 | ||||||||||||||||||||||||||
Dr. Olaf Schermeier | 1,045 | 709 | 675 | 656 | 1,720 | 1,365 | 1,576 | 1,626 | 1,179 | 1,752 | 2,755 | 3,378 | ||||||||||||||||||||||||||
Kent Wanzek | 1,029 | 994 | 741 | 732 | 1,770 | 1,726 | 1,888 | 1,380 | 1,233 | 1,818 | 3,121 | 3,198 | ||||||||||||||||||||||||||
Dominik Wehner | 651 | — | 699 | — | 1,350 | — | 1,381 | 867 | 1,147 | 1,789 | 2,528 | 2,656 | ||||||||||||||||||||||||||
Former members of the management board who resigned March 31, 2014 | ||||||||||||||||||||||||||||||||||||||
Prof. Emanuele Gatti(1) | 288 | 1,840 | — | 836 | 288 | 2,676 | ||||||||||||||||||||||||||||||||
Dr. Rainer Runte(2) | 159 | 873 | — | 674 | 159 | 1,547 | ||||||||||||||||||||||||||||||||
Harry de Wit | 1,422 | — | 1,114 | — | 2,536 | — | ||||||||||||||||||||||||||||||||
Former member of the management board who resigned March 31, 2016 | ||||||||||||||||||||||||||||||||||||||
Roberto Fusté(2) | 241 | 1,899 | — | 1,850 | 241 | 3,749 | ||||||||||||||||||||||||||||||||
| | | | | | | | | | | | | | | | | | | | | | | | | | | | | | | | | | | | | | | |
Total | $ | 13,723 | $ | 10,643 | $ | 5,697 | $ | 6,491 | $ | 19,420 | $ | 17,134 | $ | 15,689 | $ | 12,514 | $ | 10,405 | $ | 14,312 | $ | 26,094 | $ | 26,826 | ||||||||||||||
| | | | | | | | | | | | | | | | | | | | | | | | | | | | | | | | | | | | | | | | |
| | | | | | | | | | | | | | | | | | | | | | | | | | | | | | | | | | | | | | | |
Components with long-term incentive effects, i.e. stock options and share-based compensation components with cash settlement, can be exercised only after the expiration of the specified vesting period. Their value is allocated over the vesting period and proportionately recognized as an expense in the respective fiscal year of the vesting period. Compensation expenses attributable to the fiscal year and for the previous year are shown in the following table:
| | Expenses for Long-term Incentive Components | ||||||||||||||||||
|---|---|---|---|---|---|---|---|---|---|---|---|---|---|---|---|---|---|---|---|
| | Stock Options | Share-based Compensation with Cash Settlement | Share-based Compensation | ||||||||||||||||
| | 2014 | 2013 | 2014 | 2013 | 2014 | 2013 | |||||||||||||
| | (in thousands) | (in thousands) | (in thousands) | ||||||||||||||||
Managing board members serving as of December 31, 2014 | |||||||||||||||||||
Rice Powell | $ | 234 | $ | 432 | $ | 579 | $ | 586 | $ | 813 | $ | 1,018 | |||||||
Michael Brosnan | 129 | 272 | 393 | 333 | 522 | 605 | |||||||||||||
Roberto Fusté | 114 | 272 | 343 | 308 | 457 | 580 | |||||||||||||
Ronald Kuerbitz | 79 | 46 | 110 | 17 | 189 | 63 | |||||||||||||
Dr. Olaf Schermeier | 79 | 46 | 59 | 17 | 138 | 63 | |||||||||||||
Kent Wanzek | 114 | 272 | 385 | 287 | 499 | 559 | |||||||||||||
Dominik Wehner | 47 | — | 20 | — | 67 | — | |||||||||||||
Former members of the management board who resigned March 31, 2014 | |||||||||||||||||||
Prof. Emanuele Gatti(1) | 367 | 239 | 1,001 | 495 | 1,368 | 734 | |||||||||||||
Dr. Rainer Runte(2) | 450 | 275 | 543 | 353 | 993 | 628 | |||||||||||||
| | | | | | | | | | | | | | | | | | | | |
Total | $ | 1,613 | $ | 1,854 | $ | 3,433 | $ | 2,396 | $ | 5,046 | $ | 4,250 | |||||||
| | | | | | | | | | | | | | | | | | | | |
| | | | | | | | | | | | | | | | | | | | |
| | | | | | | | | | | | | | | | | | | | |
IV. Commitments to Membersmembers of the Management Board for the Eventevent of the Terminationtermination of their Appointmentappointment
The following pension commitments and other benefits are also part of the compensation system for the members of the Management Board: individual contractual pension commitments for the Management Board members Mr. Rice Powell, Mr. Roberto Fusté, Prof. Emanuele Gatti3,Michael Brosnan, Mr. Ronald Kuerbitz, Dr. Rainer Runte3, Mr. Michael BrosnanOlaf Schermeier and Mr. Kent Wanzek have been entered into by Fresenius Medical Care Management AG. In addition, pension commitments from the participation in employee pension schemes of other Fresenius Medical Care companies exist for individual members of the Management Board. Under all of these commitments, aggregate pension obligations for managing board members serving as of December 31 of the fiscal year of $21.614 million (2013: $25.687 million) exist as of the end of the fiscal year.
Each of the pension commitments by Fresenius Medical Care Management AG provides for a pension and survivor benefit as of the time of conclusively ending active work, at age 65 at the earliest (at age 60 at the earliest with respect to Prof. Emanuele Gatti and at age 63 at the earliest with respect to Dr. Rainer Runte) or upon occurrence of disability or incapacity to work (Berufs-(Berufs- oder Erwerbsunfähigkeit)higkeit), however, calculated by reference to the amount of the recipient's most recent base salary.
The retirement pension will be based on 30% of the last fixed compensation and will increase for each complete year of service by 1.5 percentage points up to a maximum of 45%. Current pensions increase according to legal requirements (Sec. 16 of the German Act to improve company pension plans,"BetrAVG" "BetrAVG"). 30% of the gross amount of any post-retirement income from an activity of the Management Board member is offset against the pension obligation. Any amounts to which the Management Board members or their surviving dependents, respectively, are entitled from other company pension rights of the
Management Board member, even from service agreements with other companies, are also to be set off. If a Management Board member dies, the surviving spouse receives a pension amounting to 60% of the resulting pension claim at that time. Furthermore, the deceased Management Board member's own legitimate children (leibliche(leibliche eheliche Kinder)Kinder) receive an orphan's pension amounting to 20% of the resulting pension claim at that time, until the completion of their education or they reach 25 years of age, at the latest. All orphans' pensions and the spousal pension together reach a maximum of 90% of the Management Board member's pension, however. If a Management Board member leaves the Management
Board of Fresenius Medical Care Management AG before reaching the age of 65, (or, in the case of Prof. Gatti, the age of 60 and, in the case of Dr. Runte, the age of 63), except in the event of a disability or incapacity to work (Berufs-(Berufs- oder Erwerbsunfähigkeit)higkeit), the rights to the aforementioned benefits remain, although the pension to be paid is reduced in proportion to the ratio of the actual years of service as a Management Board member to the potential years of service until reaching the age of 65 (or, in the case of Prof. Gatti, the age of 60 and, in the case of Dr. Runte, the age of 63).65.
Based on individual contractual commitments, Management Board members Mr. Rice Powell, Mr. Michael Brosnan, Mr. Ronald Kuerbitz and Mr. Kent Wanzek additionally participated in the U.S.-based 401(k) savings plan in the fiscal year.year; in this regard, contributions in the amount of $7,950.00 (2015: $7,950.00) were earned in the fiscal year in each case and allocated in January 2017. This plan generally allows employees in the U.S. to invest a limited portion of their gross salaries in retirement pension programs. The Company supports this investment, for full-timeWe support our employees hereby with at least one yearcontributions of service, with a contribution ofup to 50% of the investmentyearly made up to a limit of 6% of income – whereupon the allowance paid by the Company is limited to 3% of the income – or a maximum of $17,500 ($23,500 for employees 50 years of age or older). The aforementioned Management Board members were each contractually enabled to participate in this plan; in the past fiscal year the Company paid out $7,800 (2013: $7,650) respectively in this regard.payments.
Furthermore, the Management Board members Mr. Rice Powell, Mr. Michael Brosnan and Mr. Ronald Kuerbitz have acquired non-forfeitable benefits from participation in employee pension plans of Fresenius Medical Care North America, which provide payment of pensions as of the age of 65 and the payment of reduced benefits as of the age of 55. In March 2002, the rights to receive benefits from the pension plans were frozen at the level then applicable.
From the time of his previous employment activities for Fresenius Medical Care Deutschland GmbH, a pension commitment exists for Management Board member Mr. Dominik Wehner exclusively hasWehner. As a pension commitment from Fresenius Medical Care Deutschland GmbH. This pension commitment was not affected by theresult of his service agreement for the Management Board position with Fresenius Medical Care Management AG, beginningthe latter assumed this pension commitment and continues the commitment on April 1, 2014. Itthe basis of Mr. Wehner's compensation as Management Board member. This pension commitment is based on the Fresenius companies' pension scheme of January 1, 1988 and provides old-age pensions, disability pensions and surviving dependents' pensions. It does not provide for any offsetting mechanisms against other income or pension payments. The spousal pension amounts to 60% of the disability pension or old-age pension to be granted at the time of death; thedeath. The orphan's pension amounts to 10% (semi-orphans) or 20% (orphans) of the disability pension or old-age pension to be granted at the time of death. The claims of all surviving dependents are limited to a total of 100% of Mr. Dominik Wehner's pension entitlements.
Additions to pension provisions in the fiscal year for managing boardManagement Board members serving as of December 31 amounted to $6.000$3.532 million (2013: $5.678(2015: $6.864 million). The pension commitments are shown in the following table:
| | Development and status of pension commitments | Development and Status of Pension Commitments | ||||||||||||||||||
|---|---|---|---|---|---|---|---|---|---|---|---|---|---|---|---|---|---|---|---|---|
| | As of January 1, 2014 | increase | As of December 31, 2014 | As of January 1, 2016 | Increase | As of December 31, 2016 | ||||||||||||||
| | (in thousands) | (in thousands) | ||||||||||||||||||
Managing board members serving as of December 31,2014 | ||||||||||||||||||||
Rice Powell | $ | 6,196 | $ | 1,883 | $ | 8,079 | $ | 10,230 | $ | 598 | $ | 10,828 | ||||||||
Michael Brosnan | 2,396 | 1,088 | 3,484 | 4,638 | 616 | 5,254 | ||||||||||||||
Roberto Fusté | 4,912 | 709 | 5,621 | |||||||||||||||||
Ronald Kuerbitz | 189 | 65 | 254 | 2,784 | 765 | 3,549 | ||||||||||||||
Dr. Olaf Schermeier | — | — | — | 336 | 270 | 606 | ||||||||||||||
Kent Wanzek | 1,176 | 638 | 1,814 | 2,534 | 376 | 2,910 | ||||||||||||||
Dominik Wehner | 745 | 1,616 | 2,361 | 2,202 | 907 | 3,109 | ||||||||||||||
Former members of the Management Board who resigned March 31, 2014 | ||||||||||||||||||||
Prof. Emanuele Gatti | 8,652 | 1,617 | 10,269 | |||||||||||||||||
Dr. Rainer Runte | 2,166 | 1,320 | 3,486 | |||||||||||||||||
Harry de Wit | — | — | — | |||||||||||||||||
| | | | | | | | | | | | | | | | | | | | | |
Total | $ | 26,432 | $ | 8,936 | $ | 35,368 | $ | 22,724 | $ | 3,532 | $ | 26,256 | ||||||||
| | | | | | | | | | | | | | | | | | | | | | |
| | | | | | | | | | | | | | | | | | | | | |
A post-employment non-competition covenant was agreed upon with all Management Board members. If such covenant becomes applicable, the Management Board members receive compensation amounting to half of their respective annual fixed compensation for each year of respective application of the non-competition covenant, up to a maximum of two years. The employment contracts of the Management Board members contain no express provisions that are triggered by a change of control of the Company.our control.
V. Miscellaneous
All members of the Management Board have received individual contractual commitments for the continuation of their compensation in cases of sickness for a maximum of 12 months, although after six months of sick leave, insurance benefits may be set off against such payments. If a Management Board member dies, the surviving dependents will be paid three more monthly instalments after the month of
death, not to exceed, however, the amount due between the time of death and the scheduled expiration of the agreement.
In the context of Prof. Emanuele Gatti's retirement from his position as2016 fiscal year, Mr. Roberto Fusté – who was a member of the Management Board as ofuntil March 31, 2014, Prof. Gatti and Fresenius Medical Care Management AG have agreed that Prof. Gatti's service agreement will continue to be effective until the end of the agreed term on April 30, 2015. Until this point in time, Prof. Gatti will continue to receive2016 – received the compensation payments he iswas entitled to underuntil December 31, 2016 pursuant to his servicetermination agreement, i.e. a, fixed compensationcompensations (in the amount of $482,000) and fringe benefits (in the amount of approximately $280,000) as well as one-year and multi-year variable compensation components. With regard tocomponents (in the endamount of approximately $1.695 million and in the amount of $851,000, respectively). The long term of the service agreement on April 30, 2015, suchvariable compensation will only be granted proportionately for fiscal year 2015. The long-term incentive components granted to Prof. GattiMr. Roberto Fusté on the basis of the LTIP 2011 arewere not affected by his retirement from the Management Board. The payment of the Share Based AwardsAward for the fiscal year 2012 earned by Prof. Gatti for the reference years 2009 and 2010 was already madeMr. Roberto Fusté took place in the fiscal year whereas2016. The Share Based Awards earned during the entitlements for fiscal years 20112013 to 2014 will2015 are to be paid out until March 1, 2017. As of the completion of the age of 65, Mr. Roberto Fusté receives a company-funded retirement pension of $275,000 per year. It was also agreed with Mr. Roberto Fusté that following the termination of his service agreement as of December 31, 2016 as a member of the Management Board, he would be subject to Prof. Gatti within 60 days followinga post-employment non-compete obligation lasting until the end of the term of his service agreement. Upon reaching the age of 60, Prof. Gatti is entitled to receive an occupational old-age pension in the amount of approximately $409,000 per annum. On occasion of his retirement from the Management Board, Prof. Gatti further agreed to serveDecember 31, 2018, and would act as an advisor toof the Chairman of the Management Board and to be subject to a post-employment non-competition obligation for the duration of two years following the end of the term of his service agreement, i.e. until April 30, 2017, for whichBoard. For this, he will receive an annual non-compete compensation of approximately $591,000.$397,000 and an annual advisory fee in the amount of $397,000, respectively. The type and amountsamount of the individual benefits granted and allocations made to Prof. Gatti withinin favor of Mr. Roberto Fusté during the fiscal year are presentedshown in the tables in section VI below.
Furthermore, there is a compensation agreement between FMC-AG & Co. KGaA, the Fresenius Medical Care Management AG and Mr. Roberto Fusté, according to which Mr. Roberto Fusté is exempted from certain tax disadvantages resulting from income tax audits. In the context of Dr. Rainer Runte's retirement from his position asfiscal year, we did not compensate any such tax disadvantages (2015: $101,000).
Prof. Emanuele Gatti, who was a member of the Management Board also as ofuntil March 31, 2014, Dr. Runte and Fresenius Medical Care Management AG have agreed
Tablereceived pension payments in the amount of Contents
that Dr. Runte's service agreement will continue to be effective untilapproximately $374,000 (2015: $125,000) as well as fringe benefits in the endamount of $8,000 during the fiscal year. On the occasion of the agreed term December 31, 2014. Dr. Runte will continue to receive the compensation he is entitled to undertermination of his service agreement i.e.as a fixed compensation and fringe benefits as well as the one-year variable compensation component for the fiscal year. The long-term variable compensation components granted to Dr. Runte on the basismember of the LTIP 2011 are not affected by his retirement fromManagement Board effective as of April 30, 2015, a two-year post-employment non-compete obligation was agreed upon with Prof. Gatti. As a compensation for this, Prof. Emanuele Gatti receives an annual non-compete compensation in the amount of approximately $540,000. In the previous year Prof. Gatti received a partial non-compete compensation in the amount of approximately $361,000.
As agreed, Dr. Rainer Runte, was a member of the Management Board. The payment of the Share Based Awards earned by Dr. Runte for the reference years 2009Board until March 31, 2014, was granted and 2010 was already madepaid in the fiscal year whereas the entitlements for fiscal years 2011 to 2014 have been paid to Dr. Runte within 60 days following the end of the term ofa compensation in connection with his service agreement. The pension benefits agreed uponpost-contractual non-compete clause in the service agreement were adjusted to the effect that they will be paid upon reaching the ageamount of 63 whereasapproximately $538,000 (2015: $539,000) as well as fringe benefits in the amount payable is limited to approximately 75% of the benefits originally agreed upon (this amounts to approximately $181,000 per annum)$0 (2015: $31,000). On occasion of his retirement from the Management Board, Dr. Runte further agreed to be subject to a post-employment non-competition obligation for the duration of two years following the end of the term of his service agreement, i.e. until December 31, 2016, for which he will receive an annual non-compete compensation of approximately $590,000. The type and amounts of the individual benefits granted and allocations made to Dr. Runte within the fiscal year are presented in the tables below.
With Dr. Ben Lipps, the Chairman of the Management Board until December 31, 2012, there is an individual agreement instead of a pension provision to the effect that, upon termination of his employment contract/service agreement with Fresenius Medical Care Management AG, he will be retained to render consulting services to the Company for a period of ten years. Accordingly, Fresenius Medical Care Management AG and Dr. Ben Lipps entered into a consulting agreement was entered into for the period January 1, 2013 to December 31, 2022. By this consulting agreement Dr. Ben Lipps will provide consulting services on certain fields and within a specified time frame as well as complying with a non-compete covenant. The annual consideration to be granted by Fresenius Medical Care Management AG for such services (including reimbursement of expenses) amounts for the fiscal year $656,000 (including reimbursement of expenses)to $647,000, (2015: $652,000). The present value of this agreement (including pension payments for the surviving spouse in case of death) amountedamounts to $4.537$3.539 million (2015: $4.022 million) as at December 31 of the fiscal year.
In the fiscal year, no loans or advance payments of future compensation components were made to members of the Management Board of Fresenius Medical Care Management AG.
The payments to U.S. Management Board members Mr. Rice Powell, Mr. Michael Brosnan and Mr. Kent Wanzek were paid in part in the U.S. (in USD)U.S. dollar) and in part in Germany (in EUR)euro). For the part paid in Germany, the Company haswe have agreed that due to varying tax rates in both countries, the increased tax burden to such Management Board members arising from German tax rates in comparison to U.S. tax rates will be balanced (net compensation). Pursuant to a modified net compensation agreement, these Management Board members will be treated as if they were taxed in their home country, the United States, only. Therefore, the gross amounts may be retroactively changed. Since the actual tax burden can only be calculated in connection with the preparation of the Management Board members' tax returns, subsequent adjustments may have to be made, which will then be retroactively covered in future compensation reports. Furthermore, a compensation agreement has been entered into between FMC-AG & Co KGaA, Fresenius Medical Care Management AG and Roberto Fusté, pursuant to which Mr. Fusté is held harmless from certain adverse tax effects which result from an external wage tax audit for the assessment period 2005 to 2007. The payments made in the fiscal year by the Company in this context amounted to $1.456 million; in the fiscal year, the Company has furthermore made payments to compensate Mr. Fusté for adverse tax effects for the assessment periods 2008 to 2010 as well as 2014 in the amount
To the extent permitted by law, Fresenius Medical Care Management AG undertook to indemnify the members of the Management Board against claims against them arising out of their work for the Companyus and itsour affiliates, if such claims exceed their liability under German law. To secure such obligations, the Company haswe have obtained Directors directors& Officersofficers liability insurance carrying a deductible which complies with the requirements of the German Stock Corporation Act (AktG). The indemnity applies for the time in which each member of the Management Board is in office and for claims in this connection after termination of membership on the Management Board in each case.
Former members of the Management Board did not receive any compensation in the fiscal year other than that mentioned above.herein. As of December 31 of the fiscal year, pension obligations towards this group of persons exist in an amount of $16.383$21.576 million (2013: $2(2015: $15.229 million), of which $6.254 million were attributable to Mr. Roberto Fusté.
VI. Tables according to the standards of the German Corporate Governance Codevalue of benefits granted and of the allocation
The German Corporate Governance Code provides that the compensation reports for fiscal years beginning after December 31, 2013report shall include information for each member of the Management Board on the benefits granted and allocations made as well as on the pension expenses for year under report.the fiscal year. The model tables provided in the appendix to the German Corporate Governance Code shall be used to present this information. The following tables include information on the value of benefits granted as well as on the allocations made. They adhere to the structure and, to the greatest extent possible, the standards of the model tables of the German Corporate Governance Code:
| | Serving members of the Management Board as of December 31, 2016 | ||||||||||||||||||||||||
|---|---|---|---|---|---|---|---|---|---|---|---|---|---|---|---|---|---|---|---|---|---|---|---|---|---|
| | Rice Powell | Michael Brosnan | |||||||||||||||||||||||
| | Chairman of the Management Board Member of the Management Board since December 21, 2005(2) | Chief Financial Officer Member of the Management Board since January 1, 2010 | |||||||||||||||||||||||
Benefits granted | 2016 | 2016 | 2016 | 2015(3) | 2016 | 2016 | 2016 | 2015(3) | |||||||||||||||||
| | | Minimum | Maximum | | | Minimum | Maximum | | |||||||||||||||||
| | | (in thousands) | | | (in thousands) | | |||||||||||||||||||
Fixed compensation | $ | 1,375 | $ | 1,375 | $ | 1,375 | $ | 1,375 | $ | 770 | $ | 770 | $ | 770 | $ | 770 | |||||||||
Fringe benefits(1) | 133 | 133 | 133 | 379 | 215 | 215 | 215 | 592 | |||||||||||||||||
| | | | | | | | | | | | | | | | | | | | | | | | | | |
Total non-performance-based compensation | 1,508 | 1,508 | 1,508 | $ | 1,754 | $ | 985 | $ | 985 | $ | 985 | $ | 1,362 | ||||||||||||
| | | | | | | | | | | | | | | | | | | | | | | | | | |
One-year variable compensation | 2,269 | 188 | 2,723 | 2,869 | (4) | 1,271 | 109 | 1,525 | 1,611 | (4) | |||||||||||||||
| | | | | | | | | | | | | | | | | | | | | | | | | | |
Multi-year variable compensation / components with long-term incentive effects | 2,660 | — | — | 3,522 | 1,438 | — | — | 1,772 | |||||||||||||||||
| | | | | | | | | | | | | | | | | | | | | | | | | | |
thereof Share Based Award – New Incentive Bonus Plan 2010 | |||||||||||||||||||||||||
3-year term / 3-year waiting period | 971 | — | — | 182 | 594 | — | — | 102 | |||||||||||||||||
thereof Long Term Incentive Program 2011 – Stock Option Plan 2011 | |||||||||||||||||||||||||
8-year term / 4-year vesting period | — | — | — | 2,481 | — | — | — | 1,241 | |||||||||||||||||
thereof Long Term Incentive Program 2011 – Phantom Stock Plan 2011 | |||||||||||||||||||||||||
5-year term / 4-year vesting period | — | — | — | 859 | — | — | — | 429 | |||||||||||||||||
thereof Long Term Incentive Program 2016 – Performance Share Plan 2016 | |||||||||||||||||||||||||
4-year term / 4-year vesting period | 1,689 | — | — | — | 844 | — | — | — | |||||||||||||||||
| | | | | | | | | | | | | | | | | | | | | | | | | | |
Total non-performance-based and performance-based compensation | 6,437 | 1,696 | — | — | 3,694 | 1,094 | — | 4,745 | |||||||||||||||||
| | | | | | | | | | | | | | | | | | | | | | | | | | |
Pension expense | 820 | 820 | 820 | 632 | 737 | 737 | 737 | 591 | |||||||||||||||||
| | | | | | | | | | | | | | | | | | | | | | | | | | |
Value of benefits granted | $ | 7,257 | $ | 2,516 | $ | — | $ | 8,777 | $ | 4,431 | $ | 1,831 | $ | 0 | $ | 5,336 | |||||||||
| | | | | | | | | | | | | | | | | | | | | | | | | | |
| | | | | | | | | | | | | | | | | | | | | | | | | | |
| | | | | | | | | | | | | | | | | | | | | | | | | | |
| | Serving members of the Management Board as of December 31, 2014 | ||||||||||||||||||||||||
|---|---|---|---|---|---|---|---|---|---|---|---|---|---|---|---|---|---|---|---|---|---|---|---|---|---|
| | Rice Powell | Michael Brosnan | |||||||||||||||||||||||
| | Chairman of the Management Board Member of the Management Board since December 21, 2005(3) | Chief Financial Officer Member of the Management Board since January 1, 2010 | |||||||||||||||||||||||
| | 2014 | 2014 | 2014 | 2013 | 2014 | 2014 | 2014 | 2013 | |||||||||||||||||
Benefits granted | | Minimum | Maximum | | | Minimum | Maximum | | |||||||||||||||||
| | (in thousands) | (in thousands) | |||||||||||||||||||||||
Non-performance-based compensation | |||||||||||||||||||||||||
Fixed compensation | $ | 1,250 | $ | 1,250 | $ | 1,250 | $ | 1,250 | $ | 725 | $ | 725 | $ | 725 | $ | 725 | |||||||||
Fringe benefits(1) | 201 | 201 | 201 | 224 | 196 | 196 | 196 | 193 | |||||||||||||||||
| | | | | | | | | | | | | | | | | | | | | | | | | | |
Total non-performance-based compensation | 1,451 | 1,451 | 1,451 | 1,474 | 921 | 921 | 921 | 918 | |||||||||||||||||
| | | | | | | | | | | | | | | | | | | | | | | | | | |
Performance-based compensation | |||||||||||||||||||||||||
One-year variable compensation | 2,563 | (6) | 281 | 2,975 | (6) | 2,063 | 1,446 | (6) | 163 | 1,686 | (6) | 1,196 | |||||||||||||
| | | | | | | | | | | | | | | | | | | | | | | | | | |
Share Based Award – New Incentive Bonus Plan 2010 | |||||||||||||||||||||||||
3-year term / 3-year waiting period | 160 | 94 | n.a. | 165 | 93 | 54 | n.a. | 96 | |||||||||||||||||
Long Term Incentive Program 2011 – Stock Option Plan 2011 | |||||||||||||||||||||||||
8-year term / 4-year vesting period | 904 | — | n.a. | 884 | 452 | — | n.a. | 442 | |||||||||||||||||
Long Term Incentive Program 2011 – Phantom Stock Plan 2011 | |||||||||||||||||||||||||
5-year term / 4-year vesting period | 310 | — | n.a. | 311 | 155 | — | n.a. | 155 | |||||||||||||||||
| | | | | | | | | | | | | | | | | | | | | | | | | | |
Multi-year variable compensation / components with long-term incentive effects | 1,374 | 94 | n.a. | 1,360 | 700 | 54 | n.a. | 693 | |||||||||||||||||
| | | | | | | | | | | | | | | | | | | | | | | | | | |
Total non-performance-based and performance-based compensation | 5,388 | 1,826 | n.a. | 4,897 | 3,067 | 1,138 | n.a. | 2,807 | |||||||||||||||||
| | | | | | | | | | | | | | | | | | | | | | | | | | |
Pension expense | 570 | 570 | 570 | 538 | 537 | 537 | 537 | 532 | |||||||||||||||||
| | | | | | | | | | | | | | | | | | | | | | | | | | |
Value of benefits granted | $ | 5,958 | $ | 2,396 | $ | n.a. | $ | 5,435 | $ | 3,604 | $ | 1,675 | $ | n.a. | $ | 3,339 | |||||||||
| | | | | | | | | | | | | | | | | | | | | | | | | | |
| | | | | | | | | | | | | | | | | | | | | | | | | | |
| | | | | | | | | | | | | | | | | | | | | | | | | | |
| | Serving members of the Management Board as of December 31, 2016 | ||||||||||||||||||||||||
|---|---|---|---|---|---|---|---|---|---|---|---|---|---|---|---|---|---|---|---|---|---|---|---|---|---|
| | Ronald Kuerbitz | Dr. Olaf Schermeier | |||||||||||||||||||||||
| | Member of the Management Board for North America Member of the Management Board since January 1, 2013 | Member of the Management Board of Global Research and Development Member of the Management Board since March 1, 2013 | |||||||||||||||||||||||
Benefits granted | 2016 | 2016 | 2016 | 2015(3) | 2016 | 2016 | 2016 | 2015(3) | |||||||||||||||||
| | | Minimum | Maximum | | | Minimum | Maximum | | |||||||||||||||||
| | | (in thousands) | | | (in thousands) | | |||||||||||||||||||
Fixed compensation | $ | 935 | $ | 935 | $ | 935 | $ | 935 | $ | 498 | $ | 498 | $ | 498 | $ | 499 | |||||||||
Fringe benefits(1) | 21 | 21 | 21 | 31 | 92 | 92 | 92 | 704 | (5) | ||||||||||||||||
| | | | | | | | | | | | | | | | | | | | | | | | | | |
Total non-performance-based compensation | 956 | 956 | 956 | $ | 966 | 590 | 590 | 590 | 1,203 | ||||||||||||||||
| | | | | | | | | | | | | | | | | | | | | | | | | | |
One-year variable compensation | 1,543 | 140 | $ | 1,851 | 2,043 | (4) | 822 | 62 | $ | 986 | 1,049 | (4) | |||||||||||||
| | | | | | | | | | | | | | | | | | | | | | | | | | |
Multi-year variable compensation / components with long-term incentive effects | 1,633 | — | — | 1,809 | 1,180 | — | — | 1,752 | |||||||||||||||||
| | | | | | | | | | | | | | | | | | | | | | | | | | |
thereof Share Based Award – New Incentive Bonus Plan 2010 | |||||||||||||||||||||||||
3-year term / 3-year waiting period | 789 | — | — | 123 | 329 | — | — | 66 | |||||||||||||||||
thereof Long Term Incentive Program 2011 – Stock Option Plan 2011 | |||||||||||||||||||||||||
8-year term / 4-year vesting period | — | — | — | 827 | — | — | — | 827 | |||||||||||||||||
thereof Long Term Incentive Program 2011 – Phantom Stock Plan 2011 | |||||||||||||||||||||||||
5-year term / 4-year vesting period | — | — | — | 859 | — | — | — | 859 | |||||||||||||||||
thereof Long Term Incentive Program 2016 – Performance Share Plan 2016 | |||||||||||||||||||||||||
4-year term / 4-year vesting period | 844 | — | — | — | 851 | — | — | — | |||||||||||||||||
| | | | | | | | | | | | | | | | | | | | | | | | | | |
Total non-performance-based and performance-based compensation | 4,132 | 1,096 | — | 4,818 | 2,592 | 652 | — | 4,004 | |||||||||||||||||
| | | | | | | | | | | | | | | | | | | | | | | | | | |
Pension expense | 831 | 831 | 831 | 2,582 | 167 | 167 | 167 | — | |||||||||||||||||
| | | | | | | | | | | | | | | | | | | | | | | | | | |
Value of benefits granted | $ | 4,963 | $ | 1,927 | $ | — | $ | 7,400 | $ | 2,759 | $ | 819 | $ | — | $ | 4,004 | |||||||||
| | | | | | | | | | | | | | | | | | | | | | | | | | |
| | | | | | | | | | | | | | | | | | | | | | | | | | |
| | | | | | | | | | | | | | | | | | | | | | | | | | |
| | Serving members of the Management Board as of December 31, 2016 | ||||||||||||||||||||||||
|---|---|---|---|---|---|---|---|---|---|---|---|---|---|---|---|---|---|---|---|---|---|---|---|---|---|
| | Kent Wanzek | Dominik Wehner | |||||||||||||||||||||||
| | Member of the Management Board of Global Manufacturing Operations Member of the Management Board since January 1, 2010 | Member of the Management Board for EMEA Member of the Management Board since April 1, 2014 | |||||||||||||||||||||||
Benefits granted | 2016 | 2016 | 2016 | 2015(3) | 2016 | 2016 | 2016 | 2015(3) | |||||||||||||||||
| | | Minimum | Maximum | | | Minimum | Maximum | | |||||||||||||||||
| | | (in thousands) | | | (in thousands) | | |||||||||||||||||||
Fixed compensation | $ | 597 | $ | 597 | $ | 597 | $ | 597 | $ | 450 | $ | 450 | $ | 450 | $ | 388 | |||||||||
Fringe benefits(1) | 124 | 124 | 124 | 124 | 41 | 41 | 41 | 41 | |||||||||||||||||
| | | | | | | | | | | | | | | | | | | | | | | | | | |
Total non-performance-based compensation | 721 | 721 | $ | 721 | $ | 721 | 491 | $ | 491 | 491 | $ | 429 | |||||||||||||
| | | | | | | | | | | | | | | | | | | | | | | | | | |
One-year variable compensation | 985 | 81 | 1,182 | 1,210 | (4) | 742 | 58 | 890 | 771 | (4) | |||||||||||||||
| | | | | | | | | | | | | | | | | | | | | | | | | | |
Multi-year variable compensation / components with long-term incentive effects | 1,233 | — | — | 1,818 | 1,148 | — | — | 1,789 | |||||||||||||||||
| | | | | | | | | | | | | | | | | | | | | | | | | | |
thereof Share Based Award – New Incentive Bonus Plan 2010 | |||||||||||||||||||||||||
3-year term / 3-year waiting period | 389 | — | — | 145 | 297 | — | — | 103 | |||||||||||||||||
thereof Long Term Incentive Program 2011 – Stock Option Plan 2011 | |||||||||||||||||||||||||
8-year term / 4-year vesting period | — | — | — | 1,158 | — | — | — | 827 | |||||||||||||||||
thereof Long Term Incentive Program 2011 – Phantom Stock Plan 2011 | |||||||||||||||||||||||||
5-year term / 4-year vesting period | — | — | — | 515 | — | — | — | 859 | |||||||||||||||||
thereof Long Term Incentive Program 2016 – Performance Share Plan 2016 | |||||||||||||||||||||||||
4-year term / 4-year vesting period | 844 | — | — | — | 851 | — | — | — | |||||||||||||||||
| | | | | | | | | | | | | | | | | | | | | | | | | | |
Total non-performance-based and performance-based compensation | 2,939 | 802 | — | 3,749 | 2,381 | 549 | — | 2,989 | |||||||||||||||||
| | | | | | | | | | | | | | | | | | | | | | | | | | |
Pension expense | 420 | 420 | 420 | 324 | 109 | 109 | 109 | 110 | |||||||||||||||||
| | | | | | | | | | | | | | | | | | | | | | | | | | |
Value of benefits granted | $ | 3,359 | $ | 1,222 | $ | — | $ | 4,073 | $ | 2,490 | $ | 658 | $ | — | $ | 3,099 | |||||||||
| | | | | | | | | | | | | | | | | | | | | | | | | | |
| | | | | | | | | | | | | | | | | | | | | | | | | | |
| | | | | | | | | | | | | | | | | | | | | | | | | | |
| | Serving members of the Management Board as of December 31, 2016 | Former members of the Management Board who retired in fiscal year 2016 | |||||||||||||||||||||||
|---|---|---|---|---|---|---|---|---|---|---|---|---|---|---|---|---|---|---|---|---|---|---|---|---|---|
| | Harry de Wit | Roberto Fusté(6) | |||||||||||||||||||||||
| | Member of the Management Board for Asia-Pacific Member of the Management Board since April 1, 2016 | Member of the Management Board for Asia-Pacific Member of the Management Board until March 31, 2016 | |||||||||||||||||||||||
Benefits granted | 2016 | 2016 | 2016 | 2015(3) | 2016 | 2016 | 2016 | 2015(3) | |||||||||||||||||
| | | Minimum | Maximum | | | | | | |||||||||||||||||
| | | (in thousands) | | | (in thousands) | | |||||||||||||||||||
Fixed compensation | $ | 398 | $ | 398 | $ | 398 | $ | — | $ | 161 | $ | 161 | $ | 161 | $ | 644 | |||||||||
Fringe benefits(1) | 235 | 235 | 235 | — | 80 | 80 | 80 | 535 | (7) | ||||||||||||||||
| | | | | | | | | | | | | | | | | | | | | | | | | | |
Total non-performance-based compensation | 633 | 633 | 633 | — | 241 | 241 | 241 | 1,179 | |||||||||||||||||
| | | | | | | | | | | | | | | | | | | | | | | | | | |
One-year variable compensation | 657 | 137 | 789 | — | 1,412 | 193 | 1,695 | 1,272 | (4) | ||||||||||||||||
| | | | | | | | | | | | | | | | | | | | | | | | | | |
Multi-year variable compensation / components with long-term incentive effects | 1,114 | — | — | — | — | — | — | 1,850 | |||||||||||||||||
| | | | | | | | | | | | | | | | | | | | | | | | | | |
thereof Share Based Award – New Incentive Bonus Plan 2010 | |||||||||||||||||||||||||
3-year term / 3-year waiting period | 263 | — | — | — | — | — | — | 170 | |||||||||||||||||
thereof Long Term Incentive Program 2011 – Stock Option Plan 2011 | |||||||||||||||||||||||||
8-year term / 4-year vesting period | — | — | — | — | — | — | — | 993 | |||||||||||||||||
thereof Long Term Incentive Program 2011 – Phantom Stock Plan 2011 | |||||||||||||||||||||||||
5-year term / 4-year vesting period | — | — | — | — | — | — | — | 687 | |||||||||||||||||
thereof Long Term Incentive Program 2016 – Performance Share Plan 2016 | |||||||||||||||||||||||||
4-year term / 4-year vesting period | 851 | — | — | — | — | — | — | — | |||||||||||||||||
| | | | | | | | | | | | | | | | | | | | | | | | | | |
Total non-performance-based and performance-based compensation | 2,404 | 770 | — | — | 1,653 | 434 | — | 4,301 | |||||||||||||||||
| | | | | | | | | | | | | | | | | | | | | | | | | | |
Pension expense | — | — | — | — | 333 | 333 | 333 | 311 | |||||||||||||||||
| | | | | | | | | | | | | | | | | | | | | | | | | | |
Value of benefits granted | $ | 2,404 | $ | 770 | $ | — | $ | — | $ | 1,986 | $ | 767 | $ | — | $ | 4,612 | |||||||||
| | | | | | | | | | | | | | | | | | | | | | | | | | |
| | | | | | | | | | | | | | | | | | | | | | | | | | |
| | | | | | | | | | | | | | | | | | | | | | | | | | |
| | Roberto Fusté | Ronald Kuerbitz | |||||||||||||||||||||||
|---|---|---|---|---|---|---|---|---|---|---|---|---|---|---|---|---|---|---|---|---|---|---|---|---|---|
| | Member of the Management Board for Asia-Pacific Member of the Management Board since December 21, 2005(3) | Member of the Management Board for North America Member of the Management Board since January 1, 2013 | |||||||||||||||||||||||
| | 2014 | 2014 | 2014 | 2013 | 2014 | 2014 | 2014 | 2013 | |||||||||||||||||
Benefits granted | | Minimum | Maximum | | | Minimum | Maximum | | |||||||||||||||||
| | (in thousands) | (in thousands) | |||||||||||||||||||||||
Non-performance-based compensation | |||||||||||||||||||||||||
Fixed compensation | $ | 731 | $ | 731 | $ | 731 | $ | 730 | $ | 850 | $ | 850 | $ | 850 | $ | 850 | |||||||||
Fringe benefits(1) | 3,946 | (2) | 3,946 | 3,946 | 400 | 25 | 25 | 25 | 35 | ||||||||||||||||
| | | | | | | | | | | | | | | | | | | | | | | | | | |
Total non-performance-based compensation | $ | 4,677 | $ | 4,677 | $ | 4,677 | $ | 1,130 | $ | 875 | $ | 875 | $ | 875 | $ | 885 | |||||||||
| | | | | | | | | | | | | | | | | | | | | | | | | | |
Performance-based compensation | |||||||||||||||||||||||||
One-year variable compensation | 1,206 | 164 | 1,447 | 1,205 | 1,653 | (6) | 191 | 1,933 | (6) | 1,403 | |||||||||||||||
| | | | | | | | | | | | | | | | | | | | | | | | | | |
Share Based Award – New Incentive Bonus Plan 2010 | |||||||||||||||||||||||||
3-year term / 3-year waiting period | 150 | 55 | n.a. | 123 | 140 | 64 | n.a. | 223 | |||||||||||||||||
Long Term Incentive Program 2011 – Stock Option Plan 2011 | |||||||||||||||||||||||||
8-year term / 4-year vesting period | 301 | — | n.a. | 442 | 452 | — | n.a. | 442 | |||||||||||||||||
Long Term Incentive Program 2011 – Phantom Stock Plan 2011 | |||||||||||||||||||||||||
5-year term / 4-year vesting period | 310 | — | n.a. | 155 | 155 | — | n.a. | 155 | |||||||||||||||||
| | | | | | | | | | | | | | | | | | | | | | | | | | |
Multi-year variable compensation / components with long-term incentive effects | 761 | 55 | n.a. | 720 | 747 | 64 | n.a. | 820 | |||||||||||||||||
| | | | | | | | | | | | | | | | | | | | | | | | | | |
Total non-performance-based and performance-based compensation | 6,644 | 4,896 | n.a. | 3,055 | 3,275 | 1,130 | n.a. | 3,108 | |||||||||||||||||
| | | | | | | | | | | | | | | | | | | | | | | | | | |
Pension expense | 309 | 309 | 309 | 282 | — | — | — | — | |||||||||||||||||
| | | | | | | | | | | | | | | | | | | | | | | | | | |
Value of benefits granted | $ | 6,953 | $ | 5,205 | $ | n.a. | $ | 3,337 | $ | 3,275 | $ | 1,130 | $ | n.a. | $ | 3,108 | |||||||||
| | | | | | | | | | | | | | | | | | | | | | | | | | |
| | | | | | | | | | | | | | | | | | | | | | | | | | |
| | | | | | | | | | | | | | | | | | | | | | | | | | |
| | Kent Wanzek | Dr. Olaf Schermeier | Serving members of the Management Board as of December 31, 2016 | Former members of the Management Board (retired in fiscal year 2016) | ||||||||||||||||||||||||||||||||||||||||||||||||||||||||||||||||||||||
|---|---|---|---|---|---|---|---|---|---|---|---|---|---|---|---|---|---|---|---|---|---|---|---|---|---|---|---|---|---|---|---|---|---|---|---|---|---|---|---|---|---|---|---|---|---|---|---|---|---|---|---|---|---|---|---|---|---|---|---|---|---|---|---|---|---|---|---|---|---|---|---|---|---|---|
| | Member of the Management Board of Global Manufacturing Operations Member of the Management Board since January 1, 2010 | Member of the Management Board of Global Research and Development Member of the Management Board since March 1, 2013 | Rice Powell | Michael Brosnan | Ronald Kuerbitz | Dr. Olaf Schermeier | Kent Wanzek | Dominik Wehner | Harry de Wit | Roberto Fusté(6) | ||||||||||||||||||||||||||||||||||||||||||||||||||||||||||||||||
| | 2014 | 2014 | 2014 | 2013 | 2014 | 2014 | 2014 | 2013 | Chairman of the Management Board Member of the Management Board since December 21, 2005(2) | Chief Financial Officer Member of the Management Board since January 1, 2010 | Member of the Management Board for North America Member of the Management Board since January 1, 2013 | Member of the Management Board for Global Research and Development Member of the Management Board since March 1, 2013 | Member of the Management Board for Global Manufacturing Operations Member of the Management Board since January 1, 2010 | Member of the Management Board for EMEA Member of the Management Board since April 1, 2014 | Member of the Management Board for Asia-Pacific Member of the Management Board since April 1, 2016 | Member of the Management Board for Asia-Pacific Member of the Management Board until March 31, 2016 | ||||||||||||||||||||||||||||||||||||||||||||||||||||||||||
Benefits granted | | Minimum | Maximum | | | Minimum | Maximum | | ||||||||||||||||||||||||||||||||||||||||||||||||||||||||||||||||||
Allocations | 2016 | 2015(3) | 2016 | 2015(3) | 2016 | 2015(3) | 2016 | 2015(3) | 2016 | 2015(3) | 2016 | 2015(3) | 2016 | 2015(3) | 2016 | 2015(3) | ||||||||||||||||||||||||||||||||||||||||||||||||||||||||||
| | (in thousands) | (in thousands) | (in thousands) | (in thousands) | (in thousands) | (in thousands) | (in thousands) | (in thousands) | (in thousands) | (in thousands) | ||||||||||||||||||||||||||||||||||||||||||||||||||||||||||||||||
Non-performance-based compensation | ||||||||||||||||||||||||||||||||||||||||||||||||||||||||||||||||||||||||||
Fixed compensation | $ | 540 | $ | 540 | $ | 540 | $ | 521 | $ | 531 | $ | 531 | $ | 531 | $ | 442 | $ | 1,375 | $ | 1,375 | $ | 770 | $ | 770 | $ | 935 | $ | 935 | $ | 498 | $ | 499 | $ | 597 | $ | 597 | $ | 450 | $ | 388 | $ | 398 | $ | — | $ | 161 | $ | 644 | ||||||||||||||||||||||||||
Fringe benefits(1) | 98 | 98 | 98 | 70 | 310 | 310 | 310 | 92 | 133 | 379 | 215 | 592 | 21 | 31 | 92 | 704 | (5) | 124 | 124 | 41 | 41 | 235 | — | 80 | 535 | (7) | ||||||||||||||||||||||||||||||||||||||||||||||||
| | | | | | | | | | | | | | | | | | | | | | | | | | | | | | | | | | | | | | | | | | | | | | | | | | | | | | | | | | | | | | | | | | | | | | | | | | | |
Total non-performance-based compensation | $ | 638 | $ | 638 | $ | 638 | $ | 591 | $ | 841 | $ | 841 | $ | 841 | $ | 534 | ||||||||||||||||||||||||||||||||||||||||||||||||||||||||||
Total non-performance based compensation | 1,508 | 1,754 | 985 | 1,362 | 956 | 966 | 590 | 1,203 | 721 | 721 | 491 | 429 | 633 | — | 241 | 1,179 | ||||||||||||||||||||||||||||||||||||||||||||||||||||||||||
| | | | | | | | | | | | | | | | | | | | | | | | | | | | | | | | | | | | | | | | | | | | | | | | | | | | | | | | | | | | | | | | | | | | | | | | | | | |
Performance-based compensation | ||||||||||||||||||||||||||||||||||||||||||||||||||||||||||||||||||||||||||
One-year variable compensation | 891 | 113 | 1,069 | 858 | 877 | 112 | 1,052 | 730 | 2,659 | 1,145 | (4) | 1,439 | 645 | (4) | 1,634 | 870 | (4) | 986 | 423 | (4) | 1,167 | 659 | (4) | 890 | 438 | (4) | 789 | — | — | 720 | (4) | |||||||||||||||||||||||||||||||||||||||||||
| | | | | | | | | | | | | | | | | | | | | | | | | | | | | | | | | | | | | | | | | | | | | | | | | | | | | | | | | | | | | | | | | | | | | | | | | | | |
Share Based Award – New Incentive Bonus Plan 2010 | ||||||||||||||||||||||||||||||||||||||||||||||||||||||||||||||||||||||||||
3-year term / 3-year waiting period | 130 | 37 | n.a. | 134 | 68 | 37 | n.a. | 58 | ||||||||||||||||||||||||||||||||||||||||||||||||||||||||||||||||||
Long Term Incentive Program 2011 – Stock Option Plan 2011 | ||||||||||||||||||||||||||||||||||||||||||||||||||||||||||||||||||||||||||
8-year term / 4-year vesting period | 301 | — | n.a. | 442 | 452 | — | n.a. | 442 | ||||||||||||||||||||||||||||||||||||||||||||||||||||||||||||||||||
Long Term Incentive Program 2011 – Phantom Stock Plan 2011 | ||||||||||||||||||||||||||||||||||||||||||||||||||||||||||||||||||||||||||
Multi-year variable compensation / components with long-term incentive effects | 3,682 | 2,847 | 2,239 | 4,500 | 108 | 2,061 | — | — | 2,702 | 275 | 385 | 873 | — | — | — | 3,918 | ||||||||||||||||||||||||||||||||||||||||||||||||||||||||||
| | | | | | | | | | | | | | | | | | | | | | | | | | | | | | | | | | | | | | | | | | | | | | | | | | | |||||||||||||||||||||||||
thereof Share Based Award – New Incentive Bonus Plan 2010 | ||||||||||||||||||||||||||||||||||||||||||||||||||||||||||||||||||||||||||
3-year term / 3-year vesting period | ||||||||||||||||||||||||||||||||||||||||||||||||||||||||||||||||||||||||||
Grant 2011 | — | 522 | — | 317 | — | — | — | — | — | 275 | — | — | — | — | — | 292 | ||||||||||||||||||||||||||||||||||||||||||||||||||||||||||
Grant 2012 | 683 | — | 429 | — | — | — | — | — | 359 | — | — | — | — | — | — | — | ||||||||||||||||||||||||||||||||||||||||||||||||||||||||||
thereof International Stock Option Plan 2001 | ||||||||||||||||||||||||||||||||||||||||||||||||||||||||||||||||||||||||||
10-year term / one third 2-, 3- and 4-year vesting period | ||||||||||||||||||||||||||||||||||||||||||||||||||||||||||||||||||||||||||
Grant 2005 | — | — | — | 2,632 | — | — | — | — | — | — | — | 529 | — | — | — | — | ||||||||||||||||||||||||||||||||||||||||||||||||||||||||||
thereof Stock Option Plan 2006 | ||||||||||||||||||||||||||||||||||||||||||||||||||||||||||||||||||||||||||
7-year term / 3-year vesting period | ||||||||||||||||||||||||||||||||||||||||||||||||||||||||||||||||||||||||||
Grant 2008 | — | 2,325 | — | 1,551 | — | — | — | — | — | — | — | 344 | — | — | — | 2,350 | ||||||||||||||||||||||||||||||||||||||||||||||||||||||||||
Grant 2009 | 2,296 | — | 1,675 | — | — | 891 | — | — | — | — | 352 | — | — | — | — | 1,276 | ||||||||||||||||||||||||||||||||||||||||||||||||||||||||||
Grant 2010 | 501 | — | — | — | — | 1,170 | — | — | 2,208 | — | — | — | — | — | — | — | ||||||||||||||||||||||||||||||||||||||||||||||||||||||||||
thereof Long Term Incentive Program 2011 – Phantom Stock Plan 2011 | ||||||||||||||||||||||||||||||||||||||||||||||||||||||||||||||||||||||||||
5-year term / 4-year vesting period | 310 | — | n.a. | 155 | 155 | — | n.a. | 155 | ||||||||||||||||||||||||||||||||||||||||||||||||||||||||||||||||||
| | | | | | | | | | | | | | | | | | | | | | | | | | ||||||||||||||||||||||||||||||||||||||||||||||||||
Multi-year variable compensation / components with long-term incentive effects | 741 | 37 | n.a. | 731 | 675 | 37 | n.a. | 655 | ||||||||||||||||||||||||||||||||||||||||||||||||||||||||||||||||||
Grant 2011 | 202 | — | 135 | — | 108 | — | — | — | 135 | — | 33 | — | — | — | — | — | ||||||||||||||||||||||||||||||||||||||||||||||||||||||||||
Other | — | — | — | — | — | — | — | — | — | — | — | — | — | — | — | — | ||||||||||||||||||||||||||||||||||||||||||||||||||||||||||
| | | | | | | | | | | | | | | | | | | | | | | | | | | | | | | | | | | | | | | | | | | | | | | | | | | | | | | | | | | | | | | | | | | | | | | | | | | |
Total non-performance-based and performance-based compensation | 2,270 | 788 | n.a. | 2,180 | 2,393 | 990 | n.a. | 1,919 | 7,849 | 5,746 | 4,663 | 6,507 | 2,698 | 3,897 | 1,576 | 1,626 | 4,590 | 1,655 | 1,766 | 1,740 | 1,422 | — | 241 | 5,817 | ||||||||||||||||||||||||||||||||||||||||||||||||||
| | | | | | | | | | | | | | | | | | | | | | | | | | | | | | | | | | | | | | | | | | | | | | | | | | | | | | | | | | | | | | | | | | | | | | | | | | | |
Pension expense | 280 | 280 | 280 | 252 | — | — | — | — | 820 | 632 | 737 | 591 | 831 | 2,582 | 167 | — | 420 | 324 | 109 | 110 | — | — | 333 | 311 | ||||||||||||||||||||||||||||||||||||||||||||||||||
| | | | | | | | | | | | | | | | | | | | | | | | | | | | | | | | | | | | | | | | | | | | | | | | | | | | | | | | | | | | | | | | | | | | | | | | | | | |
Value of benefits granted | $ | 2,550 | $ | 1,068 | $ | n.a. | $ | 2,432 | $ | 2,393 | $ | 990 | $ | n.a. | $ | 1,919 | ||||||||||||||||||||||||||||||||||||||||||||||||||||||||||
Allocation | $ | 8,669 | $ | 6,378 | $ | 5,400 | $ | 7,098 | $ | 3,529 | $ | 6,479 | $ | 1,743 | $ | 1,626 | $ | 5,010 | $ | 1,979 | $ | 1,875 | $ | 1,850 | $ | 1,422 | $ | — | $ | 574 | $ | 6,128 | ||||||||||||||||||||||||||||||||||||||||||
| | | | | | | | | | | | | | | | | | | | | | | | | | | | | | | | | | | | | | | | | | | | | | | | | | | | | | | | | | | | | | | | | | | | | | | | | | | | |
| | | | | | | | | | | | | | | | | | | | | | | | | | | | | | | | | | | | | | | | | | | | | | | | | | | | | | | | | | | | | | | | | | | | | | | | | | | |
| | Serving members of the Management Board as of December 31, 2014 | ||||||||||||
|---|---|---|---|---|---|---|---|---|---|---|---|---|---|
| | Dominik Wehner | ||||||||||||
| | Member of the Management Board for EMEA Member of the Management Board since April 1, 2014 | ||||||||||||
| | 2014 | 2014 | 2014 | 2013 | |||||||||
| | | Minimum | Maximum | | |||||||||
| | (in thousands) | ||||||||||||
Non-performance-based compensation | |||||||||||||
Fixed compensation | $ | 349 | $ | 349 | $ | 349 | $ | — | |||||
Fringe benefits(1) | 26 | 26 | 26 | — | |||||||||
| | | | | | | | | | | | | | |
Total non-performance-based compensation | $ | 375 | $ | 375 | $ | 375 | $ | — | |||||
| | | | | | | | | | | | | | |
Performance-based compensation | |||||||||||||
One-year variable compensation | 575 | 79 | 691 | — | |||||||||
| | | | | | | | | | | | | | |
Share Based Award – New Incentive Bonus | |||||||||||||
3-year term / 3-year waiting period | 92 | 26 | n.a. | — | |||||||||
Long Term Incentive Program 2011 – Stock | |||||||||||||
8-year term / 4-year vesting period | 452 | — | n.a. | — | |||||||||
Long Term Incentive Program 2011 – Phantom | |||||||||||||
5-year term / 4-year vesting period | 155 | — | n.a. | — | |||||||||
| | | | | | | | | | | | | | |
Multi-year variable compensation / components | 699 | 26 | n.a. | — | |||||||||
| | | | | | | | | | | | | | |
Total non-performance-based and performance-based | 1,649 | 480 | n.a. | — | |||||||||
| | | | | | | | | | | | | | |
Pension expense | 39 | 39 | 39 | — | |||||||||
| | | | | | | | | | | | | | |
Value of benefits granted | $ | 1,688 | $ | 519 | $ | n.a. | $ | — | |||||
| | | | | | | | | | | | | | |
| | | | | | | | | | | | | | |
| | | | | | | | | | | | | | |
| | Former members of the Management Board who retired in fiscal year 2014 | ||||||||||||||||||||||||
|---|---|---|---|---|---|---|---|---|---|---|---|---|---|---|---|---|---|---|---|---|---|---|---|---|---|
| | Prof. Emanuele Gatti(4) | Dr. Rainer Runte(5) | |||||||||||||||||||||||
| | Member of the Management Board for EMEA and Latin America Member of the Management Board until March 31, 2014 | Member of the Management Board for Legal, Compliance and Intellectual Property Member of the Management Board until March 31, 2014 | |||||||||||||||||||||||
| | 2014 | 2014 | 2014 | 2013 | 2014 | 2014 | 2014 | 2013 | |||||||||||||||||
| | | Minimum | Maximum | | | Minimum | Maximum | | |||||||||||||||||
| | (in thousands) | (in thousands) | |||||||||||||||||||||||
Non-performance-based compensation | |||||||||||||||||||||||||
Fixed compensation | $ | 249 | $ | 249 | $ | 249 | $ | 973 | $ | 146 | $ | 146 | $ | 146 | $ | 584 | |||||||||
Fringe benefits(1) | 39 | 39 | 39 | 165 | 13 | 13 | 13 | 58 | |||||||||||||||||
| | | | | | | | | | | | | | | | | | | | | | | | | | |
Total non-performance-based compensation | $ | 288 | $ | 288 | $ | 288 | $ | 1,138 | $ | 159 | $ | 159 | $ | 159 | $ | 642 | |||||||||
| | | | | | | | | | | | | | | | | | | | | | | | | | |
Performance-based compensation | |||||||||||||||||||||||||
One-year variable compensation | 1,644 | 224 | 1,973 | 1,607 | 964 | 132 | 1,157 | 964 | |||||||||||||||||
| | | | | | | | | | | | | | | | | | | | | | | | | | |
Share Based Award – New Incentive Bonus Plan 2010 | |||||||||||||||||||||||||
3-year term / 3-year waiting period | — | 75 | n.a. | 234 | — | 44 | n.a. | 77 | |||||||||||||||||
Long Term Incentive Program 2011 – Stock Option Plan 2011 | |||||||||||||||||||||||||
8-year term / 4-year vesting period | — | — | n.a. | 354 | — | — | n.a. | 442 | |||||||||||||||||
Long Term Incentive Program 2011 – Phantom Stock Plan 2011 | |||||||||||||||||||||||||
5-year term / 4-year vesting period | — | — | n.a. | 248 | — | — | n.a. | 155 | |||||||||||||||||
| | | | | | | | | | | | | | | | | | | | | | | | | | |
Multi-year variable compensation / components with long-term incentive effects | — | 75 | n.a. | 836 | — | 44 | n.a. | 674 | |||||||||||||||||
| | | | | | | | | | | | | | | | | | | | | | | | | | |
Total non-performance-based and performance-based compensation | 1,932 | 587 | n.a. | 3,581 | 1,123 | 335 | n.a. | 2,280 | |||||||||||||||||
| | | | | | | | | | | | | | | | | | | | | | | | | | |
Pension expense | 351 | 351 | 351 | 294 | 174 | 174 | 174 | 154 | |||||||||||||||||
| | | | | | | | | | | | | | | | | | | | | | | | | | |
Value of benefits granted | $ | 2,283 | $ | 938 | $ | n.a. | $ | 3,875 | $ | 1,297 | $ | 509 | $ | n.a. | $ | 2,434 | |||||||||
| | | | | | | | | | | | | | | | | | | | | | | | | | |
| | | | | | | | | | | | | | | | | | | | | | | | | | |
| | | | | | | | | | | | | | | | | | | | | | | | | | |
| | Serving members of the Management Board as of December 31, 2014 | Former members of the Management Board who retired in fiscal year 2014 | |||||||||||||||||||||||||||||||||||||||||||||||||||||
|---|---|---|---|---|---|---|---|---|---|---|---|---|---|---|---|---|---|---|---|---|---|---|---|---|---|---|---|---|---|---|---|---|---|---|---|---|---|---|---|---|---|---|---|---|---|---|---|---|---|---|---|---|---|---|---|
| | Rice Powell | Michael Brosnan | Roberto Fusté | Ronald Kuerbitz | Kent Wanzek | Dr. Olaf Schermeier | Dominik Wehner | Prof. Gatti(4) | Dr. Rainer Runte(5) | ||||||||||||||||||||||||||||||||||||||||||||||
| | Chairman of the Management Board Member of the Management Board since December 21, 2005(3) | Chief Financial Officer Member of the Management Board since January 1, 2010 | Member of the Management Board for Asia-Pacific Member of the Management Board since December 21, 2005(3) | Member of the Management Board for North America Member of the Management Board since January 1, 2013 | Member of the Management Board for Global Manufacturing Operations Member of the Management Board since January 1, 2010 | Member of the Management Board for Global Research and Development Member of the Management Board since March 1, 2013 | Member of the Management Board for EMEA Member of the Management Board since April 1, 2014 | Member of the Management Board for EMEA and Latin America Member of the Management Board until March 31, 2014 | Member of the Management Board for Legal, Compliance and Intellectual Property Member of the Management Board until March 31, 2014 | ||||||||||||||||||||||||||||||||||||||||||||||
Allocations | 2014 | 2013 | 2014 | 2013 | 2014 | 2013 | 2014 | 2013 | 2014 | 2013 | 2014 | 2013 | 2014 | 2013 | 2014 | 2013 | 2014 | 2013 | |||||||||||||||||||||||||||||||||||||
| | (in thousands) | (in thousands) | (in thousands) | (in thousands) | (in thousands) | (in thousands) | (in thousands) | (in thousands) | (in thousands) | ||||||||||||||||||||||||||||||||||||||||||||||
Non-performance-based compensation | |||||||||||||||||||||||||||||||||||||||||||||||||||||||
Fixed compensation | $ | 1,250 | $ | 1,250 | $ | 725 | $ | 725 | $ | 731 | $ | 730 | $ | 850 | $ | 850 | $ | 540 | $ | 521 | $ | 531 | $ | 442 | $ | 349 | $ | — | $ | 249 | $ | 973 | $ | 146 | $ | 584 | |||||||||||||||||||
Fringe benfits(1) | 201 | 224 | 196 | 193 | 3,946 | (2) | 400 | 25 | 35 | 98 | 70 | 310 | 92 | 26 | — | 39 | 165 | 13 | 58 | ||||||||||||||||||||||||||||||||||||
| | | | | | | | | | | | | | | | | | | | | | | | | | | | | | | | | | | | | | | | | | | | | | | | | | | | | | | | |
Total non-performance based compensation | 1,451 | 1,474 | 921 | 918 | 4,677 | 1,130 | 875 | 885 | 638 | 591 | 841 | 534 | 375 | — | 288 | 1,138 | 159 | 642 | |||||||||||||||||||||||||||||||||||||
| | | | | | | | | | | | | | | | | | | | | | | | | | | | | | | | | | | | | | | | | | | | | | | | | | | | | | | | |
Performance-based compensation | |||||||||||||||||||||||||||||||||||||||||||||||||||||||
One-year variable compensation | 980 | (6) | 495 | 528 | (6) | 287 | 450 | 370 | 669 | (6) | 668 | 391 | 403 | 204 | 175 | 276 | — | — | 702 | — | 231 | ||||||||||||||||||||||||||||||||||
| | | | | | | | | | | | | | | | | | | | | | | | | | | | | | | | | | | | | | | | | | | | | | | | | | | | | | | | |
Share Based Award – New Incentive Bonus Plan 2009 | |||||||||||||||||||||||||||||||||||||||||||||||||||||||
3-year term / 3-year vesting period | |||||||||||||||||||||||||||||||||||||||||||||||||||||||
Grant 2009 | — | 410 | — | — | 202 | — | — | — | — | — | — | — | — | — | — | 418 | 252 | — | |||||||||||||||||||||||||||||||||||||
Share Based Award – New Incentive Bonus Plan 2010 | |||||||||||||||||||||||||||||||||||||||||||||||||||||||
3-year term / 3-year vesting period | |||||||||||||||||||||||||||||||||||||||||||||||||||||||
Grant 2010 | 554 | — | 311 | — | 216 | — | — | — | 249 | — | — | — | — | — | — | — | 249 | — | |||||||||||||||||||||||||||||||||||||
Internation Stock Option Plan 2001 | |||||||||||||||||||||||||||||||||||||||||||||||||||||||
10-year term / one third 2-, 3- and 4-year vesting period | |||||||||||||||||||||||||||||||||||||||||||||||||||||||
Grant 2003 | — | — | — | 704 | — | — | — | — | — | — | — | — | — | — | — | 592 | — | — | |||||||||||||||||||||||||||||||||||||
Grant 2004 | — | — | 918 | — | 1,427 | — | — | — | — | — | — | — | — | — | — | 1,338 | — | — | |||||||||||||||||||||||||||||||||||||
Stock Option Plan 2006 | |||||||||||||||||||||||||||||||||||||||||||||||||||||||
7-year term / 3-year vesting period | |||||||||||||||||||||||||||||||||||||||||||||||||||||||
Grant 2006 | — | — | — | 938 | — | 1,417 | — | — | — | — | — | — | — | — | — | 975 | — | 1,467 | |||||||||||||||||||||||||||||||||||||
Grant 2007 | — | 1,176 | 574 | — | 1,080 | — | 595 | — | — | — | — | — | — | — | — | 952 | — | 1,247 | |||||||||||||||||||||||||||||||||||||
Grant 2008 | — | — | — | — | — | — | 818 | — | 443 | — | — | — | — | — | — | — | — | — | |||||||||||||||||||||||||||||||||||||
Grant 2009 | — | — | — | — | — | — | — | — | 525 | — | — | — | — | — | — | — | — | — | |||||||||||||||||||||||||||||||||||||
| | | | | | | | | | | | | | | | | | | | | | | | | | | | | | | | | | | | | | | | | | | | | | | | | | | | | | | | |
Multi-year variable compensation / components with long-term incentive effects | 554 | 1,586 | 1,803 | 1,642 | 2,925 | 1,417 | 1,413 | — | 1,217 | — | — | — | — | — | — | 4,275 | 501 | 2,714 | |||||||||||||||||||||||||||||||||||||
| | | | | | | | | | | | | | | | | | | | | | | | | | | | | | | | | | | | | | | | | | | | | | | | | | | | | | | | |
Other | — | — | — | — | — | — | — | — | — | — | — | — | — | — | — | — | — | — | |||||||||||||||||||||||||||||||||||||
| | | | | | | | | | | | | | | | | | | | | | | | | | | | | | | | | | | | | | | | | | | | | | | | | | | | | | | | |
Total non-performance-based and performance-based compensation | 2,985 | 3,555 | 3,252 | 2,847 | 8,052 | 2,917 | 2,957 | 1,553 | 2,246 | 994 | 1,045 | 709 | 651 | — | 288 | 6,115 | 660 | 3,587 | |||||||||||||||||||||||||||||||||||||
Pension expense | 570 | 538 | 537 | 532 | 309 | 282 | — | — | 280 | 252 | — | — | 39 | — | 351 | 294 | 174 | 154 | |||||||||||||||||||||||||||||||||||||
| | | | | | | | | | | | | | | | | | | | | | | | | | | | | | | | | | | | | | | | | | | | | | | | | | | | | | | | |
Allocation | $ | 3,555 | $ | 4,093 | $ | 3,789 | $ | 3,379 | $ | 8,361 | $ | 3,199 | $ | 2,957 | $ | 1,553 | $ | 2,526 | $ | 1,246 | $ | 1,045 | $ | 709 | $ | 690 | $ | — | $ | 639 | $ | 6,409 | $ | 834 | $ | 3,741 | |||||||||||||||||||
| | | | | | | | | | | | | | | | | | | | | | | | | | | | | | | | | | | | | | | | | | | | | | | | | | | | | | | | |
| | | | | | | | | | | | | | | | | | | | | | | | | | | | | | | | | | | | | | | | | | | | | | | | | | | | | | | | |
| | | | | | | | | | | | | | | | | | | | | | | | | | | | | | | | | | | | | | | | | | | | | | | | | | | | | | | | |
Compensation of the Supervisory Board of Fresenius Medical Care & Co. KGaA and Supervisory Board of Management AG
The compensation of the FMC-AG & Co. KGaA Supervisory Board is set out in clause 13 of the Articles of Association.
In accordance with this provision, The Annual General Meeting resolved on May 12, 2016 to adjust the membersamount of the fixed compensation of the Supervisory Board are to be reimbursed for the expenses incurred in the exercisewith effect as of their offices, which also include the applicable VAT.January 1, 2017.
As compensation, eachEach Supervisory Board member receives in the first instance a fixed salary of $80,000 per respective complete($88,000 as of January 1, 2017) for each full fiscal year, payable in four equal instalments at the end of a calendar quarter. Should the General Meeting resolve on a higher compensation, with a majority of three-fourths of the votes cast and taking the annual results into account, such compensation shall apply.
The chairmanChairman of the Supervisory Board receives additional compensation of $80,000 ($88,000 as of January 1, 2017) and his deputy additional compensation of $40,000 ($44,000 as of January 1, 2017) per respective complete fiscal year.
In addition, each member of the Supervisory Board shall also receive as a variable performance-related compensation component an additional remuneration which is based upon the respective average growth in our basic earnings per share of the Company (EPS) during the period of the last three fiscal years prior to the payment date (3-year average EPS growth). The amount of the variable performance-related remuneration component is $60,000 in case of achieving a 3-year average EPS growth corridor from 8.00 to 8.99%, $70,000 in the corridor from 9.00 to 9.99% and $80,000 in case of a growth of 10.00% or more. If the aforementioned targets are reached, the respective variable remuneration amounts are earned to their full extent, i.e. within these margins there is no pro rata remuneration. In any case, this variable component is limited to a maximum of $80,000 per annum. Reciprocally, the members of the supervisory boardSupervisory Board are only entitled to the variable remuneration component if the 3 year3-year average EPS growth of at least 8.00% is reached. The variableProvided that the relevant targets have been achieved, the remuneration component, based on the target achievement, is, in principle, disbursed on a yearly basis namely following the approval of the Company'sour annual financial statements this for the respective fiscal year. For the fiscal year 2014 based on2016, the 3-year average EPS growth for the fiscal years 2012, 20132014, 2015 and 2014.2016 was relevant.
In application of the principles above, neither for the previous year 2013 nor for the year 2014no entitlement to a payment of variable performance-related compensation component was generated.
As a member of a committee, a Supervisory Board member of FMC-AG & Co. KGaA additionally annually receives $40,000 or,($44,000 as of January 1, 2017). A member of a committee who serves as chairman or vice chairman of a committee $60,000 or $50,000, respectivelyadditionally receives $20,000 and $10,000 a year ($22,000 and $11,000 as of January 1, 2017, respectively), payable in identical instalments at the end of a calendar quarter. For memberships in the Nomination Committee of the Supervisory Board and in theour Joint Committee as well as in the capacity of their respective chairmen and deputy chairmen, no separate remuneration shall be granted.granted to the members of the Supervisory Board. In accordance with section 13e para. 3 of the Articles of Association of FMC-AG & Co. KGaA, the members of the Joint Committee are, however, entitled to receive an attendance fee in the amount of $3,500.
Should a member of the FMC-AG & Co. KGaA Supervisory Board be a member of the Supervisory Boardsupervisory board of the General Partner, Fresenius Medical Care Management AG, at the same time, and receive compensation for his work on the Supervisory Boardsupervisory board of Fresenius Medical Care Management AG, the compensation for the work as a FMC-AG & Co. KGaA Supervisory Board member shall be reduced by half. The same applies to the additional compensation for the chairmanChairman of the FMC-AG & Co. KGaA Supervisory Board and his deputy, to the extent that they are at the same time chairman and deputy, respectively, of the Supervisory Boardsupervisory board of Fresenius Medical Care Management AG. If the deputy chairman of the FMC-AG & Co. KGaA Supervisory Board is at the same time chairman of the Supervisory Boardsupervisory board at Fresenius Medical Care Management AG, he shall receive no additional compensation for his work as deputy chairman of the FMC-AG & Co. KGaA Supervisory Board to this extent.
The compensation forof the Supervisory Boardmembers of the supervisory board of Fresenius Medical Care Management AG and the compensation forof the members of its committees were charged to FMC-AG & Co. KGaA in accordance with section 7 paragraphpara. 3 of the Articles of Association of FMC-AG & Co. KGaA.
The members of the Supervisory Board are to be reimbursed for the expenses incurred in their exercise of their offices, which also include the applicable VAT.
The total compensation of the Supervisory Board of FMC-AG & Co. KGaA including the amount charged by Fresenius Medical Care Management AG to FMC-AG & Co. KGaA, is listedstated in the following table:
tables, with the table immediately positioned hereinafter displaying the fixed compensation, whilst the subsequent table sets out the performance related compensation:
| | Fixed compensation for Supervisory Board at FMC Management AG | Fixed compensation for Supervisory Board at FMC-AG & Co. KGaA | Compensation for committee services at FMC Management AG | Compensation for committee services at FMC-AG & Co. KGaA | Non-Performance Related Compensation | Fixed compensation for Supervisory Board at FMC Management AG | Fixed compensation for Supervisory Board at FMC-AG & Co. KGaA | Compensation for committee services at FMC Management AG | Compensation for committee services at FMC-AG & Co. KGaA | Non-performance related compensation | ||||||||||||||||||||||||||||||||||||||||||||||||||||
|---|---|---|---|---|---|---|---|---|---|---|---|---|---|---|---|---|---|---|---|---|---|---|---|---|---|---|---|---|---|---|---|---|---|---|---|---|---|---|---|---|---|---|---|---|---|---|---|---|---|---|---|---|---|---|---|---|---|---|---|---|---|---|
| | 2014 | 2013 | 2014 | 2013 | 2014 | 2013 | 2014 | 2013 | 2014 | 2013 | 2016 | 2015 | 2016 | 2015 | 2016 | 2015 | 2016 | 2015 | 2016 | 2015 | ||||||||||||||||||||||||||||||||||||||||||
| | (in thousands)(1) | (in thousands)(1) | (in thousands)(1) | (in thousands)(1) | (in thousands)(1) | (in thousands)(1) | (in thousands)(1) | (in thousands)(1) | (in thousands)(1) | (in thousands)(1) | ||||||||||||||||||||||||||||||||||||||||||||||||||||
Dr. Gerd Krick | $ | 40 | $ | 40 | $ | 120 | $ | 120 | $ | 60 | $ | 60 | $ | 40 | $ | 47 | $ | 260 | $ | 267 | $ | 40 | $ | 40 | $ | 120 | $ | 120 | $ | 60 | $ | 60 | $ | 44 | $ | 40 | $ | 264 | $ | 260 | ||||||||||||||||||||||
Stephan Sturm(2) | 91 | — | — | — | 18 | — | 4 | — | 113 | — | ||||||||||||||||||||||||||||||||||||||||||||||||||||
Rolf A. Classon | 40 | 40 | 40 | 40 | 99 | 60 | 35 | — | 214 | 140 | ||||||||||||||||||||||||||||||||||||||||||||||||||||
William P. Johnston | 40 | 40 | 40 | 40 | 114 | 120 | 56 | 40 | 250 | 240 | ||||||||||||||||||||||||||||||||||||||||||||||||||||
Deborah Doyle McWhinney(3) | — | — | 51 | — | — | — | 25 | — | 76 | — | ||||||||||||||||||||||||||||||||||||||||||||||||||||
Dr. Dieter Schenk | 60 | 60 | 60 | 60 | 50 | 50 | — | — | 170 | 170 | 60 | 60 | 60 | 60 | 82 | 50 | — | — | 202 | 170 | ||||||||||||||||||||||||||||||||||||||||||
Dr. Ulf M. Schneider(2) | 160 | 160 | — | — | 70 | 70 | — | 7 | 230 | 237 | ||||||||||||||||||||||||||||||||||||||||||||||||||||
Dr. Walter L. Weisman | 40 | 40 | 40 | 40 | 50 | 50 | 60 | 67 | 190 | 197 | ||||||||||||||||||||||||||||||||||||||||||||||||||||
William P. Johnston | 40 | 40 | 40 | 40 | 120 | 120 | 40 | 47 | 240 | 247 | ||||||||||||||||||||||||||||||||||||||||||||||||||||
Prof. Dr. Bernd Fahrholz(3) | — | — | 80 | 80 | — | — | 50 | 50 | 130 | 130 | ||||||||||||||||||||||||||||||||||||||||||||||||||||
Rolf A. Classon | 40 | 40 | 40 | 40 | 60 | 60 | — | — | 140 | 140 | ||||||||||||||||||||||||||||||||||||||||||||||||||||
Pascale Witz(4) | 0 | 0 | 51 | — | — | — | — | — | 51 | — | ||||||||||||||||||||||||||||||||||||||||||||||||||||
Dr. Ulf M. Schneider(5) | 80 | 160 | — | — | 35 | 70 | — | — | 115 | 230 | ||||||||||||||||||||||||||||||||||||||||||||||||||||
Dr. Walter L. Weisman(6) | 15 | 40 | 15 | 40 | 18 | 50 | 22 | 60 | 70 | 190 | ||||||||||||||||||||||||||||||||||||||||||||||||||||
Prof. Dr. Bernd Fahrholz(7) | — | — | 29 | 80 | — | — | 18 | 50 | 47 | 130 | ||||||||||||||||||||||||||||||||||||||||||||||||||||
| | | | | | | | | | | | | | | | | | | | | | | | | | | | | | | | | | | | | | | | | | | | | | | | | | | | | | | | | | | | | | | |
Total | $ | 380 | $ | 380 | $ | 380 | $ | 380 | $ | 410 | $ | 410 | $ | 190 | $ | 218 | $ | 1,360 | $ | 1,388 | $ | 366 | $ | 380 | $ | 406 | $ | 380 | $ | 426 | $ | 410 | $ | 204 | $ | 190 | $ | 1402 | $ | 1360 | ||||||||||||||||||||||
| | | | | | | | | | | | | | | | | | | | | | | | | | | | | | | | | | | | | | | | | | | | | | | | | | | | | | | | | | | | | | | | |
| | | | | | | | | | | | | | | | | | | | | | | | | | | | | | | | | | | | | | | | | | | | | | | | | | | | | | | | | | | | | | | |
C. Board Practices
For information relating to the terms of office of the Management Board and the supervisory board of the General Partner, Management AG, and of the Supervisory Board, of FMC-AG & Co. KGaA, and the periods in which the members of those bodies have served in office, see Item 6.A, "Directors, Senior Management and Employees – Directors and Senior Management," above. For information regarding certain compensation payable to certain members of the General Partner's Management Board after termination of employment, see Item 6.B, "Directors, Senior Management and Employees – Compensation – Commitments to Members of
Management for the Event of the Termination of their Employment" above. Determination of the compensation system and of the compensation to be granted to the members of the Management Board is made by the full supervisory board of Management AG. It is assisted in these matters, particularly evaluation and assessment of the compensation of the members of the General Partner's management board, by the Human Resources Committee of the General Partner's supervisory board, the members of which are Dr. Ulf M. Schneidercurrently Stephan Sturm (Chairman), Dr. Gerd Dr.Gerd Krick (Vice Chairman), Mr.Rolf A. Classon, William P. Johnston, and Dr. Walter L. Weisman.Dieter Schenk.
The Audit and Corporate Governance Committee of the Supervisory Board currently consists of FMC-AG & Co. KGaA consisted of Dr. Walter L. WeismanWilliam P. Johnston (Chairman), Prof. Dr. Bernd FahrholzRolf A. Classon (Vice Chairman), Dr. Gerd Krick and Mr. William P. Johnston,Deborah Doyle McWhinney, all of whom are independent directors for purposes of SEC Rule 10A-3. The primary function of the Audit and Corporate Governance Committee is to assist FMC-AG & Co. KGaA's Supervisory Board in fulfilling its oversight responsibilities, primarily through:
The Audit and Corporate Governance Committee has also been in charge of conducting the internal investigation described in Item 15B, "Management's annual report on internal control over financial reporting."
In connection with the settlement of the shareholder proceedings contesting the resolutions of the Extraordinary General Meeting ("EGM") held August 30, 2005, that approved the transformation, the conversion of our preference shares into ordinary shares and related matters, we established a joint committee (the "Joint Committee") (gemeinsamer Ausschuss) of FMC-AG & Co. KGaA consisting of four members two of which are members of the supervisory board of the General Partner, Management AG, designated by it, and two of which are members of our Supervisory Board elected by the AGM. The two members designated by eachfrom the supervisory board to adviseof the General Partner are Dr. Gerd Krick and decideStephan Sturm. The two members from our Supervisory Board are Rolf A. Classon and William P. Johnston. The Joint Committee advises and decides on certain extraordinary management measures, including:
Furthermore, a nomination committee prepares candidate proposals for the supervisory board and suggests suitable candidates to supervisory board and for its nomination prospects to the General Meeting. The nomination committee consistedconsists of Dr. Gerd Krick (Chairman), Dr. Walter L. Weisman, Dr. Dieter Schenk.Schenk (Vice Chairman) and Rolf A. Classon.
The supervisory board of our General Partner, Management AG, is supported by a Regulatory and Reimbursement Assessment Committee (the "RRAC") whose members were Mr.are currently Rolf A. Classon (Chairman), William P. Johnston (Chairman), Mr. Rolf A. Classon (Vice-Chairman)(Vice Chairman) and Dr. Dieter Schenk. The primary function of the RRAC is to assist and to represent the board in fulfilling its responsibilities, primarily through assessing the Company's affairs in the area of its regulatory obligations and reimbursement structures for dialysis services. In the United States, these reimbursement regulations are mandated by the HHS and CMS for dialysis services. Similar regulatory agencies exist country by country in the International regions to address the conditions for payment of dialysis treatments. Furthermore, the supervisory board of Management AG has its own nomination committee, which consistedconsists of Dr. Ulf. M. SchneiderStephan Sturm (Chairman), Dr. Gerd Krick, and Dr. Walter L. Weisman.Dieter Schenk
We are exempt from the NYSE rule requiring companies listed on that exchange to maintain compensation committees consisting of independent directors. See Item 16G, "Corporate Governance."
D. Employees
At December 31, 2014,2016, we had 99,895109,319 employees (full-time equivalents) as compared to 90,690104,033 at December 31, 2013,2015, and 86,15399,895 at December 31, 2012.2014. The 10%5% increase in 20142016 was mainly due to the overall growth in our business and acquisitions. The following table shows the number of employees by our major category of activities for the last three fiscal years.
| | 2014 | 2013 | 2012 | 2016 | 2015 | 2014 | ||||||||||||||
|---|---|---|---|---|---|---|---|---|---|---|---|---|---|---|---|---|---|---|---|---|
North America | ||||||||||||||||||||
Health Care | 50,085 | 45,651 | 42,695 | 55,653 | 52,886 | 50,085 | ||||||||||||||
Dialysis Products | 1,244 | 1,150 | 1,245 | 1,139 | 1,034 | 1,244 | ||||||||||||||
| | | | | | | | | | | | | | | | | | | | | |
| 51,329 | 46,801 | 43,940 | 56,792 | 53,920 | 51,329 | |||||||||||||||
| | | | | | | | | | | | | | | | | | | | | |
International | ||||||||||||||||||||
Europe/Middle East/ Africa | ||||||||||||||||||||
Health Care | 14,597 | 13,595 | 13,280 | |||||||||||||||||
Dialysis Products | 3,469 | 3,100 | 3,022 | |||||||||||||||||
| | | | | | | | | | | | ||||||||||
| 18,066 | 16,695 | 16,302 | ||||||||||||||||||
| | | | | | | | | | | | ||||||||||
Asia-Pacific | ||||||||||||||||||||
Health Care | 7,082 | 6,454 | 6,123 | |||||||||||||||||
Dialysis Products | 2,039 | 1,806 | 1,595 | |||||||||||||||||
| | | | | | | | | | | | ||||||||||
| 9,121 | 8,260 | 7,718 | ||||||||||||||||||
| | | | | | | | | | | | ||||||||||
Latin America | ||||||||||||||||||||
Health Care | 27,677 | 24,355 | 23,529 | 8,332 | 8,207 | 8,274 | ||||||||||||||
Dialysis Products | 5,409 | 5,247 | 4,881 | 869 | 798 | 792 | ||||||||||||||
| | | | | | | | | | | | | | | | | | | | | |
| 33,086 | 29,602 | 28,410 | 9,201 | 9,005 | 9,066 | |||||||||||||||
| | | | | | | | | | | | | | | | | | | | | |
Corporate | 15,480 | 14,287 | 13,803 | 16,139 | 16,153 | 15,480 | ||||||||||||||
Total Company | 99,895 | 90,690 | 86,153 | 109,319 | 104,033 | 99,895 | ||||||||||||||
| | | | | | | | | | | | | | | | | | | | | | |
| | | | | | | | | | | | | | | | | | | | | |
We are members of the Chemical Industry Employers Association for most sites in Germany and we are bound by union agreements negotiated with the respective union representatives. We generally apply the principles of the association and the related union agreements for those sites where we are not members. We are also party to additional shop agreements negotiated with works councils at individual facilities that relate to those facilities. In addition, approximately 3% of our U.S. employees are covered by collective bargaining agreements. During the last three fiscal years, we have not suffered any labor-related work disruptions.
E. Share ownership
As of December 31, 2014,2016, no member of the Supervisory Boardsupervisory board of our General Partner or the Management Board beneficially owned 1% or more of our outstanding shares. At December 31, 2014, 2016,
Management Board members of the General Partner held options to acquire 1,485,076 ordinary1,010,784 shares of which options to purchase 627,984 ordinary260,183 shares were exercisable at a weighted average exercise price of €36.85€48 ($44.74)51). See Item 6.B, "Directors, Senior Management and Employees – Compensation". Those options expire at various dates between 20142017 and 2021.2023.
Options Stock option and other share based plans are discussed in detail in Note 15 of the Notes to Purchase Our Securities
Stock Option and Other Share Basedour Consolidated Financial Statements, "Share-based Plans
– Fresenius Medical Care AG & Co. KGaA Long Term Incentive Program 2011
On May 12, 2011, the FMC-AG & Co. KGaA Stock Option Plan 2011 ("2011 SOP") was established by resolution of the AGM. The 2011 SOP, together with the Phantom Stock Plan 2011, which was established by resolution of the General Partner's management and supervisory boards, forms the Company's Long Term Incentive Program 2011 ("2011 LTIP"). Under the 2011 LTIP, participants will be granted awards, which will consist of a combination of stock options and phantom stock. Awards under the 2011 LTIP will be granted over a five-year period and can be granted on the last MondayShare-based Plans" included in July and/or the first Monday in December each year. Prior to the respective grant, the participants will be able to choose how much of the granted value is granted in the form of stock options and phantom stock in a predefined range of 75:25 to 50:50, stock options v. phantom stock. The amount of phantom stock that plan participants may choose to receive instead of stock options within the aforementioned predefined range is determined on the basis of a fair value assessment pursuant to a binomial model. With respect to grants made in July, this fair value assessment will be conducted on the day following the AGM and with respect to the grants made in December, on the first Monday in October.
Members of the Management Board of the General Partner, members of the management boards of the Company's affiliated companies and the managerial staff members of the Company and of certain affiliated companies are entitled to participate in the 2011 LTIP. With respect to participants who are members of the General Partner's Management Board, the General Partner's supervisory board has sole authority to grant awards and exercise other decision making powers under the 2011 LTIP (including decisions regarding certain adjustments and forfeitures). The General Partner has such authority with respect to all other participants in the 2011 LTIP.
The awards under the 2011 LTIP are subject to a four-year vesting period. The vesting of the awards granted is subject to achievement of performance targets measured over a four-year period beginning with the first day of the year of the grant. For each such year, the performance target is achieved if the
Company's adjusted basic income per ordinary share ("Adjusted EPS"), as calculated in accordance with the 2011 LTIP, increases by at least 8% year over year during the vesting period or, if this is not the case, the compounded annual growth rate of the Adjusted EPS reflects an increase of at least 8% per year of the Adjusted EPS during the four-year vesting period. At the end of the vesting period, one-fourth of the awards granted is forfeited for each year in which the performance target is not achieved. All awards are considered vested if the compounded annual growth rate of the Adjusted EPS reflects an increase of at least 8% per year during the four-year vesting period. Vesting of the portion or portions of a grant for a year or years in which the performance target is met does not occur until completion of the four-year vesting period.
The 2011 LTIP was established with a conditional capital increase up to €12,000,000 subject to the issue of up to twelve million non-par value bearer ordinary shares with a nominal value of €1.00, each of which can be exercised to obtain one ordinary share. Of these twelve million shares, up to two million stock options are designated for members of the Management Board of the General Partner, up to two and a half million stock options are designated for members of management boards of direct or indirect subsidiaries of the Company and up to seven and a half million stock options are designated for managerial staff members of the Company and such subsidiaries. The Company may issue new shares to fulfill the stock option obligations or the Company may issue shares that it has acquired or which the Company itself has in its own possession.
The exercise price of stock options granted under the 2011 LTIP shall be the average stock exchange price on the Frankfurt Stock Exchange of the Company's ordinary shares during the 30 calendar days immediately prior to each grant date. Stock options granted under the 2011 LTIP have an eight-year term and can be exercised only after a four-year vesting period. Stock options granted under the 2011 LTIP to US participants are non-qualified stock options under the United States Internal Revenue Code of 1986, as amended. Options under the 2011 LTIP are not transferable by a participant or a participant's heirs, and may not be pledged, assigned, or disposed of otherwise.
Phantom stock under the 2011 LTIP entitles the holders to receive payment in Euro from the Company upon exercise of the phantom stock. The payment per phantom share in lieu of the issuance of such stock shall be based upon the stock exchange price on the Frankfurt Stock Exchange of one of the Company's Ordinary shares on the exercise date. Phantom stock will have a five-year term and can be exercised only after a four-year vesting period, beginning with the grant date. For participants who are U.S. tax payers, the phantom stock is deemed to be exercised in any event in the March following the end of the vesting period.
Incentive plan
In 2014, the Management Board was eligible for performance – related compensation that depended upon achievement of targets. The targets are measured by reference to operating income margin, net income growth and free cash flow (net cash provided by operating activities after capital expenditures before acquisitions and investments) in percentage of revenue, and are derived from the comparison of targeted and actually achieved current year figures. Targets are divided into Group level targets and those to be achieved in individual regions and areas of responsibility.
Those performance-related bonuses for fiscal year 2014 will consist proportionately of a cash component and a share-based component which will be paid in cash. Upon meeting the annual targets, the cash component will be paid after the end of 2014. The share-based component is subject to a three- or four-year vesting period, although a shorter period may apply in special cases. The amount of cash for the payment relating to the share-based component shall be based on the closing share price of Fresenius Medical Care AG & Co. KGaA ordinary shares upon exercise. The amount of the achievable bonus for each of the members of the Management Board is capped.
The share-based compensation incurred under these plans for years 2014, 2013 and 2012 was $ 1.0 million, $ 1.1 million and $ 2.8 million, respectively.
Fresenius Medical Care AG & Co. KGaA Stock Option Plan 2006 and prior plans
On May 9, 2006, as amended on May 15, 2007 for a three-for-one share split (the "Share Split"), the FMC-AG & Co. KGaA Stock Option Plan 2006 (the "Amended 2006 Plan") was established by resolution of our AGM with a conditional capital increase up to €15,000,000 subject to the issue of up to fifteen million no par value bearer ordinary shares with a nominal value of €1.00 each. Under the Amended 2006
Plan, up to fifteen million options can be issued, each of which can be exercised to obtain one ordinary share, with up to three million options designated for members of the management board, up to three million options designated for members of management boards of direct or indirect subsidiaries of the Company and up to nine million options designated for managerial staff members of the Company and such subsidiaries. With respect to participants who are members of the Management Board, the General Partner's supervisory board has sole authority to grant stock options and exercise other decision making powers under the Amended 2006 Plan (including decisions regarding certain adjustments and forfeitures). The Management Board has such authority with respect to all other participants in the Amended 2006 Plan.
Options under the Amended 2006 Plan were granted the last Monday in July and/or the first Monday in December. The exercise price of options granted under the Amended 2006 Plan shall be the average closing price on the Frankfurt Stock Exchange of our ordinary shares during the 30 calendar days immediately prior to each grant date. Options granted under the Amended 2006 Plan have a seven-year term but can be exercised only after a three-year vesting period. The vesting of options granted is subject to achievement of performance targets, measured over a three-year period from the grant date. For each such year, the performance target is achieved if our adjusted basic income per ordinary share ("EPS"), as calculated in accordance with the Amended 2006 Plan, increases by at least 8% year over year during the vesting period, beginning with EPS for the year of grant as compared to EPS for the year preceding such grant. Calculation of EPS under the Amended 2006 Plan excludes, among other items, the costs of the transformation of our legal form to a KGaA and the conversion of preference shares into ordinary shares. For each grant, one-third of the options granted are forfeited for each year in which EPS does not meet or exceed the 8% target. The performance targets for 2013, 2012, and 2011 were met but the options that vested will not be exercisable until expiration of the full 3-year vesting period of each year's grants. Vesting of the portion or portions of a grant for a year or years in which the performance target is met does not occur until completion of the entire three-year vesting period. The last grant under the Amended 2006 Plan took place on December 6, 2010. No further grants are possible under the Amended 2006 Plan. For information regarding options granted to each member of the Management Board, see Item 6.B, "– Compensation of the Management Board" above.
Options granted under the Amended 2006 Plan to U.S. participants are non-qualified stock options under the United States Internal Revenue Code of 1986, as amended. Options under the Amended 2006 Plan are not transferable by a participant or a participant's heirs, and may not be pledged, assigned, or otherwise disposed of.
At December 31, 2014, we had awards outstanding under the terms of various prior stock-based compensation plans, including the 2001 plan. Under the 2001 plan as amended on May 16, 2013 for a conversion of preference shares to ordinary shares, convertible bonds with a principal of up to €10,240,000 were issued to the members of the Management Board and other employees of the Company initially representing grants for up to 4 million non-voting Preference shares. Following the Share Split in 2007 and the conversion of preference shares into ordinary shares in 2013, the convertible bonds have a par value of €0.85, bear interest at a rate of 5.5% and are entitled to convert into ordinary shares instead of non-voting preference shares. Except for the members of the Management Board, eligible employees were able to purchase the bonds by issuing a non-recourse note with terms corresponding to the terms of and secured by the bond. We have the right to offset our obligation on a bond against the employee's obligation on the related note; therefore, the convertible bond obligations and employee note receivables represent stock options we issued and are not reflected in the consolidated financial statements. The options expire in ten years and one third of each grant can be exercised beginning after two, three or four years from the date of the grant. Bonds issued to Board members who did not issue a note to us are recognized as a liability on our balance sheet.
Upon issuance of the option, the employees had the right to choose options with or without a stock price target. The conversion price of options subject to a stock price target becomes the stock exchange quoted price of the ordinary shares upon the first time the stock exchange quoted price exceeds the initial value by at least 25%. The initial value ("Initial Value") is the average price of the shares during the last 30 trading days prior to the date of grant. In the case of options not subject to a stock price target, the number of convertible bonds awarded to the eligible employee would be 15% less than if the employee elected options subject to the stock price target. The conversion price of the options without a stock price target is the Initial Value, as adjusted in accordance to the Share Split. Each option entitles the holder thereof, upon payment the respective conversion price, to acquire one ordinary share. Up to 20% of the total
amount available for the issuance of awards under the 2001 plan could be issued each year through May 22, 2006. Effective May 2006, no further grants could be issued under the 2001 plan.
At December 31, 2014, the Management Board members held 1,485,076 stock options for Ordinary shares and employees of the Company held 7,704,555 stock options for ordinary shares with an average remaining contractual life of 4.59 years and 2,539,493 exercisable ordinary options at a weighted average exercise price of $45.38.report.
Item 7. Major Shareholders and Related Party Transactions
A. Major Shareholders
Security Ownership of Certain Beneficial Owners of Fresenius Medical Care
Our outstanding share capital consists of ordinary shares issued only in bearer form. Accordingly, unless we receive information regarding acquisitions of our shares through a filing with the Securities and Exchange Commission or through the German statutory requirements referred to below, or except as described below with respect to our shares held in American Depository Receipt ("ADR") form, we face difficulties precisely determining who our shareholders are at any specified time or how many shares any particular shareholder owns. Because we are a foreign private issuer under the rules of the Securities and Exchange Commission, our directors and officers are not required to report their ownership of our equity securities or their transactions in our equity securities pursuant to Section 16 of the Securities and Exchange Act of 1934. However, persons who become "beneficial owners" of more than 5% of our ordinary shares are required to report their beneficial ownership pursuant to Section 13(d) of the Securities and Exchange Act of 1934.
In addition, under Article 19(1) of the German Securities Trading ActRegulation (EU) No.596/2014 of the European Parliament and of the Council (WertpapierhandelsgesetzMarket Abuse Regulation or "WpHG""MAR"), persons who dischargedischarging managerial responsibilities within an issuer of shares, as well as persons closely associated with them, are obliged to notify the issuer and the competent authority, i.e. the German Federal Financial Supervisory Authority (Bundesanstalt für Finanzdienstleistungsaufsicht or "BaFin") or "BaFin"), of every transaction conducted on their own transactions inaccount relating to the shares or debt instruments of the issuer. This obligation also appliesissuer or to persons who are closely associated withderivatives or other financial instruments linked thereto no later than three business days after the personsdate of the transaction. Persons discharging managerial responsibility.responsibilities include the members of management as well as supervisory boards. Additionally, holders of voting securities of a German company listed on the regulated market (Regulierter Markt) of a German stock exchange or a corresponding trading segment of a stock exchange within the European Union are, under Section 21(1) of the German Securities Trading Act (Wertpapierhandelsgesetz or "WpHG"), obligated to notify the company of the level of their holding whenever such holding reaches, exceeds or falls below certain thresholds, which have been set at 3%, 5%, 10%, 15%, 20%, 25%, 30%, 50% and 75% of a company's outstanding voting rights. Such notification obligations will also apply to other financial instruments that result in an entitlement to acquire shares or that cause the hedging of shares (excluding the 3% threshold).
We have been informed that as of February 18, 2015,16, 2017, Fresenius SE owned 94,380,382, approximately 31.1%30.82%, of our ordinary shares. The following schedule illustratesWe are informed of the latest threshold notifications furnished to us by third parties pursuant to the German Securities Trading Act:WpHG. On September 30, 2016, BlackRock, Inc., a Delaware corporation, provided a group voting rights notification, stating that 4.97% of the voting rights of FMC-AG & Co. KGaA were held as of September 27, 2016. Additionally, on January 27, 2017, the Ministry of Finance on behalf of the State of Norway provided a group voting rights notification, stating that 2.97% of the voting rights of FMC-AG & Co. KGaA were held as of January 26, 2017.
Voting Rights Notifications (Last Reported Status)
Notifying party | Date of reaching, exceeding or falling bellow | Reporting threshold | Reporting criteria | Percentage of voting rights | Number of voting rights at notification date | ||||||||
|---|---|---|---|---|---|---|---|---|---|---|---|---|---|
| BlackRock Financial Management, Inc., New York, USA | September 25, 2014 | 5% falling below, 3% exceeding | Attribution pursuant to Section 22 (1) sentence 1 No. 6 as well as (1) sentence 2 WpHG | 4.04 | 12,537,228 | ||||||||
| BlackRock Holdco 2, Inc., Wilmington, USA | September 25, 2014 | 5% falling below, 3% exceeding | Attribution pursuant to Section 22 (1) sentence 1 No. 6 as well as (1) sentence 2 WpHG | 4.05 | 12,554,058 | ||||||||
| BlackRock, Inc., New York, USA | September 25, 2014 | 5% falling below, 3% exceeding | Attribution pursuant to Section 22 (1) sentence 1 No. 6 as well as (1) sentence 2 WpHG | 4.11 | 12,750,189 | ||||||||
Table As the sole shareholder of Contents
our General Partner, Fresenius SE is barred from voting its shares on certain matters. See Item 16.G, "Corporate Governance – Supervisory Board." Except for certainthese limitations on Fresenius SE's right to vote its shares as described below, all of our ordinary shares have the same voting rights. However, as the sole shareholder of our General Partner, Fresenius SE is barred from voting its ordinary shares on certain matters. See Item 16.G, "Corporate Governance – Supervisory Board."
Bank of New York Mellon, our ADR depositary, informed us, that as of December 31, 2014, 20,502,564 ordinary2016, 24,696,456 ADSs, each representing one half of an ordinarya share, were held of record by 3,5033,169 U.S. holders. For more information regarding ADRs and ADSs see Item 10.B, "Memorandum and Articles"Articles of Association – Description of American Depositary Receipts."
Security Ownership of Certain Beneficial Owners of Fresenius SE
Fresenius SE's share capital consists solely of ordinary shares, issued only in bearer form. Accordingly, Fresenius SE has difficulties precisely determining who its shareholders are at any specified time or how many shares any particular shareholder owns. However, under the German Securities Trading Act,WpHG, holders of voting securities of a German company listed on the regulated market (Regulierter Markt) of a German stock exchange or a corresponding trading segment of a stock exchange within the European Union are obligated to notify thea company of certain levels of holdings, as described above.
The Else Kröner-Fresenius Stiftung is the sole shareholder of Fresenius Management SE, the general partner of Fresenius SE, and has sole power to elect the supervisory board of Fresenius Management SE. In addition, based on the most recent information available, Else Kröner-Fresenius Stiftung owns approximately 26.7%26.2% of the Fresenius SE ordinary shares. See Item 7.B, "Related party transactions – Other interests," below.
B. Related party transactions
In connection with the formation of FMC-AG & Co. KGaA, and the combination of the dialysis businesses of Fresenius SE and W.R. Grace & Co. in 1996, Fresenius SE and its affiliates and FMC-AG & Co. KGaA and its affiliates entered into several agreements for the purpose of giving effect to the Merger and defining our ongoing relationship. Fresenius SE and W.R. Grace & Co. negotiated these agreements. The information below summarizes the material aspects of certain agreements, arrangements and transactions between FMC-AG & Co. KGaA and Fresenius SE, their affiliates and their affiliates.with certain of our equity method investees. For further information, see Note 2 of the Notes to the Consolidated Financial Statements, "Related Party Transactions," included in this report. The following descriptions are not complete and are qualified in their entirety by reference to those agreements, which have been filed with the Securities and Exchange Commission and the New York Stock Exchange. We believe that the leases, the supply agreements and the service agreements are no less favorable to us and no more favorable to Fresenius SE than would have been obtained in arm's-length bargaining between independent parties. The trademark and other intellectual property agreements summarized below were negotiated by Fresenius SE and W.R. Grace & Co., and, taken independently, are not necessarily indicative of market terms.
Dr. Gerd Krick, Chairman of our Supervisory Board, is also a member of the supervisory board of our General Partner as well as Chairman of the supervisory board of Fresenius SE and Chairman of the supervisory board of its general partner, Fresenius Management SE. Dr. Dieter Schenk, Vice Chairman of the supervisory board of our General Partner and of the Supervisory Board of FMC-AG & Co. KGaA, is also Vice Chairman of the supervisory board of Fresenius Management SE, and Dr. Ulf M. Schneider, Chairman of the supervisory board of our General Partner and a former member of the Management Board of FMC-AG & Co. KGaA, is Chairman of the management board of Fresenius Management SE. Mr. Rolf A. Classon, Dr. Walter L. Weisman and Mr. William P. Johnston are members of both our Supervisory Board and our general partner's supervisory board.
In the discussion below regarding our contractual and other relationships with Fresenius SE:
Real Property LeaseLeases
We did not acquire the land and buildings in Germany that Fresenius Worldwide Dialysis used when we were formed in 1996. Fresenius SE or its affiliates have leased part of the real property to us, directly,
and transferred the remainder of that real property to two limited partnerships. Fresenius SE is the sole limited partner of each partnership, and the sole shareholder of the general partner of each partnership. These limited partnerships, as landlords, have leased the properties to us and to our affiliates, as applicable, for use in our respective businesses. The aggregate annual rent payable by us under these leases is approximately €21.0 million, which was approximately $27.9 million for the period ended December 31, 2014, exclusive of maintenance and other costs, and is subject to escalation, based upon development of the German consumer-price-index determined by the Federal Statistical Office(Statistisches Bundesamt). The leases for manufacturing facilities have a ten-year term, followed by two successive optional renewal terms of ten years each at our election. The leases for the other facilities have a term of ten years. The current option period for the lease agreements is set to expire in 2016. Based upon an appraisal, we believe that the rents under the leases represent fair market value for such properties. For information with respect to our principal properties, in Germany, see "Item 4.D. Property, plantsplant and equipment." For discussion of related party leases, see "Note 2 of the Notes to the Consolidated Financial Statements, "Related Party Transactions – Service Agreements, Lease Agreements and Products" included in this report.
Trademarks
Fresenius SE continues to own the name and mark "Fresenius" and its "F" logo. Fresenius SE and Fresenius Medical Care Deutschland GmbH, one of our German subsidiaries, have entered into agreements containing the following provisions. Fresenius SE has granted to our German subsidiary, for our benefit and that of our affiliates, an exclusive, worldwide, royalty-free, perpetual license to use "Fresenius Medical Care" in our company names, and to use the Fresenius marks, including some combination marks containing the Fresenius name that were used by the worldwide dialysis business of Fresenius SE, and the "Fresenius Medical Care" name as a trade name, in all aspects of the renal business. Our German subsidiary, for our benefit and that of our affiliates, has also been granted a worldwide, royalty-free, perpetual license:
We and our affiliates have the right to use "Fresenius Medical Care" as a trade name in other medical businesses only with the consent of Fresenius SE. Fresenius SE may not unreasonably withhold its consent. In the U.S. and Canada, Fresenius SE will not use "Fresenius" or the "F" logo as a trademark or service mark, except that it is permitted to use "Fresenius" in combination with one or more additional words such as "Pharma Home Care" as a service mark in connection with its home care business and may use the "F" logo as a service mark with the consent of our principal German subsidiary. Our subsidiary will not unreasonably withhold its consent if the service mark includes one or more additional descriptive words or symbols. Similarly, in the U.S. and Canada, Fresenius SE has the right to use "Fresenius" as a trade name, but not as a mark, only in connection with its home care and other medical businesses other than the renal business and only in combination with one or more other descriptive words, provided that the name used by Fresenius SE is not confusingly similar to our marks and trade names. Fresenius SE's ten-year covenant not to compete with us, granted in 1996, has expired, and Fresenius SE may use "Fresenius" in its corporate names if it is used in combination with one or more additional distinctive word or words, provided that the name used by Fresenius SE is not confusingly similar to the Fresenius Medical Care marks or corporate or trade names.
Other Intellectual Property
Some of the patents, patent applications, inventions, know-how and trade secrets that Fresenius Worldwide Dialysis used prior to our formation were also used by other divisions of Fresenius SE. For Biofine®, the polyvinyl chloride-free packaging material, Fresenius SE has granted to our principal German subsidiary, for our benefit and for the benefit of our affiliates, an exclusive license for the renal business and a non-exclusive license for all other fields except other non-renal medical businesses. Our German subsidiary and Fresenius SE share equally any royalties from licenses of the Biofine® intellectual property by either our German subsidiary or by Fresenius SE to third parties outside the renal business and the other non-renal medical businesses. In addition, Fresenius SE transferred to our German subsidiary the other patents, patent applications, inventions, know-how and trade secrets that were used
predominantly in Fresenius SE's dialysis business. In certain cases Fresenius Worldwide Dialysis and the other Fresenius SE divisions as a whole each paid a significant part of the development costs for patents, patent applications, inventions, know-how and trade secrets that were used by both prior to the Merger. Where our German subsidiary acquired those jointly funded patents, patent applications, inventions, know-how and trade secrets, our subsidiary licensed them back to Fresenius SE exclusively in the other non-renal medical businesses and non-exclusively in all other fields. Where Fresenius SE retained the jointly funded patents, patent applications, inventions, know-how and trade secrets, Fresenius SE licensed them to our German subsidiary exclusively in the renal business and non-exclusively in all other fields.
Supply Agreements and Arrangements
We produce most of our products in our own facilities. However, Fresenius Kabi AG, a wholly-owned subsidiary of Fresenius SE, manufactures some of our products for us, principally dialysis concentrates and other solutions, at facilities located in Germany, Brazil, France and South Africa. Conversely, our facilities in Germany and Italy produce products for Fresenius Kabi AG.
Our local subsidiaries and those of Fresenius SE have entered into supply agreements for the purchase and sale of products from the above facilities. Prices under the supply agreements are determined by good-faith negotiation. During 2014,2016, we sold products to Fresenius SE in the amount of $63.9$26 million. In 2014,2016, we made purchases from Fresenius SE in the amount of $25.2$48 million.
The parties may modify existing or enter into additional supply agreements, arrangements and transactions. Any future modifications, agreements, arrangements and transactions will be negotiated between the parties and will be subject to the approval provisions of the pooling agreements and the regulatory provisions of German law regarding dominating enterprises.
On September 10, 2008, Fresenius Kabi AG acquired Fresenius Kabi USA, Inc. (formerly APP Pharmaceuticals Inc.) ("Kabi USA"), which manufactures and sells sodium heparin. Heparin is a blood thinning drug that is widely and routinely used in the treatment of dialysis patients to prevent life-threatening blood clots. FMCH currently purchases heparin supplied by Kabi USA through MedAssets Performance Management Solutions, Inc. ("MedAssets"), a subsidiary of Vizient, Inc. MedAssets Inc. is a publicly-traded U.S. corporation that provides inventory purchasing services to healthcare providers through a group purchasing organization ("GPO") structure. The Company has no direct supply agreement with Kabi USA and does not submit purchase orders directly to Kabi USA. A GPO is an organization that endeavors to manage supply and service costs for hospitals and
healthcare providers by negotiating discounted prices with manufacturers, distributors and other vendors. Vendors discount their prices and pay administrative fees to GPOs because GPOs provide access to a large customer base, thus reducing vendors' sales and marketing costs and overhead. FMCH is one of many U.S. healthcare providers that participate in the MedAssets GPO. FMCH purchases pharmaceuticals and supplies used in its dialysis services business through the MedAssets GPO contract. The Company has no direct supply agreement with Kabi USA and does not submit purchase orders directly to Kabi USA. During 2014,2016, we acquired $19.5$21.8 million of heparin from Kabi USA through the GPO.
On July 3, 2013, we entered into an agreement with a Fresenius SE company for the manufacturing of plasma collection devices. We agreed to produce 3,500 units which can be further increased to a maximum of 4,550 units, over the length of the five year contract. AOn January 1, 2015, this manufacturing business was sold to Kabi USA for $9 million for which a fairness opinion was also obtained from a reputable global accounting firm. Production of these units commenced in March of 2014 with an estimated contract value of approximately $55 million. A contract has been signed on January 1, 2015 to sell certain assets and liabilities related to the manufacturing facility to Kabi USA in the amount of $9.3 million. The disposal will bewas accounted for as a transaction between parties under common control.control at the carrying amounts without the generation of profits.
In December 2010, the Company formed a renal pharmaceutical company with Galenica Ltd., named VFMCRP, an equity method investee of which the Company owns 45%. Further, in 2015 and in 2016 the Company entered into exclusive supply agreements to purchase ESAs. See Item 4, "Information on the Company – Business Overview – Renal Pharmaceuticals," for additional information.
Services Agreement
We obtain administrative and other services from Fresenius SE headquarters and from other divisions and subsidiaries of Fresenius SE. These services relate to, among other things, administrative services, management information services, employee benefit administration, insurance, ITinformation technology services, tax services and treasury management services. For 2014,2016, Fresenius SE and its affiliates charged us approximately $90.0$104 million for these services. Conversely, we have provided certaincentral purchasing services to other divisions and subsidiaries of Fresenius SE relating to research and development, central purchasing and warehousing.SE. For 20142016 we charged approximately $8.3$3 million to Fresenius SE and its subsidiaries for services we rendered to them.
We and Fresenius SE may modify existing or enter into additional services agreements, arrangements and transactions. Any such future modifications, agreements, arrangements and transactions will be negotiated between the parties and will be subject to the approval provisions of the pooling agreements and the regulations of German law regarding dominating enterprises.
Financing
During 2014, we received advances between €1.4 million and €298.5 million which carried interest rates between 1.188% and 1.644%. SeeFor information on our related party financing arrangements, please see Note 102 of the Notes to the Consolidated Financial Statements, "Short-Term Borrowings and Short-Term Borrowings from Related Parties"Related Party Transactions – Short-Term Borrowings from Related Parties." On May 23, 2014, the maturity date, the Company repaid a Chinese Yuan Renminbi ("CNY") loan, with interest, of 361 million ($58 million) to a subsidiary of Fresenius SE. On August 19, 2009, the Company borrowed €1.5 million ($1.8 million) from the General Partner at 1.335%. The loan repayment is currently scheduled for August 20, 2015 at an interest rate of 1.849%. On November 28, 2013, the Company borrowed an additional €1.5 million ($1.8 million) from the General Partner at 1.875%. This loan is due on November 27, 2015 at an interest rate 1.506%.
At December 31, 2014 and December 31, 2013, a subsidiary of Fresenius SE held unsecured Senior Notes issued by the CompanyFinancing" included in the amount of €8.3 million and €11.8 million ($10.1 million at December 31, 2014 and $16.3 million at December 31, 2013), respectively. The Senior Notes were issued in 2011 and 2012, mature in 2021 and 2019, respectively, and have a coupon rate of 5.25% with interest payable semiannually.
At December 31, 2014 Fresenius SE held unsecured Senior Notes issued by the Company in the amount of $1.2 million. The Senior Notes were issued in 2014, mature in 2020 and 2024, respectively, and have a coupon rate of 4.125% and 4.75% with interest payable semiannually. As of January 7, 2015, Fresenius SE sold all positions held on these Senior Notes.
The Company is party to an unsecured loan agreement with Fresenius SE under which the Company or its subsidiaries may request and receive one or more short-term advances up to an aggregate amount of $400 million until maturity on October 30, 2017. The interest on the advance(s) will be at a fluctuating rate per annum equal to LIBOR or EURIBOR, as applicable, plus applicable margin. Advances can be repaid and reborrowed. On December 31, 2014, the Company received an advance of €1.4 million ($1.7 million) at an interest rate of 1.188%.this report.
Other Interests
Dr. Dieter Schenk, Vice Chairmanvice chairman of the supervisory boards of FMC-AG Co. KGaA and of Management AG and a member of the supervisory board of Fresenius Management SE, is a partner in the law firm of Noerr LLP, which has provided legal services to Fresenius SE and its subsidiaries and to FMC-AG & Co. KGaA and its subsidiaries. The Company incurred expenses in the amount of $2.0$1.4 million, $1.3$1.0 million and $1.5$2.0 million for these services during 2013, 20122016, 2015 and 2011,2014, respectively. Dr. Dieter Schenk is also one of the executors of the estate of the late Mrs. Else Kröner. Else Kröner-Fresenius-Stiftung, a charitable foundation established under the will of the late Mrs. Kröner, is the sole shareholder of the general partner of Fresenius SE and owns approximately 26.7%26.4% of the voting shares of Fresenius SE. Dr. Dieter Schenk is also the Chairmanchairman of the advisory boardFoundation Board of Else Kröner-Fresenius-Stiftung. See "– Security Ownership of Certain Beneficial Owners of Fresenius SE."
UnderDr. Gerd Krick, Chairman of the ArticlesSupervisory Board of Association of FMC AGFMC-AG & Co. KGaA, we will payis also a member of the supervisory board of our General Partner as well as Chairman of the supervisory board of Fresenius SE annual compensation for assuming unlimited liability at 4%and chairman of the amountsupervisory board of its general partner, Fresenius Management SE. Dr. Dieter Schenk, vice chairman of the supervisory board of our General Partner's share capital. See Item 16G, "Corporate Governance – The Legal StructurePartner and of FMC AGthe Supervisory Board of FMC-AG & Co. KGaA," below. is also vice chairman of the supervisory board of Fresenius Management SE. Mr. Rolf A. Classon and Mr. William P. Johnston are members of both the Supervisory Board of FMC-AG & Co. KGaA and our General Partner's supervisory board.
General Partner Reimbursement
Management AG is a 100% wholly-owned subsidiary of Fresenius SE. The Company's Articles of Association provide that theFor information on General Partner shall be reimbursed for any and all expenses in connection with management of the Company's business, including compensation of the members of the General Partner's supervisory board and Management Board. The aggregate amount reimbursed to Management AG for 2014 was approximately $25.5 million for its management services during 2014 including $0.2 million as compensation for its exposure to risk as general partner. The Company's Articles of Association fix this compensation as a guaranteed return of 4% of the amount of the General Partner's
share capital (which is currently €3.0 million). Seereimbursement please see, Item 16.G "Governance16G, "Corporate Governance – The Legal Structure of FMC-AGFMC AG & Co. KGaA" below.below as well as Note 2 of the Notes to the Consolidated Financial Statements, "Related Party Transactions – Financing" included in this report.
The information called for by parts 8.A.1 through 8.A.6 of this item is in the section beginning on Page F-1.
The information in Note 2018 of the Notes to Consolidated Financial Statements, "Commitments and Contingencies – Legal and Regulatory Matters," in Part III, Item 18 of this report is incorporated by this reference in response to this item. For information regarding certain tax audits and related claims, see Note 1816 of the Notes to Consolidated Financial Statements, "Income Taxes."
We generally pay annual dividends on our shares in amounts that we determine on the basis of FMC-AG & Co. KGaA's prior year unconsolidated earnings as shown in the statutory financial statements that we prepare under German law on the basis of the accounting principles of the German Commercial Code (Handelsgesetzbuch orHGB), subject to authorization by a resolution to be passed at our general meeting of shareholders. As of June 28, 2013 we converted all preference shares to ordinary shares and all options for preference shares to options for ordinary shares. At December 31, 2014 we have only one class of shares outstanding.AGM.
The General Partner and our Supervisory Board propose dividends and the shareholders approve dividends for payment in respect of a fiscal year at the AGM in the following year. Since all of our shares are in bearer form, we remit dividends to the depositary bank (Depotbank) on behalf of the shareholders.
Our Amended 2012 Credit Agreement restricts our ability to pay dividends under certain circumstances. Item 5.B,Item��5.IV, "Operating and Financial Review and Prospects – Liquidity and Capital Resources" and the notes to our consolidated financial statements appearing elsewhere in this report discuss this restriction.these restrictions.
The table below provides information regarding the annual dividend per share that we paid on our Ordinary shares. These payments were paid in the years shown for the results of operations in the year preceding the payment.
Per Share Amount | 2014 | 2013 | 2012 | |||||||
|---|---|---|---|---|---|---|---|---|---|---|
Ordinary share | € | 0.77 | € | 0.75 | € | 0.69 | ||||
| | 2016 | 2015 | 2014 | |||||||
|---|---|---|---|---|---|---|---|---|---|---|
Per Share Amount | € | 0.80 | € | 0.78 | € | 0.77 | ||||
We have announced that the general partner's Management Board and our Supervisory Board have proposed dividends for 20142016 payable in 20152017 of €0.78€0.96 per ordinary share. These dividends are subject to approval by our shareholders at our AGM to be held on May 19, 2015.11, 2017. Our goal is for dividend development to be more closely aligned with our growth in basic earnings per share, while maintaining dividend continuity.
Except as described herein, holders of ADSs will be entitled to receive dividends on the Ordinary shares represented by the respective ADSs. We will pay any cash dividends payable to such holders to the depositary in euros and, subject to certain exceptions, the depositary will convert the dividends into U.S. dollars and, after deduction of its fees and any taxes, distribute the dividends to ADS holders. See Item 10, "Additional Information – Description of American Depositary Receipts – Share Dividends and Other Distributions." Fluctuations in the exchange rate between the U.S. dollar and the euro will affect the amount of dividends that ADS holders receive. Dividends paid to holders and beneficial holders of the ADSs will be subject to deduction of German withholding tax. You can find a discussion of German withholding tax below in "Item 10.E. Taxation".
Item 9. The Offer and Listing Details
A.4. and C. Information regarding the trading markets for and price history of our stock
Trading Markets
The principal trading market for our ordinary shares is the Frankfurt Stock Exchange (FWB® Frankfurter Wertpapierbörse). All ordinary shares have been issued in bearer form. Accordingly, we face
difficulties determining precisely who our holders of ordinary shares are or how many shares any particular shareholder owns, with the exception of the number of shares held in ADR form in the United States. For more information regarding ADRs see Item 10.B., "Memorandum and articles of association – Description of American Depositary Receipts." However, under the German Securities Trading Act, holders of voting securities of a German company listed on a stock exchange within the EU are obligated to notify the company of certain levels of holdings as described in Item 7.A., "Major Shareholders." Additionally, persons discharging managerial responsibilities and affiliated persons are obliged to notify the supervising authority and the Company of trades in their shares in excess of €5,000 in any year. The ordinary sharesOrdinary Shares of Fresenius Medical Care AG had been listed on the Frankfurt
Stock Exchange since October 2, 1996. Trading in the ordinary sharesOrdinary Shares of FMC-AG & Co. KGaA on the Frankfurt Stock Exchange commenced on February 13, 2006.
Our shares have been listed on the Regulated Market (Regulierter Markt) of the Frankfurt Stock Exchange and on the Prime Standard of the Regulated Market, which is a sub-segment of the Regulated Market with additional post-admission obligations. Admission to the Prime Standard requires the fulfillment of the following transparency criteria: publication of quarterly reports; preparation of financial statements in accordance with international accounting standards (IFRS or U.S. GAAP); publication of a company calendar; convening of at least one analyst conference per year; and publication of ad-hoc messages (i.e., certain announcements of material developments and events) in English. Companies aiming to be listed in this segment have to apply for admission. Listing in the Prime Standard is a prerequisite for inclusion of shares in the selection indices of the Frankfurt Stock Exchange, such as the DAX®, the index of 30 major German stocks.
Since October 1, 1996, ADSs representing our ordinary sharesOrdinary Shares (the "Ordinary ADSs"), have been listed and traded on the New York Stock Exchange ("NYSE") under the symbol FMS. Effective December 3, 2012, we effected a two-for-one split of our Ordinary ADSs outstanding and our Preference ADSs, which changed the ratio of each class ofour ADSs to shares from one ADSs representing one share to two ADSs representing one share. The Depositary for the Ordinary ADSs is Bank of New York Mellon (the "Depositary").
Trading on the Frankfurt Stock Exchange
Deutsche Börse AG operates the Frankfurt Stock Exchange, which is the largest of the six German stock exchanges by value of shares traded. Our shares are traded on Xetra, the electronic trading system of the Deutsche Börse. The trading hours for Xetra are between 9:00 a.m. and 5:30 p.m. Central European Time ("CET"). Only brokers and banks that have been admitted to Xetra by the Frankfurt Stock Exchange have direct access to the system and may trade on it. Private investors can trade on Xetra through their banks and brokers. As of March 2012,April 2016, the most recent figures available, the shares of more than 11,000 companies were traded on Xetra.
Deutsche Börse AG publishes information for all traded securities on the Internet, http://www.deutsche-boerse.com.
Transactions on Xetra and the Frankfurt Stock Exchange settle on the second business day following the trade except for trades executed on Xetra International Markets, the European Blue Chip segment of Deutsche Börse AG, which settle on the third business day following a trade. The Frankfurt Stock Exchange can suspend a quotation if orderly trading is temporarily endangered or if a suspension is deemed to be necessary to protect the public.
The Hessian Stock Exchange Supervisory Authority(Hessische Börsenaufsicht) and the Trading Monitoring Unit of the Frankfurt Stock Exchange (HÜST Handelsüberwachungsstelle) both monitor trading on the Frankfurt Stock Exchange.
The Federal Financial Supervisory Authority (Bundesanstalt für Finanzdienstleistungsaufsicht), an independent federal authority, is responsible for the general supervision of securities trading pursuant to the provisions of the Regulation (EU) No. 596/2014 of the European Parliament and of the Council (Market Abuse Regulation or "MAR"), the German Securities Trading Act (Wertpapierhandelsgesetz or "WpHG") and other applicable laws.
The table below sets forth for the periods indicated, the high and low closing sales prices in euro for our Ordinary shares on the Frankfurt Stock Exchange, as reported by the Frankfurt Stock Exchange Xetra system. All shares on German stock exchanges trade in euro.
As of February 18, 2015,16, 2017, the closing price for shares traded on XETRA was €64.27.€76.64.
| | | Price per share (€) | ||||||||||||||||
|---|---|---|---|---|---|---|---|---|---|---|---|---|---|---|---|---|---|---|
| | | High | Low | |||||||||||||||
2017 | January | 82.20 | 74.69 | |||||||||||||||
2016 | December | 81.75 | 72.31 | |||||||||||||||
November | 77.37 | 71.62 | ||||||||||||||||
October | 77.15 | 74.21 | ||||||||||||||||
September | 80.79 | 77.11 | ||||||||||||||||
August | 85.65 | 78.85 | ||||||||||||||||
2016 | Fourth Quarter | 81.75 | 71.62 | |||||||||||||||
Third Quarter | 85.65 | 76.77 | ||||||||||||||||
| | | Price per ordinary share (€) | Second Quarter | 80.00 | 72.02 | |||||||||||||
| | | High | Low | First Quarter | 82.89 | 71.63 | ||||||||||||
2015 | January | 66.44 | 60.57 | Fourth Quarter | 83.13 | 69.43 | ||||||||||||
2014 | December | 61.85 | 58.30 | |||||||||||||||
November | 59.51 | 57.32 | Third Quarter | 81.58 | 65.28 | |||||||||||||
October | 58.50 | 51.47 | Second Quarter | 81.95 | 74.04 | |||||||||||||
September | 55.40 | 53.74 | First Quarter | 79.86 | 60.57 | |||||||||||||
August | 53.67 | 50.15 | ||||||||||||||||
2014 | Fourth Quarter | 61.85 | 51.47 | |||||||||||||||
Third Quarter | 55.40 | 48.79 | ||||||||||||||||
Second Quarter | 52.18 | 47.15 | ||||||||||||||||
First Quarter | 54.05 | 47.48 | ||||||||||||||||
2013 | Fourth Quarter | 51.86 | 47.00 | |||||||||||||||
Third Quarter | 54.44 | 47.40 | ||||||||||||||||
Second Quarter | 58.06 | 51.70 | ||||||||||||||||
First Quarter | 58.12 | 48.21 | ||||||||||||||||
2016 | Annual | 85.65 | 71.62 | |||||||||||||||
2015 | Annual | 83.13 | 60.57 | |||||||||||||||
2014 | Annual | 61.85 | 47.15 | Annual | 61.85 | 47.15 | ||||||||||||
2013 | Annual | 58.12 | 47.00 | Annual | 58.12 | 47.00 | ||||||||||||
2012 | Annual | 59.51 | 50.80 | Annual | 59.51 | 50.80 | ||||||||||||
2011 | Annual | 55.13 | 41.11 | |||||||||||||||
2010 | Annual | 45.79 | 36.10 | |||||||||||||||
The average daily trading volume of the Ordinary shares and traded on the XETRA during 20142016 was 816,486606,800 shares. This is based on total yearly turnover statistics supplied by XETRA.
Trading on the New York Stock Exchange
As of February 18, 2015,16, 2017, the closing price for the ADSs traded on the NYSE was $36.76.$41.02.
The table below sets forth, for the periods indicated, the high and low closing sales prices for the Ordinary ADSs on the NYSE. All ADS prices have been adjusted to reflect the two for one split of our ADSs in December 2012.
| | | Price per Ordinary ADS ($) | ||||||||||||||||
|---|---|---|---|---|---|---|---|---|---|---|---|---|---|---|---|---|---|---|
| | | High | Low | |||||||||||||||
2017 | January | 42.74 | 39.70 | |||||||||||||||
2016 | December | 42.54 | 38.37 | |||||||||||||||
November | 42.53 | 38.44 | ||||||||||||||||
October | 43.47 | 40.45 | ||||||||||||||||
September | 45.41 | 42.99 | ||||||||||||||||
August | 47.43 | 44.27 | ||||||||||||||||
2016 | Fourth Quarter | 43.47 | 38.37 | |||||||||||||||
Third Quarter | 47.43 | 42.88 | ||||||||||||||||
| | | Price per ordinary ADS ($) | Second Quarter | 45.46 | 40.60 | |||||||||||||
| | | High | Low | First Quarter | 45.39 | 39.34 | ||||||||||||
2015 | January | 37.95 | 35.96 | Fourth Quarter | 45.72 | 39.00 | ||||||||||||
2014 | December | 30.79 | 29.29 | |||||||||||||||
November | 29.68 | 28.60 | Third Quarter | 44.09 | 37.52 | |||||||||||||
October | 29.22 | 25.79 | Second Quarter | 44.03 | 41.59 | |||||||||||||
September | 27.60 | 26.86 | First Quarter | 42.24 | 35.96 | |||||||||||||
August | 26.69 | 25.20 | ||||||||||||||||
2014 | Fourth Quarter | 30.79 | 25.79 | |||||||||||||||
Third Quarter | 27.60 | 24.31 | ||||||||||||||||
Second Quarter | 26.10 | 23.42 | ||||||||||||||||
First Quarter | 26.91 | 23.59 | ||||||||||||||||
2013 | Fourth Quarter | 35.61 | 31.74 | |||||||||||||||
Third Quarter | 35.50 | 31.02 | ||||||||||||||||
Second Quarter | 36.07 | 33.40 | ||||||||||||||||
First Quarter | 35.55 | 32.26 | ||||||||||||||||
2016 | Annual | 47.43 | 38.37 | |||||||||||||||
2015 | Annual | 45.72 | 35.96 | |||||||||||||||
2014 | Annual | 30.79 | 23.42 | Annual | 36.07 | 31.02 | ||||||||||||
2013 | Annual | 36.07 | 31.02 | Annual | 38.93 | 32.13 | ||||||||||||
2012 | Annual | 38.93 | 32.13 | Annual | 39.96 | 27.88 | ||||||||||||
2011 | Annual | 39.96 | 27.88 | |||||||||||||||
2010 | Annual | 32.01 | 23.79 | |||||||||||||||
Item 10. Additional information
B. Articles of Association
FMC-AG & Co. KGaA is a partnership limited by shares ("KGaA") ((KGaA orKommanditgesellschaft auf Aktien) organized under the laws of Germany. FMC-AG & Co. KGaA is registered with the commercial register of the local court(Amtsgericht) of Hof an der Saale, Germany under HRB 4019. Our registered office(Sitz) is Hof an der Saale, Germany. Our registered business address is Else Kröner-Strasse 1, 61352 Bad Homburg, Germany, telephone +49-6172-609-0.
The following summary of the material provisions of our Articles of Association (Satzung) is qualified in its entirety by reference to the complete text of our Articles of Association. An English convenience translation of our Articles of Association has been filed with the Securities and Exchange Commission and can also be found on our website under www.fmc-ag.com. For a summary of certain other provisions of our Articles of Association relating to management by our General Partner and required ownership of our share capital by the shareholder of our general partner, See Item 16.G, "Governance – the Articles of Association of FMC-AG & Co. KGaA" above.KGaA."
Under our Articles of Association, our business purposes are:
We conduct our business directly and through subsidiaries within and outside Germany.
General Information Regarding Our Share Capital
As of February 18, 2015,16, 2017, our share capital consists of 303,636,122306,221,840 bearer ordinary shares without par value (Stückaktien). and a nominal value of €1.00 each. Our share capital has been fully paid in.
All shares of FMC-AG & Co. KGaA are in bearer form. Our shares are deposited as share certificates in global form (Sammelurkunden) with Clearstream Banking AG, Frankfurt am Main, Germany. Shareholders are not entitled to have their shareholdings issued in certificated form. All shares of FMC-AG & Co. KGaA are freely transferable, subject to any restrictions imposed by applicable securities laws.
General provisions on Increasing the Capital of Stock Corporations and Partnerships Limited by Shares
Under the German Stock Corporation Act (Aktiengesetz), Information on the capital of a stock, corporation or of a partnership limited byauthorized capital, conditional capital and treasury shares may be increased by a resolutionis included in Note 12 of the general meeting, passed with a majority of at least three quarters of the capital represented at the vote, unless the articles of association of the stock corporation or the partnership limited by shares provide for a different majority.
In addition, the general meeting of a stock corporation or a partnership limited by shares may create authorized capital (also called approved capital) (genehmigtes Kapital). The resolution creating authorized capital requires the affirmative vote of a majority of at least three quarters of the capital represented at the vote and may authorize the management board to issue shares up to a stated amount for a period of up to five years. The nominal value of the authorized capital may not exceed half of the share capital at the time of the authorization.
In addition, the general meeting of a stock corporation or of a partnership limited by shares may create conditional capital (bedingtes Kapital) for the purpose of issuing (i) shares to holders of convertible bonds or other securities which grant a right to shares, (ii) shares as consideration to prepare a merger with another company, or (iii) shares offered to members of the management board or employees of the company or of an affiliated company. In each case, the authorizing resolution requires the affirmative vote of a majority of at least three quarters of the capital represented at the vote. The nominal value of the conditional capital may not exceed half or, in the case of conditional capital created for the purpose of issuing shares to members of the management board and employees, 10% of the company's share capital at the time of the resolution.
In a partnership limited by shares all resolutions increasing the capital of the partnership limited by shares also require the consent of the General Partner for their effectiveness.
By resolution of the AGM of shareholders on May 11, 2010, Management AG was authorized, with the approval of the Supervisory Board, to increase, on one or more occasions, the Company's share capital until May 10, 2015 up to a total of €35,000,000 through issue of new bearer ordinary shares for cash contributions, "Authorized Capital 2010/I". The General Partner is entitled, subject to the approval of the Supervisory Board, to exclude the pre-emption rights of the shareholders. However, such an exclusion of pre-emption rights will be permissible for fractional amounts. Additionally, the newly issued shares may be taken up by financial institutions nominated by the General Partner with the obligation to offer them to the shareholders of the company (indirect pre-emption rights). No Authorized Capital 2010/I has been issued as of December 31, 2014.
In addition, by resolution of the AGM on May 11, 2010, the General Partner was authorized, with the approval of the Supervisory Board, to increase, on one or more occasions, the share capital of the Company until May 10, 2015 up to a total of €25,000,000 through the issue of new bearer ordinary shares for cash contributions or contributions in kind, "Authorized Capital 2010/II". The General Partner is entitled, subject to the approval of the Supervisory Board, to exclude the pre-emption rights of the shareholders. However, such exclusion of pre-emption rights will be permissible only if (i) in case of a capital increase against cash contributions, the nominal value of the issued shares does not exceed 10% of the nominal share value of the Company's share capital and the issue price for the new shares is at the time of the determination by the General Partner not significantly lower than the stock price in Germany of the existing listed shares of the same class and with the same rights or, (ii) in case of a capital increase against contributions in kind, the purpose of such increase is to acquire an enterprise, parts of an enterprise or an interest in an enterprise. No Authorized Capital 2010/II has been issued as of December 31, 2014.
Authorized Capital 2010/I and Authorized Capital 2010/II became effective upon registration with the commercial register of the local court in Hof an der Saale on May 25, 2010.
By resolution of the AGM on May 12, 2011, the Company's share capital was conditionally increased up to €12,000,000 subject to the issue of up to twelve million non-par value bearer ordinary shares with no par value and a nominal value of €1.00 each. This conditional increase can only be affected by the exercise of stock options under the Company's Stock Option Plan 2011, with each stock option awarded exercisable for one ordinary share (see Note 15). The Company has the right to deliver ordinary shares that it owns or purchases in the market in place of increasing capital by issuing new shares.
By resolution of the AGM on May 12, 2011 the Company was authorized to purchase treasury shares up to a maximum amount of 10% of the registered share capital existing at the time of the shareholder resolution until May 11, 2016. The shares acquired, together with other treasury shares held by the Company or attributable to the Company pursuant to Sections 71a et seqq. German Stock Corporation Act (Aktiengesetz or AktG), must at no time exceed 10% of the registered share capital. The purchase may be limited to one class of shares only. The authorization must not be used for the purpose of trading in
treasury shares. The General Partner is authorized to use treasury shares purchased on the basis of this authorization for any purpose legally permissible and in particular for the following purposes:
The authorization entitles the General Partner to acquire and use and to partially or entirely cancel treasury shares bought back, in accordance with common practice among large publically listed companies in Germany without a further resolution of the AGM being required. Furthermore, the General Partner is authorized to sell ordinary treasury shares of the Company also in ways other than via the stock exchange or by means of an offer made to all shareholders, against payment in cash and to the exclusion of subscription rights. Additionally, it is also possible to use ordinary treasury shares against contributions in kind within the scope of business combinations and upon acquisition of companies and other assets, excluding shareholders' subscription rights.
The authorization further provides that ordinary treasury shares in lieu of the utilization of a conditional capital of the Company can also be issued, excluding the subscription right of shareholders, to employees of the Company and its affiliates, including members of the management or employees of affiliates, and used to service options or obligations to purchase ordinary shares of the Company granted or to be granted to employees of the Company or its affiliates as well as members of the management of affiliates. The General Partner shall further be authorized to use ordinary treasury shares to fulfil notes carrying warrant or conversion rights or conversion obligations, issued by the Company or dependent entities of the Company as defined in Section 17 of the German Stock Corporation Act and excluding subscription rights according to section 186 (3) sentence 4 German Stock Corporation Act. Finally, the General Partner shall be authorized to exclude fractional amounts, if any, in an offer made to all shareholders.
In August 2013, we completed a share buy-back program in which we repurchased a total of 7,548,951 ordinary shares for a total of approximately €350 million (approximately $500 million). For a discussion of the 2013 buy-back program, see Item 16E, "Purchase of Equity Securities by the Issuer and Affiliated Purchasers" and Note 14 of theConsolidated Notes to the Consolidated Financial Statements, "Shareholders' Equity.Equity," included in this report
Each ordinary share entitles the holder thereof to one vote at general meetingsAGMs of shareholders of FMC-AG & Co. KGaA. Resolutions are passed at annual and extraordinary general meetings of our shareholders by a majority of the votes cast, unless a higher vote is required by law or our Articles of Association. Fresenius SE as shareholder of theour General Partner is not entitled to vote its ordinary shares in the election or removal of members of theour Supervisory Board, of FMC-AG & Co. KGaA, the approval of the acts of the General PartnersPartner and members of the
Supervisory Board, the appointment of special auditors, the assertion of compensation claims against members of the executive bodies arising out of theour management, of the Company, the waiver of compensation claims and the appointment of auditors. In the case of resolutions regarding such matters Fresenius SE's voting rights may not be exercised by any other person.
The General Partner and our Supervisory Board will propose any dividends for approval at the AGM. Usually, shareholders vote on a recommendation made by management (i.e. the General Partner) and the Supervisory Board as to the amount of dividends to be paid. Any dividends are paid once a year, generally, immediately following our AGM. Our General Partner's Management Board will propose to the shareholders at the AGM on May 19, 2015,11, 2017, a dividend with respect to 20142016 and payable in 2015,2017, of €0.78€0.96 per share. For information regarding dividends paid in prior years, see Item 3A, "Key Information – Selected Financial Data."
Under German law, dividends may only be paid from our balance sheet profits (Bilanzgewinn) as determined by our unconsolidated annual financial statements as approved by our AGM and by our General Partner. Unlike our consolidated annual financial statements, which are prepared on the basis of U.S. GAAP, the unconsolidated annual financial statements referred to above are prepared on the basis of the accounting principles of the German Commercial Code (Handelsgesetzbuch orHGB). Since our shares that are entitled to dividend payments are held in a clearing system, the dividends will be distributed in accordance with the rules of the individual clearing system. We will publish notice of the dividends paid and the appointment of the paying agent or agents for this purpose in the German Federal Gazette (Bundesanzeiger).
In the case of holders of ADRs, the depositary will receive all cash dividends and distributions on all deposited securities and will, as promptly as practicable, distribute the dividends and distributions to the holders of ADRs entitled to the dividend. See "Description of American Depositary Receipts – Share Dividends and Other Distributions."
Our companyWe may be dissolved by a resolution of our general shareholders' meeting passed with a majority of at least three quarters of our share capital represented at such general meetingAGM and the approval of the General Partner. In accordance with the AktG, in such a case, any liquidation proceeds remaining after paying all of our liabilities will be distributed among our shareholders in proportion to the total number of shares held by each shareholder.
Under the German Stock Corporation Act,AktG, each shareholder in a stock corporation or partnership limited by shares has a preferential right to subscribe for any issue by that company of shares, debt instruments convertible into shares, e.g. convertible bonds or option bonds, and participating debt instruments, e.g. profit participation rights or participating certificates, in proportion to the number of shares held by that shareholder in the existing share capital of thea company. Basically,Generally, such pre-emption rights are freely assignable. These rights may also be traded on German stock exchanges within a specified period of time prior to the expiration of the subscription period. Our general shareholders' meeting may exclude pre-emption rights by passing a resolution with a majority of at least three quarters of our share capital represented at the general meetingAGM at which the resolution to exclude the pre-emption rights is passed. In addition, an exclusion of pre-emption rights requires a report by the General Partner justifying the exclusion by explaining why the interest of FMC-AG & Co. KGaA in excluding the pre-emption rights outweighs our shareholders' interests in receiving such rights. However, such justification is not required for any issue of new shares if:
Exclusion of Minority Shareholders
Under the provisions of Sections 327a et seq. of the German Stock Corporation ActAktG concerning squeeze-outs, a shareholder who owns 95% of the issued share capital (a "principal shareholder") may request that the shareholders' general meeting of a stock corporation or a partnership limited by shares resolve to transfer the shares of the other minority shareholders to the principal shareholder in return for adequate cash compensation. In a partnership limited by shares, the consent of the general partner(s) is not necessary for the effectiveness of the resolution. The amount of cash compensation to be paid to the minority shareholders must take account of the issuer's financial condition at the time the resolution is passed. The full value of the issuer, which is normally calculated using the capitalization of earnings method (Ertragswertmethode), is decisive for determining the compensation amount.
In addition to the provisions for squeeze-outs of minority shareholders, Sections 319 et seq. of the German Stock Corporation ActAktG provides for the integration of stock corporations. In contrast to the squeeze-out of minority shareholders, integration is only possible when the future principal company is a stock corporation with a stated domicile in Germany. A partnership limited by shares cannot be integrated into another company in accordance with Sections 319 et seq. of the German Stock Corporation Act.AktG.
Our AGM must be held within the first eight months of each fiscal year at the location of FMC-AG & Co. KGaA's registered office, or in a German city where a stock exchange is situated or at the location of a registered office of a domestic affiliated company. To attend the general meetingAGM and exercise voting rights, shareholders must register for the general meetingAGM and prove ownership of shares. The relevant reporting date is the beginning of the 21st day prior to the general meeting.
Amendments to the Articles of Association
An amendment to our Articles of Association requires both a voting majority of at least 75% of the shares entitled to vote represented at the general meetingAGM and the approval of the General Partner.
Description of American Depositary Receipts
General
The Bank of New York Mellon, a New York banking corporation, is the depositary for American Depositary Shares ("ADSs")ADSs representing our ordinary shares. Each ADS represents an ownership interest in one-half of an ordinary share. The deposited shares are deposited with a custodian, as agent of the depositary, under the deposit agreement among ourselves, the depositary and all of the holders and owners of ADSs from time to time (who become bound by the deposit agreement by their acceptance of American Depositary Receipts, or ADRs, evidencing their ADSs). Each ADS also represents any securities, cash or other property deposited with the depositary but not distributed by it directly to ADS holders. The ADSs may be evidenced by certificates or may also be uncertificated. If ADSs are issued in uncertificated form, owners holding ADSs in book-entry form will receive periodic statements from the depositary showing their ownership of ADSs. In the case of beneficial holders of ADSs, owners will receive these periodic statements through their brokers.
The depositary's office is located at 101 Barclay Street, New York, NY 10286, U.S.A.
An investor may hold ADSs either directly or indirectly through a broker or other financial institution. Investors who hold ADSs directly, by having ADSs registered in their names on the books of the depositary, are ADS holders. This description assumes an investor holds ADSs directly. Investors who hold ADSs through their brokers or financial institution nominees must rely on the procedures of their brokers or financial institutions to assert the rights of an ADS holder described in this section. Investors should consult with their brokers or financial institutions to find out what those procedures are.
As an ADS holder, we will not treat you as one of our shareholders and you will not have shareholder rights. German law governs shareholder rights. The depositary will be the holder of the shares underlying your ADSs. As a registered holder of ADSs, you will have ADS holder rights. The deposit agreement sets out ADS holder rights as well as the rights and obligations of the depositary. New York law governs the deposit agreement and the ADSs.
The following is a summary of the material terms of the deposit agreement. Because it is a summary, it does not contain all the information that may be important to investors. For more complete information, investors should read the entire deposit agreement and the form of ADR which contains the terms of the
ADSs. Investors may obtain a copy of the deposit agreement at the SEC's Public Reference Room, located at 100 F Street N.E., Washington, D.C. 20549. The deposit agreement is also available in electronic form on the website maintained by the SEC, www.sec.gov.
Share Dividends and Other Distributions
We may make different types of distributions with respect to our ordinary shares. The depositary has agreed to pay to investors the cash dividends or other distributions it or the custodian receives on the shares or other deposited securities, after deducting its fees and expenses. Investors will receive these distributions in proportion to the number of underlying shares their ADSs represent.
Except as stated below, to the extent the depositary is legally permitted it will deliver distributions to ADS holders in proportion to their interests in the following manner:
is adjusted in connection with the distribution. Only whole ADSs will be issued. Any shares which would result in fractional ADSs will be sold and the net proceeds will be distributed to the ADS holders otherwise entitled to receive fractional ADSs.
We have no obligation to file a registration statement under the U.S. Securities Act of 1933, as amended (the "Securities Act") in order to make any rights available to ADS holders.
Any U.S. dollars will be distributed by checks drawn on a bank in the United States for whole dollars and cents (fractional cents will be rounded to the nearest whole cent). Registered holders will receive the checks directly, while the distributions for beneficial owners will be first sent to the brokers, who will then distribute the cash to the rightful owners.
The depositary may choose any practical method of distribution for any specific ADS holder, including the distribution of foreign currency, securities or property, or it may retain the items, without paying interest on or investing them, on behalf of the ADS holder as deposited securities.
The depositary is not responsible if it decides that it is unlawful or impractical to make a distribution available to any ADS holders.
There can be no assurance that the depositary will be able to convert any currency at a specified exchange rate or sell any property, rights, shares or other securities at a specified price, or that any of these transactions can be completed within a specified time period.
Deposit, Withdrawal and Cancellation
The depositary will deliver ADSs if an investor or his broker deposits ordinary shares or evidence of rights to receive ordinary shares with the custodian. Shares deposited with the custodian must be accompanied by certain documents, including instruments showing that such shares have been properly transferred or endorsed by the person on whose behalf the deposit is being made.
The custodian will hold all deposited shares for the account of the depositary. ADS holders thus have no direct ownership interest in the shares and only have the rights that are contained in the deposit agreement. The custodian will also hold any additional securities, property and cash received on or in substitution for the deposited shares. The deposited shares and any additional items are referred to as "deposited securities."
Upon each deposit of shares, receipt of related delivery documentation and compliance with the other provisions of the deposit agreement, including the payment of the fees and charges of the depositary and any taxes or other fees or charges owing, the depositary will deliver ADSs representing the deposited shares as instructed.
All ADSs issued will, unless specifically requested to the contrary, be delivered through the book-entry settlement system of The Depository Trust Company, also referred to as DTC, or be uncertificated and held through the depositary's book-entry direct registration system ("DRS"), and a registered holder will receive periodic statements from the depositary which will show the number of ADSs
registered in the holder's name. An ADS holder can request that the ADSs not be held through the depositary's DRS and that an American Depositary Receipt ("ADR")ADR in certificated form be issued to evidence those ADSs. ADRs will be delivered at the depositary's principal New York office or any other location that it may designate as its transfer office.
Profile is a required feature of DRS which allows a participant in DTC, claiming to act on behalf of a registered holder of ADSs, to direct the depositary to register a transfer of those ADSs to DTC or its nominee and to deliver those ADSs to the DTC account of that DTC participant without receipt by the depositary of prior authorization from the ADS registered holder to register that transfer.
In connection with and in accordance with the arrangements and procedures relating to DRS/Profile, the parties to the deposit agreement understand that the depositary will not verify, determine or otherwise ascertain that the DTC participant which is claiming to be acting on behalf of an ADS registered holder in requesting registration of transfer and delivery described in the paragraph above has the actual authority to act on behalf of the ADS registered holder (notwithstanding any requirements under the Uniform Commercial Code). In the deposit agreement, the parties agree that the depositary's reliance on and compliance with instructions received by the depositary through the DRS/Profile System and in accordance with the deposit agreement, shall not constitute negligence or bad faith on the part of the depositary.
When an investor surrenders ADSs at the depositary's office, the depositary will, upon payment of certain applicable fees, charges and taxes, and upon receipt of proper instructions, deliver the whole number of ordinary shares represented by the surrendered ADSs to the account the investor directs within Clearstream Banking AG, the central German clearing firm.
The depositary may restrict the withdrawal of deposited securities only in connection with:
This right of withdrawal may not be limited by any other provision of the deposit agreement.
Pre-release of ADSs
The deposit agreement permits the depositary to deliver ADSs before deposit of the underlying ordinary shares. This is called a pre-release of the ADSs. The depositary may also deliver shares upon cancellation of pre-released ADSs (even if the ADSs are canceled before the pre-release transaction has been closed out). A pre-release is closed out as soon as the underlying shares are delivered to the depositary. The depositary may release ADSs instead of shares to close out a pre-release. The depositary may pre-release ADSs only under the following conditions: (1) before or at the time of pre-release, the person to whom the pre-release is being made represents to the depositary in writing that it is or its customer owns the shares of the ADSs to be deposited; (2) the pre-release is fully collateralized with cash or other collateral that the depositary considers appropriate; (3) the depositary must be able to close out the pre-release on not more than five business days' notice. In addition, the depositary will limit the number of ADSs that may be outstanding at any time as a result of pre-release, although the depositary may disregard the limit from time to time, if it thinks it is appropriate to do so.
Voting Rights
You may instruct the depositary to vote the number of shares your ADSs represent. The depositary will notify you of shareholders' meetings and arrange to deliver our voting materials to you if we ask it to.to do so. Those materials will describe the matters to be voted on and explain how you may instruct the depositary how to vote. For instructions to be valid, they must reach the depositary by a date set by the depositary.
The depositary will try, as far as practical, subject to German law and the provisions of our constitutive documents, to vote the number of shares or other deposited securities represented by your ADSs as you instruct. The depositary will only vote or attempt to vote as you instruct or as described below.
We cannot ensure that you will receive voting materials or otherwise learn of an upcoming shareholders' meeting in time to ensure that you can instruct the depositary to vote the shares represented by your ADSs. In addition, the depositary and its agents are not responsible for failing to carry out voting
instructions or for the manner of carrying out voting instructions. This means that you may not be able to vote and there may be nothing you can do if your shares are not voted as you requested.
If (i) we timely asked the depositary to solicit your voting instructions, (ii) the depositary receives a recommendation as to how to vote from the custodian pursuant to the German Stock Corporation ActAktG before it mails voting materials to ADS holders and (iii) the depositary does not receive voting instructions from you by the specified date, it will consider you to have authorized and directed it to give a discretionary proxy to the custodian to vote the number of deposited securities represented by your ADSs in accordance with the custodian's recommendation. The depositary will give a discretionary proxy in those circumstances with respect to each question covered by the recommendation unless we notify the depositary that:
Fees and Expenses
For information regarding fees and expenses payable by holders of ADSs and amounts payable by the Depository to the Company,us, see Item 12.D, "American Depositary Shares – Fees and Expenses."
Payment of Taxes
ADS holders must pay any tax or other governmental charge payable by the custodian or the depositary on any ADS or ADR, deposited security or distribution. If an ADS holder owes any tax or other governmental charge, the depositary may (i) deduct the amount thereof from any cash distributions, or (ii) sell deposited securities and deduct the amount owing from the net proceeds of such sale. In either case the ADS holder remains liable for any shortfall. Additionally, if any tax or governmental charge is unpaid, the depositary may also refuse to effect any registration, registration of transfer, split-up or combination of deposited securities or withdrawal of deposited securities (except under limited circumstances mandated by securities regulations). If any tax or governmental charge is required to be withheld on any non-cash distribution, the depositary may sell the distributed property or securities to pay such taxes and distribute any remaining net proceeds to the ADS holders entitled thereto.
Limitations on Obligations and Liability
Limits on our Obligations and the Obligations of the Depositary; Limits on Liability to Holders of ADSs
The deposit agreement expressly limits our obligations and the obligations of the depositary. It also limits our liability and the liability of the depositary. We and the depositary:
In the deposit agreement, we and the depositary agree to indemnify each other under certain circumstances.
Requirements for Depositary Actions
Before the depositary will deliver or register a transfer of an ADS, make a distribution on an ADS, or permit withdrawal of shares, the depositary may require:
The depositary may refuse to deliver ADSs or register transfers of ADSs generally when the transfer books of the depositary are closed or at any time if the depositary or we think it advisable to do so.
Shareholder Communications; Inspection of Register of Holders of ADSs
The depositary, as a holder of deposited securities, will make available for your inspection at its office all communications that it receives from us that we make generally available to holders of deposited securities. The depositary will send you copies of those communications if we ask it to. You have a right to inspect the register of holders of ADSs, but not for the purpose of contacting those holders about a matter unrelated to our business or the ADSs.
Amendment of the Deposit Agreement
We may agree with the depositary to amend the deposit agreement and the ADRs without your consent for any reason. If an amendment adds or increases fees or charges, except for taxes or other governmental charges or expenses of the depositary for registration fees, facsimile costs, delivery charges or similar items, or prejudices a substantial right of ADS holders, it will not become effective for outstanding ADSs until 30 days after the depositary notifies ADS holders of the amendment.At the time the amendment becomes effective, you are considered, by continuing to hold your ADSs, to agree to the amendment and to be bound by the ADRs and the deposit agreement as amended.
Termination of the Deposit Agreement
The depositary will terminate the deposit agreement at our direction by mailing notice of termination to the ADS holders then outstanding at least 30 days prior to the date fixed in such notice of termination. The depositary may also terminate the deposit agreement by mailing notice of termination to us and the
ADS holders if 60 days have passed, the depositary told us it wants to resign but a successor depositary has not been appointed and accepted its appointment.
After termination, the depositary and its agents will do the following under the deposit agreement but nothing else: collect distributions on the deposited securities, sell rights and other property, and deliver shares and other deposited securities upon cancellation of the ADSs. Four months after termination, the depositary may sell any remaining deposited securities by public or private sale. After that, the depositary will hold the money it received on the sale, as well as any other cash it is holding under the deposit agreement for the pro rata benefit of the ADS holders that have not surrendered their ADSs. It will not invest the money and has no liability for interest. The depositary's only obligation will be to account for the money and other cash. After termination, our only obligations will be to indemnify the depositary and to pay fees and expenses of the depositary that we agreed to pay.
C. Material contracts
For information regarding certain of our material contracts, see "Item 7.B. Major Shareholders and Related Party Transactions – Related Party Transactions." For a description of our stock option plans, see "Item 6.E. Directors, Senior Management and Employees – Share Ownership – Options to Purchase our Securities." For a description of our Amended 2012 Credit Agreement and our agreements relating to our long-term and short-term indebtedness, see Note 10,8, "Short-Term Borrowings, Other Financial Liabilities and Short-Term Borrowings from Related Parties" and Note 11,9, "Long-Term Debt and Capital Lease Obligations" of the Notes to Consolidated Financial Statements.
Our material agreements include the settlement agreement that we, FMCH and NMC entered into with the Official Committee of Asbestos Injury Claimants, and the Official Committee of Asbestos Property Damage Claimants of W.R. Grace & Co., a description of which appearsStatements, included in Note 20 of the Notes to Consolidated Financial Statements, "Legal and Regulatory Matters," and the Merger agreement among us, FMCH and RCG.this report.
D. Exchange controls
Exchange Controls and Other Limitations Affecting Security Holders.
At the present time, Germany does not restrict the export or import of capital, except for certain restrictions on transactions based on international embargo or terror prevention resolutions concerning for example Iraq, Iran, the People's Republic of Korea, Russia, Sudan or Syria. However, the Federal Ministry of Economics and TechnologyEnergy (Bundesministerium für Wirtschaft und TechnologieEnergie) may – in exceptional cases – review and prohibit the direct or indirect acquisition of 25% or more of the shares or voting rights in a German company by a person or company residentwith residency outside of the European Union or the European Free Trade Area if such acquisition constitutes a sufficiently serious threat to the public security or order. This provision is also applicable on other means of acquisition, e.g asset deals, and mergers. Further, for statistical purposes only, every resident individual or corporation residing in Germany must report to the German Federal Bank (Deutsche Bundesbank), subject only to certain immaterial exceptions, any payment received from or made to an individual or a corporation resident outside of Germany if such payment exceeds €12,500 (or the corresponding amount in other currencies). In addition, residents must report (i) monthly any claims against, or any liabilities payable to, non-resident individuals or corporations, if such claims or liabilities, in the aggregate exceed €5 million at the end of any month and (ii) quarterly claims against, or liabilities payable to, non-residents arising under derivative financial instruments (derivative Finanzinstrumente) if the claims, or liabilities, under (i) exceed €500 million at the end of the quarter. Further, residents must report yearly the value (Stand) of the assets (Vermögen) of (i) non-resident companies in which either 10% or more of the shares or of the voting rights in thea company are attributed to the resident, or more than 50% of the shares or of the voting rights are attributed to the resident and/or to one or more non-resident companies which are controlled by the resident and (ii) of the resident's non-resident branch offices and permanent establishments. Likewise, residents must report yearly the value of the assets of (i) resident companies in which either 10% or more of the shares or of the voting rights in thea company are attributed to a non-resident, or more than 50% of the shares or the voting rights are attributed to a non-resident and/or to one or more resident companies which are controlled by a non-resident and (ii) of a non-resident's resident branch offices and permanent establishments.
There are no limitations imposed by German law or our Articles of Association (Satzung) on the right of a non-resident to hold theour shares or the ADSs evidencing shares.
E. Taxation
U.S. and German Tax Consequences of Holding ADSs
The discussion below is intended only as a descriptive summary and does not purport to be a complete analysis of all potential German tax and U.S. federal income tax ("USFIT") tax consequences relating to
the ownership and disposition of ADSs of the Company. Each holder of ADSs should consult theirits own tax advisors with respect to the particular German and USFIT tax consequences applicable to them as a result of holding ADSs of the Company.ownership and disposition of ADSs in light of its particular circumstances, including the application of the German and USFIT tax considerations discussed below, as well as the application of state, local, foreign or other laws.
This summary is based on the current tax laws of Germany and the United States, including the current "Convention between the United States of America and the Federal Republic of Germany for the Avoidance of Double Taxation and the Prevention of Fiscal Evasion with respect to Taxes on Income and Capital and to Certain Other Taxes", as amended through the 2006 Protocol ("Protocol") to the conventions which entered into force on December 28, 2007 (the "Treaty"). The Protocol is effective in respect of withholding taxes for amounts paid on or after January 1, 2007. Changes related to other taxes on income became effective on January 1, 2008.
Tax Treatment of Dividends
German corporations are required to withhold tax on dividends paid to resident and non-resident shareholders.shareholders at a rate of 25% (plus solidarity surcharge). The German Business Tax Reform 2008 increasedtax withholding obligation in general applies regardless of whether and, if so, to what extent the dividend is exempt from tax at the shareholder's level.
For non-resident shareholders the withholding tax rate of 25% may be reduced up to 0%, e.g. on dividends to
25% (plus solidarity surcharges) starting January 1, 2009. Also effective January 1, 2009 fora double tax treaty. For corporate non-German holders, forty percent (40%) of the withheld and remitted withholding tax may be refunded upon application at the German Federal Tax Office (at the address noted below), which would generally result in a net withholdingdividend tax of 15% (plus solidarity surcharge). The entitlement of corporate non-German holders to further reductions of the withholding tax under an applicable income tax treaty remains unaffected. A partial refund of this withholding tax can be obtained by U.S. holders under the Treaty (see discussion below). Foreign corporations will generally have to meet certain activity or substance criteria defined by applicable law in order to receive an exemption from or a (partial) refund of German dividend withholding tax.
Taxation of Capital Gains
If the shares are not held as business assets of a domestic business, capital gains realized by non-German holder are only taxable in Germany if the disposing holder holds (or has held at any time in the last five years) 1% or more of the Company's stated capital. Under the Treaty, a U.S. Holder who is not a resident of Germany for German tax purposes will not be liable for German tax on capital gains realized or accrued on the sale or other disposition of ADSs unless the ADSs are part of the business property of a permanent establishment located in Germany or are part of the assets of a fixed base of an individual located in Germany and used for the performance of independent personal services.
Refund Procedures
To claim a refund under the Treaty, the U.S. Holder must submit a claiman application for refund to the German tax authorities, with the original bank voucher, or certified copy thereof issued by the paying entity documenting the tax withheld within four years from the end of the calendar year in which the dividend is received.
Claims for refund are made on a special German claim for refund form, which must be filed with the German Federal Tax Office: Bundeszentralamt für Steuern, An der Küppe 1, D-53225 Bonn, Germany. The claim refund forms may be obtained from the German Federal Tax Office at the same address where the applications are filed, or from the Embassy of the Federal Republic of Germany, 4645 Reservoir Road, N.W., Washington, D.C. 20007-1998, or from the Office of International Operations, Internal Revenue Service, 1325 K Street, N.W., Washington, D.C. 20225, Attention: Taxpayer Service Division, Room 900 or can be downloaded from the homepage of the Bundeszentralamt für Steuern (www.bzst.bund.de)(www.bzst.de).
U.S. Holders must also submit to the German tax authorities a certification of(on IRS Form 6166) with respect to their last filed U.S. federal income tax return. Certification isRequests for IRS Form 6166 are made on IRS Form 8802, which requires payment of a user fee. IRS Form 8802 and its instructions can be obtained from the officeIRS website at www.irs.gov.
Other German Taxes
There are no German transfer, stamp or other similar taxes that would apply to U.S. holders who purchase or sell ADSs.
The following discussion describes the material USFIT consequences relating to the ownership and disposition of the ADSs by a U.S. Holder (as defined below). The information provided below is based on the Internal Revenue Code of 1986, who holds ADSs as amended (the "Code"), Internal Revenue Service ("IRS") rulings and pronouncements, and judicial decisions all as now in effect and all of which are subject to change or differing interpretations, possibly with retroactive effect.capital assets. The discussion below is intended only as a descriptive summary and does not purport to be a complete analysis of all of the potential U.S. tax consequences of holding ADSs of the Company. In particular, this discussion does not address all of the U.S. tax consequences that may be relevant to certainspecific U.S. Holders (as defined below),in light of their particular circumstances or to U.S. Holders subject to special tax rules, such as insurance companies, regulated investment companies, real estate investment trusts, grantor trusts, traders that have elected the "mark-to-market" method of accounting, a U.S. expatriate within the meaning of Sections 877 or 877A of the Code, tax-exempt entities (including a private foundation, an "individual retirement account" or a Roth IRA), investors holding ADSs through partnerships or other fiscally transparent entities, investors liable for the alternative minimum tax, investors that hold ADSs as part of a straddle or a hedge, investors whose functional currency is not the U.S. dollar, and financial institutions and dealers in securities, and to non-U.S. Holders may be different from that discussed herein.securities. U.S. Holders (as defined below) should consult their tax advisors regarding U.S. federal, state and local tax consequences of owning and disposing of ADSs.
This discussion is based on the Internal Revenue Code of 1986, as amended (the "Code"), Internal Revenue Service ("IRS") rulings and pronouncements, judicial decisions, and income tax treaties to which the U.S. is a party, all as now in effect and all of which are subject to change or differing interpretations, possibly with retroactive effect.
Ownership of ADSs in general
For USFIT purposes, a holder of ADSs generally will be treated as the owner of the shares represented by such ADSs. The U.S. Treasury Department has expressed concern that depositaries for ADSs, or other intermediaries between the holders of shares of an issuer and the issuer, may be taking actions that are inconsistent with the claiming of U.S. foreign tax credits by U.S. Holders of such receipts or shares. Accordingly, the analysis regarding the availability of a U.S. foreign tax credit for German taxes and sourcing rules described below could be affected by future actions that may be taken by the U.S. Treasury Department.
Tax Treatment of Dividends
Subject to the discussion below under "Passive Foreign Investment Company Considerations," a U.S. Holder that receives a distribution with respect to ADSs generally will be required to include the U.S. dollar value of the gross amount of such distribution (before reduction for any German withholding taxes) in gross income as a dividend when actually or constructively received to the extent of the U.S. Holder's pro rata share of the Company's current and/or accumulated earnings and profits (as determined under U.S. federal income tax principles). To the extent a distribution received by a U.S. Holder is not a dividend because it exceeds the U.S. Holder's pro rata share of the Company's current and accumulated earnings and profits, the distribution will be treated first as a tax-free return of capital and reduce (but not below zero) the adjusted tax basis of the U.S. Holder's ADSs. To the extent the distribution exceeds the adjusted tax basis of the U.S. Holder's ADSs, the remainder will be taxed as capital gain.
With respect to non-corporate U.S. Holders, certain dividends received from a qualified foreign corporation will be subject to USFIT at a maximum rate of 20% (rather than the higher rates of tax generally applicable to items of ordinary income, the maximum of which is 39.6%), provided that the ADSs in respect of which such dividend is paid have been held for at least 61 days during the 121 day period beginning 60 days before the ex-dividend date and certain other requirements are met. Periods during which you hedge a position in our ADSs or related property may not count for purposes of this discussion, a "U.S. Holder" is a beneficial ownerthe holding period test. The dividends would also not be eligible for the lower rate if you elect to take dividends into account as investment income for purposes of ADSs thatlimitations on deductions for USFIT purposes, is (1) an individual who is a citizen or residentinvestment income. Provided (i) the ADSs of the United States; (2)Company are regularly tradable on the NYSE (or certain other stock exchanges) and/or the Company qualifies for benefits under the income tax treaty between the U.S. and Germany and (ii) the Company is not a passive foreign investment company (discussed below), the Company will be treated as a qualified foreign corporation or otherfor this purpose. This reduced rate will not be available in all
entity treated as a corporation for USFIT purposes, created or organized under the laws of the United States, any state thereof or the District of Columbia; (3) an estate, the income of which is subject to USFIT regardless of its source; or (4) a trust, if it (i) is subject or the primary supervision of asituations, and U.S. court and the control of one or more U.S. persons or (ii) has a valid election in effect under applicable U.S. Treasury Regulations to be treated as a U.S. person, and (5) any beneficial owner otherwise subject to USFIT on net income bases with respect to the ADSs (including a non-resident alien individual or foreign corporation that holds, or is deemed to hold, any ADSs in connection with the conduct of a U.S. trade or business). If a partnership (including for this purpose any entity treated as a partnership for USFIT purposes) is a beneficial owner of ADSs, the USFIT consequences to a partner in the partnership will generally depend on the status of the partner and the activities of the partnership. A holder of ADSs that is a partnership and the partners in such partnershipHolders should consult their own tax advisors regarding the USFIT consequencesapplication of the ownership and disposition of ADSs.
Tax Treatment of Dividendsrelevant rules to their particular circumstances.
For U.S. federal income tax purposes, U.S. Holders are taxablesubject to tax on dividends paid by German corporations, subject towhich may qualify for a foreign tax credit for certain German income taxes paid. The amount of the refund of German withholding tax and the determination of the foreign tax credit allowable against USFIT depend on whether the U.S. Holder is a corporation owning at least 10% of the voting stock of the German corporation ("Corp U.S. Holder").
In the case of a Corp U.S. Holder, the 26.375%aggregate German withholding tax rate of 26.375% (consisting of a 25% withholding tax and a 1.375% solidarity surcharge) is reduced under the Treaty to 5% of the gross amount of the dividend. Such a holderCorp U.S. Holders may, therefore, apply for a refund of German withholding tax in the amount of 21.375% of the gross amount of the dividends. A Corp U.S. Holder will generally not be eligible for the "dividends-received deduction" under Section 243 of the Code with respect to such dividends.
In the case of any U.S. holderHolder other than a Corp U.S. Holdercorporation owning at least 10% of the voting stock of the Company ("Non-CorpOther U.S. Holder"), the German withholding tax is partially refunded under the Treaty to reduce the withholding tax to 15% of the gross amount of the dividend. In this case, for each $100 of gross dividend that we pay to a Non-Corpan Other U.S. Holder, the dividend is subject to withholding tax of $26.38, $11.38 which is refunded, resulting in a net tax of $15. For U.S. foreign tax credit purposes, the Non-CorpOther U.S. Holder would report dividend income of $100 (to the extent paid out of current and accumulated earnings and profits) and foreign taxes paid of $15, for purposes of calculating the foreign tax credit or the deduction for taxes paid.
If you are a Non-Corp U.S. Holder, dividends paid to you that constitute qualified dividend income will be taxable to you at a reduced maximum USFIT rate of 20% (rather than the higher rates of tax generally applicable to items of ordinary income, the maximum of which is 39.6%), provided that the ADSs in respect of which such dividend is paid have been held for at least 61 days during the 121 day period beginning 60 days before the ex-dividend date and meet other requirements. Periods during which you hedge a position in our ADSs or related property may not count for purposes of the holding period test. The dividends would also not be eligible for the lower rate if you elect to take dividends into account as investment income for purposes of limitations on deductions for investment income. Non-Corp U.S. holders should consult their own tax advisors regarding the availability of the reduced dividend rate in light of their own particular circumstances.
Subject to certain complex limitations, a U.S. Holder is generally entitled to a foreign tax credit equal to the portion of the withholding tax that cannot be refunded under the Treaty.
Dividends paid in Euro to a U.S. Holder of ADSs will be included in income in a dollar amount calculated by reference to the exchange rate in effect on the date the dividends, including the deemed refund of German withholding tax, are included in income by such a U.S. Holder. If dividends paid in Euro are converted into dollars on the date included in income, U.S. Holders generally should not be required to recognize foreign currency gain or loss in respect of the dividend income.
Under the Treaty, the refund of German tax, including the withholding tax, Treaty payment and solidarity surcharge, will not be granted when the ADSs are part of the business property of a U.S. Holder's permanent establishment located in Germany or are part of the assets of an individual U.S. holder'sHolder's fixed base located in Germany and used for the performance of independent personal services. In this case, however, withholding tax and solidarity surcharge may be credited against German income tax liability.
Table Subject to certain complex limitations, any German tax withheld from distributions in accordance with the Treaty will be deductible or creditable against your U.S. federal income tax liability. Any dividends will constitute foreign source income for foreign tax credit limitation purposes. If the dividends are taxed as qualified dividend income (as discussed above), the amount of Contentsthe dividend taken into account for purposes of calculating the foreign tax credit limitation will in general be limited to the gross amount of the dividend, multiplied by the reduced tax rate applicable to qualified dividend income and divided by the highest tax rate normally applicable to dividends. However, such foreign tax credit may be disallowed if the U.S. Holder held such ADSs or equity shares for less than a minimum period during which the U.S. Holder is not protected from risk of loss, or is obligated to make payments related to the dividends. The limitation on foreign taxes eligible for credit is calculated separately with respect to specific classes of income. For this purpose, any dividends distributed by us with respect to ADSs or equity shares will generally constitute "passive category income" but could, in the case of certain U.S. Holders, constitute "general category income." The rules relating to the determination of the foreign tax credit are complex and U.S. Holders should consult their tax advisors to determine whether and to what extent a credit would be available in their particular circumstances, including the effects of any applicable income tax treaties.
Dividends paid in euro to a U.S. Holder of ADSs will be included in the U.S. Holder's income in a dollar amount calculated by reference to the exchange rate in effect on the date the dividends are included in income by such U.S. holder, including the deemed refund of German withholding tax. If dividends paid in euro are converted into U.S. dollars on the date included in income, U.S. Holders generally should not be required to recognize foreign currency gain or loss in respect of the dividend income.
Taxation of Capital Gains
UponSubject to the discussion below under "Passive Foreign Investment Company Considerations", upon a sale, exchange, or other disposition of the ADSs, a U.S. Holder will generally recognize gain or loss for USFIT purposes in an amount equal to the difference between the amount realized and the U.S. Holder's tax basis in the ADSs. Such gain or loss will generally be capital gain or loss if the ADSs are held by the U.S. holderHolder as a capital asset, and will be long-term capital gain or loss if the U.S. holder'sHolder's holding period for the ADSs exceeds one year. Individual U.S. Holders are generally taxed at a maximum 20% rate on net
long-term capital gains. The deductibility of capital losses is subject to limitations. Any such gain or loss that you recognize generally will be treated as U.S. source income or loss for foreign tax credit limitation purposes. You should consult your own tax advisor regarding the availability of a foreign tax credit or deduction in respect of any German tax imposed on a sale or other disposition of ADSs.
Taxation of foreign currency gains upon refund of German withholding taxes.
U.S. Holders of ADSs who receive a refund attributable to reduced withholding taxes under the Treaty may be required to recognize foreign currency gain or loss, which will be treated as ordinary income or loss, to the extent that the dollar value of the refund on the date it is received by the U.S. Holders differs from the dollar equivalent of the refund on the date the dividend on which such withholding taxes were imposed was received by the depositary or the U.S. Holder, as the case may be.
Passive Foreign Investment Company Considerations
Special adverse USFIT rules apply to U.S. Holders owning shares of a Passive Foreign Investment Company ("PFIC"). In general, if you are a U.S. Holder, we will be a PFIC with respect to you if for any taxable year in which you held our ADSs or ordinary shares: (i) at least 75% of our gross income for the taxable year is passive income or (ii) at least 50% of the value, determined on the basis of a quarterly average, of our assets is attributable to assets that produce or are held for the production of passive income. The determination of whether we are a PFIC will be made annually. Accordingly, it is possible that we may become a PFIC in the current or any future taxable year due to changes in our asset or income composition.
Passive income generally includes dividends, interest, royalties, rents (other than certain rents and royalties derived in the active conduct of a trade or business), annuities and gains from the disposition of assets that produce passive income. Any cash we hold, including the cash raised in this offering, generally will be treated as held for the production of passive income for the purpose of the PFIC test, and any income generated from cash or other liquid assets generally will be treated as passive income for such purpose. If a non-U.S. corporation owns at least 25% by value of the shares of another corporation, the non-U.S. corporation is treated for purposes of the PFIC tests as owning its proportionate share of the assets of the other corporation, and as receiving directly its proportionate share of the other corporation's income.
Although we do not believe that we are currently a PFIC, the determination of PFIC status is highly factual and based on technical rules that are difficult to apply. Accordingly, there can be no assurances that we will not be a PFIC for the current year or any future taxable year. U.S. holdersHolders should consult their own tax advisors regarding the application of the PFIC rules to their investment in our ADSs.
Tax on Net Investment Income and Certain Reporting Obligations
In addition to regular USFIT, certain U.S. Holders that are individuals, estates, or trusts are subject to a 3.8% tax on all or a portion of their "net investment income," which may include all or a portion of their dividend income and net gain from the sale, exchange or other disposition of their ADSs.
Individuals who are U.S. Holders, and who hold "specified foreign financial assets" (as defined in section 6038D of the Code), including debt or ordinary shares of a non-U.S. corporation that are held for investment and not held in an account maintained by a U.S. "financial institution" (as defined in section 6038D of the Code), whose aggregate value exceeds US$50,000 during the tax year, may be required to attach to their tax returns for the year certain specified information. An individual who fails to timely furnish the required information may be subject to a penalty. Additionally, in the event a U.S. Holder does not file the required information, the statute of limitations may not close before such information is filed. Under certain circumstances, an entity may be treated as an individual for purposes of the foregoing rules.
United States Information Reporting and Backup Withholding
Dividends paid on, and proceeds on a sale or other dispositions of, ADSs paid to a U.S. Holder within the United States or through U.S.-related financial intermediaries are subject to information reporting and may be subject to backup withholding at a current rate of 28% unless you (1) are a corporation or other exempt recipient or (2) provide a taxpayer identification number and certify (on IRS Form W-9) that no loss of exemption from backup withholding has occurred.
Backup withholding tax is not an additional tax, and any amounts withheld under the backup withholding rules will be allowed as a refund or a credit against a U.S. Holder's U.S. federal income tax liability, provided the required information is furnished to the IRS.
Non-U.S. Holders are generally not subject to information reporting or backup withholding. However, a non-U.S. holder may be required to provide a certification (generally on IRS Form W-8BEN)W-8BEN or W-8BEN-E) of its non-U.S. status in connection with payments received in the United States or through a U.S.-related financial intermediary in order to establish its exemption from information reporting and backup withholding.
U.S. and non-U.S. Holders may be subject to other U.S. information reporting requirements. U.S. and non-U.S. Holders should consult their own advisors regarding the application of U.S. information reporting rules in light of their particular circumstances.
U.S. and German Gift and Inheritance Tax Considerations
The transfer of ADS to another person by way of gift or inheritance is generally subject to German gift or inheritance tax only if (i) the decedent, the donor, the heir, donee or any other beneficiary maintained a domicile or his/her habitual abode in Germany, or has its place of management or statutory seat in Germany at the time of the transfer, or is a German citizen who has spent no more than five consecutive years outside Germany without maintaining a residence in Germany (special rules apply to certain former German citizens who neither maintain their domicile nor have their habitual abode in Germany), (ii) the ADS were held by the decedent or donor as part of business assets for which a permanent establishment or other fixed place of business was maintained in Germany or for which a permanent representative in Germany had been appointed, or (iii) the decedent or donor, at the time of the inheritance or gift, held either individually or collectively with related parties, held directly or indirectly, at least 10% of the Company's registered share capital.
The U.S.-Germany estate, inheritance and gift tax treaty provides that an individual whose domicile is determined to be in the U.S. for purposes of such treaty will not be subject to German inheritance and gift tax, the equivalent of the U.S. federal estate and gift tax, on the individual's death or making of a gift unless the ADSs are part of the business property of a permanent establishment located in Germany or are part of the assets of a fixed base of an individual located in Germany and used for the performance of independent personal services. An individual's domicile in the U.S., however, does not prevent imposition of German inheritance and gift tax with respect to an heir, donee, or other beneficiary who is domiciled in Germany at the time the individual died or the gift was made.
Such U.S.-Germany estate, inheritance and gift tax treaty also provides a credit against U.S. federal estate and gift tax liability for the amount of inheritance and gift tax paid in Germany, subject to certain limitations, in a case where ADSs are subject to German inheritance or gift tax and U.S. federal estate or gift tax.
The above summary is not intended to constitute a complete analysis of all tax consequences relating to the ownership and disposition of ADSs. U.S. Holders should consult their own tax advisors concerning the tax consequences of the ownership and disposition of ADSs in light of their particular circumstances, including the application of the U.S. federal income tax considerations discussed above, as well as the application of state, local, foreign or other laws.
H. Documents on display
We file periodic reports and information with the Securities and Exchange Commission and the New York Stock Exchange. You may inspect a copy of these reports without charge at the Public Reference Room of the Securities and Exchange Commission at 100 F Street N.E., Washington, D.C. 20549 or at the Securities and Exchange Commission's regional offices 233 Broadway, New York, New York 10279 and 500 West Madison Street, Suite 1400, Chicago, Illinois 60661. The public may obtain information on the operation of the Public Reference Room by calling the Securities and Exchange Commission at 1-800-SEC-0330. The Securities and Exchange Commission also maintains an Internet site that contains reports, proxy and information statements and other information regarding registrants that file electronically with the Securities and Exchange Commission. The Securities and Exchange Commission's World Wide Web address is http://www.sec.gov.
The New York Stock Exchange currently lists American Depositary Shares representing our Ordinary shares. As a result, we are subject to the periodic reporting requirements of the Exchange Act and we file reports and other information with the Securities and Exchange Commission. These reports, proxy statements and other information and the registration statement and exhibits and schedules thereto may be inspected without charge at, and copies thereof may be obtained at prescribed rates from, the public reference facilities of the Securities and Exchange Commission and the electronic sources listed in the preceding paragraph. In addition, these materials are available for inspection and copying at the offices of the New York Stock Exchange, 20 Broad Street, New York, New York 10005, USA.
We prepare annual and quarterly reports. Our annual reports contain financial statements examined and reported upon, with opinions expressed by our independent auditors. Our consolidated financial statements included in thesethis and prior annual and quarterly reports are prepared in conformity with U.S. GAAP. On December 1, 2016, we announced that, commencing with our quarterly report to be filed for the first quarter of 2017; such financial statements will be prepared in accordance with IFRS. Our annual and quarterly reports to our shareholders are posted under "Publications""News & publications" on the "Investor Relations""Investors" page of our website at http://www.fmc-ag.com.www.freseniusmedicalcare.com. In furnishing our web site address in this report, however, we do not intend to incorporate any information on our web site into this report, and any information on our web site should not be considered to be part of this report.
We will also furnish the depositary with all notices of shareholder meetings and other reports and communications that are made generally available to our shareholders. The depositary, to the extent permitted by law, shall arrange for the transmittal to the registered holders of American Depositary Receipts of all notices, reports and communications, together with the governing instruments affecting our shares and any amendments thereto. Such documents are also available for inspection by registered holders of American Depositary Receipts at the principal office of the depositary.
Documents referred to in this report which relate to us as well as future annual and interim reports prepared by us may also be inspected at our offices, Else-Kröner-Strasse 1, 61352 Bad Homburg.
Item 11. Quantitative and Qualitative Disclosures About Market Risk
Our businesses operate in highly competitive markets and are subject to changes in business, economic and competitive conditions. Our business is subject to:
Our business is also subject to other risks and uncertainties that we describe from time to time in our public filings. See Item 3.D, "Key Information – Risk Factors." Developments in any of these areas could cause our results to differ materially from the results that we or others have projected or may project.
Reimbursement Rates
Approximately 31%Aapproximately 32% of our worldwide revenue for 20142016 was for services rendered to patients covered by Medicare's ESRD program and Medicaid. In order to be eligible for reimbursement by Medicare, ESRD facilities must meet conditions for coverage established by CMS. Additionally, government agencies may make changes in program interpretations, requirements or conditions of participation, and retain the right to audit the accuracy of our computations of rebates and pricing, some of which may result in implications (such as recoupment) for amounts previously estimated or paid which may have a material adverse effect on the Company's revenues, profitability and financial condition. See Item 4.B, "Information on the Company – Business Overview – Regulatory and Legal Matters – Reimbursement" and "– Health Care Reform."
��We also obtain a significant portion of our net revenues from reimbursement by non-government payors. Historically, these payors' reimbursement rates generally have been higher than government program rates in their respective countries. However, non-governmental payors are imposing cost containment measures that are creating significant downward pressure on reimbursement levels that we receive for our services and products.
Inflation
The effects of inflation during the periods covered by the consolidated financial statements have not been significant to our results of operations. However, a major portion of our net revenues from health care are subject to reimbursement rates regulated by governmental authorities, and a significant portion of other revenues, especially revenues from the U.S., is received from customers whose revenues are subject to these regulated reimbursement rates. Non-governmental payors are also exerting downward pressure on reimbursement rates. Increased operation costs that are subject to inflation, such as labor and supply costs, may not be recoverable through price increases in the absence of a compensating increase in reimbursement rates payable to us and our customers, and could materially adversely affect our business, financial condition and results of operations.
Management of Foreign Exchange and Interest Rate Risks
We are primarily exposed to market risk from changes in foreign exchange rates and changes in interest rates. In order to manage the risks from these foreign exchange rate and interest rate fluctuations, we enter into various hedging transactions, as authorized by the Management Board of the general partner, with banks which generally have ratings in the "A" Category or better. We do not use financial instruments for trading or other speculative purposes.
Fresenius SE conducts financial instrument activity for us, at our behest and in accordance with our service agreement, and for its other subsidiaries under the control of a single centralized department. Fresenius SE has established guidelines that we have agreed to, for risk assessment procedures and controls for the use of financial instruments. They include a clear segregation of duties with regard to execution on one side and administration, accounting and controlling on the other.
Foreign Exchange Risk
We conduct our business on a global basis in various currencies, although our operations are located principally in the United States and Germany. For financial reporting purposes, we have chosen the U.S. dollar as our reporting currency.currency through December 31, 2016. Therefore, changes in the rate of exchange between the U.S. dollar and the local currencies in which the financial statements of our international operations are maintained, affect our results of operations and financial position as reported in our consolidated financial statements. We have consolidated the balance sheets of our non-U.S. dollar denominated operations into U.S. dollars at the exchange rates prevailing at the balance sheet date. Revenues and expenses are translated at the average exchange rates for the period. Effective January 1, 2017, we will use euro as our reporting currency.
Our exposurechange to market riskeuro as our reporting currency could increase the effects of such exchange rate changes because the majority of our revenues (72% in 2016) are received in U.S. dollars in our North America segment and will be converted to euro for changes in foreign exchange rates relatesfinancial reporting purposes. Additionally, our individual subsidiaries are exposed to transactions such astransactional risks mainly resulting from intercompany salespurchases between production sites and purchases. We have significant amounts of sales of products invoiced in euro from our European manufacturing facilities to our other international operations.subsidiaries with different functional currencies. This exposes ourthe subsidiaries
to fluctuations in the rate of exchange between the euroinvoicing currencies and the currency in which their local operations are conducted. We evaluate our exposure to risk through the utilization of the Cash-Flow-at-Risk model (see below) and the judgment of our regional and corporate management teams. We typically hedge a portion of the exchange exposure foreseen in our annual budgeting process for the following 12 to 18 months. Currencies are monitored and our hedge position may be adjusted accordingly. We typically utilize foreign exchange forward contracts and, on a small scale, foreign exchange options. Our policy, which has been consistently followed, is that foreign exchange rate derivatives be used only for purposes of hedging foreign currency exposures. We have not used such instruments for purposes other than hedging.
In connection with intercompany loans in foreign currency, we normally use foreign exchange swaps thus assuring that no foreign exchange risks arise from those loans.
The Company is exposed to potential losses in the event of non-performance by counterparties to financial instruments. We do not expect any counterparty to fail to meet its obligations. The current credit exposure of foreign exchange derivatives is represented by the fair value of those contracts with a positive fair value at the reporting date. The table below provides information about our foreign exchange forward contracts at December 31, 2014.2016. The information is provided in U.S. dollar equivalent amounts. The table presents the notional amounts by year of maturity, the fair values of the contracts, which show the unrealized net gain (loss) on existing contracts as of December 31, 2014,2016, and the credit risk inherent to those contracts with positive market values as of December 31, 2014.2016. All contracts expire within 1715 months after the reporting date.
Foreign Currency Risk Management
December 31, 20142016
(USD in millions)
Nominal amount
| | 2015 | 2016 | 2017 | 2018 | 2019 | Total | Fair value | Credit risk | 2017 | 2018 | 2019 | 2020 | 2021 | Total | Fair value | Credit risk | ||||||||||||||||||||||||||||||||||
|---|---|---|---|---|---|---|---|---|---|---|---|---|---|---|---|---|---|---|---|---|---|---|---|---|---|---|---|---|---|---|---|---|---|---|---|---|---|---|---|---|---|---|---|---|---|---|---|---|---|---|
Purchase of EUR against US$ | $ | 185 | — | — | — | — | $ | 185 | $ | (19 | ) | $ | — | $ | 139 | — | — | — | — | $ | 139 | $ | (5 | ) | $ | — | ||||||||||||||||||||||||
Sale of EUR against US$ | 772 | — | — | — | — | 772 | 7 | 7 | 591 | — | — | — | — | 591 | 17 | 20 | ||||||||||||||||||||||||||||||||||
Purchase of EUR against others | 847 | 18 | — | — | — | 865 | (10 | ) | 20 | 27 | — | — | — | — | 27 | (11 | ) | 6 | ||||||||||||||||||||||||||||||||
Sale of EUR against others | 109 | — | — | — | — | 109 | 0 | 1 | 549 | 5 | — | — | — | 554 | 0 | 0 | ||||||||||||||||||||||||||||||||||
Others | 39 | — | — | — | — | 39 | (4 | ) | 0 | 24 | 1 | — | — | — | 25 | (2 | ) | 0 | ||||||||||||||||||||||||||||||||
| | | | | | | | | | | | | | | | | | | | | | | | | | | | | | | | | | | | | | | | | | | | | | | | | | | |
Total | $ | 1,952 | 18 | — | — | — | $ | 1,970 | $ | (26 | ) | $ | 28 | $ | 1,330 | 6 | — | — | — | $ | 1,336 | $ | (1 | ) | $ | 26 | ||||||||||||||||||||||||
| | | | | | | | | | | | | | | | | | | | | | | | | | | | | | | | | | | | | | | | | | | | | | | | | | | | |
| | | | | | | | | | | | | | | | | | | | | | | | | | | | | | | | | | | | | | | | | | | | | | | | | | | |
A summary of the high and low exchange rates for the euro to U.S. dollars and the average exchange rates for the last five years is set forth below. The European Central Bank ("ECB") determines such rates ("Reference Rates") based on the regular daily averaging of rates between central banks within and outside the European banking system. The ECB normally publishes the Reference Rates daily at 2:15 p.m.around 4p.m. (CET). In preparing our consolidated financial statements and in converting certain U.S. dollar amounts in this report, we have used the Year's Average Reference Rate of $1.3285$1.1069 or Year's Close Reference Rate of $1.2141$1.0541 per €1.00.
Year ending December 31, | Year's High | Year's Low | Year's Average | Year's Close | Year's High | Year's Low | Year's Average | Year's Close | ||||||||||||||||||
|---|---|---|---|---|---|---|---|---|---|---|---|---|---|---|---|---|---|---|---|---|---|---|---|---|---|---|
2010 US$ per EUR | 1.4563 | 1.1942 | 1.3259 | 1.3362 | ||||||||||||||||||||||
2011 US$ per EUR | 1.4882 | 1.2889 | 1.3920 | 1.2939 | ||||||||||||||||||||||
2012 US$ per EUR | 1.3454 | 1.2089 | 1.2848 | 1.3194 | 1.3454 | 1.2089 | 1.2848 | 1.3194 | ||||||||||||||||||
2013 US$ per EUR | 1.3814 | 1.2768 | 1.3281 | 1.3791 | 1.3814 | 1.2768 | 1.3281 | 1.3791 | ||||||||||||||||||
2014 US$ per EUR | 1.3953 | 1.2141 | 1.3285 | 1.2141 | 1.3953 | 1.2141 | 1.3285 | 1.2141 | ||||||||||||||||||
2015 US$ per EUR | 1.2043 | 1.0552 | 1.1095 | 1.0887 | ||||||||||||||||||||||
2016 US$ per EUR | 1.1569 | 1.0364 | 1.1069 | 1.0541 | ||||||||||||||||||||||
The Reference Rate on February 18, 201516, 2017 was $1.1372$1.0652 per €1.00.
Cash-Flow-at-Risk Model
We use a Cash-Flow-at-Risk (CFaR) model in order to estimate and quantify transaction risks from foreign currencies. The basis for the analysis of the currency risk is the foreign currency cash flows that are reasonably expected to arise within the following twelve months, less any hedges. As of December 31, 2014,
2016, the Company's cash flow at risk amounts to $32.4$52.1 million; this means the potential loss in relation to the forecasted foreign exchange cash flows of the next twelve months has a 95% probability of not being higher than $32.4$52.1 million.
Significant influence on the Company's foreign currency risk is exerted by the U.S. dollar,Chinese yuan renminbi, South Korea won, the Russian ruble, the Saudi riyal, the Hong Kong DollarIndian rupee and the Indian rupee.South African rand. The following table shows the Company's most significant net positions in foreign currencies.
Net Positions in Foreign Currencies | Year ending December 31, 2014 | Year ending December 31, 2016 | ||||||
|---|---|---|---|---|---|---|---|---|
| | (in millions) | (in millions) | ||||||
USD | $ | 67 | ||||||
CNY | $ | 168 | ||||||
KRW | 106 | |||||||
RUB | 56 | 70 | ||||||
SAR | 52 | |||||||
HKD | (51 | ) | ||||||
INR | 37 | 62 | ||||||
ZAR | 23 | |||||||
Interest Rate Exposure
We are exposed to changes in interest rates that affect our variable-rate borrowings. We enter into debt obligations including accounts receivable securitizations to support our general corporate purposes such as capital expenditures and working capital needs. Consequently, we enter into derivatives, particularly interest rate swaps to protect interest rate exposures arising from borrowings at floating rates by effectively swapping them into fixed rates.
These interest rate derivatives are designated as cash flow hedges and have been entered into in order to effectively convert payments based on variable interest rates into payments at a fixed rate. The euro-denominated interest rate swaps expire between 2016 andin 2019 and have a weighted average interest rate of 0.68%0.32%.
As of December 31, 2014,2016, the notional amount of euro-denominated interest rate swaps in place was €394€252 million ($478266 million). These interest rate swaps include swaps with a notional amount of €294 million which became effective on January 30, 2015. Interest payable and interest receivable under the swap agreements are accrued and recorded as an adjustment to interest expense at each reporting date. At December 31, 2014,2016, the negative fair value of our interest rate agreements is $5was $1 million.
The table below presents principalnotional amounts and related weighted average interest rates by year of maturity for interest rate swaps and for our significant debt obligations.
Interest Rate Exposure
December 31, 20142016
(in millions)
| | 2015 | 2016 | 2017 | 2018 | 2019 | There- after | Total | Fair Value Dec. 31, 2014 | |||||||||||||||||
|---|---|---|---|---|---|---|---|---|---|---|---|---|---|---|---|---|---|---|---|---|---|---|---|---|---|
FLOATING RATE US$ DEBT | |||||||||||||||||||||||||
Principal payments on Senior Credit Agreement | $ | 200 | 200 | 200 | 200 | 1,736 | $ | 2,536 | $ | 2,536 | |||||||||||||||
Variable interest rate = 1.58% | |||||||||||||||||||||||||
Accounts receivable securitization program | $ | 342 | $ | 342 | $ | 342 | |||||||||||||||||||
Variable interest rate = 0.23% | |||||||||||||||||||||||||
FLOATING RATE € DEBT | |||||||||||||||||||||||||
Principal payments on Senior Credit Agreement | $ | 29 | 29 | 29 | 29 | 248 | $ | 364 | $ | 364 | |||||||||||||||
Variable interest rate = 1.42% | |||||||||||||||||||||||||
Senior Notes 2011/2016 | $ | 121 | $ | 121 | $ | 126 | |||||||||||||||||||
Variable interest rate = 3.582% | |||||||||||||||||||||||||
FIXED RATE US$ DEBT | |||||||||||||||||||||||||
Senior Notes 2007/2017; | $ | 498 | $ | 498 | $ | 546 | |||||||||||||||||||
Fixed interest rate = 6.875% | |||||||||||||||||||||||||
Senior Notes 2011/2018; | $ | 397 | $ | 397 | $ | 438 | |||||||||||||||||||
Fixed interest rate = 6.50% | |||||||||||||||||||||||||
Senior Notes 2011/2021; | $ | 646 | $ | 646 | $ | 694 | |||||||||||||||||||
Fixed interest rate = 5.75% | |||||||||||||||||||||||||
Senior Notes 2012/2019; | $ | 800 | $ | 800 | $ | 855 | |||||||||||||||||||
Fixed interest rate = 5.625% | |||||||||||||||||||||||||
Senior Notes 2012/2022; | $ | 700 | $ | 700 | $ | 758 | |||||||||||||||||||
Fixed interest rate = 5.875% | |||||||||||||||||||||||||
Senior Notes 2014/2020; | $ | 500 | $ | 500 | $ | 503 | |||||||||||||||||||
Fixed interest rate = 4.125% | |||||||||||||||||||||||||
Senior Notes 2014/2024; | $ | 400 | $ | 400 | $ | 402 | |||||||||||||||||||
Fixed interest rate = 4.75% | |||||||||||||||||||||||||
FIXED RATE € DEBT | |||||||||||||||||||||||||
Senior Notes 2010/2016 | $ | 303 | $ | 303 | $ | 326 | |||||||||||||||||||
Fixed interest rate = 5.50% | |||||||||||||||||||||||||
Senior Notes 2011/2018 | $ | 482 | $ | 482 | $ | 573 | |||||||||||||||||||
Fixed interest rate = 6.50% | |||||||||||||||||||||||||
Senior Notes 2011/2021 | $ | 364 | $ | 364 | $ | 423 | |||||||||||||||||||
Fixed interest rate = 5.25% | |||||||||||||||||||||||||
Senior Notes 2012/2019 | $ | 304 | $ | 304 | $ | 349 | |||||||||||||||||||
Fixed interest rate = 5.25% | |||||||||||||||||||||||||
Equity-Neutral Convertible Bonds 2014/2020 | $ | 452 | $ | 452 | $ | 531 | |||||||||||||||||||
Fixed interest rate = 1.125% | |||||||||||||||||||||||||
INTEREST RATE DERIVATIVES | |||||||||||||||||||||||||
€ Payer Swaps Notional Amount | $ | 22 | 150 | 29 | 29 | 248 | $ | 478 | $ | (5 | ) | ||||||||||||||
Average fixed pay rate = 0.68% | 0.32 | % | 1.46 | % | 0.32 | % | 0.32 | % | 0.32 | % | 0.68 | % | |||||||||||||
Receive rate = 3-month EURIBOR | |||||||||||||||||||||||||
| | 2017 | 2018 | 2019 | 2020 | 2021 | There- after | Total | Fair Value Dec. 31, 2016 | |||||||||||||||||
|---|---|---|---|---|---|---|---|---|---|---|---|---|---|---|---|---|---|---|---|---|---|---|---|---|---|
FLOATING RATE US$ DEBT | |||||||||||||||||||||||||
Principal payments on Senior Credit Agreement | $ | 200 | 200 | 1,710 | $ | 2,110 | $ | 2,108 | |||||||||||||||||
Variable interest rate = 2.15% | |||||||||||||||||||||||||
Accounts receivable securitization program | $ | 175 | $ | 175 | $ | 175 | |||||||||||||||||||
Variable interest rate = 1.00% | |||||||||||||||||||||||||
FLOATING RATE € DEBT | |||||||||||||||||||||||||
Principal payments on Senior Credit Agreement | $ | 25 | 25 | 216 | $ | 266 | $ | 263 | |||||||||||||||||
Variable interest rate = 1.25% | |||||||||||||||||||||||||
FIXED RATE US$ DEBT | |||||||||||||||||||||||||
Senior Notes 2007/2017; Fixed interest rate = 6.875% | $ | 500 | $ | 500 | $ | 513 | |||||||||||||||||||
Senior Notes 2011/2018; Fixed interest rate = 6.50% | $ | 400 | $ | 400 | $ | 424 | |||||||||||||||||||
Senior Notes 2011/2021; Fixed interest rate = 5.75% | $ | 650 | $ | 650 | $ | 703 | |||||||||||||||||||
Senior Notes 2012/2019; Fixed interest rate = 5.625% | $ | 800 | $ | 800 | $ | 851 | |||||||||||||||||||
Senior Notes 2012/2022; Fixed interest rate = 5.875% | $ | 700 | $ | 700 | $ | 767 | |||||||||||||||||||
Senior Notes 2014/2020; Fixed interest rate = 4.125% | $ | 500 | $ | 500 | $ | 517 | |||||||||||||||||||
Senior Notes 2014/2024; Fixed interest rate = 4.75% | $ | 400 | $ | 400 | $ | 408 | |||||||||||||||||||
FIXED RATE € DEBT | |||||||||||||||||||||||||
Senior Notes 2011/2018 | $ | 422 | $ | 422 | $ | 466 | |||||||||||||||||||
Fixed interest rate = 6.50% | |||||||||||||||||||||||||
Senior Notes 2011/2021 | $ | 316 | $ | 316 | $ | 372 | |||||||||||||||||||
Fixed interest rate = 5.25% | |||||||||||||||||||||||||
Senior Notes 2012/2019 | $ | 264 | $ | 264 | $ | 296 | |||||||||||||||||||
Fixed interest rate = 5.25% | |||||||||||||||||||||||||
Equity-Neutral Convertible Bonds 2014/2020 | $ | 422 | $ | 422 | $ | 529 | |||||||||||||||||||
Fixed interest rate = 1.125% | |||||||||||||||||||||||||
INTEREST RATE DERIVATIVES | |||||||||||||||||||||||||
€ Payer Swaps Notional Amount | $ | 25 | 25 | 216 | $ | 266 | $ | (1 | ) | ||||||||||||||||
Average fixed pay rate = 0.32% | 0.32 | % | 0.32 | % | 0.32 | % | 0.32 | % | |||||||||||||||||
Receive rate = 3-month EURIBOR | |||||||||||||||||||||||||
All variable interest rates depicted above are as of December 31, 2014.2016.
Interest Rate Sensitivity Analysis
For purposes of analyzing the impact of changes in the relevant reference interest rates on the Company's results of operations, the Company calculates the portion of financial debt which bears variable interest and which has not been hedged by means of interest rate swaps or options against rising interest rates. For this particular portion of its liabilities, the Company assumes an increase in the reference rates of 0.5% compared to the actual rates as of reporting date. The corresponding additional annual interest expense is then compared to the Company's net income. This analysis shows that an increase of 0.5% in the relevant reference rates would have an effect of approximately 1% on the consolidated net income of the Company.
Item 12. Description of Securities other than Equity Securities
D. American Depositary Shares
For a description of our American Depositary Shares, see Item 10.B, "Additional Information – Articles of Association – Description of American Depositary Receipts."
D.3. Fees and expenses
ADS holders will be charged a fee for each issuance of ADSs, including issuances resulting from distributions of shares, rights and other property, and for each surrender of ADSs in exchange for
deposited securities. The fee in each case is up to $5.00 for each 100 ADSs (or any portion thereof) issued or surrendered.
The following additional charges shall be incurred by the ADS holders, by any party depositing or withdrawing shares or by any party surrendering ADSs or to whom ADSs are issued (including, without limitation, issuance pursuant to a stock dividend or stock split declared by the Company or an exchange of stock regarding the ADSs or the deposited securities or a distribution of ADRs), whichever is applicable:
We will pay all other charges and expenses of the depositary and any agent of the depositary (except the custodian) pursuant to agreements from time to time between us and the depositary. The fees described above may be amended from time to time. If an amendment adds or increases fees or charges, except for taxes or other governmental charges or expenses of the depositary for registration fees, facsimile costs, delivery charges or similar items, or prejudice a substantial right of ADS holders, it will not become effective for outstanding ADSs until 30 days after the depositary notifies ADS holders of the amendment.
D.4. Amounts payable by the depositary to the Company
Fees Incurred in Past Annual Period
Under the fee agreement between us and the depositary, the depositary agrees to pay certain fees relating to the maintenance of the ADRs. Certain fees we encounter related to our ADRs are reimbursed to us by the depositary. For 2014,2016, we received from the depositary $0.1$0.3 million in aggregate payments for continuing annual stock exchange listing fees, standard out-of-pocket maintenance costs for the ADRs (consisting of the expenses of postage and envelopes for mailing annual and interim financial reports, printing and distributing dividend checks, electronic filing of U.S. Federal tax information, mailing
required tax forms, stationary, postage, facsimile, and telephone calls), any applicable performance indicators relating to the ADR facility and legal fees.
Fees to be Paid in the Future
The Bank of New York Mellon, as depositary, has agreed to reimburse us for expenses we incur that are related to establishment and maintenance expenses of the ADS program. The depositary has agreed to reimburse us for itsthe program's continuing annual stock exchange listing fees. The depositary has also
agreed to pay the standard out-of-pocket maintenance costs for the ADRs, which consist of the expenses of postage and envelopes for mailing annual and interim financial statements, printing and distributing dividend checks, electronic filing of U.S. Federal tax information, mailing required tax forms, stationary, postage, facsimile, and telephone calls. It has also agreed to reimburse us annually for certain investor relations programs or special investor relations promotion activities. In certain instances, the depositary has agreed to provide additional payments to us based on any applicable performance indicators relating to the ADR facility. There are limits on the amount of expenses for which the depositary will reimburse the Company, but the amount of reimbursement available to us is not necessarily tied to the amount of fees the depositary collects from investors.
The depositary collects its fees for delivery and surrender of ADSs directly from investors depositing shares or surrendering ADSs for the purpose of withdrawal or from intermediaries acting for them. The depositary collects fees from the amounts distributed or by selling a portion of distributable property to pay the fees. The depositary may collect its annual fee for depositary services by deduction from cash distributions or by directly billing investors or by charging the book-entry system accounts of participants acting for them. The depositary may generally refuse to provide fee-attracting services until its fees for those services are paid.
Item 13. Defaults, Dividend Arrearages and Delinquencies
None
Item 14. Material Modifications to the Rights of Security Holders and Use of Proceeds
Not applicable
Item 15A. Disclosure Controls and Procedures
The Company's management, including the members of the Management Board of our general partner performing the functions Chief Executive Officer and Chief Financial Officer, has conducted an evaluation of the effectiveness of the Company's disclosure controls and procedures as of the end of the period covered by this report, as contemplated by Exchange Act Rule 13a-15. Based on that evaluation, the persons performing the functions of Chief Executive Officer and Chief Financial Officer concluded in connection with the filing of this report that the disclosure controls and procedures are designed to ensure that the information the Company is required to disclose in the reports filed or furnished under the Exchange Act is recorded, processed, summarized and reported within the time periods specified in the Commission's rules and forms and are effective to ensure that the information the Company is required to disclose in its reports is accumulated and communicated to the general partner's Management Board, including the general partner's Chief Executive Officer and the Chief Financial Officer, as appropriate to allow timely decisions regarding required disclosure. During the past fiscal quarter, there have been no significant changes in internal controls, or in factors that could significantly affect internal controls.
Item 15B. Management's annual report on internal control over financial reporting
Management of the Company is responsible for establishing and maintaining adequate internal control over financial reporting, as such term is defined in Exchange Act Rules 13a-15(f). The Company's internal control over financial reporting is a process designed by or under the supervision of the Chief Executive Officer of our general partner and Chief Financial Officer of our general partner, to provide reasonable assurance regarding the reliability of financial reporting and the preparation of the Company's financial statements for external reporting purposes in accordance with U.S. generally accepted accounting principles.
As of December 31, 2014,2016, management conducted an assessment of the effectiveness of the Company's internal control over financial reporting based on the criteria established in Internal Control – Integrated Framework (2013) issued by the Committee of Sponsoring Organizations of the Treadway Commission (COSO). Based on this assessment, management has determined that the Company's internal control over financial reporting as of December 31, 20142016 is effective.
The Company's internal control over financial reporting includes policies and procedures that (1) pertain to the maintenance of records that, in reasonable detail, accurately and fairly reflect transactions and dispositions of our assets; (2) provide reasonable assurances that the Company's transactions are recorded as necessary to permit preparation of financial statements in accordance with U.S. generally accepted accounting principles, and that the Company's receipts and expenditures are being made only in accordance with authorizations of management; and (3) provide reasonable assurance regarding prevention or timely detection of unauthorized acquisition, use or disposition of the Company's assets that could have a material effect on the Company's financial statements.
Because of its inherent limitation, internal control over financial reporting, no matter how well designed, cannot provide absolute assurance of achieving financial reporting objectives and may not prevent or detect misstatements. Therefore, even if the internal control over financial reporting is determined to be effective it can provide only reasonable assurance with respect to financial statement preparation and presentation. Also, projections of any evaluation of effectiveness to future periods are subject to the risk that controls may become inadequate because of changes in conditions, or that the degree of compliance with the policies or procedures may deteriorate.
The Company has received communications alleging conduct in countries outside the U.S. and Germany that may violate the U.S. Foreign Corrupt Practices Act ("FCPA")FCPA or other anti-bribery laws. The Audit and Corporate Governance Committee of the Company's Supervisory Board is conducting an investigation with the assistance of independent counsel. The Company voluntarily advised the U.S.SEC and the DOJ. The Company's investigation and dialogue with
Securities and Exchange Commission ("SEC") and the U.S. Department of Justice ("DOJ"). The Company's investigation and dialogue with the SEC and DOJ are ongoing. The Company has received a subpoena from the SEC requesting additional documents and a request from the DOJ for copies of the documents provided to the SEC. The Company is cooperating with the request.requests.
Conduct has been identified that may result in monetary penalties or other sanctions under the FCPA or other anti-bribery laws. In addition, the Company's ability to conduct business in certain jurisdictions could be negatively impacted. The Company has previously recorded a non-material accrual for an identified matter. Given the current status of the investigation, the Company cannot reasonably estimate the range of possible loss that may result from identified matters or from the final outcome of the investigation or remediation activities.
The Company's independent counsel, in conjunction with the Company's Compliance Department, have reviewed the Company's anti-corruption compliance program, including internal controls related to compliance with international anti-bribery laws, and appropriate enhancements are being implemented. The Company is fully committed to FCPA and other anti-bribery law compliance.
Management's assessment of the effectiveness of its internal control over financial reporting as of December 31, 2014,2016, is stated in its report included on page F-2.
Item 15C. Attestation report of the registered public accounting firm
The effectiveness of our internal control over financial reporting as of December 31, 2014,2016, has been audited by KPMG, an independent registered public accounting firm, as stated in their report included on page F-5.
Item 15D. Changes in Internal Control over Financial Reporting
There have been no changes in the Company's internal control over financial reporting that occurred during fiscal year 2014,2016, which have materially affected or are reasonably likely to materially affect the Company's internal control over financial reporting.
Item 16A. Audit Committee Financial Expert
Our Supervisory Board has determined that each of Prof. Dr. Bernd Fahrholz, Dr. Walter L. Weisman and Mr. William P. Johnston, qualifyMr. Rolf A. Classon, Dr. Gerd Krick and Ms. Deborah Doyle McWhinney qualifies as an audit committee financial expert and is "independent" as defined in Rule 10A-3 under the Exchange Act, in accordance with the instructions in Item 16A of Form 20-F.
Our Management Board adopted through our worldwide compliance program a code of ethics, titled theCode of Ethics and Business Conduct, which as adopted applied to members of the Management Board, including its chairman and the responsible member for Finance & Controlling, other senior officers and all Company employees. After the transformation of legal form, our Code of Business Conduct applies to the members of the Management Board of our general partner and all Company employees, including senior officers. A copy of the Company's Code of Business Conduct is available on our website under "Our Company"About Us – Compliance"Responsibility" at:
http://www.fmc-ag.com/Code_of_Conduct.htm
As of the end of the first quarter of 2015, our Code of Business Conduct will be available at:
http://www.freseniusmedicalcare.com/Code_of_Conduct.htm
Table of Contentsfileadmin/data/de/pdf/About_us/Responsibility/Code_of_Ethics_en.pdf
Item 16C. Principal Accountant Fees and Services.
In the AGM held on May 14, 2014,19, 2015, our shareholders approved the appointment of KPMG to serve as our independent auditors for the 20142016 fiscal year. KPMG billed the following fees to us for professional services in each of the last two years:
| | 2014 | 2013 | 2016 | 2015 | ||||||||||
|---|---|---|---|---|---|---|---|---|---|---|---|---|---|---|
| | (in thousands) | (in thousands) | ||||||||||||
Audit fees | $ | 9,557 | $ | 10,062 | $ | 8,740 | $ | 8,689 | ||||||
Audit related fees | 430 | 32 | 59 | 112 | ||||||||||
Tax fees | 400 | 578 | 182 | 219 | ||||||||||
Other fees | 6,243 | 3,904 | 5,205 | 5,620 | ||||||||||
| | | | | | | | | | | | | | | |
Total | $ | 16,630 | $ | 14,576 | $ | 14,186 | $ | 14,641 | ||||||
| | | | | | | | | | | | | | | | |
| | | | | | | | | | | | | | | |
"Audit Fees" are the aggregate fees billed by KPMG for the audit of our German statutory and U.S. GAAP consolidated and annual financial statements, reviews of interim financial statements and attestation services that are provided in connection with statutory and regulatory filings or engagements. Fees related to the audit of internal control over financial reporting are included in Audit Fees. "Audit-Related Fees" are fees charged by KPMG for assurance and related services that are reasonably related to the performance of the audit or review of our financial statements and are not reported under "Audit Fees." This category comprises fees billed for comfort letters, consultation on accounting issues, the audit of employee benefit plans and pension schemes, agreed-upon procedure engagements and other attestation services subject to regulatory requirements. "Other fees" include amounts related to supply chain consulting fees. "Tax Fees" are fees for professional services rendered by KPMG for tax compliance, tax advice on implications for actual or contemplated transactions, tax consulting associated with international transfer prices, and expatriate employee tax services.
Audit Committee's pre-approval policies and procedures
As a German company, we prepare statutory financial statements under German law on the basis of the accounting principles of the German Commercial Code (Handelsgesetzbuch orHGB) and consolidated financial statements in accordance with International Financial Reporting Standards. Our supervisory boardSupervisory Board engages our independent auditors to audit these financial statements, in consultation with our Audit and Corporate Governance Committee and subject to approval by our shareholders at our AGM in accordance with German law.
We also prepare financial statements in accordance with U.S. GAAP, which are included in registration statements and reports that we file with the Securities and Exchange Commission. Effective January 1, 2017 we will use euro as our reporting currency. Our Audit and Corporate Governance Committee engages our independent auditors to audit these financial statements in accordance with Rule 10A-3 under the Exchange Act and Rule 303A.06 of the NYSE Governance Rules. See also the description in "Item 6C. Directors, Senior Management and Employees – Board Practices."
In 2003, Fresenius Medical Care AG's audit committee also adopted a policy requiring management to obtain the committee's approval before engaging our independent auditors to provide any audit or permitted non-audit services to us or our subsidiaries. Pursuant to this policy, which is designed to assure that such engagements do not impair the independence of our auditors, the Audit and Corporate Governance Committee pre-approves a catalog of specific audit and non-audit services in the categories Audit Services, Audit-Related Services, Tax Services, and Other Services that may be performed by our auditors as well as additional approval requirements based on fee amount and nature.
The general partner's Chief Financial Officer reviews all individual management requests to engage our auditors as a service provider in accordance with this catalog and, if the requested services are permitted pursuant to the catalog or that, fee level, and fee structure, approves the request accordingly. Services that are not included in the catalog exceed applicable fee levels or fee structure are passed on either to the chair of the Audit and Corporate Governance Committee or to the full committee, for approval on a case by case basis. Additionally we inform the Audit and Corporate Governance Committee about all approvals on an annual basis. Neither the chairman of our Audit and Corporate Governance Committee nor the full committee is permitted to approve any engagement of our auditors if the services to be performed either fall into a category of services that are not permitted by applicable law or the services would be inconsistent with maintaining the auditors' independence.
During 2014,2016, the total fees paid to the Audit and Corporate Governance Committee members for service on the committee were $0.190 million.
Item 16D. Exemptions from the Listing Standards for Audit Committees
Not applicable
Item 16E. Purchase of Equity Securities by the Issuer and Affiliated Purchasers
We did not purchase any of our equity securities during the fiscal year covered by this report.
Item 16F. Change in Registrant's Certifying Accountant
Not applicable
Item 16G. Corporate Governance
Introduction
ADSs representing our ordinary shares are listed on the New York Stock Exchange ("NYSE").NYSE. However, because we are a "foreign private issuer," as defined in the rules of the Securities and Exchange Commission ("SEC"),SEC, we are exempt from substantially all of the governance rules set forth in Section 303A of the NYSE's Listed Companies Manual, other than the obligation to maintain an audit committee in accordance with Rule 10A-3 under the Exchange Act, the obligation to notify the NYSE if any of our executive officers becomes aware of any material non-compliance with any applicable provisions of Section 303A, and the obligation to file annual and interim written affirmations, on forms mandated by the NYSE, relating to our compliance with applicable NYSE governance rules, and the obligation to disclose the significant ways in which the governance standards that we follow differ from those applicable to U.S. companies under the NYSE governance rules. Many of the governance reforms instituted by the Dodd-Frank Wall Street Reform and Consumer Protection Act of 2010, including the requirements to provide shareholders with "say-on-pay" and "say-on-when" advisory votes related to the compensation of certain executive officers, are implemented through the SEC's proxy rules. Because foreign private issuers are exempt from the proxy rules, these governance rules are also not applicable to us. However, the compensation system for our Management Board wasis reviewed by an independent external compensation expert atas amendments to the beginning of 2014.system are made. See Item 6B, "Directors, Senior Management and Employees – Compensation – Compensation of the Management Board." Similarly, the more detailed disclosure requirements regarding management compensation applicable to U.S. domestic companies (including recently adopted requirements for pay ratio disclosure and, if it is adopted as proposed, the requirement to disclose the ratio of the median of the totalrelationship between executive compensation of all employees of an issuer to the total compensation of the issuer's chief executive officer)actually paid and a registrant's financial performance) are found in SEC Regulation S-K, whereas compensation disclosure requirements for foreign private issuers are set forth in the Form 20-F and generally limit our disclosure to the information we disclose under German law. In July 2015, the SEC issued its proposed compensation "clawback" rule which would direct U.S. national securities exchanges to establish listing standards that would require each listed issuer to develop and implement a policy providing for the recovery, under certain circumstances, of incentive-based compensation based on financial information that is subsequently restated, and also require the disclosure of the policy. If adopted as proposed, such requirements would also apply to foreign private issuers. Subject to the exceptions noted above, instead of applying their governance and disclosure requirements to foreign private issuers, the rules of both the SEC and the NYSE require that we disclose the significant ways in which our corporate practices differ from those applicable to U.S. domestic companies under NYSE listing standards.
As a German company FMC-AG & Co. KGaA follows German corporate governance practices. German corporate governance practices generally derive from the provisions of the German Stock Corporation Act (Aktiengesetz, or "AktG") including capital market related laws, the German Codetermination Act (Mitbestimmungsgesetz, or "MitBestG") and the German Corporate Governance Code. Our Articles of Association also include provisions affecting our corporate governance. German standards differ from the corporate governance listing standards applicable to U.S. domestic companies which have been adopted by the NYSE. The discussion below provides certain information regarding our organizational structure, management arrangements and governance, including information regarding the legal structure of a KGaA, management by a general partner, certain provisions of our Articles of Association and the role of the Supervisory Board in monitoring the management of our company by our General Partner. It includes a brief, general summary of the principal differences between German and U.S. corporate governance practices, together with, as appropriate, a comparison to U.S. principles or practices.
The Legal Structure of FMC-AG & Co. KGaA
A partnership limited by shares (Kommanditgesellschaft, or "KGaA") is a mixed form of entity under German corporate law, which has elements of both a partnership and a corporation. Like a stock
corporation (Aktiengesellschaft, or "AG"), the share capital of a KGaA is held by its shareholders. A KGaA is also similar to a limited partnership because there are two groups of owners, themanagement and non-management partners, one or more general partnerpartner(s) on the one hand, and the KGaA shareholders on the other hand. Our General Partner,sole general partner, Management AG, is a wholly-owned subsidiary of Fresenius SE. KGaAs and AGs are the only legal forms provided by German law for entities whose shares trade on a German stock exchange.
A KGaA's corporate bodies are its general partner, its supervisory board and the general meeting of shareholders. A KGaA may have one or more general partners who conduct the business of the KGaA. However, unlike an AG, in which the supervisory board appoints the management board, the supervisory board of a KGaA has no influence on appointment of the managing body – the general partner. Likewise, the removal of the general partner from office is subject to very strict conditions. General partners may, but are not required to, purchase shares of the KGaA. General partners are personally liable for the liabilities of the KGaA in relations with third parties subject, in the case of corporate general partners, to applicable limits on liability of corporations generally.
Management and Oversight
The management structure of FMC-AG & Co. KGaA is illustrated as follows:
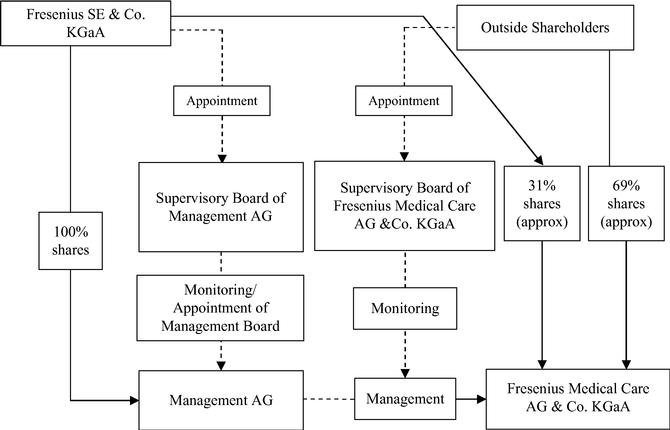
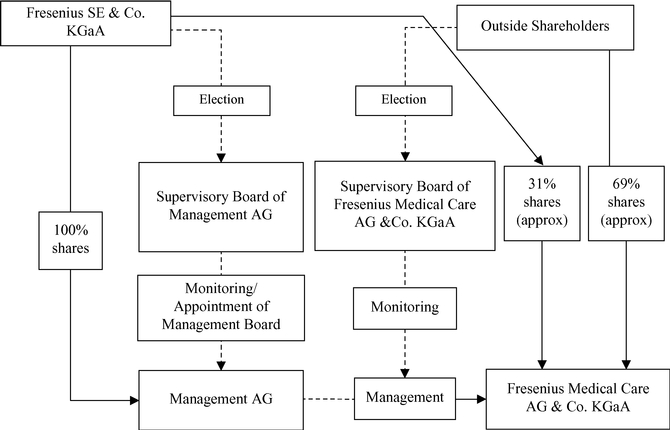
General Partner
Management AG, an AG and a wholly owned subsidiary of Fresenius SE, is theas our sole General Partner, conducts the business of FMC-AG & Co. KGaA and will conduct its business and representrepresents it in external relations. Management AG was incorporated on April 8, 2005 and registered with the commercial register in Hof an der Saale on May 10, 2005. The registered share capital of Management AG is €3.0 million.
The General Partner has not made areceives annual compensation amounting to 4% of its capital contribution tofor assuming the Companyliability and therefore, will not participate in its assets or its profits and losses. However, the Company will compensate or reimburse the General Partnermanagement of FMC-AG & Co. KGaA as well as reimbursement for all outlays in connection with conducting the business of the Company, including the remuneration of members of the general partner's Management Board and its supervisory board. See "The Articles of Association of FMC-AG & Co. KGaA – Organization of the Company" below and Item 7.B., "Major Shareholders and Related Party Transactions". FMC-AG & Co. KGaA itself will bear all expenses of its administration. Management AG will devote itself exclusively to the management of FMC-AG & Co. KGaA. The General Partner will receive annual compensation amounting to 4% of its capital for assuming the liability and the management of FMC-AG & Co. AG & Co. KGaA. In case of a capital increase of the capital of the General Partner during the year the annual compensation must be calculated pro rata subject
to the registration of such capital increase. This payment of the annual compensation constitutes a guaranteed compensation for undertaking liability and an indirect return on Fresenius SE's investment in the share capital of Management AG. This payment is also required to avoid a constructive dividend by the General Partner to Fresenius SE in the amount of reasonable compensation for undertaking liability for the obligations of FMC-AG & Co. KGaA.Transactions."
The position of the general partners in a KGaA is different and in part stronger than that of the shareholders based on: (i) the management powers of the general partners, (ii) the existing de facto veto rights regarding material resolutions adopted by the KGaA's general meeting and (iii) the independence of general partners from the influence of the KGaA shareholders as a collective body (See "General Meeting", below). Because Fresenius SE is the sole shareholder of Management AG, Fresenius SE has the sole power to elect the supervisory board of Management AG which supervises, consults and appoints the members of the Management Board of Management AG, who act on behalf of the General Partner in the conduct of the company's business and in relations with third parties. Use of an AG as the legal form of the general partner enables the Company to maintain a management structure substantially similar to FMC-AG's management structure prior to the transformation of FMC AG into a KGaA, under which Fresenius SE, as majority shareholder, had the power to elect the entire supervisory board. In accordance to §76 AktG the management of an AG in principle is not bound by instructions of its supervisory board or of Fresenius SE as sole shareholder.
The statutory provisions governing a partnership, including a KGaA, provide that the consent of the KGaA shareholders at a general meeting is required for transactions that are not in the ordinary course of business. However, as permitted by statute, our Articles of Association permit such decisions to be made by Management AG as General Partner without the consent of the FMC-AG & Co. KGaA shareholders. This does not affect the general meeting's right of approval with regard to measures of unusual significance, such as a spin-off of a substantial part of a company's assets, as developed in German Federal Supreme Court(Bundesgerichtshof) decisions.
The General Partner's supervisory board appoints the members of the General Partner's Management Board and supervises and advises them in managing Management AG and the Company. The Management Board conducts the business activities of our Company in accordance with the rules of procedure adopted by the General Partner's supervisory board pursuant to the German Corporate Governance Code. Under these rules of procedure, certain transactions are subject to the consent of the supervisory board of Management AG. These transactions include, among others:
Five of the six members of the Supervisory Board are also members of the supervisory board of Management AG. The Company and Fresenius SE have entered into a pooling agreement requiring that at least one-third (and not less than two) members of the General Partner's supervisory board be "independent directors" – i.e., persons without a substantial business or professional relationship with the Company, Fresenius SE, or any affiliate of either, other than as a member of the supervisory boards of the Company or the General Partner. See below, "Description of the Pooling Arrangements."board.
Fresenius SE's de facto control of the Company through ownership of the General Partner is conditioned upon its ownership of a substantial amount of the Company's share capital (see "The Articles of Association of FMC-AG & Co. KGaA – Organization of the Company", below).
Supervisory Board
The supervisory board of a KGaA is similar in certain respects to the supervisory board of an AG. Like the supervisory board of an AG, the supervisory board of a KGaA is under an obligation to oversee the management of the business of the Company. The members of the supervisory board are elected by the KGaA shareholders at the general meeting. Our most recentmeeting and – under certain conditions not applicable to
FMC-AG & Co. KGaA – are required to include labor representatives. Supervisory Board elections occurred in Mayboard members may hold offices on both supervisory boards, the supervisory board of 2011.a KGaA and of its general partner. Four of the six current members of the FMC-AG & Co. KGaA supervisory board are also members of the supervisory board of Management AG. Shares in the KGaA held by the General Partner or its affiliated companies are not entitled to vote for the election of the supervisory board members of the KGaA. Accordingly, Fresenius SE is not entitled to vote its shares for the election of FMC-AG & Co. KGaA's Supervisory Board members.
Althoughmembers, though Fresenius SE will not be able to vote in the election of FMC-AG & Co. KGaA's Supervisory Board, Fresenius SE will nevertheless retainretains influence on the composition of theour Supervisory Board. Because (i) four of the six former members of the FMC-AG Supervisory Board continue to hold office as four of the six current members of the Supervisory Board of FMC-AG & Co. KGaA (except for Rolf A. Classon and Mr. William P. Johnston) and (ii) in the future, the FMC-AG & Co. KGaA Supervisory Board will propose future nominees for election to its Supervisory Board (subject to the right of shareholders to make nominations), Fresenius SE is likely to retain de facto influence over the selection of the Supervisory Board of FMC-AG & Co. KGaA. However, under current Articles of Association, a resolution for the election of members of the Supervisory Board requires the affirmative vote of 75% of the votes cast at the general meeting. Such a high vote requirement could be difficult to achieve, which could result in the need to apply for court appointment of members to the Supervisory Board after the end of the terms of the members in office.
The Supervisory Board of FMC-AG & Co. KGaA has less power and scope for influence than a supervisory board of an AG. The Supervisory Board is not entitled to appoint the General Partner or its executive bodies. Nor may the Supervisory Board subject the management measures of the General Partner to its consent, or issue rules of procedure for the General Partner. Management of the Company will be conducted by the Management Board of the General Partner and only the supervisory board of the General Partner (all of whose members will be elected solely by Fresenius SE) has the authority to appoint or remove the members of the Management Board. FMC-AG & Co. KGaA's Supervisory Board will represent FMC-AG & Co. KGaA in transactions with the General Partner.
FMC-AG & Co. KGaA's annual financial statements are submitted to the Company's shareholders for approval at the AGM. Except for making a recommendation to the general meeting regarding such approval, this matter is not within the competence of the Supervisory Board.
Under certain conditions supervisory boards of large German AGs will include both shareholder representatives and a certain percentage of labor representatives, referred to as "co-determination." Depending on the company's total number of employees, up to one half of the supervisory board members are being elected by the company's employees. In these cases traditionally the chairman is a representative of the shareholders. In case of a tie vote, the supervisory board chairman may cast the decisive tie-breaking vote. We are not currently subject to German co-determination law requirements.
In recent history, there has been a trend towards selecting shareholder representatives for supervisory boards from a wider spectrum of candidates, including representatives from non-German companies, in an effort to introduce a broader range of experience and expertise and a larger degree of independence. In this regard, see the discussion of the German Corporate Governance Code recommendations regarding the composition of supervisory boards below under "Corporate Governance – Comparison with U.S. and NYSE Governance Standards and Practices." German regulations also have several rules applicable to supervisory board members which are designed to ensure that the supervisory board members as a group possess the knowledge, ability and expert experience to properly complete their tasks as well as to ensure a certain degree of independence of the board's members. In addition to prohibiting members of the management board from serving on the supervisory board, German law requires members of the supervisory board to act in the best interest of the company. They do not have to follow direction or instruction from third parties. Any service, consulting or similar agreements between the company and any of its supervisory board members must be approved by the supervisory board.
General Meeting
The general meeting is the resolution body of the KGaA shareholders. Shareholders can exercise their voting rights at the general meeting themselves, by proxy via a representative of their choice, or by a Company-nominated proxy acting on their instructions. Among other matters, the annual general meeting ("AGM")AGM of a KGaA approves its annual financial statements. The internal procedure of the general meeting of a KGaA corresponds to that of the general meeting of a stock corporation. The agenda for the general meeting is fixed by the general partner and the KGaA supervisory board except that the general partner cannot propose nominees for election as members of the KGaA supervisory board or proposals for the Company auditors.
KGaA shareholders exercise influence in the general meeting through their voting rights but, in contrast to an AG, the general partner of a KGaA has a de facto veto right with regard to material resolutions. The members of the supervisory board of a KGaA are elected by the general meeting as in an AG. Although Fresenius SE, as sole shareholder of the General Partner of the Company is not entitled to
vote its shares in the election of the Supervisory Board of FMC-AG & Co. KGaA, Fresenius SE retains a degree of influence on the composition of the Supervisory Board of FMC-AG & Co. KGaA due to the current overlapping membership on the FMC-AG & Co. KGaA Supervisory Board and the Management AG supervisory board (see "The Supervisory Board", above).
Fresenius SE is subject to various bans on voting at general meetings due to its ownership of the shares of the General Partner. Fresenius SE is banned from voting on resolutions concerning the election to and removal from office of the FMC-AG & Co. KGaA Supervisory Board, ratification or discharge of the actions of the General Partner and members of the Supervisory Board, the appointment of special auditors, the assertion of claims for damages against members of the executive bodies, the waiver of claims for damages, and the selection of auditors of the annual financial statements. Although Fresenius SE is not entitled to vote its shares in the election of the Supervisory Board, Fresenius SE retains a degree of influence on the composition of the Supervisory Board due to the current partial overlapping membership on the FMC-AG & Co. KGaA Supervisory Board and the Management AG supervisory board (which is elected by Fresenius SE).
Certain matters requiring a resolution at the general meeting will also require the consent of the General Partner, such as amendments to the Articles of Association, dissolution of the Company, mergers, a change in the legal form of the partnership limited by shares and other fundamental changes. The General Partner therefore has a de facto veto right on these matters. Annual financial statements are subject to approval by both the KGaA shareholders and the General Partner.
The Articles of Association of FMC-AG & Co. KGaA
The following is a summary of certain material provisions of our Articles of Association. This summary is not complete and is qualified in its entirety by reference to the complete form of Articles of Association of FMC-AG & Co. KGaA, a convenience English translation of which is on file with the SEC. In addition, it can be found on the Company's website under www.fmc-ag.com.www.freseniusmedicalcare.com.
Organization of the Company
The Articles of Association contain several provisions relating to the General Partner.
Under the Articles of Association, possession of the power to control management of the Company through ownership of the General Partner is conditioned upon ownership of a specific minimum portion of the Company's share capital. Under German law, Fresenius SE could significantly reduce its holdings in the Company's share capital while at the same time retaining its de facto control over the Company's management through its ownership of the shares of the General Partner. The Articles of Association of FMC-AG & Co. KGaA required that a parent company shall hold an interest of more than 25% of the share capital of FMC-AG & Co. KGaA. As a result, the General Partner will be required to withdraw from FMC-AG & Co. KGaA if its shareholder no longer holds, directly or indirectly, more than 25% of the Company's share capital. The effect of this provision is that Fresenius SE may not reduce its capital participation in FMC-AG & Co. KGaA below such amount without causing the withdrawal of the General Partner. The Articles of Association also permit a transfer of all shares in the General Partner to the Company, which would have the same effect as withdrawal of the General Partner.
The Articles of Association also provide that the General Partner must withdraw if the shares of the General Partner are acquired by a person who does not make an offer under the German Securities Acquisition and Takeover Act (Wertpapiererwerbs- und Übernahmegesetz or WpÜG) to acquire the shares of the Company's other shareholders within three months of the acquisition of the General Partner. The consideration to be offered to shareholders must include any portion of the consideration paid for the General Partner's shares in excess of the General Partner's equity capital, even if the parties to the sale allocate the premium solely to the General Partner's shares. These provisions would therefore trigger a takeover offer at a lower threshold than the German Securities Acquisition and Takeover Act, which requires that a person who acquires at least 30% of a company's shares make an offer to all shareholders. The provisions will enable shareholders to participate in any potential control premium payable for the shares of the General Partner, although the obligations to make the purchase offer and extend the control premium to outside shareholders could also discourage an acquisition of the General Partner, thereby discouraging a change of control.
In the event that the General Partner withdraws from FMC-AG & Co. KGaA as described above or for other reasons, the Articles of Association provide for continuation of the Company as a so-called "unified KGaA" (Einheits-KGaA), i.e., a KGaA in which the general partner is a wholly-owned subsidiary of the KGaA. Upon the coming into existence of a "unified KGaA", the shareholders of FMC-AG & Co. KGaA would effectively be restored to the status as shareholders in an AG, since the control over the General Partner would be exercised by FMC-AG & Co. KGaA's Supervisory Board pursuant to the
Articles of Association. If the KGaA is continued as a "unified KGaA," an extraordinary general meeting or the next AGM would vote on a change in the legal form of the partnership limited by shares into a stock corporation. In such a case, the change of legal form back to the stock corporation would be facilitated by provisions of the Articles of Association requiring only a simple majority vote and that the General Partner consent to the transformation of legal form.
The Articles of Association provide that to the extent legally required, the General Partner must declare or refuse its consent to resolutions adopted by the meeting directly at the general meeting.
The articles of association of a KGaA may be amended only through a resolution of the general meeting adopted by a qualified majority (in excess of 75% of the voting shares) and with the consent of the general partner. Therefore, neither group (i.e., the KGaA shareholders nor the general partner(s)) can unilaterally amend the articles of association without the consent of the other group. Fresenius SE will, however, continue to be able to exert significant influence over amendments to the Articles of Association through its ownership of a significant percentage of the Company's ordinary shares, since such amendments require a qualified majority (in excess of 75%) of the shares present at the meeting rather than three quarters of the outstanding shares.
Description of the Pooling Arrangements
Prior to the transformation of legal form of FMC-AG to FMC-AG & Co. KGaA, FMC-AG, Fresenius SE and the independent directors (as defined in the pooling agreements referred to below) of FMC-AG were parties to two pooling agreements for the benefit of the holders of our ordinary sharesOrdinary Shares and the holders of our preference shares (other than Fresenius SE and its affiliates). Upon consummation of the transformation in February 2006 and completion of the conversion offer made to holders of our preference shares in connection with the transformation, we entered into pooling arrangements that we believe provide similar benefits for the shareholders of FMC-AG & Co. KGaA. The following is a summary of the material provisions of the pooling arrangements which we have entered into with Fresenius SE and our independent directors. The description is qualified in its entirety by the complete text of the pooling agreement, a copy of which is on file with the SEC.SEC including the amendment to the pooling agreement made at the 2016 AGM on May 12, 2016.
General
The pooling arrangements have been entered into for the benefit of all persons who, from time to time, beneficially own our ordinary shares,Ordinary Shares, including owners of ADSs evidencing our ordinary shares,Ordinary Shares, other than Fresenius SE and its affiliates or their agents and representatives. Beneficial ownership is determined in accordance with the beneficial ownership rules of the SEC.
Independent Directors
Under the pooling arrangements, no less than one-third of the supervisory board of Management AG, the general partner of FMC-AG & Co. KGaA, must be independent directors, and there must be at least two independent directors. Independent directors are persons without a substantial business or
professional relationship with us, Fresenius SE, or any affiliate of either, other than as a member of the Supervisory Board of FMC-AG & Co. KGaA or as a member of the supervisory board of Management AG. If an independent director resigns, is removed, or is otherwise unable or unwilling to serve in that capacity, a new person shall be appointed to serve as an independent director in accordance with the provisions of the articles of association of the General Partner, and the pooling arrangements, if as a result of the resignation or removal the number of independent directors falls below the required minimum. The provisions of the pooling agreement relating to independent directors are in addition to the functions of the joint committee established in connection with the transformation of our legal form (See Item 6C, "Directors, Senior Management and Employees-Board Practices"), and are also in addition to the requirement of Rule 10A-3 under the Exchange Act that our audit committee be composed solely of independent directors as defined in that rule. We have identified the members of Management AG's supervisory board who are independent for purposes of our pooling arrangementsagreements in Item 6.B., "Directors, Senior Management and Employees – The General Partner's Supervisory Board."
Extraordinary Transactions
Under Additionally, under the pooling arrangements, we, and our affiliates, on the one hand, and Management AG and Fresenius SE, andas well as their affiliates, on the other hand, must comply with all provisions of German law regarding: any merger, consolidation, sale of all or substantially all assets, recapitalization, other business
combination, liquidation or other similar action not in the ordinary course of our business, any issuance of shares of our voting capital stock representing more than 10% of our total voting capital stock outstanding, and any amendment to our articles of association which adversely affects any holder of ordinary shares.
Interested TransactionsOrdinary Shares.
WeLastly, we and Management AG and Fresenius SE have agreed that while the pooling arrangements are in effect, a majority of the independent directors must approve any transaction or contract, or any series of related transactions or contracts, between Fresenius SE, Management AG or any of their affiliates (other than us or our controlled affiliates), on the one hand, and us or our controlled affiliates, on the other hand, which involves aggregate payments in any calendar year in excess of €5 million for each individual transaction or contract, or a related series of transactions or contracts. However, approval is not required if the transaction or contract, or series of related transactions or contracts, has been describedthough restrictions apply with regards to agreements included in apreviously approved business plan or budget that a majority of the independent directors has previously approved. In any year in which the aggregate amount of transactions that require approval (or that would have required approval in that calendar year but for the fact that such payment or other consideration did not exceed €5 million) has exceeded €25 million, a majority of the independent directors must approve all further interested transactions involving more than €2.5 million. However, approval is not required if the transaction or contract, or series of related transactions or contracts, has been described in a business plan or budget that a majority of independent directors has previously approved.plans.
Listing of American Depositary Shares; SEC Filings
During the term of the pooling agreement, Fresenius SE has agreed to use its best efforts to exercise its rights as the direct or indirect holder of the general partner interest in Fresenius Medical Care AG & Co. KGaA to cause us to, and we have agreed to:
We undertook similar commitments with respect to the listing of the preference share ADSs and distribution of voting materials, reports and other information to the holders of such ADSs until the preference share ADSs were delisted from the New York Stock Exchange in connection with the mandatory conversion of our preference shares into ordinary shares.Ordinary Shares. The provisions of the pooling agreement relating to our ordinary sharesOrdinary Shares (including ordinary sharesOrdinary Shares represented by ordinary share ADSs) continue in effect following the mandatory conversion of our preference shares.
Term
The pooling arrangements will terminate if:
Amendment
Fresenius SE and a majority of the independent directors may amend the pooling arrangements,agreements, provided, that beneficial owners of 75% of the ordinary sharesOrdinaryShares held by shareholders other than Fresenius SE and its affiliates at a general meeting of shareholders approve such amendment.
Enforcement; Governing Law
The pooling arrangements are governed by New York law and may be enforced in the state and federal courts of New York. The Company and Fresenius SE have confirmed their intention to abide by the terms of the pooling arrangements as described above.
Directors and Officers InsuranceManagers' Transactions
Subject According to any mandatory restrictions imposed byArticle 19(1) of the Regulation (EU) No. 596/2014 of the European Parliament and of the Council (Market Abuse Regulation or "MAR"), persons discharging managerial responsibilities within an issuer of shares, as well as persons closely associated with them, are obliged to notify the issuer and the competent authority, i.e. the German law, FMC-AG has obtained and FMC-AG & Co. KGaA will continue to maintain directors and officers insurance in respectFederal Financial Supervisory Authority (Bundesanstalt für Finanzdienstleistungsaufsicht or "BaFin"), of all liabilities arising from orevery transaction conducted on their own account relating to the serviceshares or debt instruments of the issuer or to derivatives or other financial instrument linked thereto no later than three business days after the date of the transaction, once the volume of all transactions conducted within a calendar year exceeds a total amount of €5,000. Persons discharging managerial responsibilities include the members of the supervisory board and our officers, subject to legally mandated deductibles. We believe that our acquisition of that insurance is in accordance with customary and usual policies followed by public corporations in the U.S.
Annual Financial Statement and Allocation of Profits
The Articles of Association on rendering of accounts require that the annual financial statement and allocation of profits of FMC-AG & Co. KGaA be submitted for approval to the AGM of the Company.
The Articles of Association of FMC-AG & Co. KGaA provide that Management AG is authorized to transfer up to a maximum of half of the annual profits of FMC-AG & Co. KGaA to other retained earnings in preparing the annual financial statements.
Articles of Association of Management AG
As a separate corporation, Management AG, has its own articles of association.
The amount of Management AG's share capital is €3,000,000, issued as 3,000,000 registered shares without par value.
Directors' Share Dealings
According to Section 15a of the German Securities Trading Act (Wertpapierhandelsgesetz,), members of the management and as well as supervisory boards or other employees in management positions and their close associates are required to inform the Company within five business days when buying or selling our shares and financial instruments based on them if the volume exceeds €5,000 within a single year.boards. We publish the information received in these reports on our web sitewebsite in accordance with the regulations as well as in our Annual Report to Shareholders. Pursuant to Article 19(11) of the MAR, a person discharging managerial responsibilities within an issuer must not either conduct any transactions on its own account or for the account of a third party, directly or indirectly, relating to,inter alia, the shares or debt instruments of the issuer during a closed period of 30 calendar days before the announcement of an interim financial report or a year-end report which the issuer is obliged to make public.
The members of the managementManagement and supervisory boards of the General Partner and of the Company are not subject to the reporting requirements of Section 16 of the Exchange Act with respect to their ownership of or transactions in our shares.
Comparison with U.S. and NYSE Governance Standards and Practices
The listing standards of the NYSE require that a U.S. domestic listed company have a majority of independent board members and that the independent directors meet in regularly scheduled sessions
without management. U.S. listed companies also must adopt corporate governance guidelines that address director qualification standards, director responsibilities, director access to management and independent advisors, director compensation, director orientation and continuing education, management succession, and an annual performance evaluation of the board. Although, as noted above, our status as a foreign private issuer exempts us from these NYSE requirements, several of these concepts are addressed (but not mandated) by the German Corporate Governance Code. The most recent version of the German Corporate Governance Code is dated June 24, 2014.May 5, 2015. While the German Corporate Governance Code's governance rules applicable to German corporations are not legally binding, companies failing tothat do not comply with the German Corporate Governance Code's recommendations must disclose publicly how and for what reason their practices differ from those recommended by the German Corporate Governance Code. Under the German Corporate Governance Code a well justified deviation from a recommendation may be
in the interest of good corporate governance. A convenience translation of our most recent annual "Declaration of Compliance" will be posted on our web site, www.fmc-ag.com and www.freseniusmedicalcare.com at the end of the first quarter of 2015 on the Investor Relations page under "Corporate Governance/Declaration of Compliance" together with our declarations for prior years.
Some of the German Corporate Governance Code's recommendations address the independence and qualifications of supervisory board members. Specifically, the German Corporate Governance Code recommends that the supervisory board should specify concrete objectives regarding its composition which, -inter alia- shall also take into account potential conflicts of interest and what the Supervisory Boardsupervisory board considers as an adequate number of independent members. Similarly, if a substantial and not merely temporary conflict of interest arises during the term of a member of the supervisory board, the German Corporate Governance Code recommends that the term of that member be terminated. The German Corporate Governance Code further recommends that at any given time not more than two former members of the management board should serve on the supervisory board. The Company's Supervisory Board includes threefour members who also serve on the supervisory board of the General Partner, andincluding three members who serve on our Audit and Governance Committee and are independent under SEC Rule 10A-3 and NYSE Rule 303A.06 (the audit committee rules of the SEC and the NYSE, respectively),. While we are exempt from the NYSE requirement that a majority of our supervisory board members be independent, and the various tests in the NYSE rules that preclude independence are not applicable to us, our pooling agreement requires that at least one-third (but not less than two) members of the General Partner's supervisory board be "independent" within the meaning of that pooling agreement. See Item 6A, "Directors, Senior Management and Employees – Directors and Senior Management – the General Partner's Supervisory Board" and "Description of the Pooling Arrangements" above. AnyUnder the Corporate Governance Code, any supervisory board must be composed of members who have the required knowledge, abilities and expert experience to properly complete their tasks. However, we are not subject to the disclosure requirements of the SEC proxy rules, which require U.S. issuers to include in SEC filings a discussion of the specific experience, qualifications, attributes or skills that led to their inclusion as board members.
Recommendations of the German Corporate Governance Code with which we do not currently comply are number 4.2.3 paragraph 2 sentence 6 and number 4.2.5 paragraph 3 pursuant to which the amount of compensation for Management Board members shall be capped, both overall and for variable compensation components and shall be presented for each individual member of the Management Board in the compensation report by using corresponding model tables. The service agreements with members of the Management Board do not provide for caps regarding specific amounts for all compensation components and accordingly not for caps regarding specific amounts for the overall compensation. The performance-oriented short-term compensation (the variable bonus) is capped. As regards stock options and phantom stocksstock as compensation components with long-term incentives, the service agreements with members of the Management Board do provide for a possibility of limitation but not for caps regarding specific amounts. Introducing caps regarding specific amounts in relation to such stock-based compensation components would contradict the basic idea of the members of the Management Board participating appropriately in the economic risks and opportunities of the Company. Alternatively, we pursue a flexible concept considering each individual case. In situations of extraordinary developments in relation to the stock-based compensation which are not related to the performance of the Management Board, the stock-based compensation may be capped. Irrespective thereof, we continue to present the compensation system and the amounts paid to members of the Management Board in the compensation report in a comprehensive and transparent manner. The compensation report includes tables relating to the value of the benefits granted as well as to the allocation in the year under review which follow the structure and largely also the specifications of the model tables. Furthermore, we do not comply with number 4.2.3 paragraph 4 of the German Corporate Governance Code according to which care shall be taken to ensure that payments made to a Management Board member on premature termination of his/her contract, including fringe benefits, do not exceed the value of two years' compensation (severance payment cap) and compensate no more than the remaining term of the employment contract. The severance payment cap shall be calculated on the basis of the total compensation for the past full financial year and,
if appropriate, also the expected total compensation for the current financial year. The employment contracts of the members of the Management Board do not contain severance payment arrangements for the case of premature termination of the contract and consequentially do not contain a limitation of any severance payment amount insofar. Uniform severance payment arrangements of this kind would contradict the concept practiced by us in accordance with the German Stock Corporation ActAktG according to which employment contracts of the members of the Management Board are, in principle, concluded for the period of their
appointment. They would also not allow for a well-balanced assessment in the individual case. Pursuant to Code number 5.1.2 paragraph 2 sentence 3 an age limit shall be specified for members of the Management Board. As in the past, we will refrain from determining an age limit for members of the Management Board in the future. Complying with this recommendation would unduly limit the selection of qualified candidates. Finally, pursuant to Code number 5.4.1 paragraph 2 and paragraph 3, the Supervisory Board shall specify concrete objectives regarding its composition and, when making recommendations to the competent election bodies, take these objectives into account. The objectives specified by the Supervisory Board and the status of the implementation shall be published in the Corporate Governance Report. These recommendations are not met. The composition of the Supervisory Board needs to be aligned to the enterprise's interest and has to ensure the effective supervision and consultation of the Management Board. Hence, it is a matter of principle and of prime importance that each member is suitably qualified. When discussing its recommendations to the competent election bodies, the Supervisory Board will take into account the international activities of the enterprise, potential conflicts of interest, the number of independent Supervisory Board members within the meaning of Code number 5.4.2, and diversity. This includes the aim to establish an appropriate female representation on a long-term basis. In the enterprise's interest not to limit the selection of qualified candidates in a general way, the Supervisory Board, however, confines itself to a general declarationpursue self-defined targets for the inclusion of intentwomen on the Supervisory Board and particularly refrains from an age limit.limit and from a duration limit on the term of membership.
Pursuant to the act on the equal participation of women and men in executive positions in private companies, the Supervisory Board of Fresenius Medical Care AG & Co. KGaA is required to define targets for the inclusion of women on the Supervisory Board for its own composition as well as an adequate implementation period to achieve these targets. The Supervisory Board of Fresenius Medical Care AG & Co. KGaA has resolved to set the target for the women as Supervisory Board members at two until June 30, 2017. On May 12, 2016, two women were elected to the Supervisory Board: Ms. Deborah McWhinney and Ms. Pascale Witz. See Item 6, "Directors, Senior Management and Employees." The legislation does not require that companies in our legal form define targets for the Management Board.
As noted in the Introduction, as a company listed on the NYSE, we are required to maintain an audit committee in accordance with Rule 10A-3 under the Exchange Act. The NYSE's listing standards applicable to U.S. domestic listed companies require that such companies also maintain a nominating committee to select nominees to the board of directors and a compensation committee, each consisting solely of directors who are "independent" as defined in the NYSE's governance rules.
In contrast to U.S. practice, with one exception, German corporate law does not mandate the creation of specific supervisory board committees, independent or otherwise. In certain cases, German corporations are required to establish what is called a mediation committee with a charter to resolve any disputes among the members of the supervisory board that may arise in connection with the appointment or dismissal of members of the management board. The German Stock Corporation ActAktG provides that the supervisory board may establish, and the German Corporate Governance Code recommends that a supervisory board establish, an audit committee to handle the formal engagement of the company's independent auditors once they have been approved by the general meeting of shareholders. Under the German Corporate Governance Code, the audit committee would also handle inter alia the monitoring of the accounting process, the effectiveness of the internal control system, the audit of the annual financial statements, here, in particular, the independence of the auditor, the services rendered additionally by the auditor, the issuing of the audit mandate to the auditor, the determination of auditing focal points and the fee arrangement, and – unless another committee is entrusted therewith – compliance. Under the Stock Corporation Act, an audit committee should supervise the effectiveness of the internal control system, the risk management system and the internal audit function. Pursuant to Section 319a of the German Commercial Code, the audit committee is responsible for the pre-approval of legally permitted non-audit services by the auditor. Our Audit and Corporate Governance Committee within the Supervisory Board functions in each of these areas and is also conducting, with the assistance of independent counsel, an investigation into allegations of conduct in countries outside the U.S. and Germany that may violate the FCPA or other anti-bribery laws. See "Item 15B. Management's annual report on internal control over financial reporting" and Note 2018 of the Notes to our Consolidated Financial Statements, "Commitments and Contingencies – Other Litigation and Potential Exposures.Exposures," included in this report. Our Audit and Corporate Governance Committee also serves as our audit committee as required by Rule 10A-3 under the Exchange Act and the NYSE rules. As sole shareholder of our General Partner, Fresenius SE elects the supervisory board of our general partner (subject to the requirements of our pooling agreement discussed above).
In practice, the supervisory boards of many German companies have also constituted other committees to facilitate the work of the supervisory board. For example, a presidential committee is frequently constituted to deal with executive compensation and nomination issues as well as service agreements with members of the supervisory board. Under the NYSE compensation committee rule, as
amended to implement SEC Rule 10C-1 adopted under the Dodd-Frank Act, NYSE-listed companies must maintain a compensation committee consisting solely of independent directors, with independence to be determined considering all relevant factors. Under the NYSE rules, foreign private issuers such as FMC-AG & Co. KGaA continue to be exempt from all requirements to maintain an independent compensation committee. At the present time, we do not maintain a compensation committee andcommittee. In accordance with the German Commercial Code these functions are carried out by our General Partner's supervisory board, as a whole assisted, with respect to compensation matters, by its Human Resources Committee.Committee which is comprised of independent and non-executive members. See Item 6.B, "Directors,"Directors, Senior Management and Employees – Compensation – Compensation of the Management Board" and "Directors – Senior Management and Employees – Board Committees." We have also established a nomination committee and we have established a joint committee (the "Joint Committee")the Joint Committee (gemeinsamer Ausschuss) together with Management AG of FMC-AG & Co. KGaA consisting of two members of each supervisory board to advise and decide on certain extraordinary management measures.
For information regarding the members of our Audit and Corporate Governance Committee as well as the functions of the Audit and Corporate Governance Committee, the Joint Committee, the Nominating Committee, and our General Partner's Regulatory and Reimbursement Assessment Committee, see Item 6.C, "Directors, Senior Management and Employees – Board Practices."
Not applicable. See "Item 18. Financial Statements."
The information called for by this item commences on Page F-1.
Pursuant to the provisions of the Instructions for the filings of Exhibits to Annual Reports on Form 20-F, Fresenius Medical Care AG & Co. KGaA (the "Registrant") is filing the following exhibits
| 1.1 | Articles of Association (Satzung) of the Registrant (incorporated by reference to Exhibit 1.1 to the Registrant's | ||
2.1 | Amended and Restated Deposit Agreement dated as of February 26, 2007 between The Bank of New York (now The Bank of New York Mellon) and the Registrant relating to Ordinary Share ADSs (incorporated by reference to Exhibit 1 to the Registrant's Registration Statement on Form F-6, Registration No. 333-140664, filed February 13, 2007). | ||
2.2 | Amendment to the form of American Depositary Receipt for American Depositary Shares representing Ordinary Shares (incorporated by reference to the amended prospectus filed May 16, 2013). | ||
2.3 | Pooling Agreement dated February 13, 2006 by and between Fresenius AG, Fresenius Medical Care Management AG and the individuals acting from time to time as Independent Directors. (incorporated by reference to Exhibit 2.3 to the Registrant's Annual Report on Form 20-F for the year ended December 31, 2005, filed March 2, 2006). | ||
2.4 | Amendment to the Pooling Agreement dated September 28, 2016 by and between Fresenius AG, Fresenius Medical Care Management AG acting for itself and in its capacity as general partner of Fresenius Medical Care AG & Co. KGaA, Mr. William P. Johnston in his capacity as a GP Independent Director and Mr. Rolf A. Classon in his capacity as a GP Independent Director. (incorporated by reference to Exhibit 2.3 to the Registrant's Report on Form 6-K for the month of October 2016, furnished October 27, 2016). | ||
2.5 | Indenture dated as of July 2, 2007 by and among FMC Finance III S.A., the Registrant and the other Guarantors party thereto and U.S. Bank National Association, as Trustee, related to the 67/8% Senior Notes due 2017 of FMC Finance III S.A. (incorporated by reference to Exhibit 4.3 to the Registrant's Report on Form 6-K for the month of August 2007, furnished August 2, 2007). | ||
Form of Note Guarantee for 67/8% Senior Notes due 2017 (Included in Exhibit 2.4) (incorporated by reference to Exhibit 4.3 to the Registrant's Report on Form 6-K for the month of August 2007, furnished August 2, 2007). | |||
Supplemental Indenture dated as of June 20, 2011 to Indenture dated as of July 2, 2007 (incorporated by reference to Exhibit 10.4 to the Registrant's Report on Form 6-K for the month of August 2011, furnished August 2, 2011). | |||
Indenture | |||
Form of Note Guarantee for 5.25% Senior Notes due 2021 (included in Exhibit 2.9) (incorporated by reference to Exhibit 2.21 to the Registrant's Annual Report on Form 20-F for the year ended December 31, 2010, filed February 23, 2011). |
| Indenture | |||
Form of Note Guarantee for 5.75% Senior Notes due 2021 (included in Exhibit 2.11) (incorporated by reference to Exhibit 2.23 to the Registrant's Annual Report on Form 20-F for the year ended December 31, 2010, filed February 23, 2011). | |||
Indenture | |||
Form of Note Guarantee for 6.50% | |||
Indenture | |||
Form of Note Guarantee for 6.50% | |||
Indenture | |||
Form of Note Guarantee for 55/8% Senior Notes due 2019 (included in Exhibit 2.19) (incorporated by reference to Exhibit 2.20 to the Registrant's Annual Report on Form 20-F for the year ended December 31, 2011, filed February 23, 2012). | |||
Indenture | |||
Form of Note Guarantee for 57/8% Senior Notes due 2022 (included in Exhibit 2.21) (incorporated by reference to Exhibit 2.22 to the Registrant's Annual Report on Form 20-F for the year ended December 31, 2011, filed February 23, 2012). |
2.20 | |||
Indenture | |||
Form of Note Guarantee for 5.25% |
| 2.22 | Indenture dated as of October 29, 2014 by and among Fresenius Medical Care US Finance II, Inc., the Company and the other Guarantors party thereto and U.S. Bank National Association, as Trustee, related to the 4.125% Senior Notes due 2020 of Fresenius Medical Care US Finance II, Inc. (incorporated by reference to Exhibit 10.1 to the Registrant's Report on Form 6-K for the month of November 2014, furnished November 4, 2014). | ||
Form of Note Guarantee for 4.125% Senior Notes due 2020 (included in Exhibit 2.25) (incorporated by reference to Exhibit 10.2 to the Registrant's Report on Form 6-K for the month of November 2014, furnished November 4, 2014). | |||
Indenture dated as of October 29, 2014 by and among Fresenius Medical Care US Finance II, Inc., the Company and the other Guarantors party thereto and U.S. Bank National Association, as Trustee, related to the 4.75% Senior Notes due 2024 of Fresenius Medical Care US Finance II, Inc. (incorporated by reference to Exhibit 10.3 to the Registrant's Report on Form 6-K for the month of November 2014, furnished November 4, 2014). | |||
Form of Note Guarantee for 4.75% Senior Notes due 2024 (included in Exhibit 2.27) ((incorporated by reference to Exhibit 10.4 to the Registrant's Report on Form 6-K for the month of November 2014, furnished November 4, 2014). | |||
Terms & Conditions | |||
Credit Agreement dated as of October 30, 2012 among the Registrant, Fresenius Medical Care Holdings, Inc., and certain subsidiaries of the Registrant as borrowers and guarantors, Bank of America N.A., as administrative agent, Deutsche Bank AG New York Branch, as sole syndication agent, Commerzbank AG, New York Branch, JPMorgan Chase Bank, National Association, The Bank of Nova Scotia, Suntrust Bank, Unicredit Bank AG, New York Branch, and Wells Fargo Bank, National Association, as co-documentation agents, and the lenders named therein (incorporated by reference to Exhibit 2.25 to the Registrant's Annual Report on Form 20-F for the year ended December 31, 2012, filed February 26, 2013). | |||
Amendment No. 1 dated November 25, 2014 to Credit Agreement | |||
Seventh Amended and Restated Transfer and Administration Agreement dated as of November 24, 2014 by and among NMC Funding Corporation, as Transferor, National Medical Care, Inc., as initial collection agent, Liberty Street Funding LLC, and other conduit investors party thereto, the financial institutions party thereto, The Bank of Tokyo-Mitsubishi UFJ, Ltd., New York Branch, Barclays Bank PLC, Credit Agricole Corporate and Investment Bank, New York, PNC Bank, National Association, Royal Bank of Canada, as administrative agents, and The Bank of Nova Scotia, as an administrative agent and as agent (incorporated by reference to Exhibit 2.33 to the Registrant's Annual Report on Form 20-F for the year ended December 31, 2014, filed February 25, 2015). | |||
2.30 | Amendment No. 1 dated December 6, 2016 to Seventh Amended and Restated Transfer and Administration Agreement (filed herewith). | ||
Second Amended and Restated Receivables Purchase Agreement dated January 17, 2013 between National Medical Care, Inc. and NMC Funding Corporation (incorporated by reference to Exhibit 2.39 to the Registrant's Annual Report on Form 20-F for the year ended December 31, 2012, filed February 26, 2013). | |||
Amendment No. 1 dated November 24, 2014 to Second Amended and Restated Receivables Purchase Agreement (incorporated by reference to Exhibit 2.35 to the Registrant's Annual Report on Form 20-F for the year ended December 31, 2014, filed February 25, 2015). | |||
2.33 | Amendment No. 2 dated December 6, 2016 to Second Amended and Restated Receivables Purchase Agreement (filed herewith). |
| 4.1 | Agreement and Plan of Reorganization dated as of February 4, 1996 between W.R. Grace & Co. and Fresenius AG. (incorporated by reference to Appendix A to the Joint Proxy Statement-Prospectus of FMC-AG, W.R. Grace & Co. and Fresenius USA, Inc., dated August 2, 1996). | ||
4.2 | Distribution Agreement dated as of February 4, 1996 by and among W.R. Grace & Co., W.R., Grace & Co. – Conn. and Fresenius AG (incorporated by reference to Appendix A to the Joint Proxy Statement-Prospectus of FMC-AG, W.R. Grace & Co. and Fresenius USA, Inc., dated August 2, 1996). | ||
4.3 | Contribution Agreement dated as of February 4, 1996 by and among Fresenius AG, Sterilpharma GmbH and W.R. Grace & Co. – Conn. (incorporated by reference to Appendix E to the Joint Proxy Statement-Prospectus of FMC-AG, W.R. Grace & Co. and Fresenius USA, Inc., dated August 2, 1996). | ||
4.4 | |||
Lease Agreement for Manufacturing Facilities dated | |||
Lease Agreement for Manufacturing Facilities dated | |||
Trademark License Agreement dated September 27, 1996 by and between Fresenius AG and FMC-AG. (Incorporated by reference to Exhibit 10.8 to FMC-AG's Registration Statement on Form F-1, Registration No. 333-05922, filed November 16, 1996). | |||
Technology License Agreement (Biofine) dated September 27, 1996 by and between Fresenius AG and FMC-AG (incorporated by reference to Exhibit 10.9 to the Registration Statement on Form F-1 of FMC-AG, Registration No. 333-05922, filed November 16, 1996). | |||
Cross-License Agreement dated September 27, 1996 by and between Fresenius AG and FMC-AG (incorporated by reference to Exhibit 10.10 to the Registration Statement on Form F-1 of FMC-AG, Registration No. 333-05922, filed November 16, 1996). | |||
Fresenius Medical Care Aktiengesellschaft 2001 International Stock Incentive Plan (incorporated by reference to Exhibit 10.17 to the Registration Statement on Form F-4 of FMC-AG et al, Registration No. 333-66558, filed August 2, 2001). | |||
Stock Option Plan 2006 of Fresenius Medical Care AG & Co. KGaA (incorporated by reference to Exhibit 10.2 to the Registrant's Amended Report on Form 6-K/A for the month of August 2006, furnished August 11, 2006). | |||
English convenience translation of the Stock Option Plan 2011 of Fresenius Medical Care AG & Co. KGaA (incorporated by reference to Exhibit 10.2 to the Registrant's Report on Form 6-K for the month of August 2011, furnished August 2, 2011). | |||
English convenience translation of the Phantom Stock Plan 2011 of Fresenius Medical Care AG & Co. KGaA (incorporated by reference to Exhibit 10.5 to the Registrant's Report on Form 6-K for the month of August 2011, furnished August 2, 2011). |
4.13 | English convenience translation of the Fresenius Medical Care & Co KGaA Long Term Incentive Plan 2016 (incorporated by reference to Exhibit 4.25 of the Registrant's Report on Form 6-K for the month of October, furnished October 27, 2016). | ||
4.14 | Amended and Restated Subordinated Loan Note dated as of March 31, 2006, among National Medical Care, Inc. and certain of its subsidiaries as Borrowers and Fresenius AG as Lender (incorporated herein by reference to Exhibit 4.3 to the Registrant's Report on Form 6-K for the month of May 2006, furnished May 17, 2006).(1) | ||
Allonge dated September 29, 2010 to Amended and Restated Subordinated Loan Note dated as of March 31, 2006 (incorporated by reference to Exhibit 10.5 to the Registrant's Amended Report on Form 6-K/A for the month of November 2010, furnished April 8, 2011).(1) |
| 4.16 | Agreement and Plan of Merger by and among Bio-Medical Applications Management Company, Inc., PB Merger Sub, Inc., Liberty Dialysis Holdings, Inc., certain stockholders of Liberty Dialysis Holdings, Inc., LD Stockholder Representative, LLC, and Fresenius Medical Care Holdings, Inc. dated as of August 1, 2011(incorporated by reference to Exhibit 10.5 to the Registrant's Report of Form 6 K for the month of November 2011, furnished November 3, 2011).(1) | ||
General Agreement 2013 (mainly related to information technology services) dated May 8, 2013 by and between FMC-AG and Fresenius Netcare GmbH. (incorporated by reference to Exhibit 4.32 to the Registrant's Report on Form 6-K for the month of July 2013, filed July 30, 2013). | |||
Loan Note dated June 30, 2014, among the Registrant and certain of its U.S. subsidiaries as borrowers and Fresenius SE & Co. KGaA as lenders (incorporated by reference to Exhibit 4.27 to the Registrant's Report on Form 6-K for the month of July 2014, furnished July 31, 2014).(1) | |||
Stock Purchase and Contribution Agreement dated as of June 13, 2014 by and among Sound Inpatient Physicians, Inc., of Sound Inpatient Holdings, LLC, Sound Inpatient Physicians Holdings, LLC and the Registrant (incorporated by reference to Exhibit 4.28 to the Registrant's Report on Form 6-K for the month of July 2014, furnished July 31, 2014).(1)(2) | |||
4.20 | Amended and Restated Loan Note dated June 18, 2015, among the Registrant and certain of its subsidiaries as borrowers and Fresenius SE & Co. KGaA as lenders (incorporated by reference to Exhibit 4.33 to the Registrant's Report on Form 6-K for the month of July 2015, furnished July 30, 2015). | ||
8.1 | List of Significant Subsidiaries. Our significant subsidiaries are identified in "Item 4.C. Information on the Company – Organizational Structure." | ||
11.1 | Code of Business Conduct. A copy of the Registrant's Code of Business Conduct is available on the Registrant's web site at: http:// | ||
12.1 | Certification of Chief Executive Officer of the general partner of the Registrant Pursuant to Section 302 of the Sarbanes-Oxley Act of 2002 (filed herewith). | ||
12.2 | Certification of Chief Financial Officer of the general partner of the Registrant Pursuant to Section 302 of the Sarbanes-Oxley Act of 2002 (filed herewith). | ||
13.1 | Certification of Chief Executive Officer and Chief Financial Officer of the general partner of the Registrant Pursuant to 18 U.S.C. Section 1350, as Adopted Pursuant to Section 906 of the Sarbanes-Oxley Act of 2002 (furnished herewith). (This Exhibit is furnished herewith, but not deemed "filed" for purposes of Section 18 of the Securities Exchange Act of 1934, as amended, or otherwise subject to liability under that section. Such certification will not be deemed to be incorporated by reference into any filing under the Securities Act or the Exchange Act, except to the extent that we explicitly incorporate it by reference.) | ||
14.1 | Consent of KPMG, independent registered public accounting firm (filed herewith). | ||
101 | The following financial statements as of and for the twelve-month period ended December 31, |
Pursuant to the requirements of the Securities Exchange Act of 1934, the Registrant has duly caused this report to be signed on its behalf by the undersigned thereunto duly authorized.
DATE: February 25, 201522, 2017
| FRESENIUS MEDICAL CARE AG & Co. KGaA a partnership limited by shares, represented by: | ||||
FRESENIUS MEDICAL CARE MANAGEMENT AG, its general partner | ||||
By: | /s/ RICE POWELL | |||
| Name: | Rice Powell | |||
| Title: | Chief Executive Officer and Chairman of the Management Board of the General Partner | |||
By: | /s/ MICHAEL BROSNAN | |||
| Name: | Michael Brosnan | |||
| Title: | Chief Financial Officer and member of the Management Board of the General Partner | |||
Audited Consolidated Financial Statements | ||||
Management's Annual Report on Internal Control over Financial Reporting | F-2 | |||
Report of Independent Registered Public Accounting Firm | F-3 | |||
Report of Independent Registered Public Accounting Firm on Internal Control over Financial Reporting | F-4 | |||
Consolidated Statements of Income for the years ended December 31, | F-5 | |||
Consolidated Statements of Comprehensive Income for the years ended December 31, | F-6 | |||
Consolidated Balance Sheets as of December 31, | F-7 | |||
Consolidated Statements of Cash Flows for the years ended December 31, | F-8 | |||
Consolidated Statements of Shareholders' Equity for the years ended December 31, | F-9 | |||
Notes to Consolidated Financial Statements | F-10 | |||
Financial Statement Schedule | S-II |
MANAGEMENT'S ANNUAL REPORT ON INTERNAL CONTROL OVER FINANCIAL REPORTING
Management of the Company is responsible for establishing and maintaining adequate internal control over financial reporting, as such term is defined in Exchange Act Rule 13a-15(f). The Company's internal control over financial reporting is a process designed by or under the supervision of the Company's chief executive officer and chief financial officer to provide reasonable assurance regarding the reliability of financial reporting and the preparation of the Company's financial statements for external reporting purposes in accordance with U.S. generally accepted accounting principles.
As of December 31, 2014,2016, management conducted an assessment of the effectiveness of the Company's internal control over financial reporting based on the criteria established in Internal Control – Integrated Framework (2013) issued by the Committee of Sponsoring Organizations of the Treadway Commission (COSO). Management's assessment follows the guidance for management of the evaluation of internal controls over financial reporting released by the Securities and Exchange Commission on May 23, 2007. Based on this assessment, management has determined that the Company's internal control over financial reporting is effective as of December 31, 2014.2016.
The Company's internal control over financial reporting includes policies and procedures that (1) pertain to the maintenance of records that in reasonable detail accurately and fairly reflect transactions and dispositions of assets; (2) provide reasonable assurance that the Company's transactions are recorded as necessary to permit preparation of financial statements in accordance with U.S. generally accepted accounting principles, and that the Company's receipts and expenditures are being made only in accordance with authorizations of the Company's management and directors; and (3) provide reasonable assurance regarding prevention or timely detection of unauthorized acquisition, use or disposition of the Company's assets that could have a material effect on the Company's financial statements.
Because of its inherent limitation, internal control over financial reporting, no matter how well designed, cannot provide absolute assurance of achieving financial reporting objectives and may not prevent or detect misstatements. Therefore, even if the internal control over financial reporting is determined to be effective it can provide only reasonable assurance with respect to financial statement preparation and presentation. Also, projections of any evaluation of effectiveness to future periods are subject to the risk that controls may become inadequate because of changes in conditions, or that the degree of compliance with the policies or procedures may deteriorate.
The Company's internal control over financial reporting as of December 31, 20142016 has been audited by KPMG AG Wirtschaftsprüfungsgesellschaft, an independent registered public accounting firm, as stated in their report included on page F-4.
| Date: February | FRESENIUS MEDICAL CARE AG & CO. KGaA, a partnership limited by shares, represented by: | |||
FRESENIUS MEDICAL CARE MANAGEMENT AG, its General Partner | ||||
By: | /s/ RICE POWELL | |||
| Name: | Rice Powell | |||
| Title: | Chief Executive Officer and Chairman of the Management Board of the General Partner | |||
By: | /s/ MICHAEL BROSNAN | |||
| Name: | Michael Brosnan | |||
| Title: | Chief Financial Officer and member of the Management Board of the General Partner | |||
REPORT OF INDEPENDENT REGISTERED PUBLIC ACCOUNTING FIRM
The Supervisory Board
Fresenius Medical Care AG & Co. KGaA:
We have audited the accompanying consolidated balance sheets of Fresenius Medical Care AG & Co. KGaA and subsidiaries ("Fresenius Medical Care" or the "Company") as of December 31, 20142016 and 20132015 and the related consolidated statements of income, comprehensive income, shareholders' equity and cash flows for each of the years in the three-year period ended December 31, 2014.2016. In connection with our audits of the consolidated financial statements, we have also audited the financial statement schedule as listed in the accompanying index. These consolidated financial statements and the financial statement schedule are the responsibility of the Company's management. Our responsibility is to express an opinion on these consolidated financial statements and the financial statement schedule based on our audits.
We conducted our audits in accordance with the standards of the Public Company Accounting Oversight Board (United States). Those standards require that we plan and perform the audit to obtain reasonable assurance about whether the financial statements are free of material misstatement. An audit includes examining, on a test basis, evidence supporting the amounts and disclosures in the financial statements. An audit also includes assessing the accounting principles used and significant estimates made by management, as well as evaluating the overall financial statement presentation. We believe that our audits provide a reasonable basis for our opinion.
In our opinion, the consolidated financial statements referred to above present fairly, in all material respects, the financial position of Fresenius Medical Care as of December 31, 20142016 and 2013,2015, and the results of their operations and their cash flows for each of the years in the three-year period ended December 31, 2014,2016, in conformity with U.S. generally accepted accounting principles. Also in our opinion, the related financial statement schedule, when considered in relation to the consolidated financial statements taken as a whole, presents fairly, in all material respects, the information set forth therein.
We also have audited, in accordance with the standards of the Public Company Accounting Oversight Board (United States), Fresenius Medical Care's internal control over financial reporting as of December 31, 2014,2016, based on criteria established in Internal Control – Integrated Framework (2013) issued by the Committee of Sponsoring Organizations of the Treadway Commission (COSO), and our report dated February 25, 201522, 2017 expressed an unqualified opinion on the effectiveness of the Company's internal control over financial reporting.
Frankfurt am Main, Germany
February 25, 201522, 2017
/s/ KPMG AG
Wirtschaftsprüfungsgesellschaft
REPORT OF INDEPENDENT REGISTERED PUBLIC ACCOUNTING FIRM
ON INTERNAL CONTROL OVER FINANCIAL REPORTING
The Supervisory Board
Fresenius Medical Care AG & Co. KGaA:
We have audited the internal control over financial reporting of Fresenius Medical Care AG & Co. KGaA and subsidiaries ("Fresenius Medical Care" or the "Company") as of December 31, 2014,2016, based on criteria established in Internal Control – IntegratedControl-Integrated Framework (2013) issued by the Committee of Sponsoring Organizations of the Treadway Commission (COSO). Fresenius Medical Care's management is responsible for maintaining effective internal control over financial reporting and its assessment of the effectiveness of internal control over financial reporting included in the accompanying Management's Annual Report on Internal Control over Financial Reporting. Our responsibility is to express an opinion on the Company's internal control over financial reporting based on our audit.
We conducted our audit in accordance with the standards of the Public Company Accounting Oversight Board (United States). Those standards require that we plan and perform the audit to obtain reasonable assurance about whether effective internal control over financial reporting was maintained in all material respects. Our audit included obtaining an understanding of internal control over financial reporting, assessing the risk that a material weakness exists, and testing and evaluating the design and operating effectiveness of internal control based on the assessed risk. Our audit also included performing such other procedures as we considered necessary in the circumstances. We believe that our audit provides a reasonable basis for our opinion.
A company's internal control over financial reporting is a process designed to provide reasonable assurance regarding the reliability of financial reporting and the preparation of financial statements for external purposes in accordance with generally accepted accounting principles. A company's internal control over financial reporting includes those policies and procedures that (1) pertain to the maintenance of records that, in reasonable detail, accurately and fairly reflect the transactions and dispositions of the assets of the company; (2) provide reasonable assurance that transactions are recorded as necessary to permit preparation of financial statements in accordance with generally accepted accounting principles, and that receipts and expenditures of the company are being made only in accordance with authorizations of management and directors of the company; and (3) provide reasonable assurance regarding prevention or timely detection of unauthorized acquisition, use, or disposition of the company's assets that could have a material effect on the financial statements.
Because of its inherent limitations, internal control over financial reporting may not prevent or detect misstatements. Also, projections of any evaluation of effectiveness to future periods are subject to the risk that controls may become inadequate because of changes in conditions, or that the degree of compliance with the policies or procedures may deteriorate.
In our opinion, Fresenius Medical Care maintained, in all material respects, effective internal control over financial reporting as of December 31, 2014,2016, based on criteria established in Internal Control – Integrated Framework (2013) issued by the Committee of Sponsoring Organizations of the Treadway Commission (COSO).
We also have audited, in accordance with the standards of the Public Company Accounting Oversight Board (United States), the consolidated balance sheets of Fresenius Medical Care as of December 31, 20142016 and 2013,2015, and the related consolidated statements of income, comprehensive income, shareholders' equity and cash flows for each of the years in the three-year period ended December 31, 2014,2016, and our report dated February 25, 201522, 2017 expressed an unqualified opinion on those consolidated financial statements.
Frankfurt am Main, Germany
February 25, 201522, 2017
/s/ KPMG AG
Wirtschaftsprüfungsgesellschaft
FRESENIUS MEDICAL CARE AG & Co. KGaA
Consolidated Statements of Income
For the years ended December 31,
(in thousands, except share data)
| | 2014 | 2013 | 2012 | 2016 | 2015 | 2014 | ||||||||||||||
|---|---|---|---|---|---|---|---|---|---|---|---|---|---|---|---|---|---|---|---|---|
Net revenue: | ||||||||||||||||||||
Health Care | $ | 12,552,646 | $ | 11,414,734 | $ | 10,772,124 | $ | 14,949,086 | $ | 13,801,298 | $ | 12,552,646 | ||||||||
Less: Patient service bad debt provision | 302,647 | 284,648 | 280,365 | 430,230 | 409,583 | 302,647 | ||||||||||||||
Net Health Care | 12,249,999 | 11,130,086 | 10,491,759 | 14,518,856 | 13,391,715 | 12,249,999 | ||||||||||||||
Dialysis Products | 3,581,614 | 3,479,641 | 3,308,523 | 3,391,931 | 3,345,867 | 3,581,614 | ||||||||||||||
| | | | | | | | | | | | | | | | | | | | | |
| 15,831,613 | 14,609,727 | 13,800,282 | 17,910,787 | 16,737,582 | 15,831,613 | |||||||||||||||
Costs of revenue: | ||||||||||||||||||||
Health Care | 9,131,005 | 8,266,635 | 7,649,514 | 10,661,488 | 9,861,253 | 9,131,005 | ||||||||||||||
Dialysis Products | 1,704,762 | 1,604,695 | 1,549,515 | 1,469,657 | 1,545,166 | 1,704,762 | ||||||||||||||
| | | | | | | | | | | | | | | | | | | | | |
| 10,835,767 | 9,871,330 | 9,199,029 | 12,131,145 | 11,406,419 | 10,835,767 | |||||||||||||||
Gross profit | 4,995,846 | 4,738,397 | 4,601,253 | 5,779,642 | 5,331,163 | 4,995,846 | ||||||||||||||
Operating (income) expenses: | ||||||||||||||||||||
Selling, general and administrative | 2,644,660 | 2,391,927 | 2,224,715 | 3,044,663 | 2,895,581 | 2,644,037 | ||||||||||||||
(Gain) loss on sale of dialysis clinics | (623 | ) | (9,426 | ) | (36,224 | ) | ||||||||||||||
Research and development | 122,114 | 125,805 | 111,631 | 162,364 | 140,302 | 122,114 | ||||||||||||||
Income from equity method investees | (24,838 | ) | (26,105 | ) | (17,442 | ) | (64,908 | ) | (31,452 | ) | (24,838 | ) | ||||||||
Other operating expenses | — | — | 100,000 | |||||||||||||||||
| | | | | | | | | | | | | | | | | | | | | |
Operating income | 2,254,533 | 2,256,196 | 2,218,573 | 2,637,523 | 2,326,732 | 2,254,533 | ||||||||||||||
Other (income) expense: | ||||||||||||||||||||
Investment Gain | — | — | (139,600 | ) | ||||||||||||||||
Interest income | (84,240 | ) | (38,942 | ) | (44,474 | ) | (46,644 | ) | (116,575 | ) | (84,240 | ) | ||||||||
Interest expense | 495,367 | 447,503 | 470,534 | 452,177 | 508,035 | 495,367 | ||||||||||||||
| | | | | | | | | | | | | | | | | | | | | |
Income before income taxes | 1,843,406 | 1,847,635 | 1,932,113 | 2,231,990 | 1,935,272 | 1,843,406 | ||||||||||||||
Income tax expense | 583,598 | 592,012 | 605,136 | 683,139 | 622,123 | 583,598 | ||||||||||||||
| | | | | | | | | | | | | | | | | | | | | |
Net income | 1,259,808 | 1,255,623 | 1,326,977 | 1,548,851 | 1,313,149 | 1,259,808 | ||||||||||||||
Less: Net income attributable to noncontrolling interests | 214,542 | 145,733 | 140,168 | 305,584 | 283,704 | 214,542 | ||||||||||||||
| | | | | | | | | | | | | | | | | | | | | |
Net income attributable to shareholders of FMC-AG & Co. KGaA | $ | 1,045,266 | $ | 1,109,890 | $ | 1,186,809 | $ | 1,243,267 | $ | 1,029,445 | $ | 1,045,266 | ||||||||
| | | | | | | | | | | | | | | | | | | | | | |
| | | | | | | | | | | | | | | | | | | | | |
Basic earnings per share | $ | 3.46 | $ | 3.65 | $ | 3.89 | $ | 4.07 | $ | 3.38 | $ | 3.46 | ||||||||
| | | | | | | | | | | | | | | | | | | | | | |
| | | | | | | | | | | | | | | | | | | | | |
Fully diluted earnings per share | $ | 3.45 | $ | 3.65 | $ | 3.87 | $ | 4.06 | $ | 3.38 | $ | 3.45 | ||||||||
| | | | | | | | | | | | | | | | | | | | | | |
| | | | | | | | | | | | | | | | | | | | | |
See accompanying notes to consolidated financial statements.
FRESENIUS MEDICAL CARE AG & Co. KGaA
Consolidated Statements of Comprehensive Income
For the years ended December 31,
(in thousands, except share data)
| | 2014 | 2013 | 2012 | 2016 | 2015 | 2014 | ||||||||||||||
|---|---|---|---|---|---|---|---|---|---|---|---|---|---|---|---|---|---|---|---|---|
Net Income | $ | 1,259,808 | $ | 1,255,623 | $ | 1,326,977 | $ | 1,548,851 | $ | 1,313,149 | $ | 1,259,808 | ||||||||
| | | | | | | | | | | | | | | | | | | | | |
Gain (loss) related to cash flow hedges | 25,547 | 22,532 | 24,019 | 27,795 | 60,131 | 25,547 | ||||||||||||||
Actuarial gains (losses) on defined benefit pension plans | (215,161 | ) | 64,989 | (103,178 | ) | (1,464 | ) | 81,834 | (215,161 | ) | ||||||||||
Gain (loss) related to foreign currency translation | (421,789 | ) | (114,439 | ) | 63,803 | 1,280 | (352,125 | ) | (421,789 | ) | ||||||||||
Income tax (expense) benefit related to components of other comprehensive income | 68,161 | (33,600 | ) | 8,831 | (11,774 | ) | (43,353 | ) | 68,161 | |||||||||||
| | | | | | | | | | | | | | | | | | | | | |
Other comprehensive income (loss), net of tax | (543,242 | ) | (60,518 | ) | (6,525 | ) | 15,837 | (253,513 | ) | (543,242 | ) | |||||||||
| | | | | | | | | | | | | | | | | | | | | |
Total comprehensive income | $ | 716,566 | $ | 1,195,105 | $ | 1,320,452 | $ | 1,564,688 | $ | 1,059,636 | $ | 716,566 | ||||||||
Comprehensive income attributable to noncontrolling interests | 208,456 | 143,689 | 139,989 | 304,138 | 278,743 | 208,456 | ||||||||||||||
| | | | | | | | | | | | | | | | | | | | | |
Comprehensive income attributable to shareholders of FMC-AG & Co. KGaA | $ | 508,110 | $ | 1,051,416 | $ | 1,180,463 | $ | 1,260,550 | $ | 780,893 | $ | 508,110 | ||||||||
| | | | | | | | | | | | | | | | | | | | | | |
| | | | | | | | | | | | | | | | | | | | | |
See accompanying notes to consolidated financial statements.
FRESENIUS MEDICAL CARE AG & Co. KGaA
Consolidated Balance Sheets
(in thousands, except share data)
| | December 31, 2014 | December 31, 2013 | December 31, 2016 | December 31, 2015 | ||||||||||
|---|---|---|---|---|---|---|---|---|---|---|---|---|---|---|
Assets | ||||||||||||||
Current assets: | ||||||||||||||
Cash and cash equivalents | $ | 633,855 | $ | 682,777 | $ | 747,233 | $ | 549,500 | ||||||
Trade accounts receivable less allowance for doubtful accounts of $418,508 in 2014 and $413,165 in 2013 | 3,203,655 | 3,037,274 | ||||||||||||
Trade accounts receivable less allowance for doubtful accounts of $508,562 in 2016 and $465,790 in 2015 | 3,524,258 | 3,285,196 | ||||||||||||
Accounts receivable from related parties | 193,225 | 153,118 | 220,797 | 218,285 | ||||||||||
Inventories | 1,115,554 | 1,097,104 | 1,409,834 | 1,340,751 | ||||||||||
Prepaid expenses and other current assets | 1,333,067 | 1,037,391 | 1,411,833 | 1,374,715 | ||||||||||
Deferred taxes | 245,354 | 279,052 | ||||||||||||
| | | | | | | | | | | | | | | |
Total current assets | 6,724,710 | 6,286,716 | 7,313,955 | 6,768,447 | ||||||||||
Property, plant and equipment, net | 3,290,180 | 3,091,954 | 3,773,213 | 3,425,574 | ||||||||||
Intangible assets | 869,411 | 757,876 | 847,198 | 830,489 | ||||||||||
Goodwill | 13,082,180 | 11,658,187 | 13,666,446 | 13,032,750 | ||||||||||
Deferred taxes | 141,052 | 104,167 | 202,838 | 188,833 | ||||||||||
Investment in equity method investees | 676,822 | 664,446 | 679,242 | 644,709 | ||||||||||
Other assets and notes receivables | 662,746 | 556,560 | ||||||||||||
Other assets | 451,050 | 474,452 | ||||||||||||
| | | | | | | | | | | | | | | |
Total assets | $ | 25,447,101 | $ | 23,119,906 | $ | 26,933,942 | $ | 25,365,254 | ||||||
| | | | | | | | | |||||||
| | | | | | | |||||||||
| | | | | | | | | | | | | | | |
Liabilities and shareholders' equity | ||||||||||||||
Current liabilities: | ||||||||||||||
Accounts payable | $ | 573,184 | $ | 542,597 | $ | 606,694 | $ | 627,828 | ||||||
Accounts payable to related parties | 140,731 | 123,929 | 278,355 | 153,023 | ||||||||||
Accrued expenses and other current liabilities | 2,197,245 | 2,012,533 | 2,653,185 | 2,503,137 | ||||||||||
Short-term borrowings and other financial liabilities | 132,693 | 96,648 | ||||||||||||
Short-term borrowings from related parties | 5,357 | 62,342 | ||||||||||||
Short-term debt | 602,494 | 109,252 | ||||||||||||
Short-term debt from related parties | 3,162 | 19,052 | ||||||||||||
Current portion of long-term debt and capital lease obligations | 313,607 | 511,370 | 763,398 | 664,335 | ||||||||||
Income tax payable | 79,687 | 170,360 | 130,009 | 72,819 | ||||||||||
Deferred taxes | 34,787 | 34,194 | ||||||||||||
| | | | | | | | | | | | | | | |
Total current liabilities | 3,477,291 | 3,553,973 | 5,037,297 | 4,149,446 | ||||||||||
Long-term debt and capital lease obligations, less current portion | 9,080,277 | 7,746,920 | 7,202,545 | 7,853,487 | ||||||||||
Other liabilities | 411,976 | 329,561 | 658,842 | 465,625 | ||||||||||
Pension liabilities | 642,318 | 435,858 | 540,267 | 585,328 | ||||||||||
Income tax payable | 177,601 | 176,933 | 124,576 | 162,500 | ||||||||||
Deferred taxes | 804,609 | 743,390 | 672,267 | 624,500 | ||||||||||
| | | | | | | | | | | | | | | |
Total liabilities | 14,594,072 | 12,986,635 | 14,235,794 | 13,840,886 | ||||||||||
Noncontrolling interests subject to put provisions | 824,658 | 648,251 | ||||||||||||
Noncontrolling interests subject to put provisions and other temporary equity | 1,241,088 | 1,028,368 | ||||||||||||
Shareholders' equity: | ||||||||||||||
Ordinary shares, no par value, €1.00 nominal value, 392,462,972 shares authorized, 311,104,251 issued and 303,555,300 outstanding | 385,215 | 382,411 | ||||||||||||
Ordinary shares, no par value, €1.00 nominal value, 385,913,972 shares authorized, 307,221,791 issued and 306,221,840 outstanding | 379,585 | 387,162 | ||||||||||||
Treasury stock, at cost | (505,014 | ) | (505,014 | ) | (66,895 | ) | (505,014 | ) | ||||||
Additional paid-in capital | 3,546,075 | 3,530,337 | 2,977,972 | 3,470,308 | ||||||||||
Retained earnings | 7,104,780 | 6,377,417 | 8,837,072 | 7,870,981 | ||||||||||
Accumulated other comprehensive (loss) income | (1,087,743 | ) | (550,587 | ) | (1,319,012 | ) | (1,336,295 | ) | ||||||
| | | | | | | | | | | | | | | |
Total FMC-AG & Co. KGaA shareholders' equity | 9,443,313 | 9,234,564 | 10,808,722 | 9,887,142 | ||||||||||
Noncontrolling interests not subject to put provisions | 585,058 | 250,456 | 648,338 | 608,858 | ||||||||||
Total equity | 10,028,371 | 9,485,020 | 11,457,060 | 10,496,000 | ||||||||||
| | | | | | | | | | | | | | | |
Total liabilities and equity | $ | 25,447,101 | $ | 23,119,906 | $ | 26,933,942 | $ | 25,365,254 | ||||||
| | | | | | | | | | | | | | | | |
| | | | | | | | | | | | | | | |
See accompanying notes to consolidated financial statements.
FRESENIUS MEDICAL CARE AG & Co. KGaA
Consolidated Statements of Cash Flows
For the years ended December 31,
(in thousands)
| | 2014 | 2013 | 2012 | 2016 | 2015 | 2014 | ||||||||||||||
|---|---|---|---|---|---|---|---|---|---|---|---|---|---|---|---|---|---|---|---|---|
Operating Activities: | ||||||||||||||||||||
Net income | $ | 1,259,808 | $ | 1,255,623 | $ | 1,326,977 | $ | 1,548,851 | $ | 1,313,149 | $ | 1,259,808 | ||||||||
Adjustments to reconcile net income to net cash provided by operating activities: | ||||||||||||||||||||
Depreciation and amortization | 699,328 | 648,225 | 602,896 | 775,945 | 717,322 | 699,328 | ||||||||||||||
Change in deferred taxes, net | 113,790 | 15,913 | 75,170 | (5,628 | ) | (45,452 | ) | 113,790 | ||||||||||||
(Gain) loss on sale of investments | (623 | ) | (9,426 | ) | (36,224 | ) | ||||||||||||||
(Gain) loss on sale of fixed assets | 3,277 | (23,558 | ) | 6,700 | ||||||||||||||||
Investment (gain) | — | — | (139,600 | ) | ||||||||||||||||
(Gain) loss on sale of fixed assets and investments | (2,317 | ) | (2,318 | ) | 2,654 | |||||||||||||||
Compensation expense related to stock options | 8,507 | 13,593 | 26,476 | 30,176 | 12,323 | 8,507 | ||||||||||||||
Cash inflow (outflow) from hedging | — | (4,073 | ) | (13,947 | ) | |||||||||||||||
Investments in equity method investees, net | 23,123 | 2,335 | 22,512 | (58,608 | ) | (17,776 | ) | 23,123 | ||||||||||||
Changes in assets and liabilities, net of amounts from businesses acquired: | ||||||||||||||||||||
Trade accounts receivable, net | (157,411 | ) | (41,280 | ) | (43,344 | ) | (242,289 | ) | (330,960 | ) | (157,411 | ) | ||||||||
Inventories | (85,758 | ) | (54,918 | ) | (48,279 | ) | (66,668 | ) | (301,009 | ) | (85,758 | ) | ||||||||
Prepaid expenses, other current and non-current assets | (24,179 | ) | 67,875 | 88,413 | 53,751 | 47,997 | (24,179 | ) | ||||||||||||
Accounts receivable from related parties | (118,800 | ) | (10,968 | ) | (25,859 | ) | (79,445 | ) | (300 | ) | (118,800 | ) | ||||||||
Accounts payable to related parties | 113,822 | (3,743 | ) | 10,064 | 133,653 | 27,208 | 113,822 | |||||||||||||
Accounts payable, accrued expenses and other current and non-current liabilities | 121,424 | 215,264 | 225,586 | 45,729 | 548,955 | 121,424 | ||||||||||||||
Income tax payable | (94,916 | ) | (36,057 | ) | (38,478 | ) | 6,732 | (9,092 | ) | (94,916 | ) | |||||||||
| | | | | | | | | | | | | | | | | | | | | |
Net cash provided by (used in) operating activities | 1,861,392 | 2,034,805 | 2,039,063 | 2,139,882 | 1,960,047 | 1,861,392 | ||||||||||||||
| | | | | | | | | | | | | | | | | | | | | |
Investing Activities: | ||||||||||||||||||||
Purchases of property, plant and equipment | (931,627 | ) | (747,938 | ) | (675,310 | ) | (1,029,992 | ) | (952,943 | ) | (931,627 | ) | ||||||||
Proceeds from sale of property, plant and equipment | 11,673 | 19,847 | 9,667 | 17,662 | 17,408 | 11,673 | ||||||||||||||
Acquisitions and investments, net of cash acquired, and purchases of intangible assets | (1,779,058 | ) | (495,725 | ) | (1,878,908 | ) | (577,581 | ) | (316,810 | ) | (1,779,058 | ) | ||||||||
Proceeds from divestitures | 8,257 | 18,276 | 263,306 | 210,584 | 251,660 | 8,257 | ||||||||||||||
| | | | | | | | | | | | | | | | | | | | | |
Net cash provided by (used in) investing activities | (2,690,755 | ) | (1,205,540 | ) | (2,281,245 | ) | (1,379,327 | ) | (1,000,685 | ) | (2,690,755 | ) | ||||||||
| | | | | | | | | | | | | | | | | | | | | |
Financing Activities: | ||||||||||||||||||||
Proceeds from short-term borrowings | 197,481 | 381,603 | 174,391 | |||||||||||||||||
Repayments of short-term borrowings | (171,889 | ) | (397,682 | ) | (163,059 | ) | ||||||||||||||
Proceeds from short-term borrowings from related parties | 303,695 | 18,593 | 39,829 | |||||||||||||||||
Repayments of short-term borrowings from related parties | (358,638 | ) | (18,228 | ) | (64,112 | ) | ||||||||||||||
Proceeds from long-term debt and capital lease obligations (net of debt issuance costs and other hedging costs of $58,967 in 2014 and $178,593 in 2012) | 2,910,611 | 441,278 | 4,750,730 | |||||||||||||||||
Proceeds from short-term debt | 891,266 | 287,526 | 197,481 | |||||||||||||||||
Repayments of short-term debt | (379,119 | ) | (313,872 | ) | (171,889 | ) | ||||||||||||||
Proceeds from short-term debt from related parties | 137,588 | 58,804 | 303,695 | |||||||||||||||||
Repayments of short-term debt from related parties | (153,638 | ) | (44,270 | ) | (358,638 | ) | ||||||||||||||
Proceeds from long-term debt and capital lease obligations (net of debt issuance costs of $58,967 in 2014) | 2,292 | 6,035 | 2,910,611 | |||||||||||||||||
Repayments of long-term debt and capital lease obligations | (1,647,978 | ) | (617,499 | ) | (3,589,013 | ) | (732,874 | ) | (324,855 | ) | (1,647,978 | ) | ||||||||
Increase (decrease) of accounts receivable securitization program | (9,500 | ) | 189,250 | (372,500 | ) | 124,000 | (290,750 | ) | (9,500 | ) | ||||||||||
Proceeds from exercise of stock options | 107,047 | 111,300 | 121,126 | |||||||||||||||||
Proceeds from conversion of preference shares into ordinary shares | — | 34,784 | — | |||||||||||||||||
Purchase of treasury stock | — | (505,014 | ) | — | ||||||||||||||||
Proceeds from exercise of stock options, net | 49,065 | 94,166 | 107,047 | |||||||||||||||||
Dividends paid | (317,903 | ) | (296,134 | ) | (271,733 | ) | (277,176 | ) | (263,244 | ) | (317,903 | ) | ||||||||
Distributions to noncontrolling interests | (250,271 | ) | (216,758 | ) | (195,023 | ) | (325,762 | ) | (284,474 | ) | (250,271 | ) | ||||||||
Contributions from noncontrolling interests | 42,356 | 66,467 | 37,704 | 79,597 | 67,395 | 42,356 | ||||||||||||||
| | | | | | | | | | | | | | | | | | | | | |
Net cash provided by (used in) financing activities | 805,011 | (808,040 | ) | 468,340 | (584,761 | ) | (1,007,539 | ) | 805,011 | |||||||||||
| | | | | | | | | | | | | | | | | | | | | |
Effect of exchange rate changes on cash and cash equivalents | (24,570 | ) | (26,488 | ) | 4,590 | 21,939 | (36,178 | ) | (24,570 | ) | ||||||||||
| | | | | | | | | | | | | | | | | | | | | |
Cash and Cash Equivalents: | ||||||||||||||||||||
Net increase (decrease) in cash and cash equivalents | (48,922 | ) | (5,263 | ) | 230,748 | 197,733 | (84,355 | ) | (48,922 | ) | ||||||||||
Cash and cash equivalents at beginning of period | 682,777 | 688,040 | 457,292 | 549,500 | 633,855 | 682,777 | ||||||||||||||
| | | | | | | | | | | | | | | | | | | | | |
Cash and cash equivalents at end of period | $ | 633,855 | $ | 682,777 | $ | 688,040 | $ | 747,233 | $ | 549,500 | $ | 633,855 | ||||||||
| | | | | | | | | | | | | | | | | | | | | | |
| | | | | | | | | | | | | | | | | | | | | |
See accompanying notes to consolidated financial statements.
FRESENIUS MEDICAL CARE AG & Co. KGaA
Consolidated Statement of Shareholders'Shareholders´ Equity
For the years ended December 31, 2014, 20132016, 2015 and 20122014,
(in thousands, except share data)
| | Preference Shares | Ordinary Shares | Treasury Stock | | | | Total FMC-AG & Co. KGaA shareholders' equity | | | Ordinary Shares | Treasury Stock | | | | Total FMC-AG & Co. KGaA shareholders' equity | | | |||||||||||||||||||||||||||||||||||||||||||||||||||
|---|---|---|---|---|---|---|---|---|---|---|---|---|---|---|---|---|---|---|---|---|---|---|---|---|---|---|---|---|---|---|---|---|---|---|---|---|---|---|---|---|---|---|---|---|---|---|---|---|---|---|---|---|---|---|---|---|---|---|---|---|---|---|---|---|---|---|---|---|
| | | | Accumulated Other comprehensive income (loss) | Noncontrolling interests not subject to put provisions | | | | Accumulated Other comprehensive income (loss) | Noncontrolling interests not subject to put provisions | | ||||||||||||||||||||||||||||||||||||||||||||||||||||||||||
| | Number of shares | No par value | Number of shares | No par value | Number of shares | Amount | Additional paid in capital | Retained earnings | Total FMC-AG & Co. KGaA shareholders' equity | Number of shares | No par value | Number of shares | Amount | Additional paid in capital | Retained earnings | Total FMC-AG & Co. KGaA shareholders' equity | ||||||||||||||||||||||||||||||||||||||||||||||||||||
Balance at December 31, 2011 | 3,965,691 | $ | 4,452 | 300,164,922 | $ | 371,649 | — | $ | — | $ | 3,362,633 | $ | 4,648,585 | $ | (485,767 | ) | $ | 7,901,552 | $ | 159,465 | ||||||||||||||||||||||||||||||||||||||||||||||||
Balance at December 31, 2013 | 308,995,730 | $ | 382,411 | (7,548,951 | ) | $ | (505,014 | ) | $ | 3,530,337 | $ | 6,377,417 | $ | (550,587 | ) | $ | 9,234,564 | $ | 250,456 | |||||||||||||||||||||||||||||||||||||||||||||||||
Proceeds from exercise of options and related tax effects | 7,642 | 10 | 2,574,836 | 3,266 | — | — | 110,510 | — | — | 113,786 | — | 113,786 | 2,108,521 | 2,804 | — | — | 99,182 | — | — | 101,986 | — | 101,986 | ||||||||||||||||||||||||||||||||||||||||||||||
Compensation expense related to stock options | — | — | — | — | — | — | 26,476 | — | — | 26,476 | — | 26,476 | — | — | — | — | 8,507 | — | — | 8,507 | — | 8,507 | ||||||||||||||||||||||||||||||||||||||||||||||
Dividends paid | — | — | — | — | — | — | — | (271,733 | ) | — | (271,733 | ) | — | (271,733 | ) | — | — | — | — | — | (317,903 | ) | — | (317,903 | ) | — | (317,903 | ) | ||||||||||||||||||||||||||||||||||||||||
Purchase/ sale of noncontrolling interests | — | — | — | — | — | — | (26,918 | ) | — | — | (26,918 | ) | 86,705 | 59,787 | — | — | — | — | (2,184 | ) | — | — | (2,184 | ) | 322,570 | 320,386 | ||||||||||||||||||||||||||||||||||||||||||
Contributions from/ to noncontrolling interests | — | — | — | — | — | — | — | — | — | — | (26,428 | ) | (26,428 | ) | — | — | — | — | — | — | — | — | (71,054 | ) | (71,054 | ) | ||||||||||||||||||||||||||||||||||||||||||
Changes in fair value of noncontrolling interests subject to put provisions | — | — | — | — | — | — | 18,880 | — | — | 18,880 | — | 18,880 | ||||||||||||||||||||||||||||||||||||||||||||||||||||||||
Net income | — | — | — | — | — | — | — | 1,186,809 | — | 1,186,809 | 45,450 | 1,232,259 | ||||||||||||||||||||||||||||||||||||||||||||||||||||||||
Other comprehensive income (loss) | — | — | — | — | — | — | — | — | (6,346 | ) | (6,346 | ) | (438 | ) | (6,784 | ) | ||||||||||||||||||||||||||||||||||||||||||||||||||||
| | | | | | | | | | | | | | | | | | | | | | | | | | | | | | ||||||||||||||||||||||||||||||||||||||||
Comprehensive income | — | — | — | — | — | — | — | — | — | 1,180,463 | 45,012 | 1,225,475 | ||||||||||||||||||||||||||||||||||||||||||||||||||||||||
| | | | | | | | | | | | | | | | | | | | | | | | | | | | | | | | | | | | | | ||||||||||||||||||||||||||||||||
Balance at December 31, 2012 | 3,973,333 | $ | 4,462 | 302,739,758 | $ | 374,915 | — | $ | — | $ | 3,491,581 | $ | 5,563,661 | $ | (492,113 | ) | $ | 8,942,506 | $ | 264,754 | $ | 9,207,260 | ||||||||||||||||||||||||||||||||||||||||||||||
| | | | | | | | | | | | | | | | | | | | | | | | | | | | | | | | | | | | | | ||||||||||||||||||||||||||||||||
| | | | | | | | | | | | | | | | | | | | | | | | | | ||||||||||||||||||||||||||||||||||||||||||||
| | | | | | | | | | | | | | | | | | | | | | | | | | | | | | | | | | | | | | ||||||||||||||||||||||||||||||||
Proceeds from exercise of options and related tax effects | 2,200 | 3 | 2,280,439 | 3,031 | — | — | 102,520 | — | — | 105,554 | — | 105,554 | ||||||||||||||||||||||||||||||||||||||||||||||||||||||||
Proceeds from conversion of preference shares into ordinary shares | (3,975,533 | ) | (4,465 | ) | 3,975,533 | 4,465 | — | — | 34,784 | — | — | 34,784 | — | 34,784 | ||||||||||||||||||||||||||||||||||||||||||||||||||||||
Compensation expense related to stock options | — | — | — | — | — | — | 13,593 | — | — | 13,593 | — | 13,593 | ||||||||||||||||||||||||||||||||||||||||||||||||||||||||
Purchase of treasury stock | — | — | — | — | (7,548,951 | ) | (505,014 | ) | — | — | — | (505,014 | ) | — | (505,014 | ) | ||||||||||||||||||||||||||||||||||||||||||||||||||||
Dividends paid | — | — | — | — | — | — | — | (296,134 | ) | — | (296,134 | ) | — | (296,134 | ) | |||||||||||||||||||||||||||||||||||||||||||||||||||||
Purchase/ sale of noncontrolling interests | — | — | — | — | — | — | (3,566 | ) | — | — | (3,566 | ) | (11,607 | ) | (15,173 | ) | ||||||||||||||||||||||||||||||||||||||||||||||||||||
Contributions from/ to noncontrolling interests | — | — | — | — | — | — | — | — | — | — | (32,275 | ) | (32,275 | ) | ||||||||||||||||||||||||||||||||||||||||||||||||||||||
Changes in fair value of noncontrolling interests subject to put provisions | — | — | — | — | — | — | (108,575 | ) | — | — | (108,575 | ) | — | (108,575 | ) | |||||||||||||||||||||||||||||||||||||||||||||||||||||
Net income | — | — | — | — | — | — | — | 1,109,890 | — | 1,109,890 | 32,577 | 1,142,467 | ||||||||||||||||||||||||||||||||||||||||||||||||||||||||
Other comprehensive income (loss) | — | — | — | — | — | — | — | — | (58,474 | ) | (58,474 | ) | (2,993 | ) | (61,467 | ) | ||||||||||||||||||||||||||||||||||||||||||||||||||||
| | | | | | | | | | | | | | | | | | | | | | | | | | | | | | ||||||||||||||||||||||||||||||||||||||||
Comprehensive income | — | — | — | — | — | — | — | — | — | 1,051,416 | 29,584 | 1,081,000 | ||||||||||||||||||||||||||||||||||||||||||||||||||||||||
| | | | | | | | | | | | | | | | | | | | | | | | | | | | | | | | | | | | | | ||||||||||||||||||||||||||||||||
Balance at December 31, 2013 | — | $ | — | 308,995,730 | $ | 382,411 | (7,548,951 | ) | $ | (505,014 | ) | $ | 3,530,337 | $ | 6,377,417 | $ | (550,587 | ) | $ | 9,234,564 | $ | 250,456 | $ | 9,485,020 | ||||||||||||||||||||||||||||||||||||||||||||
| | | | | | | | | | | | | | | ��� | | | | | | | | | | | | | | | | | | | | | | | ||||||||||||||||||||||||||||||||
| | | | | | | | | | | | | | | | | | | | | | | | | | ||||||||||||||||||||||||||||||||||||||||||||
| | | | | | | | | | | | | | | | | | | | | | | | | | | | | | | | | | | | | | ||||||||||||||||||||||||||||||||
Proceeds from exercise of options and related tax effects | — | — | 2,108,521 | 2,804 | — | — | 99,182 | — | — | 101,986 | — | 101,986 | ||||||||||||||||||||||||||||||||||||||||||||||||||||||||
Compensation expense related to stock options | — | — | — | — | — | — | 8,507 | — | — | 8,507 | — | 8,507 | ||||||||||||||||||||||||||||||||||||||||||||||||||||||||
Dividends paid | — | — | — | — | — | — | — | (317,903 | ) | — | (317,903 | ) | — | (317,903 | ) | |||||||||||||||||||||||||||||||||||||||||||||||||||||
Purchase/ sale of noncontrolling interests | — | — | — | — | — | — | (2,184 | ) | — | — | (2,184 | ) | 327,220 | 325,036 | ||||||||||||||||||||||||||||||||||||||||||||||||||||||
Contributions from/ to noncontrolling interests | — | — | — | — | — | — | — | — | — | — | (71,054 | ) | (71,054 | ) | ||||||||||||||||||||||||||||||||||||||||||||||||||||||
Expiration of put provisions and other reclassifications | — | — | — | — | — | — | — | — | 4,650 | 4,650 | ||||||||||||||||||||||||||||||||||||||||||||||||||||||||||
Changes in fair value of noncontrolling interests subject to put provisions | — | — | — | — | — | — | (89,767 | ) | — | — | (89,767 | ) | — | (89,767 | ) | (89,767 | ) | — | — | (89,767 | ) | — | (89,767 | ) | ||||||||||||||||||||||||||||||||||||||||||||
Net income | — | — | — | — | — | — | — | 1,045,266 | — | 1,045,266 | 80,949 | 1,126,215 | — | — | — | — | — | 1,045,266 | — | 1,045,266 | 80,949 | 1,126,215 | ||||||||||||||||||||||||||||||||||||||||||||||
Other comprehensive income (loss) | — | — | — | — | — | — | — | — | (537,156 | ) | (537,156 | ) | (2,513 | ) | (539,669 | ) | — | — | — | — | — | — | (537,156 | ) | (537,156 | ) | (2,513 | ) | (539,669 | ) | ||||||||||||||||||||||||||||||||||||||
| | | | | | | | | | | | | | | | | | | | | | | | | | | | | | | | | | | | | | | | | | | | | | | | | | | | | | | |||||||||||||||
Comprehensive income | — | — | — | — | — | — | — | — | — | 508,110 | 78,436 | 586,546 | — | — | — | — | — | — | — | 508,110 | 78,436 | 586,546 | ||||||||||||||||||||||||||||||||||||||||||||||
| | | | | | | | | | | | | | | | | | | | | | | | | | | | | | | | | | | | | | | | | | | | | | | | | | | | | | | | | | | | | | | | | | | | | |
Balance at December 31, 2014 | — | $ | — | 311,104,251 | $ | 385,215 | (7,548,951 | ) | $ | (505,014 | ) | $ | 3,546,075 | $ | 7,104,780 | $ | (1,087,743 | ) | $ | 9,443,313 | $ | 585,058 | $ | 10,028,371 | 311,104,251 | $ | 385,215 | (7,548,951 | ) | $ | (505,014 | ) | $ | 3,546,075 | $ | 7,104,780 | $ | (1,087,743 | ) | $ | 9,443,313 | $ | 585,058 | $ | 10,028,371 | |||||||||||||||||||||||
| | | | | | | | | | | | | | | | | | | | | | | | | | | | | | | | | | | | | | | | | | | | | | | | | | | | | | | | | | | | | | | | | | | | | | |
| | | | | | | | | | | | | | | | | | | | | | | | | | | | | | | | | | | | | | | | | | | | | | | | | | | | | | | | | | | | | | | | | | | | | |
Proceeds from exercise of options and related tax effects | 1,758,820 | 1,947 | — | — | 87,065 | — | — | 89,012 | — | 89,012 | ||||||||||||||||||||||||||||||||||||||||||||||||||||||||||
Compensation expense related to stock options | — | — | — | — | 12,323 | — | — | 12,323 | — | 12,323 | ||||||||||||||||||||||||||||||||||||||||||||||||||||||||||
Vested subsidiary stock incentive plans | — | — | — | — | (4,613 | ) | — | — | (4,613 | ) | — | (4,613 | ) | |||||||||||||||||||||||||||||||||||||||||||||||||||||||
Dividends paid | — | — | — | — | — | (263,244 | ) | — | (263,244 | ) | — | (263,244 | ) | |||||||||||||||||||||||||||||||||||||||||||||||||||||||
Purchase/ sale of noncontrolling interests | — | — | — | — | 7,461 | — | — | 7,461 | 7,169 | 14,630 | ||||||||||||||||||||||||||||||||||||||||||||||||||||||||||
Contributions from/ to noncontrolling interests | — | — | — | — | — | — | — | — | (100,852 | ) | (100,852 | ) | ||||||||||||||||||||||||||||||||||||||||||||||||||||||||
Expiration of put provisions and other reclassifications | — | — | — | — | — | — | — | — | (5,206 | ) | (5,206 | ) | ||||||||||||||||||||||||||||||||||||||||||||||||||||||||
Changes in fair value of noncontrolling interests subject to put provisions | — | — | — | — | (178,003 | ) | — | — | (178,003 | ) | — | (178,003 | ) | |||||||||||||||||||||||||||||||||||||||||||||||||||||||
Net income | — | — | — | — | — | 1,029,445 | — | 1,029,445 | 124,577 | 1,154,022 | ||||||||||||||||||||||||||||||||||||||||||||||||||||||||||
Other comprehensive income (loss) | — | — | — | — | — | — | (248,552 | ) | (248,552 | ) | (1,888 | ) | (250,440 | ) | ||||||||||||||||||||||||||||||||||||||||||||||||||||||
| | | | | | | | | | | | | | | | | | | | | | | | | | ||||||||||||||||||||||||||||||||||||||||||||
Comprehensive income | — | — | — | — | — | — | — | 780,893 | 122,689 | 903,582 | ||||||||||||||||||||||||||||||||||||||||||||||||||||||||||
| | | | | | | | | | | | | | | | | | | | | | | | | | | | | | | | | |||||||||||||||||||||||||||||||||||||
Balance at December 31, 2015 | 312,863,071 | $ | 387,162 | (7,548,951 | ) | $ | (505,014 | ) | $ | 3,470,308 | $ | 7,870,981 | $ | (1,336,295 | ) | $ | 9,887,142 | $ | 608,858 | $ | 10,496,000 | |||||||||||||||||||||||||||||||||||||||||||||||
| | | | | | | | | | | | | | | | | | | | | | | | | | | | | | | | | |||||||||||||||||||||||||||||||||||||
| | | | | | | | | | | | | | | | | | | | | | | |||||||||||||||||||||||||||||||||||||||||||||||
| | | | | | | | | | | | | | | | | | | | | | | | | | | | | | | | | |||||||||||||||||||||||||||||||||||||
Proceeds from exercise of options and related tax effects | 907,720 | 1,014 | — | — | 49,307 | — | — | 50,321 | — | 50,321 | ||||||||||||||||||||||||||||||||||||||||||||||||||||||||||
Compensation expense related to stock options | — | — | — | — | 30,176 | — | — | 30,176 | — | 30,176 | ||||||||||||||||||||||||||||||||||||||||||||||||||||||||||
Vested subsidiary stock incentive plans | — | — | — | — | (2,967 | ) | — | — | (2,967 | ) | — | (2,967 | ) | |||||||||||||||||||||||||||||||||||||||||||||||||||||||
Withdrawal of treasury stock | (6,549,000 | ) | (8,591 | ) | 6,549,000 | 438,119 | (429,528 | ) | — | — | — | — | — | |||||||||||||||||||||||||||||||||||||||||||||||||||||||
Dividends paid | — | — | — | — | — | (277,176 | ) | — | (277,176 | ) | — | (277,176 | ) | |||||||||||||||||||||||||||||||||||||||||||||||||||||||
Purchase/ sale of noncontrolling interests | — | — | — | — | (1,212 | ) | — | — | (1,212 | ) | 13,105 | 11,893 | ||||||||||||||||||||||||||||||||||||||||||||||||||||||||
Contributions from/ to noncontrolling interests | — | — | — | — | — | — | — | — | (107,354 | ) | (107,354 | ) | ||||||||||||||||||||||||||||||||||||||||||||||||||||||||
Expiration of put provisions and other reclassifications | — | — | — | — | — | — | — | — | 9,756 | 9,756 | ||||||||||||||||||||||||||||||||||||||||||||||||||||||||||
Changes in fair value of noncontrolling interests subject to put provisions | — | — | — | — | (138,112 | ) | — | — | (138,112 | ) | — | (138,112 | ) | |||||||||||||||||||||||||||||||||||||||||||||||||||||||
Net income | — | — | — | — | — | 1,243,267 | — | 1,243,267 | 123,482 | 1,366,749 | ||||||||||||||||||||||||||||||||||||||||||||||||||||||||||
Other comprehensive income (loss) | — | — | — | — | — | — | 17,283 | 17,283 | 491 | 17,774 | ||||||||||||||||||||||||||||||||||||||||||||||||||||||||||
| | | | | | | | | | | | | | | | | | | | | | | | | | ||||||||||||||||||||||||||||||||||||||||||||
Comprehensive income | — | — | — | — | — | — | — | 1,260,550 | 123,973 | 1,384,523 | ||||||||||||||||||||||||||||||||||||||||||||||||||||||||||
| | | | | | | | | | | | | | | | | | | | | | | | | | | | | | | | | |||||||||||||||||||||||||||||||||||||
Balance at December 31, 2016 | 307,221,791 | $ | 379,585 | (999,951 | ) | $ | (66,895 | ) | $ | 2,977,972 | $ | 8,837,072 | $ | (1,319,012 | ) | $ | 10,808,722 | $ | 648,338 | $ | 11,457,060 | |||||||||||||||||||||||||||||||||||||||||||||||
| | | | | | | | | | | | | | | | | | | | | | | | | | | | | | | | | |||||||||||||||||||||||||||||||||||||
| | | | | | | | | | | | | | | | | | | | | | | |||||||||||||||||||||||||||||||||||||||||||||||
| | | | | | | | | | | | | | | | | | | | | | | | | | | | | | | | | |||||||||||||||||||||||||||||||||||||
See accompanying notes to consolidated financial statements.
FRESENIUS MEDICAL CARE AG & Co. KGaA
NOTES TO CONSOLIDATED FINANCIAL STATEMENTS
(in thousands, except share and per share data)
1. The Company and Basis of Presentation
Fresenius Medical Care AG & Co. KGaA ("FMC-AG & Co. KGaA" or the "Company"), a German partnership limited by shares (Kommanditgesellschaft auf Aktien), is the world's largest kidney dialysis company.company, based on publicly reported sales and number of patients treated. The Company provides dialysis treatment and related dialysis care services related to the dialysis treatment a patient receives withpersons who suffer from end-stage renal disease ("ESRD"), as well as other health care services. We describe our other health care services as "Care Coordination." Care Coordination services include pharmacy services, vascular, cardiovascular and endovascular specialty services, non-dialysis laboratory testing services, physician services, hospitalist and intensivist services, health plan services and urgent care services, which, together with dialysis care services represent the Company's health care services. In addition, theThe Company also provides dialysis products for the treatment of ESRD, which includes manufacturingincluding products manufactured and distributing productsdistributed by the Company such as hemodialysis machines, peritoneal cyclers, dialyzers, peritoneal solutions, hemodialysis concentrates, solutions and granulates, bloodlines, renal pharmaceuticals and systems for water treatment. The Company supplies dialysis clinics it owns, operates or manages with a broad range of products in addition to sales ofand also sells dialysis products to other dialysis service providers. The Company describes its other health care services as "Care Coordination." Care Coordination currently includes the coordinated delivery of pharmacy services, vascular, cardiovascular and endovascular specialty services, non-dialysis laboratory testing services, physician services, hospitalist and intensivist services, health plan services, ambulatory surgery center services and urgent care services, which, together with dialysis care services represent the Company's health care services.
In these Notes, "FMC-AG & Co. KGaA," or the "Company," "we," "us" or "our" refers to the Company or the Company and its subsidiaries on a consolidated basis, as the context requires. "Fresenius SE" and "Fresenius SE & Co. KGaA" refer to Fresenius SE & Co. KGaA, a German partnership limited by shares resulting from the change of legal form of Fresenius SE (effective as of January 2011), a European Company (Societas Europaea) previously called Fresenius AG, a German stock corporation. "Management AG" and the "General Partner" refer to Fresenius Medical Care Management AG which is FMC-AG & Co. KGaA's general partner and is wholly owned by Fresenius SE. "Management Board" refers to the members of the management board of Management AG and, except as otherwise specified, "Supervisory Board" refers to the supervisory board of FMC-AG & Co. KGaA. "Ordinary shares" refers to the ordinary shares prior to the conversion in 2013 of the Company's preference shares into ordinary shares. Following the conversion, the Company refers to their ordinary shares as "shares," see Note 12 "Shareholders' Equity." The term "North America Segment" refers to the North America operating segment. Thesegment; the term "International"EMEA Segment" refers to the combined Europe, Middle East and Africa and Latin America ("EMEALA")operating segment, the term "Asia-Pacific Segment" refers to the Asia-Pacific operating segment, and the Asia-Pacificterm "Latin America Segment" refers to the Latin America operating segment. For further discussion of ourthe Company's operating segments, see Note 2422 "Segment and Corporate Information".Information."
The accompanying consolidated financial statements have been prepared in accordance with the United States' generally accepted accounting principles ("U.S. GAAP").
The preparation of consolidated financial statements in conformity with U.S. GAAP requires management to make estimates and assumptions that affect the reported amounts of assets and liabilities and disclosure of contingent assets and liabilities at the date of the consolidated financial statements and the reported amounts of revenues and expenses during the reporting period. Actual results could differ from those estimates. Such financial statements reflect all adjustments that, in the opinion of management, are necessary for a fair presentation of the results of the periods presented. All such adjustments are of a normal recurring nature.
Certain items, in the net aggregate amount of $37,970 and $13,670 for 2013 and 2012, respectively, relating to research and development, compensation expense and income from equity method investees have been reclassified in the prior years' comparative consolidated financial statements between the North America Segment, the International Segment and Corporate, as applicable, to conform to the current year's presentation.
Summary of Significant Accounting Policies
a) Principles of Consolidation
The consolidated financial statements include the earnings of all companies in which the Company has legal or effective control. This includes variable interest entities ("VIEs") for which the Company is deemed the primary beneficiary. The Company also consolidates certain clinics that it manages and financially controls. Noncontrolling interests represent the proportionate equity interests in the Company's consolidated entities that are not wholly owned by the Company. Noncontrolling interests of acquired
FRESENIUS MEDICAL CARE AG & Co. KGaA
NOTES TO CONSOLIDATED FINANCIAL STATEMENTS — (Continued)
(in thousands, except share and per share data)
entities are valued at fair value. The equity method of accounting is used for investments in associated companies over which the Company has significant exercisable influence, even when the Company holds 50% or less of the common stock of the entity. All significant intercompany transactions and balances have been eliminated.
FRESENIUS MEDICAL CARE AG & Co. KGaA
NOTES TO CONSOLIDATED FINANCIAL STATEMENTS — (Continued)(in thousands, except share data)
The Company has entered into various arrangements with certain legal entities whereby the entities' investors own disproportionate equity ownership interests in relationholders lack the power to direct the risksactivities that most significantly impact the entities' performance, and rewards they retain for these arrangements or the entities are unableobligation to provide their own funding for their operations.absorb expected losses and receive expected residual returns of the legal entities. In these arrangements, the entities are VIEs in which the Company has been determined to be the primary beneficiary and which therefore have been fully consolidated. During 2014,2016, as a result of the changes arising from the Financial Accounting Standards Board's ("FASB") Accounting Standards Update 2015-02 ("ASU 2015-02"), the Company has consolidated 113 new VIEsreassessed all of its arrangements with joint ventures and other partners. With the adoption of ASU 2015-02, the Company has presented the VIE data below on a retrospective basis which is applied using the VIE entities in place as of December 31, 2016 for 2015 and 2014 utilizing a pro forma presentation to ensure comparability. For further information on the Company's adoption of ASU 2015-02, see 1t) below. In the North America Segment, 111 formerly consolidated VIEs do not follow the variable interest entity guidance any longer, but are consolidated through contractual management agreements. In 2016, 26 VIEs are now consolidated because of newly entered arrangements as a result of acquisitions. In the International Segment, the Company has consolidated five new VIEswell as a result of acquisitions while three entities haveone entity ceased to be VIEs due to either an increase ina VIE because the Company's shareholdings to 100% or a sale of a previously consolidated entity.arrangement was dissolved. In the EMEA Segment, one VIE was liquidated. The Company has provided some or all of the following services to the VIEs: management, financing or product supply. AllConsolidated VIEs generated approximately $533,652, $203,333$251,594, $246,983 and $205,858$320,254 in revenue in 2016, 2015, and 2014, 2013,respectively. At December 31, 2016 and 2012, respectively. The2015 the Company provided funding to VIEs through loans and accounts receivable of $298,875$188,299 and $150,300 in 2014 and 2013,$196,199, respectively. The table below shows the carrying amounts of the assets and liabilities of VIEs at December 31, 20142016 and 2013:2015:
| | 2014 | 2013 | 2016 | 2015 | ||||||||||
|---|---|---|---|---|---|---|---|---|---|---|---|---|---|---|
Trade accounts receivable, net | $ | 195,369 | $ | 102,549 | $ | 80,080 | $ | 97,326 | ||||||
Other current assets | 232,487 | 59,695 | 85,948 | 80,596 | ||||||||||
Property, plant and equipment, intangible assets & other non-current assets | 59,351 | 26,274 | 57,306 | 60,155 | ||||||||||
Goodwill | 37,934 | 32,759 | 31,931 | 31,995 | ||||||||||
Accounts payable, accrued expenses and other liabilities | 485,006 | 133,977 | 191,223 | 204,126 | ||||||||||
Non-current loans from related parties | 28,985 | 12,998 | 54,301 | 41,151 | ||||||||||
Equity | 11,150 | 74,302 | 9,741 | 24,795 | ||||||||||
b) Cash and Cash Equivalents
Cash and cash equivalents comprise cash funds and all short-term, liquid investments with original maturities of up to three months.
c) Inventories
Inventories are stated at the lower of cost (determined by using the average or first-in, first-out method) or marketnet realizable value (see Note 4)3). Costs included in inventories are based on invoiced costs and/or production costs or the marked to market valuation, as applicable. Included in production costs are material, direct labor and production overhead, including depreciation charges.
d) Property, Plant and Equipment
Property, plant, and equipment are stated at cost less accumulated depreciation (see Note 6)5). Significant improvements are capitalized; repairs and maintenance costs that do not extend the useful lives of the assets are charged to expense as incurred. Property and equipment under capital leases are stated at the present value of future minimum lease payments at the inception of the lease, less accumulated depreciation. Depreciation on property, plant and equipment is calculated using the straight-line method over the estimated useful lives of the assets ranging from 34 to 4050 years for buildings and improvements with a weighted average life of 13 years and 3 to 1819 years for machinery and equipment with a weighted average
FRESENIUS MEDICAL CARE AG & Co. KGaA
NOTES TO CONSOLIDATED FINANCIAL STATEMENTS — (Continued)
(in thousands, except share and per share data)
life of 10 years. Equipment held under capital leases and leasehold improvements are amortized using the straight-line method over the shorter of the lease term or the estimated useful life of the asset. Internal use platform software that is integral to the computer equipment it supports is included in property, plant and equipment. The Company capitalizes interest on borrowed funds during construction periods. Interest capitalized during 2016, 2015, and 2014 2013,was $4,954, $6,082 and 2012 was $4,571, $7,358 and $3,952,$4,285, respectively.
e) Intangible Assets and Goodwill
Intangible assets such as non-compete agreements, technology, distribution rights, patents, licenses to treat, licenses to manufacture, distribute and sell pharmaceutical drugs, exclusive contracts and exclusive licenses, trade names, management contracts, application software, acute care agreements, customer relationships and lease agreements are recognized and reported apart from goodwill (see Note 7)6).
FRESENIUS MEDICAL CARE AG & Co. KGaA
NOTES TO CONSOLIDATED FINANCIAL STATEMENTS — (Continued)(in thousands, except share data)goodwill.
Goodwill and identifiable intangibles with indefinite useful lives are not amortized but tested for impairment annually or when an event becomes known that could trigger an impairment. The Company identified trade names and certain qualified management contracts as intangible assets with indefinite useful lives because, based on an analysis of all of the relevant factors, there is no foreseeable limit to the period over which those assets are expected to generate net cash inflows for the Company. Intangible assets with finite useful lives are amortized over their respective useful lives to their residual values. The Company amortizes non-compete agreements over their useful life which on average is 86 years. Technology is amortized over its useful life of 15 years. Licenses to manufacture, distribute and sell pharmaceutical drugs, exclusive contracts and exclusive licenses are amortized over their useful life which on average is 10 years. Customer relationships are amortized over their useful life of 1210 years. All other intangible assets are amortized over their weighted average useful lives of 67 years. The weighted average useful life of all amortizable intangible assets is 98 years. Intangible assets with finite useful lives are evaluated for impairment when events have occurred that may give rise to an impairment.
To perform the annual impairment test of goodwill, the Company identified its reporting units and determined their carrying value by assigning the assets and liabilities, including the existing goodwill and intangible assets, to those reporting units. OneThe reporting unit was identified inunits are the North America Segment. The EMEALA operating segment is divided into two reporting units (EuropeSegment, EMEA Segment, Asia-Pacific Segment and the Latin America), while only one reporting unit exists in the operating segment Asia-Pacific.America Segment. For the purpose of goodwill impairment testing, all corporate assets and liabilities are allocated to the reporting units.
In a first step, the Company compares the fair value of a reporting unit to its carrying amount. Fair value is determined using estimated future cash flows for the unit discounted by an after-tax weighted average cost of capital ("WACC") specific to that reporting unit. Estimating the future cash flows involves significant assumptions, especially regarding future reimbursement rates and sales prices, number of treatments, sales volumes and costs. In determining discounted cash flows, the Company utilizes for every reporting unit, its three-year budget, projections for years 4 to 10 and a representative growth rate for all remaining years. Projections for up to ten years are possible due to the stability of the Company's business which, results from the non-discretionary nature of the health care services we provide,the Company provides, the need for products utilized to provide such services and the availability of government reimbursement for a substantial portion of our services. The reporting units' average revenue growth for the ten year planning period is within a mid single-digit range for the North America Segment, EMEA Segment and the Latin America Segment, whereas for the Asia-Pacific Segment the average revenue growth is in the high single-digits. A substantial portion of the Company's profit is generated in the North America Segment. The Company expects a stable operating income margin with a higher margin in dialysis business compensating a lower margin in Care Coordination. The reporting units' respective expected growth rates for the period beyond ten years are: North America Segment 1%, EuropeEMEA Segment 0%, Asia-Pacific Segment 4% and Latin America 4%, and Asia-Pacific 4%Segment 3.5%. The discount factor is determined by the WACC of the respective reporting unit. The Company's WACC consisted of a basic rate of 6.01%5.14% for 2014.2016. The basic rate is then adjusted by a country-specific risk rate and, if appropriate, by a factor to reflect higher risks associated with the cash flows from recent material acquisitions, until they are appropriately integrated, within each reporting unit. In 2014,2016, WACCs for the reporting units ranged from 5.96%5.12% to 15.73%15.88%.
FRESENIUS MEDICAL CARE AG & Co. KGaA
NOTES TO CONSOLIDATED FINANCIAL STATEMENTS — (Continued)
(in thousands, except share and per share data)
In the case that the fair value of the reporting unit is less than its carrying value, a second step would be performed which compares the implied fair value of the reporting unit's goodwill to the carrying value of its goodwill. If the fair value of the goodwill is less than the carrying value, the difference is recorded as an impairment.
To evaluate the recoverability of intangible assets with indefinite useful lives, the Company compares the fair values of intangible assets with their carrying values. An intangible asset's fair value is determined using a discounted cash flow approach or other methods, if appropriate.
f) Derivative Financial Instruments
Derivative financial instruments, which primarily include foreign currency forward contracts and interest rate swaps, are recognized as assets or liabilities at fair value in the balance sheet (see Note 21)19). From time to time, the Company may enter into other types of derivative instruments which are dealt with on a transaction by transaction basis. Changes in the fair value of derivative financial instruments classified as fair value hedges and in the corresponding underlying assets and liabilities are recognized periodically in earnings, while the effective portion of changes in fair value of derivative financial instruments classified as cash flow hedges is recognized in accumulated other comprehensive income (loss) ("AOCI") in shareholders' equity. The ineffective portion is recognized in current net earnings. The change in fair value
FRESENIUS MEDICAL CARE AG & Co. KGaA
NOTES TO CONSOLIDATED FINANCIAL STATEMENTS — (Continued)(in thousands, except share data)
of derivatives that do not qualify for hedge accounting are recorded in the income statement and usually offset the changes in value recorded in the income statement for the underlying asset or liability.
g) Foreign Currency Translation
For purposes of these consolidated financial statements, the U.S. dollar is the reporting currency. Substantially all assets and liabilities of the parent company and all non-U.S. subsidiaries are translated at year-end exchange rates, while revenues and expenses are translated at average exchange rates. Adjustments for foreign currency translation fluctuations are excluded from net earnings and are reported in AOCI. In addition, the translation adjustments of certain intercompany borrowings, which are of a long-term nature, are reported in AOCI.
h) Revenue Recognition and Allowance for Doubtful Accounts
Health careCare revenues, other than the hospitalist revenues discussed below, are recognized on the date the patient receives treatment and includes amounts related to certain services, products and supplies utilized in providing such treatment. The patient is obligated to pay for health care services at amounts estimated to be receivable based upon the Company's standard rates or at rates determined under reimbursement arrangements. In the U.S., these arrangements are generally with third party payors, likesuch as Medicare, Medicaid or commercial insurers. Outside the U.S., the reimbursement is usually made through national or local government programs with reimbursement rates established by statute or regulation.
Dialysis product revenues are recognized upon transfer of title to the customer, either at the time of shipment, upon receipt or upon any other terms that clearly define passage of title. Product revenues are normally based upon pre-determined rates that are established by contractual arrangement.
For both health care revenues and dialysis product revenues, patients, third party payors and customers are billed at our standard rates net of contractual allowances, discounts or rebates to reflect the estimated amounts to be receivable from these payors.
HospitalistIn the U.S., hospitalist revenues are reported at the estimated net realizable amount from third-party payors, client hospitals, and others at the time services are provided. Third-party payors include federal and state agencies (under the Medicare and Medicaid programs), managed care health plans, and commercial insurance companies. Inpatient acute care services rendered to Medicare and Medicaid program beneficiaries are paid according to a fee-for-service schedule. These rates vary according to a patient classification system that is based on clinical, diagnostic and other factors. Inpatient acute services
FRESENIUS MEDICAL CARE AG & Co. KGaA
NOTES TO CONSOLIDATED FINANCIAL STATEMENTS — (Continued)
(in thousands, except share and per share data)
generated through payment arrangements with managed care health plans and commercial insurance companies are recorded on an accrual basis in the period in which services are provided at established rates. Contractual adjustments and bad debts are recorded as deductions from gross revenue to determine net revenue. In addition to the net patient service revenue described below, the company receives subsidies from hospitals to provide hospitalist services.
As of January 1, 2012, the Company adopted ASU 2011-07, Health Care Entities-Presentation and Disclosure of Patient Service Revenue, Provision for Bad Debts, and the Allowance for Doubtful Accounts and as a result, forFor services performed for patients where the collection of the billed amount or a portion of the billed amount cannot be determined at the time services are performed, Health Care Entities must record the difference between the receivable recorded and the amount estimated to be collectible must be recorded as a provision andwith the expense is presented as a reduction of health careHealth Care revenue. The provision includes such items as amounts due from patients without adequate insurance coverage and patient co-payment and deductible amounts due from patients with health care coverage. The Company basesdetermines the provision mainlyprimarily on past collection history and reports it as "Patient service bad debt provision" on the Consolidated Statements of Income.
A minor portion of International Segment product revenues outside the North America Segment is generated from arrangements which give the customer, typically a healthcare provider, the right to use dialysis machines. In the same contract the customer agrees to purchase the related treatment disposables at a price marked up from the standard price list. If the right to use the machine is conveyed through an operating lease, FMC-AG & Co. KGaA
FRESENIUS MEDICAL CARE AG & Co. KGaA
NOTES TO CONSOLIDATED FINANCIAL STATEMENTS — (Continued)(in thousands, except share data)
does not recognize revenue upon delivery of the dialysis machine but recognizes revenue on the sale of disposables.disposables with revenue for the use of dialysis machines recognized over the term of the lease contract. If the lease of the machines is a sales type lease, ownership of the dialysis machine is transferred to the user upon installation of the dialysis machine at the customer site. In this type of contract, revenue is recognized in accordance with the accounting principles for sales type leases.
Any tax assessed by a governmental authority that is incurred as a result of a revenue transaction (e.g. sales tax) is excluded from revenues and the related revenue is reported on a net basis.
Allowance for doubtful accounts
Doubtful Accounts
In the North America Segment for receivables generated from health care services, the accounting for the allowance for doubtful accounts is based on an analysis of collection experience and recognizing the differences between payors. The Company also performs an aging of accounts receivable which enables the review of each customer and their payment pattern. From time to time, accounts receivable are reviewed for changes from the historic collection experience to ensure the appropriateness of the allowances.
The allowance for doubtful accounts in the InternationalEMEA Segment, the Asia-Pacific Segment, the Latin America Segment and the dialysis products business in the North America Segment dialysis products business is an estimate comprised of customer specific evaluations regarding their payment history, current financial stability, and applicable country specific risks for receivables that are overdue more than one year. The changes in the allowance for these receivables are recorded in Selling, general and administrative as an expense.
When all efforts to collect a receivable, including the use of outside sources where required and allowed, have been exhausted, and after appropriate management review, a receivable deemed to be uncollectible is considered a bad debt and written off.
i) Research and Development expensesExpenses
Research and development expenses are expensed as incurred.
j) Income Taxes
Current taxes are calculated based on the profit (loss) of the fiscal year and in accordance with local tax rules of the respective tax jurisdictions. Expected and executed additional tax payments and tax refunds for prior years are also taken into account. Benefits from income tax positions have been recognized only when it was more likely than not that the Company would be entitled to the economic benefits of the tax positions. The more-likely-than-not threshold has been determined based on the technical merits that the position will be sustained upon examination. If a tax position meets the more-likely-than-not recognition
FRESENIUS MEDICAL CARE AG & Co. KGaA
NOTES TO CONSOLIDATED FINANCIAL STATEMENTS — (Continued)
(in thousands, except share and per share data)
threshold, management estimates the largest amount of tax benefit that is more than fifty percent likely to be realized upon settlement with a taxing authority, which becomes the amount of benefit recognized. If a tax position is not considered more likely than not to be sustained based solely on its technical merits, no benefits are recognized.
The Company recognizes deferred tax assets and liabilities for the future tax consequences attributable to temporary differences between the financial statement carrying amounts of existing assets and liabilities and their respective tax basis, tax credits and tax loss carryforwards which are more likely than not to be utilized.carryforwards. Deferred tax assets and liabilities are measured using the respective countries enacted tax rates to be applied to taxable income in the years in which those temporary differences are expected to be recovered or settled. In addition, the recognition of deferred tax assets considers the budget planning of the Company and implemented tax strategies. A valuation allowance is recorded to reduce the carrying amount of the deferred tax assets unless it isto the amount more likely than not that such assets willto be realized (see Note 18)16).
It is the Company's policy that assets onfor uncertain tax positions are recognized to the extent it is more likely than not the tax will be recovered. It is also the Company's policy to recognize interest and penalties related to its income tax positions as income tax expense.
FRESENIUS MEDICAL CARE AG & Co. KGaA
NOTES TO CONSOLIDATED FINANCIAL STATEMENTS — (Continued)(in thousands, except share data)
k) Impairment
The Company reviews the carrying value of its long-lived assets or asset groups with definite useful lives to be held and used for impairment whenever events or changes in circumstances indicate that the carrying value of these assets may not be recoverable. Recoverability of these assets is measured by a comparison of the carrying value of an asset to the future net cash flows directly associated with the asset. If assets are considered to be impaired, the impairment recognized is the amount by which the carrying value exceeds the fair value of the asset. The Company uses a discounted cash flow approach or other methods, if appropriate, to assess fair value.
Long-lived assets to be disposed of by sale are reported at the lower of carrying value or fair value less cost to sell and depreciation is ceased. Long-lived assets to be disposed of other than by sale are considered to be held and used until disposal.
For the Company's policy related to goodwill impairment, see 1e) above.
l) Debt Issuance Costs
CertainDebt issuance costs related to a recognized debt liability are presented on the issuancebalance sheet as a direct deduction from the carrying amount of that debt liability. These costs are amortized over the term of the related obligation (see Note 11)9).
m) Self-InsuranceSelf-insurance Programs
Under the Company's insurance programs for professional, product and general liability, auto liability and worker's compensation claims and medical malpractice claims, the Company's largest subsidiary is partially self-insured for professional liability claims. For all other coverage, the Company assumes responsibility for incurred claims up to predetermined amounts above which third party insurance applies. Reported liabilities for the year represent estimated future payments of the anticipated expense for claims incurred (both reported and incurred but not reported) based on historical experience and existing claim activity. This experience includes both the rate of claims incidence (number) and claim severity (cost) and is combined with individual claim expectations to estimate the reported amounts.
n) Concentration of Risk
The Company is engaged in the manufacture and sale of products for all forms of kidney dialysis, principally to healthcare providers throughout the world, and in providing kidney dialysis treatment. The Company also provides additional health care services under Care Coordination. The Company performs ongoing evaluations of its customers' financial condition and, generally, requires no collateral.
FRESENIUS MEDICAL CARE AG & Co. KGaA
NOTES TO CONSOLIDATED FINANCIAL STATEMENTS — (Continued)
(in thousands, except share and per share data)
Approximately 31%, 32% and 32% of the Company's worldwide revenuesRevenues which were earned and subject to regulations under Medicare and Medicaid, governmental healthcare programs administered by the United States government, were approximately 32% in 2016 and 2015, and 31% in 2014 2013, and 2012, respectively.of the Company's worldwide revenues.
No single debtor other than U.S. Medicare and Medicaid accounted for more than 5% of total trade accounts receivable in any of these years. Trade accounts receivable inoutside the InternationalNorth America Segment are, for a large part, due from government or government-sponsored organizations that are established in the various countries within which we operate.the Company operates. Amounts pending approval from third party payors represent less than 3% at December 31, 2014.2016.
See Note 43 for discussion of suppliers with long-term purchase commitments.
o) Legal Contingencies
From time to time, during the ordinary course of the Company's operations, the Company is party to litigation and arbitration and is subject to investigations relating to various aspects of its business (see Note 20)18). The Company regularly analyzes current information about such claims for probable losses and provides accruals for such matters, including the estimated legal expenses and consulting services in connection with these matters, as appropriate. The Company utilizes its internal legal department as well as external resources for these assessments. In making the decision regarding the need for loss accrual, the
FRESENIUS MEDICAL CARE AG & Co. KGaA
NOTES TO CONSOLIDATED FINANCIAL STATEMENTS — (Continued)(in thousands, except share data)
Company considers the degree of probability of an unfavorable outcome and its ability to make a reasonable estimate of the amount of loss.
The filing of a suit or formal assertion of a claim or assessment, or the disclosure of any such suit or assertion, does not necessarily indicate that accrual of a loss is appropriate.
p) Earnings perPer Share
Basic earnings per share is calculated by dividing net income attributable to shareholders by the weighted average number of shares outstanding during the year. Prior to the conversion of preference shares to ordinary shares during the second quarter of 2013, basic earnings per share was computed according to the two-class method by dividing net income attributable to shareholders, less preference amounts, by the weighted number of ordinary and preference shares outstanding during the year. Diluted earnings per share include the effect of all potentially dilutive instruments on ordinary shares and previously outstanding preference shares that would have been outstanding during the years presented had the dilutive instruments been issued.
Equity-settled awards granted under the Company's stock incentive plans (see Note 17)15), are potentially dilutive equity instruments.
q) Treasury Stock
The Company may, from time to time, acquire its own shares ("Treasury Stock") as approved by its shareholders. The acquisition, sale or retirement of its Treasury Stock is recorded separately in equity. For the calculation of basic earnings per share, treasury stock is not considered outstanding and is therefore deducted from the number of shares outstanding with the value of such Treasury Stock shown as a reduction of the Company's equity.
r) Employee Benefit Plans
For the Company's funded benefit plans, the defined benefit obligation is offset against the fair value of plan assets (funded status). A pension liability is recognized in the Consolidated Balance Sheets if the defined benefit obligation exceeds the fair value of plan assets. A pension asset is recognized (and reported under "Other assets and notes receivables" in the Consolidated Balance Sheets) if the fair value of plan assets exceeds the defined benefit obligation and if the Company has a right of reimbursement against the fund or a right to reduce future payments to the fund. Changes in the funded status of a plan resulting from actuarial gains or losses and prior service costs or credits that are not recognized as components of the net periodic benefit cost are recognized through accumulated other comprehensive income, net of tax, in the year in which they occur. Actuarial gains or losses and prior service costs are subsequently recognized as components of net periodic benefit cost when realized. The Company uses December 31 as the measurement date when measuring the funded status of all plans.
s) Recent Pronouncements
Recently Implemented Accounting Pronouncements
On February 28, 2013 FASB issuedAccounting Standards Update 2013-04 ("ASU 2013-04")Liabilities (Topic 405), Obligations Resulting from Joint and Several Liability Arrangements for which the Total Amount of the Obligations is Fixed at the Reporting Date. ASU 2013-04's objective is to provide guidance and clarification on the recognition, measurement and disclosure of obligations resulting from joint and several liability arrangements such as debt arrangements, other contractual obligations and settled litigation and judicial rulings. The update is effective for fiscal years and interim periods within those years beginning on or after December 15, 2013. We adopted ASU 2013-04 as of January 1, 2014. ASU 2013-04 does not have a material impact on our consolidated financial statements.
On March 4, 2013 FASB issuedAccounting Standards Update 2013-05 ("ASU 2013-05")Foreign Currency Matters (Topic 830), Parent's Accounting for the Cumulative Translation Adjustment upon Derecognition of Certain Subsidiaries or Groups of Assets within a Foreign Entity or of an Investment in a
FRESENIUS MEDICAL CARE AG & Co. KGaA
NOTES TO CONSOLIDATED FINANCIAL STATEMENTS — (Continued)(in thousands, except share data)
Foreign Entity. The purpose of ASU 2013-05 is to provide clarification and further refinement regarding the treatment of the release of a cumulative translation adjustment into net income. This occurs in instances where the parent sells either a part or all of its investment in a foreign entity, as well as when a company ceases to hold a controlling interest in a subsidiary or group of assets that is a nonprofit activity or business within a foreign entity. The update is effective for fiscal years and interim periods within those years beginning on or after December 15, 2013. We adopted ASU 2013-05 as of January 1, 2014. ASU 2013-05 does not have a material impact on the Company and its consolidated financial statements.
On June 19, 2014, FASB issued Accounting Standards Update 2014-12 ("ASU 2014-12"),Compensation – Stock Compensation (Topic 718): Accounting for Share-Based Payments When the Terms of an Award Provide That a Performance Target Could Be Achieved after the Requisite Service Period. The amendments in ASU 2014-12 require that a performance target that affects vesting and that could be achieved after the requisite service period is treated as a performance condition. The update is effective for fiscal years and interim periods within those years beginning on or after December 15, 2015. Early adoption is permitted. We utilized and will continue to utilize the guidance updated by this ASU and as such there is no expected impact on our Consolidated Financial Statements.
On July 18, 2013, FASB issuedAccounting Standards Update 2013-11 ("ASU 2013-11") Income Taxes (Topic 740) Presentation of an Unrecognized Tax Benefit When a Net Operating Loss Carryforward, a Similar Tax Loss, or a Tax Credit Carryforward Exists. The purpose of ASU 2013-11 is to align the financial statement presentation of an unrecognized tax benefit when a net operating loss carryforward, a similar tax loss or a tax credit carryforward exists. In most cases, the unrecognized tax benefit should be presented as a reduction to a deferred tax asset for a net operating loss carryforward, a similar tax loss or a tax credit carryforward. The update is effective for fiscal years and interim periods within those years beginning on or after December 15, 2013. We adopted ASU 2013-11 as of January 1, 2014. ASU 2013-11 does not have a material impact on the Company and its consolidated financial statements.
On November 4, 2014 FASB issuedAccounting Standards Update 2014-16 ("ASU 2014-16")Derivatives and Hedging (Topic 815), Determining Whether the Host Contract in a Hybrid Financial Instrument Issued in the Form of a Share Is More Akin to Debt or to Equity. ASU 2014-16's objective is to eliminate the use of different methods in practice and thereby reduce existing diversity under GAAP in the accounting for hybrid financial instruments issued in the form of a share. The update is effective for fiscal years and interim periods within those years beginning on or after December 15, 2015. As early adoption is permissible and the Company's financial statements are in conformity with the update, the Company has adopted ASU 2014-16 as of November 4, 2014. ASU 2014-16 does not have a material impact on the Company and its consolidated financial statements.
On November 18, 2014 FASB issuedAccounting Standards Update 2014-17 ("ASU 2014-17")Business Combinations (Topic 805): Pushdown Accounting. ASU 2014-17's objective is to provide an acquired entity with an option to apply pushdown accounting in its separate financial statements. This option is given upon occurrence of an event in which an acquirer obtains control of the acquired entity. The update is effective on November 18, 2014 and has been adopted by the Company as of November 18, 2014. ASU 2014-17 does not have an impact on the Company and its consolidated financial statements.
Recent Accounting Pronouncements Not Yet Adopted
On January 23, 2014, FASB issued Accounting Standards Update 2014-05 ("ASU 2014-05")Service Concession Arrangements (Topic 853). ASU 2014-05's objective is to specify that an operating entity should not account for a service concession arrangement that is within the scope of ASU 2014-05 as a lease. The update is effective for fiscal years and interim periods within those years beginning on or after December 15, 2014. ASU 2014-05 will not have a material impact on the Company and its Consolidated Financial Statements.
FRESENIUS MEDICAL CARE AG & Co. KGaA
NOTES TO CONSOLIDATED FINANCIAL STATEMENTS — (Continued)
(in thousands, except share and per share data)
s) Share-based Plans
The grant date fair value of stock options and convertible equity instruments that are settled by delivering equity-instruments granted to the Management Board and executive employees of the group entities by FMC-AG & Co. KGaA is measured using the binominal option pricing model and recognized as expense over the vesting period of the stock option plans. For certain exceptions a shorter vesting period may apply after which the stock options will not forfeit in any way. In such cases the vesting period is shortened accordingly.
The balance sheet date fair value of cash-settled phantom stocks granted to the Management Board and executive employees of the Company is calculated using the binominal option pricing model. The corresponding liability based on the balance sheet date fair value is accrued over the vesting period of the phantom stock plans. For certain exceptions a shorter vesting period may apply after which the phantom stocks will not forfeit in any way. In such cases the vesting period is shortened accordingly.
The balance sheet date fair value of cash-settled performance shares granted to the Management Board and executive employees of the Company is calculated using the Monte Carlo pricing model. The corresponding liability based on the balance sheet date fair value is accrued over the vesting period of the performance share plan. For certain exceptions a shorter vesting period may apply after which the performance shares will not forfeit in any way. In such cases the vesting period is shortened accordingly.
Two of the Company's subsidiaries are authorized to issue Incentive Units (see Note 15). The balance sheet date fair value of the awards under the subsidiary stock incentive plans, whereby Incentive Units are issued by certain of the Company's subsidiaries, is calculated using the Monte Carlo pricing model. The corresponding liability is accrued over the vesting period of the Incentive Units.
t) Recent Pronouncements
Recently Implemented Accounting Pronouncements
On April 10,February 18, 2015, FASB issued ASU 2015-02,Consolidation (Topic 810): Amendments to the Consolidation Analysis, which focuses on clarifying guidance related to the evaluation of various types of legal entities such as limited partnerships, limited liability corporations and certain security transactions for consolidation. The update is effective for fiscal years beginning after December 15, 2015, and for interim periods within fiscal years beginning after December 15, 2015. The Company has implemented ASU 2015-02 on a retrospective basis which is applied using the VIE entities in place as of December 31, 2016 for 2015 and 2014 utilizing a pro forma presentation to ensure comparability. These types of legal entities are predominantly utilized in the U.S. The consolidation disclosures in "a) Principles of Consolidation" above were amended in relation to this ASU.
On November 20, 2015, FASB issued Accounting Standards Update 2014-082015-17 ("ASU 2014-08"2015-17")PresentationIncome Taxes (Topic 740): Balance Sheet Classification of Financial Statements (Topic 205) and Property, Plant, and Equipment (Topic 360), Reporting discontinued Operations and Disclosures of Disposals of Components of an Entity.Deferred Taxes ASU 2014-08's objective is to reduce, which focuses on reducing the complexity of classifying deferred taxes on the balance sheet. ASU 2015-17 eliminates the current requirement for organizations to present deferred tax liabilities and difficultyassets as current and non-current in applying guidance for discontinued operations. ASU 2014-08's main focus is to limita classified balance sheet and requires the presentation to disposals representing a strategic shift that has a major effect on operations or financial results.classification of all deferred tax assets and liabilities as non-current. The update is effective for fiscal years and interim periods within those years beginning on or after December 15, 2014. Currently,2016. The Company adopted this ASU 2014-08as of March 31, 2016. In accordance with ASU 2015-17, deferred taxes recorded as of December 31, 2015 within current assets and liabilities have been reclassified to non-current assets and liabilities in the amount of $216,127 and $36,399, respectively. As a result of deferred tax netting, non-current assets and liabilities were then adjusted in the amount of $168,232.
The Company has prepared its consolidated financial statements in accordance with U.S. GAAP for the periods presented in these Notes. The discussion below regarding accounting standards not yet adopted does not apply beyond the fiscal year 2016. Starting on January 1, 2017, the Company will not have an impact on our Consolidatedprepare its consolidated financial statements in accordance with International Financial Statements.Reporting Standards.
FRESENIUS MEDICAL CARE AG & Co. KGaA
NOTES TO CONSOLIDATED FINANCIAL STATEMENTS — (Continued)
(in thousands, except share and per share data)
Recent Accounting Pronouncements Not Yet Adopted
On May 28, 2014, the FASB issued Accounting Standards Update 2014-09 ("ASU 2014-09"),Revenue from Contracts with Customers, Topic 606. Simultaneously, the IASB published its equivalent revenue standard, "IFRS 15,"Revenue from Contracts with Customers. The standards are the result of a convergence project between FASB and the IASB. This update specifies how and when companies reporting under U.S. GAAP will recognize revenue as well as providing users of financial statements with more informative and relevant disclosures. ASU 2014-09 supersedes some guidance included in topic 605, Revenue Recognition, some guidance within the scope of Topic 360, Property, Plant, and Equipment, and some guidance within the scope of Topic 350, Intangibles – Goodwill and Other. This ASU applies to nearly all contracts with customers, unless those contracts are within the scope of other standards (for example, lease contracts or insurance contracts). With the issuance of Accounting Standards Update 2015-14 ("ASU 2015-14"),Revenue from Contracts with Customers (Topic 606): Deferral of the Effective Date on August 12, 2015, the effective date of ASU 2014-09 for public business entities, among others, was deferred from fiscal years and interim periods within those years beginning after December 15, 2016 to fiscal years and interim periods within those years beginning after December 15, 2017. Earlier adoption is permitted. There will be no impact from ASU 2014-09; however, the Company is currently evaluating the impact of IFRS 15, in conjunction with all amendments to the standard, on its consolidated financial statements. Based on the Company's evaluation, it expects differences to the current accounting mainly with regard to the calculation of the transaction price for health care services provided. IFRS 15 requires the consideration of implicit price concessions when determining the transaction price. This updatewill lead to a corresponding decrease of revenues from health care services and thus will no longer be included in selling, general and administrative expenses as an allowance for doubtful accounts. The first analysis of this issue showed a decrease of revenue by approximately 2 - 3% without any effect on net income. A more detailed quantification of the impact of IFRS 15 is not yet possible. The Company is also evaluating accounting policy options and transition methods of IFRS 15.
On February 25, 2016, FASB issued Accounting Standards Update 2016-02 ("ASU 2016-02")Leases (Subtopic 842). ASU 2016-02 is expected to increase transparency and comparability by recognizing lease assets and lease liabilities from lessees on the balance sheet and disclosing key information about leasing arrangements in the financial statements. The lessor accounting is largely unchanged. The updates are effective for fiscal years and interim periods within those years beginning on or after December 15, 2016. Earlier adoption is not2018. Early applications of the amendments in these updates are permitted. WeThere will be no impact from ASU 2016-02; however, the IASB issued IFRS 16, Leases, which supersedes the current standard on lease-accounting, IAS 17, as well as the interpretations IFRIC 4, SIC-15 and SIC-27. The Company expects a balance sheet extension due to the "on balance sheet" recognition of right of use assets and liabilities for agreed lease payment obligations related to certain leased clinics and buildings which are currently evaluatingclassified as operating leases. Based on a first impact analysis as of December 31, 2015, using certain assumptions and simplifications, the impactCompany expects a financial debt increase of 2014-09approximately €4,000,000. Referring to the consolidated statement of income, the Company expects an EBITDA (Earnings before Interest, Taxes, Depreciation and Amortization) as well as operating income improvement due to the separation of rent expenses in depreciation and interest expenses but without effect on our Consolidated Financial Statements.
On June 12, 2014, FASB issued Accounting Standards Update 2014-11 ("ASU 2014-11")the cash outflows. The Leverage Ratio (debt/EBITDA ratio – financial debt is compared to EBITDA adjusted for acquisitions made within the reporting period with a purchase price above a $50,000 threshold as defined in the Amended 2012 Credit Agreement (the "Amended 2012 Credit Agreement",Transfers see Note 9 below) and Servicing (Topic 860): Repurchase-to-Maturity Transactions, Repurchase Financings, and Disclosures, which aligns the accounting for repurchase-to-maturity transactions and repurchase financing arrangements with the accounting for other typical repurchase agreements, i.e these transactionsnon-cash charges) will be accounted for as secured borrowings. ASU 2014-11 also requires additional disclosuresincrease by about repurchase agreements and other similar transactions.0.5. The update is effective for fiscal years and interim periods within those years beginning on or after December 15, 2014. ASU 2014-11 will not have a material impact on the Company and its Consolidated Financial Statements.
2. Acquisitions, Investments and Purchaseswill depend on the contract portfolio at the effective date, as well as the transition method. The Company expects to apply the modified retrospective method after review of Intangible Assets
During 2014,the analysis performed. Currently, the Company completed acquisitions, made investments, and purchased intangible assets in the amountis evaluating optional exceptions of $1,986,732, including those listed below. Of this amount, $1,779,058 were paid in cash and $207,674 were assumed obligations and pending payments for purchase considerations. Unaudited pro forma results of operations assuming these acquisitions had taken place at the beginning of each period are not provided because the historical operating results of the acquired companies were not significant.
AcquisitionsIFRS 16.
The Company's acquisition spending was driven primarily by the purchase of dialysis clinics in the normal course of its operations and the expansion of Care Coordination activities in 2014.
The aggregate purchase price of all collectively and individually non-material acquisitions during the year was $1,687,195, net of cash acquired. Of this amount, $1,479,521 were paid in cash and $207,674 were assumed obligations and pending payments for purchase considerations. Based on preliminary purchase price allocations, the Company recorded $1,713,206 of goodwill and $196,281 of intangible assets, which represent the share of both controlling and noncontrolling interests. Goodwill arose principally due to the fair value of the acquired established streams of future cash flows for these acquisitions versus building similar franchises.
FRESENIUS MEDICAL CARE AG & Co. KGaA
NOTES TO CONSOLIDATED FINANCIAL STATEMENTS — (Continued)
(in thousands, except share and per share data)
On July 1, 2014,January 5, 2016, FASB issued Accounting Standards Update 2016-01 ("ASU 2016-01")Financial Instruments – Overall (Subtopic 825-10): Recognition and Measurement of Financial Assets and Financial Liabilities. ASU 2016-01 focuses on improving the Company completed a transactionrecognition and measurement of financial instruments to become the controlling majority shareholderprovide users of the U.S. based company Sound Inpatient Physicians, Inc. ("Sound"), a physician services organization focused on hospitalist and post-acute care services. This business was acquired to expand the Company's hospitalist services to further increase the quality of care to our patients. Sound has more than 1,000 physician partners providing care in over 100 hospitals and post-acute care centers across the United States.
equity instruments. The intangibleupdate is effective for fiscal years and interim periods within those years beginning after December 15, 2017. Earlier adoption is generally not permitted. On June 16, 2016, FASB issued Accounting Standards Update 2016-13 ("ASU 2016-13")Financial Instruments – Credit Losses (Topic 326): Measurement of Credit Losses on Financial Instruments. ASU 2016-13 amends guidance on reporting credit losses for assets associated with these acquisitions consist primarily of customer relationshipsheld at amortized cost basis and tradenames at fair value to be amortized on a straight-line basis over a weighted average period of approximately 8-9 years.
Business combinations during 2014 decreased the Company's Net Income (Net Income attributable to the shareholders of FMC-AG & Co. KGaA) by $3,598, including the costs of the acquisitions, and Net Revenue increased by $541,070. Total Assets increased $2,505,027 due to business combinations.
Investments and Purchases of Intangible Assets
Investments and purchases of intangible assets were $299,537 for the period ended December 31, 2014. This amount was primarily driven by an investment in available for sale financial assets. For Securities and Exchange Commission filers, these updates are effective for fiscal years and interim periods within those years beginning after December 15, 2019. Early adoption is permitted as of the fiscal years beginning after December 15, 2018, including interim periods within those fiscal years. There will be no impact from ASU 2016-01 or ASU 2016-13; however, in July 2014, the IASB issued a new version of IFRS 9, Financial Instruments. This IFRS 9 version is considered the final and complete version, which replaces IAS 39 upon application of IFRS 9. IFRS 9 includes all prior guidance on the classification and measurement of financial assets and financial liabilities as well as deferred acquisition paymentshedge accounting and notesintroduces requirements for impairment of financial instruments as well as modified requirements for the measurement categories of financial assets. The Company concluded that IFRS 9 will not be adopted early and is currently evaluating the impact on its consolidated financial statements. In accordance with IAS 39, the majority of the non-derivative financial assets are measured at amortized costs. The analysis on the business model and the contractual cash flow characteristics of each instrument is still ongoing. The requirements on the classification and measurement of non-derivative financial liabilities have not significantly changed. The Company anticipates a limited impact on its consolidated financial statements. Derivatives not designated as hedging instruments will continue to be classified and measured at fair value through profit and loss. Further, the Company intends to implement the simplified method to determine the provisions for risks from trade accounts receivable, receivables relatedfrom lease contracts and capitalized contract costs according to an equity method investee.IFRS 15. A quantification of the impact is not yet possible. Based on currently available information, derivative financial instruments presently designated as hedging instruments are also qualified for hedge accounting according to the requirements of IFRS 9. The Company is also evaluating accounting policy choices and transition methods of IFRS 9.
3.2. Related Party Transactions
The Company's parent, Fresenius SE & Co. KGaA ("Fresenius SE"), a German partnership limited by shares, owns 100% of the share capital of Fresenius Medical Care Management AG, the Company's general partner ("General Partner"). Fresenius SE is also the Company's largest shareholder and owns approximately 31.1%30.82% of the Company's outstanding shares, excluding treasury shares held by the Company, at December 31, 2014.2016. The Company has entered into certain arrangements for services, leases and products with Fresenius SE or its subsidiaries and with certain of the Company's equity method investees as described in item a) below. The Company's terms related to the receivables or payables for these services, leases and products are generally consistent with the normal terms of the Company's ordinary course of business transactions with unrelated parties. Financing arrangements as described in item b) below have agreed upon terms which are determined at the time such financing transactions occur and reflect market rates at the time of the transaction. The relationship between the Company and its key management personnel who are considered to be related parties is described in item c) below. Our related party transactions are settled through Fresenius SE's cash management system where appropriate.
a) Service Agreements, Lease Agreements and Products
The Company is party to service agreements with Fresenius SE and certain of its affiliates (collectively the "Fresenius SE Companies") to receive services, including, but not limited to: administrative services, management information services, employee benefit administration, insurance, information technology services, tax services and treasury management services. The Company also provides certaincentral purchasing services to the Fresenius SE Companies, including research and development, central purchasing and warehousing. Under these agreements, the Company also performs clinical studies and marketing and distribution services for certain of its equity method investees.Companies. These related party agreements generally have a duration of 1-5 years and are renegotiated on an as needed basis when the agreement comes due. The Company
FRESENIUS MEDICAL CARE AG & Co. KGaA
NOTES TO CONSOLIDATED FINANCIAL STATEMENTS — (Continued)
(in thousands, except share and per share data)
provides administrative services to one of its equity method investees. In 2015, the Company also performed marketing and distribution services for certain of its equity method investees.
The Company is a party to real estate operating lease agreements with the Fresenius SE Companies, which mainly include leases for the Company's corporate headquarters in Bad Homburg, Germany and production sites in Schweinfurt and St. Wendel, Germany. The majorityleases were re-negotiated and revised upon expiration at the end of 2016. These new lease agreements began on January 1, 2017 and expire on December 31, 2026. Certain of the office lease contracts are commercially agreed but pending formal approval by the supervisory board of Fresenius SE. The Company expects formal approval of these contracts to be granted in the first quarter of 2017 with an effective date of January 1, 2017. Based upon an appraisal, the rents under the leases expire in 2016 and contain renewal options.represent fair market value for such properties. As of December 31, 2014,2016 and 2015, future minimum rental payments under these non-cancelable operating leases with Fresenius SE were $18,022, including amounts pending formal approval above through September 2017, and $24,224 as well as $128,436 and $16,215 with other Fresenius SE affiliates, were $55,163 and $83,944, respectively. These minimum rental payments are included within the amounts disclosed in Note 19.17.
In addition to the above mentioned service and lease agreements, the Company sold products to the Fresenius SE Companies and made purchases from the Fresenius SE Companies.Companies and equity method investees. In addition, Fresenius Medical Care Holdings, Inc. ("FMCH") purchases heparin supplied by Fresenius Kabi USA, Inc. ("Kabi USA"), through an independent group purchasing organization ("GPO"). Kabi USA is wholly-owned by Fresenius Kabi AG, aan indirect, wholly-owned subsidiary of Fresenius SE. The Company has no direct supply agreement with Kabi USA and does not submit purchase orders directly to Kabi USA. FMCH acquires heparin from Kabi USA, through the GPO contract, which was negotiated by the GPO at arm's length on behalf of all members of the GPO.
The Company entered into an agreement with a Fresenius SE company for the manufacturing of plasma collection devices. The Company agreed to produce 3,500 units which can be further increased to a maximum of 4,550 units, over the length of the five year contract. A contract was signed onOn January 1, 2015, to sell certain assets and liabilities related to thethis manufacturing facilitybusiness was sold to Kabi USA in the amount of $9,327.for $9,327 for which a fairness opinion was obtained from a reputable global accounting firm. The disposal will bewas accounted for as a transaction between parties under common control.control at the carrying amounts without the generation of profits.
In December 2010, the Company formed a renal pharmaceutical company with Galenica Ltd., named Vifor Fresenius Medical Care Renal Pharma Ltd. ("VFMCRP"), an equity method investee of which the Company owns 45%. The Company has entered into exclusive supply agreements to purchase certain pharmaceuticals from VFMCRP.
FRESENIUS MEDICAL CARE AG & Co. KGaA
NOTES TO CONSOLIDATED FINANCIAL STATEMENTS — (Continued)
(in thousands, except share and per share data)
Below is a summary, including the Company's receivables from and payables to the indicated parties resulting from the above described transactions with related parties.
| Service Agreements, Lease Agreements and Products | Service Agreements, Lease Agreements and Products | Service Agreements, Lease Agreements and Products | ||||||||||||||||||||||||||||||||||||||||||||||||||||||||||||
|---|---|---|---|---|---|---|---|---|---|---|---|---|---|---|---|---|---|---|---|---|---|---|---|---|---|---|---|---|---|---|---|---|---|---|---|---|---|---|---|---|---|---|---|---|---|---|---|---|---|---|---|---|---|---|---|---|---|---|---|---|---|---|
| | For the year ended December 31, 2014 | For the year ended December 31, 2013 | For the year ended December 31, 2012 | December 31, 2014 | December 31, 2013 | For the year ended December 31, 2016 | For the year ended December 31, 2015 | For the year ended December 31, 2014 | December 31, 2016 | December 31, 2015 | ||||||||||||||||||||||||||||||||||||||||||||||||||||
| | Sales of goods and services | Purchases of goods and services | Sales of goods and services | Purchases of goods and services | Sales of goods and services | Purchases of goods and services | Accounts Receivables | Accounts Payables | Accounts Receivables | Accounts Payables | Sales of goods and services | Purchases of goods and services | Sales of goods and services | Purchases of goods and services | Sales of goods and services | Purchases of goods and services | Accounts Receivables | Accounts Payables | Accounts Receivables | Accounts Payables | ||||||||||||||||||||||||||||||||||||||||||
Service Agreements | ||||||||||||||||||||||||||||||||||||||||||||||||||||||||||||||
Fresenius SE | 380 | 21,788 | 807 | 21,059 | 129 | 19,926 | 106 | 3,134 | 245 | 2,365 | 431 | 22,381 | 254 | 20,262 | 380 | 21,788 | 139 | 54 | 422 | 3,185 | ||||||||||||||||||||||||||||||||||||||||||
Fresenius SE affiliates | 7,956 | 68,236 | 6,743 | 82,518 | 5,681 | 60,852 | 1,396 | 2,462 | 975 | 1,900 | 3,068 | 82,003 | 8,162 | 75,900 | 7,956 | 72,256 | 867 | 3,011 | 2,104 | 4,079 | ||||||||||||||||||||||||||||||||||||||||||
Equity method investees | 17,911 | — | 21,647 | — | 26,602 | — | 4,265 | 270 | 20,336 | — | 19,457 | — | 23,369 | — | 17,911 | — | 2,641 | — | 10,180 | — | ||||||||||||||||||||||||||||||||||||||||||
| | | | | | | | | | | | | | | | | | | | | | | | | | | | | | | | | | | | | | | | | | | | | | | | | | | | | | | | | | | | | | | |
Total | $ | 26,247 | $ | 90,024 | $ | 29,197 | $ | 103,577 | $ | 32,412 | $ | 80,778 | $ | 5,767 | $ | 5,866 | $ | 21,556 | $ | 4,265 | $ | 22,956 | $ | 104,384 | $ | 31,785 | $ | 96,162 | $ | 26,247 | $ | 94,044 | $ | 3,647 | $ | 3,065 | $ | 12,706 | $ | 7,264 | ||||||||||||||||||||||
| | | | | | | | | | | | | | | | | | | | | | | | | | | | | | | | | | | | | | | | | | | | | | | | | | | | | | | | | | | | | | | | |
| | | | | | | | | | | | | | | | | | | | | | | | | | | | | | | | | | | | | | | | | | | | | | | | | | | | | | | | | | | | | | | |
Lease Agreements | ||||||||||||||||||||||||||||||||||||||||||||||||||||||||||||||
Fresenius SE | — | 10,554 | — | 9,865 | — | 9,126 | — | — | — | — | — | 10,488 | — | 9,621 | — | 10,554 | — | — | — | — | ||||||||||||||||||||||||||||||||||||||||||
Fresenius SE affiliates | — | 17,389 | — | 17,111 | — | 16,053 | — | — | — | — | — | 15,183 | — | 14,660 | — | 17,389 | — | — | — | — | ||||||||||||||||||||||||||||||||||||||||||
| | | | | | | | | | | | | | | | | | | | | | | | | | | | | | | | | | | | | | | | | | | | | | | | | | | | | | | | | | | | | | | |
Total | $ | — | $ | 27,943 | $ | — | $ | 26,976 | $ | — | $ | 25,179 | $ | — | $ | — | $ | — | $ | — | $ | — | $ | 25,671 | $ | — | $ | 24,281 | $ | — | $ | 27,943 | $ | — | $ | — | $ | — | $ | — | ||||||||||||||||||||||
| | | | | | | | | | | | | | | | | | | | | | | | | | | | | | | | | | | | | | | | | | | | | | | | | | | | | | | | | | | | | | | | |
| | | | | | | | | | | | | | | | | | | | | | | | | | | | | | | | | | | | | | | | | | | | | | | | | | | | | | | | | | | | | | | |
Products | ||||||||||||||||||||||||||||||||||||||||||||||||||||||||||||||
Fresenius SE | 1 | — | 17 | — | 13 | — | — | — | — | — | 2 | — | 5 | — | 1 | — | — | — | — | — | ||||||||||||||||||||||||||||||||||||||||||
Fresenius SE affiliates | 63,917 | 44,754 | 30,045 | 51,901 | 22,085 | 60,208 | 18,352 | 4,132 | 18,587 | 7,231 | 25,846 | 48,028 | 25,920 | 37,166 | 63,917 | 44,754 | 8,378 | 5,046 | 8,774 | 3,768 | ||||||||||||||||||||||||||||||||||||||||||
Equity method investees | — | $ | 410,927 | $ | — | $ | 275,340 | $ | — | $ | 27,584 | $ | — | $ | 58,322 | $ | — | $ | 8,253 | |||||||||||||||||||||||||||||||||||||||||||
| | | | | | | | | | | | | | | | | | | | | | | | | | | | | | | | | | | | | | | | | | | | | | | | | | | | | | | | | | | | | | | |
Total | $ | 63,918 | $ | 44,754 | $ | 30,062 | $ | 51,901 | $ | 22,098 | $ | 60,208 | $ | 18,352 | $ | 4,132 | $ | 18,587 | $ | 7,231 | $ | 25,848 | $ | 458,955 | $ | 25,925 | $ | 312,506 | $ | 63,918 | $ | 72,338 | $ | 8,378 | $ | 63,368 | $ | 8,774 | $ | 12,021 | ||||||||||||||||||||||
| | | | | | | | | | | | | | | | | | ��� | | | | | | | | | | | | | | | | | | | | | | | | | | | | | | | | | | | | | | | | | | | | | | |
| | | | | | | | | | | | | | | | | | | | | | | | | | | | | | | | | | | | | | | | | | | | | | | | | | | | | | | | | | | | | | | |
b) Financing
The Company receives short-term financing from and provides short-term financing to Fresenius SE. The Company also utilizes Fresenius SE's cash management system for the settlement of certain intercompany receivables and payables with its subsidiaries and other related parties. As of December 31, 20142016 and December 31, 2013,2015, the Company had accounts receivables from Fresenius SE related to short-term financing in the amount of $146,144$208,589 and $112,568,$131,252, respectively. As of December 31, 20142016 and December 31, 2013,2015, the Company had accounts payables to Fresenius SE related to short-term financing in the amount of $103,386$196,431 and $102,731,$115,932, respectively. The interest rates for these cash management
FRESENIUS MEDICAL CARE AG & Co. KGaA
NOTES TO CONSOLIDATED FINANCIAL STATEMENTS — (Continued)(in thousands, except share data)
arrangements are set on a daily basis and are based on the then-prevailing overnight reference rate for the respective currencies.
On May 23, 2014,August 19, 2009, the Company borrowed €1,500 ($1,581 at December 31, 2016 and $1,633 at December 31, 2015) from the General Partner on an unsecured basis at 1.335%. The loan repayment has been extended periodically and is currently due August 22, 2017 with an interest rate of 1.054%. On November 28, 2013, the Company borrowed an additional €1,500 ($1,581 at December 31, 2016 and $1,633 at December 31, 2015) with an interest rate of 1.875% from the General Partner. This loan is due on November 24, 2017 with an interest rate of 1.021%.
The Company provided unsecured term loans to one of its equity method investees during 2015 and 2016 in the amount of CHF 78,416 ($79,618 based upon the average exchange rate for the twelve months ended December 31, 2016). These loans were repaid in full during the first half of 2016. The loans were entered into in order to fund the 2015 sale of European marketing rights for certain renal pharmaceuticals to the same equity method investee as well as to finance the investee's payments for license and distribution agreements. These marketing rights were sold to this equity method investee in 2015 which resulted in a Chinese Yuan Renminbi ("CNY") loan upon its maturitygain of 360,794 ($57,854), including interest, to a subsidiary of Fresenius SE.approximately $11,137, after tax.
On June 12, 2014, the Company provided a one-year unsecured term loan to one of its equity method investees in the amount of $22,500 at an interest rate of 2.5366%. The loan agreement contains automatic one year renewals and requires a six-month termination notice.
On August 19, 2009, the Company borrowed €1,500 ($1,821 at December 31, 2014) from the General Partner on an unsecured basis at 1.335%. The loan repayment has been extended periodically and is currently due August 20, 2015 with an interest rate of 1.849%. On November 28, 2013, the Company borrowed an additional €1,500 ($1,821 at December 31, 2014) from the General Partner at 1.875%. This loan is duewas repaid in full on November 27, 2015 with an interest rateJune 12, 2015.
FRESENIUS MEDICAL CARE AG & Co. KGaA
NOTES TO CONSOLIDATED FINANCIAL STATEMENTS — (Continued)
(in thousands, except share and per share data)
At December 31, 2014, the Company borrowed from Fresenius SE €1,400 ($1,700 at2016 and December 31, 2014) on an unsecured basis at an interest rate of 1.188%. Subsequent to December 31, 2014, the Company received additional advances from Fresenius SE increasing the amount borrowed to €27,200 ($33,024) and is due on February 27, 2015. For further information on this loan agreement, see Note 10. "Short-Term Borrowings, Other Financial Liabilities and Short-Term Borrowings from Related Parties – Short-Term Borrowings from Related Parties."
At December 31, 2014 and 2013,2015, a subsidiary of Fresenius SE held unsecured Senior Notes issued by the Company in the amount of €8,300 and €11,800€8,300 ($10,0778,749 at December 31, 20142016 and $16,273$9,036 at December 31, 2013)2015), respectively. The Senior Notes were issued in 2011 and 2012, mature in 2021 and 2019, respectively, and each havehas a coupon rate of 5.25%. with interest payable semiannually. For further information on thethese Senior Notes, see Note 11.9. "Long-Term Debt and Capital Lease Obligations – Senior Notes".
AtOn December 31, 20142016 the Company provided a cash advance to Fresenius SE held unsecured Senior Notes issued by the Company in the amount of $1,170. The Senior Notes were issued in 2014, mature in 2020 and 2024, respectively, and have a coupon€36,245 ($38,206 at December 31, 2016) on an unsecured basis at an interest rate of 4.125% and 4.75%. As of0.771% which was repaid on January 7,2, 2017. On December 31, 2015 the Company borrowed from Fresenius SE sold all positions held on these Senior Notes.in the amount of €14,500 ($15,786 at December 31, 2015) at an interest rate of 0.970%. For further information on the Senior Notes,these loan agreements, see Note 11 "Long-Term8. "Short-Term Debt and Capital Lease ObligationsShort-Term Debt from Related Parties – Senior Notes".Short-Term Debt from Related Parties."
c) Key Management Personnel
Due to the legal form of a German partnership limited by shares, the General Partner holds a key management position within the Company. In addition, as key management personnel, members of the Management Board and the Supervisory Board, as key management personnel, as well as their close relatives, are considered related parties.
The Company's Articles of Association provide that the General Partner shall be reimbursed for any and all expenses in connection with management of the Company's business, including remuneration of the members of the General Partner's supervisory board and the members of the General Partner's management board.Management Board. The aggregate amount reimbursed to the General Partner was $25,511, $16,327$22,663, $16,940 and $18,995,$25,511, respectively, for its management services during 2014, 20132016, 2015 and 20122014 and included an annual fee of $159, $159$133, $133 and $94,$159, respectively, as compensation for assuming liability as general partner. The annual fee is set at 4% of the amount of the General Partner's share capital (€3,000 as of December 31, 2014)2016). As of December 31, 20142016 and December 31, 2013,2015, the Company had accounts receivable from the General Partner in the amount of $462$183 and $407,$486, respectively. As of December 31, 20142016 and December 31, 2013,2015, the Company had accounts payable to the General Partner in the amount of $27,347$15,491 and $9,702,$17,806, respectively.
The Chairman of the Company's Supervisory Board is also the Chairman of the Supervisory Boardsupervisory board of Fresenius SE and of the general partner of Fresenius SE. He is also a member of the Supervisory Boardsupervisory board of the Company's General Partner.
FRESENIUS MEDICAL CARE AG & Co. KGaA
NOTES TO CONSOLIDATED FINANCIAL STATEMENTS — (Continued)(in thousands, except share data)
The Vice Chairman of the Company's Supervisory Board is a member of the Supervisory Boardsupervisory board of the general partner of Fresenius SE and Vice Chairman of the Supervisory Boardsupervisory board of the Company's General Partner. He is also Chairman of the Advisory Board of a charitable foundation that is the sole shareholder of the general partner of Fresenius SE. He is also a partner in a law firm which provided services to the Company and certain of its subsidiaries. The Company incurred expenses in the amount of $1,957, $1,268,$1,392, $958, and $1,519$1,957 for these services during 2016, 2015 and 2014, 2013 and 2012, respectively. FiveFour of the six members of the Company's Supervisory Board, including the Chairman and Vice Chairman, are also members of the Supervisory Boardsupervisory board of the Company's General Partner.
The Chairman of the Supervisory Boardsupervisory board of the Company's general partnerGeneral Partner is also the Chairman of the Management Boardmanagement board of the general partner of Fresenius SE, and the Chairman and Chief Executive Officer of the Management Board of the Company's general partnerGeneral Partner is a member of the Management Board of the general partner of Fresenius SE.
4. Inventories
At December 31, 2014 and December 31, 2013, inventories consisted of the following:
| | 2014 | 2013 | |||||
|---|---|---|---|---|---|---|---|
Finished goods | $ | 677,110 | $ | 640,355 | |||
Raw materials and purchased components | 197,920 | 185,146 | |||||
Health care supplies | 170,614 | 195,519 | |||||
Work in process | 69,910 | 76,084 | |||||
| | | | | | | | |
Inventories | $ | 1,115,554 | $ | 1,097,104 | |||
| | | | | | | | |
| | | | | | | | |
| | | | | | | | |
Under the terms of certain unconditional purchase agreements, the Company is obligated to purchase approximately $443,658 of materials, of which $206,054 is committed at December 31, 2014 for 2015. The terms of these agreements run 1 to 6 years.
Healthcare supplies inventories at December 31, 2014 and 2013 included $34,752 and $33,294, respectively, of Erythropoietin ("EPO"). The Company's previous contract with its EPO supplier, Amgen Inc. ("Amgen") expired on December 31, 2014. As a result, the Company entered into a new four-year sourcing and supply agreement with Amgen.
FRESENIUS MEDICAL CARE AG & Co. KGaA
NOTES TO CONSOLIDATED FINANCIAL STATEMENTS — (Continued)
(in thousands, except share and per share data)
5.3. Inventories
At December 31, 2016 and December 31, 2015, inventories consisted of the following:
| | 2016 | 2015 | |||||
|---|---|---|---|---|---|---|---|
Finished goods | $ | 724,814 | $ | 670,291 | |||
Health care supplies | 381,908 | 395,342 | |||||
Raw materials and purchased components | 225,879 | 206,525 | |||||
Work in process | 77,233 | 68,593 | |||||
| | | | | | | | |
Inventories | $ | 1,409,834 | $ | 1,340,751 | |||
| | | | | | | | |
| | | | | | | | |
| | | | | | | | |
Under the terms of certain unconditional purchase agreements, the Company is obligated to purchase approximately $442,024 of materials, of which $213,338 is committed at December 31, 2016 for 2017. The terms of these agreements run 1 to 5 years.
4. Prepaid Expenses and Other Current Assets
At December 31, 20142016 and 2013,2015, prepaid expenses and other current assets consisted of the following:
| | 2014 | 2013 | 2016 | 2015 | ||||||||||
|---|---|---|---|---|---|---|---|---|---|---|---|---|---|---|
Taxes Receivable | $ | 318,480 | $ | 133,673 | ||||||||||
Available for sale financial assets(1) | 168,062 | 29,185 | $ | 264,310 | $ | 271,952 | ||||||||
Cost Report Receivable from Medicare and Medicaid | 137,543 | 130,236 | ||||||||||||
Receivables for supplier rebates | 85,548 | 105,994 | ||||||||||||
Insurance recoveries | 220,000 | 220,000 | ||||||||||||
Cost report receivable from Medicare and Medicaid | 126,655 | 109,311 | ||||||||||||
Payments on account | 88,549 | 37,016 | ||||||||||||
Other taxes receivable | 79,833 | 69,684 | ||||||||||||
Other deferred charges | 58,315 | 62,555 | 68,648 | 63,210 | ||||||||||
Leases receivable | 55,503 | 48,538 | 57,483 | 53,117 | ||||||||||
Prepaid rent | 53,015 | 49,409 | 57,394 | 51,651 | ||||||||||
Income taxes receivable | 54,959 | 131,396 | ||||||||||||
Receivables for supplier rebates | 50,168 | 48,625 | ||||||||||||
Derivatives | 41,913 | 27,021 | ||||||||||||
Amounts due from managed locations | 34,054 | 22,676 | 28,863 | 20,888 | ||||||||||
Payments on account | 30,680 | 33,934 | ||||||||||||
Derivatives | 28,241 | 16,664 | ||||||||||||
Prepaid insurance | 21,290 | 11,854 | 17,491 | 21,848 | ||||||||||
Deposit / Guarantee / Security | 19,447 | 19,212 | 15,913 | 15,276 | ||||||||||
Receivable for sale of investment to third party | 9,335 | 21,846 | ||||||||||||
Other | 313,554 | 351,615 | 239,654 | 233,720 | ||||||||||
| | | | | | | | | | | | | | | |
Total prepaid expenses and other current assets | $ | 1,333,067 | $ | 1,037,391 | $ | 1,411,833 | $ | 1,374,715 | ||||||
| | | | | | | | | | | | | | | | |
| | | | | | | | | | | | | | | |
The item "Insurance recoveries" includes the recognized amount in relation to the NaturaLyte® and GranuFlo® agreement in principle, which partially offsets the accrued settlement amount recorded in Accrued Expenses and Other Current Liabilities (see Note 7). For further information, see Note 18 "Commitments and Contingencies – Commercial Litigation".
The item "Other" in the table above primarily includes interest receivables, notes receivables and loans to customers.customers, receivables from employees and notes receivables.
6.
FRESENIUS MEDICAL CARE AG & Co. KGaA
NOTES TO CONSOLIDATED FINANCIAL STATEMENTS — (Continued)
(in thousands, except share and per share data)
5. Property, Plant and Equipment
At December 31, 20142016 and 2013,2015, property, plant and equipment consisted of the following:
| | 2014 | 2013 | 2016 | 2015 | ||||||||||
|---|---|---|---|---|---|---|---|---|---|---|---|---|---|---|
Land | $ | 65,081 | $ | 46,689 | $ | 68,560 | $ | 65,076 | ||||||
Buildings and improvements | 2,630,431 | 2,432,824 | 3,159,699 | 2,758,018 | ||||||||||
Machinery and equipment | 3,965,870 | 3,808,356 | 4,379,553 | 4,070,878 | ||||||||||
Machinery, equipment and rental equipment under capitalized leases | 62,016 | 43,239 | 88,079 | 69,179 | ||||||||||
Construction in progress | 314,067 | 267,653 | 466,217 | 445,431 | ||||||||||
| | | | | | | | | | | | | | | |
| 7,037,465 | 6,598,761 | 8,162,108 | 7,408,582 | |||||||||||
Accumulated depreciation | (3,747,285 | ) | (3,506,807 | ) | (4,388,895 | ) | (3,983,008 | ) | ||||||
| | | | | | | | | | | | | | | |
Property, plant and equipment, net | $ | 3,290,180 | $ | 3,091,954 | $ | 3,773,213 | $ | 3,425,574 | ||||||
| | | | | | | | | | | | | | | | |
| | | | | | | | | | | | | | | |
Depreciation expense for property, plant and equipment amounted to $600,845, $555,125$657,518, $606,964 and $515,455$600,845 for the years ended December 31, 2014, 2013,2016, 2015, and 2012,2014, respectively.
Included in machinery and equipment at December 31, 20142016 and 20132015 were $614,797$670,258 and $597,024,$628,140, respectively, of peritoneal dialysis cycler machines which the Company leases to customers with end-stage renal disease on a month-to-month basis and hemodialysis machines which the Company leases to physicians under operating leases.
Accumulated depreciation related to machinery, equipment and rental equipment under capital leases was $24,420$43,198 and $21,201$32,339 at December 31, 2016 and 2015, respectively.
6. Intangible Assets and Goodwill
At December 31, 2016 and 2015, the carrying value and accumulated amortization of intangible assets other than goodwill consisted of the following:
| | 2016 | 2015 | |||||||||||
|---|---|---|---|---|---|---|---|---|---|---|---|---|---|
| | Gross Carrying Amount | Accumulated Amortization | Gross Carrying Amount | Accumulated Amortization | |||||||||
Amortizable Intangible Assets | |||||||||||||
Non-compete agreements | $ | 360,938 | $ | (292,980 | ) | $ | 346,186 | $ | (273,220 | ) | |||
Technology | 176,893 | (64,440 | ) | 106,510 | (57,821 | ) | |||||||
Licenses and distribution agreements | 192,747 | (121,152 | ) | 193,280 | (112,167 | ) | |||||||
Customer Relationships | 261,766 | (62,910 | ) | 262,754 | (35,347 | ) | |||||||
Self-developed software | 153,826 | (88,729 | ) | 140,914 | (72,797 | ) | |||||||
Other | 389,125 | (289,697 | ) | 357,065 | (264,621 | ) | |||||||
Construction in progress | 18,873 | — | 23,333 | — | |||||||||
| | | | | | | | | | | | | | |
| $ | 1,554,168 | $ | (919,908 | ) | $ | 1,430,042 | $ | (815,973 | ) | ||||
| | | | | | | | | | | | | | |
| | | | | | | | | | | | | | |
| | | | | | | | | | | | | | |
The increase in technology intangible assets was primarily driven by the purchase of a medical technology company focusing on the treatment of lung and cardiac failure in 2016.
FRESENIUS MEDICAL CARE AG & Co. KGaA
NOTES TO CONSOLIDATED FINANCIAL STATEMENTS — (Continued)
(in thousands, except share and per share data)
At December 31, 2016 and 2015 the carrying value of non-amortizable intangible assets other than goodwill consisted of the following:
| | 2016 | 2015 | |||||
|---|---|---|---|---|---|---|---|
| | Carrying Amount | Carrying Amount | |||||
Non-amortizable Intangible Assets | |||||||
Tradename | $ | 209,441 | $ | 209,404 | |||
Management contracts | 3,497 | 7,016 | |||||
| | | | | | | | |
| $ | 212,938 | $ | 216,420 | ||||
| | | | | | | | |
| | | | | | | | |
| | | | | | | | |
Total Intangible Assets | $ | 847,198 | $ | 830,489 | |||
| | | | | | | | |
| | | | | | | | |
| | | | | | | | |
The amortization on intangible assets amounted to $118,427, $110,359 and $98,483 for the years ended December 31, 2016, 2015, and 2014, respectively. The table shows the estimated amortization expense of these assets for the following five years.
Estimated Amortization Expense | ||||
2017 | $ | 117,315 | ||
| | | | | |
2018 | $ | 111,578 | ||
| | | | | |
2019 | $ | 109,232 | ||
| | | | | |
2020 | $ | 101,705 | ||
| | | | | |
2021 | $ | 98,582 | ||
| | | | | |
Goodwill
Changes in the carrying amount of goodwill are mainly a result of acquisitions and 2013, respectively.the impact of foreign currency translations. The Company's acquisitions consisted primarily of the purchase of clinics in the normal course of operations in 2016 and 2015 as well as the purchase of a medical technology company focusing on the treatment of lung and cardiac failure in 2016 and the purchase of a distributor in the Asia-Pacific Segment in 2015. The changes to goodwill in 2016 and 2015 are as follows:
| | North America Segment | EMEA Segment | Asia- Pacific Segment | Latin America Segment | Segment Total | Corporate | Total | |||||||||||||||
|---|---|---|---|---|---|---|---|---|---|---|---|---|---|---|---|---|---|---|---|---|---|---|
Balance as of December 31, 2014 | $ | 11,180,954 | $ | 1,018,881 | $ | 365,351 | $ | 100,824 | $ | 12,666,010 | $ | 416,170 | $ | 13,082,180 | ||||||||
Goodwill acquired, net of divestitures | 43,186 | 52,484 | 22,247 | (1,018 | ) | 116,899 | — | 116,899 | ||||||||||||||
Reclassifications | — | 4,867 | (2,774 | ) | — | 2,093 | (2,093 | ) | — | |||||||||||||
Foreign Currency Translation Adjustment | (561 | ) | (132,260 | ) | (11,250 | ) | (20,531 | ) | (164,602 | ) | (1,727 | ) | (166,329 | ) | ||||||||
| | | | | | | | | | | | | | | | | | | | | | | |
Balance as of December 31, 2015 | $ | 11,223,579 | $ | 943,972 | $ | 373,574 | $ | 79,275 | $ | 12,620,400 | $ | 412,350 | $ | 13,032,750 | ||||||||
| | | | | | | | | | | | | | | | | | | | | | | |
| | | | | | | | | | | | | | | | | | | | | | | |
| | | | | | | | | | | | | | | | | | | | | | | |
Goodwill acquired, net of divestitures | 292,138 | 314,463 | 15,152 | 9,624 | 631,377 | 17,206 | 648,583 | |||||||||||||||
Reclassifications | 3,163 | — | — | — | 3,163 | — | 3,163 | |||||||||||||||
Foreign Currency Translation Adjustment | (341 | ) | (20,331 | ) | (825 | ) | 5,377 | (16,120 | ) | (1,930 | ) | (18,050 | ) | |||||||||
| | | | | | | | | | | | | | | | | | | | | | | |
Balance as of December 31, 2016 | $ | 11,518,539 | $ | 1,238,104 | $ | 387,901 | $ | 94,276 | $ | 13,238,820 | $ | 427,626 | $ | 13,666,446 | ||||||||
| | | | | | | | | | | | | | | | | | | | | | | |
| | | | | | | | | | | | | | | | | | | | | | | |
| | | | | | | | | | | | | | | | | | | | | | | |
FRESENIUS MEDICAL CARE AG & Co. KGaA
NOTES TO CONSOLIDATED FINANCIAL STATEMENTS — (Continued)
(in thousands, except share and per share data)
7. Intangible Assets and Goodwill
At December 31, 2014 and 2013, the carrying value and accumulated amortization of intangible assets other than goodwill consisted of the following:
| | 2014 | 2013 | |||||||||||
|---|---|---|---|---|---|---|---|---|---|---|---|---|---|
| | Gross Carrying Amount | Accumulated Amortization | Gross Carrying Amount | Accumulated Amortization | |||||||||
Amortizable Intangible Assets | |||||||||||||
Non-compete agreements | $ | 338,443 | $ | (257,234 | ) | $ | 325,335 | $ | (240,412 | ) | |||
Technology | 113,346 | (51,225 | ) | 106,510 | (44,584 | ) | |||||||
Licenses and distribution agreements | 194,810 | (111,754 | ) | 223,701 | (112,697 | ) | |||||||
Customer Relationships | 239,694 | (12,059 | ) | 98,000 | (650 | ) | |||||||
Self-developed software | 122,944 | (59,955 | ) | 105,087 | (46,097 | ) | |||||||
Other | 355,750 | (252,619 | ) | 350,475 | (264,031 | ) | |||||||
Construction in progress | 32,653 | — | 39,570 | — | |||||||||
| | | | | | | | | | | | | | |
| $ | 1,397,640 | $ | (744,846 | ) | $ | 1,248,678 | $ | (708,471 | ) | ||||
| | | | | | | | | | | | | | |
| | | | | | | | | | | | | | |
| | | | | | | | | | | | | | |
At December 31, 2014 and 2013 the carrying value of non-amortizable intangible assets other than goodwill consisted of the following:
| | 2014 | 2013 | |||||
|---|---|---|---|---|---|---|---|
| | Carrying Amount | Carrying Amount | |||||
Non-amortizable Intangible Assets | |||||||
Tradename | $ | 209,513 | $ | 210,630 | |||
Management contracts | 7,104 | 7,039 | |||||
| | | | | | | | |
| $ | 216,617 | $ | 217,669 | ||||
| | | | | | | | |
| | | | | | | | |
| | | | | | | | |
Total Intangible Assets | $ | 869,411 | $ | 757,876 | |||
| | | | | | | | |
| | | | | | | | |
| | | | | | | | |
The amortization on intangible assets amounted to $98,483, $93,100 and $87,441 for the years ended December 31, 2014, 2013, and 2012, respectively. The table shows the estimated amortization expense of these assets for the following five years.
Estimated Amortization Expense | ||||
2015 | $ | 96,634 | ||
| | | | | |
2016 | $ | 92,633 | ||
| | | | | |
2017 | $ | 87,653 | ||
| | | | | |
2018 | $ | 84,809 | ||
| | | | | |
2019 | $ | 81,943 | ||
| | | | | |
Changes in the carrying amount of goodwill are mainly a result of acquisitions and the impact of foreign currency translations. During 2014 and 2013, the Company's acquisitions consisted primarily of the
FRESENIUS MEDICAL CARE AG & Co. KGaA
NOTES TO CONSOLIDATED FINANCIAL STATEMENTS — (Continued)(in thousands, except share data)
purchase of clinics in the normal course of operations and the expansion in Care Coordination. The changes to goodwill in 2014 and 2013 are as follows:
| | North America | International | Segment Total | Corporate | Total | |||||||||||
|---|---|---|---|---|---|---|---|---|---|---|---|---|---|---|---|---|
Balance as of December 31, 2012 | $ | 9,487,013 | $ | 1,521,359 | $ | 11,008,372 | $ | 413,517 | $ | 11,421,889 | ||||||
Goodwill acquired, net of divestitures | 158,582 | 99,634 | 258,216 | — | 258,216 | |||||||||||
Reclassifications | — | (3,807 | ) | (3,807 | ) | 4,226 | 419 | |||||||||
Foreign Currency Translation Adjustment | 52 | (23,029 | ) | (22,977 | ) | 640 | (22,337 | ) | ||||||||
| | | | | | | | | | | | | | | | | |
Balance as of December 31, 2013 | $ | 9,645,647 | $ | 1,594,157 | $ | 11,239,804 | $ | 418,383 | $ | 11,658,187 | ||||||
| | | | | | | | | | | | | | | | | |
| | | | | | | | | | | | | | | | | |
| | | | | | | | | | | | | | | | | |
Goodwill acquired, net of divestitures | 1,535,840 | 174,967 | 1,710,807 | — | 1,710,807 | |||||||||||
Reclassifications | — | — | — | — | — | |||||||||||
Foreign Currency Translation Adjustment | (533 | ) | (284,068 | ) | (284,601 | ) | (2,213 | ) | (286,814 | ) | ||||||
| | | | | | | | | | | | | | | | | |
Balance as of December 31, 2014 | $ | 11,180,954 | $ | 1,485,056 | $ | 12,666,010 | $ | 416,170 | $ | 13,082,180 | ||||||
| | | | | | | | | | | | | | | | | |
| | | | | | | | | | | | | | | | | |
| | | | | | | | | | | | | | | | | |
8. Other Assets and Notes Receivables
On August 12, 2013, FMCH made an investment-type transaction by providing a credit facility to a middle-market dialysis provider in the amount of up to $200,000 to fund general corporate purposes. The transaction is in the form of subordinated notes with a maturity date of July 4, 2020 (unless prepaid) and a payment-in-kind ("PIK") feature that will allow interest payments in the form of cash (at 10.75%) or PIK (at 11.75%). The PIK feature, if used, allows for the addition of the accrued interest to the then outstanding principal. The collateral for this loan is 100% of the equity interest in this middle-market dialysis provider. The availability period for drawdowns on this loan was 18 months and ended on February 12, 2015. The Company assesses the recoverability of this investment based on quarterly financial statements and other information obtained, used for an assessment of profitability and business plan objectives, as well as by analyzing general economic and market conditions in which the provider operates. On April 30, 2014, the Payee exercised the PIK feature and converted $10,137 of accrued interest then due to outstanding principal. On October 31, 2014, the Payee paid interest of $9,999. Consequently, at December 31, 2014, $180,137 is effectively drawn down with $3,369 of interest income accrued. Interest is payable on a semi-annual basis.
9. Accrued Expenses and Other Current Liabilities
At December 31, 20142016 and 2013,2015, accrued expenses and other current liabilities consisted of the following:
| | 2014 | 2013 | 2016 | 2015 | ||||||||||
|---|---|---|---|---|---|---|---|---|---|---|---|---|---|---|
Accrued salaries, wages and incentive plan compensations | $ | 647,627 | $ | 542,230 | $ | 743,772 | $ | 664,996 | ||||||
Unapplied cash and receivable credits | 333,858 | 302,337 | 411,495 | 395,817 | ||||||||||
Accrued settlement | 280,000 | 280,000 | ||||||||||||
Accrued self-insurance | 238,036 | 201,346 | 263,484 | 225,845 | ||||||||||
Accrued operating expenses | 139,652 | 102,914 | 190,364 | 236,286 | ||||||||||
Lease obligations | 122,402 | 105,469 | ||||||||||||
Accrued interest | 119,886 | 122,166 | 113,571 | 121,348 | ||||||||||
Withholding tax and VAT | 91,839 | 93,407 | 93,777 | 84,918 | ||||||||||
Derivative financial instruments | 53,804 | 25,701 | ||||||||||||
Accrued variable payments outstanding for acquisition | 32,984 | 18,200 | ||||||||||||
Special charge for legal matters | — | 115,000 | ||||||||||||
Accrued variable payments outstanding for acquisitions | 82,559 | 52,370 | ||||||||||||
Derivatives | 26,897 | 11,614 | ||||||||||||
Other | 539,559 | 489,232 | 324,864 | 324,474 | ||||||||||
| | | | | | | | | | | | | | | |
Total accrued expenses and other current liabilities | $ | 2,197,245 | $ | 2,012,533 | $ | 2,653,185 | $ | 2,503,137 | ||||||
| | | | | | | | | | | | | | | | |
| | | | | | | | | | | | | | | |
FRESENIUS MEDICAL CARE AG & Co. KGaA
NOTES TO CONSOLIDATED FINANCIAL STATEMENTS — (Continued)(in thousands, except share data)
In 2001, the Company recorded a $258,159 special charge to address legal matters relating to transactions pursuant to the Agreement and Plan of Reorganization dated at February 4, 1996 by and between W.R. Grace & Co. and Fresenius SE, estimated liabilities and legal expenses arising in connection with the W.R. Grace & Co. Chapter 11 proceedings (the "Grace Chapter 11 Proceedings") and the cost of resolving pending litigation and other disputes with certain commercial insurers. During the second quarter of 2003, the court supervising the Grace Chapter 11 Proceedings approved a definitive settlement whereby the Company agreed to pay $115,000. On February 3, 2014, the Company paid $115,000 which had been previously accrued. All mattersThe item "Accrued settlement" includes accruals related to theour NaturaLyte® and GranuFlo® agreement in principle, partially offset by insurance recoveries recorded charge have now been resolved.in Prepaid Expenses and Other Current Assets (see Note 4). For further information, see Note 18 "Commitments and Contingencies – Commercial Litigation".
The item "Other" in the table above includes accruals for legal and compliance costs, physician compensation,deferred income, commissions, bonuses and rebates, short-term portionposition of pension liabilities bonuses and rebates and accrued rents.physician compensation.
10. Short-Term Borrowings, Other Financial Liabilities8. Short-term Debt and Short-Term BorrowingsShort-term Debt from Related Parties
At December 31, 20142016 and December 31, 2013,2015, short-term borrowings, other financial liabilitiesdebt and short-term borrowingsdebt from related parties consisted of the following:
| | 2014 | 2013 | 2016 | 2015 | ||||||||||
|---|---|---|---|---|---|---|---|---|---|---|---|---|---|---|
Borrowings under lines of credit | $ | 132,495 | $ | 95,690 | $ | 93,829 | $ | 109,230 | ||||||
Other financial liabilities | 198 | 958 | ||||||||||||
Commercial Paper Program | 501,662 | — | ||||||||||||
Other | 7,003 | 22 | ||||||||||||
| | | | | | | | | | | | | | | |
Short-term borrowings and other financial liabilities | 132,693 | 96,648 | ||||||||||||
Short-term borrowings from related parties (see Note 3.b, excluding interest) | 5,357 | 62,342 | ||||||||||||
Short-term debt | $ | 602,494 | $ | 109,252 | ||||||||||
Short-term debt from related parties (see Note 2.b) | 3,162 | 19,052 | ||||||||||||
| | | | | | | | | | | | | | | |
Short-term borrowings, other financial liabilities and short-term borrowings from related parties | $ | 138,050 | $ | 158,990 | ||||||||||
Short-term debt and short-term debt from related parties | $ | 605,656 | $ | 128,304 | ||||||||||
| | | | | | | | | | | | | | | | |
| | | | | | | | | | | | | | | |
Borrowings Under Lines of Credit and Further Availabilities Short-term
Borrowings under lines of credit
Short-term borrowings in the amount of $132,495$93,829 and $95,690$109,230 at December 31, 20142016 and 2013,2015, respectively, represented amounts borrowed by the Company's subsidiaries under lines of credit with commercial banks. The average interest rates on these borrowings at December 31, 20142016 and 20132015 were 5.09%6.49% and 4.00%6.38%, respectively.
Excluding amounts available under the Amended 2012 Credit Agreement, (the "Amended 2012 Credit Agreement", see Note 11 below), at December 31, 20142016 and 2013,2015, the Company had $247,735$242,407 and $232,943$222,888 available under other commercial bank agreements. In some instances, lines of credit are secured by assets of the Company's subsidiary that is party to the agreement or may require the Company's guarantee. In certain circumstances, the subsidiary may be required to meet certain covenants.
FRESENIUS MEDICAL CARE AG & Co. KGaA
NOTES TO CONSOLIDATED FINANCIAL STATEMENTS — (Continued)
(in thousands, except share and per share data)
The Company and certain consolidated entities operate a multi-currency notional pooling cash management system. The Company met the conditions to offset balances within this cash pool for reporting purposes. At December 31, 2016 and 2015, cash and borrowings under lines of credit in the amount of $343,094 and $48,277 were offset under this cash management system.
Commercial Paper Program
Commercial paper programs are flexible financing instruments to obtain short-term funding on the money market. Typically, commercial paper maturities range from a few days up to under two years. The Company established a commercial paper program on January 19, 2016 under which short-term notes of up to €1,000,000 ($1,054,100) can be issued. At December 31, 2016, the outstanding commercial paper amounted to €476,000 ($501,752 at December 31, 2016).
Other
At December 31, 2016 and 2015, the Company had $7,003 and $22 of other debt which was mainly related to fixed payments outstanding for acquisitions.
Short-term BorrowingsDebt from related parties
Related Parties
The Company is party to an unsecured loan agreement with Fresenius SE under which the Company or its subsidiaries may request and receive one or more short-term advances up to an aggregate amount of $400,000 until maturity on October 30, 2017. The interest on the advance(s) will be at a fluctuating rate per annum equal to LIBOR or EURIBOR as applicable plus an applicable margin. Advances can be repaid and reborrowed. OnAt December 31, 2014,2016, there were no advances from Fresenius SE under this facility. At December 31, 2015, the Company received an advanceborrowed from Fresenius SE in the amount of €1,400€14,500 ($1,700)15,786 at an interest rate of 1.188%December 31, 2015). For further information on short-term borrowingsdebt from related party outstanding at December 31, 2014 and 2013,parties, see Note 3 b.
Table of Contents2 b).
FRESENIUS MEDICAL CARE AG & Co. KGaA
NOTES TO CONSOLIDATED FINANCIAL STATEMENTS — (Continued)(in thousands, except share data)
11.9. Long-term Debt and Capital Lease Obligations
As of December 31, 20142016 and December 31, 2013,2015, long-term debt and capital lease obligations consisted of the following:
| | 2014 | 2013 | |||||
|---|---|---|---|---|---|---|---|
Amended 2012 Credit Agreement | $ | 2,900,222 | $ | 2,707,145 | |||
Senior Notes | 5,514,947 | 4,824,753 | |||||
Equity-neutral convertible bonds | 451,653 | — | |||||
Euro Notes(1) | — | 46,545 | |||||
European Investment Bank Agreements(2) | — | 193,074 | |||||
Accounts receivable facility | 341,750 | 351,250 | |||||
Capital lease obligations | 40,991 | 24,264 | |||||
Other | 144,321 | 111,259 | |||||
| | | | | | | | |
Long-term debt and capital lease obligations | $ | 9,393,884 | $ | 8,258,290 | |||
Less current maturities | (313,607 | ) | (511,370 | ) | |||
| | | | | | | | |
Long-term debt and capital lease obligations, less current portion | $ | 9,080,277 | $ | 7,746,920 | |||
| | | | | | | | |
| | | | | | | | |
| | | | | | | | |
| | 2016 | 2015 | |||||
|---|---|---|---|---|---|---|---|
Amended 2012 Credit Agreement | $ | 2,365,522 | $ | 2,611,580 | |||
Senior Notes | 4,923,476 | 5,325,618 | |||||
Convertible Bonds | 401,333 | 407,705 | |||||
Accounts Receivable Facility | 173,965 | 50,185 | |||||
Capital lease obligations | 46,143 | 40,621 | |||||
Other | 55,504 | 82,113 | |||||
| | | | | | | | |
Long-term debt and capital lease obligations | $ | 7,965,943 | $ | 8,517,822 | |||
Less current portion | (763,398 | ) | (664,335 | ) | |||
| | | | | | | | |
Long-term debt and capital lease obligations, less current portion | $ | 7,202,545 | $ | 7,853,487 | |||
| | | | | | | | |
| | | | | | | | |
| | | | | | | | |
The Company's long-term debt as of December 31, 2014,2016, all of which ranks equally in rights of payment, are described as follows:
The Company originally entered into a syndicated credit facility of $3,850,000 and a 5 year period (the "2012 Credit Agreement") with a large group of banks and institutional investors (collectively, the "Lenders") on October 30, 2012. On November 26, 2014, the 2012 Credit Agreement was amended to increase the total credit facility to approximately $4,400,000 (approximately $3,800,000 as of December 31,
FRESENIUS MEDICAL CARE AG & Co. KGaA
NOTES TO CONSOLIDATED FINANCIAL STATEMENTS — (Continued)
(in thousands, except share and per share data)
2016 due to quarterly repayments and currency effects) and extend the term for an additional two years until October 30, 2019.
As of December 31, 2014,2016, the Amended 2012 Credit Agreement consists of:
Interest on the credit facilities is, at the Company's option, at a rate equal to either (i) LIBOR or EURIBOR (as applicable) plus an applicable margin or (ii) the Base Rate as defined in the Amended 2012 Credit Agreement plus an applicable margin. At December 31, 2014,2016 and 2015, the dollar-denominated tranches outstanding under the Amended 2012 Credit Agreement had a weighted average interest rate of 1.61%. The2.15% and 1.72%, respectively. At December 31, 2016 and 2015, the euro-denominated tranche had an interest rate of 1.42%.1.25% and 1.38%, respectively.
The applicable margin is variable and depends on the Company's Consolidated Leverage Ratio which is a ratio of its consolidated funded debt less cash and cash equivalents held by the Consolidated Group to Consolidated EBITDA (as these terms are defined in the Amended 2012 Credit Agreement).
In addition to scheduled principal payments, indebtedness outstanding under the Amended 2012 Credit Agreement would be reduced by portions of the net cash proceeds received from certain sales of assets.
FRESENIUS MEDICAL CARE AG & Co. KGaA
NOTES TO CONSOLIDATED FINANCIAL STATEMENTS — (Continued)(in thousands, except share data)
Obligations under the Amended 2012 Credit Agreement are secured by pledges of capital stock of certain material subsidiaries in favor of the Lenders.
The Amended 2012 Credit Agreement contains affirmative and negative covenants with respect to the Company and its subsidiaries. Under certain circumstances these covenants limit indebtedness, investments, and restrict the creation of liens. Under the Amended 2012 Credit Agreement the Company is required to comply with a maximum consolidated leverage ratio (ratio of consolidated funded debt less cash and cash equivalents held by the Consolidated Group to consolidated EBITDA). Additionally, the Amended 2012 Credit Agreement provides for a limitation on dividends, share buy-backs and similar payments. Dividends to be paid are subject to an annual basket, which is €360,000€440,000 ($437,076463,804 at December 31, 2014)2016) for 2015,2017, and will increase in subsequent years. Additional dividends and other restricted payments may be made subject to the maintenance of a maximum leverage ratio.
In default, the outstanding balance under the Amended 2012 Credit Agreement becomes immediately due and payable at the option of the Lenders.
The Company incurred fees of approximately $19,265 in conjunction with the Amended 2012 Credit Agreement. Unamortized fees related to the 2012 Credit Agreement of approximately $13,436, together with the newly capitalized fees of $5,829, will be amortized over the term of the Amended 2012 Credit Agreement.
The following table shows the available and outstanding amounts under the Amended 2012 Credit Agreement at December 31, 20142016 and 2013:2015:
| | Maximum Amount Available 2014 | Balance Outstanding 2014 | Maximum Amount Available 2016 | Balance Outstanding 2016(1) | ||||||||||||||||||||||
|---|---|---|---|---|---|---|---|---|---|---|---|---|---|---|---|---|---|---|---|---|---|---|---|---|---|---|
Revolving Credit USD | $ | 1,000,000 | $ | 1,000,000 | $ | 35,992 | $ | 35,992 | $ | 1,000,000 | $ | 1,000,000 | $ | 10,187 | $ | 10,187 | ||||||||||
Revolving Credit EUR | € | 400,000 | $ | 485,640 | € | — | $ | — | € | 400,000 | $ | 421,640 | € | — | $ | — | ||||||||||
USD Term Loan | $ | 2,500,000 | $ | 2,500,000 | $ | 2,500,000 | $ | 2,500,000 | $ | 2,100,000 | $ | 2,100,000 | $ | 2,100,000 | $ | 2,100,000 | ||||||||||
EUR Term Loan | € | 300,000 | $ | 364,230 | € | 300,000 | $ | 364,230 | € | 252,000 | $ | 265,633 | € | 252,000 | $ | 265,633 | ||||||||||
| | | | | | | | | | | | | | | | | | | | | | | | ||||
| $ | 4,349,870 | $ | 2,900,222 | $ | 3,787,273 | $ | 2,375,820 | |||||||||||||||||||
| | | | | | | | | | | | | | | | | | | | | | | | | |||
| | | | | | | | | | | | | | | | | | | | | | | | ||||
| | Maximum Amount Available 2013 | Balance Outstanding 2013 | |||||||||||
|---|---|---|---|---|---|---|---|---|---|---|---|---|---|
Revolving Credit USD | $ | 600,000 | $ | 600,000 | $ | 138,190 | $ | 138,190 | |||||
Revolving Credit EUR | € | 500,000 | $ | 689,550 | € | 50,000 | $ | 68,955 | |||||
USD Term Loan | $ | 2,500,000 | $ | 2,500,000 | $ | 2,500,000 | $ | 2,500,000 | |||||
| | | | | | | | | | | | | | |
| $ | 3,789,550 | $ | 2,707,145 | ||||||||||
| | | | | | | | | | | | | | |
| | | | | | | | | | | | | | |
| | | | | | | | | | | | | | |
In addition, at December 31, 2014 and December 31, 2013, the Company had letters of credit outstanding in the amount of $6,893 and $9,444, respectively, under the revolving credit facility, which are not included above as part of the balance outstanding at those dates but which reduce available borrowings under the respective revolving credit facility.
FRESENIUS MEDICAL CARE AG & Co. KGaA
NOTES TO CONSOLIDATED FINANCIAL STATEMENTS — (Continued)
(in thousands, except share and per share data)
| | Maximum Amount Available 2015 | Balance Outstanding 2015(1) | |||||||||||
|---|---|---|---|---|---|---|---|---|---|---|---|---|---|
Revolving Credit USD | $ | 1,000,000 | $ | 1,000,000 | $ | 25,110 | $ | 25,110 | |||||
Revolving Credit EUR | € | 400,000 | $ | 435,480 | € | — | $ | — | |||||
USD Term Loan | $ | 2,300,000 | $ | 2,300,000 | $ | 2,300,000 | $ | 2,300,000 | |||||
EUR Term Loan | € | 276,000 | $ | 300,481 | € | 276,000 | $ | 300,481 | |||||
| | | | | | | | | | | | | | |
| $ | 4,035,961 | $ | 2,625,591 | ||||||||||
| | | | | | | | | | | | | | |
| | | | | | | | | | | | | | |
| | | | | | | | | | | | | | |
At December 31, 2016 and 2015, the Company had letters of credit outstanding in the amount of $3,550 and $3,600, respectively, under the USD revolving credit facility, which are not included above as part of the balance outstanding at those dates but which reduce available borrowings under the applicable revolving credit facility.
At December 31, 2014,2016 and 2015, the Company's Senior Notes consisted of the following:
Issuer/Transaction | Face Amount | Maturity | Coupon | Book value 2014 | Book value 2013 | Face Amount | Maturity | Coupon | Book Value 2016 | Book Value 2015 | ||||||||||||||||||||
|---|---|---|---|---|---|---|---|---|---|---|---|---|---|---|---|---|---|---|---|---|---|---|---|---|---|---|---|---|---|---|
FMC Finance VI S.A. 2010 | € | 250,000 | July 15, 2016 | 5.50 | % | $ | 302,537 | $ | 342,944 | € | 250,000 | July 15, 2016 | 5.50 | % | $ | — | $ | 271,409 | ||||||||||||
FMC Finance VIII S.A. 2011(1) | € | 100,000 | October 15, 2016 | 3.58 | % | $ | 121,410 | $ | 137,910 | € | 100,000 | October 15, 2016 | 3.21 | % | $ | — | $ | 108,735 | ||||||||||||
FMC US Finance, Inc. 2007 | $ | 500,000 | July 15, 2017 | 67/8 | % | $ | 497,781 | $ | 496,894 | $ | 500,000 | July 15, 2017 | 67/8 | % | $ | 499,098 | $ | 497,363 | ||||||||||||
FMC Finance VIII S.A. 2011 | € | 400,000 | September 15, 2018 | 6.50 | % | $ | 482,097 | $ | 546,531 | € | 400,000 | September 15, 2018 | 6.50 | % | $ | 418,665 | $ | 430,600 | ||||||||||||
FMC US Finance II, Inc. 2011 | $ | 400,000 | September 15, 2018 | 6.50 | % | $ | 397,084 | $ | 396,297 | $ | 400,000 | September 15, 2018 | 6.50 | % | $ | 397,275 | $ | 395,678 | ||||||||||||
FMC US Finance II, Inc. 2012 | $ | 800,000 | July 31, 2019 | 5.625 | % | $ | 800,000 | $ | 800,000 | $ | 800,000 | July 31, 2019 | 5.625 | % | $ | 797,560 | $ | 796,505 | ||||||||||||
FMC Finance VIII S.A. 2012 | € | 250,000 | July 31, 2019 | 5.25 | % | $ | 303,525 | $ | 344,775 | € | 250,000 | July 31, 2019 | 5.25 | % | $ | 262,464 | $ | 270,655 | ||||||||||||
FMC US Finance II, Inc. 2014 | $ | 500,000 | October 15, 2020 | 4.125 | % | $ | 500,000 | $ | — | $ | 500,000 | October 15, 2020 | 4.125 | % | $ | 496,798 | $ | 495,944 | ||||||||||||
FMC US Finance, Inc. 2011 | $ | 650,000 | February 15, 2021 | 5.75 | % | $ | 646,283 | $ | 645,672 | $ | 650,000 | February 15, 2021 | 5.75 | % | $ | 643,708 | $ | 642,167 | ||||||||||||
FMC Finance VII S.A. 2011 | € | 300,000 | February 15, 2021 | 5.25 | % | $ | 364,230 | $ | 413,730 | € | 300,000 | February 15, 2021 | 5.25 | % | $ | 314,235 | $ | 324,045 | ||||||||||||
FMC US Finance II, Inc. 2012 | $ | 700,000 | January 31, 2022 | 5.875 | % | $ | 700,000 | $ | 700,000 | $ | 700,000 | January 31, 2022 | 5.875 | % | $ | 696,834 | $ | 696,086 | ||||||||||||
FMC US Finance II, Inc. 2014 | $ | 400,000 | October 15, 2024 | 4.75 | % | $ | 400,000 | $ | — | $ | 400,000 | October 15, 2024 | 4.75 | % | $ | 396,839 | $ | 396,431 | ||||||||||||
| | | | | | | | | | | | | | | | | | | | | | | | ||||||||
| $ | 5,514,947 | $ | 4,824,753 | $ | 4,923,476 | $ | 5,325,618 | |||||||||||||||||||||||
| | | | | | | | | | | | | | | | | | | | | | | | ||||||||
| | | | | | | | | | | | | | | | ��� | | | | ||||||||||||
| | | | | | | | | | | | | | | | | | | | | | | | ||||||||
In October 2014, FMC US Finance II, Inc. issued $500,000 and $400,000 dollar-denominated senior notes ("the 2014 Senior Notes"), the proceeds of which were used to repay Term Loan A-2 under our 2012 Credit Agreement, which was established on July 1, 2014 to finance the investment in Sound and fully repaid on October 29, 2014, as well as other short term debt, and for acquisitions and general corporate purposes. The 2014 Senior Notes were issued at par.
All Senior Notes are unsecured and guaranteed on a senior basis jointly and severally by the Company and by FMCH and Fresenius Medical Care Deutschland GmbH ("D-GmbH"), (together with FMCH, the "Guarantor Subsidiaries"). The issuers may redeem the Senior Notes (except for the Floating Rate Senior Notes) at any time at 100% of principal plus accrued interest and a premium calculated pursuant to the terms of the indenture. The holders have the right to request that the issuers repurchase the Senior Notes at 101% of principal plus accrued interest upon the occurrence of a change of control of the Company followed by a decline in the ratings of the respective Senior Notes.
The Company has agreed to a number of covenants to provide protection to the holders which, under certain circumstances, limit the ability of the Company and its subsidiaries to, among other things, incur debt, incur liens, engage in sale-leaseback transactions and merge or consolidate with other companies or sell assets. At December 31, 2014,2016, the Company was in compliance with all of its covenants under the Senior Notes.
Equity-neutral
FRESENIUS MEDICAL CARE AG & Co. KGaA
NOTES TO CONSOLIDATED FINANCIAL STATEMENTS — (Continued)
(in thousands, except share and per share data)
Convertible Bonds
On September 19, 2014, the Company issued €400,000 ($514,080)514,080 at issuance) principal amount of equity-neutral convertible bonds (the "Convertible Bonds") which have a coupon of 1.125% and are due on January 31, 2020. The bonds were issued at par with the initialpar. The current conversion price based upon the predetermined share price of €73.6448.is €73.6054. Beginning November 2017, bond holders can exercise the conversion rights embedded in the bonds at certain dates. In order to fully offset the economic exposure from the conversion feature, the Company purchased call options on its shares ("Share Options"). Any increase of the Company's share price above the conversion price would be offset by a corresponding value increase of the Share Options. The Company will amortize the remaining cost of these options €29,600 ($38,042 at December 31, 2014), and various other offering costs over the life of these bonds in the bonds,amount of €19,265 ($20,307 at December 31, 2016), effectively increasing the total interest rate to 2.611%. We used the net proceeds of $470,976 for general corporate purposes. The Convertible Bonds are jointly and severally guaranteed by FMCH and D-GmbH.
FRESENIUS MEDICAL CARE AG & Co. KGaA
NOTES TO CONSOLIDATED FINANCIAL STATEMENTS — (Continued)(in thousands, except share data)
The Company refinanced the A/RAccounts Receivable Facility on November 24, 2014December 6, 2016 for a term expiring on November 24, 2017December 6, 2019 with the available borrowings atof $800,000.
The following table shows the available and outstanding amounts under the A/RAccounts Receivable Facility at December 31, 20142016 and December 31, 2013.2015.
| | Maximum Amount Available(1) | Balance Outstanding | |||||||||||
|---|---|---|---|---|---|---|---|---|---|---|---|---|---|
| | 2014 | 2013 | 2014 | 2013 | |||||||||
A/R Facility | $ | 800,000 | $ | 800,000 | $ | 341,750 | $ | 351,250 | |||||
| | Maximum Amount Available(1) | Balance Outstanding(2) | |||||||||||
|---|---|---|---|---|---|---|---|---|---|---|---|---|---|
| | 2016 | 2015 | 2016 | 2015 | |||||||||
Accounts Receivable Facility | $ | 800,000 | $ | 800,000 | $ | 175,000 | $ | 51,000 | |||||
The Company also had letters of credit outstanding under the A/RAccounts Receivable Facility in the amount of $66,622$15,647 at December 31, 20142016 and $65,622$16,622 at December 31, 2013.2015. These letters of credit wereare not included above as part of the balance outstanding at December 31, 2014;2016 and 2015; however, they reduce available borrowings under the A/RAccounts Receivable Facility.
Under the A/RAccounts Receivable Facility, certain receivables are sold to NMC Funding Corporation ("NMC Funding"), a wholly-owned subsidiary. NMC Funding then assigns percentage ownership interests in the accounts receivable to certain bank investors. Under the terms of the A/RAccounts Receivable Facility, NMC Funding retains the right, at any time, to recall all the then outstanding transferred interests in the accounts receivable. Consequently, the receivables remain on the Company's Consolidated Balance Sheet and the proceeds from the transfer of percentage ownership interests are recorded as long-term debt.
NMC Funding pays interest to the bank investors calculated based on the commercial paper rates for the particular tranches selected. The averageAt December 31, 2016 and 2015, the interest rate during 2014 was 1.052%.1.00% and 0.89%, respectively. Refinancing fees, which include legal costs and bank fees, are amortized over the term of the facility.
At December 31, 20142016 and 2013,2015, in conjunction with certain acquisitions and investments, the Company had pendingfixed payments of purchase considerationsoutstanding for acquisitions totaling approximately $34,973$25,895 and $94,084,$4,115, respectively, of which $31,369$16,073 and $60,036,$2,597, respectively, were classified as the current portion of long-term debt.
Aggregate annual payments applicable to the Amended 2012 Credit Agreement, Senior Notes, the Convertible Bonds, the A/R Facility, capital leases and other borrowings for the five years subsequent to December 31, 2014 and thereafter are:
2015 | $ | 313,607 | ||
2016 | 701,714 | |||
2017 | 1,099,976 | |||
2018 | 1,120,753 | |||
2019 | 3,089,452 | |||
Thereafter | 3,116,570 | |||
| | | | | |
| $ | 9,442,072 | |||
| | | | | |
| | | | | |
| | | | | |
FRESENIUS MEDICAL CARE AG & Co. KGaA
NOTES TO CONSOLIDATED FINANCIAL STATEMENTS — (Continued)
(in thousands, except share and per share data)
12.Annual Payments
Aggregate annual payments applicable to the Amended 2012 Credit Agreement, Senior Notes, the Convertible Bonds, the Accounts Receivable Facility, capital leases and other borrowings for the five years subsequent to December 31, 2016 and thereafter are:
2017 | $ | 764,300 | ||
2018 | 1,064,456 | |||
2019 | 3,178,459 | |||
2020 | 930,017 | |||
2021 | 972,874 | |||
Thereafter | 1,115,424 | |||
| | | | | |
| $ | 8,025,530 | |||
| | | | | |
| | | | | |
| | | | | |
10. Employee Benefit Plans
General
FMC-AG & Co. KGaA recognizes pension costs and related pension liabilities for current and future benefits to qualified current and former employees of the Company. The Company's pension plans are structured in accordance with the differing legal, economic and fiscal circumstances in each country. The Company currently has two types of plans, defined benefit and defined contribution plans. In general, plan benefits in defined benefit plans are based on all or a portion of the employees' years of services and final salary. Plan benefits in defined contribution plans are determined by the amount of contribution by the employee and the employer, both of which may be limited by legislation, and the returns earned on the investment of those contributions.
Upon retirement under defined benefit plans, the Company is required to pay defined benefits to former employees when the defined benefits become due. Defined benefit plans may be funded or unfunded. The Company has twofive major defined benefit plans, one funded plan in the U.S. and anone in France as well as one unfunded plan in Germany.Germany and two in France.
Starting 2016, the defined benefit plans in France were transferred from "Benefit plans offered by other subsidiaries" to the detailed reconciliations of the funded status and the plan assets, retrospectively for 2015. The adjustment of the benefit obligation at the beginning of 2015 has been implemented through the position "Other adjustments."
Actuarial assumptions generally determine benefit obligations under defined benefit plans. The actuarial calculations require the use of estimates. The main factors used in the actuarial calculations affecting the level of the benefit obligations are: assumptions on life expectancy, the discount rate and future salary and benefit levels. Under the Company's funded plans, assets are set aside to meet future payment obligations. An estimated return on the plan assets is recognized as income in the respective period. Actuarial gains and losses are generated when there are variations in the actuarial assumptions and by differences between the actual and the estimated projected benefits obligations and the return on plan assets for that year. The Company's pension liability is impacted by these actuarial gains or losses.
Under defined contribution plans, the Company pays defined contributions to an independent third party as directed by the employee during the employee's service life, which satisfies all obligations of the Company to the employee. The employee retains all rights to the contributions made by the employee and to the vested portion of the Company paid contributions upon leaving the Company. The Company has a defined contribution plan in the U.S.
Defined Benefit Pension Plans
During the first quarter of 2002 FMCH, the Company's U.S. subsidiary, curtailed its defined benefit and supplemental executive retirement plans. Under the curtailment amendment for substantially all
FRESENIUS MEDICAL CARE AG & Co. KGaA
NOTES TO CONSOLIDATED FINANCIAL STATEMENTS — (Continued)
(in thousands, except share and per share data)
employees eligible to participate in the plan, benefits have been frozen as of the curtailment date and no additional defined benefits for future services will be earned. The Company has retained all employee benefit obligations as of the curtailment date. Each year FMCH contributes to the plan covering United States employees at least the minimum amount required by the Employee Retirement Income Security Act of 1974, as amended. In 2014,2016, FMCH's minimum funding requirement was $21,000.$9,600. In addition to the compulsory contributions, the Company voluntarily provided $21,365$100,965 to the defined benefit plan.plan of which $100,000 was contributed in the third quarter of 2016. Expected funding for 20152017 is $20,370.$1,180.
The benefit obligation for all defined benefit plans at December 31, 2014,2016, was $877,722 (2013: $660,860)$855,861 (2015: $822,626) which consists of the gross benefit obligation of $494,269 (2013: $378,170)$438,235 (2015: $477,667) for the U.S. plan and of $4,231 (2015: $4,063) for the French plan, which isare funded by plan assets, and the benefit obligation of $383,453 (2013: $282,690)$404,779 (2015: $333,320) for the German unfunded plan.
FRESENIUS MEDICAL CARE AG & Co. KGaA
NOTES TO CONSOLIDATED FINANCIAL STATEMENTS — (Continued)(in thousands, except share data)plan and $8,616 (2015: $7,576) for the two French unfunded plans.
The following table shows the changes in benefit obligations, the changes in plan assets, the funded status of the pension plans and the net pension liability. Benefits paid as shown in the changes in benefit obligations represent payments made from both the funded and unfunded plans while the benefits paid as shown in the changes in plan assets include only benefit payments from the Company's funded benefit plan.
| | 2014 | 2013 | 2016 | 2015 | ||||||||||
|---|---|---|---|---|---|---|---|---|---|---|---|---|---|---|
Change in benefit obligation: | ||||||||||||||
Benefit obligation at beginning of year | $ | 660,860 | $ | 655,447 | $ | 822,626 | $ | 877,722 | ||||||
Foreign currency translation | (46,505 | ) | 11,998 | (15,151 | ) | (40,646 | ) | |||||||
Other Adjustments | — | 2,203 | — | 11,772 | ||||||||||
Service cost | 18,617 | 15,900 | 25,335 | 25,825 | ||||||||||
Interest cost | 29,513 | 26,859 | 29,330 | 28,016 | ||||||||||
Amendments | — | (410 | ) | |||||||||||
Transfer of plan participants | 220 | (32 | ) | 31 | (102 | ) | ||||||||
Actuarial (gain) loss | 234,199 | (34,698 | ) | 36,757 | (56,250 | ) | ||||||||
Benefits paid | (19,182 | ) | (16,817 | ) | (34,008 | ) | (23,163 | ) | ||||||
Curtailments and settlements | (9,059 | ) | (138 | ) | ||||||||||
| | | | | | | | | | | | | | | |
Benefit obligation at end of year | $ | 877,722 | $ | 660,860 | ||||||||||
| $ | 855,861 | $ | 822,626 | |||||||||||
| | | | | | | | | | | | | | | | |
| | | | | | | | | | | | | | | |
Change in plan assets: | ||||||||||||||
Fair value of plan assets at beginning of year | $ | 248,495 | $ | 228,393 | $ | 260,260 | $ | 270,858 | ||||||
Foreign currency translation | (3 | ) | — | |||||||||||
Other Adjustments | — | 102 | ||||||||||||
Actual return on plan assets | (3,600 | ) | 23,058 | 13,225 | (11,158 | ) | ||||||||
Employer contributions | 42,365 | 11,339 | 110,565 | 20,098 | ||||||||||
Benefits paid | (16,402 | ) | (14,295 | ) | (30,707 | ) | (19,640 | ) | ||||||
Settlements | (9,005 | ) | — | |||||||||||
| | | | | | | | | | | | | | | |
Fair value of plan assets at end of year | $ | 270,858 | $ | 248,495 | 344,335 | 260,260 | ||||||||
| | | | | | | | | | | | | | | | |
| | | | | | | | | | | | | | | |
Funded status at end of year | $ | 606,864 | $ | 412,365 | $ | 511,526 | $ | 562,366 | ||||||
| | | | | | | | | | | | | | | | |
| | | | | | | | | | | | | | | |
Benefit plans offered by other subsidiaries | $ | 41,990 | $ | 29,321 | $ | 35,550 | $ | 30,059 | ||||||
| | | | | | | | | | | | | | | | |
| | | | | | | | | | | | | | | |
Net Pension Liability | $ | 648,854 | $ | 441,686 | $ | 547,076 | $ | 592,425 | ||||||
| | | | | | | | | | | | | | | | |
| | | | | | | | | | | | | | | |
Benefit plans offered by the U.S., Germany and GermanyFrance contain a pension liability of $606,864$511,526 and $412,365$562,366 at December 31, 20142016 and 2013,2015, respectively. The pension liability consists of a current portion of $4,151 (2013: $4,221)$4,726 (2015: $4,393) which is recognized as a current liability in the line item "Accrued expenses and other current liabilities" in the balance sheet. The non-current portion of $602,713 (2013: $408,144)$506,800 (2015: $557,973) is recorded
FRESENIUS MEDICAL CARE AG & Co. KGaA
NOTES TO CONSOLIDATED FINANCIAL STATEMENTS — (Continued)
(in thousands, except share and per share data)
as non-current pension liability in the balance sheet. Approximately 80%74% of the beneficiaries are located in the U.S. and 6% in France with the majority of the remaining 20% located in Germany.
The accumulated benefit obligation for all defined benefit pension plans with an obligation in excess of plan assets was $811,359$780,820 and $614,576$759,171 at December 31, 20142016 and 2013,2015, respectively; the related plan assets had a fair value of $270,858$344,335 and $248,495$260,260 at December 31, 20142016 and 2013,2015, respectively.
Benefit plans offered by other subsidiaries outside of the U.S., Germany and GermanyFrance contain separate benefit obligations. The total net pension liability for these other plans was $41,990$35,550 and $29,321$30,059 at December 31, 20142016 and 20132015 respectively and consists of a pension asset of $68 (2013: $77)$0 (2015: $61) recognized as "Other non-current assets and notes receivables" and a current pension liability of $2,453 (2013: $1,684)$2,083 (2015: $2,765), which is recognized as a current liability in the line item "Accrued expenses and other current liabilities". The non-current pension liability of $39,605 (2013: $27,714)$33,467 (2015: $27,355) for these plans is recorded as "non-current pension liability" in the balance sheet.
At December 31, 20142016 the weighted average duration of the defined benefit obligation was 1819 years (2013:(2015: 18 years).
The table below reflects pre-tax effects of actuarial losses (gains) in other comprehensive income ("OCI") relating to pension liabilities. At December 31, 2016, there are no cumulative effects of prior service costs included in other comprehensive income.
| | Actuarial (gains) losses | |||
|---|---|---|---|---|
Actuarial (gains) losses recognized in OCI at December 31, 2013 | $ | 222,967 | ||
Actuarial (gain) loss for the year | 253,969 | |||
Prior Service Costs (Credit) | (17,147 | ) | ||
Amortization of unrealized losses | (21,661 | ) | ||
| | | | | |
Actuarial (gains) losses recognized in OCI at December 31, 2014 | $ | 438,128 | ||
| | | | | |
| | | | | |
| | | | | |
Actuarial (gain) loss for the year | (28,687 | ) | ||
Other Adjustments | 1,167 | |||
Prior Service Costs (Credit) | (503 | ) | ||
Amortization of unrealized losses | (34,625 | ) | ||
Foreign currency translation | (19,186 | ) | ||
| | | | | |
Actuarial (gains) losses recognized in OCI at December 31, 2015 | $ | 356,294 | ||
| | | | | |
| | | | | |
| | | | | |
Actuarial (gain) loss for the year | 39,014 | |||
Prior Service Costs (Credit) | 55 | |||
Amortization of unrealized losses | (30,811 | ) | ||
Foreign currency translation | (6,794 | ) | ||
| | | | | |
Actuarial (gains) losses recognized in OCI at December 31, 2016 | $ | 357,758 | ||
| | | | | |
| | | | | |
| | | | | |
The actuarial loss expected to be amortized from other comprehensive income into net periodic pension cost over the next year is $29,288.
The discount rates for all plans are based upon yields of portfolios of highly rated debt instruments with maturities that mirror the plan's benefit obligation. The Company's discount rates at December 31, 2016 and at December 31, 2015 are the weighted average of these plans based upon their benefit obligations.
The following weighted-average assumptions were utilized in determining benefit obligations at December 31:
in % | 2016 | 2015 | |||||
|---|---|---|---|---|---|---|---|
Discount rate | 3.25 | 3.67 | |||||
Rate of compensation increase | 3.23 | 3.27 | |||||
FRESENIUS MEDICAL CARE AG & Co. KGaA
NOTES TO CONSOLIDATED FINANCIAL STATEMENTS — (Continued)
(in thousands, except share and per share data)
The table below reflects pre-tax effects of actuarial losses (gains) in other comprehensive income ("OCI") relating to pension liabilities. At December 31, 2014, there are no cumulative effects of prior service costs included in other comprehensive income.
| | Actuarial (gains) losses | |||
|---|---|---|---|---|
Actuarial (gains) losses recognized in OCI at December 31, 2011 | $ | 184,778 | ||
Actuarial (gain) loss for the year | 119,685 | |||
Amortization of unrealized losses | (18,334 | ) | ||
Foreign currency translation | 1,827 | |||
| | | | | |
Actuarial (gains) losses recognized in OCI at December 31, 2012 | $ | 287,956 | ||
| | | | | |
| | | | | |
| | | | | |
Actuarial (gain) loss for the year | $ | (44,118 | ) | |
Other Adjustments | 563 | |||
Amortization of unrealized losses | (25,418 | ) | ||
Foreign currency translation | 3,984 | |||
| | | | | |
Actuarial (gains) losses recognized in OCI at December 31, 2013 | $ | 222,967 | ||
| | | | | |
| | | | | |
| | | | | |
Actuarial (gain) loss for the year | 253,969 | |||
Other Adjustments | — | |||
Amortization of unrealized losses | (17,147 | ) | ||
Foreign currency translation | (21,661 | ) | ||
| | | | | |
Actuarial (gains) losses recognized in OCI at December 31, 2014 | $ | 438,128 | ||
| | | | | |
| | | | | |
| | | | | |
The actuarial loss expected to be amortized from other comprehensive income into net periodic pension cost over the next year is $37,869.
The discount rates for all plans are based upon yields of portfolios of equity and highly rated debt instruments with maturities that mirror the plan's benefit obligation. The Company's discount rates at December 31, 2014 and at December 31, 2013 are the weighted average of these plans based upon their benefit obligations. The following weighted-average assumptions were utilized in determining benefit obligations at December 31:
in % | 2014 | 2013 | |||||
|---|---|---|---|---|---|---|---|
Discount rate | 3.23 | 4.55 | |||||
Rate of compensation increase | 3.28 | 3.29 | |||||
Sensitivity analysisAnalysis
Increases and decreases in principal actuarial assumptions by 0.5 percentage points would affect the pension liability at December 31, 20142016 as follows:
| | 0.5% increase | 0.5% decrease | 0.5% increase | 0.5% decrease | ||||||||||
|---|---|---|---|---|---|---|---|---|---|---|---|---|---|---|
Discount rate | $ | (76,765 | ) | $ | 88,257 | $ | (75,036 | ) | 86,517 | |||||
Rate of compensation increase | 10,266 | (10,164 | ) | 12,286 | (12,095 | ) | ||||||||
Rate of pensions increase | 28,010 | (25,325 | ) | 31,285 | (28,276 | ) | ||||||||
The sensitivity analysis was calculated based on the average duration of the pension obligations determined at December 31, 2014.2016. The calculations were performed isolated for each significant actuarial parameter, in order to show the effect on the fair value of the pension liability separately.
The sensitivity analysis for compensation increases and for pension increases excludes the U.S. pension plan because it is frozen and therefore is not affected by changes from these two actuarial assumptions.
FRESENIUS MEDICAL CARE AG & Co. KGaA
NOTES TO CONSOLIDATED FINANCIAL STATEMENTS — (Continued)(in thousands, except share data)
The defined benefit pension plans' net periodic benefit costs are comprised of the following components for each of the years ended December 31:
| | 2014 | 2013 | 2012 | 2016 | 2015 | 2014 | ||||||||||||||
|---|---|---|---|---|---|---|---|---|---|---|---|---|---|---|---|---|---|---|---|---|
Components of net periodic benefit cost: | ||||||||||||||||||||
Service cost | $ | 18,617 | $ | 15,900 | $ | 10,704 | $ | 25,335 | $ | 25,825 | $ | 18,617 | ||||||||
Interest cost | 29,513 | 26,859 | 26,194 | 29,330 | 28,016 | 29,513 | ||||||||||||||
Expected return on plan assets | (16,169 | ) | (13,638 | ) | (15,241 | ) | (15,482 | ) | (16,405 | ) | (16,169 | ) | ||||||||
Amortization of unrealized losses | 17,147 | 25,418 | 18,334 | 30,811 | 34,625 | 17,147 | ||||||||||||||
Amortization of prior service cost (credit) | (55 | ) | 94 | — | ||||||||||||||||
Settlement loss (gain) | (54 | ) | (138 | ) | — | |||||||||||||||
| | | | | | | | | | | | | | | | | | | | | |
Net periodic benefit costs | $ | 49,108 | $ | 54,539 | $ | 39,991 | $ | 69,885 | $ | 72,017 | $ | 49,108 | ||||||||
| | | | | | | | | | | | | | | | | | | | | | |
| | | | | | | | | | | | | | | | | | | | | |
Net periodic benefit cost is allocated as personnel expense within costs of revenues, selling, general and administrative expense or research and development expense. This is depending upon the area in which the beneficiary is employed.
The following weighted-average assumptions were used in determining net periodic benefit cost for the year ended December 31:
in % | 2014 | 2013 | 2012 | 2016 | 2015 | 2014 | ||||||||||||||
|---|---|---|---|---|---|---|---|---|---|---|---|---|---|---|---|---|---|---|---|---|
Discount rate | 4.55 | 4.14 | 5.10 | 3.67 | 3.21 | 4.55 | ||||||||||||||
Expected return of plan assets | 6.00 | 6.00 | 7.00 | 6.00 | 6.00 | 6.00 | ||||||||||||||
Rate of compensation increase | 3.29 | 3.32 | 3.69 | 3.27 | 3.26 | 3.29 | ||||||||||||||
Expected benefit payments for the next five years and in the aggregate for the five years thereafter are as follows:
2015 | $ | 19,752 | ||||||
2016 | 21,633 | |||||||
2017 | 23,461 | $ | 23,145 | |||||
2018 | 25,154 | 24,496 | ||||||
2019 | 27,271 | 26,411 | ||||||
2020 - 2024 | 170,331 | |||||||
2020 | 28,617 | |||||||
2021 | 30,635 | |||||||
2022 - 2026 | 182,971 | |||||||
FRESENIUS MEDICAL CARE AG & Co. KGaA
NOTES TO CONSOLIDATED FINANCIAL STATEMENTS — (Continued)
(in thousands, except share and per share data)
Plan Assets
The following table presents the fair values of the Company'sCompany´s pension plan assets at December 31, 20142016 and 2013.2015.
| | | Fair Value Measurements at 2014 | | Fair Value Measurements at 2013 | | Fair Value Measurements at 2016 | | Fair Value Measurements at 2015 | ||||||||||||||||||||||||||||||
|---|---|---|---|---|---|---|---|---|---|---|---|---|---|---|---|---|---|---|---|---|---|---|---|---|---|---|---|---|---|---|---|---|---|---|---|---|---|---|
| | | Quoted Prices in Active Markets for Identical Assets | Significant Observable Inputs | | Quoted Prices in Active Markets for Identical Assets | Significant Observable Inputs | | Quoted Prices in Active Markets for Identical Assets | Significant Observable Inputs | | Quoted Prices in Active Markets for Identical Assets | Significant Observable Inputs | ||||||||||||||||||||||||||
| | Total | (Level 1) | (Level 2) | Total | (Level 1) | (Level 2) | Total | (Level 1) | (Level 2) | Total | (Level 1) | (Level 2) | ||||||||||||||||||||||||||
Asset Category | ||||||||||||||||||||||||||||||||||||||
Equity Investments | ||||||||||||||||||||||||||||||||||||||
Index Funds(1) | $ | 69,485 | $ | (310 | ) | $ | 69,795 | $ | 62,003 | $ | 205 | $ | 61,798 | $ | 85,448 | $ | (2,102 | ) | $ | 87,550 | $ | 64,828 | $ | 98 | $ | 64,730 | ||||||||||||
Fixed Income Investments | ||||||||||||||||||||||||||||||||||||||
Government Securities(2) | 1,629 | 850 | 779 | 4,913 | 3,735 | 1,178 | 2,502 | 1,902 | 600 | 4,815 | 4,269 | 546 | ||||||||||||||||||||||||||
Corporate Bonds(3) | 181,132 | — | 181,132 | 155,389 | — | 155,389 | 220,318 | — | 220,318 | 169,717 | — | 169,717 | ||||||||||||||||||||||||||
Other Bonds(4) | 4,573 | — | 4,573 | 1,437 | — | 1,437 | 5,628 | — | 5,628 | 7,794 | — | 7,794 | ||||||||||||||||||||||||||
U.S. Treasury Money Market Funds(5) | 7,989 | 7,989 | — | 19,150 | 19,150 | — | 30,337 | 30,337 | — | 13,003 | 13,003 | — | ||||||||||||||||||||||||||
Other types of investments | ||||||||||||||||||||||||||||||||||||||
Cash, Money Market and Mutual Funds(6) | 6,050 | 6,050 | — | 5,603 | 5,603 | — | 102 | 102 | — | 103 | 103 | — | ||||||||||||||||||||||||||
| | | | | | | | | | | | | | | | | | | | | | | | | | | | | | | | | | | | | | | |
Total | $ | 270,858 | $ | 14,579 | $ | 256,279 | $ | 248,495 | $ | 28,693 | $ | 219,802 | $ | 344,335 | $ | 30,239 | $ | 314,096 | $ | 260,260 | $ | 17,473 | $ | 242,787 | ||||||||||||||
| | | | | | | | | | | | | | | | | | | | | | | | | | | | | | | | | | | | | | | | |
| | | | | | | | | | | | | | | | | | | | | | | | | | | | | | | | | | | | | | | |
The methods and inputs used to measure the fair value of plan assets are as follows:
Plan Investment Policy and Strategy in the U.S.
For the U.S. funded plan, theThe Company periodically reviews the assumption for long-term expected return on pension plan assets. As part of the assumptions review, a range of reasonable expected investment returns for the pension plan as a whole was determined based on an analysis of expected future returns for each asset class
FRESENIUS MEDICAL CARE AG & Co. KGaA
NOTES TO CONSOLIDATED FINANCIAL STATEMENTS — (Continued)
(in thousands, except share and per share data)
returns for each asset class weighted by the allocation of the assets. The range of returns developed relies both on forecasts, which include the actuarial firm's expected long-term rates of return for each significant asset class or economic indicator, and on broad-market historical benchmarks for expected return, correlation, and volatility for each asset class. As a result, the Company's expected rate of return on pension plan assets was 6.00%6% for 2014.2016.
The Company'sCompany´s overall investment strategy is to achieve a mix of approximately 98% of investments for long-term growth and income and 2% in cash or cash equivalents. Investment income and cash or cash equivalents are used for near-term benefit payments. Investments are governed by the investment policy and include well diversified index funds or funds targeting index performance.
The investment policy, utilizing a revised target investment allocation in a range around 30% equity and 70% long-term U.S. corporate bonds, considers that there will be a time horizon for invested funds of more than 5 years. The total portfolio will be measured against a custom index that reflects the asset class benchmarks and the target asset allocation. The Plan policy does not allow investments in securities of the Company or other related party securities. The performance benchmarks for the separate asset classes include: S&P 500 Index, S&P 400 Mid-Cap Index, Russell 2000 Index, MSCI EAFE Index, MSCI Emerging Markets Index and Barclays Capital Long-Corporate Bond Index.
Defined Contribution Plans
Most FMCH employees are eligible to join a 401(k) savings plan. Employees can deposit up to 75% of their pay up to a maximum of $17.5$18 if under 50 years old ($2324 if 50 or over) under this savings plan. The Company will match 50% of the employee deposit up to a maximum Company contribution of 3% of the employee's pay. The Company's total expense under this defined contribution plan for the years ended December 31, 2016, 2015, and 2014, 2013,was $48,458, $46,267 and 2012, was $41,560, $38,999 and $38,582, respectively.
13.11. Noncontrolling Interests Subject to Put Provisions and Other Temporary Equity
The Company has potential obligations to purchase the noncontrolling interests held by third parties in certain of its consolidated subsidiaries. These obligations are in the form of put provisions and are exercisable at the third-party owners' discretion within specified periods as outlined in each specific put provision. If these put provisions were exercised, the Company would be required to purchase all or part of third-party owners' noncontrolling interests at the appraised fair value at the time of exercise. The methodology the Company uses to estimate the fair values of the noncontrolling interest subject to put provisions assumes the greater of net book value or a multiple of earnings, based on historical earnings, development stage of the underlying business and other factors. Additionally, there are put provisions that are valued by an external valuation firm. The external valuation estimates the fair values using a combination of discounted cash flows and a multiple of earnings and/or revenue. The estimated fair values of the noncontrolling interests subject to these put provisions can also fluctuate, the discounted cash flows and the implicit multiple of earnings and/or revenue at which these noncontrolling interest obligations may ultimately be settled could vary significantly from our current estimates depending upon market conditions.
At December 31, 20142016, 2015 and 20132014, the Company's potential obligations under these put options were $824,658$1,234,888, $1,023,755 and $648,251,$824,658, respectively. At December 31, 20142016, 2015 and 2013,2014, put options with an aggregate purchase obligation of $123,846$303,913, $258,552 and $119,148,$123,846, respectively, were exercisable. In the last three fiscal years ending December 31, 2014, six2016, eleven such put provisions have been exercised for a total consideration of $16,439.$10,465.
The following is a roll forward of noncontrolling interests subject to put provisions for the years ended December 31, 2014, 2013 and 2012:
| | 2014 | 2013 | 2012 | |||||||
|---|---|---|---|---|---|---|---|---|---|---|
Beginning balance as of January 1, | $ | 648,251 | $ | 523,260 | $ | 410,491 | ||||
Contributions to noncontrolling interests | (142,696 | ) | (122,179 | ) | (114,536 | ) | ||||
Purchase/ sale of noncontrolling interests | 83,252 | 6,723 | 134,643 | |||||||
Contributions from noncontrolling interests | 16,064 | 17,767 | 16,565 | |||||||
Changes in fair value of noncontrolling interests | 89,767 | 108,575 | (18,880 | ) | ||||||
Net income | 133,593 | 113,156 | 94,718 | |||||||
Other comprehensive income (loss) | (3,573 | ) | 949 | 259 | ||||||
| | | | | | | | | | | |
Ending balance as of December 31, | $ | 824,658 | $ | 648,251 | $ | 523,260 | ||||
| | | | | | | | | | | |
| | | | | | | | | | | |
| | | | | | | | | | | |
FRESENIUS MEDICAL CARE AG & Co. KGaA
NOTES TO CONSOLIDATED FINANCIAL STATEMENTS — (Continued)
(in thousands, except share and per share data)
The following is a roll forward of noncontrolling interests subject to put provisions for the years ended December 31, 2016, 2015 and 2014:
| | 2016 | 2015 | 2014 | |||||||
|---|---|---|---|---|---|---|---|---|---|---|
Beginning balance as of January 1, | $ | 1,023,755 | $ | 824,658 | $ | 648,251 | ||||
Contributions to noncontrolling interests | (187,354 | ) | (164,830 | ) | (142,696 | ) | ||||
Purchase/ sale of noncontrolling interests | 57,707 | 7,915 | 87,902 | |||||||
Contributions from noncontrolling interests | 32,259 | 16,749 | 16,064 | |||||||
Expiration of put provisions and other reclassifications | (9,756 | ) | 5,206 | (4,650 | ) | |||||
Changes in fair value of noncontrolling interests | 138,112 | 178,003 | 89,767 | |||||||
Net income | 182,102 | 159,127 | 133,593 | |||||||
Other comprehensive income (loss) | (1,937 | ) | (3,073 | ) | (3,573 | ) | ||||
| | | | | | | | | | | |
Ending balance as of December 31, | $ | 1,234,888 | $ | 1,023,755 | $ | 824,658 | ||||
| | | | | | | | | | | |
| | | | | | | | | | | |
| | | | | | | | | | | |
In addition to the amounts in the table above, Other Temporary Equity related to the subsidiary stock incentive plan was $ 6,200 and $ 4,613 at December 31, 2016 and 2015, respectively (see Note 15).
14.12. Shareholders' Equity
Capital Stock
At December 31, 2016, the Company's share capital consists of 306,221,840 bearer shares without par value (Stückaktien) and a nominal value of €1.00 each. The Company's share capital has been fully paid in.
The General Partner has no equity interest in the Company and, therefore, does not participate in either the assets or the profits and losses of the Company. However, the General Partner is compensated for all outlays in connection with conducting the Company's business, including the remuneration of members of the management boardits Management Board and theits supervisory board (see Note 3)2).
The general meeting of a partnership limited by shares may approve Authorized Capital (genehmigtes Kapital). The resolution creating Authorized Capital requires the affirmative vote of a majority of three quarters of the capital represented at the vote and may authorize the management boardGeneral Partner and its Management Board to issue new shares up to a stated amount for a period of up to five years. The nominal value of any proposed increase of the Authorized Capital may not exceed half of the issued capital stock at the time of the authorization.
In addition, the general meeting of a partnership limited by shares may create Conditional Capital (bedingtes Kapital) for the purpose of issuing (i) new shares to holders of convertible bonds or other securities which grant a right to shares, (ii) new shares as the consideration in a merger with another company, or (iii) new shares offered to management or employees. In each case, the authorizing resolution requires the affirmative vote of a majority of three quarters of the capital represented at the vote. The nominal value for any proposed increase of the Conditional Capital may not exceed half or, in the case of Conditional Capital created for the purpose of issuing shares to management and employees, 10% of the Company's issued capital at the time of the resolution.
All resolutions increasing the capital of a partnership limited by shares also require the consent of the General Partner in order for the resolutions to go into effect.
Following the conversion of all 3,975,533 outstanding preference shares into ordinary shares (approved at FMC-AG & Co. KGaA's Annual General Meeting ("AGM") and Preference Shareholder Meeting held on May 16, 2013) in the amount of €3,976 ($4,465) on a 1:1 basis, subscribed capital at December 31, 2013 comprised solely ordinary shares. In addition, 32,006 options associated with the preference shares were converted into options associated with ordinary shares. At the time of preference share conversion, there were no dividend arrearages.
On July 5, 2013, the Company received a €27,000 ($34,784) premium from the largest former preference shareholder, a European financial institution, for the conversion of their preference shares to ordinary shares. This amount was recorded as an increase in equity.
Authorized Capital
By resolution of the AGMCompany's Annual General Meeting ("AGM") on May 11, 2010,19, 2015, the General Partner was authorized, with the approval of the supervisory board,Supervisory Board, to increase, on one or more occasions, the Company's share capital until May 10, 201518, 2020 up to a total of €35,000 through issue of new bearer ordinary shares for cash contributions, "Authorized Capital 2010/2015/I". Additionally, the newly issued shares may be taken up by a credit and/or financial institution or a consortium of such credit and/or financial institutions nominatedretained by the General Partner with the obligation to offer them to the shareholders of the Company (indirect pre-emption rights).
FRESENIUS MEDICAL CARE AG & Co. KGaA
NOTES TO CONSOLIDATED FINANCIAL STATEMENTS — (Continued)
(in thousands, except share and per share data)
Company. The General Partner is entitled, subject to the approval of the supervisory board, to exclude the pre-emption rights of the shareholders. However, such an exclusion of pre-emption rights will be permissible only for fractional amounts. No Authorized Capital 2010/2015/I has been issued at December 31, 2014.2016.
In addition, by resolution of the AGM of shareholders on May 11, 2010,19, 2015, the General Partner was authorized, with the approval of the supervisory board,Supervisory Board, to increase, on one or more occasions, the share capital of the Company until May 10, 201518, 2020 up to a total of €25,000 through the issue of new bearer ordinary shares for cash contributions or contributions in kind, "Authorized Capital 2010/2015/II". The new shares can also be obtained by a credit and/or financial institution or a consortium of such credit and/or financial institutions retained by the General Partner with the obligation to offer the shares to the Company's shareholders for subscription. The General Partner is entitled, subject to the approval of the supervisory board,Supervisory Board, to exclude the pre-emption rights of the shareholders. However, such exclusion of pre-emption rights will be permissible only if (i) in case of a capital increase against cash contributions, the nominal value of the issued shares does not exceed 10% of the nominal share value of the Company's share capital and the issue price for the new shares is at the time of the determination by the General Partner not significantly lower than the stock price in Germany of the
FRESENIUS MEDICAL CARE AG & Co. KGaA
NOTES TO CONSOLIDATED FINANCIAL STATEMENTS — (Continued)(in thousands, except share data)
existing listed shares of the same class and with the same rights or, (ii) in case of a capital increase against contributions in kind, the purpose of such increase is to acquire an enterprise, parts of an enterprise or an interest in an enterprise. No Authorized Capital 2010/2015/II has been issued at December 31, 2014.2016.
Authorized Capital 2010/2015/I and Authorized Capital 2010/2015/II became effective upon registration with the commercial register of the local court in Hof an der Saale on May 25, 2010.June 10, 2015.
Conditional Capital
By resolution of the Company's AGM on May 12, 2011, the Company's share capital was conditionally increased with regards to the 2011 Stock Option Plan ("2011 SOP") by up to €12,000 subject to the issue of up to twelve million no par value bearer ordinary shares with a nominalcalculated proportionate value of €1.00 each. The Conditional Capital increase can only be used for the purposes of servicing stock options under the 2011 SOP, with each stock option awarded exercisable for one ordinary share. The Company has the right to deliver ordinary shares that it owns or purchases in the market in lieu of increasing capital by issuing new shares. For further information, see Note 17.15.
By resolution of the Company's AGM on May 9, 2006, as amended by the resolution of the Company's AGM on May 15, 2007, resolving a three-for-one share split, the Company's share capital was conditionally increased by up to €15,000 corresponding to 15 million ordinary shares with no par value and a nominalcalculated proportionate value of €1.00.€1.00 each. This Conditional Capital increase can only be effected byused for the exercisepurposes of servicing stock options under the Company's Stock Option Plan 2006 with each stock option awarded exercisable for one ordinary share (see Note 17)15). The Company has the right to deliver ordinary shares that it owns or purchases in the market in placelieu of increasing capital by issuing new shares.
Through the Company's other employee participation programs, the Company has issued convertible bonds and stock option/subscription rights (Bezugsrechte) to employees and the members of the Management Board of the General Partner and employees and members of management of affiliated companies that entitle these persons to receive shares. At December 31, 2014, 9,189,631 convertible bonds or2016, 6,067,167 options remained outstanding with a remaining average term of 4.595 years under these programs. For the year ending December 31, 2014, 2,108,5212016, 907,720 options had been exercised under these employee participation plans (see Note 17)15).
As the result of the Company's three-for-one stock split for both then-outstanding preference and ordinary shares, which was approved by the shareholders at the AGM on May 15, 2007, on June 15, 2007 the Company's Conditional Capital was increased by $6,557 (€4,454). Conditional Capital available for all programs at December 31, 2014 is $25,9322016 was $19,703 (€21,359)18,692). For all programs, Conditional Capital of $16,146 (€15,318) was available, which includes $14,569included $11,960 (€12,000)11,346) for the 2011 SOP $7,007and $4,186 (€5,771)3,972) for the 2006 Plan and $4,356 (€3,588) for the 2001 Plan (see Note 17)15).
Treasury Stock
By resolution of the Company's AGM on May 12, 2011, the Company was authorized to conduct a share buy-back program to repurchase ordinary shares. On April 4, 2013, the Company issued an ad hoc announcement of a share buy-back program in the aggregate value of up to €385,000 (approximately $500,000). The buy-back started on May 20, 2013 and was completed on August 14, 2013 after 7,548,951 shares had been repurchased in the amount of €384,966 ($505,014). These shares are restricted treasury stock which means there are no associated dividends or voting rights. These treasury shares will be used solely to either reduce the registered share capital of the Company by cancellation of the acquired shares, or to fulfill employee participation programs of the Company.
FRESENIUS MEDICAL CARE AG & Co. KGaA
NOTES TO CONSOLIDATED FINANCIAL STATEMENTS — (Continued)
(in thousands, except share and per share data)
Treasury Stock
By resolution of the Company's AGM on May 12, 2011, the Company was authorized to conduct a share buy-back program. The buy-back program commenced on May 20, 2013 and was completed on August 14, 2013 after 7,548,951 shares had been repurchased in the amount of €384,966 ($505,014). On February 16, 2016, the Company retired 6,549,000 of the repurchased shares from the buy-back program at an average weighted price of €51 per share ($67 per share).
The following tabular disclosure provides the monthly detail of shares repurchased during the buy-back program, which ended on August 14, 2013:2013, as well as the subsequent retirement of a portion of those repurchased shares on February 16, 2016:
| Average price paid per share | Total number of shares purchased and retired as part of publicly announced plans or programs | | | |||||||||||||||||||||||||||||
|---|---|---|---|---|---|---|---|---|---|---|---|---|---|---|---|---|---|---|---|---|---|---|---|---|---|---|---|---|---|---|---|---|
| | Average price paid per share | Total number of shares purchased as part of publicly announced plans or programs | Total Value of Shares Repurchased | Total Value of Shares | ||||||||||||||||||||||||||||
Period | in € | in $(1) | in €(3) | in $(2)(3) | in € | in $(1) | in €(3) | in $(2),(3) | ||||||||||||||||||||||||
| | | | | (in thousands) | | | | (in thousands) | ||||||||||||||||||||||||
Purchase of Treasury Stock | ||||||||||||||||||||||||||||||||
May 2013 | 52.96 | 68.48 | 1,078,255 | 57,107 | 73,842 | 52.96 | 68.48 | 1,078,255 | 57,107 | 73,842 | ||||||||||||||||||||||
June 2013 | 53.05 | 69.95 | 2,502,552 | 132,769 | 175,047 | 53.05 | 69.95 | 2,502,552 | 132,769 | 175,047 | ||||||||||||||||||||||
July 2013 | 49.42 | 64.63 | 2,972,770 | 146,916 | 192,124 | 49.42 | 64.63 | 2,972,770 | 146,916 | 192,124 | ||||||||||||||||||||||
August 2013 | 48.40 | 64.30 | 995,374 | 48,174 | 64,001 | 48.40 | 64.30 | 995,374 | 48,174 | 64,001 | ||||||||||||||||||||||
| | | | | | | | | | | | | | | | | | | | | | | | | | | | | | | | | |
Repurchased Treasury Stock | 51.00 | 66.90 | 7,548,951 | 384,966 | 505,014 | |||||||||||||||||||||||||||
| | | | | | | | | | | | | | | | | | ||||||||||||||||
Retirement of repurchased Treasury Stock | ||||||||||||||||||||||||||||||||
February 2016 | 51.00 | 66.90 | 6,549,000 | 333,973 | 438,119 | |||||||||||||||||||||||||||
| | | | | | | | | | | | | | | | | | ||||||||||||||||
Total | 51.00 | 66.90 | 7,548,951 | 384,966 | 505,014 | 51.00 | 66.90 | 999,951 | 50,993 | 66,895 | ||||||||||||||||||||||
| | | | | | | | | | | | | | | | | | | | | | | | | | | | | | | | | | |
| | | | | | | | | | | | | | | | | | | | | | | | | | | | | | | | | |
By resolution of the Company's AGM on May 12, 2016, the General Partner is authorized to purchase treasury shares up to a maximum amount of 10% of the registered share capital existing at the time of this resolution until May 11, 2021. The shares acquired, together with other treasury shares held by the Company or attributable to the Company pursuant to sections 71a et seqq. AktG, must at no time exceed 10% of the registered share capital. The purchase will be made through the stock exchange, by way of a public tender offer, or a public invitation to shareholders to submit an offer for sale. This authorization is not applicable for the purpose of trading in treasury shares. The General Partner is authorized to use treasury shares purchased on the basis of this authorization or any other earlier authorization for any legally permissible purpose, in particular (i) to redeem shares without requiring any further resolution by the General Meeting, (ii) to sell treasury shares to third parties against contributions in kind, (iii) to award treasury shares, in lieu of the utilization of conditional capital of the Company, to employees of the Company and companies affiliated with the Company, including members of the management of affiliated companies, and use them to service options or obligations to purchase shares of the Company, and (iv) to use treasury shares to service bonds carrying warrant and/or conversion rights or conversion obligations issued by the Company or companies affiliated with the Company pursuant to section 17 AktG.
Dividends
Under German law, the amount of dividends available for distribution to shareholders is based upon the unconsolidated retained earnings of Fresenius Medical Care AG & Co. KGaA as reported in its balance sheet determined in accordance with the German Commercial Code (Handelsgesetzbuch). In
FRESENIUS MEDICAL CARE AG & Co. KGaA
NOTES TO CONSOLIDATED FINANCIAL STATEMENTS — (Continued)
(in thousands, except share and per share data)
addition, the payment of dividends by FMC-AG & Co. KGaA is subject to limitations under the Amended 2012 Credit Agreement (see Note 11)9).
Cash dividends of $277,176 for 2015 in the amount of €0.80 per share were paid on May 13, 2016.
Cash dividends of $263,244 for 2014 in the amount of €0.78 per share were paid on May 20, 2015.
Cash dividends of $317,903 for 2013 in the amount of €0.77 per ordinary share were paid on May 16, 2014.
Cash dividends of $296,134 for 2012 in the amount of €0.77 per then-outstanding preference share and €0.75 per ordinary share were paid on May 17, 2013.
Cash dividends of $271,733 for 2011 in the amount of €0.71 per then-outstanding preference share and €0.69 per ordinary share were paid on May 11, 2012.
15.13. Sources of Revenue
Below is a table showing the sources of our U.S. patient service revenue (net of contractual allowance and discounts but before patient service bad debt provision), included in the Company's health care revenue, for the years ended December 31, 2014, 2013 and 2012. Outside of the U.S., the Company does not recognize patient service revenue at the time the services are rendered without assessing the patient's ability to pay. Accordingly, the additional disclosure requirements introduced with ASU 2011-07 only apply solely to the U.S. patient service revenue. Below is a table showing the sources of our U.S. patient service revenue (net of contractual allowance and discounts but before patient service bad debt provision), included in the Company's Health Care revenue, for the years ended December 31, 2016, 2015 and 2014:
| | 2014 | 2013 | 2012 | 2016 | 2015 | 2014 | ||||||||||||||
|---|---|---|---|---|---|---|---|---|---|---|---|---|---|---|---|---|---|---|---|---|
Medicare program | $ | 4,677,053 | $ | 4,411,285 | $ | 4,029,773 | $ | 5,413,652 | $ | 5,058,262 | $ | 4,677,053 | ||||||||
Private/alternative payors | 4,278,847 | 3,841,473 | 3,605,081 | 5,361,158 | 4,830,401 | 4,278,847 | ||||||||||||||
Medicaid and other government sources | 433,092 | 392,908 | 474,520 | 619,419 | 538,077 | 433,092 | ||||||||||||||
Hospitals | 568,859 | 411,340 | 400,791 | 1,018,176 | 915,184 | 568,859 | ||||||||||||||
| | | | | | | | | | | | | | | | | | | | | |
Total patient service revenue | $ | 9,957,851 | $ | 9,057,006 | $ | 8,510,165 | $ | 12,412,405 | $ | 11,341,924 | $ | 9,957,851 | ||||||||
| | | | | | | | | | | | | | | | | | | | | | |
| | | | | | | | | | | | | | | | | | | | | |
14. Earnings Per Share
The following table contains reconciliations of the numerators and denominators of the basic and diluted earnings per share computations for 2016, 2015 and 2014:
| | 2016 | 2015 | 2014 | |||||||
|---|---|---|---|---|---|---|---|---|---|---|
Numerators: | ||||||||||
Net income attributable to shareholders of FMC-AG & Co. KGaA | $ | 1,243,267 | $ | 1,029,445 | $ | 1,045,266 | ||||
Denominators: | ||||||||||
Weighted average number of shares outstanding | 305,748,381 | 304,440,184 | 302,339,124 | |||||||
Potentially dilutive shares | 509,363 | 479,851 | 528,772 | |||||||
| | | | | | | | | | | |
Total weighted average shares outstanding assuming dilution | 306,257,744 | 304,920,035 | 302,867,896 | |||||||
Basic earnings per share | $ | 4.07 | $ | 3.38 | $ | 3.46 | ||||
Fully diluted earnings per share | $ | 4.06 | $ | 3.38 | $ | 3.45 | ||||
15. Share-based Plans
Fresenius Medical Care AG & Co. KGaA Share-based Plans
At December 31, 2016, the Company has various share-based compensation plans, which may either be equity- or cash-settled:
Fresenius Medical Care AG & Co. KGaA Long-term Incentive Plan 2016
As of May 11, 2016, the issuance of stock options and phantom stocks under the FMC AG & Co. KGaA Long-Term Incentive Program 2011 ("LTIP 2011") is no longer possible. In order to continue to enable the members of the Management Board, the members of the management boards of affiliated companies and managerial staff members to adequately participate in the long-term, sustained success of the Company, the Management Board and the supervisory board of Management AG have approved and
FRESENIUS MEDICAL CARE AG & Co. KGaA
NOTES TO CONSOLIDATED FINANCIAL STATEMENTS — (Continued)
(in thousands, except share and per share data)
adopted the FMC-AG & Co. KGaA Long-Term Incentive Plan 2016 ("LTIP 2016") as a successor program effective January 1, 2016.
The LTIP 2016 is a variable compensation program with long-term incentive effects. Pursuant to the LTIP 2016, the plan participants may be granted so-called "Performance Shares" annually or semiannually during 2016 to 2018. Performance Shares are non-equity, cash-settled virtual compensation instruments which may entitle plan participants to receive a cash payment depending on the achievement of pre-defined performance targets further defined below as well as the Company's share price development.
For members of the Management Board, the Supervisory Board will, in due exercise of its discretion and taking into account the individual responsibility and performance of each Management Board member, determine an initial value for each grant for any awards to Management Board members. For plan participants other than the members of the Management Board, such determination will be made by the Management Board. The initial grant value is determined in the currency in which the respective participant receives their base salary at the time of the grant. In order to determine the number of Performance Shares each plan participant receives, their respective grant value will be divided by the value per Performance Share at the time of the grant, which is mainly determined based on the average price of the Company's shares over a period of thirty calendar days prior to the respective grant date. The number of granted Performance Shares may change over the performance period of three years, depending on the level of achievement of the following: (i) revenue growth, (ii) growth in net income attributable to shareholders of FMC-AG & Co. KGaA ("net income growth") and (iii) return on invested capital ("ROIC") improvement.
Revenue, net income and ROIC are determined according to IFRS in euro based on full year results. Revenue growth and net income growth, for the purpose of this plan, are determined at constant currency.
An annual target achievement level of 100% will be reached for the revenue growth performance target if revenue growth is 7% in each individual year of the three-year performance period; revenue growth of 0% will lead to a target achievement level of 0% and the maximum target achievement level of 200% will be reached in the case of revenue growth of at least 16%. If revenue growth ranges between these values, the degree of target achievement will be linearly interpolated between these values.
An annual target achievement level of 100% for the net income growth performance target will be reached if net income growth is 7% in each individual year of the three-year performance period. In the case of net income growth of 0%, the target achievement level will also be 0%; the maximum target achievement of 200% will be reached in the case of net income growth of at least 14%. Between these values, the degree of target achievement will be determined by means of linear interpolation.
With regard to ROIC improvement, an annual target achievement level of 100% will be reached if the target ROIC as defined for the respective year is reached. The target ROIC is 7.3% for 2016 and will increase by 0.2 percentage points per year to 7.5% (2017), 7.7% (2018), 7.9% (2019) and 8.1% (2020). A target achievement level of 0% will be reached if the ROIC falls below the target ROIC for the respective year by 0.2 percentage points or more, whereas the maximum target achievement level of 200% will be reached if the target ROIC for the respective year is exceeded by 0.2 percentage points or more. The degree of target achievement will be determined by means of linear interpolation if the ROIC ranges between these values. In case the annual ROIC target achievement level in the third year of a performance period is equal or higher than the ROIC target achievement level in each of the two previous years of such performance period, the ROIC target achievement level of the third year is deemed to be achieved for all years of the respective performance period.
The achievement level for each of the three performance targets will be weighted annually at one-third to determine the yearly target achievement for each year of the three-year performance period. The level of overall target achievement over the three-year performance period will then be determined on the basis of the mean of these three average yearly target achievements. The overall target achievement can be in a range of 0% to 200%.
16. Earnings Per ShareTable of Contents
FRESENIUS MEDICAL CARE AG & Co. KGaA
NOTES TO CONSOLIDATED FINANCIAL STATEMENTS — (Continued)
(in thousands, except share and per share data)
The following table contains reconciliationsnumber of Performance Shares granted to the plan participants at the beginning of the numerators and denominatorsperformance period will each be multiplied by the level of overall target achievement in order to determine the final number of Performance Shares.
The final number of Performance Shares is generally deemed earned four years after the day of a respective grant (the vesting period). The number of such vested Performance Shares is then multiplied by the average Company share price over a period of thirty days prior to the lapse of this four-year vesting period. The respective resulting amount will then be paid to the plan participants as cash compensation.
The first awards under the Long-Term Incentive Plan 2016 were granted on July 25, 2016. During 2016, under the Long-Term Incentive Plan 2016, the Company awarded 642,349 Performance Shares, including 79,888 Performance Shares awarded to the members of the basicManagement Board at a measurement date weighted average fair value of $80.31 (€76.19) each and diluted earnings per share computations for 2014, 2013 and 2012:
| | 2014 | 2013 | 2012 | |||||||
|---|---|---|---|---|---|---|---|---|---|---|
Numerators: | ||||||||||
Net income attributable to shareholders of FMC-AG & Co. KGaA | $ | 1,045,266 | $ | 1,109,890 | $ | 1,186,809 | ||||
less: | ||||||||||
Dividend preference on Preference shares(a) | — | — | 102 | |||||||
| | | | | | | | | | | |
Income available to all classes of shares | $ | 1,045,266 | $ | 1,109,890 | $ | 1,186,707 | ||||
| | | | | | | | | | | |
| | | | | | | | | | | |
| | | | | | | | | | | |
Denominators: | ||||||||||
Weighted average number of: | ||||||||||
Ordinary shares outstanding | 302,339,124 | 301,877,303 | 301,139,652 | |||||||
Preference shares outstanding(a) | — | 1,937,819 | 3,969,307 | |||||||
| | | | | | | | | | | |
Total weighted average shares outstanding | 302,339,124 | 303,815,122 | 305,108,959 | |||||||
Potentially dilutive Ordinary shares | 528,772 | 673,089 | 1,761,064 | |||||||
Potentially dilutive Preference shares | — | — | 16,851 | |||||||
| | | | | | | | | | | |
Total weighted average Ordinary shares outstanding assuming dilution | 302,867,896 | 302,550,392 | 302,900,716 | |||||||
Basic earnings per share | $ | 3.46 | $ | 3.65 | $ | 3.89 | ||||
Fully diluted earnings per share | $ | 3.45 | $ | 3.65 | $ | 3.87 | ||||
17. Stock Options
Fresenius Medical Care AG & Co KGaA Stock Options and other Share-Based Plans
In connection with its equity-settled stock option programs, the Company incurred compensation expense of $6,307, $13,593 and $26,476 for the years ending December 31, 2014, 2013, and 2012, respectively. There were no capitalized compensation costs in any of the three years presented. The Company also recorded a related deferred income tax of $1,384, $3,828 and $6,854 for the years ending December 31, 2014, 2013, and 2012, respectively.
At December 31, 2014, the Company has various stock-based compensation plans as follows:four-year vesting period.
Fresenius Medical Care AG & Co. KGaA Long TermLong-term Incentive Program 2011
On May 12, 2011, the Fresenius Medical Care AG & Co. KGaA Stock Option Plan 2011 ("2011 SOP") was established by resolution of the Company's AGM. The 2011 SOP, together with the Phantom Stock Plan 2011, which was established by resolution of the General Partner's Management and Supervisory Boards,supervisory boards, forms the Company's Long Term Incentive Program 2011 ("2011 Incentive Program"). Under the 2011 Incentive Program, participants may bewere granted awards, which will consistconsisted of a combination of stock options and phantom stock. AwardsThe final grant under the 2011 Incentive Program will be granted over a five year period and can be granted on the last Monday in July and/or the first Monday in December each year. Generally, and prior to the respective grants, participants will be able to choose how much of the granted value is granted in the form of stock options and phantom stock in a predefined range of 75:25 to 50:50, stock options vs. phantom stock. For grants made in 2014 and for participants not belonging to the General Partner's Management Board, the grant ratio was predefined at 50:50. The number of phantom shares that plan participants may choose to receive instead of stock options within the aforementioned predefined range is determined on the basis of a fair value assessment pursuant to a binomial model. With respect to grants made in July, this fair value assessment will be conducted on the day following the Company's AGM and with respect to the grants made in December on the first Monday
FRESENIUS MEDICAL CARE AG & Co. KGaA
NOTES TO CONSOLIDATED FINANCIAL STATEMENTS — (Continued)(in thousands, except share data)
in October.2015. Awards under the 2011 Incentive Program are subject to a four-year vesting period. Vesting of the awards granted is subject to achievement of pre-defined performance targets. The 2011 Incentive ProgramSOP was established with a conditional capital increase up to €12,000 subject to the issue of up to twelve million non-par value bearer ordinary shares with a nominal value of €1.00, each of which can be exercised to obtain one ordinary share.
The Management Board, members of the management boards of the Company's affiliated companies and the managerial staff members of the Company and of certain affiliated companies are entitled to participate in the 2011 Incentive Program. With respect to participants who are members of the Management Board, the General Partner's Supervisory Board has sole authority to make plan interpretations, decide on certain adjustments and to grant awardsStock options granted under the 2011 Incentive Program. The General Partner has such authority with respect to all other participants inProgram have an eight-year term and can be exercised for the 2011 Incentive Program.
first time after a four-year vesting period. The exercise price of stock options granted under the 2011 Incentive Program shall be the average stock exchange price on the Frankfurt Stock Exchange of the Company's shares during the 30 calendar days immediately prior to each grant date. Stock options granted under the 2011 Incentive Program have an eight-year term and can be exercised only after a four-year vesting period. Stock options granted under the 2011 Incentive Program to U.S. participants are non-qualified stock options under the United States Internal Revenue Code of 1986, as amended. OptionsStock options under the 2011 Incentive Program are not transferable by a participant or a participant's heirs, and may not be pledged, assigned, or disposed of otherwise.
Phantom stock awards under the 2011 Incentive Program entitle the holders to receive payment in Euroeuro from the Company upon exercise of the phantom stock. The payment per phantom share in lieu of the issuance of such stock shall be based upon the share price on the Frankfurt Stock Exchange of one of the Company's shares on the exercise date. Phantom stock awards have a five-year term and can be exercised onlyfor the first time after a four-year vesting period, beginning with the grant date, however a shorter period may apply for certain exceptions.period. For participants who are U.S. tax payers, the phantom stock is deemed to be exercised in any event in the month of March following the end of the vesting period.
During 2014,2015, under the 2011 Incentive Program, the Company awarded 1,677,3603,073,360 stock options, including 273,900502,980 stock options granted to the Management Board, at a weighted average exercise price of $61.14$83.89 (€50.35)77.06), a weighted average fair value of $12.21$16.57 each and a total fair value of $20,479$50,923 which will be amortized over the four-year vesting period. The Company also awarded 299,547607,828 shares of phantom stock, including 24,95062,516 shares of phantom stock granted to members of the Management Board at a measurement date weighted average fair value of $70.62$80.36 (€58.17)73.81) each and a total fair value of $21,155,$48,843, which will be revalued if the fair value changes, and amortized over the four-year vesting period.
During 2013, the Company awarded 2,141,076 stock options under the 2011 Incentive Program, including 328,680 stock options granted to the Management Board at a weighted average exercise priceTable of $68.61 (€49.75), a weighted average fair value of $11.88 eachContents
FRESENIUS MEDICAL CARE AG & Co. KGaA
NOTES TO CONSOLIDATED FINANCIAL STATEMENTS — (Continued)
(in thousands, except share and a total fair value of $25,431, which will be amortized over the four-year vesting period. The Company awarded 186,392 phantom shares, including 25,006 phantom shares granted to the Management Board at a measurement date weighted average fair value of $66.50 (€48.22) each and a total fair value of $12,395 which will be revalued if the fair value changes, and amortized over the four year vesting period.per share data)
New Incentive planBonus Plan
In 2014,2016, the Management Board was eligible for performance-related compensation that depended upon achievement of pre-defined targets. The targets are measured by reference tobased on the operating income margin, net income growth and free cash flow (net cash provided by operating activities after capital expenditures before acquisitions and investments) in percentage of revenue, and are derived from the comparison of targeted and actually achieved current year figures. Targets are divided into Group level targets and those to be achieved in individual regions and areas of responsibility.
FRESENIUS MEDICAL CARE AG & Co. KGaA
NOTES TO CONSOLIDATED FINANCIAL STATEMENTS — (Continued)(in thousands, except share data)
Performance-related bonuses for fiscal year 20142016 will consist proportionately of a cash component and a share-based component which will be paid in cash. Upon meeting the annual targets, the cash component for the year 2016 will be paid afterin the end of 2014.following year. The share-based component is subject to a three- or four-yearthree-year vesting period, although a shorter period may apply in special cases.cases (e.g. occupational disability, retirement, and employment contracts which were not extended by the Company). The amount of cash for the payment relating to the share-based component shall be based on the share price of Fresenius Medical Care AG & Co. KGaA ordinary shares upon exercise. The amount of the achievable bonus forFor each of the members of the Management Board, the amount of the achievable pay component as well as of the allocation value of the cash-settled share-based compensation is capped.
Share-based compensation related to this plan for years ending 2016, 2015 and 2014 2013was $3,632, $891 and 2012 was $1,040, $1,110 and $2,751, respectively.
Fresenius Medical Care AG & Co. KGaA Stock Option Plan 2006
The Fresenius Medical Care AG & Co. KGaA Stock Option Plan 2006 ("Amended 2006 Plan") was established with a conditional capital increase up to €12,800, subject to the issue of up to five million no par value bearer ordinary shares with a nominal value of €1.00, each of which can be exercised to obtain one ordinary share. In connection with the share split affectedeffected in 2007, the principal amount was adjusted to the same proportion as the share capital out of the capital increase up to €15,000 by the issue of up to 15 million new non-par value bearer ordinary shares. After December 2010, no further grants were issued under the Amended 2006 Plan. Options granted under this plan are exercisable through December 2017.
Options granted under the Amended 2006 Plan to US participants are non-qualified stock options under the United States Internal Revenue Code of 1986, as amended. Options under the Amended 2006 Plan are not transferable by a participant or a participant's heirs, and may not be pledged, assigned, or otherwise disposed of.
Fresenius Medical Care 2001 International Stock Option Plan
Information on Holdings Under the Fresenius Medical Care 2001 International Stock Incentive Plan (the "2001 Plan"), options in the form of convertible bonds with a principal of up to €10,240 were issued to the Management Board and other employees of the Company representing grants for up to 4 million non-voting preference shares. The convertible bonds originally had a par value of €2.56 and bear interest at a rate of 5.5%. In connection with the share split affected in 2007, the principal amount was adjusted in the same proportion as the share capital out of the capital increase and the par value of the convertible bonds was adjusted to €0.85 without affecting the interest rate.
Based on the resolution of the Annual General Meeting and the separate Meeting of the Preference Shareholders on May 16, 2013 regarding the conversion of all preference shares into ordinary shares, the 2001 Plan was amended accordingly. The partial amount of the capital increase which was formerly referred to as the issuance of bearer preference shares will now be referred exclusively to the issuance of bearer ordinary shares.
Effective May 2006, no further grants can be issued under the 2001 Plan and no options were granted under this plan after 2005. The outstanding options will expire before 2016.
Additional stock option plans informationShare-based Plans
At December 31, 2014,2016, the Management Board held 1,485,0761,010,784 stock options and employees of the Company held 7,704,5555,056,383 stock options under the various stock-basedshare-based compensation plans of the Company. No stock options for preference shares were outstanding, due to the preference share conversion during the second quarter of 2013.
At December 31, 2014,2016, the Management Board held 66,96081,019 phantom shares and employees of the Company held 666,038812,970 phantom shares under the 2011 Incentive Plan.
At December 31, 2016, the Management Board held 79,888 Performance Shares and employees of the Company held 555,148 Performance Shares under the LTIP 2016.
FRESENIUS MEDICAL CARE AG & Co. KGaA
NOTES TO CONSOLIDATED FINANCIAL STATEMENTS — (Continued)
(in thousands, except share and per share data)
Additional Information on Stock Options
The table below provides reconciliations for stock options outstanding at December 31, 2016, as compared to December 31, 2015.
| | Options (in thousands) | Weighted average exercise price | Weighted average exercise price | |||||||
|---|---|---|---|---|---|---|---|---|---|---|
| | | € | $ | |||||||
Stock options for shares | ||||||||||
Balance at December 31, 2015 | 8,737 | 58.75 | 61.93 | |||||||
Granted | — | — | — | |||||||
Exercised | 908 | 43.45 | 45.80 | |||||||
Forfeited | 1,762 | 52.08 | 54.89 | |||||||
| | | | | | | | | | | |
Balance at December 31, 2016 | 6,067 | 62.98 | 66.38 | |||||||
| | | | | | | | | | | |
| | | | | | | | | | | |
| | | | | | | | | | | |
The following table provides a summary of fully vested options outstanding and exercisable at December 31, 2016:
| Fully Vested Outstanding and Exercisable Options | |||||||||||||||||||
|---|---|---|---|---|---|---|---|---|---|---|---|---|---|---|---|---|---|---|---|
| | Number of Options | Weighted average remaining contractual life in years | Weighted average exercise price | Weighted average exercise price | Aggregate intrinsic value | Aggregate intrinsic value | |||||||||||||
| | (in thousands) | | € | $ | € | $ | |||||||||||||
Options for shares | 1,162 | 2.02 | 49.68 | 52.37 | 35,759 | 37,694 | |||||||||||||
At December 31, 2016, there was $23,336 of total unrecognized compensation costs related to non-vested options granted under all plans. These costs are expected to be recognized over a weighted-average period of 2 years.
During the years ended December 31, 2016, 2015, and 2014, the Company received cash of $44,018, $76,093 and $98,523, respectively, from the exercise of stock options (see Note 12). The intrinsic value of stock options exercised for the twelve-month periods ending December 31, 2016, 2015, and 2014 was $34,767, $73,886 and $47,396, respectively. The Company recorded a cash inflow for income taxes from stock option exercises of $8,887, $18,073 and $8,529 for the years ending December 31, 2016, 2015, and 2014, respectively. The excess tax benefit allocated to additional paid-in capital for the twelve-month periods ending December 31, 2016, 2015 and 2014 for all share-based compensation programs was $6,427, $13,451 and $4,056, respectively.
The compensation expenses related to equity-settled stock option programs are determined based upon the fair value on the grant date and the number of stock options granted which will be recognized over the four year vesting period. In connection with its equity-settled stock option programs, the Company incurred compensation expense of $25,691, $6,583 and $6,307 for the years ending December 31, 2016, 2015, and 2014, respectively. There were no capitalized compensation costs in relation to equity-settled instruments in any of the three years presented. The Company also recognized a related income tax benefit of $8,232, $1,857 and $1,384 for the years ending December 31, 2016, 2015, and 2014, respectively.
The expenses related to cash- settled share based payment transactions are determined based upon the fair value at the measurement date and the number of phantom shares or Performance Shares granted which will be recognized over the four-year vesting period. In connection with cash-settled share based payment transactions, the Company recognized expense of $17,167, $11,932 and $5,389 related to phantom shares for the years ending December 31, 2016, 2015, and 2014, respectively, and $21,598 related to Performance Shares for the year ended December 31, 2016.
FRESENIUS MEDICAL CARE AG & Co. KGaA
NOTES TO CONSOLIDATED FINANCIAL STATEMENTS — (Continued)
(in thousands, except share and per share data)
The table below provides reconciliations for stock options outstanding at December 31, 2014, as compared to December 31, 2013.
| | Options (in thousands) | Weighted average exercise price | Weighted average exercise price | |||||||
|---|---|---|---|---|---|---|---|---|---|---|
| | | € | $ | |||||||
Stock options for ordinary shares | ||||||||||
Balance at December 31, 2013 | 10,791 | 45.83 | 55.64 | |||||||
Granted | 1,677 | 50.35 | 61.14 | |||||||
Exercised | 2,109 | 35.17 | 42.70 | |||||||
Forfeited | 1,170 | 51.81 | 62.90 | |||||||
| | | | | | | | | | | |
Balance at December 31, 2014 | 9,189 | 48.34 | 58.69 | |||||||
| | | | | | | | | | | |
| | | | | | | | | | | |
| | | | | | | | | | | |
The following table provides a summary of fully vested options outstanding and exercisable at December 31, 2014:
| Fully Vested Outstanding and Exercisable Options | |||||||||||||||||||
|---|---|---|---|---|---|---|---|---|---|---|---|---|---|---|---|---|---|---|---|
| | Number of Options | Weighted average remaining contractual life in years | Weighted average exercise price | Weighted average exercise price | Aggregate intrinsic value | Aggregate intrinsic value | |||||||||||||
| | (in thousands) | | € | US$ | € | US$ | |||||||||||||
Options for ordinary shares | 2,539 | 1.84 | 37.38 | 45.38 | 62,139 | 75,443 | |||||||||||||
At December 31, 2014, there was $32,040 of total unrecognized compensation costs related to non-vested options granted under all plans. These costs are expected to be recognized over a weighted-average period of 1.95 years.
During the years ended December 31, 2014, 2013, and 2012, the Company received cash of $98,523, $102,418 and $100,118, respectively, from the exercise of stock options (see Note 14). The intrinsic value of convertible bonds and stock options exercised for the twelve-month periods ending December 31, 2014, 2013, and 2012 was $47,396, $52,203 and $83,690, respectively. The Company recorded a cash inflow for income taxes from stock option exercises of $8,529, $8,882 and $21,008 for the years ending December 31, 2014, 2013, and 2012, respectively. The excess tax benefit allocated to additional paid-in capital for the twelve-month periods ending December 31, 2014, 2013 and 2012 was $4,056, $3,897 and $13,668, respectively.
In connection with cash-settled share based payment transactions under the 2011 Incentive Program the Company recognized expense of $5,389, $3,559 and $5,144 for the years ending December 31, 2014, 2013 and 2012, respectively.
Fair Value Information
The Company used a binomial option-pricing model in determining the fair value of the awards under the 2011 SOP and the Amended 2006 Plan. Option valuation models require the input of subjective assumptions including expected stock price volatility. The Company's assumptions are based upon its past experiences, market trends and the experiencesexperience of other entities of the same size and in similar industries. Expected volatility is based on historical volatility of the Company's shares. To incorporate the effects of expected early exercise in the model, an early exercise of vested options was assumed as soon as the share price exceeds 155% of the exercise price. The Company's stock options have characteristics that vary
FRESENIUS MEDICAL CARE AG & Co. KGaA
NOTES TO CONSOLIDATED FINANCIAL STATEMENTS — (Continued)(in thousands, except share data)
significantly from traded options and changes in subjective assumptions can materially affect the fair value of the option. The assumptions used to determine the fair value of the 2014 and 20132015 grants are as follows:
| | 2014 | 2013 | |||||
|---|---|---|---|---|---|---|---|
Expected dividend yield | 1.99% | 2.02% | |||||
Risk-free interest rate | 0.83% | 1.33% | |||||
Expected volatility | 22.16% | 22.44% | |||||
Expected life of options | 8 years | 8 years | |||||
Weighted average exercise price (in €) | 50.35 | 49.75 | |||||
Weighted average exercise price (in US-$) | 61.14 | 68.61 | |||||
| 2015 | ||||
|---|---|---|---|---|
Expected dividend yield | 1.46% | |||
Risk-free interest rate | 0.44% | |||
Expected volatility | 22.32% | |||
Expected life of options | 8 years | |||
Weighted average exercise price (in €) | 77.06 | |||
Weighted average exercise price (in US-$) | 83.89 | |||
Subsidiary Stock Incentive Plans
Subsidiary stock incentive plans were established during 2014 in conjunction with two acquisitions made by the Company. Under these plans, two of the Company's subsidiaries are authorized to issue a total of 396,044,859116,103,806 Incentive Units. The Incentive Units have two types of vesting conditions – a service condition and a performance condition. Of the total Incentive Units granted, eighty percent vest ratably over a four year period and twenty percent vest upon the achievement of certain of the relevant subsidiary's performance targets over the next 6 yearsa six year vesting period (the "Performance Units").
Fifty percent of the Performance Units will vest upon achievement of performance targets in 2017. The remaining 50%, plus any unvested Performance Units, will vest upon achievement of performance targets in 2019. All of the Performance Units will vest upon achievement of performance targets in 2020, if not previously vested. Additionally, for one of the subsidiaries, all Performance Units not previously vested will vest upon successful completion of an initial public offering.
As of December 31, 2016, 2015 and 2014, there was $20,005$17,220, $28,448 and $32,311, respectively, of total unrecognized compensation cost related to unvested Incentive Units under the plans. That cost isThese costs are expected to be recognized over a weighted average period of six2.2 years.
The Company used the Monte Carlo pricing model in determining the fair value of the awards under this incentive plan. Option valuation models require the input of subjective assumptions including expected stock price volatility. The Company's assumptions are based upon its past experiences, market trends and the experiences of other entities of the same size and in similar industries.
16. Income Taxes
Income before income taxes is attributable to the following geographic locations:
| | 2016 | 2015 | 2014 | |||||||
|---|---|---|---|---|---|---|---|---|---|---|
Germany | $ | 205,818 | $ | 134,193 | $ | 243,684 | ||||
United States | 1,626,406 | 1,440,040 | 1,262,570 | |||||||
Other | 399,766 | 361,039 | 337,152 | |||||||
| | | | | | | | | | | |
| $ | 2,231,990 | $ | 1,935,272 | $ | 1,843,406 | |||||
| | | | | | | | | | | |
| | | | | | | | | | | |
| | | | | | | | | | | |
FRESENIUS MEDICAL CARE AG & Co. KGaA
NOTES TO CONSOLIDATED FINANCIAL STATEMENTS — (Continued)
(in thousands, except share and per share data)
18. Income Taxes
Income before income taxes is attributable to the following geographic locations:
| | 2014 | 2013 | 2012 | |||||||
|---|---|---|---|---|---|---|---|---|---|---|
Germany | $ | 243,684 | $ | 234,336 | $ | 263,651 | ||||
United States | 1,262,570 | 1,254,690 | 1,356,094 | |||||||
Other | 337,152 | 358,609 | 312,368 | |||||||
| | | | | | | | | | | |
| $ | 1,843,406 | $ | 1,847,635 | $ | 1,932,113 | |||||
| | | | | | | | | | | |
| | | | | | | | | | | |
| | | | | | | | | | | |
Income tax expense (benefit) for the years ended December 31, 2014, 2013,2016, 2015, and 2012,2014, consisted of the following:
| | 2014 | 2013 | 2012 | 2016 | 2015 | 2014 | ||||||||||||||
|---|---|---|---|---|---|---|---|---|---|---|---|---|---|---|---|---|---|---|---|---|
Current: | ||||||||||||||||||||
Germany | $ | 72,613 | $ | 81,117 | $ | 52,862 | $ | 56,037 | $ | 72,231 | $ | 72,613 | ||||||||
United States | 270,676 | 387,017 | 342,250 | 503,029 | 458,780 | 270,676 | ||||||||||||||
Other | 141,291 | 116,186 | 139,136 | 142,037 | 138,588 | 141,291 | ||||||||||||||
| | | | | | | | | | | | | | | | | | | | | |
| 484,580 | 584,320 | 534,248 | 701,103 | 669,599 | 484,580 | |||||||||||||||
| | | | | | | | | | | | | | | | | | | | | |
Deferred: | ||||||||||||||||||||
Germany | (22,651 | ) | (33,106 | ) | 10,478 | (23,333 | ) | (45,813 | ) | (22,651 | ) | |||||||||
United States | 152,423 | 47,298 | 98,200 | 21,813 | (12,693 | ) | 152,423 | |||||||||||||
Other | (30,754 | ) | (6,500 | ) | (37,790 | ) | (16,444 | ) | 11,030 | (30,754 | ) | |||||||||
| | | | | | | | | | | | | | | | | | | | | |
| 99,018 | 7,692 | 70,888 | (17,964 | ) | (47,476 | ) | 99,018 | |||||||||||||
| | | | | | | | | | | | | | | | | | | | | |
| $ | 583,598 | $ | 592,012 | $ | 605,136 | $ | 683,139 | $ | 622,123 | $ | 583,598 | |||||||||
| | | | | | | | | | | | | | | | | | | | | | |
| | | | | | | | | | | | | | | | | | | | | |
A reconciliation between the expected and actual income tax expense is shown below. The expected corporate income tax expense is computed by applying the German corporation tax rate (including the solidarity surcharge) and the trade tax rate on income before income taxes. The German combined statutory tax rates were 29.20%29.69%, 29.16%29.62% and 28.71%29.20% for the fiscal years ended December 31, 2014, 2013,2016, 2015, and 2012,2014, respectively.
| | 2014 | 2013 | 2012 | 2016 | 2015 | 2014 | ||||||||||||||
|---|---|---|---|---|---|---|---|---|---|---|---|---|---|---|---|---|---|---|---|---|
Expected corporate income tax expense | $ | 538,275 | $ | 538,770 | $ | 554,613 | $ | 662,566 | $ | 573,228 | $ | 538,275 | ||||||||
Tax free income | (39,441 | ) | (64,141 | ) | (90,943 | ) | ||||||||||||||
Tax-free income | (38,008 | ) | (35,715 | ) | (44,658 | ) | ||||||||||||||
Income from equity method investees | (5,476 | ) | (4,869 | ) | (2,133 | ) | (17,314 | ) | (14,272 | ) | (5,476 | ) | ||||||||
Tax rate differentials | 148,294 | 132,977 | 137,527 | 145,801 | 126,263 | 148,294 | ||||||||||||||
Non-deductible expenses | 25,161 | 20,564 | 19,961 | |||||||||||||||||
Nondeductible expenses | 37,251 | 36,406 | 25,161 | |||||||||||||||||
Taxes for prior years | (25,247 | ) | (6,389 | ) | 22,420 | (23,334 | ) | 19,969 | (25,247 | ) | ||||||||||
Change in valuation allowance | 6,284 | 3,154 | (19,680 | ) | 6,600 | (2,571 | ) | 6,284 | ||||||||||||
Noncontrolling partnership interests | (81,594 | ) | (55,023 | ) | (49,081 | ) | (116,818 | ) | (109,470 | ) | (81,594 | ) | ||||||||
Tax on divestitures | — | 14,953 | — | |||||||||||||||||
Other | 17,342 | 26,969 | 32,452 | 26,395 | 13,332 | 22,559 | ||||||||||||||
| | | | | | | | | | | | | | | | | | | | | |
Actual income tax expense | $ | 583,598 | $ | 592,012 | $ | 605,136 | $ | 683,139 | $ | 622,123 | $ | 583,598 | ||||||||
| | | | | | | | | | | | | | | | | | | | | | |
| | | | | | | | | | | | | | | | | | | | | |
Effective tax rate | 31.7 | % | 32.0 | % | 31.3 | % | 30.6 | % | 32.1 | % | 31.7 | % | ||||||||
| | | | | | | | | | | | | | | | | | | | | | |
| | | | | | | | | | | | | | | | | | | | | |
FRESENIUS MEDICAL CARE AG & Co. KGaA
NOTES TO CONSOLIDATED FINANCIAL STATEMENTS — (Continued)
(in thousands, except share and per share data)
The tax effects of the temporary differences and net operating losses that give rise to deferred tax assets and liabilities at December 31, 20142016 and 2013,2015, are presented below:
| | 2014 | 2013 | 2016 | 2015 | ||||||||||
|---|---|---|---|---|---|---|---|---|---|---|---|---|---|---|
Deferred tax assets: | ||||||||||||||
Accounts receivable | $ | 7,007 | $ | 8,789 | $ | 12,543 | $ | 8,850 | ||||||
Inventory | 9,424 | 9,731 | ||||||||||||
Property, plant and equipment, intangible and other non-current assets | 29,144 | 20,093 | ||||||||||||
Inventories | 12,585 | 11,503 | ||||||||||||
Intangible assets | 6,487 | 7,967 | ||||||||||||
Property, plant and equipment and other non-current assets | 25,461 | 28,476 | ||||||||||||
Accrued expenses and other liabilities | 285,333 | 305,664 | 352,999 | 372,365 | ||||||||||
Pensions | 170,659 | 97,958 | ||||||||||||
Pension liabilities | 114,564 | 151,732 | ||||||||||||
Net operating loss carryforwards, tax credit carryforwards and interest carryforwards | 138,934 | 141,727 | 171,294 | 131,640 | ||||||||||
Derivatives | 10,912 | 2,169 | 5,784 | 1,317 | ||||||||||
Stock-based compensation | 11,934 | 22,710 | 6,873 | 3,173 | ||||||||||
Other | 12,407 | 13,632 | 24,403 | 4,018 | ||||||||||
| | | | | | | | | | | | | | | |
Total deferred tax assets | $ | 675,754 | $ | 622,473 | $ | 732,993 | $ | 721,041 | ||||||
Less: valuation allowance | (49,479 | ) | (48,563 | ) | (33,255 | ) | (34,654 | ) | ||||||
| | | | | | | | | | | | | | | |
Net deferred tax assets | $ | 626,275 | $ | 573,910 | $ | 699,738 | $ | 686,387 | ||||||
| | | | | | | | | | | | | | | | |
| | | | | | | | | | | | | | | |
Deferred tax liabilities: | ||||||||||||||
Accounts receivable | $ | 40,453 | $ | 43,031 | $ | 26,480 | $ | 43,664 | ||||||
Inventory | 10,316 | 12,264 | ||||||||||||
Property, plant and equipment, intangible and other non-current assets | 867,677 | 776,254 | ||||||||||||
Inventories | 7,208 | 8,318 | ||||||||||||
Intangible assets | 706,186 | 686,650 | ||||||||||||
Property, plant and equipment and other non-current assets | 166,129 | 129,835 | ||||||||||||
Accrued expenses and other liabilities | 10,368 | 17,197 | 16,231 | 5,575 | ||||||||||
Derivatives | 4,177 | 2,274 | 10,353 | 5,488 | ||||||||||
Other | 146,274 | 117,255 | 236,580 | 242,524 | ||||||||||
| | | | | | | | | | | | | | | |
Total deferred tax liabilities | 1,079,265 | 968,275 | 1,169,167 | 1,122,054 | ||||||||||
| | | | | | | | | | | | | | | |
Net deferred tax assets (liabilities) | $ | (452,990 | ) | $ | (394,365 | ) | $ | (469,429 | ) | $ | (435,667 | ) | ||
| | | | | | | | | | | | | | | | |
| | | | | | | | | | | | | | | |
At December 31, 2016 and December 31, 2015 the item "Other" includes the deferred tax liability in the amount of $86,790 related to the recognized insurance recoveries in relation to the NaturaLyte® and GranuFlo® agreement in principle. For further information, see Note 18 "Commitments and Contingencies – Commercial Litigation".
The valuation allowance increaseddecreased by $916$1,399 in 20142016 and increaseddecreased by $4,372$14,825 in 2013.2015.
FRESENIUS MEDICAL CARE AG & Co. KGaA
NOTES TO CONSOLIDATED FINANCIAL STATEMENTS — (Continued)
(in thousands, except share and per share data)
The net operating losses included in the table below reflect U.S. federal tax, German corporate income tax, and other tax loss carryforwards in the various countries in which we operate:the Company operates, and expire as follows:
2015 | $ | 12,083 | ||||||
2016 | 16,516 | |||||||
2017 | 23,223 | $ | 23,808 | |||||
2018 | 24,469 | 24,033 | ||||||
2019 | 40,685 | 21,179 | ||||||
2020 | 10,150 | 34,464 | ||||||
2021 | 7,216 | 15,619 | ||||||
2022 | 11,811 | 16,056 | ||||||
2023 | 9,434 | 13,597 | ||||||
2024 and thereafter | 33,367 | |||||||
2024 | 14,297 | |||||||
2025 | 13,616 | |||||||
2026 and thereafter | 21,825 | |||||||
Without expiration date | 101,003 | 91,442 | ||||||
| | | | | | | | | |
Total | $ | 289,957 | $ | 289,936 | ||||
| | | | | | | | | | |
| | | | | | | | | |
In assessing the realizability of deferred tax assets, management considers whether it is more-likely-than-not that some portion or all of a deferred tax asset will be realized. The ultimate realization of deferred tax assets is dependent upon the generation of future taxable income during the periods in which those temporary differences and tax loss carryforwards become deductible. Management considers the expected reversal of deferred tax liabilities and projected future taxable income in making this assessment. Based upon the level of historical taxable income and projections for future taxable
FRESENIUS MEDICAL CARE AG & Co. KGaA
NOTES TO CONSOLIDATED FINANCIAL STATEMENTS — (Continued)(in thousands, except share data)
income over the periods in which the deferred tax assets are deductible, management believes it is more-likely-than-not the Company will realize the benefits of these deductible differences, net of the existing valuation allowances at December 31, 2014.2016.
The Company provides for income taxes and foreign withholding taxes on the cumulative earnings of foreign subsidiaries and foreign corporate joint ventures that will not be reinvested. At December 31, 2014,2016, the Company provided for $11,426 (2013: $8,396)$11,497 (2015: $9,273) of deferred tax liabilities associated with earnings that are likely to be distributed in 20152017 and the following years. Provision has not been made for additional taxes on $6,622,324 (2013: $6,269,794)$7,418,713 (2015: $7,463,853) undistributed earnings of foreign subsidiaries as these earnings are considered indefinitely reinvested. The earnings could become subject to additional tax if remitted or deemed remitted as dividends; however calculation of such additional tax is not practicable. These taxes would predominantly comprise foreign withholding tax on dividends of foreign subsidiaries, and German income tax of approximately 1.5% on alltax; however, those dividends and capital gains.gains would generally be 95% tax free for German tax purposes.
FMC-AG & Co. KGaA companies are subject to tax audits in Germany and the U.S. on a regular basis and on-going tax audits in other jurisdictions.
In Germany, the tax audit for the years 2002 through 2005 was completed during 2014 and resulted in payments totaling €76,232 ($101,274 for the period ended December 31, 2014), which had been previously provided for. The tax years 2006 through 20122013 are currently under audit by the tax authorities. The Company recognized and recorded the current proposed adjustments of this audit period in the financial statements. Fiscal years 20132014 until 20142016 are open to audit.
In the U.S., the tax years 2011 and 2012 are currently under audit by the tax authorities. Fiscalfiscal years 2013 until 20142016 are open to audit. FMCH is also subject to audit in various state jurisdictions. A number of these audits are in progress and various years are open to audit in various state jurisdictions. All expected results for both federal and state income tax audits have been recognized in the financial statements.
The Company filed claims for refunds contesting the Internal Revenue Service's ("IRS") disallowance of FMCH's deductions for civil settlement payments taken by FMCH in prior year tax returns. As a result of a settlement agreement with the IRS, the Company received a partial refund in September 2008 of $37,000, inclusive of interest and preserved its right to pursue claims in the United States Courts for refunds of all other disallowed deductions, which totaled approximately $126,000. On December 22, 2008, the Company filed a complaint for complete refund in the United States District Court for the District of Massachusetts, styled asFresenius Medical Care Holdings, Inc. v. United States. On August 15, 2012, a jury entered a verdict for FMCH granting additional deductions of $95,000. On May 31, 2013, the District Court entered final judgment for FMCH in the refund amount of $50,400. On September 18, 2013, the IRS appealed the District Court's ruling to the United States Court of Appeals for the First Circuit (Boston). On August 13, 2014, the United States Court of Appeals for the First Circuit (Boston) affirmed the District Court's order. The District Court judgment became final upon the government's decision not to seek a writ of certiorari from the United States Supreme Court. Accordingly, the Company recorded a net tax benefit of approximately $23,000 in the fourth quarter of 2014.
Subsidiaries of FMC-AG & Co. KGaA in a number of countries outside of Germany and the U.S. are also subject to tax audits. The Company estimates that the effects of such tax audits are not material to these consolidated financial statements.
The following table shows the reconciliation of the beginning and ending amounts of unrecognized tax benefits:
Unrecognized tax benefits (net of interest) | 2014 | 2013 | 2012 | |||||||
|---|---|---|---|---|---|---|---|---|---|---|
Balance at January 1, | $ | 199,924 | $ | 225,198 | $ | 223,829 | ||||
Increases in unrecognized tax benefits prior periods | 35,584 | 25,260 | 13,232 | |||||||
Decreases in unrecognized tax benefits prior periods | (21,143 | ) | (11,445 | ) | (5,913 | ) | ||||
Increases in unrecognized tax benefits current period | 12,600 | 10,062 | 17,903 | |||||||
Changes related to settlements with tax authorities | (60,872 | ) | (52,325 | ) | (14,763 | ) | ||||
Foreign currency translation | 15 | 3,174 | (9,090 | ) | ||||||
| | | | | | | | | | | |
Balance at December 31, | $ | 166,108 | $ | 199,924 | $ | 225,198 | ||||
| | | | | | | | | | | |
| | | | | | | | | | | |
| | | | | | | | | | | |
FRESENIUS MEDICAL CARE AG & Co. KGaA
NOTES TO CONSOLIDATED FINANCIAL STATEMENTS — (Continued)
(in thousands, except share and per share data)
The following table shows the reconciliation of the beginning and ending amounts of unrecognized tax benefits:
Unrecognized tax benefits (excluding interest) | 2016 | 2015 | 2014 | |||||||
|---|---|---|---|---|---|---|---|---|---|---|
Balance at January 1, | $ | 149,289 | $ | 166,108 | $ | 199,924 | ||||
Increases in unrecognized tax benefits prior periods | 27,802 | 30,973 | 35,584 | |||||||
Decreases in unrecognized tax benefits prior periods | (38,707 | ) | (20,244 | ) | (21,143 | ) | ||||
Increases in unrecognized tax benefits current period | 2,287 | — | 12,600 | |||||||
Changes related to settlements with tax authorities | (22,401 | ) | (6,762 | ) | (60,872 | ) | ||||
Reductions as a result of a lapse of the statute of limitations | — | (1,300 | ) | — | ||||||
Foreign currency translation | (298 | ) | (19,486 | ) | 15 | |||||
| | | | | | | | | | | |
Balance at December 31, | $ | 117,972 | $ | 149,289 | $ | 166,108 | ||||
| | | | | | | | | | | |
| | | | | | | | | | | |
| | | | | | | | | | | |
Included in the balance at December 31, 20142016 were $156,368$111,957 of unrecognized tax benefits which would affect the effective tax rate if recognized. The Company is currently not in a position to forecast the timing and magnitude of changes in unrecognized tax benefits.
During the year ended December 31, 20142016 the Company recognized benefits of $13,986$6,594 and in 2013 and 20122015 expenses of $2,155$11,478 and $11,071 in 2014 benefits of $13,986 for interest and penalties, respectively.penalties. At December 31, 20142016 and December 31, 20132015 the Company had a total accrual of income tax related interest and penalties of $1,397$24,938 and $17,580,$27,029, respectively.
19.17. Operating Leases
The Company leases buildings and machinery and equipment under various lease agreements expiring on dates through 2047.2055. Rental expense recorded for operating leases for the years ended December 31, 2016, 2015 and 2014 2013was $824,998, $754,380 and 2012 was $729,387, $670,963 and $617,195, respectively. For information regarding intercompany operating leases, see Note 32 a).
Future minimum rental payments under non-cancelable operating leases for the five years succeeding December 31, 20142016 and thereafter are:
2015 | $ | 661,366 | ||||||
2016 | 583,491 | |||||||
2017 | 477,370 | $ | 740,438 | |||||
2018 | 396,689 | 641,122 | ||||||
2019 | 329,722 | 559,252 | ||||||
2020 | 476,878 | |||||||
2021 | 395,448 | |||||||
Thereafter | 1,130,293 | 1,360,906 | ||||||
| | | | | | | | | |
| 3,578,931 | 4,174,044 | |||||||
| | | | | | | | | | |
| | | | | | | | | |
20.18. Commitments and Contingencies
Legal and Regulatory Matters
The Company is routinely involved in numerous claims, lawsuits, regulatory and tax audits, investigations and other legal matters arising, for the most part, in the ordinary course of its business of providing healthcarehealth care services and products. Legal matters that the Company currently deems to be material or noteworthy are described below. For the matters described below in which the Company believes a loss is both reasonably possible and estimable, an estimate of the loss or range of loss exposure is provided. For the other matters described below, the Company believes that the loss probability is remote and/or the loss or range of possible losses cannot be reasonably estimated at this time. The outcome of litigation and other legal matters is always difficult to predict accurately and outcomes that are not consistent with the Company's view of the merits can occur. The Company believes that it has valid defenses to the legal matters pending against it and is defending itself vigorously. Nevertheless, it is possible that the resolution of one or more of
FRESENIUS MEDICAL CARE AG & Co. KGaA
NOTES TO CONSOLIDATED FINANCIAL STATEMENTS — (Continued)
(in thousands, except share and per share data)
the legal matters currently pending or threatened could have a material adverse effect on its business, results of operations and financial condition.
Commercial Litigation
On August 27, 2012, Baxter Health International Inc. ("Baxter") filed suit in the U.S. District Court for the Northern District of Illinois, styled Baxter International Inc., et al., v. Fresenius Medical Care Holdings, Inc., Case No. 12-cv-06890, alleging that the Company's Liberty® cycler infringes certain U.S. patents that were issued to Baxter between October 2010 and June 2012. The Company believes it has valid defenses to these claims, and will defend this litigation vigorously.
On April 5, 2013, the U.S. Judicial Panel on Multidistrict Litigation ordered that the numerous lawsuits filed and anticipated to be filedpending in various federal courts alleging wrongful death and personal injury claims against FMCH and certain of its affiliates relating to FMCH's acid concentrate products NaturaLyte® and Granuflo®GranuFlo® be transferred and consolidated for pretrial management purposes into a consolidated multidistrict litigation in the United States District Court for the District of Massachusetts. See, In Re: Fresenius Granuflo/Naturalyte Dialysate Products Liability Litigation, Case No. 2013-md-02428. The Massachusetts state courts and the St. Louis City (Missouri) court subsequently established similar consolidated litigation for such cases filed in Massachusetts county courts and St. Louis City court. See, In Re: Consolidated Fresenius Cases, Case No. MICV 2013-03400-O (Massachusetts Superior Court, Middlesex County). These lawsuits alleged generally that inadequate labeling and warnings for these products caused harm to patients. In addition, similar cases were filed in other state courts. On February 17, 2016, the Company reached with a committee of plaintiffs' counsel and reported to the courts an agreement in principle for settlement of potentially all cases. The agreement in principle called for the Company to pay $250,000 into a settlement fund in exchange for releases of all or substantially all of the plaintiffs' claims, subject to the Company's right to void the settlement under certain conditions, including if more than 3% of all plaintiffs rejected the settlement or the distribution of rejecters met certain criteria.
As subsequently agreed between the Company and the plaintiff committee, and ordered by the courts, plaintiffs may enforce the settlement and compel payment by the Company if the total of cases electing to participate in the settlement or dismissed by the courts with prejudice, voluntarily or involuntarily, comes to comprise 97% of all cases. The courts are entering "Lone Pine" orders requiring plaintiffs, on pain of dismissal, who have not elected to participate in the settlement to submit specific justification satisfactory to the courts for their complaints, including attorney verification of certain material factual representations and expert medical opinions relating to causation. The Company may elect to void the settlement as of May 10, 2017 if the 97% threshold has not been achieved or if plantiffs' non-participation falls into suspect patterns. Incidental change to this date is likely. Trials in cases not participating in the settlement may resume as scheduled in the discretion of their respective courts. The Company expects that, in combination with elections to participate and notices of dismissal already submitted, theLone Pine procedure will result in confirmation of the settlement.
The Company's affected insurers have agreed to fund $220,000 of the settlement fund if the settlement is not voided, with a reservation of rights regarding certain coverage issues between and among the Company and its insurers. The Company has accrued a net expense of $60,000 for consummation of the settlement, including legal fees and other anticipated costs.
Subsequent to the agreement in principle, the Company's insurers in the AIG group initiated an action for declaratory judgment in New York state court advancing various arguments for reducing the amount of their coverage obligations. The Company filed an action in Massachusetts state court seeking to compel the AIG group carriers to honor their obligations under applicable policies, including reimbursement to the Company of litigation defense costs incurred before the agreement in principle was reached. The affected carriers have confirmed that the coverage litigation does not impact their commitment to fund $220,000 of the settlement with plaintiffs.
Certain of the complaints in the Granuflo®/Naturalyte® litigation named combinations of FMC-AG & Co. KGaA, Management AG, Fresenius SE and Fresenius Management SE as defendants, in addition to FMCH and its domestic United States affiliates. The agreement in principle provides for dismissals and releases of claims encompassing the European defendants.
Four institutional plaintiffs have filed complaints against FMCH or its affiliates under state deceptive practices statutes resting on certain background allegations common to the GranuFlo®/NaturaLyte® personal injury litigation, but seeking as remedy the repayment of sums paid to FMCH attributable to the Granuflo®/Naturalyte® products. These cases implicate different legal standards, theories of liability and
FRESENIUS MEDICAL CARE AG & Co. KGaA
NOTES TO CONSOLIDATED FINANCIAL STATEMENTS — (Continued)
(in thousands, except share and per share data)
styled In Re: Fresenius Granuflo/Naturalyte Dialysate Products Liability Litigation, Case No. 2013-md-02428. The Massachusetts state courts subsequently established a similar consolidated litigation for such cases filed in Massachusetts county courts, styled In Re: Consolidated Fresenius Cases, Case No. MICV 2013-03400-O (Massachusetts Superior Court, Middlesex County). These lawsuits allege generally that inadequate labeling and warnings for these products caused harm to patients. In addition, similar cases have been filed in several state courts outside Massachusetts, in someforms of which the judicial authorities have established consolidated proceedings for their disposition. The attorneys general of Louisiana and Mississippi have also filed complaints under their state deceptive practice statutes and in their state courts based on allegations similar topotential recovery from those advanced in the personal injury litigation. FMCH believes that these lawsuitslitigation and their claims will not be extinguished by the personal injury litigation settlement described above. The four plaintiffs are without merit,the Attorneys General for the States of Kentucky, Louisiana and will defend them vigorously.Mississippi and the commercial insurance company Blue Cross Blue Shield of Louisiana in its private capacity.See, State of Mississippi ex rel. Hood, v. Fresenius Medical Care Holdings, Inc., No. 14-cv-152 (Chancery Court, DeSoto County); State of Louisiana ex re. Caldwell and Louisiana Health Service & Indemnity Company v. Fresenius Medical Care Airline, 2016 Civ. 11035 (U.S.D.C. D. Mass.); Commonwealth of Kentucky ex rel. Beshear v. Fresenius Medical Care Holdings, Inc. et al., No. 16-CI-00946 (Circuit Court, Franklin County).
Other Litigation and Potential Exposures
On February 15, 2011, a whistleblower (relator) action under the False Claims Act against FMCH was unsealed by order of the United States District Court for the District of Massachusetts and served by the relator. The United States has not intervened in the caseSee, United States ex rel. Chris Drennen v. Fresenius Medical Care Holdings, Inc., 2009 Civ. 10179 (D. Mass.). The United States did not intervene initially in the case. The relator's complaint, which was first filed under seal in February 2009, allegesalleged that the Company seekssought and receivesreceived reimbursement from government payors for serum ferritin and multiple forms of hepatitis B laboratory tests that arewere medically unnecessary or not properly ordered by a physician. Discovery on the relator's complaint closed in May 2015. On MarchOctober 2, 2015, the United States Attorney moved to intervene on the relator's complaint with respect only to certain Hepatitis B surface antigen tests performed prior to 2011, when Medicare reimbursement rules for such tests changed. FMCH opposed the government's motion to intervene, which remains undecided.
On October 6, 2015, the Office of Inspector General of the United States Department of Health and Human Services ("OIG") issued a subpoena to the Company seeking information about utilization and invoicing by Fresenius Vascular Care facilities as a whole for a period beginning after the Company's acquisition of American Access Care LLC in October 2011 ("AAC"). The Company is cooperating in the government's inquiry, which is being managed by the United States Attorney for the Eastern District of Massachusetts issued a subpoena seeking the production of documents related to the same laboratory tests that are the subject of the relator's complaint. FMCH has cooperated fullyNew York. Allegations against AAC arising in responding to the subpoena, and will vigorously contest the relator's complaint.
Subpoenas or search warrants have been issued by federal and state law enforcement authorities under the supervision of the United States Attorneys for the Districts ofdistricts in Connecticut, Southern Florida Eastern Virginia and Rhode Island to American Access Care LLC ("AAC"), which the Company acquired in October 2011, and to the Company's subsidiary, Fresenius Vascular Care, Inc., which now operates former AAC centers as well as its own original facilities. Subpoenas have also been issued to certain of the Company's outpatient hemodialysis facilities for records relating to vascular access treatmentutilization and monitoring. The Company is cooperating fullyinvoicing were settled in these investigations. Communications with certain of the investigating United States Attorney Offices indicate that the inquiry encompasses invoicing and coding for procedures commonly performed in vascular access centers and the documentary support for the medical necessity of such procedures. The AAC acquisition agreement contains customary indemnification obligations with respect to breaches of representations, warranties or covenants and certain other specified matters. As of October 18, 2013, a group of the prior owners of AAC exercised their right pursuant to the terms of the acquisition agreement to assume responsibility for responding to certain of the subpoenas. Pursuant to the AAC acquisition agreement the prior owners are obligated to indemnify the Company for certain liabilities that might arise from those subpoenas. On February 9, 2015, the Company reached an agreement in principle with the United States Attorney for the Southern District of Florida to resolve the Southern Florida (Miami) investigation, which arose from allegations made in whistleblower actions filed under seal in July 2011. Under the settlement, which remains contingent on judicial approval, the Company will pay $1.2 million to the United States. The settlement and whistleblower complaint relate to actions prior to the Company's acquisition of AAC by a physician no longer associated with the Company.2015.
The Company has received communications alleging conduct in countries outside the U.S. and Germany that may violate the U.S. Foreign Corrupt Practices Act ("FCPA") or other anti-bribery laws. The Audit and Corporate Governance Committee of the Company's Supervisory Board is conducting an investigationinvestigations with the assistance of independent counsel. The Company voluntarily advised the U.S. Securities and Exchange Commission ("SEC") and the U.S. Department of Justice ("DOJ"). The Company's investigationinvestigations and dialogue with the SEC and DOJ are ongoing. The Company has received a subpoena from the SEC requesting additional documents and a request from the DOJ for copies of the documents provided to the SEC. The Company is cooperating with the requests.government investigations.
Conduct has been identified that may result in monetary penalties or other sanctions under the FCPA or other anti-bribery laws. In addition, the Company's ability to conduct business in certain jurisdictions
FRESENIUS MEDICAL CARE AG & Co. KGaA
NOTES TO CONSOLIDATED FINANCIAL STATEMENTS — (Continued)(in thousands, except share data)
could be negatively impacted. The Company has previously recorded a non-material accrual for an identified matter. Given the current status of the investigationinvestigations and remediation activities, the Company cannot reasonably estimate the range of possible loss that may result from identified matters or from the final outcome of the investigationinvestigations or remediation activities.
The Company's independent counsel, in conjunction with the Company's Compliance Department, has reviewed the Company'sCompany is implementing enhancements to its anti-corruption compliance program, including internal controls related to compliance with international anti-bribery laws, and appropriate enhancements are being implemented.laws. The Company iscontinues to be fully committed to FCPA and other anti-bribery law compliance.
In December 2012, FMCH received a subpoena from the United States Attorney for the District of Massachusetts requesting production of a broad range of documents related to products manufactured by FMCH, electron-beam sterilization of dialyzers and the Liberty peritoneal dialysis cycler. FMCH has cooperated fully in the government's investigation. In December 2014, FMCH was advised that the government's investigation was precipitated by a whistleblower, who first filed a complaint under seal in June 2013. In September 2014, the government declined to intervene in the whistleblower's actions.
In January 2013, FMCH received a subpoena from the United States Attorney for the Western District of Louisiana requesting discovery responses relating to the Granuflo® and Naturalyte® acid concentrate products that are also the subject of personal injury litigation described above. FMCH has cooperated fully in the government's investigation.
On June 13, 2014, the Ministry of Commerce of the People's Republic of China, (MOFCOM) launched an anti-dumping investigation into producers of hemodialysis equipment in the European Union and Japan, which includes certain of the Company's subsidiaries. On December 17, 2014 the MOFCOM announced the termination of the investigation after the complaint had been withdrawn by the petitioner.
The Company filed claims for refunds contesting the Internal Revenue Service's ("IRS") disallowance of FMCH's deductions for civil settlement payments taken by FMCH in prior year tax returns. As a result of a settlement agreement with the IRS, the Company received a partial refund in September 2008 of $37,000, inclusive of interest and preserved its right to pursue claims in the United States Courts for refunds of all other disallowed deductions, which totaled approximately $126,000. On December 22, 2008, the Company filed a complaint for complete refund in the United States District Court for the District of Massachusetts, styled asFresenius Medical Care Holdings, Inc. v. United States. On August 15, 2012, a jury entered a verdict for FMCH granting additional deductions of $95,000. On May 31, 2013, the District Court entered final judgment for FMCH in the refund amount of $50,400. On September 18, 2013, the IRS appealed the District Court's ruling to the United States Court of Appeals for the First Circuit (Boston). On August 13, 2014, the United States Court of Appeals for the First Circuit (Boston) affirmed the District Court's order. The District Court judgment became final upon the government's decision not to seek a writ of certiorari from the United States Supreme Court.
In August 2014, FMCH received a subpoena from the United States Attorney for the District of Maryland inquiring into FMCH's contractual arrangements with hospitals and physicians, including contracts relating to the management of in-patient acute dialysis services. FMCH is cooperating in the investigation.
In July 2015, the Attorney General for Hawaii issued a civil complaint under the Hawaii False Claims Act alleging a conspiracy pursuant to which certain Liberty subsidiaries of FMCH overbilled Hawaii Medicaid for Liberty's Epogen® administrations to Hawaii Medicaid patients during the period from 2006
FRESENIUS MEDICAL CARE AG & Co. KGaA
NOTES TO CONSOLIDATED FINANCIAL STATEMENTS — (Continued)
(in thousands, except share and per share data)
through 2010, prior to the time of FMCH's acquisition of Liberty.See, Hawaii v. Liberty Dialysis – Hawaii, LLC et al., Case No. 15-1-1357-07 (Hawaii 1st Circuit). The State alleges that Liberty acted unlawfully by relying on incorrect and unauthorized billing guidance provided to Liberty by Xerox State Healthcare LLC, which acted as Hawaii's contracted administrator for its Medicaid program reimbursement operations during the relevant period. The amount of the overpayment claimed by the State is approximately $8,000, but the State seeks civil remedies, interest, fines, and penalties against Liberty and FMCH under the Hawaii False Claims Act substantially in excess of the overpayment. FMCH filed third-party claims for contribution and indemnification against Xerox. The State's False Claims Act complaint was filed after Liberty initiated an administrative action challenging the State's recoupment of alleged overpayments from sums currently owed to Liberty. The civil litigation and administrative action are proceeding in parallel.
On August 31 and November 25, 2015, respectively, FMCH received subpoenas from the United States Attorneys for the District of Colorado and the Eastern District of New York inquiring into FMCH's participation in and management of dialysis facility joint ventures in which physicians are partners. FMCH is cooperating in the investigations.
On June 30, 2016, FMCH received a subpoena from the United States Attorney for the Northern District of Texas (Dallas) seeking information about the use and management of pharmaceuticals including Velphoro® as well as FMCH's interactions with DaVita Healthcare Partners, Inc. The Company understands that the subpoena relates to an investigation previously disclosed by DaVita and that the investigation encompasses DaVita, Amgen, and Sanofi. FMCH is cooperating in the investigation.
On November 18, 2016, FMCH received a subpoena from the United States Attorney for the Eastern District of New York seeking documents and information relating to the operations of Shiel Medical Laboratory, Inc., which FMCH acquired in October 2013. In the course of cooperating in the investigation and preparing to respond to the subpoena, FMCH has identified falsifications and misrepresentations in documents submitted by a Shiel salesperson that relate to the integrity of certain invoices submitted by Shiel for laboratory testing for patients in long term care facilities. On February 21, 2017, Fresenius Medical Care North America ("FMCNA") initiated termination of the employee and notification to the United States Attorney of the termination and its circumstances. The Company cannot at this time determine the scope of the conduct implicated in the employee's termination, or whether related liability for overpayments or penalties under the False Claims Act might be material.
On January 3, 2017, the Company received a subpoena from the United States Attorney for the District of Massachusetts inquiring into the Company's interactions and relationships with the American Kidney Fund, including the Company's charitable contributions to the Fund and the Fund's financial assistance to patients for insurance premiums. FMCH is cooperating in the investigation.
On December 14, 2016, CMS published an Interim Final Rule ("IFR") titled "Medicare Program; Conditions for Coverage for End-Stage Renal Disease Facilities-Third Party Payment" that would amend the Conditions for Coverage for dialysis providers, like FMCNA. The IFR would have effectively enabled insurers to reject premium payments made by patients who received grants for individual market coverage from the AKF and therefore, could have resulted in those patients losing their individual market coverage. The loss of individual market coverage for these patients would have had a material and adverse impact on the operating results of the Company.
On January 25, 2017, a federal district court in Texas, responding to litigation initiated by a patient advocacy group and dialysis providers including FMCNA, preliminarily enjoined CMS from implementing the IFR. Dialysis Patient Citizens v. Burwell (E.D. Texas, Sherman Div.). The preliminary injunction is based on CMS' failure to follow appropriate notice-and-comment procedures in adopting the IFR. The preliminary injunction will remain in place in the absence of a contrary ruling by the district or appellate courts.
At this time, the extent to which CMS will continue to contest the preliminary injunction is unclear. It is also unclear whether CMS will elect to pursue, through notice and comment, another rule related to this topic. The operation of charitable assistance programs is also receiving increased attention by state regulators, including State Departments of Insurance. The result may be a regulatory framework that
FRESENIUS MEDICAL CARE AG & Co. KGaA
NOTES TO CONSOLIDATED FINANCIAL STATEMENTS — (Continued)
(in thousands, except share and per share data)
differs from state to state. Even in the absence of the IFR or similar administrative actions, insurers are expected to continue to take steps to thwart the premium assistance provided to our patients for individual market plans as well as other insurance coverages.
From time to time, the Company is a party to or may be threatened with other litigation or arbitration, claims or assessments arising in the ordinary course of its business. Management regularly analyzes current information including, as applicable, the Company's defenses and insurance coverage and, as necessary, provides accruals for probable liabilities for the eventual disposition of these matters.
The Company, like other healthcare providers, insurance plans and suppliers, conducts its operations under intense government regulation and scrutiny. It must comply with regulations which relate to or govern the safety and efficacy of medical products and supplies, the marketing and distribution of such products, the operation of manufacturing facilities, laboratories, and dialysis clinics and other health care facilities, and environmental and occupational health and safety. With respect to its development, manufacture, marketing and distribution of medical products, if such compliance is not maintained, the Company could be subject to significant adverse regulatory actions by the FDAU.S. Food and Drug Administration ("FDA") and comparable regulatory authorities outside the U.S. These regulatory actions could include
FRESENIUS MEDICAL CARE AG & Co. KGaA
NOTES TO CONSOLIDATED FINANCIAL STATEMENTS — (Continued)(in thousands, except share data)
warning letters or other enforcement notices from the FDA, and/or comparable foreign regulatory authority which may require the Company to expend significant time and resources in order to implement appropriate corrective actions. If the Company does not address matters raised in warning letters or other enforcement notices to the satisfaction of the FDA and/or comparable regulatory authorities outside the U.S., these regulatory authorities could take additional actions, including product recalls, injunctions against the distribution of products or operation of manufacturing plants, civil penalties, seizures of the Company's products and/or criminal prosecution. FMCH is currently engaged in remediation efforts with respect to threeone pending FDA warning letters.letter. The Company must also comply with the laws of the United States, including the federal Anti-Kickback Statute, the federal False Claims Act, the federal Stark Law, the federal Civil Monetary Penalties Law and the federal Foreign Corrupt Practices Act as well as other federal and state fraud and abuse laws. Applicable laws or regulations may be amended, or enforcement agencies or courts may make interpretations that differ from the Company's interpretations or the manner in which it conducts its business. Enforcement has become a high priority for the federal government and some states. In addition, the provisions of the False Claims Act authorizing payment of a portion of any recovery to the party bringing the suit encourage private plaintiffs to commence whistleblower actions. By virtue of this regulatory environment, the Company's business activities and practices are subject to extensive review by regulatory authorities and private parties, and continuing audits, subpoenas, other inquiries, claims and litigation relating to the Company's compliance with applicable laws and regulations. The Company may not always be aware that an inquiry or action has begun, particularly in the case of whistleblower actions, which are initially filed under court seal.
The Company operates many facilities and handles personal health information of its patients and beneficiaries throughout the United States and other parts of the world. In such a decentralized system, it is often difficult to maintain the desired level of oversight and control over the thousands of individuals employed by many affiliated companies. The Company relies upon its management structure, regulatory and legal resources, and the effective operation of its compliance program to direct, manage and monitor the activities of these employees. On occasion, the Company may identify instances where employees or other agents deliberately, recklessly or inadvertently contravene the Company's policies or violate applicable law. The actions of such persons may subject the Company and its subsidiaries to liability under the Anti-Kickback Statute, the Stark Law, the False Claims Act, Health Insurance Portability and Accountability Act, the Health Information Technology for Economic and Clinical Health Act and the Foreign Corrupt Practices Act, among other laws and comparable laws of other countries.
Physicians, hospitals and other participants in the healthcare industry are also subject to a large number of lawsuits alleging professional negligence, malpractice, product liability, worker's compensation or related claims, many of which involve large claims and significant defense costs. The Company has been and is currently subject to these suits due to the nature of its business and expects that those types of lawsuits may continue. Although the Company maintains insurance at a level which it believes to be prudent, it cannot assure that the coverage limits will be adequate or that insurance will cover all asserted
FRESENIUS MEDICAL CARE AG & Co. KGaA
NOTES TO CONSOLIDATED FINANCIAL STATEMENTS — (Continued)
(in thousands, except share and per share data)
claims. A successful claim against the Company or any of its subsidiaries in excess of insurance coverage could have a material adverse effect upon it and the results of its operations. Any claims, regardless of their merit or eventual outcome, could have a material adverse effect on the Company's reputation and business.
The Company has also had claims asserted against it and has had lawsuits filed against it relating to alleged patent infringements or businesses that it has acquired or divested. These claims and suits relate both to operation of the businesses and to the acquisition and divestiture transactions. The Company has, when appropriate, asserted its own claims, and claims for indemnification. A successful claim against the Company or any of its subsidiaries could have a material adverse effect upon its business, financial condition, and the results of its operations. Any claims, regardless of their merit or eventual outcome, could have a material adverse effect on the Company's reputation and business.
In additionThe Company is also subject to ongoing and future tax audits in the U.S., Germany and other jurisdictions. With respect to other potential adjustments and disallowances of tax matters currently under review, the Company does not anticipate that an unfavorable ruling could have a material impact on its results of operations. The Company is not currently able to determine the timing of these potential additional tax payments.
Other than those individual contingent liabilities mentioned above, as well as in Note 4 and 19, the current estimated amount of the Company's other known individual contingent liabilities is immaterial.
FRESENIUS MEDICAL CARE AG & Co. KGaA
NOTES TO CONSOLIDATED FINANCIAL STATEMENTS — (Continued)
(in thousands, except share and per share data)
21.19. Financial Instruments
Non-derivative Financial Instruments
The following table presents the carrying amounts and fair values of the Company's non-derivative financial instruments at December 31, 2014,2016, and December 31, 2013.2015.
| | | 2014 | 2013 | | 2016 | 2015 | |||||||||||||||||||||||||
|---|---|---|---|---|---|---|---|---|---|---|---|---|---|---|---|---|---|---|---|---|---|---|---|---|---|---|---|---|---|---|---|
| | Fair Value Hierarchy | Carrying Amount | Fair Value | Carrying Amount | Fair Value | Fair Value Hierarchy | Carrying Amount | Fair Value | Carrying Amount | Fair Value | |||||||||||||||||||||
Assets | |||||||||||||||||||||||||||||||
Cash and cash equivalents | 1 | $ | 633,855 | $ | 633,855 | $ | 682,777 | $ | 682,777 | 1 | $ | 747,233 | $ | 747,233 | $ | 549,500 | $ | 549,500 | |||||||||||||
Accounts receivable(1)(2) | 2 | 3,431,672 | 3,431,672 | 3,220,518 | 3,220,518 | ||||||||||||||||||||||||||
Available for sale financial assets | 1 | 171,917 | 171,917 | 38,949 | 38,949 | ||||||||||||||||||||||||||
Notes Receivables | 3 | 180,250 | 180,308 | 165,807 | 175,768 | ||||||||||||||||||||||||||
Trade accounts receivable(1) | 2 | 3,540,124 | 3,540,124 | 3,303,456 | 3,303,456 | ||||||||||||||||||||||||||
Accounts receivable from related parties | 2 | 220,797 | 220,797 | 218,285 | 218,285 | ||||||||||||||||||||||||||
Available for sale financial assets(2) | 1 | 270,310 | 270,310 | 275,770 | 275,770 | ||||||||||||||||||||||||||
Other financial assets(2) | 2 | 442,163 | 442,163 | 376,035 | 376,035 | ||||||||||||||||||||||||||
Liabilities |
| ||||||||||||||||||||||||||||||
Accounts payable(1) | 2 | $ | 713,915 | $ | 713,915 | $ | 666,526 | $ | 666,526 | 2 | $ | 606,800 | $ | 606,800 | $ | 627,828 | $ | 627,828 | |||||||||||||
Short-term borrowings(1) | 2 | 138,050 | 138,050 | 158,990 | 158,990 | ||||||||||||||||||||||||||
Long term debt, excluding Amended 2012 Credit Agreement, Senior Notes, Convertible Bonds and Euro Notes | 2 | 527,062 | 527,062 | 679,847 | 679,847 | ||||||||||||||||||||||||||
Accounts payable to related parties | 2 | 278,355 | 278,355 | 153,023 | 153,023 | ||||||||||||||||||||||||||
Other current financial liabilities(3) | 2 | 1,351,590 | 1,351,590 | 1,330,283 | 1,330,283 | ||||||||||||||||||||||||||
Short-term debt(4) | 2 | 605,656 | 605,745 | 128,304 | 128,304 | ||||||||||||||||||||||||||
Long term debt, excluding Amended 2012 Credit Agreement, Senior Notes and Convertible Bonds | 2 | 275,612 | 276,647 | 172,919 | 172,919 | ||||||||||||||||||||||||||
Amended 2012 Credit Agreement | 2 | 2,900,222 | 2,900,222 | 2,707,145 | 2,710,270 | 2 | 2,365,522 | 2,370,539 | 2,611,580 | 2,625,591 | |||||||||||||||||||||
Senior Notes | 2 | 5,514,947 | 5,992,859 | 4,824,753 | 5,348,679 | 2 | 4,923,476 | 5,317,087 | 5,325,618 | 5,782,937 | |||||||||||||||||||||
Convertible Bonds | 2 | 451,653 | 531,193 | — | — | 2 | 401,333 | 529,087 | 407,705 | 546,057 | |||||||||||||||||||||
Euro Notes | 2 | — | — | 46,545 | 47,423 | ||||||||||||||||||||||||||
Variable payments outstanding for acquisitions(3) | 3 | 235,596 | 235,596 | 55,660 | 55,660 | ||||||||||||||||||||||||||
Noncontrolling interests subject to put provisions | 3 | 824,658 | 824,658 | 648,251 | 648,251 | 3 | 1,234,888 | 1,234,888 | 1,023,755 | 1,023,755 | |||||||||||||||||||||
The carrying amounts in the table are included in the Consolidated Balance Sheets under the indicated captions or, in the case of long-term debt and noncontrolling interests subject to put provisions, in the captions shown in Note 11.9 and Note 11, respectively.
The significant methods and assumptions used in estimating the fair values of non-derivative financial instruments are as follows:
Cash and cash equivalents are stated at nominal value which equals the fair value.
Short-term financial instruments such as trade accounts receivable, accounts receivable from related parties, accounts payable, accounts payable to related parties and short-term borrowingsdebt as well as certain other financial instruments are valued at their carrying amounts, which are reasonable estimates of the fair value due to the relatively short period to maturity of these instruments.
FRESENIUS MEDICAL CARE AG & Co. KGaA
NOTES TO CONSOLIDATED FINANCIAL STATEMENTS — (Continued)
(in thousands, except share and per share data)
The fair value of available for sale financial assets quoted in an active market is based on price quotations at the period-end date.
The valuation of notes receivable was determined using significant unobservable inputs. They were valued using a constructed index based upon similar instruments with comparable credit ratings, terms, tenor, interest rates and that are within the Company's industry. The Company tracked the prices of the constructed index from the note issuance date to the reporting date to determine fair value. See Note 8 for further information on the long-term notes receivable.
The fair values of major long-term financial liabilitiesdebt are calculated on the basis of market information. Instruments for which market quotes are available are measured using these quotes. The fair values of the other long-term financial liabilitiesdebt are calculated at the present value of the respective future cash flows. To determine these present values, the prevailing interest rates and credit spreads for the Company as of the balance sheet date are used.
FRESENIUS MEDICAL CARE AG & Co. KGaA
NOTES TO CONSOLIDATED FINANCIAL STATEMENTS — (Continued)(in thousands, except share data)the individual fair values is based on the key inputs of the arrangement that determine the future contingent payment as well as the Company's expectation of these factors. The Company assesses the likelihood and timing of achieving the relevant objectives. The underlying assumptions are reviewed regularly.
The valuation of noncontrolling interests subject to put provisions is determined using significant unobservable inputs. See Note 1311 for a discussion of the Company's methodology for estimating the fair value of these noncontrolling interests subject to put obligations.
Currently, there is no indication that a decrease in the value of the Company's financing receivables is probable. Therefore, the allowances on credit losses of financing receivables are immaterial.
Derivative Financial Instruments
The Company is exposed to market risk from changes in foreign exchange rates and interest rates. In order to manage the risk of currency exchange rate and interest rate fluctuations, the Company enters into various hedging transactions by means of derivative instruments with highly rated financial institutions as authorized by the Company's General Partner. On a quarterly basis, the Company performs an assessment of its counterparty credit risk. The Company currently considers this risk to be low. The Company's policy, which has been consistently followed, is that financial derivatives be used only for the purpose of hedging foreign currency and interest rate exposure.
In certain instances, the Company enters into derivative contracts that do not qualify for hedge accounting but are utilized for economic purposes ("economic hedges"). The Company does not use financial instruments for trading purposes.
The Company established guidelines for risk assessment procedures and controls for the use of financial instruments. They include a clear segregation of duties with regard to execution on one side and administration, accounting and controlling on the other.
To reduce the credit risk arising from derivatives the Company concluded Master Netting Agreements with banks. Through such agreements, positive and negative fair values of the derivative contracts could be offset against one another if a partner becomes insolvent. This offsetting is valid for transactions where the aggregate amount of obligations owed to and receivable from are not equal. If insolvency occurs, the party which owes the larger amount is obliged to pay the other party the difference between the amounts owed in the form of one net payment.
The Company elects not to offset the fair values of derivative financial instruments subject to master netting agreements in theits Consolidated Balance Sheets.
At December 31, 20142016 and December 31, 2013,2015, the Company had $26,820$25,627 and $18,334$24,366, respectively, of derivative financial assets subject to netting arrangements and $52,380$28,198 and $16,371$12,765 of derivative financial liabilities subject to netting arrangements. Offsetting these derivative financial instruments would have resulted in net assets of $13,856$14,413 and $12,169$16,273 as well as net liabilities of $39,416$16,984 and $10,207$4,672 at December 31, 20142016 and December 31, 2013,2015, respectively.
In connection with the issuance of the Convertible Bonds in September 2014, the Company purchased Share Options. Any increase ofchange in the Company's share price above the conversion price would be offset by a corresponding value increase ofchange in the Share Options (see Note 11).Options.
FRESENIUS MEDICAL CARE AG & Co. KGaA
NOTES TO CONSOLIDATED FINANCIAL STATEMENTS — (Continued)
(in thousands, except share and per share data)
Foreign Exchange Risk Management
The Company conducts business on a global basis in various currencies, though a majority of its operations are in Germany and the United States. For financial reporting purposes, the Company has chosen the U.S. dollar as its reporting currency. Therefore, changes in the rate of exchange between the U.S. dollar and the local currencies in which the financial statements of the Company's international operations are maintained affect its results of operations and financial position as reported in its consolidated financial statements.
The Company's exposureAdditionally, individual subsidiaries are exposed to market risk for changes in foreign exchange rates relates to transactions such as salestransactional risks mainly resulting from intercompany purchases between production sites and purchases. The Company has significant amounts of sales of products invoiced in euro from its European manufacturing facilities to its other international operations and, to a lesser extent, sales of products invoiced in other non-functionalsubsidiaries with different functional currencies. This exposes the subsidiaries to fluctuations in the rate of exchange between the euroinvoicing currencies and the currency in which their local operations are conducted. For the
FRESENIUS MEDICAL CARE AG & Co. KGaA
NOTES TO CONSOLIDATED FINANCIAL STATEMENTS — (Continued)(in thousands, except share data)
purpose of hedging existing and foreseeable foreign exchange transaction exposures, the Company enters into foreign exchange forward contracts and, on a small scale, foreign exchange options. At December 31, 20142016 and December 31, 20132015 the Company had no foreign exchange options.
Changes in the fair value of the effective portion of foreign exchange forward contracts designated and qualifying as cash flow hedges of forecasted product purchases and sales are reported in AOCI. Additionally, in connection with intercompany loans in foreign currency, the Company uses foreign exchange swaps thus assuring that no foreign exchange risks arise from those loans, which, if they qualify for cash flow hedge accounting, are also reported in AOCI. These amounts recorded in AOCI are subsequently reclassified into earnings as a component of cost of revenues for those contracts that hedge product purchases and sales or as an adjustment of interest income/expense for those contracts that hedge loans, in the same period in which the hedged transaction affects earnings. The notional amounts of foreign exchange contracts in place that are designated and qualify as cash flow hedges totaled $401,555$108,950 and $238,983$193,880 at December 31, 20142016 and December 31, 2013,2015, respectively.
The Company also enters into derivative contracts for forecasted product purchases and sales and for intercompany loans in foreign currency thatcurrencies which do not qualify for hedge accounting but are utilized for economic hedges as defined above. In these two cases, the change in value of the economic hedge is recorded in the income statement and usually offsets the change in value recorded in the income statement for the underlying asset or liability. The notional amounts of economic hedges that do not qualify for hedge accounting totaled $1,568,928$1,483,763 and $1,512,559$1,637,129 at December 31, 20142016 and December 31, 2013,2015, respectively.
Interest Rate Risk Management
The Company enters into derivatives, particularly interest rate swaps and, to a certain extent, interest rate options, to protect against the risk of rising interest rates. These interest rate derivatives are designated as cash flow hedges and have been entered into in order to effectively convert payments based on variable interest rates into payments at a fixed interest rate. The euro-denominated interest rate swaps expire between 2016 andin 2019 and have a weighted average interest rate of 0.68%0.32%. Interest payable and receivable under the swap agreements is accrued and recorded as an adjustment to interest expense.
At December 31, 2014 and December 31, 2013, the notional amount of the euro-denominated interest rate swaps in place was €394,000 and €100,000 ($478,355 and $137,910 at December 31, 2014 and December 31, 2013, respectively). These interest rate swaps include swaps with a notional amount of €294,000 which became effective on January 30, 2015.
In addition, the Company also enters into interest rate hedges ("pre-hedges") in anticipation of future debt issuance, from time to time. These pre-hedges are used to hedge interest rate exposures with regard to interest rates which are relevant for the future debt issuance and which could rise until the debt is actually issued. These pre-hedges were settled at the issuance date of the corresponding debt with the settlement amount recorded in AOCI amortized to interest expense over the life of the pre-hedges. At December 31, 2014 and December 31, 2013, the Company had $85,675 and $118,844, respectively, related to such settlements of pre-hedges deferred in AOCI, net of tax.
FRESENIUS MEDICAL CARE AG & Co. KGaA
NOTES TO CONSOLIDATED FINANCIAL STATEMENTS — (Continued)
(in thousands, except share and per share data)
At December 31, 2016 and December 31, 2015, the notional amount of the euro-denominated interest rate swaps in place was €252,000 and €376,000 ($265,633 and $409,351 at December 31, 2016 and December 31, 2015, respectively).
In addition, the Company also enters into interest rate hedges ("pre-hedges") in anticipation of future long-term debt issuance, from time to time. These pre-hedges are used to hedge interest rate exposures with regard to interest rates which are relevant for the future long-term debt issuance and which could rise until the respective debt is actually issued. These pre-hedges were settled at the issuance date of the corresponding long-term debt with the settlement amount recorded in AOCI amortized to interest expense over the life of the debt. At December 31, 2016 and December 31, 2015, the Company had $37,752 and $58,581, respectively, related to such settlements of pre-hedges deferred in AOCI, net of tax.
Derivative Financial Instruments Valuation
The following table shows the carrying amounts of the Company's derivatives at December 31, 20142016 and December 31, 2013.2015.
| | 2014 | 2013 | 2016 | 2015 | ||||||||||||||||||||||
|---|---|---|---|---|---|---|---|---|---|---|---|---|---|---|---|---|---|---|---|---|---|---|---|---|---|---|
| | Assets(2) | Liabilities(2) | Assets(2) | Liabilities(2) | Assets(2) | Liabilities(2) | Assets(2) | Liabilities(2) | ||||||||||||||||||
Derivatives in cash flow hedging relationships(1) | ||||||||||||||||||||||||||
Current | ||||||||||||||||||||||||||
Foreign exchange contracts | 2,659 | (24,509 | ) | 4,985 | (2,719 | ) | 2,127 | (4,323 | ) | 3,114 | (2,921 | ) | ||||||||||||||
Interest rate contracts | — | — | — | (1,637 | ) | |||||||||||||||||||||
Non-current | ||||||||||||||||||||||||||
Foreign exchange contracts | — | (77 | ) | 759 | (374 | ) | 18 | (80 | ) | 171 | (127 | ) | ||||||||||||||
Interest rate contracts | — | (4,779 | ) | — | (4,392 | ) | — | (1,491 | ) | — | (961 | ) | ||||||||||||||
| | | | | | | | | | | | | | | | | | | | | | | | | | | |
Total | $ | 2,659 | $ | (29,365 | ) | $ | 5,744 | $ | (7,485 | ) | $ | 2,145 | $ | (5,894 | ) | $ | 3,285 | $ | (5,646 | ) | ||||||
| | | | | | | | | | | | | | | | | | | | | | | | | | | | |
| | | | | | | | | | | | | | | | | | | | | | | | | | | |
Derivatives not designated as hedging instruments(1) | ||||||||||||||||||||||||||
Current | ||||||||||||||||||||||||||
Foreign exchange contracts | 25,582 | (29,295 | ) | 11,679 | (22,982 | ) | 39,785 | (22,574 | ) | 23,908 | (7,056 | ) | ||||||||||||||
Non-current | �� | |||||||||||||||||||||||||
Foreign exchange contracts | — | (137 | ) | 1,060 | (820 | ) | — | (125 | ) | 1,062 | (65 | ) | ||||||||||||||
Derivatives embedded in the Convertible Bonds | — | (65,767 | ) | — | — | — | (99,785 | ) | — | (115,990 | ) | |||||||||||||||
Share Options to secure the Convertible Bonds | 65,767 | — | — | — | 99,785 | — | 115,990 | — | ||||||||||||||||||
| | | | | | | | | | | | | | | | | | | | | | | | | | | |
Total | $ | 91,349 | $ | (95,199 | ) | $ | 12,739 | $ | (23,802 | ) | $ | 139,570 | $ | (122,484 | ) | $ | 140,960 | $ | (123,111 | ) | ||||||
| | | | | | | | | | | | | | | | | | | | | | | | | | | | |
| | | | | | | | | | | | | | | | | | | | | | | | | | | |
The carrying amounts for the current portion of derivatives indicated as assets in the table above are included in Prepaid expenses and other current assets in the Consolidated Balance Sheets while the current portion of those indicated as liabilities are included in Accrued expenses and other current liabilities. The non-current portions indicated as assets or liabilities are included in the Consolidated Balance Sheets in Other assets or Other liabilities, respectively.
The significant methods and assumptions used in estimating the fair values of derivative financial instruments are as follows:
The fair value of interest rate swaps is calculated by discounting the future cash flows on the basis of the market interest rates applicable for the remaining term of the contract as of the balance sheet date. To determine the fair value of foreign exchange forward contracts, the contracted forward rate is compared to the current forward rate for the remaining term of the contract as of the balance sheet date. The result is then discounted on the basis of the market interest rates prevailing at the balance sheet date for the
FRESENIUS MEDICAL CARE AG & Co. KGaA
NOTES TO CONSOLIDATED FINANCIAL STATEMENTS — (Continued)
(in thousands, except share and per share data)
applicable currency. The fair value of the embedded derivative of the convertible bonds is calculated using the difference between the market value of the convertible bond and the market value of an adequate straight bond discounted with the market interest rates as of the reporting date.
The Company includes itsCompany's own credit risk foris incorporated in the fair value estimation of derivatives that are liabilities. Counterparty credit risk adjustments are factored into the valuation of derivatives that are assets. The Company monitors and analyses the credit risk from derivative financial instruments deemed liabilities and counterparty-credit risks foron a regular basis. For the valuation of derivative financial instruments, deemed assets when measuringthe credit risk is considered in the fair value of every individual instrument. The default probability is based upon the credit default swap spreads of each counterparty appropriate for the duration. The calculation of the credit risk considered in the valuation is performed by multiplying the default probability appropriate for the duration with the expected discounted cash flows of the derivative financial instruments.
Table of Contentsinstrument.
FRESENIUS MEDICAL CARE AG & Co. KGaA
NOTES TO CONSOLIDATED FINANCIAL STATEMENTS — (Continued)(in thousands, except share data)
The Effect of Derivatives on the Consolidated Financial Statements
| | Amount of Gain or (Loss) Recognized in AOCI on Derivatives (Effective Portion) for the year ended December 31, | | | | ||||||||||||||||||||||||||
|---|---|---|---|---|---|---|---|---|---|---|---|---|---|---|---|---|---|---|---|---|---|---|---|---|---|---|---|---|---|---|
| | | Amount of (Gain) or Loss Reclassified from AOCI in Income (Effective Portion) for the year ended December 31, | Amount of Gain or (Loss) Recognized in AOCI on Derivatives (Effective Portion) for the year ended December 31, | | Amount of (Gain) or Loss Reclassified from AOCI in Income (Effective Portion) for the year ended December 31, | |||||||||||||||||||||||||
| | Location of (Gain) or Loss Reclassified from AOCI in Income (Effective Portion) | Location of (Gain) or Loss Reclassified from AOCI in Income (Effective Portion) | ||||||||||||||||||||||||||||
Derivatives in Cash Flow Hedging Relationships | 2014 | 2013 | 2014 | 2013 | 2016 | 2015 | 2016 | 2015 | ||||||||||||||||||||||
Interest rate contracts | $ | 19,550 | $ | (6,601 | ) | Interest income/expense | $ | 26,571 | $ | 28,111 | $ | 1,162 | $ | 11,817 | Interest income/expense | $ | 29,150 | $ | 28,355 | |||||||||||
Foreign exchange contracts | (23,123 | ) | 3,684 | Costs of Revenue | 2,549 | (3,251 | ) | (2,664 | ) | 2,273 | Costs of Revenue | 147 | 17,686 | |||||||||||||||||
Foreign exchange contracts | Interest income/expense | — | 589 | |||||||||||||||||||||||||||
| | | | | | | | | | | | | | | | | | | | | | | | | | | | ||||
| $ | (3,573 | ) | $ | (2,917 | ) | $ | 29,120 | $ | 25,449 | $ | (1,502 | ) | $ | 14,090 | $ | 29,297 | $ | 46,041 | ||||||||||||
| | | | | | | | | | | | | | | | | | | | | | | | | | | | | |||
| | | | | | | | | | | | | | | | | | | | | | | | | | | | ||||
| | | Amount of (Gain) or Loss Recognized in Income on Derivatives for the year ended December 31, | | | | Amount of (Gain) or Loss Recognized in Income on Derivatives for the year ended December 31, | | | ||||||||||||||||||||||
|---|---|---|---|---|---|---|---|---|---|---|---|---|---|---|---|---|---|---|---|---|---|---|---|---|---|---|---|---|---|---|
| | Location of (Gain) or Loss Recognized in Income on Derivatives | | | Location of (Gain) or Loss Recognized in Income on Derivatives | | | ||||||||||||||||||||||||
Derivatives not Designated as Hedging Instruments | 2014 | 2013 | | | 2016 | 2015 | | | ||||||||||||||||||||||
Foreign exchange contracts | Selling, general and administrative expense | $ | (83,901 | ) | $ | (15,190 | ) | Selling, general and administrative expense | $ | (2,335 | ) | $ | (61,328 | ) | ||||||||||||||||
Foreign exchange contracts | Interest income/expense | 6,483 | 7,161 | Interest income/expense | 3,251 | 8,196 | ||||||||||||||||||||||||
Derivatives embedded in the Convertible Bonds | Interest income/expense | (13,146 | ) | 58,105 | ||||||||||||||||||||||||||
Share Options to secure the Convertible Bonds | Interest income/expense | 13,146 | (58,105 | ) | ||||||||||||||||||||||||||
| | | | | | | | | | | | | | | | | | | | | | | | | |||||||
| $ | (77,418 | ) | $ | (8,029 | ) | $ | 916 | $ | (53,132 | ) | ||||||||||||||||||||
| | | | | | | | | | | | | | | | | | | | | | | | | | ||||||
| | | | | | | | | | | | | | | | | | | | | | | | | |||||||
For foreign exchange derivatives at December 31, 2016, the Company expects to recognize $13,840$3,737 of losses deferred in AOCI at December 31, 2014, in earnings during the next twelve months.
The Company expects to incur additional interest expense of $22,332$20,918 over the next twelve months which is currently deferred in AOCI. This amount reflects the projected amortization of the settlement amount of the terminated swaps and the current fair value of the additional interest payments resulting from the interest rate swaps maturing between 2016 andin 2019 at December 31, 2014.2016.
At December 31, 2014,2016, the Company had foreign exchange derivatives with maturities of up to 1715 months and interest rate swaps with maturities of up to 5834 months.
FRESENIUS MEDICAL CARE AG & Co. KGaA
NOTES TO CONSOLIDATED FINANCIAL STATEMENTS — (Continued)
(in thousands, except share and per share data)
22.20. Other Comprehensive Income (Loss)
The changes in the components of other comprehensive income (loss) for the years ended December 31, 2014, 2013,2016, 2015, and 20122014 are as follows:
| | Pretax | Tax effect | Net, before non- controlling interests | Non- controlling interests | Other comprehensive income (loss), net of tax | Pretax | Tax effect | Net, before non- controlling interests | Non- controlling interests | Other comprehensive income (loss), net of tax | ||||||||||||||||||||||
|---|---|---|---|---|---|---|---|---|---|---|---|---|---|---|---|---|---|---|---|---|---|---|---|---|---|---|---|---|---|---|---|---|
Year ended December 31, 2012 | ||||||||||||||||||||||||||||||||
Year ended December 31, 2014 | ||||||||||||||||||||||||||||||||
Other comprehensive income (loss) relating to cash flow hedges: | ||||||||||||||||||||||||||||||||
Changes in fair value of cash flow hedges during the period | $ | 5,072 | $ | (21,171 | ) | $ | (16,099 | ) | $ | — | $ | (16,099 | ) | $ | (3,573 | ) | $ | 1,417 | $ | (2,156 | ) | $ | — | $ | (2,156 | ) | ||||||
Reclassification adjustments | 18,947 | (4,968 | ) | 13,979 | — | 13,979 | 29,120 | (8,385 | ) | 20,735 | — | 20,735 | ||||||||||||||||||||
| | | | | | | | | | | | | | | | | | | | | | | | | | | | | | | | | |
Total other comprehensive income (loss) relating to cash flow hedges | 24,019 | (26,139 | ) | (2,120 | ) | — | (2,120 | ) | 25,547 | (6,968 | ) | 18,579 | — | 18,579 | ||||||||||||||||||
Foreign-currency translation adjustment | 63,982 | — | 63,982 | (179 | ) | 63,803 | ||||||||||||||||||||||||||
Foreign currency translation adjustment | (415,703 | ) | — | (415,703 | ) | (6,086 | ) | (421,789 | ) | |||||||||||||||||||||||
Defined benefit pension plans: | ||||||||||||||||||||||||||||||||
Actuarial (loss) gain on defined benefit pension plans | (232,308 | ) | 81,476 | (150,832 | ) | — | (150,832 | ) | ||||||||||||||||||||||||
Reclassification adjustments | 17,147 | (6,347 | ) | 10,800 | — | 10,800 | ||||||||||||||||||||||||||
| ��� | | | | | | | | | | | | | | | | | ||||||||||||||||
Total other comprehensive income (loss) relating to defined benefit pension plans | (215,161 | ) | 75,129 | (140,032 | ) | — | (140,032 | ) | ||||||||||||||||||||||||
| | | | | | | | | | | | | | | | | | ||||||||||||||||
Other comprehensive income (loss) | $ | (605,317 | ) | $ | 68,161 | $ | (537,156 | ) | $ | (6,086 | ) | $ | (543,242 | ) | ||||||||||||||||||
| | | | | | | | | | | | | | | | | | ||||||||||||||||
| | | | | | | | | | | | | |||||||||||||||||||||
| | | | | | | | | | | | | | | | | | ||||||||||||||||
Year ended December 31, 2015 | ||||||||||||||||||||||||||||||||
Other comprehensive income (loss) relating to cash flow hedges: | ||||||||||||||||||||||||||||||||
Changes in fair value of cash flow hedges during the period | $ | 14,090 | $ | (4,511 | ) | $ | 9,579 | $ | — | $ | 9,579 | |||||||||||||||||||||
Reclassification adjustments | 46,041 | (12,557 | ) | 33,484 | — | 33,484 | ||||||||||||||||||||||||||
| | | | | | | | | | | | | | | | | | ||||||||||||||||
Total other comprehensive income (loss) relating to cash flow hedges | 60,131 | (17,068 | ) | 43,063 | — | 43,063 | ||||||||||||||||||||||||||
Foreign currency translation adjustment | (347,164 | ) | — | (347,164 | ) | (4,961 | ) | (352,125 | ) | |||||||||||||||||||||||
Defined benefit pension plans: | ||||||||||||||||||||||||||||||||
Actuarial (loss) gain on defined benefit pension plans | (121,512 | ) | 42,159 | (79,353 | ) | — | (79,353 | ) | 47,209 | (13,434 | ) | 33,775 | — | 33,775 | ||||||||||||||||||
Reclassification adjustments | 18,334 | (7,189 | ) | 11,145 | — | 11,145 | 34,625 | (12,851 | ) | 21,774 | — | 21,774 | ||||||||||||||||||||
| | | | | | | | | | | | | | | | | | | | | | | | | | | | | | | | | |
Total other comprehensive income (loss) relating to defined benefit pension plans | (103,178 | ) | 34,970 | (68,208 | ) | — | (68,208 | ) | 81,834 | (26,285 | ) | 55,549 | — | 55,549 | ||||||||||||||||||
| | | | | | | | | | | | | | | | | | | | | | | | | | | | | | | | | |
Other comprehensive income (loss) | $ | (15,177 | ) | $ | 8,831 | $ | (6,346 | ) | $ | (179 | ) | $ | (6,525 | ) | $ | (205,199 | ) | $ | (43,353 | ) | $ | (248,552 | ) | $ | (4,961 | ) | $ | (253,513 | ) | |||
| | | | | | | | | | | | | | | | | | | | | | | | | | | | | | | | | | |
| | | | | | | | | | | | | | | | | | | | | | | | | | | | | | | | | |
Year ended December 31, 2013 | ||||||||||||||||||||||||||||||||
Year ended December 31, 2016 | ||||||||||||||||||||||||||||||||
Other comprehensive income (loss) relating to cash flow hedges: | ||||||||||||||||||||||||||||||||
Changes in fair value of cash flow hedges during the period | $ | (2,917 | ) | $ | 1,346 | $ | (1,571 | ) | $ | — | $ | (1,571 | ) | $ | (1,502 | ) | $ | 627 | $ | (875 | ) | $ | — | $ | (875 | ) | ||||||
Reclassification adjustments | 25,449 | (7,393 | ) | 18,056 | — | 18,056 | 29,297 | (8,419 | ) | 20,878 | — | 20,878 | ||||||||||||||||||||
| | | | | | | | | | | | | | | | | | | | | | | | | | | | | | | | | |
Total other comprehensive income (loss) relating to cash flow hedges | 22,532 | (6,047 | ) | 16,485 | — | 16,485 | 27,795 | (7,792 | ) | 20,003 | — | 20,003 | ||||||||||||||||||||
Foreign-currency translation adjustment | (112,395 | ) | — | (112,395 | ) | (2,044 | ) | (114,439 | ) | |||||||||||||||||||||||
Foreign currency translation adjustment | 2,726 | — | 2,726 | (1,446 | ) | 1,280 | ||||||||||||||||||||||||||
Defined benefit pension plans: | ||||||||||||||||||||||||||||||||
Actuarial (loss) gain on defined benefit pension plans | 39,571 | (17,828 | ) | 21,743 | — | 21,743 | (32,275 | ) | 7,416 | (24,859 | ) | — | (24,859 | ) | ||||||||||||||||||
Reclassification adjustments | 25,418 | (9,725 | ) | 15,693 | — | 15,693 | 30,811 | (11,398 | ) | 19,413 | — | 19,413 | ||||||||||||||||||||
| | | | | | | | | | | | | | | | | | | | | | | | | | | | | | | | | |
Total other comprehensive income (loss) relating to defined benefit pension plans | 64,989 | (27,553 | ) | 37,436 | — | 37,436 | (1,464 | ) | (3,982 | ) | (5,446 | ) | — | (5,446 | ) | |||||||||||||||||
| | | | | | | | | | | | | | | | | | | | | | | | | | | | | | | | | |
Other comprehensive income (loss) | $ | (24,874 | ) | $ | (33,600 | ) | $ | (58,474 | ) | $ | (2,044 | ) | $ | (60,518 | ) | $ | 29,057 | $ | (11,774 | ) | $ | 17,283 | $ | (1,446 | ) | $ | 15,837 | |||||
| | | | | | | | | | | | | | | | | | | | | | | | | | | | | | | | | | |
| | | | | | | | | | | | | | | | | | | | | | | | | | | | | | | | | |
Year ended December 31, 2014 | ||||||||||||||||||||||||||||||||
Other comprehensive income (loss) relating to cash flow hedges: | ||||||||||||||||||||||||||||||||
Changes in fair value of cash flow hedges during the period | $ | (3,573 | ) | $ | 1,417 | $ | (2,156 | ) | $ | — | $ | (2,156 | ) | |||||||||||||||||||
Reclassification adjustments | 29,120 | (8,385 | ) | 20,735 | — | 20,735 | ||||||||||||||||||||||||||
| | | | | | | | | | | | | | | | | |||||||||||||||||
Total other comprehensive income (loss) relating to cash flow hedges | 25,547 | (6,968 | ) | 18,579 | — | 18,579 | ||||||||||||||||||||||||||
Foreign-currency translation adjustment | (415,703 | ) | — | (415,703 | ) | (6,086 | ) | (421,789 | ) | |||||||||||||||||||||||
Defined benefit pension plans: | ||||||||||||||||||||||||||||||||
Actuarial (loss) gain on defined benefit pension plans | (232,308 | ) | 81,476 | (150,832 | ) | — | (150,832 | ) | ||||||||||||||||||||||||
Reclassification adjustments | 17,147 | (6,347 | ) | 10,800 | — | 10,800 | ||||||||||||||||||||||||||
| | | | | | | | | | | | | | | | | |||||||||||||||||
Total other comprehensive income (loss) relating to defined benefit pension plans | (215,161 | ) | 75,129 | (140,032 | ) | — | (140,032 | ) | ||||||||||||||||||||||||
| | | | | | | | | | | | | | | | | |||||||||||||||||
Other comprehensive income (loss) | $ | (605,317 | ) | $ | 68,161 | $ | (537,156 | ) | $ | (6,086 | ) | $ | (543,242 | ) | ||||||||||||||||||
| | | | | | | | | | | | | | | | | |||||||||||||||||
| | | | | | | | | | | | ||||||||||||||||||||||
| | | | | | | | | | | | | | | | | |||||||||||||||||
FRESENIUS MEDICAL CARE AG & Co. KGaA
NOTES TO CONSOLIDATED FINANCIAL STATEMENTS — (Continued)
(in thousands, except share and per share data)
Changes in AOCI by component for the years ended December 31, 2014, 2013,2016, 2015, and 20122014 are as follows:
| | Gain (Loss) related to cash flow hedges | Actuarial gain (loss) on defined benefit pension plans | Gain (Loss) related to foreign- currency translation | Total, before non- controlling interests | Non- controlling interests | Total | Gain (Loss) related to cash flow hedges | Actuarial gain (loss) on defined benefit pension plans | Gain (Loss) related to foreign- currency translation | Total, before non- controlling interests | Non- controlling interests | Total | ||||||||||||||||||||||||||
|---|---|---|---|---|---|---|---|---|---|---|---|---|---|---|---|---|---|---|---|---|---|---|---|---|---|---|---|---|---|---|---|---|---|---|---|---|---|---|
Balance at December 31, 2011 | $ | (136,221 | ) | $ | (111,215 | ) | $ | (238,331 | ) | $ | (485,767 | ) | $ | 3,048 | $ | (482,719 | ) | |||||||||||||||||||||
Balance at December 31, 2013 | $ | (121,856 | ) | $ | (141,987 | ) | $ | (286,744 | ) | $ | (550,587 | ) | $ | 825 | $ | (549,762 | ) | |||||||||||||||||||||
| | | | | | | | | | | | | | | | | | | | | | | | | | | | | | | | | | | | | | | |
Other comprehensive income before reclassifications | (16,099 | ) | (79,353 | ) | 63,982 | (31,470 | ) | (179 | ) | (31,649 | ) | |||||||||||||||||||||||||||
Other comprehensive income (loss) before reclassifications | (2,156 | ) | (150,832 | ) | (415,703 | ) | (568,691 | ) | (6,086 | ) | (574,777 | ) | ||||||||||||||||||||||||||
Amounts reclassified from AOCI | 13,979 | 11,145 | — | 25,124 | — | 25,124 | 20,735 | 10,800 | — | 31,535 | — | 31,535 | ||||||||||||||||||||||||||
| | | | | | | | | | | | | | | | | | | | | | | | | | | | | | | | | | | | | | | |
Net current-period other comprehensive income | (2,120 | ) | (68,208 | ) | 63,982 | (6,346 | ) | (179 | ) | (6,525 | ) | |||||||||||||||||||||||||||
| | | | | | | | | | | | | | | | | | | | ||||||||||||||||||||
Balance at December 31, 2012 | $ | (138,341 | ) | $ | (179,423 | ) | $ | (174,349 | ) | $ | (492,113 | ) | $ | 2,869 | $ | (489,244 | ) | |||||||||||||||||||||
| | | | | | | | | | | | | | | | | | | | ||||||||||||||||||||
| | | | | | | | | | | | | | ||||||||||||||||||||||||||
| | | | | | | | | | | | | | | | | | | | ||||||||||||||||||||
Other comprehensive income before reclassifications | (1,571 | ) | 21,743 | (112,395 | ) | (92,223 | ) | (2,044 | ) | (94,267 | ) | |||||||||||||||||||||||||||
Amounts reclassified from AOCI | 18,056 | 15,693 | — | 33,749 | — | 33,749 | ||||||||||||||||||||||||||||||||
| | | | | | | | | | | | | | | | | | | | ||||||||||||||||||||
Net current-period other comprehensive income | 16,485 | 37,436 | (112,395 | ) | (58,474 | ) | (2,044 | ) | (60,518 | ) | ||||||||||||||||||||||||||||
| | | | | | | | | | | | | | | | | | | | ||||||||||||||||||||
Balance at December 31, 2013 | $ | (121,856 | ) | $ | (141,987 | ) | $ | (286,744 | ) | $ | (550,587 | ) | $ | 825 | $ | (549,762 | ) | |||||||||||||||||||||
| | | | | | | | | | | | | | | | | | | | ||||||||||||||||||||
| | | | | | | | | | | | | | ||||||||||||||||||||||||||
| | | | | | | | | | | | | | | | | | | | ||||||||||||||||||||
Other comprehensive income before reclassifications | (2,156 | ) | (150,832 | ) | (415,703 | ) | (568,691 | ) | (6,086 | ) | (574,777 | ) | ||||||||||||||||||||||||||
Amounts reclassified from AOCI | 20,735 | 10,800 | — | 31,535 | — | 31,535 | ||||||||||||||||||||||||||||||||
| | | | | | | | | | | | | | | | | | | | ||||||||||||||||||||
Net current-period other comprehensive income | 18,579 | (140,032 | ) | (415,703 | ) | (537,156 | ) | (6,086 | ) | (543,242 | ) | |||||||||||||||||||||||||||
Other comprehensive income (loss) after reclassifications | 18,579 | (140,032 | ) | (415,703 | ) | (537,156 | ) | (6,086 | ) | (543,242 | ) | |||||||||||||||||||||||||||
| | | | | | | | | | | | | | | | | | | | | | | | | | | | | | | | | | | | | | | |
Balance at December 31, 2014 | $ | (103,277 | ) | $ | (282,019 | ) | $ | (702,447 | ) | $ | (1,087,743 | ) | $ | (5,261 | ) | $ | (1,093,004 | ) | $ | (103,277 | ) | $ | (282,019 | ) | $ | (702,447 | ) | $ | (1,087,743 | ) | $ | (5,261 | ) | $ | (1,093,004 | ) | ||
| | | | | | | | | | | | | | | | | | | | | | | | | | | | | | | | | | | | | | | | |
| | | | | | | | | | | | | | | | | | | | | | | | | | | | | | | | | | | | | | | |
Other comprehensive income (loss) before reclassifications | 9,579 | 33,775 | (347,164 | ) | (303,810 | ) | (4,961 | ) | (308,771 | ) | ||||||||||||||||||||||||||||
Amounts reclassified from AOCI | 33,484 | 21,774 | — | 55,258 | — | 55,258 | ||||||||||||||||||||||||||||||||
| | | | | | | | | | | | | | | | | | | | | |||||||||||||||||||
Other comprehensive income (loss) after reclassifications | 43,063 | 55,549 | (347,164 | ) | (248,552 | ) | (4,961 | ) | (253,513 | ) | ||||||||||||||||||||||||||||
| | | | | | | | | | | | | | | | | | | | | |||||||||||||||||||
Balance at December 31, 2015 | $ | (60,214 | ) | $ | (226,470 | ) | $ | (1,049,611 | ) | $ | (1,336,295 | ) | $ | (10,222 | ) | $ | (1,346,517 | ) | ||||||||||||||||||||
| | | | | | | | | | | | | | | | | | | | | |||||||||||||||||||
| | | | | | | | | | | | | | | |||||||||||||||||||||||||
| | | | | | | | | | | | | | | | | | | | | |||||||||||||||||||
Other comprehensive income (loss) before reclassifications | (875 | ) | (24,859 | ) | 2,726 | (23,008 | ) | (1,446 | ) | (24,454 | ) | |||||||||||||||||||||||||||
Amounts reclassified from AOCI | 20,878 | 19,413 | — | 40,291 | — | 40,291 | ||||||||||||||||||||||||||||||||
| | | | | | | | | | | | | | | | | | | | | |||||||||||||||||||
Other comprehensive income (loss) after reclassifications | 20,003 | (5,446 | ) | 2,726 | 17,283 | (1,446 | ) | 15,837 | ||||||||||||||||||||||||||||||
| | | | | | | | | | | | | | | | | | | | | |||||||||||||||||||
Balance at December 31, 2016 | $ | (40,211 | ) | $ | (231,916 | ) | $ | (1,046,885 | ) | $ | (1,319,012 | ) | $ | (11,668 | ) | $ | (1,330,680 | ) | ||||||||||||||||||||
| | | | | | | | | | | | | | | | | | | | | |||||||||||||||||||
| | | | | | | | | | | | | | | |||||||||||||||||||||||||
| | | | | | | | | | | | | | | | | | | | | |||||||||||||||||||
FRESENIUS MEDICAL CARE AG & Co. KGaA
NOTES TO CONSOLIDATED FINANCIAL STATEMENTS — (Continued)(in thousands, except share data)
Reclassifications out of AOCI for the years ended December 31, 2014, 2013,2016, 2015, and 20122014 are as follows:
| | Amount of (Gain) Loss reclassified from AOCI in Income | | Amount of (Gain) Loss reclassified from AOCI in Income | | ||||||||||||||||||
|---|---|---|---|---|---|---|---|---|---|---|---|---|---|---|---|---|---|---|---|---|---|---|
| | Location of (Gain) Loss reclassified from AOCI in Income | Location of (Gain) Loss reclassified from AOCI in Income | ||||||||||||||||||||
| Details about AOCI Components | 2014 | 2013 | 2012 | 2016 | 2015 | 2014 | ||||||||||||||||
(Gain) Loss related to cash flow hedges | ||||||||||||||||||||||
Interest rate contracts | $ | 26,571 | $ | 28,111 | $ | 23,779 | Interest income/expense | $ | 29,150 | $ | 28,355 | $ | 26,571 | Interest income/expense | ||||||||
Foreign exchange contracts | 2,549 | (3,251 | ) | (5,414 | ) | Costs of Revenue | ||||||||||||||||
Foreign exchange contracts | — | 589 | 582 | Interest income/expense | 147 | 17,686 | 2,549 | Costs of Revenue | ||||||||||||||
| | | | | | | | | | | | | | | | | | | | | | ||
| 29,120 | 25,449 | 18,947 | Total before tax | 29,297 | 46,041 | 29,120 | Total before tax | |||||||||||||||
| | | | | | | | | | | | | | | | | | | | | | ||
| (8,385 | ) | (7,393 | ) | (4,968 | ) | Tax expense or benefit | (8,419 | ) | (12,557 | ) | (8,385 | ) | Tax expense or benefit | |||||||||
| | | | | | | | | | | | | | | | | | | | | | ||
| $ | 20,735 | $ | 18,056 | $ | 13,979 | Net of tax | $ | 20,878 | $ | 33,484 | $ | 20,735 | Net of tax | |||||||||
| | | | | | | | | | | | | | | | | | | | | | ||
Actuarial (Gain) Loss on defined benefit pension plans | ||||||||||||||||||||||
Actuarial (gain) loss | $ | 17,147 | $ | 25,418 | $ | 18,334 | (1) | |||||||||||||||
Amortization of unrealized (gain) loss | $ | 30,811 | $ | 34,625 | $ | 17,147 | (1) | |||||||||||||||
| | | | | | | | | | | | | | | | | | | | | | ||
| 17,147 | 25,418 | 18,334 | Total before tax | 30,811 | 34,625 | 17,147 | Total before tax | |||||||||||||||
| | | | | | | | | | | | | | | | | | | | | | ||
| (6,347 | ) | (9,725 | ) | (7,189 | ) | Tax expense or benefit | (11,398 | ) | (12,851 | ) | (6,347 | ) | Tax expense or benefit | |||||||||
| | | | | | | | | | | | | | | | | | | | | | ||
| $ | 10,800 | $ | 15,693 | $ | 11,145 | Net of tax | $ | 19,413 | $ | 21,774 | $ | 10,800 | Net of tax | |||||||||
| | | | | | | | | | | | | | | | | | | | | | ||
Total reclassifications for the period | $ | 31,535 | $ | 33,749 | $ | 25,124 | Net of tax | $ | 40,291 | $ | 55,258 | $ | 31,535 | Net of tax | ||||||||
| | | | | | | | | | | | | | | | | | | | | | | |
| | | | | | | | | | | | | | | | | | | | | | ||
23. Supplementary Cash Flow Information
The following additional information is provided with respect to the consolidated statements of cash flows:
| | 2014 | 2013 | 2012 | |||||||
|---|---|---|---|---|---|---|---|---|---|---|
Supplementary cash flow information: | ||||||||||
Cash paid for interest | $ | 379,978 | $ | 374,648 | $ | 349,415 | ||||
| | | | | | | | | | | |
Cash paid for income taxes(1) | $ | 689,954 | $ | 542,625 | $ | 552,711 | ||||
| | | | | | | | | | | |
Cash inflow for income taxes from stock option exercises(2) | $ | 8,529 | $ | 8,882 | $ | 21,008 | ||||
| | | | | | | | | | | |
Supplemental disclosures of cash flow information: | ||||||||||
Details for acquisitions: | ||||||||||
Assets acquired | $ | (2,505,027 | ) | $ | (417,669 | ) | $ | (2,519,189 | ) | |
Liabilities assumed | 450,808 | 31,335 | 241,342 | |||||||
Noncontrolling interest subject to put provisions | 95,015 | 15,460 | 123,210 | |||||||
Noncontrolling interest | 328,997 | 9,104 | 104,947 | |||||||
Pending payments for purchase considerations | 18,253 | 66,917 | 6,624 | |||||||
| | | | | | | | | | | |
Cash paid | (1,611,954 | ) | (294,853 | ) | (2,043,066 | ) | ||||
Less cash acquired | 132,433 | 6,858 | 173,278 | |||||||
| | | | | | | | | | | |
Net cash paid for acquisitions | (1,479,521 | ) | (287,995 | ) | (1,869,788 | ) | ||||
Cash paid for investments | (274,913 | ) | (195,921 | ) | (387 | ) | ||||
Cash paid for intangible assets | (24,624 | ) | (11,809 | ) | (8,733 | ) | ||||
| | | | | | | | | | | |
Total cash paid for acquisitions and investments, net of cash acquired, and purchases of intangible assets | $ | (1,779,058 | ) | $ | (495,725 | ) | $ | (1,878,908 | ) | |
| | | | | | | | | | | |
| | | | | | | | | | | |
| | | | | | | | | | | |
FRESENIUS MEDICAL CARE AG & Co. KGaA
NOTES TO CONSOLIDATED FINANCIAL STATEMENTS — (Continued)
(in thousands, except share and per share data)
24.21. Supplementary Cash Flow Information
The following additional information is provided with respect to the consolidated statements of cash flows:
| | 2016 | 2015 | 2014 | |||||||
|---|---|---|---|---|---|---|---|---|---|---|
Supplementary cash flow information: | ||||||||||
Cash paid for interest | $ | 387,125 | $ | 381,212 | $ | 379,978 | ||||
| | | | | | | | | | | |
Cash paid for income taxes(1) | $ | 598,916 | $ | 547,401 | $ | 689,954 | ||||
| | | | | | | | | | | |
Cash inflow for income taxes from stock option exercises(2) | $ | 8,887 | $ | 18,073 | $ | 8,529 | ||||
| | | | | | | | | | | |
Supplemental disclosures of cash flow information: | ||||||||||
Details for acquisitions: | ||||||||||
Assets acquired | $ | (877,706 | ) | $ | (216,023 | ) | $ | (2,505,027 | ) | |
Liabilities assumed | 125,623 | 34,841 | 450,808 | |||||||
Noncontrolling interest subject to put provisions | 48,292 | 7,622 | 95,015 | |||||||
Noncontrolling interest | 15,992 | 983 | 328,997 | |||||||
Non-cash consideration | 244,458 | 69,233 | 18,253 | |||||||
| | | | | | | | | | | |
Cash paid | (443,341 | ) | (103,344 | ) | (1,611,954 | ) | ||||
Less cash acquired | 22,869 | 3,193 | 132,433 | |||||||
| | | | | | | | | | | |
Net cash paid for acquisitions | (420,472 | ) | (100,151 | ) | (1,479,521 | ) | ||||
Cash paid for investments | (143,637 | ) | (184,101 | ) | (274,913 | ) | ||||
Cash paid for intangible assets | (13,472 | ) | (32,558 | ) | (24,624 | ) | ||||
| | | | | | | | | | | |
Total cash paid for acquisitions and investments, net of cash acquired, and purchases of intangible assets | $ | (577,581 | ) | $ | (316,810 | ) | $ | (1,779,058 | ) | |
| | | | | | | | | | | |
| | | | | | | | | | | |
| | | | | | | | | | | |
22. Segment and Corporate Information
TheIn 2015, the Company has identified threeincreased its operating segments North America Segment, EMEALA and Asia-Pacific, which were determined based uponfrom three to four segments in conjunction with a change in the structure of how the Company manages its businesses. All segments are primarily engaged in providing health care services and the distribution of products and equipment for the treatment of ESRD. For reporting purposes, the Company has aggregated the EMEALA and Asia-Pacificbusiness. The operating segments as the "International Segment." The segments are aggregated due to their similar characteristics such as the same services provided and products sold, the same type of patient population and similar methods of distribution of products and services. The General Partner's management board member responsible for the profitability and cash flow of each segment's various businesses supervises the management of each operating segment. The accounting policies of the segments are the sameNorth America Segment, the EMEA Segment, the Asia-Pacific Segment and the Latin America Segment. Accordingly, the two reporting segments disclosed prior to 2015 (the North America Segment and the International Segment, which was comprised of EMEA, Asia-Pacific and Latin America) have now been reclassified into four reporting segments as those the Company applies in preparing the consolidated financial statements under U.S. GAAP.noted above.
Management evaluates each segment using measures that reflect all of the segment's controllable revenues and expenses. With respect to the performance of business operations, management believes that the most appropriate U.S. GAAP measures are revenue, operating income and operating income margin. The Company does not include income taxes as it believes this is outside the segments' control. Financing is a corporate function, which the Company's segments do not control. Therefore, the Company does not include interest expense relating to financing as a segment measurement. Similarly, the Company does not allocate certain costs, which relate primarily to certain headquartersheadquarters' overhead charges, including accounting and finance, ("Corporate"), because the Company believes that these costs are also not within the control of the individual segments. Production of products, production asset management, quality management and procurement related to production are centrally managed at Corporate by Global Manufacturing Operations.Corporate. The Company's global research and development is also centrally managed at Corporate. These Corporate activities do not fulfill the definition of a segment. Products are transferred to the segments at cost; therefore no internal profit is generated. The associated internal revenues for the product transfers and their elimination are recorded as Corporate activities. Capital expenditures for production are based on the expected demand of the segments and consolidated profitability considerations. In addition, certain revenues, investments and intangible assets, as well as any related expenses, are not allocated to a segment but are accounted for as Corporate.
FRESENIUS MEDICAL CARE AG & Co. KGaA
NOTES TO CONSOLIDATED FINANCIAL STATEMENTS — (Continued)
(in thousands, except share and per share data)
intangible assets, as well as any related expenses, are not allocated to a segment but are accounted for as Corporate.
Information pertaining to the Company's segment and Corporate activities for the twelve-month periods ended December 31, 2014, 20132016, 2015 and 20122014 is set forth below.
| | North America Segment | International Segment | Segment Total | Corporate | Total | |||||||||||
|---|---|---|---|---|---|---|---|---|---|---|---|---|---|---|---|---|
2014 | ||||||||||||||||
Net revenue external customers | $ | 10,500,095 | $ | 5,265,011 | $ | 15,765,106 | $ | 66,507 | $ | 15,831,613 | ||||||
Inter-segment revenue | 8,992 | 343 | 9,335 | (9,335 | ) | — | ||||||||||
| | | | | | | | | | | | | | | | | |
Revenue | 10,509,087 | 5,265,354 | 15,774,441 | 57,172 | 15,831,613 | |||||||||||
| | | | | | | | | | | | | | | | | |
Depreciation and amortization | (364,137 | ) | (190,698 | ) | (554,835 | ) | (144,493 | ) | (699,328 | ) | ||||||
| | | | | | | | | | | | | | | | | |
Operating Income | 1,642,911 | 970,456 | 2,613,367 | (358,834 | ) | 2,254,533 | ||||||||||
| | | | | | | | | | | | | | | | | |
Income (loss) from equity method investees | 18,457 | 6,381 | 24,838 | — | 24,838 | |||||||||||
Segment assets | 16,925,685 | 6,130,597 | 23,056,282 | 2,390,819 | 25,447,101 | |||||||||||
thereof investments in equity method investees | 291,118 | 385,704 | 676,822 | — | 676,822 | |||||||||||
Capital expenditures, acquisitions and investments(1) | 2,006,585 | 413,124 | 2,419,709 | 290,976 | 2,710,685 | |||||||||||
2013 | ||||||||||||||||
Net revenue external customers | $ | 9,606,111 | $ | 4,970,319 | $ | 14,576,430 | $ | 33,297 | $ | 14,609,727 | ||||||
Inter-segment revenue | 7,045 | — | 7,045 | (7,045 | ) | — | ||||||||||
| | | | | | | | | | | | | | | | | |
Revenue | 9,613,156 | 4,970,319 | 14,583,475 | 26,252 | 14,609,727 | |||||||||||
| | | | | | | | | | | | | | | | | |
Depreciation and amortization(2) | (331,397 | ) | (188,104 | ) | (519,501 | ) | (128,724 | ) | (648,225 | ) | ||||||
| | | | | | | | | | | | | | | | | |
Operating Income(3) | 1,623,071 | 897,191 | 2,520,262 | (264,066 | ) | 2,256,196 | ||||||||||
| | | | | | | | | | | | | | | | | |
Income (loss) from equity method investees(4) | 16,388 | 9,717 | 26,105 | — | 26,105 | |||||||||||
Segment assets | 14,698,039 | 6,177,482 | 20,875,521 | 2,244,385 | 23,119,906 | |||||||||||
thereof investments in equity method investees | 268,370 | 396,076 | 664,446 | — | 664,446 | |||||||||||
Capital expenditures, acquisitions and investments(5) | 789,340 | 286,420 | 1,075,760 | 167,903 | 1,243,663 | |||||||||||
2012 | ||||||||||||||||
Net revenue external customers | $ | 9,031,108 | $ | 4,740,132 | $ | 13,771,240 | $ | 29,042 | $ | 13,800,282 | ||||||
Inter-segment revenue | 10,072 | — | 10,072 | (10,072 | ) | — | ||||||||||
| | | | | | | | | | | | | | | | | |
Revenue | 9,041,180 | 4,740,132 | 13,781,312 | 18,970 | 13,800,282 | |||||||||||
| | | | | | | | | | | | | | | | | |
Depreciation and amortization(2) | (311,198 | ) | (179,431 | ) | (490,629 | ) | (112,267 | ) | (602,896 | ) | ||||||
| | | | | | | | | | | | | | | | | |
Operating Income(3) | 1,597,643 | 840,644 | 2,438,287 | (219,714 | ) | 2,218,573 | ||||||||||
| | | | | | | | | | | | | | | | | |
Income (loss) from equity method investees(4) | 12,844 | 4,598 | 17,442 | — | 17,442 | |||||||||||
Segment assets | 14,170,453 | 5,892,477 | 20,062,930 | 2,263,068 | 22,325,998 | |||||||||||
thereof investments in equity method investees | 266,521 | 370,852 | 637,373 | — | 637,373 | |||||||||||
Capital expenditures, acquisitions and investments(6) | 2,147,522 | 230,888 | 2,378,410 | 175,808 | 2,554,218 | |||||||||||
Segment and Corporate Information | North America Segment | EMEA Segment | Asia-Pacific Segment | Latin America Segment | Segment Total | Corporate | Total | |||||||||||||||
|---|---|---|---|---|---|---|---|---|---|---|---|---|---|---|---|---|---|---|---|---|---|---|
2016 | ||||||||||||||||||||||
Revenue external customers | $ | 12,885,879 | $ | 2,666,644 | $ | 1,631,717 | $ | 712,150 | $ | 17,896,390 | $ | 14,397 | $ | 17,910,787 | ||||||||
Inter-segment revenue | 3,437 | — | 34 | 267 | 3,738 | (3,738 | ) | — | ||||||||||||||
Revenue | 12,889,316 | 2,666,644 | 1,631,751 | 712,417 | 17,900,128 | 10,659 | 17,910,787 | |||||||||||||||
Operating income | 2,119,297 | 524,181 | 319,076 | 65,849 | 3,028,403 | (390,880 | ) | 2,637,523 | ||||||||||||||
Depreciation and amortization | (430,824 | ) | (120,791 | ) | (48,196 | ) | (17,242 | ) | (617,053 | ) | (158,892 | ) | (775,945 | ) | ||||||||
Income (loss) from equity method investees | 64,806 | (2,919 | ) | 1,519 | 1,502 | 64,908 | — | 64,908 | ||||||||||||||
Total assets | 18,255,288 | 3,785,602 | 1,863,441 | 729,193 | 24,633,524 | 2,300,418 | 26,933,942 | |||||||||||||||
thereof investments in equity method investees | 324,860 | 221,054 | 106,900 | 26,428 | 679,242 | — | 679,242 | |||||||||||||||
Capital expenditures, acquisitions and investments(1) | 916,354 | 310,568 | 53,795 | 45,477 | 1,326,194 | 281,379 | 1,607,573 | |||||||||||||||
2015 | ||||||||||||||||||||||
Revenue external customers | $ | 11,813,330 | $ | 2,628,688 | $ | 1,501,456 | $ | 766,424 | $ | 16,709,898 | $ | 27,684 | $ | 16,737,582 | ||||||||
Inter-segment revenue | 5,292 | 1 | 143 | 447 | 5,883 | (5,883 | ) | — | ||||||||||||||
Revenue | 11,818,622 | 2,628,689 | 1,501,599 | 766,871 | 16,715,781 | 21,801 | 16,737,582 | |||||||||||||||
Operating Income(2) | 1,797,835 | 576,895 | 297,860 | 48,233 | 2,720,823 | (394,091 | ) | 2,326,732 | ||||||||||||||
Depreciation and amortization | (399,434 | ) | (113,131 | ) | (44,616 | ) | (14,835 | ) | (572,016 | ) | (145,306 | ) | (717,322 | ) | ||||||||
Income (loss) from equity method investees | 20,799 | 6,820 | 2,526 | 1,307 | 31,452 | — | 31,452 | |||||||||||||||
Total assets(3) | 17,269,258 | 3,293,600 | 1,727,495 | 604,667 | 22,895,020 | 2,470,234 | 25,365,254 | |||||||||||||||
thereof investments in equity method investees | 288,956 | 220,610 | 109,347 | 25,796 | 644,709 | — | 644,709 | |||||||||||||||
Capital expenditures, acquisitions and investments(4) | 709,503 | 174,229 | 48,949 | 50,549 | 983,230 | 286,523 | 1,269,753 | |||||||||||||||
2014(5) | ||||||||||||||||||||||
Revenue external customers | $ | 10,500,095 | $ | 3,072,067 | $ | 1,356,936 | $ | 836,008 | $ | 15,765,106 | $ | 66,507 | $ | 15,831,613 | ||||||||
Inter-segment revenue | 8,992 | 0 | 7 | 336 | 9,335 | (9,335 | ) | — | ||||||||||||||
Revenue | 10,509,087 | 3,072,067 | 1,356,943 | 836,344 | 15,774,441 | 57,172 | 15,831,613 | |||||||||||||||
Operating Income | 1,642,911 | 589,971 | 279,046 | 101,439 | 2,613,367 | (358,834 | ) | 2,254,533 | ||||||||||||||
Depreciation and amortization | (364,137 | ) | (133,155 | ) | (37,729 | ) | (19,814 | ) | (554,835 | ) | (144,493 | ) | (699,328 | ) | ||||||||
Income (loss) from equity method investees | 18,457 | 4,415 | 942 | 1,024 | 24,838 | — | 24,838 | |||||||||||||||
Total assets(6)(7) | 16,701,657 | 3,574,076 | 1,819,394 | 714,752 | 22,809,879 | 2,359,699 | 25,169,578 | |||||||||||||||
thereof investments in equity method investees | 291,118 | 238,604 | 119,428 | 27,672 | 676,822 | — | 676,822 | |||||||||||||||
Capital expenditures, acquisitions and investments(8) | 2,006,585 | 210,509 | 128,480 | 74,135 | 2,419,709 | 290,976 | 2,710,685 | |||||||||||||||
FRESENIUS MEDICAL CARE AG & Co. KGaA
NOTES TO CONSOLIDATED FINANCIAL STATEMENTS — (Continued)
(in thousands, except share and per share data)
For the geographic presentation, revenues are attributed to specific countries based on the end user's location for products and the country in which the service is provided. Information with respect to the Company's geographic operations is set forth in the table below:
| | Germany | North America | Rest of the World | Total | |||||||||
|---|---|---|---|---|---|---|---|---|---|---|---|---|---|
2014 | |||||||||||||
Net revenue | $ | 456,937 | $ | 10,500,095 | $ | 4,874,581 | $ | 15,831,613 | |||||
Long-lived assets | 543,184 | 14,790,265 | 3,182,123 | 18,515,572 | |||||||||
2013 | |||||||||||||
Net revenue | $ | 437,459 | $ | 9,606,111 | $ | 4,566,157 | $ | 14,609,727 | |||||
Long-lived assets | 609,040 | 12,891,384 | 3,226,779 | 16,727,203 | |||||||||
2012 | |||||||||||||
Net revenue | $ | 409,195 | $ | 9,031,108 | $ | 4,359,979 | $ | 13,800,282 | |||||
Long-lived assets | 493,782 | 12,428,762 | 3,185,773 | 16,108,317 | |||||||||
| | Germany | North America | Rest of the World | Total | |||||||||
|---|---|---|---|---|---|---|---|---|---|---|---|---|---|
2016 | |||||||||||||
Revenue external customers | $ | 421,604 | $ | 12,885,879 | $ | 4,603,304 | $ | 17,910,787 | |||||
Long-lived assets | 907,921 | 15,227,607 | 3,181,818 | 19,317,346 | |||||||||
2015 | |||||||||||||
Revenue external customers | $ | 400,401 | $ | 11,813,330 | $ | 4,523,851 | $ | 16,737,582 | |||||
Long-lived assets | 556,276 | 14,771,036 | 2,963,439 | 18,290,751 | |||||||||
2014 | |||||||||||||
Revenue external customers | $ | 456,937 | $ | 10,500,095 | $ | 4,874,581 | $ | 15,831,613 | |||||
Long-lived assets | 520,690 | 14,753,136 | 3,182,123 | 18,455,949 | |||||||||
25.23. Subsequent Events
On January 31, 2017, the Company announced an agreement with the United States Departments of Veterans Affairs and Justice resolving litigation commenced in 2014 regarding reimbursement for services provided to veterans by the Company's clinics during the period January 2009 through February 15, 2011. The agreement is expected to increase the Company's recognition of revenue in 2017 by approximately $100,000 (approximately €100,000). The estimated positive impact on the Company's net income (net income attributable to shareholders of Fresenius Medical Care & Co. KGaA) is expected to be approximately $45,000 to $50,000 (approximately €45,000 to €50,000). The payment is expected to be received in due course.
FRESENIUS MEDICAL CARE AG & Co. KGaA
NOTES TO CONSOLIDATED FINANCIAL STATEMENTS — (Continued)
(in thousands, except share and per share data)
24. Supplemental Condensed Combining Information
FMC Finance III, a former wholly-owned subsidiary of the Company, issued 67/8% Senior Notes due 2017 in July 2007. On June 20, 2011, Fresenius Medical Care US Finance, Inc. ("US Finance") acquired substantially all of the assets of FMC Finance III and assumed its obligations, including the 67/8% Senior Notes and the related indenture. The 67/8% Senior Notes are fully and unconditionally guaranteed, jointly and severally on a senior basis, by the Company and by the Guarantor Subsidiaries. The 67/8% Senior Notes and related guarantees were issued in an exchange offer registered under the Securities Act of 1933. The financial statements in this report present the financial condition of the Company, on a consolidated basis at December 31, 20142016 and December 31, 20132015 and its results of operations and cash flows for the periods ended December 31, 2014, 20132016, 2015 and 2012.2014. The following combining financial information for the Company is at December 31, 20142016 and December 31, 20132015 and for the periods ended December 31, 2014, 20132016, 2015 and 2012,2014, segregated between FMC US Finance as issuer, the Company, D-GmbH and FMCH as guarantors, and the Company's other businesses (the "Non-Guarantor Subsidiaries"). For purposes of the condensed combining information, the Company and the guarantors carry their investments under the equity method. Other (income) expense includes income (loss) related to investments in consolidated subsidiaries recorded under the equity method for purposes of the condensed combining information. In addition, other (income) expense includes income and losses from profit and loss transfer agreements as well as dividends received.
FRESENIUS MEDICAL CARE AG & Co. KGaA
NOTES TO CONSOLIDATED FINANCIAL STATEMENTS — (Continued)(in thousands, except share data)
| | For the year ended December 31, 2014 | For the year ended December 31, 2016 | ||||||||||||||||||||||||||||||||||||||||||
|---|---|---|---|---|---|---|---|---|---|---|---|---|---|---|---|---|---|---|---|---|---|---|---|---|---|---|---|---|---|---|---|---|---|---|---|---|---|---|---|---|---|---|---|---|
| | Issuer | Guarantors | | | | Issuer | Guarantors | | | | ||||||||||||||||||||||||||||||||||
| | FMC US Finance | FMC-AG & Co. KGaA | D-GmbH | FMCH | Non-Guarantor Subsidiaries | Combining Adjustment | Combined Total | FMC US Finance | FMC - AG & Co. KGaA | D-GmbH | FMCH | Non-Guarantor Subsidiaries | Combining Adjustment | Combined Total | ||||||||||||||||||||||||||||||
Net revenue | $ | — | $ | — | $ | 2,211,756 | $ | — | $ | 17,159,641 | $ | (3,539,784 | ) | $ | 15,831,613 | |||||||||||||||||||||||||||||
Revenue | $ | — | $ | — | $ | 1,930,408 | $ | — | $ | 19,269,789 | $ | (3,289,410 | ) | $ | 17,910,787 | |||||||||||||||||||||||||||||
Cost of revenue | — | — | 1,395,295 | — | 12,929,889 | (3,489,417 | ) | 10,835,767 | — | — | 1,218,268 | — | 14,162,753 | (3,249,876 | ) | 12,131,145 | ||||||||||||||||||||||||||||
| | | | | | | | | | | | | | | | | | | | | | | | | | | | | | | | | | | | | | | | | | | | | |
Gross profit | — | — | 816,461 | — | 4,229,752 | (50,367 | ) | 4,995,846 | — | — | 712,140 | — | 5,107,036 | (39,534 | ) | 5,779,642 | ||||||||||||||||||||||||||||
| | | | | | | | | | | | | | | | | | | | | | | | | | | | | | | | | | | | | | | | | | | | | |
Operating (income) expenses: | ||||||||||||||||||||||||||||||||||||||||||||
Selling, general and administrative(1) | — | 234,170 | 198,789 | 147,203 | 2,046,499 | (7,462 | ) | 2,619,199 | — | 150,457 | 225,873 | 23,507 | 2,557,983 | 21,935 | 2,979,755 | |||||||||||||||||||||||||||||
Research and development | — | — | 74,338 | — | 47,776 | — | 122,114 | — | — | 90,490 | — | 72,598 | (724 | ) | 162,364 | |||||||||||||||||||||||||||||
| | | | | | | | | | | | | | | | | | | | | | | | | | | | | | | | | | | | | | | | | | | | | |
Operating income (loss) | — | (234,170 | ) | 543,334 | (147,203 | ) | 2,135,477 | (42,905 | ) | 2,254,533 | — | (150,457 | ) | 395,777 | (23,507 | ) | 2,476,455 | (60,745 | ) | 2,637,523 | ||||||||||||||||||||||||
| | | | | | | | | | | | | | | | | | | | | | | | | | | | | | | | | | | | | | | | | | | | | |
Other (income) expense: | ||||||||||||||||||||||||||||||||||||||||||||
Interest, net | (6,930 | ) | 238,554 | (5,029 | ) | 198,726 | (14,181 | ) | (13 | ) | 411,127 | (7,152 | ) | 181,102 | (3,925 | ) | 235,053 | 455 | — | 405,533 | ||||||||||||||||||||||||
Other, net | — | (1,555,399 | ) | 382,870 | (771,567 | ) | — | 1,944,096 | — | — | (1,631,682 | ) | 299,545 | (1,006,195 | ) | — | 2,338,332 | — | ||||||||||||||||||||||||||
| | | | | | | | | | | | | | | | | | | | | | | | | | | | | | | | | | | | | | | | | | | | | |
Income (loss) before income taxes | 6,930 | 1,082,675 | 165,493 | 425,638 | 2,149,658 | (1,986,988 | ) | 1,843,406 | 7,152 | 1,300,123 | 100,157 | 747,635 | 2,476,000 | (2,399,077 | ) | 2,231,990 | ||||||||||||||||||||||||||||
Income tax expense (benefit) | 2,524 | 37,409 | 150,268 | (136,469 | ) | 832,919 | (303,053 | ) | 583,598 | 2,625 | 56,856 | 118,090 | (102,002 | ) | 909,834 | (302,264 | ) | 683,139 | ||||||||||||||||||||||||||
| | | | | | | | | | | | | | | | | | | | | | | | | | | | | | | | | | | | | | | | | | | | | |
Net income (loss) | 4,406 | 1,045,266 | 15,225 | 562,107 | 1,316,739 | (1,683,935 | ) | 1,259,808 | 4,527 | 1,243,267 | (17,933 | ) | 849,637 | 1,566,166 | (2,096,813 | ) | 1,548,851 | |||||||||||||||||||||||||||
Net income attributable to noncontrolling interests | — | — | — | — | 214,542 | — | 214,542 | — | — | — | — | 305,584 | — | 305,584 | ||||||||||||||||||||||||||||||
| | | | | | | | | | | | | | | | | | | | | | | | | | | | | | | | | | | | | | | | | | | | | |
Net income (loss) attributable to shareholders of FMC-AG & Co. KGaA | $ | 4,406 | $ | 1,045,266 | $ | 15,225 | $ | 562,107 | $ | 1,102,197 | $ | (1,683,935 | ) | $ | 1,045,266 | $ | 4,527 | $ | 1,243,267 | $ | (17,933 | ) | $ | 849,637 | $ | 1,260,582 | $ | (2,096,813 | ) | $ | 1,243,267 | |||||||||||||
| | | | | | | | | | | | | | | | | | | | | | | | | | | | | | | | | | | | | | | | | | | | | | |
| | | | | | | | | | | | | | | | | | | | | | | | | | | | | | | | | | | | | | | | | | | | | |
| | For the year ended December 31, 2013 | |||||||||||||||||||||
|---|---|---|---|---|---|---|---|---|---|---|---|---|---|---|---|---|---|---|---|---|---|---|
| | Issuer | Guarantors | | | | |||||||||||||||||
| | FMC US Finance | FMC-AG & Co. KGaA | D-GmbH | FMCH | Non-Guarantor Subsidiaries | Combining Adjustment | Combined Total | |||||||||||||||
Net revenue | $ | — | $ | — | $ | 2,084,014 | $ | — | $ | 15,825,782 | $ | (3,300,069 | ) | $ | 14,609,727 | |||||||
Cost of revenue | — | — | 1,356,114 | — | 11,789,397 | (3,274,181 | ) | 9,871,330 | ||||||||||||||
| | | | | | | | | | | | | | | | | | | | | | | |
Gross profit | — | — | 727,900 | — | 4,036,385 | (25,888 | ) | 4,738,397 | ||||||||||||||
| | | | | | | | | | | | | | | | | | | | | | | |
Operating (income) expenses: | ||||||||||||||||||||||
Selling, general and administrative(1) | — | 184,054 | 284,589 | (48,563 | ) | 2,070,503 | (134,187 | ) | 2,356,396 | |||||||||||||
Research and development | — | — | 72,638 | — | 53,336 | (169 | ) | 125,805 | ||||||||||||||
| | | | | | | | | | | | | | | | | | | | | | | |
Operating income (loss) | — | (184,054 | ) | 370,673 | 48,563 | 1,912,546 | 108,468 | 2,256,196 | ||||||||||||||
| | | | | | | | | | | | | | | | | | | | | | | |
Other (income) expense: | ||||||||||||||||||||||
Interest, net | (6,871 | ) | 210,759 | 5,922 | 176,643 | 22,108 | — | 408,561 | ||||||||||||||
Other, net | — | (1,545,184 | ) | 259,165 | (816,954 | ) | — | 2,102,973 | — | |||||||||||||
| | | | | | | | | | | | | | | | | | | | | | | |
Income (loss) before income taxes | 6,871 | 1,150,371 | 105,586 | 688,874 | 1,890,438 | (1,994,505 | ) | 1,847,635 | ||||||||||||||
Income tax expense (benefit) | 2,494 | 40,481 | 108,837 | (50,528 | ) | 684,151 | (193,423 | ) | 592,012 | |||||||||||||
| | | | | | | | | | | | | | | | | | | | | | | |
Net income (loss) | 4,377 | 1,109,890 | (3,251 | ) | 739,402 | 1,206,287 | (1,801,082 | ) | 1,255,623 | |||||||||||||
Net income attributable to noncontrolling interests | — | — | — | — | 145,733 | — | 145,733 | |||||||||||||||
| | | | | | | | | | | | | | | | | | | | | | | |
Net income (loss) attributable to shareholders of FMC-AG & Co. KGaA | $ | 4,377 | $ | 1,109,890 | $ | (3,251 | ) | $ | 739,402 | $ | 1,060,554 | $ | (1,801,082 | ) | $ | 1,109,890 | ||||||
| | | | | | | | | | | | | | | | | | | | | | | |
| | | | | | | | | | | | | | | | | | | | | | | |
| | | | | | | | | | | | | | | | | | | | | | | |
FRESENIUS MEDICAL CARE AG & Co. KGaA
NOTES TO CONSOLIDATED FINANCIAL STATEMENTS — (Continued)
(in thousands, except share and per share data)
| | For the year ended December 31, 2012 | For the year ended December 31, 2015 | ||||||||||||||||||||||||||||||||||||||||||
|---|---|---|---|---|---|---|---|---|---|---|---|---|---|---|---|---|---|---|---|---|---|---|---|---|---|---|---|---|---|---|---|---|---|---|---|---|---|---|---|---|---|---|---|---|
| | Issuer | Guarantors | | | | Issuer | Guarantors | | | | ||||||||||||||||||||||||||||||||||
| | FMC US Finance | FMC-AG & Co. KGaA | D-GmbH | FMCH | Non-Guarantor Subsidiaries | Combining Adjustment | Combined Total | FMC US Finance | FMC - AG & Co. KGaA | D-GmbH | FMCH | Non-Guarantor Subsidiaries | Combining Adjustment | Combined Total | ||||||||||||||||||||||||||||||
Net revenue | $ | — | $ | — | $ | 1,884,622 | $ | — | $ | 14,806,815 | $ | (2,891,155 | ) | $ | 13,800,282 | |||||||||||||||||||||||||||||
Revenue | $ | — | $ | — | $ | 1,870,515 | $ | — | $ | 17,938,856 | $ | (3,071,789 | ) | $ | 16,737,582 | |||||||||||||||||||||||||||||
Cost of revenue | — | — | 1,197,337 | — | 10,876,513 | (2,874,821 | ) | 9,199,029 | — | — | 1,192,256 | — | 13,279,090 | (3,064,927 | ) | 11,406,419 | ||||||||||||||||||||||||||||
| | | | | | | | | | | | | | | | | | | | | | | | | | | | | | | | | | | | | | | | | | | | | |
Gross profit | — | — | 687,285 | — | 3,930,302 | (16,334 | ) | 4,601,253 | — | — | 678,259 | — | 4,659,766 | (6,862 | ) | 5,331,163 | ||||||||||||||||||||||||||||
| | | | | | | | | | | | | | | | | | | | | | | | | | | | | | | | | | | | | | | | | | | | | |
Operating (income) expenses: | ||||||||||||||||||||||||||||||||||||||||||||
Selling, general and administrative(1) | — | 59,222 | 203,284 | (78,297 | ) | 2,057,304 | 29,536 | 2,271,049 | — | 183,650 | 255,184 | 190,544 | 2,256,333 | (21,582 | ) | 2,864,129 | ||||||||||||||||||||||||||||
Research and development | — | — | 69,025 | — | 42,442 | 164 | 111,631 | — | — | 75,661 | — | 64,641 | — | 140,302 | ||||||||||||||||||||||||||||||
| | | | | | | | | | | | | | | | | | | | | | | | | | | | | | | | | | | | | | | | | | | | | |
Operating income (loss) | — | (59,222 | ) | 414,976 | 78,297 | 1,830,556 | (46,034 | ) | 2,218,573 | — | (183,650 | ) | 347,414 | (190,544 | ) | 2,338,792 | 14,720 | 2,326,732 | ||||||||||||||||||||||||||
| | | | | | | | | | | | | | | | | | | | | | | | | | | | | | | | | | | | | | | | | | | | | |
Other (income) expense: | ||||||||||||||||||||||||||||||||||||||||||||
Investment gain | — | — | — | — | (139,600 | ) | — | (139,600 | ) | |||||||||||||||||||||||||||||||||||
Interest, net | (6,839 | ) | 216,914 | 2,682 | 156,794 | 71,797 | (15,288 | ) | 426,060 | (6,993 | ) | 200,596 | (3,706 | ) | 227,381 | (25,829 | ) | 11 | 391,460 | |||||||||||||||||||||||||
Other, net | — | (1,531,505 | ) | 261,505 | (910,777 | ) | — | 2,180,777 | — | — | (1,437,029 | ) | 208,835 | (844,301 | ) | — | 2,072,495 | — | ||||||||||||||||||||||||||
| | | | | | | | | | | | | | | | | | | | | | | | | | | | | | | | | | | | | | | | | | | | | |
Income (loss) before income taxes | 6,839 | 1,255,369 | 150,789 | 832,280 | 1,898,359 | (2,211,523 | ) | 1,932,113 | 6,993 | 1,052,783 | 142,285 | 426,376 | 2,364,621 | (2,057,786 | ) | 1,935,272 | ||||||||||||||||||||||||||||
Income tax expense (benefit) | 2,482 | 68,560 | 119,255 | (30,967 | ) | 687,964 | (242,158 | ) | 605,136 | 2,584 | 23,338 | 120,728 | (164,871 | ) | 880,073 | (239,729 | ) | 622,123 | ||||||||||||||||||||||||||
| | | | | | | | | | | | | | | | | | | | | | | | | | | | | | | | | | | | | | | | | | | | | |
Net income (loss) | 4,357 | 1,186,809 | 31,534 | 863,247 | 1,210,395 | (1,969,365 | ) | 1,326,977 | 4,409 | 1,029,445 | 21,557 | 591,247 | 1,484,548 | (1,818,057 | ) | 1,313,149 | ||||||||||||||||||||||||||||
Net income attributable to noncontrolling interests | — | — | — | — | 140,168 | — | 140,168 | — | — | — | — | 283,704 | — | 283,704 | ||||||||||||||||||||||||||||||
| | | | | | | | | | | | | | | | | | | | | | | | | | | | | | | | | | | | | | | | | | | | | |
Net income (loss) attributable to shareholders of FMC-AG & Co. KGaA | $ | 4,357 | $ | 1,186,809 | $ | 31,534 | $ | 863,247 | $ | 1,070,227 | $ | (1,969,365 | ) | $ | 1,186,809 | $ | 4,409 | $ | 1,029,445 | $ | 21,557 | $ | 591,247 | $ | 1,200,844 | $ | (1,818,057 | ) | $ | 1,029,445 | ||||||||||||||
| | | | | | | | | | | | | | | | | | | | | | | | | | | | | | | | | | | | | | | | | | | | | | |
| | | | | | | | | | | | | | | | | | | | | | | | | | | | | | | | | | | | | | | | | | | | | |
| | For the year ended December 31, 2014 | |||||||||||||||||||||
|---|---|---|---|---|---|---|---|---|---|---|---|---|---|---|---|---|---|---|---|---|---|---|
| | Issuer | Guarantors | | | | |||||||||||||||||
| | FMC US Finance | FMC - AG & Co. KGaA | D-GmbH | FMCH | Non-Guarantor Subsidiaries | Combining Adjustment | Combined Total | |||||||||||||||
Revenue | $ | — | $ | — | $ | 2,211,756 | $ | — | $ | 17,159,641 | $ | (3,539,784 | ) | $ | 15,831,613 | |||||||
Cost of revenue | — | — | 1,395,295 | — | 12,929,889 | (3,489,417 | ) | 10,835,767 | ||||||||||||||
| | | | | | | | | | | | | | | | | | | | | | | |
Gross profit | — | — | 816,461 | — | 4,229,752 | (50,367 | ) | 4,995,846 | ||||||||||||||
| | | | | | | | | | | | | | | | | | | | | | | |
Operating (income) expenses: | ||||||||||||||||||||||
Selling, general and administrative(1) | — | 234,170 | 198,789 | 147,203 | 2,046,499 | (7,462 | ) | 2,619,199 | ||||||||||||||
Research and development | — | — | 74,338 | — | 47,776 | — | 122,114 | |||||||||||||||
| | | | | | | | | | | | | | | | | | | | | | | |
Operating income (loss) | — | (234,170 | ) | 543,334 | (147,203 | ) | 2,135,477 | (42,905 | ) | 2,254,533 | ||||||||||||
| | | | | | | | | | | | | | | | | | | | | | | |
Other (income) expense: | ||||||||||||||||||||||
Interest, net | (6,930 | ) | 238,554 | (5,029 | ) | 198,726 | (14,181 | ) | (13 | ) | 411,127 | |||||||||||
Other, net | — | (1,555,399 | ) | 382,870 | (771,567 | ) | — | 1,944,096 | — | |||||||||||||
| | | | | | | | | | | | | | | | | | | | | | | |
Income (loss) before income taxes | 6,930 | 1,082,675 | 165,493 | 425,638 | 2,149,658 | (1,986,988 | ) | 1,843,406 | ||||||||||||||
Income tax expense (benefit) | 2,524 | 37,409 | 150,268 | (136,469 | ) | 832,919 | (303,053 | ) | 583,598 | |||||||||||||
| | | | | | | | | | | | | | | | | | | | | | | |
Net income (loss) | 4,406 | 1,045,266 | 15,225 | 562,107 | 1,316,739 | (1,683,935 | ) | 1,259,808 | ||||||||||||||
Net income attributable to noncontrolling interests | — | — | — | — | 214,542 | — | 214,542 | |||||||||||||||
| | | | | | | | | | | | | | | | | | | | | | | |
Net income (loss) attributable to shareholders of FMC-AG & Co. KGaA | $ | 4,406 | $ | 1,045,266 | $ | 15,225 | $ | 562,107 | $ | 1,102,197 | $ | (1,683,935 | ) | $ | 1,045,266 | |||||||
| | | | | | | | | | | | | | | | | | | | | | | |
| | | | | | | | | | | | | | | | | | | | | | | |
| | | | | | | | | | | | | | | | | | | | | | | |
FRESENIUS MEDICAL CARE AG & Co. KGaA
NOTES TO CONSOLIDATED FINANCIAL STATEMENTS — (Continued)
(in thousands, except share and per share data)
| | For the year ended December 31, 2014 | For the year ended December 31, 2016 | ||||||||||||||||||||||||||||||||||||||||||
|---|---|---|---|---|---|---|---|---|---|---|---|---|---|---|---|---|---|---|---|---|---|---|---|---|---|---|---|---|---|---|---|---|---|---|---|---|---|---|---|---|---|---|---|---|
| | Issuer | Guarantors | | | | Issuer | Guarantors | | | | ||||||||||||||||||||||||||||||||||
| | FMC US Finance | FMC-AG & Co. KGaA | D-GmbH | FMCH | Non-Guarantor Subsidiaries | Combining Adjustment | Combined Total | FMC US Finance | FMC - AG & Co. KGaA | D-GmbH | FMCH | Non-Guarantor Subsidiaries | Combining Adjustment | Combined Total | ||||||||||||||||||||||||||||||
Net Income | $ | 4,406 | $ | 1,045,266 | $ | 15,225 | $ | 562,107 | $ | 1,316,739 | $ | (1,683,935 | ) | $ | 1,259,808 | $ | 4,527 | $ | 1,243,267 | $ | (17,933 | ) | $ | 849,637 | $ | 1,566,166 | $ | (2,096,813 | ) | $ | 1,548,851 | |||||||||||||
| | | | | | | | | | | | | | | | | | | | | | | | | | | | | | | | | | | | | | | | | | | | | |
Gain (loss) related to cash flow hedges | — | 46,374 | — | — | (20,827 | ) | — | 25,547 | — | 30,311 | 1,412 | — | (3,928 | ) | — | 27,795 | ||||||||||||||||||||||||||||
Actuarial gain (loss) on defined benefit pension plans | — | (4,788 | ) | (85,460 | ) | (116,240 | ) | (8,673 | ) | — | (215,161 | ) | — | (2,686 | ) | (39,547 | ) | 45,479 | (4,710 | ) | — | (1,464 | ) | |||||||||||||||||||||
Gain (loss) related to foreign currency translation | — | 20,407 | (85,635 | ) | — | (375,504 | ) | 18,943 | (421,789 | ) | — | 77,047 | (16,128 | ) | — | (83,079 | ) | 23,440 | 1,280 | |||||||||||||||||||||||||
Income tax (expense) benefit related to components of other comprehensive income | — | (14,707 | ) | (25,288 | ) | (45,857 | ) | 154,013 | — | 68,161 | — | (9,501 | ) | (12,161 | ) | 17,941 | (8,053 | ) | — | (11,774 | ) | |||||||||||||||||||||||
| | | | | | | | | | | | | | | | | | | | | | | | | | | | | | | | | | | | | | | | | | | | | |
Other comprehensive income (loss), net of tax | — | 47,286 | (196,383 | ) | (162,097 | ) | (250,991 | ) | 18,943 | (543,242 | ) | — | 95,171 | (66,424 | ) | 63,420 | (99,770 | ) | 23,440 | 15,837 | ||||||||||||||||||||||||
| | | | | | | | | | | | | | | | | | | | | | | | | | | | | | | | | | | | | | | | | | | | | |
Total comprehensive income | $ | 4,406 | $ | 1,092,552 | $ | (181,158 | ) | $ | 400,010 | $ | 1,065,748 | $ | (1,664,992 | ) | $ | 716,566 | $ | 4,527 | $ | 1,338,438 | $ | (84,357 | ) | $ | 913,057 | $ | 1,466,396 | $ | (2,073,373 | ) | $ | 1,564,688 | ||||||||||||
Comprehensive income attributable to noncontrolling interests | — | — | — | — | — | 208,456 | 208,456 | — | — | — | — | — | 304,138 | 304,138 | ||||||||||||||||||||||||||||||
| | | | | | | | | | | | | | | | | | | | | | | | | | | | | | | | | | | | | | | | | | | | | |
Comprehensive income attributable to shareholders of FMC-AG & Co. KGaA | $ | 4,406 | $ | 1,092,552 | $ | (181,158 | ) | $ | 400,010 | $ | 1,065,748 | $ | (1,873,448 | ) | $ | 508,110 | $ | 4,527 | $ | 1,338,438 | $ | (84,357 | ) | $ | 913,057 | $ | 1,466,396 | $ | (2,377,511 | ) | $ | 1,260,550 | ||||||||||||
| | | | | | | | | | | | | | | | | | | | | | | | | | | | | | | | | | | | | | | | | | | | | | |
| | | | | | | | | | | | | | | | | | | | | | | | | | | | | | | | | | | | | | | | | | | | | |
| | For the year ended December 31, 2015 | |||||||||||||||||||||
|---|---|---|---|---|---|---|---|---|---|---|---|---|---|---|---|---|---|---|---|---|---|---|
| | Issuer | Guarantors | | | | |||||||||||||||||
| | FMC US Finance | FMC - AG & Co. KGaA | D-GmbH | FMCH | Non-Guarantor Subsidiaries | Combining Adjustment | Combined Total | |||||||||||||||
Net Income | $ | 4,409 | $ | 1,029,445 | $ | 21,557 | $ | 591,247 | $ | 1,484,548 | $ | (1,818,057 | ) | $ | 1,313,149 | |||||||
| | | | | | | | | | | | | | | | | | | | | | | |
Gain (loss) related to cash flow hedges | — | 40,358 | — | — | 19,773 | — | 60,131 | |||||||||||||||
Actuarial gain (loss) on defined benefit pension plans | — | 2,228 | 53,574 | 21,765 | 4,267 | — | 81,834 | |||||||||||||||
Gain (loss) related to foreign currency translation | — | (46,797 | ) | (63,961 | ) | — | (258,491 | ) | 17,124 | (352,125 | ) | |||||||||||
Income tax (expense) benefit related to components of other comprehensive income | — | (12,251 | ) | (15,869 | ) | (8,586 | ) | (6,647 | ) | — | (43,353 | ) | ||||||||||
| | | | | | | | | | | | | | | | | | | | | | | |
Other comprehensive income (loss), net of tax | — | (16,462 | ) | (26,256 | ) | 13,179 | (241,098 | ) | 17,124 | (253,513 | ) | |||||||||||
| | | | | | | | | | | | | | | | | | | | | | | |
Total comprehensive income | $ | 4,409 | $ | 1,012,983 | $ | (4,699 | ) | $ | 604,426 | $ | 1,243,450 | $ | (1,800,933 | ) | $ | 1,059,636 | ||||||
Comprehensive income attributable to noncontrolling interests | — | — | — | — | — | 278,743 | 278,743 | |||||||||||||||
| | | | | | | | | | | | | | | | | | | | | | | |
Comprehensive income attributable to shareholders of FMC-AG & Co. KGaA | $ | 4,409 | $ | 1,012,983 | $ | (4,699 | ) | $ | 604,426 | $ | 1,243,450 | $ | (2,079,676 | ) | $ | 780,893 | ||||||
| | | | | | | | | | | | | | | | | | | | | | | |
| | | | | | | | | | | | | | | | | | | | | | | |
| | | | | | | | | | | | | | | | | | | | | | | |
FRESENIUS MEDICAL CARE AG & Co. KGaA
NOTES TO CONSOLIDATED FINANCIAL STATEMENTS — (Continued)
(in thousands, except share and per share data)
| | For the year ended December 31, 2014 | |||||||||||||||||||||
|---|---|---|---|---|---|---|---|---|---|---|---|---|---|---|---|---|---|---|---|---|---|---|
| | Issuer | Guarantors | | | | |||||||||||||||||
| | FMC US Finance | FMC - AG & Co. KGaA | D-GmbH | FMCH | Non-Guarantor Subsidiaries | Combining Adjustment | Combined Total | |||||||||||||||
Net Income | $ | 4,406 | $ | 1,045,266 | $ | 15,225 | $ | 562,107 | $ | 1,316,739 | $ | (1,683,935 | ) | $ | 1,259,808 | |||||||
| | | | | | | | | | | | | | | | | | | | | | | |
Gain (loss) related to cash flow hedges | — | 46,374 | — | — | (20,827 | ) | — | 25,547 | ||||||||||||||
Actuarial gain (loss) on defined benefit pension plans | — | (4,788 | ) | (85,460 | ) | (116,240 | ) | (8,673 | ) | — | (215,161 | ) | ||||||||||
Gain (loss) related to foreign currency translation | — | 20,407 | (85,635 | ) | — | (375,504 | ) | 18,943 | (421,789 | ) | ||||||||||||
Income tax (expense) benefit related to components of other comprehensive income | — | (11,873 | ) | 25,288 | 45,857 | 8,889 | — | 68,161 | ||||||||||||||
| | | | | | | | | | | | | | | | | | | | | | | |
Other comprehensive income (loss), net of tax | — | 50,120 | (145,807 | ) | (70,383 | ) | (396,115 | ) | 18,943 | (543,242 | ) | |||||||||||
| | | | | | | | | | | | | | | | | | | | | | | |
Total comprehensive income | $ | 4,406 | $ | 1,095,386 | $ | (130,582 | ) | $ | 491,724 | $ | 920,624 | $ | (1,664,992 | ) | $ | 716,566 | ||||||
Comprehensive income attributable to noncontrolling interests | — | — | — | — | — | 208,456 | 208,456 | |||||||||||||||
| | | | | | | | | | | | | | | | | | | | | | | |
Comprehensive income attributable to shareholders of FMC-AG & Co. KGaA | $ | 4,406 | $ | 1,095,386 | $ | (130,582 | ) | $ | 491,724 | $ | 920,624 | $ | (1,873,448 | ) | $ | 508,110 | ||||||
| | | | | | | | | | | | | | | | | | | | | | | |
| | | | | | | | | | | | | | | | | | | | | | | |
| | | | | | | | | | | | | | | | | | | | | | | |
FRESENIUS MEDICAL CARE AG & Co. KGaA
NOTES TO CONSOLIDATED FINANCIAL STATEMENTS — (Continued)
(in thousands, except share data)
| | For the year ended December 31, 2013 | |||||||||||||||||||||
|---|---|---|---|---|---|---|---|---|---|---|---|---|---|---|---|---|---|---|---|---|---|---|
| | Issuer | Guarantors | | | | |||||||||||||||||
| | FMC US Finance | FMC-AG & Co. KGaA | D-GmbH | FMCH | Non-Guarantor Subsidiaries | Combining Adjustment | Combined Total | |||||||||||||||
Net Income | $ | 4,377 | $ | 1,109,890 | $ | (3,251 | ) | $ | 739,402 | $ | 1,206,287 | $ | (1,801,082 | ) | $ | 1,255,623 | ||||||
| | | | | | | | | | | | | | | | | | | | | | | |
Gain (loss) related to cash flow hedges | — | 21,020 | — | — | 1,512 | — | 22,532 | |||||||||||||||
Actuarial gain (loss) on defined benefit pension plans | — | (971 | ) | (15,150 | ) | 83,597 | (2,487 | ) | — | 64,989 | ||||||||||||
Gain (loss) related to foreign currency translation | — | (158,328 | ) | 32,934 | — | (12,896 | ) | 23,851 | (114,439 | ) | ||||||||||||
Income tax (expense) benefit related to components of other comprehensive income | — | (6,317 | ) | (4,418 | ) | 32,979 | (55,844 | ) | — | (33,600 | ) | |||||||||||
| | | | | | | | | | | | | | | | | | | | | | | |
Other comprehensive income (loss), net of tax | — | (144,596 | ) | 13,366 | 116,576 | (69,715 | ) | 23,851 | (60,518 | ) | ||||||||||||
| | | | | | | | | | | | | | | | | | | | | | | |
Total comprehensive income | $ | 4,377 | $ | 965,294 | $ | 10,115 | $ | 855,978 | $ | 1,136,572 | $ | (1,777,231 | ) | $ | 1,195,105 | |||||||
Comprehensive income attributable to noncontrolling interests | — | — | — | — | — | 143,689 | 143,689 | |||||||||||||||
| | | | | | | | | | | | | | | | | | | | | | | |
Comprehensive income attributable to shareholders of FMC-AG & Co. KGaA | $ | 4,377 | $ | 965,294 | $ | 10,115 | $ | 855,978 | $ | 1,136,572 | $ | (1,920,920 | ) | $ | 1,051,416 | |||||||
| | | | | | | | | | | | | | | | | | | | | | | |
| | | | | | | | | | | | | | | | | | | | | | | |
| | | | | | | | | | | | | | | | | | | | | | | |
| | For the year ended December 31, 2012 | |||||||||||||||||||||
|---|---|---|---|---|---|---|---|---|---|---|---|---|---|---|---|---|---|---|---|---|---|---|
| | Issuer | Guarantors | | | | |||||||||||||||||
| | FMC US Finance | FMC-AG & Co. KGaA | D-GmbH | FMCH | Non-Guarantor Subsidiaries | Combining Adjustment | Combined Total | |||||||||||||||
Net Income | $ | 4,357 | $ | 1,186,809 | $ | 31,534 | $ | 863,247 | $ | 1,210,395 | $ | (1,969,365 | ) | $ | 1,326,977 | |||||||
| | | | | | | | | | | | | | | | | | | | | | | |
Gain (loss) related to cash flow hedges | — | (4,465 | ) | (9 | ) | 11,725 | 16,768 | — | 24,019 | |||||||||||||
Actuarial gain (loss) on defined benefit pension plans | — | (2,091 | ) | (46,830 | ) | (49,796 | ) | (4,461 | ) | — | (103,178 | ) | ||||||||||
Gain (loss) related to foreign currency translation | — | (84,026 | ) | 18,540 | — | 132,627 | (3,338 | ) | 63,803 | |||||||||||||
Income tax (expense) benefit related to components of other comprehensive income | — | 3,615 | 13,447 | 15,019 | (23,250 | ) | — | 8,831 | ||||||||||||||
| | | | | | | | | | | | | | | | | | | | | | | |
Other comprehensive income (loss), net of tax | — | (86,967 | ) | (14,852 | ) | (23,052 | ) | 121,684 | (3,338 | ) | (6,525 | ) | ||||||||||
| | | | | | | | | | | | | | | | | | | | | | | |
Total comprehensive income | $ | 4,357 | $ | 1,099,842 | $ | 16,682 | $ | 840,195 | $ | 1,332,079 | $ | (1,972,703 | ) | $ | 1,320,452 | |||||||
Comprehensive income attributable to noncontrolling interests | — | — | — | — | — | 139,989 | 139,989 | |||||||||||||||
| | | | | | | | | | | | | | | | | | | | | | | |
Comprehensive income attributable to shareholders of FMC-AG & Co. KGaA | $ | 4,357 | $ | 1,099,842 | $ | 16,682 | $ | 840,195 | $ | 1,332,079 | $ | (2,112,692 | ) | $ | 1,180,463 | |||||||
| | | | | | | | | | | | | | | | | | | | | | | |
| | | | | | | | | | | | | | | | | | | | | | | |
| | | | | | | | | | | | | | | | | | | | | | | |
FRESENIUS MEDICAL CARE AG & Co. KGaA
NOTES TO CONSOLIDATED FINANCIAL STATEMENTS — (Continued)(in thousands, exceptand per share data)
| | At December 31, 2014 | At December 31, 2016 | ||||||||||||||||||||||||||||||||||||||||
|---|---|---|---|---|---|---|---|---|---|---|---|---|---|---|---|---|---|---|---|---|---|---|---|---|---|---|---|---|---|---|---|---|---|---|---|---|---|---|---|---|---|---|
| | Issuer | Guarantors | | | | Issuer | Guarantors | | | | ||||||||||||||||||||||||||||||||
| | FMC US Finance | FMC-AG & Co. KGaA | D-GmbH | FMCH | Non-Guarantor Subsidiaries | Combining Adjustment | Combined Total | FMC US Finance | FMC - AG & Co. KGaA | D-GmbH | FMCH | Non-Guarantor Subsidiaries | Combining Adjustment | Combined Total | ||||||||||||||||||||||||||||
Current assets: | ||||||||||||||||||||||||||||||||||||||||||
Cash and cash equivalents | $ | 1 | $ | 117 | $ | 5,722 | $ | — | $ | 628,015 | $ | — | $ | 633,855 | $ | 0 | $ | 38,207 | $ | 988 | $ | — | $ | 1,012,927 | $ | (304,889) | $ | 747,233 | ||||||||||||||
Trade accounts receivable, less allowance for doubtful accounts | — | — | 165,090 | — | 3,037,010 | 1,555 | 3,203,655 | — | — | 152,040 | — | 3,372,856 | (638) | 3,524,258 | ||||||||||||||||||||||||||||
Accounts receivable from related parties | 1,266,916 | 5,558,131 | 840,302 | 2,570,654 | 3,544,817 | (13,587,595) | 193,225 | 1,266,328 | 1,867,405 | 994,691 | 2,344,048 | 4,124,502 | (10,376,177) | 220,797 | ||||||||||||||||||||||||||||
Inventories | — | — | 231,127 | — | 1,038,591 | (154,164) | 1,115,554 | — | — | 238,215 | — | 1,353,960 | (182,341) | 1,409,834 | ||||||||||||||||||||||||||||
Prepaid expenses and other current assets | — | 76,846 | 43,387 | 183 | 1,182,301 | 30,350 | 1,333,067 | — | 80,201 | 49,939 | 183 | 1,238,146 | 43,364 | 1,411,833 | ||||||||||||||||||||||||||||
Deferred taxes | — | — | — | — | 290,064 | (44,710) | 245,354 | |||||||||||||||||||||||||||||||||||
| | | | | | | | | | | | | | | | | | | | | | | | | | | | | | | | | | | | | | | | | | | |
Total current assets | 1,266,917 | 5,635,094 | 1,285,628 | 2,570,837 | 9,720,798 | (13,754,564) | 6,724,710 | 1,266,328 | 1,985,813 | 1,435,873 | 2,344,231 | 11,102,391 | (10,820,681) | 7,313,955 | ||||||||||||||||||||||||||||
Property, plant and equipment, net | — | 566 | 260,662 | — | 3,147,750 | (118,798) | 3,290,180 | — | 649 | 274,042 | — | 3,601,302 | (102,780) | 3,773,213 | ||||||||||||||||||||||||||||
Intangible assets | — | 945 | 64,679 | — | 799,958 | 3,829 | 869,411 | — | 657 | 44,528 | — | 796,804 | 5,209 | 847,198 | ||||||||||||||||||||||||||||
Goodwill | — | — | 55,312 | — | 13,026,868 | — | 13,082,180 | — | — | 52,908 | — | 13,613,538 | — | 13,666,446 | ||||||||||||||||||||||||||||
Deferred taxes | — | 81,555 | 38,291 | — | 129,927 | (108,721) | 141,052 | — | 105,601 | 49,495 | — | 166,127 | (118,385) | 202,838 | ||||||||||||||||||||||||||||
Other assets and notes receivables(1) | — | 9,154,819 | 45,297 | 13,267,706 | 6,662,384 | (27,790,638) | 1,339,568 | — | 14,297,824 | 36,194 | 14,515,756 | 7,471,030 | (35,190,512) | 1,130,292 | ||||||||||||||||||||||||||||
| | | | | | | | | | | | | | | | | | | | | | | | | | | | | | | | | | | | | | | | | | | |
Total assets | $ | 1,266,917 | $ | 14,872,979 | $ | 1,749,869 | $ | 15,838,543 | $ | 33,487,685 | $ | (41,768,892) | $ | 25,447,101 | $ | 1,266,328 | $ | 16,390,544 | $ | 1,893,040 | $ | 16,859,987 | $ | 36,751,192 | $ | (46,227,149) | $ | 26,933,942 | ||||||||||||||
| | | | | | | | | | | | | | | | | | | | | | | | | | | | | | | | | | | | | | | | | | | | |
| | | | | | | | | | | | | | | | | | | | | | | | | | | | | | | | | | | | | | | | | | | |
Current liabilities: | ||||||||||||||||||||||||||||||||||||||||||
Accounts payable | $ | — | $ | 1,844 | $ | 34,798 | $ | — | $ | 536,542 | $ | — | $ | 573,184 | $ | — | $ | 1,275 | $ | 25,315 | $ | — | $ | 580,104 | $ | — | $ | 606,694 | ||||||||||||||
Accounts payable to related parties | — | 1,452,812 | 587,677 | 1,662,032 | 10,232,251 | (13,794,041) | 140,731 | — | 361,658 | 808,527 | 1,672,266 | 6,761,341 | (9,325,437) | 278,355 | ||||||||||||||||||||||||||||
Accrued expenses and other current liabilities | 29,771 | 61,367 | 141,392 | 9,240 | 1,982,051 | (26,576) | 2,197,245 | 29,771 | 39,189 | 126,974 | 150,676 | 2,309,043 | (2,468) | 2,653,185 | ||||||||||||||||||||||||||||
Short-term borrowings | — | 1 | — | — | 132,692 | — | 132,693 | — | 844,800 | — | — | 100,788 | (343,094) | 602,494 | ||||||||||||||||||||||||||||
Short-term borrowings from related parties | — | — | — | — | 5,357 | — | 5,357 | — | 1,310,482 | — | — | — | (1,307,320) | 3,162 | ||||||||||||||||||||||||||||
Current portion of long-term debt and capital lease obligations | — | 55,391 | — | 200,000 | 58,216 | — | 313,607 | 502,671 | 25,298 | 1,284 | 200,000 | 34,145 | — | 763,398 | ||||||||||||||||||||||||||||
Income tax payable | — | 13,663 | — | — | 66,024 | — | 79,687 | — | 10,410 | — | — | 119,599 | — | 130,009 | ||||||||||||||||||||||||||||
Deferred taxes | — | 1,573 | 7,992 | — | 47,555 | (22,333) | 34,787 | |||||||||||||||||||||||||||||||||||
| | | | | | | | | | | | | | | | | | | | | | | | | | | | | | | | | | | | | | | | | | | |
Total current liabilities | 29,771 | 1,586,651 | 771,859 | 1,871,272 | 13,060,688 | (13,842,950) | 3,477,291 | 532,442 | 2,593,112 | 962,100 | 2,022,942 | 9,905,020 | (10,978,319) | 5,037,297 | ||||||||||||||||||||||||||||
Long term debt and capital lease obligations, less current portion | 1,162,534 | 855,029 | — | 2,335,992 | 7,783,062 | (3,056,340) | 9,080,277 | 650,000 | 628,551 | 4,563 | 1,896,451 | 6,423,443 | (2,400,463) | 7,202,545 | ||||||||||||||||||||||||||||
Long term borrowings from related parties | — | 2,891,256 | — | 2,833,854 | 72,505 | (5,797,615) | — | — | 2,204,248 | — | 3,246,515 | — | (5,450,763) | — | ||||||||||||||||||||||||||||
Other liabilities | — | 70,823 | 1,615 | 170,149 | 147,015 | 22,374 | 411,976 | — | 102,595 | 3,862 | 410,454 | 103,597 | 38,334 | 658,842 | ||||||||||||||||||||||||||||
Pension liabilities | — | 14,872 | 324,156 | — | 296,531 | 6,759 | 642,318 | — | 20,090 | 381,788 | — | 175,137 | (36,748) | 540,267 | ||||||||||||||||||||||||||||
Income tax payable | 637 | 11,035 | — | — | 48,370 | 117,559 | 177,601 | 976 | 33,226 | — | — | (2,368) | 92,742 | 124,576 | ||||||||||||||||||||||||||||
Deferred taxes | — | — | — | — | 831,050 | (26,441) | 804,609 | — | — | — | — | 703,018 | (30,751) | 672,267 | ||||||||||||||||||||||||||||
| | | | | | | | | | | | | | | | | | | | | | | | | | | | | | | | | | | | | | | | | | | |
Total liabilities | 1,192,942 | 5,429,666 | 1,097,630 | 7,211,267 | 22,239,221 | (22,576,654) | 14,594,072 | 1,183,418 | 5,581,822 | 1,352,313 | 7,576,362 | 17,307,847 | (18,765,968) | 14,235,794 | ||||||||||||||||||||||||||||
Noncontrolling interests subject to put provisions | — | — | 0 | — | 824,658 | — | 824,658 | |||||||||||||||||||||||||||||||||||
Redeemable Preferred Stock | — | — | — | 235,141 | (235,141) | — | — | |||||||||||||||||||||||||||||||||||
Noncontrolling interests subject to put provisions and other temporary equity | — | — | — | — | 1,241,088 | — | 1,241,088 | |||||||||||||||||||||||||||||||||||
Total FMC-AG & Co. KGaA shareholders' equity | 73,975 | 9,443,313 | 652,239 | 8,392,135 | 10,073,889 | (19,192,238) | 9,443,313 | 82,910 | 10,808,722 | 540,727 | 9,283,625 | 17,553,919 | (27,461,181) | 10,808,722 | ||||||||||||||||||||||||||||
Noncontrolling interests not subject to put provisions | — | — | — | — | 585,058 | — | 585,058 | — | — | — | — | 648,338 | — | 648,338 | ||||||||||||||||||||||||||||
| | | | | | | | | | | | | | | | | | | | | | | | | | | | | | | | | | | | | | | | | | | |
Total equity | 73,975 | 9,443,313 | 652,239 | 8,392,135 | 10,658,947 | (19,192,238) | 10,028,371 | 82,910 | 10,808,722 | 540,727 | 9,283,625 | 18,202,257 | (27,461,181) | 11,457,060 | ||||||||||||||||||||||||||||
| | | | | | | | | | | | | | | | | | | | | | | | | | | | | | | | | | | | | | | | | | | |
Total liabilities and equity | $ | 1,266,917 | $ | 14,872,979 | $ | 1,749,869 | $ | 15,838,543 | $ | 33,487,685 | $ | (41,768,892) | $ | 25,447,101 | $ | 1,266,328 | $ | 16,390,544 | $ | 1,893,040 | $ | 16,859,987 | $ | 36,751,192 | $ | (46,227,149) | $ | 26,933,942 | ||||||||||||||
| | | | | | | | | | | | | | | | | | | | | | | | | | | | | | | | | | | | | | | | | | | | |
| | | | | | | | | | | | | | | | | | | | | | | | | | | | | | | | | | | | | | | | | | | |
FRESENIUS MEDICAL CARE AG & Co. KGaA
NOTES TO CONSOLIDATED FINANCIAL STATEMENTS — (Continued)
(in thousands, except share and per share data)
| | At December 31, 2013 | At December 31, 2015 | ||||||||||||||||||||||||||||||||||||||||
|---|---|---|---|---|---|---|---|---|---|---|---|---|---|---|---|---|---|---|---|---|---|---|---|---|---|---|---|---|---|---|---|---|---|---|---|---|---|---|---|---|---|---|
| | Issuer | Guarantors | | | | Issuer | Guarantors | | | | ||||||||||||||||||||||||||||||||
| | FMC US Finance | FMC-AG & Co. KGaA | D-GmbH | FMCH | Non-Guarantor Subsidiaries | Combining Adjustment | Combined Total | FMC US Finance | FMC - AG & Co. KGaA | D-GmbH | FMCH | Non-Guarantor Subsidiaries | Combining Adjustment | Combined Total | ||||||||||||||||||||||||||||
Current assets: | ||||||||||||||||||||||||||||||||||||||||||
Cash and cash equivalents | $ | 0 | $ | 13 | $ | 4,490 | $ | — | $ | 672,206 | $ | 6,068 | $ | 682,777 | $ | 2 | $ | 448 | $ | 5,055 | $ | — | $ | 544,443 | $ | (448) | $ | 549,500 | ||||||||||||||
Trade accounts receivable, less allowance for doubtful accounts | — | — | 152,480 | — | 2,882,736 | 2,058 | 3,037,274 | ��� | — | 144,105 | — | 3,140,355 | 736 | 3,285,196 | ||||||||||||||||||||||||||||
Accounts receivable from related parties | 1,269,092 | 960,137 | 815,748 | 1,643,394 | 4,073,975 | (8,609,228) | 153,118 | 1,266,557 | 985,449 | 682,359 | 2,434,976 | 4,002,451 | (9,153,507) | 218,285 | ||||||||||||||||||||||||||||
Inventories | — | — | 287,625 | — | 946,790 | (137,311) | 1,097,104 | — | — | 233,012 | — | 1,256,252 | (148,513) | 1,340,751 | ||||||||||||||||||||||||||||
Prepaid expenses and other current assets | — | 71,939 | 41,240 | 167 | 879,085 | 44,960 | 1,037,391 | — | 91,902 | 60,024 | 983 | 1,186,883 | 34,923 | 1,374,715 | ||||||||||||||||||||||||||||
Deferred taxes | — | — | — | — | 322,337 | (43,285) | 279,052 | |||||||||||||||||||||||||||||||||||
| | | | | | | | | | | | | | | | | | | | | | | | | | | | | | | | | | | | | | | | | | | |
Total current assets | 1,269,092 | 1,032,089 | 1,301,583 | 1,643,561 | 9,777,129 | (8,736,738) | 6,286,716 | 1,266,559 | 1,077,799 | 1,124,555 | 2,435,959 | 10,130,384 | (9,266,809) | 6,768,447 | ||||||||||||||||||||||||||||
Property, plant and equipment, net | — | 734 | 238,469 | — | 2,980,268 | (127,517) | 3,091,954 | — | 595 | 267,926 | — | 3,260,604 | (103,551) | 3,425,574 | ||||||||||||||||||||||||||||
Intangible assets | — | 501 | 73,166 | — | 684,290 | (81) | 757,876 | — | 1,653 | 51,593 | — | 777,319 | (76) | 830,489 | ||||||||||||||||||||||||||||
Goodwill | — | — | 62,829 | — | 11,595,358 | — | 11,658,187 | — | — | 49,599 | — | 12,983,151 | — | 13,032,750 | ||||||||||||||||||||||||||||
Deferred taxes | — | 80,931 | 14,209 | — | 118,306 | (109,279) | 104,167 | — | 91,392 | 27,626 | — | 221,211 | (151,396) | 188,833 | ||||||||||||||||||||||||||||
Other assets and notes receivables(1) | — | 13,955,933 | 47,661 | 12,583,487 | 5,234,132 | (30,600,207) | 1,221,006 | — | 13,950,467 | 43,452 | 13,256,088 | 6,372,300 | (32,503,146) | 1,119,161 | ||||||||||||||||||||||||||||
| | | | | | | | | | | | | | | | | | | | | | | | | | | | | | | | | | | | | | | | | | | |
Total assets | $ | 1,269,092 | $ | 15,070,188 | $ | 1,737,917 | $ | 14,227,048 | $ | 30,389,483 | $ | (39,573,822) | $ | 23,119,906 | $ | 1,266,559 | $ | 15,121,906 | $ | 1,564,751 | $ | 15,692,047 | $ | 33,744,969 | $ | (42,024,978) | $ | 25,365,254 | ||||||||||||||
| | | | | | | | | | | | | | | | | | | | | | | | | | | | | | | | | | | | | | | | | | | | |
| | | | | | | | | | | | | | | | | | | | | | | | | | | | | | | | | | | | | | | | | | | |
Current liabilities: | ||||||||||||||||||||||||||||||||||||||||||
Accounts payable | $ | — | $ | 2,193 | $ | 28,689 | $ | — | $ | 511,715 | $ | — | $ | 542,597 | $ | — | $ | 7,233 | $ | 22,914 | $ | — | $ | 597,681 | $ | — | $ | 627,828 | ||||||||||||||
Accounts payable to related parties | — | 1,896,712 | 522,719 | 1,600,480 | 4,931,344 | (8,827,326) | 123,929 | — | 277,986 | 497,410 | 1,668,390 | 5,386,272 | (7,677,035) | 153,023 | ||||||||||||||||||||||||||||
Accrued expenses and other current liabilities | 29,770 | 45,897 | 129,727 | 9,403 | 1,786,709 | 11,027 | 2,012,533 | 29,771 | 61,216 | 118,047 | 15,527 | 2,285,939 | (7,363) | 2,503,137 | ||||||||||||||||||||||||||||
Short-term borrowings | — | 60 | — | — | 96,588 | — | 96,648 | — | — | — | — | 109,700 | (448) | 109,252 | ||||||||||||||||||||||||||||
Short-term borrowings from related parties | — | — | — | — | 62,342 | — | 62,342 | — | 1,757,402 | ��� | — | — | (1,738,350) | 19,052 | ||||||||||||||||||||||||||||
Current portion of long-term debt and capital lease obligations | — | 271,090 | — | 200,000 | 40,280 | — | 511,370 | — | 25,228 | — | 200,000 | 439,107 | — | 664,335 | ||||||||||||||||||||||||||||
Income tax payable | — | 114,197 | — | — | 56,163 | — | 170,360 | — | 20,898 | — | — | 51,921 | — | 72,819 | ||||||||||||||||||||||||||||
Deferred taxes | — | 2,331 | 9,002 | — | 64,539 | (41,678) | 34,194 | |||||||||||||||||||||||||||||||||||
| | | | | | | | | | | | | | | | | | | | | | | | | | | | | | | | | | | | | | | | | | | |
Total current liabilities | 29,770 | 2,332,480 | 690,137 | 1,809,883 | 7,549,680 | (8,857,977) | 3,553,973 | 29,771 | 2,149,963 | 638,371 | 1,883,917 | 8,870,620 | (9,423,196) | 4,149,446 | ||||||||||||||||||||||||||||
Long term debt and capital lease obligations, less current portion | 1,167,466 | 96,699 | — | 2,438,189 | 7,478,944 | (3,434,378) | 7,746,920 | 1,157,603 | 663,515 | — | 2,113,544 | 6,657,108 | (2,738,283) | 7,853,487 | ||||||||||||||||||||||||||||
Long term borrowings from related parties | — | 3,359,606 | — | 2,092,818 | 6,940 | (5,459,364) | — | — | 2,276,600 | — | 2,680,741 | — | (4,957,341) | — | ||||||||||||||||||||||||||||
Other liabilities | — | 5,616 | 6,028 | — | 298,313 | 19,604 | 329,561 | — | 117,444 | 1,612 | 488,142 | (176,998) | 35,425 | 465,625 | ||||||||||||||||||||||||||||
Pension liabilities | — | 10,377 | 254,233 | — | 171,248 | — | 435,858 | — | 15,342 | 315,171 | — | 284,589 | (29,774) | 585,328 | ||||||||||||||||||||||||||||
Income tax payable | 2,287 | 30,846 | — | — | 20,262 | 123,538 | 176,933 | 801 | 11,900 | — | — | 22,060 | 127,739 | 162,500 | ||||||||||||||||||||||||||||
Deferred taxes | — | — | — | — | 768,156 | (24,766) | 743,390 | — | — | — | — | 693,815 | (69,315) | 624,500 | ||||||||||||||||||||||||||||
| | | | | | | | | | | | | | | | | | | | | | | | | | | | | | | | | | | | | | | | | | | |
Total liabilities | 1,199,523 | 5,835,624 | 950,398 | 6,340,890 | 16,293,543 | (17,633,343) | 12,986,635 | 1,188,175 | 5,234,764 | 955,154 | 7,166,344 | 16,351,194 | (17,054,745) | 13,840,886 | ||||||||||||||||||||||||||||
Noncontrolling interests subject to put provisions | — | — | 0 | — | 648,251 | — | 648,251 | |||||||||||||||||||||||||||||||||||
Noncontrolling interests subject to put provisions and other temporary equity | — | — | 0 | — | 1,028,368 | — | 1,028,368 | |||||||||||||||||||||||||||||||||||
Redeemable Preferred Stock | — | — | — | 235,141 | (235,141) | — | — | — | — | — | 235,141 | (235,141) | — | — | ||||||||||||||||||||||||||||
Total FMC-AG & Co. KGaA shareholders' equity | 69,569 | 9,234,564 | 787,519 | 7,651,017 | 13,432,374 | (21,940,479) | 9,234,564 | 78,384 | 9,887,142 | 609,597 | 8,290,562 | 15,991,690 | (24,970,233) | 9,887,142 | ||||||||||||||||||||||||||||
Noncontrolling interests not subject to put provisions | — | — | — | — | 250,456 | — | 250,456 | — | — | — | — | 608,858 | — | 608,858 | ||||||||||||||||||||||||||||
| | | | | | | | | | | | | | | | | | | | | | | | | | | | | | | | | | | | | | | | | | | |
Total equity | 69,569 | 9,234,564 | 787,519 | 7,651,017 | 13,682,830 | (21,940,479) | 9,485,020 | 78,384 | 9,887,142 | 609,597 | 8,290,562 | 16,600,548 | (24,970,233) | 10,496,000 | ||||||||||||||||||||||||||||
| | | | | | | | | | | | | | | | | | | | | | | | | | | | | | | | | | | | | | | | | | | |
Total liabilities and equity | $ | 1,269,092 | $ | 15,070,188 | $ | 1,737,917 | $ | 14,227,048 | $ | 30,389,483 | $ | (39,573,822) | $ | 23,119,906 | $ | 1,266,559 | $ | 15,121,906 | $ | 1,564,751 | $ | 15,692,047 | $ | 33,744,969 | $ | (42,024,978) | $ | 25,365,254 | ||||||||||||||
| | | | | | | | | | | | | | | | | | | | | | | | | | | | | | | | | | | | �� | | | | | | | | |
| | | | | | | | | | | | | | | | | | | | | | | | | | | | | | | | | | | | | | | | | | | |
FRESENIUS MEDICAL CARE AG & Co. KGaA
NOTES TO CONSOLIDATED FINANCIAL STATEMENTS — (Continued)
(in thousands, except share and per share data)
| | For the year ended December 31, 2014 | For the year ended December 31, 2016 | ||||||||||||||||||||||||||||||||||||||||||
|---|---|---|---|---|---|---|---|---|---|---|---|---|---|---|---|---|---|---|---|---|---|---|---|---|---|---|---|---|---|---|---|---|---|---|---|---|---|---|---|---|---|---|---|---|
| | Issuer | Guarantors | | | | Issuer | Guarantors | | | | ||||||||||||||||||||||||||||||||||
| | FMC US Finance | FMC-AG & Co. KGaA | D-GmbH | FMCH | Non-Guarantor Subsidiaries | Combining Adjustment | Combined Total | FMC US Finance | FMC - AG & Co. KGaA | D-GmbH | FMCH | Non-Guarantor Subsidiaries | Combining Adjustment | Combined Total | ||||||||||||||||||||||||||||||
Operating Activities: | ||||||||||||||||||||||||||||||||||||||||||||
Net income (loss) | $ | 4,406 | $ | 1,045,266 | $ | 15,225 | $ | 562,107 | $ | 1,316,739 | $ | (1,683,935 | ) | $ | 1,259,808 | $ | 4,527 | $ | 1,243,267 | $ | (17,933 | ) | $ | 849,637 | $ | 1,566,166 | $ | (2,096,813 | ) | $ | 1,548,851 | |||||||||||||
Adjustments to reconcile net income to net cash provided by (used in) operating activities: | ||||||||||||||||||||||||||||||||||||||||||||
Equity affiliate income | — | 4,211,195 | — | (771,567 | ) | — | (3,439,628 | ) | — | — | (393,220 | ) | — | (1,006,195 | ) | — | 1,399,415 | — | ||||||||||||||||||||||||||
Depreciation and amortization | — | 632 | 55,433 | — | 676,704 | (33,441 | ) | 699,328 | — | 1,251 | 66,502 | — | 738,307 | (30,115 | ) | 775,945 | ||||||||||||||||||||||||||||
Change in deferred taxes, net | — | (18,444 | ) | (2,212 | ) | — | 145,601 | (11,155 | ) | 113,790 | — | (26,327 | ) | (8,431 | ) | — | 37,690 | (8,560 | ) | (5,628 | ) | |||||||||||||||||||||||
(Gain) loss on sale of fixed assets and investments | — | — | 131 | — | 2,523 | — | 2,654 | — | (346 | ) | 3,148 | — | (5,119 | ) | — | (2,317 | ) | |||||||||||||||||||||||||||
(Gain) loss on investments | — | 13,862 | 986 | — | — | (14,848 | ) | — | — | (67,509 | ) | 5,728 | — | — | 61,781 | — | ||||||||||||||||||||||||||||
(Write Up) write-off loans from related parties | — | 67,629 | 7,371 | — | — | (75,000 | ) | — | — | 33,940 | 2,113 | — | — | (36,053 | ) | — | ||||||||||||||||||||||||||||
Compensation expense related to stock options | — | 6,307 | — | — | 2,200 | — | 8,507 | — | 25,691 | — | — | 4,485 | — | 30,176 | ||||||||||||||||||||||||||||||
Investments in equity method investees, net | — | 42,087 | — | — | (18,964 | ) | — | 23,123 | — | — | — | — | (58,608 | ) | — | (58,608 | ) | |||||||||||||||||||||||||||
Changes in assets and liabilities, net of amounts from businesses acquired: | ||||||||||||||||||||||||||||||||||||||||||||
Trade accounts receivable, net | — | — | (33,760 | ) | — | (123,932 | ) | 281 | (157,411 | ) | — | — | (13,141 | ) | — | (230,566 | ) | 1,418 | (242,289 | ) | ||||||||||||||||||||||||
Inventories | — | — | 24,166 | — | (148,719 | ) | 38,795 | (85,758 | ) | — | — | (8,889 | ) | — | (94,250 | ) | 36,471 | (66,668 | ) | |||||||||||||||||||||||||
Prepaid expenses and other current and non-current assets | — | 20,961 | 10,742 | 149,106 | (198,834 | ) | (6,154 | ) | (24,179 | ) | — | 60,145 | 10,466 | 106,963 | (156,916 | ) | 33,093 | 53,751 | ||||||||||||||||||||||||||
Accounts receivable from / payable to related parties | (3 | ) | (5,222,902 | ) | 6,481 | (814,972 | ) | 948,813 | 5,077,605 | (4,978 | ) | (28 | ) | (1,083,344 | ) | 7,812 | 150,463 | 274,202 | 705,103 | 54,208 | ||||||||||||||||||||||||
Accounts payable, accrued expenses and other current and non-current liabilities | — | 29,906 | 47,061 | 1,754 | 42,577 | 126 | 121,424 | — | (35,530 | ) | 44,870 | 2,506 | 34,060 | (177 | ) | 45,729 | ||||||||||||||||||||||||||||
Income tax payable | (1,650 | ) | (112,696 | ) | — | (136,469 | ) | 146,271 | 9,628 | (94,916 | ) | 175 | 12,007 | — | (102,002 | ) | 129,680 | (33,128 | ) | 6,732 | ||||||||||||||||||||||||
| | | | | | | | | | | | | | | | | | | | | | | | | | | | | | | | | | | | | | | | | | | | | |
Net cash provided by (used in) operating activities | 2,753 | 83,803 | 131,624 | (1,010,041 | ) | 2,790,979 | (137,726 | ) | 1,861,392 | 4,674 | (229,975 | ) | 92,245 | 1,372 | 2,239,131 | 32,435 | 2,139,882 | |||||||||||||||||||||||||||
| | | | | | | | | | | | | | | | | | | | | | | | | | | | | | | | | | | | | | | | | | | | | |
Investing Activities: | ||||||||||||||||||||||||||||||||||||||||||||
Purchases of property, plant and equipment | — | (835 | ) | (111,994 | ) | — | (863,362 | ) | 44,564 | (931,627 | ) | — | (383 | ) | (68,659 | ) | — | (994,311 | ) | 33,361 | (1,029,992 | ) | ||||||||||||||||||||||
Proceeds from sale of property, plant and equipment | — | — | 454 | — | 11,219 | — | 11,673 | — | 86 | 546 | — | 17,030 | — | 17,662 | ||||||||||||||||||||||||||||||
Disbursement of loans to related parties | — | (163,172 | ) | — | 249,485 | — | (86,313 | ) | — | — | 104,036 | — | 365,016 | — | (469,052 | ) | — | |||||||||||||||||||||||||||
Acquisitions and investments, net of cash acquired, and purchases of intangible assets | — | (273,204 | ) | (15,168 | ) | (1,800 | ) | (1,773,964 | ) | 285,078 | (1,779,058 | ) | — | (148,005 | ) | (885 | ) | (200 | ) | (576,467 | ) | 147,976 | (577,581 | ) | ||||||||||||||||||||
Proceeds from divestitures | — | — | — | — | 8,257 | — | 8,257 | — | 80,115 | — | — | 192,267 | (61,798 | ) | 210,584 | |||||||||||||||||||||||||||||
| | | | | | | | | | | | | | | | | | | | | | | | | | | | | | | | | | | | | | | | | | | | | |
Net cash provided by (used in) investing activities | — | (437,211 | ) | (126,708 | ) | 247,685 | (2,617,850 | ) | 243,329 | (2,690,755 | ) | — | 35,849 | (68,998 | ) | 364,816 | (1,361,481 | ) | (349,513 | ) | (1,379,327 | ) | ||||||||||||||||||||||
| | | | | | | | | | | | | | | | | | | | | | | | | | | | | | | | | | | | | | | | | | | | | |
Financing Activities: | ||||||||||||||||||||||||||||||||||||||||||||
Short-term borrowings, net | — | 1,803 | (2,982 | ) | — | (28,172 | ) | — | (29,351 | ) | ||||||||||||||||||||||||||||||||||
Short-term debt, net | — | 486,259 | (27,900 | ) | — | 380,832 | (343,094 | ) | 496,097 | |||||||||||||||||||||||||||||||||||
Long-term debt and capital lease obligations, net | (2,752 | ) | 540,825 | — | 762,356 | (124,109 | ) | 86,313 | 1,262,633 | (4,676 | ) | (26,566 | ) | 552 | 241,012 | (1,409,956 | ) | 469,052 | (730,582 | ) | ||||||||||||||||||||||||
Increase (decrease) of accounts receivable securitization program | — | — | — | — | (9,500 | ) | — | (9,500 | ) | — | — | — | — | 124,000 | — | 124,000 | ||||||||||||||||||||||||||||
Proceeds from exercise of stock options | — | 98,523 | — | — | 8,524 | — | 107,047 | — | 44,018 | — | — | 5,047 | — | 49,065 | ||||||||||||||||||||||||||||||
Dividends paid | — | (317,903 | ) | — | — | (20,387 | ) | 20,387 | (317,903 | ) | — | (277,176 | ) | — | — | (20,786 | ) | 20,786 | (277,176 | ) | ||||||||||||||||||||||||
Capital increase (decrease) | — | — | — | — | 218,371 | (218,371 | ) | — | — | — | — | (607,200 | ) | 741,307 | (134,107 | ) | — | |||||||||||||||||||||||||||
Distributions to noncontrolling interest | — | — | — | — | (250,271 | ) | — | (250,271 | ) | — | — | — | — | (325,762 | ) | — | (325,762 | ) | ||||||||||||||||||||||||||
Contributions from noncontrolling interest | — | — | — | — | 42,356 | — | 42,356 | — | — | — | — | 79,597 | — | 79,597 | ||||||||||||||||||||||||||||||
| | | | | | | | | | | | | | | | | | | | | | | | | | | | | | | | | | | | | | | | | | | | | |
Net cash provided by (used in) financing activities | (2,752 | ) | 323,248 | (2,982 | ) | 762,356 | (163,188 | ) | (111,671 | ) | 805,011 | (4,676 | ) | 226,535 | (27,348 | ) | (366,188 | ) | (425,721 | ) | 12,637 | (584,761 | ) | |||||||||||||||||||||
| | | | | | | | | | | | | | | | | | | | | | | | | | | | | | | | | | | | | | | | | | | | | |
Effect of exchange rate changes on cash and cash equivalents | — | 30,264 | (702 | ) | — | (54,132 | ) | — | (24,570 | ) | — | 5,350 | 34 | — | 16,555 | — | 21,939 | |||||||||||||||||||||||||||
| | | | | | | | | | | | | | | | | | | | | | | | | | | | | | | | | | | | | | | | | | | | | |
Cash and Cash Equivalents: | ||||||||||||||||||||||||||||||||||||||||||||
Net increase (decrease) in cash and cash equivalents | 1 | 104 | 1,232 | — | (44,191 | ) | (6,068 | ) | (48,922 | ) | (2 | ) | 37,759 | (4,067 | ) | — | 468,484 | (304,441 | ) | 197,733 | ||||||||||||||||||||||||
Cash and cash equivalents at beginning of period | 0 | 13 | 4,490 | — | 672,206 | 6,068 | 682,777 | 2 | 448 | 5,055 | — | 544,443 | (448 | ) | 549,500 | |||||||||||||||||||||||||||||
| | | | | | | | | | | | | | | | | | | | | | | | | | | | | | | | | | | | | | | | | | | | | |
Cash and cash equivalents at end of period | $ | 1 | $ | 117 | $ | 5,722 | $ | — | $ | 628,015 | $ | — | $ | 633,855 | $ | 0 | $ | 38,207 | $ | 988 | $ | — | $ | 1,012,927 | $ | (304,889 | ) | $ | 747,233 | |||||||||||||||
| | | | | | | | | | | | | | | | | | | | | | | | | | | | | | | | | | | | | | | | | | | | | | |
| | | | | | | | | | | | | | | | | | | | | | | | | | | | | | | | | | | | | | | | | | | | | |
FRESENIUS MEDICAL CARE AG & Co. KGaA
NOTES TO CONSOLIDATED FINANCIAL STATEMENTS — (Continued)
(in thousands, except share and per share data)
| | For the year ended December 31, 2013 | For the year ended December 31, 2015 | ||||||||||||||||||||||||||||||||||||||||||
|---|---|---|---|---|---|---|---|---|---|---|---|---|---|---|---|---|---|---|---|---|---|---|---|---|---|---|---|---|---|---|---|---|---|---|---|---|---|---|---|---|---|---|---|---|
| | Issuer | Guarantors | | | | Issuer | Guarantors | | | | ||||||||||||||||||||||||||||||||||
| | FMC US Finance | FMC-AG & Co. KGaA | D-GmbH | FMCH | Non-Guarantor Subsidiaries | Combining Adjustment | Combined Total | FMC US Finance | FMC - AG & Co. KGaA | D-GmbH | FMCH | Non-Guarantor Subsidiaries | Combining Adjustment | Combined Total | ||||||||||||||||||||||||||||||
Operating Activities: | ||||||||||||||||||||||||||||||||||||||||||||
Net income (loss) | $ | 4,377 | $ | 1,109,890 | $ | (3,251 | ) | $ | 739,402 | $ | 1,206,287 | $ | (1,801,082 | ) | $ | 1,255,623 | $ | 4,409 | $ | 1,029,445 | $ | 21,557 | $ | 591,247 | $ | 1,484,548 | $ | (1,818,057 | ) | $ | 1,313,149 | |||||||||||||
Adjustments to reconcile net income to net cash provided by (used in) operating activities: | ||||||||||||||||||||||||||||||||||||||||||||
Equity affiliate income | — | (924,138 | ) | — | (816,954 | ) | — | 1,741,092 | — | — | (1,026,063 | ) | — | (844,301 | ) | — | 1,870,364 | — | ||||||||||||||||||||||||||
Depreciation and amortization | — | 689 | 52,029 | — | 629,071 | (33,564 | ) | 648,225 | — | 611 | 52,242 | — | 698,483 | (34,014 | ) | 717,322 | ||||||||||||||||||||||||||||
Change in deferred taxes, net | — | (34,548 | ) | 3,149 | — | 46,888 | 424 | 15,913 | — | (28,642 | ) | (1,997 | ) | — | (2,415 | ) | (12,398 | ) | (45,452 | ) | ||||||||||||||||||||||||
(Gain) loss on sale of fixed assets and investments | — | (43 | ) | 437 | — | (33,378 | ) | — | (32,984 | ) | — | (65,480 | ) | 880 | — | (3,157 | ) | 65,439 | (2,318 | ) | ||||||||||||||||||||||||
(Gain) loss on investments | — | — | (61 | ) | — | — | 61 | — | — | 49,283 | — | — | — | (49,283 | ) | — | ||||||||||||||||||||||||||||
(Write Up) write-off loans from related parties | — | 91,593 | — | — | — | (91,593 | ) | — | — | (6,306 | ) | 50,344 | — | — | (44,038 | ) | — | |||||||||||||||||||||||||||
Compensation expense related to stock options | — | 13,593 | — | — | — | — | 13,593 | — | 6,583 | — | — | 5,740 | — | 12,323 | ||||||||||||||||||||||||||||||
Cash inflow (outflow) from hedging | — | (4,073 | ) | — | — | — | — | (4,073 | ) | |||||||||||||||||||||||||||||||||||
Investments in equity method investees, net | — | 22,945 | — | — | (20,610 | ) | — | 2,335 | — | 5,535 | — | — | (23,311 | ) | — | (17,776 | ) | |||||||||||||||||||||||||||
Changes in assets and liabilities, net of amounts from businesses acquired: | ||||||||||||||||||||||||||||||||||||||||||||
Trade accounts receivable, net | — | — | 14,851 | — | (54,149 | ) | (1,982 | ) | (41,280 | ) | — | — | 1,307 | — | (332,939 | ) | 672 | (330,960 | ) | |||||||||||||||||||||||||
Inventories | — | — | (4,162 | ) | — | (70,848 | ) | 20,092 | (54,918 | ) | — | — | (26,250 | ) | — | (283,906 | ) | 9,147 | (301,009 | ) | ||||||||||||||||||||||||
Prepaid expenses and other current and non-current assets | — | 46,352 | (11,519 | ) | (44,179 | ) | 72,114 | 5,107 | 67,875 | — | 5,090 | (33,404 | ) | 193,867 | (117,604 | ) | 48 | 47,997 | ||||||||||||||||||||||||||
Accounts receivable from / payable to related parties | (8 | ) | (334,000 | ) | 644,752 | 128,185 | (559,991 | ) | 106,351 | (14,711 | ) | (12 | ) | 593,823 | (90,143 | ) | 185,216 | (621,180 | ) | (40,796 | ) | 26,908 | ||||||||||||||||||||||
Accounts payable, accrued expenses and other current and non-current liabilities | — | 11,469 | 21,203 | 6,246 | 181,426 | (5,080 | ) | 215,264 | — | 18,756 | 20,310 | 4,370 | 505,793 | (274 | ) | 548,955 | ||||||||||||||||||||||||||||
Income tax payable | 174 | 7,917 | — | (50,528 | ) | 7,661 | (1,281 | ) | (36,057 | ) | 164 | 10,853 | — | (164,871 | ) | 128,319 | 16,443 | (9,092 | ) | |||||||||||||||||||||||||
| | | | | | | | | | | | | | | | | | | | | | | | | | | | | | | | | | | | | | | | | | | | | |
Net cash provided by (used in) operating activities | 4,543 | 7,646 | 717,428 | (37,828 | ) | 1,404,471 | (61,455 | ) | 2,034,805 | 4,561 | 593,488 | (5,154 | ) | (34,472 | ) | 1,438,371 | (36,747 | ) | 1,960,047 | |||||||||||||||||||||||||
| | | | | | | | | | | | | | | | | | | | | | | | | | | | | | | | | | | | | | | | | | | | | |
Investing Activities: | ||||||||||||||||||||||||||||||||||||||||||||
Purchases of property, plant and equipment | — | (320 | ) | (76,096 | ) | — | (712,213 | ) | 40,691 | (747,938 | ) | — | (341 | ) | (80,824 | ) | — | (904,256 | ) | 32,478 | (952,943 | ) | ||||||||||||||||||||||
Proceeds from sale of property, plant and equipment | — | 48 | 583 | — | 19,216 | — | 19,847 | — | 57 | (555 | ) | — | 17,906 | — | 17,408 | |||||||||||||||||||||||||||||
Disbursement of loans to related parties | — | 911,133 | — | 141,347 | — | (1,052,480 | ) | — | — | (301,245 | ) | — | 312,278 | — | (11,033 | ) | — | |||||||||||||||||||||||||||
Acquisitions and investments, net of cash acquired, and purchases of intangible assets | — | (103,308 | ) | (24,503 | ) | (1,000 | ) | (492,683 | ) | 125,769 | (495,725 | ) | — | (90,112 | ) | (891 | ) | — | (270,693 | ) | 44,886 | (316,810 | ) | |||||||||||||||||||||
Proceeds from divestitures | — | — | — | — | 18,276 | — | 18,276 | — | 20,562 | — | — | 251,660 | (20,562 | ) | 251,660 | |||||||||||||||||||||||||||||
| | | | | | | | | | | | | | | | | | | | | | | | | | | | | | | | | | | | | | | | | | | | | |
Net cash provided by (used in) investing activities | — | 807,553 | (100,016 | ) | 140,347 | (1,167,404 | ) | (886,020 | ) | (1,205,540 | ) | — | (371,079 | ) | (82,270 | ) | 312,278 | (905,383 | ) | 45,769 | (1,000,685 | ) | ||||||||||||||||||||||
| | | | | | | | | | | | | | | | | | | | | | | | | | | | | | | | | | | | | | | | | | | | | |
Financing Activities: | ||||||||||||||||||||||||||||||||||||||||||||
Short-term borrowings, net | — | 20 | (613,593 | ) | — | 597,859 | — | (15,714 | ) | |||||||||||||||||||||||||||||||||||
Short-term debt, net | — | 14,534 | 87,346 | — | (113,244 | ) | (448 | ) | (11,812 | ) | ||||||||||||||||||||||||||||||||||
Long-term debt and capital lease obligations, net | (4,544 | ) | (140,374 | ) | — | 1,596,569 | (2,680,352 | ) | 1,052,480 | (176,221 | ) | (4,560 | ) | (50,839 | ) | — | (277,806 | ) | 3,352 | 11,033 | (318,820 | ) | ||||||||||||||||||||||
Increase (decrease) of accounts receivable securitization program | — | — | — | — | 189,250 | — | 189,250 | — | — | — | — | (290,750 | ) | — | (290,750 | ) | ||||||||||||||||||||||||||||
Proceeds from exercise of stock options | — | 102,419 | — | — | 8,881 | — | 111,300 | — | 76,093 | — | — | 18,073 | — | 94,166 | ||||||||||||||||||||||||||||||
Proceeds from conversion of preference shares into ordinary shares | — | 34,784 | — | — | — | — | 34,784 | |||||||||||||||||||||||||||||||||||||
Purchase of treasury stock | — | (505,014 | ) | — | — | — | — | (505,014 | ) | |||||||||||||||||||||||||||||||||||
Dividends paid | — | (296,134 | ) | — | (684,229 | ) | 681,345 | 2,884 | (296,134 | ) | — | (263,244 | ) | — | — | (2,707 | ) | 2,707 | (263,244 | ) | ||||||||||||||||||||||||
Capital increase (decrease) | — | — | — | (1,014,859 | ) | 1,117,683 | (102,824 | ) | — | — | — | — | — | 22,762 | (22,762 | ) | — | |||||||||||||||||||||||||||
Distributions to noncontrolling interest | — | — | — | — | (216,758 | ) | — | (216,758 | ) | — | — | — | — | (284,474 | ) | — | (284,474 | ) | ||||||||||||||||||||||||||
Contributions from noncontrolling interest | — | — | — | — | 66,467 | — | 66,467 | — | — | — | — | 67,395 | — | 67,395 | ||||||||||||||||||||||||||||||
| | | | | | | | | | | | | | | | | | | | | | | | | | | | | | | | | | | | | | | | | | | | | |
Net cash provided by (used in) financing activities | (4,544 | ) | (804,299 | ) | (613,593 | ) | (102,519 | ) | (235,625 | ) | 952,540 | (808,040 | ) | (4,560 | ) | (223,456 | ) | 87,346 | (277,806 | ) | (579,593 | ) | (9,470 | ) | (1,007,539 | ) | ||||||||||||||||||
| | | | | | | | | | | | | | | | | | | | | | | | | | | | | | | | | | | | | | | | | | | | | |
Effect of exchange rate changes on cash and cash equivalents | — | (10,965 | ) | 170 | — | (15,693 | ) | — | (26,488 | ) | — | 1,378 | (589 | ) | — | (36,967 | ) | — | (36,178 | ) | ||||||||||||||||||||||||
| | | | | | | | | | | | | | | | | | | | | | | | | | | | | | | | | | | | | | | | | | | | | |
Cash and Cash Equivalents: | ||||||||||||||||||||||||||||||||||||||||||||
Net increase (decrease) in cash and cash equivalents | (1 | ) | (65 | ) | 3,989 | — | (14,251 | ) | 5,065 | (5,263 | ) | 1 | 331 | (667 | ) | — | (83,572 | ) | (448 | ) | (84,355 | ) | ||||||||||||||||||||||
Cash and cash equivalents at beginning of period | 1 | 78 | 501 | — | 686,457 | 1,003 | 688,040 | 1 | 117 | 5,722 | — | 628,015 | — | 633,855 | ||||||||||||||||||||||||||||||
| | | | | | | | | | | | | | | | | | | | | | | | | | | | | | | | | | | | | | | | | | | | | |
Cash and cash equivalents at end of period | $ | 0 | $ | 13 | $ | 4,490 | $ | — | $ | 672,206 | $ | 6,068 | $ | 682,777 | $ | 2 | $ | 448 | $ | 5,055 | $ | — | $ | 544,443 | $ | (448 | ) | $ | 549,500 | |||||||||||||||
| | | | | | | | | | | | | | | | | | | | | | | | | | | | | | | | | | | | | | | | | | | | | | |
| | | | | | | | | | | | | | | | | | | | | | | | | | | | | | | | | | | | | | | | | | | | | |
FRESENIUS MEDICAL CARE AG & Co. KGaA
NOTES TO CONSOLIDATED FINANCIAL STATEMENTS — (Continued)
(in thousands, except share and per share data)
| | For the year ended December 31, 2012 | For the year ended December 31, 2014 | ||||||||||||||||||||||||||||||||||||||||||
|---|---|---|---|---|---|---|---|---|---|---|---|---|---|---|---|---|---|---|---|---|---|---|---|---|---|---|---|---|---|---|---|---|---|---|---|---|---|---|---|---|---|---|---|---|
| | Issuer | Guarantors | | | | Issuer | Guarantors | | | | ||||||||||||||||||||||||||||||||||
| | FMC US Finance | FMC-AG & Co. KGaA | D-GmbH | FMCH | Non-Guarantor Subsidiaries | Combining Adjustment | Combined Total | FMC US Finance | FMC - AG & Co. KGaA | D-GmbH | FMCH | Non-Guarantor Subsidiaries | Combining Adjustment | Combined Total | ||||||||||||||||||||||||||||||
Operating Activities: | ||||||||||||||||||||||||||||||||||||||||||||
Net income (loss) | $ | 4,357 | $ | 1,186,809 | $ | 31,534 | $ | 863,247 | $ | 1,220,798 | $ | (1,979,768 | ) | $ | 1,326,977 | $ | 4,406 | $ | 1,045,266 | $ | 15,225 | $ | 562,107 | $ | 1,316,739 | $ | (1,683,935 | ) | $ | 1,259,808 | ||||||||||||||
Adjustments to reconcile net income to net cash provided by (used in) operating activities: | ||||||||||||||||||||||||||||||||||||||||||||
Equity affiliate income | — | (1,002,965 | ) | — | (910,777 | ) | (10,403 | ) | 1,924,145 | — | — | 4,211,195 | — | (771,567 | ) | — | (3,439,628 | ) | — | |||||||||||||||||||||||||
Depreciation and amortization | — | 519 | 47,832 | — | 583,375 | (28,830 | ) | 602,896 | — | 632 | 55,433 | — | 676,704 | (33,441 | ) | 699,328 | ||||||||||||||||||||||||||||
Change in deferred taxes, net | — | 1,994 | 4,113 | — | 71,744 | (2,681 | ) | 75,170 | — | (18,444 | ) | (2,212 | ) | — | 145,601 | (11,155 | ) | 113,790 | ||||||||||||||||||||||||||
(Gain) loss on sale of fixed assets and investments | — | (40 | ) | (163 | ) | — | (29,321 | ) | — | (29,524 | ) | — | — | 131 | — | 2,523 | — | 2,654 | ||||||||||||||||||||||||||
(Gain) loss on investments | — | 1,247 | — | — | — | (1,247 | ) | — | — | 13,862 | 986 | — | — | (14,848 | ) | — | ||||||||||||||||||||||||||||
(Write Up) write-off loans from related parties | — | 7,527 | — | — | — | (7,527 | ) | — | — | 67,629 | 7,371 | — | — | (75,000 | ) | — | ||||||||||||||||||||||||||||
Investment (gain) | — | — | — | — | (139,600 | ) | — | (139,600 | ) | |||||||||||||||||||||||||||||||||||
Compensation expense related to stock options | — | 26,476 | — | — | — | — | 26,476 | — | 6,307 | — | — | 2,200 | — | 8,507 | ||||||||||||||||||||||||||||||
Cash inflow (outflow) from hedging | — | 1,322 | — | — | (15,269 | ) | — | (13,947 | ) | |||||||||||||||||||||||||||||||||||
Investments in equity method investees, net | — | 36,453 | — | — | (13,941 | ) | — | 22,512 | — | 42,087 | — | — | (18,964 | ) | — | 23,123 | ||||||||||||||||||||||||||||
Changes in assets and liabilities, net of amounts from businesses acquired: | ||||||||||||||||||||||||||||||||||||||||||||
Trade accounts receivable, net | — | — | (23,848 | ) | — | (19,496 | ) | — | (43,344 | ) | — | — | (33,760 | ) | — | (123,932 | ) | 281 | (157,411 | ) | ||||||||||||||||||||||||
Inventories | — | — | (40,910 | ) | — | (11,532 | ) | 4,163 | (48,279 | ) | — | — | 24,166 | — | (148,719 | ) | 38,795 | (85,758 | ) | |||||||||||||||||||||||||
Prepaid expenses and other current and non-current assets | — | 148,172 | (13,633 | ) | (64,830 | ) | 37,633 | (18,929 | ) | 88,413 | — | 20,961 | 10,742 | 149,106 | (198,834 | ) | (6,154 | ) | (24,179 | ) | ||||||||||||||||||||||||
Accounts receivable from / payable to related parties | (3,724 | ) | 1,653,955 | (49,477 | ) | 117,090 | (1,788,646 | ) | 55,007 | (15,795 | ) | (3 | ) | (5,222,902 | ) | 6,481 | (814,972 | ) | 948,813 | 5,077,605 | (4,978 | ) | ||||||||||||||||||||||
Accounts payable, accrued expenses and other current and non-current liabilities | — | (1,884 | ) | 33,157 | 1,024 | 193,756 | (467 | ) | 225,586 | — | 29,906 | 47,061 | 1,754 | 42,577 | 126 | 121,424 | ||||||||||||||||||||||||||||
Income tax payable | 97 | (137 | ) | — | (30,967 | ) | 13,927 | (21,398 | ) | (38,478 | ) | (1,650 | ) | (112,696 | ) | — | (136,469 | ) | 146,271 | 9,628 | (94,916 | ) | ||||||||||||||||||||||
| | | | | | | | | | | | | | | | | | | | | | | | | | | | | | | | | | | | | | | | | | | | | |
Net cash provided by (used in) operating activities | 730 | 2,059,448 | (11,395 | ) | (25,213 | ) | 93,025 | (77,532 | ) | 2,039,063 | 2,753 | 83,803 | 131,624 | (1,010,041 | ) | 2,790,979 | (137,726 | ) | 1,861,392 | |||||||||||||||||||||||||
| | | | | | | | | | | | | | | | | | | | | | | | | | | | | | | | | | | | | | | | | | | | | |
Investing Activities: | ||||||||||||||||||||||||||||||||||||||||||||
Purchases of property, plant and equipment | — | (485 | ) | (78,272 | ) | — | (638,394 | ) | 41,841 | (675,310 | ) | — | (835 | ) | (111,994 | ) | — | (863,362 | ) | 44,564 | (931,627 | ) | ||||||||||||||||||||||
Proceeds from sale of property, plant and equipment | — | 40 | 407 | — | 9,220 | — | 9,667 | — | — | 454 | — | 11,219 | — | 11,673 | ||||||||||||||||||||||||||||||
Disbursement of loans to related parties | — | (1,551,372 | ) | — | 289,879 | — | 1,261,493 | — | — | (163,172 | ) | — | 249,485 | — | (86,313 | ) | — | |||||||||||||||||||||||||||
Acquisitions and investments, net of cash acquired, and purchases of intangible assets | — | (1,618,662 | ) | (2,021 | ) | — | (1,876,310 | ) | 1,618,085 | (1,878,908 | ) | — | (273,204 | ) | (15,168 | ) | (1,800 | ) | (1,773,964 | ) | 285,078 | (1,779,058 | ) | |||||||||||||||||||||
Proceeds from divestitures | — | 44 | — | — | 263,306 | (44 | ) | 263,306 | — | — | — | — | 8,257 | — | 8,257 | |||||||||||||||||||||||||||||
| | | | | | | | | | | | | | | | | | | | | | | | | | | | | | | | | | | | | | | | | | | | | |
Net cash provided by (used in) investing activities | — | (3,170,435 | ) | (79,886 | ) | 289,879 | (2,242,178 | ) | 2,921,375 | (2,281,245 | ) | — | (437,211 | ) | (126,708 | ) | 247,685 | (2,617,850 | ) | 243,329 | (2,690,755 | ) | ||||||||||||||||||||||
| | | | | | | | | | | | | | | | | | | | | | | | | | | | | | | | | | | | | | | | | | | | | |
Financing Activities: | ||||||||||||||||||||||||||||||||||||||||||||
Short-term borrowings, net | — | (24,338 | ) | 91,628 | — | (80,241 | ) | — | (12,951 | ) | ||||||||||||||||||||||||||||||||||
Short-term debt, net | — | 1,803 | (2,982 | ) | — | (28,172 | ) | — | (29,351 | ) | ||||||||||||||||||||||||||||||||||
Long-term debt and capital lease obligations, net | (730 | ) | 1,308,572 | — | (264,666 | ) | 1,380,034 | (1,261,493 | ) | 1,161,717 | (2,752 | ) | 540,825 | — | 762,356 | (124,109 | ) | 86,313 | 1,262,633 | |||||||||||||||||||||||||
Increase (decrease) of accounts receivable securitization program | — | — | — | — | (372,500 | ) | — | (372,500 | ) | — | — | — | — | (9,500 | ) | — | (9,500 | ) | ||||||||||||||||||||||||||
Proceeds from exercise of stock options | — | 100,178 | — | — | 20,948 | — | 121,126 | — | 98,523 | — | — | 8,524 | — | 107,047 | ||||||||||||||||||||||||||||||
Dividends paid | — | (271,733 | ) | — | — | (241 | ) | 241 | (271,733 | ) | — | (317,903 | ) | — | — | (20,387 | ) | 20,387 | (317,903 | ) | ||||||||||||||||||||||||
Capital increase (decrease) | — | — | — | — | 1,581,588 | (1,581,588 | ) | — | — | — | — | — | 218,371 | (218,371 | ) | — | ||||||||||||||||||||||||||||
Distributions to noncontrolling interest | — | — | — | — | (195,023 | ) | — | (195,023 | ) | — | — | — | — | (250,271 | ) | — | (250,271 | ) | ||||||||||||||||||||||||||
Contributions from noncontrolling interest | — | — | — | — | 37,704 | — | 37,704 | — | — | — | — | 42,356 | — | 42,356 | ||||||||||||||||||||||||||||||
| | | | | | | | | | | | | | | | | | | | | | | | | | | | | | | | | | | | | | | | | | | | | |
Net cash provided by (used in) financing activities | (730 | ) | 1,112,679 | 91,628 | (264,666 | ) | 2,372,269 | (2,842,840 | ) | 468,340 | (2,752 | ) | 323,248 | (2,982 | ) | 762,356 | (163,188 | ) | (111,671 | ) | 805,011 | |||||||||||||||||||||||
| | | | | | | | | | | | | | | | | | | | | | | | | | | | | | | | | | | | | | | | | | | | | |
Effect of exchange rate changes on cash and cash equivalents | — | (1,616 | ) | 10 | — | 6,196 | — | 4,590 | — | 30,264 | (702 | ) | — | (54,132 | ) | — | (24,570 | ) | ||||||||||||||||||||||||||
| | | | | | | | | | | | | | | | | | | | | | | | | | | | | | | | | | | | | | | | | | | | | |
Cash and Cash Equivalents: | ||||||||||||||||||||||||||||||||||||||||||||
Net increase (decrease) in cash and cash equivalents | — | 76 | 357 | — | 229,312 | 1,003 | 230,748 | 1 | 104 | 1,232 | — | (44,191 | ) | (6,068 | ) | (48,922 | ) | |||||||||||||||||||||||||||
Cash and cash equivalents at beginning of period | 1 | 2 | 144 | — | 457,145 | — | 457,292 | 0 | 13 | 4,490 | — | 672,206 | 6,068 | 682,777 | ||||||||||||||||||||||||||||||
| | | | | | | | | | | | | | | | | | | | | | | | | | | | | | | | | | | | | | | | | | | | | |
Cash and cash equivalents at end of period | $ | 1 | $ | 78 | $ | 501 | $ | — | $ | 686,457 | $ | 1,003 | $ | 688,040 | $ | 1 | $ | 117 | $ | 5,722 | $ | — | $ | 628,015 | $ | — | $ | 633,855 | ||||||||||||||||
| | | | | | | | | | | | | | | | | | | | | | | | | | | | | | | | | | | | | | | | | | | | | | |
| | | | | | | | | | | | | | | | | | | | | | | | | | | | | | | | | | | | | | | | | | | | | |
FRESENIUS MEDICAL CARE AG & Co. KGaA
Schedule II – Valuation and Qualifying Accounts
(in thousands, except share data)
Development of allowance for doubtful accounts
| | 2014 | 2013 | 2012 | 2016 | 2015 | 2014 | ||||||||||||||
|---|---|---|---|---|---|---|---|---|---|---|---|---|---|---|---|---|---|---|---|---|
Allowance for doubtful accounts as of January 1 | $ | 413,165 | $ | 328,893 | $ | 299,751 | $ | 465,790 | $ | 418,508 | $ | 413,165 | ||||||||
Change in valuation allowances as recorded in the consolidated statements of income | 325,451 | 336,090 | 303,508 | 477,045 | 440,284 | 325,451 | ||||||||||||||
Write-offs and recoveries of amounts previously written-off | (309,058 | ) | (249,783 | ) | (273,643 | ) | (433,713 | ) | (381,087 | ) | (309,058 | ) | ||||||||
Foreign currency translation | (11,050 | ) | (2,035 | ) | (723 | ) | (560 | ) | (11,915 | ) | (11,050 | ) | ||||||||
| | | | | | | | | | | | | | | | | | | | | |
Allowance for doubtful accounts as of December 31 | $ | 418,508 | $ | 413,165 | $ | 328,893 | $ | 508,562 | $ | 465,790 | $ | 418,508 | ||||||||
| | | | | | | | | | | | | | | | | | | | | | |
| | | | | | | | | | | | | | | | | | | | | |
S-II