| | | | |
| | 1 | | |
Use these links to rapidly review the document
TABLE OF CONTENTSContentsVale S.A. Financial Statements
As filed with the Securities and Exchange Commission on April 10, 201718, 2019
UNITED STATES SECURITIES AND EXCHANGE COMMISSION
Washington, D.C. 20549
Form 20-F
ANNUAL REPORT PURSUANT TO SECTION 13 OR 15(d)
OF THE SECURITIES EXCHANGE ACT OF 1934
For the fiscal year ended: December 31, 20162018
Commission file number: 001-15030
VALE S.A.
(Exact name of Registrant as specified in its charter)
Federative Republic of Brazil
(Jurisdiction of incorporation or organization)
Luciano Siani Pires, Chief Financial Officer
phone: +55 21 3814 8888fax: +55 21 3814 88203485 5000
Avenida das Américas, 700Praia de Botafogo 186 – Bloco 8offices 701 – Loja 3181901 – Botafogo22640-10022250-145 Rio de Janeiro, RJ, Brazil
(Address of principal executive offices)
Securities registered or to be registered pursuant to Section 12(b) of the Act:
| Title of Each Class | | Name of Each Exchange on Which Registered | | |||
|---|---|---|---|---|---|---|
| ||||||
| ||||||
Common shares of Vale, no par value per share | | | New York Stock Exchange* | | | |
American Depositary Shares (evidenced by American Depositary Receipts), each representing one common share of Vale | ||||||
| ||||||
| | | New York Stock Exchange | | | |
5.875% Guaranteed Notes due 2021, issued by Vale Overseas | | | New York Stock Exchange | | | |
4.375% Guaranteed Notes due 2022, issued by Vale Overseas | | | New York Stock Exchange | | | |
6.250% Guaranteed Notes due 2026, issued by Vale Overseas | | | New York Stock Exchange | | | |
8.250% Guaranteed Notes due 2034, issued by Vale Overseas | | | New York Stock Exchange | | | |
6.875% Guaranteed Notes due 2036, issued by Vale Overseas | | | New York Stock Exchange | | | |
6.875% Guaranteed Notes due 2039, issued by Vale Overseas | | | New York Stock Exchange | | | |
5.625% Notes due 2042, issued by Vale S.A. | | | New York Stock Exchange | | | |
| Securities registered or to be registered pursuant to Section 12(g) of the Act:None Securities for which there is a reporting obligation pursuant to Section 15(d) of the Act:None The number of outstanding shares of each class of stock of Vale as of December 31, 12 golden shares, no par value per share |
Indicate by check mark if the registrant is a well-known seasoned issuer, as defined in Rule 405 of the Securities Act. |
| Yes |
| If this report is an annual or transition report, indicate by check mark if the registrant is not required to file reports pursuant to Section 13 or 15(d) of the Securities Exchange Act of 1934. |
| Yes o No |
| Indicate by check mark whether the registrant (1) has filed all reports required to be filed by Section 13 or 15(d) of the Securities Exchange Act of 1934 during the preceding 12 months (or for such shorter period that the registrant was required to file such reports) and (2) has been subject to such filing requirements for the past 90 days. |
| Yes |
| Indicate by check mark whether the registrant has submitted electronically |
| Yes |
| Indicate by check mark whether the registrant is a large accelerated filer, an accelerated filer, |
| Large accelerated filer |
| Indicate by check mark which basis of accounting the registrant has used to prepare the financial statements included in this filing: |
| U.S. GAAP o International Financial Reporting Standards as issued by the International Accounting Standards Board |
| If "Other" has been checked in response to the previous question, indicate by check mark which financial statement item the registrant has elected to follow. |
| Item 17 o Item 18o |
| If this is an annual report, indicate by check mark whether the registrant is a shell company (as defined in Rule 12b-2 of the Exchange Act). |
| Yes o No |
Page
| Form 20-F | | ii |
I. Overview | | 1 |
Business overview | | |
Selected financial data | | |
Forward-looking statements | | |
| | 19 |
II. Information on the company | ||
| | 37 | |
Lines of business | | |
1. Ferrous minerals | | |
2. Base metals | | |
3. Coal | | |
4. Infrastructure | | |
5. Other investments | | |
Reserves | | |
Capital expenditures | | |
Regulatory matters | | |
| ||
| | 88 | |
Overview | | |
Results of operations | | 96 |
Liquidity and capital resources | | |
Contractual obligations | | |
Off-balance sheet arrangements | | |
Critical accounting policies and estimates | | |
Risk management | ||
| | 119 | |
IV. Share | | 123 |
Major shareholders | | |
Related party transactions | | 126 |
Distributions | | 128 |
Trading markets | | 129 |
Depositary shares | | 130 |
Purchases of equity securities by the issuer and affiliated purchasers | | |
| ||
| | 133 | |
Management | | 133 |
Management compensation | | |
| ||
| | ||
VI. Additional information | | 151 |
Legal Proceedings | | 151 |
Memorandum and articles of association | | |
Shareholder debentures | | |
Exchange controls and other limitations affecting security holders | | |
Taxation | | |
Evaluation of disclosure controls and procedures | | |
Management's report on internal control over financial reporting | | |
Corporate governance | | |
Code of | | |
Principal accountant fees and services | | |
Change in registrant's certifying accountant | | 188 |
Information filed with securities regulators | | |
Exhibits | | |
Glossary | | |
Signatures | | |
i
FORM 20-F CROSS REFERENCECROSS-REFERENCE GUIDE
| Item | | Form 20-F caption | | Location in this report | | Page | | Form 20-F caption | | Location in this report | | Page |
|---|---|---|---|---|---|---|---|---|---|---|---|---|
| | | | | | | | | | | | | |
1 | | Identity of directors, senior management and advisers | | Not applicable | | – | | Identity of directors, senior management and advisers | | Not applicable | | – |
| | | | | | | | | | | | | |
2 | | Offer statistics and expected timetable | | Not applicable | | – | | Offer statistics and expected timetable | | Not applicable | | – |
| | | | | | | | | | | | | |
3 | | Key information | | | | Key information | | | ||||
| | 3A Selected financial data | | Selected financial data | | 15 | | 3A Selected financial data | | Selected financial data | | 16 | |
| | 3B Capitalization and indebtedness | | Not applicable | | – | | 3B Capitalization and indebtedness | | Not applicable | | – | |
| | 3C Reasons for the offer and use of proceeds | | Not applicable | | – | | 3C Reasons for the offer and use of proceeds | | Not applicable | | – | |
| | 3D Risk factors | | Risk factors | | 1 | | 3D Risk factors | | Risk factors | | 19 | |
| | | | | | | | | | | | | |
4 | | Information on the Company | | | | Information on the Company | | | ||||
| | 4A History and development of the company | | Business overview, Capital expenditures | | 17, 71 | | 4A History and development of the company | | Business overview, Capital expenditures; Information filed with securities regulators, | | 1, 81, 189 | |
| | 4B Business overview | | Business overview, Lines of business, Reserves, Regulatory matters | | 17, 27, 62, 73 | | 4B Business overview | | Business overview, Lines of business, Reserves, Regulatory matters | | 1, 37, 72, 83 | |
| | 4C Organizational structure | | Exhibit 8 | | – | | 4C Organizational structure | | Exhibit 8 | | – | |
| | 4D Property, plant and equipment | | Lines of business, Capital expenditures, Regulatory matters | | 27, 71, 73 | | 4D Property, plant and equipment | | Lines of business, Capital expenditures, Regulatory matters | | 37, 81, 83 | |
| | | | | | | | | | | | | |
4A | | Unresolved staff comments | | None | | – | | Unresolved staff comments | | None | | – |
| | | | | | | | | | | | | |
5 | | Operating and financial review and prospects | | | | Operating and financial review and prospects | | | ||||
| | 5A Operating results | | Results of operations | | 87 | | 5A Operating results | | Results of operations | | 96 | |
| | 5B Liquidity and capital resources | | Liquidity and capital resources | | 100 | | 5B Liquidity and capital resources | | Liquidity and capital resources | | 110 | |
| | 5C Research and development, patents and licenses, etc. | | Capital expenditures | | 71 | | 5C Research and development, patents and licenses, etc. | | Capital expenditures | | 81 | |
| | 5D Trend information | | Results of operations | | 87 | | 5D Trend information | | Results of operations | | 96 | |
| | 5E Off-balance sheet arrangements | | Off-balance sheet arrangements | | 103 | | 5E Off-balance sheet arrangements | | Off-balance sheet arrangements | | 114 | |
| | | Critical accounting policies and estimates | | 103 | | | Critical accounting policies and estimates | | 115 | |||
| | 5F Tabular disclosure of contractual obligations | | Contractual obligations | | 103 | | 5F Tabular disclosure of contractual obligations | | Contractual obligations | | 113 | |
| | 5G Safe harbor | | Forward-looking statements | | iv | | 5G Safe harbor | | Forward-looking statements | | 18 | |
| | | | | | | | | | | | | |
6 | | Directors, senior management and employees | | | – | | Directors, senior management and employees | | | – | ||
| | 6A Directors and senior management | | Management | | 122 | | 6A Directors and senior management | | Management | | 133 | |
| | 6B Compensation | | Management compensation | | 133 | | 6B Compensation | | Management compensation | | 146 | |
| | 6C Board practices | | Management—Board of directors | | 122 | | 6C Board practices | | Management—Board of directors | | 133 | |
| | 6D Employees | | Employees | | 135 | | 6D Employees | | Employees | | 149 | |
| | 6E Share ownership | | Major shareholders, | | | 6E Share ownership | | Major shareholders, Employees—Performance-based compensation | | 123, 150 | ||
| | | Major shareholders, Employees—Performance-based compensation | | 109, 136 | ||||||||
| | | | | | | | | | | | | |
7 | | Major shareholders and related party transactions | | | | Major shareholders and related party transactions | | | ||||
| | 7A Major shareholders | | Major shareholders | | 109 | | 7A Major shareholders | | Major shareholders | | 123 | |
| | 7B Related party transactions | | Related party transactions | | 116 | | 7B Related party transactions | | Related party transactions | | 126 | |
| | 7C Interests of experts and counsel | | Not applicable | | – | | 7C Interests of experts and counsel | | Not applicable | | – | |
| | | | | | | | | | | | | |
8 | | Financial information | | | | Financial information | | | ||||
| | 8A Consolidated statements and other financial information | | Financial statements | | F-1 | | 8A Consolidated statements and other financial information | | Financial statements | | F-1 | |
| | | Distributions | | 118 | | | Distributions | | 130 | |||
| | | Legal proceedings | | 136 | | | Legal proceedings | | 151 | |||
| | 8B Significant changes | | Not applicable | | – | | 8B Significant changes | | Not applicable | | – | |
| | | | | | | | | | | | | |
9 | | The offer and listing | | | | The offer and listing | | | ||||
| | 9A Offer and listing details | | Share price history | | 120 | | 9A Offer and listing details | | Not applicable | | – | |
| | 9B Plan of distribution | | Not applicable | | – | | 9B Plan of distribution | | Not applicable | | – | |
| | 9C Markets | | Trading markets | | 119 | | 9C Markets | | Trading markets | | 129 | |
| | 9D Selling shareholders | | Not applicable | | – | | 9D Selling shareholders | | Not applicable | | – | |
| | 9E Dilution | | Not applicable | | – | | 9E Dilution | | Not applicable | | – | |
| | 9F Expenses of the issue | | Not applicable | | – | | 9F Expenses of the issue | | Not applicable | | – | |
| | | | | | | | | | | | | |
ii
Form 20-F cross-reference guide
| Item | | Form 20-F caption | | Location in this report | | Page | | Form 20-F caption | | Location in this report | | Page |
|---|---|---|---|---|---|---|---|---|---|---|---|---|
| | | | | | | | | | | | | |
10 | | Additional information | | | | Additional information | | | ||||
| | 10A Share capital | | Memorandum and articles of association—Common shares and preferred shares | | 144 | | 10A Share capital | | Memorandum and articles of association—Common shares and golden shares | | 163 | |
| | 10B Memorandum and articles of association | | Memorandum and articles of association | | 144 | | 10B Memorandum and articles of association | | Memorandum and articles of association | | 163 | |
| | 10C Material contracts | | Lines of business, Results of operations, Related party transactions | | 27, 87, 116 | | 10C Material contracts | | Lines of business, Results of operations, Related party transactions | | 37, 96, 126 | |
| | 10D Exchange controls | | Exchange controls and other limitations affecting security holders | | 152 | | 10D Exchange controls | | Exchange controls and other limitations affecting security holders | | 171 | |
| | 10E Taxation | | Taxation | | 154 | | 10E Taxation | | Taxation | | 173 | |
| | 10F Dividends and paying agents | | Not applicable | | – | | 10F Dividends and paying agents | | Not applicable | | – | |
| | 10G Statement by experts | | Reserves | | 62 | | 10G Statement by experts | | Reserves | | 72 | |
| | 10H Documents on display | | Information filed with securities regulators | | 166 | | 10H Documents on display | | Information filed with securities regulators | | 189 | |
| | 10I Subsidiary information | | Not applicable | | – | | 10I Subsidiary information | | Not applicable | | – | |
| | | | | | | | | | | | | |
11 | | Quantitative and qualitative disclosures about market risk | | Risk management | | 107 | | Quantitative and qualitative disclosures about market risk | | Risk management | | 119 |
| | | | | | | | | | | | | |
12 | | Description of securities other than equity securities | | | | Description of securities other than equity securities | | | ||||
| | 12A Debt securities | | Not applicable | | – | | 12A Debt securities | | Not applicable | | – | |
| | 12B Warrants and rights | | Not applicable | | – | | 12B Warrants and rights | | Not applicable | | – | |
| | 12C Other securities | | Not applicable | | – | | 12C Other securities | | Not applicable | | – | |
| | 12D American Depositary Shares | | Depositary shares | | 120 | | 12D American Depositary Shares | | Depositary shares | | 130 | |
| | | | | | | | | | | | | |
13 | | Defaults, dividend arrearages and delinquencies | | Not applicable | | – | | Defaults, dividend arrearages and delinquencies | | Not applicable | | – |
| | | | | | | | | | | | | |
14 | | Material modifications to the rights of security holders and use of proceeds | | Not applicable | | – | | Material modifications to the rights of security holders and use of proceeds | | Not applicable | | – |
| | | | | | | | | | | | | |
15 | | Controls and procedures | | Evaluation of disclosure controls and procedures | | 161 | | Controls and procedures | | Evaluation of disclosure controls and procedures | | 181 |
| | | Management's report on internal control over financial reporting | | 161 | | | Management's report on internal control over financial reporting | | 181 | |||
| | | | | | | | | | | | | |
16A | | Audit Committee financial expert | | Management—Fiscal Council | | 130 | | Audit Committee financial expert | | Management—Fiscal Council | | 142 |
| | | | | | | | | | | | | |
16B | | Code of ethics | | Code of ethics and conduct | | 164 | | Code of ethics | | Code of ethical conduct | | 186 |
| | | | | | | | | | | | | |
16C | | Principal accountant fees and services | | Principal accountant fees and services | | 165 | | Principal accountant fees and services | | Principal accountant fees and services | | 187 |
| | | | | | | | | | | | | |
16D | | Exemptions from the listing standards for audit committees | | Management—Fiscal Council; Corporate governance | | 130, 162 | | Exemptions from the listing standards for audit committees | | Management—Fiscal Council; Corporate governance | | 142, 182 |
| | | | | | | | | | | | | |
16E | | Purchase of equity securities by the issuer and affiliated purchasers | | Purchases of equity securities by the issuer and affiliated purchasers | | 121 | | Purchase of equity securities by the issuer and affiliated purchasers | | Purchases of equity securities by the issuer and affiliated purchasers | | 132 |
| | | | | | | | | | | | | |
16F | | Change in registrant's certifying accountant | | Not applicable | | – | | Change in registrant's certifying accountant | | Change in registrant's certifying accountant | | 188 |
| | | | | | | | | | | | | |
16G | | Corporate governance | | Corporate governance | | 162 | | Corporate governance | | Corporate governance | | 182 |
| | | | | | | | | | | | | |
16H | | Mine safety disclosure | | Not applicable | | – | | Mine safety disclosure | | Not applicable | | – |
| | | | | | | | | | | | | |
17 | | Financial statements | | Not applicable | | – | | Financial statements | | Not applicable | | – |
| | | | | | | | | | | | | |
18 | | Financial statements | | Financial statements | | F-1 | | Financial statements | | Financial statements | | F-1 |
| | | | | | | | | | | | | |
19 | | Exhibits | | Exhibits | | 167 | | Exhibits | | Exhibits | | 190 |
| | | | | | | | | | | | | |
iii
This annual report contains statements that may constitute forward-looking statements within the meaning of the safe harbor provisions of the U.S. Private Securities Litigation Reform Act of 1995. Many of those forward-looking statements can be identified by the use of forward-looking words such as "anticipate," "believe," "could," "expect," "should," "plan," "intend," "estimate" and "potential," among others. Those statements appear in a number of places and include statements regarding our intent, belief or current expectations with respect to:
We caution you that forward-looking statements are not guarantees of future performance and involve risks and uncertainties. Actual results may differ materially from those in forward-looking statements as a result of various factors. These risks and uncertainties include factors relating to (a) economic, political and social issues in the countries in which we operate, (b) the global economy, (c) commodity prices, (d) financial and capital markets, (e) the mining and metals businesses, which are cyclical in nature, and their dependence upon global industrial production, which is also cyclical, (f) regulation and taxation, (g) operational incidents or accidents, and (h) the high degree of global competition in the markets in which we operate. For additional information on factors that could cause our actual results to differ from expectations reflected in forward-looking statements, seeRisk factors. Forward-looking statements speak only as of the date they are made, and we do not undertake any obligation to update them in light of new information or future developments. All forward-looking statements attributed to us or a person acting on our behalf are expressly qualified in their entirety by this cautionary statement, and you should not place undue reliance on any forward-looking statement.
Vale S.A. is a stock corporation, or sociedade por ações, that was organized on January 11, 1943 under the laws of the Federative Republic of Brazil for an unlimited period of time. Its head office is located at Avenida das Américas, 700 - bloco 8 - loja 318 - Barra da Tijuca, Rio de Janeiro, RJ, Brazil, and its telephone number is 55-21-3485-5000.
In this report, references to "Vale" are to Vale S.A. References to "we," "us" or the "Company" are to Vale and, except where the context otherwise requires, its consolidated subsidiaries. References to our "preferred shares" are to our preferred class A shares. References to our "ADSs" or "American Depositary Shares" include both our common American Depositary Shares (our "common ADSs"), each of which represents one common share of Vale, and our preferred class A American Depositary Shares (our "preferred ADSs"), each of which represents one class A preferred share of Vale. American Depositary Shares are represented by American Depositary Receipts ("ADRs") issued by the depositary.
Unless otherwise specified, we use metric units.
References to "real," "reais" or "R$" are to the official currency of Brazil, the real (singular) or reais (plural). References to "U.S. dollars" or "US$" are to United States dollars. References to "A$" are to Australian dollars. References to "€" are to Euros.
iv
Table of ContentsI. OVERVIEW
External risks
Our business is exposed to the cyclicality of global economic activity and requires significant investments of capital.
As a mining company, we are a supplier of industrial raw materials. Industrial production tends to be the most cyclical and volatile component of global economic activity, which affects demand for minerals and metals. At the same time, investment in mining requires a substantial amount of funds in order to replenish reserves, expand and maintain production capacity, build infrastructure, preserve the environment and minimize social impacts. Sensitivity to industrial production, together with the need for significant long-term capital investments, are important sources of risk for our financial performance and growth prospects.
Adverse economic developments in China could have a negative impact on our revenues, cash flow and profitability.
China has been the main driver of global demand for minerals and metals over the last few years. In 2016, Chinese demand represented 72% of global demand for seaborne iron ore, 52% of global demand for nickel and 48% of global demand for copper. The percentage of our net operating revenues attributable to sales to customers in China was 46.4% in 2016. Therefore, any contraction of China's economic growth could result in lower demand for our products, leading to lower revenues, cash flow and profitability. Poor performance in the Chinese real estate sector, the largest consumer of carbon steel in China, would also negatively impact our results.
Our business may be adversely affected by declines in demand for and prices of the products our customers produce.
Demand for our iron ore, coal and nickel products depends on global demand for steel. Iron ore and iron ore pellets, which together accounted for 71.5% of our 2016 net operating revenues, are used to produce carbon steel. Nickel, which accounted for 11.1% of our 2016 net operating revenues, is used mainly to produce stainless and alloy steels. Demand for steel depends heavily on global economic conditions, but it also depends on a variety of regional and sectorial factors. The prices of different steels and the performance of the global steel industry are highly cyclical and volatile, and these business cycles in the steel industry affect demand and prices for our products. In addition, vertical backward integration of the steel and stainless steel industries and the use of scrap could reduce the global seaborne trade of iron ore and primary nickel. The demand for copper is affected by the demand for copper wire, and a sustained decline in the construction industry could have a negative impact on our copper business.
The prices we charge, including prices for iron ore, nickel, copper and coal, are subject to volatility.
Global prices for metals are subject to significant fluctuations and are affected by many factors, including actual and expected global macroeconomic and political conditions, levels of supply and demand, the availability and cost of substitutes, inventory levels, technological developments, regulatory and international trade matters, investments by commodity funds and others and actions of participants in the commodity markets. Sustained low market prices for the products we sell may result in the suspension of certain of our projects and operations, decrease in our mineral reserves, impairment of assets, and may adversely affect our cash flows, financial position and results of operations.
We are mostly affected by movements in iron ore prices. For example, a price reduction of US$1 per dry metric ton unit ("dmt") in the average iron ore price would have reduced our operating income for the year ended December 31, 2016 by approximately US$325 million. Average iron ore prices significantly changed in the last four years, from US$135 per dmt in 2013 to US$97 per dmt in 2014, US$55.5 per dmt in 2015 and US$58.5 per dmt in 2016, according to the average Platts IODEX (62% Fe CFR China). On February 28, 2017 the year to date average Platts IODEX iron ore price was US$84.8 per dmt. In addition to reduced demand for iron ore, an excess in supply has adversely affected our prices since 2014 and supply may grow with the expected conclusion of certain iron ore projects in coming years.
World nickel prices were adversely affected by lower demand in the first half of 2016, but benefited from increased demand, especially from the Chinese stainless steel sector, in the second half of 2016. Nickel refining in China, primarily using imported nickel ores and related raw materials, increased significantly between 2006 and 2015, with Chinese nickel pig iron production representing 19% of global nickel output. Since 2014, Chinese nickel pig iron production has been adversely affected by export restrictions in feed-producing countries, but the revocation or relaxation of export restrictions in feed producing countries, such as Indonesia, may benefit the production of nickel pig iron in China, which may in turn adversely affect global nickel prices. In January 2017, the Indonesian government issued a ministerial decree allowing for the controlled recommencement of nickel ore exports from Indonesia. For additional information about the average realized prices for the products we sell, seeOperating and financial review and prospects—Overview—Major factors affecting prices.
We may not be able to adjust production volume in a timely or cost-efficient manner in response to changes in demand.
Lower utilization of capacity during periods of weak demand may expose us to higher unit production costs since a significant portion of our cost structure is fixed in the short-term due to the high capital intensity of mining operations. In addition, efforts to reduce costs during periods of weak demand could be limited by labor regulations or previous labor or government agreements.
Conversely, during periods of high demand, our ability to rapidly increase production capacity is limited, which could prevent us from meeting demand for our products. Moreover, we may be unable to complete expansions and greenfield projects in time to take advantage of rising demand for iron ore, nickel or other products. When demand exceeds our production capacity, we may meet excess customer demand by purchasing iron ore, iron ore pellets or nickel from joint ventures or unrelated parties and reselling it, which would increase our costs and narrow our operating margins. If we are unable to satisfy excess customer demand in this way, we may lose customers. In addition, operating close to full capacity may expose us to higher costs, including demurrage fees due to capacity restraints in our logistics systems.
Changes in exchange rates for the currencies in which we conduct operations could adversely affect our financial condition and results of operations.
A substantial portion of our revenues and our debt is denominated in U.S. dollars, and given that our functional currency is the Brazilianreal, changes in exchange rates may result in (i) losses or gains on our net U.S. dollar-denominated indebtedness and accounts receivable and (ii) fair value losses or gains on currency derivatives we use to stabilize our cash flow in U.S. dollars. In 2016, we had foreign exchange gains of US$3.3 billion, while in 2015 and 2014 we had foreign exchange losses of US$7.0 billion and US$2.1 billion, respectively. In addition, changing values of the Brazilianreal, the Canadian dollar, the Australian dollar, the Indonesian rupiah and other currencies against the U.S. dollar affects our results since most of our costs of goods sold is denominated in currencies other than the U.S. dollar, principally thereal (55% in 2016) and the Canadian dollar (12% in 2016), while our revenues are mostly U.S. dollar-denominated. We expect currency fluctuations to continue to affect our financial income, expense and cash flow generation.
Significant volatility in currency prices may also result in disruption of foreign exchange markets, which could limit our ability to transfer or to convert certain currencies into U.S. dollars and other currencies for the purpose of making timely payments of interest and principal on our indebtedness. The central banks and governments of the countries in which we operate may institute restrictive exchange rate policies in the future and impose taxes on foreign exchange transactions.
Financial risks
Lower cash flows, resulting from decreased prices of our products, have adversely affected our credit ratings and the cost and availability of financing.
Lower prices of our products may adversely affect our future cash flows, credit ratings and our ability to secure financing at attractive rates. It may also negatively affect our ability to fund our capital investments, pay dividends and comply with the financial covenants in some of our long-term debt instruments.
Also, certain Canadian provinces where we operate require us to provide financial assurances, such as letters of credit, surety bonds or cash collateral, to cover certain closure and remediation costs after we conclude our operations. We may be required to increase the amount of these financial assurances if our credit ratings are downgraded below certain levels. If we are unable to provide these financial assurances, we would need to have discussions with the relevant jurisdictions about other options and ultimately it could affect our ability to operate in these jurisdictions.
We may not be able to implement our strategy with respect to divestments and strategic partnerships.
In the past few years, we have entered into agreements to dispose of assets and to make strategic partnerships, in order to optimize our business portfolio and implement our financing strategy and capital expenditure plans. We may continue to seek opportunities for divestments and strategic partnerships in the future. We are exposed to a number of risks in connection with these transactions, including imposition of regulatory conditions, inability to satisfy conditions for completion or for receipt of additional payments, and negative market reactions. If we are unable to complete our dispositions or strategic partnerships, particularly the sale of our fertilizer business or our partnership in our coal assets in Mozambique, we may have to revise our business and financing strategy and incur additional costs, which could in turn adversely affect our results of operations, financial conditions or reputation.
Risks relating to legal proceedings and Samarco dam failure
We are involved in legal proceedings that could have a material adverse effect on our business in the event of unfavorable outcomes.
We are involved in legal proceedings in which adverse parties have claimed substantial amounts, including several legal proceedings and investigations relating to the failure of Samarco's Fundão tailings dam. Although we are vigorously contesting them, the outcomes of these proceedings are uncertain and may result in obligations that could materially adversely affect our business and the value of the securities issued by Vale and its subsidiaries. For additional information, seeAdditional information—Legal proceedings.
Our obligations and potential liabilities arising from the failure of a tailings dam owned by Samarco Mineração S.A. ("Samarco") in Minas Gerais could negatively impact our business, our financial conditions and our reputation.
In November 2015, the Fundão tailings dam owned by Samarco failed, causing environmental damage in the surrounding area. The failure of Samarco's tailings dam has adversely affected and will continue to affect our business, but the full impact is still uncertain and cannot be estimated. Below is a discussion of the main effects of the dam failure on our business.
Political, economic, social and regulatory risks
Political, economic and social conditions in the countries in which we have operations or projects could adversely impact our business.
Our financial performance may be negatively affected by regulatory, political, economic and social conditions in countries in which we have significant operations or projects. In many of these jurisdictions, we are exposed to various risks such as political instability, bribery, extortion, corruption, robbery, sabotage, kidnapping, civil strife, acts of war, guerilla activities, piracy in international shipping routes and terrorism. These issues may adversely affect the economic and other conditions under which we operate in ways that could have a materially negative effect on our business. As an example, sections of our Carajás railroad (EFC) in the Brazilian state of Pará and other railways worldwide are subject to interruptions that can harm our operations and adversely affect our business.
Political and economic instability in Brazil could adversely impact our business and the market price of our securities.
The Brazilian federal government's economic policies may have important effects on Brazilian companies, including us, and on market conditions and prices of securities of Brazilian companies. Our financial condition and results of operations may be adversely affected by the following factors and the Brazilian federal government's response to these factors:
Historically, the country's political situation has influenced the performance of the Brazilian economy, and political crises have affected the confidence of investors and the general public, which resulted in economic deceleration and heightened volatility in the securities issued abroad by Brazilian companies. In August 2016, the Brazilian Congress approved the impeachment of the Brazilian president. Also, ongoing corruption investigations have led to charges against public officials, members of several political parties and directors and officers of many Brazilian companies. Political instability may aggravate economic uncertainties in Brazil and increase volatility of securities of Brazilian issuers.
In 2015 and 2016, Brazil faced an economic recession, adverse fiscal developments and political instability, which may continue in 2017. Brazilian GDP declined by 3.6% in 2016 and by 3.85% in 2015, while unemployment increased to 11.5% in 2016 from 6.9% in 2015. Inflation, as reported by the consumer price index (IPCA), was 6.29% in 2016, 10.67% in 2015 and 6.41% in 2014. The Brazilian Central Bank's base interest rate (SELIC) was 13.75% on December 31, 2016, 14.25% on December 31, 2015 and 11.75% on December 31, 2014. Future economic, social and political developments in Brazil may impair our business, financial condition or results of operations, or cause the market value of our securities to decline.
Disagreements with local communities in which we operate could adversely impact our business and reputation.
Disputes with communities where we operate may arise from time to time. In some instances, our operations and mineral reserves are located on or near lands owned or used by indigenous people or other groups of stakeholders. Some of our mining and other operations are located in territories where title may be subject to disputes or uncertainties, or in areas claimed for agriculture or land reform purposes, which may lead to disagreements with landowners, organized social movements, local communities and the government. We may be required to consult and negotiate with these groups as part of the process to obtain licenses required to operate, to mitigate impact on our operations or to obtain access to their lands.
Disagreements or disputes with local groups, including indigenous groups, organized social movements and local communities, could cause delays or interruptions to our operations, adversely affect our reputation or otherwise hamper our ability to develop our reserves and conduct our operations. Protesters have taken actions to disrupt our operations and projects, and they may continue to do so in the future, which may harm our operations and could adversely affect our business.
We could be adversely affected by changes in government policies or by trends such as resource nationalism, including the imposition of new taxes or royalties on mining activities.
Mining is subject to government regulation, including taxes and royalties, which can have a significant financial impact on our operations. In the countries where we are present, we are subject to potential renegotiation, nullification or forced modification of existing contracts and licenses, expropriation or nationalization of property, foreign exchange controls, changes in local laws and regulations and policies. We are also subject to new taxes or raising of existing taxes and royalty rates, reduction of tax exemptions and benefits, renegotiation of tax stabilization agreements or changes on the basis on which taxes are calculated in a manner that is unfavorable to us. Governments that have committed to provide a stable taxation or regulatory environment may alter those commitments or shorten their duration. We also face the risk of having to submit to the jurisdiction of a foreign court or arbitration panel or having to enforce a judgment against a sovereign nation within its own territory.
We are also required to meet domestic beneficiation requirements in certain countries, such as local processing rules, export taxes or restrictions or charges on unprocessed ores. The imposition of or increase in such requirements, taxes or charges can significantly increase the risk profile and costs of operations in those jurisdictions. We and the mining industry are subject to rising trends of resource nationalism in certain countries in which we operate that can result in constraints on our operations, increased taxation or even expropriations and nationalizations.
Concessions, authorizations, licenses and permits are subject to expiration, limitation on renewal and various other risks and uncertainties.
Our operations depend on authorizations and concessions from governmental regulatory agencies in the countries in which we operate. We are subject to laws and regulations in many jurisdictions that can change at any time, and changes in laws and regulations may require modifications to our technologies and operations and result in unanticipated capital expenditures.
Some of our mining concessions are subject to fixed expiration dates and might only be renewed a limited number of times for a limited period of time. Apart from mining concessions, we may need to obtain various authorizations, licenses and permits from governmental or other regulatory bodies in connection with the planning, maintenance, operation and closure of our mines and related logistics infrastructure, which may be subject to fixed expiration dates or periodic review or renewal. There is no assurance that renewals will be granted as and when sought, and there is no assurance that new conditions will not be imposed in connection with renewal. Fees for mining concessions might increase substantially due to the passage of time from the original issuance of each individual exploration license. If so, the costs of holding or renewing our mining concessions may render our business objectives not viable. Accordingly, we need to continually assess the mineral potential of each mining concession, particularly at the time of renewal, to determine if the costs of maintaining the concession are justified by the results of operations to date, and we might elect to let some of our concessions lapse. There can be no assurance that concessions will be obtained on terms favorable to us, or at all, for our future intended mining or exploration targets.
In a number of jurisdictions where we have exploration projects, we may be required to retrocede to the state a certain portion of the area covered by the exploration license as a condition to renewing the license or obtaining a mining concession. This requirement can lead to a substantial loss of part of the mineral deposit originally identified in our feasibility studies. For more information on mining concessions and other similar rights, seeInformation on the Company—Regulatory matters.
Operational risks
Our projects are subject to risks that may result in increased costs or delay in their implementation
We are investing to maintain and further increase our production capacity and logistics capabilities. We regularly review the economic viability of our projects. As a result of this review, we may decide to postpone, suspend or interrupt the implementation of certain projects. Our projects are also subject to a number of risks that may adversely affect our growth prospects and profitability, including the following:
Operational problems could materially and adversely affect our business and financial performance.
Ineffective project management and operational breakdowns might require us to suspend or curtail operations, which could generally reduce our productivity. Operational breakdowns could entail failure of critical plant and machinery. There can be no assurance that ineffective project management or other operational problems will not occur. Any damages to our projects or delays in our operations caused by ineffective project management or operational breakdowns could materially and adversely affect our business and results of operations. Our business is subject to a number of operational risks that may adversely affect our results of operations, such as:
Our business could be adversely affected by the failure of our counterparties to perform their obligations.
Customers, suppliers, contractors, financial institutions, joint venture partners and other counterparties may fail to perform existing contracts and obligations, which may unfavorably impact our operations and financial results. The ability of suppliers and customers to perform their obligations may be adversely affected in times of financial stress and economic downturn.
We currently operate important parts of our iron ore, pelletizing, nickel, coal, copper, fertilizers, bauxite and steel businesses through joint ventures. Important parts of our electricity investments and projects are operated through consortia or joint ventures. Our forecasts and plans for these joint ventures and consortia assume that our partners will observe their obligations to make capital contributions, purchase products and, in some cases, provide skilled and competent managerial personnel. If any of our partners fails to observe its commitments, the affected joint venture or consortium may not be able to operate in accordance with its business plans, or we may have to increase the level of our investment to implement these plans.
Some of our investments are controlled by partners or have separate and independent management. These investments may not fully comply with our standards, controls and procedures, including our health, safety, environment and community standards. Failure by any of our partners or joint ventures to adopt adequate standards, controls and procedures could lead to higher costs, reduced production or environmental, health and safety incidents or accidents, which could adversely affect our results and reputation.
We may not have adequate insurance coverage for some business risks.
Our businesses are generally subject to a number of risks and hazards, which could result in damage to, or destruction of, properties, facilities and equipment. The insurance we maintain against risks that are typical in our business may not provide adequate coverage. Insurance against some risks (including liabilities for environmental pollution or certain hazards or interruption of certain business activities) may not be available at a reasonable cost, or at all. Even when it is available, we may self-insure where we determine that is more cost-effective to do so. As a result, accidents or other negative developments involving our mining, production or transportation facilities could have a material adverse effect on our operations.
Labor disputes may disrupt our operations from time to time.
A substantial number of our employees, and some of the employees of our subcontractors, are represented by labor unions and are covered by collective bargaining or other labor agreements, which are subject to periodic negotiation. Strikes and other labor disruptions at any of our operations could adversely affect the operation of facilities and the timing of completion and cost of our capital projects. For more information about labor relations, seeManagement and employees—Employees. Moreover, we could be adversely affected by labor disruptions involving unrelated parties that may provide us with goods or services.
Higher energy costs or energy shortages would adversely affect our business.
Costs of fuel oil, gas and electricity are a significant component of our cost of production, representing 10.9% of our total cost of goods sold in 2016. To fulfill our energy needs, we depend on the following sources: oil byproducts, which represented 36% of total energy needs in 2016, electricity (32%), natural gas (15%), coal (15%) and other energy sources (2%).
Electricity costs represented 3.9% of our total cost of goods sold in 2016. If we are unable to secure reliable access to electricity at acceptable prices, we may be forced to curtail production or may experience higher production costs, either of which would adversely affect our results of operations. We face the risk of energy shortages in the countries where we have operations and projects, especially Brazil, due to lack of infrastructure or weather conditions, such as floods or droughts. Future shortages, and government efforts to respond to or prevent shortages, may adversely impact the cost or supply of electricity for our operations.
Failures in our information technology systems or difficulties in integrating new enterprise resource planning software may interfere with the normal functioning of our business.
We rely on information technology ("IT") systems for the operation of many of our business processes. Failures in our IT systems, whether caused by accident or malicious acts, may result in the disclosure or theft of sensible information, misappropriation of funds and disruptions to our business operations.
Health, safety and environmental risks
Our business is subject to environmental, health and safety incidents.
Our operations involve the use, handling, storage, discharge and disposal of hazardous substances into the environment and the use of natural resources, and the mining industry is generally subject to significant risks and hazards, including fire, explosion, toxic gas leaks, spilling of polluting substances or other hazardous materials, rockfalls, incidents involving dams, failure of other operational structures and incidents involving mobile equipment, vehicles or machinery. This could occur by accident or by breach of operating and maintenance standards, and could result in a significant environmental and social impacts, damage to or destruction of mineral properties or production facilities, personal injury, illness or death of employees, contractors or community members close to operations, environmental damage, delays in production, monetary losses and possible legal liability. Additionally, in remote localities, our employees may be exposed to tropical and contagious diseases that may affect their health and safety. Notwithstanding our standards, policies and controls, our operations remain subject to incidents or accidents that could adversely affect our business, stakeholders or reputation.
Our business may be adversely affected by environmental and health and safety regulation, including regulations pertaining to climate change.
Nearly all aspects of our activities, products, services and projects around the world are subject to environmental regulations and health and safety regulations, which may expose us to increased liability or increased costs. These regulations require us to have environmental licenses, permits and authorizations for our operations and projects, and to conduct environmental and social impact assessments in order to get approval for our projects and permission for initiating construction. Significant changes to existing operations are also subject to these requirements. Difficulties in obtaining or renewing permits may lead to construction delays, cost increases, and may adversely impact our production volumes. Environmental and health and safety regulations also impose standards and controls on activities relating to mineral research, mining, pelletizing activities, railway and marine services, ports, decommissioning, refining, distribution and marketing of our products. Such regulation may give rise to significant costs and liabilities. Litigation relating to these or other matters may adversely affect our financial condition or cause harm to our reputation.
Environmental and health and safety regulation in many countries in which we operate has become stricter in recent years, and it is possible that more regulation or more aggressive enforcement of existing regulations will adversely affect us by imposing restrictions on our activities and products, creating new requirements for the issuance or renewal of environmental licenses, raising our costs or requiring us to engage in expensive reclamation efforts. For example, changes in Brazilian legislation for the protection of caves have required us to conduct extensive technical studies and to negotiate compensatory measures with Brazilian environmental regulators in order to continue to operate in certain sites. It is possible that in certain of our iron ore mining operations or projects, we may be required to limit or modify our mining plans or to incur additional costs to preserve caves or to compensate for the impact on them, with potential consequences for production volumes, costs or reserves in our iron ore business. For more information about Brazilian environmental regulations related to caves, seeInformation on the Company—Regulatory matters—Environmental regulations.
In response to the failure of Samarco's tailings dam in Minas Gerais, additional environmental and health and safety laws and regulations may be forthcoming in Brazil and authorities may impose more stringent conditions in connection with the licensing process of our projects and operations. Also, we may encounter delays in the receipt of environmental operating license for other tailings dams.
National policies and international regulations regarding climate change may affect a number of our businesses in various countries. The ratification of the Paris Agreement in 2016 increased international pressure for the establishment of a global carbon price, and on companies to adopt carbon pricing strategies. The pricing of greenhouse gas emissions may impact our operational costs, mainly through higher price for fossil fuels as mining is an energy intensive industry. Consumption of coal, one of the products we sell, in particular, is facing pressure from international institutions due to its carbon intensity.
Regulatory initiatives at the national and international levels that affect our shipping practices could increase our costs or require us to make new capital expenditures.
Natural disasters may cause severe damage to our operations and projects in the countries where we operate and may have a negative impact on our sales to countries affected by such disasters.
Natural disasters, such as wind storms, droughts, floods, earthquakes and tsunamis may adversely affect our operations and projects in the countries where we operate, and may cause a contraction in sales to countries adversely affected due to, among other factors, power outages and the destruction of industrial facilities and infrastructure. The physical impact of climate change on our business remains uncertain, but we are likely to experience changes in rainfall patterns, increased temperatures, water shortages, rising sea levels, increased storm frequency and intensity as a result of climate change, which may adversely affect our operations. On some occasions in recent years, we have determined thatforce majeure events have occurred due to effect of severe weather on our mining and logistics activities.
Risks relating to our mining reserves
Our reserve estimates may materially differ from mineral quantities that we are actually able to recover; our estimates of mine life may prove inaccurate; and market price fluctuations and changes in operating and capital costs may render certain ore reserves uneconomical to mine.
Our reported reserves are estimated quantities of ore and minerals that we have determined can be economically mined and processed under present and assumed future conditions. There are numerous uncertainties inherent in estimating quantities of reserves and in projecting potential future rates of mineral production, including factors beyond our control. Reserve reporting involves estimating deposits of minerals that cannot be measured in an exact manner, and the accuracy of any reserve estimate is a function of the quality of available data, engineering and geological interpretation and judgment. As a result, no assurance can be given that the indicated amount of ore will be recovered or that it will be recovered at the rates we anticipate. Reserve estimates and estimates of mine life may require revisions based on actual production experience, projects, updated exploration drilling data and other factors. For example, lower market prices of minerals and metals, reduced recovery rates or increased operating and capital costs due to inflation, exchange rates, changes in regulatory requirements or other factors may render proven and probable reserves uneconomic to exploit and may ultimately result in a reduction of reserves. Such a reduction could affect depreciation and amortization rates and have an adverse effect on our financial performance.
We may not be able to replenish our reserves, which could adversely affect our mining prospects.
We engage in mineral exploration, which is highly uncertain in nature, involves many risks and frequently is non-productive. Our exploration programs, which involve significant expenditures, may fail to result in the expansion or replacement of reserves depleted by current production. If we do not develop new reserves, we will not be able to sustain our current level of production beyond the remaining lives of our existing mines.
The feasibility of new mineral projects may change over time.
Once mineral deposits are discovered, it can take a number of years from the initial phases of drilling until production is possible, during which the economic feasibility of production may change. Substantial time and expenditures are required to:
If a project proves not to be economically feasible by the time we are able to exploit it, we may incur substantial losses and be obliged to take write-downs. In addition, potential changes or complications involving metallurgical and other technological processes arising during the life of a project may result in delays and cost overruns that may render the project not economically feasible.
We face rising extraction costs or investment requirements over time as reserves deplete.
Reserves are gradually depleted in the ordinary course of a given open pit or underground mining operation. As mining progresses, distances to the primary crusher and to waste deposits become longer, pits become steeper, mines may move from being open pit to underground, and underground operations become deeper. In addition, for some types of reserves, mineralization grade decreases and hardness increases at greater depths. As a result, over time, we usually experience rising unit extraction costs with respect to each mine, or we may need to make additional investments, including adaptation or construction of processing plants and expansion or construction of tailings dams. Several of our mines have been operating for long periods, and we will likely experience rising extraction costs per unit in the future at these operations in particular.
Risks relating to our corporate structure
Our controlling shareholder has significant influence over Vale and the Brazilian Government has certain veto rights.
As of March 31, 2017, Valepar S.A. ("Valepar") owned 53.9% of our outstanding common stock and 33.7% of our total outstanding capital. As a result of its share ownership, Valepar can elect the majority of our board of directors and control the outcome of some actions that require shareholder approval. The shareholders of Valepar are party to a shareholders' agreement that governs Valepar's actions in its capacity as a shareholder of Vale. The existing shareholders' agreement will expire on May 9, 2017, and certain Valepar shareholders have entered into a new shareholders' agreement that will become effective on May 10, 2017, for a period of six months or until the merger of Valepar into Vale. The new shareholders' agreement contemplates a proposal to change our governance structure and the execution of a shareholders' agreement at the Vale level, binding with respect to 20% of our common shares, which will continue to give significant influence to these shareholders. For a description of our ownership structure and of the shareholders' agreements, seeShare ownership and trading—Major shareholders.
The Brazilian government owns 12 golden shares of Vale, granting it limited veto power over certain company actions, such as changes to our name, the location of our headquarters and our corporate purpose as it relates to mining activities. For a detailed description of the Brazilian government's veto powers, seeAdditional information—Memorandum and articles of association—Common shares and preferred shares.
The implementation of a change in our capital structure and governance, and any potential benefits, are subject to uncertainty and may not lead to the benefits that we expect.
Pursuant to the new shareholder's agreement of Valepar, which will become effective on May 10, 2017, Valepar is expected to submit a proposal to simplify our shareholding structure and corporate governance, with the purpose of eventually enabling Vale to be listed on BM&FBOVESPA'sNovo Mercado special segment and making Vale a company without defined control. For a description of our ownership structure and the proposed changes to the Valepar shareholders' agreements pursuant to the Proposal, seeShare ownership and trading—Major shareholders.
The implementation of the proposal to simplify our shareholding structure is subject to, among other requirements, (i) the approval of the proposal, including the merger of Valepar into Vale, by our shareholders and the executive officers and board of directors of Vale and Valepar, and (ii) the acceptance by at least 54.09% of class A preferred shares of the voluntary conversion into common shares, within 45 days from the shareholders' meeting decision on the matter. We cannot predict how long it will take to implement all the necessary steps or whether they will be successfully implemented at all. Finally, we cannot predict whether or when we will migrate to theNovo Mercado segment of the BM&FBOVESPA, as the listing is subject to conversion of all of our preferred shares into common shares.
The uncertainty in the timing and effective implementation may delay or limit our ability to achieve certain benefits that might derive from the simplified corporate ownership structure and eventual migration to theNovo Mercado, such as increased liquidity for shareholders. We cannot guarantee that these benefits will be fully realized, and any failure to achieve those benefits may affect the value of our shares and ADSs.
Our governance and compliance processes may fail to prevent regulatory penalties and reputational harm.
We operate in a global environment, and our activities extend over multiple jurisdictions and complex regulatory frameworks with increased enforcement activities worldwide. Our governance and compliance processes, which include the review of internal control over financial reporting, may not prevent future breaches of legal, accounting or governance standards. We may be subject to breaches of our Code of Ethics and Conduct, anti-corruption policies and business conduct protocols and to instances of fraudulent behavior, corrupt practices and dishonesty by our employees, contractors or other agents. Our failure to comply with applicable laws and other standards could subject us to fines, loss of operating licenses and reputational harm.
It could be difficult for investors to enforce any judgment obtained outside Brazil against us or any of our associates.
Our investors may be located in jurisdictions outside Brazil and could seek to bring actions against us or our directors or officers in the courts of their home jurisdictions. We are a Brazilian company, and the majority of our officers and directors are residents of Brazil. The vast majority of our assets and the assets of our officers and directors are likely to be located in jurisdictions other than the home jurisdictions of our foreign investors. It might not be possible for investors outside Brazil to effect service of process within their home jurisdictions on us or on our officers or directors who reside outside their home jurisdictions. In addition, a final conclusive foreign judgment will be enforceable in the courts of Brazil without a re-examination of the merits only if previously confirmed by the Brazilian Superior Court of Justice (STJ—Superior Tribunal de Justiça), and confirmation will only be granted if the foreign judgment: (a) fulfills all formalities required for its enforceability under the laws of the country where it was issued; (b) was issued by a competent court after due service of process on the defendant, as required under applicable law; (c) is not subject to appeal; (d) does not conflict with a final and unappealable decision issued by a Brazilian court; (e) was authenticated by a Brazilian consulate in the country in which it was issued or is duly apostilled in accordance with the Convention for Abolishing the Requirement of Legalization for Foreign Public Documents and is accompanied by a sworn translation into Portuguese, unless this procedure was exempted by an international treaty entered into by Brazil; (f) it does not cover matters subject to the exclusive jurisdiction of the Brazilian courts; and (g) is not contrary to Brazilian national sovereignty, public policy or good morals. Therefore, investors might not be able to recover against us or our directors and officers on judgments of the courts of their home jurisdictions predicated upon the laws of such jurisdictions.
Risks relating to our depositary shares
If ADR holders exchange ADSs for the underlying shares, they risk losing the ability to remit foreign currency abroad.
The custodian for the shares underlying our ADSs maintains a registration with the Central Bank of Brazil entitling it to remit U.S. dollars outside Brazil for payments of dividends and other distributions relating to the shares underlying our ADSs or upon the disposition of the underlying shares. If an ADR holder exchanges its ADSs for the underlying shares, it will be entitled to rely on the custodian's registration for only five business days from the date of exchange. Thereafter, an ADR holder may not be able to obtain and remit foreign currency abroad upon the disposition of, or distributions relating to, the underlying shares unless it obtains its own registration under applicable regulation, which permits qualifying institutional foreign investors to buy and sell securities on the BM&FBOVESPA. For more information regarding these exchange controls, seeAdditional information—Exchange controls and other limitations affecting security holders. If an ADR holder attempts to obtain its own registration, it may incur expenses or suffer delays in the application process, which could delay the receipt of dividends or other distributions relating to the underlying shares or the return of capital in a timely manner.
The custodian's registration or any registration obtained could be affected by future legislative changes, and additional restrictions applicable to ADR holders, the disposition of the underlying shares or the repatriation of the proceeds from disposition could be imposed in the future.
ADR holders may be unable to exercise preemptive rights relating to the shares underlying their ADSs.
The ability of ADR holders to exercise preemptive rights is not assured, particularly if the applicable law in the holder's jurisdiction (for example, the Securities Act in the United States) requires that either a registration statement be effective or an exemption from registration be available with respect to those rights, as is in the case in the United States. We are not obligated to extend the offer of preemptive rights to holders of ADRs, to file a registration statement in the United States, or to make any other similar filing in any other jurisdiction, relating to preemptive rights or to undertake steps that may be needed to make exemptions from registration available, and we cannot assure holders that we will file any registration statement or take such steps.
ADR holders may encounter difficulties in the exercise of voting rights.
ADR holders do not have the rights of shareholders. They have only the contractual rights set forth for their benefit under the deposit agreements. ADR holders are not permitted to attend shareholders' meetings, and they may only vote by providing instructions to the depositary. In practice, the ability of a holder of ADRs to instruct the depositary as to voting will depend on the timing and procedures for providing instructions to the depositary either directly or through the holder's custodian and clearing system. With respect to ADSs for which instructions are not received, the depositary may, subject to certain limitations, grant a proxy to a person designated by us.
The legal protections for holders of our securities differ from one jurisdiction to another and may be inconsistent, unfamiliar or less effective than investors anticipate.
We are a global company with securities traded in several different markets and investors located in many different countries. The legal regime for the protection of investors varies around the world, sometimes in important ways, and investors in our securities should recognize that the protections and remedies available to them may be different from those to which they are accustomed in their home markets. We are subject to securities legislation in several countries, which have different rules, supervision and enforcement practices. The only corporate law applicable to our parent company is the law of Brazil, with its specific substantive rules and judicial procedures. We are subject to corporate governance rules in several jurisdictions where our securities are listed, but as a foreign private issuer, we are not required to follow many of the corporate governance rules that apply to U.S. domestic issuers with securities listed on the New York Stock Exchange, and we are not subject to the U.S. proxy rules.
The tables below present selected consolidated financial information as of and for the periods indicated. You should read this information together with our consolidated financial statements in this annual report. The comparative information for 2012 to 2015 has been re-presented to report our fertilizers segment as discontinued operations.
Consolidated statement of income data
| | | For the year ended December 31, | | |||||||||||||
|---|---|---|---|---|---|---|---|---|---|---|---|---|---|---|---|---|
| | | 2012 | | 2013 | | 2014 | | 2015 | | 2016 | | |||||
| | | (US$ million) | | |||||||||||||
Net operating revenues | | 42,983 | | 43,953 | | 35,124 | | 23,384 | | 27,488 | | |||||
Cost of goods sold and services rendered | | (22,407 | ) | (21,668 | ) | (22,790 | ) | (18,751 | ) | (17,650 | ) | |||||
Selling, general, administrative and other operating expenses, net | | (1,954 | ) | (1,101 | ) | (2,059 | ) | (819 | ) | (774 | ) | |||||
Research and evaluation expenses | | (1,356 | ) | (748 | ) | (662 | ) | (395 | ) | (319 | ) | |||||
Pre-operating and operational stoppage | | (3,495 | ) | (2,375 | ) | (975 | ) | (942 | ) | (453 | ) | |||||
Impairment of non-current assets and onerous contracts | | (4,023 | ) | (182 | ) | (99 | ) | (8,769 | ) | (1,174 | ) | |||||
Results on measurement or sales of non-current assets | | (377 | ) | (215 | ) | (167 | ) | 61 | | (66 | ) | |||||
| | | | | | | | | | | | | |||||
Operating income (loss) | | 9,371 | | 17,664 | | 8,372 | | (6,231 | ) | 7,052 | | |||||
| | | | | | | | | | | | | |||||
Non-operating income (expenses): | | | | | | | ||||||||||
Financial income (expenses), net | | (3,976 | ) | (8,314 | ) | (6,018 | ) | (10,654 | ) | 1,843 | | |||||
Equity results in associates and joint ventures | | 645 | | 469 | | 501 | | (445 | ) | 309 | | |||||
Impairment and other results in associates and joint ventures | | (1,941 | ) | 14 | | (61 | ) | (349 | ) | (1,220 | ) | |||||
| | | | | | | | | | | | | |||||
Net income (loss) before income taxes | | 4,099 | | 9,833 | | 2,794 | | (17,679 | ) | 7,984 | | |||||
Income taxes | | (32 | ) | (6,889 | ) | (1,603 | ) | 5,249 | | (2,781 | ) | |||||
Net income (loss) from continuing operations | | 4,067 | | 2,944 | | 1,191 | | (12,430 | ) | 5,203 | | |||||
Loss attributable to non-controlling interests | | (311 | ) | (191 | ) | (308 | ) | (501 | ) | (8 | ) | |||||
| | | | | | | | | | | | | |||||
Net income (loss) from continuing operations attributable to Vale's stockholders | | 4,378 | | 3,135 | | 1,499 | | (11,929 | ) | 5,211 | | |||||
| | | | | | | | | | | | | |||||
Net income (loss) from discontinued operations attributable to Vale's stockholders | | 1,076 | | (2,551 | ) | (842 | ) | (200 | ) | (1,229 | ) | |||||
Net income (loss) attributable to Vale's stockholders | | 5,454 | | 584 | | 657 | | (12,129 | ) | 3,982 | | |||||
| | | | | | | | | | | | | |||||
| | | | | | | | | | | | | |||||
| | | | | | | | | | | | | |||||
Loss attributable to non-controlling interests | | (257 | ) | (178 | ) | (304 | ) | (491 | ) | (6 | ) | |||||
| | | | | | | | | | | | | |||||
Net income (loss) | | 5,197 | | 406 | | 353 | | (12,620 | ) | 3,976 | | |||||
| | | | | | | | | | | | | |||||
Total cash paid to stockholders(1) | | 6,000 | | 4,500 | | 4,200 | | 1,500 | | 250 | | |||||
Earnings (loss) per share
| | | For the year ended December 31, | | |||||||||||||
|---|---|---|---|---|---|---|---|---|---|---|---|---|---|---|---|---|
| | | 2012 | | 2013 | | 2014 | | 2015 | | 2016 | | |||||
| | | (US$, except as noted) | | |||||||||||||
Earnings (loss) per share from continuing operations: | | | | | | | ||||||||||
Per common share | | 0.86 | | 0.61 | | 0.29 | | (2.31 | ) | 1.01 | | |||||
Per preferred share | | 0.86 | | 0.61 | | 0.29 | | (2.31 | ) | 1.01 | | |||||
Earnings (loss) per share from discontinued operations: | | | | | | | ||||||||||
Per common share | | 0.20 | | (0.50 | ) | (0.16 | ) | (0.04 | ) | (0.24 | ) | |||||
Per preferred share | | 0.20 | | (0.50 | ) | (0.16 | ) | (0.04 | ) | (0.24 | ) | |||||
Earnings (loss) per share: | | | | | | | ||||||||||
Per common share | | 1.06 | | 0.11 | | 0.13 | | (2.35 | ) | 0.77 | | |||||
Per preferred share | | 1.06 | | 0.11 | | 0.13 | | (2.35 | ) | 0.77 | | |||||
Weighted average number of shares outstanding (in thousands)(1): | | | | | | | ||||||||||
Common shares | | 3,172,179 | | 3,185,653 | | 3,185,653 | | 3,185,653 | | 3,185,653 | | |||||
Preferred shares | | 1,933,491 | | 1,967,722 | | 1,967,722 | | 1,967,722 | | 1,967,722 | | |||||
| | | | | | | | | | | | | |||||
Total | | 5,105,670 | | 5,153,375 | | 5,153,375 | | 5,153,375 | | 5,153,375 | | |||||
| | | | | | | | | | | | | |||||
| | | | | | | | | | | | | |||||
| | | | | | | | | | | | | |||||
Distributions to stockholders per share(2): | | | | | | | ||||||||||
Expressed in US$ | | 1.17 | | 0.87 | | 0.81 | | 0.29 | | 0.05 | | |||||
Expressed in R$ | | 2.26 | | 1.81 | | 1.89 | | 0.98 | | 0.17 | | |||||
Balance sheet data
| | | As of December 31, | | |||||||||||||
|---|---|---|---|---|---|---|---|---|---|---|---|---|---|---|---|---|
| | | 2012 | | 2013 | | 2014 | | 2015 | | 2016 | | |||||
| | | (US$ million) | | |||||||||||||
Current assets | | 22,069 | | 20,611 | | 16,594 | | 11,429 | | 13,978 | | |||||
Non-current assets held for sale | | 457 | | 3,766 | | 3,640 | | 4,044 | | 8,589 | | |||||
Property, plant and equipment, net and intangible assets | | 94,093 | | 88,536 | | 84,942 | | 59,426 | | 62,290 | | |||||
Investments in associated companies and joint ventures | | 6,384 | | 3,584 | | 4,133 | | 2,940 | | 3,696 | | |||||
Non-current assets | | 7,574 | | 8,100 | | 7,180 | | 10,653 | | 10,461 | | |||||
| | | | | | | | | | | | | |||||
Total assets | | 130,577 | | 124,597 | | 116,489 | | 88,492 | | 99,014 | | |||||
| | | | | | | | | | | | | |||||
| | | | | | | | | | | | | |||||
| | | | | | | | | | | | | |||||
Current liabilities | | 12,402 | | 9,164 | | 10,626 | | 10,438 | | 10,142 | | |||||
Liabilities associated with non-current assets held for sale | | 169 | | 448 | | 111 | | 107 | | 1,090 | | |||||
Long-term liabilities(1) | | 16,380 | | 22,379 | | 22,043 | | 15,896 | | 19,096 | | |||||
Long-term debt(2) | | 26,799 | | 27,670 | | 27,388 | | 26,347 | | 27,662 | | |||||
| | | | | | | | | | | | | |||||
Total liabilities | | 55,750 | | 59,661 | | 60,168 | | 52,788 | | 57,990 | | |||||
| | | | | | | | | | | | | |||||
| | | | | | | | | | | | | |||||
| | | | | | | | | | | | | |||||
Stockholders' equity: | | | | | | | ||||||||||
Capital stock | | 60,578 | | 60,578 | | 61,614 | | 61,614 | | 61,614 | | |||||
Additional paid-in capital | | (552 | ) | (552 | ) | (601 | ) | (854 | ) | (851 | ) | |||||
Retained earnings and revenue reserves | | 13,213 | | 3,299 | | (5,891 | ) | (27,171 | ) | (21,721 | ) | |||||
| | | | | | | | | | | | | |||||
Total Vale shareholders' equity | | 73,239 | | 63,325 | | 55,122 | | 33,589 | | 39,042 | | |||||
| | | | | | | | | | | | | |||||
Non-controlling interests | | 1,588 | | 1,611 | | 1,199 | | 2,115 | | 1,982 | | |||||
| | | | | | | | | | | | | |||||
Total stockholders' equity | | 74,827 | | 64,936 | | 56,321 | | 35,704 | | 41,024 | | |||||
| | | | | | | | | | | | | |||||
Total liabilities and stockholders' equity | | 130,577 | | 124,597 | | 116,489 | | 88,492 | | 99,014 | | |||||
| | | | | | | | | | | | | |||||
| | | | | | | | | | | | | |||||
| | | | | | | | | | | | | |||||
Summary
We are one of the largest metals and mining companies in the world, based on market capitalization. We are the world's largest producer of iron ore and iron ore pellets and the world's largest producer of nickel. We also produce manganese ore, ferroalloys, metallurgical and thermal coal, copper, platinum group metals (PGMs), gold, silver and cobalt. We are presently engaged in greenfield mineral exploration in six countries around the globe.five countries. We operate large logistics systems in Brazil and other regions of the world, including railroads, maritime terminals and ports, which are integrated with our mining operations. In addition, we have a portfolio of maritime freight assets, floating transfer stations and distribution centerscenter to support the delivery of iron ore worldwide. Directly and through affiliates and joint ventures, we also have investments in energy and steel businesses.
In this report, references to "Vale" are to Vale S.A. References to "we," "us" or the "Company" are to Vale and, except where the context otherwise requires, its consolidated subsidiaries. References to our "ADSs" or "American Depositary Shares" are to our common American Depositary Shares (our "common ADSs"), each of which represents one common share of Vale. American Depositary Shares are represented by American Depositary Receipts ("ADRs") issued by the depositary.
Vale S.A. is a stock corporation, orsociedade por ações, that was organized on January 11, 1943 under the laws of the Federative Republic of Brazil for an unlimited period of time. Its head office is located at Praia de Botafogo 186 – offices 701-1901 – Botafogo, 22250-145 Rio de Janeiro, RJ, Brazil, and its telephone number is 55-21-3485-5000.
Unless otherwise specified, we use metric units. References to "real," "reais" or "R$" are to the official currency of Brazil, thereal (singular) orreais (plural). References to "U.S. dollars" or "US$" are to United States dollars. References to "€" are to Euros.
| | | | |
| | 1 | | |
FAILURE OF THE TAILINGS DAM AT THE CÓRREGO DO FEIJÃO MINE
On January 25, 2019, a tailings dam ("Dam I") failed at our Córrego do Feijão mine, in the city of Brumadinho, state of Minas Gerais. The failure released a flow of tailings debris, which affected our administrative area at the Córrego do Feijão mine and parts of the communities of Córrego do Feijão and Parque da Cachoeira outside of Brumadinho, reaching the nearby Paraopeba River. The dam failure resulted in nearly 300 fatalities or presumed fatalities, and also caused extensive property and environmental damage in the region. Our priority now is to provide support to those affected by the dam failure.
The causes of the accident are still uncertain and are being investigated by us and by several governmental authorities. We are providing our full cooperation to the authorities and to the investigations into the dam failure.
Dam I
The Córrego do Feijão mine is part of the Paraopeba complex, in the Southern System. Dam I was first built in 1976 by Ferteco Mineração, a company we acquired in 2001. Dam I received disposed tailings from the Córrego do Feijão and Jangada mines from 1976 until it became inactive in 2016. Dam I contained approximately 11.7 million cubic meters of iron ore tailings.
The dam was raised by building successive layers (lifts) above the tailings accumulated in the reservoir, a technique known as the "upstream" method. There are two other raising methods, the "downstream" method and the "centerline" method, in which the dam is raised by placing new layers away from the initial dam or on top of it, as opposed to over the accumulated tailings. Each of these methods presents a different risk profile.
Dam VI, another dam located at the Córrego do Feijão mine, was impacted by the tailings debris flow from the failure of Dam I. Due to the ongoing investigation into potential damages from the impact of the tailings debris, it has not received the certification of stability (Stability Condition Statement, or "DCE") required by the rules of the national mining agency, the ANM (Agência Nacional de Mineração). Dam VI is being continuously monitored.
The Jangada mine, also located in the Paraopeba complex, was not affected by the tailings debris flow, but its operations were suspended because of the closure of Feijão processing plant, which processed the run-of-mine of the Jangada mine.
Vale's response
Our senior management has been focused on emergency and long-term initiatives, with three main purposes: (i) providing assistance to victims and remediation of the affected area, (ii) determining the causes of the failure of Dam I, and (iii) preventing further accidents through improved standards and accelerated decommissioning of upstream dams.
(i) Assistance and remediation efforts
Immediately following the failure of Dam I, we contacted the local authorities and activated our Emergency Mining Dam Response Plan (Plano de Ação de Emergência de Barragens de Mineração (PAEBM)) to rescue and provide immediate humanitarian assistance to affected parties, including employees and members of the community. We also mobilized our teams to monitor the Paraopeba River basin, rescue wildlife and domestic animals and support sanitation measures. We mobilized over 400
| | | | |
| | 2 | | |
Business Overview
doctors, nurses, psychologists, social workers and volunteers to set up assistance centers for those affected. These assistance centers provided humanitarian aid, including medical, psychological and social assistance, distributed basic emergency items, including pharmaceuticals, food, potable water and clothing, and provided duplicate records (such as identification cards, marriage certificates, and birth certificates) to those who lost their homes. We also provided 40 ambulances, a support helicopter, shopping vouchers for clothing, accommodation and transportation for over 800 people.
On January 31, 2019, we presented an emergency plan to the Minas Gerais Public Prosecutor's Office, and to the state and federal environmental agencies, including containment, retention, remediation and recovery actions. The plan contemplates removing debris, installing hydraulic barriers and small dams to assist in the tailings control process, establishing water treatment stations, restoring roads and installing membrane barriers downstream to contain ultrafine sediments and protect the water system on the Paraopeba River basin.
On February 6, 2019, we entered into an agreement with various governmental authorities undertaking to gradually replace our professionals who had been providing assistance to the populations affected since the dam failure, with a team to join the health and social service teams of the city of Brumadinho. We will bear for at least six months the costs of employing 142 professionals, including doctors, nurses, psychologists, physical therapists, occupational therapists, social workers and endemic disease control agents, in addition to administrative and operational professionals, as well as logistics costs incurred by these teams.
We have donated resources to the Municipality of Brumadinho, the fire department of Minas Gerais and other entities that provided assistance to the affected parties. For those affected by the dam failure, we established a three-tiered financial assistance program, under which, we have made donations to more than 440 people. We are also providing funeral assistance and contributing to funeral expenses for each affected family. These donations are without prejudice to any right that any person affected by the dam failure may have to claim damages against us.
(ii) Determination of the causes for the failure of the dam
We are investigating the causes of the failure of Dam I. We engaged a legal advisor and technical experts to conduct an investigation into the causes of the failure of the dam. In addition, our Board of Directors established the Independent Ad Hoc Consulting Committee for Investigation (CIAEA), an independent committee to investigate and advise the Board of Directors in connection with the determination of the causes of the dam failure.
(iii) Prevention of further accidents and accelerated decommissioning of upstream dams
On January 29, 2019, we decided to accelerate our existing plan to decommission our tailings dams built using the upstream method. "Decommissioning" or "decharacterization" means reintegrating the dam and its contents into the local environment, so that the structure is effectively no longer a dam. We will determine the appropriate actions to decommission each dam safely, in accordance with the geotechnical and geographic conditions of each dam. For certain of our upstream dams, we will first convert the dam into a downstream or centerline dam and conclude the decommissioning subsequently. Some of our existing downstream or centerline dams contain smaller dikes or structures that were built using the upstream technique, and we are also planning to remove these upstream dikes or structures. At this point, we cannot predict the costs and timing for decommissioning our upstream tailings dams.
We have been taking steps to decommission upstream dams since late 2015, in response to the failure of Samarco's Fundão dam. In February 2019, we announced our plan to accelerate this process and our
| | | | |
| | 3 | | |
Business Overview
decision to temporarily suspend our operations at mines and concentration plants located in areas where upstream dams are located. Also, based on our initial assessments, we determined that certain dams would not meet the requirements of new safety requirements imposed by ANM, and evacuated certain areas and relocated the population located within the Self-Rescue Zone of these dams. We expect to resume production at these mines and concentration plants in the future.
Independent Committees
Our Board of Directors has created three independent ad hoc advisory committees to support the Board in matters relating to the dam failure. All of these committees are composed of external and independent members appointed by our Board of Directors. These committees are described below.
Impacts of the failure of Dam I on Vale
The impacts of the dam failure on our operations and results of operations will be very significant, but their full scale and scope remains uncertain. Some of major impacts are described below.
(i) Freeze orders
Various Brazilian courts have ordered freezes, attachments, deposits and similar measures affecting an aggregate of R$17.6 billion (US$4.5 billion) of our financial assets, including balances in our bank accounts and judicial deposits to secure the payment of damages resulting from the dam failure. This total amount also includes common shares that we hold in treasury and that have been attached. We are also subject to a number of other proceedings and investigations related to the dam failure, which may result in additional attachment of assets and seizure of balances in our bank accounts.
(ii) Liabilities and legal proceedings
Our potential legal liabilities resulting from the dam failure are significant, and we cannot estimate the total amount at this time. We are already the subject of several investigations and legal proceedings relating to the failure of Dam I, and we expect to face other investigations and proceedings. For additional information regarding the legal proceedings relating to the failure of Dam I, seeAdditional Information—Legal proceedings. We will continue to cooperate fully with the authorities and to support the investigations into the dam failure. We will also contest any actions that we believe are unjustified.
| | | | |
| | 4 | | |
Business Overview
The proceedings are all in very early stages, and we cannot reasonably estimate the size of potential losses or settlements or the timing for decisions. We estimate that we will recognize provisions in our financial statements for the first quarter of 2019 in the amount of R$850 million (US$220 million) in connection with an ongoing public civil action brought by labor prosecutors and provisions ranging from R$1.0 billion to R$2.0 billion (US$260 million to US$520 million) in connection with our preliminary agreement with the State of Minas Gerais and other authorities. Our potential liabilities resulting from the dam failure are significant, and additional provisions are expected.
(iii) Suspension of operations
Following the dam failure, we have suspended various operations, either voluntarily or as a result of revocation of licenses or court orders. As of April 15, 2019, the estimated impact of the suspension of operations following the dam failure on our production is 92.8 million metric tons per year (including the estimated annual impact of the suspension of the Brucutu mine). Additional operations may be suspended as a result of new laws and regulations relating to the use of dams, or our inability to obtain the required licenses or the stability reports required by applicable regulations, as discussed below.
Below is a summary of operations suspended since the date of the dam failure.
(iv) New regulations
Various governmental authorities have approved or proposed new regulations relating to licensing, use and operations of dams in response to the Dam I failure. Additional rules imposing restrictions on mining operations and ancillary activities are expected. Also, new taxes, contributions or other obligations may be imposed on us as a result of the failure of Dam I or its direct or indirect impacts. These rules may affect not only our iron ore operations, but also our base metals operations in Brazil and other operations that rely on dams.
| | | | |
| | 5 | | |
Business Overview
2022. The statute also prohibits the increase, modification or construction of any dam if communities are established within its Self-Rescue Zone (Zona de Autossalvamento or "ZAS"), an area which encompasses the portion of the valley downstream of the dam where timely evacuation and intervention by the competent authorities in emergency situations is not possible. Although this statute permits the construction of new dams and the use of existing dams built using other techniques, it imposes significant restrictions on them as well. As a result, we may not be able to rely on tailings dams for new projects and expansion of existing operations.
As a result of new regulations, the licensing process for our operations may become longer and more uncertain, and our costs of monitoring and compliance are expected to increase. These additional laws and regulations may impose restrictions on our operations, require additional investments or eventually require us to suspend additional operations.
We will need to rely on alternative methods to continue operating certain of our mines and plants, particularly those that rely on tailings dams. We have studies in progress, and we have developed a pilot project, to apply a waste disposal technology that consists of filtering and stacking of partially or totally dewatered tailings, which will reduce our reliance on tailings dams in the medium and long term. These alternative technologies will cause an increase in our production costs and require additional investments in our mines and plants.
(v) Impact on reserves
As a result of the dam failure and our decision to accelerate the decommissioning of our upstream tailings dams, we are not in a position to report reserves for the Feijão, Jangada and Capim Branco mines (in the Paraopeba complex).
We are reviewing the impact on our reported reserves of the ongoing investigations and legal proceedings involving the use of dams in our mining operations and of the new rules relating to licensing, use and operations of dams, which were adopted in response to the Dam I failure. These proceedings and regulations may impact our iron ore reserves and reserves for other products for which the production process involves dams. Because alternative methods are available, particularly the dry stockpiling and dry processing technologies, we currently believe that our iron ore reserves will not be materially impacted by these new rules, but we have not concluded our analysis.
(vi) Uncertainties arising from increased safety requirements and external expert certification
Brazilian state and federal authorities are strengthening regulations on dam safety. Many regulations applicable to our mines require us to obtain independent reports and certificates from external experts on the safety and stability of our dams. External experts may be unwilling to provide these reports and certificates as a result of the uncertainties regarding the causes of the Dam I failure, the increasing risk of liability and uncertainties about interpretation of new regulations. If any of our dams is unable to comply
| | | | |
| | 6 | | |
Business Overview
with safety requirements, we may need to evacuate the area surrounding this dam, relocate communities and take other emergency actions.
(vii) Impacts on our financial performance and results of operations
We expect the failure of Dam I, and the consequences summarized above, to have extensive impact on our financial performance and results of operations. We have not yet determined the nature and amount of all the consequences. SeeOperating and financial review and prospects—Impact of the failure of Dam I at the Córrego do Feijão Mine. These will include:
| | | | |
| | 7 | | |
Business Overview
We may also need to incur additional debt to pay for assistance and remediation actions.
Temporary leave of executive officers
On March 1, 2019, our Board of Directors received a formal recommendation from the federal and state (Minas Gerais) public prosecution offices, the federal police and the civil police of Minas Gerais that we suspend certain of our employees and executive officers. In response to this recommendation, our CEO, Fabio Schvartsman, and our executive officer for Ferrous Minerals and Coal, Gerd Peter Poppinga, requested temporary leave from their positions. Our Board of Directors approved these requests on March 2, 2019, and appointed Eduardo de Salles Bartolomeo as interim chief executive officer and Claudio de Oliveira Alves as interim executive officer for Ferrous Minerals and Coal. Mark James Travers has been appointed executive officer for Base Metals, subject to obtaining the requisite visa and relocating to Brazil, as required under Brazilian law.
OPERATIONAL SUMMARY
The following table presents the breakdown of total net operating revenues attributable to each of our lines of business ofwith continuing operations.
| | | Year ended December 31, | | Year ended December 31, | | ||||||||||||||||||||||||||
|---|---|---|---|---|---|---|---|---|---|---|---|---|---|---|---|---|---|---|---|---|---|---|---|---|---|---|---|---|---|---|---|
| | | 2014 | | 2015 | | 2016 | | 2016 | | 2017 | | 2018 | | ||||||||||||||||||
| | | US$ million | | % of total | | US$ million | | % of total | | US$ million | | % of total | | (US$ million) | | (% of total) | | (US$ million) | | (% of total) | | (US$ million) | | (% of total) | | ||||||
Ferrous minerals: | | | | | | | | | | | | | | | | | | | | ||||||||||||
Iron ore | | 19,301 | | 55.0% | | 12,330 | | 52.7% | | 15,784 | | 57.4% | | 15,784 | | | 57.4 | % | | 18,524 | | | 54.5 | % | | 20,354 | | | 55.7 | % | |
Pellets | | 5,263 | | 15.0 | | 3,600 | | 15.4 | | 3,827 | | 13.9 | | 3,827 | | | 13.9 | | | 5,653 | | | 16.7 | | | 6,651 | | | 18.2 | | |
Ferroalloys and manganese | | 392 | | 1.1 | | 162 | | 0.7 | | 302 | | 1.1 | | 302 | | | 1.1 | | | 469 | | | 1.4 | | | 454 | | | 1.2 | | |
Other ferrous products and services | | 741 | | 2.1 | | 470 | | 2.0 | | 438 | | 1.6 | | 438 | | | 1.6 | | | 483 | | | 1.4 | | | 474 | | | 1.3 | | |
| | | | | | | | | | | | | | | | | | | | | | | | | | | ||||||
Subtotal | | 25,697 | | 73.2 | | 16,562 | | 70.8 | | 20,351 | | 74.0 | | 20,351 | | | 74.0 | | | 25,129 | | | 74.0 | | | 27,933 | | | 76.4 | | |
| | | | | | | | | | | | | | | | | | | | | | | | | | | ||||||
Coal | | 739 | | 2.1 | | 526 | | 2.3 | | 839 | | 3.1 | | 839 | | | 3.1 | | | 1,567 | | | 4.6 | | | 1,643 | | | 4.5 | | |
Base metals: Nickel and other products(1) | | 6,241 | | 17.8 | | 4,693 | | 20.1 | | 4,472 | | 16.3 | |||||||||||||||||||
Base metals: | | | | | | | | | | | | | | ||||||||||||||||||
Nickel and other products(1) | | 4,472 | | | 16.3 | | | 4,667 | | | 13.7 | | | 4,610 | | | 12.6 | | | ||||||||||||
Copper(2) | | 1,451 | | 4.1 | | 1,470 | | 6.3 | | 1,667 | | 6.0 | | 1,667 | | | 6.1 | | | 2,204 | | | 6.5 | | | 2,093 | | | 5.7 | | |
| | | | | | | | | | | | | | | | | | | | | | | | | | | ||||||
Subtotal | | 7,692 | | 21.9 | | 6,163 | | 26.4 | | 6,139 | | 22.3 | | 6,139 | | | 22.3 | | | 6,871 | | | 20.2 | | | 6,703 | | | 18.3 | | |
| | | | | | | | | | | | | | | | | | | | | | | | | | | ||||||
Other(3) | | 996 | | 2.8 | | 133 | | 0.5 | | 159 | | 0.6 | | 159 | | | 0.6 | | | 400 | | | 1.2 | | | 296 | | | 0.8 | | |
| | | | | | | | | | | | | | | | | | | | | | | | | | | ||||||
Total net operating revenues from continuing operations | | 35,124 | | 100.0% | | 23,384 | | 100.0% | | 27,488 | | 100.0% | | 27,488 | | | 100 | % | | 33,967 | | | 100 | % | | 36,575 | | | 100 | % | |
| | | | | | | | | | | | | | | | | | | | | | | | | | | | |||||
| | | | | | | | | | | | | | | | | | | | | | | | | | | ||||||
Ferrous minerals:
| | | | |
| | 8 | | |
Business Overview
suspended), and two in Oman. The operations of three of our pellet plants in Brazil have been suspended since 2012 in response to market conditions, and their capacity was partially replaced by Tubarão VIII, a more efficient plant. In response to market conditions, we plan to re-start operations at one of our pellet plants in 2018. We also have a 50% stake in Samarco Mineração S.A. ("Samarco") and 25% stakes in two pellet companies in China.
Base metals:
Coal:
Logistics infrastructure:
| | | | |
| | 9 | | |
Business strategyOverview
BUSINESS STRATEGY
Our missionThe year of 2019 has been a very challenging year for us. We know that there is much to transform natural resources into prosperitybe done to address the effects of the failure of the tailings dam at the Córrego do Feijão mine. We are committed to remediating the damages caused to the city of Brumadinho and sustainable development. In all of our lines of business,the surrounding communities. We will manage the liabilities arising from this deeply regretted event, and we are committed to learning and sharing the lessons from the dam failure. With this purpose, we are dedicated to:
Below are the highlights of our major business strategies.
Commitment to sustainabilityKeeping our people and communities safe and restoring trust from our stakeholders
We are fully committed in addressing the effects of the failure of Dam I at the Feijão mine, with three key initiatives: (i) assistance to victims and recovery of the area affected by the rupture of the dam, (ii) determination of the causes of the dam failure, and (iii) prevention of further accidents through adoption of the highest standards and accelerated decommissioning of all upstream dams. SeeBusiness overview—Failure of the tailings dam at the Córrego do Feijão mine. We continue making every effort to provide relief and support to those affected by the dam failure and to restore the trust of our stakeholders on us. We are committed to promoting sustainable development,rebuilding our reputation in Brazil and in the global mining industry.
Capital discipline
We reiterate our strong commitment to a sound balance sheet. In 2018, we completed our deleveraging process and achieved our net debt target of US$10 billion. We will allocate capital in a disciplined way, which means generating value forwill be key to enable us to address the effects of Dam I failure. In January 2019, our shareholders and other stakeholders, and simultaneously improving health and safetyBoard of Directors approved the suspension of our workers, enhancingshareholder remuneration policy, so that no payment of dividends or interest on shareholders' equity will be made pursuant to this policy in excess of mandatory payments required by law, and we will not approve any share buyback for the well-being of the communities surrounding our operations and protecting the environment. This can be achieved through conscious and responsible management, corporate voluntary actions and cross-sectorial partnerships. Below is a list of measures illustrating our commitment to sustainability:time being.
Disciplined capital managementMaintaining our value over volume approach for the iron ore business
In all of our lines of businesses,the iron ore business, we are committed to investingdelivering the highest possible margins under the current circumstances, by managing our extensive supply chain and flexible product portfolio to cope with production constraints in world-class assets, with long life, low cost, potentialthe short-term. We will constantly seek better price realization, based on adjustments to expand and high quality output, capable of creating value through different economic cycles. We exercise disciplined capital management and maintaining a low cost structure. The preservation of our credit ratings and reduction of our debt leverage are also among our key commitments. In the past years, we suspended operations of assets in responseproduct portfolio according to market conditionsdemand and disposed of assets that we have determined to be non-strategic or in order to optimize the structure of our business portfolio. The divestiture of assets improves capital allocation and unlocks funds to finance the execution of top priority projects and to manage our liquidity.
Improving our competitiveness in the global iron ore market
supply chain optimization. We are committed to improving our competitiveness in the global iron ore market, by focusing our product line to capture industry trends, improving quality and productivity, controlling costs, strengthening our logistics infrastructure of railroads, ports, shipping and distribution centers, and
| | | | |
| | 10 | | |
Business Overview
strengthening relationships with customers. Our diversified portfolio of high qualityhigh-quality products, strong technical marketing strategy, efficient logistics and long-standing relationships with major customers will help us overcome the immediate challenges and achieve this goal.
With the continuous increase of the share of dry processing production, from 45% in 2014 to 60% in 2018, and aimed at 70% by 2023, our reliance on new dams and dam raisings tend to reduce. To treat the tailings from wet processing, we are investing in studies and new technologies with a view to allowing us to operate certain of our mines and plants without having to rely on the use of tailings dams. In particular, we have studies in progress, and we have developed a pilot project, to apply a waste disposal technology that consists of filtering and stacking of partially or totally dewatered tailings, which will reduce our reliance on tailings dams in the medium and long term. These alternative technologies will cause an increase in our production costs and require additional investments in our mines and plants. In line with this goal, we acquired New Steel in January 2019, bringing innovative technologies for the dry beneficiation of iron ore.
We will continue to promote the Brazilian blend fines (BRBF), a product resulting fromstandard with silica (SiO2) content limited to 5% and lower alumina (1.5%), offering strong performance in any kind of sintering operation. We produce BRBF by blending fines from Carajás, which contain a higher concentration of iron and a lower concentration of silica in the ore, with fines from the Southern and Southeastern Systems, which contain a lower concentration of iron in the ore. The resulting blend offers strong performance in any kindore, but also low concentration of sintering operation.alumina. It is blended and soldproduced in our Teluk Rubiah Maritime Terminal in Malaysia and in five distribution centerssixteen ports in China, whichChina. This process reduces the time needed to reach Asian markets and increases our distribution capillarity by allowing the use of smaller vessels. The blending strategy also permits the use of iron ore with lower concentration particularly from the Southern System,and Southeastern Systems, allowing more efficient mining plans and increasesincreasing the use of dry processing methods, which in turn reduce capital expenditures, expandextend the life of our mines and reduce the use of water in our operations.operations: a key flexibility to cope with the short-term challenges.
EnhancingTransforming our logistics capacity to support our iron ore and coal businessesbase metals business into a significant cash generator
We have been expanding the capacity of our railroads and ports, entering into long term affreightment agreements and developing distribution centers in Asia to meet the logistics needs of our iron ore and coal businesses.
Maximizing value in the nickel and copper businesses
electric vehicle revolution. We are the world's largest nickel producer, with large-scale, long-life and low-cost operations, a substantial resource base and diversified mining operations that produce nickel from nickel sulfidessulfide and lateriteslaterite sources using advanced technology.
We have processing facilitiestransitioned to a smaller footprint in North America, Europe, Asia, Brazil,our nickel business by calibrating investments and production to reflect current market conditions, and our nickel turnaround plan is now based on three pillars: supply chain integration, operational excellence and digital transformation. In Canada, we are optimizing the flowsheet, running a cost reduction program and improving underground mine performance at Sudbury and finalizing the ramp-up of operations at Long Harbour. In Indonesia, we are renewing truck and mine equipment, increasing efficiency of the furnaces and increasing fuel efficiency through coal conversion. In New Caledonia, we are developing a mine plan revision and Indonesia, which produce an arraya study to increase efficiency of products for use in most nickel applications. We are a leading producer of high-quality nickel products for non-stainless steel applications, such as plating, alloy steels, high nickel alloys and batteries, which represented 58% of our refined nickel sales in 2016. Our goal is to strengthen our competitiveness in the nickel business.VNC plant. In the long-term,long term, the battery segment shows an important upside potential as electric vehicle production continues to attract significant investments, which could positively impactaffect nickel price and our nickel premiums. We continue to optimize our operations and to review our asset utilization aiming to increase productivity and improve returns.
We produce copper concentrates from our Sossego and Salobo facilities located in the Carajás region. These copper mines benefit from our infrastructure facilities serving the Northern System. The gold we produce at Sossego and Salobo increases the total aggregated value of those operations. A key aspect of our strategy for our copper assets in the Carajás region is to improve our efficiency and asset utilization while evaluatingwe evaluate opportunities to extend our operations at Sossego and expand Salobo.increase copper production. We also producehave plans to develop a multi-year copper as a coproductexpansion plan, with Salobo III being the first approved project in our nickel operations, principally at Sudbury and Voisey's Bay, in Canada.the pipeline.
| | | | |
| | 11 | | |
Business Overview
ImprovingConcluding the ramp-up of our coal business
We have coal operations in Moatize (Mozambique), and we hold a minority interest in a joint venture in China. We intendbeen working to increase our coal production, mainly through the expansionramp-up of a new coal handling processing plant (CHPP) of coal in the Moatize operations in Mozambique and the ramp-up of the Nacala Logistics Corridor (NLC) in Mozambique and Malawi, where we have entered into a strategic partnership with Mitsui. As we complete the ramp-up of our new CHPP in Moatize and the Nacala Logistics Corridor,NLC, we expect our costs are expected to reduce,diminish, enhancing the competitiveness of our coal operations. Key initiatives, such as knowledge transfer from our iron ore operations, opening of new mine sections and preparation of selected mining pits for future disposals are expected to lead to higher capacity utilization, mine productivity and yields.
Developing our resource baseEnhancing corporate governance
We are taking advantagecommitted to continuing to improve our corporate governance. Following the conversion of our global presenceclass A preferred shares into common shares, in December 2017, we completed our listing on the Novo Mercado segment of the B3 exchange (formerly BM&FBovespa), the special listing segment of B3 for companies committed to develop mineral exploration initiatives. We conduct brownfield explorationthe highest standards of corporate governance. In 2018, our Board of Directors revised some of our policies, including our Corporate Integrity Policy, Code of Ethical Conduct, Socio-Environmental Investment Policy, Risk Management Policy, Remuneration to maximize results from existing mining areasShareholders Policy and to support both projects and operations. We conductSecurities Trading Policy.
In 2018, as required under Brazilian rules, we started reporting our greenfield exploration activities in six countries, which are Brazil, Peru, Chile, Canada, Australia and Indonesia. In particular, we seek to identify opportunities and develop depositscompliance with the potentialCode of Best Practices for large scale production at low cost. Our exploration activities are focusedCorporate Governance of the Brazilian Corporate Governance Institute (IBGC). The code is based on iron ore, nickelthe "comply or explain" principle, and copper.
Optimizing our energy matrix
As a large consumerwe currently fully comply with 80% of electricity, we have invested in power generation projects to support our operationsthe practices recommended by the IBGC and to reduce our exposure topartially comply with 17% of practices recommended by the volatility of energy prices and regulatory uncertainties. Accordingly, we have developed hydroelectric power generation plants in Brazil, Canada and Indonesia, and 50% of our worldwide electricity needs come from our own plants. We are seeking to develop a clean energy mix by focusing on reducing our carbon footprint.code.
Significant changes in our businessSIGNIFICANT CHANGES IN OUR BUSINESS
We summarize below major events related to our organic growth,acquisitions, divestitures acquisitions and other significant developments in our business since the beginning of 2016.2018.
Organic growthAcquisitions
We have an extensive program of investments in the organic growth of our businesses. Our main investment projects are summarized under —Capital expenditures. The most significant projects that have come on stream since the beginning of 2016 are summarized below:
Dispositions and asset sales
We are always seeking to optimize the structure of our portfolio of businesses in order to achieve the most efficient allocation of capital. We summarize below our most significant dispositions since the beginning of 2016.2018.
| | | | |
| | 12 | | |
Business Overview
Project Financing for the CubatãoNacala Logistics Corridor
We have a partnership with Mitsui in coal assets in 2017.Mozambique. In February 2018, we concluded the agreements for a project financing for the Nacala Logistics Corridor, which connects the Moatize coal mine to the Nacala-à-Velha maritime terminal, located in Nacala, Mozambique, in the total amount of US$2.730 billion, as follows:
Vale received US$2.6 billion in proceeds, in repayment of certain shareholders loans provided for construction of NLC, net of certain commissions paid by NLC. The project financing will be repaid in 14 years with the proceeds obtained from the tariff charged by NLC in connection with its provision of coal transportation services.
| | | | |
| | 13 | | |
Sale of gold stream from Salobo copper mine—Business Overview
Partnership in coal assets in Mozambique
In September 2016, we agreed with Mitsui the new terms of our partnership in coal assets in Mozambique. Under these new terms, Mitsui agreed to pay us an amount of up to US$450 million, consisting of: (i) a fixed payment of US$255 million for 15% of our 95% stake in the Moatize coal mine and (ii) an additional amount of up to US$195 million, subject to certain conditions, including mine performance. Mitsui will also contribute an amount of approximately US$348 million for 50% of our 70% stake in the Nacala Logistics Corridor and extend a long-term facility of US$165 million to Nacala Logistics Corridor. We completed the equity transaction with Mitsui on March 27, 2017. The total value of the transaction will be approximately US$770 million, including all amounts mentioned above except the additional amount of up to US$195 million, which is subject to certain conditions still to be satisfied. From these US$770 million, we received US$733 million upon completion of the equity transaction on March 27, 2017, and expect to receive the remainder upon closing of the project financing, which is expected to occur during 2017. If the project financing is not signed before the end of 2017, Mitsui has certain rights to transfer its participation in the Moatize coal mine and the Nacala Logistics Corridor back to us. SeeLines of Business—Infrastructure—Railroads.
Obtaining environmental licenses for the S11D project in Carajás
In December 2016, we obtained the operational environmental license for the S11D project located in Carajás, Brazil. This license is a key step in the process of expanding our iron ore production and improving our competitiveness in the iron ore business.
Optimizing our base metals operations in Canada
We plan to optimizehave optimized our nickel operations across Canada, as part of an overall strategy to prioritize value over volume, reduce our atmospheric emissions and comply with local regulations. Our goal is to concentrate our refining and smelting activities in Sudbury, whereIn 2018, we will focus on the production of copper concentrate, copper matte and refined nickel. In Long Harbour we will produce nickel rounds, copper cathode and cobalt metal. We will phasephased out our smelting and refining activities in Thompson, where we will focusfocusing our operations on nickel concentrate production. The concentrate is then shipped to our Sudbury operation to be further processed. In Sudbury, we produce copper concentrate, copper matte, copper cathodes and refined nickel. In Long Harbour, we produce nickel rounds, copper cathodes and cobalt rounds. We successfully blended nickel intermediates from Sudbury and Asia in our refinery in Wales to make higher premium products.
We will now turn our focus to the optimization of the mining assets to ensure a sustainable and value-accretive ore supply to our three concentrators in Canada:
FailureCobalt streaming transaction
In June 2018, we sold to Wheaton Precious Metals Corp. (Wheaton) and Cobalt 27 Capital Corp. (Cobalt 27) a combined 75% of Samarco's tailings damthe cobalt produced as a byproduct at our Voisey's Bay mine from January 1, 2021, which includes the ramp-down of production from the existing mine and the life-of-mine production from our underground mine expansion project. In consideration, we received US$690 million in Minas Geraiscash from Wheaton and Cobalt 27 upon closing of the transaction on June 28, 2018, and will receive additional payments of 20%, on average, of cobalt prices upon delivery. We remain exposed to approximately 40% of future cobalt production from Voisey's Bay, through our retained interest in 25% of cobalt production and the additional payments upon delivery. These transactions enabled the development of the Voisey's Bay underground mine extension project, which will extend the mine life of Voisey's Bay.
Samarco's dam failureResumption of operations of São Luis and Tubarão I and II pellet plants
OnIn 2018, we resumed the operations of our Tubarão I, Tubarão II and São Luis pellet plants. The operations of these plants had been suspended since 2012 due to market conditions.
| | | | |
| | 14 | | |
Business Overview
FAILURE OF SAMARCO'S TAILINGS DAM IN MINAS GERAIS
In November 5, 2015, the Fundão tailings dams owned by Samarco S.A. failed, releasing tailings downstream, reaching and flooding certain communities and causing impacts on communities and the environment along the Rio Doce river. The failure resulted in 19 fatalities and caused property and environmental damage to the affected areas.
After the dam failure, Samarco together with the public authorities, provided first aid, food, water, housing, social assistance and financial aid to the affected families and individuals, and both Vale and BHPB, Samarco's shareholders, have been actively involved in supporting Samarco during this period. In addition to these emergency actions, Samarco has been monitoring the affected area, performing emergency work to contain any movement of tailings, reinforcing the structures of its dams and dikes to ensure the safety of the region and mitigating the environmental and social impacts of the event. Samarco continues to reinforce and improve the structures of its dams to contain the remaining tailings.
Impact of dam failure on our and Samarco's operations
Our operation in the Mariana mining complex, near Samarco's mining area, was also negatively impacted by the failure of Samarco's tailings dam. A major conveyor belt connecting our Fábrica Nova mine to our Timbopeba beneficiation plant was damaged, and the Alegria mine is operating with a dry beneficiation process.
Following the dam failure, governmental authorities ordered the suspension of Samarco's operations. With the exception of the Fundão tailings dam and the Santarém water dam, which was impacted by the overflow of tailings from the Fundão dam, all other production assetsjoint venture equally owned by Samarco were undamaged. Samarco's management is working on a plan that would permit it to resume operationsVale S.A. and provide a long-term solution for the disposal of tailings. The feasibility, timing and scope of measures necessary to resume Samarco's operations remain uncertain.BHP Billiton Brasil Ltda. ("BHPB").
In December 2016, we entered into a non-binding term sheet outlining the general terms and conditions to permit Samarco, upon its eventual resumption of operations, to deposit its tailings in our Timbopeba pit. A definitive agreement is being negotiated and is subject to due diligence and governmental approvals. The use of the Timbopeba pit may allow Samarco to operate for several years without a new tailings structure.
The Framework Agreement and the agreements with the MPF
In MarchJune 2016, Samarco and its shareholders (Vale and BHPB) created the Fundação Renova, a not-for-profit private foundation, to develop and implement (i) social and economic remediation and compensation programs and (ii) environmental remediation and compensation programs in the region affected by the dam failure.
The creation of Fundação Renova was provided for under the agreement for settlement and conduct adjustment (the "Framework Agreement") signed in March 2016 by Vale, S.A. and BHPB, entered into the Framework Agreement withSamarco, the Brazilian federal government, the two Brazilian states affected by the failure (Espí(Minas Gerais and Espírito Santo and Minas Gerais)Santo) and other governmental authorities in order to implement programs for remediation and compensation of the areas and communities affected by Samarco's dam failure.authorities. The Framework Agreement has a 15-year term, renewable for successive one-year periods until all the obligations under the Framework Agreement have been performed. The Framework Agreement does not provide for admission of civil, criminal or administrative liability for the Fundão dam failure. The Framework Agreement provides that, within three years of the date of the agreement, the parties would review its terms to assessing the effectiveness of the ongoing remediation and compensation activities.
InOn June 2016,25, 2018, Samarco, Vale S.A. and BHPB createdentered into a comprehensive agreement with the offices of the federal and state (Minas Gerais and Espírito Santo) prosecutors, public defenders and attorney general, among other parties, improving the governance mechanism of Fundação Renova Foundationand establishing, among other things, a process for potential revisions to developthe remediation programs provided under the Framework Agreement based on the findings of experts hired by Samarco to advise the MPF (Federal Prosecutor's Office) over a two-year period (the "June 2018 Agreement"). SeeAdditional information—Legal proceedings.
Under the Framework Agreement and implementthe June 2018 Agreement, Fundação Renova must be funded by Samarco, but to the extent that Samarco is unable to fund, Vale and BHPB must ratably bear the funding requirements under the Framework Agreement. As Samarco is currently unable to resume its activities, we and BHPB have been funding the Fundação Renova and also providing funds directly to Samarco, to preserve its operations and to support Samarco's funding obligations. At this point, we cannot predict when Samarco will resume its operations.
Pursuant to the Framework Agreement, Fundação Renova and Samarco allocated R$2.1 billion to social and economic remediation and compensation pursuantprograms in 2018 and have allocated R$5.3 billion to these programs since the Framework Agreement. The foundation must be funded by Samarco according to the following schedule: R$2.0 billion (US$614 million) in 2016, R$1.2 billion (US$368 million) in 2017 and R$1.2 billion (US$368 million) in 2018.dam failure. From 2019 to 2021, Samarco, agreedor Vale and BHP, will provide to provideFundação Renova funding based on the amounts needed to implement the projects approved for the relevanteach year, subject to an annual minimum of R$800 million (US$245 million) and an annual maximum of R$1.6 billion (US$491 million).billion. Starting in 2022, Samarco will provide the necessary funding in order to complete remaining programs approved for each year. The foundation will
Additionally, Fundação Renova must allocate ana minimum annual amount of R$240 million (US$74 million) over 15 years (from 2016) to the implementation of compensation programs, and these annual amounts are included inprograms. Under the annual contributions described above forterms of the first six years. Through the endFramework Agreement, Fundação Renova must spend an additional amount of 2018,at least R$500 million (US$153 million) will be provided foron sewage collection and treatment and solid waste disposal under the termsdisposal.
For a discussion of the Framework Agreement.legal proceedings resulting from the failure of Samarco's tailings dam, seeAdditional information—Legal proceedings.
| | | | |
| | 15 | | |
The tables below present selected consolidated financial information as of and for the periods indicated. You should read this information together with our consolidated financial statements in this annual report.
Consolidated statement of income data
| | | For the year ended December 31, | | ||||||||||||||||||
|---|---|---|---|---|---|---|---|---|---|---|---|---|---|---|---|---|---|---|---|---|---|
| | | 2014 | | 2015 | | 2016 | | 2017 | | 2018 | | ||||||||||
| | | (US$ million) | | ||||||||||||||||||
| Net operating revenues | | 35,124 | | | 23,384 | | | 27,488 | | | 33,967 | | | 36,575 | | | |||||
| Cost of goods sold and services rendered | | (22,790 | ) | | (18,751 | ) | | (17,650 | ) | | (21,039 | ) | | (22,109 | ) | | |||||
| Selling, general, administrative and other operating expenses, net | | (2,059 | ) | | (819 | ) | | (774 | ) | | (951 | ) | | (968 | ) | | |||||
| Research and evaluation expenses | | (662 | ) | | (395 | ) | | (319 | ) | | (340 | ) | | (373 | ) | | |||||
| Pre-operating and operational stoppage | | (975 | ) | | (942 | ) | | (453 | ) | | (413 | ) | | (271 | ) | | |||||
| Impairment and other results on non-current assets | | (266 | ) | | (8,708 | ) | | (1,240 | ) | | (294 | ) | | (899 | ) | | |||||
| | | | | | | | | | | | | ||||||||||
| Operating income (loss) | | 8,372 | | | (6,231 | ) | | 7,052 | | | 10,930 | | | 11,955 | | | |||||
| Non-operating income (expenses): | | | | | | | | | | | | ||||||||||
| Financial income (expenses), net | | (6,018 | ) | | (10,654 | ) | | 1,843 | | | (3,019 | ) | | (4,957 | ) | | |||||
| Equity results and other results in associates and joint ventures | | 440 | | | (794 | ) | | (911 | ) | | (82 | ) | | (182 | ) | | |||||
| | | | | | | | | | | | | ||||||||||
| Net income (loss) before income taxes | | 2,794 | | | (17,679 | ) | | 7,984 | | | 7,829 | | | 6,816 | | | |||||
| Income taxes | | (1,603 | ) | | 5,249 | | | (2,781 | ) | | (1,495 | ) | | 172 | | | |||||
| | | | | | | | | | | | | ||||||||||
| Net income (loss) from continuing operations | | 1,191 | | | (12,430 | ) | | 5,203 | | | 6,334 | | | 6,988 | | | |||||
| Net income (loss) attributable to non-controlling interests | | (308 | ) | | (501 | ) | | (8 | ) | | 21 | | | 36 | | | |||||
| | | | | | | | | | | | | ||||||||||
| Net income (loss) from continuing operations attributable to Vale's stockholders | | 1,499 | | | (11,929 | ) | | 5,211 | | | 6,313 | | | 6,952 | | | |||||
| | | | | | | | | | | | | ||||||||||
| Net income (loss) from discontinued operations attributable to Vale's stockholders | | (842 | ) | | (200 | ) | | (1,229 | ) | | (806 | ) | | (92 | ) | | |||||
| Net income (loss) attributable to Vale's stockholders | | 657 | | | (12,129 | ) | | 3,982 | | | 5,507 | | | 6,860 | | | |||||
| | | | | | | | | | | | | ||||||||||
| | | | | | | | | | | | | | | | | | |||||
| | | | | | | | | | | | | ||||||||||
| Net income (loss)attributable to non-controlling interests | | (304 | ) | | (491 | ) | | (6 | ) | | 14 | | | 36 | | | |||||
| | | | | | | | | | | | | ||||||||||
| Net income (loss) | | 353 | | | (12,620 | ) | | 3,976 | | | 5,521 | | | 6,896 | | | |||||
| | | | | | | | | | | | | ||||||||||
| Total cash paid to stockholders(1) | | 4,200 | | | 1,500 | | | 250 | | | 1,456 | | | 3,313 | | | |||||
Earnings (loss) per share
The table below shows our earnings (loss) per share. The earnings (loss) per share for 2014 to 2016 have been retrospectively adjusted to reflect the conversion of our Class A preferred shares into common shares, which was concluded in November 2017, as if the conversion had occurred at the beginning of the earliest year presented.
| | | For the year ended December 31, | | ||||||||||||||||||
|---|---|---|---|---|---|---|---|---|---|---|---|---|---|---|---|---|---|---|---|---|---|
| | | 2014 | | 2015 | | 2016 | | 2017 | | 2018 | | ||||||||||
| | | (US$, except as noted) | | ||||||||||||||||||
| Earnings (loss) per common share from continuing operations | | 0.29 | | | (2.30 | ) | | 1.00 | | | 1.21 | | | 1.34 | | | |||||
| Earnings (loss) per common share from discontinued operations | | (0.16 | ) | | (0.03 | ) | | (0.23 | ) | | (0.16 | ) | | (0.02 | ) | | |||||
| | | | | | | | | | | | | ||||||||||
| Earnings (loss) per common share | | 0.13 | | | (2.33 | ) | | 0.77 | | | 1.05 | | | 1.32 | | | |||||
| | | | | | | | | | | | | ||||||||||
| | | | | | | | | | | | | | | | | | |||||
| | | | | | | | | | | | | ||||||||||
| Weighted average number of shares outstanding (in thousands)(1)(2) | | 5,197,432 | | | 5,197,432 | | | 5,197,432 | | | 5,197,432 | | | 5,182,445 | | | |||||
| | | | | | | | | | | | | ||||||||||
| | | | | | | | | | | | | | | | | | |||||
| | | | | | | | | | | | | ||||||||||
| Distributions to stockholders per share(2)(3) | | | | | | | | | | | | ||||||||||
Expressed in US$ | | 0.81 | | | 0.29 | | | 0.05 | | | 0.28 | | | 0.64 | | | |||||
Expressed in R$ | | 1.89 | | | 0.98 | | | 0.17 | | | 0.90 | | | 2.39 | | | |||||
| | | | |
| | 16 | | |
In January 2017, Samarco, Vale and BHPB entered into two preliminary agreements with the MPF in connection with the pending public civil actions brought by the Brazilian Government and others and the public civil action brought by the MPF, which are described underAdditional information—Legal proceedingsSelected Financial Data
In March 2017, the court partially ratified the first agreement, pending the appointment of an expert and conclusion of the final agreement. We expect the Framework Agreement and the agreements with the MPF to be a first step towards the settlement of these actions. Any final settlement of these actions is subject to approval by the court.
Impact of the failure of Samarco's tailings dam in our financial statements
For a discussion of the impact of the failure of Samarco's tailings dam in our financial statements, seeOperating and financial review and prospects—Failure of Samarco's tailing dams.
Reorganization of our shareholding structure and share ownership by controlling shareholders
Pursuant to the new shareholders' agreement entered into by certain shareholders of Valepar, our controlling shareholder, on February 19, 2017, Valepar is expected to make a proposal to simplify our shareholding structure and corporate governance, with the purpose of eventually enabling Vale to be listed on BM&FBOVESPA'sNovo Mercadospecial segment and making Vale a company without defined control. This proposal is composed of a series of indivisible and interdependent steps, and is subject to approval by our shareholders and the executive officers and board of directors of Vale and Valepar. The proposal contemplates (i) the voluntary conversion of at least 54.09% of our class A preferred shares into common shares, (ii) the amendment of our bylaws to adjust them, to the extent possible, toNovo Mercadorules, and (iii) the merger of Valepar into Vale. Subsequently, certain former shareholders of Valepar will enter into a new shareholders' agreement at the Vale level. Our eventual migration to theNovo Mercadosegment of the BM&FBOVESPA is also subject to conversion of all of our preferred shares into common shares. For a description of our ownership structure and the proposed changes to the Valepar shareholders' agreements pursuant to the Proposal, seeShare ownership and trading—Major shareholders.Balance sheet data
| | | As of December 31, | | ||||||||||||||||||
|---|---|---|---|---|---|---|---|---|---|---|---|---|---|---|---|---|---|---|---|---|---|
| | | 2014 | | 2015 | | 2016 | | 2017 | | 2018 | | ||||||||||
| | | (US$ million) | | ||||||||||||||||||
| Current assets | | 16,594 | | | 11,429 | | | 13,978 | | | 15,367 | | | 15,292 | | | |||||
| Non-current assets held for sale | | 3,640 | | | 4,044 | | | 8,589 | | | 3,587 | | | – | | | |||||
| Property, plant and equipment, net and intangible assets | | 84,942 | | | 59,426 | | | 62,290 | | | 63,371 | | | 56,347 | | | |||||
| Investments in associated companies and joint ventures | | 4,133 | | | 2,940 | | | 3,696 | | | 3,568 | | | 3,225 | | | |||||
| Non-current assets | | 7,180 | | | 10,653 | | | 10,461 | | | 13,291 | | | 13,326 | | | |||||
| | | | | | | | | | | | | ||||||||||
| Total assets | | 116,489 | | | 88,492 | | | 99,014 | | | 99,184 | | | 88,190 | | | |||||
| | | | | | | | | | | | | ||||||||||
| | | | | | | | | | | | | | | | | | |||||
| | | | | | | | | | | | | ||||||||||
| Current liabilities | | 10,626 | | | 10,438 | | | 10,142 | | | 11,935 | | | 9,111 | | | |||||
| Liabilities associated with non-current assets held for sale | | 111 | | | 107 | | | 1,090 | | | 1,179 | | | – | | | |||||
| Long-term liabilities(1) | | 22,043 | | | 15,896 | | | 19,096 | | | 20,512 | | | 19,784 | | | |||||
| Long-term debt(2) | | 27,388 | | | 26,347 | | | 27,662 | | | 20,786 | | | 14,463 | | | |||||
| | | | | | | | | | | | | ||||||||||
| Total liabilities | | 60,168 | | | 52,788 | | | 57,990 | | | 54,412 | | | 43,358 | | | |||||
| | | | | | | | | | | | | ||||||||||
| | | | | | | | | | | | | | | | | | |||||
| | | | | | | | | | | | | ||||||||||
| Stockholders' equity: | | | | | | | | | | | | ||||||||||
Capital stock | | 61,614 | | | 61,614 | | | 61,614 | | | 61,614 | | | 61,614 | | | |||||
| Additional paid-in capital | | (601 | ) | | (854 | ) | | (851 | ) | | (1,106 | ) | | (1,122 | ) | | |||||
| Retained earnings and revenue reserves | | (5,891 | ) | | (27,171 | ) | | (21,721 | ) | | (17,050 | ) | | (16,507 | ) | | |||||
| | | | | | | | | | | | | ||||||||||
Total Vale shareholders' equity | | 55,122 | | | 33,589 | | | 39,042 | | | 43,458 | | | 43,985 | | | |||||
| | | | | | | | | | | | | ||||||||||
| Non-controlling interests | | 1,199 | | | 2,115 | | | 1,982 | | | 1,314 | | | 847 | | | |||||
| | | | | | | | | | | | | ||||||||||
| Total stockholders' equity | | 56,321 | | | 35,704 | | | 41,024 | | | 44,772 | | | 44,832 | | | |||||
| | | | | | | | | | | | | ||||||||||
| Total liabilities and stockholders' equity | | 116,489 | | | 88,492 | | | 99,014 | | | 99,184 | | | 88,190 | | | |||||
| | | | | | | | | | | | | ||||||||||
| | | | | | | | | | | | | | | | | | |||||
| | | | | | | | | | | | | ||||||||||
| | | | |
| | 17 | | |
This annual report contains statements that may constitute forward-looking statements within the meaning of the safe harbor provisions of the U.S. Private Securities Litigation Reform Act of 1995. Many of those forward-looking statements can be identified by the use of forward-looking words such as "anticipate," "believe," "could," "expect," "should," "plan," "intend," "estimate" and "potential," among others. Those statements appear in a number of places and include statements regarding our intent, belief or current expectations with respect to:
We caution you that forward-looking statements are not guarantees of future performance and involve risks and uncertainties. Actual results may differ materially from those in forward-looking statements as a result of various factors. These risks and uncertainties include factors relating to (i) economic, political and social issues in the countries in which we operate, (ii) the global economy, (iii) commodity prices, (iv) financial and capital markets, (v) the mining and metals businesses, which are cyclical in nature, and their dependence upon global industrial production, which is also cyclical, (vi) regulation and taxation, (vii) operational incidents or accidents, and (viii) the high degree of global competition in the markets in which we operate. For additional information on factors that could cause our actual results to differ from expectations reflected in forward-looking statements, seeRisk factors. Forward-looking statements speak only as of the date they are made, and we do not undertake any obligation to update them in light of new information or future developments. All forward-looking statements attributed to us or a person acting on our behalf are expressly qualified in their entirety by this cautionary statement, and you should not place undue reliance on any forward-looking statement.
| | | | |
| | 18 | | |
RISKS RELATING TO DAM FAILURE
The failure of Dam I in Minas Gerais has adversely affected our business, financial condition and reputation, and the overall impact of the dam failure on us is still uncertain.
On January 25, 2019, Dam I failed, resulting in nearly 300 fatalities or presumed fatalities, in addition to personal, property and environmental damages. SeeBusiness Overview—Failure of the tailings dam at the Córrego do Feijão mine. The causes of the dam failure are uncertain and are being investigated by us and by several governmental authorities. This event has adversely affected our operations, but the overall impact of the dam failure is still uncertain.
| | | | |
| | 19 | | |
Risk Factors
| | | | |
| | 20 | | |
Risk Factors
The failure of a tailings dam or similar structure may cause severe damages, and the decommissioning of our upstream tailings dams may be long and costly.
We own a number of tailings dams and similar structures. In addition, we own stakes in companies that own a number of dams or similar structures, including Samarco and Mineração Rio do Norte S.A. (MRN). The failure of any of these structures could cause losses of lives and severe personal, property and environmental damages, and could have adverse effects on our business and reputation, as evidenced by the consequences of the failure of Dam I at Córrego do Feijão. SeeBusiness Overview—Failure of the tailings dam at the Córrego do Feijão mine. Some of our dams, and some of the dams owned by our investees, such as Samarco and MRN, were built using the "upstream" method, which presents specific stability risks.
Recently approved laws and regulations require us to decommission all of our upstream dams on a specified timetable. We are still determining the appropriate measures for decommissioning each upstream dam. This process will require significant expenditures, and the decommissioning process may take a long time. At this point, we cannot estimate the costs and timing for conclusion of the decommissioning process. We may not be able to conclude the decommissioning process for all of our upstream dams within the time-frame imposed by the new laws and regulations.
| | | | |
| | 21 | | |
Risk Factors
We are involved in legal proceedings that could have a material adverse effect on our business in the event of unfavorable outcomes.
We are involved in legal proceedings in which adverse parties have sought injunctions to suspend certain of our operations or claimed substantial amounts, including several legal proceedings and investigations relating to the failure of our Dam I and the failure of Samarco's Fundão tailings dam. The outcomes of these proceedings are uncertain and may materially and adversely affect our business, our liquidity and the value of the securities issued by us or our subsidiaries. SeeAdditional information—Legal proceedings.
Our obligations and potential liabilities arising from the failure of a tailings dam owned by Samarco in Minas Gerais could negatively impact our business, our financial conditions and our reputation.
In November 2015, the Fundão tailings dam owned by Samarco failed, causing fatalities and environmental damage in the surrounding area. The failure of Samarco's tailings dam has adversely affected and will continue to affect our business, and the full impact is still uncertain and cannot be estimated. Below is a discussion of the main effects of the dam failure on our business.
| | | | |
| | 22 | | |
Risk Factors
EXTERNAL RISKS
Our business is exposed to the cyclicality of global economic activity and requires significant investments of capital.
As a mining company, we are a supplier of industrial raw materials. Industrial production tends to be the most cyclical and volatile component of global economic activity, which affects demand for minerals and metals. At the same time, investment in mining requires a substantial amount of funds in order to replenish reserves, expand and maintain production capacity, build infrastructure, preserve the environment, prevent fatalities and occupational hazards and minimize social impacts. Sensitivity to industrial production, together with the need for significant long-term capital investments, are important sources of risk for our financial performance and growth prospects.
Also, we may not be able to adjust production volume in a timely or cost-efficient manner in response to changes in demand. Lower utilization of capacity during periods of weak demand may expose us to higher unit production costs since a significant portion of our cost structure is fixed in the short-term due to the capital intensity of mining operations. In addition, efforts to reduce costs during periods of weak demand could be limited by labor regulations or previous labor or government agreements. Conversely, during periods of high demand, our ability to rapidly increase production capacity is limited, which could prevent us from meeting demand for our products. Moreover, we may be unable to complete expansions and greenfield projects in time to take advantage of rising demand for iron ore, nickel or other products. When demand exceeds our production capacity, we may meet excess customer demand by purchasing iron ore fines, iron ore pellets or nickel from joint ventures or unrelated parties processing and reselling it, which would increase our costs and narrow our operating margins. If we are unable to satisfy excess customer demand in this way, we may lose customers. In addition, operating close to full capacity may expose us to higher costs, including demurrage fees due to capacity restraints in our logistics systems.
The prices for our products are subject to volatility, which may adversely affect our business.
Global prices for metals are subject to significant fluctuations and are affected by many factors, including actual and expected global macroeconomic and political conditions, regional and sectorial factors, levels of supply and demand, the availability and cost of substitutes, inventory levels, technological developments, regulatory and international trade matters, investments by commodity funds and others and actions of participants in the commodity markets. Sustained low market prices for the products we sell may result in the suspension of certain of our projects and operations, decrease in our mineral reserves, impairment of assets, and may adversely affect our cash flows, financial position and results of operations.
| | | | |
| | 23 | | |
Risk Factors
Demand for our iron ore, coal and nickel products depends on global demand for steel. Iron ore and iron ore pellets, which together accounted for 73.8% of our 2018 net operating revenues, are used to produce carbon steel. Nickel, which accounted for 8.8% of our 2018 net operating revenues, is used mainly to produce stainless and alloy steels. The prices of different steels and the performance of the global steel industry are highly cyclical and volatile, and these business cycles in the steel industry affect demand and prices for our products. In addition, vertical backward integration of the steel and stainless steel industries and the use of scrap could reduce the global seaborne trade of iron ore and primary nickel. The demand for copper is affected by the demand for copper wire, and a sustained decline in the construction industry could have a negative impact on our copper business.
We are mostly affected by movements in iron ore prices. For example, a price reduction of US$1 per dry metric ton unit ("dmt") in the average iron ore price would have reduced our operating income for the year ended December 31, 2018 by approximately US$340 million. Average iron ore prices significantly changed in the last five years, from US$97.0 per dmt in 2014, US$55.5 per dmt in 2015, US$58.5 per dmt in 2016, US$71.3 per dmt in 2017 and US$69.5 per dmt in 2018, according to the average Platts IODEX (62% Fe CFR China). On March 29, 2019, the year-to-date average Platts IODEX iron ore price was US$87.05 per dmt. SeeOperating and financial review and prospects—Overview—Major factors affecting prices.
Adverse economic developments in China could have a negative impact on our revenues, cash flow and profitability.
China has been the main driver of global demand for minerals and metals over the last few years. In 2018, Chinese demand represented 72% of global demand for seaborne iron ore, 51% of global demand for nickel and 49% of global demand for copper. The percentage of our net operating revenues attributable to sales to customers in China was 41.7% in 2018. Therefore, any contraction of China's economic growth could result in lower demand for our products, leading to lower revenues, cash flow and profitability. Poor performance in the Chinese real estate sector, the largest consumer of carbon steel in China, would also negatively impact our results.
Changes in exchange rates for the currencies in which we conduct operations could adversely affect our financial condition and results of operations.
A substantial portion of our revenues, trade receivables and our debt is denominated in U.S. dollars, and given that our functional currency is the Brazilianreal, changes in exchange rates may result in (i) losses or gains on our net U.S. dollar-denominated indebtedness and accounts receivable and (ii) fair value losses or gains on currency derivatives we use to stabilize our cash flow in U.S. dollars. In 2018, we had net foreign exchange losses of US$2.247 million, while we had net foreign exchange losses of US$463 million in 2017 and net foreign exchange gains of US$3.252 billion in 2016. In addition, changing values of the Brazilianreal, the Canadian dollar, the Euro, the Indonesian rupiah, the Chineseyuan and other currencies against the U.S. dollar affects our results since most of our costs of goods sold is denominated in currencies other than the U.S. dollar, principally thereal (50.9% in 2018) and the Canadian dollar (5.4% in 2018), while our revenues are mostly U.S. dollar-denominated. We expect currency fluctuations to continue to affect our financial income, expense and cash flow generation.
Significant volatility in currency prices may also result in disruption of foreign exchange markets, which could limit our ability to transfer or to convert certain currencies into U.S. dollars and other currencies for the purpose of making timely payments of interest and principal on our indebtedness. The central banks and governments of the countries in which we operate may institute restrictive exchange rate policies in the future and impose taxes on foreign exchange transactions.
| | | | |
| | 24 | | |
Risk Factors
FINANCIAL RISKS
Lower cash flows, resulting from suspension of operations or decreased prices of our products, may adversely affect our credit ratings and the cost and availability of financing.
The suspension of operations or a decline in the prices of our products may adversely affect our future cash flows, credit ratings and our ability to secure financing at attractive rates. It may also negatively affect our ability to fund our capital investments, including disbursements required to remediate and compensate damages resulting from the failure of Dam I, provide the financial assurances required to obtain licenses in certain jurisdictions, pay dividends and comply with the financial covenants in some of our long-term debt instruments. SeeOperating and financial review and prospects—Liquidity and capital resources.
POLITICAL, ECONOMIC, SOCIAL AND REGULATORY RISKS
Political, economic and social conditions in the countries in which we have operations or projects could adversely impact our business.
Our financial performance may be negatively affected by regulatory, political, economic and social conditions in countries in which we have significant operations or projects. In many of these jurisdictions, we are exposed to various risks such as political instability, bribery, cyber-attacks, extortion, corruption, robbery, sabotage, kidnapping, civil strife, acts of war, guerilla activities, piracy in international shipping routes and terrorism. These issues may adversely affect the economic and other conditions under which we operate in ways that could have a materially negative effect on our business.
Political, social and economic instability in Brazil could adversely impact our business and the market price of our securities.
The Brazilian federal government's economic policies may have important effects on Brazilian companies, including us, and on market conditions and prices of securities of Brazilian companies. Our financial condition and results of operations may be adversely affected by the following factors and the Brazilian federal government's response to these factors:
| | | | |
| | 25 | | |
Risk Factors
Historically, the country's political situation has influenced the performance of the Brazilian economy, and political crises have affected the confidence of investors and the general public, which resulted in economic deceleration, downgrading of credit ratings of the Brazilian government and Brazilian issuers, and heightened volatility in the securities issued abroad by Brazilian companies. Political instability may aggravate economic uncertainties in Brazil and increase volatility of securities of Brazilian issuers.
Brazil held presidential and federal and state legislative elections in October 2018. We cannot predict whether the new administration will result in changes in Brazilian governmental and economic policies or in the Brazilian mining industry.
In the last years, Brazil faced an economic recession, adverse fiscal developments and political instability. Brazilian GDP grew by 1.1% in 2018 and 1.1% in 2017 but declined by 3.6% in 2016. Unemployment rate was 12.3% in 2018, 12.7% in 2017 and 11.5% in 2016. Inflation, as reported by the consumer price index (IPCA), was 3.75% in 2018, 2.95% in 2017 and 6.29% in 2016. The Brazilian Central Bank's base interest rate (SELIC) was 3.5% on December 31, 2018, 7.00% on December 31, 2017 and 13.75% on December 31, 2016. Future economic, social and political developments in Brazil may impair our business, financial condition or results of operations, or cause the market value of our securities to decline.
Disagreements with local communities could adversely impact our business and reputation.
Disputes with communities where we operate may arise from time to time. Accidents or incidents involving mines, industrial facilities and related infrastructure, such as the failure of Dam I, may significantly impact the communities where we operate. In some instances, our operations and mineral reserves are located on or near lands owned or used by indigenous people or other groups of stakeholders. Some of our mining and other operations are located in territories where title may be subject to disputes or uncertainties, or in areas claimed for agriculture or land reform purposes, which may lead to disagreements with landowners, organized social movements, local communities and the government. In some jurisdictions, we may be required to consult and negotiate with these groups as part of the process to obtain licenses required to operate, to mitigate impact on our operations or to obtain access to their lands. Disagreements or disputes with local communities and groups, including indigenous groups, organized social movements and local communities, could cause delays in obtaining licenses, increases in planned budget, delays or interruptions to our operations. These issues may adversely affect our reputation or otherwise hamper our ability to develop our reserves and conduct our operations. SeeInformation on the Company—Regulatory matters andAdditional information—Legal proceedings.
We could be adversely affected by changes in government policies or by trends such as resource nationalism, including the imposition of new taxes or royalties on mining activities.
Mining is subject to government regulation, including taxes and royalties, which can have a significant financial impact on our operations. In the countries where we are present, we are subject to potential renegotiation, nullification or forced modification of existing contracts and licenses, expropriation or nationalization of property, foreign exchange controls, changes in local laws, regulations and policies and audits and reassessments. We are also subject to new taxes or raising of existing taxes and royalty rates, reduction of tax exemptions and benefits, renegotiation of tax stabilization agreements or changes on the basis on which taxes are calculated in a manner that is unfavorable to us. Governments that have committed to provide a stable taxation or regulatory environment may alter those commitments or shorten their duration. We also face the risk of having to submit to the jurisdiction of a foreign court or arbitration panel or having to enforce a judgment against a sovereign nation within its own territory. SeeInformation on the Company—Regulatory matters andAdditional information—Royalties and other taxes on mining activities.
| | | | |
| | 26 | | |
Risk Factors
We are also required to meet domestic beneficiation requirements in certain countries, such as local processing rules, export taxes or restrictions or charges on unprocessed ores. The imposition of or increase in such requirements, taxes or charges can significantly increase the risk profile and costs of operations in those jurisdictions. We and the mining industry are subject to rising trends of resource nationalism in certain countries in which we operate that can result in constraints on our operations, increased taxation or even expropriations and nationalizations.
As a supplier of iron ore, nickel and other raw materials to the global integrated steel industry, we are subject to additional risk from the imposition of duties, tariffs, import and export controls and other trade barriers impacting our products and the products our customers produce. Global trade is subject to a growing trend of increased trade barriers, which could exacerbate commodities' price volatility and in turn result in instability in the prices of our products.
Concessions, authorizations, licenses and permits are subject to expiration, limitation on renewal and various other risks and uncertainties.
Our operations depend on authorizations and concessions from governmental regulatory agencies in the countries in which we operate. We are subject to laws and regulations in many jurisdictions that can change at any time, and changes in laws and regulations may require modifications to our technologies and operations and result in unanticipated capital expenditures.
Some of our mining concessions are subject to fixed expiration dates and might only be renewed a limited number of times for a limited period of time. Apart from mining concessions, we may need to obtain various authorizations, licenses and permits from governmental or other regulatory bodies in connection with the planning, maintenance, operation and closure of our mines and related logistics infrastructure, which may be subject to fixed expiration dates or periodic review or renewal. There is no assurance that renewals will be granted as and when sought, and there is no assurance that new conditions will not be imposed in connection with renewal. Fees for mining concessions might increase substantially due to the passage of time from the original issuance of each individual exploration license. If so, the costs of holding or renewing our mining concessions may render our business objectives not viable. Accordingly, we need to continually assess the mineral potential of each mining concession, particularly at the time of renewal, to determine if the costs of maintaining the concession are justified by the results of operations to date, and we might elect to let some of our concessions lapse. There can be no assurance that concessions will be obtained on terms favorable to us, or at all, for our future intended mining or exploration targets.
In a number of jurisdictions where we have exploration projects, we may be required to retrocede to the state a certain portion of the area covered by the exploration license as a condition to renewing the license or obtaining a mining concession. This requirement can lead to a substantial loss of part of the mineral deposit originally identified in our feasibility studies. For more information on mining concessions and other similar rights, seeInformation on the Company—Regulatory matters.
OPERATIONAL RISKS
Our projects are subject to risks that may result in increased costs or delay in their implementation.
We are investing to maintain and further increase our production capacity and logistics capabilities. We regularly review the economic viability of our projects. As a result of this review, we may decide to
| | | | |
| | 27 | | |
Risk Factors
postpone, suspend or interrupt the implementation of certain projects. Our projects are also subject to a number of risks that may adversely affect our growth prospects and profitability, including the following:
Operational problems could materially and adversely affect our business and financial performance.
Ineffective project management and operational breakdowns might require us to suspend or curtail operations, which could generally reduce our productivity. Operational breakdowns could entail failure of critical plant and machinery. There can be no assurance that ineffective project management or other operational problems will not occur. Any damages to our projects or delays in our operations caused by ineffective project management or operational breakdowns could materially and adversely affect our business and results of operations. Our business is subject to a number of operational risks that may adversely affect our results of operations, such as:
| | | | |
| | 28 | | |
Risk Factors
Our business could be adversely affected by the failure or unavailability of certain critical assets or infrastructure.
We rely on certain critical assets and infrastructure to produce and to transport our products to our customers. These critical assets include mines, industrial facilities, ports, railways, roads and bridges. The failure or unavailability of any critical asset, whether resulting from natural events or operational issues, could have a material adverse effect on our business.
Substantially all of our iron ore production from the Northern system is transported from Carajas, in the Brazilian state of Pará, to the port of Ponta da Madeira, in the Brazilian state of Maranhão, through the Carajás railroad (EFC). Any interruption of the Carajás railroad or of the port of Ponta da Madeira could significantly impact our ability to sell our production from the Northern system. With respect to the Carajás railroad, there is particular risk of interruption at the bridge over the Tocantins river, in which the trains run on a single line railway. In the port of Ponta da Madeira, there is particular risk of interruption at the São Marcos access channel, a deep-water channel that provides access to the port. Also, any failure or interruption of our long distance conveyor belt (TCLD) used to transport our iron ore production from the S11D mine to the beneficiation plant, could adversely impact our operations at the S11D mine.
Our business could be adversely affected by the failure of our counterparties, joint venture partners or joint ventures we do not control to perform their obligations.
Customers, suppliers, contractors, financial institutions, joint venture partners and other counterparties may fail to perform existing contracts and obligations, which may unfavorably impact our operations and financial results. The ability of suppliers and customers to perform their obligations may be adversely affected in times of financial stress and economic downturn.
Important parts of our iron ore, pelletizing, nickel, coal, copper, energy and other businesses are held through joint ventures. This may reduce our degree of control, as well as our ability to identify and manage risks. Our forecasts and plans for these joint ventures and consortia assume that our partners will observe their obligations to make capital contributions, purchase products and, in some cases, provide skilled and competent managerial personnel. If any of our partners fails to observe its commitments, the affected joint venture or consortium may not be able to operate in accordance with its business plans, or we may have to increase the level of our investment to implement these plans.
Some of our investments are controlled by partners or have separate and independent management. These investments may not fully comply with our standards, controls and procedures, including our health, safety, environment and community standards. Failure by any of our partners or joint ventures to adopt adequate standards, controls and procedures could lead to higher costs, reduced production or
| | | | |
| | 29 | | |
Risk Factors
environmental, health and safety incidents or accidents, which could adversely affect our results and reputation.
We may not have adequate insurance coverage for some business risks.
Our businesses are generally subject to a number of risks and hazards, which could have impact on people, assets and the environment. The insurance we maintain against risks that are typical in our business may not provide adequate coverage. Insurance against some risks (including liabilities for environmental damages, damages resulting from dams breaches, spills or leakage of hazardous substances and interruption of certain business activities) may not be available at a reasonable cost, or at all. Even when it is available, we may self-insure where we determine that is more cost-effective to do so. As a result, accidents or other negative developments involving our mining, production or transportation facilities may not be covered by insurance, and could have a material adverse effect on our operations.
Labor disputes may disrupt our operations from time to time.
A substantial number of our employees, and some of the employees of our subcontractors, are represented by labor unions and are covered by collective bargaining or other labor agreements, which are subject to periodic negotiation. Strikes and other labor disruptions at any of our operations could adversely affect the operation of facilities and the timing of completion and cost of our capital projects. For more information about labor relations, seeManagement and employees—Employees. Moreover, we could be adversely affected by labor disruptions involving unrelated parties that may provide us with goods or services.
Higher energy costs or energy shortages would adversely affect our business.
Costs of fuel oil, gas and electricity are a significant component of our cost of production, representing 11.1% of our total cost of goods sold in 2018. To fulfill our energy needs, we rely on the following sources: oil byproducts, which represented 31% of total energy needs in 2018, electricity (31%), natural gas (17%), coal (17%) and other energy sources (4%).
Electricity costs represented 4.1% of our total cost of goods sold in 2018. If we are unable to secure reliable access to electricity at acceptable prices, we may be forced to curtail production or may experience higher production costs, either of which would adversely affect our results of operations. We face the risk of energy shortages in the countries where we have operations and projects, especially Brazil, due to lack of infrastructure or weather conditions, such as floods or droughts. Future shortages, and government efforts to respond to or prevent shortages, may adversely impact the cost or supply of electricity for our operations.
Failures in our information technology, operational technology, cybersecurity and telecommunications systems may adversely affect our business and reputation.
We rely heavily on information technology, operational technology and telecommunications systems for the operation of many of our business processes. Failures in those systems, whether caused by obsolescence, technical failures, negligence, accident or malicious acts, may result in the disclosure or theft of sensitive information, misappropriation of funds and disruptions to or interruption in our business operations. We may be the target of attempts to gain unauthorized access to information technology and operational technology systems through the internet, including sophisticated and coordinated attempts often referred to as advanced persistent threats. Disruption of critical information technology, operational technology, cybersecurity or telecommunications systems, or breaches of
| | | | |
| | 30 | | |
Risk Factors
information security, may harm our reputation and have a material adverse effect on our operational performance, earnings and financial condition.
HEALTH, SAFETY AND ENVIRONMENTAL RISKS
Our business is subject to environmental, health and safety incidents.
Our operations involve the use, handling, storage, discharge and disposal of hazardous substances into the environment and the use of natural resources, resulting in significant risks and hazards, including fire, explosion, toxic gas leaks, spilling of polluting substances or other hazardous materials, rockfalls, incidents involving dams, failure of other operational structures, as well as activities involving mobile equipment, vehicles or machinery and other potentially fatal incidents and accidents. Incidents may occur due to deficiencies in identifying and assessing risks or in implementing sound risk management, and once these risks materialize, they could result in significant environmental and social impacts, damage to or destruction of mines or production facilities, personal injury, illness and fatalities, involving employees, contractors or community members near our operations, as well as delays in production, monetary losses and possible legal liability. Additionally, in remote localities, our employees may be exposed to tropical and contagious diseases that may affect their health and safety. Notwithstanding our standards, policies, controls and monitoring procedures, our operations remain subject to incidents or accidents that could adversely impact our business, stakeholders or reputation.
Our business may be adversely affected by social, environmental and health and safety regulation, including regulations pertaining to climate change.
Nearly all aspects of our activities, products and services associated with capital projects and operations around the world are subject to social, environmental and health and safety regulations, which may expose us to increased liability or increased costs. These regulations require us to have environmental licenses, permits and authorizations for our operations and projects, and to conduct environmental and social impact assessments in order to get approval for our projects and permission for initiating construction and continuing operating. Significant changes to existing operations are also subject to these requirements. Difficulties in obtaining or renewing permits may lead to construction delays, cost increases, and may adversely impact our production volumes. Social, environmental and health and safety regulations also impose standards, procedures and monitoring controls on activities relating to mineral research, mining, beneficiation, pelletizing activities, railway and marine services, ports, decommissioning, distribution and marketing of our products. Such regulation may give rise to significant costs and liabilities. Litigation relating to these or other related matters may adversely affect our financial condition or cause harm to our reputation.
Social, environmental and health and safety regulations in many countries in which we operate have become stricter in recent years, and it is possible that more regulation or more stringent enforcement of existing regulations will adversely affect us by imposing restrictions on our activities and products, creating new requirements for the issuance or renewal of environmental licenses and labor authorizations, resulting in licensing and operation delays, raising our costs or requiring us to engage in expensive reclamation efforts.
In response to the failure of Dam I, additional environmental and health and safety laws and regulations have been approved, and other may be forthcoming, and authorities may impose more stringent conditions in connection with the licensing process of our projects and operations. We will encounter more stringent requirements for and delays in the receipt of environmental operating license for other tailings dams.
| | | | |
| | 31 | | |
Risk Factors
National policies and international regulations regarding climate change may affect a number of our businesses in various countries. The ratification of the Paris Agreement in 2016 increased international pressure for the establishment of a global carbon price, and on companies to adopt carbon pricing strategies. The pricing of greenhouse gas emissions may impact our operational costs, mainly through higher price for fossil fuels as mining is an energy intensive industry, and our cost of international freight. In particular, consumption of thermal coal, one of the products we sell, is facing pressure from international institutions due to its carbon intensity.
Regulatory initiatives at the national and international levels that affect our shipping practices could increase our costs or require us to make new capital expenditures. Regulations, mainly from the European Union and China, may impose additional requirements for our products related to the safety of downstream users.
Natural disasters may cause severe damage to our operations and projects in the countries where we operate and may have a negative impact on our sales to countries affected by such disasters.
Natural disasters, such as wind storms, droughts, floods, earthquakes and tsunamis may adversely affect our operations and projects in the countries where we operate, and may cause a contraction in sales to countries adversely affected due to, among other factors, power outages and the destruction of industrial facilities and infrastructure. The physical impact of climate change on our business remains uncertain, but we are likely to experience changes in rainfall patterns, increased temperatures, water shortages, rising sea levels, increased storm frequency and intensity as a result of climate change, which may adversely affect our operations. On some occasions in recent years, we have determined that force majeure events have occurred due to the effect of severe weather on our mining and logistics activities.
RISKS RELATING TO OUR MINING RESERVES
Our reserve estimates may materially differ from mineral quantities that we are actually able to recover; our estimates of mine life may prove inaccurate; more stringent regulations and market price fluctuations and changes in operating and capital costs may render certain ore reserves uneconomical to mine.
Our reported reserves are estimated quantities of ore and minerals that we have determined can be economically and legally mined and processed under present and assumed future conditions. There are numerous uncertainties inherent in estimating quantities of reserves and in projecting potential future rates of mineral production, including factors beyond our control. Reserve reporting involves estimating deposits of minerals that cannot be measured in an exact manner, and the accuracy of any reserve estimate is a function of the quality of available data, engineering and geological interpretation and judgment. As a result, no assurance can be given that the indicated amount of ore will be recovered or that it will be recovered at the rates we anticipate. Reserve estimates and estimates of mine life may require revisions based on actual production experience, projects, updated exploration drilling data and other factors. Lower market prices of minerals and metals, more stringent regulations, reduced recovery rates or increased operating and capital costs due to inflation, exchange rates, changes in regulatory requirements or other factors may render proven and probable reserves uneconomic to exploit and may ultimately result in a reduction of reserves. Also, our inability to obtain licenses for new operations, supporting structures or activities, or to renew our existing licenses, can cause a reduction of our reserves. Such a reduction could affect depreciation and amortization rates and have an adverse effect on our financial performance.
| | | | |
| | 32 | | |
Risk Factors
We may not be able to replenish our reserves, which could adversely affect our mining prospects.
We engage in mineral exploration, which is highly uncertain in nature, involves many risks and frequently is non-productive. Our exploration programs, which involve significant expenditures, may fail to result in the expansion or replacement of reserves depleted by current production. If we do not develop new reserves, we will not be able to sustain our current level of production beyond the remaining lives of our existing mines.
The feasibility of new mineral projects may change over time.
Once mineral deposits are discovered, it can take a number of years from the initial phases of drilling until production is possible, during which the economic feasibility of production may change. Substantial time and expenditures are required to:
If a project proves not to be economically feasible by the time we are able to exploit it, we may incur substantial losses and be obliged to take write-downs. In addition, potential changes or complications involving metallurgical and other technological processes arising during the life of a project may result in delays and cost overruns that may render the project not economically feasible.
We face rising extraction costs and investment requirements over time as reserves deplete.
Reserves are gradually depleted in the ordinary course of a given open pit or underground mining operation. As mining progresses, distances to the primary crusher and to waste deposits become longer, pits become steeper, mines may move from being open pit to underground, and underground operations become deeper. In addition, for some types of reserves, mineralization grade decreases and hardness increases at greater depths. As a result, over time, we usually experience rising unit extraction costs with respect to each mine, or we may need to make additional investments, including adaptation or construction of processing plants and expansion or construction of tailings dams. Several of our mines have been operating for long periods, and we will likely experience rising extraction costs per unit in the future at these operations in particular.
| | | | |
| | 33 | | |
Risk Factors
RISKS RELATING TO OUR CORPORATE STRUCTURE
The shareholders that are party to our shareholders' agreement have significant power over Vale.
On August 14, 2017, Litel Participações S.A. ("Litel"), Bradespar S.A. ("Bradespar"), Mitsui & Co., Ltd. ("Mitsui") and BNDES Participações S.A. ("BNDESPAR") entered into a shareholders' agreement pursuant to which they undertook to vote jointly on certain key matters (the "Shareholders' Agreement"). The Shareholders' Agreement is expected to expire on November 9, 2020. SeeShare ownership and trading—Major shareholders. On December 31, 2018, Litel, Bradespar, Mitsui and BNDESPAR together held 39.03% of our total capital stock. As long as no other shareholder or group of shareholders owns more shares than the parties to the Shareholders' Agreement, these major shareholders may elect a majority of the members of our Board of Directors and control the outcome of certain actions requiring shareholder approval.
The Brazilian Government has certain veto rights.
The Brazilian government owns 12 golden shares of Vale, granting it limited veto power over certain company actions, such as changes to our name, the location of our headquarters and our corporate purpose as it relates to mining activities. For a detailed description of the Brazilian government's veto powers, seeAdditional information—Memorandum and articles of association—Common shares and golden shares.
Our governance and compliance processes may fail to prevent breaches of legal, accounting or governance standards.
We operate in a global environment, and our activities extend over multiple jurisdictions and complex regulatory frameworks, with increasing enforcement activities worldwide. Our governance and compliance processes, which include the review of internal control over financial reporting, may not timely identify or prevent future breaches of legal, accounting or governance standards. We may be subject to breaches of our code of ethical conduct, anti-corruption policies and business conduct protocols and to instances of fraudulent behavior, corrupt practices and dishonesty by our employees, contractors or other agents. Our failure to comply with applicable laws and other standards could subject us to investigations by authorities, litigation, fines, loss of operating licenses, disgorgement of profits, involuntary dissolution and reputational harm.
It could be difficult for investors to enforce any judgment obtained outside Brazil against us or any of our associates.
Our investors may be located in jurisdictions outside Brazil and could seek to bring actions against us or our directors or officers in the courts of their home jurisdictions. We are a Brazilian company, and the majority of our officers and directors are residents of Brazil. The vast majority of our assets and the assets of our officers and directors are likely to be located in jurisdictions other than the home jurisdictions of our foreign investors. It might not be possible for investors outside Brazil to effect service of process within their home jurisdictions on us or on our officers or directors who reside outside their home jurisdictions. In addition, a final conclusive foreign judgment will be enforceable in the courts of Brazil without a re-examination of the merits only if previously confirmed by the Brazilian Superior Court of Justice (STJ—Superior Tribunal de Justiça), and confirmation will only be granted if the foreign judgment: (i) fulfills all formalities required for its enforceability under the laws of the country where it was issued; (ii) was issued by a competent court after due service of process on the defendant, as required under
| | | | |
| | 34 | | |
Risk Factors
applicable law; (iii) is not subject to appeal; (iv) does not conflict with a final and unappealable decision issued by a Brazilian court; (v) was authenticated by a Brazilian consulate in the country in which it was issued or is duly apostilled in accordance with the Convention for Abolishing the Requirement of Legalization for Foreign Public Documents and is accompanied by a sworn translation into Portuguese, unless this procedure was exempted by an international treaty entered into by Brazil; (vi) it does not cover matters subject to the exclusive jurisdiction of the Brazilian courts; and (vii) is not contrary to Brazilian national sovereignty, public policy or good morals. Therefore, investors might not be able to recover against us or our directors and officers on judgments of the courts of their home jurisdictions predicated upon the laws of such jurisdictions.
RISKS RELATING TO OUR DEPOSITARY SHARES
If ADR holders exchange ADSs for the underlying shares, they risk losing the ability to remit foreign currency abroad.
The custodian for the shares underlying our ADSs maintains a registration with the Central Bank of Brazil permitting qualifying institutional foreign investors to buy and sell securities on the B3 and entitling the custodian to remit U.S. dollars outside Brazil for payments of dividends and other distributions relating to the shares underlying our ADSs or upon the disposition of the underlying shares. If an ADR holder exchanges its ADSs for the underlying shares, it will be entitled to rely on the custodian's registration for only five business days from the date of exchange. Thereafter, an ADR holder may not be able to obtain and remit foreign currency abroad upon the disposition of, or distributions relating to, the underlying shares unless it obtains its own registration under applicable regulation. SeeAdditional information—Exchange controls and other limitations affecting security holders. If an ADR holder attempts to obtain its own registration, it may incur expenses or suffer delays in the application process, which could delay the receipt of dividends or other distributions relating to the underlying shares or the return of capital in a timely manner.
The custodian's registration or any registration obtained could be affected by future legislative changes, and additional restrictions applicable to ADR holders, the disposition of the underlying shares or the repatriation of the proceeds from disposition could be imposed in the future.
ADR holders may not have all the rights of our shareholders, and may be unable to exercise preemptive rights relating to the shares underlying their ADSs.
ADR holders may not have the same rights that are attributed to our shareholders by Brazilian law or our bylaws, and the rights of ADR holders may be subject to certain limitations provided in the deposit agreement or by the securities intermediaries through which ADR holders hold their securities. Also, the ability of ADR holders to exercise preemptive rights is not assured, particularly if the applicable law in the holder's jurisdiction (for example, the Securities Act in the United States) requires that either a registration statement be effective or an exemption from registration be available with respect to those rights, as is in the case in the United States. We are not obligated to extend the offer of preemptive rights to holders of ADRs, to file a registration statement in the United States, or to make any other similar filing in any other jurisdiction, relating to preemptive rights or to undertake steps that may be needed to make exemptions from registration available, and we cannot assure holders that we will file any registration statement or take such steps.
| | | | |
| | 35 | | |
Risk Factors
ADR holders may encounter difficulties in the exercise of voting rights.
ADR holders do not have the rights of shareholders. They have only the contractual rights set forth for their benefit under the deposit agreements. ADR holders are not permitted to attend shareholders' meetings, and they may only vote by providing instructions to the depositary. In practice, the ability of a holder of ADRs to instruct the depositary as to voting will depend on the timing and procedures for providing instructions to the depositary either directly or through the holder's custodian and clearing system. With respect to ADSs for which instructions are not received, the depositary may, subject to certain limitations, grant a proxy to a person designated by us.
The legal protections for holders of our securities differ from one jurisdiction to another and may be inconsistent, unfamiliar or less effective than investors anticipate.
We are a global company with securities traded in several different markets and investors located in many different countries. The legal regime for the protection of investors varies around the world, sometimes in important ways, and investors in our securities should recognize that the protections and remedies available to them may be different from those to which they are accustomed in their home markets. We are subject to securities legislation in several countries, which have different rules, supervision and enforcement practices. The only corporate law applicable to our parent company is the law of Brazil, with its specific substantive rules and judicial procedures. We are subject to corporate governance rules in several jurisdictions where our securities are listed, but as a foreign private issuer, we are not required to follow many of the corporate governance rules that apply to U.S. domestic issuers with securities listed on the New York Stock Exchange, and we are not subject to the U.S. proxy rules.
| | | | |
| | 36 | | |
II. INFORMATION ON THE COMPANY
Our principal lines of business consist of mining and related logistics. This section presents information about operations, production, sales and competition and is organized as follows.
| 1. Ferrous minerals 1.1 Iron ore and iron ore pellets 1.1.1 Iron ore operations 1.1.2 Iron ore production 1.1.3 Iron ore pellets operations 1.1.4 Iron ore pellets production 1.1.5 Customers, sales and marketing 1.1.6 Competition 1.2 Manganese ore and ferroalloys 1.2.1 Manganese ore operations and production 1.2.2 Ferroalloys operations and production 1.2.3 Manganese ore and ferroalloys: sales and competition 2. Base metals 2.1 Nickel 2.1.1 Operations 2.1.2 Production 2.1.3 Customers and sales 2.1.4 Competition 2.2 Copper 2.2.1 Operations 2.2.2 Production 2.2.3 Customers and sales 2.2.4 Competition 2.3 PGMs and other precious metals 2.4 Cobalt | | 3. Coal 3.1 Operations 3.2 Production 3.3 Customers and sales 3.4 Competition 4. Infrastructure 4.1 Logistics 4.1.1 Railroads 4.1.2 Ports and maritime terminals 4.1.3 Shipping 4.2 Energy 5. Other investments |
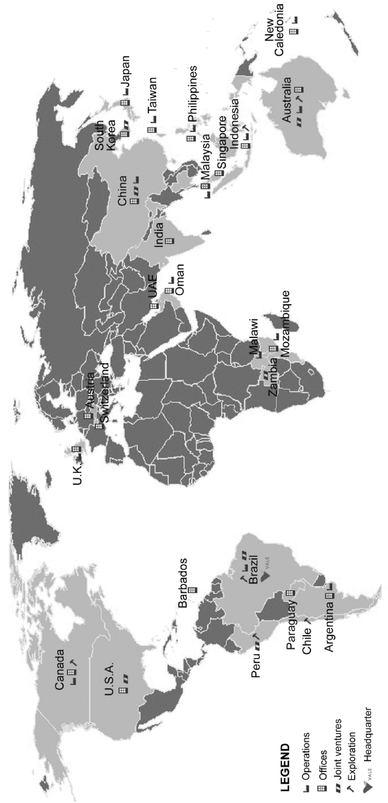
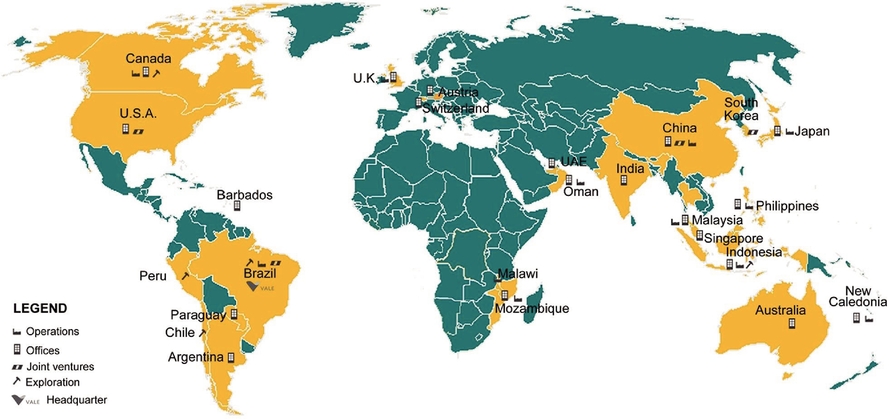
| | | | |
| | 38 | | |
1. Ferrous minerals
Table of Contents
Lines of Business
1. FERROUS MINERALS
Our ferrous minerals business includes iron ore mining, iron ore pellet production, manganese ore mining and ferroalloy production. Each of these activities is described below.
1.1 Iron ore and iron ore pellets
1.1.1 Iron ore operations
We conduct our iron ore business in Brazil primarily at the parent-company level, and through our subsidiaries Mineração Corumbaense Reunida S.A. ("MCR") and Minerações Brasileiras Reunidas S.A.—MBR ("MBR"). Our mines, all of which are open pit, and their related operations are mainly concentrated in three systems: the Southeastern, Southern and Northern Systems, each with its own transportation and shipping capabilities. We also conduct mining operations in the Midwestern System and we have a 50% stake in Samarco. Samarco's operations have been suspended following the failure of one of its tailings dams located in Minas Gerais in November 2015 (seeBusiness overview—Failure of Samarco's tailings dam in Minas Gerais). We conduct each of our iron ore operations in Brazil under concessions from the federal government granted for an indefinite period, subject to the life of the mines.
| Company/Mining System | | Location | | Description/History | | Mineralization | | Operations | | Power source | | Access/Transportation | |
|---|---|---|---|---|---|---|---|---|---|---|---|---|---|
Vale | | | | | | | |||||||
Northern System | | Carajás, state of Pará | | Divided into Serra Norte, Serra Sul and Serra Leste (Northern, Southern and Eastern ranges). Since 1984, we have been conducting mining activities in the northern range, which is divided into three main mining areas (N4W, N4E and N5) and two major beneficiation plants. In 2014, we started a | | High-grade hematite ore type (iron grade of more than 65% on average). | | Open-pit mining operations. In Serra Norte, one of the major plants applies the natural moisture beneficiation process, consisting of crushing and screening, and the other applies both the natural moisture and the wet beneficiation process in distinct lines. The wet beneficiation process consists simply of sizing operations, including screening, hydrocycloning, crushing and filtration. Output from this site consists of sinter feed, pellet feed and lump ore. Serra Leste and Serra Sul natural moisture beneficiation process consists of crushing and screening. Serra Sul produces only sinter feed and Serra Leste produces | | Supplied through the national electricity grid. Produced directly by Vale or acquired through power purchase agreements. | | ||
Southeastern System | | Iron Quadrangle, state of Minas Gerais | | Three mining complexes: Itabira (two mines, with three major beneficiation plants), Minas Centrais (two mines, with two major beneficiation plants and one secondary plant) and Mariana (three mines, with two major beneficiation plants). | | Ore reserves with high ratios of itabirite ore relative to hematite ore type. Itabirite ore type has iron grade of 35-60%. Part of the ore is concentrated to achieve shipping grade and part is shipped and blended in Asia with the | | Open-pit mining operations. We generally process the run-of-mine by means of standard crushing, classification and concentration steps, producing sinter feed, lump ore and pellet feed in the beneficiation plants located at the mining complexes. For status of halted operations seeBusiness overview—Failure of the tailings dam at the Córrego do Feijão mine. | | Supplied through the national electricity grid. Produced directly by Vale or acquired through power purchase agreements. | | EFVM railroad connects these mines to the Tubarão port. |
| | | | |
| | 39 | | |
Lines of Business
| Company/Mining System | | Location | | Description/History | | Mineralization | | Operations | | Power source | | Access/Transportation |
|---|---|---|---|---|---|---|---|---|---|---|---|---|
Southern System | | Iron Quadrangle, state of Minas Gerais | | Three major mining complexes: Minas Itabirito (four mines and three major beneficiation plants); Vargem Grande (three mines and two major beneficiation plants); and Paraopeba (five mines and two major beneficiation plants). | | Ore reserves with high ratios of itabirite ore type relative to hematite ore type. Itabirite ore has iron grade of 35-60%. Part of the ore is concentrated to achieve shipping grade and part is shipped and blended in Asia with the | | Open-pit mining operations. We generally process the run-of-mine by means of standard crushing, classification and concentration steps, producing sinter feed, lump ore and pellet feed in the beneficiation plants located at the mining complexes. For status of halted operations seeBusiness overview—Failure of the tailings dam at the Córrego do Feijão mine. | | Supplied through the national electricity grid. Produced directly by Vale or acquired through power purchase agreements. | | MRS transports our iron ore products from the mines to our Guaíba Island and Itaguaí maritime terminals in the Brazilian state of Rio de Janeiro. EFVM railroad connects certain mines to the Tubarão port. |
Midwestern System | | State of Mato Grosso do Sul | | Two mines and two plants located in the city of Corumbá. | | Hematite ore type, which generates lump ore predominantly. Iron grade of 62% on average. | | Open-pit mining operations. The beneficiation process for the run-of-mine consists of standard crushing and classification steps, producing lump ore and sinter feed. | | Supplied through the national electricity grid. Acquired | | Transported by barges traveling along the Paraguay |
| | | | | ||||||||
| | 40 | | |
Lines of Business
1.1.2 Iron ore production
The following table sets forth information about our iron ore production.
| | | | | Production for the year ended December 31(2), | | | | | | Production for the year ended December 31, | | | ||||||||
|---|---|---|---|---|---|---|---|---|---|---|---|---|---|---|---|---|---|---|---|---|
| | | | | 2016 process recovery(4) | | | | 2018 process recovery(2) | ||||||||||||
| Mine/Plant | | Type | | 2014 | | 2015 | | 2016 | | Type | | 2016 | | 2017 | | 2018(1) | ||||
| | | | | (million metric tons) | | (%) | | | | (million metric tons) | | (%) | ||||||||
Southeastern System | | | | | | | | | | | ||||||||||
Itabira | | Open pit | | 35.8 | | 35.6 | | 33.4 | | 49.6 | | Open pit | | 33.4 | | 37.8 | | 41.7 | | 50 |
Minas Centrais | | Open pit | | 33.7 | | 41.3 | | 40.9 | | 67.6 | | Open pit | | 40.9 | | 37.6 | | 36.0 | | 64 |
Mariana | | Open pit | | 39.4 | | 36.1 | | 28.4 | | 89.4 | | Open pit | | 28.4 | | 33.1 | | 26.7 | | 81 |
| | | | | | | | | | | | | | | | | | | | | |
Total Southeastern System | Total Southeastern System | | 108.9 | | 113.0 | | 102.7 | | | | 102.7 | | 108.6 | | 104.4 | | ||||
| | | | | | | | | | | | | | | | | | | | | |
Southern System | | | | | | | | | | | ||||||||||
Minas Itabirito | | Open pit | | 41.0 | | 41.4 | | 40.1 | | 71.7 | | Open pit | | 40.1 | | 36.8 | | 35.5 | | 82 |
Vargem Grande | | Open pit | | 25.0 | | 29.3 | | 29.2 | | 64.9 | | Open pit | | 29.2 | | 23.3 | | 21.4 | | 68 |
Paraopeba | | Open pit | | 31.2 | | 28.1 | | 26.4 | | 95.9 | | Open pit | | 26.4 | | 26.3 | | 27.3 | | 98 |
| | | | | | | | | | | | | | | | | | | | | |
Total Southern System | Total Southern System | | 97.2 | | 98.8 | | 95.7 | | | | 95.7 | | 86.4 | | 84.1 | | ||||
| | | | | | | | | | | | | | | | | | | | | |
Northern System | | | | | | | | | | | ||||||||||
Serra Norte | | Open pit | | 117.5 | | 127.6 | | 143.6 | | 95.5 | | Open pit | | 143.6 | | 142.7 | | 131.5 | | 95 |
Serra Leste | | Open pit | | 2.2 | | 2.0 | | 4.2 | | 98.9 | | Open pit | | 4.2 | | 4.3 | | 4.1 | | 100 |
Serra Sul | | Open pit | | – | | – | | 0.4 | | 100.0 | | Open pit | | 0.4 | | 22.2 | | 58.0 | | 100 |
| | | | | | | | | | | | | | | | | | | | | |
Total Northern System | Total Northern System | | 119.7 | | 129.6 | | 148.1 | | | | 148.1 | | 169.2 | | 193.6 | | ||||
| | | | | | | | | | | | | | | | | | | | | |
Midwestern System | | | | | | | | | | | ||||||||||
Corumbá | | Open pit | | 3.8 | | 2.8 | | 1.9 | | 73.9 | ||||||||||
Corumbà | | Open pit | | 1.9 | | 2.4 | | 2.5 | | 72 | ||||||||||
Urucum | | Open pit | | 2.1 | | 1.7 | | 0.4 | | 65.8 | | Open pit | | 0.4 | | 0.0 | | 0.0 | | |
| | | | | | | | | | | | | | | | | | | | | |
Total Midwestern System | Total Midwestern System | | 5.8 | | 4.5 | | 2.3 | | | | 2.3 | | 2.4 | | 2.5 | | ||||
| | | | | | | | | | | | | | | | | | | | | |
Total Vale Systems(2) | | 331.6 | | 345.9 | | 348.8 | | |||||||||||||
| | | | | | | | | | | | ||||||||||
Samarco(3) | | Open pit | | 13.1 | | 12.7 | | 0.0 | | |||||||||||
| | | | | | | | | | | | ||||||||||
Total | Total | | 344.7 | | 358.6 | | 348.8 | | | | 348.8 | | 366.5 | | 384.6 | | ||||
| | | | | | | | | | | | | | | | | | | | | |
| | | | | | | | | | | | ||||||||||
| | | | | | | | | | | | ||||||||||
| | | | |
| | 41 | | |
Lines of Business
1.1.3 Iron ore pelletspellet operations
We produce iron ore pellets in Brazil and Oman, directly and through joint ventures, as set forth in the table below. We also have a 25% interest in two iron ore pelletizing plants in China,Zhuhai YPM Pellet Co., Ltd. ("Zhuhai YPM") andAnyang Yu Vale Yongtong Pellet Co., Ltd. ("Anyang"). Our total estimated nominal capacity is 64.7 Mtpy, including the full capacity of our pelletizing plants in Oman, but not including our joint ventures Samarco, Zhuhai YPM and Anyang. We supply all of the iron ore requirements of our wholly-ownedwholly owned pellet plants and part of the iron ore requirements for Samarco and Zhuhai YPM. In 2016,2018, we sold 1.08 million102 thousand metric tons of pellet feed to Zhuhai YPM and 0.33 million metric tons to Anyang YVY. We suspended our sales of run-of-mine to Samarco following the failure of Samarco's tailings dam in November 2015.YPM.
| | | | |
| | 42 | | |
| Company/Plant | Description/History | Nominal capacity (Mtpy) | Power source | Other information | Vale's share (%) | Partners | |||||||
|---|---|---|---|---|---|---|---|---|---|---|---|---|---|
Brazil: | |||||||||||||
Vale | |||||||||||||
Tubarão (state of | Three wholly-owned pellet plants (Tubarão I, II and VIII) and five leased plants (Itabrasco, Hispanobras, Kobrasco and two Nibrasco plants). These plants receive iron ore primarily from our Southeastern System mines and distribution is made though our logistics infrastructure. | 36.7(1) | Supplied through the national electricity grid. Produced directly by Vale or acquired through power purchase agreements. | Operations at the Tubarão I and II pellet plants have been suspended since November 13, 2012 in response to changes in steel industry demand for raw materials, and replaced by Tubarão VIII, a newer and more efficient plant. | 100.0 | – | |||||||
Fábrica (state of | Part of the Southern System. Receives iron ore from Minas Itabirito mining complex, more specifically from João Pereira and Segredo mines. Production is mostly transported by MRS and EFVM. | 4.5 | Supplied through the national electricity grid. Produced directly by Vale or acquired through power purchase agreements. | – | 100.0 | – | |||||||
Vargem Grande (state | Part of the Southern System. Receives iron ore from Minas Itabirito and Vargem Grande mining complexes, more specifically from Sapecado, Galinheiro, Capitão do Mato and Tamanduá mines and the production is mostly transported by MRS. | 7.0 | Supplied through the national electricity grid. Produced directly by Vale or acquired through power purchase agreements. | – | 100.0 | – | |||||||
São Luís (state of | Part of the Northern System. Receives iron ore from the Carajás mines and production is shipped to customers through our Ponta da Madeira maritime terminal. | 7.5 | – | On October 8, 2012, we suspended operations at the São Luís pellet plant in response to changes in steel industry demand for raw materials. We plan to re-start the São Luis pellet plant in the beginning of 2018, after the renewal of its operational license, the revamp of the plant and the upgrade of its automation system. | 100.0 | – | |||||||
| Company/Plant | Description/History | Nominal capacity (Mtpy) | Power source | Other information | Vale's share (%) | Partners | Description/History | Nominal capacity (Mtpy) | Power source | Other information | Vale's equity interest (%) | Partners | |||||||||||||
|---|---|---|---|---|---|---|---|---|---|---|---|---|---|---|---|---|---|---|---|---|---|---|---|---|---|
Samarco | Four pellet plants, with aggregate nominal capacity of 30.5 Mtpy, located in the Ponta Ubu unit, in Anchieta, state of Espírito Santo. | 30.5(2) | Supplied through the national electricity grid. Acquired from regional utility companies or produced directly by Samarco. | In January 2016, Samarco suspended its pelletizing operations as pelletizing feed became unavailable as a result of the suspension of its mining operations in November 2015. | 50.0 | BHP Billiton Brasil Ltda. | |||||||||||||||||||
| Brazil: | |||||||||||||||||||||||||
Vale | |||||||||||||||||||||||||
| Tubarão (state of Espírito Santo) | Three wholly owned pellet plants (Tubarão I, II and VIII) and five leased plants (Itabrasco, Hispanobras, Kobrasco and two Nibrasco plants). These plants receive iron ore primarily from our Southeastern System mines and use our logistics infrastructure for distribution. | 36.7(1) | Supplied through the national electricity grid. Produced directly by Vale or acquired through power purchase agreements. | Operations at the Tubarão I and Tubarão II pellet plants started up in the first half of 2018 in response to market conditions. Operations at these plants had been suspended since 2012. | 100.0 | – | |||||||||||||||||||
Fábrica (state of Minas Gerais) | Part of the Southern System. Receives iron ore from the Minas Itabirito mining complex, more specifically from João Pereira and Segredo mines. Production is mostly transported by MRS and EFVM. | 4.5 | Supplied through the national electricity grid. Produced directly by Vale or acquired through power purchase agreements. | Operations at the Fábrica plant have been suspended since February 2019, following a determination of the ANM (seeBusiness overview—Failure of the tailings dam at the Córrego do Feijão mine). | 100.0 | – | |||||||||||||||||||
Vargem Grande (state of Minas Gerais) | Part of the Southern System. Receives iron ore from the Minas Itabirito and Vargem Grande mining complexes, more specifically from Sapecado, Galinheiro, Capitão do Mato and Tamanduá mines. Production is mostly transported by MRS. | 7.0 | Supplied through the national electricity grid. Produced directly by Vale or acquired through power purchase agreements. | Operations at the Vargem Grande plant have been suspended since February 2019, following a determination of the ANM (seeBusiness overview—Failure of the tailings dam at the Córrego do Feijão mine). | 100.0 | – | |||||||||||||||||||
São Luís (state of Maranhão) | Part of the Northern System. Receives iron ore from the Carajás mines. Production is shipped to customers through our Ponta da Madeira maritime terminal. | 7.5 | Supplied through the national electricity grid. Produced directly by Vale or acquired through power purchase agreements. | Operation at the São Luís plant restarted in the second half of 2018 in response to market conditions. Operations at this plant had been suspended since 2012. | 100.0 | – | |||||||||||||||||||
Oman: |
| ||||||||||||||||||||||||
Vale Oman | Vale's industrial complex. Two pellet | 9.0 | Supplied through the national | Oman plants are supplied by iron ore | 70.0 | Oman Oil | Vale's industrial complex. Two pellet plants with a total nominal capacity of 9.0 Mtpy. The pelletizing plants are integrated with our distribution center that has a nominal capacity of 40.0 Mtpy. | 9.0 | Supplied through the national electricity grid. | Oman plants are supplied by iron ore from the Iron Quadrangle state of Minas Gerais through the Tubarão port and by iron ore from Carajás through the Ponta da Madeira maritime terminal. | 70.0 | Oman Oil Company S.A.O.C. | |||||||||||||
| | | | |
| | 43 | | |
Lines of Business
1.1.4 Iron ore pellets production
The following table sets forth information about our main iron ore pellet production.
| | | Production for the year ended December 31, | | Production for the year ended December 31, | ||||||||
|---|---|---|---|---|---|---|---|---|---|---|---|---|
| Company | | 2014 | | 2015 | | 2016 | | 2016 | | 2017 | | 2018 |
| | | (million metric tons) | | (million metric tons) | ||||||||
Vale(1) | | 43.0 | | 46.2 | | 46.2 | | 46.2 | | 50.3 | | 55.3 |
Samarco | | 12.1 | | 12.3 | | 0.0 | ||||||
| | | | | | | | | | | | | |
Total | | 55.1 | | 58.5 | | 46.2 | | 46.2 | | 50.3 | | 55.3 |
| | | | | | | | | | | | | | |
| | | | | | | | | | | | | |
1.1.5 Customers, sales and marketing
We supply all of our iron ore and iron ore pellets (including our share of joint-venture pellet production) to the steel industry. Prevailing and expected levels of demand for steel products affect demand for our iron ore and iron ore pellets. Demand for steel products is influenced by many factors, such as global manufacturing production, civil construction and infrastructure spending. For further information about demand and prices, seeOperating and financial review and prospects—Major factors affecting prices.
In 2016,2018, China accounted for 58%56% of our iron ore and iron ore pellet shipments, and Asia as a whole accounted for 71%70%. Europe accounted for 14%22%, followed by Brazil with 8%. Our 10ten largest customers collectively purchased 130146 million metric tons of iron ore and iron ore pellets from us, representing 38%40% of our 20162018 iron ore and iron ore pellet sales volumes and 36%39% of our total iron ore and iron ore pellet revenues. In 2016,2018, no individual customer accounted for more than 10%7% of our iron ore and iron ore pellet shipments.
Of our total 20162018 pellet production, including the production of our joint ventures, 62.9%54% was blast furnace pellets and 37.1%46% was direct reduction pellets. Blast furnace and direct reduction are different technologies employed by steel mills to produce steels, each using different types of pellets. In 2016,2018, the Asian market (mainly Japan, South Korea and Taiwan)Japan), the European market and the Brazilian market were the primary markets for our blast furnace pellets, while the Middle East North America and North AfricaAmerica were the primary markets for our direct reduction pellets.
We invest in customer service in order to improve our competitiveness. We work with our customers to understand their objectives and to provide them with iron ore solutions to meet specific customer needs. Using our expertise in mining, agglomeration and iron-making processes, we search for technical solutions that will balance the best use of our world-class mining assets and the satisfaction of our customers. We believe that our ability to provide customers with a total iron ore solution and the quality of our products are both very important advantages helping us improve our competitiveness in relation to competitors that may be more conveniently located geographically. In addition to offering technical assistance to our customers, we have sales offices in St. Prex (Switzerland), Tokyo (Japan), Seoul (South Korea), Singapore, Dubai (UAE) and Shanghai (China), which support the global sales by Vale International, and an office in Brazil, which supports sales to South America. These offices also allow us to stay in close contact with our customers, monitor their requirements and our contract performance, and ensure that our customers receive timely deliveries.
We sell iron ore and iron ore pellets under different arrangements, including long-term contracts with customers and on a spot basis through tenders and trading platforms. Our pricing is generally linked to market price indexes and uses a variety of mechanisms, including current spot prices and average prices over specified
| | | | |
| | 44 | | |
Lines of Business
periods. In cases where the products are priced before the final price is determinable at delivery, we recognize the sale based on a provisional price with a subsequent adjustment reflecting the final price.
In 2015 and 2016,2018, we hedged part of our total exposure to bunker oil prices relating to our owned fleet and long-term contracts of affreightment connected to our FOB and CFR international and domestic sales. The 20152018 hedge program was settled in 2015 and 2016. We expect the 2016 hedge program to be settled in 2017.2018.
1.1.6 Competition
The global iron ore and iron ore pellet markets are highly competitive. The main factors affecting competition are price, quality and range of products offered, reliability, operating costs and shipping costs.
We are competitive in the Asian market for two main reasons. First, steel companies generally seek to obtain the types (or blends) of iron ore and iron ore pellets that can produce the intended final product in the most economic and efficient manner. Our iron ore has low impurity levels and other properties that generally lead to lower processing costs. For example, in addition to its high grade,high-grade, the alumina content of our iron ore is very low compared to Australian ores, reducing consumption of coke and increasing productivity in blast furnaces, which is particularly important during periods of high demand. When market demand is strong, our quality differential generally becomes more valuable to customers. Second, steel companies often develop sales relationships based on a reliable supply of a specific mix of iron ore and iron ore pellets. Our ownership and operation of logistics facilities in the Northern and Southeastern Systems help us ensure that our products are delivered on time and at a relatively low cost. We rely on long-term contracts of affreightment to secure transport capacity and enhance our ability to offer our products in the Asian market at competitive prices on a CFR basis, despite higher transportationfreight costs compared to Australian producers. To support our commercial strategy for our iron ore business, we operate two distribution centers, one in Malaysia and one in Oman and we have long-term agreements with fivesixteen ports in China, which also serve as distribution centers.
In 2015, we launched the Brazilian blend fines (BRBF), a product resulting from blending fines from Carajás, which contain a higher concentration of iron and a lower concentration of silica in the ore, with fines from the Southern and Southeastern Systems, which contain a lower concentration of iron in the ore. In August 2018, Metal Bulletin launched a new index, the 62% Fe low-alumina index, which is based on our BRBF. During the remainder of 2018, the 62% Fe low-alumina index traded with a premium of US$4.50 per dmt over the 62% Fe index. The resulting blend offers strong performance in any kind of sintering operation. It is blended and soldproduced in our Teluk Rubiah Maritime Terminal in Malaysia and in fivesixteen distribution centers in China, which reduces the time to reach Asian markets and increases our distribution capillarity by using smaller vessels.
| | | | |
| | 45 | | |
Lines of Business
With respect to pellets, our major competitors are LKAB, Iron Ore Company of Canada, (IOC), Ferrexpo Plc, Arcelor Mittal Mines Canada (former Quebec Cartier Mining Co.) and Bahrain Steel (former Gulf Industrial Investment Co.).
1.2 Manganese ore and ferroalloys
1.2.1 Manganese ore operations and production
We conduct our manganese mining operations in Brazil through Vale S.A. and our wholly-ownedwholly owned subsidiaries Vale Manganês S.A. ("Vale Manganês") and MCR. Our mining operations are carried out under concessions from the federal government granted for an indefinite period. Our mines produce metallurgical ore, used primarily for the production of manganese ferroalloys, a raw material used to produce carbon and stainless steel.
| Mining complex | Company | Location | Description/History | Mineralization | Operations | Power source | Access/ Transportation | |||||||
|---|---|---|---|---|---|---|---|---|---|---|---|---|---|---|
Azul | Vale S.A. | State of Pará | Open-pit mining operations and on-site beneficiation plant. | Crushing, scrubbing and classification steps, producing lumps and fines. | Supplied through the national electricity grid. Produced directly by Vale or acquired through power purchase agreements. | Manganese ore is transported by truck and EFC railroad to the Ponta da Madeira maritime terminal. | ||||||||
Morro da Mina | Vale Manganês | State of Minas Gerais | Open-pit mining operations and | Crushing, screening and dense-heavy medium separation DMS / HMS process producing lumps to the Barbacena and Ouro Preto ferroalloy | Supplied through the national electricity grid. Acquired from regional utility companies. | Manganese ore is transported by | ||||||||
Urucum | MCR | State of Mato Grosso do Sul | Underground mining operations and on-site beneficiation plant. | Crushing, scrubbing and classification steps, producing lumps and fines. | Supplied through the national electricity grid. Acquired | Manganese ore is transported by |
| | | | |
| | 46 | | |
Lines of Business
The following table sets forth information about our manganese ore production, obtained after beneficiation process, and mass recovery for the year of 2016.recovery.
| | | Production for the year ended December 31, | | | Production for the year ended December 31, | | ||||||||||||||
|---|---|---|---|---|---|---|---|---|---|---|---|---|---|---|---|---|---|---|---|---|
| | | 2016 process recovery | | 2018 process recovery(1) | ||||||||||||||||
| Mine | Type | 2014 | 2015 | 2016 | Type | 2016 | 2017 | 2018 | ||||||||||||
| | | (million metric tons) | (%) | (million metric tons) | (%) | |||||||||||||||
Azul | Open pit | 1.7 | 1.7 | 1.7 | 51.2 | Open pit | 1.7 | 1.4 | 1.0 | 43 | ||||||||||
Morro da Mina | Open pit | 0.1 | – | 0.0 | 70.0 | Open pit | 0.0 | 0.1 | 0.1 | 82 | ||||||||||
Urucum | Underground | 0.6 | 0.7 | 0.7 | 82.0 | Underground | 0.7 | 0.7 | 0.7 | 79 | ||||||||||
| | | | | | | | | | | | | | | | | | | | | |
Total | Total | 2.4 | 2.4 | 2.4 | 2.4 | 2.2 | 1.8 | |||||||||||||
| | | | | | | | | | | | | | | | | | | | | | |
| | | | | | | | | | | | | | | | | | | | | |
1.2.2 Manganese ferroalloys operations and production
We conduct our manganese ferroalloys business through our wholly-ownedwholly owned subsidiary Vale Manganês. The production of manganese ferroalloys consumes significant amounts of electricity, which is provided through power purchase agreements. For information on the risks associated with potential energy shortages, seeRisk factors.
We produce several types of manganese ferroalloys, such as high carbon and medium carbon ferro-manganese and ferro-silicon manganese.
| Plant | Location | Description/History | Nominal capacity | Power source | ||||
|---|---|---|---|---|---|---|---|---|
Minas Gerais Plants | Cities of Barbacena and Ouro Preto | Barbacena has | Barbacena: 66,000 metric tons per year (54,000 metric tons per year of ferro-silicon manganese and 12,000 metric tons per year of ferro-manganese medium carbon). Ouro Preto: 64,000 metric tons per year of ferro-silicon manganese. | Supplied through the national electricity grid. Acquired from Furnas—Centrais Elétricas S.A. or through power purchase agreements. | ||||
Bahia Plant | City of Simões Filho | Four furnaces, two converters and a sintering plant. | 135,000 metric tons per year (42,000 metric tons per year of ferro-silicon manganese and 93,000 metric tons per year of high carbon ferro-manganese). The plant has a capacity to refine until 40,000 metric tons per year of ferro-manganese high carbon to produce ferro-manganese medium carbon alloy, according to market demand. | Supplied through the national electricity grid. |
| | | | |
| | 47 | | |
Lines of Business
The following table sets forth information about our manganese ferroalloys production.
| | | Production for the year ended December 31(1), | | Production for the year ended December 31(1), | ||||||||
|---|---|---|---|---|---|---|---|---|---|---|---|---|
| Plant | | 2014 | | 2015 | | 2016 | | 2016 | | 2017 | | 2018 |
| | | (thousand metric tons) | | (thousand metric tons) | ||||||||
Barbacena | | 50 | | 6 | | 48 | | 48 | | 58 | | 55 |
Ouro Preto | | 8 | | 1 | | – | | – | | 3 | | 10 |
Simões Filho | | 113 | | 92 | | 77 | | 77 | | 88 | | 103 |
| | | | | | | | | | | | | |
Total | | 171 | | 99 | | 124 | | 124 | | 149 | | 168 |
| | | | | | | | | | | | | | |
| | | | | | | | | | | | | |
We suspended operations at the Ouro Preto plant in February 2014, due to market conditions. In January 2015, the power purchase agreement pursuant to which we acquire energy for our Barbacena and Ouro Preto plants expired, and we also suspended operations in our Barbacena plant. The Barbacena plant resumed operations in February 2016. We are considering power supply alternatives to these plants, taking into consideration the energy prices and current market conditions for manganese ferroalloys.
1.2.3 Manganese ore and ferroalloys: sales and competition
The markets for manganese ore and ferroalloys are highly competitive. Competition in the manganese ore market takes place in two segments. HighHigh- and medium-grade manganese ore competes on a global seaborne basis, while low-grade ore competes on a regional basis. For some manganese ferroalloys, high and medium-grade ore is mandatory, while for otherespecially ferromanganese, higher-grade manganese ores are complementary.required to achieve competitive quality and cost, while medium- to lower-grade ores may be used in silicomanganese production. The main suppliers of high-grade ores are located in South Africa, Gabon, Australia and Brazil. The main producers of low-grade ores are located in the Ukraine, China, South Africa, Ghana, Kazakhstan, India and Mexico.
We compete in the seaborne market with both high- and medium-grade ores from the Azul and Urucum mines, where we benefit from extensive synergies with our iron ore operations, from mine to rail to port to vesselsvessel operations. Our main competitors in this segment are South32 (Australia and South Africa) and Eramet (Gabon). Our low-gradelower-grade ores, especially those from Morro da Mina, are consumed internally in our ferroalloy smelters.
The manganese ferroalloy market is characterized by a large number of participants who compete primarily on the basis of price. Our competitors are located principally in countries that produce manganese ore or carbon steel. Potential entrants and substitutes come from silicon or chrome ferroalloys, whowhich can occasionally shift their furnaces to manganese alloys, and from electrolytic manganese producers. Competitors may be either integrated smelters like us, who feed manganese ore from their own mines, or non-integrated smelters. The principal competitive factors in this market are the costs of manganese ore, electricity, logistics and reductants such as coke, coal and charcoal. We compete with both stand-alone producers and integrated producers that also mine their own ore.producers.
Focusing mainly in the Brazilian, South and SouthNorth American steelmaking customers, our ferroalloys operations also benefit from synergies with our iron ore sales, marketing, procurement and logistics activities. We buy our energy and coke supplies at reasonable market prices both though medium- andmedium-and long-term contracts. Competitors in the Brazilian market are about a dozen smelters with capacities from five to 90 thousand metric tons per year, most non-integrated onesof which are not integrated and some of themwhich are customers of our manganese ores. We have a distinctive advantage in comparison to them in producing ferroalloys with higher manganese content ferroalloys.content.
| | | | |
| | 48 | | |
2. BASE METALS
2. Base metals
2.1 Nickel
2.1 Nickel2.1.1 Operations
2.1.1 Operations
We conduct our nickel operations primarily through our wholly-ownedwholly owned subsidiary Vale Canada Limited, which operates two nickel production systems, one in the North Atlantic region and the other in the Asia Pacific region. We also produce copper as a coproduct in our nickel operations in Canada and, through Vale S.A., operate a third nickel production system, Onça Puma, in the South Atlantic region. Our nickel operations are set forth in the following table.
Company/Mining System | Location | Description/History | Operations | Mining title | Power source | Access/ Transportation | ||||||
|---|---|---|---|---|---|---|---|---|---|---|---|---|
| North Atlantic: | ||||||||||||
| Vale Canada | Integrated mining, milling, smelting and refining operations to process ore into finished nickel with a nominal capacity of 66,000 metric tons of refined nickel per year and additional nickel oxide feed for the refinery in |
Nickel. Primarily underground mining operations with nickel sulfide ore bodies, which also contain some copper, cobalt, PGMs, gold and silver. We also process external feeds from third parties and from our
Copper. We produce two intermediate copper products, copper concentrate and copper | Patented mineral rights with no expiration date; mineral leases expiring between | Supplied by Ontario's provincial electricity grid and produced directly by | Located by the Trans-Canada highway and the two major railways that pass through the Sudbury area. Finished products are delivered to the North American market by truck. For overseas customers, the products are loaded into containers and travel intermodally (truck/rail/containership) through both east and west coast Canadian ports. |
| | | | |
| | 49 | | |
Lines of Business
| Company/Mining System | Location | Description/History | Operations | Mining title | Power source | Access/ Transportation | ||||||
|---|---|---|---|---|---|---|---|---|---|---|---|---|
| Vale Canada |
Nickel. Primarily underground mining operations with nickel sulfide ore bodies, which also contain some copper and cobalt. | Order in Council leases expiring between 2020 and 2025; mineral leases expiring in 2034. | Supplied by Manitoba's provincial utility company. |
| Vale Newfoundland & Labrador Limited | Integrated open-pit mining and milling operation at Voisey's Bay producing nickel and copper concentrates with refining of nickel concentrate at Long Harbour into finished metal products with an expected nominal capacity of approximately 50,000 metric tons of refined nickel per year upon ramp-up. Voisey's Bay's operations started in 2005 and was purchased by us in 2006. | Comprised of the Ovoid open pit mine, and deposits for underground operations at a later stage. We mine nickel sulfide ore bodies, which also contain copper and cobalt. The Long Harbour facility continued to ramp up in | Mining lease expiring in 2027, with a right of further renewals for 10-year periods. | Power at Voisey's Bay is 100% supplied through Vale owned diesel generators. Power at the Long Harbour refinery is supplied by the Newfoundland and Labrador provincial utility company. | The nickel and copper concentrates from Voisey's Bay are transported to the port by haulage trucks and then shipped by | |||||||
| Vale Europe Limited | U.K.—Clydach, Wales | Stand-alone nickel refinery (producer of finished nickel), with nominal capacity of 40,000 metric tons per year. The Clydach refinery commenced operations in 1902 and was acquired by us in 2006. | Processes a nickel intermediate product, nickel oxide, supplied from our Sudbury and Matsuzaka operations to produce finished nickel in the form of powders and pellets. | – | Supplied through the national electricity grid. | Transported to final customer in the UK and continental Europe by truck. Products for overseas customers are trucked to the ports of Southampton and Liverpool and shipped by ocean container. | ||||||
| Asia/Pacific | ||||||||||||
PT Vale Indonesia Tbk ("PTVI") | Indonesia —Sorowako, Sulawesi | Open cast mining area and related processing facility (producer of nickel matte, an intermediate product) with a nominal capacity of approximately 80,000 metric tons of nickel in matte per year. PTVI's shares are traded on the Indonesia Stock Exchange. We indirectly hold 59.28% of PTVI's share capital, Sumitomo Metal Mining Co., Ltd ("Sumitomo") holds 20.09%, Sumitomo Corporation holds 0.14% and the public holds 20.49%.(2) PTVI was established in 1968, commenced its commercial operations in 1978, was listed on the Indonesian stock exchange in 1990 and was acquired by us in 2006. | PTVI mines nickel laterite ore and produces nickel matte, which is shipped primarily to our nickel refinery in Japan. Pursuant to life-of-mine off-take agreements, PTVI sells 80% of its production to our wholly owned subsidiary Vale Canada and 20% of its production to Sumitomo. | Contract of work expiring in 2025, entitled to two consecutive ten-year extensions, in the form of a business license, subject to approval of the Indonesian government.(2) | Produced primarily by PTVI's low-cost hydroelectric power plants on the Larona River (there are currently three facilities). PTVI has thermal generating facilities in order to supplement its hydroelectric power supply with a source of energy that is not subject to hydrological factors. | Trucked approximately 55 km to the river port at Malili and then loaded onto barges in order to load break-bulk vessels for onward shipment. |
| | | | |
| | 50 | | |
Lines of Business
| Company/Mining System | Location | Description/History | Operations | Mining title | Power source | Access/ Transportation | ||||||
|---|---|---|---|---|---|---|---|---|---|---|---|---|
| New | Mining and processing operations (producer of nickel oxide, nickel hydroxide and cobalt carbonate). We hold 95% of VNC's shares and the remaining 5% is held by Société de Participation Minière du Sud | Mining concessions expiring between | Supplied through the national electricity grid and by independent producers. | Products are packed into containers and are trucked approximately 4 km to Prony port and shipped by ocean container. | ||||||||
Vale Japan Limited | Japan —Matsuzaka | Stand-alone nickel refinery (producer of intermediate and finished nickel), with a nominal capacity of 60,000 metric tons per year. We own 87.2% of the shares, and Sumitomo owns the remaining shares. The refinery was built in 1965 and was acquired by us in 2006. | Produces intermediate products for further processing in our refineries in Asia and the UK, and finished nickel products using nickel matte sourced from PTVI. | – | Supplied through the national electricity grid. Acquired from regional utility companies. | Products trucked over public roads to customers in Japan. For overseas customers, the product is loaded into containers at the plant and shipped from the ports of Yokkaichi and Nagoya. | ||||||
Vale Taiwan Limited | Taiwan —Kaoshiung | Stand-alone nickel refinery (producer of finished nickel), with nominal capacity of 18,000 metric tons per year. The refinery commenced production in 1983 and was acquired by us in 2006. | Produced finished nickel for the stainless steel industry, primarily using intermediate products from our Matsuzaka and New Caledonian operations. We suspended operations at this plant in 2017 due to market conditions and it currently remains under care and maintenance. | – | Supplied through the national electricity grid. Acquired from regional utility companies. | Trucked over public roads to customers in Taiwan. For overseas customers, the product is loaded into containers at the plant and shipped from the port of Kaoshiung. | ||||||
Vale Nickel (Dalian) Co., Ltd | China —Dalian, Liaoning | Stand-alone nickel refinery (producer of finished nickel), with nominal capacity of 32,000 metric tons per year. We own 98.3% of the equity interest and Ningbo Sunhu Chemical Products Co., Ltd. owns the remaining 1.7%. The refinery commenced production in 2008. | Produces finished nickel for the stainless steel industry, primarily using intermediate products from our Matsuzaka and New Caledonian operations. | – | Supplied through the national electricity grid. Acquired from regional utility companies. | Product transported over public roads by truck and by railway to customers in China. It is also shipped in ocean containers to overseas and some domestic customers. |
| | | | |
| | 51 | | |
Lines of Business
| Company/Mining System | Location | Description/History | Operations | Mining title | Power source | Access/ Transportation | ||||||
|---|---|---|---|---|---|---|---|---|---|---|---|---|
| South Atlantic | ||||||||||||
| Vale/Onça Puma | Mining and smelting operation producing a | The Onça Puma mine is built | Mining concession for indefinite period. | Supplied through the national electricity grid. Produced directly by Vale or acquired through power purchase agreements. | The ferro-nickel is transported by truck to the Vila do Conde maritime terminal in the Brazilian state of Pará, and exported in ocean containers. |
| | | | |
| | 52 | | |
Lines of Business
2.1.2 Production
The following table sets forth our annual mine production by operating mine (or, on an aggregate basis in the case of the Sulawesi operating areas operated by PTVI in Indonesia, because it is organized by mining areas rather than individual mines) and the average percentage grades of nickel and copper. The mine production at Sulawesi represents the product from PTVI's screening station delivered to PTVI's processing plant and does not include nickel losses due to drying and smelting. For our Sudbury, Thompson and Voisey's Bay operations, the production and average grades represent the mine product delivered to those operations' respective processing plants and do not include adjustments due to beneficiation, smelting or refining. For our Onça Puma'sPuma operation in Brazil and VNC'sVNC operation in New Caledonia the production and average grade represents in-place ore production and does not include losses due to processing.
| | | 2014(1) | | 2015(1) | | 2016(1) | | 2016(1) | | 2017(1) | | 2018(1) | ||||||||||||||||||||||||
|---|---|---|---|---|---|---|---|---|---|---|---|---|---|---|---|---|---|---|---|---|---|---|---|---|---|---|---|---|---|---|---|---|---|---|---|---|
| | | | | Grade | | | | Grade | | | | Grade | | | | Grade | | | | Grade | | | | Grade | ||||||||||||
| | | Production | | Copper | | Nickel | | Production | | Copper | | Nickel | | Production | | Copper | | Nickel | | Production | | Copper | | Nickel | | Production | | Copper | | Nickel | | Production | | Copper | | Nickel |
Ontario operating mines | | | | | | | | | | | | | | | | | | | ||||||||||||||||||
Copper Cliff North | | 1,053 | | 1.45 | | 1.34 | | 1,138 | | 1.42 | | 1.38 | | 979 | | 1.44 | | 1.26 | | 979 | | 1.44 | | 1.26 | | 814 | | 1.40 | | 1.30 | | 746 | | 1.30 | | 1.29 |
Creighton | | 903 | | 1.81 | | 2.47 | | 774 | | 2.00 | | 2.33 | | 832 | | 2.17 | | 2.76 | | 832 | | 2.17 | | 2.76 | | 595 | | 2.91 | | 3.17 | | 608 | | 2.77 | | 2.55 |
Stobie | | 2,089 | | 0.58 | | 0.66 | | 1,471 | | 0.63 | | 0.73 | | 1,373 | | 0.57 | | 0.64 | | 1,373 | | 0.57 | | 0.64 | | 448 | | 0.53 | | 0.62 | | – | | – | | – |
Garson | | 678 | | 1.39 | | 1.75 | | 778 | | 1.39 | | 1.94 | | 711 | | 1.34 | | 1.91 | | 711 | | 1.34 | | 1.91 | | 635 | | 1.48 | | 1.93 | | 655 | | 1.35 | | 2.00 |
Coleman | | 1,385 | | 3.10 | | 1.52 | | 1,309 | | 2.95 | | 1.56 | | 1,209 | | 3.76 | | 1.47 | | 1,209 | | 3.76 | | 1.47 | | 1,007 | | 3.76 | | 1.53 | | 618 | | 3.31 | | 1.40 |
Ellen | | 181 | | 0.62 | | 1.07 | | 165 | | 0.70 | | 0.95 | | 75 | | 0.42 | | 0.88 | | 75 | | 0.42 | | 0.88 | | – | | – | | – | | – | | – | | – |
Totten | | 303 | | 1.98 | | 1.50 | | 528 | | 1.88 | | 1.62 | | 671 | | 1.86 | | 1.43 | | 671 | | 1.86 | | 1.43 | | 710 | | 1.90 | | 1.33 | | 710 | | 2.02 | | 1.39 |
| | | | | | | | | | | | | | | | | | | | | | | | | | | | | | | | | | | | | |
Total Ontario operations | | 6,591 | | 1.57 | | 1.36 | | 6,164 | | 1.64 | | 1.46 | | 5,850 | | 1.84 | | 1.47 | | 5,850 | | 1.84 | | 1.47 | | 4,210 | | 2.18 | | 1.65 | | 3,337 | | 2.10 | | 1.70 |
| | | | | | | | | | | | | | | | | | | | | | | | | | | | | | | | | | | | | | |
| | | | | | | | | | | | | | | | | | | | | | | | | | | | | | | | | | | | | |
Manitoba operating mines | | | | | | | | | | | | | | | | | | | ||||||||||||||||||
Thompson | | 1,184 | | – | | 1.95 | | 1,163 | | – | | 1.82 | | 1,140 | | – | | 1.97 | | 1,140 | | – | | 1.97 | | 1,229 | | – | | 1.94 | | 1,034 | | – | | 2.05 |
Birchtree | | 545 | | – | | 1.39 | | 564 | | – | | 1.47 | | 503 | | – | | 1.36 | | 503 | | – | | 1.36 | | 329 | | – | | 1.30 | | – | | – | | – |
| | | | | | | | | | | | | | | | | | | | | | | | | | | | | | | | | | | | | |
Total Manitoba operations | | 1,729 | | – | | 1.78 | | 1,727 | | – | | 1.71 | | 1,643 | | – | | 1.78 | | 1,643 | | – | | 1.78 | | 1,557 | | – | | 1.81 | | 1,034 | | – | | 2.05 |
| | | | | | | | | | | | | | | | | | | | | | | | | | | | | | | | | | | | | | |
| | | | | | | | | | | | | | | | | | | | | | | | | | | | | | | | | | | | | |
Voisey's Bay operating mines | | | | | | | | | | | | | | | | | | | ||||||||||||||||||
Ovoid | | 2,243 | | 1.54 | | 2.58 | | 2,328 | | 1.51 | | 2.57 | | 2,392 | | 1.44 | | 2.62 | | 2,392 | | 1.44 | | 2.62 | | 2,378 | | 1.44 | | 2.56 | | 1,895 | | 1.32 | | 2.37 |
| | | | | | | | | | | | | | | | | | | | | | | | | | | | | | | | | | | | | | |
| | | | | | | | | | | | | | | | | | | | | | | | | | | | | | | | | | | | | |
Sulawesi operating mining areas | | | | | | | | | | |||||||||||||||||||||||||||
Sulawesi operating mines | | | | | | | | | | |||||||||||||||||||||||||||
Sorowako | | 4,391 | | – | | 1.99 | | 4,694 | | – | | 1.99 | | 4,708 | | – | | 1.93 | | 4,708 | | – | | 1.93 | | 4,569 | | – | | 1.89 | | 4,469 | | – | | 1.90 |
| | | | | | | | | | | | | | | | | | | | | | | | | | | | | | | | | | | | | | |
| | | | | | | | | | | | | | | | | | | | | | | | | | | | | | | | | | | | | |
New Caledonia operating mines | | | | | | | | | | | | | | | | | | | ||||||||||||||||||
VNC | | 2,134 | | – | | 1.44 | | 2,561 | | – | | 1.41 | | 2,919 | | – | | 1.53 | | 2,919 | | – | | 1.53 | | 3,030 | | | 1.47 | | 2,620 | | – | | 1.46 | |
| | | | | | | | | | | | | | | | | | | | | | | | | | | | | | | | | | | | | | |
| | | | | | | | | | | | | | | | | | | | | | | | | | | | | | | | | | | | | |
Brazil operating mines | | | | | | | | | | | | | | | | | | | ||||||||||||||||||
Onça Puma | | 1,358 | | – | | 2.19 | | 1,024 | | – | | 2.13 | | 1,710 | | – | | 2.04 | | 1,710 | | – | | 2.04 | | 964 | | – | | 2.05 | | – | | – | | – |
| | | | | | | | | | | | | | | | | | | | | | | | | | | | | | | | | | | | | | |
| | | | | | | | | | | | | | | | | | | | | | | | | | | | | | | | | | | | | |
| | | | |
| | 53 | | |
Lines of Business
The following table sets forth information about our nickel production, including: nickel refined through our facilities and intermediates designated for sale. The numbers below are reported on a contained nickel ore-source basis.
| | | | | Finished production by ore source for the year ended December 31, | | | | Finished production by ore source for the year ended December 31, | ||||||||
|---|---|---|---|---|---|---|---|---|---|---|---|---|---|---|---|---|
| Mine | | Type | | 2014 | | 2015 | | 2016 | | Type | | 2016 | | 2017 | | 2018 |
| | | | | (thousand metric tons contained nickel) | | | | (thousand metric tons contained nickel) | ||||||||
Sudbury | | Underground | | 64.3 | | 54.4 | | 80.4 | | Underground | | 80.4 | | 61.9 | | 50.6 |
Thompson | | Underground | | 26.1 | | 24.8 | | 26.5 | | Underground | | 26.5 | | 23.0 | | 14.8 |
Voisey's Bay(1) | | Open pit | | 48.3 | | 53.0 | | 49.0 | | Open pit | | 49.0 | | 51.8 | | 38.6 |
Sorowako(2) | | Open cast | | 78.7 | | 79.5 | | 81.1 | | Open cast | | 81.1 | | 73.1 | | 72.1 |
Onça Puma | | Open pit | | 21.4 | | 24.4 | | 24.1 | | Open pit | | 24.1 | | 24.7 | | 22.9 |
New Caledonia(3) | | Open pit | | 18.7 | | 26.9 | | 34.3 | | Open pit | | 34.3 | | 40.3 | | 32.5 |
External(4) | | – | | 17.5 | | 27.6 | | 15.6 | | – | | 15.6 | | 13.1 | | 13.1 |
| | | | | | | | | | | | | | | | | |
Total(5) | | | 274.9 | | 290.6 | | 311.0 | Total(5) | | 311.0 | | 288.2 | | 244.6 | ||
| | | | | | | | | | | | | | | | | | |
| | | | | | | | | | | | | | | | | |
2.1.3 Customers and sales
Our nickel customers are broadly distributed on a global basis. In 2016, 47%2018, 46% of our refined nickel sales were delivered to customers in Asia, 27%24% to Europe, 24%28% to North America and 1%2% to other markets. We have short-term fixed-volume contracts with customers for the majority of our expected annual nickel sales. These contracts generally provide stable demand for a significant portion of our annual production.
Nickel is an exchange-traded metal, listed on the London Metal Exchange ("LME") and Shanghai Futures Exchange ("SHFE"), and most nickel products are priced according to a discount or premium to the LME price, depending primarily on the nickel product's physical and technical characteristics. Our finished nickel products represent what is known in the industry as "primary" nickel, meaning nickel produced principally from nickel ores (as opposed to "secondary" nickel, which is recovered from recycled nickel-containing material). Finished primary nickel products are distinguishable in terms of the following characteristics, which determine the product price level and the suitability for various end-use applications:
| | | | |
| | 54 | | |
Lines of Business
In 2016,2018, the principal end-usefirst-use applications for primary nickel were:
In 2016, 58%2018, 67% of our refined nickel sales were made into non-stainless steel applications, compared to the industry average for primary nickel producers of 30%. This brings more diversification and sales volume stability to our nickel revenues. As a result of our focus on such higher-value segments, our average realized nickel prices for refined nickel have typically exceeded LME cash nickel prices.
We offer sales and technical support to our customers on a global basis through an established marketing network headquartered at our head office in Toronto (Canada). We have a well-established global marketing network for finished nickel, based at our head office in Toronto (Canada). We also have sales and technical support distributed around the world with primary back offices in Singapore and Toronto (Canada) and have sales managers located in St.Prex (Switzerland), Saddle Brook,Paramus, New Jersey (United States) and at several sites throughout Asia. For information about demand and prices, seeOperating and financial review and prospects—Major factors affecting prices.
2.1.4 Competition
The global nickel market is highly competitive. Our key competitive strengths include our long-life mines, our low cash costs of production relative to other nickel producers, sophisticated exploration and processing technologies, and a diversified portfolio of products. Our global marketing reach, diverse product mix, and customer technical support direct our products into applications and geographic regions that offer the highest margins for our products.
Our nickel deliveries represented 16%11% of global consumption for primary nickel in 2016.2018. In addition to us, the largest mine-to-market integrated suppliers in the nickel industry (each with its own integrated facilities, including nickel mining, processing, refining and marketing operations) are Nornickel, Glencore, Jinchuan Nonferrous Metals Corporation and Sumitomo Metal Mining Co. Ltd.BHP Billiton. Together with us, these companies accounted for about 38%37% of global refined primary nickel production in 2016.2018.
The nickel market is based on the quality of the nickel products. Class I products, which have higher nickel content and lower levels of deleterious elements, are more suitable for high-end nickel applications, such as utilization in the specialties industries (e.g.: aircraft and spacecraft) and in batteries for electric vehicles. Class II products, which present lower nickel content and higher levels of deleterious elements, are mostly absorbed into the stainless steel market. The majority of the world nickel production is composed of Class II nickel products (57% of the global market in 2018), which include the increasingly relevant nickel pig iron (NPI, with nickel content under 15%). Most of our products are high quality nickel products, which makes Vale the producer of choice for specialty nickel applications. In 2018, 58% of our nickel products were Class I and 26% were battery-suitable Class II products, a product that does not fully satisfy the specifications of Class I, but has potential for use in electric vehicles. Looking forward, as a result of the worldwide lower availability of nickel sulfide reserves (the specific kind of orebodies that source Class I nickel) when compared to nickel laterite reserves (mainly producing Class II products), we expect the
| | | | |
| | 55 | | |
Lines of Business
market for Class I nickel to be further tightened, creating more opportunities for our premium product portfolio.
While stainless steel production is a major driver of global nickel demand, stainless steel producers can obtain nickel with a wide range of nickel content, including secondary nickel (scrap). The choice between primary and secondary nickel is largely based on their relative prices and availability. SeeOperating and Financial Review and Prospects—Major factors affecting prices—Nickel.
Competition in the nickel market is based primarily on quality and reliability of supply and price. We believe our operations are competitive in the nickel market because of the high quality of our nickel products and our relatively low production costs.
| | | | |
| | 56 | | |
Lines of Business
2.2 CopperCOPPER
2.2.1 Operations
We conduct our copper operations at the parent-company level in Brazil and through our subsidiaries in Canada.
| Mining complex/Location | | Location | | Description/History | | Mineralization/Operations | | Mining title | | Power source | | Access/Transportation |
|---|---|---|---|---|---|---|---|---|---|---|---|---|
| Brazil: | | | | | | | ||||||
| Vale/Sossego | | Carajás, state of Pará. | | Two main copper ore bodies, Sossego and Sequeirinho, and a processing facility to concentrate the ore. Sossego was developed by Vale. Production started in 2004 and has a nominal capacity of | | The copper ore is mined using the open-pit method, and the run-of-mine is processed by means of standard primary crushing and conveying, SAG milling (a semi-autogenous mill that uses a large rotating drum filled with ore, water and steel grinding balls to transform the ore into a fine slurry), ball milling, copper concentrate flotation, tailings disposal, concentrate thickening, filtration and load out. | | Mining concession for an indefinite period. | | Supplied through the national electricity grid. Produced directly by Vale or acquired through power purchase agreements. | | We truck the concentrate to a storage terminal in Parauapebas and then transport it via the EFC railroad to the Itaqui Port in São Luís, |
| Vale/Salobo | | Carajás, state of Pará. | | Salobo I processing plant started production in 2012 and has a total capacity of | | Our Salobo copper mine is mined using the open-pit method, and the run-of-mine is processed by means of standard primary and secondary crushing, conveying, roller press grinding, ball milling, copper concentrate flotation, tailings disposal, concentrate thickening, filtration and load out. | | Mining concession for an indefinite period. | | Supplied through the national electricity grid. Acquired through power purchase agreements. | | We truck the concentrate to a storage terminal in Parauapebas and then transport it via the EFC railroad to the Itaqui Port in São Luís, |
| Canada: | | | | | | | ||||||
| Vale Canada | | Canada—Sudbury, Ontario | | | See —Base metals—Nickel—Operations | | | |||||
| Vale Canada/ Voisey's Bay | | Canada—Voisey's Bay, Newfoundland and Labrador | | | See —Base metals—Nickel—Operations | |||||||
| | | |||||||||||
| | | | | ||||
| | 57 | | |
Lines of Business
2.2.2 Production
The following table sets forth our annual mine production in our Salobo and Sossego mines and the average percentage grades of copper. The production and average grade represents in-place ore production and does not include losses due to processing. For the annual production of copper as a coproduct in our nickel operations, see—Base metals—Nickel—Production.
| | | 2014(1) | | 2015(1) | | 2016(1) | | 2016(1) | | 2017(1) | | 2018(1) | ||||||||||||
|---|---|---|---|---|---|---|---|---|---|---|---|---|---|---|---|---|---|---|---|---|---|---|---|---|
| | | Production | | Grade | | Production | | Grade | | Production | | Grade | | Production | | Grade | | Production | | Grade | | Production | | Grade |
Brazil | | | | | | | | | | | | | ||||||||||||
Sossego | | 15,105 | | 0.86 | | 12,857 | | 0.93 | | 12,687 | | 0.82 | | 12,687 | | 0.82 | | 12,380 | | 0.81 | | 15,664 | | 0.72 |
Salobo | | 18,644 | | 0.84 | | 44,296 | | 0.62 | | 57,279 | | 0.62 | | 57,279 | | 0.62 | | 61,573 | | 0.63 | | 50,963 | | 0.69 |
| | | | | | | | | | | | | | | | | | | | | | | | | |
Total | | 33,749 | | 0.85 | | 57,153 | | 0.69 | | 69,966 | | 0.66 | | 69,966 | | 0.66 | | 73,953 | | 0.66 | | 66,627 | | 0.70 |
| | | | | | | | | | | | | | | | | | | | | | | | | | |
| | | | | | | | | | | | | | | | | | | | | | | | | |
The following table sets forth information on our copper production.
| | | | | Finished production by ore source for the year ended December 31, | | | | Finished production by ore source for the year ended December 31, | ||||||||
|---|---|---|---|---|---|---|---|---|---|---|---|---|---|---|---|---|
| Mine | | Type | | 2014 | | 2015 | | 2016 | | Type | | 2016 | | 2017 | | 2018 |
| | | | | (thousand metric tons) | | | | (thousand metric tons) | ||||||||
Brazil: | | | | | | | | | ||||||||
Salobo | | Open pit | | 98 | | 155 | | 176 | | Open pit | | 176 | | 193 | | 193 |
Sossego | | Open pit | | 110 | | 104 | | 93 | | Open pit | | 93 | | 100 | | 92 |
Canada: (as coproduct of nickel operations) | | | | | | | | | ||||||||
Sudbury | | Underground | | 98 | | 98 | | 122 | | Underground | | 122 | | 98 | | 72 |
Voisey's Bay | | Open pit | | 33 | | 32 | | 32 | | Open pit | | 32 | | 34 | | 26 |
Thompson | | Underground | | 2 | | 1 | | 3 | | Underground | | 3 | | 2 | | 1 |
External(1) | | – | | 29 | | 23 | | 21 | | – | | 21 | | 12 | | 11 |
Zambia: | | | | | | | | | ||||||||
Lubambe(2) | | Underground | | 10 | | 10 | | 8 | | Underground | | 8 | | 7 | | – |
| | | | | | | | | | | | | | | | | |
Total | | | 380 | | 424 | | 453 | | | 453 | | 446 | | 395 | ||
| | | | | | | | | | | | | | | | | | |
| | | | | | | | | | | | | | | | | |
2.2.3 Customers and sales
We sell copper concentrates from Sossego and Salobo under mediummedium- and long-term contracts to copper smelters in Europe, India and Asia. We have medium-term copper supply agreements with Glencore Canada Corporationdomestic customer for part of the copper concentrates and copper matte produced in Sudbury, which are also sold under long-term contracts in Europe and Asia. We sell copper concentrates from Voisey's Bay under long-term contracts to customers in Europe and electrowon copper cathodes from Sudbury and Long Harbour in North America under short-term sales agreements.
| | | | |
| | 58 | | |
Lines of Business
2.2.4 Competition
The global refined copper market is highly competitive. Producers are integrated mining companies and custom smelters, covering all regions of the world, while consumers are principally wire rod and copper-alloy producers. Competition occurs mainly on a regional level and is based primarily on production costs, quality, reliability of supply and logistics costs. The world's largest copper cathode producers are Corporación Nacional del Cobre de Chile ("Codelco"), Aurubis AG, Jiangxi Copper Corporation Ltd., Glencore, Tongling Non-Ferrous Metals Group Co. and Freeport McMoRan Copper & Gold Inc. ("Freeport-McMoRan"), Aurubis AG, Jiangxi Copper Corporation Ltd. and Glencore,each operating at the parent-company level or through subsidiaries. Our participation in the global refined copper cathodes market is marginal as we position ourselves more competitively in the copper concentrate market.
Copper concentrate and copper anodematte are intermediate products in the copper production chain. Both the concentrate and anodematte markets are competitive, having numerous producers but fewer participants and smaller volumes than in the copper cathode market due to the high levels of integration by the major copper producers.
In the copper concentrate market, mining occurs on a global basis with a predominant share from South America, while consumers are custom smelters located mainly in Europe and Asia. Competition in the custom copper concentrate market occurs mainly on a global level and is based on production costs, quality, logistics costs and reliability of supply. The largest competitors in the copper concentrate market are Freeport McMoRan, Glencore, BHP Billiton, Freeport McMoRan, Codelco, Anglo American, and Antofagasta plc, Rio Tinto and First Quantum; each operating at the parent-company level or through subsidiaries. Our market share in 20162018 was about 4%2% of the total custom copper concentrate market.
The copper anode/blister market is very limited; generally, anodes are produced to supply each company's integrated refinery. The trade in anodes/blister is limited to those facilities that have more smelting capacity than refining capacity or to those situations where logistics cost savings provide an incentive to source anodes from outside smelters. The largest competitors in the copper anode market in 2016 included Glencore, First Quantum Minerals Ltd, Codelco, and China Nonferrous Metals, operating at the parent-company level or through subsidiaries.
2.3 PGMs and other precious metals
As byproducts of our Sudbury nickel operations in Canada, we recover significant quantities of PGMs, as well as small quantities of gold and silver. We operate a processing facility in Port Colborne, Ontario, which produces PGMs, gold and silver intermediate products using feed from our Sudbury operation. We have aThe refinery in Acton, England, where we process our intermediate products, as well asPGM intermediates and PGM feeds purchased from unrelatedthird parties were processed was closed in 2018 as part of business optimization, and toll-refined materials. In 2016,the PGM concentrates from our Canadian operations supplied about 88% of our PGM production, whichPort Colborne operation are being sold to third parties. Gold and silver intermediates are also includes metals purchased from unrelatedsold to third parties. Our base metals marketing department sells our own PGMs and other precious metals, as well as products from unrelated parties and toll-refined products, on a sales agency basis. Our copper concentrates from our Salobo and Sossego mines in Carajás, in the Brazilian state of Pará, also contain gold, the value of which we realize in the sale of those products.
In February 2013, we sold to Wheaton Precious Metals Corp. (formerly Silver WheatonWheaton) ("Wheaton") 25% of the gold produced as a byproduct at our Salobo copper mine, in Brazil, for the life of that mine, and 70% of the gold produced as a byproduct at our Sudbury nickel mines, in Canada, for 20 years. In each of March 2015 and August 2016, we sold to Silver Wheaton an additional 25% of the gold produced as a byproduct at our Salobo copper mine. In consideration for the August 2016 sale, we received an initial cash payment of US$800 million, an option value of approximately US$23 million from a reduction of the exercise price of the warrants of Silver Wheaton held by Vale since 2013, and ongoing payments of the lesser of US$400 per ounce (subject to a 1% annual inflation adjustment starting January 1, 2019) and the prevailing market price, for each ounce of gold that we deliver under the agreement. We may receive an additional cash payment if we expand our capacity to process Salobo copper ores to more than 28 Mtpy before 2036. The additional cash payment may range from US$113 million to US$953 million, depending on ore grade, timing and size of the expansion. SeeBusiness overview—Significant changes in our business. Pursuant to the gold stream contract, Silver Wheaton received 247,287282,879 oz. of gold in 2016.2018.
| | | | |
| | 59 | | |
Lines of Business
The following table sets forth information on the contained volume of precious metals and platinum group metals (PGMs) as a byproduct of our production of nickel and copper concentrates.
| Mine | | Type | | 2014 | | 2015 | | 2016 | | Type | | 2016 | | 2017 | | 2018 |
|---|---|---|---|---|---|---|---|---|---|---|---|---|---|---|---|---|
| | | | | (thousand troy ounces of contained metal) | | | | (thousand troy ounces of contained metal) | ||||||||
Sudbury(1): | | | | | | | | | ||||||||
Platinum | | Underground | | 182 | | 154 | | 166 | | Underground | | 166 | | 144 | | 135 |
Palladium | | Underground | | 398 | | 341 | | 322 | | Underground | | 322 | | 214 | | 218 |
Gold(2) | | Underground | | 83 | | 89 | | 98 | | Underground | | 98 | | 74 | | 57 |
Salobo: | | | | | | | | | ||||||||
Gold(2) | | Open pit | | 160 | | 251 | | 317 | | Open pit | | 317 | | 346 | | 361 |
Sossego: | | | | | | | | | ||||||||
Gold | | Open pit | | 78 | | 80 | | 67 | | Open pit | | 67 | | 65 | | 59 |
2.4 Cobalt
We recover significant quantities of cobalt as a byproduct of our nickel operations. In 2016,2018, we produced 1,8511,288 metric tons of refined cobalt metal (in the form of cobalt rounds) at our Port Colborne refinery, 3,1881,630 metric tons of cobalt rounds at our Long Harbour refinery, 2,105 metric tons of cobalt in a cobalt-based intermediate product at our nickel operations in New Caledonia, and our remaining cobalt production consisted of 76170 metric tons of cobalt contained in other intermediate products (such as nickel concentrates). As a result of the ramp-up of VNC operations in New Caledonia, our production of cobalt intermediate as a byproduct of our nickel production is increasing.will increase in the coming years. We sell cobalt on a global basis. OurThe cobalt metal isand the Long-Harbour cobalt rounds are electro-refined at our Port Colborne refinery and hashave very high purity levels (99.8%), meeting the LME contract specification. Cobalt metal is used in the production of various alloys, particularly for aerospace applications, as well as the manufacture of cobalt-based chemicals.
In 2016, Long HarbourJune 2018, we sold to Wheaton and Cobalt 27 Capital Corp. ("Cobalt 27") a combined 75% of the cobalt produced as a byproduct at our Voisey's Bay mine from January 1, 2021, which includes the ramp-down of production from the existing mine and the life-of-mine production from our underground mine expansion project. In consideration, we received US$690 million in cash from Wheaton and Cobalt 27 upon closing of the transaction on June 28, 2018, and will receive additional payments of 20%, on average, of cobalt intermediate withprices upon delivery. Vale remains exposed to approximately 40% of future cobalt production from Voisey's Bay, through Vale's retained interest in 25% of cobalt production and the operation expected to begin producing high quality cobalt metaladditional payments upon delivery. SeeBusiness overview—Significant changes in 2017.
our business. The following table sets forth information on our cobalt production.
| | | | | Finished production by ore source for the year ended December 31, | | | | Finished production by ore source for the year ended December 31, | ||||||||
|---|---|---|---|---|---|---|---|---|---|---|---|---|---|---|---|---|
| Mine | | Type | | 2014 | | 2015 | | 2016 | | Type | | 2016 | | 2017 | | 2018 |
| | | | | (contained metric tons) | | | | (contained metric tons) | ||||||||
Sudbury | | Underground | | 833 | | 751 | | 882 | | Underground | | 882 | | 840 | | 520 |
Thompson | | Underground | | 489 | | 365 | | 700 | | Underground | | 700 | | 138 | | 198 |
Voisey's Bay | | Open pit | | 952 | | 849 | | 887 | | Open pit | | 887 | | 1,829 | | 1,902 |
New Caledonia | | Open pit | | 1,384 | | 2,391 | | 3,188 | | Open pit | | 3,188 | | 2,780 | | 2,104 |
Others(1) | | – | | 84 | | 177 | | 143 | | – | | 143 | | 224 | | 371 |
| | | | | | | | | | | | | | | | | |
Total | | | 3,743 | | 4,533 | | 5,799 | | | 5,799 | | 5,811 | | 5,093 | ||
| | | | | | | | | | | | | | | | | | |
| | | | | | | | | | | | | | | | | |
| | | | |
| | 60 | | |
3.1 Operations
We produce metallurgical and thermal coal through our subsidiary Vale Moçambique, which operates the Moatize mine. We also have a minority interest in a Chinese company, Henan Longyu Energy Resources Co., Ltd. ("Longyu"). In November 2016, we sold our coal operation in Carborough Downs in Australia.
In September 2016, we agreed with Mitsui the new terms of our partnership in coal assets in Mozambique. Under the new terms, Mitsui agreed to pay us an amount of up to US$450 million, consisting of: (i) an aggregate of US$255 million for 15% of Vale's 95% stake in the Moatize coal mine and (ii) an additional amount of up to US$195 million, subject to certain conditions, including mine performance. Mitsui will also contribute an amount of approximately US$348million for a 50% stake of Nacala Logistics Corridor and extend a long-term facility of US$165 million to Nacala Logistics Corridor. We completed the equity transaction with Mitsui on March 27, 2017. The total value of the transaction will be approximately US$770 million, including all amounts mentioned above except the additional amount of up to US$195 million, which is subject to certain conditions, such as mining performance, still to be satisfied. From these US$770 million, we received US$733 million upon completion of the equity transaction on March 27, 2017, and we expect to receive the remainder upon closing of the project financing, which is expected to occur during 2017. If the project financing is not signed before the end of 2017, Mitsui has certain rights to transfer its participation in the Moatize coal mine and the Nacala Logistics Corridor back to us.
| Company/Mining complex | | Location | | Description/History | | Mineralization/ Operations | | Mining title | | Power source | | Access/ Transportation |
|---|---|---|---|---|---|---|---|---|---|---|---|---|
| Vale Moçambique | | | | | | | ||||||
| Moatize | | Tete, Mozambique | | Open-cut mine, which was developed directly by Vale. Operations started in August 2011 and are expected to reach a nominal production capacity of 22 Mtpy, considering the Moatize expansion, comprised of metallurgical and thermal coal and the Nacala Logistics Corridor | | Produces metallurgical and thermal coal. Moatize's main branded | | Mining concession expiring in 2032, renewable thereafter. | | Supplied by local utility company. Back up supply on site. | | The coal is transported from the mine to the |
| | | | |
| | 61 | | |
Lines of Business
3.2 Production
The following table sets forth information on our marketable coal production.
| | | | | Production for the year ended December 31, | | | | Production for the year ended December 31, | ||||||||
|---|---|---|---|---|---|---|---|---|---|---|---|---|---|---|---|---|
| Operation | | Mine type | | 2014 | | 2015 | | 2016 | | Mine type | | 2016 | | 2017 | | 2018 |
| | | | | (thousand metric tons) | | | | (thousand metric tons) | ||||||||
Metallurgical coal: | | | | | | | | | ||||||||
Moatize(1) | | Open-cut | | 3,124 | | 3,401 | | 3,480 | | Open-cut | | 3,480 | | 6,953 | | 6,161 |
| | | | | | | | | | | | | | | | | |
Thermal coal: | | | | | | | | | ||||||||
Moatize(1) | | Open-cut | | 1,784 | | 1,559 | | 2,012 | | Open-cut | | 2,012 | | 4,307 | | 5,444 |
| | | | | | | | | | | | | | | | | |
3.3 Customers and sales
Coal sales from our Moatize operations, in Mozambique, target global steel and energy markets, including Asia, Africa, Europe and the Americas. Our Chinese coal joint venture directs its sales into the Chinese domestic market.
3.4 Competition
The global coal industry comprises markets for black (metallurgicalmetallurgical and thermal) and brown (lignite)thermal coal and is highly competitive.
The demand for steel, especially in Asia, underpins demand for metallurgical coal, while demand for electricity underpins demand for thermal coal. We expect some increase in coal supply from the United States, Canada and Australia, driven by increased prices in the second half of 2016, which would thus rebalance the market following the price increases caused by China intervention policies relating to domestic coal production.
Competitiveness in the coal industry is primarily based primarily on the economics of production costs, coal quality, transportation costs and proximity to the market. Our key competitive strengths are completion of a new and competitive transportation corridor the proximity to the Atlantic and Indian markets (as compared to our main competitors) and the size and quality of our reserves. The logistics facilities in Mozambique help us ensure that our products are delivered on time and at a relatively low cost in comparison to lengthy waits at the ports in Queensland, Australia and on the east coast of the United States.
Major participantsOur main competitors in the seabornemetallurgical coal marketbusiness are located in Australia and Canada and include subsidiaries, affiliates and joint ventures of BHP Billiton, Glencore, Anglo American, Rio Tinto, Teck, Peabody, Jellinbah Resources, among others. In the thermal coal business, our main competitors are located in Indonesia, South Africa, Australia, Colombia, USA, Russia and include subsidiaries affiliates and joint ventures of Glencore, Anglo American, Drummond Co, Pt Bumi Resources and PT Adaro, Energy and the Shenhua Group, among others.
| | | | |
| | 62 | | |
Lines of Business
4. INFRASTRUCTURE
4. Infrastructure
4.1 Logistics
4.1 Logistics
We have developed our logistics business based on the transportation needs of our mining operations and we also provide transportation services for other customers. We conduct our logistics businesses at the parent-company level and through subsidiaries and joint ventures, as set forth in the table below.
| | | | | | | Our share of capital | | | | | | | | Our share of capital | | | ||||||||||||
|---|---|---|---|---|---|---|---|---|---|---|---|---|---|---|---|---|---|---|---|---|---|---|---|---|---|---|---|---|
| Company | | Business | | Location | | Voting | | Total | | Partners | | Business | | Location | | Voting | | Total | | Partners | ||||||||
| | | | | | | (%) | | | | | | | | (%) | | | ||||||||||||
Vale | | Railroad (EFVM and EFC), port and maritime terminal operations | | Brazil | | | – | | | – | | – | | Railroad (EFVM and EFC), port and maritime terminal operations | | Brazil | | | – | | | – | | – | ||||
VLI(1) | | Railroad, port, inland terminal and maritime terminal operations. Holding of certain general cargo logistics assets | | Brazil | | | 37.6 | | | 37.6 | | FI-FGTS, Mitsui and Brookfield | | Railroad, port, inland terminal and maritime terminal operations. Holding of certain general cargo logistics assets | | Brazil | | | 37.6 | | | 37.6 | | FI-FGTS, Mitsui and Brookfield | ||||
MRS | | Railroad operations | | Brazil | | | 46.75 | | | 48.12 | | CSN, Congonhas Minérios, Usiminas Participações e Logísticas, Gerdau, Railvest Investments and public investors. | | Railroad operations | | Brazil | | | 47.1 | | | 48.2 | | CSN, Congonhas Minérios, Usiminas Participações e Logísticas, Gerdau, Railvest Investments and public investors. | ||||
CPBS | | Port and maritime terminal operations | | Brazil | | | 100 | | | 100 | | – | | Port and maritime terminal operations | | Brazil | | | 100 | | | 100 | | – | ||||
PTVI | | Port and maritime terminal operations | | Indonesia | | | 59.2 | | | 59.2 | | Sumitomo, public investors | | Port and maritime terminal operations | | Indonesia | | | 59.2 | | | 59.2 | | Sumitomo, public investors | ||||
Vale Logística Argentina | | Port operations | | Argentina | | | 100 | | | 100 | | – | | Port operations | | Argentina | | | 100 | | | 100 | | – | ||||
CEAR(2)(4) | | Railroad | | Malawi | | | 43.4 | | | 43.4 | | Portos e Caminhos de Ferro de Moçambique, E.P. | ||||||||||||||||
CDN(3)(4) | | Railroad and maritime terminal operations | | Mozambique | | | 43.4 | | | 43.4 | | Portos e Caminhos de Ferro de Moçambique, E.P. | ||||||||||||||||
CLN(4) | | Railroad and port operations | | Mozambique | | | 80.0 | | | 80.0 | | Portos e Caminhos de Ferro de Moçambique, E.P. | ||||||||||||||||
Vale Logística Uruguay | | Port operations | | Uruguay | | | 100 | | | 100 | | – | ||||||||||||||||
Central East African Railways ("CEAR")(3) | | Railroad | | Malawi | | | 46.2 | | | 46.2 | | Mitsui, investors | ||||||||||||||||
Corredor de Desenvolvimento do Norte ("CDN")(3) | | Railroad | | Mozambique | | | 46.2 | | | 46.2 | | Mitsui, investors | ||||||||||||||||
Corredor de Desenvolvimento do Norte—Porto ("CDN Porto")(3) | | Port and maritime terminal operations | | Mozambique | | | 46.2 | | | 46.2 | | Mitsui, investors | ||||||||||||||||
Corredor Logístico Integrado de Nacala S.A. ("CLN")(4) | | Railroad and port operations | | Mozambique | | | 50.0 | | | 50.0 | | Mitsui | ||||||||||||||||
Vale Logistics Limited ("VLL")(4) | | Railroad operations | | Malawi | | | 100 | | | 100 | | – | | Railroad operations | | Malawi | | | 50.0 | | | 50.0 | | Mitsui | ||||
Transbarge Navegación | | Paraná and Paraguay Waterway System (Convoys) | | Paraguay | | | 100 | | | 100 | | – | | Paraná and Paraguay Waterway System (Convoys) | | Paraguay | | | 100 | | | 100 | | – | ||||
VNC | | Port and maritime terminal operations | | New Caledonia | | | 95.0 | | | 95.0 | | SPMSC | | Port and maritime terminal operations | | New Caledonia | | | 95.0 | | | 95.0 | | SPMSC | ||||
VMM | | Port and maritime terminal operations | | Malaysia | | | 100 | | | 100 | | – | | Port and maritime terminal operations | | Malaysia | | | 100 | | | 100 | | – | ||||
Vale Newfoundland & Labrador Limited | | Port operations | | Voisey's Bay and Long Harbour, in Newfoundland and Labrador | | | 100 | | | 100 | | – | | Port operations | | Voisey's Bay and Long Harbour, in Newfoundland and Labrador | | | 100 | | | 100 | | – | ||||
Vale Oman Distribution Center LLC | | Port and maritime terminal operations | | Oman | | | 100 | | | 100 | | – | | Port and maritime terminal operations | | Oman | | | 100 | | | 100 | | – | ||||
| | | | |
| | 63 | | |
Lines of Business
4.1.1 Railroads
4.1.1 Railroads
Brazil
Vitória a Minas railroad(" ("EFVM"). The EFVM railroad links our Southeastern System mines in the Iron Quadrangle region in the Brazilian state of Minas Gerais to the Tubarão Port,port, in Vitória, in the Brazilian state of Espírito Santo. We operate this 905-kilometer888-kilometer railroad under a 30-year renewable concession, which expires in 2027. The EFVM railroad consists of two lines of track extending for a distance of 601584 kilometers to permit continuous railroad travel in opposite directions, and single-track branches of 304 kilometers. Industrial manufacturers are located in this area and major agricultural regions are also accessible to it. VLI has rights to usepurchase railroad transportation capacity on our EFVM railroad. In 2016,2018, the EFVM railroad transported a daily average of 329.3334.5 thousand metric tons of iron ore and 61.160.2 thousand metric tons of other cargo. The EFVM railroad also carried one1,135 million passengers in 2016.2018. In 2016,2018, we had a fleet of 325322 locomotives and 19,13519,413 wagons at EFVM, which were operated by Vale and third parties.
Carajás railroad(" ("EFC"). The EFC railroad links our Northern System mines in the Carajás region in the Brazilian state of Pará to the Ponta da Madeira maritime terminal, in São Luis, in the Brazilian state of Maranhão. We operate the EFC railroad under a 30-year renewable concession, which expires in 2027. EFC extends for 997 kilometers from our Carajás mines to our Ponta da Madeira maritime terminal complex facilities located near the Itaqui Port.facilities. Its main cargo is iron ore, principally carried for us. VLI has rights to usepurchase railroad transportation capacity on our EFC railroad. In 2016,2018, the EFC railroad transported a daily average of 419559.8 thousand metric tons of iron ore and 22.831.1 thousand metric tons of other cargo. EFC also carried 293317.9 thousand passengers in 2016.2018. EFC supports the largest train, in terms of capacity, in Latin America, which measures 3.5 kilometers, weighs 42.0141.67 thousand gross metric tons when loaded and has 330 cars. In 2016,2018, EFC had a fleet of 289282 locomotives and 18,13521,087 wagons, which were operated by Vale and third parties.
The principal items of cargo of the EFVM and EFC railroads are:
We charge market prices for customer freight, including iron ore pellets originating from joint ventures and other enterprises in which we do not have a 100% equity interest. Market prices vary based on the distance traveled, the type of product transported and other criteria, subject to price caps set forth in the weight of the freight in question,relevant concession agreements, and are regulated by the Brazilian transportation regulatory agency, ANTT (Agência Nacional de Transportes Terrestres).
VLI. VLI provides integrated logistics solutions through 7,9357,940 kilometers of railroads in Brazil (FCA and FNS), eight inland terminals with a total storage capacity of 795,000 metric tons and three maritime
| | | | |
| | 64 | | |
Lines of Business
terminals and ports operations. We hold a 37.6% stake in VLI, and are party to a shareholders' agreement with FI-FGTS, Mitsui and Brookfield, which hold the remaining equity interests in VLI. VLI's main assets are:
In 2016,2018, VLI transported a total of 31.9838.4 billion ntk of general cargo, including 19.5318.4 billion ntk from FCA and FNS and 12.458.0 billion ntk through operational agreements with Vale.
MRS Logística S.A.(" ("MRS"). The MRS railroad, in which we have a 48.2% equity interest, is 1,643 kilometers long and links the Brazilian states of Rio de Janeiro, São Paulo and Minas Gerais. In 2016, theThe MRS railroad transports our iron ore products from the Southern System mines to our maritime terminals. In 2018, it transported a daily average of 338.8317.4 thousand metric tons of iron ore and 122.0160.0 thousand metric tons of other cargo.
Africa
We are concluding the ramp up of theThe Nacala Logistics Corridor which(NLC) connects the Moatize mine to the Nacala-à-Velha maritime terminal, located in Nacala, Mozambique, and which crosses into the Republic of Malawi. The Nacala CorridorNLC consists of railway and port infrastructure, including greenfield and rehabilitation of existing railways in Mozambique and Malawi and a new coal port terminal in Mozambique. The Nacala Corridor will allow for the expansion ofNLC transports our coal products from the Moatize mine to our maritime terminal and supportsupports our operations in Southeastern Africa. In Mozambique, we are operating under two concession agreements, one related to the Mozambican greenfield railway and another related to the newly constructed coal port, both held by our subsidiary Corredor Logístico Integrado de Nacala S.A. ("CLN"), which will expire in 2042,2043, subject to renewal. We have also rehabilitated existing railroads under a concession held by our subsidiary, Corredor de Desenvolvimento do Norte S.A. ("CDN"),CDN, which will expire in 2035. In Malawi, we are operating under a concession held by our subsidiary, Vale Logistics Limited ("VLL"),VLL, which will expire in 2046, subject to renewal, and we have also rehabilitated existing railroads under a concession held by our subsidiary, Central East African Railway Company Limited ("CEAR"),CEAR, which was extendedwill expire in 2013 for2046. In 2018, the NLC transported a 30-year period from the commencementdaily average of rail services under VLL's greenfield railway concession.32.42 thousand metric tons of coal and 1.48 thousand metric tons of other cargo. The NLC also carried 800,883 passengers in 2018. In 2018, we had a fleet of 101 locomotives and 2,677 wagons at NLC, which were operated by CLN.
In November 2016, we agreed2017, the new terms of our partnership in coal assets in Mozambique with Mitsui. Under these new terms, Mitsui will contribute an amount of approximately US$348 million for a 50% stake of Nacala Logistics Corridor and extend a long-term facility of US$165 million to Nacala Logistics Corridor. The completion of the equity transaction is subject to certain conditions precedent, including certain conditions precedents relating to the completion of aNLC companies obtained project financing in the expectedtotal amount of US$2.72.730 billion. The transaction closed in March 2018. Vale received US$2.6 billion in proceeds, in repayment of certain shareholders loans provided for construction of NLC, net of certain commissions paid by NLC. The project financing will be repaid in 14 years with the proceeds obtained from the tariff charged by NLC in connection with the provision of coal transportation.
| | | | |
| | 65 | | |
Lines of Business
4.1.2 Ports and maritime terminals
Brazil
We operate a portports and maritime terminals principally as a means to complete the delivery of our iron ore and iron ore pellets to bulk carrier vessels serving the seaborne market. SeeFerrous minerals—Iron ore and iron ore pellets—Iron ore operations. We also use our portports and terminals to handle customers' cargo.
Tubarão and Praia Mole Ports. The Tubarão Port,port, which covers an area of 18 square kilometers, is located near the Vitória Port in the Brazilian state of Espírito Santo and contains the iron ore maritime terminal and the general cargo terminals (Terminal de Granéis Líquidos and theTerminal de Produtos Diversos). The Praia Mole port is also located nearin the Vitória Port.Brazilian state of Espírito Santo.
Ponta da Madeira maritime terminal. Our Ponta da Madeira maritime terminal is located near the Itaqui Port, in the Brazilian state of Maranhão. Pier I can accommodate vessels of up to 420,000 DWT and has a maximum loading rate of 16,000 metric tons per hour. Pier III, which has two berths and three shiploaders, can accommodate vessels of up to 210,000 DWT at the south berth and 180,000 DWT at the north berth (or two vessels of 180,000 DWT simultaneously), subject to tide conditions, and has a maximum loading rate of 8,000 metric tons per hour in each shiploader. Pier IV (south berth) is able to accommodate vessels of up to 420,000 DWT and have two ship loaders that work alternately with a maximum loading rate of 16,000 metric tons per hour. Pier IV (north berth) is able to accommodate vessels of up to 420,000 DWT and have two ship loaders that work alternately with a maximum loading rate of 16,000 metric tons per hour. In 2016,2018, Vale received from the Brazilian tax authorities, the customs authorization for the operations of Pier IV (north berth) performed pre-tests for a subsequent request for the definitive authorization to operate.. Cargo shipped through our Ponta da Madeira maritime terminal consists of the Northern system production of iron ore, pellets and manganese. In 2016, 149.02018, 198 million metric tons of iron ore were handledshipped through the terminal. The Ponta da Madeira maritime terminal has a storage yard with a static capacity of 7.77.2 million tons, which will be expanded to 10.7 millionmetric tons. VLI currently handles and stores fertilizers, grain, pig iron and manganese ore, which are then shipped through the Itaqui Port.
Itaguaí maritime terminal—Cia. Portuária Baía de Sepetiba ("CPBS"). From this terminal we mostly export iron ore from our Southern system. CPBS is a wholly-ownedwholly owned subsidiary that operates the Itaguaí
| | | | |
| | 66 | | |
Lines of Business
terminal, at the Itaguaí Port, in Sepetiba in the Brazilian state of Rio de Janeiro, which is leased from Companhia Docas do Rio de Janeiro (CDRJ). The Itaguaí port terminal has a pier with one berth that allows the loading of ships up to 17.8 meters of draft and approximately 200,000 DWT of capacity. In 2016,2018, the terminal loaded 21.419.2 million metric tons of iron ore.
Guaíba Island maritime terminal. From this terminal we also export mostly iron ore from our Southern system. We operate a maritime terminal on Guaíba Island in the Sepetiba Bay, in the Brazilian state of Rio de Janeiro. The iron ore terminal has a pier with two berths that allows the loading of ships of up to 350,000 DWT. In 2016,2018, the terminal loaded 46.141.2 million metric tons of iron ore.
VLI also operates Inácio Barbosa maritime terminal (TMIB), owned by Petrobras, in the Brazilian state of Sergipe; Santos maritime terminal (TIPLAM), in the Brazilian state of São Paulo, which is jointly owned by VLI and Vale Fertilizantes; and Pier II in the Itaqui Port, which can accommodate vessels of up to 155,000 DWT and has a maximum loading rate of 4,5003,800 metric tons per hour for pig iron and of 3,000 metric tons per hour for grains.
ArgentinaUruguay
Since October 2017, our subsidiary Vale Logística ArgentinaUruguay S.A. ("Vale Logística Argentina"VLU") contracts third partythird-party services to operate two terminals and a transhipper in Argentina. The terminals are located at Rosariothe Corporación Navios port terminal in the provinceNueva Palmira Free Zone in Uruguay. The port terminal provides facilities for the unloading, storing, weighing and loading of Santa Fébulk materials from Corumbá, Brazil, by river barge for transshipment to ocean-going vessels destined for Brazilian, Asian and at San Nicolas port in the province of Buenos Aires. The transhipper is also located in the province of Santa Fé. WeEuropean markets. In 2018, we handled 1.76 million1.058 thousand metric tons of iron and manganese ore through these ports and transhipper in 2016, which came from Corumbá, Brazil, via the Paraguay and Paraná rivers, for shipment to Brazilian, Asian and European markets.Corporación Navios port.
Canada
Vale Newfoundland and& Labrador Limited operates a port as part of our mining operation at Voisey's Bay, Labrador and a port as part of our processing operation at Long Harbour, Newfoundland. The port at Voisey's Bay is used for shipping nickel, copper and re-supply. The port at Long Harbour is used to receive nickel concentrate from Voisey's Bay along with goods and materials required for the Long Harbour operation.
Oman
Vale Oman Distribution Center LLC operates a distribution center in Liwa, Sultanate of Oman. The maritime terminal has a large deep waterdeep-water jetty, a 600-meter long platform connected to the shore by means of a 700-meter long trestle, and is integrated with a storage yard that has a throughput capacity to handle 40 Mtpy of iron ore and iron ore pellets per year. The loading nominal capacity is 10,000 metric tons per hour and the nominal unloading capacity is 9,000 metric tons per hour.
Indonesia
PTVI owns and operates two ports in Indonesia to support its nickel mining activities.
| | | | |
| | 67 | | |
Lines of Business
New Caledonia
We own and operate a port in Prony Bay, Province Sud, New Caledonia. This port has three terminals, including a passenger ferry terminal able to berth two ships up to 50m long, a dry bulk wharf where vessels of up to 55,00058,000 DWT can unload at a rate of 8,000 metric tons per day and a general cargo wharf where vessels up to 200m long can berth. The general cargo wharf can move containers at a rate of seven per hour and liquid fuels (LPG, HFO, Diesel)diesel) at a rate of 350 cubic meters per hour, and break-bulk. The port's container yard, covering an area of approximately 13,000 square meters, can receive up to 1,000 units. A bulk storage yard is linked to the port by a conveyor and has a storage capacity of 94,000 metric tons of limestone, 95,000 metric tons of sulfur, and 60,000 metric tons of coal.
Malaysia
Teluk Rubiah Maritime Terminal ("TRMT"). TRMT is located in the Malaysian state of Perak and has a pier with two berths that allows the unloading of vessels of approximately 400,000 DWT of capacity and the loading of vessels up to 220,000 DWT of capacity. In 2016,2018, the terminal unloaded 21.424 million metric tons of iron ore and loaded 21.724 million metric tons of iron ore. In this terminal we produce and sell the Brazilian blend fines, by mixing iron ore produced in Carajás with iron ore produced in our Southern and Southeastern systems.
4.1.3 Shipping
4.1.3 Shipping
Maritime shipping of iron ore and pellets
In 2016,2018, we shipped approximately 202248 million metric tons of iron ore and pellets pursuant toin transactions in which we were responsible for freight (CFR or CIF basis), which corresponds to 59% of our total iron ore and pellets sales.transportation. We transportship a large amount of our iron ore products from Brazil to Asia through long-term contracts of affreightment with owners of very large ore carriers of 400,000 deadweight tons ("DWT")(VLOCs). These vessels reduce energy consumption and greenhouse emissions by carrying an increased amount of cargo in a single trip, offering lower shipping costs. In 2016,2018, approximately 4864 million metric tons of iron ore products were transported by these vessels under long term contracts of affreightment.affreightment on vessels of 400,000 DWT.
We also own 8 vessels that are in operation, consisting of four very large ore carriers with a capacity of 400,000 DWT each, and fourthree capesize vessels with capacities ranging from 150,000 to 250,000180,000 DWT.
We have changed our strategy with respect to maritime shipping. In the past, we owned and operated a low-cost fleet of vessels to transportcarry our cargoes from Brazil to our markets, especially in Asia. We now focus on securing long-term shipping capacity and protecting against volatility in freight pricing through long-term contracts of affreightment, without incurring the costs relating to building, owning and owningoperating the vessels. Since 2014, we have sold 1519 of our very large ore carriersVLOCs of 400,000 DWT for an aggregate amount of US$1.5841.940 billion. We sold threeIn 2018, Vale concluded negotiations of these very large ore carrieslong-term contracts of affreightment with shipowners to employ 47 new VLOCs of 325,000 DWT. These shipowners plan to build the new vessels in 2016. Also,China, South Korea and Japan, with deliveries estimated to take place between 2019 and 2023. Vessels will be equipped with similar engines to the ones that are currently being used in September 2016, we agreed to sell fourthe second generation of our capesizeValemax vessels, to Polaris Shipping Co. Ltd. for US$35 million per vessel. Twoand which are much more fuel-efficient.
| | | | |
| | 68 | | |
Table of the vessels were delivered in December 2016, and two in January 2017.Contents
We also own and operate two Floating Transfer Stations ("FTS") in Subic Bay, Philippines, which transfer iron ore from very large ore carriers to smaller vessels that deliver the cargo to its destinations. We have suspended operations at oneLines of our FTS since February 2016, and we may sell both FTS in 2017.Business
Paraná-Paraguay—Paraguay waterway system
In the ParanáThrough our subsidiary, Transbarge Navegación, and Paraguay waterway system,other chartered convoys, we transport iron ore and manganese ores through the Paraná and Paraguay waterway system. The barges are unloaded in our subsidiary Transbarge Navegación, whichlocal customers' terminals in Argentina or in a contracted terminal in the Nueva Palmira Free Zone in Uruguay, where we load the ore into ocean going vessels. We transported 2.982.1 million metric tons through the waterway system in 2016, and other chartered convoys. The barges are discharged in2018, including 1.046 thousand metric tons of ore through our local customers' terminals in contracted terminals in Argentina or in the facilities of our subsidiary Vale Logística Argentina, which load the ore into ocean-going vessels. We loaded 1.76 millionand 1.058 thousand metric tons of ore at two portsthrough a port in Argentina, namely San Nicolas and Rosario, and at a transshipper into ocean-going vessels in 2016.Uruguay.
Tugboats
We manage a fleet of 1615 owned tugboats in total.tugboats. We directly operate nine tugboats in the ports of Vitória and Mangaratiba, in the Brazilian states of Espírito Santo and Rio de Janeiro, respectively. We have a 50% stake in a consortium that operates fourfive tugboats in the port of São Luís in the Brazilian states of Maranhão. ThreeOne additional tugboats are freightedtugboat is hired to and operated by third parties, under their responsibility, in other ports in Brazil. We also own two tugboats in New Caledonia.
4.2 Energy
We have developed our energy assets based on the current and projected energy needs of our operations, with the goal of reducing our energy costs and minimizing the risk of energy shortages.
Brazil
Energy management and efficient supply in Brazil are priorities for us, given the uncertainties associated with changes in the regulatory environment and the risk of rising electricity prices. In 2016,2018, our installed capacity in Brazil was 1.41.6 GW, sourced from both directly and indirectly owned power plants. We use the electricity produced by these plants for our internal consumption needs. We currently own direct stakes in three hydroelectric power plants and fourthree small hydroelectric power plants in operation. The hydroelectric power plant of Candonga, the operations of which remain suspended since November 2015 as a result of the failure of the Samarco Dam, is located in the Southeastern region, Machadinho is located in the Southern region, and Estreito is located in the Northern region. The small hydroelectric power plants of Ituerê, Mello, Glória and Nova Maurício are located in the Southeastern region. WeIn 2018, we sold the Ituerê hydroelectric power plant, located in the Southeastern region, due to its high required investments, low capacity and high cash cost when compared to our other assets. Through our 55% participation in Aliança Geração de Energia S.A. ("Aliança Geração"), we also have indirect stakes in the hydroelectric power plants of Igarapava, Porto Estrela, Funil, Candonga, Aimorés, Capim Branco I, Capim Branco II, through our 55% participation in Aliança Geração de Energia S.A. ("Aliança Geração"). These hydroelectric power plants are, located in the Southeastern regionRegion and, partadditionally, we have indirect stake in Santo Inácio, a Wind Complex located in Ceará State, which started operations in December 2017. Part of itsthe electricity generated electricityby these assets is directedsupplied to Vale'sour operations through a power purchase agreementagreements with Aliança Geração.
In order to achieve electricity self-sufficiency in Brazil by 2030 and increase renewable energy sources, we signed a long-term energy supply contract for 20 years, which will be supplied by the Folha Larga Sul wind farm, a 151.2 MW project in Campo Formoso, Bahia, Brazil. This project is expected to begin commercial operation by the first half of 2020. The agreement also includes a future asset call option held by Vale.
We also have a 4.59% indirect stake in Norte Energia S.A. ("Norte Energia"), the company established to develop and operate the Belo Monte hydroelectric plant in the Brazilian state of Pará, which started operations in April 2016. Our participation in the Belo Monte project gives us the right to purchase 9% of
| | | | |
| | 69 | | |
Lines of Business
the electricity generated by the plant, which has already been contracted through a long-term power purchase agreement entered into with Norte Energia.
We also produce, through our subsidiary Biopalma da Amazônia S.A. ("Biopalma"), palm oil in the Brazilian state of Pará, with the objective to produce biodiesel in the future through an industrial plant to be installed by Biopalma. This biodiesel, blended with regular diesel to produce diesel B20 (20% biodiesel), may be used to power.
Canada
In 2018, our fleet of mining trucks, heavy machinery and locomotives in the Northern System operations.
Canada
In 2016, our wholly-ownedwholly owned and operated hydroelectric power plants in Sudbury generated 17%19% of the electricity requirements of our Sudbury operations. The power plants consist of five separate generation stations with an installed generator nameplate capacity of 5655 MW. The output of the plants is limited by water availability, as well as by constraints imposed by a water management plan regulated by the provincial government of Ontario. Over the course of 2016,2018, average demand for electrical energy was 199162 MW to all surface plants and mines in the Sudbury area.
In 2016,2018, diesel generation provided 100% of the electric requirements of our Voisey's Bay operations. We also have six diesel generators on-site, with output ranging from 12 to 14 MW, in order to meet seasonal demands.
Indonesia
Energy costs are a significant component of our nickel production costs for the processing of lateritic ore at our PTVI operations in Indonesia. A major portion of PTVI's electric furnace power requirements is supplied at a low cost by its three hydroelectric power plants on the Larona River: (i) the Larona plant, which has an average generating capacity of 165 MW, (ii) the Balambano plant, which has an average capacity of 110 MW and (iii) the Karebbe plant, with 90 MW of average generating capacity. These plants help reduce production costs by substituting oil used for power generation with hydroelectric power, reduce CO2 emissions by replacing non-renewable power generation, and enable us to increase our current nickel production capacity in Indonesia.
5.Other investments
Below is a list of our main investments:
| | | | |
| | 70 | | |
Lines of Business
| | | | |
| | 71 | | |
Presentation of information concerning reservesPRESENTATION OF INFORMATION CONCERNING RESERVES
The estimates of proven and probable ore reserves at our mines and projects and the estimates of mine life included in this annual report have been prepared by our staff of experienced geologists and engineers, unless otherwise stated, and in accordance with the technical definitions established by the SEC. Under the SEC's Industry Guide 7:
We periodically revise our reserve estimates when we have new geological data, economic assumptions or mining plans. During 2016,2018, we performed an analysis of our reserve estimates for certain projects and operations, which is reflectedpresented in new estimates as of December 31, 2016.this report. Reserve estimates for each operation assume that we either have or expect to obtain all of the necessary rights and permits to mine, extract and process mineral reserves at each mine. For some of our operations, the projected exhaustion date includes stockpile reclamation. Where we own less than 100% of the operation, reserve estimates have not been adjusted to reflect our proportional ownership interest. Certain figures in the tables, discussions and notes have been rounded. For a description of risks relating to reserves and reserve estimates, seeRisk factors.
TableAs a part of ContentsVale internal governance process, we have a Mineral Resources and Mineral Reserves Global Committee coordinated by our exploration and projects department and composed of representatives of all business units (Ferrous, Coal and Base Metals) and the accounting, investor relations and capital projects departments. The purpose of these committee is ensuring the transparency, consistency, professional competence and reliability of all information prepared for internal purposes and public reporting. It is also responsible for overseeing the governance of our estimation and reporting of mineral reserves, which include external audit when applicable.
We report our reserves in accordance with the SEC's Industry Guide 7, as summarized above. In 2018, the SEC adopted new rules governing disclosures on mining properties, including reporting of reserves and resources, which will take effect for our 2021 fiscal year (although earlier adoption is permitted). The new SEC rules will align SEC disclosure requirements more closely with global regulatory practices and standards, as embodied in standards developed by CRIRSCO (Committee for Mineral Reserves International Reporting Standards). We already estimate our reserves under CRIRSCO standards, therefore we do not expect material changes when the new SEC standards become effective.
Our reserve estimates are based on certain assumptions about future prices. We have determined that our reported reserves could be economically produced if prices for the products identified in the following
| | | | |
| | 72 | | |
Reserves
table were equal to the three-year average historical prices through December 31, 2016.2018. For this purpose, we used the three-year historical average prices set forth in the following table.
| Commodity | | Three-year average historical price | | Pricing source |
|---|---|---|---|---|
Iron ore: | | | ||
Vale(1) | | US$ | | Average Platts IODEX (62% Fe CFR China) |
| | | ||
| | US$ | | |
| | US$ | | |
Base metals: | | | ||
Nickel(3) | | US$ | | LME Ni |
Copper | | US$ | | LME Cu |
Nickel and copper byproducts: | | | ||
Platinum | | US$ | | Average realized price |
Palladium | | US$ | | Average realized price |
Gold | | US$ | | Average realized price |
Cobalt(3) | | US$ | | 99.3% low cobalt metal (source: Metal Bulletin) |
Manganese ore(4): | | | ||
Manganese | | US$ | | Average CRU (44% Mn CFR |
Iron ore reservesIRON ORE RESERVES
The following tables below set forth our iron ore reserves and other information about our iron ore mines. Our reserve table reflects our production and operational plans, which are based on the facilities (consisting of both mines and processing plants) within each system, rather than the individual mines.
We classify our iron ore reserves as proven reserves to the extent that they satisfy the requirements of the definition of proven (measured) reserves, as described above, and that we have obtained the environmental licenses for the corresponding pit operation and have at least a reasonable expectation of obtaining on a timely basis any additional licenses necessary to conduct the operations.
We periodically review the economic viability of our iron ore reserves in light of changes in the iron ore industry. Although in production stage,We have determined that the Urucum and Corumbá reservesmines, although at production stage, are not economically viable based on expected long-termthree-year average historical prices. Since last yearAccordingly, we are not reporting reserves at those facilities.facilities since 2015.
Variations in iron ore reserves from 2017 to 2018 reflect depletion resulting from mine production for all mines. Our reserves for Fazendão, Fábrica Nova and Capanema (located at the Mariana complex in our Southeastern System), João Pereira, Galinheiro and Sapecado (located at the Minas Itabirito complex in our Southern System) and Capitão do Mato (located at the Vargem Grande complex in our Southern System) have been positively affected by new geological information and estimates. Also, followingwe are no longer reporting reserves for the Conta História project, located at the Mariana complex in our Southeastern System, because we are reviewing our long term plan for Mariana complex.
| | | | |
| | 73 | | |
Reserves
Following the failure of the Fundão tailingsDam I tailing dam in November 2015January 2019 and the shutdown of itsthe Feijão and Jangada mines and related infrastructure, all located in the Paraopeba Complex (Southern System), we are reviewing these operations Samarco is reviewing the operation's reserves.and Capim Branco project. Under these circumstances, Vale iswe are currently not in a position to report reserves for Samarco asthese reserves. For more information about the failure of December 31, 2016.Feijão tailing dam, seeBusiness overview—Failure of the tailings dam at the Córrego do Feijão mine.
The variations in iron ore reserves from 2015On January 29, 2019, we announced our decision to 2016 reflect new strategic guidelinesaccelerate the decommissioning of our upstream tailings dams. In order to proceed with the accelerated decommissioning of these upstream tailings dams, we will temporarily halt production at the units where the structures are located, namely: Abóboras, Capitão do Mato and Tamanduá (located at the Vargem Grande complex); Segredo and João Pereira (located at the Fábrica sub-complex in the reviewMinas Itabirito complex). We will also suspend production at Fábrica and Vargem Grande pelletizing plants. The temporary halt of these operations does not impact our mineral reserves, because the final pits, considering new price, cost, projectsupstream dams being decommissioned were no longer in use and blending assumptions, which affected all deposits. In addition, we have new deposits disclosedare not necessary for these operations. We expect to resume these operations once the first time and resource models update. The reserve statement also contemplates depletion by mine production.
Also in 2016, a portion of our reserves in all of our mining systems was reclassified from "proven" to "probable" reserves, without impacting the overall tonnage. This reclassification was a result of a complete review of our open pits anddecommissioning work is consistent with best practices in the mining industry. It reflects as "proven" only reserves for which all environmental licenses have been obtained, and under "probable" the reserves for which the licensing process is still ongoing, although we have a reasonable expectation of receiving the required licenses on a timely basis.completed.
| | Iron ore reserves(1) | | | Iron ore reserves(1) (As of December 31, 2018) | | |||||||||||||||||||||||||||||||||||||||||||||
| | Proven – 2016 | | Probable – 2016 | | Total – 2016 | | Total – 2015 | | | Proven – 2018 | | Probable – 2018 | | Total – 2018 | | Total – 2017 | | |||||||||||||||||||||||||||||||||
| | Tonnage | | Grade | | Tonnage | | Grade | | Tonnage | | Grade | | Tonnage | | Grade | | | Tonnage | | Grade | | Tonnage | | Grade | | Tonnage | Grade | | Tonnage | | Grade | | ||||||||||||||||||
Southeastern System(2) | | | | | | | | | | | | | | | | | | | ||||||||||||||||||||||||||||||||
Itabira(3) | | 811.4 | | 45.2 | | 198.9 | | 45.4 | | 1,010.3 | | 45.2 | | 746.7 | | 47.2 | | | 687.5 | | 45.7 | | 173.9 | | 45.8 | | 861.4 | | 45.7 | | 920.2 | | 45.6 | | ||||||||||||||||
Minas Centrais(4) | | 198.5 | | 49.0 | | 650.9 | | 56.8 | | 849.4 | | 55.0 | | 1,091.1 | | 53.3 | | | 163.6 | | 48.5 | | 570.7 | | 57.4 | | 734.4 | | 55.4 | | 776.5 | | 55.1 | | ||||||||||||||||
Mariana(5) | | 535.4 | | 45.5 | | 3,603.4 | | 44.2 | | 4,138.8 | | 44.3 | | 3,177.1 | | 43.8 | | | 366.6 | | 46.9 | | 3,507.9 | | 44.5 | | 3,874.5 | | 44.7 | | 4,100.4 | | 44.3 | | ||||||||||||||||
| | | | | | | | | | | | | | | | | | | | | | | | | | | | | | | | | | | | ||||||||||||||||
Total Southeastern System | | 1,545.3 | | 45.8 | | 4,453.1 | | 46.1 | | 5,998.5 | | 46.0 | | 5,014.9 | | 46.4 | | | 1,217.7 | | 46.4 | | 4,252.6 | | 46.3 | | 5,470.4 | | 46.3 | | 5,797.1 | | 45.9 | | ||||||||||||||||
| | | | | | | | | | | | | | | | | | | | | | | | | | | | | | | | | | | | ||||||||||||||||
Southern System(6) | | | | | | | | | | | | | | | | | | | ||||||||||||||||||||||||||||||||
Minas Itabirito(7) | | 467.7 | | 56.6 | | 3,279.1 | | 43.5 | | 3,746.8 | | 45.1 | | 2,887.0 | | 43.2 | | | 436.9 | | 54.8 | | 3,243.7 | | 43.7 | | 3,680.5 | | 45.0 | | 3,658.2 | | 45.0 | | ||||||||||||||||
Vargem Grande(8) | | 100.6 | | 50.5 | | 1,442.4 | | 48.0 | | 1,543.0 | | 48.2 | | 2,441.9 | | 44.5 | | | 368.9 | | 44.0 | | 1,170.5 | | 47.9 | | 1,539.3 | | 47.0 | | 1,462.5 | | 48.3 | | ||||||||||||||||
Paraopeba(9) | | 85.5 | | 62.5 | | 245.3 | | 60.5 | | 330.7 | | 61.0 | | 154.8 | | 62.0 | | | 42.9 | | 63.2 | | 123.2 | | 60.6 | | 166.1 | | 61.3 | | 308.5 | | 60.4 | | ||||||||||||||||
| | | | | | | | | | | | | | | | | | | | | | | | | | | | | | | | | | | | ||||||||||||||||
Total Southern System | | 653.8 | | 56.4 | | 4,966.8 | | 45.6 | | 5,620.6 | | 46.9 | | 5,483.7 | | 44.3 | | | 848.6 | | 50.5 | | 4,537.3 | | 45.3 | | 5,385.9 | | 46.1 | | 5,429.2 | | 46.7 | | ||||||||||||||||
| | | | | | | | | | | | | | | | | | | | | | | | | | | | | | | | | | | | ||||||||||||||||
Northern System(10) | | | | | | | | | | | | | | | | | | | ||||||||||||||||||||||||||||||||
Serra Norte(11) | | 552.7 | | 66.5 | | 1,784.7 | | 65.9 | | 2,337.4 | | 66.0 | | 2,426.4 | | 66.7 | | | 576.2 | | 66.3 | | 1,443.6 | | 65.7 | | 2,019.9 | | 65.9 | | 2,169.2 | | 66.0 | | ||||||||||||||||
Serra Sul (S11)(12) | | 1,730.5 | | 65.8 | | 2,494.1 | | 65.5 | | 4,224.6 | | 65.6 | | 4,239.6 | | 66.7 | | |||||||||||||||||||||||||||||||||
Serra Sul(12) | | 1,969.0 | | 66.1 | | 2,319.1 | | 66.4 | | 4,288.1 | | 66.3 | | 4,195.3 | | 65.5 | | |||||||||||||||||||||||||||||||||
Serra Leste | | 18.9 | | 64.5 | | 241.6 | | 65.5 | | 260.4 | | 65.4 | | 303.5 | | 65.4 | | | 6.9 | | 66.7 | | 249.3 | | 65.4 | | 256.2 | | 65.4 | | 258.1 | | 65.4 | | ||||||||||||||||
| | | | | | | | | | | | | | | | | | | | | | | | | | | | | | | | | | | | ||||||||||||||||
Total Northern System | | 2,302.1 | | 65.9 | | 4,520.4 | | 65.7 | | 6,822.5 | | 65.7 | | 6,969.4 | | 66.7 | | | 2,552.1 | | 66.2 | | 4,012.0 | | 66.1 | | 6,564.1 | | 66.1 | | 6,622.6 | | 65.6 | | ||||||||||||||||
| | | | | | | | | | | | | | | | | | | | | | | | | | | | | | | | | | | | ||||||||||||||||
Total Vale Systems | | 4,501.2 | | 57.6 | | 13,940.3 | | 52.3 | | 18,441.5 | | 53.6 | | 17,468.0 | | 53.8 | | | 4,618.4 | | 58.1 | | 12,802.0 | | 52.1 | | 17,420.4 | | 53.7 | | 17,848.9 | | 53.5 | | ||||||||||||||||
| | | | | | | | | | | | | | | | | | | | | | | | | | | | | | | | | | | | ||||||||||||||||
| | | | | | | | | | | | | | | | | | | |||||||||||||||||||||||||||||||||
| | | | | | | | | | | | | | | | | | | |||||||||||||||||||||||||||||||||
| | | | |
| | 74 | | |
Reserves
The mine exhaustion schedule has been adjusted due to our new production plan and our revision of project capacity. As a result of the Fundão dam failure, the Alegria and Germano operations' projected exhaustion dates are currently being reevaluated as part of Samarco's general review of its iron ore resources and reserves.
| | | Iron ore integrated operations | | | Iron ore integrated operations | | ||||||||||||||||||||||||||||||
|---|---|---|---|---|---|---|---|---|---|---|---|---|---|---|---|---|---|---|---|---|---|---|---|---|---|---|---|---|---|---|---|---|---|---|---|---|
| | | Type | | Operating since | | Projected exhaustion date(1) | | Vale interest | | | Type | | Operating since | | Projected exhaustion date(1) | | Vale interest | | ||||||||||||||||||
| | | | | | | | | (%) | | | | | | | | | (%) | | ||||||||||||||||||
Southeastern System | | | | | | | | | | | | | | | | | | | ||||||||||||||||||
Itabira | | Open pit | | | 1957 | | | 2029 | | | 100.0 | | | | Open pit | | | 1957 | | | 2028 | | | 100.0 | | | ||||||||||
Minas Centrais | | Open pit | | | 1994 | | | 2056 | | | 100.0 | | | | Open pit | | | 1994 | | | 2054 | | | 100.0 | | | ||||||||||
Mariana | | Open pit | | | 1976 | | | 2104 | | | 100.0 | | | | Open pit | | | 1976 | | | 2106 | | | 100.0 | | | ||||||||||
Southern System | | | | | | | | | | | | | | | | | | | ||||||||||||||||||
Minas Itabirito | | Open pit | | | 1942 | | | 2105 | | | 100.0 | | | | Open pit | | | 1942 | | | 2120 | | | 100.0 | | | ||||||||||
Vargem Grande | | Open pit | | | 1993 | | | 2055 | | | 100.0 | | | | Open pit | | | 1993 | | | 2059 | | | 100.0 | | | ||||||||||
Paraopeba | | Open pit | | | 2001 | | | 2032 | | | 100.0 | | | | Open pit | | | 2001 | | | 2036 | | | 100.0 | | | ||||||||||
Northern System | | | | | | | | | | | | | | | | | | | ||||||||||||||||||
Serra Norte | | Open pit | | | 1984 | | | 2041 | | | 100.0 | | | | Open pit | | | 1984 | | | 2042 | | | 100.0 | | | ||||||||||
Serra Sul (S11CD) | | Open pit | | | 2016 | | | 2049 | | | 100.0 | | | |||||||||||||||||||||||
Serra Leste (SL1) | | Open pit | | | 2014 | | | 2059 | | | 100.0 | | | |||||||||||||||||||||||
Serra Sul | | Open pit | | | 2016 | | | 2062 | | | 100.0 | | | |||||||||||||||||||||||
Serra Leste | | Open pit | | | 2014 | | | 2062 | | | 100.0 | | | |||||||||||||||||||||||
Manganese ore reserves
The following tables set forth manganese ore reserves and other information about our mines. We are ableThe variation in the mine's ore reserves from 2017 to report mineral reserve for Urucum in 20162018 predominantly reflects depletion through mine production and update due to the logistics cost reduction. We are revising our reported reserves due to the updating of its resource models and mineral reserves currently in progress, to consider new geological information and estimates of ore reserves for Azul and Morro da Mina. Our manganese ore reserves information for Urucum are currently being reviewed to consider new reserve assumptions. As this revision is stilleconomic assumptions and ongoing geotechnical studies, which are expected to be completed by 2020. Although the Urucum mine continues to operate, we are disclosing currentnot in a position to report reserves by depletion.for the Urucum mine until these studies are concluded.
| | Manganese ore reserves(1)(2) | | | Manganese ore reserves(1)(2) (As of December 31, 2018) | | |||||||||||||||||||||||||||||||||||||||||||||
| | Proven – 2016 | | Probable – 2016 | | Total – 2016 | | Total – 2015 | | | Proven – 2018 | | Probable – 2018 | | Total – 2018 | | Total – 2017 | | |||||||||||||||||||||||||||||||||
| | Tonnage | | Grade | | Tonnage | | Grade | | Tonnage | | Grade | | Tonnage | | Grade | | | Tonnage | | Grade | | Tonnage | | Grade | | | | | Tonnage | | Grade | | ||||||||||||||||||
Azul | | 35.9 | | 28.5 | | 2.0 | | 25.5 | | 38.0 | | 28.4 | | 43.6 | | 29.3 | | | 10.3 | | 26.5 | | 4.4 | | 27.5 | | 14.7 | | 26.8 | | 15.0 | | 26.6 | | ||||||||||||||||
Urucum | | 8.3 | | 46.3 | | 1.7 | | 46.5 | | 10.1 | | 46.3 | | – | | – | | | – | | – | | – | | – | | – | | – | | 9.3 | | 46.5 | | ||||||||||||||||
Morro da Mina | | 5.8 | | 31.0 | | 2.8 | | 29.7 | | 8.6 | | 30.6 | | 8.6 | | 30.6 | | | 4.8 | | 28.4 | | 3.7 | | 24.5 | | 8.5 | | 26.7 | | 8.5 | | 30.4 | | ||||||||||||||||
| | | | | | | | | | | | | | | | | | | | | | | | | | | | | | | | | | | | ||||||||||||||||
Total | | 50.1 | | 31.8 | | 6.5 | | 32.9 | | 56.6 | | 31.9 | | 52.2 | | 29.6 | | | 15.1 | | 27.1 | | 8.1 | | 26.1 | | 23.2 | | 26.7 | | 32.7 | | 33.2 | | ||||||||||||||||
| | | | | | | | | | | | | | | | | | | | | | | | | | | | | | | | | | | | ||||||||||||||||
| | | | | | | | | | | | | | | | | | | | | | | | | | | | | | | | | | | | ||||||||||||||||
| | | | | | | | | | | | | | | | | | | | | | | | | | | | | | | | | | | | ||||||||||||||||
| | | Manganese ore mines | | |||||||||||||||
|---|---|---|---|---|---|---|---|---|---|---|---|---|---|---|---|---|---|---|
| | | Type | | Operating since | | Projected exhaustion date | | Vale interest | | |||||||||
| | | | | | | | | (%) | | |||||||||
Azul(1) | | Open pit | | | 1985 | | | | 2032 | | | | 100.0 | | | |||
Urucum | | Underground | | | 1976 | | | | 2032 | | | | 100.0 | | | |||
Morro da Mina | | Open pit | | | 1902 | | | | 2049 | | | | 100.0 | | | |||
| | | | |
| | 75 | | |
Reserves
The mine exhaustion schedule has been adjusted to reflect our new production plan.
| | | Manganese ore mines | | |||||||||||||||
|---|---|---|---|---|---|---|---|---|---|---|---|---|---|---|---|---|---|---|
| | | Type | | Operating since | | Projected exhaustion date | | Vale interest | | |||||||||
| | | | | | | | | (%) | | |||||||||
Azul | | Open pit | | | 1985 | | | | 2026 | | | | 100.0 | | | |||
Urucum | | Underground | | | 1976 | | | | – | | | | 100.0 | | | |||
Morro da Mina | | Open pit | | | 1902 | | | | 2049 | | | | 100.0 | | | |||
Coal reservesCOAL RESERVES
Our coal reserve estimates have been provided on an in-place material basis after adjustments for depletion moisture content,through mine production, anticipated mining losses and dilution. Marketable reserves include adjustments for losses associated with beneficiation of raw coal mined to meet saleable product requirements.
We continue our exploration program in Moatize, targeting areas within the current mine plan and the extension of it, with the purpose of aggregating more reserves in the future. In 2018, we drilled 52% (approximately 92,000 meters) of the total 177,000 meter exploration drill campaign, which will continue in 2019. The results of this campaign are still under analysis and have not been reflected in our mineral reserve disclosure.
| | | Coal ore reserves(1) | | ||||||||||||||||||||||||
|---|---|---|---|---|---|---|---|---|---|---|---|---|---|---|---|---|---|---|---|---|---|---|---|---|---|---|---|
| | | ROM(2) | | | | | | ||||||||||||||||||||
| | | Marketable reserves(3) | | ||||||||||||||||||||||||
| | | | | Proven – 2016 | | Probable – 2016 | | | | | | | | | | ||||||||||||
| | | Coal type | | Total – 2016 | | Total – 2015 | | 2016 | | 2015 | | ||||||||||||||||
| | | (tonnage) | | (tonnage) | | (calorific value) | | (tonnage) | | (calorific value) | | (tonnage) | | (tonnage) | | ||||||||||||
Moatize | | Metallurgical & thermal l | | 247.4 | | 1,148.2 | | 1,395.6 | | 28.3 (thermal) | | 1,411.7 | | 28.3 (thermal) | | | 499.6 | | | | 505.5 | | | ||||
| | | | | | | | | | | | | | | | | | | | | ||||||||
| | | Coal ore reserves(1) (As of December 31, 2018) | ||||||||||||||||||||||
|---|---|---|---|---|---|---|---|---|---|---|---|---|---|---|---|---|---|---|---|---|---|---|---|---|
| | | ROM(2) | | | | | ||||||||||||||||||
| | | Marketable reserves(3) | ||||||||||||||||||||||
| | | | | Proven – 2018 | | Probable – 2018 | | | | | | | | | ||||||||||
| | | Coal type | | Total – 2018 | | Total – 2017 | | 2018 | | 2017 | ||||||||||||||
| | Tonnage | | Tonnage | | CV | | Tonnage | | CV | | Tonnage | | Tonnage | |||||||||||
Moatize | | Metallurgical & thermal | | 194.8 | | 791.0 | | | 985.7 | | | 26.0 | | | 1,022.5 | | | 26.0 (thermal) | | 403.0 | | 415.0 | ||
| | | Coal mines | | |||||||||||||||
|---|---|---|---|---|---|---|---|---|---|---|---|---|---|---|---|---|---|---|
| | | Type | | Operating since | | Projected exhaustion date | | Vale interest | | |||||||||
| | | | | | | | | (%) | | |||||||||
Moatize(1) | | Open pit | | | 2011 | | | | 2047 | (2) | | | 95.0 | | | |||
| | | Coal mines | | |||||||||||||||
|---|---|---|---|---|---|---|---|---|---|---|---|---|---|---|---|---|---|---|
| | | Type | | Operating since | | Projected exhaustion date | | Vale interest | | |||||||||
| | | | | | | | | (%) | | |||||||||
Moatize | | Open pit | | | 2011 | | | | 2039 | | | | 80.75 | | | |||
| | | | |
| | 76 | | |
Nickel ore reservesReserves
NICKEL ORE RESERVES
Our nickel mineral reserve estimates are of in-place material after adjustments for depletion and mining losses (or screening and drying in the case of PTVI) and recoveries, with no adjustments made for metal losses due to processing.
| | Nickel ore reserves(1) (As of December 31, 2018) | | ||||||||||||||||||||||||||||||||||||||||||||||||||||||
| | Nickel ore reserves(1) | | | Proven – 2018 | | Probable – 2018 | | Total – 2018 | | Total – 2017 | | Recovery | | |||||||||||||||||||||||||||||||||||||||||||
| | Proven – 2016 | | Probable – 2016 | | Total – 2016 | | Total – 2015 | | Recovery | | | Tonnage | | Grade | | Tonnage | | Grade | | Tonnage | | Grade | | Tonnage | | Grade | | range | | |||||||||||||||||||||||||||
| | Tonnage | | Grade | | Tonnage | | Grade | | Tonnage | | Grade | | Tonnage | | Grade | | range (%) | | | | | | | | | | | (%) | | |||||||||||||||||||||||||||
Canada | | | | | | | | | | | | | | | | | | | | | ||||||||||||||||||||||||||||||||||||
Sudbury | | 32.4 | | 1.48 | | 39.5 | | 1.33 | | 71.9 | | 1.40 | | 76.4 | | 1.27 | | 75 – 85 | | | 20.9 | | 1.65 | | 40.8 | | 1.27 | | 61.7 | | 1.40 | | 64.9 | | 1.43 | | 75 – 85 | | ||||||||||||||||||
Thompson | | – | | – | | – | | – | | – | | – | | 20.6 | | 1.71 | | 85 – 90 | | | – | | – | | – | | – | | – | | – | | – | | – | | 85 – 90 | | ||||||||||||||||||
Voisey's Bay | | 18.4 | | 2.35 | | 15.4 | | 2.02 | | 33.8 | | 2.20 | | 36.1 | | 2.24 | | 80 – 90 | | | 15.5 | | 2.24 | | 15.5 | | 2.00 | | 31.0 | | 2.12 | | 32.4 | | 2.13 | | 80 – 90 | | ||||||||||||||||||
Indonesia | | | | | | | | | | | | | | | | | | | | | ||||||||||||||||||||||||||||||||||||
PTVI | | 91.6 | | 1.78 | | 19.2 | | 1.75 | | 110.9 | | 1.78 | | 119.3 | | 1.78 | | 85 – 90 | | | 101.8 | | 1.76 | | 14.7 | | 1.64 | | 116.4 | | 1.74 | | 95.1 | | 1.79 | | 85 – 90 | | ||||||||||||||||||
New Caledonia | | | | | | | | | | | | | | | | | | | | | ||||||||||||||||||||||||||||||||||||
VNC | | – | | – | | – | | – | | – | | – | | – | | – | | | | – | | – | | – | | – | | – | | – | | – | | – | | – | | |||||||||||||||||||
Brazil | | | | | | | | | | | | | | | | | | | | | ||||||||||||||||||||||||||||||||||||
Onça Puma | | 63.0 | | 1.65 | | 45.0 | | 1.37 | | 108.0 | | 1.53 | | 97.4 | | 1.56 | | 85 – 90 | | | 60.7 | | 1.66 | | 53.1 | | 1.38 | | 113.8 | | 1.53 | | 106.5 | | 1.53 | | 85 – 90 | | ||||||||||||||||||
| | | | | | | | | | | | | | | | | | | | | | | | | | | | | | | | | | | | | | | | ||||||||||||||||||
Total | | 205.4 | | 1.75 | | 119.1 | | 1.50 | | 324.5 | | 1.66 | | 349.8 | | 1.65 | | | | 199.0 | | 1.75 | | 124.0 | | 1.45 | | 322.9 | | 1.64 | | 298.9 | | 1.66 | | | ||||||||||||||||||||
| | | | | | | | | | | | | | | | | | | | | | | | | | | | | | | | | | | | | | | | | |||||||||||||||||
| | | | | | | | | | | | | | | | | | | | | | | | | | | | | | | | | | | | | | | | ||||||||||||||||||
In Canada, our Sudbury operationsoperation's mineral reserves decreased in 2018 due to mining depletions, the reclassificationdepletion and minor adjustments due to re-evaluations of mineral reserves to mineral resource at Garson, downgrading of mineral reserve to exploration target at Stobie and a decrease of mineral reserves at all mines due to re-interpretation and planning changes. The nickel grades at the Sudbury operations increased due to a change in the cutoff policy.Copper Cliff Mine. The Voisey's Bay operations mineral reserves decreased due to mining depletions. Thedepletion. In Indonesia, the mineral reserves at the PTVI decreasedoperations increased due to the conversion of resource to reserve, considering an extension of the mining depletion, pit redesigns and reevaluations, and reclassification to mineral resource.rights until 2045. The mineral reserves at Onça Puma, in Brazil, increased due to a decrease in operating coststhe conversion of the Puma West resources to reserves and cutoff.an update of the Puma block model.
We are not reporting the mineral reserves of VNC and Thompson as of December 31, 2016,2018, because the mineral reserves for our operations in New Caledonia and Thompson would not be economically viable at the three-year historical average price, due to the decline in nickel prices in the past three years. However, based on our expectations about future prices, our operations in New Caledonia and Thompson continue to be economically viable. VNC and Thompson continue to operate and are currently conducting studies to identify measures to reduce their costs of production.
| | | Nickel ore mines | | | Nickel ore mines | | ||||||||||||||||||||||||||||||
|---|---|---|---|---|---|---|---|---|---|---|---|---|---|---|---|---|---|---|---|---|---|---|---|---|---|---|---|---|---|---|---|---|---|---|---|---|
| | | Type | | Operating since | | Projected exhaustion date | | Vale interest | | | Type | | Operating since | | Projected exhaustion date | | Vale interest | | ||||||||||||||||||
| | | | | | | | | (%) | | | | | | | | | (%) | | ||||||||||||||||||
Canada | | | | | | | | | | | | | | | | | | | ||||||||||||||||||
Sudbury | | Underground | | | 1885 | | | 2042 | | | 100.0 | | | | Underground | | | 1885 | | | 2042 | | | 100.0 | | | ||||||||||
Thompson | | Underground | | | 1961 | | | – | | | 100.0 | | | | Underground | | | 1961 | | | – | | | 100.0 | | | ||||||||||
Voisey's Bay(1) | | Open pit/Underground | | | 2005 | | | 2032 | | | 100.0 | | | | Open pit/Underground | | | 2005 | | | 2033 | | | 100.0 | | | ||||||||||
Indonesia | | | | | | | | | | | | | | | | | | | ||||||||||||||||||
PTVI | | Open pit | | | 1977 | | | 2035 | | | 59.2 | | | | Open pit | | | 1977 | | | 2040 | | | 59.27 | | | ||||||||||
New Caledonia | | | | | | | | | | | | | | | | | | | ||||||||||||||||||
VNC | | Open pit | | | 2011 | | | – | | | 95.0 | | | | Open pit | | | 2011 | | | – | | | 95.0 | | | ||||||||||
Brazil | | | | | | | | | | | | | | | | | | | ||||||||||||||||||
Onça Puma | | Open pit | | | 2011 | | | 2061 | | | 100.0 | | | | Open pit | | | 2011 | | | 2071 | | | 100.0 | | | ||||||||||
| | | | |
| | 77 | | |
Copper ore reservesReserves
COPPER ORE RESERVES
Our copper mineral reserve estimates are of in-place material after adjustments for depletion and mining losses and recoveries, with no adjustments made for metal losses due to processing.
| | Copper ore reserves(1) (As of December 31, 2018) | | ||||||||||||||||||||||||||||||||||||||||||||||||||||||
| | Copper ore reserves(1) | | | Proven – 2018 | | Probable – 2018 | | Total – 2018 | | Total – 2017 | | Recovery | | |||||||||||||||||||||||||||||||||||||||||||
| | Proven – 2016 | | Probable – 2016 | | Total – 2016 | | Total – 2015 | | Recovery | | | Tonnage | | Grade | | Tonnage | | Grade | | (%) | | Grade | | Tonnage | | Grade | | range | | |||||||||||||||||||||||||||
| | Tonnage | | Grade | | Tonnage | | Grade | | Tonnage | | Grade | | Tonnage | | Grade | | range (%) | | | | | | | | | | | % | | |||||||||||||||||||||||||||
Canada | | | | | | | | | | | | | | | | | | | | | ||||||||||||||||||||||||||||||||||||
Sudbury | | 32.4 | | 2.06 | | 39.5 | | 1.43 | | 71.9 | | 1.71 | | 76.4 | | 1.61 | | 90 – 95 | | | 20.9 | | 2.43 | | 40.8 | | 1.44 | | 61.7 | | 1.78 | | 64.9 | | 1.80 | | 90 – 95 | | ||||||||||||||||||
Voisey's Bay | | 18.4 | | 1.12 | | 15.4 | | 0.89 | | 33.8 | | 1.02 | | 36.1 | | 1.05 | | 90 – 95 | | | 15.5 | | 1.00 | | 15.5 | | 0.88 | | 31.0 | | 0.94 | | 32.4 | | 0.96 | | 90 – 95 | | ||||||||||||||||||
Brazil | | | | | | | | | | | | | | | | | | | | | ||||||||||||||||||||||||||||||||||||
Sossego | | 101.5 | | 0.64 | | 9.4 | | 0.66 | | 110.9 | | 0.65 | | 117.8 | | 0.67 | | 90 – 95 | | | 103.1 | | 0.66 | | 5.9 | | 0.69 | | 109.0 | | 0.66 | | 120.1 | | 0.68 | | 90 – 95 | | ||||||||||||||||||
Salobo | | 623.7 | | 0.68 | | 554.6 | | 0.58 | | 1,178.3 | | 0.63 | | 1,156.8 | | 0.67 | | 80 – 90 | | | 619.2 | | 0.63 | | 537.7 | | 0.58 | | 1,156.9 | | 0.61 | | 1,193.4 | | 0.61 | | 80 – 90 | | ||||||||||||||||||
Zambia | | | | | | | | | | | ||||||||||||||||||||||||||||||||||||||||||||||
Lubambe | | 5.4 | | 2.22 | | 40.0 | | 2.18 | | 45.4 | | 2.18 | | 48.6 | | 2.25 | | 85 – 90 | | |||||||||||||||||||||||||||||||||||||
| | | | | | | | | | | | | | | | | | | | | | | | | | | | | | | | | | | | | | | | ||||||||||||||||||
Total | | 781.3 | | 0.75 | | 659.0 | | 0.74 | | 1,440.3 | | 0.75 | | 1,435.7 | | 0.78 | | | | 758.7 | | 0.69 | | 599.9 | | 0.65 | | 1,358.5 | | 0.67 | | 1,410.8 | | 0.68 | | | ||||||||||||||||||||
| | | | | | | | | | | | | | | | | ��� | | | | | | | | | | | | | | | | | | | | | | | | |||||||||||||||||
| | | | | | | | | | | | | | | | | | | | | | | | | | | | | | | | | | | | | | | | ||||||||||||||||||
In Canada, our Sudbury operationsoperation's mineral reserves decreased in 2018 due to depletion and minor adjustments due to re-evaluations of mineral reserves at Copper Cliff Mine, and our Voisey's Bay operation's mineral reserves decreased due to mining depletions, the reclassification of mineral reserves to mineral resource at Garson, downgrading of mineral reserve to exploration target at Stobie and a decrease of mineral reserves at all mines due to re-interpretation and planning changes. The copper grades at the Sudbury operations increased due to a change in the cutoff grade policy. The Voisey's Bay operations mineral reserves decreased due to mining depletions.depletion. In Brazil, the Sossego operations mineral reserves decreased due to mining depletion partially offset by the addition of mineral reserves located in the bottom of the pits and the reevaluation of the existing pit designs and unplanned dilution factors.stockpile reclamation. The mineral reserve estimates at the Salobo operation increased due to mining depletion being offset by the addition of new mineral reserves from an updated final pit design and the reevaluation of the mineral block model. The Lubambe mineral reserves decreased due to mining depletion.depletion and re-evaluation work, partially offset by medium- and low-grade stockpile additions.
| | | Copper ore mines | | |||||||||||||||
|---|---|---|---|---|---|---|---|---|---|---|---|---|---|---|---|---|---|---|
| | | Type | | Operating since | | Projected exhaustion date | | Vale interest | | |||||||||
| | | | | | | | | (%) | | |||||||||
Canada | | | | | | | | | | | | |||||||
Sudbury | | Underground | | | 1885 | | | | 2042 | | | | 100.0 | | | |||
Voisey's Bay | | Open pit/Underground | | | 2005 | | | | 2033 | | | | 100.0 | | | |||
Brazil | | | | | | | | | | | | |||||||
Sossego | | Open pit | | | 2004 | | | | 2027 | | | | 100.0 | | | |||
Salobo | | Open pit | | | 2012 | | | | 2051 | (1) | | | 100.0 | | | |||
| | | | |
| | 78 | | |
| | | Copper ore mines | | |||||||||||||||
|---|---|---|---|---|---|---|---|---|---|---|---|---|---|---|---|---|---|---|
| | | Type | | Operating since | | Projected exhaustion date | | Vale interest | | |||||||||
| | | | | | | | | (%) | | |||||||||
Canada | | | | | | | | | | | | |||||||
Sudbury | | Underground | | | 1885 | | | | 2042 | | | | 100.0 | | | |||
Voisey's Bay | | Open pit/Underground | | | 2005 | | | | 2032 | | | | 100.0 | | | |||
Brazil | | | | | | | | | | | | |||||||
Sossego | | Open pit | | | 2004 | | | | 2025 | | | | 100.0 | | | |||
Salobo | | Open pit | | | 2012 | | | | 2066 | | | | 100.0 | | | |||
Zambia | | | | | | | | | | | | |||||||
Lubambe | | Underground | | | 2013 | | | | 2038 | | | | 40.0 | | | |||
PGMs and other precious metals reservesReserves
PGMS AND OTHER PRECIOUS METALS RESERVES
We expect to recover significant quantities of precious metals as byproducts of our Sudbury, Sossego and Salobo operations. Our mineral reserve estimates are of in-place material after adjustments for mining depletion and mining losses and recoveries, with no adjustments made for metal losses due to processing.
| | Precious metals reserves(1) (As of December 31, 2018) | | ||||||||||||||||||||||||||||||||||||||||||||||||||||||
| | Precious metals reserves(1) | | | Proven – 2018 | | Probable – 2018 | | Total – 2018 | | Total – 2017 | | Recovery | | |||||||||||||||||||||||||||||||||||||||||||
| | Proven – 2016 | | Probable – 2016 | | Total – 2016 | | Total – 2015 | | Recovery | | | Tonnage | | Grade | | Tonnage | | Grade | | Tonnage | | Grade | | Tonnage | | Grade | | range | | |||||||||||||||||||||||||||
| | Tonnage | | Grade | | Tonnage | | Grade | | Tonnage | | Grade | | Tonnage | | Grade | | range (%) | | | | | | | | | | | (%) | | |||||||||||||||||||||||||||
Canada | | | | | | | | | | | | | | | | | | | | | ||||||||||||||||||||||||||||||||||||
Sudbury | | | | | | | | | | | | | | | | | | | | | ||||||||||||||||||||||||||||||||||||
Platinum | | 32.4 | | 1.1 | | 39.5 | | 1.3 | | 71.9 | | 1.2 | | 76.4 | | 1.1 | | 80 – 90 | | | 20.9 | | 1.3 | | 40.8 | | 1.2 | | 61.7 | | 1.2 | | 64.9 | | 1.2 | | 80 – 90 | | ||||||||||||||||||
Palladium | | 32.4 | | 1.3 | | 39.5 | | 1.3 | | 71.9 | | 1.3 | | 76.4 | | 1.1 | | 80 – 90 | | | 20.9 | | 1.5 | | 40.8 | | 1.5 | | 61.7 | | 1.5 | | 64.9 | | 1.4 | | 80 – 90 | | ||||||||||||||||||
Gold | | 32.4 | | 0.5 | | 39.5 | | 0.4 | | 71.9 | | 0.4 | | 76.4 | | 0.4 | | 80 – 90 | | | 20.9 | | 0.6 | | 40.8 | | 0.4 | | 61.7 | | 0.5 | | 64.9 | | 0.5 | | 80 – 90 | | ||||||||||||||||||
Brazil | | | | | | | | | | | | | | | | | | | | | ||||||||||||||||||||||||||||||||||||
Sossego | | | | | | | | | | | | | | | | | | | | | ||||||||||||||||||||||||||||||||||||
Gold | | 101.5 | | 0.2 | | 9.4 | | 0.2 | | 110.9 | | 0.2 | | 117.8 | | 0.2 | | 75 – 80 | | | 103.1 | | 0.2 | | 5.9 | | 0.2 | | 109.0 | | 0.2 | | 120.1 | | 0.2 | | 75 – 80 | | ||||||||||||||||||
Salobo | | | | | | | | | | | | | | | | | | | | | ||||||||||||||||||||||||||||||||||||
Gold | | 623.7 | | 0.4 | | 554.6 | | 0.3 | | 1,178.3 | | 0.4 | | 1,156.8 | | 0.4 | | 60 – 70 | | | 619.2 | | 0.3 | | 537.7 | | 0.3 | | 1,156.9 | | 0.3 | | 1,193.4 | | 0.3 | | 60 – 70 | | ||||||||||||||||||
| | | | | | | | | | | | | | | | | | | | | | | | | | | | | | | | | | | | | | | | | |||||||||||||||||
| | | | | | | | | | | | | | | | | | | | | | | | | | | | | | | | | | | | | | | | ||||||||||||||||||
Total Pt + Pd(2) | | 32.4 | | 2.4 | | 39.5 | | 2.6 | | 71.9 | | 2.5 | | 76.4 | | 2.2 | | | | 20.9 | | 2.9 | | 40.8 | | 2.7 | | 61.7 | | 2.8 | | 64.9 | | 2.6 | | | ||||||||||||||||||||
| | | | | | | | | | | | | | | | | | | | | | | | | | | | | | | | | | | | | | | | | |||||||||||||||||
| | | | | | | | | | | | | | | | | | | | | | | | | | | | | | | | | | | | | | | | ||||||||||||||||||
Total Gold | | 757.6 | | 0.3 | | 603.5 | | 0.3 | | 1,361.1 | | 0.3 | | 1,351.0 | | 0.4 | | | | 743.2 | | 0.3 | | 584.4 | | 0.3 | | 1,327.6 | | 0.3 | | 1,378.4 | | 0.3 | | | ||||||||||||||||||||
| | | | | | | | | | | | | | | | | | | | | | | | | | | | | | | | | | | | | | | | | |||||||||||||||||
| | | | | | | | | | | | | | | | | | | | | | | | | | | | | | | | | | | | | | | | ||||||||||||||||||
In Sudbury our mineral reserve estimates for platinum, palladium and gold decreased for the same reasons discussed above in connection with the nickel mineral reserves. In Brazil, mineral reserve estimates for gold changed for the same reasons discussed above in connection with the copper mineral reserves.
| | | Precious metals mines | | | Precious metals mines | | ||||||||||||||||||||||||||||||
|---|---|---|---|---|---|---|---|---|---|---|---|---|---|---|---|---|---|---|---|---|---|---|---|---|---|---|---|---|---|---|---|---|---|---|---|---|
| | | Type | | Operating since | | Projected exhaustion date | | Vale interest | | | Type | | Operating since | | Projected exhaustion date | | Vale interest | | ||||||||||||||||||
| | | | | | | | | (%) | | | | | | | | | (%) | | ||||||||||||||||||
Canada | | | | | | | | | | | | | | | | | | | ||||||||||||||||||
Sudbury | | Underground | | | 1885 | | | 2042 | | | 100.0 | | | | Underground | | | 1885 | | | 2042 | | | 100.0 | | | ||||||||||
Brazil | | | | | | | | | | | | | | | | | | | ||||||||||||||||||
Sossego | | Open pit | | | 2004 | | | 2025 | | | 100.0 | | | | Open pit | | | 2004 | | | 2027 | | | 100.0 | | | ||||||||||
Salobo | | Open pit | | | 2012 | | | 2066 | | | 100.0 | | | | Open pit | | | 2012 | | | 2051 | | | 100.0 | | | ||||||||||
| | | | |
| | 79 | | |
Reserves
COBALT ORE RESERVES
We expect to recover significant quantities of cobalt as a byproduct of our Sudbury and Voisey's Bay operations. Our cobalt reserve estimates are of in-place material after adjustments for depletion and mining losses, with no adjustments for metal losses due to processing.
| | Cobalt ore reserves(1) (As of December 31, 2018) | | ||||||||||||||||||||||||||||||||||||||||||||||||||||||
| | Cobalt ore reserves(1) | | | Proven – 2018 | | Probable – 2018 | | Total – 2018 | | Total – 2017 | | Recovery | | |||||||||||||||||||||||||||||||||||||||||||
| | Proven – 2016 | | Probable – 2016 | | Total – 2016 | | Total – 2015 | | Recovery | | | Tonnage | | Grade | | Tonnage | | Grade | | Tonnage | | Grade | | Tonnage | | Grade | | range | | |||||||||||||||||||||||||||
| | Tonnage | | Grade | | Tonnage | | Grade | | Tonnage | | Grade | | Tonnage | | Grade | | range (%) | | | | | | | | | | | % | | |||||||||||||||||||||||||||
Canada | | | | | | | | | | | | | | | | | | | | | ||||||||||||||||||||||||||||||||||||
Sudbury | | 32.4 | | 0.04 | | 39.5 | | 0.04 | | 71.9 | | 0.04 | | 76.4 | | 0.04 | | 20-40 | | | 20.9 | | 0.04 | | 40.8 | | 0.02 | | 61.7 | | 0.03 | | 64.9 | | 0.04 | | 20 – 40 | | ||||||||||||||||||
Voisey's Bay | | 18.4 | | 0.13 | | 15.4 | | 0.13 | | 33.8 | | 0.13 | | 36.1 | | 0.13 | | 70-80 | | | 15.5 | | 0.13 | | 15.5 | | 0.12 | | 31.0 | | 0.13 | | 32.4 | | 0.13 | | 70 – 80 | | ||||||||||||||||||
New Caledonia | | | | | | | | | | | | | | | | | | | | | ||||||||||||||||||||||||||||||||||||
VNC | | – | | – | | – | | – | | – | | – | | – | | – | | | | – | | – | | – | | – | | – | | – | | – | | – | | | ||||||||||||||||||||
| | | | | | | | | | | | | | | | | | | | | | | | | | | | | | | | | | | | | | | | ||||||||||||||||||
Total | | 50.8 | | 0.07 | | 54.9 | | 0.07 | | 105.7 | | 0.07 | | 112.5 | | 0.07 | | | | 36.4 | | 0.08 | | 56.3 | | 0.05 | | 92.7 | | 0.06 | | 97.3 | | 0.07 | | | ||||||||||||||||||||
| | | | | | | | | | | | | | | | | | | | | | | | | | | | | | | | | | | | | | | | | |||||||||||||||||
| | | | | | | | | | | | | | | | | | | | | | | | | | | | | | | | | | | | | | | | ||||||||||||||||||
Our cobalt reserve estimates decreased in 20162018 for the same reasons discussed above in connection with the nickel mineral reserves.
| | | Cobalt ore mines | | | Cobalt ore mines | | ||||||||||||||||||||||||||||||
|---|---|---|---|---|---|---|---|---|---|---|---|---|---|---|---|---|---|---|---|---|---|---|---|---|---|---|---|---|---|---|---|---|---|---|---|---|
| | | Type | | Operating since | | Projected exhaustion date | | Vale interest | | | Type | | Operating since | | Projected exhaustion date | | Vale interest | | ||||||||||||||||||
| | | | | | | | | (%) | | | | | | | | | (%) | | ||||||||||||||||||
Canada | | | | | | | | | | | | | | | | | | | ||||||||||||||||||
Sudbury | | Underground | | | 1885 | | | 2042 | | | 100.0 | | | | Underground | | | 1885 | | | 2042 | | | 100.0 | | | ||||||||||
Voisey's Bay | | Open pit/Underground | | | 2005 | | | 2032 | | | 100.0 | | | | Open pit/ Underground | | | 2005 | | | 2033 | | | 100.0 | | | ||||||||||
New Caledonia | | | | | | | | | | | | | | | | | | | ||||||||||||||||||
VNC | | Open pit | | | 2011 | | | – | | | 95.0 | | | | Open pit | | | 2011 | | | – | | | 95.0 | | | ||||||||||
| | | | |
| | 80 | | |
We have an extensive program of investments in the organic growth of our businesses. The figures discussed in this section are for project execution and sustaining existing operations and replacement projects.
The 20172019 investment budget approved by our Board of Directors is US$1.846 billion703 million for project execution, reflecting a 41.8%27.7% decrease compared to the 20162018 investment budget, and US$2.7023.731 billion for sustaining existing operations and replacement projects, reflecting a 9.8% decrease30.2% increase compared to 2016. This is the sixth consecutive year of lower capital expenditures, maintaining capital discipline and focusing only on world class projects.
2018. Most of the capital expenditures budget for project execution will be invested in Brazil (95.1%(96%).
| | | 2017 expenditures(1) | | 2018 expenditures(1) | | 2019 budget | | ||||||||||
|---|---|---|---|---|---|---|---|---|---|---|---|---|---|---|---|---|---|
| | | (US$ million) | | (US$ million) | | (% of total) | | ||||||||||
Project execution (construction in progress) | | | 1,617 | | | | 888 | | | 703 | | 15.9 | | ||||
Investments to sustain existing operations and replacement projects (property, plant and equipment) | | | 2,231 | | | | 2,896 | | | 3.731 | | 84.1 | | ||||
| | | | | | | | | | | ||||||||
Total | | | US$ | 3,848 | | | | US$ | 3,784 | | | US$ | 4.434 | | 100% | | |
| | | | | | | | | | | ||||||||
| | | | | | | | | | | | | | | ||||
| | | | | | | | | | | ||||||||
| | | 2015 expenditures | | 2016 expenditures | | 2017 budget | | ||
|---|---|---|---|---|---|---|---|---|---|
| | | (US$ million) | | (US$ million) | | (US$ million) | | (% of total) | |
Project execution | | 5,548 | | 3,179 | | 1,846 | | 40.6% | |
Investments to sustain existing operations and replacement projects | | 2,853 | | 2,302 | | 2,702 | | 59.4% | |
| | | | | | | | | | |
Total | | US$8,401 | | US$5,482 | | US$4,548 | | 100% | |
| | | | | | | | | | |
| | | | | | | | | | |
| | | | | | | | | | |
We are developing a focused organic growth portfolio with fewer projects, but higher expected rates of return. Our main initiative, the S11D, project, accounts for 87.2%44.2% of the US$1.846 billion703 million budgeted for project execution in 2017.
Table of Contents2019.
The following table sets forth total expenditures in 20162018 for our main investment projects and expenditures budgeted for those projects in 2017,2019, together with estimated total expenditures for each project and the actual or estimated start-up date of each project as of December 31, 2016.2018.
| | | | | | | Executed CAPEX | | Expected CAPEX | | | | | | Executed CAPEX | | Expected CAPEX | ||||||||
|---|---|---|---|---|---|---|---|---|---|---|---|---|---|---|---|---|---|---|---|---|---|---|---|---|
Business area | | Main projects(1) | | Actual or estimated start-up | | 2016(2) | | Total executed(3) | | 2017(4) | | Total expected(5) | | Main projects(1) | | Actual or estimated start-up | | 2018(2) | | Total executed(3) | | 2019(4) | | Total expected(5) |
| | | | | | | (US$ million) | | | | | | (US$ million) | ||||||||||||
Iron ore | | Carajás Serra Sul S11D(6)(8) | | 2H16 | | 940 | | 5,595 | | 649 | | 6,750 | | CLN S11D(6) | | 1H14 to 2H19 | | 578 | | 7,146 | | 209 | | 7,679 |
| | CLN S11D(7) | | 1H14 to 2H19 | | 1,195 | | 5,662 | | 962 | | 7,850 | |||||||||||||
Coal mining | | Moatize II(8) | | 2H16 | | 117 | | 2,058 | | 6 | | 2,105 | ||||||||||||
Base Metals | | Voisey's Bay Mine Expansion(9) | | 1H20 | | 10 | | 10 | | 76 | | 1,904 | ||||||||||||
Base Metals—North Atlantic | | VBME | | 1H21 | | 163 | | 223 | | 311 | | 1,694 | ||||||||||||
Iron ore | | Gelado | | 2H21 | | 5 | | 5 | | 87 | | 428 | ||||||||||||
Base Metals—South Atlantic | | Salobo III | | 1H22 | | 3 | | 3 | | 193 | | 1,128 | ||||||||||||
Our key investment projects are described in 2016.
The paragraphs below describe the status of each project as of December 31, 2016 and have not been updated to reflect any developments after that date.
Ferrous minerals and logistics projects
Iron ore mining and logistics projects:more detail below:
| | | | |
| | 81 | | |
Table of 2016, having loaded 11 vessels (aggregate of 3,100,000 tons) until the end Contents
Capital Expenditures
of 2016. The project is 76%97% complete, with total realizedexecuted capital expenditures (total cash outflows) of US$5.667.146 billion. The start-up is expected to continue through the second half of 2019.
Base metals projects
| | | | |
| | 82 | | |
We are subject to a wide range of governmental regulation in all the jurisdictions in which we operate worldwide. The following discussion summarizes the kinds of regulation that have the most significant impact on our operations.
Mining rights and regulation of mining activitiesMINING RIGHTS AND REGULATION OF MINING ACTIVITIES
Mining and mineral processing are subject to extensive regulation. In order to conduct these activities, we are required to obtain and maintain some form of governmental or private permits, which may include concessions, licenses, claims, tenements, leases or permits (all of which we refer to below as "concessions"). The legal and regulatory regime applicable to the mining industry and governing concessions differs among jurisdictions, often in important ways. In most jurisdictions, including Brazil, mineral resources belong to the State and may only be exploited pursuant to a governmental concession. In other jurisdictions, such as Ontario in Canada, a substantial part of our mining operations is conducted pursuant to mining rights we own (private permits). Government agencies are typically in charge of granting mining concessions and monitoring compliance with mining law and regulations.
The table below summarizes our principal concessions and other similar rights for our continuing operations. It does not include information with respect to our fertilizer business (discontinued operations).
| Location | | Mining title | | Approximate area covered (in hectares) | | Expiration date | | Mining title | | Approximate area covered (in hectares) | | Expiration date |
|---|---|---|---|---|---|---|---|---|---|---|---|---|
Brazil | | Mining concessions (including under applications) | | 574,967 | | Indefinite | | Mining concessions (including under applications) | | 595,523 | | Indefinite |
Canada(1) | | Mining concessions (terminology varies among provinces) | | 225,685 | | 2017 – 2036 | | Mining concessions (terminology varies among provinces) | | 218,761 | | 2018 – 2038 |
Indonesia(2) | | Contract of work | | 118,435 | | 2025 | | Contract of work | | 118,017 | | 2025 |
Australia | | Mining leases | | 4,559 | | 2041 | ||||||
New Caledonia | | Mining concessions | | 21,077 | | 2017 – 2051 | ||||||
Mozambique(3) | | Mining concessions | | 23,780 | | 2032 | ||||||
New Caledonia(3) | | Mining concessions | | 21,077 | | 2022 – 2051 | ||||||
Mozambique(4) | | Mining concessions | | 23,780 | | 2032 | ||||||
In addition to the concessions listed above, we have exploration licenses and exploration applications covering 4.43.6 million hectares in Brazil and 1.41.5 million hectares in other countries.
There are several proposed or recently adopted changes in mining legislation and regulations in the jurisdictions where we have operations that could materially affect us.
| | | | |
| | 83 | | |
Royalties and other taxes on mining activitiesRegulatory Matters
ROYALTIES AND OTHER TAXES ON MINING ACTIVITIES
We are required in many jurisdictions to pay royalties or taxes on our revenues or profits from mineral extractions and sales. These payments are an important element of the economic performance of a mining operation. The following royalties and taxes apply in some of the jurisdictions in which we have our largest operations:
| | | | |
| | 84 | | |
Environmental regulationsRegulatory Matters
ENVIRONMENTAL REGULATIONS
We are also subject to environmental regulations that apply to the specific types of mining and processing activities we conduct. We are required to obtain approvals, licenses, permits or authorizations from governmental authorities to construct and operate. In most jurisdictions, the development of new facilities requires us to submit environmental and social impacts statementsassessments for approval and often to make investments to mitigate environmental and social impacts, and we must operate our facilities in compliance with the terms of the approvals, licenses, permits or authorizations.
We are taking several steps to improve the efficiency of the licensing process, including stronger integration of our environmental and project development teams, the implementationfunding research into new and alternative technologies to reduce environmental and social impacts, use and continuous improvement of a Best Practices Guide for Environmental Licensing and the Environment, the deployment of highly-skilled specialist teams and closer interaction with environmental regulators and the creation of an executive committee to expedite internal decisions regarding licensing.regulators.
Environmental regulations affecting our operations relate, among other matters, to emissions of pollutants into the air, soil and water;water, including greenhouse gas and climate change regulations; recycling and waste management; protection and preservation of forests, coastlines, caves, cultural heritage sites, watersheds and other features of the ecosystem; water use; and financial provisions and closure plans needed since therequired for mining license; climate change andlicenses, including decommissioning and reclamation.reclamation costs. Environmental legislation is becoming stricter worldwide, which could lead to greater costs for environmental compliance. In particular, we expect heightened attention from various governments to reducing greenhouse gas emissions as a result of concern over climate change, especially following the entry into force of the Paris Agreement in late 2016.
There are several examples of environmental regulation and compliance initiatives that could affect our operations.
BRAZILIAN REGULATION OF MINING DAMS
In May 2016,2017, the DNPM (predecessor to the ANM) created new obligations for companies operating mining dams in Brazil, primarily:
| | | | |
| | 85 | | |
Regulatory Matters
high associated potential damage (DPA) completed these studies in June 2018, while those for medium-DPA mining dams were completed in December 2018. Studies for low-DPA mining dams must be completed by June 2019. The RPSB reports must be renewed each 3, 5 and 7 years for high, medium and low DPA respectively, and whenever any structural modifications are made.
In February 2019, the ANM issued a resolution on dam safety requiring companies that own upstream tailings dams to submit a technical decommissioning project by August 2019 and to fully decommission any inactive upstream tailings dam by August 2021, and any active upstream tailings dam by August 2023. In addition, the resolution requires the decommissioning of our facilities within the Self-Rescue Zone of a tailings dam. This new resolution is already in effect, but is under public consultation for potential adjustments until May 1, 2019.
In February 2019, a new statute approved by the state of Minas Gerais issued a decree orderingprohibits the increase, modification or construction of any upstream dam. The statute also prohibits the increase, modification or construction of any dam if communities are established within its Self-Rescue Zone, an immediate assessmentarea which encompasses the portion of the stability conditionsvalley downstream of the upstreamdam where timely evacuation and intervention by the competent authorities in emergency situations is not possible. In general, it imposes certain restrictions on the use of any other type of tailings dams and suspending new licensing procedures for building or heightening upstream dams, until the state environmental authority defined new rules and procedures. We have conducted extraordinary auditssignificant restrictions on the stability conditions of our upstream dams, and no anomalies were identified. We filed a report with local governmental authorities in September 2016. In March 2017, the state of Minas Gerais determined that upstream dams, or dams that have been once heightened by this method, that had their stability conditions attested by audit could be heightened by other constructive methods.
Regulation of other activitiesREGULATION OF OTHER ACTIVITIES
In addition to mining and environmental regulation, we are subject to comprehensive regulatory regimes for some of our other activities, including rail transport, port operations and electricity generation. We are also subject to more general legislation on workers' health and safety, safety and support of communities near mines, and other matters. The following descriptions relate to some of the other regulatory regimes applicable to our operations:
| | | | |
| | 86 | | |
Regulatory Matters
phase. If we agree to an earlier renewal of our concession,concessions, we may have to agree with additional performance indications,indicators, new investments obligations and new service standards.
| | | | |
| | 87 | | |
In December 2016, we agreed to sell substantially all of our fertilizer business to Mosaic, subject to certain conditions precedent. Until closing of the transaction, which is expected by the end of 2017, we continue to conduct potash and phosphate operations in Brazil and to hold a 40% economic interest and 51% voting interest in a joint venture that operates a phosphate rock mine in Peru. As a result of this transaction, our Fertilizer business is reported as discontinued operations, which requires the presentation of prior periods of this line of business as discontinued operations.
Phosphates and nitrogen
Our subsidiary Vale Fertilizantes is a producer of phosphate rock, phosphate fertilizers (e.g., monoammonium phosphate (MAP), triple superphosphate (TSP) and single superphosphate (SSP)), dicalcium phosphate (DCP) and nitrogen fertilizers (e.g., ammonia and ammonium nitrate). It is the largest producer of phosphate and nitrogen crop nutrients in Brazil. Vale Fertilizantes operates the following phosphate rock mines, through concessions for indefinite period: Catalão, in the Brazilian state of Goiás, Tapira, Patos de Minas and Araxá, all in the Brazilian state of Minas Gerais, and Cajati, in the Brazilian state of São Paulo. In addition, Vale Fertilizantes has nine processing plants for the production of phosphate and nitrogen nutrients, located in Catalão in the Brazilian state of Goiás; Araxá, Patos de Minas and Uberaba, which are all in the Brazilian state of Minas Gerais; Cajati and three plants in Cubatão, which are all in the Brazilian state of São Paulo. In February 2015, operation at our plant in Guará was suspended due to market conditions.
Since 2010, we also have a 40% economic interest and 51% voting interest in the joint venture Compañia Minera Miski Mayo S.R.L, which operates the Bayóvar phosphate rock mine in Peru, with nominal capacity of 3.9Mtpy, through a concession for indefinite period.
The following table sets forth information about our phosphate rock production.
| | | | | Production for the year ended December 31, | ||||
|---|---|---|---|---|---|---|---|---|
| Mine | | Type | | 2014 | | 2015 | | 2016 |
| | | | | (thousand metric tons) | ||||
Bayóvar | | Open pit | | 3,801 | | 3,881 | | 3,853 |
Catalão | | Open pit | | 1,055 | | 1,000 | | 872 |
Tapira | | Open pit | | 2,005 | | 1,970 | | 1,633 |
Patos de Minas(1) | | Open pit | | 73 | | 23 | | 0 |
Araxá | | Open pit | | 883 | | 707 | | 711 |
Cajati | | Open pit | | 605 | | 581 | | 477 |
| | | | | | | | | |
Total | | | 8,421 | | 8,163 | | 7,546 | |
| | | | | | | | | |
| | | | | | | | | |
| | | | | | | | | |
The following table sets forth information about our phosphate and nitrogen nutrients production.
| | | Production for the year ended December 31, | ||||
|---|---|---|---|---|---|---|
| Product | | 2014 | | 2015 | | 2016 |
| | | (thousand metric tons) | ||||
Monoammonium phosphate (MAP) | | 1,065 | | 1,097 | | 1,020 |
Triple superphosphate (TSP) | | 910 | | 866 | | 833 |
Single superphosphate (SSP) | | 1,854 | | 1,953 | | 1,753 |
Dicalcium phosphate (DCP) | | 502 | | 480 | | 487 |
Ammonia(1) | | 178 | | 138 | | 135 |
Nitric acid | | 469 | | 475 | | 468 |
Ammonium nitrate | | 485 | | 515 | | 523 |
Phosphate reserves
Our phosphate reserves estimates are of in-place material after adjustments for depletion, mining dilution and recovery. The total phosphate reserves have decreased mainly due to reevaluation of our reserves at Araxá and Cajati, and because certain reserves from Bayóvar were downgraded to resources. The remaining phosphate reserves decreased due to mine production depletion.
| | Phosphate reserves(1)(2) | | |||||||||||||||||||||||
| | Proven – 2016 | | Probable – 2016 | | Total – 2016 | | Total – 2015 | | |||||||||||||||||
| | Tonnage | | Grade | | Tonnage | | Grade | | Tonnage | | Grade | | Tonnage | | Grade | | |||||||||
Bayóvar(3) | | 101.6 | | 16.96 | | 145.6 | | 14.97 | | 247.2 | | 15.79 | | 402.0 | | 15.40 | | ||||||||
Catalão | | 56.3 | | 10.52 | | 29.1 | | 10.62 | | 85.5 | | 10.55 | | 93.5 | | 10.53 | | ||||||||
Tapira | | 276.9 | | 7.76 | | 378.0 | | 7.41 | | 655.0 | | 7.56 | | 666.6 | | 7.57 | | ||||||||
Araxá | | 21.3 | | 10.71 | | 1.0 | | 7.75 | | 22.3 | | 10.59 | | 86.6 | | 11.86 | | ||||||||
Cajati | | 40.5 | | 5.16 | | 41.2 | | 5.15 | | 81.7 | | 5.15 | | 104.8 | | 5.20 | | ||||||||
Patrocínio(4) | | 183.8 | | 13.73 | | 302.3 | | 11.10 | | 486.1 | | 12.09 | | 486.1 | | 12.09 | | ||||||||
| | | | | | | | | | | | | | | | | | | ||||||||
Total | | 680.4 | | 10.91 | | 897.3 | | 9.88 | | 1,577.7 | | 10.32 | | 1,839.6 | | 10.69 | | ||||||||
| | | | | | | | | | | | | | | | | | | ||||||||
| | | | | | | | | | | | | | | | | | | ||||||||
| | | | | | | | | | | | | | | | | | | ||||||||
| | | Phosphate rock ore mine | | |||||||||||||||
|---|---|---|---|---|---|---|---|---|---|---|---|---|---|---|---|---|---|---|
| | | Type | | Operating since | | Projected exhaustion date | | Vale interest | | |||||||||
| | | | | | | | | (%) | | |||||||||
Bayóvar | | Open pit | | | 2010 | | | | 2040 | (1) | | | 40.0 | | | |||
Catalão | | Open pit | | | 1982 | | | | 2033 | | | | 100.0 | | | |||
Tapira | | Open pit | | | 1979 | | | | 2046 | (2) | | | 100.0 | | | |||
Araxá | | Open pit | | | 1977 | | | | 2042 | (3) | | | 100.0 | | | |||
Cajati | | Open pit | | | 1970 | | | | 2033 | | | | 100.0 | | | |||
Patrocínio | | Open pit | | | 2016 | | | | 2046 | (2) | | | 100.0 | | | |||
Potash
We conduct potash operations in Brazil at the parent-company level, with mining concessions of indefinite duration. We have leased Taquari-Vassouras, the only potash mine in Brazil (in Rosario do Catete, in the Brazilian state of Sergipe), from Petrobras since 1992. In April 2012, we extended the lease for 30 more years. The following table sets forth information on our potash production.
| | | | | Production for the year ended December 31, | | | ||||
|---|---|---|---|---|---|---|---|---|---|---|
| | | | | 2016 process recovery | ||||||
| Mine | | Type | | 2014 | | 2015 | | 2016 | ||
| | | | | (thousand metric tons) | | (%) | ||||
Taquari-Vassouras | | Underground | | 492 | | 481 | | 501 | | 86.1 |
Potash ore reserves
The total potash reserves have increased due to update of Taquari-Vassouras reserves model, supported by approximately 30.000 meters of underground drilling. We were able to increase the reserves due to reevaluation of extraction ratio; also we have made a partial pillar mining extraction. The reserve estimates are of in-place material after adjustments for depletion, mining losses and recoveries, with no adjustments made for metal losses due to processing.
| | Potash ore reserves(1)(2) | | |||||||||||||||||||||||
| | Proven – 2016 | | Probable – 2016 | | Total – 2016 | | Total – 2015 | | |||||||||||||||||
| | Tonnage | | Grade | | Tonnage | | Grade | | Tonnage | | Grade | | Tonnage | | Grade | | |||||||||
Taquari-Vassouras(3) | | 3.6 | | 25.05 | | 6.0 | | 21.88 | | 9.5 | | 23.06 | | 7.7 | | 23.72 | | ||||||||
Carnalita Project | | 247.1 | | 12.18 | | 54.5 | | 12.18 | | 301.6 | | 12.18 | | 301.6 | | 12.18 | | ||||||||
| | | | | | | | | | | | | | | | | | | ||||||||
Total | | 250.7 | | 12.36 | | 60.5 | | 13.14 | | 311.1 | | 12.51 | | 309.3 | | 12.47 | | ||||||||
| | | | | | | | | | | | | | | | | | | ||||||||
| | | | | | | | | | | | | | | | | | | ||||||||
| | | | | | | | | | | | | | | | | | | ||||||||
| | | Potash ore mines | | |||||||||||||||
|---|---|---|---|---|---|---|---|---|---|---|---|---|---|---|---|---|---|---|
| | | Type | | Operating since | | Projected exhaustion date | | Vale interest | | |||||||||
| | | | | | | | | (%) | | |||||||||
Taquari-Vassouras | | Underground | | | 1986 | | | | 2020 | (1) | | | 100.0 | | | |||
Carnalita Project(2) | | Solution mining | | | – | | | | 2042 | (3) | | | 100.0 | | | |||
For purposes of determining our phosphate and potash reserves, we used the three-year historical average prices set forth in the following table:
| ||||
| ||||
|
II.III. OPERATING AND FINANCIAL REVIEW AND PROSPECTS
Our performance in 2018 was overshadowed by the tragic event in Brumadinho in January 2019. For a discussion of the expected impact of the dam failure on our future results, seeBusiness overview—Failure of the tailings dam at the Córrego do Feijão mine.
In 2016, we delivered a sound operational performance, with multiple production records, particularly (i) total iron ore production of 348.8 million metric tons, (ii) iron ore production of 148.1 million metric tons in Carajás, (iii) nickel production of 311,000 tons, (iv) copper production of 453,100 tons, (v) cobalt production of 5,799 tons, (vi) contained gold as byproduct in copper and nickel concentrates of 483,000 oz and (vii) coal production of 5.5 million metric tons in Moatize.
In 2016, we generated2018, our net income attributable to our stockholders offrom continuing operations in 2018 was US$3.9826.988 billion, compared to a loss of US$12.1296.334 billion in 2015. The most relevant factors impacting2017, and our resultsAdjusted EBITDA in 2016 were (i) the partial recovery of average prices for iron ore and iron ore pellets, with an impact of2018 was US$2.96616.593 billion, on our net revenues, (ii)8.2% higher sales volumes of iron ore fines and pellets (an impact of US$715 million on our net revenues), nickel, copper and coal, (iii) lower prices for base metals (negative impact of US$431 million on our net revenues), (iv) US$1.174 billionthan in charges for impairment of assets of continuing operations and onerous contracts, and (v) loss in the amount of US$1.738 billion in loss of discontinued operations,2017, mainly as a result of higher realized prices (impact of US$977 million) and higher sales volumes (impact of US$975 million) for ferrous minerals, which were partially offset by higher costs and expenses for ferrous minerals (impact of US$616 million), driven by cost factors that are directly linked to iron ore prices. Adjusted EBITDA is a non-GAAP measure, which is calculated using net income or loss and adding back (i) depreciation, depletion and amortization, (ii) income taxes, (iii) financial results, net, (iv) equity results and other results in associates and joint ventures, net of dividends received, and (v) special events. For more information on the salereconciliation of our fertilizer businessAdjusted EBITDA to Mosaic.our net income, see note 4 to our consolidated financial statements.
IMPACT OF THE FAILURE OF DAM I AT THE CÓRREGO DO FEIJÃO MINE
The failure of Dam I represents an event subsequent to the financial statements as of and for the year ended December 31, 2018. Accounting impacts of the dam failure will consequently be reflected in the financial statements for 2019, beginning with the financial statements as of and for the quarter ended March 31, 2019. We received US$1.343 billionexpect the failure of Dam I and its consequences to have extensive impact on our financial performance and results of operations. We have not yet determined the full scope and amount of all the consequences, but some major expected impacts are summarized below.
| | | | |
| | 88 | | |
Overview
prosecutors in Minas Gerais pursuant to which we agreed to indemnify direct and indirect employees affected by the closure of our operations at Córrego do Feijão mine. We currently estimate that a provision of approximately US$220 million will be recognized in 2019 in connection with this proceeding. On February 20, 2019, we entered into a preliminary agreement with certain public authorities, pursuant to which we agreed to provide certain emergency indemnification payments to the residents of Brumadinho and the communities that are located in a certain region by the Paraopeba river. We estimate a provision ranging from US$260 million to US$520 million in connection with this settlement. Our potential liabilities resulting from the Salobo copper mine fordam failure are significant, and additional provisions may be recognized during the lifeyear of mine2019.
Major factors affecting pricesMAJOR FACTORS AFFECTING PRICES
Iron ore and iron ore pellets
Iron ore and iron ore pellets are priced based on a wide array of quality levels and physical characteristics. Price differences derive from various factors, such as the iron content of specific ore deposits, the beneficiation processes required to produce the desired final product, particle size, moisture content and the type and concentration of contaminants (such as phosphorus, alumina, silica and manganese ore) in the ore. Also, fines, lump ore and pellets typically command different prices.
Demand for our iron ore and iron ore pellets is a function of global demand for carbon steel. Demand for carbon steel, in turn, is strongly influenced by real estate and infrastructure construction and global industrial production. Demand from China has been the principal driver of world demand and prices.
Prices are also influenced by the supply of iron oreIn 2018, China's "supply-side reform" was broadened to include coke and iron ore pelletsoperations, in addition to steel operations. As a result, supply constraints were observed in both industries. During the international market. In 2015, an excess in theyear, iron ore supply hadprice levels were mainly sustained by these constraints, combined with firm steel consumption and higher steel prices. As a negative impact on prices. In 2016, prices began to rise in February driven by policies and supply restrictions imposed by the Chinese government, which caused iron ore prices to reach a peak of US$70 per dry metric ton by early May. As expected,result, steel mills increased their productivity in response to the increase in demand and price, which increasedsupported the premium for high gradehigh-grade ores, such as our iron ore from Carajás, and pellets. Steel mill productivity rates stabilized through August 2016,
China's steel sector outperformed in 2018, mainly driven by machinery, manufacturing and real estate. The infrastructure sector underperformed during the year, mainly driven by deleveraging and tighter public—private partnership policies. Manufactured goods enjoyed healthy external demand driven by strong orders from the United States and developed countries, as well as high grade material premiums, with high coking coal prices increasingrobust internal demand driven by improvements in the value perceptionindustry's profit margins, all leading China to deliver a record-high steel production of high grade ores even more. Prices increased again928.3 Mt in October 2016, reaching US$83.952018, an increase of 6.6% year-on-year as per dry metric ton in December 2016, with the price spread between the 65% Ferrous content iron ore that we produce in Carajás and the benchmark 62% Ferrous content iron ore reaching US$15 per dry metric ton.World Steel Association.
The expected conclusion of certain iron ore projects in 2017, especially in Australia and in Brazil, may result in negative pressures on prices, which would pose additional challenges for higher cost producers of iron ore. We expect China's economic growth to slow down in 2017, principally due to slowerGlobal steel production excluding China also posted strong growth in 2018 with 880.3 Mt, an increase of 2.5% year-on-year, as the real estateworld enjoys its first synchronized growth since the global financial crisis of 2008 and manufacturing sectors, which may be partially offset by infrastructure investments.2009 as consumption and job creation increased and investments resumed, reflecting in steel demand and production.
| | | | |
| | 89 | | |
OurOverview
As a results of the macroeconomic condition mentioned above, in 2018 there was an increase in the price spreads between high- and low-quality ores. Improved steel profitability, high coking coal price and the environmental restrictions imposed during 2018 led mills to source high-quality ores like the Carajás iron ore (IOCJ), with around 65% Fe, which provide higher productivity and lower emission levels. While the Metal Bulletin 58% average of US$40.5/dmt in 2018 was only 13% lower year-on-year, the Metal Bulletin 65% average of US$90.4/dmt in 2018 represented an increase of 3% year-on-year.
The price differentials between high- and low-grade iron ores are a structural change that should continue to impact the market in the coming years. The move towards a more efficient steel industry, with the enforcement of stricter environmental policies in China, should support the demand for high-quality ores that enable productivity and lower emission levels like pellets and IOCJ.
While the increased demand for higher grade ores should support the quality premiums, the relatively strong supply of ores with lower Fe and high contaminant levels should also maintain pressure on the discounts for such products. Iron ore Platts IODEX 62% averaged US$69.5/dmt in 2018, in line with the 2017 level of 71.3/dmt, as the steel sector outperformance led to higher steel prices are based onand iron ore premiums across the world.
In 2019, we expect China's economic growth to moderate from 2018 with some downward risks from property, trade and certain manufacturing sectors (e.g. auto and home appliances). However, since the property stock level has been reduced, the investments and new starts should see only a variety of pricing options, which generally use spot price indices as a benchmark. Our pricing is generally based on published indicessmall decrease. In addition, the Chinese government has showed clear signs to support infrastructure investment that should partly offset the headwinds from the property and uses a variety of mechanisms, including current spot prices, average prices over an agreed period and future prices on delivery. In cases where the final price is only determinable on a future date after shipment, we recognize the sale based on a provisional price at the time of shipment with a subsequent adjustment reflecting the final price.trade sectors.
Nickel
Nickel is an exchange-traded metal, listed on the LME and, starting in 2015, on the SHFE. Most nickel products are priced based on a discount or premium to the LME price, depending on the nickel product's physical and technical characteristics. Demand for nickel is strongly affected by stainless steel production, which represents, on average, 69%70% of global primary nickel consumption.consumption in 2018.
We have short-term fixed-volume contracts with customers for the majority of our expected annual nickel sales. These contracts, together with our sales for non-stainless steel applications (alloy steels, high nickel alloys, plating and batteries), provide stable demand for a significant portion of our annual production. In 2016, 58%2018, 67% of our refined nickel sales were made for non-stainless steel applications, compared to the industry average for primary nickel producers of 30%, bringing more stability to our sales volumes. As a result of our focus on such higher-value segments, our average realized nickel prices for refined nickel have typically exceeded LME cash nickel prices.
Stainless steel is a significant driver of demand for nickel, particularly in China. In 2016, Chinese2018, stainless steel demandproduction in China represented 65%41% of total globalnickel demand. As a consequence, changes in Chinese stainless steel production have a large impact on global nickel demand. In 2016,2018, Chinese stainless steel production grew 10%2% compared to 3%7% in 2015.2017. Also, the growth in stainless focused on 300-series grade steels, which contains relatively high amounts of nickel, due to superior physical characteristics compared to other austenitic stainless steel series. We anticipate that demand will continue growing in 2017.2019.
While stainless steel production is a major driver of global nickel demand, stainless steel producers can obtain nickel with a wide range of nickel content, including secondary nickel (scrap). The choice between primary and secondary nickel is largely based on their relative prices and availability. Between 2012On average between 2014 and 2016,2018, secondary nickel accounted for approximately 40% of total nickel used for stainless steels, and primary nickel accounted for approximately 60%.steel. Regional availability and consumption of secondary nickel varies. In China, due to low availability of scrap,
| | | | |
| | 90 | | |
Overview
the use of secondary nickel represents 20%22% of the total nickel used for stainless steels,steel, while nickel pig iron, a relatively low-gradelow grade nickel product made primarily in China from imported lateritic ores, accounts for approximately 32%36%.
In recent years, Chinese domestic production of nickel pig iron accounted for the majority of world nickel supply growth. In 2016,2018, approximately 360,000449kt thousand metric tons, representing 19%22% of world primary nickel supply was produced as nickel pig iron mainlyin China using nickel ore from the Philippines.Philippines and Indonesia. Chinese nickel pig iron production was adversely affected by export restriction of unprocessed ores from Indonesia, beginning in 2014. As a result, despite the increase of ore supply from the Philippines, nickel pig iron production declined and has continued to decline in 2016 by 9% year-over-year. Nickel pig iron projects in Indonesia continued to ramp up in 2016, with production levels increasing significantly relative to 2015. However, due to the low price environment the overall global supply declined 2% as producers reduced production and several mines closed. Recent market developments in Indonesia and the Philippines may further impact nickel pig iron production in China. In January 2017, the Indonesian government issued a ministerial decree changing the 2009 mining law that banned the export of unprocessed and semi-processed ores from the country. The ministerial decree allows for the controlled recommencement of nickel ore exports from Indonesia. In February 2017,Indonesia giving broad availability of ores for the governmentproduction of the Philippines announced the results of a country-wide mining audit with over half of the mines associated with Philippine nickel ore exports identified for potential closure. The government of the Philippines is currently auditing the mining industry, which may result in restrictions on mining exports, which in turn would further contribute to the decline of the Chinese nickel pig iron industry.
in China. As a result, the bottleneck for production has shifted away from ore availability to nickel pig iron capacity. Furthermore, Indonesia is emerging as a large producer of increased demandnickel pig iron. In 2018, 263kt of nickel as nickel pig iron was produced in Indonesia much of it integrated directly to produce stainless steel. We expect nickel pig iron production in Indonesia and decrease in supply, theChina to continue to grow.
The nickel market was in deficit in 2016.2018 by approximately 146kt. Global exchange inventories (London Metals Exchange and Shanghai Future Exchange) declined 26,000188,239 metric tons from January 1, 20162018 to December 31, 2016.2018, implying some off-exchange inventory holding. We expect the market to remain in deficit in 2017.2019, although less so than we estimated for 2018.
In the long term, the battery segment shows important upside potential as electric vehicle production continues to attract significant investments, which could positively affect nickel price and our nickel premiums. As currently foreseeable, commercially viable electric vehicle battery technologies utilize nickel; increasing nickel content in such batteries results in improved energy storage and lower cost. As a result, nickel demand is expected to surge, particularly given the expected increase in production of electric vehicles and the trends towards increased battery size and increased nickel content in batteries to improve performance and lower cost.
Copper
Copper demand in recent years has been driven primarily by China, given the important role copper plays in construction in addition to electrical and consumer applications. Copper prices are determined on the basis of (i) prices of copper metal on terminal markets, such as the LME, SHFE and the NYMEX,COMEX, and (ii) in the case of intermediate products, such as copper concentrate (which comprise most of our sales) and copper anode, treatment and refining charges negotiated with each customer. Under a pricing system referred to as MAMA ("month after month of arrival"), sales of copper concentrates and anodes are provisionally priced at the time of shipment, and final prices are settled on the basis of the LME price for a future period, generally one to three months after the shipment date.
Demand for refined copper grew by an estimated 2%approximately 3% in 2016, and2018, with China was responsible for an approximately 48%49% of worldwide consumption. MostPredominant use of the copper imported byin China was used in infrastructureconstruction and in the electrical grid. New projects primarilyIn 2018, supply disruptions due to labor negotiations were expected to continue in Peru and mine expansions continued to ramp up in 2016,2018, particularly from 2017. However, these disputes were averted, resulting in a global mine output increaseproduction increasing approximately 3% compared to 2017. In the first half of 5% in 2016 relative to 2015. As supply grew more thanthe year, demand in 2016,China as well as a positive macroeconomic environment helped improve copper prices declined in 2016. Prices recovered in fourth quarterprices. Yet, this trend reversed during the second half of 2016, as the market anticipated a potential increase in U.S. demand givenyear where trade war disputes between China and the election results.United States put downward pressure on copper prices. We anticipate that the market will reach a balance in 2017,2019, as demand continues to grow and projects complete ramping up.
| | | | |
| | 91 | | |
Overview
Coal
Demand for metallurgical coal is fundamentally driven by steel demand, and future growth continues to be expected in Asia. Asia, including India, accounts for more than half of the steel market and consumes approximately 75% of seaborne metallurgical coal. Chinese total import demand increasedcoking coal imports decreased by 17%7% to almost 6865 million metric tons in 20162018 compared to approximately 5770 million metric tons imported in 2015.2017, mainly due to increased domestic coal consumption. In 2016,2018, China accounted for approximately 20% of alltotal metallurgical coal imports. Global demand excluding China declinedhas increased by 1.8%approximately 2.1% in 2016,2018, compared to 2015, partially due2017, mainly driven by India, and is expected to increase by 10% (to 55 million metric tons), mainly driven by South America and Southeast Asia.
The Chinese government has implemented a number of policies in order to conduct structural reforms and address oversupply capacity, while improving overall safety standards and the decline in imports in Europelong-term competitiveness of its domestic coal industry. Between 2016 and Brazil.
In 2016,2018, total closures reached approximately 60Mt and the Chinese government imposed a 276-days per year constraint onset up plans to cut an additional 200Mt by 2020. In order to meet air quality rules implemented as part of new environmental measures, Chinese coal mines and coke makers have been inspected several times during 2018 and were shut down for not meeting safety and environmental standards in the operationsFenwei region. This has resulted in shortages of coke and premium coking coal, producers, creating a major supply shortage. Consequently,leading to higher prices.
In the international market, price volatility continued in 2018. Premium coking coal production in China declined by more than 10% in 2016, causing significant increase in prices. Disruptions in Australian operations and cutbacksaverage price climbed 10.1% year-on-year from U.S. producers over the last two years also contributed to the price surge. The seaborne metallurgical coal market, which has been affected by four years of constant price declines, registered a rapid increase in metallurgical coal rise, exceeding US$100187 per metric ton in July, then exceeding2017 to US$200207 per metric ton. Seaborne coking coal prices were strong at US$262 per metric in early January amid severe weather conditions and logistics constraints. Prices reached a bottom of US$179 per metric ton, mainly driven by weaker currency related to the trade war, steel production cuts and weak demand from India with ongoing monsoons. However, prices rebounded in September 2016the second half of 2018, mainly due to an increase in demand from China after the end of the winter cuts, logistic constraints and finally exceedingsupply tightness in Queensland due to port maintenance, and tightness in the U.S. industry related to hurricane Florence, reaching a price of US$300220 per metric ton in November 2016.at year-end. The steep rise in prices prompted the Chinese government to gradually loosenprice of metallurgical coal production controls, causing prices to decline. Metallurgical coal price on February 28, 2017January 10, 2019 was US$162.5199 per metric ton.
Demand for thermal coal is closely related to electricity consumption, which continues to be driven by global economic growth and urbanization, with the highest levels of growth found in Asia and emerging markets. Global power demand increased 3.6% year on year and thermal coal demand increased 1.6% year on year. The Chinese seaborne thermal coal import posted a second year in a row increase, reaching approximately 220 million metric tons in 2018, up 9.7% year on year, as a result of increased power demand. Demand in Asian countries (excluding China) has been relatively stable, Coal consumption for power generation has fallen for the fifth consecutive year in Europe, and demand decreasedis estimated to drop by approximately 1.4%6.5% year on year. The European seaborne import decrease was largely impacted by the decline in 2016coal consumption in the UK and Germany, and continued competition against gas and renewables. However, short-term factors, such as low water levels in Europe reducing hydropower generation and nuclear and gas supply issues have kept demand volatile. In India, year-on-year thermal coal demand remained firm, and seaborne imports increased by 9% in 2018, compared to 2015. Chinese seaborne coal demand soared2017, due to increased power generation and lower than expected domestic production. The power sector in mid-2016India is expected to grow in the near term and domestic production plans set by the Indian government are unlikely to reach targets due to a hot summernumber of land acquisition issues and strong industrial activity. Chinese seaborne importsinfrastructure projects.
The Newcastle Index average in 2018 reached approximately 150 millionUS$107.3 per metric tons, an increase of 12%ton, up 21% year on year, while European seaborne importsthe Richards Bay Coal Index increased by 21% to US$97.8 per metric ton. Thermal coal prices started the year on a strong note supported by healthy demand in India and in China. However, prices fell by nearly 18%. European seaborne import decline was largelyin the second half of 2018 due to capacity closuresweaker demand from China and improved renewables in coal-fired power plants inEurope. Chinese import restrictions, improved Chinese domestic supply, and warmer winters have dented the United Kingdom. In addition, Germany and Spain produced more electricity from gas in 2016, and Germany increased electricity production from hydro. In India, thermal coal demand remained stable year on year, and imports dropped by 6.3% in 2016, compared to 2015, amid an increase in domestic thermal coal supply. Even though Indian domestic coal production has underperformed against government targets affected by infrastructure bottlenecks, heavy rains and by lackluster demand.high ash
| | | | |
| | 92 | | |
After China introducedOverview
off-specification prices and the 276-working-day policy in April, the pricediscounts of thermal coal reachedRichards Bay widened from US$1107 per metric ton in Asia as Chinese utility companies sought seaborne materialthe beginning of 2018 to offset domestic supply shortage. While there have been several drivers of thermal coal seaborne prices in 2016, the coal industry reform ledUS$23 per metric ton by the Chinese government altered thermal coal prices globally. The renewed production control relaxation measure is likely to allow the market to return to balance in 2017. Together with normalized inventory levels and lower influence of speculative activities, we expect thermal coal prices to decline through the year.year-end.
Climate change policies willmay continue to adversely impact coal demand in Europe, North America and China. However, consumption in other developing Asian economies is expected to expand. On the supply side, current investments are low and the lack of new project developmentsdevelopment is expected to impact supply and demand balance by 2020, at which point prices will be set by incentive prices.
Sale of fertilizer businessFAILURE OF SAMARCO'S FUNDÃO TAILINGS DAM
As part of our ongoing efforts to optimize the structure of our portfolio of businesses in order to achieve the most efficient allocation of capital, in December 2016 we entered into an agreement with Mosaic for the sale of our Fertilizers business, including assets in Brazil, Peru and Canada. As a result of this agreement, we report operational and financial results for our fertilizers business in the income statements under "discontinued operations." Therefore, unless otherwise indicated, all figures presented in this annual report do not include the results of the fertilizers business. For more information on the sale of our fertilizer business, seeInformation on the Company—Business Overview—Significant changes in our business—Dispositions and asset sales—Sale of Fertilizer Business.
The net assets of our fertilizer business in our balance sheet as of December 31, 2016 were adjusted to reflect their fair value minus the cost to sell the business, and we recognized a loss in the amount of US$1.738 billion (US$1.147 billion, net of tax) under "loss of discontinued operations" in our income statement for the year ended December 31, 2016.
Impairment charges
In recent years, we have recognized significant impairments of our assets and investments, attributable to a variety of factors. In 2016, the most important factor was the changing price environment's effects on our short to medium-term pricing assumptions for nickel. As a result, in 2016 we recognized impairments on assets and investments of continuing operations, and a provision for losses on onerous contracts, totaling US$1.174 billion.
The main impairment charges we recognized in 2016 were:
These amounts were partially offset by reversal of prior impairments on assets of our Northern System's pelletizing plant based on new market circumstances and on studies carried out by our management demonstrating economic feasibility. Accordingly, the total of US$160 million impairment recorded in 2013 and 2015 was fully reversed.
Failure of Samarco's Fundão tailings dam
We own a 50% interest in Samarco and accountsaccount for it under the equity method. Below is a summary of the impact of the failure of Samarco's dam, which occurred in November 2015, in our financial statements:
| | | | |
| | 93 | | |
Overview
(US$294 million) and R$1,045 million (US$284 million) in 2016, 2017 and 2018, respectively, and we expect to contribute R$1,160 million (US$309 million) in 2019, to be used in the programs in accordance with the Framework Agreement. This total amount was deducted from the provision of US$1.163 billion mentioned above.
Effect of Brazilian currency exchange variationEFFECT OF CURRENCY EXCHANGE VARIATION
Our results are affected in several ways by changes in the value of the Brazilianreal exchange rate. The year-end. Year-end exchange rate variations impact our financial results, while the average exchange rate impacts our operational performance.
In 2016,2018, the Brazilianreal appreciated 17%depreciated 17.1% against the U.S. dollar, from an exchange rate of R$3.903.31 to US$1.00 on December 31, 20152017 to R$3.263.87 to US$1.00 on December 31, 2016.2018. The most important effects were non-cash gains,losses, as described below.
In 2016, on an2018, the annual average theexchange rate for Brazilianrealreais depreciated by 4% against the U.S. dollar depreciated by 13.0%, from an average exchange rate of R$3.343.19 to US$1.00 in 20152017 to R$3.483.66 to US$1.00 in 2016. The Brazilianreal depreciation2018. This had a positive impact on an annual average brought positive impacts to our operational result and cash flows. The most important effect is described below:
In January 2017, Valewe implemented hedge accounting for the foreign currency risk arising from itsVale S.A.'s net investments in Vale International and Vale Austria. The purpose of the program is to mitigate the impact of foreign exchange variations in Vale's earnings, reducing volatility and allowing financial statements to better reflect the economic performance of the company.
Under the hedge accounting program, the Vale S.A.our debt denominated in U.S. dollars and Euros will serveserves as a hedge instrument for Vale S.A. investments in Vale International and Vale Austria.these investments. With the program, the impact of exchange rate variations overon debt denominated in U.S. dollars and Euros will behas been partially recorded under other comprehensive income, reducing the volatility onof our financial performance.
Starting on January 1, 2019, we will treat certain long-term intercompany loans payable by Vale S.A. to Vale International, for which settlement is neither planned nor likely to occur in the foreseeable future, as part of Vale S.A.'s net investment in Vale International. Until December 31, 2018, the impact of the exchange variation on these intercompany loans was reflected on our consolidated income statement. With the change in the accounting treatment, the foreign exchange differences associated with our net
| | | | |
| | 94 | | |
Overview
investment in Vale International will be recognized in other comprehensive income in in our stockholders' equity. This amount would be reclassified from stockholders' equity to income statement in case of disposal or partial disposal of the net investment in Vale International. Upon implementation of this change, the effect of net foreign exchange gains or losses in the financial results reported in our consolidated income statement is expected to reduce.
CHANGES IN ACCOUNTING POLICIES
Certain new accounting standards became effective for the accounting period beginning on or after January 1, 2018. The key changes to accounting policies are described below:
Under IFRS 15, for contracts in which we are responsible for providing shipping services after the date of transfer of control of goods to customers (sales under CFR or CIF Incoterms), the provision of shipping services is accounted for as a separate performance obligation, and a portion of the transaction price is allocated to such services and recognized over time. The impact on the timing of revenue recognition did not significantly impact our financial statements for 2018. Therefore, we did not present this revenue separately in our financial statements.
As of December 31, 2018, we have non-cancellable operating lease commitments in the nominal amount of US$2.498 billion. We have reviewed these leasing commitments over the last year in light of the new lease accounting rules in IFRS 16. Of these commitments, we expect to recognize right-of-use assets and lease liabilities ranging from US$1.8 billion to US$2 billion on January 1, 2019, which corresponds to the net present value of these non-cancellable operating lease commitments.
The actual impact of adopting the standard is subject to further changes because we have not finalized the testing and assessment of controls over our new IT systems. Also, the new accounting policies are subject to change until we present our first financial statements from the date of initial application.
For more information, see note 2 to our consolidated financial statements.
| | | | |
| | 95 | | |
Consolidated RevenuesCONSOLIDATED REVENUES
In 2016,2018, our net operating revenues from continuing operations increased by 17.6%7.7% to US$27.48836.575 billion, primarily resulting from higher realized prices for iron ore fines and pellets (an impact of US$2.966 billion980 million on our net revenues) and other commodities, and higher sales volumes of iron ore fines and pellets (an impact of US$715 million1.848 billion on our net revenues), nickel, copper and coal.. Our net operating revenues were adverselyalso positively impacted by lowerhigher prices for base metals (negative(positive impact of US$431685 million). Net operating results of each segment are discussed below under—Results of operations by segment.
Our revenue depends, among other factors, on the volume of production at our facilities and the prices for our products. We publish a quarterly production report that is availableFor more information on our website and furnished toproduction, seeInformation on the SEC on Form 6-K.Company—Lines of Business. Increases in the capacity of our facilities resulting from our capital expenditure program have an important effect on our performance. Our production is also affected by acquisitions and dispositions.
The following table summarizes, for the periods indicated, the distribution of our net operating revenues offrom continuing operations based on the geographical location of our customers.
| | | Net operating revenues by destination | | Net operating revenues by destination | | ||||||||||||||||||||||||||||||||
|---|---|---|---|---|---|---|---|---|---|---|---|---|---|---|---|---|---|---|---|---|---|---|---|---|---|---|---|---|---|---|---|---|---|---|---|---|---|
| | | 2014 | | 2015 | | 2016 | | 2016 | | 2017 | | 2018 | | ||||||||||||||||||||||||
| | | (US$ million) | | (% of total) | | (US$ million) | | (% of total) | | (US$ million) | | (% of total) | | (US$ million) | | (% of total) | | (US$ million) | | (% of total) | | (US$ million) | | (% of total) | | ||||||||||||
North America | | | | | | | | | | | | | | | | | |||||||||||||||||||||
Canada | | US$1,393 | | 4.0% | | US$1,122 | | 4.8% | | US$1,172 | | 4.3% | | 1,172 | | 4.3 | % | | 1,008 | | 3.0 | % | | 656 | | 1.8 | % | | |||||||||
United States | | 1,368 | | 3.9 | | 855 | | 3.7 | | 1,005 | | 3.6 | | 1,005 | | 3.7 | | | 1,310 | | 3.9 | | | 1,353 | | 3.7 | | | |||||||||
| | | | | | | | | | | | | | | | | | | | | | | | | | | ||||||||||||
| | 2,761 | | 7.9 | | 1,977 | | 8.5 | | 2,177 | | 7.9 | | 2,177 | | 7.9 | | | 2,318 | | 6.8 | | | 2,009 | | 5.5 | | | ||||||||||
| | | | | | | | | | | | | | | | | | | | | | | | | | | ||||||||||||
South America | | | | | | | | | | | | | | | | | |||||||||||||||||||||
Brazil | | 3,696 | | 10.5 | | 2,017 | | 8.6 | | 2,064 | | 7.5 | | 2,064 | | 7.5 | | | 3,475 | | 10.2 | | | 3,248 | | 8.9 | | | |||||||||
Other | | 656 | | 1.9 | | 377 | | 1.6 | | 354 | | 1.3 | | 354 | | 1.3 | | | 664 | | 2.0 | | | 822 | | 2.2 | | | |||||||||
| | | | | | | | | | | | | | | | | | | | | | | | | | | ||||||||||||
| | 4,352 | | 12.4 | | 2,394 | | 10.2 | | 2,418 | | 8.8 | | 2,418 | | 8.8 | | | 4,139 | | 12.2 | | | 4,070 | | 11.1 | | | ||||||||||
| | | | | | | | | | | | | | | | | | | | | | | | | | | ||||||||||||
Asia | | | | | | | | | | | | | | | | | |||||||||||||||||||||
China | | 12,657 | | 36.0 | | 9,095 | | 38.9 | | 12,747 | | 46.4 | | 12,747 | | 46.4 | | | 14,018 | | 41.3 | | | 15,242 | | 41.7 | | | |||||||||
Japan | | 3,627 | | 10.3 | | 1,959 | | 8.4 | | 1,741 | | 6.3 | | 1,741 | | 6.3 | | | 2,456 | | 7.2 | | | 2,743 | | 7.5 | | | |||||||||
South Korea | | 1,555 | | 4.4 | | 790 | | 3.4 | | 880 | | 3.2 | | 880 | | 3.2 | | | 1,399 | | 4.1 | | | 1,299 | | 3.6 | | | |||||||||
Taiwan | | 721 | | 2.1 | | 620 | | 2.6 | | 621 | | 2.3 | | 621 | | 2.3 | | | 700 | | 2.1 | | | 513 | | 1.4 | | | |||||||||
Other | | 976 | | 2.8 | | 830 | | 3.5 | | 889 | | 3.2 | | 889 | | 3.2 | | | 1,483 | | 4.4 | | | 1,854 | | 5.1 | | | |||||||||
| | | | | | | | | | | | | | | | | | | | | | | | | | | ||||||||||||
| | 19,536 | | 55.6 | | 13,294 | | 56.8 | | 16,878 | | 61.4 | | 16,878 | | 61.4 | | | 20,056 | | 59.0 | | | 21,651 | | 59.2 | | | ||||||||||
| | | | | | | | | | | | | | | | | | | | | | | | | | | ||||||||||||
Europe | | | | | | | | | | | | | | | | | |||||||||||||||||||||
Germany | | 2,111 | | 6.0 | | 1,433 | | 6.1 | | 1,379 | | 5.0 | | 1,379 | | 5.0 | | | 1,389 | | 4.1 | | | 1,653 | | 4.5 | | | |||||||||
United Kingdom | | 709 | | 2.0 | | 399 | | 1.7 | | 326 | | 1.2 | | 326 | | 1.2 | | | 346 | | 1.0 | | | 327 | | 0.9 | | | |||||||||
Italy | | 849 | | 2.4 | | 461 | | 2.0 | | 435 | | 1.6 | | 435 | | 1.6 | | | 521 | | 1.5 | | | 553 | | 1.5 | | | |||||||||
France | | 565 | | 1.6 | | 331 | | 1.4 | | 429 | | 1.6 | | 429 | | 1.6 | | | 551 | | 1.6 | | | 655 | | 1.8 | | | |||||||||
Other | | 2,374 | | 6.8 | | 1,905 | | 8.1 | | 2,079 | | 7.5 | | 2,079 | | 7.6 | | | 2,695 | | 7.9 | | | 2,920 | | 8.0 | | | |||||||||
| | | | | | | | | | | | | | | | | | | | | | | | | | | ||||||||||||
| | 6,608 | | 18.8 | | 4,529 | | 19.4 | | 4,648 | | 16.9 | | 4,648 | | 16.9 | | | 5,502 | | 16.2 | | | 6,107 | | 16.7 | | | ||||||||||
| | | | | | | | | | | | | | | | | | | | | | | | | | | ||||||||||||
Rest of the world | | 1,867 | | 5.3 | | 1,190 | | 5.1 | | 1,367 | | 5.0 | | 1,367 | | 5.0 | | | 1,952 | | 5.7 | | | 2,738 | | 7.5 | | | |||||||||
| | | | | | | | | | | | | | | | | | | | | | | | | | | ||||||||||||
Total | | US$35,124 | | 100.0% | | US$23,384 | | 100.0% | | US$27,488 | | 100.0% | | 27,488 | | 100 | % | | 33,967 | | 100 | % | | 36,575 | | 100 | % | | |||||||||
| | | | | | | | | | | | | | | | | | | | | | | | | | | | |||||||||||
| | | | | | | | | | | | | | | | | | | | | | | | | | | ||||||||||||
Consolidated operating costs and expensesCONSOLIDATED OPERATING COSTS AND EXPENSES
Our cost of goods sold and services rendered from continuing operations totaled US$17.65022.109 billion in 2016, decreasing2018, increasing by 5.9%5.1%, or US$1.1011.070 billion, from the US$18.75121.039 billion recorded in 2015. Lower2017. Higher costs were mostly driven by the positive resultshigher freight costs (impact of cost-saving initiatitves (US$1.718 billion, of which US$1.374 billion in our589 million) and higher costs per metric ton on ferrous minerals business), exchange(impact of US$997 million) due to external factors such as the increase in royalties' rate variation (US$463 million) and raw material inflation. The increase in cost of goods sold was partially offset by higher sales volume.the positive impact
| | | | |
| | 96 | | |
Results of Operations
caused by the depreciation of the Brazilianreal against U.S. dollar and other currencies (impact of US$946 million).
Our selling, general, administrative and other expenses from continuing operations decreased by 28.3% in 2016, mostly due to simplification of corporate functions, lower expenses with corporate services and other cost-cutting measures. We reduced our research and evaluation expenses by 19.2%, tototaled US$319968 million in 2016 from2018, in line with US$395951 million recorded in 2015. Our2017. We decreased our pre-operating and stoppage expenses decreased by US$489142 million, in 2016, primarily because theas S11D ramp-up of our nickel operation in New Caledonia approached operational targets in 2015matured and therefore startedbegan to be accounted for as costs in 2016. Other operating2018. This reduction was partially offset by the increase by 9.7% in our research and evaluation expenses, increased by 29%, mainly due to the positive effect of US$150 million from goldstream transaction recorded in 2016, compared to US$230373 million in 2015, and to the positive effect of2018 from US$37 million reversal of provisions for asset retirement obligations in 2016 compared to US$331340 million in 2015.2017.
Results of operations by segmentRESULTS OF OPERATIONS BY SEGMENT
Net operating revenue by segment
The following table summarizes our net operating revenues by product for the periods indicated.
| | | Year ended December 31, | | | Year ended December 31, | | |||||||||||||||||||
|---|---|---|---|---|---|---|---|---|---|---|---|---|---|---|---|---|---|---|---|---|---|---|---|---|---|
| | | 2014(1) | | % change | | 2015(1) | | % change | | 2016 | | | 2016 | | % change | | 2017 | | % change | | 2018 | | |||
| | | (US$ million, except for %) | | | (US$ million, except for %) | | |||||||||||||||||||
Ferrous minerals: | | | | | | | | | | | | | |||||||||||||
Iron ore | | US$19,301 | | (36.1)% | | US$12,330 | | 28.0% | | US$15,784 | | | 15,784 | | 17.4 | % | 18,524 | | 9.9 | % | 20,354 | | |||
Pellets | | 5,263 | | (31.6) | | 3,600 | | 6.3 | | 3,827 | | | 3,827 | | 47.7 | | 5,653 | | 17.7 | | 6,651 | | |||
Ferroalloys and manganese | | 392 | | (58.7) | | 162 | | 86.4 | | 302 | | | 302 | | 55.3 | | 469 | | (3.2) | | 454 | | |||
Other ferrous products and services | | 741 | | (36.6) | | 470 | | (6.8) | | 438 | | | 438 | | 10.3 | | 483 | | (1.9) | | 474 | | |||
| | | | | | | | | | | | | | | | | | | | | | | | |||
Subtotal | | 25,697 | | (35.5) | | 16,562 | | 22.9 | | 20,351 | | | 20,351 | | 23.5 | | 25,129 | | 11.2 | | 27,933 | | |||
| | | | | | | | | | | | | ||||||||||||||
Coal | | 739 | | (28.8) | | 526 | | 59.5 | | 839 | | | 839 | | 86.8 | | 1,567 | | 4.9 | | 1,643 | | |||
| | | | | | | | | | | | | ||||||||||||||
Base metals: | | | | | | | | | | | | | |||||||||||||
Nickel and other products(2) | | 6,241 | | (24.8) | | 4,693 | | (4.7) | | 4,472 | | ||||||||||||||
Copper concentrate(3) | | 1,451 | | 1.3 | | 1,470 | | 13.4 | | 1,667 | | ||||||||||||||
Nickel and other products(1) | | 4,472 | | 4.4 | | 4,667 | | (1.2) | | 4,610 | | ||||||||||||||
Copper concentrate(2) | | 1,667 | | 32.2 | | 2,204 | | (5.0) | | 2,093 | | ||||||||||||||
| | | | | | | | | | | | | | | | | | | | | | | | |||
Subtotal | | 7,692 | | (19.9) | | 6,163 | | (0.4) | | 6,139 | | | 6,139 | | 11.9 | | 6,871 | | (2.4) | | 6,703 | | |||
| | | | | | | | | | | | | ||||||||||||||
Other products and services(4) | | 996 | | (86.6) | | 133 | | 19.5 | | 159 | | ||||||||||||||
Other products and services(3) | | 159 | | 151.6 | | 400 | | (26.0) | | 296 | | ||||||||||||||
| | | | | | | | | | | | | | | | | | | | | | | | |||
Net operating revenues | | US$35,124 | | (33.4)% | | US$23,384 | | 17.6% | | US$27,488 | | | 27,488 | | 23.6 | % | 33,967 | | 7.7 | % | 36,575 | | |||
| | | | | | | | | | | | | | | | | | | | | | | | | ||
| | | | | | | | | | | | | | | | | | | | | | | | |||
Sales volumes
The following table sets forth, for our principal products, the total volumes we sold in each of the periods indicated.
| | | Year ended December 31, | | | Year ended December 31, | |||||||||||
|---|---|---|---|---|---|---|---|---|---|---|---|---|---|---|---|---|
| | | 2014 | | 2015 | | 2016 | | | 2016 | | 2017 | | 2018 | |||
| | | (thousand metric tons, except where indicated) | | | (thousand metric tons, except where indicated) | |||||||||||
Ferrous minerals: | | | | | | | | |||||||||
Iron ore fines | | 255,877 | | 276,393 | | 289,940 | | | 289,940 | | 288,692 | | 307,433 | |||
Pellets | | 43,682 | | 46,284 | | 47,709 | | | 47,709 | | 51,775 | | 56,592 | |||
Manganese | | 1,879 | | 1,764 | | 1,851 | | | 1,851 | | 1,826 | | 1,572 | |||
Ferroalloys | | 150 | | 69 | | 127 | | | 127 | | 132 | | 141 | |||
ROM | | 14,075 | | 12,269 | | 3,496 | | | 3,496 | | 2,637 | | 1,548 | |||
Coal: | | | | | | | | |||||||||
Thermal coal | | 1,152 | | 892 | | 5,457 | | | 5,457 | | 4,602 | | 5,393 | |||
Metallurgical coal | | 6,330 | | 5,614 | | 4,907 | | | 4,907 | | 7,178 | | 6,240 | |||
Base metals: | | | | | | | | |||||||||
Nickel | | 272 | | 292 | | 311 | | | 311 | | 295 | | 236 | |||
Copper | | 353 | | 397 | | 430 | | | 430 | | 424 | | 379 | |||
PGMs (000' oz) | | 577 | | 519 | | 507 | | |||||||||
Gold (000' oz) | | 351 | | 425 | | 497 | | |||||||||
Silver (000' oz) | | 1,889 | | 2,303 | | 2,578 | | |||||||||
PGMs (000' oz.) | | 507 | | 350 | | 374 | ||||||||||
Gold (000' oz.) | | 497 | | 471 | | 484 | ||||||||||
Silver (000' oz.) | | 2,578 | | 2,179 | | 2,169 | ||||||||||
Cobalt (metric tons) | | 3,188 | | 3,840 | | 4,734 | | | 4,734 | | 5,013 | | 4,974 | |||
| | | | |
| | 97 | | |
Results of Operations
Average realized prices
The following table sets forth our average realized prices for our principal products for each of the periods indicated. We determine average realized prices based on our net operating revenues, which consist of the price charged to customers, excluding certain items that we deduct in arriving at net operating revenues, mainly value-added tax.
| | | Year ended December 31, | | | Year ended December 31, | |||||||||||
|---|---|---|---|---|---|---|---|---|---|---|---|---|---|---|---|---|
| | | 2014 | | 2015 | | 2016 | | | 2016 | | 2017 | | 2018 | |||
| | | (US$ per metric ton, except where indicated) | | | (US$ per metric ton, except where indicated) | |||||||||||
Ferrous minerals: | | | | | | | | |||||||||
Iron ore | | 75.43 | | 44.61 | | 54.44 | | | 54.44 | | 64.17 | | 66.21 | |||
Pellets | | 120.48 | | 77.79 | | 80.26 | | | 80.26 | | 109.18 | | 117.52 | |||
Manganese | | 118.15 | | 56.42 | | 110.87 | | | 110.87 | | 159.01 | | 162.51 | |||
Ferroalloys | | 1,125.83 | | 899.32 | | 757.67 | | | 757.67 | | 1,353.72 | | 1,178.50 | |||
Coal: | | | | | | | | |||||||||
Thermal coal | | 67.65 | | 52.36 | | 46.17 | | | 46.17 | | 71.05 | | 84.19 | |||
Metallurgical coal | | 104.37 | | 85.55 | | 119.54 | | | 119.54 | | 172.69 | | 190.60 | |||
Base metals: | | | | | | | | |||||||||
Nickel | | 16,426.47 | | 11,684.30 | | 9,800.00 | | | 9,800.00 | | 10,654.00 | | 13,666.83 | |||
Copper | | 6,015.47 | | 4,352.94 | | 4,458.00 | | | 4,458.00 | | 5,970.00 | | 5,583.00 | |||
Platinum (US$/oz) | | 1,261.87 | | 1,020.14 | | 919.00 | | | 919.00 | | 891.00 | | 901.00 | |||
Gold (US$/oz) | | 1,192.51 | | 1,123.07 | | 1,260.49 | | | 1,260.49 | | 1,247.00 | | 1,254.15 | |||
Silver (US$/oz) | | 19.42 | | 12.63 | | 16.22 | | | 16.22 | | 15.30 | | 14.43 | |||
Cobalt (US$/lb) | | 10.67 | | 9.95 | | 11.01 | | |||||||||
Cobalt | | 24,273.00 | | 51,513.00 | | 62,910.72 | ||||||||||
Cost of goods sold by segment
The following table presents, for each indicated period, our cost of goods sold by segment and the percentage change from year to year. Because significant portions of changes in our cost of goods sold may derive from exchange rate variations, we also present in the table below the effect of exchange variations and the changes on a constant currency basis.
| | | Year ended December 31, | ||||||||||||||
|---|---|---|---|---|---|---|---|---|---|---|---|---|---|---|---|---|
| | | 2016 | | 2015(1) | | 2016 | ||||||||||
| | | Cost of goods sold (US$ million) | | Cost of goods sold (US$ million) | | Variation as reported (%) | | Exchange rate impact in 2016 (US$ million) | | Variation without exchange rate impact (US$ million) | | Variation - constant currency basis (%) | ||||
Ferrous minerals: | | | | | | | ||||||||||
Iron ore | | 6,622 | | 7,604 | | (12.9)% | | (148 | ) | (834 | ) | (11.2)% | ||||
Pellets | | 2,002 | | 2,121 | | (5.6) | | (51 | ) | (68 | ) | (3.2) | ||||
Ferroalloys and manganese | | 231 | | 175 | | 32.0 | | (6 | ) | 62 | | 36.6 | ||||
Other ferrous products and services | | 269 | | 341 | | (21.1) | | (13 | ) | (59 | ) | (18.3) | ||||
| | | | | | | | | | | | | | ||||
Subtotal | | 9,124 | | 10,241 | | (10.9) | | (218 | ) | (899 | ) | (9.0) | ||||
Coal | | 872 | | 839 | | 3.9 | | (3 | ) | 36 | | 4.3 | ||||
Base metals: | | | | | | | ||||||||||
Nickel and other products(2) | | 3,204 | | 3,393 | | (5.6) | | (86 | ) | (103 | ) | (3.1) | ||||
Copper(3) | | 924 | | 903 | | 2.3 | | (37 | ) | 58 | | 6.7 | ||||
| | | | | | | | | | | | | | ||||
Subtotal | | 4,128 | | 4,296 | | (3.9) | | (123 | ) | (45 | ) | (1.1) | ||||
Other | | 259 | | 139 | | 86.3 | | (6 | ) | 126 | | 95.3 | ||||
| | | | | | | | | | | | | | ||||
Total (excluding depreciation) | | 14,383 | | 15,515 | | (7.3) | | (350 | ) | (782 | ) | (5.2) | ||||
| | | | | | | | | | | | | | ||||
| | | | | | | | | | | | | | ||||
| | | | | | | | | | | | | | ||||
Depreciation | | 3,267 | | 3,236 | | 1.0 | | (113 | ) | 144 | | 4.6 | ||||
| | | | | | | | | | | | | | ||||
Total (including depreciation) | | 17,650 | | 18,751 | | (5.9)% | | (463 | ) | (638 | ) | (3.5)% | ||||
| | | | | | | | | | | | | | ||||
| | | | | | | | | | | | | | ||||
| | | | | | | | | | | | | | ||||
| | | Year ended December 31, | | Year ended December 31, | | ||||||||||||||||||||||||||||
|---|---|---|---|---|---|---|---|---|---|---|---|---|---|---|---|---|---|---|---|---|---|---|---|---|---|---|---|---|---|---|---|---|---|
| | | | | | | | | | | | | | | ||||||||||||||||||||
| | | 2015(1) | | 2014(1) | | 2015 | | 2017 | | 2018 | | 2018 | | ||||||||||||||||||||
| | | | | | | | | | | | | | | ||||||||||||||||||||
| | Cost of goods sold | | Cost of goods sold | | Variation as reported | | Exchange rate impact in 2018 | | Variation without exchange rate impact | | Variation— constant currency basis | | |||||||||||||||||||||
| | | | | | | | | | | | | | | ||||||||||||||||||||
| | | Cost of goods sold (US$ million) | | Cost of goods sold (US$ million) | | Variation as reported (%) | | Exchange rate impact in 2015 (US$ million) | | Variation without exchange rate impact (US$ million) | | Variation - constant currency basis (%) | | | | (US$ million, except for %) | | ||||||||||||||||
Ferrous minerals: | | | | | | | | | | | | | | | | ||||||||||||||||||
Iron ore | | 7,604 | | 9,532 | | (20.2)% | | (1,442 | ) | (486 | ) | (6.0)% | | 7,950 | | 9,048 | | 13.8 | % | | (534) | | 1,632 | | 22.0 | % | | ||||||
Pellets | | 2,121 | | 2,705 | | (21.6) | | (540 | ) | (44 | ) | (2.0) | | 2,876 | | 3,393 | | 18.0 | | | (208) | | 725 | | 27.2 | | | ||||||
Ferroalloys and manganese | | 175 | | 261 | | (33.0) | | (73 | ) | (13 | ) | (6.9) | | 278 | | 290 | | 4.3 | | | (29) | | 41 | | 16.5 | | | ||||||
Other ferrous products and services | | 341 | | 565 | | (39.6) | | (179 | ) | (45 | ) | (11.7) | | 306 | | 313 | | 2.3 | | | (34) | | 41 | | 15.1 | | | ||||||
| | | | | | | | | | | | | | | | | | | | | | | | | | | | | ||||||
Subtotal | | 10,241 | | 13,063 | | (21.6) | | (2,234 | ) | (588 | ) | (5.4) | | 11,410 | | 13,044 | | 14.3 | | | (805) | | 2,439 | | 23.0 | | | ||||||
Coal | | 839 | | 1,071 | | (21.7) | | (80 | ) | (152 | ) | (15.3) | | 1,354 | | 1,575 | | 16.3 | | | – | | 221 | | 16.3 | | | ||||||
Base metals: | | | | | | | | | | | | | | | | ||||||||||||||||||
Nickel and other products(2) | | 3,393 | | 3,710 | | (8.5) | | (336 | ) | 19 | | 0.6 | |||||||||||||||||||||
Copper(3) | | 903 | | 877 | | 3.0 | | (258 | ) | 284 | | 45.7 | |||||||||||||||||||||
Nickel and other products(1) | | 3,437 | | 3,060 | | (11.0) | | | (14) | | (363) | | (10.6) | | | ||||||||||||||||||
Copper(2) | | 979 | | 960 | | (1.9) | | | (96) | | 77 | | 8.7 | | | ||||||||||||||||||
| | | | | | | | | | | | | | | | | | | | | | | | | | | | | ||||||
Subtotal | | 4,296 | | 4,587 | | (6.3) | | (594 | ) | 303 | | 7.6 | | 4,416 | | 4,020 | | (9.0) | | | (110) | | (286) | | (6.6) | | | ||||||
Other | | 139 | | 601 | | (76.9) | | (112 | ) | (350 | ) | (71.6) | | 375 | | 263 | | (29.9) | | | (31) | | (81) | | (23.5) | | | ||||||
| | | | | | | | | | | | | | | | | | | | | | | | | | | | | ||||||
Total (excluding depreciation) | | 15,515 | | 19,322 | | (19.7) | | (3,020 | ) | (787 | ) | (4.8) | | 17,555 | | 18,902 | | 7.7 | | | (946) | | 2,293 | | 13.8 | | | ||||||
| | | | | | | | | | | | | | | | | | | | | | | | | | | | | | |||||
| | | | | | | | | | | | | | | | | | | | | | | | | | | | | ||||||
Depreciation | | 3,236 | | 3,468 | | (6.7) | | (695 | ) | 463 | | 16.7 | | 3,484 | | 3,207 | | (8.0) | | | (191) | | (86) | | (2.6) | | | ||||||
| | | | | | | | | | | | | | | | | | | | | | | | | | | | | ||||||
Total (including depreciation) | | 18,751 | | 22,790 | | (17.7)% | | (3,715 | ) | (324 | ) | (1.7)% | | 21,039 | | 22,109 | | 5.1 | % | | (1,137) | | 2,207 | | 11.1 | % | | ||||||
| | | | | | | | | | | | | | | | | | | | | | | | | | | | | | |||||
| | | | | | | | | | | | | | | | | | | | | | | | | | | | | ||||||
| | | | |
| | 98 | | |
Table of discontinued operations (see note 14 toContents
Results of Operations
| | | Year ended December 31, | | ||||||||||||||
|---|---|---|---|---|---|---|---|---|---|---|---|---|---|---|---|---|---|
| | | 2016 | | 2017 | | 2017 | | ||||||||||
| | | Cost of goods sold | | Cost of goods sold | | Variation as reported | | Exchange rate impact in 2017 | | Variation without exchange rate impact | | Variation— constant currency basis | | ||||
| | | | | | | (US$ million, except for %) | | ||||||||||
Ferrous minerals: | | | | | | | | | | ||||||||
Iron ore | | 6,622 | | 7,950 | | 20.1 | % | | 330 | | 998 | | 14.4 | % | | ||
Pellets | | 2,002 | | 2,876 | | 43.7 | | | 110 | | 764 | | 36.2 | | | ||
Ferroalloys and manganese | | 231 | | 278 | | 20.3 | | | 14 | | 33 | | 13.5 | | | ||
Other ferrous products and services | | 269 | | 306 | | 13.8 | | | 36 | | 1 | | 0.3 | | | ||
| | | | | | | | | | | | | | | | | ||
Subtotal | | 9,124 | | 11,410 | | 25.1 | | | 490 | | 1,796 | | 18.7 | | | ||
Coal | | 872 | | 1,354 | | 55.3 | | | – | | 482 | | 55.3 | | | ||
Base metals: | | | | | | | | | | ||||||||
Nickel and other products(1) | | 3,204 | | 3,437 | | 7.3 | | | 64 | | 169 | | 5.2 | | | ||
Copper(2) | | 924 | | 979 | | 6.0 | | | 81 | | (26 | ) | (2.6 | ) | | ||
| | | | | | | | | | | | | | | | | ||
Subtotal | | 4,128 | | 4,416 | | 7.0 | | | 145 | | 143 | | 3.3 | | | ||
Other | | 259 | | 375 | | 44.8 | | | 20 | | 96 | | 34.4 | | | ||
| | | | | | | | | | | | | | | | | ||
Total (excluding depreciation) | | 14,383 | | 17,555 | | 22.1 | | | 655 | | 2,517 | | 16.7 | | | ||
| | | | | | | | | | | | | | | | | ||
| | | | | | | | | | | | | | | | | ||
| | | | | | | | | | | | | | | | | ||
Depreciation | | 3,267 | | 3,484 | | 6.6 | | | 159 | | 58 | | 1.7 | | | ||
| | | | | | | | | | | | | | | | | ||
Total (including depreciation) | | 17,650 | | 21,039 | | 19.2 | % | | 814 | | 2,575 | | 13.9 | % | | ||
| | | | | | | | | | | | | | | | | ||
| | | | | | | | | | | | | | | | | ||
| | | | | | | | | | | | | | | | | ||
Expenses by segment (excluding impairment charges)depreciation)
The following table summarizes, for each indicated period, our expenses (including(consisting of selling, general and administrative, research and evaluation, pre-operating, stoppage and other expenses, net of other revenues) by segment and the percentage change from year to year. Because significant portions of
| | | | |
| | 99 | | |
Results of Operations
changes in our expenses may derive from exchange rate variations, we also present in the table below the effect of exchange variations and the changes on a constant currency basis. The table excludes the effect of impairment charges. See—Impairment charges.
| | | Year ended December 31, | ||||||||||||||
|---|---|---|---|---|---|---|---|---|---|---|---|---|---|---|---|---|
| | | 2016 | | 2015(1) | | 2016 | ||||||||||
| | | Expenses (US$ million) | | Expenses (US$ million) | | Variation as reported (%) | | Exchange rate impact in 2016 (US$ million) | | Variation without exchange rate impact (US$ million) | | Variation - constant currency basis (%) | ||||
Ferrous minerals: | | | | | | | ||||||||||
Iron ore | | 727 | | 643 | | 13.1% | | (23 | ) | 107 | | 17.3% | ||||
Pellets | | 108 | | 19 | | 468.4 | | – | | 89 | | 468.4 | ||||
Ferroalloys and manganese | | 15 | | 18 | | (16.7) | | (1 | ) | (2 | ) | (11.8) | ||||
Other ferrous products and services | | 14 | | (3 | ) | (566.7) | | 2 | | 15 | | (1500.0) | ||||
| | | | | | | | | | | | | | ||||
Subtotal | | 864 | | 677 | | 27.6 | | (22 | ) | 209 | | 31.9 | ||||
| | | | | | | | | | | | | | ||||
Coal | | 21 | | 223 | | (90.6) | | (1 | ) | (201 | ) | (90.5) | ||||
| | | | | | | | | | | | | | ||||
Base metals: | | | | | | | ||||||||||
Nickel and other products(2) | | 287 | | 668 | | (57.0) | | – | | (381 | ) | (57.0) | ||||
Copper(3) | | 30 | | 41 | | (26.8) | | (1 | ) | (10 | ) | (25.0) | ||||
Other base metals | | (150 | ) | (230 | ) | (34.8) | | – | | 80 | | (34.8) | ||||
| | | | | | | | | | | | | | ||||
Subtotal | | 167 | | 479 | | (65.1) | | (1 | ) | (311 | ) | (65.1) | ||||
Others | | 274 | | 294 | | (6.8) | | 4 | | (24 | ) | (8.1) | ||||
| | | | | | | | | | | | | | ||||
Total (excluding depreciation) | | 1,326 | | 1,673 | | (20.7) | | (20 | ) | (327 | ) | (19.8) | ||||
| | | | | | | | | | | | | | ||||
| | | | | | | | | | | | | | ||||
| | | | | | | | | | | | | | ||||
Depreciation | | 220 | | 483 | | (54.5) | | (6 | ) | (257 | ) | (53.9) | ||||
| | | | | | | | | | | | | | ||||
Total (including depreciation) | | 1,546 | | 2,156 | | (28.3)% | | (26 | ) | (584 | ) | (27.4)% | ||||
| | | | | | | | | | | | | | ||||
| | | | | | | | | | | | | | ||||
| | | | | | | | | | | | | | ||||
| | Year ended December 31, | | ||||||||||||||||||||||||||||||
|---|---|---|---|---|---|---|---|---|---|---|---|---|---|---|---|---|---|---|---|---|---|---|---|---|---|---|---|---|---|---|---|---|
| | | Year ended December 31, | | 2017 | | 2018 | | 2018 | | |||||||||||||||||||||||
| | | 2015(1) | | 2014(1) | | 2015 | | Expenses | | Expenses | | Variation as reported | | Exchange rate impact in 2018 | | Variation without exchange rate impact | | Variation— constant currency basis | | |||||||||||||
| | | Expenses (US$ million) | | Expenses (US$ million) | | Variation as reported (%) | | Exchange rate impact in 2015 (US$ million) | | Variation without exchange rate impact (US$ million) | | Variation - constant currency basis (%) | | | | | | (US$ million, except for %) | | |||||||||||||
Ferrous minerals: | | | | | | | | | | | | | | | | |||||||||||||||||
Iron ore | | 643 | | 1,737 | | (63.0)% | | (539 | ) | (555 | ) | (46.3)% | | 258 | | 301 | | 16.7% | | (34 | ) | 77 | | | 34.4% | | | |||||
Pellets | | 19 | | 59 | | (67.8) | | (11 | ) | (29 | ) | (60.4) | | 35 | | 56 | | 60.0 | | (5 | ) | 26 | | | 86.7 | | | |||||
Ferroalloys and manganese | | 18 | | 36 | | (50.0) | | (9 | ) | (9 | ) | (33.3) | | 12 | | 4 | | (66.7 | ) | (1 | ) | (7 | ) | | (63.6 | ) | | |||||
Other ferrous products and services | | (3 | ) | 7 | | (142.9) | | (1 | ) | (9 | ) | (150.0) | | (9 | ) | 6 | | (166.7 | ) | – | | 15 | | | (166.7 | ) | | |||||
| | | | | | | | | | | | | | | | | | | | | | | | | | | | | |||||
Subtotal | | 677 | | 1,839 | | (63.2) | | (560 | ) | (602 | ) | (47.1) | | 296 | | 367 | | 24.0 | | (40 | ) | 111 | | | 43.4 | | | |||||
| | | | | | | | | | | | | | ||||||||||||||||||||
Coal | | 223 | | 365 | | (38.9) | | (8 | ) | (134 | ) | (37.5) | | 30 | | 30 | | – | | – | | – | | | – | | | |||||
| | | | | | | | | | | | | | ||||||||||||||||||||
Base metals: | | | | | | | ||||||||||||||||||||||||||
Nickel and other products(2) | | 668 | | 551 | | 21.2 | | (27 | ) | 144 | | (27.5) | ||||||||||||||||||||
Copper(3) | | 41 | | 33 | | 24.2 | �� | (9 | ) | 17 | | (70.8) | ||||||||||||||||||||
Other base metals | | (230 | ) | – | | – | | | (230 | ) | – | |||||||||||||||||||||
| | | | | | | | | | | | | | ||||||||||||||||||||
Nickel and other products(1) | | 171 | | 119 | | (30.4 | ) | 2 | | (54 | ) | | (31.2 | ) | | |||||||||||||||||
Copper(2) | | 28 | | 22 | | (21.4 | ) | (2 | ) | (4 | ) | | (15.4 | ) | | |||||||||||||||||
Subtotal | | 479 | | 584 | | (18.0) | | (36 | ) | (69 | ) | (12.6) | | 199 | | 141 | | (29.1 | ) | – | | (58 | ) | | (29.1 | ) | | |||||
Others | | 294 | | 507 | | (42.0) | | (153 | ) | (60 | ) | (16.9) | | 955 | | 930 | | (2.6 | ) | (96 | ) | 71 | | | 8.3 | | | |||||
| | | | | | | | | | | | | | | | | | | | | | | | | | | | | |||||
Total (excluding depreciation) | | 1,673 | | 3,295 | | (49.2) | | (757 | ) | (865 | ) | (34.1) | | 1,480 | | 1,468 | | (0.8 | ) | (136 | ) | 124 | | | 9.2 | | | |||||
| | | | | | | | | | | | | | | | | | | | | | | | | | | | | |||||
| | | | | | | | | | | | | | ||||||||||||||||||||
| | | | | | | | | | | | | | ||||||||||||||||||||
Depreciation | | 483 | | 401 | | 20.4 | | 67 | | 15 | | 3.2 | | 224 | | 144 | | (35.7 | ) | (25 | ) | (55 | ) | | (27.6 | ) | | |||||
| | | | | | | | | | | | | | | | | | | | | | | | | | | | | |||||
Total including depreciation | | 2,156 | | 3,696 | | (41.7)% | | (690 | ) | (850 | ) | (28.3)% | ||||||||||||||||||||
Total (including depreciation) | | 1,704 | | 1,612 | | (5.4 | )% | (161 | ) | 69 | | | 4.5% | | | |||||||||||||||||
| | | | | | | | | | | | | | | | | | | | | | | | | | | | | | ||||
| | | | | | | | | | | | | | | | | | | | | | | | | | | | | |||||
| | | Year ended December 31, | | |||||||||||
|---|---|---|---|---|---|---|---|---|---|---|---|---|---|---|
| | | 2016 | | 2017 | | 2017 | | |||||||
| | | Expenses | | Expenses | | Variation as reported | | Exchange rate impact in 2017 | | Variation without exchange rate impact | | Variation— constant currency basis | | |
| | | | | | | (US$ million, except for %) | | |||||||
Ferrous minerals: | | | | | | | | | ||||||
Iron ore | | 489 | | 258 | | (47.2 | )% | 38 | | (269 | ) | (51.0 | )% | |
Pellets | | 70 | | 35 | | (50.0 | ) | 5 | | (40 | ) | (53.3 | ) | |
Ferroalloys and manganese | | 12 | | 12 | | – | | 1 | | (1 | ) | (7.7 | ) | |
Other ferrous products and services | | 10 | | (9 | ) | (190.0 | ) | 1 | | (20 | ) | (181.8 | ) | |
| | | | | | | | | | | | | | | |
Subtotal | | 581 | | 296 | | (49.0 | ) | 45 | | (330 | ) | (52.7 | ) | |
| | | | | | | | | | | | | | | |
Coal | | (7 | ) | 30 | | (528.6 | ) | 1 | | 36 | | (600.0 | ) | |
| | | | | | | | | | | | | | | |
Base metals: | | | | | | | | | ||||||
Nickel and other products(1) | | 191 | | 171 | | (10.5 | ) | (2 | ) | (18 | ) | (9.5 | ) | |
Copper(2) | | 21 | | 28 | | 33.3 | | 2 | | 5 | | 21.7 | | |
Other base metals | | (150 | ) | – | | (100.0 | ) | – | | 150 | | (100.0 | ) | |
| | | | | | | | | | | | | | | |
Subtotal | | 62 | | 199 | | 221.0 | | – | | 137 | | 220.9 | | |
Others | | 690 | | 955 | | 38.4 | | 37 | | 228 | | 31.4 | | |
| | | | | | | | | | | | | | | |
Total (excluding depreciation) | | 1,326 | | 1,480 | | 11.6 | | 83 | | 71 | | 5.0 | | |
| | | | | | | | | | | | | | | |
Depreciation | | 220 | | 224 | | 1.8 | | 10 | | (6 | ) | (2.6 | ) | |
| | | | | | | | | | | | | | | |
Total (including depreciation) | | 1,546 | | 1,704 | | 10.2% | | 93 | | 65 | | 4.0% | | |
| | | | | | | | | | | | | | | |
| | | | | | | | | | | | | | | |
| | | | | | | | | | | | | | | |
| | | | |
| | 100 | | |
Results of Operations
Adjusted EBITDA by segment
Our management uses adjusted EBITDA to assess each segment's contribution to our performance and to support decisions about resource allocation. Adjusted EBITDA is a non-GAAP measure, which is calculated for each segment using operating income or loss for this segment plus dividends received and interest from associates and joint ventures, and associates, and adding back the amounts charged as (i) depreciation, depletion and amortization and (ii) impairment of non-current assets and provisions for losses on onerous contracts and (iii) results on measurement or sale of non-current assets.special events. For more information, see note 34 to our consolidated financial statements.
The table below shows a reconciliation of our consolidated Adjusted EBITDA from continuing operations with our net income (loss) from continuing operations for the years ended December 31, 2016, 2015 and 2014.periods indicated.
| | | Year ended December 31, | | Year ended December 31, | | |||||||||||||||||
|---|---|---|---|---|---|---|---|---|---|---|---|---|---|---|---|---|---|---|---|---|---|---|
| | | 2014 | | 2015 | | 2016 | | 2016 | | 2017 | | 2018 | | |||||||||
| | | (US$ million) | | (US$ million) | | |||||||||||||||||
Income (loss) from continuing operations attributable to Vale's stockholders | | 1,499 | | (11,929) | | 5,211 | ||||||||||||||||
Income from continuing operations attributable to Vale's stockholders | | | 5,211 | | | 6,313 | | | 6,952 | | | |||||||||||
Income (loss) attributable to noncontrolling interests | | | (8 | ) | | 21 | | | 36 | | | |||||||||||
| | | | | | | | | | | | | | | |||||||||
Loss attributable to noncontrolling interests | | (308) | | (501) | | (8) | ||||||||||||||||
Income (loss) from continuing operations | | 1,191 | | (12,430) | | 5,203 | ||||||||||||||||
| | | | | | | | ||||||||||||||||
Income from continuing operations | | | 5,203 | | | 6,334 | | | 6,988 | | | |||||||||||
Depreciation, depletion and amortization | | | 3,487 | | | 3,708 | | | 3,351 | | | |||||||||||
Income taxes | | 1,603 | | (5,249) | | 2,781 | | | 2,781 | | | 1,495 | | | (172 | ) | | |||||
Impairment and others results in associates and joint ventures | | 61 | | 349 | | 1,220 | ||||||||||||||||
Equity results in associates and joint ventures | | (501) | | 445 | | (309) | ||||||||||||||||
Financial results, net | | 6,018 | | 10,654 | | (1,843) | | | (1,843 | ) | | 3,019 | | | 4,957 | | | |||||
Operating income (loss) | | 8,372 | | (6,231) | | 7,052 | ||||||||||||||||
| | | | | | | | ||||||||||||||||
Impairment of non-current assets and onerous contracts | | 99 | | 8,769 | | 1,174 | ||||||||||||||||
Results on measurement or sale of non-current assets | | 167 | | (61) | | 66 | ||||||||||||||||
Dividends received from associates and joint ventures | | 568 | | 318 | | 193 | ||||||||||||||||
Depreciation, depletion and amortization | | 3,869 | | 3,719 | | 3,487 | ||||||||||||||||
Equity results and other results in associates and joint ventures, net of dividends received | | | 1,104 | | | 488 | | | 570 | | | |||||||||||
Special events | | | 1,240 | | | 294 | | | 899 | | | |||||||||||
| | | | | | | | | | | | | | | |||||||||
Adjusted EBITDA from continuing operations | | 13,075 | | 6,514 | | 11,972 | | | 11,972 | | | 15,338 | | | 16,593 | | | |||||
| | | | | | | | ||||||||||||||||
| | | | | | | | ||||||||||||||||
| | | | | | | | | | | | | | | |||||||||
Adjusted EBITDA from discontinued operations (Fertilizers) | | 278 | | 567 | | 209 | | | 209 | | | 4 | | | (3 | ) | | |||||
| | | | | | | | | | | | | | | |||||||||
Total Adjusted EBITDA | | 13,353 | | 7,081 | | 12,181 | | | 12,181 | | | 15,342 | | | 16,590 | | | |||||
| | | | | | | | | | | | | | | | ||||||||
| | | | | | | | | | | | | | | |||||||||
Special events are gains or losses recognized in our operating results that are not related to the performance of the business segments. We exclude special events from adjusted EBITDA to keep the segment performance analysis comparable with prior periods. The following table summarizes Adjusted EBITDA for each of our segments.special events we identified are as follows:
| | | Year ended December 31, | ||||
|---|---|---|---|---|---|---|
| | | 2014 | | 2015 | | 2016 |
| | | Adjusted EBITDA | | Adjusted EBITDA | | Adjusted EBITDA |
| | | (US$ million) | ||||
Ferrous minerals: | | | | |||
Iron ore | | 8,076 | | 4,105 | | 8,445 |
Pellets | | 2,981 | | 1,685 | | 1,820 |
Ferroalloys and manganese | | 95 | | (31) | | 56 |
Other ferrous products and services | | 169 | | 140 | | 155 |
| | | | | | | |
Subtotal | | 11,321 | | 5,899 | | 10,476 |
| | | | | | | |
Coal | | (669) | | (508) | | (54) |
| | | | | | | |
Base metals: | | | | |||
Nickel and other products(1) | | 1,980 | | 632 | | 985 |
Copper(2) | | 541 | | 526 | | 713 |
Other | | – | | 230 | | 150 |
| | | | | | | |
Subtotal | | 2,521 | | 1,388 | | 1,848 |
| | | | | | | |
Other(3) | | (98) | | (265) | | (298) |
| | | | | | | |
Total Adjusted EBITDA from continuing operations | | 13,075 | | 6,514 | | 11,972 |
| | | | | | | |
| | | | | | | |
| | | | | | | |
Adjusted EBITDA from discontinued operations (Fertilizers) | | 278 | | 567 | | 209 |
| | | | | | | |
Total Adjusted EBITDA | | 13,353 | | 7,081 | | 12,181 |
| | | | | | | |
| | | | | | | |
| | | | | | | |
| | | Year ended December 31, | | |||||||||||||
|---|---|---|---|---|---|---|---|---|---|---|---|---|---|---|---|---|
| | | 2016 | | 2017 | | 2018 | | |||||||||
| | | (US$ million) | | |||||||||||||
Result in disposal of assets | | | (66 | ) | | | (481 | ) | | | (322 | ) | | |||
Nacala Logistic Corridor | | | – | | | | 458 | | | | – | | | |||
Impairment and onerous contracts | | | (1,174 | ) | | | (271 | ) | | | (577 | ) | | |||
| | | | | | | | | |||||||||
Total | | | (1,240 | ) | | | (294 | ) | | | (899 | ) | | |||
| | | | | | | | | |||||||||
| | | | | | | | | | | | | | | |||
| | | | | | | | | |||||||||
| | | | |
| | 101 | | |
Results of Operations
| | | Year ended December 31, | | |||||||||||||
|---|---|---|---|---|---|---|---|---|---|---|---|---|---|---|---|---|
| | | 2016 | | 2017 | | 2018 | | |||||||||
| | | Adjusted EBITDA | | Adjusted EBITDA | | Adjusted EBITDA | | |||||||||
| | | (US$ million) | | |||||||||||||
Ferrous minerals: | | | | | | | | | | | ||||||
Iron ore | | | 8,683 | | | | 10,346 | | | | 11,033 | | | |||
Pellets | | | 1,858 | | | | 2,823 | | | | 3,356 | | | |||
Ferroalloys and manganese | | | 59 | | | | 179 | | | | 160 | | | |||
Other ferrous products and services | | | 159 | | | | 205 | | | | 162 | | | |||
| | | | | | | | | |||||||||
Subtotal | | | 10,759 | | | | 13,553 | | | | 14,711 | | | |||
| | | | | | | | | |||||||||
Coal | | | (26 | ) | | | 362 | | | | 181 | | | |||
| | | | | | | | | |||||||||
Base metals: | | | | | | | | | | | ||||||
Nickel and other products(1) | | | 1,081 | | | | 1,059 | | | | 1,431 | | | |||
Copper(2) | | | 722 | | | | 1,197 | | | | 1,111 | | | |||
Other | | | 150 | | | | – | | | | – | | | |||
| | | | | | | | | |||||||||
Subtotal | | | 1,953 | | | | 2,256 | | | | 2,542 | | | |||
| | | | | | | | | |||||||||
Other(3) | | | (714 | ) | | | (833 | ) | | | (841 | ) | | |||
| | | | | | | | | |||||||||
Total Adjusted EBITDA from continuing operations | | | 11,972 | | | | 15,338 | | | | 16,593 | | | |||
| | | | | | | | | |||||||||
Adjusted EBITDA from discontinued operations (Fertilizers) | | | 209 | | | | 4 | | | | (3 | ) | | |||
| | | | | | | | | |||||||||
Total Adjusted EBITDA | | | 12,181 | | | | 15,342 | | | | 16,590 | | | |||
| | | | | | | | | |||||||||
| | | | | | | | | | | | | | | |||
| | | | | | | | | |||||||||
We discuss below, for each segment, the changes in our net operating revenues, cost of goods sold (excluding depreciation, depletion and amortization), expenses (excluding depreciation, depletion and amortization and excluding impairment charges) and Adjusted EBITDA.
Ferrous minerals
20162018 compared to 20152017.
| | | | |
| | 102 | | |
Results of Operations
offset by lower pre-operating expenses in the amount of US$322 million. We also sawS11D as there was an increase in pre-operating and stoppage expenses from US$169 million in 2015 to US$187 million in 2016, mainly as a result of the increase in S11D pre-operating expenses and stoppage expense in our iron ore operations in Mariana, in the state of Minas Gerais.
production curve.
2017 compared to US$255 million in 2015, reflecting lower dividends, especially due to the lack of dividends from Samarco.
2015 compared to 20142016
Coal
20162018 compared to 20152017.
| | | | |
| | 103 | | |
Results of Operations
20152017 compared to 20142016
Base metals
20162018 compared to 20152017.
| | | | |
| | 104 | | |
Results of Operations
2017 compared to 2016
IMPAIRMENT OF NON-CURRENT ASSETS AND ONEROUS CONTRACTS
2018 compared to 2017.
In 2018, we recorded an impairment of non-current assets and onerous contracts of US$577 million compared to US$271 million in 2017. In 2018 we recorded an impairment of US$184 million due to the review undertaken of the business plan related to our certain forestry assets, leading to a reduction in the
| | | | |
| | 105 | | |
2015Results of Operations
expected operational capacity of these assets. We also recorded an additional provision of US$393 million in relation to onerous contracts in the Midwest system for fluvial transportation and port structure.
2017 compared to 20142016.
In 2017, we recorded an impairment of base metals
Financial results, netFINANCIAL RESULTS, NET
The following table details our net financial results, net, from continuing operations for the periods indicated.
| | | Year ended December 31, | | Year ended December 31, | | ||||||||
|---|---|---|---|---|---|---|---|---|---|---|---|---|---|
| | | 2014 | | 2015 | | 2016 | | 2016 | | 2017 | | 2018 | |
| | | (US$ million) | | (US$ million) | | ||||||||
Financial income(1) | | US$389 | | US$251 | | US$170 | | 170 | | 478 | | 423 | |
Financial expenses(2) | | (2,900) | | (1,068) | | (2,677) | | (2,677 | ) | (3,273 | ) | (2,345 | ) |
Gains (losses) on derivatives, net | | (1,334) | | (2,477) | | 1,256 | | 1,256 | | 454 | | (266 | ) |
Foreign exchange gains (losses), net | | (2,076) | | (7,044) | | 3,252 | | 3,252 | | (467 | ) | (2,247 | ) |
Indexation losses, net | | (97) | | (316) | | (158) | | (158 | ) | (211 | ) | (522 | ) |
| | | | | | | | | | | | | | |
Financial results, net | | US$(6,018) | | US$(10,654) | | US$1,843 | | 1,843 | | (3,019 | ) | (4,957 | ) |
| | | | | | | | | | | | | | | |
| | | | | | | | | | | | | | |
20162018 compared to 2015.2017.
In 2016,2018, our financial results, net, was incomewere an expense of US$1.843 billion,4,957 million compared to an expense of US$10.654 billion3,019 million in 2015.2017. This principallymainly resulted from:
| | | | |
| | 106 | | |
Results of Operations
2017 compared to 2016.
In 2017, our financial results, net, was a loss of US$3.019 billion, compared to an income of US$1.843 billion in 2015.2016. This principally resulted from:
EQUITY RESULTS AND OTHER RESULTS IN ASSOCIATES AND JOINT VENTURES
20152018 compared to 2014.2017. Our financial results, net increased 77.0%, to US$10.654 billion in 2015 from US$6.018 billion in 2014. This principally resulted from:
Equity results in associates and joint ventures
2016 compared to 2015.Our equity results in associates and joint ventures increased to a gain of US$309 million in 2016 from a loss of US$445 million in 2015 mostly due to the positive results in 2016 from our equity positions in Companhia Siderurgica do Pecém (US$25 million gain), MRN (US$48 million gain) and California Steel Industries, Inc.—CSI (US$32 million gain), as compared to the negative results in 2015 from Samarco (US$167 million loss), Companhia Siderurgica do Pecém (US$307 million loss), CSI (US$27 million loss) and Companhia Siderurgica do Atlântico—CSA (US$80 million loss).
2015 compared to 2014. Our equity results in associates and joint ventures in 2015 decreased to a loss of US$445 million from an income of US$501 million in 2014, mostly due to the negative results from Companhia Siderúrgica do Pecém (US$307 million loss in 2015) and from Samarco (US$167 million loss in 2015) while in 2014 we had a positive result from Samarco (US$392 million income).
Impairment and other results in associates and joint ventures
2016 compared to 2015. We recognized a loss resulting from impairment and other results in associates and joint ventures in 2018 were a loss of US$1.220 billion182 million, compared to a loss of US$82 million in 2017, mostly due to the US$487 million loss related to our investment in Samarco, driven by the additional provision recognized in 2018 (SeeBusiness overview-Failure of Samarco's Fundão tailings dam and note 22 to our consolidated financial statements), partially
| | | | |
| | 107 | | |
Results of Operations
offset by positive results in 2018 from our equity positions in our joint venture pelletizing plants (US$305 million).
2017 compared to 2016.
Our equity results and other results in associates and joint ventures in 2017 were a loss of US$82 million, compared to a loss of US$911 million in 2016, mostly due to the US$180 million loss related to our investment in Samarco, driven by the write-downs of whichthe debts instruments used to fund its working capital, partially offset by positive results in 2017 from our equity positions in our joint ventures (US$98 million). In 2016, we recognized an impairment of US$1.109 billion related to our investments in Samarco, US$75 million resulted from the sale of CSA and US$36 million from the sale of Mineração Paragominas. We recognized a loss resulting from impairment and other results in associates and joint ventures of US$349 million in 2015, of which US$446 million related to impairment from investments in associates and joint ventures, which was partially offset by a gain in the sale of our participation in Shandong Yankuang (US$79 million), a coking coal producer, and a gain in the disposal of energy generation assets (US$18 million). SeeSamarco.
Business overview—Failure of Samarco's tailings dam in Minas Gerais and note 15 to our consolidated financial statements.RESULTS OF DISCONTINUED OPERATIONS
20152018 compared to 2014.2017. In 2015, we recognized a loss resulting from impairment and other results in associates and joint ventures of US$349 million, of which US$132 million resulted from impairment from investments in related to our investment in Samarco and US$314 million related to our investment in TEAL. This was partially offset by US$97 million a gain in the sale of our participation in Shandong Yankuang (US$79 million), a coking coal producer, and a gain in the disposal of energy generation assets (US$18 million). In 2014, we recognized a loss resulting from impairment and other results in associates and joint ventures of US$61 million, primarily resulting from a US$30 million loss resulting from the sale of Vale Florestar.
Results of discontinued operations
2016 compared to 2015.In 2016,2018, we had a net loss from discontinued operations attributable to Vale's stockholders of USS$1.229 billion,US$92 million compared to a loss of US$200806 million in 2015.2017. In January 2018, we concluded the transaction with The Mosaic Company ("Mosaic"), and received US$1,080 million in cash and 34.2 million common shares, corresponding to 8.9% of Mosaic's outstanding common shares after the issuance of these shares (US$899 million, based on the Mosaic's quotation at closing date of the transaction) and recognized an additional loss of US$55 million in the income statement from discontinued operations. In May 2018, we concluded the transaction with Yara International ASA to sell our assets located in Cubatão and received US$255 million in cash and recognized a loss of US$69 million in the income statement from discontinued operations. For more information on our discontinued operations, see note 14 to our consolidated financial statements.
2017 compared to 2016.
In 2017, we had a net loss from discontinued operations attributable to Vale's stockholders of USS$806 million, compared to a loss of US$1,229 million in 2016. In December 2016, we entered into an agreement with Mosaic to sell a significant part of our fertilizer business. In January 2018, we concluded the transaction with Mosaic, which was preceded by final adjustments under the original terms and conditions of the negotiation. As consequence of these adjustments, an impairment loss of US$729 million was recognized in 2017. Additionally, in November 2017, we entered into an agreement with Yara International ASA to sell our nitrogen assets located in Cubatão, Brazil and an impairment loss of US$156 million was recognized in 2017.
INCOME TAXES
2018 compared to 2017.
In 2018, we recorded a resultnet income tax benefit of US$172 million, compared to a net income tax expense of US$1.495 billion in 2017, principally because of a benefit related to the recognition of a tax loss carry forward from a foreign subsidiary. In 2018, our effective tax rate was 18.1%, excluding this transaction,benefit. The effective tax rate was different from the statutory rate mainly due to: unrecognized tax on current year losses, partially offset by the tax benefit from interest on stockholders' equity and the tax incentives for our fertilizer business is being reported as discontinuediron ore, copper and nickel operations in the North and Northeast regions of Brazil. The incentives are calculated based on the taxable income of the incentive activity (tax operating income), taking into account the allocation of tax operating income to different tranches of production during the periods
| | | | |
| | 108 | | |
Results of Operations
specified for each product. In 2018, this tax incentive structure reduced our financial statements for the year ended December 31, 2016, and we have re-presented our financial statements for the years ended December 31, 2015 and 2014 accordingly. The net assets of our fertilizer business in our balance sheet as of December 31, 2016 were adjustedincome tax expense by US$1.449 billion.
2017 compared to reflect their fair value minus the cost to sell the business, and we recognized a loss in the amount of US$1.738 billion (US$1.147 billion, net of taxes) in "loss from discontinued operations" in our income statement for the year ended December 31, 2016. For more information on our discontinued operations see note 14 to our consolidated financial statements.
Income taxes
For 2016,In 2017, we recorded net income tax expense of US$2.7811.495 billion, compared to a net income tax gainexpense of US$5.2492.781 billion in 2015.2016. In 2016,2017, our effective tax rate was 34.8%19.1%. The effective tax rate was slightly different from the statutory rate mainly due to US$708432 million of unrecognized tax on current year losses, partially offset by the tax benefit from interest on stockholders' equity and the tax incentives for our iron ore, copper and nickel operations in the North and Northeast regions of Brazil. The incentives are calculated based on the taxable income of the incentive activity (tax operating income), taking into account the allocation of tax operating income to different tranches of production during the periods specified for each product. In 2016,2017, this tax incentive structure reduced our net income tax expense by US$344 million.1.100 billion.
| | | | |
| | 109 | | |
For 2015, we recorded net income tax gain of US$5.249 billion, compared to a net income tax expense of US$1.603 billion in 2014. In 2015, our effective tax rate was 29.7%. Tax legislation that became effective in 2015 provides that income of our foreign subsidiaries will be taxed in Brazil, on an accrual basis, applying the differential between the local rate and the Brazilian tax rates. Accordingly, the effective tax rate was different from the statutory rate mainly due to: (i) unrecognized tax losses and (ii) nondeductible impairment, partially offset by the constitution of tax loss forward related to losses at foreign subsidiaries that we were able to recognize due to change of law. Under the legislation that became effective in 2015, the accumulated losses of our foreign subsidiaries as of December 31, 2014 were available to offset their future profits. On September 30, 2015, we filed the required tax return and completed the review of the income tax loss carryforwards available in each foreign subsidiary as of December 31, 2014, which permitted us to recognize a deferred tax asset of US$2.952 billion related to accumulated losses in certain of our foreign subsidiaries.
LIQUIDITY AND CAPITAL RESOURCES
Overview
In the ordinary course of business, our principal funding requirements are for capital expenditures, dividend payments and debt service. We have historically metwill also need funding for remediation and reparation measures in connection with the failure of Dam I at Córrego do Feijão mine. We expect to meet these requirements, in line with our historical practice, by using cash generated from operating activities and borrowings, supplemented by dispositions of assets.
For 2017,2019, we have budgeted capital expenditures of US$4.5484.334 billion, including US$1.846 billion703 million for project execution and US$2.7023.731 billion for sustaining existing operations and replacement projects. A principal amount of US$1.061 billion773 million of our debt matures in 2017.2019.
We have taken measures to reduce our capital expenditures, and we are constantly evaluating opportunities for additional cash generation. Also, we continue to consider the sale of certain assets and investments, and joint ventures for certain of our businesses. Finally, we are committed to continue the reduction in our costs and expenses, to reduce our debt leverage and to maintain discipline in capital allocation.
Sources of fundsSOURCES OF FUNDS
Our principal sources of funds are operating cash flow and borrowings, supplemented by disposition of assets. The amount of operating cash flow is strongly affected by global prices for our products. In 2016,2018, our operating activities generated cash flows from continuing operations of US$6.581 billion, compared to US$4.49112.901 billion, in 2015, primarily reflectingline with the increaseUS$12.450 billion generated in prices of iron ore.2017.
In 2016,2018, we borrowed US$6.9191.225 billion under our new and existing financing agreements. Our major new borrowing transactions in 2016 are summarized below.
In 2016,2018, we received US$1.3431.481 billion as a result of divestments and sales of interests in certain joint ventures and investments.investments and sales of assets. The main divestment transactions in 20162018 are described below:
Uses of fundsUSES OF FUNDS
In the ordinary course of business, our principal funding requirements are for capital expenditures, dividend payments and debt service. We will also need funding for remediation and reparation measures in connection with the failure of Dam I at Córrego do Feijão mine.
Capital expenditures
Our capital expenditures in 2016, including the fertilizer business,2018 amounted to US$5.4823.807 billion, including US$3.179 billion911 million for project execution and US$2.3022.896 billion dedicated to sustaining existing operations. For more information about
| | | | |
| | 110 | | |
Liquidity and Capital Resources
the specific projects for which we have budgeted funds, seeInformation on the Company—Capital expenditures.
Distributions and repurchases
WeOn March 15, 2018, we paid totala second tranche of dividends on the results of the 2017 fiscal year of US$250664 million in December 2016 (classifiedand dividends on the results of the 2018 fiscal year of US$773 million, both classified as interest on shareholders' equity).stockholders' equity. We did not repurchase anyalso repurchased 71,173,683 of our common shares (including common shares represented by ADSs), in 2016.the total amount of US$1 billion.
On September 20, 2018, we paid dividends on the results of the 2018 fiscal year of US$1.876 billion (US$1.659 billion and US$217 million as dividends, both classified as interest on stockholders' equity.
Tax payments
We paid US$388676 million in income tax in 2016,2018, excluding the payments in connection with REFIS, compared to US$544563 million in 2015.2017. In connection with our participation in the REFIS, our outstanding commitment totals US$5.4194.349 billion, which will be paid in 142118 monthly installments. In 2016,2018, we paid a total of US$417452 million in connection with the REFIS.
Liability Management
In 2016,2018, we repaid US$5.5656.479 billion in debt that was set to mature in future years.debt. Our main liability management transactions in the year are summarized below.
DebtDEBT
As of December 31, 2016,2018, our total outstanding debt was US$29.32215.466 billion (including US$28.69115.228 billion of principal and US$631238 million of accrued interest) compared with US$28.85322.489 billion at the end of 2015.2017. As of December 31, 2016,2018, US$472233 million of our debt was secured by liens on some of our assets. As of December 31, 2016,2018, the weighted average of the remaining term of our debt was 7.9 years, compared to 8.18.9 years, in 2015.line with 2017.
As of December 31, 2016,2018, the short-term debt and the current portion of long-term debt was US$1.6601.003 billion, including charges.accrued interest.
| | | | |
| | 111 | | |
Liquidity and Capital Resources
Our major categories of long-term indebtedness are described below. The principal amounts given below include the current portion of long-term debt and exclude accrued charges.interest.
We have a variety of credit lines available, including the following, as of December 31, 2016:2018:
Some of our long-term debt instruments contain financial covenants. In particular, instruments representing approximately 21%18% of the aggregate principal amount of our total debt require that we maintain, as of the end of each quarter, (a)(i) a consolidated ratio of total debt to adjusted EBITDA for the past 12 months not exceeding 4.5 to one and (b)(ii) a consolidated interest coverage ratio of at least 2.0 to one. These covenants appear in our financing agreements with BNDES, with other export and development agencies, and with some other lenders. During the last quarter of 2015, we agreed with lenders under these agreements to amend the leverage ratio to require a ratio of 5.5 to one through the end of 2016 in order to give us flexibility to finalize our investment cycle.
As of December 31, 2016, (i) our consolidated ratio of total debt to adjusted EBITDA for the past 12 months was 2.4 to one and (ii) our consolidated interest coverage ratio was 6.9 to one.
As of December 31, 2016,2018, the corporate guarantees we provided (corresponding to our direct or indirect interest) for the companies Norte Energia S.A. and Companhia Siderúrgica do Pecém S.A. totaled US$361331 million and US$1.4501.404 billion, respectively.
| | | | |
| | 112 | | |
The following table summarizes our contractual obligations as of December 31, 2016.2018. This table excludes other common non-contractual obligations that we may have, including pension obligations, deferred tax liabilities and contingent obligations arising from uncertain tax positions, all of which are discussed in the notes to our consolidated financial statements.
| | | Payments due by period | | | Payments due by period | | ||||||||||||||||||||||||||||||||||||
|---|---|---|---|---|---|---|---|---|---|---|---|---|---|---|---|---|---|---|---|---|---|---|---|---|---|---|---|---|---|---|---|---|---|---|---|---|---|---|---|---|---|---|
| | | Total | | Less than 1 year | | 2018 | | 2019 | | 2020 | | Thereafter | | | Total | | Less than 1 year | | 2020 | | 2021 | | 2022 | | Thereafter | | ||||||||||||||||
| | | (US$ million) | | | (US$ million) | | ||||||||||||||||||||||||||||||||||||
Debt less accrued interest | | 28,691 | | | 1,061 | | | 3,824 | | 3,449 | | 3,857 | | | 16,500 | | | | 15,228 | | 773 | | 1,053 | | 1,233 | | 1,872 | | 10,297 | | ||||||||||||
Interest payments(1) | | 13,635 | | | 1,583 | | | 1,369 | | 1,211 | | 1,010 | | | 8,462 | | | | 8,950 | | 831 | | 799 | | 732 | | 662 | | 5,926 | | ||||||||||||
Operating lease obligations(2) | | 1,029 | | | 149 | | | 134 | | 131 | | 130 | | | 485 | | | | 2,497 | | 250 | | 201 | | 189 | | 165 | | 1,692 | | ||||||||||||
Purchase obligations(3) | | 4,388 | | | 2,572 | | | 363 | | 186 | | 140 | | | 1,127 | | | | 7,327 | | 2,677 | | 1,445 | | 548 | | 463 | | 2,194 | | ||||||||||||
| | | | | | | | | | | | | | | | | | | | | | | | | | | | ||||||||||||||||
Total | | US$47,743 | | | US$5,365 | | | US$5,690 | | US$4,977 | | US$5,137 | | | US$26,574 | | | | 34,002 | | 4,531 | | 3,498 | | 2,702 | | 3,162 | | 20,109 | | ||||||||||||
| | | | | | | | | | | | | | | | | | | | | | | | | | | | | |||||||||||||||
| | | | | | | | | | | | | | | | | | | | | | | | | | | | ||||||||||||||||
| | | | |
| | 113 | | |
OFF-BALANCE SHEET ARRANGEMENTS
As of December 31, 2016,2018, we did not have any off-balance sheet arrangements as defined in the Form 20-F not disclosed in our consolidated financial statements.20-F.
| | | | |
| | 114 | | |
CRITICAL ACCOUNTING POLICIES AND ESTIMATES
We believe that the following are our critical accounting policies. We consider an accounting policy to be critical if it is important to our financial condition and results of operations and if it requires significant judgments and estimates on the part of our management.
Mineral reservesCONSOLIDATION
In some circumstances, our judgment is required to determine whether, after considering all relevant factors, we have either control, joint control or significant influence over an entity. Significant influence includes situations of collective control. We hold the majority of the voting capital in five joint arrangements (Aliança Geração de Energia S.A., Aliança Norte Energia Participações S.A., Companhia Hispano-Brasileira de Pelotização, Companhia Ítalo-Brasileira de Pelotização and useful lifeCompanhia Nipo-Brasileira de Pelotização), but our management has concluded that we do not have a sufficiently dominant voting interest to have the power to direct the activities of minesthe entity, as the power to make relevant decisions shared with other parties, pursuant to the terms of shareholders' agreements. As a result, these entities are accounted for under the equity method.
MINERAL RESERVES AND MINES USEFUL LIFE
We regularly evaluate and update our estimates of proven and probable mineral reserves. Our proven and probable mineralThese reserves are determined using generally accepted estimation techniques. Calculating our reserves requires us to make assumptions about future conditions that are uncertain, including future ore and metal prices, currency prices, inflation rates, mining technology, availability of permits, production and capital costs. Changes in some or all of these assumptions could have a significant impact on our recorded proven and probable reserves.
The estimated volume of mineral reserves is used as basis for the calculation of depletion of the mineral properties and also for the estimated useful life, which is a major factor to quantify the provision for asset retirement obligation, environmental recovery of mines and impairment of long livedlong-lived assets. Any changes to the estimates of the volume of mine reserves and the useful lives of assets may have a significant impact on the depreciation, depletion and amortization charges and assessments of impairment.
Table of ContentsASSET RETIREMENT OBLIGATIONS
Asset retirement obligation
Expenditures relating to ongoing compliance with environmental regulations are charged against earnings or capitalized as appropriate. These ongoing programs are designed to minimize the environmental impact of our activities.
We recognize a liability for the fair value of our estimated asset retirement obligations in the period in which they are incurred, if a reasonable estimate can be made. We consider the accounting estimates related to reclamation and closure costs to be critical accounting estimates because:
| | | | |
| | 115 | | |
Critical Accounting Policies and Estimates
Our executive officers define the policies and procedures that are used to evaluate our asset retirement obligations. The future costs of retirement of our mines and processing assets at all our sites are reviewed annually, in each case considering the actual stage of exhaustion and the projected exhaustion date of each mine and site. The future estimated retirement costs are discounted using applicable discount rates that reflect current market assessments of the time value of money and of the risks specific to present value using a credit-adjusted risk-free interest rate.the liability.
As of December 31, 2016,2018, we estimated the fair value of our total asset retirement obligations to be US$2.8773.115 billion.
Impairment of non-current assets and onerous contractIMPAIRMENT OF NON-CURRENT ASSETS AND ONEROUS CONTRACTS
Non-financial assets are reviewed for impairment whenever events or changes in circumstances indicate that the carrying amount might not be recoverable. An impairment loss is recognized for the amount by which the asset's carrying value exceeds its recoverable amount. The recoverable amount is the higher of an asset's fair value less costs of disposal ("FVLCS"FVLCD") and value in use ("VIU").
FVLCSFVLCD is generally determined as the present value of the estimated future cash flows expected to arise from the continued use of the asset, including any expansion prospects, and its eventual disposal. VIU model is determined as the present value of the estimated future cash flows expected to arise from the continued use of the asset in its present form. VIU is determined by applying assumptions specific to the company's continued use and cannot take into account future development. These assumptions are different to those used in calculating fair value and consequently the VIU calculation is likely to give a different result to a FVLCSFVLCD calculation.
The future cash flows are based on the current life-of-mine plan or long-term production plan for the cash-generating unit. Assets that have an indefinite useful life and are not subject to amortization, such as goodwill, are tested annually for impairment.
For the purposes of assessing impairment, assets are grouped at the lowest levels for which there are separately identifiable cash flows (Cash Generating Units (CGUs)("CGUs")). Goodwill is allocated to Cash Generating UnitsCGUs or Cash Generating UnitsCGU groups that are expected to benefit from the business combinations in which the goodwill arose and are identified in accordance with the operating segment.
Non-current assets (excluding goodwill) in which the company recognized impairment in the past are reviewed whenever events or changes in circumstances indicate that the impairment may no longer be applicable. In such cases, an impairment reversal will be recognized.
For onerous contracts, a provision is recognized for certain long-term contracts when the present value of certain long-term contracts where the unavoidable cost of meeting the company's obligations exceedto meet our obligation exceeds the economic benefits tothat could be receive under it.received from those contracts.
| | | | |
| | 116 | | |
Fair valuesTable of derivativesContents
Critical Accounting Policies and other financial instrumentsEstimates
FAIR VALUES OF DERIVATIVES AND OTHER FINANCIAL INSTRUMENTS
Derivatives transactions that are not qualified for hedge accounting are classified and presented as an economic hedge, as we use derivative instruments to manage our financial risks as a way of hedging against these risks. Derivative financial instruments are recognized as assets or liabilities in the balance sheet and are measured at their fair values. Changes in the fair values of derivatives are recorded in the statement of comprehensive income statement or in stockholders' equity when the transaction is eligible for effective hedge accounting.
We use well-known market participants' valuation methodologies to compute the fair value of instruments. To evaluate the financial instruments, we use estimates and judgments related to present values, taking into account market curves, projected interest rates, exchange rates, counterparty (credit) risk adjustments, forward market prices and their respective volatilities, when applicable. We evaluate the impact of credit risk on financial instruments and derivative transactions, and we enter into transactions with financial institutions that we consider to have a high credit quality. The financial institution's credit risk tracking is performed making use of a credit risk valuation methodology that considers, among other information, published ratings provided by international rating agencies and other management judgments.
Deferred income taxesDEFERRED INCOME TAXES
We recognize deferred tax effects of tax loss carryforwards and temporary differences in our consolidated financial statements. We recorddo not recognize a valuation allowancetax asset when we believe that it is probable that tax assetsit will not be fully recoverable in the future.
Deferred tax assets arising from tax losses, negative social contribution basis and temporary differences are registered taking into consideration the analysis of future performance, based on economic and financial projections, prepared based on internal assumptions and macroeconomic, trade and tax scenarios that may be subject to changes in future.
When we prepare our consolidated financial statements, the provision for income tax is calculated individually for each entity inof the groupCompany based on Brazilian tax rates, on an accrual basis, by applying the differential between the nominal local tax rates (based on rules in force in the location of the entity) and the Brazilian rate.
Determining our provision for income taxes and our deferred tax assets and liabilities and any valuation allowance to be recorded against our net deferred tax assets requires significant management judgment, estimates and assumptions about matters that are highly uncertain. For each income tax asset, we evaluate the likelihood of whether some portion or the entire asset will not be realized. The valuation allowance madeDeferred tax assets recognized in relation to accumulated tax loss carryforwards depends on our assessment of the probability of generation of future taxable profits within the legal entity in which the related deferred tax asset is recorded, based on our production and sales plans, commodity prices, operating costs, environmental costs, group restructuring plans for subsidiaries and site reclamation costs and planned capital costs.
Table of ContentsLITIGATION
Litigation
We disclose material contingent liabilities unless the possibility of any loss arising is considered remote, and we disclose material contingent assets where the inflow of economic benefits is probable. We discuss our material contingencies in Notenote 28 to our consolidated financial statements.
| | | | |
| | 117 | | |
Critical Accounting Policies and Estimates
We record an estimated loss from a loss contingency when information available prior to the issuance of our financial statements indicates that it is probable that an outflow of resources will be required to settle an obligation, and the amount of the loss can be reasonably estimated. In particular, given the nature of Brazilian tax legislation, the assessment of potential tax liabilities requires significant management judgment. By their nature, contingencies will only be resolved when one or more future events occurs or fails to occur, and typically those events will occur a number of years in the future. Assessing such liabilities, particularly in the Brazilian legal environment, inherently involves the exercise of significant management judgment and estimates of the outcome of future events.
The provision for litigation as of December 31, 2016,2018, totaling US$839 million,1.357 billion, consists of provisions of US$534496 million for labor, US$84166 million for civil, US$214692 million for tax and US$73 million for environmental claims. Claims for which the likelihood of loss, in our opinion and based on the advice of our legal counsel, is reasonably possible but not probable, and for which we have not made provisions, amounted to a total of US$13.42713.124 billion as of December 31, 2016,2018, including claims of US$2.4181.475 billion for labor claims, US$1.5021.957 billion for civil claims, US$7.6368.641 billion for tax claims and US$1.8711.051 billion for environmental claims.
Employee post-retirement benefitsEMPLOYEE POST-RETIREMENT BENEFITS
We sponsor defined benefit pension and other post-retirement benefit plans covering some of our employees. The determination of the amount of our obligations for these benefits depends on certain actuarial assumptions. These assumptions are described in Notenote 29 to our consolidated financial statements and include, among others, the discount rate, the expected long-term rate of return on plan assets and increases in salaries.
Provision related to the dam failure of Samarco MineraçãoPROVISION RELATED TO SAMARCO MINERAÇÃO S.A.
The provision requires the use of assumptions that may be mainly affected by: (i) changes in scope of work required under the Framework Agreement as result of further technical analysis, (ii) uncertainty regarding the timing of resumption of Samarco's operations; (iii) updates in the discount rate; and (iv) resolution of existing and potential legal claims. As a result, future expenditures may differ from the amounts currently provided and changes to key assumptions could result in a material impact to the amount of the provision in future reporting periods. For each reporting period, we will reassess the key assumptions used by Samarco in the preparation of the projected cash flows and will adjust the provision, if required.
DEFERRED REVENUE
Defining the gain on sale of mineral interest and the deferred revenue portion of the transaction requires the use of critical accounting estimates as follows: (i) discount rates used to measure the present value of future inflows and outflows; (ii) allocation of costs between nickel or copper and gold based on relative prices; and (iii) expected margin for the independent elements (sale of mineral rights and service for gold extraction) based on our best estimate.
| | | | |
| | 118 | | |
The aimpurpose of our risk management strategy is to promote enterprise-widecompany-wide risk management that supports the achievement of our objectives, financial strength and flexibility and business continuity.
We developed an integrated framework for managing risk, which considers the impact on our business of not only market risk factors (market risk), but also risks arising from third-party obligations (credit risk), risks associated with inadequate or failed internal processes, people, systems or external events (operational risk), risks arising from third-party obligations (credit risk), risks from exposure to legal penalties, fines or reputational losses associated with failure to act in accordance with applicable laws and regulations, internal policies or best practices (compliance risk), and risks associated with our business model, governance and political and regulatory conditions in countries in which we operate (political(strategic risk), among others.
In order to achieve this objective and to further improve our corporate governance practices, our Board of Directors has established a company-wide risk management policy and an Executive Risk Management Committee. The risk management policy requires that we regularly evaluate and monitor the corporate risks on a consolidated basis in order to guarantee that our overall risk level remains in accordance with our strategic guidelines.
See note 2233 to our consolidated financial statements for quantitative information about risks relating to financial instruments, including financial instruments entered into pursuant to our risk management policies.
MarketIn order to achieve this objective and to further improve our corporate governance practices, our Board of Directors created the Governance, Compliance and Risk Committee. SeeManagement—Advisory Committees to the Board of Directors. In 2018, we approved a new Risk Management Policy with the purposes described below.
RISK GOVERNANCE STRUCTURE
Our integrated risk governance practice is based on lines of defense model described below. We reevaluate our risk practices from time to time to ensure the alignment between strategic decisions, performance and the risk approach determined by our Board of Directors.
First line of defense. Consists on the personnel in charge of addressing the specific risk and the process executors of business, project, support and administrative areas. This is the personnel directly responsible for identifying, evaluating, treating, monitoring and managing the risk events in an integrated way. This first line of defense must:
| | | | |
| | 119 | | |
Risk Management
definition and execution of action plans and establish corrective actions for the continuous improvement of risk management.
Second line of defense. Corresponds to risk management, internal controls, policies management, legal compliance and other specialist areas. The second line of defense is in charge of supervising and supporting the work of first line of defense, providing training and instruments for risk management. The second line of defense must identify and monitor new and emerging risks, ensure compliance with laws, regulations, internal norms and promote continuous improvement in risk management.
Our Board of Executive Officers is responsible for defining the responsibilities of Governance, Risk and Compliance (GRC) area, which includes:
Some areas, such as Environment, Health and Safety, Corporate Integrity and Information Security, act as a second line of defense with respect to specific risks, monitoring risks and controls, and ensuring the compliance with regulations, policies and standards. The definition of the areas that will be the second line of defense specialist has been delegated to the Risk Executive Committee.
Based on our risk matrix, the Board of Executive Officers will define the scope and the operating model of GRC area, considering the combination of severity with probability whose occurrence could jeopardize the achievement of organization's objectives.
| | | | |
| | 120 | | |
Risk Management
Third line of defense. The third line of defense is composed of areas that are independent from our management. It includes the Internal Audit and the Ethics and Conduct Office, which perform, within their scopes of work, evaluations, inspections, control tests, risk analysis and investigations of complaints, providing independence assurance, including with respect to the effectiveness of risk management, internal controls and compliance.
MARKET RISK
We are exposed to various market risk factors that can impact our cash flow. An assessment of the potential impact of the consolidated market risk exposure is performed periodically to support the decision making process regarding the risk management strategy, which may incorporate financial instruments, including derivatives. The financial instrument portfolio is monitored on a monthly basis, enabling us to properly evaluate financial results and their impact on cash flow, and ensure correlation between the strategies implemented and the proposed objectives.
Considering the nature of our business and operations, the main market risk factors that we are exposed to are:
Our floating rate debt consists mainly of loans including export pre-payments, commercial bank loans and multilateral organization loans. In general, the U.S. dollar floating rate debt is subject to changes to LIBOR (London Interbank Offer Rate) in U.S. dollars. We take advantage of the potential correlation between commodity prices and U.S. dollar floating interest rates as a partial natural hedge for this risk.
Table of ContentsOPERATIONAL AND CYBER RISK
CreditOperational risk
We are exposed to credit risk arising from trade receivables, derivative transactions, guarantees, down payment for suppliers and cash investments. Our credit risk management process provides a framework for assessing and managing counterparties' credit risk and for maintaining our risk at an acceptable level.
Commercial credit risk management
We assign an internal credit rating and a credit limit to each counterparty using our own quantitative methodology for credit risk analysis, which is based on market prices, external credit ratings and financial information of the counterparty, as well as qualitative information regarding the counterparty's strategic position and history of commercial relations.
Based on the counterparty's credit risk, risk mitigation strategies may be used to manage our credit risk. The main credit risk mitigation strategies include non-recourse discount of receivables, insurance instruments, letters of credit, corporate and bank guarantees, mortgages, among others.
From a geographic standpoint, we have a diversified accounts receivable portfolio, with Asia, Europe and Brazil, the regions with the most significant exposure. According to each region, different guarantees can be used to enhance the credit quality of the receivables. We monitor the counterparty exposure in the portfolio periodically and we block additional sales to customers in delinquency.
Treasury credit risk management
To manage the credit exposure arising from cash investments and derivative instruments, credit limits are approved to each counterparty to which we have credit exposure. We control the portfolio diversification and monitor different indicators of solvency and liquidity of our different counterparties that were approved for trading.
Operational risk
Operational risk management is the structured approach we take to manage uncertainty related to internal and external events. Internal events consist of inadequate or failed internal processes, people and systems, while external events include natural or third party-causedand operational catastrophes regulatory, political, economic or social actions takencaused by governments or other key stakeholders.third parties.
We mitigate operational risk with new controls and improvement of existing ones, new mitigation plans and transfer of risk through insurance. We seek a clear view of the major risks we are exposed to, the cost-benefit on mitigation plans and the controls in place to closely monitor the impact of operational risks and to efficiently allocate capital to reduce it.
| | | | |
| | 121 | | |
Risk Management
Cyber risk
Cybernetic risk is the approach taken to manage information security risks such as theft and leakage of information, technology assets unavailability and compromising data integrity.
CREDIT RISK
We are exposed to credit risk arising from trade receivables, derivative transactions, guarantees, down payment for suppliers and cash investments. Our credit risk management process provides a framework for assessing and managing counterparties' credit risk and for maintaining our risk at an acceptable level.
Commercial credit risk management
We assign an internal credit rating and a credit limit to each counterparty using our own quantitative methodology for credit risk analysis, which is based on market prices, external credit ratings and financial information of the counterparty, as well as qualitative information regarding the counterparty's strategic position and history of commercial relations.
Based on the counterparty's credit risk, risk mitigation strategies may be used to manage our credit risk. The main credit risk mitigation strategies include non-recourse discount of receivables, insurance instruments, letters of credit, corporate and bank guarantees, mortgages, among others.
From a geographic standpoint, we have a diversified accounts receivable portfolio, with Asia, Europe and Brazil, the regions with the most significant exposure. According to each region, different guarantees can be used to enhance the credit quality of the receivables. We monitor the counterparty exposure in the portfolio periodically and we block additional commercial credit to customers in delinquency.
Treasury credit risk management
To manage the credit exposure arising from cash investments and derivative instruments, credit limits are approved to each counterparty to which we have credit exposure. We control the portfolio diversification and monitor different indicators of solvency and liquidity of our different counterparties that were approved for trading.
COMPLIANCE RISK
Under our bylaws, we are prohibited from making, directly or indirectly through third parties, any contribution to political movements in Brazil or abroad, including those organized as political parties, and to their representatives or candidates.
STRATEGIC RISK
Strategic risk comprises governance, business model, external environment issues, regulatory, political, economic or social actions taken by governments or other stakeholders.
| | | | |
| | 122 | | |
III.IV. SHARE OWNERSHIP AND TRADING
Our corporate capital is currently composed of 3,217,188,4025,284,474,770 common shares and 2,027,127,718 preferred shares, including 12 golden shares issued to the Brazilian government. Holders of our preferred shares and the golden shares are generally entitled to the same voting rights as holders of common shares, except with respect to the election of members of the Board of Directors, and are entitled to certain preferential dividends as described below. The 12 golden shares owned by the Brazilian government have veto powers over certain actions, such as changes to our name, the location of our headquarters and our corporate purpose as it relates to mining activities. In July 2018, the Board of Directors approved a US$1 billion share buy-back program, which was concluded in November 2018.
Valepar is Vale's controlling shareholder. Valepar is a special-purpose company organized under the laws of Brazil that was incorporated for the sole purpose of holding an interest in Vale. Valepar does not have any other business activity. Valepar acquired its controlling stake in Vale from the Brazilian government in 1997 as part of the first stage of Vale's privatization.
The following table sets forth information regarding ownership of Vale shares by the shareholders we know beneficially own more than 5% of any class of our outstanding capital stock, and by our directors and executive officers as a group, as of December 31, 2016.2018.
| | | Common shares owned | | % of class | | Preferred shares owned | | % of class |
|---|---|---|---|---|---|---|---|---|
Valepar(1) | | 1,716,435,045 | | 53.9% | | 20,340,000 | | 1.0% |
BNDESPAR(2) | | 206,378,882 | | 6.5% | | 66,185,272 | | 3.4% |
Capital Group International, Inc.(3) | | n/a | | n/a | | 202,763,494 | | 10.0% |
Capital Research Global Investors(3) | | n/a | | n/a | | 220,419,398 | | 10.9% |
Directors and executive officers as a group | | 9,300 | | Less than 1.0% | | 1,645,064 | | Less than 1.0% |
| | | Common shares owned | | % of class |
|---|---|---|---|---|
Litel Participações S.A.(1). | | 1,075,773,534 | | 20.4% |
Capital Research and Management Company(2) | | 485,848,934 | | 9.2% |
BNDESPAR(3) | | 342,484,176 | | 6.5% |
Bradespar S.A.(4) | | 296,009,366 | | 5.6% |
Mitsui | | 286,347,055 | | 5.4% |
BlackRock, Inc.(5) | | 272,763,231 | | 5.2% |
Directors and executive officers as a group | | 960,191 | | Less than 1% |
The table below sets forth information regarding
| | | Common shares owned | | % of class | | |
|---|---|---|---|---|---|---|
Valepar shareholders | | | | |||
Litel Participações S.A.(1) | | 637,443,857 | | 49.00 | | |
Eletron S.A. | | 380,708 | | 0.03 | | |
Bradespar S.A.(2) | | 275,965,821 | | 21.21 | | |
Mitsui | | 237,328,059 | | 18.24 | | |
BNDESPAR | | 149,787,385 | | 11.51 | | |
| | | | | | | |
Total | | 1,300,905,830 | | 100.00% | | |
| | | | | | | |
| | | | | | | |
| | | | | | | |
The table below sets forth information regarding ownership of Litel Participações S.A., one of Valepar's shareholders, as of December 31, 2016.2018.
| | | Common shares owned | | % of class | | | Common shares owned | | % of class | | ||||
|---|---|---|---|---|---|---|---|---|---|---|---|---|---|---|
Litel Participações S.A. shareholders(1) | | | | | | |||||||||
Litel Participações S.A.shareholders(1) | | | | |||||||||||
BB Carteira Ativa | | 222,125,498 | | | 80.62 | | | | 222,125,666 | | 80.62% | | ||
Carteira Ativa II | | 31,688,469 | | | 11.50 | | | |||||||
Carteira Ativa III | | 19,115,635 | | | 6.94 | | | |||||||
Carteira Ativa II FIA | | 31,688,469 | | 11.50% | | |||||||||
PETROS | | 19,115,854 | | 6.94% | | |||||||||
Singular FIA | | 2,583,921 | | | 0.94 | | | | 2,583,921 | | 0.94% | | ||
Caixa de Previdência dos Funcionários do Banco do Brasil | | 168 | | | 0.00 | | | |||||||
Others | | 658 | | | 0.00 | | | | 439 | | 0.00% | | ||
| | | | | | | | | | | | ||||
Total | | 275,514,349 | | | 100.00 | % | | | 275,514,349 | | 100.00% | | ||
| | | | | | | | | | | | | |||
| | | | | | | | | | | | ||||
| | | | |
| | 123 | | |
Each of the existing Valepar shareholders' agreement and the February 2017 shareholders' agreement:
Pursuant to each of the existing Valepar shareholders' agreement and the February 2017 shareholders' agreement, Valepar cannot support any of the actions described below with respect to Vale without the consent of at least 75% of the holders of Valepar's common shares:
The February 2017 shareholders' agreement adds additional actions to this list, including:
Pursuant to the February 2017 shareholders' agreement, the disposal of shares of Vale owned by Valepar is subject to approval of 95% of the common shares subject to the agreement.
Changes in our shareholding structure and share ownership by controlling shareholdersCHANGES IN OUR SHAREHOLDING STRUCTURE
IfIn 2017, we successfully implement the changes in our shareholder structure described below, Litel, Bradespar, Mitsui and BNDESPAR, which are currently shareholderscompleted a series of Valepar, will become shareholders of Vale and will enter into a new shareholder's agreement (the "proposed Vale shareholders' agreement").
Pursuant to the February 2017 shareholders' agreement, Valepar is expected to make a proposalmeasures to simplify our shareholding structure and enhance our corporate governance, with the purpose of eventually enabling Vale to be listed on BM&FBOVESPA'sNovo Mercado special segment and making Vale a company without defined control.
The initial proposal comprises, beyond the performance of all acts and procedures imposed by the applicable legal provisions and rules, the following indivisible and interdependent steps to simplify our shareholding structure, whichgovernance. These measures are subject to approval by our executive officers, Board of Directors and shareholders:summarized below:
Pursuant to item (iii) above, Valepar's Consequently, the former shareholders will receive 1.2065 of our common shares for each Valepar share held by them. As a result, we will issue 173,543,667 new common shares, all registered and without par value, in favor of Valepar's shareholders. Consequently, Valepar's shareholders will own 36.73%36.72% of our outstanding common stock after the merger of Valepar.
The R$3,073 million goodwill balance carried See—Shareholders' Agreement for more information on Valepar's financial statements and its future use by Vale will not be subject to capitalization in favor of Valepar's shareholders, but will be for the benefit of all of our shareholders. Valepar will hold atnew agreement among the time of the merger enough cash and cash equivalents to fully settle its liabilities.
We cannot predict how long it will take to implement each of these steps or whether they will be successfully implemented. The implementation of the proposal is subject to the approval of the proposal, including the merger of Valepar into us, by the executive officers, board of directors andformer shareholders of Valepar.
After the simplification of our corporate ownership structure pursuant to the proposal, we will seek to list our common shares on theNovo Mercado segment of the BM&FBOVESPA. However, such listings are dependent on a numberB3, the special listing segment for companies committed to the highest standards of factors, over which we have no control, including approvals by our shareholders and the applicable regulators, and the conversion of all of our preferred shares into common shares.corporate governance;
SHAREHOLDERS' AGREEMENT
Proposed Vale shareholders' agreement
The proposal will also contemplate the execution of a shareholders' agreement at Vale level on the date of effectiveness of the merger of Valepar into us, if the merger is approved, byOn August 14, 2017, Litel, Bradespar, Mitsui and BNDESPAR executed the Shareholders' Agreement, by means of which they undertook to give us greater stability and to adapt our corporate governance structure during the period of transition to a new corporate structure without defined control. For six months from the date of entry into force of the Vale shareholder's agreement, the controlling shareholders will be undervote jointly on certain restrictive obligations with respect to trading of our shares.issues. The following are key provisions of the proposed Vale shareholders' agreement:Shareholders' Agreement:
| | | | |
| | 124 | | |
Major Shareholders
| | | | |
| | 125 | | |
We have a policy on related party transactions, which sets forth rules and principles to ensure transparency and arm's-length terms in our transactions with related parties and other situations of potential conflicts of interest. The definition of related party is based on applicable accounting standards and on this internal policy, which may be more restrictive than applicable laws and regulations under certain circumstances. Pursuant to that policy and our bylaws, our Governance, Compliance and SustainabilityRisk Committee is responsible for issuing reports about potential conflicts of interest between us and our shareholders or management and for reviewing the procedure and terms of related party transactions that are submitted to our Board of Directors for approval. Under the policy, if we identify a conflict of interest with a shareholder, then that shareholder or its representative may not participate in any discussions related to the transaction at any shareholders' meeting and will only have access to publicly available information about the matter. In addition, if we identify a conflict of interest with a member of the Board of Directors or an executive officer, then such member of the Board or executive officer may not participate in any discussions or have access to any information or document related to the matter. The policy also prohibits the extension of any loans to related parties other than our subsidiaries and affiliated companies. For information regarding investments in associate companies and joint ventures and for information regarding transactions with major related parties, see Notes 15notes 16 and 31 ofto our consolidated financial statements.
We have engaged, and expect to continue to engage, in arm's-length transactions with certain entities controlled by, or affiliated with, our controlling shareholders, including the following:principal shareholders.
BradescoBRADESCO
Bradespar a controlling shareholder of Valepar, is controlled by a group of entities that also control Banco Bradesco S.A. ("Bradesco"). Bradesco and its affiliates are full servicefull-service financial institutions that have performed, and may perform in the future, investment banking, advisory or general financing and banking services for us and our affiliates, from time to time, in the ordinary course of business. An affiliate of Bradesco owns preferred shares representing 36.4% of the total capital of our subsidiary MBR.
Banco do BrasilBANCO DO BRASIL
Previ, a pension fund of the employees of Banco do Brasil S.A. ("Banco do Brasil"), owns 100% of the investment fund BB Carteira Ativa, which holds the majority of the common equity of Litel Participações S.A., which in turn holds 49%20.4% of the common equityshares of Valepar.Vale. Banco do Brasil appoints three out of the six members of Previ's senior management. An affiliate of Banco do Brasil is the manager of BB Carteira Ativa. Banco do Brasil is also a full servicefull-service financial institution, and Banco do Brasil and its affiliates have performed, and may perform in the future, investment banking, advisory or general financing and banking services for us and our affiliates, from time to time, in the ordinary course of business.
MitsuiMITSUI
We have commercial relationships in the ordinary course of our business with Mitsui, a large Japanese conglomerate and a shareholder of Valepar.conglomerate. Mitsui has direct investments in some of our subsidiaries, joint ventures and associated companies. Mitsui has a minority stake in our subsidiary MVM Resources International B.V., which controls the Bayóvar (Peru) phosphate operations. Mitsui is also our joint venture partner at VLI. We haveMitsui has an investment agreement with Mitsuiindirect stake in connection with ourVale Mozambique and Nacala Corridor Holding, which controls the coal businessoperations (mine, rail and port) in Mozambique (seeInformation on the Company—Business overview—Significant changes in our business).
| | | | |
| | 126 | | |
Related Party Transactions
BNDES
BNDES is the Brazilian state-owned development bank and the parent company of one of our major shareholders, BNDESPAR. Below is a description of our main transactions with BNDES:
We and BNDES are parties to a contract relating to authorizations for mining exploration. This contract, which we refer to as the Mineral Risk Contract, provides for the joint development of certain unexplored mineral deposits that form part of our Northern System, except for our iron ore and manganese ore deposits which were specifically excluded from the contract, as well as proportional participation in any profits earned from the development of such resources. In 2007, the Mineral Risk Contract was extended indefinitely, with specific rules for all exploration projects and exploration targets and mineral rights covered under the contract.
BNDES has provided us with credit lines of R$7.3 billion (US$2.2 billion) to finance our investment program, facilities totaling R$985 million (US$302 million) to finance the acquisition of equipment in Brazil, a R$3.9 billion (US$1.2 billion) financing for our CLN 150 Mtpy project and a R$6.2 billion (US$1.9 billion) financing for our S11D project and its infrastructure (CLN S11D). For more information on our transactions with BNDES, seeOperating and financial review and prospects—Liquidity and capital resources.
BNDES holds a total of R$1.289 billion937 million (US$396242 million), in debentures of our subsidiary Salobo Metais S.A., with a right to subscribe for Salobo's preferred shares in exchange for part of the outstanding debentures, which right expires two years after Salobo reaches an accumulated revenue equivalent to 200,000 metric tons of copper.
BNDES holds debentures issued by Vale exchangeable into common shares of VLI.
BNDESPAR is in the control group of several Brazilian companies with which we have commercial relationships in the ordinary course of our business.
| | | | |
| | 127 | | |
Our shareholders approved our new dividend policy atImmediately following the shareholders' meeting held on April 25, 2016. Distributions may be classified as "dividends" or "interest on shareholders' equity," for Brazilian tax purposes, and references to "dividends" should be understood to cover all distributions, regardlessfailure of their classification, unless otherwise stated. Pursuant to the new dividend policy,Dam I, our Board of Executive Officers proposes dividend payments toDirectors determined the Boardsuspension of Directors, which approves the amount of dividend distributions based on the context of the company's business, taking into consideration, among other factors, our debt level and expected future commitments of cash.
Pursuant to our new dividend policy, and therefore no payment of dividends or interest on shareholders' equity will be paid in two installments. The first installment must be proposed by the Executive Officersmade pursuant to Vale's Distribution Policy, and if approved by the Board of Directors, paid in October of each year. The second installment must be proposed during the first three months of the subsequent fiscal year and, if approved by the annual shareholders' meeting, paid in April. The amount of the first installment must be determined based on the accumulated results for the year and expected free cash flow for the remainder of the year. The second installmentno decision with respect to share buyback will be included in the results from the allocation of net income proposed for the preceding fiscal year. The distribution amount of the first installment is expressed in U.S. dollars and payment is made inreais upon the conversion of the proposed amount in U.S. dollars toreais based on the PTAX-Option 5 exchange rate published by the Brazilian Central Bank on the business day prior to the meetinguntil further determination of our Board of Directors on which payment is approved. The distribution amount of the second installment is expressed and paid inreais. Our board of executive officers may propose additional dividend payments to our Board of Directors, based on analysis of our cash flows and the availability of profits or reserves of profits.Directors.
We typically pay the same amount per share on both common and preferred shares. Under Brazilian law and our bylaws, we are required to distribute to our shareholders an annual amount equal to not less than 25% of the distributable amount, referred to as the mandatory dividend, unless the Board of Directors advises our shareholders at our shareholders' meeting that payment of the mandatory dividend for the preceding year is inadvisable in light of our financial condition. For a discussion of dividend distribution provisions under Brazilian corporate law and our bylaws, seeAdditional information. In September 2018, we paid dividends to our shareholders in the amount of US$1.876 billion, which exceeds the minimum dividends required by law for the year of 2018.
The tax regime applicable to distributions to ADR and to non-resident shareholders will depend on whether those distributions are classified as dividends or as interest on shareholders' equity. SeeAdditional information—Taxation—Taxation—Brazilian tax considerations.
By law, we are required to hold an annual shareholders' meeting by April 30 of each year at which an annual dividend may be declared. Additionally, our Board of Directors may declare interim dividends. Under Brazilian corporate law, dividends are generally required to be paid to the holder of record on a dividend declaration date within 60 days following the date the dividend was declared, unless a shareholders' resolution sets forth another date of payment, which, in either case, must occur prior to the end of the fiscal year in which the dividend was declared. A shareholder has a three-year period from the dividend payment date to claim dividends (or payments of interest on shareholders' equity) in respect of its shares, after which we will have no liability for such payments.
We make cash distributions on the common shares and preferred shares underlying the ADSs inreais to the custodian on behalf of the depositary. The custodian then converts such proceeds into U.S. dollars and transfers such U.S. dollars to be delivered to the depositary for distribution to holders of ADRs net of the depositary's fees. For information on taxation of dividend distributions, seeAdditional information—Taxation—Taxation—Brazilian tax considerations.
The following table sets forth the cash distributions we paid to holders of common shares and preferred shares for the periods indicated. Amounts have been restated to give effect to stock splits that we carried out in subsequent periods. Amounts are stated before any applicable withholding tax.
| | | | | Reais per share | | | | | | | | Reais per share | | U.S. dollars per share(1) | | | ||||||||
|---|---|---|---|---|---|---|---|---|---|---|---|---|---|---|---|---|---|---|---|---|---|---|---|---|
| Year | | Payment date | | Dividends | | Interest on equity | | Total | | U.S. dollars per share(1) | | U.S. dollars total (US$ million)(1) | | Payment date | | Dividends | | Interest on equity | | Total | | Total | | U.S. dollars total(1) (US$ million) |
2012 | | April 30 | | – | | 1.08 | | 1.08 | | 0.59 | | 3,000 | ||||||||||||
| | October 31 | | 0.66 | | 0.53 | | 1.19 | | 0.58 | | 3,000 | |||||||||||||
2013 | | April 30 | | 0.15 | | 0.71 | | 0.86 | | 0.44 | | 2,250 | ||||||||||||
| | October 31 | | 0.12 | | 0.82 | | 0.94 | | 0.44 | | 2,250 | |||||||||||||
2014 | | April 30 | | – | | 0.90 | | 0.90 | | 0.41 | | 2,100 | | April 30 | | – | | 0.90 | | 0.90 | | 0.41 | | 2,100 |
| | October 31 | | 0.34 | | 0.65 | | 0.99 | | 0.41 | | 2,100 | | October 31 | | 0.34 | | 0.65 | | 0.99 | | 0.41 | | 2,100 | |
2015 | | April 30 | | – | | 0.60 | | 0.60 | | 0.19 | | 1,000 | | April 30 | | – | | 0.60 | | 0.60 | | 0.19 | | 1,000 |
| | October 31 | | 0.37 | | – | | 0.37 | | 0.10 | | 500 | | October 31 | | 0.37 | | – | | 0.37 | | 0.10 | | 500 | |
2016 | | December 16 | | – | | 0.17 | | 0.17 | | 0.05 | | 250 | | December 16 | | – | | 0.17 | | 0.17 | | 0.05 | | 250 |
2017 | | April 28 | | – | | 0.91 | | 0.91 | | 0.28(2) | | 1,470(2) | ||||||||||||
2018 | | March 15 | | – | | 0.91 | | 0.91 | | 0.28(2) | | 1,451(2) | ||||||||||||
| | September 20 | | 0.17 | | 1.31 | | 1.48 | | 0.36(2) | | 1.861(2) | |||||||||||||
| | | | |
| | 128 | | |
Our publicly traded share capital consists of common shares, and preferred shares, each without par value. Our common shares and our preferred shares are publicly traded in Brazil on the BM&FBOVESPA,B3, under the ticker symbols VALE3 and VALE5, respectively.symbol VALE3. Our common shares and preferred shares also trade on the LATIBEX, under the ticker symbols XVALO and XVALP, respectively.XVALO. The LATIBEX is a non-regulated electronic market created in 1999 by the Madrid stock exchange in order to enable trading of Latin American equity securities.
Our common ADSs, each representing one common share, and our preferred ADSs, each representing one preferred share, are traded on the New York Stock Exchange ("NYSE"),NYSE, under the ticker symbols VALE and VALE.P, respectively.symbol VALE. Our common ADSs and preferred ADSs are traded on Euronext Paris under the ticker symbols VALE3 and VALE5, respectively.symbol VALE3. Citibank N.A. serves as the depositary for both the common and the preferred ADSs. On March 1, 2017,December 31, 2018, there were 1,365,783,2601,211,272,764 common ADSs outstanding, 773,593,512 common ADSs and 592,189,748 preferred ADSs, representing 56.6% of our outstanding common shares and 43.4% of our outstanding preferred shares, or 26.5%22.92% of our total share capital.
| | | | |
| | 129 | | |
The following table sets forth trading information for our ADSs, as reported by the New York Stock Exchange and our shares, as reported by the BM&FBOVESPA, for the periods indicated. Share prices in the table have been adjusted to reflect stock splits.
| | | BM&F BOVESPA (Reais per share) | | NYSE (US$ per share) | ||||||||||||
|---|---|---|---|---|---|---|---|---|---|---|---|---|---|---|---|---|
| | | Common share | | Preferred share | | Common ADS | | Preferred ADS | ||||||||
| | | High | | Low | | High | | Low | | High | | Low | | High | | Low |
2012 | | 45.87 | | 32.45 | | 53.41 | | 32.12 | | 37.08 | | 15.88 | | 32.50 | | 15.67 |
2013 | | 44.10 | | 28.39 | | 42.60 | | 26.00 | | 21.49 | | 12.63 | | 20.88 | | 11.47 |
2014 | | | | | | | | | ||||||||
1Q | | 35.71 | | 29.26 | | 32.73 | | 25.90 | | 15.25 | | 12.42 | | 14.01 | | 10.93 |
2Q | | 33.34 | | 28.40 | | 30.12 | | 25.47 | | 15.07 | | 12.62 | | 13.61 | | 11.19 |
3Q | | 32.92 | | 26.54 | | 29.36 | | 23.30 | | 14.83 | | 10.87 | | 13.23 | | 9.49 |
4Q | | 28.31 | | 18.69 | | 24.80 | | 16.00 | | 11.80 | | 6.86 | | 10.31 | | 5.89 |
2015 | | | | | | | | | ||||||||
1Q | | 22.84 | | 17.94 | | 20.10 | | 15.45 | | 8.69 | | 5.65 | | 7.63 | | 4.85 |
2Q | | 27.06 | | 17.54 | | 20.30 | | 14.95 | | 8.80 | | 5.58 | | 6.66 | | 4.77 |
3Q | | 19.94 | | 15.35 | | 16.00 | | 12.27 | | 5.90 | | 4.03 | | 5.00 | | 3.21 |
4Q | | 20.79 | | 11.65 | | 16.26 | | 9.32 | | 5.48 | | 3.07 | | 4.31 | | 2.43 |
2016 | | | | | | | | | ||||||||
1Q | | 17.58 | | 8.60 | | 12.78 | | 6.57 | | 4.65 | | 2.15 | | 3.42 | | 1.60 |
2Q | | 21.76 | | 14.02 | | 16.68 | | 11.24 | | 6.07 | | 3.91 | | 4.66 | | 3.02 |
3Q | | 19.12 | | 16.02 | | 16.17 | | 12.78 | | 6.07 | | 4.82 | | 5.05 | | 3.79 |
4Q | | 31.03 | | 17.65 | | 27.84 | | 15.55 | | 9.16 | | 5.45 | | 8.20 | | 4.78 |
Last six months | | | | | | | | | ||||||||
October 2016 | | 22.14 | | 17.65 | | 20.80 | | 15.55 | | 6.95 | | 5.45 | | 6.58 | | 4.78 |
November 2016 | | 31.01 | | 21.61 | | 27.50 | | 20.45 | | 9.10 | | 6.67 | | 8.00 | | 6.30 |
December 2016 | | 31.03 | | 25.19 | | 27.84 | | 21.78 | | 9.16 | | 7.62 | | 8.20 | | 6.64 |
January 2017 | | 34.13 | | 25.06 | | 32.38 | | 22.85 | | 10.78 | | 7.62 | | 10.26 | | 6.89 |
February 2017 | | 36.43 | | 29.92 | | 34.24 | | 28.60 | | 11.52 | | 9.56 | | 10.87 | | 9.10 |
March 2017 | | 33.32 | | 29.00 | | 31.87 | | 27.29 | | 10.69 | | 9.30 | | 10.26 | | 8.77 |
Citibank N.A. serves as the depositary for our ADSs. ADR holders are required to pay various fees to the depositary, and the depositary may refuse to provide any service for which a fee is assessed until the applicable fee has been paid.
ADR holders are required to pay the depositary amounts in respect of expenses incurred by the depositary or its agents on behalf of ADR holders, including expenses arising from compliance with applicable law, taxes or other governmental charges, facsimile transmission or conversion of foreign currency into U.S. In this case, the depositary may decide in its sole discretion to seek payment by either billing holders or by deducting the fee from one or more cash dividends or other cash distributions. The depositary may recover any unpaid taxes or other governmental charges owed by an ADR holder by billing such holder, by deducting the fee from one or more cash dividends or other cash distributions, or by selling underlying shares after reasonable attempts to notify the holder, with the holder liable for any remaining deficiency.
ADR holders are also required to pay additional fees for certain services provided by the depositary, as set forth in the table below.
| Depositary service | | Fee payable by ADR holders |
|---|---|---|
Issuance of ADSs upon deposit of shares, excluding issuances as a result of distributions described in the following item | | Up to US$5.00 or less per 100 ADSs (or fraction thereof) issued |
Distribution of securities other than ADSs or rights to purchase additional ADSs (i.e., spin-off shares) | | Up to US$5.00 or less per 100 ADSs (or fraction thereof) held |
Distribution of cash dividends or other cash distributions (i.e., sale of rights and other entitlements) | | Up to US$5.00 or less per 100 ADSs (or fraction thereof) held |
Distribution of ADSs pursuant to (i) stock dividends or other free stock distributions, or (ii) exercise of rights to purchase additional ADSs | | Up to US$5.00 or less per 100 ADSs (or portion thereof) held |
Delivery of deposited property against surrender of ADSs | | Up to US$5.00 or less per 100 ADSs (or portion thereof) surrendered |
ADS services | | Up to US$5.00 per 100 ADSs (or fraction thereof) held on the applicable record date(s) established by the depositary |
The depositary may deduct applicable depositary fees and charges from the funds being distributed in the case of cash distributions. For distributions other than cash, the depositary will invoice the amount of the applicable depositary fees to the applicable holders.
In June 2016, we terminated our HDR program, and in July 2016 we concluded the delisting of HDRs from the Hong Kong Stock Exchange.
Additional ChargesADDITIONAL CHARGES
The holders, beneficial owners, persons depositing shares and persons surrendering ADSs for cancellation and for the purpose of withdrawing deposited securities are also subject to the following charges: (i) taxes (including applicable interest and penalties) and other governmental charges; (ii) registration fees as may be applicable from time to time; (iii) reimbursement of certain expenses as provided in the deposit agreement; (iv) the expenses and charges incurred by the depositary in the conversion of foreign currency; (v) certain fees and expenses incurred by the depositary in connection with compliance with exchange control regulations and other regulatory requirements; and (v)(vi) certain fees and expenses incurred in connection with the delivery or servicing of deposited shares, as provided for under the deposit agreement.
| | | | |
| | 130 | | |
Depositary Shares
The depositary reimburses us for certain expenses we incur in connection with the ADR programs and other expenses, subject to a ceiling agreed between us and the depositary from time to time. These reimbursable expenses currently include legal and accounting fees, listing fees, investor relations expenses and fees payable to service providers for the distribution of material to ADR holders. The depositary also agreed to make an additional reimbursement annually based on the issuance and cancellation fees, dividend fees and depositary service fees charged by the depositary to our ADS holders. In this context, forFor the year ended December 31, 2016,2018, Citibank N.A. reimbursed us US$3.2024.673 million.
| | | | |
| | 131 | | |
PURCHASES OF EQUITY SECURITIES BY THE ISSUER AND AFFILIATED PURCHASERS
Vale did not engage in anyOn December 11, 2018, we announced the completion of the US$1 billion share repurchase program during 2016.approved by the Board of Directors on July 25, 2018. We acquired 71,173,683 common shares at an average price of US$14.05 per share (including common shares represented by ADSs), for a total aggregate purchase price of US$1.0 billion. The repurchased shares represent 1.37% of the free float of common shares outstanding before the launching of the program. See note 30 to our consolidated financial statements for further information.
The results of our share repurchase program for 2018 are set forth below.
| | | Total number of common shares purchased(1) | | Average price paid per common share | | Total number of common shares purchased as part of publicly announced programs | | Maximum number of shares that may yet be purchased under the program |
|---|---|---|---|---|---|---|---|---|
| | | | | (US$) | | | | |
August 2018 | | 32,353,894 | | 13.35 | | 32,353,894 | | – |
September 2018 | | 6,802,524 | | 13.80 | | 6,802,524 | | – |
October 2018 | | 13,136,543 | | 14.78 | | 13,136,543 | | – |
November 2018 | | 18,880,722 | | 14.83 | | 18,880,722 | | – |
| | | | | | | | | |
Total | | 71,173,683 | | 14.05 | | 71,173,683 | | – |
| | | | |
| | 132 | | |
Management
IV.V. MANAGEMENT AND EMPLOYEES
Board of DirectorsBOARD OF DIRECTORS
Our Board of Directors sets general guidelines and policies for our business and monitors the implementation of those guidelines and policies by our executive officers. Our bylaws provide for a Board of Directors consisting of 1112 members and 1112 alternates, each of whom serves on behalf of a particular director. All members (and their respective alternates) are elected for the same two-year term at a general shareholders' meeting, can be re-elected, and are subject to removal at any time. Our bylaws provide that the chief executive officer cannot serve as chairman of the Board of Directors. In the shareholders' meeting scheduled for April 30, 2019, our shareholders will vote a proposal to increase the number of members of our Board of Directors to 13 members.
The Board of Directors holds regularly scheduled meetings on a monthly basis and holds additional meetings when called by the chairman, vice-chairman or any two directors. Decisions of the Board of Directors require a quorum of a majority of the directors and are taken by majority vote. Alternate directors may attend and vote at meetings in the absence of the director for whom the alternate director is acting.
TenAll members (and their respective alternates) are elected for the same two-year term at a general shareholders' meeting, can be re-elected, and are subject to removal at any time. The terms of all of our 11directors and alternate directors will expire at the Ordinary General Shareholder's meeting of 2019.
Eight of our eleven current directors (and tenseven of our 11eight alternate directors) were appointed by Valepar. This includes an additional director appointed by Valepar, because no individual or group of common and preferred shareholders met the thresholds described under our bylaws and Brazilian corporate law.parties to the Shareholders' Agreement. One director and his respective alternate are appointed by our employees, pursuant to our bylaws. Non-controlling shareholders holding common shares representing at least 15% of our voting capital and preferred shares representing at least 10% of our total share capital, have the right to appoint onemay elect a member and an alternate to our Board of Directors. Our employeesSeeMemorandum and Articles of Association—Voting Rights.
New listing rules applicable to independence requirements for the Novo Mercado came into force in January 2018. Pursuant to the Novo Mercado listing rules and our non-controlling shareholders each have the right, as a class, to appoint one director and an alternate. The terms of allbylaws, at least two directors or 20% of our directors, whichever number is higher, must be independent. We currently have two independent members. If the proposal to increase the number of board members to 13 is approved, we expect to have at least one additional independent member in our Board of Directors. To be considered independent under our bylaws and alternate directors will expirethe Novo Mercado listing rules in effect in 2018, a director may not (i) have current professional ties to Vale other than as a member of the Board of Directors or be a significant shareholder of Vale; (ii) have been an employee or executive of Vale or of any party to the Shareholders' Agreement for at least the Ordinary General Shareholder's meetingpast three years; (iii) sell goods or services to or purchase goods or services from Vale; (iv) be affiliated with any party to the Shareholders' Agreement; (v) be a relative, to the second degree, of 2017.any director or executive of Vale; (vi) have been a member of Vale's audit committee in the past three years; and (vii) be an affiliate of any non-profit organization receiving significant financial resources from Vale.
| | | | |
| | 133 | | |
Management
The following table lists the current members of the Board of Directors and each director's alternate.
| Director | | Year first elected | | Alternate director(1) | | Year first elected | | Year first elected | | Alternate director | | Year first elected |
|---|---|---|---|---|---|---|---|---|---|---|---|---|
Gueitiro Matsuo Genso (chairman) | | 2015 | | Gilberto Antonio Vieira | | 2015 | | 2015 | | Gilberto Antonio Vieira | | 2015 |
Fernando Jorge Buso Gomes (vice-chairman) | | 2015 | | Moacir Nachbar Junior | | 2015 | | 2015 | | Vacant | | – |
Oscar Augusto de Camargo Filho | | 2003 | | Eduardo de Oliveira Rodrigues Filho | | 2011 | | 2003 | | Eduardo de Oliveira Rodrigues Filho | | 2011 |
Dan Antônio Marinho Conrado | | 2012 | | Arthur Prado Silva(8) | | 2015 | | 2012 | | Arthur Prado Silva | | 2015 |
Marcel Juviniano Barros | | 2012 | | Francisco Ferreira Alexandre | | 2013 | | 2012 | | Gilmar Dalilo Cezar Wanderley | | 2017 |
Alberto Ribeiro Guth(2) | | 2015 | | Marcelo Gasparino da Silva(9) | | 2016 | ||||||
Lucio Azevedo(3) | | 2015 | | Carlos Roberto de Assis Ferreira(3) | | 2015 | ||||||
Eduardo Refinetti Guardia(4) | | 2016 | | Robson Rocha | | 2011 | ||||||
Eduardo de Salles Bartolomeo(5) | | 2016 | | Marcelo Marcolino(10) | | 2016 | ||||||
Motomu Takahashi(6) | | 2016 | | Yoshitomo Nishimitsu | | 2015 | ||||||
Denise Pauli Pavarina(7) | | 2017 | | Luiz Mauricio Leuzinger | | 2012 | ||||||
Lucio Azevedo(1) | | 2015 | | Raimundo Nonato Alves Amorim(1) | | 2017 | ||||||
Eduardo Refinetti Guardia | | 2016 | | Robson Rocha | | 2011 | ||||||
Toshiya Asahi | | 2017 | | Yoshitomo Nishimitsu | | 2015 | ||||||
Vacant | | – | | Luiz Mauricio Leuzinger | | 2012 | ||||||
Sandra Maria Guerra de Azevedo(2)(3) | | 2017 | | Vacant | | – | ||||||
Isabella Saboya de Albuquerque(3) | | 2017 | | Vacant | | – | ||||||
Ney Roberto Ottoni de Brito | | 2018 | | Vacant | | – | ||||||
Below is a summary of the business experience, activities and areas of expertise of our current directors.
Gueitiro Matsuo Genso, 45:47: Chairman of Vale's Board of Directors since February 2016 (Member of Vale's Board of Directors since March 2015).
Other current director or officer positions:; Member of the StrategicPersonnel Committee since November 2017.
Professional experience: Coordinator of Vale since 2015; Chief Executive Officer of Valepar since 2015; andVale's Finance Committee from May 2018 to December 2018; Chief Executive Officer of PREVI—Caixa de Previdência dos Funcionários do Banco do Brasil S.A. since 2015.
Professional experience:from 2015 to 2018; Member of Vale's Executive Development Committee from April 2017 to October 2017 and of Vale's Strategic Committee from 2015 to 2017; Chief Executive Officer of Valepar from 2015 to August 2017; Executive Officer of Private Customers of Banco do Brasil S.A. from 2014 to 2015; Member of the Board of Directors of the Brazilian Interbank Payment Chamber from 2014 to 2015; Member of the Fiscal Council of Grupo Segurador BB Mapfre from 2011 to 2015; Sector Officer of the Brazilian Bank Federation (Febraban) from 2010 to 2015; Executive Officer of Real Estate Credit of Banco do Brasil S.A. from 2011 to 2014; Executive Officer of Home Loans of Banco do Brasil S.A. from 2011 to 2014; Executive Officer of Loans of Banco do Brasil S.A. from 2010 to 2011; and Executive Officer of Products of Banco Nossa Caixa S.A. from 2009 to 2010.
Academic background: Degree in Business Administrationbusiness administration from Faculdade SPEI; MBA from Fundação Getúlio Vargas; and MBA in Agribusinessagribusiness from Escola Superior de Agricultura Luiz de Queiroz.
Dan Antonio Marinho Conrado, 52: Member of Vale's Board of Directors since October 2012.
Other current director or officer positions: Chairman of Valepar's Board of Directors since 2012; and Alternate Member of the Board of Directors of Mapfre BB SH2 Participações S.A. since 2011.
Professional experience: Chairman of Vale's Board of Directors from 2012 to 2016; Chief Executive Officer of Valepar from 2012 to 2015; Member of Vale's Strategic Committee from 2012 to 2015; Permanent Participant of Vale's Strategic Committee from 2015 to 2016; Alternate Member of the Board of Directors of Petróleo Brasileiro S.A.—Petrobrás and, Member of the Board of Directors of its wholly owned subsidiary, BR Distribuidora, from July 2015 to November 2015; Member of the Board of Directors of Fras-le S.A. from 2010 to 2013; Member of the Board of Directors of Aliança do Brasil S.A. from 2010 to 2011; and Vice-President of Retail, Distribution and Operations of Banco do Brasil S.A from 2011 to 2012.
Academic background: Degree in Law from Universidade Dom Bosco; MBA from Universidade Federal do Rio de Janeiro, COPPEAD; and MBA from Instituto de Ensino e Pesquisa em Administração of Universidade Federal de Mato Grosso, Inepad.
Marcel Juviniano Barros, 54: Member of Vale's Board of Directors since October 2012; and Member of the Executive Development Committee of Vale since February 2013.
Other current director or officer positions: Officer of Securities of PREVI—Caixa de Previdência dos Funcionários do Banco do Brasil S.A. since 2012; Member of the Board of Directors of Valepar since 2012; and Member of the Board of PRI—Principles for Responsible Investment of the UN since 2012.
Professional experience: Between 1987 and 2012 held several positions at Banco do Brasil S.A., including the position of Union Auditor; and General Secretary of the National Confederation of Financial Branch Workers, where he coordinated international networks from 2008 to 2011.
Academic background: Degree in History from Fundação Municipal de Ensino Superior de Bragança Paulista.
Eduardo Refinetti Guardia, 51: Member of Vale's Board of Directors since July 2016.
Other current director or officer positions: Executive Secretary of the Department of the Treasury since 2016; and Chairman of Banco do Brasil S.A.'s Board of Directors since 2016.
Professional experience: Executive Officer of Products of BM&FBOVESPA from 2013 to 2016; and Executive Officer of Finance and Investor Relations of BM&FBOVESPA from 2010 to 2013.
Academic background: Degree in Economics from Pontífica Universidade Católica; Master's Degree in Economics from Universidade Estadual de Campinas; and PhD in Economics from Universidade de São Paulo.
Fernando Jorge Buso Gomes, 60: Vice-Chairman62: Vice Chairman of Vale's Board of Directors since January 2017 (Member of Vale's Board of Directors since April 2015); Member of the Finance Committee since April 2015, Coordinator of the Governance Sustainability Committee of Vale since April 2015; and Member of the FinancialPersonnel Committee and the Executive Development Committee of Vale since April 2015.November 2017.
Other current director or officer positions: Executive Officer of Valepar since 2015; Member of the Board of Directors of Valepar since 2015 (and Vice-Chairman of Board of Directors since 2017); Chief Executive Officer and Investor Relations Executive Officer of Bradespar since 2015 and 2015, respectively; Executive Officer of Millennium Security Holdings Corp. since 2015; and Vice Chairman of Bradespar's Board of Directors since April 2018.
Professional experience: Coordinator of Vale's Governance Sustainability Committee and Member of the Executive Development Committee from April 2015 to October 2017; Member of the Strategy Committee from April 2017 to October 2017; Executive Officer of Valepar from 2015 to 2017; Member of the Board of Directors of 2b Capital S.A. since 2014; and Executive OfficerValepar from 2015 to 2017 (and Vice-Chairman of Banco Bradesco BBI S.A. since 2006.Board of Directors from
| | | | |
| | 134 | | |
Professional experience:Management
January to August 2017); Member of the Board of Directors of Sete Brasil S.A. from 2011 to 2015; Chairman of the Board of Directors of Smartia Corretora de Seguros S.A. from 2012 to 2015; Chairman of the Board of Directors of SMR Grupo de Investimentos e Participações S.A. from 2014 to 2015; Member of the Board of Directors of BCPAR S.A. from 2013 to 2015; Member of the Board of Directors of BR Towers S.A. from 2013 to 2014; Member of the Board of Directors of CPFL Energias Renováveis S.A. from 2011 to 2012; and Member of the Board of Directors of LOG Commercial Properties S.A. from 2013 to 2015; Executive Officer of Banco Bradesco BBI S.A. from 2006 to 2015; Member of the Board of Directors of 2b Capital S.A. from November 2014 to December 2018; Chief Executive Officer and Executive Officer of 2b Capital S.A. from May 2015 to June 2016 and from June 2016 to December 2018, respectively; Member of Vale's Board of Directors from April 2015 to January 2017; Chief Executive Officer of Antares Holding Ltda. from April 2015 to April 2017; Chief Executive Officer of Brumado Holdings Ltda from April 2015 to April 2017; and Member of the Investments Committee of Fundo de Investimento em Participações Sondas from May 2011 to April 2015.
Academic background: Degree in Economic Scienceseconomic sciences from Integrated CollegeFaculdades Integradas Bennett.
Oscar Augusto de Camargo Filho, 79:81: Member of Vale's Board of Directors since September 2003; Member of Vale's Strategy Committee since March 2006;October 2003 and Coordinator of Vale's Executive Developmentthe Personnel Committee since November 2003.2017.
Other current director or officer positions: Managing Partner of CWH Consultoria Empresarial, since 2003.
Professional experience: Member of the Board of Directors of Valepar from 2003 to 2014.
Academic background: Degree in Law from Universidade de São Paulo; and Post-graduate Degree in International Marketing from Cambridge University.
Eduardo de Salles Bartolomeo, 53:2014; Member of Vale's Strategy Committee from March 2006 to October 2017; Coordinator of Vale's Executive Development Committee from November 2003 to October 2017; Secretary to Board of Directors and Strategic Committee since September 2016.
Other current director or officer positions: Member of the Board of Directors of Arteris S.A. since 2015; and Member of the Board of Directors of Login Logística Intermodal since 2016.
Professional experience:Commercial Executive Officer of ValeMotores Perkins from 20071963 to 2012;1973; Commercial Executive Officer of MBR and Caemi Group from 1973 to 1981; Chief Executive Officer of BHG—Brazilian HospitalityCaemi International and Commercial Vice President of Caemi Group from 20131981 to 2015;1988; Chief Executive Officer of Caemi Mineração e Siderurgia from 1988 to 1992; Chief Executive Officer of Caemi Mineração e Siderurgia and Member of the Board of Directors of MRS Logística S.A.Ferrovias from 20071996 to 2009.2002.
Academic background: Degree in Metallurgical Engineeringlaw from Universidade Federal Fluminense; MBAde São Paulo; and Post-graduate degree in international marketing from Katholieke Universiteit Leuven; and MBA from Massachusetts Institute of Technology.Cambridge University.
Motomu TakahashiDan Antonio Marinho Conrado, 63:54: Member of Vale's Board of Directors since April 2016.October 2012; Member of the Sustainability Committee since November 2017.
Other current director or officer positions: Representative Director and Executive Vice-president of Mitsui & Co. Ltd. since 2016.
Professional experience: Executive Vice-PresidentMember of Vale's Governance and Chief Operating OfficerSustainability Committee from April 2017 to October 2017 and of the American business unit of Mitsui & Co. Ltd.Vale's Strategic Committee from 2015October 2012 to 2016; Senior Executive Managing Officer and Chief Operating Officer of the American business unit of Mitsui & Co. Ltd. from 2014 toApril 2015; and Executive Managing Officer and Chief Operating Officer of iron and steel products business unit of Mitsui & Co. Ltd from 2011 to 2014.
Academic background: Degree in Economics from Tokyo University; and Advanced Management Program from Harvard Business School.
Alberto Ribeiro Guth, 57: MemberChairman of Vale's Board of Directors since June 2015.
Other current director or officer positions: Managing Partnerfrom October 2012 to February 2016; Chairman of Angra Partners GestãoValepar's Board of Directors from 2012 to 2017; Chief Executive Officer of Valepar from 2012 to 2015; Chief Executive Officer of PREVI—Caixa de Recursos Ltda. since 2003; Director of Angra Infraestrutura Gestão de Informações Ltda. since 2006; Managing Partner of Angra Partners Participações Ltda. since 2010; Managing Partner of Angra Partners Assessoria Financeira Ltda. since 2010;Previdência dos Funcionários do Banco do Brasil S.A. from 2012 to 2014, Alternate Member of the Board of Directors of TGMapfre BB SH2 Participações S.A. since 2008;from 2011 to 2017; and Alternate Member of the Board of Directors of Via VarejoPetróleo Brasileiro S.A. since 2012; Member of the Board of Directors of Centrais Elétricas de Santa Catarina S.A.—CELESC since 2015; Executive Officer of Futuretel S.A. since 2012; Executive Officer of Zain Participações S.A. since 2012; Executive Officer of Sul 116 Participações S.A. since 2012; Executive Officer of Newtel Participações S.A. since 2012; Executive Officer of Invitel Legacy S.A. since 2012; Member of the Board of Directors of Estre Ambiental S.A. since 2014; Director of Aconcágua Investimentos e Participações Ltda. since 2013; Member of the Board of Directors of Geradora Aluguel de Máquinas S.A. since 2013; Director of Neustift Participações Ltda. since 2014;Petrobrás and Member of the Board of Directors of Rio Barigui Participações S.A. since 2012; and Member of the Board of Directors of Capinauá Participações S.A. since 2007.
Professional experience: Managing Partner of Angra Partners Participações Ltda.its wholly owned subsidiary, BR Distribuidora, from 2010July 2015 to 2014, and of Angra Partners Assessoria Financeira Ltda. from 2010 to 2015; Member of the Board of Directors of Ediouro Participações S.A. from 2013 to 2014; Member of the Board of Directors of Companhia Providência Indústria e Comércio S.A. from 2013 to 2014; and Executive Officer of Daleth Participações S.A. from 2012 toNovember 2015.
Academic background: Degree in Engineeringlaw from Universidade Dom Bosco; MBA from Universidade Federal do Rio de Janeiro, COPPEAD; and MBA from Instituto Militar de Engenharia; and MBA in Finance from Wharton Business School.Ensino e Pesquisa em Administração of Universidade Federal de Mato Grosso, Inepad.
| | | | |
| | 135 | | |
Denise Pauli PavarinaManagement
Marcel Juviniano Barros, 53:56: Member of Vale's Board of Directors since February 2017October 2012; Member of the Personnel Committee since November 2017.
Other current director or officer positions: Officer of Securities of PREVI—Caixa de Previdência dos Funcionários do Banco do Brasil S.A. since 2012.
Professional experience: Member of the Executive Development Committee of Vale from February 2013 to October 2017; Member of the Board of Directors of Valepar since 2017; Member of the Conduct and Ethics Committee of Banco Bradesco S.A. since 2016; Member of the IT Committee of BM&FBOVESPA S.A.—Bolsa de Valores, Mercadorias e Futuro since 2016; Member of the Board of Directors of BM&FBOVESPA S.A.—Bolsa de Valores, Mercadorias e Futuro since 2015; Member of the Advisory Committee for Intermediation Sector of BM&FBOVESPA S.A.—Bolsa de Valores, Mercadorias e Futuro since 2015; Managing Director of BRAM—Bradesco Asset Management S.A. since 2012; Member of the Management Board of Fundação Bradesco since 2009; Member of the Board of Directors of Fundação Instituto de Moléstias do Aparelho Digestivo e da Nutrição since 2012; Member of the Board of Directors (representing ANBIMA) of Instituto BRAIN—Brasil Investimentos & Negócios since 2012; Managing Director of Kirton Bank S.A. and Kirton Gestão de Recursos Ltda. since 2016; Member of the Investment Committee of NEO Capital Mezanino Fundo de Investimentos em Participações since 2010; and Vice-Chairman of the Board of Directors of 2bCapital S.A. since 2014.
Professional experience: Adjunct Executive Officer of Banco Bradesco S.A. from 2012 to 2015; Managing Executive Officer ofAugust 2017; held several positions at Banco Bradescodo Brasil S.A. from 2015 to 2017; Member, including Union Auditor, between 1987 and 2012; and General Secretary of the Management BoardNational Confederation of Fundação BradescoFinancial Branch Workers from 20012008 to 2007; President of Associação Brasileira das Entidades dos Mercados Financeiros e de Capitais—ANBIMA from 2012 to 2016; Superintendent Director of BRAM—Bradesco Asset Management S.A. from 2009 to 2012; Member of the Representatives Council (representing ANBIMA) of Confederação Nacional das Instituições Financeiras—CNF from 2012 to 2016; Member of the Consulting Board of Instituto BRAIN—Brasil Investimentos & Negócios from 2012 to 2014; Member of the Strategic Committee (representing ANBIMA) of Instituto BRAIN—Brasil Investimentos & Negócios from 2012 to 2013; and Member of the Board of Directors of 2bCapital S.A. from 2010 to 2014.2011.
Academic background: Degree in Economic Scienceshistory from Faculdade Armando Álvares Penteado; Law Degree from Universidade Paulista; and MBA from InstituteFundação Municipal de Ensino e Pesquisa.Superior de Bragança Paulista.
Lucio Azevedo, 58:60: Member of Vale's Board of Directors since April 2015.
Professional experience: Chairman of Railway Labor Unions in the Brazilian states of Maranhão, Pará and Tocantins since 2013.
Academic background: Incomplete secondary education.
Eduardo Refinetti Guardia, 53: Member of Vale's Board of Directors since July 2016; Member of the Finance Committee since April 2017 and Coordinator of the Finance Committee since December 2018.
TechnicalProfessional experience: Coordinator of the Finance Committee from August 2017 to May 2018; Executive Officer of Products of BM&FBOVESPA (now B3) from 2013 to 2016; Executive Officer of Finance and Investor Relations of BM&FBOVESPA (now B3) from 2010 to 2013; Chairman of the Board of Directors of Banco do Brasil S.A. from June 2016 to April 2017; Executive Secretary of the Department of the Treasury from June 2016 to March 2018; Minister of the Department of Treasury from April 2018 to December 2018; and Manager of the Capital and Risk Committee of Banco do Brasil S.A. from September 2017 to December 2018.
Academic background: Degree in economics from Pontifícia Universidade Católica; Master's Degree in economics from Universidade Estadual de Campinas; and PhD in economics from Universidade de São Paulo.
Ney Roberto Ottoni de Brito, 73: Member of Vale's Board of Directors since January 2018; Coordinator of the Governance, Compliance and Risk Committee and Member of the Finance Committee since January 2018.
Other current director or officer positions: Chief Executive Officer of Ney O. Brito e Associados since 1978.
Academic background: Graduate degree in mechanical engineering from Escola Politécnica of the Universidade Federal do Rio de Janeiro; Master's degree in production engineering from COPPE of the Universidade Federal do Rio de Janeiro; PhD in finance from Stanford University.
Toshiya Asahi, 52: Member of Vale's Board of Directors since October 2017.
| | | | |
| | 136 | | |
Management
Other current director or officer positions: Vice President of Mitsui & Co. (Brasil) S.A. since 2015; and Member of the Board of Directors of Gaspetro since October 2016.
Professional experience: Deputy General Manager of New Metals and Aluminum of Mitsui & Co. Ltd. from 2014 to 2015; Deputy Executive Officer of Mitsui & Co. Ltd. from 2012 to 2014.
Academic background: Graduate degree in metallurgical engineering from the University of Kyushu.
Sandra Maria Guerra de Azevedo, 63: Member of Vale's Board of Directors since October 2017 and Member of the Governance, Compliance and Risk Committee since November 2017.
Other current director or officer positions: Founding Partner of Better Governance Consulting Services since 2005; and Member of the Board of Directors of Global Reporting Initiative since January 2017.
Professional experience: Member of the Board of Directors of Companhia Paranaense de Energia from October 2016 to April 2017; Consulting counselor of Solvi Participações from 2011 to 2013; Consulting counselor of Solvi Valorização Energética from January 2013 to June 2013; Consulting counselor of Solvi Saneamento from June 2012 to December 2012; Consulting counselor of Grupo Itapemirim from 2009 to 2013; Co-founder of the Brazilian Institute of Corporate Governance (IBGC), serving as Chairman of its Board of Directors from 2012 to 2016; and Member of the Board of Directors of Vix Logística S.A. from April 2015 to April 2018.
Academic background: Graduate degree in social communications-journalism from Universidade Paulista; MBA from Universidade de São Paulo.
Isabella Saboya de Albuquerque, 48: Member of Vale's Board of Directors since October 2017
Other current director or officer positions: Member of the Board of Directors of Wiz Soluções e Corretagem de Seguros S.A. since April 2016; Vice-chairman of the Board of Directors of the Brazilian Institute of Corporate Governance (IBGC) since April 2017; Member of the State Governance Market Advisory Chamber of B3 since August 2017; Member of the Council of Autoregulation in Investment Governance Abrapp/Sindapp/ICSS since December 2016.
Professional experience: Member of the Fiscal Council of Bradespar S.A. from April 2016 to July 2016; Member of the Fiscal Council of Mills S.A. from April 2016 to April 2017; Member of the Board of Directors of BR Malls S.A. from May 2016 to March 2017; Partner at Jardim Botânico Investimentos S.A. from 2009 to 2015.
Academic background: Graduate degree in economics from Pontifícia Universidade Católica do Rio de Janeiro.
ADVISORY COMMITTEES TO THE BOARD OF DIRECTORS
Our bylaws provide for the following advisory committees to the Board of Directors, each governed by its own internal rules.
Our bylaws provide for the following technical and advisory committees to the Board of Directors:
Executive DevelopmentPersonnel Committee, which is responsible for (i) reporting on general human resources policies as submitted byevaluating the adequacy of the compensation model for members of the Board of Executive Officers and the proposed annual, global budget for the compensation of executives, supporting the Board of Directors in the setting and monitoring of goals for performance evaluation of our executive officers
| | | | |
| | 137 | | |
Management
and certain other key managers, supporting the Board of Directors in determining disciplinary treatment of confirmed allegations against members of the Board of Executive Officers or other managers who report directly to the Chief Executive Officer or to the Board of Directors, (ii) analyzing and issuing reports tosupporting the Board of Directors on proposals relating toin the annual, global budget forprocess of selecting and appointing the remuneration of administrators and members of the executive officers, (iii) proposing and updating methodologies and goals for evaluating the performance of our executive officers, and (iv)Chief Executive Officer, monitoring the development of the executive officer succession plan.
TheStrategy Committee, which is responsibleplan for reviewingthe Executive Board and making recommendationsother leaders who report directly to the BoardChief Executive Officer, evaluating and recommending adjustments to corporate governance best practices, identifying and recommending potential candidates to be directors and to be members of Directors concerning (i) the strategic guidelinesAdvisory Committees, among other matters. The current members of the Personnel Committee are Oscar Augusto de Camargo Filho, Gueitiro Matsuo Genso, Marcel Juviniano Barros, Fernando Jorge Buso Gomes and plan submitted annually to the Board of Directors by our executive officers, (ii) investment or divestiture opportunities submitted by executive officers and (iii) mergers and acquisitions and other reorganizations.Ana Silvia Matte.
TheFinance Committee, which is responsible for (i) reviewingevaluating the structure and making recommendations toconditions of investment and divestment transactions, including mergers, consolidations and spin-offs in which Vale is involved, evaluating the Board of Directors concerning our corporate riskscompatibility and financial policies and the internal financial control systems, compatibilityconsistency between the compensation level of distributions to shareholders and the parameters established in the annual budget and the consistency between ourfinancial scheduling, as well as Vale's general dividend policy on dividends and capital structure, (ii) evaluating ourVale's annual budget and annual investment plan, as well as ourevaluating Vale's annual funding plan and risk exposureindebtedness limits, , (iii) evaluating our risk management procedurescurrent and (iv)capital investments, monitoring the financial execution of our capital expenditure projects, ongoing budget and ongoing budget.cash flow, monitoring financial risks and controls, preparing and approving the Finance Committee's annual work plan, among other matters. The current members of the Finance Committee are Eduardo Refinetti Guardia, Ney Brito, Fernando Jorge Buso Gomes, Eduardo de Oliveira Rodrigues Filho and Gilmar Dalilo Cezar Wanderley.
| | | | |
| | 138 | | |
Management
INDEPENDENT AD HOC ADVISORY COMMITTEES TO THE BOARD OF DIRECTORS CREATED IN RESPONSE TO DAM I FAILURE
EXECUTIVE OFFICERS
Executive officers
The executive officers are responsible for day-to-day operations and the implementation of the general policies and guidelines set forth by our Board of Directors. Our bylaws provide for a minimum of six and a maximum of 11 executive officers. The executive officers hold weekly meetings and hold additional meetings when called by any executive officer. Under Brazilian corporate law, executive officers must be Brazilian residents.
The Board of Directors appoints executive officers for two-year terms and may remove them at any time. The following table lists our current executive officers.
| Officer | | Year of appointment | | Position | | Age | | ||
|---|---|---|---|---|---|---|---|---|---|
Murilo Pinto de Oliveira Ferreira(1) | | 2011 | | Chief Executive Officer | | 63 | | ||
Luciano Siani Pires | | 2012 | | Chief Financial Officer and Executive Officer for Investor Relations | | 47 | | ||
Gerd Peter Poppinga(2) | | 2014 | | Executive Officer (Ferrous Minerals) | | 57 | | ||
Jennifer Anne Maki | | 2015 | | Executive Officer (Base Metals) | | 46 | | ||
Humberto Ramos de Freitas | | 2011 | | Executive Officer (Logistics and Mineral Research) | | 63 | | ||
Roger Allan Downey | | 2012 | | Executive Officer (Fertilizer, Coal and Strategy) | | 49 | | ||
Clovis Torres Junior | | 2016 | | Executive Officer (Human Resources, Sustainability, Compliance and General Counsel) | | 49 | | ||
| Officer | | Year of appointment | | Position | | Age | | ||
|---|---|---|---|---|---|---|---|---|---|
Eduardo de Salles Bartolomeo(1)(2) | | 2017 | | Interim Chief Executive Officer | | 55 | | ||
Luciano Siani Pires | | 2012 | | Chief Financial Officer and Executive Officer for Investor Relations | | 49 | | ||
Claudio de Oliveira Alves(2) | | 2019 | | Interim Executive Officer (Ferrous Minerals and Coal) | | 51 | | ||
Vacant(3) | | 2019 | | Executive Officer (Base Metals) | | – | | ||
Luiz Eduardo Fróes do Amaral Osorio | | 2017 | | Executive Officer (Sustainability and Institutional Relations) | | 45 | | ||
Alexandre Gomes Pereira | | 2017 | | Executive Officer (Business Support) | | 49 | | ||
Fabio Schvartsman(2) | | 2017 | | Executive Officer (on leave) | | 65 | | ||
Gerd Peter Poppinga(2) | | 2014 | | Executive Officer (on leave) | | 59 | | ||
| | | | |
| | 139 | | |
Management
Below is a summary of the business experience, activities and areas of expertise of our current executive officers.
Murilo PintoEduardo de Oliveira FerreiraSalles Bartolomeo, 63:55: Interim Chief Executive Officer of Vale and Participant of Vale's Strategy and Disclosure Committees since May 2011.March 2019.
Other current director or officer positions: Chairman of the Board of Directors of Login Logística Intermodal since 2016.
Professional experience: Executive Officer for Base Metals from 2017 to March 2019; Member of Vale's Board of Directors from September 2016 to December 2017; Coordinator of Vale's Governance, Compliance and Risk Committee from November 2017 to December 2017; Member of Vale's Financial Committee from April to December 2017; Chief Executive Officer of Nova Transportadora do Sudeste from April to December 2017; Member of Vale's Strategic Committee from September 2016 to October 2017; Executive Officer of Vale with responsibility over several different departmentsfor Integrated Operations from 20052010 to 2008, including business development, M&A, steel, energy, nickel and base metals; Chief executive officer2012; Executive Officer of Vale Canadafor Logistics, Projects & Sustainability from 2007 to 20082010; Member of the Board of Directors of Arteris S.A. from 2015 to 2017; Chief Executive Officer of BHG—Brazilian Hospitality Group from 2013 to 2015; Member of the Board of Directors of MRS Logística S.A. from 2007 to 2009; Head of Vale's logistical operations from 2004 to 2006; and memberChief Executive Officer of its board of directorsPetroflex from 2006 to 2007; Chairman of the board of directors of Petrobras from May to November 2015, Alunorte from 2005 to 2008, MRN from 2006 to 2008 and Valesul Alumíno S.A. ("Valesul"), a subsidiary of Vale involved in the production of aluminum, from 2006 to 2008; Member of the board of commissioners of PTVI, from 2007 to 2008. Mr. Ferreira has been a member of the board of directors of several companies, including Usiminas, a Brazilian steel company, from 2006 to 2008, and was a partner at Studio Investimentos, an asset management firm with a focus on the Brazilian stock market, from October 2009 to March 2011.2007.
Academic background: Degree in business administration from Fundação Getúlio Vargas in São Paulo; post-graduateGraduate degree in business administrationmetallurgical engineering from Universidade Federal Fluminense; MBAs from Katholieke Universiteit Leuven and finance from Fundação Getúlio Vargas in Rio de Janeiro; senior executive education program at the IMD Business School in Lausanne, Switzerland.Massachusetts Institute of Technology.
Luciano Siani Pires, 47:49: Chief Financial Officer and Executive Officer for Investor Relations of Vale since August 2012 and Member of Vale'sthe Executive Risk Management and Disclosure CommitteesCommittee since August 2012.
Other current director or officer positions: Member of the Board of Directors of The Mosaic Company since January 2018; and Chairman of the Board of Directors of VLI S.A since September 2017.
Professional experience: Alternate Member of the Board of Directors of Vale, from 2005 to 2007; Member of Vale's Financial Committee from 2012 to 2015; Global Officer of Strategic Planning, from 2008 to 2009 and in 2011, and Global Officer of Human Resources and Governance from 2009 to 2011 of Vale; Member of the boardBoard of directorsDirectors of Valepar, from 2007 to 2008; Member of the boardBoard of directorsDirectors of Telemar Participações S.A., from 2005 to 2008; Member of the boardBoard of directorsDirectors of Suzano Papel e Celulose S.A., from 2005 to 2008; Several executive positions at BNDES, including executive secretary and chief of staff of the presidency, headHead of capital markets and head of export finance, from 1992 to 2008;1999 and from 2001 to 2008, respectively; and Consultant at McKinsey & Company from 2003 to 2005.
Academic background: Degree in mechanical engineering from Pontifícia Universidade Católica do Rio de Janeiro; and MBA in finance from the Stern School of Business, New York University.
Claudio de Oliveira Alves, 51: Interim Executive Officer for Ferrous Minerals and Coal of Vale since March 2019.
Professional experience: Chief Operating Officer of Pelletizing and Manganese Division of Vale from January 2017 to March 2019; Chief Global Officer of Iron Ore Marketing and Sales of Vale from August
| | | | |
| | 140 | | |
Management
2013 to December 2016; Chief Marketing Officer from September 2011 to June 2013; and Chief Strategy Officer from July 2010 to September 2011.
Academic background: Degree in production engineering from Federal University of Rio de Janeiro; Post Graduate degree in Management from Fundação Dom Cabral; Specialization in Strategic Marketing from Darden School of Business; MBA in Management from University of São Paulo; Specialization in Industrial Marketing from INSEAD; Specialization in Transforming Leadership from Massachusetts Institute of Technology (MIT); Specialization in Leadership from IMD; and participation on Innovation and Sustainability Program from MIT.
Luiz Eduardo Fróes do Amaral Osorio, 45: Executive Officer for Sustainability and Institutional Relations of Vale since July 2017.
Other current director or officer positions: President of the Board of Directors of Instituto Brasileiro de Mineração—IBRAM.
Professional experience: Executive Vice-President of Legal and Company Relations of CPFL Energia S.A. from 2014 to 2017; Member of the Board of Directors of CPFL Energias Renováveis S.A. from 2014 to 2017; Vice-Chairman of the Board of Directors of Instituto CPFL from 2015 to 2017; Executive Director of International Markets of Raízen from 2012 to 2014; Vice President, General Counsel and Chief Institutional Relations Officer of CPFL Energy Group from May 2014 to July 2017; Executive Director for International Markets, based in London, of Raízen from July 2012 to March 2014; Vice President for Sustainable Develompment and External Affairs of Raízen from March 2011 to June 2012.
Academic background: Law degree from Pontifícia Universidade Católica do Rio de Janeiro; Master's degree in development management from American University's School of International Service; Participated in coursework in corporate social responsibility at Harvard Business School, general management skills at INSEAD, strategy and leadership at the University of Pennsylvania and leadership in corporate counsel from Harvard Law School.
Alexandre Gomes Pereira, 49: Executive Officer for Business Support since August 2017.
Professional experience: Global Information Officer of Vale from 2011 to 2017; Head of Global IT Services of Vale from 2009 to 2011; Vice President and Chief Information Officer of Vale's global nickel business (Vale Canada) from 2007 to 2009; IT General Manager of Vale from 2002 to 2007.
Academic background: Degree in mathematics/computer science from State University of Rio de Janeiro (UERJ); Post-graduate degrees in business management from Fundação Dom Cabral and in computer networks from the Federal University of Espírito Santo (UFES); and MBA from São Paulo University (USP).
Fabio Schvartsman, 65: Executive officer (on leave since March 2019). SeeBusiness overview—Failure of the tailings dam at the Córrego do Feijão mine.
Professional experience: Chief Executive Officer of Vale from May 2017 to March 2019; Coordinator of Vale's Strategic Committee from May 2017 to October 2017; Chief Executive Officer of Klabin S.A. from 2011 to 2017; Chief Executive Officer of SanAntonio Internacional from April 2008 to April 2010; Chief Executive Officer of Telemar Participações S.A. from April 2007 to February 2008; several executive positions at Grupo Ultra from May 1985 to April 2007, including Planning and Control Officer and Investor Relations Officer, Chief Financial Officer of Ultrapar Holding and managing partner of Ultra S.A.; and General Manager of the Economic Studies, Development and Planning areas of Duratex S.A. from February 1976 to April 1985.
| | | | |
| | 141 | | |
Management
Academic background: Graduate and post-graduate degrees in production engineering from the University of São Paulo and a post-graduate degree in Business Administration from Fundação Getúlio Vargas.
Gerd Peter Poppinga, 57:59: Executive officer (on leave since March 2019). SeeBusiness overview—Failure of the tailings dam at the Córrego do Feijão mine.
Professional experience: Executive Officer for Ferrous Minerals of Vale sincefrom November 2014.
Other current director or officer positions: Member of the Board of Directors of Vale International since June 2015.
Professional experience:2014 to March 2019; Executive Officer for Base Metals Operations and Information Technology of Vale from November 2011 to November 2014; Executive vice president for Asia Pacific of Vale Canada from November 2009 to November 2011; Director for strategy, business development, human resources and sustainability of Vale Canada from May 2008 to October 2009; Director for strategy and information technology of Vale Canada Limited from November 2007 to April 2008. In2008; Several memberships on boards of directors and executive boards from 2005 to 2010 in connection with his roles at Vale, Mr. Poppinga was also memberVale; Member of the boardBoard of directorsDirectors of Samarco Mineração S.A. from December 2014 to April 2016; and the executive board of several companies from 2005 to 2010. From 1985 until 1999, Mr. Poppinga also held several positions at Mineração da Trinidade S.A.—SAMITRI, a publicly held mining company that was acquired by Vale in 2001.2001, from 1985 to 1999.
Academic Background: Degree in geology from Universität Clausthal—Zellerfeld, Germany; Participated in coursework in geostatistics extension course at Universidade Federal de Ouro Preto (UFOP); participated in the, executive MBA fromat Fundação Dom Cabral;Cabral, negotiation dynamics at INSEAD; Seniorsenior leadership program at M.I.T.; Leadership program at IMD Business School, Lausanne, Switzerland; and strategic megatrends with Asia Focus program at Kellogg Singapore.
Jennifer Anne Maki, 46: Executive Officer for Base Metals of Vale since November 2015.
Other current director or officer positions: President commissioner of PTVI; Member of the board of directors of Vale New Caledonia and Vale's Global Pension Committee; Chairwoman and member of the Canadian pension committee since 2009 and 2007, respectively.
Professional experience: Chief financial officer of Vale Canada from 2007 to 2013, prior to which Ms. Maki held positions in the base metals treasury and controllership areas. From 1993 to 2003, she worked at PricewaterhouseCoopers LLP in roles of increasing responsibility.
Academic background: Degree in business from Queens University; post-graduate degree in accounting from the Institute of Chartered Accountants of Ontario.
Humberto Ramos de Freitas, 63: Executive Officer for Logistics and Mineral Research of Vale since November 2011.
Other current director or officer positions: Chairman of the board of the Brazilian Association of Port Terminals since May 2009.
Professional experience: Member of the board of directors of MRS from December 2010 to October 2012; Logistics Operations Officer of Vale from September 2009 to June 2010; Director for Ports and Navigation of Vale from March 2007 to August 2009; Chief executive officer of Valesul from August 2003 to February 2007; General superintendent of ports of CSN from December 1997 to November 1999.
Academic background: Degree in metallurgical engineering from the Escola de Minas de Ouro Preto; Executive development program at the Kellogg School of Management at Northwestern University; Advanced management and business development partnership programs from Fundação Dom Cabral/INSEAD; Senior executive program at MIT; Strategic business planning from McKinsey Consulting; Management training course from the Association of Overseas Technical Scholarship in Tokyo, Japan.
Roger Allan Downey, 49: Executive Officer for Fertilizer, Coal and Strategy of Vale (Executive Officer for Fertilizer and Coal since May 2012 and for Strategy since 2015).
Professional experience: Managing partner of CWH Consultoria Empresarial SC Ltda., a privately-held consulting company, from January 2012 to April 2012; Alternate member of the board of directors of Valepar from February 2012 to April 2012; Chief executive officer of MMX Mineração e Metálicos S.A., a publicly-held mining company, from August 2009 to November 2011; Director of equity research of Banco de Investimentos Credit Suisse (Brasil) S.A., a privately-held brokerage and investment bank, from August 2005 to August 2009; Strategic Marketing Manager for Iron Ore at Vale from 2002 to 2005; Commercial and new business manager of Rio Tinto, a publicly-held mining company, from October 1996 to September 2002; Market coordinator of CAEMI from December 1991 to October 1996.
Academic background: Graduate certificate of management and MBA from the University of Western Australia; Graduate diploma in business administration from the Australian National Business School.
Clovis Torres Junior, 49: Executive Officer for Human Resources, Sustainability, Compliance and General Counsel of Vale since August 2016.
Other current director or officer positions: Chairman of the Managing Council of the Brazilian Mining Institute (IBRAM); Vice President of the National Iron and Base Metals Mining Trade Association (SINFERBASE); Member of the Corporate Law Commission of the Brazilian Bar Association (OAB); Member of the Board of Trustees of Fundação Getulio Vargas; Member of the Economics Council of the Rio de Janeiro State Federation of Industry (FIRJAN).
Professional experience: General Counsel and Chief Compliance Officer of Vale, from July 2011 to July 2016; Executive Vice President of Bahia Mineração Ltda., from September 2007 to July 2011; Director of the Corporate Legal Department of Vale, from May 2003 to September 2007; Partner in the law firm Machado, Meyer, Sendaz & Opice Advogados, from December 2000 to May 2003; Senior Lawyer at the International Finance Corporation in the United States, from January 1997 to December 2000; Senior Lawyer at Cargill Agrícola S.A., from August 1995 to January 1997; Senior Lawyer at Clyde & Co International Law Firm, in Brazil and England, from June 1993 to July 1995. From May 2015 to November 2015, Clovis chaired the Board of Directors of Petrobras Distribuidora S.A. and served on the Board of Directors of Petrobras S.A.
Academic background: Bachelor Degree in Law from the Catholic University of Salvador and a Master in International Law, Trade and Finance from Tulane Law School, Louisiana, United States; Executive MBA degree from Fundação Getulio Vargas in São Paulo; and several courses on management, leadership, corporate finance and mergers and acquisitions at the Massachusetts Institute of Technology Harvard University, the International Institute for Management Development (IMD), and INSEAD.IMD Business School in Lausanne, Switzerland, and strategic megatrends (Asia-focused) at Kellogg Singapore.
On March 27, 2017, Vale announced the appointment ofFabio Schvartsman, 63, as its new Chief Executive Officer starting in late May 2017. Mr. Schvartsman has graduate and post-graduate degrees in production engineering from the University of São Paulo and a post-graduate degree in Business Administration from Fundação Getúlio Vargas. He worked for 10 years at Duratex and for 22 years at the Ultra Group, which he left in 2007 as the Ultrapar Holding CFO and managing partner of Ultra S.A. Mr. Schvartsman was CEO of Telemar Participações and of San Antonio International and has been Klabin's CEO since 2011.CONFLICTS OF INTEREST
Conflicts of interest
Under Brazilian corporate law, if a director or an executive officer has a conflict of interest with the company in connection with any proposed transaction, such director or executive officer may not vote in any decision of the board of directors or of the board of executive officers regarding such transaction and must disclose the nature and extent of the conflicting interest for transcription in the minutes of the meeting. Under our Policy on Related Party Transactions, any director or executive officer who has a conflict of interest cannot receive any relevant documentation or information and may not participate in any related discussions. None of our directors or executive officers can transact any business with us, except on reasonable or fair terms and conditions that are identical to the terms and conditions prevailing in the market or offered by unrelated parties. For more details about our Policy on Related Party Transactions seeShare ownership and trading—Related party transactions.
Fiscal CouncilFISCAL COUNCIL
We have a fiscal council established in accordance with Brazilian law. The primary responsibilities of the fiscal council under Brazilian corporate law are to monitor management's activities, review the Company'scompany's financial statements, and report its findings to the shareholders. Our management is required to obtain the Fiscal Council's pre-approval before engaging independent auditors to provide any audit or permitted non-audit services to Vale or its consolidated subsidiaries. Our Fiscal Council has pre-approved a detailed list of services based on detailed proposals from our auditors up to specified monetary limits. The list of pre-approved services is updated from time to time. Services that are included in this list, or that exceed the specified limits, or that relate to internal controls must be separately approved by the Fiscal Council. The policy also sets forth a list of prohibited services. The Fiscal Council is provided with reports on engagement and performance of the services included in the list on a periodic basis, and it also reviews and monitors the Company'scompany's external auditor's independence and objectivity. The Fiscal Council has the power to review and evaluate the performance of the Company'scompany's external auditors on an annual basis and make a recommendation to the Board of Directors on whether the Companycompany should remove and replace
| | | | |
| | 142 | | |
Management
its existing external auditors. The Fiscal Council may also recommend withholding the payment of compensation to the independent auditors and has the power to mediate disagreements between management and the auditors regarding financial reporting.
Under our bylaws and internal regulations, our Fiscal Council is also responsible for evaluating the effectiveness of the procedures for the receipt, retention and treatment of any complaints related to accounting, controls and audit issues, as well as procedures for the confidential, anonymous submission of concerns regarding such matters.
Brazilian law requires the members of a fiscal council to meet certain eligibility requirements. A member of our Fiscal Council cannot (i) hold office as a member of the board of directors, fiscal council or advisory committee of any company that is a competitor of Vale or otherwise has a conflicting interest with Vale, unless compliance with this requirement is expressly waived by shareholder vote, (ii) be an employee or member of senior management or the Board of Directors of Vale or its subsidiaries or affiliates, or (iii) be a spouse or relative within the third degree by affinity or consanguinity of an officer or director of Vale.
We are subject to Rule 10A-3 under the Exchange Act, which requires, absent an exemption, that a listed company maintains a standing audit committee composed of members of the Board of Directors that meet specified requirements. In lieu of establishing an independent audit committee, we have given our Fiscal Council the necessary powers to qualify for the exemption set forth in Exchange Act Rule 10A-3(c)(3). We believe our Fiscal Council satisfies the independence and other requirements of Exchange Act Rule 10A-3 that would apply in the absence of our reliance on the exemption.
Our Board of Directors has determined that one of the members of our Fiscal Council, Mr. Aníbal Moreira dos Santos,Marcus Vinicius Dias Severini, is an audit committee financial expert. In addition, Mr. Moreira dos SantosMarcus Vinícius Dias Severini meets the applicable independence requirements for Fiscal Council membership under Brazilian law and the NYSE independence requirements that would apply to audit committee members in the absence of our reliance on the exemption set forth in Exchange Act Rule 10A-3(c)(3).
Members of the Fiscal Council are elected by our shareholders for one-year terms. The current members of the Fiscal Council and their respective alternates were elected on April 25, 2016.13, 2018. The terms of the members of the Fiscal Council expire at the next annual shareholders' meeting following election.
Two members of our Fiscal Council (and the respective alternates) may be elected by non-controlling shareholders: one member may be appointed by the holders of our preferred shareholdersgolden shares and one member may be appointed by minority holders of common shares pursuant to applicable CVM rules.
The following table lists the current and alternate members of the Fiscal Council.
| Current member | | Year first elected | | Alternate | | Year first elected |
|---|---|---|---|---|---|---|
Paulo José dos Reis Souza(1) | | 2016 | | Paula Bicudo de Castro Magalhães(1) | | 2016 |
Raphael Manhães Martins(2) | | 2015 | | Julio Sergio de Souza Cardoso(2) | | 2016 |
Marcelo Amaral Moraes(3) | | 2004 | | Vacant(4) | | – |
Aníbal Moreira dos Santos(3) | | 2005 | | Oswaldo Mário Pêgo de Amorim Azevedo(3) | | 2004 |
Sandro Kohler Marcondes (3) | | 2016 | | Sergio Mamede Rosa do Nascimento (3) | | 2016 |
| Current member | | Year first elected | | Alternate | | Year first elected |
|---|---|---|---|---|---|---|
Marcelo Amaral Moraes | | 2004 | | Vacant(3) | | – |
Marcus Vinícius Dias Severini | | 2017 | | Vacant(4) | | – |
Eduardo Cesar Pasa | | 2017 | | Sergio Mamede Rosa do Nascimento | | 2016 |
Raphael Manhães Martins(1) | | 2015 | | Gaspar Carreira Junior(1) | | 2017 |
Daniel Rodrigues Alves(2) | | 2018 | | Rodrigo Toledo Cabral Cota(2) | | 2018 |
| | | | |
| | 143 | | |
Management
Below is a summary of the business experience, activities and areas of expertise of the members of our Fiscal Council.
Paulo José dos Reis Souza, 54 Member of Vale's Fiscal Council since April 2016.
Other current director or officer positions: Program Director of the Department of the Treasury since 2016.
Professional experience: Subsecretary of Fiscal Policy of the Department of the Treasury from 2015 to 2016; Program Director of the Department of the Treasury from 2011 to 2015; Member of the Fiscal Council of Petróleo Brasileiro S.A.—Petrobras from 2012 to 2016, and from January 2017 to April 2017; Member of the Fiscal Council of Banco do Brasil S.A. from 2012 to 2016; Member of the Fiscal Council of BR Distribuidora from 2008 to 2012; Member of the Fiscal Council of Indústrias Nucleares do Brasil S.A. from 2011 to 2012; and Member of the Fiscal Council of Serviço Federal de Processamento de Dados—SERPRO from 2015 to 2016.
Academic background: Degree in Business Administration from Centro Universitário UNA; Specialization in Public Policies and Corporate Governance from Escola Nacional de Administração Públicas—ENAP; and Master Degree in Public Sector Economy from Fundação Getúlio Vargas.
Raphael Manhães Martins, 34: Member of Vale's Fiscal Council since April 2015.
Other current director or officer positions: Member of the Board of Directors of Eternit S.A. since 2015; Member of the Fiscal Council of Light S.A. since 2014; and Attorney for Faoro Advogados since 2010.
Professional experience: Alternate Member of the Fiscal Council of Light S.A. from 2012 to 2013; Member of the Fiscal Council of Embratel Participações S.A. from September 2014 to December 2014.
Academic background: Degree in Law from Universidade Estadual do Rio de Janeiro.
Marcelo Amaral Moraes, 49:51: Member of Vale's Fiscal Council since April 2004.
Other current director or officer positions: President of the Fiscal Council of Aceco TI S.A. since 2016; and Member of the Board of Directors of Eternit S.A. since 2016.2016; and Member of the Board of Directors of CPFL Energia S.A. since April 2017.
Professional experience: Managing Director of Capital Dynamics Investimentos Ltda. from 2012 to 2015.
Academic background: Degree in Economicseconomics from Universidade Federal do Rio de Janeiro; MBA from COPPEAD at the Universidade Federal do Rio de Janeiro—COPPEAD;Janeiro; and Post-graduate Degree in Corporate Lawcorporate law and Arbitrationarbitration from Fundação Getúlio Vargas.
Aníbal Moreira dos SantosMarcus Vinícius Dias Severini, 78: Member of Vale's Fiscal Council since July 2005.
Professional experience: From 1998 until his retirement in 2003, Mr. Moreira dos Santos served as Executive Officer of several Caemi Mineração e Metalurgia S.A. subsidiaries, including Caemi Canada Inc., Caemi Canada Investments Inc., CMM Overseas, Ltd., Caemi International Holdings BV and Caemi International Investments NV, and as Chief Accounting Officer of Caemi Mineração e Metalurgia S.A. from 1983 to 2003. He also served as Member of the Fiscal Councils of Log-in S.A. from 2009 to 2014.
Academic background: Degree in Accounting from Fundação Getúlio Vargas.
Sandro Kohler Marcondes, 52:61: Member of Vale's Fiscal Council since April 2016.2017.
Other current director or officer positions: Chief FinancialMember of the Fiscal Council of BRF S.A. since April 2015 and member of Valia's Audit Committee since January 2019.
Professional experience: Controller of Vale from 1994 to 2015. Member of the Fiscal Council of Mills Estruturas e Serviços de Engenharia S.A. from April 2015 to April 2018.
Academic background: Degree in accounting sciences from UniverCidade; Graduate degree in electrical engineering from Universidade Federal Fluminense; and a specialized degree in economic engineering from UniSUAW.
Eduardo Cesar Pasa, 48: Member of Vale's Fiscal Council since April 2017.
Other current director or officer positions: Accounting Management Officer of NeoenergiaBanco do Brasil S.A. since 2016.April 2015; Member of the Deliberations Council of PREVI since 2010; Member of the Fiscal Council of Petrobras S.A. since April 2017; and Alternate Member of the Fiscal Council of Brasilprev Seguros e Previdência since March 2018.
Professional experience: Coordinator of Vale's Controlling Committee of Vale from 2014 to 2017; Member of the Fiscal Council of Centrais Elétricas Brasileiras S.A. (Eletrobras) from 2015 to 2017; Member of the Fiscal Council of Cateno Gestão de Contas de Pagamento S.A. from 2016 to 2017; General Accounting Manager of Banco do Brasil S.A. from 2009 to 2015; Member of the Fiscal Council of CASSI from 2010 to 2014; Alternate Member of the Fiscal Council of Banco Votorantim S.A. from 2009 to 2015; and Member of the Fiscal Council of BBTS-BB Tecnologia e Serviços from 2008 to 2015.
Academic background: Graduate degree in accounting sciences from Centro Universitário de Brasília—UniCeub; Post-graduate degree in accounting sciences from the Post-Graduate School of Economics at Fundação Getúlio Vargas; Master's Degree in accounting sciences from the School of Economics, Administration and Accounting of the Universidade de São Paulo.
Raphael Manhães Martins, 36: Member of Vale's Fiscal Council since April 2015.
Other current director or officer positions: Member of Vale'sthe Board of Directors of Eternit S.A. since April 2015; Attorney for Faoro Advogados since April 2010; Member of the Board of Directors of Condor S.A.
| | | | |
| | 144 | | |
Management
Indústria Química since May 2017; Member of the Board of Directors of Welser Itage Participações e Comércio S.A. since May 2017; and Member of the Board of Directors of Light S.A. since August 2018.
Professional experience: Attorney for Cr2 Empreendimentos from 2007 to 2011;2009; and Member of the Fiscal Council of Light S.A. from 2014 to 2018.
Academic background: Degree in law from Universidade Estadual do Rio de Janeiro.
Daniel Rodrigues Alves, 76: Member of Vale's Fiscal Council since April 2018.
Other current director or officer positions: Executive Assistant Secretary of the Brazilian Ministry of Finance since 2016; and Alternate Member of the Board of Directors of Valepar from 2009 to 2015; Executive Officer of Banco do BrasilBB MAPFRE SH1 Participações S.A. from 2005 to 2016; Alternate Member of the Board of Directors of Banco Patagônia S.A.since 2017.
Professional experience: Managing partner at Rodrigues Alves e Soares Duarte Advogados from 2011 to 2012; Member2014; Legal consultant at Empresa Gestora de Ativos—EMGEA, a state-owned company connected to the Brazilian Ministry of the Fiscal Council of PREVI—Caixa de Previdência dos Funcionários do Banco do Brasil S.A.Finance from 20122015 to 2014; Member of the Embraer S.A. Fiscal Council from 2014 to 2015; Member of the decision-making body of CASSI—Caixa de Assistência de Funcionários do Branco do Brasil S.A. from 2012 to 2013.2016.
Academic background: Degree in Business Administrationlaw from FaculdadeAssociação de FozEnsino Unificado do Iguaçu;Distrito Federal; and Master DegreeSpecialized degree in Business Administrationinternational law from the Fundação Getúlio Vargas.Vargas in Rio de Janeiro.
| | | | |
| | 145 | | |
Under our bylaws, our shareholders are responsible for establishing the aggregate compensation we pay to the members of our Board of Directors and our Board of Executive Officers, and the Board of Directors allocates the compensation among its members and the Board of Executive Officers.
Our shareholders determine this The Personnel Committee, composed of four members of the Board of Directors and one independent non-director, advises the Board of Directors on the distribution of the annual aggregate compensation at the general shareholders' meeting each year. In order to establish aggregate director and officer compensation, our shareholders usually take into account various factors, which range from attributes, experience and skills of our directors and executive officers to the recent performance of our operations. Once aggregate compensation is established, our Board of Directors is then responsible for distributing such aggregate compensation in compliance with our bylaws among the directors and executive officers. Theofficers and in setting and monitoring goals for the performance evaluation of the Executive Development Committee makes recommendationsBoard. SeeManagement and employees—Management—Advisory committees to the Board concerningof Directors.
As a global company, we require management with a deep knowledge of our business and market and unlimited dedication. Attracting and retaining talent, and engaging and motivating the annualprofessionals holding strategic positions, especially our executive officers, is critical for our success.
The compensation submitted by our Board of Directors for approval of our shareholders, and the distribution of the aggregate compensation among the members of our Board of Directors and our Board of Executive Officers, are based on benchmarking against the compensation policies and practices of the top global mining companies and other large global companies in other similar industries, and various other factors, such as the directors' and officers' responsibilities, time devoted to their duties, professional competence and reputation, market practices in the places where we operate, and the alignment of short- and long-term strategies, shareholder returns and the sustainability of the business.
One of the core principles for designing the compensation proposal is the alignment with our performance and return to our shareholders. The compensation package offered to our Board of Executive Officers, assuming the achievement of target average performance, is composed as follows: 27% fixed compensation, 27% short-term (performance target-based) variable compensation and 46% long-term (share-based incentives) variable compensation. The short-term variable compensation component is based on our cash generation, taking into account economic and financial targets that reflect operating performance, as well as health and safety targets, sustainability and accomplishment of strategic initiatives. Of the long-term variable portion, 20% of aggregate compensation is to be awarded under our Matching Program and 26% is to be awarded as Performance Shares Units (PSUs) under our phantom stock plan, for which payment is a direct function of our Total Shareholder Return (TSR) indicator's performance compared to a preselected group of comparable companies. As such, 73% of the executive officers. compensation package is at risk, and the mix offered can vary according to the performance achieved and the return to our shareholders (pay-for-performance) in each year
In additionJanuary 27, 2019, our Board of Directors determined the suspension of payments of all variable compensation to fixed compensation, our executive officers, are also eligiblefrom that date until the Board of Directors decides to revert such determination based on the outcome of the investigations into the causes of the failure of Dam I. We made a payment under the PSU program on January 15, 2019, prior to the failure of Dam I, which represents approximately 24% of the variable compensation initially contemplated for bonuses2019.
EXECUTIVE OFFICERS
As of December 31, 2018, we had six executive officers and incentive payments.
Executive officers
all of them held their positions for the full year of 2018. For the year ended December 31, 2016,2018, the amountaverage annual compensation paid to theour executive officers was US$4.06 million, the highest annual compensation paid to an executive officer was US$6.20 million and the lowest annual compensation was US$1.44 million. The average annual compensation corresponds to the total aggregate compensation paid to executive officers in 2018, not including amounts paid in 2018 for executive officers who left in prior years, divided by the number of current officers. Including payments made in 2018 for executive officers who left in prior years, the average annual compensation accrued forpaid to our executive officers was US$7.58 million.
| | | | |
| | 146 | | |
Management Compensation
For the year and payable at a later date,ended December 31, 2018, the total payments related to executive officers' compensation packages is set forth in the table below.
| | | For the year ended December 31, |
|---|---|---|
| | | (US$ million) |
| | |
In-kind benefits and pension plans | | 1.93 |
Variable compensation(1) | | |
| | | |
| | |
Severance | | |
| | | |
Total amount paid in 2018 to current and former executive officers | | 40.22 |
Social security contributions | | |
| ||
| | | |
Total expenditures related to executive officers' compensation packages | | |
Fixed compensation and in kindin-kind benefits include a base salary in cash, paid on a monthly basis, reimbursement for certain investments in private pension plans, health care, relocation expenses, life insurance, driver and car expenses.
Variable compensation consists of (i) an annual cash bonus, based on specific targets for each executive officer and on Vale's global cash generation, both approved by our Board of Directors, and (ii) payments tied to the performance of our shares under two programs, the Matching Program and the Performance Shares UnitsShare Unit (PSU). Program.
Under our Matching Program, our executive officers are permitted to purchase a certain number of preferredcommon shares or ADRs in the market within a purchase window through the plan administrator. At the end of a three-year cycle, participants are entitled to receive a reward equivalent to the same number of preferredcommon shares ofor ADRs held through the end of the cycle. Participants may sell or transfers its preferred shares or ADRs at any time during the vesting period, in which case they forfeit the right to any receive reward with respect to these preferred shares or ADRs. Participation in our Matching Program is mandatory for our Board of Executive Officers in the years in which we pay cash bonuses. Participants may sell or transfers their common shares or ADRs at any time during the vesting period, in which case they forfeit the right to receive any reward with respect to these common shares or ADRs. The Board of Executive Officers must observe the Securities Trading Policy in order to sell or transfer Matching Program shares. The 2019 cycle of our Matching Program to our executive officers is temporarily suspended since January 27, 2019, pending conclusion of investigations related to the failure of the Dam I and further resolution of the Board of Directors.
Under our PSU program,Program, our executive officers receive payments in cash tied to Vale's performance, as compared to a selected group of peermining companies, based on the total shareholder return (dividend or interest on equity payments and share appreciation) of the common shares of those companies during the vesting period. Starting in a2019, the PSU Programs will have three-year cliff vesting (instead of four-year scaled vesting) for each cycle. The 2019 cycle of our PSU Program to our executive officers is temporarily suspended since January 27, 2019, pending conclusion of investigations related to the failure of the Dam I and further resolution of the Board of Directors.
Pension, retirement or similar benefits consist of our contribution to Valia, the manager of pension plans sponsored by Vale.
Our severance packages for qualified terminations may comprise: (i) a lump-sum severance payment, corresponding to one-half the annual fixed compensation for executive officers and equal to the annual fixed compensation for the Chief Executive Officer, paid shortly after the termination date; (ii) non-compete agreement compensation corresponding to twice the annual fixed compensation, to be paid in eight equal quarterly installments after termination; (iii) pro-rated payment of any outstanding
| | | | |
| | 147 | | |
Management Compensation
long-term variable compensation grants (Matching and PSU Programs), paid shortly after the termination date; and (iv) pro-rated payment of any outstanding short-term incentive plan (bonus), to be paid in April following the termination date. Severance expenditures in 2018 were related to seven former executive officers who left the company in 2016, 2017 and 2018.
Social security contributions are mandatory contributions we are required to make to the Brazilian government for our executive officers.
Vale has also entered into indemnification agreements with its officers.
Table of ContentsBOARD OF DIRECTORS
As of December 31, 2018 our Board of Directors had 12 members and the monthly average number of members that received compensation during 2018 was 12.08. For the year ended December 31, 2018, the average annual compensation paid to the members of our Board of Directors was US$0.17 million, the highest annual compensation paid to a member of the Board of Directors was US$0.3 million and the lowest annual compensation was US$0.15 million.
In 2016,2018, we paid US$1.52.09 million in aggregate to the members of our Board of Directors for services in all capacities, all of which was fixed compensation. There are no pension, retirement or similar benefits for the members of our Board of Directors. On March 31, 2017,February 28, 2019, the total number of common shares owned by our directors and executive officers was 22,764, and the total number of preferred shares owned by our directors and executive officers was 2,011,050.1,009,690. None of our directors or executive officers beneficially owns 1% or more of any class of our shares. Vale has also entered into indemnification agreements with its directors.
FISCAL COUNCIL
As of December 31, 2018 our Fiscal Council had 5 members and the monthly average number of members that received compensation during 2018 was 5. For the year ended December 31, 2018, the average, the highest and the lowest annual compensation paid to a member of the Fiscal Council was US$ 0.11 million.
We paid an aggregate of US$0.510.56 million to members of the Fiscal Council in 2016.2018. In addition, the members of the Fiscal Council are reimbursed for travel expenses related to the performance of their functions.
Advisory committeesADVISORY COMMITTEES
We paid an aggregate of US$0.100.48 million to members of our permanent advisory committees in 2016. Under our bylaws,2018. Until May 2018, those members who arewere directors or officers of Vale arewere not entitled to additional compensation for participating on a committee. Since June 2018, directors who participate in advisory committees are entitled to receive, in addition to the compensation as a board member, compensation for participating in one or more committees limited to 50% of the amount of a directors' compensation. Members of our advisory committees are also reimbursed for travel expenses related to the performance of their duties.
| | | | |
| | 148 | | |
The following tables set forth the number of our employees by business and by location as of the dates indicated.
| | | As of December 31, | | As of December 31, | ||||||||
|---|---|---|---|---|---|---|---|---|---|---|---|---|
| By business: | | 2014 | | 2015 | | 2016 | | 2016 | | 2017(1) | | 2018 |
Ferrous minerals | | 46,832 | | 42,838 | | 42,579 | | 42,579 | | 42,734 | | 43,504 |
Coal | | 1,897 | | 1,608 | | 2,039 | | 2,039 | | 2,258 | | 2,350 |
Base metals | | 15,564 | | 15,554 | | 15,239 | | 15,239 | | 15,243 | | 14,349 |
Fertilizer nutrients(1) | | 6,773 | | 9,181 | | 8,935 | | 8,935 | | 8,055 | | 12 |
Energy(2) | | NA | | NA | | 4,058 | ||||||
Corporate activities | | 5,465 | | 4,917 | | 4,270 | | 4,270 | | 5,306 | | 5,997 |
| | | | | | | | | | | | | |
Total | | 76,531 | | 74,098 | | 73,062 | | 73,062 | | 73,596 | | 70,270 |
| | | | | | | | | | | | | | |
| | | | | | | | | | | | | |
| | | As of December 31, | ||||
|---|---|---|---|---|---|---|
| By location: | | 2016 | | 2017(1) | | 2018(1) |
South America | | 57,535 | | 58,457 | | 55,423 |
Brazil | | 56,576 | | 57,513 | | 55,230 |
North America | | 6,630 | | 6,432 | | 6,032 |
Europe | | 385 | | 375 | | 298 |
Asia | | 4,499 | | 4,571 | | 4,475 |
Oceania | | 1,521 | | 1,364 | | 1,378 |
Africa | | 2,492 | | 2,397 | | 2,664 |
| | | | | | | |
Total | | 73,062 | | 73,596 | | 70,270 |
| | | | | | | |
| | | | | | | |
| | | | | | | |
| | | As of December 31, | ||||
|---|---|---|---|---|---|---|
| By location: | | 2014 | | 2015 | | 2016 |
South America | | 60,903 | | 58,830 | | 57,535 |
North America | | 6,673 | | 6,773 | | 6,630 |
Europe | | 395 | | 385 | | 385 |
Asia | | 4,476 | | 4,516 | | 4,499 |
Oceania | | 1,706 | | 1,654 | | 1,521 |
Africa | | 2,378 | | 1,940 | | 2,492 |
| | | | | | | |
Total | | 76,531 | | 74,098 | | 73,062 |
| | | | | | | |
| | | | | | | |
| | | | | | | |
We negotiate wages and benefits with a large number of unions worldwide that represent our employees. We have collective agreements with unionized employees at our operations in Australia, Brazil, Canada, Indonesia, Malawi, Mozambique, New Caledonia, Oman Peru and the United Kingdom.
Wages and benefitsWAGES AND BENEFITS
Wages and benefits for Vale and its subsidiaries are generally established on a company-by-company basis. Our benefits policy is aligned with our attraction and retention strategy, in accordance with applicable laws and market practice in the countries where we operate. We provide an attractive and competitive benefits package ensuring health, well-being, protection and life quality. Among the main benefits offered are medical and dental assistance, life insurance, private pension plans and short-and long-term disability benefits.
We establish our wage and benefits programs for Vale S.A. and its subsidiaries, other than Vale Canada. In November 2016,2018, we reached a one-year agreement with the Brazilian unions providing for a salary increase of 8.5%6.0% beginning in November 2016.2018. The provisions of our collective bargaining agreements with unions also apply to our non-unionized employees.
Vale Canada also establishes wages and benefits for its unionized employees through collective bargaining agreements. In March 2016, Vale Newfoundland & Labrador Limited, a subsidiary ofNo collective bargaining took place in 2018, as no contracts expired within the year. On January 1, 2018, Vale Canada Limited, reachedimplemented a three-year agreement withflexible benefits program for employees represented by the technical and administrative union representingat our Sudbury operation; this plan was negotiated
| | | | |
| | 149 | | |
Employees
during the production and maintenance employees at the Voisey's Bay mine.collective bargaining process in 2017. For non-unionized employees, Vale Canada undertakes an annual review of salaries.salaries and benefits. We also provide our employees and their dependents with other benefits, including supplementary medical assistance.assistance, and in 2017 Vale Canada introduced a new flexible benefits plan for its non-union employees.
Pension plansPENSION PLANS
Brazilian employees of Vale and of most of its Brazilian subsidiaries are eligible to participate in pension plans managed by Valia.
Most of the participants in plans held by Valia are participants in a plan named "Vale Mais",Mais," which Valia implemented in 2000. This plan is primarily a defined contribution plan with a defined benefit feature relating to service prior to 2000 and another defined benefit feature to cover temporary or permanent disability, pension and financial protection to dependents in case of death. Valia also operates a defined benefit plan, closed to new participants since May 2000, with benefits based on years of service, salary and social security benefits. This plan covers retired participants and their beneficiaries, as well as a relatively small number of employees that declined to transfer from the old plan to the "Vale Mais" plan when it was established in May 2000.
Employees within our Base Metals operations principally in Canada and the United Kingdom, participate in defined benefit pension plans and defined contribution pension plans. AllThe defined benefit plans have been closed to new participants since 2009, and all new employees within our Base Metals operations participate in defined contribution pension plans. Employees in Japan and Taiwan participate in a defined benefit pension plan. Employees in other jurisdictions, including China, Indonesia, Malawi, Switzerland, the United States and Zambia,are eligible to participate in defined contribution pension plans.
Performance-based compensationPERFORMANCE-BASED COMPENSATION
All Vale parent-company employees may receive incentive compensation each year in an amount based on the performance of Vale, which can range from 0 to 200% of a market-based reference amount, depending on certain targets set, and the cash generation in each period. Similar incentive compensation arrangements are in place at our subsidiaries.
Qualifying management personnel are eligible to participate in the PSU and Matching programs. See description of these programs underManagement compensation—Executive officers.
| | | | |
| | 150 | | |
We and our subsidiaries are defendants in numerous legal actions in the ordinary course of business, including civil, administrative, tax, social security and labor proceedings. The most significant proceedings are discussed below. Except as otherwise noted below, the amounts claimed, and the amounts of our provisions for possible losses, are stated as of December 31, 2016.2018. See note 28 to our consolidated financial statements for further information.
LegalLEGAL PROCEEDINGS RELATED TO THE FAILURE OF DAM I
We are engaged in several investigations and legal proceedings relatedrelating to the failure of Samarco'sDam I. These proceedings are all in early stages, and we cannot reasonably estimate the range of loss or the timing for decisions. Other proceedings or investigations relating to the failure of Dam I are expected. Our potential liabilities resulting from the dam failure are significant, and additional provisions are expected.
a) Public civil actions brought by the State of Minas Gerais and state public prosecutors for damages resulting from the failure of Dam I
We are party to public civil actions brought by the State of Minas Gerais and state prosecutors before various state courts in Minas Gerais claiming economic and environmental damages resulting from the dam failure and a broad range of injunctions ordering Vale to take specific remediation and reparation actions.
In January 2019, immediately after the failure of Dam I, state courts in Minas Gerais granted orders freezing R$11.0 billion in cash in our bank accounts and requesting us to take a number of emergency and reparation measures in connection with the failure of Dam I. These orders were granted in response to preliminary injunctions filed by the State of Minas Gerais and state prosecutors in preparation for these public civil actions.
In one of these proceedings, on February 20, 2019, we entered into a preliminary agreement with the State of Minas Gerais, and certain other authorities that joined this proceeding, in order to expedite payment of monetary damages resulting from the failure of Dam I. Under this preliminary agreement, we agreed to advance indemnification payments to the affected people and independent technical consulting services to affected individuals and to reimburse or direct payment of the expenses incurred by the State of Minas Gerais.
In one of these public civil actions, the state prosecutors have requested that Vale be ordered to contribute significant amounts to a fund, to be created and managed by state prosecutors with the purpose of funding remediation and reparation measures.
b) Public civil actions brought by state prosecutors and other authorities regarding safety requirements at other dams
We are party to more than ten public civil actions in which public prosecutors and other authorities seek the suspension of operations, the imposition of restrictions on operations, or injunctions compelling us to implement safety measures at other existing tailings dams.
| | | | |
| | 151 | | |
Legal Proceedings
c) Public civil action brought by labor prosecutors
We are a party to a public civil action brought by labor prosecutors claiming, among other things, a pre-judgment attachment to secure the payment of monetary damages and costs including expert reports, wages, socio-economic relief, funeral expenses and other remediation measures to the workers affected by the failure of Dam I. The labor court in Belo Horizonte, Minas Gerais, granted pre-judgment attachments in the amount of R$1.6 billion million in cash in our bank accounts to secure the payment of damages and severance claims of employees affected by the closure of our operations in the Córrego do Feijão mine.
| | | | |
| | 152 | | |
Legal Proceedings
On February 15, 2019, we entered into a preliminary agreement with the labor prosecutors pursuant to which we agreed to indemnify our direct and indirect employees affected by the closure of Córrego do Feijão mine. Under the terms of the agreement, we agreed to maintain the jobs of our direct employees until December 31, 2019 and will assist third party employees with a replacement or pay their salaries until December 31, 2019. We also agreed to keep paying wages regularly to the missing people until the authorities have considered them as fatal victims of the event and will pay to the families of the fatal victims an amount equivalent to two thirds of their wages until December 31, 2019 or until we reach the final agreement with the labor prosecutors. We will also provide a lifelong medical insurance benefit to the spouses of the victims and a similar benefit to the dependents of the victims until they are 22 years old. Our initial estimate is that this agreement will result in a provision of approximately US$220 million in 2019.
d) Putative class actions in the United States
We and certain of our officers have been named defendants in civil class action suits, under U.S. federal securities laws, brought before federal courts in New York by holders of our securities. The plaintiffs allege that we made false and misleading statements or omitted to make disclosures concerning the risks of the operations of Dam I and the adequacy of the related programs and procedures. The plaintiffs have not specified an amount of alleged damages in these actions.
We believe that the claims have no merit, and we will contest them. However, given the preliminary status of the actions, it is not possible at this time to determine a range of outcomes or to make reliable estimates of the potential exposure.
e) Criminal investigations
The Minas Gerais state police, the Brazilian federal police and state and federal prosecutors are conducting criminal investigations in connection with the failure of Dam I. In connection with the investigation conducted by the state prosecutors, the 2nd criminal court in Brumadinho ordered the temporary arrest of certain employees of Vale and of a company that had provided testing and certification services to us. These individuals have been released from detention and are still being investigated. We cannot estimate the timing for conclusion of the investigations and do not have precise information on the potential crimes being investigated. We do not have information on the names of all the individuals targeted by the investigation.
f) Investigation by Brazilian legislative bodies
In March 2019, the Brazilian Senate initiated an investigation (Comissão Parlamentar de Inquérito, or "CPI") to determine the causes of and responsibilities for the failure of Dam I and to propose changes to the existing legal and regulatory regime applicable to the mining industry and other related matters. ln February 2019, the Brazilian House of Representatives created a commission to monitor tailings dams across the country, and to oversee the work of various public authorities in charge of monitoring such dams. In April 2019, the Brazilian House of Representatives announced that it will initiate a CPI, similar to the one conducted by the Senate. State and local legislative bodies have initiated other CPIs in response to the failure of Dam I, and other similar investigations and inquiries. These investigations may result in the approval of more stringent rules applicable to our business.
| | | | |
| | 153 | | |
Legal Proceedings
g) Other proceedings
We are a defendant in a number of private actions, before state and federal courts in the state of Minas Gerais, brought by individuals, business entities, associations, non-governmental organizations and other entities seeking remediation and compensation for environmental, property and personal damages resulting from the Dam I failure. These proceedings include requests for significant amounts in damages, injunctions, pre-judgment attachment of assets and seizure of our bank accounts. We are also engaged in several other investigations and proceedings claiming damages resulting from the dam failure. These actions and proceedings are in early stages, and we cannot reasonably estimate their impact. Other proceedings and investigations relating to the failure of the tailings dam in Minas GeraisBrumadinho are expected.
LEGAL PROCEEDINGS RELATED TO THE FAILURE OF SAMARCO'S TAILINGS DAM IN MINAS GERAIS
We are engaged in several legal proceedings relating to the failure of Samarco's tailings dam in the city of Mariana, in the state of Minas Gerais. We have notified our insurers of the dam failure event and related complaints. For further discussion of the principal legal proceedings in which we are engaged, seeInformation on the Company—Business overview—Failure of Samarco's tailings dam in Minas Gerais. Most of these proceedings are in early stages, and we cannot reasonably estimate the possible loss or range of lossesloss or the timing for a decision.
a) Putative class action in the United States
We and certain of our officers have been named as defendants in civil class action suits in federal court in New York brought by holders of our securities under U.S. federal securities laws. The plaintiffs allege that we made false and misleading statements or omitted to make disclosures concerning the risks and dangers of the operations of Samarco's Fundão dam and the adequacy of the related programs and procedures. The plaintiffs have not specified an amount of alleged damages in these actions.
In March 2016, the judge overseeing the securities class action issued an order consolidating these actions and designating lead plaintiffs and counsel. In July 2016, we filed a motion to dismiss the consolidated amended complaint. On March 23, 2017, the Judge issued a ruling dismissing a significant part of the claims against us and the individual defendants, and allowing the case to continue based on more limited claims. The claims that were not dismissed relate to certain statements contained in our 2013 and 2014 sustainability reports concerning risk mitigation plans, policies and procedures, and certain statements made in a conference call in November 2015 concerning our responsibility for the Fundão dam collapse.
We believe that the remaining claims have no merit, we will continue vigorously contesting this action. It is not possible to determine a range of outcomes or reliable estimates of the potential exposure at this time, and no provision has been recognized.
b) Public civil action filed by the Brazilian government and others and public civil action filed by the Federal Prosecution Office
In November 2015, the Brazilian federal government, the states of Minas Gerais and Espírito Santo, certain federal and state authorities and certain public entities collectively filed a public civil action before a federal courtthe 12th Federal Court in Belo Horizonte, state of Minas Gerais, against Samarco and its shareholders, Vale and BHPB. The plaintiffs claimed approximately R$20.2 billion in monetary damages and a number of measures to remediate the environmental damages caused by the Fundão dam failure. Certain claims brought by the plaintiffs refer to specific defendants individually, while other claims are directed at all defendants.
�� In December 2015, the federal court in Minas Gerais granted an injunction preventing Vale from selling or otherwise transferring its mining rights in Brazil. In November 2016, the federal court ordered that the defendants: (i) in 90 days, present evidence that the leakage of waste from Fundão tailing dam has been definitely contained; (ii) in six months, present conclusive studies, with the endorsement from the appropriate environmental agencies, regarding an action plan and the feasibility of the withdrawal of mud placed on the banks of Rio Doce river, its affluents and the areas near its estuary; (iii) in 30 days, make a deposit in the total amount of R$1.2 billion to secure future reparation measures. The court has provisionally suspended our obligation to make this R$1.2 billion cash deposit to the extent that we provide the guarantees required under the agreements with MPF described under item c) below.
In March 2016, we, together with Samarco and BHPB, entered into the Framework Agreementa framework agreement with the federal government, the state governments of Espírito Santo and Minas Gerais and certain other federal and state authorities. SeeBusiness overview—Failure of Samarco's tailings dam in Minas Gerais. In January 2017, Samarco, Vale and BHPB entered into two preliminary agreements withThe Framework Agreement has a 15-year term, renewable for successive one-year periods until all the MPF as described below. We expectobligations under the Framework Agreement have been performed. The Framework Agreement does not provide for admission of civil, criminal or administrative liability for the Fundão dam failure. The Framework Agreement provides that, within three years of the date of the agreement, the parties would review its terms to assessing the effectiveness of the ongoing remediation and the agreements with the MPF to be a first step towards the settlement of these actions. Any settlement of these actions is subject to approval by the court.compensation activities.
c) Public civil action filed by Federal Prosecution Office
In May 2016, the Federal Prosecution Office (MPF)MPF filed a public civil action before the 12th Federal Court in Belo Horizonte against Samarco, Vale, BHPB, BNDES and the governmental authorities that are parties to the Framework Agreement. In July 2016, the court excluded all the governmental authorities and BNDES as defendants in this proceeding. In this action, the MPF requested that the court order a broad range of specific actions to be taken by the various parties. The MPF also stated in its complaint that the required remedial measures would have a total value of R$155 billion, based on a comparison with the costs of the Deepwater Horizon oil spill in the Gulf of Mexico in 2010.
In this public civil action, the The MPF claims monetary damages from the defendants on a joint and several basis as well asalso claimed other forms of relief, including injunctions (i) ordering the defendants to implement several measures to mitigate or remediate social, economic and environmental impacts arising from the collapsefailure of the Fundão dam, as well as other emergency measures; (ii) preventing the defendants from encumbering or disposing of their assets; (iii) preventing the defendants from paying dividends; (iv) ordering the defendants to deposit R$7.7 billion into a fund, managed by the defendants, for implementation of social, environmental and emergency programs; (v) ordering the defendants to provide collateral in the amount of R$155 billion to secure their compliance with the final court decision; (vi) ordering the defendants to maintain working capital in the amount of R$2 billion initially, and thereafter in an amount equal to 100% of the expenses of the
| | | | |
| | 154 | | |
Legal Proceedings
remediation and compensation measures projected for the subsequent twelve months; and (vii) ordering BNDES to take actions under its credit agreements with the defendants, including cessation of further drawings and acceleration of outstanding principal. A preliminary hearing for conciliation was held in September 2016.
In January 2017,June 2018, Vale, Samarco, ValeBHPB and BHPBthe offices of the federal and state (Minas Gerais and Espírito Santo) prosecutors, public defenders and attorneys general, among other parties entered into two preliminary agreements witha comprehensive agreement to improve the Federal Prosecution Office relatinggovernance mechanism of Fundação Renova and establish a process for potential revisions to thisthe remediation programs provided under the Framework Agreement based on the findings of experts hired by Samarco to advise the MPF over a two-year period (the June 2018 Agreement). The June 2018 Agreement terminated certain lawsuits, including public civil action and the public civil action broughtactions filed by the Brazilian federal government and others. SeeBusiness overview—Failurethe states of Samarco's tailings damMinas Gerais and Espírito Santo. It also contemplates the future termination of other public civil actions upon agreement over the remediation programs under experts' review, and confirmed the collateral provided by the parties to secure the payment of remediation measures in Minas Gerais. The preliminary agreement was partially ratified, pending the appointmentamount of an expert and conclusion of the final agreement. R$2.2 billion.
We expect the Framework Agreement and the agreements withJune 2018 Agreement to represent the MPF to be a first step towardssteps for the settlement of the public civil action brought by the Brazilian government and others, the public civil action brought by MPF and other related proceedings.
d)b) Criminal proceeding
In October 2016, the MPF filed criminal charges before the federal court of Ponte Nova, state of Minas Gerais, against Samarco, Vale, BHPB and a number of individuals who were employees of Samarco or members of Samarco's governance bodies or advisory committees. The charges include murder, physical injury and various environmental crimes due to the failure of Samarco's Fundão dam.
Together with the indictment, the MPF is seeking a pre-judgment attachment order to seize assets from the three companies to secure the payment of the R$20 billion claimed in connection with the failure of Fundão dam and is also seeking the imposition of external monitoring of the companies' ethical and social-environmental matters practices for 10 years.
A decision is pending on the requests for injunctions against the defendants. The criminal charges were accepted by the judge in November 2016, which initiated2016. The criminal proceedings is subject to challenge in separate proceedings in federal courts. We are not able to anticipate when a judgment will be issued or when the judge will correct the criminal proceeding. process in accordance with the decision of the federal court.
c) Class actions in the United States
We and certain of our officers have been named as defendants in civil class action suits in federal courts in New York brought by holders of our securities and by holders of Samarco's bonds, each under U.S. federal securities laws. The plaintiffs allege that we made false and misleading statements or omitted to make disclosures concerning the risks of the operations of Samarco's Fundão dam and the adequacy of the related programs and procedures. The plaintiffs have not specified an amount of alleged damages in these actions.
We believe that the claims have no merit, and we will continue contesting them. However, given the preliminary status of the actions, it is not possible to determine a range of outcomes or reliable estimates of the potential exposure at this time, and no provision has been recognized so far.
c.1) Related to Vale's American Depositary Receipts
Vale and certain of its officers were named as defendants in a securities class action in the U.S. Federal Court for the Southern District of New York brought by holders of Vale's ADRs under U.S. federal securities laws.
| | | | |
| | 155 | | |
Legal Proceedings
In March 2017, the judge issued a ruling dismissing a significant part of the claims against us and the individual defendants, and allowing the case to continue based on more limited claims. The claims that were not dismissed relate to certain statements contained in our 2013 sustainability report concerning risk mitigation plans, policies and procedures, and certain statements made in a conference call in November 2015 concerning Samarco. This lawsuit is currently in the discovery phase.
c.2) Related to Samarco's bonds
Vale, together with Samarco and BHPB, was named as defendant in class action alleging violations of U.S. federal securities laws brought by holders of bonds issued by Samarco in the U.S. Federal Court for the Southern District of New York. The defendants filed a joint motion to dismiss the complaint, and a decision on this motion is still pending. Discovery will not commence until after the court rules on the defendants' pending motion to dismiss.
d) Tax proceeding
In September 2018, the federal tax authorities filed a request before the 27th federal court in Belo Horizonte for an order seizing Vale's assets to secure the payment of federal tax debts of the joint venture, in the amount of approximately R$10 billion. The court initially granted an order to freeze assets of Vale, but this decision was reversed, in all material respects, because these tax debts are currently suspended under Brazilian law. We were served in January 2019 and have submitted our initial defense in March 2017.immediately thereafter. We are vigorously contesting this action.
e) Other proceedings
Vale is a defendant in several public civil actions brought by state prosecutors of Minas Gerais and Espírito Santo, other authorities or civil associations claiming environmental damages as a result of the failure of Samarco's dam. The relief claimed in these proceedings are generally similar to the claims brought in the public civil action brought by the Brazilian government and others and the public civil action brought by the MPF. In 2017, The Superior Court of Justice (STJ) decided that the 12th Federal Court in Belo Horizonte is the competent court to rule on all these public civil actions. All these public civil actions have been suspended while we negotiate an agreement with the MPF, as discussed in item a) above.
Vale has been named as a defendant in a number of private actions, before different state and federal courts in the states of Minas Gerais and Espírito Santo, brought by individuals, business entities, municipalities and other actionsentities seeking remediation and compensation for environmental, property and personal damages resulting from the Fundão dam failure, including several other public civil actions brought by state prosecutors of Minas Gerais and Espírito Santo and other authorities and civil associations. The claims in these proceedings are generally similar to the claims in the public civil action brought by the Brazilian government and others, the public civil action brought by the MPF and the criminal proceedings described above.failure. These other proceedings include requests for significant amounts in damages, injunctions, pre-judgment attachment of assets and seizure of our bank accounts. Other proceedingsVale has settled part of these suits, and investigations in connection with the dam failure are expected.
In March 2017, certain holders of debt securities issued by Samarco, who are plaintiffscontinues to defend itself in a securities class action against Samarco arising outnumber of the failure of the Fundão dam before the Southern District of New York, filed an amended complaint adding Vale and BHPB as defendants in this proceeding. The plaintiffs are seeking damages for alleged violations of securities laws and other claims in connection with the purchase and sale of debt securities issued by Samarco. We will vigorously contest this action, which we believe to be without merit.
Table of Contentsthese proceedings.
Samarco is engaged in several other investigations and proceedings claiming damages resulting from the dam failure. Immediately after the dam failure, the environmental authority of the state of Minas Gerais and the DNPM an agency of(currently, the Ministry of Mines and Energy of the Brazilian government,ANM) commenced an investigation into the causes of the dam failure, and determinedordered the suspension of Samarco's operations pending the conclusion of these investigations.
Tubarão port litigationTUBARÃO PORT LITIGATION
In January 2016, as part of an environmental investigation conducted by the Brazilian federal police, a federal court in the Brazilian state of Espírito Santo ordered the suspension of our activities in the Pier II and the coal
| | | | |
| | 156 | | |
Legal Proceedings
pier of the Tubarão Port,port due to potential environmental damages resulting from the release of iron ore in the sea area around the Pier II and the coal pier.piers. Our operations in the Pier II and the coal pier of the Tubarão Portport were suspended for four days, until the Federal Court of Appeals ("TRF") of the Second Region (Tribunal Regional Federal da Segunda Região) suspended the effects of the injunction. The TRF granted us 60 days to implement certain measures to monitor, control and mitigate the release of iron ore in the terminal. This 60-day period expired on March 25, 2016, and we believe that we are in compliance with the requirements imposed by the TRF. In July 4, 2016, the TRF confirmed the suspension of the effects of the injunction and ordered an expert investigation to confirm that we havehad properly implemented the measures to monitor, control and mitigate the release of iron ore in the terminal.
This expert investigation commenced in 2018 and the expert appointed by the court submitted its report in March 2019. Vale and the federal prosecutors will submit their comments on the expert report in April 2019. As parta result of this proceeding, we may be required to suspend our activities in the Tubarão port or to implement additional measures to prevent or mitigate the release of iron ore in the sea. The environmental investigation is still ongoing. Depending on the outcome of this investigation,
In September 2017, the federal police orconcluded its environmental investigation and recommended that the MPF press charges against us for environmental crimes resulting from the release of iron ore in the sea around the Tubarão port. In June 2018, the MPF requested that the federal police reopen and continued the investigation. In September 2018, we entered into a settlement agreement with the MPF, state prosecutors and the environmental and water authority of the state of Espírito Santo (IEMA), pursuant to which we agreed to take additional measures to control emissions and to implement certain measures recommended by the environmental agency of the state of Sao Paulo (CETESB). The estimated investments required to comply with these measures are approximately R$1.27 billion. As part of this settlement, the MPF requested the suspension of the police investigation and the preliminary injunction. The federal court requested an opinion from the Attorney General in order to confirm such request. In the event that the Attorney General does not approve the request to ratify our settlement agreement, the federal prosecutors may bringseek other legal proceedingsactions against us, in the future and may seek injunctions to suspend theincluding requests for suspension of our activities ofin the Tubarão port.
Onça Puma litigation
In 2009,port, or press charges for environmental crimes. We will vigorously contest any action against us resulting from the federal prosecutorpolice's investigation.
ONÇA PUMA LITIGATION
In 2012, the MPF brought a public civil action against Vale and the Brazilian state of Pará, seeking the suspension of our nickel operations in Onça Puma, in the state of Pará, due to the alleged impact on the Xikrin do Cateté and Kayapó indigenous communities located close to the mining site. The federal prosecutor contendsprosecutors contend that (i) our operations would be contaminating the water of the Catete River, which crosses the communities, (ii) we have failed to comply with certain conditions under our environmental licenses, and (iii) the state of Pará should not have granted environmental license to this operation.
In 2015,November 2018, the federal courtTRF of the First Region (Tribunal Regional Federal da Primeira Região) affirmed the decision to suspend our nickel mining operations at Onça Puma until the conclusion of a number of expert evaluations of the impact of our activities in the cityCatete River and the surrounding communities. The court also ordered us to make a monthly payment to each member of Redenção, state of Pará granted an injunction suspending our nickel operations in Onça Pumathe Xikrin and ordering the payment of a cash compensationKayapó tribes to compensate the affected indigenous communities. In response to our appeal, the Supreme Court suspended the injunction, and granted us 120 days to implement certain monitoring and other mitigating measures and to comply with certain requirements of our environmental license. Although we have taken all the possible steps for implementation, we were unable to conclude the implementation of these measures because the indigenous communities refused to grant us access to their lands, as determined by court.
A final decision from the Supreme Court with respect to the injunction for suspension of operationsOur mining activities in Onça Puma followinghave been suspended since September 2017, when the impossibility to implement the monitoring and mitigating measures, is still pending. In September 2016,court first granted an injunction in favor of the federal court issued a preliminary injunction determining the payment of R$17 million to the indigenous people and ordering us to pay the amount of R$1 million per month for each of Xikrin do Cateté land involved. prosecutor.
We have appealed this decision, but a decision on our appeal is still pending and we cannot anticipate when our mining activities in Onça Puma will resume. We believe that the MPF's claims have no merit. Three expert reports indicate that our activities do not cause harm to the Catete River and the Supreme Court issued a preliminary decision suspending these paymentssurrounding indigenous communities, and two additional expert evaluations are pending. We will continue to the indigenous people. We are vigorously contestingcontest this action, which we believe to be without merit.action.
| | | | |
| | 157 | | |
Itabira suitsLegal Proceedings
PUBLIC CIVIL ACTION SEEKING SUSPENSION OF S11D MINE
In May 2016, associations representing the indigenous community of Xikrin do Cateté brought a public civil action against Vale, the Federal Environmental Agency (IBAMA), the Federal Indigenous Agency (FUNAI) and the National Bank of Economic and Social Development (BNDES), seeking the suspension of the environmental permitting process of our S11D mine. The associations contend that FUNAI and IBAMA have failed to conduct the appropriate studies regarding the affected indigenous communities during the environmental permitting process, and consequently that the indigenous groups affected by this mine have not provided the required consent. The plaintiffs also requested a monthly payment of R$2 million for each association until the defendants conclude the studies.
Applicable law provides for mandatory consultation with the indigenous communities located within ten kilometers of the mine, and these indigenous communities are located more than 12 kilometers away from the mine. We have submitted our preliminary defense, and in January 2017 the court denied plaintiffs' request for an injunction suspending our S11D mine.
In July 2017, the judge of the Federal Court of Marabá partially modified the previous decision and ordered that we prepare a study of the impacts of the S11D operation on the Xikrin tribe within 180 days. Vale submitted a work plan for the study to FUNAI and the plan was approved. The court then ordered us to present the work plan to the indigenous community and we are awaiting approval to continue with its preparation.
This decision does not affect our operations in S11D. We appealed this decision and will continue to vigorously contest this action.
PUBLIC CIVIL ACTION SEEKING SUSPENSION OF SALOBO MINE
In July 2018, associations representing the indigenous community of Xikrin do Cateté brought a public civil action against Vale, the Federal Environmental Agency (IBAMA) and the Federal Indigenous Agency (FUNAI), seeking the suspension of the environmental permitting process of Salobo Mine. The associations contend that FUNAI and IBAMA have failed to conduct the appropriate studies regarding the affected indigenous communities during the environmental permitting process and contends that our operations would be contaminating the water of the Itacaiúnas River and consequently that the indigenous groups affected by this mine have not provided the required consent. The plaintiffs also requested a monthly payment of R$2 million for each association until the defendants conclude the studies.
Applicable law provides for mandatory consultation with the indigenous communities located within ten kilometers of the mine, and these indigenous communities are located more than 22 kilometers away from the mine. In October 2017 the court denied plaintiffs' request for an injunction suspending our Salobo Mine.
In February 2019, Vale, IBAMA, and the environmental agency Instituto Chico Mendes de Conservação da Biodiversidade (ICMBio) filed a joint answer in court, rebutting the plaintiff's claims, and reaffirming the legality of the environmental permitting process of Salobo Mine and the fulfillment of all conditions imposed by relevant authorities. In March 2019, the MPF presented an opinion for the suspension of the activities in the Salobo Mine. A decision by the federal court is pending.
| | | | |
| | 158 | | |
Legal Proceedings
ITABIRA SUITS
We are a defendant in two separate actions brought by the municipality of Itabira, in the Brazilian state of Minas Gerais. In the first action, filed in August 1996, the municipality of Itabira alleges that our Itabira iron ore mining operations have caused environmental and social harm, and claims damages with respect to the alleged environmental degradation of the site of one of our mines, as well as the immediate restoration of the affected ecological complex and the performance of compensatory environmental programs in the region. The damages sought, as adjusted from the date of the claim, amount to approximately R$4.7026.379 billion. An expert report favorable to Vale has been issued, but the court granted the municipality's request for additional expert evidence. The elaborationpreparation of this additional expert evidence is pending. Both parties agreed to suspend the action until the presentation of an expert report, and to reconvene to discuss a potential settlement after such expert report is presented.
In the second action, filed in September 1996, the municipality of Itabira claims the right to be reimbursed for expenses it has incurred in connection with public services rendered as a consequence of our mining activities. The damages sought, as adjusted from the date of the claim, amount to approximately R$5.4406.7 billion. This proceeding was suspended for a settlement negotiation, but has resumed its normal course as the parties have not reached an agreement, and the evidence production phase will follow. We believe these suits are without merits and will continue to vigorously contest them.
Public civil action seeking suspension of S11D projectMINISTRY OF LABOR PROCEEDING
In May 2016, associations representing the indigenous Xikrin do Cateté people brought a public civil action against Vale, the Federal Environmental Agency (IBAMA), the Federal Indigenous Agency (FUNAI) and the National Bank of Economic and Social Development (BNDES), seeking the suspension of the environmental permitting procedure of our S11D project. The associations contend that FUNAI and IBAMA have failed to conduct the appropriate studies regarding the indigenous people during the environmental permitting procedure, and that the indigenous groups consequently did not provide a required consent. They also requested a monthly payment of R$2 million for each association until the defendants conclude the studies.
We will take all necessary steps to defend our rights in this public civil action. Applicable legislation provides for mandatory consultation of indigenous communities located within ten kilometers of the project, and these indigenous communities are located more than 12 kilometers away from the project. We have submitted our preliminary defense, and in January 2017 the court denied plaintiffs' request for an injunction suspending our S11D project. This decision is subject to appeal.
Environmental proceedings involving Jangada and Feijão mines
In June 2016, the environmental authority of the Brazilian state of Minas Gerais ordered the suspension of part of our Jangada and Feijão mines in the Southern System, in order to protect caves located near these mines, under Brazilian legislation for the protection of caves. We have obtained an injunction from the state courts of Minas Gerais suspending the order of the environmental authority, and the environmental authority has appealed. In the event that the injunction is overturned or revoked, we may be required to suspend approximately 50% of our operations at the affected mines, with potential consequences for production volumes, costs or reserves in our iron ore business. Our total production in the mines of Jangada and Feijão in 2016 was 0.3 million metric tons and 8.3 million metric tons, respectively.
Ministry of Labor proceeding
In February 2015, following an inspection in the facilities of a company that provided transportation services to us between our mines Mina do Pico and Mina de Fábrica in the state of Minas Gerais, the Ministry of Labor determined that this transportation company had failed to comply with certain obligations relating to health, safety, overtime and other labor matters. By adopting a broad interpretation of the law, the Ministry of Labor concluded that its employees were working in conditions similar to slavery. Upon learning of the findings, we promptly remediated the problems and we eventually terminated the agreement with the transportation company. Nevertheless, the Ministry of Labor made findingscommenced two administrative proceedings against us. We submitted our defense at the administrative level, which was rejected. In June 2016, we commenced judicial proceedings challenging the administrative findingsus, one alleging illegal outsourcing and seeking a rulinganother alleging that the Ministry of Labor may not classify us as engagingillegally outsourced employees were working in practicesconditions similar to slavery. In December 2018, the regional labor court upheld Vale's annulment action and confirmed that the outsourcing of the transportation services in this case was lawful. However, in March 2019 the courts confirmed administrative decision that determined that we had employees in conditions similar to slavery. We appealed this decision and will continue to vigorously contest this action.
CFEM-related proceedingsTAX PROCEEDINGS
a) CFEM-related proceedings
We are engaged in numerous administrative and judicial proceedings related to the mining royalty known as the CFEM. For more information about CFEM, seeInformation on the Company—Regulatory matters—Royalties and other taxes on mining activities. These proceedings arise out of a large number of assessments by the DNPM.DNPM (currently, the ANM). The proceedings concern different interpretations of DNPM'sthe agency's method of estimating sales, the statute of limitations, due process of law, payment of royalties on pellet sales and CFEM charges on the revenues generated by our subsidiaries abroad. The aggregate amount claimed in the pending assessments is approximately R$6.2787.6 billion, including interest and penalties through December 31, 2016.2018.
| | | | |
| | 159 | | |
Legal Proceedings
We are contesting DNPM'sthese claims using the available avenues under Brazilian law, beginning with challenges in administrative tribunals and proceeding with challenges in the judicial courts. We have received some favorable and unfavorable decisions, and we cannot predict the amount of time required before final judicial resolutions.
DNPM'sThe agency's assessments initially covered a period of up to 20 years before their issuances, based on the interpretation that the applicable statute of limitation for CFEM claims would be 20 years. We challenged all the assessments contending that these claims are subject to a 5-year statute of limitation. In December 2015, the Attorney General's Office issued a legal opinion concluding that CFEM claims are subject to a 10-year statute of limitations. This conclusion is consistent with recentthe decisions of the Superior Court of Justice ("STJ"), and we expect that the DNPMANM and the courts will revise all the assessments to exclude charges that are time barred under this legal opinion.
b) ICMS tax assessments and legal proceedings
We are engaged in several administrative and court proceedings relating to additional charges of value-added tax on services and circulation of goods (ICMS) by the tax authorities of different Brazilian states. In each of these proceedings, the tax authorities claim that (i) certain credits we have deducted from our payments of ICMS were not deductible anddeductible; (ii) we have failed to comply with certain accessory obligations; (iii) we are required to pay the ICMS on electricity purchases and (iv) we are required to pay ICMS in connection with goods that we bring into the State of Pará. We have determinedestimate our possible losses resulting from these proceedings in R$3.049 billion.
The tax authorities of the State of Minas Gerais contend that we should have a possible losspaid ICMS in proceedings involving a total estimatedrelation to the costs of transportation of iron ore, but we understand that ICMS is not applicable to this activity because the ore was transported directly by us. The judicial court has definitively decided in our favor with respect to tax assessments covering activities in 2009 and 2010 in an aggregate amount of R$4.4 billion.632 million. With respect to activities in 2011, 2012 and 2013, the amount in dispute is R$959 million (included in the possible losses mentioned above). We also expect a favorable outcome in this case.
In connection with a legal proceeding relating to ICMS, prosecutors in the state of Rio de Janeiro are seeking criminal charges against members of management of our subsidiary MBR, alleging tax fraud. The amount involveddefense has presented its case in the underlying tax proceeding is small (approximately R$7 million), but if these charges are accepted by the court, a criminal proceeding against these individuals will be started.and a decision is pending. The case has been extinguished for one of the members of management of our subsidiary MBR, but remains pending for the others. We believe that these allegations are without merit.
In addition to the tax assessments described above, the tax authorities of Pará has issued tax assessments asserting that the calculation of ICMS should be based on the market value of the iron ore transported, as opposed to the cost of production of the ore, which we have used to calculate the ICMS owed in years past. We are engaged in two judicial proceedings challenging these tax assessments, one of which covers the years 2007, 2008 and 2009, in an aggregate amount of R$1.08 billion, and the other covering the years 2010, 2011 and 2012, in an aggregate amount of R$1.07 billion, as of December 2016. We have provided a bank guarantee in the full amount in dispute to suspend the collection proceeding while our judicial challenge is pending, as required by Brazilian law. The state attorney of Pará has issued an opinion in our favor, and we are waiting for a decision of the tax authorities, and we have determined that the possibility of a loss in connection with these proceedings is remote.
Also, the tax authorities of the State of Minas Gerais contend that Vale should also have paid ICMS in relation to the transportation of the iron ore, but in the Company's point of view such taxation is not applicable because the ore was transported directly by Vale. The court decided in our favor with respect to the tax assessment covering the years of 2009 and 2010, in an aggregate amount of R$566 million. The discussion remains in relation to the years of 2011, 2012 and 2013, in the aggregate amount of R$855 million, and we also expect a favorable outcome.
c) Litigation on Brazilian taxation of foreign subsidiaries
We are engaged in legal proceedings concerning the contention of the Brazilian federal tax authority (Receita Federal) that we should pay Brazilian corporate income tax and social security contributions on the net income of our non-Brazilian subsidiaries and affiliates. The position of the tax authority is based on Article 74 of Brazilian Provisional Measure 2,158-34/2001 ("Article 74"), a tax regulation issued in 2001.
In 2013, we significantly reduced the amount in dispute by participating in the REFIS, a federal tax settlement program for payment of amounts relating to Brazilian corporate income tax and social contribution. We settled the claims related to the net income of our non-Brazilian subsidiaries and affiliates from 2003 to 2012, and we continue to dispute the assessments with respect to 1996 to 2002. Under the REFIS, we paid US$2.6R$5.9 billion in 2013, and we agreed to pay the remaining US$7.0R$16.3 billion in monthly installments, bearing interest at the SELIC rate. SELIC is a variable interest rate, established by the Brazilian central bank, used to update federal tax obligations in Brazil. On December, 31, 2018, the SELIC rate was 6.5% per annum (as compared to 7.0% per annum on December 31, 2017). As of December 31, 2016,2018, the remaining balance was US$5.419R$16.4 billion, to be paid in 142118 further installments.
| | | | |
| | 160 | | |
Legal Proceedings
We had initiated a direct legal proceeding (mandado de segurança) in 2003 challenging the tax authority's position. In December 2013, as required by the REFIS statute, we waived the legal arguments with respect to the period between 2003 and 2012.
We are continuing our direct legal proceeding with respect to the years not included in the REFIS. TheAt December 31, 2018, the total amount in dispute for the period between 1996 and 2002 iswas R$2.1792.3 billion. In 2014, the Superior Court of Justice (STJ) ruled in our favor on certain of our arguments against those assessments. In particular, the STJ ruled that: (a) Article 74 violates certain provisions under the international treaties against double taxation between Brazil and the countries where some of our subsidiaries are based, so profits realized by Vale's subsidiaries in those jurisdictions are not taxable in Brazil under Article 74; and (b) it is illegal to charge income tax and social contribution tax on our interest in the profits of affiliates that we account for under the equity method. The STJ also ruled that the profits realized by Vale's subsidiaries in the Bermuda are subject to taxation in Brazil under Article 74. The tax authorities filed an appeal before the Federal Supreme Court and a decision is pending.
d) Assessments and legal proceedings related to PIS/COFINS assessments
Between 2011 and 2016, weWe have received several tax assessments from the Brazilian federal tax authority contending that we incorrectly claimed PIS and COFINS tax credits for the period between 2004 and 2011.credits. PIS and COFINS are taxes imposed by the Brazilian government on our gross revenues, which may be partially offset by credits resulting from PIS and COFINS payments made by our suppliers. The tax authorities claim that (i) some credits we have deducted from our payments of PIS and COFINS were not deductible and (ii) we have not submitted adequate evidence of certain other credits. We are contesting these assessments in the administrative level.and judicial levels. The total amount of these tax assessmentsin dispute is R$3.2 billion.4.2 billion as of December 31, 2018, including disputes involving Vale's subsidiaries and divested companies for which we remain liable for taxes prior to divestment.
e) Income tax assessmentslitigation
In 2004, a decision of the Brazilian Superior Court of Justice (STJ) granted us the right to deduct the amounts we pay as social security contributions on the net income (CSLL) from our taxable income. The total CSLL deducted from our taxable income between 2003 and 2018 was R$7.7 billion. In 2006, the Brazilian federal tax authorities commenced a rescission action (ação rescisória) against us, seeking the reversal of the 2004 decision. The rescission action was rejected by the federal court in Rio de Janeiro and by the Federal Court of Appeals (TRF) of the Second Region (TRF2).Region. The tax authorities have appealed to the Superior Court of Justice (STJ) and to the Supreme Court (STF)., and the STJ determined that the TRF had not properly considered one of the questions raised by the federal government, and remanded the case for further decision of the TRF. If the courts decide for rescission of the 2004 decision, we will no longer be able to deduct the CSLL from our future taxable income, and the decision will determine whether or not we will be required to supplement the income tax payments we made between 2003made.
f) Fines on the undue deduction of tax credits
We have received multiple assessments from the Brazilian federal tax authority imposing fines due to allegedly undue deduction of tax credits from our payments of income tax and 2016.contributions on the net income (CSLL).
In these cases, the tax authority challenged our right to set off certain tax credits and issued assessments imposing fines in the amount of 50% of the amount that was unduly deducted. As of December 31, 2016,2018, the total CSLL deductedamount of fines imposed under these assessments were R$1 billion, and new assessments are expected. We are challenging these assessments in administrative proceedings. These assessments cover only the fines resulting from our taxable income between 2003the allegedly undue deductions, as the principal amount of unpaid taxes, interest and 2016 was R$6.414 billion.other penalties for late payment are being discussed in separate administrative proceedings. If we succeed in these separate administrative proceedings, the corresponding fines are expected to be cancelled. The legal grounds for these fines are currently being discussed by another company before the Federal Supreme Court (STF), and a favorable decision to this other company will applicable to other taxpayers, including us.
| | | | |
| | 161 | | |
Legal Proceedings
UPDATES ON OTHER PROCEEDINGS
Railway litigation
In 1994,As reported in our annual report on form 20-F for prior years, we were a party to our privatization, we entered into a contract withlegal proceedings against Rede Ferroviária Federal S.A. ("RFFSA"), the Brazilian federal rail network, relating to contracts to build two railway networks in the city of Belo Horizonte, Brazil, which were to be incorporated into an existing railway segment, in a project called "Transposição de Belo Horizonte." We subsequently entered into a related agreement with the Brazilian government to begin the construction of an alternative railway segment, because the initially agreed segments could not be built. In August 2006, RFFSA (now succeeded as defendant by the Brazilian government) filed a breach of contract claim against us stemming from the 1994 contract regarding the construction of two railway networks.
Before the RFFSA lawsuit was filed, we filed a claim against RFFSA challenging the inflation adjustment provisions in the contract with RFFSA. We contend that the method of calculation employed by the Brazilian government is not lawful under Brazilian law. Pursuant to a partial settlement of the original RFFSA lawsuit, if the claim is decided in the Brazilian government's favor, then the construction costs of the new railway segment assumed by Vale will offset the damages due from Vale under such claim, representing a significant reduction in the amount we would be required to pay.
Horizonte. In June 2012, a federal court rejected both the federal judge rejected both RFFSA'sgovernment's (as successor to RFFSA) claims against us and our contractual claim against RFFSA. All the appeals against these decisions have been rejected, and in March 2019 the courts certified that decisions are final and unappealable.
We are a party to certain other proceedings reported on our annual report on form 20-F for reviewprior years, including (i) a proceeding in which the environmental authority of the inflation adjustment provisions. On February 24, 2016,Brazilian state of Minas Gerais seeks the Federal Courtsuspension of Appeals (Tribunal Regional Federal) affirmedpart of our Jangada and Córrego do Feijão mines in the June 2012 decision of the federal judge. A request for clarification from RFFSA and our appealSouthern System, in order to the Superior Court of Justice (STJ) are pending. The current amount claimed by RFFSA, including adjustments for inflation and interest, is approximately of R$4.3 billion.
Praia Mole suit
We are among the defendants inprotect caves located near these mines; (ii) a public civil action filed by the federal prosecutorMPF in November 1997 seeking to annul the concession agreements under which the defendants operatefor the Praia Mole maritime terminal interminal; and (iii) a citizen suit (ação popular) brought by certain officers of FUNCEF (Caixa Econômica Federal's pension fund) and oil sector workers challenging the Brazilian stateconversion of Espírito Santo. In July 2012, the Federal Court of Appeals affirmed the November 2007 decisionpreferred class A shares into common shares. These proceedings are still ongoing, but we no longer believe that rejected the prosecutor's claim and recognized the validity of those concession agreements. The prosecutor has appealed that ruling, and a final decisionthey may have significant effects on the appeal is still pending.our financial position or profitability.
| | | | |
| | 162 | | |
MEMORANDUM AND ARTICLES OF ASSOCIATION
Company objectives and purposesCOMPANY OBJECTIVES AND PURPOSES
Our corporate purpose is defined by our bylaws to include:
Common shares and preferred sharesCOMMON SHARES AND GOLDEN SHARES
Set forth below is certain information concerning our authorized and issued share capital and a brief summary of certain significant provisions of our bylaws and Brazilian corporate law. This description does not purport to be complete and is qualified by reference to our bylaws (an English translation of which we have filed with the SEC) and to Brazilian corporate law.
Our bylaws authorize the issuance of up to 3.67 billion common shares and up to 7.2 billion preferred shares, in each case based solely on the approval of the Board of Directors without any additional shareholder approval.
EachThe Brazilian government holds 12 golden shares of Vale. Our bylaws do not provide for the conversion of golden shares into common share entitles the holder thereof to one vote at meetings of our shareholders. Holders of common shares are not entitled to any preference relating to our dividends or other distributions.
Holders of preferred shares andshares. In addition, the golden shares do not have any preference upon our liquidation and there are generally entitledno redemption provisions associated with the golden shares.
Voting Rights
Pursuant to the same voting rights as holders of common shares, except with respect to the election of members of the Board of Directors, and are entitled to a preferential dividend as described below. Non-controllingBrazilian corporate law, non-controlling shareholders holding common shares representing at least 15% of oura company's voting capital, and preferred shares representing at least 10% of our total share capital have the right to appoint each one member and an alternate to our Board of Directors. If no group of common or preferred shareholders meets the thresholds described above, shareholders holding preferred or common shares representing at least 10% of our total share capital are entitled to combine their holdings to appoint one member and an alternate to ourthe board of directors. If no group of common shareholders meets this threshold, holders of golden shares may combine their holdings with those of holders of common shares, to reach at least 10% of the total
| | | | |
| | 163 | | |
Memorandum and Articles of Association
share capital in order to appoint one member and an alternate to the Board of Directors. Holders of preferred shares, including the golden shares, may elect one member of the permanent Fiscal Council and the respective alternate. Non-controlling holders of common shares may also elect one member of the Fiscal Council and an alternate, pursuant to applicable CVM rules.
The Brazilian government holds 12the golden shares may elect one member of Vale. the permanent Fiscal Council and the respective alternate.
The golden shares are preferred shares that entitle the holder to the same rights (including with respect to voting and dividend preference) as holders of preferred shares. In addition, the holder of the golden shares is entitled to veto any proposed action relating to the following matters:
Shareholders' meetings
Our Ordinary General Shareholders' Meeting is convened by April of each year for shareholders to resolve upon our financial statements, distribution of profits, election of Directors and Fiscal Council Members, if necessary, and compensation of senior management. Extraordinary General Shareholders' Meetings are convened by the Board of Directors as necessary in order to decide all other matters relating to our corporate purposes and to pass such other resolutions as may be necessary.
Pursuant to Brazilian corporate law, shareholders voting at a general shareholders' meeting have the power, among other powers, to:
| | | | |
| | 164 | | |
Memorandum and Articles of Association
Pursuant to CVM recommendations, all general shareholders' meetings, including the annual shareholders' meeting, require no fewer than 30 days' notice to shareholders prior to the scheduled meeting date. Where any general shareholders' meeting is adjourned, 8 days' prior notice to shareholders of the reconvened meeting is required. Pursuant to Brazilian corporate law, this notice to shareholders is required to be published no fewer than three times, in theDiário Oficial do Estado do Rio de Janeiro and in a newspaper with general circulation in the city where we have our registered office, in Rio de Janeiro—Valor Econômico—Estado do Rio de Janeiro is the newspaper currently designated for this purpose. Such notice must contain the agenda for the meeting and, in the case of an amendment to our bylaws, an indication of the meeting's subject matter. In addition, under our bylaws, the holder of the golden shares is entitled to a minimum of 15 days' prior formal notice to its legal representative of any general shareholders' meeting to consider any proposed action subject to the veto rights accorded to the golden shares.
A shareholders' meeting may be held if shareholders representing at least one-quarter of the voting capital are present, except as otherwise provided, including for meetings convened to amend our bylaws, which require a quorum of at least two-thirds of the voting capital. If no such quorum is present, notice must again be given in the same manner as described above, and a meeting may then be convened without any specific quorum requirement, subject to the minimum quorum and voting requirements for certain matters, as discussed below.
Except as otherwise provided by law, resolutions of a shareholders' meeting are passed by a simple majority vote, abstentions not being taken into account. Under Brazilian corporate law, the approval of shareholders representing at least one-half of the issued and outstanding voting shares is required for the types of action described below, as well as, in the case of the first two items below, a majority of issued and outstanding shares of the affected class:
| | | | |
| | 165 | | |
Memorandum and Articles of Association
Whenever the shares of any class of capital stock are entitled to vote, each share is entitled to one vote. Annual shareholders' meetings must be held by April 30 of each year. Shareholders' meetings are called, convened and presided over by the chairman or, in case of his absence, by the vice-chairman of our Board of Directors. In the case of temporary impediment or absence of the chairman or vice-chairman of the Board of Directors, the shareholders' meetings may be chaired by their respective alternates, or in the absence or impediment of such alternates, by a director or other person especially appointed by the chairman of the Board of Directors.
A shareholder may be represented at a general shareholders' meeting by a proxy appointed in accordance with applicable Brazilian law not more than one year before the meeting, who must be a shareholder, a company officer, a lawyer or a financial institution. If the proxy document is in a foreign language, it must be accompanied by corporate documents or a power of attorney, as applicable, each duly translated into Portuguese by a sworn translator. Notarization and consularization of proxies and supporting documents is not required. Proxies and supporting documents in English or Spanish do not require translation.
Redemption rights
Our common shares and golden shares are not redeemable, except that a dissenting shareholder is entitled under Brazilian corporate law to obtain redemption upon a decision made at a shareholders' meeting approving any of the items listed above, as well as:
The right of redemption triggered by shareholder decisions to merge, consolidate or to participate in a centralized group of companies may only be exercised if our shares do not satisfy certain tests of liquidity, among others, at the time of the shareholder resolution. The right of redemption lapses 30 days after publication of the minutes of the relevant general shareholders' meeting, unless the resolution is subject to confirmation by the holder of golden shares (which must be made at a special meeting to be held within one year), in which case the 30-day term is counted from the publication of the minutes of the special meeting.
We would be entitled to reconsider any action giving rise to redemption rights within 10 days following the expiration of such rights if the redemption of shares of dissenting shareholders would jeopardize our financial stability. Any redemption pursuant to Brazilian corporate law would be made at no less than the book value per share, determined on the basis of the last balance sheet approved by the shareholders; provided that if the general shareholders' meeting giving rise to redemption rights occurred more than 60 days after the date of the last approved balance sheet, a shareholder would be entitled to demand that his or her shares be valued on the basis of a new balance sheet dated within 60 days of such general shareholders' meeting.
| | | | |
| | 166 | | |
Memorandum and Articles of Association
Preemptive rights
Each of our shareholders has a general preemptive right to subscribe for shares in any capital increase, in proportion to his or her shareholding. A minimum period of 30 days following the publication of notice of a capital increase is assured for the exercise of the right, and the right is transferable. Under our bylaws and Brazilian corporate law, and subject to the requirement for shareholder approval of any necessary increase to our authorized share capital, our Board of Directors may decide not to extend preemptive rights to our shareholders, or to reduce the 30-day period for the exercise of preemptive rights, in each case with respect to any issuance of shares, debentures convertible into shares or warrants in the context of a public offering.
Tag-along rights and mandatory tender offers
In accordance with Novo Mercado listing rules and our bylaws:
Calculation of distributable amount
At each annual shareholders' meeting, the Board of Directors is required to recommend, based on the executive officers' proposal, how to allocate our earnings for the preceding fiscal year. For purposes of Brazilian corporate law, a company's net income after income taxes and social contribution taxes for such fiscal year, net of any accumulated losses from prior fiscal years and amounts allocated to employees' and management's participation in earnings represents its "net profits" for such fiscal year. In accordance with Brazilian corporate law, an amount equal to our net profits, as further reduced by amounts allocated to the legal reserve, to the fiscal incentive investment reserve, to the contingency reserve or to the unrealized income reserve established by us in compliance with applicable law (discussed below) and increased by reversals of reserves constituted in prior years, is available for distribution to shareholders in any given year. Such amount, the adjusted net profits, is referred to herein as the distributable amount. We may also establish discretionary reserves, such as reserves for investment projects.
The Brazilian corporate law provides that all discretionary allocations of net profits, including discretionary reserves, the contingency reserve, the unrealized income reserve and the reserve for investment projects, are subject to approval by the shareholders voting at the annual meeting and can be transferred to capital or used for the payment of dividends in subsequent years. The fiscal incentive
| | | | |
| | 167 | | |
Memorandum and Articles of Association
investment reserve and legal reserve are also subject to approval by the shareholders voting at the annual meeting and may be transferred to capital but are not available for the payment of dividends in subsequent years.
The sum of certain discretionary reserves may not exceed the amount of our paid-in capital. When such limit is reached, our shareholders may vote to use the excess to pay in capital, increase capital or distribute dividends.
Our calculation of net profits and allocations to reserves for any fiscal year are determined on the basis of the unconsolidated financial statements of our parent company, Vale S.A., inreais, prepared in accordance with Brazilian corporate law. Our consolidated financial statements have been prepared in accordance with IFRS using U.S. dollars as the reporting currency and, although our allocations to reserves and dividends will be reflected in these financial statements, investors will not be able to calculate such allocations or required dividend amounts from our consolidated financial statements in U.S. dollars.
Mandatory dividend
The Brazilian corporate law and our bylaws prescribe that we must distribute to our shareholders in the form of dividends or interest on shareholders' equity an annual amount equal to not less than 25% of the distributable amount, referred to as the mandatory dividend, unless the Board of Directors advises our shareholders at our general shareholders' meeting that payment of the mandatory dividend for the preceding year is inadvisable in light of our financial condition. To date, our Board of Directors has never determined that payment of the mandatory dividend was inadvisable. The Fiscal Council must review any such determination and report it to the shareholders. In addition to the mandatory dividend, our Board of Directors may recommend to the shareholders payment of dividends from other funds legally available therefore. Any payment of interim dividends will be netted against the amount of the mandatory dividend for that fiscal year. The shareholders must also approve the recommendation of the Board of Directors with respect to any required distribution. The amount of the mandatory dividend is subject to the size of the legal reserve, the contingency reserve, and the unrealized income reserve. The amount of the mandatory dividend is not subject to the size of the discretionary tax incentive reserve. See—Calculation of distributable amount.
Dividend preference of preferred shares
Pursuant to our bylaws, holders of preferred shares and the golden shares are entitled to a minimum annual non-cumulative preferential dividend equal to (i) at least 3% of the book value per share, calculated in accordance with the financial statements which serve as reference for the payment of dividends, or (ii) 6% of their pro rata share of our paid-in capital, whichever is higher. To the extent that we declare dividends in any particular year in amounts which exceed the preferential dividends on preferred shares, and after holders of common shares have received distributions equivalent, on a per share basis, to the preferential dividends on preferred shares, holders of common shares and preferred shares shall receive the same additional dividend amount per share. We regularly have had sufficient distributable amounts to be able to distribute equal amounts to both common and preferred shareholders.
Other matters relating to our preferred shares
Our bylaws do not provide for the conversion of preferred shares into common shares. In addition, the preferred shares do not have any preference upon our liquidation and there are no redemption provisions associated with the preferred shares.
Distributions classified as shareholders' equity
Brazilian companies are permitted to pay limited amounts to shareholders and treat such payments as an expense for Brazilian income tax purposes. Our bylaws provide for the distribution of interest on shareholders' equity as an alternative form of payment to shareholders. The interest rate applied is limited to the Brazilian long-term interest rate, or TJLP, for the applicable period. The deduction of the amount of interest paid cannot exceed the greater of (1) 50% of net income (after the deduction of the provision of social contribution on net profits and before the deduction of the provision of the corporate income tax) before taking into account any such distribution for the period in respect of which the payment is made or (2) 50% of the sum of retained earnings and profit reserves. Any payment of interest on shareholders' equity is subject to Brazilian withholding income tax. SeeAdditional information—Taxation—Taxation—Brazilian tax considerations. Under our bylaws, the amount paid to shareholders as interest on shareholders' equity (net of any withholding tax) may be included as part of any mandatory and minimum dividend. Under Brazilian corporate law, we are obligated to distribute to shareholders an amount sufficient to ensure that the net amount received, after payment by us of applicable Brazilian withholding taxes in respect of the distribution of interest on shareholders' equity, is at least equal to the mandatory dividend.
| | | | |
| | 168 | | |
Voting rights
Each common share entitles the holder thereof to one vote at meetings of our shareholders. Holders of preferred shares are entitled to the same voting rights as holders of common shares except for the election of members of the Board of Directors, which will no longer apply in the event of any dividend arrearage, as described below. One of the members of the permanent Fiscal Council and his or her alternate are elected by majority vote of the holders of preferred shares. Holders of preferred shares and common shares may, in certain circumstances, combine their respective holdings to elect members of our Board of Directors, as described under—Common shares and preferred shares.
The golden shares entitle the holder thereof to the same voting rights as holders of preferred shares. The golden shares also confer certain other significant veto rights in respect of particular actions, as described under—Common shares and preferred shares.
The Brazilian corporate law provides that non-voting or restricted-voting shares, such as the preferred shares, acquire unrestricted voting rights beginning when a company has failed for three consecutive fiscal years (or for any shorter period set forth in a company's constituent documents) to pay any fixed or minimum dividend to which such shares are entitled and continuing until payment thereof is made. Our bylaws do not set forth any such shorter period.
Any change in the preferences or advantages of our preferred shares, or the creation of a class of shares having priority over the preferred shares, would require the approval of the holder of the golden shares, who can veto such matters, as well as the approval of the holders of a majority of the outstanding preferred shares, voting as a class at a special meeting.
Shareholders' meetings
Our Ordinary General Shareholders' Meeting is convened by April of each year for shareholders to resolve upon our financial statements, distribution of profits, election of Directors and Fiscal Council Members, if necessary, and compensation of senior management. Extraordinary General Shareholders' Meetings are convened by the Board of Directors as necessary in order to decide all other matters relating to our corporate purposes and to pass such other resolutions as may be necessary.
Pursuant to Brazilian corporate law, shareholders voting at a general shareholders' meeting have the power, among other powers, to:
Memorandum and Articles of the Board of Directors and members of the Fiscal Council at any time;Association
Pursuant to CVM recommendations, all general shareholders' meetings, including the annual shareholders' meeting, require no fewer than 30 days' notice to shareholders prior to the scheduled meeting date. Where any general shareholders' meeting is adjourned, 8 days' prior notice to shareholders of the reconvened meeting is required. Pursuant to Brazilian corporate law, this notice to shareholders is required to be published no fewer than three times, in theDiário Oficial do Estado do Rio de Janeiro and in a newspaper with general circulation in the city where we have our registered office, in Rio de Janeiro—Valor Econômico—Estado do Rio de Janeiro is the newspaper currently designated for this purpose. Such notice must contain the agenda for the meeting and, in the case of an amendment to our bylaws, an indication of the meeting's subject matter. In addition, under our bylaws, the holder of the golden shares is entitled to a minimum of 15 days' prior formal notice to its legal representative of any general shareholders' meeting to consider any proposed action subject to the veto rights accorded to the golden shares. See—Common shares and preferred shares.
A shareholders' meeting may be held if shareholders representing at least one-quarter of the voting capital are present, except as otherwise provided, including for meetings convened to amend our bylaws, which require a quorum of at least two-thirds of the voting capital. If no such quorum is present, notice must again be given in the same manner as described above, and a meeting may then be convened without any specific quorum requirement, subject to the minimum quorum and voting requirements for certain matters, as discussed below. A shareholder without a right to vote may attend a general shareholders' meeting and take part in the discussion of matters submitted for consideration.
Except as otherwise provided by law, resolutions of a shareholders' meeting are passed by a simple majority vote, abstentions not being taken into account. Under Brazilian corporate law, the approval of shareholders representing at least one-half of the issued and outstanding voting shares is required for the types of action described below, as well as, in the case of the first two items below, a majority of issued and outstanding shares of the affected class:
Whenever the shares of any class of capital stock are entitled to vote, each share is entitled to one vote. Annual shareholders' meetings must be held by April 30 of each year. Shareholders' meetings are called, convened and presided over by the chairman or, in case of his absence, by the vice-chairman of our Board of Directors. In the case of temporary impediment or absence of the chairman or vice-chairman of the Board of Directors, the shareholders' meetings may be chaired by their respective alternates, or in the absence or impediment of such alternates, by a director especially appointed by the chairman of the Board of Directors. A shareholder may be represented at a general shareholders' meeting by a proxy appointed in accordance with applicable Brazilian law not more than one year before the meeting, who must be a shareholder, a company officer, a lawyer or a financial institution.
Redemption rights
Our common shares and preferred shares are not redeemable, except that a dissenting shareholder is entitled under Brazilian corporate law to obtain redemption upon a decision made at a shareholders' meeting approving any of the items listed above, as well as:
Only holders of shares adversely affected by shareholder decisions altering the rights, privileges or priority of a class of shares or creating a new class of shares may require us to redeem their shares. The right of redemption triggered by shareholder decisions to merge, consolidate or to participate in a centralized group of companies may only be exercised if our shares do not satisfy certain tests of liquidity, among others, at the time of the shareholder resolution. The right of redemption lapses 30 days after publication of the minutes of the relevant general shareholders' meeting, unless, as in the case of resolutions relating to the rights of preferred shares or the creation of a new class of preferred shares, the resolution is subject to confirmation by the preferred shareholders (which must be made at a special meeting to be held within one year), in which case the 30-day term is counted from the publication of the minutes of the special meeting.
We would be entitled to reconsider any action giving rise to redemption rights within 10 days following the expiration of such rights if the redemption of shares of dissenting shareholders would jeopardize our financial stability. Any redemption pursuant to Brazilian corporate law would be made at no less than the book value per share, determined on the basis of the last balance sheet approved by the shareholders; provided that if the general shareholders' meeting giving rise to redemption rights occurred more than 60 days after the date of the last approved balance sheet, a shareholder would be entitled to demand that his or her shares be valued on the basis of a new balance sheet dated within 60 days of such general shareholders' meeting.
Preemptive rights
Each of our shareholders has a general preemptive right to subscribe for shares in any capital increase, in proportion to his or her shareholding. A minimum period of 30 days following the publication of notice of a capital increase is assured for the exercise of the right, and the right is transferable. Under our bylaws and Brazilian corporate law, and subject to the requirement for shareholder approval of any necessary increase to our authorized share capital, our Board of Directors may decide not to extend preemptive rights to our shareholders, or to reduce the 30-day period for the exercise of preemptive rights, in each case with respect to any issuance of shares, debentures convertible into shares or warrants in the context of a public offering. In the event of a capital increase that would maintain or increase the proportion of capital represented by preferred shares, holders of preferred shares will have preemptive rights to subscribe only to newly issued preferred shares. In the event of a capital increase that would reduce the proportion of capital represented by preferred shares, shareholders will have preemptive rights to subscribe for preferred shares, in proportion to their shareholdings, and for common shares only to the extent necessary to prevent dilution of their overall interest in us. In the event of a capital increase that would maintain or increase the proportion of capital represented by common shares, shareholders will have preemptive rights to subscribe only to newly issued common shares. In the event of a capital increase that would reduce the proportion of capital represented by common shares, holders of common shares will have preemptive rights to subscribe for preferred shares only to the extent necessary to prevent dilution of their overall interest in us.
Tag-along rights
According to Brazilian corporate law, in the event of a sale of control of a company, the acquirer is obliged to offer to holders of voting shares the right to sell their shares for a price equal to at least 80% of the price paid for the voting shares representing control.
Form and transfer of shares
Our preferredcommon shares and commongolden shares are in book-entry form registered in the name of each shareholder. The transfer of such shares is made under Brazilian corporate law, which provides that a transfer of shares is effected by our transfer agent, Banco Bradesco, upon presentation of valid share transfer instructions to us by a transferor or its representative. When preferred shares or common shares are acquired or sold on a Brazilian stock exchange, the transfer is effected on the records of our transfer agent by a representative of a brokerage firm or the stock exchange's clearing system. Transfers of shares by a foreign investor are made in the same way and are executed by the investor's local agent, who is also responsible for updating the information relating to the foreign investment furnished to the Central Bank of Brazil.
The BM&FBOVESPAB3 operates a central clearing system throughCompanhia Brasileira de Liquidação e Custódia, or CBLC. A holder of our shares may participate in this system and all shares elected to be put into the system will be deposited in custody with CBLC (through a Brazilian institution that is duly authorized to operate by the Central Bank of Brazil and maintains a clearing account with CBLC). The fact that such shares are subject to custody with the relevant stock exchange will be reflected in our registry of shareholders. Each participating shareholder will, in turn, be registered in the register of our beneficial shareholders that is maintained by CBLC and will be treated in the same way as registered shareholders.
| | | | |
| | 169 | | |
At the time of the first stage of our privatization in 1997, we issued shareholder revenue interests known in Brazil as "debêntures participativas" to our then-existing shareholders. The terms of the debentures were established to ensure that our pre-privatization shareholders, including the Brazilian government, would participate alongside us in potential future financial benefits that we derive from exploiting certain mineral resources that were not taken into account in determining the minimum purchase price of our shares in the privatization. In accordance with the debentures deed, holders have the right to receive semi-annual payments equal to an agreed percentage of our net revenues (revenues less value-added tax, transport fee and insurance expenses related to the trading of the products) from certain identified mineral resources that we owned at the time of the privatization, to the extent that we exceed defined thresholds of sales volume relating to certain mineral resources, and from the sale of mineral rights that we owned at that time. Our obligation to make payments to the holders will cease when all the relevant mineral resources are exhausted.exhausted, sold or otherwise disposed of by us.
We made available for withdrawal by holders of shareholder debentures US$118 million in 2014, US$65 million in 2015 and US$84 million in 2016. In October 2013, the accumulated sales volume of iron ore from the Northern System reached the relevant threshold established2016, US$147 million in the debentures deed, which triggered our obligation to make additional semi-annual payments of the premium on iron ore products, starting2017 and US$148 million in 2014.2018. See note 3213 to our consolidated financial statements for a description of the terms of the debentures.
| | | | |
| | 170 | | |
EXCHANGE CONTROLS AND OTHER LIMITATIONS
AFFECTING SECURITY HOLDERS
Under Brazilian corporate law, there are no restrictions on ownership of our capital stock by individuals or legal entities domiciled outside Brazil. However, the right to convert dividend payments and proceeds from the sale of preferred shares or common shares into foreign currency and to remit such amounts outside Brazil is subject to restrictions under foreign investment legislation, which generally requires, among other things, that the relevant investment be registered with the Central Bank of Brazil. These restrictions on the remittance of foreign capital abroad could hinder or prevent the depositary bank and its agents for the preferred shares or common shares represented by ADSs from converting dividends, distributions or the proceeds from any sale of preferred shares, common shares or rights, as the case may be, into U.S. dollars and remitting such amounts abroad. Delays in, or refusal to grant any required government approval for conversions of Brazilian currency payments and remittances abroad of amounts owed to holders of ADSs could adversely affect holders of ADRs.
Under CMN Resolution No. 4,373/4,373 of 2014 of the CMN,("Resolution 4,373"), foreign investors, defined to include individuals, legal entities, mutual funds and other collective investment entities, domiciled or headquartered outside Brazil, may invest in almost all financial assets and engage in almost all transactions available in the Brazilian financial and capital markets, provided that certain requirements are fulfilled. In accordance with Resolution No. 4,373/2014, the definition of foreign investor includes individuals, legal entities, mutual funds and other collective investment entities, domiciled or headquartered outside Brazil.they:
Under Resolution No. 4,373/2014, a foreign investor must:
Resolution No. 4,373/20144,373 specifies the manner of custody and the permitted means for trading securities held by foreign investors under the resolution. The offshore transfer or assignment of securities or other financial assets held by foreign investors pursuant to Resolution No. 4,373/20144,373 is prohibited, except for transfers resulting from a corporate reorganization, or occurring upon the death of an investor by operation of law or will.
Resolution No. 4,373/20144,373 also provides for the issuance of depositary receipts in foreign markets in respect of shares of Brazilian issuers. It provides that the proceeds from the sale of ADSs by holders of ADRs outside Brazil are not subject to Brazilian foreign investment controls and holders of ADSs who are not residents of a low-tax jurisdiction (país com tributação favorecida), as defined by Brazilian law, will be entitled to favorable tax treatment.
An electronic registration has been issued to the custodian in the name of the depositary with respect to the ADSs. Pursuant to this electronic registration, the custodian and the depositary are able to convert dividends and other distributions with respect to the underlying shares into foreign currency and to remit the proceeds outside Brazil. If a holder exchanges ADSs for preferred shares or common shares, the holder must, within five business days, seek to obtain its own electronic registration with the Central Bank of Brazil under Law No. 4,131/4,131 of 1962 and Resolution No. 4,373/2014.4,373. Thereafter, unless the holder has registered its investment with the Central Bank of Brazil, such holder may not convert into foreign currency and remit outside Brazil the proceeds from the disposition of, or distributions with respect to, such preferred shares or common shares.
Under Brazilian law, whenever there is a serious imbalance in Brazil's balance of payments or reasons to foresee a serious imbalance, the Brazilian government may impose temporary restrictions on the
| | | | |
| | 171 | | |
Exchange Controls and Other Limitations Affecting Security Holders
remittance to foreign investors of the proceeds of their investments in Brazil, and on the conversion of Brazilian currency into foreign currencies. Such restrictions may hinder or prevent the custodian or holders who have exchanged ADSs for underlying preferred shares or common shares from converting distributions or the proceeds from any sale of such shares, as the case may be, into U.S. dollars and remitting such U.S. dollars abroad. In the event the custodian is prevented from converting and remitting amounts owed to foreign investors, the custodian will hold thereais it cannot convert for the account of the holders of ADRs who have not been paid. The depositary will not invest thereais and will not be liable for interest on those amounts. Anyreais so held will be subject to devaluation risk against the U.S. dollar.
| | | | |
| | 172 | | |
The following summary contains a description of the principal Brazilian and U.S. federal income tax consequences of the ownership and disposition of preferred shares, common shares or ADSs. You should know that this summary does not purport to be a comprehensive description of all the tax considerations that may be relevant to a holder of preferred shares, common shares or ADSs.
Holders of preferred shares, common shares or ADSs should consult their own tax advisors to discuss the tax consequences of the purchase, ownership and disposition of preferred shares, common shares or ADSs, including, in particular, the effect of any state, local or other national tax laws.
Although there is at present no treaty to avoid double taxation between Brazil and the United States, both countries' tax authorities have been having discussions that may result in the execution of such a treaty. In this regard, the two countries signed a Tax Information Exchange Agreement on March 20, 2007, which the Brazilian government approved in May 2013. We cannot predict whether or when such a treaty will enter into force or how, if entered into, such a treaty will affect the U.S. holders, as defined below, of preferred shares, common shares or ADSs.
Brazilian tax considerationsBRAZILIAN TAX CONSIDERATIONS
The following discussion summarizes the principal Brazilian tax consequences of the acquisition, ownership and disposition of preferred shares, common shares or ADSs by a holder not deemed to be domiciled in Brazil for purposes of Brazilian taxation ("Non-Brazilian Holder"). It is based on the tax laws of Brazil and regulations thereunder in effect on the date hereof, which are subject to change (possibly with retroactive effect). This discussion does not specifically address all of the Brazilian tax considerations applicable to any particular Non-Brazilian Holder. Therefore, Non-Brazilian Holders should consult their own tax advisors concerning the Brazilian tax consequences of an investment in preferred shares, common shares or ADSs.
Shareholder distributions
For Brazilian corporations, such as the Company,Vale, distributions to shareholders are classified as either dividend or interest on shareholders' equity.
Dividends
Amounts distributed as dividends will generally not be subject to Brazilian withholding income tax if the distribution is paid only from profits for the corresponding year, as determined under Brazilian tax principles. Dividends paid from profits generated before January 1, 1996 may be subject to Brazilian withholding income tax at varying rates depending on the year the profits were generated. Dividends paid from sources other than profits as determined under Brazilian tax principles may be subject to withholding tax.
Interest on shareholders' equity
Amounts distributed as interest on shareholders' equity are generally subject to withholding income tax at the rate of 15%, except where:
| | | | |
| | 173 | | |
Taxation
legislation imposes restrictions on the disclosure of the shareholding structure or the ownership of the investment, in which case the applicable withholding income tax rate is 25%; or
Interest on shareholders' equity is calculated as interest rate on the sum of the following accounts: (i) share capital, (ii) capital reserves, (ii) profits reserves, (iv) treasury stocks and (v) accumulated losses. The interest rate applied may not exceed the TJLP, the benchmark Brazilian long-term interest rate. In addition, the amount of distributions classified as interest on shareholders' equity may not be more than the greater of (1) 50% of net income (after the deduction of social contribution on net profits but before taking into account such payment of interest and the provision for corporate income tax) for the period in respect of which the payment is made and (2) 50% of the sum of retained earnings and profit reserves.
Payments of interest on shareholders' equity are deductible for the purposes of corporate income tax and social contribution on net profit, to the extent of the limits described above. The tax benefit to the Company in the case of a distribution by way of interest on shareholders' equity is a reduction in the Company's corporate tax charge by an amount equivalent to 34% of such distribution.
Taxation of capital gains
Taxation of Non-Brazilian Holders on capital gains depends on the status of the holder as either:
Investors identified in items (i) or (ii) are subject to favorable tax treatment, as described below.
Capital gains realized by a Non-Brazilian Holder from the disposition of "assets located in Brazil" are subject to taxation in Brazil. Preferred shares and commonCommon shares qualify as assets located in Brazil, and the disposition of such assets by a Non-Brazilian Holder may be subject to income tax on the gains assessed, in accordance with the rules described below, regardless of whether the transaction is carried out with another non-Brazilian resident or with a Brazilian resident.
There is some uncertainty as to whether ADSs qualify as "assets located in Brazil" for this purpose. Arguably, the ADSs do not constitute assets located in Brazil and therefore the gains realized by a Non-Brazilian Holder on the disposition of ADSs to another non-Brazilian resident should not be subject to income tax in Brazil. However, it is not certain that the Brazilian courts will uphold this interpretation of the definition of "assets located in Brazil" in connection with the taxation of gains realized by a Non-Brazilian Holder on the disposition of ADSs. Consequently, gains on a disposition of ADSs by a Non-Brazilian Holder (whether in a transaction carried out with another Non-Brazilian Holder or a person domiciled in Brazil) may be subject to income tax in Brazil in accordance with the rules applicable to a disposition of shares.
| | | | |
| | 174 | | |
Taxation
Although there are arguments to the contrary, the deposit of preferred shares or common shares in exchange for ADSs may be subject to Brazilian income tax if the acquisition cost of the shares being deposited is lower than the average price, determined as either:
The positive difference between the average price of the preferred shares or common shares calculated as described above and their acquisition cost will be considered to be a capital gain subject to income tax in Brazil. In some circumstances, there are grounds to conclude that such taxation is not applicable with respect to any 4,373 Holder, provided such holder is not located in a Low Tax Jurisdiction.
The withdrawal of preferred shares or common shares by holders in exchange for ADSs is not subject to Brazilian income tax, subject to compliance with applicable regulations regarding the registration of the investment with the Central Bank of Brazil.
For the purpose of Brazilian taxation, the income tax rules on gains related to disposition of preferred shares or common shares vary depending on:
The gain realized as a result of a transaction on a Brazilian stock exchange is the difference between: (i) the amount in Brazilian currency realized on the sale or disposition and (ii) the acquisition cost, without any adjustment for inflation, of the securities that are the subject of the transaction.
Through December 31, 2016,2018, any gain realized by a Non-Brazilian Holder on a sale or disposition of preferred shares or common shares carried out on the Brazilian stock exchange was:
The sale or disposition of common shares carried out on the Brazilian stock exchange is subject to withholding tax at the rate of 0.005% on the sale value. This withholding tax can be offset against the
| | | | |
| | 175 | | |
Taxation
eventual income tax due on the capital gain. A 4,373 Holder that is not resident or domiciled in a Low Tax Jurisdiction is not subject to this withholding tax.
Beginning on January 1, 2017, the taxation regime for capital gains in Brazil was significantly amended. Under the new regime, capital gains realized by non-Brazilian residents and individuals resident in Brazil are subject to income tax at progressive taxation, and the rates rangeranging from 15% to 22.5% as described below:
We believe that this new regime of capital gains taxation replaces previous instances of taxation at the rate of 15%, but does(ii) is not change the rate of 25% applicable to residentsresident or domiciled in a Low Tax Jurisdictions. We expect that the tax authorities will adapt regulations to clarify, among other issues, whether the new regime appliesJurisdiction, or not to(B)(i) is a 4,373 Holders, to a residentsHolder and (ii) is resident or domiciled in a Low Tax Jurisdiction. You should consult your own tax advisors concerning the implications of these rules in light of your particular circumstances.
With respect to transactions arranged by a broker that are conducted on the Brazilian non-organized over-the-counter market, a withholding income tax at a rate of 0.005% on the sale value is levied on the transaction and can be offset against the eventual income tax due on the capital gain.
In the case of a redemption of preferred shares, common shares or ADSs or a capital reduction by a Brazilian corporation, the positive difference between the amount received by any Non-Brazilian Holder and the acquisition cost of the preferred shares, common shares or ADSs being redeemed is treated as capital gain and is therefore generally subject to income tax at the progressive rate from 15% to 22.5%, while the 25% rate applies to residents in a Low Tax Jurisdiction.
Any exercise of pre-emptive rights relating to our preferred shares or common shares will not be subject to Brazilian taxation. Any gain realized by a Non-Brazilian Holder on the disposition of pre-emptive rights relating to preferred shares or common shares in Brazil will be subject to Brazilian income taxation in accordance with the same rules applicable to the sale or disposition of preferred shares or common shares.
Tax on foreign exchange and financial transactions
Foreign exchange transactions
Brazilian law imposes a tax on foreign exchange transactions, or an IOF/Exchange Tax, due on the conversion ofreais into foreign currency and on the conversion of foreign currency intoreais. Currently, for most foreign currency exchange transactions, the rate of IOF/Exchange Tax is 0.38%.
The outflow of resources from Brazil related to investments held by a Non-Brazilian Holder in the Brazilian financial and capital markets is currently subject to IOF/Exchange Tax at a zero percent rate. In any case, the Brazilian government may increase such rates at any time, up to 25%, with no retroactive effect.
Transactions involving securities
Brazilian law imposes a tax on transactions involving securities, or an IOF/Securities Tax, including those carried out on the Brazilian stock exchange. The rate of IOF/Securities Tax applicable to transactions involving publicly traded securities in Brazil is currently zero. The rate of IOF/Securities Tax applicable to a transfer of shares traded on the Brazilian stock exchange to back the issuance of depositary receipts has also been zero since December 24, 2013. However, the Brazilian Government may increase such rates at any time up to 1.5% of the transaction amount per day, but the tax cannot be applied retroactively.
Other Brazilian taxes
There are no Brazilian inheritance, gift or succession taxes applicable to the ownership, transfer or disposition of preferred shares, common shares or ADSs by a Non-Brazilian Holder, except for gift and inheritance taxes
| | | | |
| | 176 | | |
Taxation
which are levied by some states of Brazil on gifts made or inheritances bestowed by a Non-Brazilian Holder to individuals or entities resident or domiciled within such states in Brazil. There are no Brazilian stamp, issue, registration, or similar taxes or duties payable by holders of preferred shares or common shares or ADSs.
U.S. federal income tax considerationsFEDERAL INCOME TAX CONSIDERATIONS
This summary does not purport to be a comprehensive description of all the U.S. federal income tax consequences of the acquisition, holding or disposition of the preferred shares, common shares or ADSs. This summary applies to U.S. holders, as defined below, who hold their preferred shares, common shares or ADSs as capital assets and does not apply to special classes of holders, such as:
This discussion is based on the Internal Revenue Code of 1986, as amended to the date hereof, administrative pronouncements, judicial decisions and final, temporary and proposed Treasury Regulations, all as in effect on the date hereof. These authorities are subject to differing interpretations and may be changed, perhaps retroactively, so as to result in U.S. federal income tax consequences different from those discussed below. There can be no assurance that the U.S. Internal Revenue Service (the "IRS") will not challenge one or more of the tax consequences discussed herein or that a court will not sustain such a challenge in the event of litigation. This summary does not address the Medicare tax on net investment income, the alternative minimum tax, or any aspect of state, local or non-U.S. tax law.
YOU SHOULD CONSULT YOUR TAX ADVISORS WITH REGARD TO THE APPLICATION OF THE U.S. FEDERAL INCOME TAX LAWS TO YOUR PARTICULAR SITUATIONS AS WELL AS ANY TAX CONSEQUENCES ARISING UNDER THE LAWS OF ANY STATE, LOCAL OR NON-U.S. TAXING JURISDICTION.
This discussion is also based, in part, on representations of the depositary and the assumption that each obligation in the deposit agreement and any related agreement will be performed in accordance with its terms.
| | | | |
| | 177 | | |
Taxation
For purposes of this discussion, you are a "U.S. holder" if you are a beneficial owner of preferred shares, common shares or ADSs that is, for U.S. federal income tax purposes:
The term U.S. holder also includes certain former citizens of the United States.
In general, if you are the beneficial owner of American depositary receipts evidencing ADSs, you will be treated as the beneficial owner of the preferred shares or common shares represented by those ADSs for U.S. federal income tax purposes. Deposits and withdrawals of preferred shares or common shares by you in exchange for ADSs will not result in the realization of gain or loss for U.S. federal income tax purposes. Your tax basis in such preferred shares or common shares will be the same as your tax basis in such ADSs, and the holding period in such preferred shares or common shares will include the holding period in such ADSs.
Taxation of dividends
The gross amount of a distribution paid on ADSs preferred shares or common shares, including distributions paid in the form of payments of interest on capital for Brazilian tax purposes, out of our current or accumulated earnings and profits (as determined for U.S. federal income tax purposes) will be taxable to you as foreign source dividend income and generally will not be eligible for the dividends-received deduction allowed to corporate shareholders under U.S. federal income tax law. The amount of any such distribution will include the amount of Brazilian withholding taxes, if any, withheld on the amount distributed. To the extent that a distribution exceeds our current and accumulated earnings and profits, such distribution will be treated as a nontaxable return of capital to the extent of your basis in the ADSs preferred shares or common shares, as the case may be, with respect to which such distribution is made, and thereafter as a capital gain.
You will be required to include dividends paid inreais in income in an amount equal to their U.S. dollar value calculated by reference to an exchange rate in effect on the date such distribution is received by the depositary, in the case of ADSs, or by you, in the case of common shares or preferred shares. If the depositary or you do not convert suchreais into U.S. dollars on the date they are received, it is possible that you will recognize foreign currency loss or gain, which would be ordinary loss or gain, when thereais are converted into U.S. dollars. If you hold ADSs, you will be considered to receive a dividend when the dividend is received by the depositary.
Subject to certain exceptions for short-term and hedged positions, the U.S. dollar amount of dividends received by certain non-corporate taxpayers, including individuals, will be subject to taxation at the preferential rates applicable to long-term capital gains if the dividends are "qualified dividends." Dividends paid on the ADSs will be treated as qualified dividends if (i) the ADSs are readily tradable on an established securities market in the United States and (ii) the Company was not, in the year prior to the year in which the dividend was paid, and is not, in the year in which the dividend is paid, a passive foreign investment company ("PFIC"). The ADSs are listed on the New York Stock Exchange and will qualify as readily tradable on an established securities market in the United States so long as they are so listed. Based on Vale's audited financial statements and relevant market and shareholder data, Vale believes that it was not treated as a PFIC for U.S. federal income tax purposes with respect to its 20162018 taxable year. In addition, based on Vale's audited financial statements and its current expectations regarding the value
| | | | |
| | 178 | | |
Taxation
and nature of its assets, the sources and nature of its income, and relevant market and shareholder data, Vale does not anticipate becoming a PFIC for its 20172019 taxable year.
Based on existing guidance, it is not entirely clear whether dividends received with respect to the preferred shares and common shares will be treated as qualified dividends (and therefore whether such dividends will qualify for the preferential rates of taxation applicable to long-term capital gains), because the preferred shares and common shares are not themselves listed on a U.S. exchange. In addition, the U.S. Treasury has announced its intention to promulgate rules pursuant to which holders of ADSs preferred shares or common stockshares and intermediaries through whom such securities are held will be permitted to rely on certifications from issuers to establish that dividends are treated as qualified dividends. Because such procedures have not yet been issued, it is unclear whether we will be able to comply with them. You should consult your own tax advisors regarding the availability of the reduced dividend tax rate in light of your own particular circumstances.
Subject to generally applicable limitations and restrictions, you will be entitled to a credit against your U.S. federal income tax liability, or a deduction in computing your U.S. federal taxable income, for Brazilian income taxes withheld by us. You must satisfy minimum holding period requirements to be eligible to claim a foreign tax credit for Brazilian taxes withheld on dividends. The limitation on foreign taxes eligible for credit is calculated separately for specific classescategories of income. For this purpose dividends paid by us on our shares will generally constitute "passive income." Foreign tax credits may not be allowed for withholding taxes imposed in respect of certain short-term or hedged positions in securities or in respect of arrangements in which a U.S. holder's expected economic profit is insubstantial. You should consult your own tax advisors concerning the implications of these rules in light of your particular circumstances.
Taxation of capital gains
Upon a sale or exchange of preferred shares, common shares or ADSs, you will recognize a capital gain or loss for U.S. federal income tax purposes equal to the difference, if any, between the amount realized on the sale or exchange and your adjusted tax basis in the preferred shares, common shares or ADSs. This gain or loss will be long-term capital gain or loss if your holding period in the preferred shares, common shares or ADSs exceeds one year. The net amount of long-term capital gain recognized by individual U.S. holders generally is subject to taxation at preferential rates. Your ability to use capital losses to offset income is subject to limitations.
Any gain or loss will be U.S. source gain or loss for U.S. foreign tax credit purposes. Consequently, if a Brazilian withholding tax is imposed on the sale or disposition of ADSs preferred shares or common shares, and you do not receive significant foreign source income from other sources, you may not be able to derive effective U.S. foreign tax credit benefits in respect of such Brazilian withholding tax. You should consult your own tax advisor regarding the application of the foreign tax credit rules to your investment in, and disposition of, ADSs preferred shares or common shares.
If a Brazilian tax is withheld on the sale or disposition of shares, the amount realized by a U.S. holder will include the gross amount of the proceeds of such sale or disposition before deduction of the Brazilian tax. SeeBrazilian tax considerations above.
Foreign financial asset reporting
Certain U.S. holders that own "specified foreign financial assets" with an aggregate value in excess of US$50,000 are generally required to file an information statement along with their tax returns, currently on IRS Form 8938, with respect to such assets. "Specified foreign financial assets" include any financial accounts held at a non-U.S. financial institution, as well as securities issued by a non-U.S. issuer that are not held in accounts maintained by financial institutions. The understatement of income attributable to
| | | | |
| | 179 | | |
Taxation
"specified foreign financial assets" in excess of U.S.$5,000 extends the statute of limitations with respect to the tax return to six years after the return was filed. U.S. holders who fail to report the required information could be subject to substantial penalties. You are encouraged to consult with your own tax advisors regarding the possible application of these rules, including the application of the rules to your particular circumstances.
Information reporting and backup withholding
Information returns may be filed with the IRS in connection with distributions on the preferred shares, common shares or ADSs and the proceeds from their sale or other disposition. You may be subject to United States backup withholding tax on these payments if you fail to provide your taxpayer identification number or comply with certain certification procedures or otherwise establish an exemption from backup withholding. If you are required to make such a certification or to establish such an exemption, you generally must do so on IRS Form W-9.
Backup withholding is not an additional tax. The amount of any backup withholding from a payment to you will be allowed as a credit against your U.S. federal income tax liability and may entitle you to a refund, provided that the required information is timely furnished to the IRS.
A holder that is a foreign corporation or a non-resident alien individual may be required to comply with certification and identification procedures in order to establish its exemption from information reporting and backup withholding.
| | | | |
| | 180 | | |
EVALUATION OF DISCLOSURE CONTROLS AND PROCEDURES
Our management, with the participation of our chief executive officer and chief financial officer, has evaluated the effectiveness of our disclosure controls and procedures as of December 31, 2016.2018. There are inherent limitations to the effectiveness of any system of disclosure controls and procedures, including the possibility of human error and the circumvention or overriding of the controls and procedures. Accordingly, even effective disclosure controls and procedures can only provide reasonable assurance of achieving their control objectives.
Our chief executive officer and chief financial officer have concluded that our disclosure controls and procedures were effective to provide reasonable assurance that information required to be disclosed by us in the reports filed or submitted under the Exchange Act is recorded, processed, summarized and reported, within the time periods specified in the applicable rules and forms, and that it is accumulated and communicated to our management, including our chief executive officer and chief financial officer, as appropriate to allow timely decisions regarding required disclosure.
MANAGEMENT'S REPORT ON INTERNAL CONTROL OVER FINANCIAL REPORTING
Our management is responsible for establishing and maintaining adequate internal control over financial reporting. Our internal control over financial reporting is a process designed to provide reasonable assurance regarding the reliability of financial reporting and the preparation of financial statements for external purposes in accordance with generally accepted accounting principles. Our internal control over financial reporting includes those policies and procedures that: (i) pertain to the maintenance of records that, in reasonable detail, accurately and fairly reflect the transactions and dispositions of the assets of the Company; (ii) provide reasonable assurance that transactions are recorded to permit preparation of financial statements in accordance with generally accepted accounting principles, and that receipts and expenditures of the Company are being made only in accordance with authorizations of management and directors of the Company; and (iii) provide reasonable assurance regarding prevention or timely detection of unauthorized acquisition, use, or disposition of our assets that could have a material effect on the financial statements. Because of its inherent limitations, internal control over financial reporting may not prevent or detect misstatements. Also, projections of any evaluation of the effectiveness to future periods are subject to the risk that controls may become inadequate and that the degree of compliance with the policies or procedures may deteriorate.
Our management has assessed the effectiveness of Vale's internal control over financial reporting as of December 31, 20162018 based on the criteria established in "Internal Control—Integrated Framework (2013)" issued by the Committee of Sponsoring Organizations of the Treadway Commission ("COSO").Commission. Based on such assessment and criteria, our management has concluded that our internal control over financial reporting was effective as of December 31, 2016.2018. The effectiveness of our internal control over financial reporting as of December 31, 20162018 has been audited by KPMG Auditores Independentes, an independent registered public accounting firm, as stated in their report which appears herein.
The adoption of IFRS 15 (Revenue from Contracts with Customers) required the implementation of new controls and the modification of certain accounting processes related to revenue recognition. The impact of these changes was not material to our internal control over financial reporting. Our management identified no changeother changes in our internal control over financial reporting that occurred during our fiscal year ended December 31, 20162018 that has materially affected, or is reasonably likely to materially affect, our internal control over financial reporting.
| | | | |
| | 181 | | |
Under NYSE rules, foreign private issuers are subject to more limited corporate governance requirements than U.S. domestic issuers. As a foreign private issuer, we must comply with four principal NYSE corporate governance rules: (1) we must satisfy the requirements of Exchange Act Rule 10A-3 relating to audit committees; (2) our chief executive officer must promptly notify the NYSE in writing after any executive officer becomes aware of any non-compliance with the applicable NYSE corporate governance rules; (3) we must provide the NYSE with annual and interim written affirmations as required under the NYSE corporate governance rules; and (4) we must provide a brief description of any significant differences between our corporate governance practices and those followed by U.S. companies under NYSE listing standards. The table below briefly describes the significant differences between our practices and the practices of U.S. domestic issuers under NYSE corporate governance rules.
Since 2018, we also report our compliance with the Code of Best Practices for Corporate Governance of the Brazilian Corporate Governance Institute (IBGC), as required by Brazilian regulations. The code is based on the "comply or explain" principle, and we currently fully comply with 80% of the practices recommended by the IBGC and partially comply with 17% of practices recommended by the code
Section | | NYSE corporate governance rule for U.S. domestic issuers | | Our approach |
|---|---|---|---|---|
303A.01 | | A listed company must have a majority of independent directors. | | We |
303A.03 | | The non-management directors of a listed company must meet at regularly scheduled executive sessions without management. | | We do not have any management directors. |
| | | |||
303A.04 | | A listed company must have a nominating/corporate governance committee composed entirely of independent directors, with a written charter that covers certain minimum specified duties.
| | We do not have a |
| | | According to its charter, | ||
| | | · supporting the Board of Directors in the process of selecting and appointing the Chief Executive Officer, and evaluating the Chief Executive Officer's appointment of other executives; | ||
| | | · evaluating and recommending | ||
| | | · identifying and recommending | ||
| ||||
| ||||
| ||||
| ||||
| ||||
| | | · |
| | | | |
| | 182 | | |
Corporate Governance
Section | | NYSE corporate governance rule for U.S. domestic issuers | | Our approach |
|---|---|---|---|---|
| | | According to its charter, the Governance, Compliance and Risk Committee is responsible, among other matters, for: | ||
| | | · ensuring the adoption and improvement of good practices of compliance and integrity, including evaluating events of potential conflicts of interest; | ||
| | | · monitoring the scope of activities and effectiveness of the departments in charge of our corporate governance, compliance, corporate integrity, risk management and controls and proposing improvements; | ||
| | | · evaluating proposals for modifying the corporate governance documents, such as the By-Laws, the Code of Ethical Conduct and written charters of our Advisory Committees and Board of Directors, in addition to other policies and documents which are not the responsibility of other committees; | ||
| | | · ensuring the effectiveness of mechanisms to handle conflicts of interests in our transactions, as well as opining on related party transactions submitted for resolution of the Board of Directors, pursuant to the Policy on Transactions with Related Parties; | ||
| | | · promoting, monitoring and ensuring the development and efficacy of the governance model, assuring that all initiatives are in line with the best practices and are in synergy; and | ||
| | | · annually reviewing and recommending changes necessary to improve Vale's corporate governance. | ||
| | | These committees' charters allow for the inclusion of one independent member. For this purpose, an independent member is a person who: | ||
| | | · Has no current link to Vale, except for membership on an Advisory Committee or a non-material shareholding in our share capital or investment in our bonds, and is not financially dependent on compensation from us; | ||
| | | · Has not been an employee of the Company (or of its subsidiaries) or of a direct or indirect controlling shareholder, or a representative of any direct or indirect controlling shareholder for, at least, three years; | ||
| | | · Does not provide, purchase or offer (trade), directly or indirectly, services and/or products to us on a scale that is material to that person or to us; | ||
| | | · Is not linked to a controlling shareholder, member of the controlling group or of another group with material shareholding, the spouse or relative up to the second degree of the foregoing, or connected to entities related to a controlling shareholder; | ||
| | | · Is not a spouse or relative up to the second degree of any officer or manager of Vale; | ||
| | | · Has not been a partner, in the past three years, of an auditing firm that audits or has audited Vale in this same period; and |
| | | | |
| | 183 | | |
Corporate Governance
Section | | NYSE corporate governance rule for U.S. domestic issuers | | Our approach |
|---|---|---|---|---|
| | | · Is not a member of a non-profit entity that receives significant financial funds from us or from our related parties. | ||
303A.05 | | A listed company must have a compensation committee composed entirely of independent directors, with a written charter that covers certain minimum specified duties. | ||
| | We do not | have a compensation committee. However, we have | ||
| | | · | ||
| | | · | ||
| | | · | ||
| ||||
303A.06 | | A listed company must have an audit committee with a minimum of three independent directors who satisfy the independence requirements of Rule 10A-3 under the Exchange Act, with a written charter that covers certain minimum specified duties. | | In lieu of appointing an audit committee composed of independent members of the Board of Directors, we have established a permanentconselho fiscal, or fiscal council, in accordance with the applicable provisions of Brazilian corporate law, and provided the fiscal council with additional powers to permit it to meet the requirements of Exchange Act Rule 10A-3(c)(3). |
| | | Under our bylaws, the Fiscal Council shall have between three and five members. Under Brazilian corporate law, which provides standards for the independence of the Fiscal Council from us and our management, none of the members of the Fiscal Council may be a member of the Board of Directors or an executive officer. Management does not elect any Fiscal Council member. Our Board of Directors has determined that one of the members of our Fiscal Council meets the New York Stock Exchange independence requirements that would apply to audit committee members in the absence of our reliance on Exchange Act Rule 10A-3(c)(3). | ||
| | | The responsibilities of the Fiscal Council are set forth in its charter. Under our bylaws, the charter must give the Fiscal Council responsibility for the matters required under Brazilian corporate law, as well as responsibility for: | ||
| | | · establishing procedures for the receipt, retention and treatment of complaints related to accounting, controls and audit issues, as well as procedures for the confidential, anonymous submission of concerns regarding such matters; | ||
| | | · recommending and assisting the Board of Directors in the appointment, establishment of compensation and dismissal of independent auditors; | ||
| | | · pre-approving services to be rendered by the independent auditors; |
| | | | |
| | 184 | | |
Corporate Governance
Section | | NYSE corporate governance rule for U.S. domestic issuers | | Our approach |
|---|---|---|---|---|
| | | · overseeing the work performed by the independent auditors, with powers to recommend withholding the payment of compensation to the independent auditors; and | ||
| | | · mediating disagreements between management and the independent auditors regarding financial reporting. | ||
303A.08 | | Shareholders must be given the opportunity to vote on all equity-compensation plans and material revisions thereto, with limited exemptions set forth in the NYSE rules. | | Under Brazilian corporate law, shareholder pre-approval is required for the adoption of any equity compensation plans. |
303A.09 | | A listed company must adopt and disclose corporate governance guidelines that cover certain minimum specified subjects. | | We have not published formal corporate governance guidelines. |
303A.10 | | A listed company must adopt and disclose a code of business conduct and ethics for directors, officers and employees, and promptly disclose any waivers of the code for directors or executive officers. | | We have adopted a formal code of ethical conduct, which applies to our directors, officers and employees. We report each year in our annual report on Form 20-F any waivers of the code of ethical conduct granted for directors or executive officers. Our code of ethical conduct has a scope that is similar, but not identical, to that required for a U.S. domestic company under the NYSE rules. |
303A.12 | | a) Each listed company CEO must certify to the NYSE each year that he or she is not aware of any violation by the company of NYSE corporate governance listing standards. | | We are subject to (b) and (c) of these requirements, but not (a). |
| | b) Each listed company CEO must promptly notify the NYSE in writing after any executive officer of the listed company becomes aware of any non-compliance with any applicable provisions of this Section 303A. | | ||
| | c) Each listed company must submit an executed Written Affirmation annually to the NYSE. In addition, each listed company must submit an interim Written Affirmation as and when required by the interim Written Affirmation form specified by the NYSE. | |
| | | | |
| | 185 | | |
CODE OF ETHICS ANDETHICAL CONDUCT
We have a code of ethics andethical conduct that applies to our employees and to the members of our Board of Directors and our Board of Executive Officers, including the chief executive officer and the chief financial officer and the principal accounting officer. We have posted this Codecode of Ethics and Conductethical conduct on our website, at: http://www.vale.com (under English Version/Investors/The Company/Corporate Governance/Policies). Copies of our code of ethics andethical conduct may be obtained without charge by writing to us at the address set forth on the front cover of this Form 20-F. We have not granted any implicit or explicit waivers from any provision of our code of ethics andethical conduct since its adoption.
Ethics Channel
Any breaches of our policies and standards can be reported by anyone, including employees, contractors, suppliers, members of affected communities and other stakeholders, via our Ethics Channel.
Allegations presented to our Ethics Channel are communicated to Vale's Ethics and Conduct Office, an independent department reporting directly to the Board of Directors and responsible for handling complaints as well as disseminating Vale's Code of Ethical Conduct. In 2018, Vale's Board of Directors approved an updated version of the Code of Ethical Conduct, which is now available in 8 languages.
Allegations are investigated by the Ethics and Conduct Office, except in the event of (i) lack of information to initiate an examination, in which case the Office will request additional information to the person raising the concern and will proceed with the investigation provided it receives additional information within 15 days, and (ii) lack of pertinence to the Ethics and Conduct Office's scope of work. The Ethics and Conduct Office's scope of work includes not only alleged violation of Vale's Code of Ethics and Conduct, such as fraud and moral harassment cases, but also the resolution of issues that have not been properly addressed by other lines of reporting in the company, such as delay in payments to contractors.
In 2018, our Ethics and Conduct Office Channel received 2,709 complaints, 91% of which were investigated. Investigations confirmed violations in 45% of these complaints. All confirmed violations triggered correction plans, which are presented by company's managers and approved by the Ethics and Conduct Office. As a general rule, these plans contain measures to promote process improvements, training initiatives and feedback to employees. Depending on the seriousness of the allegations, employees involved may be subject to administrative measures, such as warnings, suspensions or terminations. Suppliers involved in serious violations of the Code of Ethical Conduct are also subject to punitive measures, such as fines or contract termination.
Investigations by the Ethics and Conduct Office in 2018 resulted in 2,007 corrective actions, including the termination of 214 employees.
| | | | |
| | 186 | | |
PRINCIPAL ACCOUNTANT FEES AND SERVICES
The following table summarizes the fees billed to us by our independent auditors KPMG Auditores Independentes for professional services in 20162017 and 2015:2018:
| | | Year ended December 31, | | Year ended December 31, | ||||
|---|---|---|---|---|---|---|---|---|
| | | 2015 | | 2016 | | 2017 | | 2018 |
| | | (US$ thousand) | | (US$ thousand) | ||||
Audit fees | | 4,844 | | 6,084 | | 6,159 | | 4,490 |
Audit-related fees | | 206 | | 63 | | 90 | | 15 |
Other fees | | – | | 6 | | 18 | | 13 |
| | | | | | | | | |
Total fees | | 5,050 | | 6,143 | | 6,267 | | 4,518 |
| | | | | | | | | | |
| | | | | | | | | |
"Audit"Audit fees" are the aggregate fees billed by KPMG Auditores Independentes for the audit of our annual financial statements, the audit of the statutory financial statements of our subsidiaries, and reviews of interim financial statements and attestation services that are provided in connection with statutory and regulatory filings or engagements. They also include fees for services that only the independent auditor reasonably can provide, including the provision of comfort letters and consents in connection with statutory and regulatory filings and the review of documents filed with the SEC and other capital markets or local financial reporting regulatory bodies. "Audit-related fees" are fees charged by KPMG Auditores Independentes for assurance and related services that are reasonably related to the performance of the audit or review of our financial statements and are not reported under "Audit fees."
On September 27, 2018, our Board of Directors approved the hiring of PricewaterhouseCoopers Auditores Independentes, in replacement of KPMG Auditores Independentes, for the provision of audit services for a period of five years. These services will begin in the fiscal year starting on January 1, 2019.
| | | | |
| | 187 | | |
CHANGE IN REGISTRANT'S CERTIFYING ACCOUNTANT
PricewaterhouseCoopers Auditores Independentes ("PwC") replaced KPMG Auditores Independentes ("KPMG") as our independent public accountants and will audit our financial statements for the fiscal year starting on January 1, 2019. The change in auditors is being made pursuant independent auditor´s rotation regulation established by CVM that limits the consecutive terms of the engagement to five years. Because of the limitations set forth in this regulation, KPMG's contract was not renewed. The replacement of KPMG by PwC was approved by our Board of Directors on September 27, 2018. KPMG is engaged as our independent auditor for the fiscal years ended December 31, 2017 and 2018 until the filing of this Form 20-F with the SEC.
KPMG audited our financial statements for the fiscal years ended December 31, 2016, 2017 and 2018. None of the reports of KPMG on our financial statements for either of such fiscal years contained an adverse opinion or disclaimer of opinion, or was qualified or modified as to uncertainty, audit scope or accounting principles. There were no disagreements with KPMG, whether or not resolved, on any matter of accounting principles or practices, financial statement disclosure, or auditing scope or procedure, which, if not resolved to KPMG's satisfaction, would have caused it to make reference to the subject matter of the disagreement in connection with any reports it would have issued, and there were no "reportable events" as that term is defined in Item 16F(a)(1)(v) of Form 20-F. KPMG did not audit any of our financial statements for any period subsequent to December 31, 2018.
We have provided KPMG with a copy of the foregoing disclosure, and have requested that it furnish us with a letter addressed to the SEC stating whether or not it agrees with such disclosure. We are including as Exhibit 15.2 to this Form 20-F a copy of the letter from KPMG as required by Item 16F(a)(3) of Form 20-F.
During the fiscal years ended December 31, 2016, 2017 and 2018, we did not consult with PwC regarding the application of accounting principles to a specific completed or contemplated transaction or regarding the type of audit opinion that might be rendered by PwC on our financial statements. Further, PwC did not provide any written or oral advice that was an important factor considered by us in reaching a decision as to any such accounting, auditing or financial reporting or any matter being the subject of disagreement or "reportable event" or any other matter as defined in Item 16F(a)(v) of Form 20-F.
| | | | |
| | 188 | | |
INFORMATION FILED WITH SECURITIES REGULATORS
We are subject to various information and disclosure requirements in those countries in which our securities are traded, and we file financial statements and other periodic reports with the CVM, BM&FBOVESPA,B3, the SEC and the French securities regulator Autorité des Marchés Financiers.
| | | | |
| | 189 | | |
The amount of long-term debt securities of Vale or its subsidiaries authorized under any individual outstanding agreement does not exceed 10% of Vale's total assets on a consolidated basis. Vale hereby agrees to furnish the SEC, upon its request, a copy of any instruments defining the rights of holders of its long-term debt or of its subsidiaries for which consolidated or unconsolidated financial statements are required to be filed.
| | | | |
| | 190 | | |
Alumina | | Aluminum oxide. It is the main component of bauxite, and extracted from bauxite ore in a chemical refining process. It is the principal raw material in the electro-chemical process from which aluminum is produced. |
Aluminum | | A white metal that is obtained in the electro-chemical process of reducing aluminum oxide. |
| ||
Austenitic stainless steel | | Steel that contains a significant amount of chromium and sufficient nickel to stabilize the austenite microstructure, giving to the steel good formability and ductility and improving its high temperature resistance. They are used in a wide variety of applications, ranging from consumer products to industrial process equipment, as well as for power generation and transportation equipment, kitchen appliances and many other applications where strength, corrosion and high temperature resistance are required. |
| | |
Bauxite | | A rock composed primarily of hydrated aluminum oxides. It is the principal ore of alumina, the raw material from which aluminum is made. |
Beneficiation | | A variety of processes whereby extracted ore from mining is reduced to particles that can be separated into ore-mineral and waste, the former suitable for further processing or direct use. |
| ||
CFR | | Cost and freight. Indicates that all costs related to the transportation of goods up to a named port of destination will be paid by the seller of the goods. |
Coal | | Coal is a black or brownish-black solid combustible substance formed by the decomposition of vegetable matter without access to air. The rank of coal, which includes anthracite, bituminous coal (both are called hard coal), sub-bituminous coal, and lignite, is based on fixed carbon, volatile matter, and heating value. |
Cobalt | | Cobalt is a hard, lustrous, silver-gray metal found in ores, and used in the preparation of magnetic, wear-resistant, and high-strength alloys (particularly for jet engines and turbines). Its compounds are also used in the production of inks, paints, catalysts and battery materials. |
Coke | | Coal that has been processed in a coke oven, for use as a reduction agent in blast furnaces and in foundries for the purposes of transforming iron ore into pig iron. |
Coking | | Hard coking coal is the highest value segment of the metallurgical coal market segments (see metallurgical coal) because of its high strength factors to form a strong coke. |
Concentration | | Physical, chemical or biological process to increase the grade of the metal or mineral of interest. |
Copper | | A reddish brown metallic element. Copper is highly conductive, both thermally and electrically. It is highly malleable and ductile and is easily rolled into sheet and drawn into wire. |
Copper anode | | Copper anode is a metallic product of the converting stage of smelting process that is cast into blocks and generally contains 99% copper grade, which requires further processing to produce refined copper cathodes. |
Copper cathode | | Copper plate with purity higher than or equal to 99.9% that is produced by an electrolytic process. |
Copper concentrate | | Material produced by concentration of copper minerals contained in the copper ore. It is the raw material used in smelters to produce copper metal. |
CVM | | TheComissão de Valores Mobiliários (Brazilian Securities and Exchange Commission). |
| | | | |
| | 191 | | |
Glossary
DWT | | Deadweight ton. The measurement unit of a vessel's capacity for cargo, fuel oil, stores and crew, measured in metric tons of 1,000 kg. A vessel's total deadweight is the total weight the vessel can carry when loaded to |
Electrowon copper cathode | | Refined copper cathode is a metallic product produced by an electrochemical process in which copper is recovered from an electrolyte and plated onto an electrode. Electrowon copper cathodes generally contain 99.99% copper grade. |
Ferroalloys | | Manganese ferroalloys are alloys of iron that contain one or more other chemical elements. These alloys are used to add these other elements into molten metal, usually in steelmaking. The principal ferroalloys are those of manganese, silicon and chromium. |
FOB | | Free on board. It indicates that the purchaser pays for shipping, insurance and all the other costs associated with transportation of the goods to their destination. |
Gold | | A precious metal sometimes found free in nature, but usually found in conjunction with silver, quartz, calcite, lead, tellurium, zinc or copper. It is the most malleable and ductile metal, a good conductor of heat and electricity and unaffected by air and most reagents. |
Grade | | The proportion of metal or mineral present in ore or any other host material. |
| ||
Hematite Ore | | Hematite is an iron oxide mineral, but also denotes the high-grade iron ore type within the iron deposits. |
Iron ore pellets | | Agglomerated ultra-fine iron ore particles of a size and quality suitable for particular iron making processes. Our iron ore pellets range in size from 8 mm to 18 mm. |
Itabirite ore | | Itabirite is a banded iron formation and denotes the low-grade iron ore type within the iron deposits. |
Lump ore | | Iron ore or manganese ore with the coarsest particle size in the range of 6.35 mm to 50 mm in diameter, but varying slightly between different mines and ores. |
Manganese ore | | A hard brittle metallic element found primarily in the minerals pyrolusite, hausmannite and manganite. Manganese ore is essential to the production of virtually all steels and is important in the production of cast iron. |
Metallurgical coal | | Coal used in the production of steel, comprising multiple segments, including hard coking coal (see hard coking coal), semi-hard coking coal, semi-soft coking coal, all used to produce coke to feed a blast furnace; and, PCI (pulverized coal injection) coal used for direct injection fuel source into the blast furnace (see PCI). A bituminous hard coal with a quality that allows the production of coke. Normally used in coke ovens for metallurgical purposes. |
Mineral deposit(s) | | A mineralized body that has been intersected by a sufficient number of closely spaced drill holes and/or underground/surface samples to support sufficient tonnage and grade of metal(s) or mineral(s) of interest to warrant further exploration-development work. |
Mineral | | A concentration or occurrence of minerals of economic interest in such form and quantity that could justify an eventual economic extraction. The location, quantity, grade, geological characteristics and continuity of a mineral resource are known, estimated or interpreted from specific geological evidence through drill holes, trenches and/or outcrops. Mineral resources are sub-divided, in order of increasing geological confidence, into Inferred, Indicated and Measured Resources. |
Mt | | Million metric tons |
Mtpy | | Million metric tons per year. |
Nickel | | A silvery white metal that takes on a high polish. It is hard, malleable, ductile, somewhat ferromagnetic, and a fair conductor of heat and electricity. It belongs to the iron-cobalt group of metals and is chiefly valuable for the alloys it forms, such as stainless steel and other corrosion-resistant alloys. |
| | | | |
| | 192 | | |
Glossary
Nickel laterite | | Deposits are formed by intensive weathering of olivine-rich ultramafic rocks such as dunite, peridotite and komatite. |
Nickel matte | | An intermediate smelter product that must be further refined to obtain pure metal. |
Nickel pig iron | | A low-grade nickel product, made from lateritic ores, suitable primarily for use in stainless steel production. Nickel pig iron typically has a nickel grade of 1.5-6% produced from blast furnaces. Nickel pig iron can also contain chrome, manganese, and impurities such as phosphorus, sulfur and carbon. |
Nickel sulfide | | Formed through magmatic processes where nickel combines with sulfur to form a sulfide phase. Pentlandite is the most common nickel sulfide ore mineral mined and often occurs with chalcopyrite, a common copper sulfide mineral. |
| ||
Ntk | | Net ton (the weight of the goods being transported excluding the weight of the wagon) kilometer. |
Open-pit mining | | Method of extracting rock or minerals from the earth by their removal from an open pit. Open-pit mines for extraction of ore are used when deposits of commercially useful minerals or rock are found near the surface; that is, where the overburden (surface material covering the valuable deposit) is relatively thin or the material of interest is structurally unsuitable for underground mining. |
Oxides | | Compounds of oxygen with another element. For example, magnetite is an oxide mineral formed by the chemical union of iron with oxygen. |
Palladium | | A silver-white metal that is ductile and malleable, used primarily in automobile-emissions control devices, and electrical applications. |
PCI | | Pulverized coal injection. Type of coal with specific properties ideal for direct injection via the tuyeres of blast furnaces. This type of coal does not require any processing or coke making, and can be directly injected into the blast furnaces, replacing lump cokes to be charged from the top of the blast furnaces. |
Pelletizing | | Iron ore pelletizing is a process of agglomeration of ultra-fines produced in iron ore exploitation and concentration steps. The three basic stages of the process are: (i) ore preparation (to get the correct fineness); (ii) mixing and balling (additive mixing and ball formation); and (iii) firing (to get ceramic bonding and strength). |
PGMs | | Platinum group metals. Consist of platinum, palladium, rhodium, ruthenium, osmium and iridium. |
Phosphate | | A phosphorous compound, which occurs in natural ores and is used as a raw material for primary production of fertilizer nutrients, animal feeds and detergents. |
Pig iron | | Product of smelting iron ore usually with coke and limestone in a blast furnace. |
Platinum | | A dense, precious, grey-white transition metal that is ductile and malleable and occurs in some nickel and copper ores. Platinum is resistant to corrosion and is used primarily in jewelry, and automobile-emissions control devices. |
Potash | | A potassium chloride compound, chiefly KCl, used as simple fertilizer and in the production of mixture fertilizer. |
Precious metals | | Metals valued for their color, malleability, and rarity, with a high economic value driven not only by their practical industrial use, but also by their role as investments. The widely-traded precious metals are gold, silver, platinum and palladium. |
Primary nickel | | Nickel produced directly from mineral ores. |
| | | | |
| | 193 | | |
Glossary
Probable (indicated) reserves | | Reserves for which quantity and grade and/or quality are computed from information similar to that used for proven (measured) reserves, but the sites for inspection, sampling and measurement are farther apart or are otherwise less adequately spaced. The degree of assurance, although lower than that for proven (measured) reserves, is high enough to assume continuity between points of observation. |
Proven (measured) reserves | | Reserves for which |
Real,reais or R$ | | The official currency of Brazil is thereal (singular) (plural:reais). |
Reserves (ore/mineral) | | The part of a mineral deposit that could be economically and legally extracted or produced at the time of the reserve determination. |
ROM | | Run-of-mine. Ore in its natural (unprocessed) state, as mined, without having been crushed. |
Secondary or scrap nickel | | Stainless steel or other nickel-containing scrap. |
Seaborne market | | Comprises the total ore trade between countries using ocean bulk vessels. |
Silver | | A ductile and malleable metal used in photography, coins and medal fabrication, and in industrial applications. |
Sinter feed (also known as fines) | | Iron ore fines with particles in the range of 0.15 mm to 6.35 mm in diameter. Suitable for sintering. |
Sintering | | The agglomeration of sinter feed, binder and other materials, into a coherent mass by heating without melting, to be used as metallic charge into a blast furnace. |
| | The most common type of semi-finished steel. Traditional slabs measure 10 inches thick and 30-85 inches wide (and average 20 feet long), while the output of the recently developed "thin slab" casters is two inches thick. Subsequent to casting, slabs are sent to the hot-strip mill to be rolled into coiled sheet and plate products. |
Stainless steel | | Alloy steel containing at least 10% chromium and with superior corrosion resistance. It may also contain other elements such as nickel, manganese, niobium, titanium, molybdenum, copper, in order to improve mechanical, thermal properties and service life. It is primarily classified as austenitic (200 and 300 series), ferritic (400 series), martensitic, duplex or precipitation hardening grades. |
Thermal coal | | A type of coal that is suitable for energy generation in thermal power stations, cement plants and other coal fired ovens/kilns in general industry. |
Tpy | | Metric tons per year. |
Troy ounce | | One troy ounce equals 31.103 grams. |
Underground mining | | Mineral exploitation in which extraction is carried out beneath the earth's surface. |
U.S. dollars or US$ | | The United States dollar. |
| | | | |
| | 194 | | |
The registrant hereby certifies that it meets all of the requirements for filing on Form 20-F and that it has duly caused and authorized the undersigned to sign this annual report on its behalf.
| | VALE S.A. | |||
| By: | | /s/ Name: Title: Interim Chief Executive Officer | |
| By: | | /s/ LUCIANO SIANI PIRES Name: Luciano Siani Pires Title: Chief Financial Officer | |
Date: April 10, 201718, 2019
| | | | |
| | 195 | | |
![]()
Vale S.A. Financial Statements
| | | | Page | |
|---|---|---|---|---|
Report of | | F-3 | ||
Management's Report on Internal Control over Financial Reporting | | |||
| F-6 | |||
Consolidated Income Statement | | F-7 | ||
Consolidated Statement of | | F-8 | ||
Consolidated Statement of | | F-9 | ||
Consolidated Statement of Financial Position | | F-10 | ||
Consolidated Statement of Changes in Equity | | |||
Notes to the Financial Statements | | |||
1. | | Corporate information | | |
2. | | Basis for preparation of the financial statements | | |
3. | | Brumadinho's dam failure | | F-18 |
4. | | Information by business segment and by geographic area | | |
| ||||
5. | | Costs and expenses by nature | | |
6. | | Financial results | | |
7. | | Streaming transactions | | F-35 |
8. | | Income taxes | | |
9. | | Basic and diluted earnings (loss) per share | | |
10. | | Accounts receivable | | |
11. | | Inventories | | |
12. | | Recoverable taxes | | |
13. | | Other financial assets and liabilities | | |
14. | | Non-current assets and liabilities held for sale and discontinued operations | | |
15. | | Subsidiaries | | F-46 |
16. | | Investments in associates and joint ventures | | |
| | Noncontrolling interest | | |
| ||||
18. | | Intangibles | | F-54 |
19. | | Property, plant and equipment | | |
| | Impairment and onerous contracts | | |
| | | | |
| | F-1 | | |
![]()
| | | Page | ||
|---|---|---|---|---|
| | Loans, borrowings and cash and cash equivalents | | |
| | Liabilities related to associates and joint ventures | |
| ||||
23. | | Financial instruments classification | | F-66 |
24. | | Fair value estimate | | F-69 |
25. | | Derivative financial instruments | | |
26. | | Provisions | | |
27. | | Asset retirement obligations | | |
28. | | Litigation | | |
29. | | Employee benefits | | |
30. | | Stockholders' equity | | |
31. | | Related parties | | F-96 |
32. | | Commitments | | F-99 |
| | Risk management | | F-100 |
| | Additional information about derivatives financial instruments | | |
|
| | | | |
| | F-2 | | |
![]()
![]()
KPMG Auditores Independentes
Rua do Passeio, 38 - Setor 2 - 17° andar - Centro
20021-290 - Rio de Janeiro/RJ - Brasil
Caixa Postal 2888 - CEP 20001-970 - Rio de Janeiro/RJ - Brasil
Telefone +55 (21) 2207-9400, Fax +55 (21) 2207-9000
www.kpmg.com.br
Report of Independent Registered Public Accounting Firm
TheTo the Stockholders and Board of Directors and Stockholders of
Vale S.A.
Rio de Janeiro – RJ
Opinions on the Consolidated Financial Statements and Internal Control Over Financial Reporting
We have audited the accompanying consolidated statements of financial position of Vale S.A. and subsidiaries ("Vale" or "the Company") as of December 31, 20162018 and 2015, and2017, the related consolidated statements of income, comprehensive income, changes in equity and cash flows for each of the years in the three-year period ended December 31, 2016.2018, and the related notes (collectively, the "consolidated financial statements"). We also have audited Vale'sthe Company's internal control over financial reporting as of December 31, 2016,2018, based on criteria established inInternal Control—Integrated Framework (2013) (2013) issued by the Committee of Sponsoring Organizations of the Treadway Commission (COSO). Vale'sCommission.
In our opinion, the consolidated financial statements referred to above present fairly, in all material respects, the financial position of the Company as of December 31, 2018 and 2017, and the results of its operations and its cash flows for each of the years in the three-year period ended December 31, 2018, in conformity with International Financial Reporting Standards as issued by the International Accounting Standards Board. Also in our opinion, the Company maintained, in all material respects, effective internal control over financial reporting as of December 31, 2018, based on criteria established inInternal Control—Integrated Framework (2013) issued by the Committee of Sponsoring Organizations of the Treadway Commission.
| KPMG Auditores Independentes, uma sociedade simples brasileira e firma-membro da rede KPMG de firmas-membro independentes e afiliadas à KPMG International Cooperative ("KPMG International"), uma entidade suíça. | | KPMG Auditores Independentes, a Brazilian entity and a member firm of the KPMG network of independent member firms affiliated with KPMG International Cooperative ("KPMG International"), a Swiss entity. |
| | �� | | |
| | F-3 | | |
![]()
![]()
Basis for Opinions
The Company's management is responsible for these consolidated financial statements, for maintaining effective internal control over financial reporting, and for its assessment of the effectiveness of internal control over financial reporting, included in the accompanying Management's Report on Internal Control over Financial Reporting. Our responsibility is to express an opinion on thesethe Company's consolidated financial statements and an opinion on Vale'sthe Company's internal control over financial reporting based on our audits. We are a public accounting firm registered with the Public Company Accounting Oversight Board (United States) (PCAOB) and are required to be independent with respect to the Company in accordance with the U.S. federal securities laws and the applicable rules and regulations of the Securities and Exchange Commission and the PCAOB.
We conducted our audits in accordance with the standards of the Public Company Accounting Oversight Board (United States).PCAOB. Those standards require that we plan and perform the auditaudits to obtain reasonable assurance about whether the consolidated financial statements are free of material misstatement, whether due to error or fraud, and whether effective internal control over financial reporting was maintained in all material respects.
Our audits of the consolidated financial statements included performing procedures to assess the risks of material misstatement of the consolidated financial statements, whether due to error or fraud, and performing procedures that respond to those risks. Such procedures included examining, on a test basis, evidence supportingregarding the amounts and disclosures in the consolidated financial statements, assessingstatements. Our audits also included evaluating the accounting principles used and significant estimates made by management, andas well as evaluating the overall presentation of the consolidated financial statement presentation.statements. Our audit of internal control over financial reporting included obtaining an understanding of internal control over financial reporting, assessing the risk that a material weakness exists, and testing and evaluating the design and operating effectiveness of internal control based on the assessed risk. Our audits also included performing such other procedures as we considered necessary in the circumstances. We believe that our audits providesprovide a reasonable basis for our opinions.
![]()
We draw attention to Note 3 to the consolidated financial statements of the Company, which describes the Brumadinho dam failure occurred at the Company's operating facilities on January 25, 2019. The Company's management considered that the event is not a condition that existed at the end of the reporting period, and therefore does not require adjustments to the financial statements as of December 31, 2018. The amounts disclosed in the mentioned Note related to this event are based on management's best estimates, however, at the current stage of the investigations, assessments of causes and possible third parties lawsuits, it is not possible to reliably measure all potential costs that the Company may incur for the purposes of disclosure in the financial statements.
| | | | |
| | F-4 | | |
![]()
![]()
![]()
Definition and Limitations of Internal Control Over Financial Reporting
A company's internal control over financial reporting is a process designed to provide reasonable assurance regarding the reliability of financial reporting and the preparation of financial statements for external purposes in accordance with generally accepted accounting principles. A company's internal control over financial reporting includes those policies and procedures that (1) pertain to the maintenance of records that, in reasonable detail, accurately and fairly reflect the transactions and dispositions of the assets of the company; (2) provide reasonable assurance that transactions are recorded as necessary to permit preparation of financial statements in accordance with generally accepted accounting principles, and that receipts and expenditures of the company are being made only in accordance with authorizations of management and directors of the company; and (3) provide reasonable assurance regarding prevention or timely detection of unauthorized acquisition, use, or disposition of the company's assets that could have a material effect on the financial statements.
Because of its inherent limitations, internal control over financial reporting may not prevent or detect misstatements. Also, projections of any evaluation of effectiveness to future periods are subject to the risk that controls may become inadequate because of changes in conditions, or that the degree of compliance with the policies or procedures may deteriorate.
In our opinion, the consolidated financial statements referred to above present fairly, in all material respects, the financial position of Vale S.A. and subsidiaries as of December 31, 2016 and 2015, and the results of its operations and its cash flows for each of the years in the three-year period ended December 31, 2016, in conformity with International Financial Reporting Standards as issued by the International Accounting Standards Board. Also in our opinion, Vale maintained, in all material respects, effective internal control over financial reporting as of December 31, 2016, based on criteria established inInternal Control—Integrated Framework (2013) issued by the Committee of Sponsoring Organizations of the Treadway Commission (COSO).
/s/ KPMG KPMG Auditores Independentes | | |
We have served as the Company's auditor since 2014 | |
|
| | | | |
| | F-5 | | |
![]()
![]()
Management's Report on Internal Control over Financial Reporting
The management of Vale S.A (Vale) is responsible for establishing and maintaining adequate internal control over financial reporting.
The Vale's internal control over financial reporting is a process designed to provide reasonable assurance regarding the reliability of financial reporting and the preparation of financial statements for external purposes in accordance with generally accepted accounting principles. The company's internal control over financial reporting includes those policies and procedures that: (i) pertain to the maintenance of records that, in reasonable detail, accurately and fairly reflect the transactions and dispositions of the assets of the company; (ii) provide reasonable assurance that transactions are recorded to permit preparation of financial statements in accordance with generally accepted accounting principles, and that receipts and expenditures of the company are being made only in accordance with authorizations of management and directors of the company; and (iii) provide reasonable assurance regarding prevention or timely detection of unauthorized acquisition, use, or disposition of the company's assets that could have a material effect on the financial statements.
Because of its inherent limitations, internal control over financial reporting may not prevent or detect misstatements. Also, projections of any evaluation of the effectiveness to future periods are subject to the risk that controls may become inadequate because of changes in conditions, and that the degree of compliance with the policies or procedures may deteriorate.
Vale's management has assessed the effectiveness of the company's internal control over financial reporting as of December 31, 20162018 based on the criteria established in Internal Control—Integrated Framework (2013) issued by the Committee of Sponsoring Organizations of the Treadway Commission (COSO). Based on such assessment and criteria, Vale's management has concluded that the company's internal control over financial reporting are effective as of December 31, 2016.2018.
The effectiveness of the company's internal control over financial reporting as of December 31, 20162018 has been audited by KPMG Auditores Independentes, an independent registered public accounting firm, as stated in their report which appears herein.
February 22nd, 2017
| | ||
/s/ Eduardo de Salles Bartolomeo Chief Executive Officer | | |
/s/ LUCIANO SIANI PIRES Luciano Siani Pires Chief Financial Officer and Investors Relations | |
| | | | |
| | F-6 | | |
![]()
Consolidated Income Statement
In millions of United States dollars, except earnings per share data
| | | Year ended December 31 | | | Year ended December 31 | |||||||||||||||||
|---|---|---|---|---|---|---|---|---|---|---|---|---|---|---|---|---|---|---|---|---|---|---|
| | | Notes | | 2016 | | 2015 | | 2014 | | | Notes | | 2018 | | 2017 | | 2016 | |||||
Continuing operations | | | | | | | | | | |||||||||||||
Net operating revenue | | 3(d) | | 27,488 | | 23,384 | | 35,124 | | | 4(e) | | 36,575 | | 33,967 | | 27,488 | |||||
Cost of goods sold and services rendered | | 5(a) | | (17,650) | | (18,751) | | (22,790) | | | 5(a) | | (22,109 | ) | (21,039 | ) | (17,650) | |||||
| | | | | | | | | | | | | | | | | | | |||||
Gross profit | | | 9,838 | | 4,633 | | 12,334 | | | | 14,466 | | 12,928 | | 9,838 | |||||||
| | | | | | | | | | | |||||||||||||
Operating expenses | | | | | | |
| | | | ||||||||||||
Selling and administrative expenses | | 5(b) | | (507) | | (612) | | (1,036) | | | 5(b) | | (523 | ) | (531 | ) | (507) | |||||
Research and evaluation expenses | | | (319) | | (395) | | (662) | | | | (373 | ) | (340 | ) | (319) | |||||||
Pre operating and operational stoppage | | | (453) | | (942) | | (975) | | | | (271 | ) | (413 | ) | (453) | |||||||
Other operating expenses, net | | 5(c) | | (267) | | (207) | | (1,023) | | | 5(c) | | (445 | ) | (420 | ) | (267) | |||||
| | | | | | | | | | | | | | | | | | | |||||
| | | (1,546) | | (2,156) | | (3,696) | | | | (1,612 | ) | (1,704 | ) | (1,546) | ||||||||
Impairment of non-current assets and onerous contracts | | 19 | | (1,174) | | (8,769) | | (99) | | |||||||||||||
Results on measurement or sale of non-current assets | | 14 | | (66) | | 61 | | (167) | | |||||||||||||
Impairment and disposal of non-current assets | | 16, 19 and 20 | | (899 | ) | (294 | ) | (1,240) | ||||||||||||||
| | | | | | | | | | | | | | | | | | | |||||
Operating income (loss) | | | 7,052 | | (6,231) | | 8,372 | | ||||||||||||||
Operating income | | | 11,955 | | 10,930 | | 7,052 | |||||||||||||||
Financial income | | 6 | | 7,968 | | 7,792 | | 3,704 | | | 6 | | 423 | | 478 | | 170 | |||||
Financial expenses | | 6 | | (6,125) | | (18,446) | | (9,722) | | | 6 | | (2,345 | ) | (3,273 | ) | (2,677) | |||||
Equity results in associates and joint ventures | | 15 | | 309 | | (445) | | 501 | | |||||||||||||
Impairment and other results in associates and joint ventures | | 15, 19 and 21 | | (1,220) | | (349) | | (61) | | |||||||||||||
Other financial items | | 6 | | (3,035 | ) | (224 | ) | 4,350 | ||||||||||||||
Equity results and other results in associates and joint ventures | | 16 and 22 | | (182 | ) | (82 | ) | (911) | ||||||||||||||
| | | | | | | | | | | | | | | | | | | |||||
Net income (loss) before income taxes | | | 7,984 | | (17,679) | | 2,794 | | ||||||||||||||
Income before income taxes | | | 6,816 | | 7,829 | | 7,984 | |||||||||||||||
Income taxes | | 8 | | | | | | 8 | | | | |||||||||||
Current tax | | | (943) | | (332) | | (1,060) | | | | (752 | ) | (849 | ) | (943) | |||||||
Deferred tax | | | (1,838) | | 5,581 | | (543) | | | | 924 | | (646 | ) | (1,838) | |||||||
| | | | | | | | | | | | | | | | | | | |||||
| | | (2,781) | | 5,249 | | (1,603) | | | | 172 | | (1,495 | ) | (2,781) | ||||||||
Net income (loss) from continuing operations | | | 5,203 | | (12,430) | | 1,191 | | ||||||||||||||
Loss attributable to noncontrolling interests | | | (8) | | (501) | | (308) | | ||||||||||||||
Net income from continuing operations | | | 6,988 | | 6,334 | | 5,203 | |||||||||||||||
Net income (loss) attributable to noncontrolling interests | | | 36 | | 21 | | (8) | |||||||||||||||
| | | | | | | | | | | | | | | | | | | |||||
Net income (loss) from continuing operations attributable to Vale's stockholders | | | 5,211 | | (11,929) | | 1,499 | | ||||||||||||||
Net income from continuing operations attributable to Vale's stockholders | | | 6,952 | | 6,313 | | 5,211 | |||||||||||||||
| | | | | | | | | | | | | | | | | | | | ||||
| | | | | | | | | | | | | | | | | | | |||||
Discontinued operations | | 14 | | | | | | 14 | | | | |||||||||||
Loss from discontinued operations | | | (1,227) | | (190) | | (838) | | | | (92 | ) | (813 | ) | (1,227) | |||||||
Income attributable to noncontrolling interests | | | 2 | | 10 | | 4 | | ||||||||||||||
Net income (loss) attributable to noncontrolling interests | | | – | | (7 | ) | 2 | |||||||||||||||
| | | | | | | | | | | | | | | | | | | |||||
Loss from discontinued operations attributable to Vale's stockholders | | | (1,229) | | (200) | | (842) | | | | (92 | ) | (806 | ) | (1,229) | |||||||
| | | | | | | | | | | | | | | | | | | | ||||
| | | | | | | | | | | | | | | | | | | |||||
Net income (loss) | | | 3,976 | | (12,620) | | 353 | | ||||||||||||||
Loss attributable to noncontrolling interests | | | (6) | | (491) | | (304) | | ||||||||||||||
Net income | | | 6,896 | | 5,521 | | 3,976 | |||||||||||||||
Net income (loss) attributable to noncontrolling interests | | | 36 | | 14 | | (6) | |||||||||||||||
| | | | | | | | | | | | | | | | | | | |||||
Net income (loss) attributable to Vale's stockholders | | | 3,982 | | (12,129) | | 657 | | ||||||||||||||
Net income attributable to Vale's stockholders | | | 6,860 | | 5,507 | | 3,982 | |||||||||||||||
| | | | | | | | | | | | | | | | | | | | ||||
| | | | | | | | | | | | | | | | | | | |||||
Earnings (loss) per share attributable to Vale's stockholders: | | | | | | |||||||||||||||||
Basic and diluted earnings (loss) per share: | | 9 | | | | | ||||||||||||||||
Preferred share (US$) | | | 0.77 | | (2.35) | | 0.13 | | ||||||||||||||
Earnings per share attributable to Vale's stockholders: | | | | | ||||||||||||||||||
Basic and diluted earnings per share: | | 9 | | | | |||||||||||||||||
Common share (US$) | | | 0.77 | | (2.35) | | 0.13 | | | | 1.32 | | 1.05 | | 0.77 | |||||||
The accompanying notes are an integral part of these financial statements.
| | | | |
| | F-7 | | |
![]()
Consolidated Statement of Comprehensive Income
In millions of United States dollars
| | | Year ended December 31 | | | Year ended December 31 | ||||||||||||||||||||
|---|---|---|---|---|---|---|---|---|---|---|---|---|---|---|---|---|---|---|---|---|---|---|---|---|---|
| | | 2016 | | 2015 | | 2014 | | | 2018 | | 2017 | | 2016 | ||||||||||||
Net income (loss) | | | 3,976 | | | (12,620 | ) | | 353 | | | ||||||||||||||
Net income | | 6,896 | | 5,521 | | 3,976 | |||||||||||||||||||
| | | | | | | | | | | | | | | ||||||||||||
Other comprehensive income (loss): | | | | | | | | | | | | ||||||||||||||
Items that will not be reclassified subsequently to the income statement | | | | | | | | | | | | ||||||||||||||
Cumulative translation adjustments | | | 6,460 | | | (18,128 | ) | | (7,436 | ) | | ||||||||||||||
Translation adjustments | | (6,762 | ) | (717 | ) | 6,460 | |||||||||||||||||||
Retirement benefit obligations | | | | | | | | | | 41 | | (46 | ) | (70) | |||||||||||
Gross balance for the year | | | (112 | ) | | 66 | | | (279 | ) | | ||||||||||||||
Effect of taxes | | | 42 | | | 3 | | | 85 | | | ||||||||||||||
Equity results in associates and joint ventures, net of taxes | | | – | | | – | | | 2 | | | ||||||||||||||
Fair value adjustment to investment in equity securities | | 60 | | – | | – | |||||||||||||||||||
Transfer to reserve | | (16 | ) | – | | – | |||||||||||||||||||
| | | | | | | | | | | | | | | ||||||||||||
| | | (70 | ) | | 69 | | | (192 | ) | | |||||||||||||||
Total items that will not be reclassified subsequently to the income statement, net of tax | | (6,677 | ) | (763 | ) | 6,390 | |||||||||||||||||||
| | | | | | | | | | | | | | | ||||||||||||
Total items that will not be reclassified subsequently to the income statement | | | 6,390 | | | (18,059 | ) | | (7,628 | ) | | ||||||||||||||
| | | | | | | | |||||||||||||||||||
| | | | | | | | | | | | | | | ||||||||||||
Items that may be reclassified subsequently to the income statement | | | | | | | | | | | | ||||||||||||||
Cumulative translation adjustments | | | | | | | | | |||||||||||||||||
Gross balance for the year | | | (3,603 | ) | | 9,340 | | | 3,407 | | | ||||||||||||||
Effect of taxes | | | (74 | ) | | 904 | | | – | | | ||||||||||||||
Translation adjustments | | 3,899 | | 1,026 | | (3,677) | |||||||||||||||||||
Fair value adjustment to debt instruments | | – | | – | | 1 | |||||||||||||||||||
Cash flow hedge | | – | | – | | 10 | |||||||||||||||||||
Net investments hedge | | (543 | ) | (95 | ) | – | |||||||||||||||||||
Transfer of realized results to net income | | | (75 | ) | | – | | | – | | | | (78 | ) | (11 | ) | (78) | ||||||||
| | | | | | | | | | | | | | | ||||||||||||
| | | (3,752 | ) | | 10,244 | | | 3,407 | | | |||||||||||||||
Available-for-sale financial instruments | | | | | | | | | |||||||||||||||||
Gross balance for the year | | | 1 | | | 1 | | | (4 | ) | | ||||||||||||||
Transfer of realized results to net income, net of taxes | | | – | | | – | | | 4 | | | ||||||||||||||
Total of items that may be reclassified subsequently to the income statement, net of tax | | 3,278 | | 920 | | (3,744) | |||||||||||||||||||
| | | | | | | | | | | | | | | ||||||||||||
| | | 1 | | | 1 | | | – | | | |||||||||||||||
| | | | | | | | | ||||||||||||||||||
Cash flow hedge | | | | | | | | | |||||||||||||||||
Gross balance for the year | | | 6 | | | 828 | | | (290 | ) | | ||||||||||||||
Effect of taxes | | | (1 | ) | | (7 | ) | | (3 | ) | | ||||||||||||||
Equity results in associates and joint ventures, net of taxes | | | 5 | | | (5 | ) | | (1 | ) | | ||||||||||||||
Transfer of realized results to net income, net of taxes | | | (3 | ) | | (369 | ) | | (122 | ) | | ||||||||||||||
| | | | | | | | | ||||||||||||||||||
| | | 7 | | | 447 | | | (416 | ) | | |||||||||||||||
| | | | | | | | | ||||||||||||||||||
Total of items that may be reclassified subsequently to the income statement | | | (3,744 | ) | | 10,692 | | | 2,991 | | | ||||||||||||||
| | | | | | | | | ||||||||||||||||||
Total comprehensive income (loss) | | | 6,622 | | | (19,987 | ) | | (4,284 | ) | | ||||||||||||||
Total comprehensive income | | 3,497 | | 5,678 | | 6,622 | |||||||||||||||||||
| | | | | | | | | | | | | | | | |||||||||||
| | | | | | | | | | | | | | | ||||||||||||
Comprehensive income (loss) attributable to noncontrolling interests | | | 111 | | | (543 | ) | | (330 | ) | | | (84 | ) | 13 | | 111 | ||||||||
| | | | | | | | |||||||||||||||||||
Comprehensive income (loss) attributable to Vale's stockholders | | | 6,511 | | | (19,444 | ) | | (3,954 | ) | | | 3,581 | | 5,665 | | 6,511 | ||||||||
| | | | | | | | | | | | | | | | |||||||||||
| | | | | | | | | | | | | | | ||||||||||||
From continuing operations | | 3,589 | | 5,696 | | 6,642 | |||||||||||||||||||
From discontinued operations | | (8 | ) | (31 | ) | (131) | |||||||||||||||||||
| | | | | | | | |||||||||||||||||||
| | 3,581 | | 5,665 | | 6,511 | ||||||||||||||||||||
| | | | | | | | |||||||||||||||||||
| | | | | | | | |||||||||||||||||||
| | | | | | | | |||||||||||||||||||
Items above are stated net of tax and the related taxes are disclosed in note 8.
The accompanying notes are an integral part of these financial statements.
| | | | |
| | F-8 | | |
![]()
Consolidated Statement of Cash Flows
In millions of United States dollars
| | | Year ended December 31 | | |||||||||||||
|---|---|---|---|---|---|---|---|---|---|---|---|---|---|---|---|---|
| | | 2016 | | 2015 | | 2014 | | |||||||||
Cash flow from operating activities: | | | | | | | | | | | ||||||
Net income (loss) before income taxes from continuing operations | | | 7,984 | | | | (17,679 | ) | | | 2,794 | | | |||
Continuing operations adjustments for: | | | | | | | | | | | ||||||
Equity results in associates and joint ventures | | | (309 | ) | | | 445 | | | | (501 | ) | | |||
Results on measurement or sale of non-current assets | | | (84 | ) | | | (213 | ) | | | 258 | | | |||
Impairment and others results in associates and joint ventures | | | 1,220 | | | | 349 | | | | 61 | | | |||
Impairment of non-current assets and onerous contracts | | | 1,174 | | | | 8,769 | | | | 99 | | | |||
Depreciation, amortization and depletion | | | 3,487 | | | | 3,719 | | | | 3,869 | | | |||
Financial results, net | | | (1,843 | ) | | | 10,654 | | | | 6,018 | | | |||
Changes in assets and liabilities: | | | | | | | | | | | ||||||
Accounts receivable | | | (2,744 | ) | | | 1,671 | | | | 2,567 | | | |||
Inventories | | | 288 | | | | (217 | ) | | | (467 | ) | | |||
Suppliers and contractors | | | 243 | | | | 658 | | | | 1,014 | | | |||
Payroll and related charges | | | 133 | | | | (578 | ) | | | (106 | ) | | |||
Other taxes assets and liabilities, net | | | (109 | ) | | | (222 | ) | | | (252 | ) | | |||
Deferred revenue—Gold stream (note 7) | | | 524 | | | | 532 | | | | – | | | |||
Other assets and liabilities, net | | | 591 | | | | (304 | ) | | | 256 | | | |||
| | | | | | | | | |||||||||
Cash provided from operations | | | 10,555 | | | | 7,584 | | | | 15,610 | | | |||
Interest on loans and borrowings paid | | | (1,663 | ) | | | (1,457 | ) | | | (1,539 | ) | | |||
Derivatives received (paid), net (note 25) | | | (1,602 | ) | | | (1,202 | ) | | | (179 | ) | | |||
Interest on participative stockholders' debentures paid | | | (84 | ) | | | (65 | ) | | | (112 | ) | | |||
Income taxes | | | (388 | ) | | | (544 | ) | | | (491 | ) | | |||
Income taxes—Settlement program | | | (417 | ) | | | (384 | ) | | | (494 | ) | | |||
| | | | | | | | | |||||||||
Net cash provided by operating activities from continuing operations | | | 6,401 | | | | 3,932 | | | | 12,795 | | | |||
Net cash provided by operating activities from discontinued operations | | | 180 | | | | 559 | | | | 309 | | | |||
| | | | | | | | | |||||||||
Net cash provided by operating activities | | | 6,581 | | | | 4,491 | | | | 13,104 | | | |||
Cash flow from investing activities continuing: | | | | | | | | | | | ||||||
Financial investments redeemed (invested) | | | 12 | | | | 308 | | | | (148 | ) | | |||
Loans and advances—net receipts (payments) | | | (210 | ) | | | (17 | ) | | | 364 | | | |||
Guarantees and deposits—net receipts (payments) | | | (41 | ) | | | (67 | ) | | | 78 | | | |||
Additions to investments | | | (239 | ) | | | (65 | ) | | | (271 | ) | | |||
Additions to property, plant and equipment and intangible (note 3(b)) | | | (4,951 | ) | | | (8,114 | ) | | | (11,777 | ) | | |||
Dividends and interest on capital received from associates and joint ventures | | | 193 | | | | 318 | | | | 568 | | | |||
Proceeds from disposal of assets and investments | | | 543 | | | | 1,456 | | | | 1,199 | | | |||
Proceeds from gold stream transaction | | | 276 | | | | 368 | | | | – | | | |||
| | | | | | | | | |||||||||
Net cash used in investing activities from continuing operations | | | (4,417 | ) | | | (5,813 | ) | | | (9,987 | ) | | |||
Net cash used in investing activities from discontinued operations | | | (281 | ) | | | (346 | ) | | | (278 | ) | | |||
| | | | | | | | | |||||||||
Net cash used in investing activities | | | (4,698 | ) | | | (6,159 | ) | | | (10,265 | ) | | |||
Cash flow from financing activities from continuing operations: | | | | | | | | | | | ||||||
Loans and borrowings (i) | | | | | | | | | | | ||||||
Additions | | | 6,994 | | | | 4,995 | | | | 2,341 | | | |||
Repayments | | | (7,717 | ) | | | (2,753 | ) | | | (1,864 | ) | | |||
Transactions with stockholders: | | | | | | | | | | | ||||||
Dividends and interest on capital paid to Vale's stockholders | | | (250 | ) | | | (1,500 | ) | | | (4,200 | ) | | |||
Dividends and interest on capital paid to noncontrolling interest | | | (291 | ) | | | (15 | ) | | | (66 | ) | | |||
Transactions with noncontrolling stockholders | | | (17 | ) | | | 1,049 | | | | – | | | |||
| | | | | | | | | |||||||||
Net cash provided by (used in) financing activities from continuing operations | | | (1,281 | ) | | | 1,776 | | | | (3,789 | ) | | |||
Net cash provided by (used in) financing activities from discontinuing operations | | | (17 | ) | | | (73 | ) | | | (72 | ) | | |||
| | | | | | | | | |||||||||
Net cash provided by (used in) financing activities | | | (1,298 | ) | | | 1,703 | | | | (3,861 | ) | | |||
Increase (decrease) in cash and cash equivalents | | | 585 | | | | 35 | | | | (1,022 | ) | | |||
Cash and cash equivalents in the beginning of the year | | | 3,591 | | | | 3,974 | | | | 5,321 | | | |||
Effect of exchange rate changes on cash and cash equivalents | | | 86 | | | | (418 | ) | | | (325 | ) | | |||
| | | | | | | | | |||||||||
Cash and cash equivalents at end of the year | | | 4,262 | | | | 3,591 | | | | 3,974 | | | |||
| | | | | | | | | |||||||||
| | | | | | | | | | | | | | | |||
| | | | | | | | | |||||||||
Non-cash transactions: | | | | | | | | | | | ||||||
Additions to property, plant and equipment—capitalized loans and borrowing costs | | | 653 | | | | 761 | | | | 588 | | | |||
| | | Year ended December 31 | ||||||
|---|---|---|---|---|---|---|---|---|
| | | 2018 | | 2017 | | 2016 | ||
Cash flow from operating activities: | | | | |||||
Income before income taxes from continuing operations | | 6,816 | | 7,829 | | 7,984 | ||
Adjusted for: | | | | |||||
Equity results and other results in associates and joint ventures | | 182 | | 82 | | 911 | ||
Impairment and disposal of non-current assets | | 899 | | 294 | | 1,240 | ||
Depreciation, amortization and depletion | | 3,351 | | 3,708 | | 3,487 | ||
Financial results, net | | 4,957 | | 3,019 | | (1,843) | ||
Changes in assets and liabilities: | | | | |||||
Accounts receivable | | (156 | ) | 1,277 | | (2,744) | ||
Inventories | | (817 | ) | (339 | ) | 288 | ||
Suppliers and contractors | | (376 | ) | 232 | | 243 | ||
Provision—Payroll, related charges and others remunerations | | (11 | ) | 372 | | 133 | ||
Proceeds from cobalt and gold stream transactions | | 690 | | – | | 524 | ||
Other assets and liabilities, net | | (205 | ) | (912 | ) | 332 | ||
| | | | | | | | ||
| | 15,330 | | 15,562 | | 10,555 | |||
Interest on loans and borrowings paid (note 21) | | (1,121 | ) | (1,686 | ) | (1,663) | ||
Derivatives paid, net | | (67 | ) | (240 | ) | (1,602) | ||
Interest on participative stockholders' debentures paid | | (113 | ) | (135 | ) | (84) | ||
Income taxes (including settlement program) | | (1,128 | ) | (1,051 | ) | (805) | ||
| | | | | | | | ||
Net cash provided by operating activities from continuing operations | | 12,901 | | 12,450 | | 6,401 | ||
Cash flow from investing activities: | | | | |||||
Capital expenditures | | (3,784 | ) | (3,831 | ) | (4,951) | ||
Additions to investments | | (23 | ) | (93 | ) | (239) | ||
Proceeds from disposal of assets and investments | | 1,481 | | 922 | | 543 | ||
Dividends and interest on capital received from associates and joint ventures | | 245 | | 227 | | 193 | ||
Others investments activities, net(1) | | 2,240 | | (583 | ) | (239) | ||
Proceeds from gold stream transaction | | – | | – | | 276 | ||
| | | | | | | | ||
Net cash provided by (used in) investing activities from continuing operations | | 159 | | (3,358 | ) | (4,417) | ||
Cash flow from financing activities: | | | | |||||
Loans and borrowings from third-parties (note 21) | | 1,225 | | 1,976 | | 6,994 | ||
Payments of loans and borrowings from third-parties (note 21) | | (7,841 | ) | (8,998 | ) | (7,717) | ||
Dividends and interest on capital paid to stockholders | | (3,313 | ) | (1,456 | ) | (250) | ||
Dividends and interest on capital paid to noncontrolling interest | | (182 | ) | (126 | ) | (291) | ||
Share buyback program (note 30) | | (1,000 | ) | – | | – | ||
Transactions with noncontrolling stockholders | | (17 | ) | (98 | ) | (17) | ||
| | | | | | | | ||
Net cash used in financing activities from continuing operations | | (11,128 | ) | (8,702 | ) | (1,281) | ||
Net cash used in discontinued operations (note 14) | | (46 | ) | (252 | ) | (118) | ||
Increase in cash and cash equivalents | | 1,886 | | 138 | | 585 | ||
Cash and cash equivalents in the beginning of the year | | 4,328 | | 4,262 | | 3,591 | ||
Effect of exchange rate changes on cash and cash equivalents | | (313 | ) | (60 | ) | 86 | ||
Effects of disposals of subsidiaries and merger, net of cash and cash equivalents | | (117 | ) | (12 | ) | – | ||
| | | | | | | | ||
Cash and cash equivalents at end of the year | | 5,784 | | 4,328 | | 4,262 | ||
| | | | | | | | ||
| | | | | | | | ||
| | | | | | | | ||
Non-cash transactions: | | | | |||||
Additions to property, plant and equipment—capitalized loans and borrowing costs | | 194 | | 370 | | 653 | ||
The accompanying notes are an integral part of these financial statements.
| | | | |
| | F-9 | | |
![]()
Consolidated Statement of Financial Position
In millions of United States dollars
| | | Notes | | December 31, 2016 | | December 31, 2015 | | | Notes | | December 31, 2018 | | December 31, 2017 | |||||||||
|---|---|---|---|---|---|---|---|---|---|---|---|---|---|---|---|---|---|---|---|---|---|---|
Assets | | | | | | | | | | | | |||||||||||
Current assets | | | | | | | | | | | | |||||||||||
Cash and cash equivalents | | | 20 | | | 4,262 | | | 3,591 | | | | | 5,784 | | 4,328 | ||||||
Accounts receivable | | | 10 | | | 3,663 | | | 1,476 | | | | 10 | | 2,648 | | 2,600 | |||||
Other financial assets | | | 13 | | | 363 | | | 219 | | | | 13 | | 435 | | 2,022 | |||||
Inventories | | | 11 | | | 3,349 | | | 3,528 | | | | 11 | | 4,443 | | 3,926 | |||||
Prepaid income taxes | | | | | 159 | | | 900 | | | | | 543 | | 781 | |||||||
Recoverable taxes | | | 12 | | | 1,625 | | | 1,404 | | | | 12 | | 883 | | 1,172 | |||||
Others | | | | | 557 | | | 311 | | | | | 556 | | 538 | |||||||
| | | | | | | | | | | | | | | | | |||||||
| | | | | 13,978 | | | 11,429 | | | | | 15,292 | | 15,367 | ||||||||
Non-current assets held for sale | | | 14 | | | 8,589 | | | 4,044 | | | | 14 | | – | | 3,587 | |||||
| | | | | | | | | | | | | | | | | |||||||
| | | | | 22,567 | | | 15,473 | | | | | 15,292 | | 18,954 | ||||||||
Non-current assets | | | | | | | | | | | | |||||||||||
Judicial deposits | | | 28 | (c) | | 962 | | | 882 | | | | 28(c) | | 1,716 | | 1,986 | |||||
Other financial assets | | | 13 | | | 628 | | | 282 | | | | 13 | | 3,144 | | 3,232 | |||||
Prepaid income taxes | | | | | 527 | | | 471 | | | | | 544 | | 530 | |||||||
Recoverable taxes | | | 12 | | | 727 | | | 501 | | | | 12 | | 751 | | 638 | |||||
Deferred income taxes | | | 8 | (a) | | 7,343 | | | 7,904 | | | | 8(a) | | 6,908 | | 6,638 | |||||
Others | | | | | 274 | | | 613 | | | | | 263 | | 267 | |||||||
| | | | | | | | | | | | | | | | | |||||||
| | | | | 10,461 | | | 10,653 | | | | | 13,326 | | 13,291 | ||||||||
Investments in associates and joint ventures | | | 15 | | | 3,696 | | | 2,940 | | | | 16 | | 3,225 | | 3,568 | |||||
Intangibles | | | 17 | | | 6,871 | | | 5,324 | | | | 18 | | 7,962 | | 8,493 | |||||
Property, plant and equipment | | | 18 | | | 55,419 | | | 54,102 | | | | 19 | | 48,385 | | 54,878 | |||||
| | | | | | | | | | | | | | | | | |||||||
| | | | | 76,447 | | | 73,019 | | | | | 72,898 | | 80,230 | ||||||||
| | | | | | | | | | | | | | | | | |||||||
Total assets | | | | | 99,014 | | | 88,492 | | | | | 88,190 | | 99,184 | |||||||
| | | | | | | | | | | | | | | | | | ||||||
| | | | | | | | | | | | | | | | | |||||||
Liabilities | | | | | | | | | | | | |||||||||||
Current liabilities | | | | | | | | | | | | |||||||||||
Suppliers and contractors | | | | | 3,630 | | | 3,365 | | | | | 3,512 | | 4,041 | |||||||
Loans and borrowings | | | 20 | | | 1,660 | | | 2,506 | | | | 21 | | 1,003 | | 1,703 | |||||
Other financial liabilities | | | 13 | | | 1,086 | | | 2,551 | | | | 13 | | 1,604 | | 986 | |||||
Taxes payable | | | | | 657 | | | 595 | | | | 8(d) | | 650 | | 697 | ||||||
Provision for income taxes | | | | | 171 | | | 241 | | | | | 210 | | 355 | |||||||
Liabilities related to associates and joint ventures | | | 21 | | | 292 | | | – | | | | 22 | | 289 | | 326 | |||||
Provisions | | | 26 | | | 952 | | | 540 | | | | 26 | | 1,363 | | 1,394 | |||||
Dividends and interest on capital | | | | | 798 | | | – | | | | 30(d) | | – | | 1,441 | ||||||
Others | | | | | 896 | | | 640 | | | | | 480 | | 992 | |||||||
| | | | | | | | | | | | | | | | | |||||||
| | | | | 10,142 | | | 10,438 | | | | | 9,111 | | 11,935 | ||||||||
Liabilities associated with non-current assets held for sale | | | 14 | | | 1,090 | | | 107 | | | | 14 | | – | | 1,179 | |||||
| | | | | | | | | | | | | | | | | |||||||
| | | | | 11,232 | | | 10,545 | | | | | 9,111 | | 13,114 | ||||||||
| | | | | | | | | | | |||||||||||||
Non-current liabilities | | | | | | | | | | | | |||||||||||
Loans and borrowings | | | 20 | | | 27,662 | | | 26,347 | | | | 21 | | 14,463 | | 20,786 | |||||
Other financial liabilities | | | 13 | | | 2,127 | | | 2,125 | | | | 13 | | 2,711 | | 2,894 | |||||
Taxes payable | | | | | 4,961 | | | 4,085 | | | | 8(d) | | 3,917 | | 4,890 | ||||||
Deferred income taxes | | | 8 | (a) | | 1,700 | | | 1,670 | | | | 8(a) | | 1,532 | | 1,719 | |||||
Provisions | | | 26 | | | 5,748 | | | 5,309 | | | | 26 | | 7,095 | | 7,027 | |||||
Liabilities related to associates and joint ventures | | | 21 | | | 785 | | | – | | | | 22 | | 832 | | 670 | |||||
Deferred revenue—Gold stream | | | 7 | | | 2,090 | | | 1,749 | | | | | 1,603 | | 1,849 | ||||||
Others | | | | | 1,685 | | | 958 | | | | | 2,094 | | 1,463 | |||||||
| | | | | | | | | | | | | | | | | |||||||
| | | | | 46,758 | | | 42,243 | | | | | 34,247 | | 41,298 | ||||||||
| | | | | | | | | | | | | | | | | |||||||
Total liabilities | | | | | 57,990 | | | 52,788 | | | | | 43,358 | | 54,412 | |||||||
| | | | | | | | | | | | | | | | | |||||||
| | | | | | | | ||||||||||||||||
| | | | | | | | ||||||||||||||||
Stockholders' equity | | | 30 | | | | | | | | 30 | | | |||||||||
Equity attributable to Vale's stockholders | | | | | 39,042 | | | 33,589 | | | | | 43,985 | | 43,458 | |||||||
Equity attributable to noncontrolling interests | | | | | 1,982 | | | 2,115 | | | | | 847 | | 1,314 | |||||||
| | | | | | | | | | | | | | | | | |||||||
Total stockholders' equity | | | | | 41,024 | | | 35,704 | | | | | 44,832 | | 44,772 | |||||||
| | | | | | | | | | | | | | | | | |||||||
Total liabilities and stockholders' equity | | | | | 99,014 | | | 88,492 | | | | | 88,190 | | 99,184 | |||||||
| | | | | | | | | | | | | | | | | | ||||||
| | | | | | | | | | | | | | | | | |||||||
The accompanying notes are an integral part of these financial statements.
| | | | |
| | F-10 | | |
![]()
Consolidated Statement of Changes in Equity
In millions of United States dollars
| | | Share capital | | Results on conversion of shares | | Results from operation with noncontrolling interest | | Profit reserves | | Treasury stocks | | Unrealized fair value gain (losses) | | Cumulative translation adjustments | | Retained earnings | | Equity attributable to Vale's stockholders | | Equity attributable to noncontrolling interests | | Total stockholder's equity | | | Share capital | | Results on conversion of shares | | Capital reserve | | Net ownership changes in subsidiaries | | Profit reserves | | Treasury stocks | | Unrealized fair value gain (losses) | | Cumulative translation adjustments | | Retained earnings | | Equity attributable to Vale's stockholders | | Equity attributable to noncontrolling interests | | Total stockholders' equity | | |||||||||||||||||||||||||||||||||||||||||||||
|---|---|---|---|---|---|---|---|---|---|---|---|---|---|---|---|---|---|---|---|---|---|---|---|---|---|---|---|---|---|---|---|---|---|---|---|---|---|---|---|---|---|---|---|---|---|---|---|---|---|---|---|---|---|---|---|---|---|---|---|---|---|---|---|---|---|---|---|---|---|---|---|---|---|---|---|---|---|---|---|---|---|---|---|---|---|---|---|---|---|---|---|---|---|
Balance at December 31, 2013 | | | 60,578 | | | (152 | ) | | | (400 | ) | | | 29,566 | | ��� | | (4,477 | ) | | | (1,202 | ) | | | (20,588 | ) | | | – | | | 63,325 | | | 1,611 | | | 64,936 | | | ||||||||||||||||||||||||||||||||||||||||||||||||||||
Balance at December 31, 2015 | | 61,614 | | (152 | ) | – | | (702 | ) | 985 | | (1,477 | ) | (992 | ) | (25,687 | ) | – | | 33,589 | | 2,115 | | 35,704 | | ||||||||||||||||||||||||||||||||||||||||||||||||||||||||||||||||||||
| | | | | | | | | | | | | | | | | | | | | | | | | | | | | | | | | | | | | | | | | | | | | | | | | | |||||||||||||||||||||||||||||||||||||||||||||
Net income (loss) | | | – | | | – | | | – | | | – | | | – | | | – | | | – | | | 657 | | | 657 | | | (304 | ) | | | 353 | | | | – | | – | | – | | – | | – | | – | | – | | – | | 3,982 | | 3,982 | | (6 | ) | 3,976 | | ||||||||||||||||||||||||||||||||
Other comprehensive income: | | | | | | | | | | | | | | | | | | | | | | | | | | | | | | | | | | | | | | ||||||||||||||||||||||||||||||||||||||||||||||||||||||||
Retirement benefit obligations | | | – | | | – | | | – | | | – | | | – | | | (192 | ) | | – | | | – | | | (192 | ) | | – | | | (192 | ) | | | – | | – | | – | | – | | – | | – | | (70 | ) | – | | – | | (70 | ) | – | | (70 | ) | |||||||||||||||||||||||||||||||||
Cash flow hedge | | | – | | | – | | | – | | | – | | | – | | | (416 | ) | | – | | | – | | | (416 | ) | | – | | | (416 | ) | | | – | | – | | – | | – | | – | | – | | 7 | | – | | – | | 7 | | – | | 7 | | |||||||||||||||||||||||||||||||||
Available-for-sale financial instruments | | – | | – | | – | | – | | – | | – | | 1 | | – | | – | | 1 | | – | | 1 | | ||||||||||||||||||||||||||||||||||||||||||||||||||||||||||||||||||||
Translation adjustments | | | – | | | – | | | – | | | (2,237 | ) | | – | | | 97 | | | (2,098 | ) | | 235 | | | (4,003 | ) | | (26 | ) | | (4,029 | ) | | | – | | – | | – | | – | | 195 | | – | | (93 | ) | 2,387 | | 102 | | 2,591 | | 117 | | 2,708 | | |||||||||||||||||||||||||||||||||
Transactions with stockholders: | | | | | | | | | | | | | | | | | | | | | | | | | | | | | | | | | | | | | | ||||||||||||||||||||||||||||||||||||||||||||||||||||||||
Dividends and interest on capital of Vale's stockholders | | | – | | | – | | | – | | | – | | | – | | | – | | | – | | | (4,200 | ) | | (4,200 | ) | | – | | | (4,200 | ) | | | – | | – | | – | | – | | – | | – | | – | | – | | (1,061 | ) | (1,061 | ) | – | | (1,061 | ) | |||||||||||||||||||||||||||||||||
Dividends of noncontrolling interest | | | – | | | – | | | – | | | – | | | – | | | – | | | – | | | – | | | – | | | (8 | ) | | (8 | ) | | | – | | – | | – | | – | | – | | – | | – | | – | | – | | – | | (268 | ) | (268 | ) | |||||||||||||||||||||||||||||||||
Acquisitions and disposal of participation of noncontrolling interest | | | – | | | – | | | (49 | ) | | – | | | – | | | – | | | – | | | – | | | (49 | ) | | (201 | ) | | (250 | ) | | ||||||||||||||||||||||||||||||||||||||||||||||||||||||||||
Acquisitions and disposal of noncontrolling interest | | – | | – | | – | | 3 | | – | | – | | – | | – | | – | | 3 | | (1 | ) | 2 | | ||||||||||||||||||||||||||||||||||||||||||||||||||||||||||||||||||||
Capitalization of noncontrolling interest advances | | | – | | | – | | | – | | | – | | | – | | | – | | | – | | | – | | | – | | | 127 | | | 127 | | | | – | | – | | – | | – | | – | | – | | – | | – | | – | | – | | 25 | | 25 | | |||||||||||||||||||||||||||||||||
Capitalization of reserves | | | 1,036 | | | – | | | – | | | (1,036 | ) | | – | | | – | | | – | | | – | | | – | | | – | | | – | | | ||||||||||||||||||||||||||||||||||||||||||||||||||||||||||
Cancellation of treasury stock | | | – | | | – | | | – | | | (3,000 | ) | | 3,000 | | | – | | | – | | | – | | | – | | | – | | | – | | | ||||||||||||||||||||||||||||||||||||||||||||||||||||||||||
Realization of reserves | | | – | | | – | | | – | | | (3,387 | ) | | – | | | – | | | – | | | 3,387 | | | – | | | – | | | – | | | ||||||||||||||||||||||||||||||||||||||||||||||||||||||||||
Appropriation to undistributed retained earnings | | | – | | | – | | | – | | | 79 | | | – | | | – | | | – | | | (79 | ) | | – | | | – | | | – | | | | – | | – | | – | | – | | 3,023 | | – | | – | | – | | (3,023 | ) | – | | – | | – | | |||||||||||||||||||||||||||||||||
| | | | | | | | | | | | | | | | | | | | | | | | | | | | | | | | | | | | | | | | | | | | | | | | | | |||||||||||||||||||||||||||||||||||||||||||||
Balance at December 31, 2014 | | | 61,614 | | | (152 | ) | | | (449 | ) | | | 19,985 | | | (1,477 | ) | | | (1,713 | ) | | | (22,686 | ) | | | – | | | 55,122 | | | 1,199 | | | 56,321 | | | |||||||||||||||||||||||||||||||||||||||||||||||||||||
Balance at December 31, 2016 | | 61,614 | | (152 | ) | – | | (699 | ) | 4,203 | | (1,477 | ) | (1,147 | ) | (23,300 | ) | – | | 39,042 | | 1,982 | | 41,024 | | ||||||||||||||||||||||||||||||||||||||||||||||||||||||||||||||||||||
| | | | | | | | | | | | | | | | | | | | | | | | | | | | | | | | | | | | | | | | | | | | | | | | | | |||||||||||||||||||||||||||||||||||||||||||||
Loss | | | – | | | – | | | – | | | – | | | – | | | – | | | – | | | (12,129 | ) | | (12,129 | ) | | (491 | ) | | (12,620 | ) | | ||||||||||||||||||||||||||||||||||||||||||||||||||||||||||
| | | | | | | | | | | | | | | | | | | | | | | | | | | ||||||||||||||||||||||||||||||||||||||||||||||||||||||||||||||||||||
| | | | | | | | | | | | | | | | | | | | | | | | | | | ||||||||||||||||||||||||||||||||||||||||||||||||||||||||||||||||||||
Net income | | – | | – | | – | | – | | – | | – | | – | | – | | 5,507 | | 5,507 | | 14 | | 5,521 | | ||||||||||||||||||||||||||||||||||||||||||||||||||||||||||||||||||||
Other comprehensive income: | | | | | | | | | | | | | | | | | | | | | | | | | | | | | | | | | | | | | | ||||||||||||||||||||||||||||||||||||||||||||||||||||||||
Retirement benefit obligations | | | – | | | – | | | – | | | – | | | – | | | 70 | | | – | | | – | | | 70 | | | (1 | ) | | 69 | | | | – | | – | | – | | – | | – | | – | | (46 | ) | – | | – | | (46 | ) | – | | (46 | ) | |||||||||||||||||||||||||||||||||
Cash flow hedge | | | – | | | – | | | – | | | – | | | – | | | 447 | | | – | | | – | | | 447 | | | – | | | 447 | | | ||||||||||||||||||||||||||||||||||||||||||||||||||||||||||
Available-for-sale financial instruments | | | – | | | – | | | – | | | – | | | – | | | 1 | | | – | | | – | | | 1 | | | – | | | 1 | | | ||||||||||||||||||||||||||||||||||||||||||||||||||||||||||
Net investments hedge | | – | | – | | – | | – | | – | | – | | – | | (95 | ) | – | | (95 | ) | – | | (95 | ) | ||||||||||||||||||||||||||||||||||||||||||||||||||||||||||||||||||||
Translation adjustments | | | – | | | – | | | – | | | (5,371 | ) | | – | | | 203 | | | (2,665 | ) | | – | | | (7,833 | ) | | (51 | ) | | (7,884 | ) | | | – | | – | | – | | – | | (158 | ) | – | | 10 | | 447 | | – | | 299 | | (1 | ) | 298 | | |||||||||||||||||||||||||||||||||
The accompanying notes are an integral part of these financial statements.
| | | | |
| | F-11 | | |
![]()
Consolidated Statement of Changes in Equity (Continued)
In millions of United States dollars
| | | Share capital | | Results on conversion of shares | | Results from operation with noncontrolling interest | | Profit reserves | | Treasury stocks | | Unrealized fair value gain (losses) | | Cumulative translation adjustments | | Retained earnings | | Equity attributable to Vale's stockholders | | Equity attributable to noncontrolling interests | | Total stockholder's equity | | | Share capital | | Results on conversion of shares | | Capital reserve | | Net ownership changes in subsidiaries | | Profit reserves | | Treasury stocks | | Unrealized fair value gain (losses) | | Cumulative translation adjustments | | Retained earnings | | Equity attributable to Vale's stockholders | | Equity attributable to noncontrolling interests | | Total stockholders' equity | | |||||||||||||||||||||||||||||||||||||||||||||
|---|---|---|---|---|---|---|---|---|---|---|---|---|---|---|---|---|---|---|---|---|---|---|---|---|---|---|---|---|---|---|---|---|---|---|---|---|---|---|---|---|---|---|---|---|---|---|---|---|---|---|---|---|---|---|---|---|---|---|---|---|---|---|---|---|---|---|---|---|---|---|---|---|---|---|---|---|---|---|---|---|---|---|---|---|---|---|---|---|---|---|---|---|---|
Transactions with stockholders: | | | | | | | | | | | | | | | | | | | | | | | | | | | | | | | | | | | | | | ||||||||||||||||||||||||||||||||||||||||||||||||||||||||
Dividends and interest on capital of Vale's stockholders | | | – | | | – | | | – | | | (1,500 | ) | | – | | | – | | | – | | | – | | | (1,500 | ) | | – | | | (1,500 | ) | | | – | | – | | – | | – | | (658 | ) | – | | – | | – | | (1,475 | ) | (2,133 | ) | – | | (2,133 | ) | |||||||||||||||||||||||||||||||||
Dividends of noncontrolling interest | | | – | | | – | | | – | | | – | | | – | | | – | | | – | | | – | | | – | | | (32 | ) | | (32 | ) | | | – | | – | | – | | – | | – | | – | | – | | – | | – | | – | | (202 | ) | (202 | ) | |||||||||||||||||||||||||||||||||
Acquisitions and disposal of participation of noncontrolling interest | | | – | | | – | | | (253 | ) | | – | | | – | | | – | | | (336 | ) | | – | | | (589 | ) | | 1,455 | | | 866 | | | ||||||||||||||||||||||||||||||||||||||||||||||||||||||||||
Acquisitions and disposal of noncontrolling interest | | – | | – | | – | | (255 | ) | – | | – | | – | | – | | – | | (255 | ) | (512 | ) | (767 | ) | ||||||||||||||||||||||||||||||||||||||||||||||||||||||||||||||||||||
Capitalization of noncontrolling interest advances | | | – | | | – | | | – | | | – | | | – | | | – | | | – | | | – | | | – | | | 36 | | | 36 | | | | – | | – | | – | | – | | – | | – | | – | | – | | – | | – | | 33 | | 33 | | |||||||||||||||||||||||||||||||||
Appropriation to undistributed retained earnings | | | — | | | – | | | – | | | (12,129 | ) | | – | | | – | | | – | | | 12,129 | | | – | | | – | | | – | | | | – | | – | | – | | – | | 4,032 | | – | | – | | – | | (4,032 | ) | – | | – | | – | | |||||||||||||||||||||||||||||||||
Merger of Valepar (note 30) | | – | | – | | 1,139 | | – | | – | | – | | – | | – | | – | | 1,139 | | – | | 1,139 | | ||||||||||||||||||||||||||||||||||||||||||||||||||||||||||||||||||||
| | | | | | | | | | | | | | | | | | | | | | | | | | | | | | | | | | | | | | | | | | | | | | | | | | |||||||||||||||||||||||||||||||||||||||||||||
Balance at December 31, 2015 | | | 61,614 | | | (152 | ) | | | (702 | ) | | | 985 | | | (1,477 | ) | | | (992 | ) | | | (25,687 | ) | | | – | | | 33,589 | | | 2,115 | | | 35,704 | | | |||||||||||||||||||||||||||||||||||||||||||||||||||||
Balance at December 31, 2017 | | 61,614 | | (152 | ) | 1,139 | | (954 | ) | 7,419 | | (1,477 | ) | (1,183 | ) | (22,948 | ) | – | | 43,458 | | 1,314 | | 44,772 | | ||||||||||||||||||||||||||||||||||||||||||||||||||||||||||||||||||||
| | | | | | | | | | | | | | | | | | | | | | | | | | | | | | | | | | | | | | | | | | | | | | | | | | |||||||||||||||||||||||||||||||||||||||||||||
Net income (loss) | | | – | | | – | | | – | | | – | | | – | | | – | | | – | | | 3,982 | | | 3,982 | | | (6 | ) | | 3,976 | | | ||||||||||||||||||||||||||||||||||||||||||||||||||||||||||
| | | | | | | | | | | | | | | | | | | | | | | | | | | ||||||||||||||||||||||||||||||||||||||||||||||||||||||||||||||||||||
| | | | | | | | | | | | | | | | | | | | | | | | | | | ||||||||||||||||||||||||||||||||||||||||||||||||||||||||||||||||||||
Net income | | – | | – | | – | | – | | – | | – | | – | | – | | 6,860 | | 6,860 | | 36 | | 6,896 | | ||||||||||||||||||||||||||||||||||||||||||||||||||||||||||||||||||||
Other comprehensive income: | | | | | | | | | | | | | | | | | | | | | | | | | | | | | | | | | | | | | | ||||||||||||||||||||||||||||||||||||||||||||||||||||||||
Retirement benefit obligations | | | – | | | – | | | – | | | – | | | – | | | (70 | ) | | – | | | – | | | (70 | ) | | – | | | (70 | ) | | | – | | – | | – | | (16 | ) | – | | – | | 41 | | – | | – | | 25 | | – | | 25 | | |||||||||||||||||||||||||||||||||
Cash flow hedge | | | – | | | – | | | – | | | – | | | – | | | 7 | | | – | | | – | | | 7 | | | – | | | 7 | | | ||||||||||||||||||||||||||||||||||||||||||||||||||||||||||
Available-for-sale financial instruments | | | – | | | – | | | – | | | – | | | – | | | 1 | | | – | | | – | | | 1 | | | – | | | 1 | | | ||||||||||||||||||||||||||||||||||||||||||||||||||||||||||
Fair value adjustment to investment in equity securities | | – | | – | | – | | – | | – | | – | | 60 | | – | | – | | 60 | | – | | 60 | | ||||||||||||||||||||||||||||||||||||||||||||||||||||||||||||||||||||
Net investments hedge | | – | | – | | – | | – | | – | | – | | – | | (543 | ) | – | | (543 | ) | – | | (543 | ) | ||||||||||||||||||||||||||||||||||||||||||||||||||||||||||||||||||||
Translation adjustments | | | – | | | – | | | – | | | 195 | | | – | | | (93 | ) | | 2,387 | | | 102 | | | 2,591 | | | 117 | | | 2,708 | | | | – | | – | | – | | – | | (1,257 | ) | – | | 49 | | (1,613 | ) | – | | (2,821 | ) | (120 | ) | (2,941 | ) | |||||||||||||||||||||||||||||||||
Transactions with stockholders: | | | | | | | | | | | | | | | | | | | | | | | | | | | | | | | | | | | | | | ||||||||||||||||||||||||||||||||||||||||||||||||||||||||
Dividends and interest on capital of Vale's stockholders | | | – | | | – | | | – | | | – | | | – | | | – | | | – | | | (1,061 | ) | | (1,061 | ) | | – | | | (1,061 | ) | | | – | | – | | – | | – | | – | | – | | – | | – | | (2,054 | ) | (2,054 | ) | – | | (2,054 | ) | |||||||||||||||||||||||||||||||||
Dividends of noncontrolling interest | | | – | | | – | | | – | | | – | | | – | | | – | | | – | | | – | | | – | | | (268 | ) | | (268 | ) | | | – | | – | | – | | – | | – | | – | | – | | – | | – | | – | | (166 | ) | (166 | ) | |||||||||||||||||||||||||||||||||
Acquisitions and disposal of participation of noncontrolling interest | | | – | | | – | | | 3 | | | – | | | – | | | – | | | – | | | – | | | 3 | | | (1 | ) | | 2 | | | ||||||||||||||||||||||||||||||||||||||||||||||||||||||||||
Acquisitions and disposal of noncontrolling interest | | – | | – | | – | | – | | – | | – | | – | | – | | – | | – | | (229 | ) | (229 | ) | ||||||||||||||||||||||||||||||||||||||||||||||||||||||||||||||||||||
Capitalization of noncontrolling interest advances | | | – | | | – | | | – | | | – | | | – | | | – | | | – | | | – | | | – | | | 25 | | | 25 | | | | – | | – | | – | | – | | – | | – | | – | | – | | – | | – | | 12 | | 12 | | |||||||||||||||||||||||||||||||||
Appropriation to undistributed retained earnings | | | – | | | – | | | – | | | 3,023 | | | – | | | – | | | – | | | (3,023 | ) | | – | | | – | | | – | | | | – | | – | | – | | – | | 4,806 | | – | | | | (4,806 | ) | – | | | – | | ||||||||||||||||||||||||||||||||||||
Share buyback program | | – | | – | | – | | – | | – | | (1,000 | ) | – | | – | | – | | (1,000 | ) | – | | (1,000 | ) | ||||||||||||||||||||||||||||||||||||||||||||||||||||||||||||||||||||
| | | | | | | | | | | | | | | | | | | | | | | | | | | | | | | | | | | | | | | | | | | | | | | | | | |||||||||||||||||||||||||||||||||||||||||||||
Balance at December 31, 2016 | | | 61,614 | | | (152 | ) | | (699 | ) | | 4,203 | | | (1,477 | ) | | (1,147 | ) | | (23,300 | ) | | – | | | 39,042 | | | 1,982 | | | 41,024 | | | ||||||||||||||||||||||||||||||||||||||||||||||||||||||||||
Balance at December 31, 2018 | | 61,614 | | (152 | ) | 1,139 | | (970 | ) | 10,968 | | (2,477 | ) | (1,033 | ) | (25,104 | ) | – | | 43,985 | | 847 | | 44,832 | | ||||||||||||||||||||||||||||||||||||||||||||||||||||||||||||||||||||
| | | | | | | | | | | | | | | | | | | | | | | | | | | | | | | | | | | | | | | | | | | | | | | | | | | ||||||||||||||||||||||||||||||||||||||||||||
| | | | | | | | | | | | | | | | | | | | | | | | | | | | | | | | | | | | | | | | | | | | | | | | | | |||||||||||||||||||||||||||||||||||||||||||||
The accompanying notes are an integral part of these financial statements.
| | | | |
| | F-12 | | |
![]()
Notes to the Financial Statements
Expressed in millions of United States dollar, unless otherwise stated
1. Corporate information
Vale S.A. (the "Parent Company") is a public company headquartered at 700, Avenida das Américas, Rio de Janeiro, Brazil with securities traded on the stock exchanges of São Paulo—BM&F BOVESPA (Vale3 and Vale5), New York—NYSE (VALE and VALE.P), Paris—NYSE Euronext (Vale3 and Vale5) and Madrid—LATIBEX (XVALO and XVALP).
Vale and its direct and indirect subsidiaries ("Vale", "Group" or "Company") are global producers of iron ore and iron ore pellets, key raw materials for steelmaking, and producers of nickel, which is used to produce stainless steel and metal alloys employed in the production of several products. The GroupCompany also produces copper, metallurgical and thermal coal, potash, phosphates and other fertilizer nutrients, manganese ore, ferroalloys, platinum group metals, gold, silver and cobalt. The information by segment is presented in note 3.4.
Vale S.A. (the "Parent Company") is a public company headquartered in the city of Rio de Janeiro, Brazil with securities traded on the stock exchanges of São Paulo—B3 S.A. (VALE3), New York—NYSE (VALE), Paris—NYSE Euronext (VALE3) and Madrid—LATIBEX (XVALO).
On December 22, 2017 after the conversion of the class "A" preferred shares into common shares, the Company migrated to the special listing segment of B3 S.A. ("Novo Mercado") (further details in note 30).
2. Basis for preparation of the financial statements
The consolidated financial statements of the Company ("financial statements") present the accounts of the Group and have been prepared and are being presented in accordance with the International Financial Reporting Standards ("IFRS") as issued by theInternational Accounting Standards Board ("IASB").
The financial statements have been prepared under the historical cost convention as adjusted to reflect: (i) the fair value of financial instruments measured at fair value through income statement or available-for-sale financial instruments measured at fair value through the statement of comprehensive income; and (ii) impairment of assets.
The comparative information for the years ended December 31, 2015issue of these financial statements was authorized on April 18, 2019.
The financial statements of the sale of the fertilizers assets, as presented in Note 14.
Subsequent events were evaluated through February 22, 2017, which is the date the financial statements were approved by the Board of Directors.
c) ConsolidationCompany and investments inits associates and joint ventures
The financial statements reflect are measured using the assets, liabilities and transactionscurrency of the primary economic environment in which the entity operates ("functional currency"), which in the case of the Parent Company and its direct and indirect controlled entitiesis the Brazilian real ("subsidiaries"R$"). Intercompany balances and transactions, which include unrealized profits,For presentation purposes, these financial statements are eliminated. Subsidiaries over which control is achieved through other means, suchpresented in United States dollar ("US$") as stockholders agreement, are also consolidated even if the Company does not own a majority ofbelieves that this is how international investors analyze the voting capital.financial statements.
| | | | |
| | F-13 | | |
![]()
Notes to the Financial Statements (Continued)
Expressed in millions of United States dollar, unless otherwise stated
2. Basis for preparation of the financial statements (Continued)
The entities over whichexchange rates used by the Company has joint control ("joint ventures") or significant influence, but not control ("associates") are presented in note 15. Those investments are accounted for using the equity method. For interests in joint arrangements not classified as 'joint ventures' ("joint operations"), the Company recognizesto translate its share of assets, liabilities and net income.
Unrealized gains on downstream or upstream transactions between the Company and its associates and joint ventures are eliminated fully or proportionately to the Company's interest.
The material consolidated entities in each business segment offoreign operations are as follows:
| | | Location | | Principal activity /Business | | % ownership | | % Voting capital | | % Noncontrolling interest or other investors | | |||||||||
|---|---|---|---|---|---|---|---|---|---|---|---|---|---|---|---|---|---|---|---|---|
Direct and indirect subsidiaries | | | | | | | | | | | | | ||||||||
Companhia Portuária da Baía de Sepetiba | | Brazil | | Iron ore | | | 100.0 | % | | | 100.0 | % | | | 0.0 | % | | |||
Mineração Corumbaense Reunida S.A. | | Brazil | | Iron ore and manganese | | | 100.0 | % | | | 100.0 | % | | | 0.0 | % | | |||
Minerações Brasileiras Reunidas S.A. ("MBR") | | Brazil | | Iron ore | | | 62.5 | % | | | 98.3 | % | | | 37.5 | % | | |||
Salobo Metais S.A. | | Brazil | | Copper | | | 100.0 | % | | | 100.0 | % | | | 0.0 | % | | |||
Nacala Corridor Holding Netherlands B.V. | | Netherlands | | Coal | | | 100.0 | % | | | 100.0 | % | | | 0.0 | % | | |||
PT Vale Indonesia | | Indonesia | | Nickel | | | 59.2 | % | | | 59.2 | % | | | 40.8 | % | | |||
Vale International Holdings GmbH | | Austria | | Holding and research | | | 100.0 | % | | | 100.0 | % | | | 0.0 | % | | |||
Vale Canada Limited | | Canada | | Nickel | | | 100.0 | % | | | 100.0 | % | | | 0.0 | % | | |||
Vale International S.A. | | Switzerland | | Trading and holding | | | 100.0 | % | | | 100.0 | % | | | 0.0 | % | | |||
Vale Malaysia Minerals Sdn. Bhd. | | Malaysia | | Iron ore | | | 100.0 | % | | | 100.0 | % | | | 0.0 | % | | |||
Vale Manganês S.A. | | Brazil | | Manganese and ferroalloys | | | 100.0 | % | | | 100.0 | % | | | 0.0 | % | | |||
Vale Moçambique S.A. | | Mozambique | | Coal | | | 95.0 | % | | | 95.0 | % | | | 5.0 | % | | |||
Vale Nouvelle Caledonie S.A.S. | | New Caledonia | | Nickel | | | 95.0 | % | | | 95.0 | % | | | 5.0 | % | | |||
Vale Oman Distribution Center LLC | | Oman | | Iron ore and pelletizing | | | 100.0 | % | | | 100.0 | % | | | 0.0 | % | | |||
Vale Oman Pelletizing Company LLC | | Oman | | Pelletizing | | | 70.0 | % | | | 70.0 | % | | | 30.0 | % | | |||
| | | Closing rate | | Average rate for the year ended | |||||||||||||
|---|---|---|---|---|---|---|---|---|---|---|---|---|---|---|---|---|---|
| | | 2018 | | 2017 | | 2016 | | 2018 | | 2017 | | 2016 | |||||
US Dollar ("US$") | | 3.8748 | | 3.3080 | | 3.2591 | | 3.6558 | | 3.1925 | | 3.4833 | |||||
Canadian dollar ("CAD") | | 2.8451 | | 2.6344 | | 2.4258 | | 2.8190 | | 2.4618 | | 2.6280 | |||||
Euro ("EUR" or "€") | | 4.4390 | | 3.9693 | | 3.4384 | | 4.3094 | | 3.6088 | | 3.8543 | |||||
InvestmentsSignificant and relevant accounting policies for the understanding of the recognition and measurement basis used in the preparation of these financial statements were included in the respective notes. The accounting polices applied in the preparations of these financial statements are consistent with those adopted and disclosed in the financial statements of prior years, except for new accounting policies related to the application of IFRS 9—Financial Instruments and IFRS 15—Revenue from Contracts with Customers, which were adopted by the Company from January 1, 2018.
The nature and effect of the changes as a result of adoption of these new accounting standards are described below:
IFRS 9 Financial Instrument—This standard addresses the classification and measurement of financial assets and liabilities, new impairment model and new rules for hedge accounting. The Company applied IFRS 9 prospectively, with an initial application date of January 1, 2018. The Company has not restated the comparative information, which continues to be reported under IAS 39—Financial Instruments. The main changes are described below:
Classification and measurement—Under IFRS 9, debt instruments are subsequently measured at fair value through profit or loss ("FVTPL"), through amortized cost, or fair value through other comprehensive income ("FVOCI"). The classification is based on the Company's business model for managing the assets and whether the instruments' contractual cash flows represent 'solely payments of principal and interest' ("SPPI") on the principal amount outstanding.
On the date of initial application of IFRS 9, the Company has assessed which business models apply to the financial assets held by investors in Vale's subsidiaries arethe Company and has classified as noncontrolling interests. The Company treats transactions with noncontrolling interests as transactions with equity owners ofits financial instruments into the Group and as described in note 16.appropriate
| | | | |
| | F-14 | | |
For purchases of noncontrolling interests, the difference between any amount paid and the portion acquired of the carrying value of net assets of the subsidiary is recorded in stockholders' equity. Gains or losses on disposals of noncontrolling interest are also recorded in stockholders' equity.
![]()
Notes to the Financial Statements (Continued)
Expressed in millions of United States dollar, unless otherwise stated
2. Basis for preparation of the financial statements (Continued)
As explained in note 14, the Fertilizer Segment is presented as discontinued operations, which includes the following subsidiaries:
| | | Location | | Principal activity | | % ownership | | % Voting capital | | % Noncontrolling interest or other investors | | |||||||||
|---|---|---|---|---|---|---|---|---|---|---|---|---|---|---|---|---|---|---|---|---|
Direct and indirect subsidiaries | | | | | | | | | | | | | ||||||||
Compañia Minera Miski Mayo S.A.C. | | Peru | | Fertilizers | | | 40.0 | % | | | 51.0 | % | | | 60.0 | % | | |||
Vale Fertilizantes S.A. | | Brazil | | Fertilizers | | | 100.0 | % | | | 100.0 | % | | | 0.0 | % | | |||
d) Functional currency and presentation currency
IFRS 9 categories. The financial statementsreclassification of the Group and its associates and joint ventures are measured using the currencyfinancial instruments of the primary economic environment in which the entity operates ("functional currency"), which in the case of the Parent Company is the Brazilian real ("BRL" or "R$"). For presentation purposes, these financial statements are presented in United States dollar ("USD" or "US$") as the Company believes that this is how international investors analyze the financial statements.
Operations in other currencies are translated into the functional currency using the actual exchange rates in force on the respective transactions dates. The foreign exchange gains and losses resulting from the translation at the exchange rates in force at the end of the year are recognized in the income statement as financial expense or income. The exceptions are transactions for which gains and losses are recognized in the statement of comprehensive income.
The income statement and balance sheet of the Group's entities which functional currency is different from the presentation currency are translated into the presentation currency as follows: (i) assets, liabilities and stockholders' equity (except components described in item (iii) are translated at the closing rate at the balance sheet date; (ii) income and expenses are translated at the average exchange rates, except for specific transactions that, considering their significance, are translated at the rate at the transaction date and; (iii) capital, capital reserves and treasury stock are translated at the rate at the date of each transaction. All resulting exchange differences are recognized in the comprehensive income as cumulative translation adjustment, and transferred to the income statement when the operations are realized.
The exchange rates used by the Group for major currencies to translate its operations areJanuary 1, 2018 were as follows:
| | | Closing rate | | Average rate for the year ended | | ||||||||||||||
|---|---|---|---|---|---|---|---|---|---|---|---|---|---|---|---|---|---|---|---|
| | | 2016 | | 2015 | | 2014 | | 2016 | | 2015 | | 2014 | | ||||||
Brazilian Reais ("R$") | | 3.2591 | | 3.9048 | | 2.6562 | | 3.4833 | | 3.3387 | | 2.3547 | | ||||||
Canadian dollar ("CAD") | | 2.4258 | | 2.8171 | | 2.2920 | | 2.6280 | | 2.6020 | | 2.1308 | | ||||||
Australian dollar ("AUD") | | 2.3560 | | 2.8532 | | 2.1765 | | 2.5876 | | 2.4979 | | 2.1205 | | ||||||
Euro ("EUR" or "€") | | 3.4384 | | 4.2504 | | 3.2270 | | 3.8543 | | 3.6999 | | 3.1205 | | ||||||
| | | Measurement category | | Carrying amount | ||||||
|---|---|---|---|---|---|---|---|---|---|---|
| | | IAS 39 | | IFRS 9 | | IAS 39 | | IFRS 9 | | Difference |
Financial assets | | | | | | |||||
Current | | | | | | |||||
Financial investments | | Loans and receivables | | FVTPL | | 18 | | 18 | | – |
Derivative financial instruments | | FVTPL | | FVTPL | | 106 | | 106 | | – |
Accounts receivable | | Loans and receivables | | Amortized cost | | 2,600 | | 2,600 | | – |
Related parties | | Loans and receivables | | Amortized cost | | 1,898 | | 1,898 | | – |
Non-current | | | | | | |||||
Derivative financial instruments | | FVTPL | | FVTPL | | 453 | | 453 | | – |
Loans | | Loans and receivables | | Amortized cost | | 151 | | 151 | | – |
Related parties | | Loans and receivables | | Amortized cost | | 2,628 | | 2,628 | | – |
Financial liabilities | | | | | | |||||
Current | | | | | | |||||
Suppliers and contractors | | Loans and receivables | | Amortized cost | | 4,041 | | 4,041 | | – |
Derivative financial instruments | | FVTPL | | FVTPL | | 104 | | 104 | | – |
Loans and borrowings | | Loans and receivables | | Amortized cost | | 1,703 | | 1,703 | | – |
Related parties | | Loans and receivables | | Amortized cost | | 882 | | 882 | | – |
Non-current | | | | | | |||||
Derivative financial instruments | | FVTPL | | FVTPL | | 686 | | 686 | | – |
Loans and borrowings | | Loans and receivables | | Amortized cost | | 20,786 | | 20,786 | | – |
Related parties | | Loans and receivables | | Amortized cost | | 975 | | 975 | | – |
Participative stockholders' debentures | | Loans and receivables | | Amortized cost | | 1,233 | | 1,233 | | – |
These reclassifications have no impact on the measurement categories. The financial instruments that were classified as "Loans and receivables" under IAS 39 did meet the IFRS 9 criteria for classification at amortized cost, because these financial instruments are held within a business model whose objective is to hold to collect the cash flows, which represent solely payments of principal and interest. The derivatives held for trading are required to be held as FVTPL under IFRS 9, therefore there were no changes in relation to these instruments from the adoption of IFRS 9.
Impairment—IFRS 9 has replaced the IAS 39's incurred loss approach with a forward-looking expected credit loss ("ECL") approach.
For accounts receivables, the Company has applied the standard's simplified approach and has calculated ECLs based on lifetime expected credit losses and the identified loss is deemed not significant. The Company has established a provision matrix that is based on its historical credit loss experience, adjusted for forward-looking factors specific to the economic environment and by any financial guarantees related to these accounts receivables.
At each reporting date, the Company assesses whether financial assets carried at amortized cost are credit-impaired. Information about the Company's exposure to credit risk is set out in note 33.
| | | | |
| | F-15 | | |
![]()
Notes to the Financial Statements (Continued)
Expressed in millions of United States dollar, unless otherwise stated
2. Basis for preparation of the financial statements (Continued)
e) Significant accounting policiesThe new impairment approach of IFRS 9 did not have a significant impact to the Company for the year ended December 31, 2018.
The accounting policies applied in financial statements are consistent with those adopted and disclosed in the financial statements of prior years. Hedge accounting—The Company has not early adopted any standards and interpretations that have been issued or amended but which are not yetelected to adopt the new general hedge accounting model in force.IFRS 9. The accounting policies of subsidiaries, affiliates and joint ventures are adjusted to ensure consistency with the policies adoptedchanges introduced by Vale.
Significant and relevant accounting policies for the understanding of the financial statements were included in the respective notes, with a summary of the recognition and measurement basis used by the Company.
The brief description of the recent accounting pronouncements issued by the IASB, which are not yet in force, and the current assessment did by the Company of the impacts on its financial statements, subject to changes due to the more analyzes in progress, are detailed below:
The Company does not plancurrently apply cash flow or fair value hedge accounting. The Company currently applies the early adoption ofnet investment hedge for which there are no changes introduced by this new standard. Based on the history of financial instruments traded by the Company, it is not expected significant impacts on financial statements by applying the IFRS 9 requirements.standard (note 25).
IFRS 15 Revenue from Contracts with Customers—CustomersIn May 2014, the IASB issued IFRS 15, which replaces—This standard establishes a comprehensive framework for determining whether, how much and when revenue is recognized. It replaced IAS 18 RevenuesRevenue, IAS 11 Construction Contracts and the related interpretations. IFRS 15 introduces the five-step model for revenue recognition from contract with a customer. The new standard is based on the principle that revenue is recognized when the control of a good or service to be transferred to a customer in an amount that reflects the consideration to which the entity expects to be entitled in exchange for those goods or services. This standard shall apply for annual periods beginning on or after January 1, 2018.
The Company plans to adopthas adopted the new standard on the required effective date using the fullmodified retrospective method withmethod. Accordingly, the practical expedients approach for concluded contracts. During 2016,comparative information presented has not been restated.
The Company has assessed its revenue streams and the Company performednature and effect of the changes as a preliminary assessmentresult of adoption of IFRS 15 is described below:
Under IFRS 15, the provision of shipping services for CFR and CIF contracts should be considered as a separate performance obligation or not.
in which a proportion of the transaction price would be allocated and recognized over time as the shipping services are provided. The Company expects to disclose quantitative information, if any, priorimpact on the timing of revenue recognition of the proportion that would have been allocated to the adoptionshipping service to the Company's income statement for the year ended December 31, 2018 is deemed not significant. Therefore, such revenue has not been presented separately in these financial statements.
![]()
Notes toprovisional pricing mechanisms embedded within the Financial Statements (Continued)
Expressed in millions of United States dollar, unless otherwise stated
2. Basis for preparation ofprovisionally priced commodities sales remains unmodified. Therefore, these revenues are recognized based on the financial statements (Continued)
| | | | |
| | F-16 | | |
The Company has not yet quantified the impact of adopting IFRS 16 on its assets and liabilities. The quantitative effect of the adoption of IFRS 16 will depend specifically on the Company´s decision related to the method of transition, the use of practical expedients approach and exemptions for recognition, and any additional leases that Company will hold. The Company expects to disclose its transition approach and quantitative information prior to adoption, planned for January 1, 2019.
f) Critical accounting estimates and judgments
The preparation of financial statements requires the use of certain critical accounting estimates, assumptions and judgments by the management of the Company. These estimates are based on the best knowledge and information existing at the balance sheet date. Changes in facts and circumstances may lead to the revision of these estimates. Actual future results may differ from the estimates.
![]()
Notes to the Financial Statements (Continued)
Expressed in millions of United States dollar, unless otherwise stated
2. Basis for preparation of the financial statements (Continued)
Overall, there was no material impact on the Company's financial statement from the IFRS 15 adoption for the year ended December 31, 2018.
The significantCompany will apply the standard from its mandatory adoption date of January 1, 2019. Vale will apply the simplified transition approach and will not restate comparative amounts for the year prior to first adoption. Right-of-use assets will be measured at the amount of the lease liability on adoption.
As at December 31, 2018, the Company has non-cancellable operating lease commitments in the nominal amount of US$2,498 (note 32). The Company has set up a project team which has reviewed these leasing commitments over the last year in light of the new lease accounting rules in IFRS 16. Of these commitments, the Company expects to recognize right-of-use assets and lease liabilities an amount ranging from US$1.8 billion to US$2 billion at present value on January 1, 2019, an amount ranging from US$240 to US$260 on current liabilities and US$1,560 to US$1,740 on non-current liabilities.
The actual impacts of adopting the standard may be subject to further changes because the Company has not finalized the testing, assessment of controls over its new IT systems and the new accounting policies are subject to change until the Company presents its first financial statements from the date of initial application.
The Company has not early adopted any standards and interpretations that have been issued or amended but are not yet effective for the year ended December 31, 2018. Therefore, there are no other standards that are not yet effective and that would be expected to have a material impact on the entity in the current or future reporting periods.
The preparation of financial statements requires the use of critical accounting estimates and the application of judgment by management in applying the Company's accounting policies. These estimates are as follows:based on the experience, best knowledge, information available at the statement of financial position date and other factors, including expectations of future events that are believed to be reasonable under the circumstances. Changes in facts and circumstances may lead to the revision of these estimates. Actual future results may differ from the estimates.
| | | | | ||
| ||||||
| | |||||
| | |||||
| ||||||
3. Information by business segment and by geographic area
The Company divided its operations into five reportable segments: Ferrous Minerals, Coal, Base Metals, Fertilizers (presented as discontinued operations) and Others. The segments are aligned with products and reflect the structure used by Management to evaluate group performance. The responsible bodies for making operational decisions, allocating resources and evaluating performance include the Executive Boards and the Board of Directors, which use adjusted EBITDA as a measure of performance.
The information presented to the Executive Board on the performance of each segment is derived from the accounting records, adjusted for reallocations between segments.
The main activities of the operating segments are as follows:
Ferrous minerals—Ferrous minerals comprises the production and extraction of ferrous minerals, as iron ore fines, iron ore pellets and its logistic services (railroads, ports and terminals), manganese and ferroalloys and others ferrous products and services.
Coal—Coal comprises the extraction of metallurgical and thermal coal and its logistic services (railroads, ports and terminals).
Base metals—Base metals include the production and extraction of non-ferrous minerals, and are presented as nickel and its by-products (ferro-nickel, copper, gold, precious metals and others) and copper (copper concentrated).
Fertilizers (Discontinued operations)—Fertilizers include the production of the three major groups of nutrients (potash, phosphate and nitrogen) and other fertilizers products. The group of assets related to this segment is classified as "Non-current assets and liabilities held for sale" (note 14).
Others—The segments of others comprise sales and expenses of other products, services and investments in joint ventures and associate in other business.
Notes to the Financial Statements (Continued)
Expressed in millions of United States dollar, unless otherwise stated
3. Information by business segment and by geographic area (Continued)
a) Adjusted EBITDA
The definition of adjusted EBITDA for the Company is the operating income or loss excluding (i) the depreciation, depletion and amortization, (ii) results on measurement or sales of non-current assets, (iii) impairment, (iv) onerous contracts and plus (v) dividends received from associates and joint ventures.
| | | Year ended December 31, 2016 | | |||||||||||||||||||||||||||||||||
|---|---|---|---|---|---|---|---|---|---|---|---|---|---|---|---|---|---|---|---|---|---|---|---|---|---|---|---|---|---|---|---|---|---|---|---|---|
| | | Net operating revenue | | Cost of goods sold and services rendered | | Sales, administrative and other operating expenses | | Research and evaluation expenses | | Pre operating and operational stoppage | | Dividends received from associates and joint ventures | | Adjusted EBITDA | | |||||||||||||||||||||
Ferrous minerals | | | | | | | | | | | | | | | | | | | | | | | ||||||||||||||
Iron ore | | | 15,784 | | | | (6,622 | ) | | | (486 | ) | | | (91 | ) | | | (150 | ) | | | 10 | | | | 8,445 | | | |||||||
Pellets | | | 3,827 | | | | (2,002 | ) | | | (73 | ) | | | (13 | ) | | | (22 | ) | | | 103 | | | | 1,820 | | | |||||||
Ferroalloys and manganese | | | 302 | | | | (231 | ) | | | (4 | ) | | | — | | | | (11 | ) | | | — | | | | 56 | | | |||||||
Other ferrous products and services | | | 438 | | | | (269 | ) | | | (8 | ) | | | (2 | ) | | | (4 | ) | | | — | | | | 155 | | | |||||||
| | | | | | | | | | | | | | | | | |||||||||||||||||||||
| | | 20,351 | | | | (9,124 | ) | | | (571 | ) | | | (106 | ) | | | (187 | ) | | | 113 | | | | 10,476 | | | ||||||||
Coal | | | 839 | | | | (872 | ) | | | 35 | | | | (15 | ) | | | (41 | ) | | | — | | | | (54 | ) | | |||||||
Base metals | | | | | | | | | | | | | | | | | | | | | | | ||||||||||||||
Nickel and other products | | | 4,472 | | | | (3,204 | ) | | | (95 | ) | | | (78 | ) | | | (114 | ) | | | 4 | | | | 985 | | | |||||||
Copper | | | 1,667 | | | | (924 | ) | | | (25 | ) | | | (5 | ) | | | — | | | | — | | | | 713 | | | |||||||
Other base metals products | | | — | | | | — | | | | 150 | | | | — | | | | — | | | | — | | | | 150 | | | |||||||
| | | | | | | | | | | | | | | | | |||||||||||||||||||||
| | | 6,139 | | | | (4,128 | ) | | | 30 | | | | (83 | ) | | | (114 | ) | | | 4 | | | | 1,848 | | | ||||||||
Others | | | 159 | | | | (259 | ) | | | (157 | ) | | | (116 | ) | | | (1 | ) | | | 76 | | | | (298 | ) | | |||||||
| | | | | | | | | | | | | | | | | |||||||||||||||||||||
Total of continuing operations | | | 27,488 | | | | (14,383 | ) | | | (663 | ) | | | (320 | ) | | | (343 | ) | | | 193 | | | | 11,972 | | | |||||||
| | | | | | | | | | | | | | | | | |||||||||||||||||||||
| | | | | | | | | | | | | | | | | | | | | | | | | | | | | | | |||||||
| | | | | | | | | | | | | | | | | |||||||||||||||||||||
Discontinued operations (Fertilizers) | | | 1,875 | | | | (1,545 | ) | | | (87 | ) | | | (22 | ) | | | (16 | ) | | | 4 | | | | 209 | | | |||||||
| | | | | | | | | | | | | | | | | |||||||||||||||||||||
Total | | | 29,363 | | | | (15,928 | ) | | | (750 | ) | | | (342 | ) | | | (359 | ) | | | 197 | | | | 12,181 | | | |||||||
| | | | | | | | | | | | | | | | | |||||||||||||||||||||
| | | | | | | | | | | | | | | | | | | | | | | | | | | | | | | |||||||
| | | | | | | | | | | | | | | | | |||||||||||||||||||||
![]()
Notes to2. Basis for preparation of the Financial Statementsfinancial statements (Continued)
ExpressedThe significant estimates and judgments applied by Company in millionsthe preparation of United States dollar, unless otherwise stated
| | | Net operating revenue | | Cost of goods sold and services rendered | | Sales, administrative and other operating expenses | | Research and evaluation expenses | | Pre operating and operational stoppage | | Dividends received from associates and joint ventures | | Adjusted EBITDA | | |||||||||||||||||||||
|---|---|---|---|---|---|---|---|---|---|---|---|---|---|---|---|---|---|---|---|---|---|---|---|---|---|---|---|---|---|---|---|---|---|---|---|---|
| | | Year ended December 31, 2015 | | |||||||||||||||||||||||||||||||||
Ferrous minerals | | | | | | | | | | | | | | | | | | | | | | | ||||||||||||||
Iron ore | | | 12,330 | | | | (7,604 | ) | | | (398 | ) | | | (121 | ) | | | (124 | ) | | | 22 | | | | 4,105 | | | |||||||
Pellets | | | 3,600 | | | | (2,121 | ) | | | 9 | | | | (4 | ) | | | (24 | ) | | | 225 | | | | 1,685 | | | |||||||
Ferroalloys and manganese | | | 162 | | | | (175 | ) | | | 1 | | | | — | | | | (19 | ) | | | — | | | | (31 | ) | | |||||||
Other ferrous products and services | | | 470 | | | | (341 | ) | | | 8 | | | | (3 | ) | | | (2 | ) | | | 8 | | | | 140 | | | |||||||
| | | | | | | | | | | | | | | | | |||||||||||||||||||||
| | | 16,562 | | | | (10,241 | ) | | | (380 | ) | | | (128 | ) | | | (169 | ) | | | 255 | | | | 5,899 | | | ||||||||
Coal | | | 526 | | | | (839 | ) | | | (140 | ) | | | (22 | ) | | | (61 | ) | | | 28 | | | | (508 | ) | | |||||||
Base metals | | | | | | | | | | | | | | | | | | | | | | | ||||||||||||||
Nickel and other products | | | 4,693 | | | | (3,393 | ) | | | (154 | ) | | | (103 | ) | | | (411 | ) | | | — | | | | 632 | | | |||||||
Copper | | | 1,470 | | | | (903 | ) | | | (32 | ) | | | (8 | ) | | | (1 | ) | | | — | | | | 526 | | | |||||||
Other base metals products | | | — | | | | — | | | | 230 | | | | — | | | | — | | | | — | | | | 230 | | | |||||||
| | | | | | | | | | | | | | | | | |||||||||||||||||||||
| | | 6,163 | | | | (4,296 | ) | | | 44 | | | | (111 | ) | | | (412 | ) | | | — | | | | 1,388 | | | ||||||||
Others | | | 133 | | | | (139 | ) | | | (160 | ) | | | (134 | ) | | | — | | | | 35 | | | | (265 | ) | | |||||||
| | | | | | | | | | | | | | | | | |||||||||||||||||||||
Total of continuing operations | | | 23,384 | | | | (15,515 | ) | | | (636 | ) | | | (395 | ) | | | (642 | ) | | | 318 | | | | 6,514 | | | |||||||
| | | | | | | | | | | | | | | | | |||||||||||||||||||||
| | | | | | | | | | | | | | | | | | | | | | | | | | | | | | | |||||||
| | | | | | | | | | | | | | | | | |||||||||||||||||||||
Discontinued operations (Fertilizers) | | | 2,225 | | | | (1,469 | ) | | | (37 | ) | | | (82 | ) | | | (70 | ) | | | — | | | | 567 | | | |||||||
| | | | | | | | | | | | | | | | | |||||||||||||||||||||
Total | | | 25,609 | | | | (16,984 | ) | | | (673 | ) | | | (477 | ) | | | (712 | ) | | | 318 | | | | 7,081 | | | |||||||
| | | | | | | | | | | | | | | | | |||||||||||||||||||||
| | | | | | | | | | | | | | | | | | | | | | | | | | | | | | | |||||||
| | | | | | | | | | | | | | | | | |||||||||||||||||||||
![]()
Notes to the Financial Statements (Continued)
Expressed in millions of United States dollar, unless otherwise stated
| | | Net operating revenue | | Cost of goods sold and services rendered | | Sales, administrative and other operating expenses | | Research and evaluation expenses | | Pre operating and operational stoppage | | Dividends received from associates and joint ventures | | Adjusted EBITDA | | |||||||||||||||||||||
|---|---|---|---|---|---|---|---|---|---|---|---|---|---|---|---|---|---|---|---|---|---|---|---|---|---|---|---|---|---|---|---|---|---|---|---|---|
| | | Year ended December 31, 2014 | | |||||||||||||||||||||||||||||||||
Ferrous minerals | | | | | | | | | | | | | | | | | | | | | | | ||||||||||||||
Iron ore | | | 19,301 | | | | (9,532 | ) | | | (1,258 | ) | | | (319 | ) | | | (160 | ) | | | 44 | | | | 8,076 | | | |||||||
Pellets | | | 5,263 | | | | (2,705 | ) | | | (21 | ) | | | — | | | | (38 | ) | | | 482 | | | | 2,981 | | | |||||||
Ferroalloys and manganese | | | 392 | | | | (261 | ) | | | (13 | ) | | | — | | | | (23 | ) | | | — | | | | 95 | | | |||||||
Other ferrous products and services | | | 741 | | | | (565 | ) | | | 3 | | | | (10 | ) | | | — | | | | — | | | | 169 | | | |||||||
| | | | | | | | | | | | | | | | | |||||||||||||||||||||
| | | 25,697 | | | | (13,063 | ) | | | (1,289 | ) | | | (329 | ) | | | (221 | ) | | | 526 | | | | 11,321 | | | ||||||||
Coal | | | 739 | | | | (1,071 | ) | | | (309 | ) | | | (18 | ) | | | (38 | ) | | | 28 | | | | (669 | ) | | |||||||
Base metals | | | | | | | | | | | | | | | | | | | | | | | ||||||||||||||
Nickel and other products | | | 6,241 | | | | (3,710 | ) | | | 101 | | | | (138 | ) | | | (514 | ) | | | — | | | | 1,980 | | | |||||||
Copper | | | 1,451 | | | | (877 | ) | | | (12 | ) | | | (5 | ) | | | (16 | ) | | | — | | | | 541 | | | |||||||
| | | | | | | | | | | | | | | | | |||||||||||||||||||||
| | | 7,692 | | | | (4,587 | ) | | | 89 | | | | (143 | ) | | | (530 | ) | | | — | | | | 2,521 | | | ||||||||
Others | | | 996 | | | | (601 | ) | | | (329 | ) | | | (172 | ) | | | (6 | ) | | | 14 | | | | (98 | ) | | |||||||
| | | | | | | | | | | | | | | | | |||||||||||||||||||||
Total of continuing operations | | | 35,124 | | | | (19,322 | ) | | | (1,838 | ) | | | (662 | ) | | | (795 | ) | | | 568 | | | | 13,075 | | | |||||||
| | | | | | | | | | | | | | | | | |||||||||||||||||||||
| | | | | | | | | | | | | | | | | | | | | | | | | | | | | | | |||||||
| | | | | | | | | | | | | | | | | |||||||||||||||||||||
Discontinued operations (Fertilizers) | | | 2,415 | | | | (1,885 | ) | | | (95 | ) | | | (72 | ) | | | (85 | ) | | | — | | | | 278 | | | |||||||
| | | | | | | | | | | | | | | | | |||||||||||||||||||||
Total | | | 37,539 | | | | (21,207 | ) | | | (1,933 | ) | | | (734 | ) | | | (880 | ) | | | 568 | | | | 13,353 | | | |||||||
| | | | | | | | | | | | | | | | | |||||||||||||||||||||
| | | | | | | | | | | | | | | | | | | | | | | | | | | | | | | |||||||
| | | | | | | | | | | | | | | | | |||||||||||||||||||||
![]()
Notes to the Financial Statements (Continued)
Expressed in millions of United States dollar, unless otherwise stated
3. Information by business segment and by geographic area (Continued)
Adjusted EBITDA is reconciled to net income (loss)these financial statements are as follows:
| | | Year ended December 31 | | |||||||||||||
|---|---|---|---|---|---|---|---|---|---|---|---|---|---|---|---|---|
| | | 2016 | | 2015 | | 2014 | | |||||||||
Adjusted EBITDA from continuing operations | | | 11,972 | | | | 6,514 | | | | 13,075 | | | |||
| | | | | | | | | |||||||||
Depreciation, depletion and amortization | | | (3,487 | ) | | | (3,719 | ) | | | (3,869 | ) | | |||
Dividends received from associates and joint ventures | | | (193 | ) | | | (318 | ) | | | (568 | ) | | |||
Results on measurement or sale of non-current assets | | | (66 | ) | | | 61 | | | | (167 | ) | | |||
Impairment of non-current assets and onerous contracts | | | (1,174 | ) | | | (8,769 | ) | | | (99 | ) | | |||
| | | | | | | | | |||||||||
Operating income (loss) | | | 7,052 | | | | (6,231 | ) | | | 8,372 | | | |||
Financial results, net | | | 1,843 | | | | (10,654 | ) | | | (6,018 | ) | | |||
Equity results in associates and joint ventures | | | 309 | | | | (445 | ) | | | 501 | | | |||
Impairment and others results in associates and joint ventures | | | (1,220 | ) | | | (349 | ) | | | (61 | ) | | |||
Income taxes | | | (2,781 | ) | | | 5,249 | | | | (1,603 | ) | | |||
| | | | | | | | | |||||||||
Income (loss) from continuing operations | | | 5,203 | | | | (12,430 | ) | | | 1,191 | | | |||
Loss attributable to noncontrolling interests | | | (8 | ) | | | (501 | ) | | | (308 | ) | | |||
| | | | | | | | | |||||||||
Income (loss) attributable to Vale's stockholders | | | 5,211 | | | | (11,929 | ) | | | 1,499 | | | |||
| | | | | | | | | |||||||||
| | | | | | | | | | | | | | | |||
| | | | | | | | | |||||||||
Note | | Significant estimates and judgments |
|---|---|---|
| 7 | | Deferred revenue |
| 8 | | Deferred income taxes |
| 16 | | Consolidation |
| 19 | | Mineral reserves and mines useful life |
| 20 | | Impairment of non-current assets |
| 22 | | Liabilities related to associates and joint ventures |
| 24 | | Fair values estimate |
| 27 | | Asset retirement obligations |
| 28 | | Litigation |
| 29 | | Employee post-retirement obligations |
On January 25, 2019 (subsequent event), a breach has been experienced in the Dam I of the Córrego do Feijão mine, which belongs to the Paraopebas Complex in the Southern System, located in Brumadinho, Minas Gerais, Brasil ("Brumadinho dam"). This dam was inactive since 2016 (without additional tailings disposal) and there was no other operational activity in this structure.
Due to the dam failure, 306 people lost their lives or are missing and ecosystems were affected. Around 11.7 million metric tons of iron ore waste were contained in the Brumadinho dam. It is not yet known the exact volume of iron ore waste that was released due to the dam failure. The tailings contained in the Dam I have caused an impact of around 270 km in extension, destroying some of Vale's facilities, affecting local communities and disturbing the environment. The Paraopeba river and its ecosystems have also been impacted by the event.
The Company has not been sparing efforts to support the victims and to mitigate and recover the social and environmental damages resulting from the breach of the dam. Vale has provided support in multiple ways, aiming to ensure the humanitarian assistance to those affected by the dam breach.
To determine the causes for the event, Vale has engaged a panel of independent experts. Furthermore, the Company established three Extraordinary Independent Consulting Committees to support the Board of Directors, which are composed by independent members that are unrelated to the management or to the Company's operations to ensure that the initiatives by the committees be unbiased. Following are the committees:
| | | | |
| | F-18 | | |
| | | Year ended December 31 | | |||||||||||||
|---|---|---|---|---|---|---|---|---|---|---|---|---|---|---|---|---|
| | | 2016 | | 2015 | | 2014 | | |||||||||
Adjusted EBITDA from discontinued operations | | | 209 | | | | 567 | | | | 278 | | | |||
| | | | | | | | | |||||||||
Depreciation, depletion and amortization | | | (347 | ) | | | (310 | ) | | | (418 | ) | | |||
Dividends received from associates and joint ventures | | | (4 | ) | | | – | | | | – | | | |||
Results on measurement or sale of non-current assets | | | (1,738 | ) | | | (157 | ) | | | (1,054 | ) | | |||
| | | | | | | | | |||||||||
Operating income (loss) | | | (1,880 | ) | | | 100 | | | | (1,194 | ) | | |||
Financial results, net | | | 20 | | | | (147 | ) | | | (51 | ) | | |||
Equity results in associates and joint ventures | | | 3 | | | | 6 | | | | 4 | | | |||
Income taxes | | | 630 | | | | (149 | ) | | | 403 | | | |||
| | | | | | | | | |||||||||
Loss from discontinued operations | | | (1,227 | ) | | | (190 | ) | | | (838 | ) | | |||
Income attributable to noncontrolling interests | | | 2 | | | | 10 | | | | 4 | | | |||
| | | | | | | | | |||||||||
Loss attributable to Vale's stockholders | | | (1,229 | ) | | | (200 | ) | | | (842 | ) | | |||
| | | | | | | | | |||||||||
| | | | | | | | | | | | | | | |||
| | | | | | | | | |||||||||
| | | Year ended December 31, 2016 | | |||||||||||||||||||||||
|---|---|---|---|---|---|---|---|---|---|---|---|---|---|---|---|---|---|---|---|---|---|---|---|---|---|---|
| | | Product inventory | | Investments in associates and joint ventures | | Property, plant and equipment and intangible assets (i) | | Additions to property, plant and equipment and intangible (ii) | | Depreciation, depletion and amortization (iii) | | |||||||||||||||
Ferrous minerals | | | 1,134 | | | | 1,808 | | | | 34,834 | | | | 3,246 | | | | 1,618 | | | |||||
Coal | | | 126 | | | | 285 | | | | 1,907 | | | | 612 | | | | 191 | | | |||||
Base metals | | | 1,110 | | | | 12 | | | | 23,372 | | | | 1,057 | | | | 1,658 | | | |||||
Others | | | 3 | | | | 1,591 | | | | 2,177 | | | | 36 | | | | 20 | | | |||||
| | | | | | | | | | | | | |||||||||||||||
Total | | | 2,373 | | | | 3,696 | | | | 62,290 | | | | 4,951 | | | | 3,487 | | | |||||
| | | | | | | | | | | | | |||||||||||||||
| | | | | | | | | | | | | | | | | | | | | | | |||||
| | | | | | | | | | | | | |||||||||||||||
![]()
Notes to the Financial Statements (Continued)
Expressed in millions of United States dollar, unless otherwise stated
3. InformationBrumadinho's dam failure (Continued)
| | | Year ended December 31, 2015 | | |||||||||||||||||||||||
|---|---|---|---|---|---|---|---|---|---|---|---|---|---|---|---|---|---|---|---|---|---|---|---|---|---|---|
| | | Product inventory | | Investments in associates and joint ventures | | Property, plant and equipment and intangible assets (i) | | Additions to property, plant and equipment and intangible (ii) | | Depreciation, depletion and amortization (iii) | | |||||||||||||||
Ferrous minerals | | | 1,036 | | | | 1,479 | | | | 28,202 | | | | 4,941 | | | | 1,669 | | | |||||
Coal | | | 53 | | | | 306 | | | | 1,812 | | | | 1,539 | | | | 192 | | | |||||
Base metals | | | 1,166 | | | | 17 | | | | 23,522 | | | | 1,555 | | | | 1,841 | | | |||||
Others | | | 3 | | | | 1,063 | | | | 2,024 | | | | 79 | | | | 17 | | | |||||
Discontinued operations (Fertilizers) | | | 295 | | | | 75 | | | | 3,866 | | | | 257 | | | | 310 | | | |||||
| | | | | | | | | | | | | |||||||||||||||
Total | | | 2,553 | | | | 2,940 | | | | 59,426 | | | | 8,371 | | | | 4,029 | | | |||||
| | | | | | | | | | | | | |||||||||||||||
| | | | | | | | | | | | | | | | | | | | | | | |||||
| | | | | | | | | | | | | |||||||||||||||
In addition, Vale has determined the suspension (i) of the variable remuneration of its executives; (ii) the Shareholder's Remuneration Policy and (iii) any other resolution related to shares buyback. The Company paid the shareholders in anticipation of the remuneration for the year, the amount of US$1,246 e US$1,835, respectively.1,876 in September 2018, approved by the Board of Directors on July 25, 2018. This payment was higher than the minimum mandatory remuneration for the year ended December 31, 2018 and consequently no additional dividends to shareholders is required (note 30).
The Company has concluded for the purpose of these financial statements that the dam breach and the following events are not a condition that existed at the end of the reporting period, and therefore does not require adjustments in the book values recognized in the income statement.
At the current stage of the investigations, assessments of the causes and possible third parties lawsuits, it is not possible to have a reliable measure of all cost that the Company may incur for the purpose of disclosure in the financial statements. The amounts that are being disclosed took into consideration the best estimates by the Company´s management.
On January 29, 2019 the Company has informed the market and Brazilian authorities its decision to speed up the plan to "de-characterize" all of its tailings dams built by the upstream method (same method as Brumadinho dam), located in associatesBrazil. The "de-characterizing" means that the structure will be dismantled and joint ventures, intangiblewill no longer have its original operational characteristics.
The Company is developing specific studies for the de-characterization of these dams which will be submitted for approval by the relevant authorities when concluded, in accordance with regulations and property, plantlegal requirements. The estimate on January 29, 2019, based on a preliminary assessment, resulted in a total amount of US$1.3 billion (R$5 billion) assuming the removal and equipmentreprocessing of all tailings contained in the upstream dams, followed by geographic areathe fully recovery of the sites in the "de-characterization" method.
| | | | |
| | F-19 | | |
| | | December 31, 2016 | | December 31, 2015 | | ||||||||||||||||||||||||||||||||||||
|---|---|---|---|---|---|---|---|---|---|---|---|---|---|---|---|---|---|---|---|---|---|---|---|---|---|---|---|---|---|---|---|---|---|---|---|---|---|---|---|---|---|
| | | Investments in associates and joint ventures | | Intangible | | Property, plant and equipment | | Total | | Investments in associates and joint ventures | | Intangible | | Property, plant and equipment | | Total | | ||||||||||||||||||||||||
Brazil | | | 3,172 | | | | 4,720 | | | | 34,509 | | | | 42,401 | | | | 2,408 | | | | 3,285 | | | | 32,190 | | | | 37,883 | | | ||||||||
Canada | | | – | | | | 2,002 | | | | 10,267 | | | | 12,269 | | | | 2 | | | | 2,039 | | | | 10,589 | | | | 12,630 | | | ||||||||
Americas, except Brazil and Canada | | | 185 | | | | – | | | | 30 | | | | 215 | | | | 157 | | | | – | | | | 456 | | | | 613 | | | ||||||||
Europe | | | – | | | | – | | | | 639 | | | | 639 | | | | – | | | | – | | | | 608 | | | | 608 | | | ||||||||
Asia | | | 339 | | | | – | | | | 4,173 | | | | 4,512 | | | | 367 | | | | – | | | | 5,219 | | | | 5,586 | | | ||||||||
Australia | | | – | | | | – | | | | 43 | | | | 43 | | | | – | | | | – | | | | 74 | | | | 74 | | | ||||||||
New Caledonia | | | – | | | | – | | | | 3,087 | | | | 3,087 | | | | – | | | | – | | | | 3,521 | | | | 3,521 | | | ||||||||
Mozambique | | | – | | | | 149 | | | | 1,715 | | | | 1,864 | | | | – | | | | – | | | | 442 | | | | 442 | | | ||||||||
Oman | | | – | | | | – | | | | 956 | | | | 956 | | | | – | | | | – | | | | 1,003 | | | | 1,003 | | | ||||||||
Other regions | | | – | | | | – | | | | – | | | | – | | | | 6 | | | | – | | | | – | | | | 6 | | | ||||||||
| | | | | | | | | | | | | | | | | | | ||||||||||||||||||||||||
Total | | | 3,696 | | | | 6,871 | | | | 55,419 | | | | 65,986 | | | | 2,940 | | | | 5,324 | | | | 54,102 | | | | 62,366 | | | ||||||||
| | | | | | | | | | | | | | | | | | | ||||||||||||||||||||||||
| | | | | | | | | | | | | | | | | | | | | | | | | | | | | | | | | | | ||||||||
| | | | | | | | | | | | | | | | | | | ||||||||||||||||||||||||
| | | Year ended December 31, 2016 | | |||||||||||||||||||||||
|---|---|---|---|---|---|---|---|---|---|---|---|---|---|---|---|---|---|---|---|---|---|---|---|---|---|---|
| | | Ferrous minerals | | Coal | | Base metals | | Others | | Total | | |||||||||||||||
Americas, except United States and Brazil | | | 334 | | | | 20 | | | | 1,172 | | | | – | | | | 1,526 | | | |||||
United States of America | | | 232 | | | | – | | | | 749 | | | | 24 | | | | 1,005 | | | |||||
Europe | | | 2,559 | | | | 218 | | | | 1,854 | | | | 17 | | | | 4,648 | | | |||||
Middle East/Africa/Oceania | | | 1,252 | | | | 95 | | | | 20 | | | | – | | | | 1,367 | | | |||||
Japan | | | 1,292 | | | | 121 | | | | 328 | | | | – | | | | 1,741 | | | |||||
China | | | 11,985 | | | | 63 | | | | 699 | | | | – | | | | 12,747 | | | |||||
Asia, except Japan and China | | | 912 | | | | 305 | | | | 1,173 | | | | – | | | | 2,390 | | | |||||
Brazil | | | 1,785 | | | | 17 | | | | 144 | | | | 118 | | | | 2,064 | | | |||||
| | | | | | | | | | | | | |||||||||||||||
Net operating revenue | | | 20,351 | | | | 839 | | | | 6,139 | | | | 159 | | | | 27,488 | | | |||||
| | | | | | | | | | | | | |||||||||||||||
| | | | | | | | | | | | | | | | | | | | | | | |||||
| | | | | | | | | | | | | |||||||||||||||
![]()
Notes to the Financial Statements (Continued)
Expressed in millions of United States dollar, unless otherwise stated
3. Information by business segment and by geographic areaBrumadinho's dam failure (Continued)
Before the event, the decommissioning plans of these dams were based on a method which aimed to ensure the physical and chemical stability of the structures, not necessarily, in all cases, removing and reprocessing the tailings contained in the dams. Since the event, the Company has been working on an individual detailed engineering plans to each of these dams to allow the total de-characterization of the structures. The Company is still developing the revised estimate for the costs to de-characterize the upstream dams and, therefore, the additional amount to the provision that will be recognized and disclosed in 2019 could not be reliably estimated.
In order to carry out safely the de-characterization of the dams, the Company has temporarily stopped the production of the units where the upstream dams are located, as already disclosed to the market. The stoppage results in a reduction in production of approximately 40 million tons of iron ore on annual basis.
In addition, the Company has other operations that are temporarily suspended due to judicial decisions or technical analysis performed by the Company on the dams, which represents a potential reduction in sales of 52.8 million tons of iron ore. The Company is working on legal and technical measures to resume these operations.
For reference, the Company sold 365 million tons of iron ore and pellets in 2018.
Due to the dam failure and review undertaken on the safety requirements for other dams in the Minas Gerais region, when necessary people were placed in temporary accommodation.
Following the event and the decision to speed up the de-characterization of the upstream dams, the Company will write-off assets of the Córrego do Feijão mine and those related to the upstream dams in Brazil, resulting in a loss of US$124 (R$480 million) in 2019, which will impact the Company's balance sheet and income statement.
The Company has been working together with the authorities and society to remediate the environmental and social impacts of the event. As a result, the Company has started negotiations and entered into agreements with the relevant authorities and affected people.
Public Ministry of Labor
On February 15, 2019, Vale entered into a preliminary agreement with the Public Ministry of Labor to indemnify the direct and third-party employees of the Córrego do Feijão mine who were affected by the termination of this operation. Under the terms of the agreement, Vale will maintain the jobs of its direct employees until December 31, 2019 and will either assist terminated third party employees with a replacement or pay their salaries until December 31, 2019.
| | | | |
| | F-20 | | |
| | | Year ended December 31, 2015 | | |||||||||||||||||||||||
|---|---|---|---|---|---|---|---|---|---|---|---|---|---|---|---|---|---|---|---|---|---|---|---|---|---|---|
| | | Ferrous minerals | | Coal | | Base metals | | Others | | Total | | |||||||||||||||
Americas, except United States and Brazil | | | 359 | | | | 18 | | | | 1,122 | | | | – | | | | 1,499 | | | |||||
United States of America | | | 30 | | | | – | | | | 804 | | | | 21 | | | | 855 | | | |||||
Europe | | | 2,506 | | | | 102 | | | | 1,921 | | | | – | | | | 4,529 | | | |||||
Middle East/Africa/Oceania | | | 1,009 | | | | 97 | | | | 84 | | | | – | | | | 1,190 | | | |||||
Japan | | | 1,512 | | | | 74 | | | | 373 | | | | – | | | | 1,959 | | | |||||
China | | | 8,400 | | | | 44 | | | | 651 | | | | – | | | | 9,095 | | | |||||
Asia, except Japan and China | | | 1,081 | | | | 169 | | | | 990 | | | | – | | | | 2,240 | | | |||||
Brazil | | | 1,665 | | | | 22 | | | | 218 | | | | 112 | | | | 2,017 | | | |||||
| | | | | | | | | | | | | |||||||||||||||
Net operating revenue | | | 16,562 | | | | 526 | | | | 6,163 | | | | 133 | | | | 23,384 | | | |||||
| | | | | | | | | | | | | |||||||||||||||
| | | | | | | | | | | | | | | | | | | | | | | |||||
| | | | | | | | | | | | | |||||||||||||||
| | | Year ended December 31, 2014 | | |||||||||||||||||||||||
|---|---|---|---|---|---|---|---|---|---|---|---|---|---|---|---|---|---|---|---|---|---|---|---|---|---|---|
| | | Ferrous minerals | | Coal | | Base metals | | Others | | Total | | |||||||||||||||
Americas, except United States and Brazil | | | 652 | | | | 3 | | | | 1,373 | | | | 21 | | | | 2,049 | | | |||||
United States of America | | | 24 | | | | – | | | | 1,099 | | | | 245 | | | | 1,368 | | | |||||
Europe | | | 3,894 | | | | 115 | | | | 2,586 | | | | 13 | | | | 6,608 | | | |||||
Middle East/Africa/Oceania | | | 1,608 | | | | 110 | | | | 149 | | | | – | | | | 1,867 | | | |||||
Japan | | | 2,566 | | | | 192 | | | | 863 | | | | 6 | | | | 3,627 | | | |||||
China | | | 11,939 | | | | 76 | | | | 642 | | | | – | | | | 12,657 | | | |||||
Asia, except Japan and China | | | 2,189 | | | | 235 | | | | 828 | | | | – | | | | 3,252 | | | |||||
Brazil | | | 2,825 | | | | 8 | | | | 152 | | | | 711 | | | | 3,696 | | | |||||
| | | | | | | | | | | | | |||||||||||||||
Net operating revenue | | | 25,697 | | | | 739 | | | | 7,692 | | | | 996 | | | | 35,124 | | | |||||
| | | | | | | | | | | | | |||||||||||||||
| | | | | | | | | | | | | | | | | | | | | | | |||||
| | | | | | | | | | | | | |||||||||||||||
Accounting policy
Revenue is recognized when Vale transfers to its customers all of the significant risks and rewards of ownership of the product sold or when the services are rendered. Net revenue excludes any applicable sales taxes and is recognized at the fair value of the consideration received or receivable to the extent that it is probable that economic benefits will flow to Vale and the revenues can be reliably measured.
Depending on the contract, sales can be recognized when the product is available at the loading port, loaded on the ship, at the port of discharge or on the costumer warehouse. Service revenues are recognized in the amount by which the services are rendered and accepted by the customer.
In some cases, the sale price is determined on a provisional basis at the date of sale and adjustments to the sales price subsequently occur based on movements in quoted market or contractual prices up to the date of final pricing. Revenue is recognized based on the estimated fair value of the total consideration receivable, and the provisionally priced sales mechanism embedded within these sale arrangements is characterized as a derivative. Therefore, the fair value of the final sales price adjustment is re-estimated continuously and changes in fair value are recognized as operational revenue in the income statement. As of December 31, 2016, US$412 of revenues (2015: US$(274)) were still not settled and were provisionally measured based on iron ore fines and copper forward prices.
![]()
Notes to the Financial Statements (Continued)
Expressed in millions of United States dollar, unless otherwise stated
3. Brumadinho's dam failure (Continued)
The Company will also keep paying wages regularly to the missing people until the authorities have considered them as fatal victims of the event and will pay to the families of the fatal victims an amount equivalent to two thirds of their wages until December 31, 2019 or until Vale reaches the final agreement with the Public Ministry of Labor.
Under the terms proposed by Vale and considering the uncertainties related to the necessary procedures to estimate the amount to be spent, including the number of individuals entitled to indemnification, the Company has estimated that this agreement will result in a provision of approximately US$220 (R$850 million) in 2019.
Moreover, the Company will provide a lifelong medical insurance benefit to the widows and widowers and a similar benefit to the dependents of the victims until they are 22 years old. Due to the preliminary stage of this agreement and considering the complexity of an actuarial estimate, it is not possible yet to determine a range of outcomes or reliable estimates and, therefore, the amount of the provision related to this obligation could not be estimated. The Company expects to have this information during the course of 2019.
Brazilian Federal Government, State of Minas Gerais, Public Prosecutors and Public Defendants
On a judicial hearing that took place on February 20, 2019, in the scope of the public civil action n° 5010709-36.2019.8.13.0024, in process of the 6th Public Treasury Lower Court of Belo Horizonte, Vale entered into a preliminary agreement with the State of Minas Gerais, Federal Government and representatives of Public Authorities in which the Company commits to make emergency indemnification payments to the residents of Brumadinho and the communities that are located up to one kilometer from the Paraopeba river bed, from Brumadinho to the city of Pompéu, subject to registration.
Due to this agreement, the Company will anticipate indemnification to each family member through monthly payments during a 12-month period, which changes based, among other factors, on the age of the beneficiary. The Company has initially estimated a provision ranging from US$260 (R$1 billion) to US$520 (R$2 billion) related to these payments, depending on the number of beneficiaries that will be registered.
The agreement also includes the following measures: (i) independent technical assistance to support on the individual indemnities of those affected, if requested; and (ii) reimbursement or direct funding of the extraordinary expenses of the State of Minas Gerais and its governmental bodies due to the dam failure, including transportation, accommodation and food expenses of the employees involved in the rescue and other emergency actions. The respective amounts are still being estimated by the State of Minas Gerais and will be presented in Court.
| | | | |
| | F-21 | | |
![]()
Notes to the Financial Statements (Continued)
Expressed in millions of United States dollar, unless otherwise stated
3. Brumadinho's dam failure (Continued)
Donations
Vale has offered donations of US$26 thousand (R$100 thousand) to each of the families with missing members or affected by fatalities, US$13 thousand (R$50 thousand) to families that resided in the Self-Saving Zone ("ZAS") near to Brumadinho dam, US$4 thousand (R$15 thousand) to business owners of the region and US$1 thousand (R$5 thousand) for each family that resided in the ZAS of Sul Superior dam, which belongs to the Gongo Soco mine, in Barão de Cocais. The estimated amount spent to date is around US$16 (R$62 million). These humanitarian donations will not be subject to any compensation with eventual indemnification obligations that the Company may have with its beneficiaries.
Vale also entered into an agreement with the Brumadinho city, in which the Company will donate to the city an amount of approximately US$21 (R$80 million) over the next 2 years.
Environment and fauna
The Company is building a retention dike for the tailings on the affected areas. The Company has also installed anti-turbidity barriers for sediment retention alongside the Paraopeba River. In addition, Vale has mobilized cleaning, de-sanding and dredging the Paraopeba river channel.
Daily collection points of water and barriers for sediment retention were installed alongside the Paraopeba River, Três Maias reservoir and São Francisco river.
Vale also has set up an exclusive structure for treatment of the rescued animals, enabling emergency care and recovery before the animals are authorized, after veterinarian assessment, to be returned to their tutors.
Furthermore, the Company has agreed to pay the administrative fines imposed by the State Secretary for Environment and Sustainable Development—SEMAD MG, in the total approximated amount of US$26 (R$99 million).
| | | | |
| | F-22 | | |
![]()
Notes to the Financial Statements (Continued)
Expressed in millions of United States dollar, unless otherwise stated
3. Brumadinho's dam failure (Continued)
The Company has incurred the following expenses up to the present moment:
| | 2019 | |
|---|---|---|
Incurred expenses | | |
Administrative sanctions | | 26 |
Donations to the affected people and to the city | | 16 |
Drilling and infrastructure | | 5 |
Environmental recovery | | 4 |
Medical aid and other materials | | 2 |
Fuel and transportation | | 2 |
Others(*) | | 22 |
| | | |
| | 78 | |
| | | |
| | | |
| | | |
Off the events identified at this stage, a significant portion has not been disbursed or measured. The total costs incurred with Vale's employees dedicated to providing support with matters related to the event (including wages), equipment and materials were not measured yet.
Vale is subject to significant contingencies due to the Brumadinho dam failure. Vale has already been named on several judicial and administrative proceedings brought by authorities and affected people and is currently under investigations. New contingencies are expected to come in the future. Vale is still evaluating these contingencies and will recognize a provision based on the stage of these claims. Due to the preliminary stage of the investigations and claims, it is not possible to determine a range of reliable results or estimates of potential exposure related to dam breach at this point in time.
Lawsuits
On January 27, 2019, following the injunctions granted upon the requests of the Public Prosecutors of the State of Minas Gerais and the State of Minas Gerais, the Company had restricted US$2.8 billion (R$11 billion) on its bank accounts to take the necessary measures to reassure the stability of the other dams of the Córrego do Feijão Mine Complex, provide accommodation and assistance to the affected people, remediate environmental impacts, among other obligations.
On January 31, 2019, the Public Ministry of Labor filed a Public Civil Action and a couple of preliminary injunctions were granted determining the freezing of US$400 (R$1.6 billion) on the Company's bank accounts to secure the indemnification of direct and third-party employees that worked in the Córrego de Feijão mine at the time of the Brumadinho dam breach.
| | | | |
| | F-23 | | |
![]()
Notes to the Financial Statements (Continued)
Expressed in millions of United States dollar, unless otherwise stated
3. Brumadinho's dam failure (Continued)
On March 18, 2019 the Public Prosecutor of the State of Minas Gerais filed a Public Civil Action and a preliminary injunction was granted to freeze US$258 (R$1 billion) of the Company's assets, aiming to grant funds that could be required to indemnify for losses that may arise from the evacuation of the community of Sebastião de Águas Claras—Macacos community.
On March 25, 2019, the Public Prosecutor of the State of Minas Gerais filed a Public Civil Action and a preliminary injunction was granted to freeze US$761 (R$2.95 billion) of the Company's assets, to grant funds that might be required to indemnify for losses that may arise from evacuation of the communities in Gongo Soco, Barão de Cocais.
In total, approximately US$4.4 billion (R$16.9 billion) of the Company's assets were blocked, of which approximately US$121 (R$468 million) were freeze on the Company's bank accounts, US$3.3 billion (R$12.6 billion) were converted into judicial deposits and US$1 billion (R$3.75 billion) was guaranteed using 75,312,728 treasury shares out of the 158,216,372 treasury shares held by Vale as at December 31, 2018.
Other collective and individual claims related to the Brumadinho dam breach were filed. Some collective claims were extinguished by the applicable court.
Administrative sanctions
In addition, the Company was notified of the imposition of administrative fines by Brazilian Institute of the Environment and Renewable Natural Resources ("IBAMA"), in the amount of US$65 (R$250 million) and a daily fine of US$26 thousand (R$100 thousand), drawn up on February 7, 2019, which Vale has presented defenses against all of them. In addition, the Brumadinho Municipal Department of the Environment has also imposed fines totaling approximately US$28 (R$108 million), which the Company has also presented a defense.
U.S. Securities class action suits
Vale and certain of its current officers have been named as defendants in securities class action complaints in Federal Courts in New York brought by holders of Vale's securities under U.S. federal securities laws. The complaints allege that Vale made false and misleading statements or omitted to make disclosures concerning the risks and potential damage of a breach of the dam in the Córrego de Feijão mine. The plaintiffs have not specified an amount of alleged damages in these complaints. Vale intends to defend these actions and mount a full defense against these claims. As a consequence of the preliminary nature of these proceedings, it is not possible to determine a range of outcomes or reliable estimates of the potential exposure at this time, and the amount of provision that will be recognized in 2019 could not be estimated.
The Company is negotiating with insurers under its operational risk, general liability and engineering risk policies, but these negotiations are still at a preliminary stage. Any payment of insurance proceeds will depend on the coverage definitions under these policies and assessment of the amount of loss. In light of the uncertainties, no indemnification to the Company was recognized in Vale's financial statements.
| | | | |
| | F-24 | | |
![]()
Notes to the Financial Statements (Continued)
Expressed in millions of United States dollar, unless otherwise stated
4. Information by business segment and by geographic area (Continued)
Amounts billedThe Company operated the following reportable segments during this year: Ferrous Minerals, Coal, Base Metals and Fertilizers (presented as discontinued operations). The segments are aligned with products and reflect the structure used by Management to customersevaluate Company's performance. The responsible bodies for shipping relatedmaking operational decisions, allocating resources and evaluating performance are the Executive Boards and the Board of Directors. The performance of the operating segments is assessed based on a measure of adjusted EBITDA.
The information presented to the Executive Board on the performance of each segment is derived from the accounting records, adjusted for reallocations between segments.
The main activities of the operating segments are as follows:
Ferrous minerals—comprise of the production and extraction of iron ore, iron ore pellets, manganese, ferroalloys, other ferrous products sold byand its logistic services.
Coal—comprise of the Company are recognizedproduction and extraction of metallurgical and thermal coal and its logistic services.
Base metals—include the production and extraction of nickel and its by-products (copper, gold, silver, cobalt, precious metals and others) and copper, as revenue whenwell as their by-products (gold and silver).
Fertilizers (Discontinued operations)—include the production of potash, phosphate, nitrogen and other fertilizer products (note 14).
a) Adjusted EBITDA
The definition of adjusted EBITDA for the Company is responsible for shipping. Shipping costs are recognizedthe operating income or loss plus dividends received and interest from associates and joint ventures, and excluding the amounts charged as operating costs.
4. Special events occurred during the year
The(i) depreciation, depletion and amortization and (ii) special events occurred during(note 4b).
The Company allocate in "Others" the year are those that,sales and expenses of other products, services, research and development, investments in the Company's judgment, significantly impacted the income statement due to their sizejoint ventures and nature. To determine whether an event or transaction is non-recurring, the Company considers quantitativeassociates of other business and qualitative factors, such as frequency and impact on the result of the year.unallocated corporate expenses.
The special events identified by the Company are as follows:
| | | | |
| | F-25 | | |
| | | Year ended December 31 | | |||||||||||||
|---|---|---|---|---|---|---|---|---|---|---|---|---|---|---|---|---|
| | | 2016 | | 2015 | | 2014 | | |||||||||
Samarco Provision | | | (1,109 | ) | | | – | | | | – | | | |||
Results on measurement of non-current assets—Fertilizers business | | | (1,738 | ) | | | – | | | | – | | | |||
Impairment of non-current assets and onerous contracts | | | (1,174 | ) | | | (8,769 | ) | | | (99 | ) | | |||
Gold stream transaction | | | 150 | | | | 230 | | | | – | | | |||
Deferred income tax in foreign jurisdiction | | | – | | | | 2,952 | | | | – | | | |||
| | | | | | | | | |||||||||
Total | | | (3,871 | ) | | | (5,587 | ) | | | (99 | ) | | |||
Samarco—In June 2016, the Company recognized in the income statement the amount of US$1,038 (R$3,733) which represented its best estimate of the obligation to comply with the reparation and compensation programs under the Agreement related to the dam failure of Samarco Mineração S.A. The Company also expensed an amount of US$71 (R$234) applied by Samarco to funds its working capital requirements. For more details, see note 21.
Fertilizers assets—In December 2016, the Company approved the sale of fertilizers assets and the acquisition of a minority interest in The Mosaic Company ("Mosaic"). Vale assessed the net assets of the fertilizer business segment for impairment purposes and a loss in the amount of US$1,738 was recognized. The fertilizers segment is presented as discontinued operations see note 14.
Impairment of non-current assets and onerous contracts—In 2016, the Company recognized an impairment loss of US$1,174 mainly by the reduction in the nickel price projections, see note 19.
Gold stream transaction—In 2016, the Company recognized a gain of the result on sale of mineral rights in the amount of US$150, see note 7.
![]()
Notes to the Financial Statements (Continued)
Expressed in millions of United States dollar, unless otherwise stated
4. Special events occurred during the yearInformation by business segment and by geographic area (Continued)
2015
Impairment of non-current assets and onerous contracts—In 2015,2018, the Company recognized an impairment losshas allocated general and corporate expenses to "Others" as these are not directly related to the performance of US$8,769 mainly by: (i) the reduction in estimated future coal prices combined with the increase of logistics costs and (ii) the reduction the recoverable values of the VNL and VNC CGUs, see note 19.
Gold stream transaction—In 2015, the Company recognized a gain of the result on sale of mineral rightseach business segment. The comparative periods were restated to reflect this change in the amount of US$230, see note 7.allocation criteria.
Deferred income tax—In 2015, in the first adoption of the Law 12.973, the Company recognized assets deferred income tax related to accumulated losses of subsidiaries abroad in the amount of US$2,952, see note 8.
5. Costs and expenses by nature
| | | Year ended December 31 | | | Year ended December 31, 2018 | |||||||||||||||||||||||||||||||
|---|---|---|---|---|---|---|---|---|---|---|---|---|---|---|---|---|---|---|---|---|---|---|---|---|---|---|---|---|---|---|---|---|---|---|---|---|
| | | 2016 | | 2015 | | 2014 | | | Net operating revenue | | Cost of goods sold and services rendered | | Selling, administrative and other operating expenses | | Research and evaluation | | Pre operating and operational stoppage | | Dividends received and interest from associates and joint ventures | | Adjusted EBITDA | |||||||||||||||
Personnel | | | 2,087 | | | 2,092 | | | 2,756 | | | |||||||||||||||||||||||||
Materials and services | | | 3,108 | | | 2,954 | | | 4,306 | | | |||||||||||||||||||||||||
Fuel oil and gas | | | 1,233 | | | 1,207 | | | 1,461 | | | |||||||||||||||||||||||||
Maintenance | | | 2,747 | | | 2,518 | | | 2,353 | | | |||||||||||||||||||||||||
Energy | | | 694 | | | 482 | | | 497 | | | |||||||||||||||||||||||||
Acquisition of products | | | 511 | | | 829 | | | 1,607 | | | |||||||||||||||||||||||||
Depreciation and depletion | | | 3,267 | | | 3,236 | | | 3,468 | | | |||||||||||||||||||||||||
Freight | | | 2,509 | | | 3,496 | | | 3,592 | | | |||||||||||||||||||||||||
Ferrous minerals | | | | | | | | |||||||||||||||||||||||||||||
Iron ore | | 20,354 | | (9,048 | ) | (76 | ) | (110 | ) | (115 | ) | 28 | | 11,033 | ||||||||||||||||||||||
Iron ore Pellets | | 6,651 | | (3,393 | ) | (11 | ) | (26 | ) | (19 | ) | 154 | | 3,356 | ||||||||||||||||||||||
Ferroalloys and manganese | | 454 | | (290 | ) | (3 | ) | (1 | ) | – | | – | | 160 | ||||||||||||||||||||||
Other ferrous products and services | | 474 | | (313 | ) | (4 | ) | (1 | ) | (1 | ) | 7 | | 162 | ||||||||||||||||||||||
| | | | | | | | | | | | | | | | ||||||||||||||||||||||
| | 27,933 | | (13,044 | ) | (94 | ) | (138 | ) | (135 | ) | 189 | | 14,711 | |||||||||||||||||||||||
Coal | | 1,643 | | (1,575 | ) | (9 | ) | (21 | ) | – | | 143 | | 181 | ||||||||||||||||||||||
Base metals | | | | | | | | |||||||||||||||||||||||||||||
Nickel and other products | | 4,610 | | (3,060 | ) | (47 | ) | (39 | ) | (33 | ) | – | | 1,431 | ||||||||||||||||||||||
Copper | | 2,093 | | (960 | ) | (4 | ) | (18 | ) | – | | – | | 1,111 | ||||||||||||||||||||||
| | | | | | | | | | | | | | | | ||||||||||||||||||||||
| | 6,703 | | (4,020 | ) | (51 | ) | (57 | ) | (33 | ) | – | | 2,542 | |||||||||||||||||||||||
Others | | | 1,494 | | | 1,937 | | | 2,750 | | | | 296 | | (263 | ) | (752 | ) | (157 | ) | (21 | ) | 56 | | (841) | |||||||||||
| | | | | | | | | |||||||||||||||||||||||||||||
Total | | | 17,650 | | | 18,751 | | | 22,790 | | | |||||||||||||||||||||||||
| | | | | | | | | |||||||||||||||||||||||||||||
| | | | | | | | | | | | | |||||||||||||||||||||||||
| | | | | | | | | |||||||||||||||||||||||||||||
Cost of goods sold | | | 17,148 | | | 18,233 | | | 21,839 | | | |||||||||||||||||||||||||
Cost of services rendered | | | 502 | | | 518 | | | 951 | | | |||||||||||||||||||||||||
| | | | | | | | | | | | | | | | | | | | | | | |||||||||||||||
Total of continuing operations | | | 17,650 | | | 18,751 | | | 22,790 | | | | 36,575 | | (18,902 | ) | (906 | ) | (373 | ) | (189 | ) | 388 | | (16,593) | |||||||||||
| | | | | | | | | | | | | | | | | | | | | | | | ||||||||||||||
| | | | | | | | | | | | | | | | | | | | | | | |||||||||||||||
Discontinued operations (Fertilizers) | | | 1,887 | | | 1,762 | | | 2,274 | | | | 121 | | (120 | ) | (4 | ) | – | | – | | – | | (3) | |||||||||||
| | | | | | | | | | | | | | | | | | | | | | | |||||||||||||||
Total | | | 19,537 | | | 20,513 | | | 25,064 | | | | 36,696 | | (19,022 | ) | (910 | ) | (373 | ) | (189 | ) | 388 | | (16,590) | |||||||||||
| | | | | | | | | | | | | | | | | | | | | | | | ||||||||||||||
| | | | | | | | | | | | | | | | | | | | | | | |||||||||||||||
| | | | |
| | F-26 | | |
![]()
Notes to the Financial Statements (Continued)
Expressed in millions of United States dollar, unless otherwise stated
4. Information by business segment and by geographic area (Continued)
| | | Year ended December 31, 2017 | | |||||||||||||||||||
|---|---|---|---|---|---|---|---|---|---|---|---|---|---|---|---|---|---|---|---|---|---|---|
| | | Net operating revenue | | Cost of goods sold and services rendered | | Selling, administrative and other operating expenses | | Research and evaluation | | Pre operating and operational stoppage | | Dividends received and interest from associates and joint ventures | | Adjusted EBITDA | | |||||||
Ferrous minerals | | | | | | | | | ||||||||||||||
Iron ore | | 18,524 | | (7,950 | ) | 11 | | (88 | ) | (181 | ) | 30 | | 10,346 | | |||||||
Iron ore Pellets | | 5,653 | | (2,876 | ) | (9 | ) | (19 | ) | (7 | ) | 81 | | 2,823 | | |||||||
Ferroalloys and manganese | | 469 | | (278 | ) | (8 | ) | – | | (4 | ) | – | | 179 | | |||||||
Other ferrous products and services | | 483 | | (306 | ) | 11 | | (2 | ) | – | | 19 | | 205 | | |||||||
| | | | | | | | | | | | | | | | | |||||||
| | 25,129 | | (11,410 | ) | 5 | | (109 | ) | (192 | ) | 130 | | 13,553 | | ||||||||
Coal | | 1,567 | | (1,354 | ) | (12 | ) | (14 | ) | (4 | ) | 179 | | 362 | | |||||||
Base metals | | | | | | | | | ||||||||||||||
Nickel and other products | | 4,667 | | (3,437 | ) | (47 | ) | (49 | ) | (75 | ) | – | | 1,059 | | |||||||
Copper | | 2,204 | | (979 | ) | (15 | ) | (13 | ) | – | | – | | 1,197 | | |||||||
| | | | | | | | | | | | | | | | | |||||||
| | 6,871 | | (4,416 | ) | (62 | ) | (62 | ) | (75 | ) | – | | 2,256 | | ||||||||
Others | | 400 | | (375 | ) | (791 | ) | (155 | ) | (9 | ) | 97 | | (833 | ) | |||||||
| | | | | | | | | | | | | | | | | |||||||
Total of continuing operations | | 33,967 | | (17,555 | ) | (860 | ) | (340 | ) | (280 | ) | 406 | | 15,338 | | |||||||
| | | | | | | | | | | | | | | | | |||||||
| | | | | | | | | | | | | | | | | |||||||
| | | | | | | | | | | | | | | | | |||||||
Discontinued operations (Fertilizers) | | 1,746 | | (1,606 | ) | (102 | ) | (12 | ) | (25 | ) | 3 | | 4 | | |||||||
| | | | | | | | | | | | | | | | | |||||||
Total | | 35,713 | | (19,161 | ) | (962 | ) | (352 | ) | (305 | ) | 409 | | 15,342 | | |||||||
| | | | | | | | | | | | | | | | | |||||||
| | | | | | | | | | | | | | | | | |||||||
| | | | | | | | | | | | | | | | | |||||||
| | | | |
| | F-27 | | |
![]()
Notes to the Financial Statements (Continued)
Expressed in millions of United States dollar, unless otherwise stated
4. Information by business segment and by geographic area (Continued)
| | | Year ended December 31, 2016 | | |||||||||||||||||||
|---|---|---|---|---|---|---|---|---|---|---|---|---|---|---|---|---|---|---|---|---|---|---|
| | | Net operating revenue | | Cost of goods sold and services rendered | | Selling, administrative and other operating expenses | | Research and evaluation | | Pre operating and operational stoppage | | Dividends received and interest from associates and joint ventures | | Adjusted EBITDA | | |||||||
Ferrous minerals | | | | | | | | | ||||||||||||||
Iron ore | | 15,784 | | (6,622 | ) | (248 | ) | (91 | ) | (150 | ) | 10 | | 8,683 | | |||||||
Iron ore Pellets | | 3,827 | | (2,002 | ) | (35 | ) | (13 | ) | (22 | ) | 103 | | 1,858 | | |||||||
Ferroalloys and manganese | | 302 | | (231 | ) | (1 | ) | – | | (11 | ) | – | | 59 | | |||||||
Other ferrous products and services | | 438 | | (269 | ) | (4 | ) | (2 | ) | (4 | ) | – | | 159 | | |||||||
| | | | | | | | | | | | | | | | | |||||||
| | 20,351 | | (9,124 | ) | (288 | ) | (106 | ) | (187 | ) | 113 | | 10,759 | | ||||||||
Coal | | 839 | | (872 | ) | 63 | | (15 | ) | (41 | ) | – | | (26 | ) | |||||||
Base metals | | | | | | | | | ||||||||||||||
Nickel and other products | | 4,472 | | (3,204 | ) | 1 | | (78 | ) | (114 | ) | 4 | | 1,081 | | |||||||
Copper | | 1,667 | | (924 | ) | (16 | ) | (5 | ) | – | | – | | 722 | | |||||||
Other base metals products | | – | | – | | 150 | | – | | – | | – | | 150 | | |||||||
| | | | | | | | | | | | | | | | | |||||||
| | 6,139 | | (4,128 | ) | 135 | | (83 | ) | (114 | ) | 4 | | 1,953 | | ||||||||
Others | | 159 | | (259 | ) | (573 | ) | (116 | ) | (1 | ) | 76 | | (714 | ) | |||||||
| | | | | | | | | | | | | | | | | |||||||
Total of continuing operations | | 27,488 | | (14,383 | ) | (663 | ) | (320 | ) | (343 | ) | 193 | | 11,972 | | |||||||
| | | | | | | | | | | | | | | | | |||||||
| | | | | | | | | | | | | | | | | |||||||
| | | | | | | | | | | | | | | | | |||||||
Discontinued operations (Fertilizers) | | 1,875 | | (1,545 | ) | (87 | ) | (22 | ) | (16 | ) | 4 | | 209 | | |||||||
| | | | | | | | | | | | | | | | | |||||||
Total | | 29,363 | | (15,928 | ) | (750 | ) | (342 | ) | (359 | ) | 197 | | 12,181 | | |||||||
| | | | | | | | | | | | | | | | | |||||||
| | | | | | | | | | | | | | | | | |||||||
| | | | | | | | | | | | | | | | | |||||||
Adjusted EBITDA is reconciled to net income (loss) as follows:
From continuing operations
| | | Year ended December 31 | | |||||||
|---|---|---|---|---|---|---|---|---|---|---|
| | | 2018 | | 2017 | | 2016 | | |||
Net income from continuing operations | | 6,988 | | 6,334 | | 5,203 | | |||
Depreciation, depletion and amortization | | 3,351 | | 3,708 | | 3,487 | | |||
Income taxes | | (172 | ) | 1,495 | | 2,781 | | |||
Financial results, net | | 4,957 | | 3,019 | | (1,843 | ) | |||
Equity results and other results in associates and joint ventures, net of dividends received | | 570 | | 488 | | 1,104 | | |||
Special events (note 4b) | | 899 | | 294 | | 1,240 | | |||
Adjusted EBITDA from continuing operations | | 16,593 | | 15,338 | | 11,972 | | |||
| | | | |
| | F-28 | | |
![]()
Notes to the Financial Statements (Continued)
Expressed in millions of United States dollar, unless otherwise stated
4. Information by business segment and by geographic area (Continued)
From discontinued operations
| | | Year ended December 31 | | |||||||||
|---|---|---|---|---|---|---|---|---|---|---|---|---|
| | | 2018 | | 2017 | | 2016 | | |||||
Loss from discontinued operations | | (92 | ) | | (813 | ) | | (1,227 | ) | |||
| | | | | | | | | |||||
Depreciation, depletion and amortization | | – | | | 1 | | | 347 | | |||
Income taxes | | (40 | ) | | (102 | ) | | (630 | ) | |||
Financial results, net | | 5 | | | 28 | | | (20 | ) | |||
Equity results in associates and joint ventures, net of dividends received | | – | | | 5 | | | 1 | | |||
Impairment of non-current assets | | 124 | | | 885 | | | 1,738 | | |||
| | | | | | | | | |||||
Adjusted EBITDA from discontinued operations | | (3 | ) | | 4 | | | 209 | | |||
| | | | | | | | | |||||
| | | | | | | | | | | |||
| | | | | | | | | |||||
b) Special events occurred during the year
Special events are gains or losses recognized in the Company's operating results that are not related to the performance of the business segments. The Company excludes special events from adjusted EBITDA to keep the segment performance analysis comparable with prior periods.
The special events identified by the Company are as follows:
| | | Year ended December 31 | | |||||||||
|---|---|---|---|---|---|---|---|---|---|---|---|---|
| | | 2018 | | 2017 | | 2016 | | |||||
Result in disposal of assets (note 19) | | (322 | ) | | (481 | ) | | (66 | ) | |||
Nacala Logistic Corridor (note 16) | | – | | | 458 | | | – | | |||
Impairment and onerous contracts (note 20) | | (577 | ) | | (271 | ) | | (1,174 | ) | |||
| | | | | | | | | |||||
Total | | (899 | ) | | (294 | ) | | (1,240 | ) | |||
| | | | | | | | | |||||
| | | | | | | | | | | |||
| | | | | | | | | |||||
c) Assets by segment
| | | December 31, 2018 | | December 31, 2017 | | ||||||||||||||
|---|---|---|---|---|---|---|---|---|---|---|---|---|---|---|---|---|---|---|---|
| | | Product inventory | | Investments in associates and joint ventures | | Property, plant and equipment and intangible(i) | | Product inventory | | Investments in associates and joint ventures | | Property, plant and equipment and intangible(i) | | ||||||
Ferrous minerals | | 2,210 | | 1,814 | | 31,377 | | 1,770 | | 1,922 | | 36,103 | | ||||||
Coal | | 119 | | 317 | | 1,589 | | 82 | | 317 | | 1,719 | | ||||||
Base metals | | 1,147 | | 14 | | 21,295 | | 1,009 | | 13 | | 23,603 | | ||||||
Others | | 11 | | 1,080 | | 2,086 | | 6 | | 1,316 | | 1,946 | | ||||||
| | | | | | | | | | | | | | | ||||||
Total | | 3,487 | | 3,225 | | 56,347 | | 2,867 | | 3,568 | | 63,371 | | ||||||
| | | | | | | | | | | | | | | ||||||
| | | | | | | | | | | | | | | ||||||
| | | | | | | | | | | | | | | ||||||
| | | | |
| | F-29 | | |
![]()
Notes to the Financial Statements (Continued)
Expressed in millions of United States dollar, unless otherwise stated
4. Information by business segment and by geographic area (Continued)
| | | Year ended December 31 | | ||||||||||||||||
|---|---|---|---|---|---|---|---|---|---|---|---|---|---|---|---|---|---|---|---|
| | | 2018 | | 2017 | | 2016 | | ||||||||||||
| | | Capital expenditures(ii) | | | | Capital expenditures(ii) | | | | Capital expenditures(ii) | | | | ||||||
| | | Depreciation, depletion and amortization | | Depreciation, depletion and amortization | | Depreciation, depletion and amortization | | ||||||||||||
| | | Sustaining capital | | Project execution | | Sustaining capital | | Project execution | | Sustaining capital | | Project execution | | ||||||
Ferrous minerals | | 1,569 | | 823 | | 1,672 | | 1,194 | | 1,485 | | 1,709 | | 891 | | 2,355 | | 1,533 | |
Coal | | 132 | | 24 | | 252 | | 73 | | 45 | | 296 | | 149 | | 463 | | 185 | |
Base metals | | 1,189 | | 34 | | 1,351 | | 960 | | 50 | | 1,590 | | 1,045 | | 12 | | 1,636 | |
Others | | 6 | | 7 | | 76 | | 4 | | 20 | | 113 | | 3 | | 33 | | 133 | |
| | | | | | | | | | | | | | | | | | | | |
Total | | 2,896 | | 888 | | 3,351 | | 2,231 | | 1,600 | | 3,708 | | 2,088 | | 2,863 | | 3,487 | |
| | | | | | | | | | | | | | | | | | | | |
| | | | | | | | | | | | | | | | | | | | |
| | | | | | | | | | | | | | | | | | | | |
d) Investment in associates and joint ventures, intangible and property, plant and equipment by geographic area
| | | December 31, 2018 | | December 31, 2017 | | ||||||||||||
|---|---|---|---|---|---|---|---|---|---|---|---|---|---|---|---|---|---|
| | | Investments in associates and joint ventures | | Intangible | | Property, plant and equipment | | Total | | Investments in associates and joint ventures | | Intangible | | Property, plant and equipment | | Total | |
Brazil | | 2,604 | | 5,875 | | 29,226 | | 37,705 | | 2,993 | | 6,231 | | 34,209 | | 43,433 | |
Canada | | – | | 1,956 | | 9,905 | | 11,861 | | – | | 2,118 | | 10,967 | | 13,085 | |
Americas, except Brazil and Canada | | 247 | | – | | – | | 247 | | 200 | | – | | – | | 200 | |
Europe | | – | | – | | 366 | | 366 | | – | | – | | 394 | | 394 | |
Indonesia | | – | | 1 | | 2,776 | | 2,777 | | – | | – | | 2,787 | | 2,787 | |
Asia, except Indonesia | | 374 | | – | | 1,025 | | 1,399 | | 375 | | – | | 1,100 | | 1,475 | |
Australia | | – | | – | | – | | – | | – | | – | | 45 | | 45 | |
New Caledonia | | – | | – | | 2,796 | | 2,796 | | – | | – | | 2,965 | | 2,965 | |
Mozambique | | – | | 130 | | 1,459 | | 1,589 | | – | | 143 | | 1,532 | | 1,675 | |
Oman | | – | | – | | 829 | | 829 | | – | | 1 | | 868 | | 869 | |
Other regions | | – | | – | | 3 | | 3 | | – | | – | | 11 | | 11 | |
| | | | | | | | | | | | | | | | | | |
Total | | 3,225 | | 7,962 | | 48,385 | | 59,572 | | 3,568 | | 8,493 | | 54,878 | | 66,939 | |
| | | | | | | | | | | | | | | | | | |
| | | | | | | | | | | | | | | | | | |
| | | | | | | | | | | | | | | | | | |
| | | | |
| | F-30 | | |
![]()
Notes to the Financial Statements (Continued)
Expressed in millions of United States dollar, unless otherwise stated
4. Information by business segment and by geographic area (Continued)
e) Net operating revenue by geographic area
| | | Year ended December 31, 2018 | ||||||||||||
|---|---|---|---|---|---|---|---|---|---|---|---|---|---|---|
| | | Ferrous minerals | | Coal | | Base metals | | Others | | Total | ||||
Americas, except United States and Brazil | | 820 | | – | | 658 | | – | | 1,478 | ||||
United States of America | | 388 | | – | | 952 | | 13 | | 1,353 | ||||
Germany | | 1,130 | | – | | 523 | | – | | 1,653 | ||||
Europe, except Germany | | 2,218 | | 436 | | 1,800 | | – | | 4,454 | ||||
Middle East/Africa/Oceania | | 2,562 | | 151 | | 25 | | – | | 2,738 | ||||
Japan | | 2,072 | | 163 | | 508 | | – | | 2,743 | ||||
China | | 14,381 | | – | | 861 | | – | | 15,242 | ||||
Asia, except Japan and China | | 1,798 | | 767 | | 1,101 | | – | | 3,666 | ||||
Brazil | | 2,564 | | 126 | | 275 | | 283 | | 3,248 | ||||
| | | | | | | | | | | | ||||
Net operating revenue | | 27,933 | | 1,643 | | 6,703 | | 296 | | 36,575 | ||||
| | | | | | | | | | | | ||||
| | | | | | | | | | | | ||||
| | | | | | | | | | | | ||||
| | | Year ended December 31, 2017 | ||||||||||||
|---|---|---|---|---|---|---|---|---|---|---|---|---|---|---|
| | | Ferrous minerals | | Coal | | Base metals | | Others | | Total | ||||
Americas, except United States and Brazil | | 593 | | – | | 1,009 | | 70 | | 1,672 | ||||
United States of America | | 355 | | – | | 872 | | 83 | | 1,310 | ||||
Germany | | 1,097 | | – | | 292 | | – | | 1,389 | ||||
Europe, except Germany | | 1,721 | | 396 | | 1,985 | | 11 | | 4,113 | ||||
Middle East/Africa/Oceania | | 1,768 | | 171 | | 13 | | – | | 1,952 | ||||
Japan | | 1,927 | | 130 | | 399 | | – | | 2,456 | ||||
China | | 13,442 | | – | | 576 | | – | | 14,018 | ||||
Asia, except Japan and China | | 1,332 | | 711 | | 1,539 | | – | | 3,582 | ||||
Brazil | | 2,894 | | 159 | | 186 | | 236 | | 3,475 | ||||
| | | | | | | | | | | | ||||
Net operating revenue | | 25,129 | | 1,567 | | 6,871 | | 400 | | 33,967 | ||||
| | | | | | | | | | | | ||||
| | | | | | | | | | | | ||||
| | | | | | | | | | | | ||||
| | | Year ended December 31, 2016 | ||||||||||||
|---|---|---|---|---|---|---|---|---|---|---|---|---|---|---|
| | | Ferrous minerals | | Coal | | Base metals | | Others | | Total | ||||
Americas, except United States and Brazil | | 334 | | 20 | | 1,172 | | – | | 1,526 | ||||
United States of America | | 232 | | – | | 749 | | 24 | | 1,005 | ||||
Germany | | 1,077 | | – | | 302 | | – | | 1,379 | ||||
Europe, except Germany | | 1,482 | | 218 | | 1,552 | | 17 | | 3,269 | ||||
Middle East/Africa/Oceania | | 1,252 | | 95 | | 20 | | – | | 1,367 | ||||
Japan | | 1,292 | | 121 | | 328 | | – | | 1,741 | ||||
China | | 11,985 | | 63 | | 699 | | – | | 12,747 | ||||
Asia, except Japan and China | | 912 | | 305 | | 1,173 | | – | | 2,390 | ||||
Brazil | | 1,785 | | 17 | | 144 | | 118 | | 2,064 | ||||
| | | | | | | | | | | | ||||
Net operating revenue | | 20,351 | | 839 | | 6,139 | | 159 | | 27,488 | ||||
| | | | | | | | | | | | ||||
| | | | | | | | | | | | ||||
| | | | | | | | | | | | ||||
| | | | |
| | F-31 | | |
![]()
Notes to the Financial Statements (Continued)
Expressed in millions of United States dollar, unless otherwise stated
4. Information by business segment and by geographic area (Continued)
Accounting policy
Vale recognizes revenue when the control of a good or service transfers to a customer of an amount that reflects the consideration to which the entity expects to be entitled in exchange for those goods or services. Net revenue excludes any applicable sales taxes.
Depending on the contract, sales revenue can be recognized when the product is available at the loading port, loaded on the ship, at the port of discharge or at the customer's warehouse. Service revenues are recognized in the amount by which the services are rendered and accepted by the customer.
Generally, the contract payment terms consider the upfront payments or the use of credit letters. The payment terms do not have a significant financing component and were not changed from previous years. In some cases, the sale price is determined on a provisional basis at the date of sale and adjustments to the sale price subsequently occur based on movements in the quoted market or contractual prices up to the date of final pricing. Revenue is recognized based on the estimated fair value of the total consideration receivable, and the provisionally priced sale mechanism embedded within these sale arrangements has the character of a derivative. Accordingly, the fair value of the final sale price adjustment is re-estimated continuously and changes in fair value are recognized as operational revenue in the income statement.
Commodity price risk—The commodity price risk arises from volatility of iron ore, nickel, copper and coal prices. The Company is mostly exposed to the fluctuations in the iron ore and copper price. The selling price of these products can be measured reliably at each period, since the price is quoted in an active market.
As of December 31, 2018, the Company had 27 million tons (2017: 33 million tons) provisionally priced based on iron ore forward prices and 78 thousand tons (2017: 106 thousand tons) provisionally priced based on copper forward prices. The final price of these sales will be determined during the first quarter of 2019. A 10% change in the price of iron ore realized on the provisionally priced sales, with all other factors held constant, would increase or reduce net income by US$185. A 10% change in the price of copper realized on the provisionally priced sales, with all other factors held constant, would increase or reduce net income by US$56.
| | | | |
| | F-32 | | |
![]()
Notes to the Financial Statements (Continued)
Expressed in millions of United States dollar, unless otherwise stated
5. Costs and expenses by nature (Continued)
a) Cost of goods sold and services rendered
| | | Year ended December 31 | ||||
|---|---|---|---|---|---|---|
| | | 2018 | | 2017 | | 2016 |
Personnel | | 2,278 | | 2,295 | | 2,087 |
Materials and services | | 3,957 | | 3,814 | | 3,108 |
Fuel oil and gas | | 1,538 | | 1,313 | | 1,233 |
Maintenance | | 2,807 | | 3,096 | | 2,747 |
Energy | | 906 | | 963 | | 694 |
Acquisition of products | | 513 | | 543 | | 511 |
Depreciation and depletion | | 3,207 | | 3,484 | | 3,267 |
Freight | | 4,306 | | 3,346 | | 2,509 |
Others | | 2,597 | | 2,185 | | 1,494 |
| | | | | | | |
Total | | 22,109 | | 21,039 | | 17,650 |
| | | | | | | |
| | | | | | | |
| | | | | | | |
Cost of goods sold | | 21,526 | | 20,426 | | 17,148 |
Cost of services rendered | | 583 | | 613 | | 502 |
| | | | | | | |
Total | | 22,109 | | 21,039 | | 17,650 |
| | | | | | | |
| | | | | | | |
| | | | | | | |
b)
| | | Year ended December 31 | | | Year ended December 31 | |||||||||||||||||
|---|---|---|---|---|---|---|---|---|---|---|---|---|---|---|---|---|---|---|---|---|---|---|
| | | 2016 | | 2015 | | 2014 | | | 2018 | | 2017 | | 2016 | |||||||||
Personnel | | | 209 | | | 253 | | | 415 | | | | 212 | | 234 | | 209 | |||||
Services | | | 72 | | | 106 | | | 187 | | | | 92 | | 77 | | 72 | |||||
Advertising and publicity | | | 8 | | | 11 | | | 40 | | | |||||||||||
Depreciation and amortization | | | 120 | | | 131 | | | 220 | | | | 62 | | 91 | | 120 | |||||
Travel expenses | | | 8 | | | 11 | | | 23 | | | |||||||||||
Taxes and rents | | | 13 | | | 16 | | | 27 | | | |||||||||||
Others | | | 77 | | | 84 | | | 124 | | | | 157 | | 129 | | 106 | |||||
| | | | | | | | | |||||||||||||||
Total of continuing operations | | | 507 | | | 612 | | | 1,036 | | | |||||||||||
| | | | | | | | | |||||||||||||||
| | | | | | | | | | | | | |||||||||||
| | | | | | | | | |||||||||||||||
Discontinued operations (Fertilizers) | | | 56 | | | 40 | | | 63 | | | |||||||||||
| | | | | | | | | | | | | | | |||||||||
Total | | | 563 | | | 652 | | | 1,099 | | | | 523 | | 531 | | 507 | |||||
| | | | | | | | | | | | | | | | ||||||||
| | | | | | | | | | | | | | | |||||||||
c)
| | | Year ended December 31 | | | Year ended December 31 | |||||||||||||||||
|---|---|---|---|---|---|---|---|---|---|---|---|---|---|---|---|---|---|---|---|---|---|---|
| | | 2016 | | 2015 | | 2014 | | | 2018 | | 2017 | | 2016 | |||||||||
Provision for litigation | | | 137 | | | 11 | | | 169 | | | | 185 | | 169 | | 137 | |||||
Provision for loss with VAT credits (ICMS) | | | 41 | | | 194 | | | 116 | | | |||||||||||
Profit sharing program | | | 76 | | | 15 | | | 121 | | | | 187 | | 149 | | 76 | |||||
Disposal of materials and inventories | | | (91 | ) | | 193 | | | 187 | | | |||||||||||
Gold stream transaction (note 7) | | | (150 | ) | | (230 | ) | | – | | | |||||||||||
Others | | | 254 | | | 24 | | | 430 | | | | 73 | | 102 | | 54 | |||||
| | | | | | | | | |||||||||||||||
Total of continuing operations | | | 267 | | | 207 | | | 1,023 | | | |||||||||||
| | | | | | | | | |||||||||||||||
| | | | | | | | | | | | | |||||||||||
| | | | | | | | | |||||||||||||||
Discontinued operations (Fertilizers) | | | 34 | | | (1 | ) | | 34 | | | |||||||||||
| | | | | | | | | | | | | | | |||||||||
Total | | | 301 | | | 206 | | | 1,057 | | | | 445 | | 420 | | 267 | |||||
| | | | | | | | | | | | | | | | ||||||||
| | | | | | | | | | | | | | | |||||||||
| | | | |
| | F-33 | | |
![]()
Notes to the Financial Statements (Continued)
Expressed in millions of United States dollar, unless otherwise stated
6. Financial result
| | | Year ended December 31 | | | Year ended December 31 | |||||||||||||||||||
|---|---|---|---|---|---|---|---|---|---|---|---|---|---|---|---|---|---|---|---|---|---|---|---|---|
| | | 2018 | | 2017 | | 2016 | ||||||||||||||||||
Financial income | | | | |||||||||||||||||||||
Short-term investments | | 177 | | 176 | | 92 | ||||||||||||||||||
Others | | 246 | | 302 | | 78 | ||||||||||||||||||
| | | | | | | | ||||||||||||||||||
| | | 2016 | | 2015 | | 2014 | | | 423 | | 478 | | 170 | |||||||||||
Financial expenses | | | | | | | | | | | | |||||||||||||
Loans and borrowings gross interest | | | (1,768 | ) | | (1,647 | ) | | (1,727 | ) | | | (1,185 | ) | (1,697 | ) | (1,768) | |||||||
Capitalized loans and borrowing costs | | | 653 | | | 761 | | | 588 | | | | 194 | | 370 | | 653 | |||||||
Labor, tax and civil lawsuits | | | (10 | ) | | (59 | ) | | (91 | ) | | |||||||||||||
Derivative financial instruments | | | (484 | ) | | (3,553 | ) | | (1,974 | ) | | |||||||||||||
Indexation and exchange rate variation (a) | | | (2,964 | ) | | (13,825 | ) | | (4,848 | ) | | |||||||||||||
Participative stockholders' debentures | | | (417 | ) | | 965 | | | (315 | ) | | | (550 | ) | (625 | ) | (417) | |||||||
Expenses of REFIS | | | (514 | ) | | (547 | ) | | (683 | ) | | |||||||||||||
Interest on REFIS | | (202 | ) | (397 | ) | (514) | ||||||||||||||||||
Others | | | (621 | ) | | (541 | ) | | (672 | ) | | | (602 | ) | (924 | ) | (631) | |||||||
| | | | | | | | | | | | | | | |||||||||||
| | | (6,125 | ) | | | (18,446 | ) | | | (9,722 | ) | | | (2,345 | ) | (3,273 | ) | (2,677) | ||||||
| | | | | | | | | |||||||||||||||||
Financial income | | | | | | | | | ||||||||||||||||
Short-term investments | | | 92 | | | 140 | | | 181 | | | |||||||||||||
Other financial items | | | | |||||||||||||||||||||
Net foreign exchange gains (losses) on loans and borrowings | | (2,666 | ) | (249 | ) | 3,314 | ||||||||||||||||||
Derivative financial instruments | | | 1,740 | | | 1,076 | | | 640 | | | | (266 | ) | 454 | | 1,256 | |||||||
Indexation and exchange rate variation (b) | | | 6,058 | | | 6,465 | | | 2,675 | | | |||||||||||||
Others | | | 78 | | | 111 | | | 208 | | | |||||||||||||
Other net foreign exchange gains (losses) | | 419 | | (218 | ) | (62) | ||||||||||||||||||
Net indexation losses | | (522 | ) | (211 | ) | (158) | ||||||||||||||||||
| | | | | | | | | | | | | | | |||||||||||
| | | 7,968 | | | 7,792 | | | 3,704 | | | | (3,035 | ) | (224 | ) | 4,350 | ||||||||
| | | | | | | | | | | | | | | |||||||||||
Financial results, net | | | 1,843 | | | (10,654 | ) | | | (6,018 | ) | | | (4,957 | ) | (3,019 | ) | 1,843 | ||||||
| | | | | | | | | | | | | | | | ||||||||||
| | | | | | | | | | | | | | | |||||||||||
Summary of indexation and exchange rate variation | | | | | | | | | ||||||||||||||||
Loans and borrowings | | | 5,099 | | | (10,460 | ) | | (3,250 | ) | | |||||||||||||
Others | | | (2,005 | ) | | 3,100 | | | 1,077 | | | |||||||||||||
| | | | | | | | | |||||||||||||||||
Net (a) + (b) | | | 3,094 | | | (7,360 | ) | | | (2,173 | ) | | ||||||||||||
| | | | | | | | | |||||||||||||||||
| | | | | | | | | | | | | |||||||||||||
| | | | | | | | | |||||||||||||||||
a) Hedge in foreign operations
As fromat January 1, 2017, (subsequent event)Vale S.A., which the Company starts to apply netfunctional currency is Reais, designated its debts in US$ and Euro, as an instrument in a hedge of its investment hedge accounting in foreign operation considering Valeoperations (Vale International S.A. and Vale International Holding GmbH investments as theGmbH; hedging objects and designated as hedging instruments the Parent Company third party loans and borrowings (excluding interest) in different currencies denominated in US dollar and euro, amounting to US$8,067 and EUR1,500 (US$1,583) as the hedging instrument, respectively.
Accordingly, the Company plansobjects) to mitigate part of itsthe foreign exchange risk sinceon financial statements. Further details are disclosed in note 25.
b) Net investment in the foreign operation
From January 1, 2019 (subsequent event), the Company will consider certain long-term loans payable to Vale International S.A., for which settlement is neither planned nor likely to occur in the foreseeable future, as part of its net investment in the foreign operation. The foreign exchange gains or lossesdifferences arising on the hedging instrument (effective portion)monetary item, forming part of the net investment in the foreign operation, will be recognized in other comprehensive income thus offsetting sameand reclassified from stockholders' equity to income statement on disposal or partial disposal of the net investment. Therefore, upon adoption the effect of net foreign exchange gains or losses in the income statement is expected to reduce.
Accounting policy
Transactions in foreign currencies—Transactions in foreign currencies are translated into the functional currency using the exchange rate prevailing at the transaction date. The foreign exchange gains and losses generatedresulting from translatingthe translation at the exchange rates prevailing at the end of the year are recognized in the income statement as "financial income or expense". The exceptions are transactions related to
| | | | |
| | F-34 | | |
![]()
Notes to the Financial Statements (Continued)
Expressed in millions of United States dollar, unless otherwise stated
6. Financial result (Continued)
qualifying net investment hedges or items that are attributable to part of the net investmentsinvestment in a foreign operation, for which gains and losses are recognized in the aforementioned controlled companies. If the hedge relationship is not considered effective, the hedging instrument's exchange variations will be allocated to income statement for the year.of comprehensive income.
7. Deferred revenue—Gold stream transactionCobalt streaming
In 2013,June 2018, the Company entered into two different agreements, one with Wheaton Precious Metals Corp ("Wheaton") and the other with Cobalt 27 Capital Corp. ("Cobalt 27"), to sell a stream equivalent to 75% of the cobalt extracted as a by-product from the Voisey's Bay mine, in Canada, starting on January 1, 2021. Furthermore, the Company restarted the Voisey's Bay underground mine expansion project, which is going to increase the expected useful life of Voisey's Bay mine from 2023 to 2034. The first year of underground production is expected to be 2021, when the current operations on the open pit mine begin to ramp down.
Upon completion of the transaction, the Company received an upfront payment of US$690 in cash, US$390 from Wheaton and US$300 from Cobalt 27, which has been recorded as other non-current liabilities. Vale will receive additional payments of 20%, on average, of the market reference price for cobalt, for each pound of finished cobalt delivered.
Thus, from January 1, 2021 onwards, Wheaton and Cobalt 27 will be entitled to receive 42.4% and 32.6%, respectively, of cobalt equivalent to the production from the Voisey's Bay mine, while Vale remains exposed to approximately 40% of the cobalt economic exposure, as Vale retains the rights to 25% of the future cobalt production and will receive 20% additional payments for the cobalt stream. The estimated result of the sale of the mineral rights is not expected to be significant and it will be accounted for once certain production thresholds have been met at Voisey's Bay mine.
Gold streaming
In August 2016, the Company made an amended to the gold transaction entered into to 2013 with Silver Wheaton Corp.Precious Metals Corp ("SLW"Wheaton") to sellinclude in each contract an additional 25% of the gold extracted as a by-product over the lifea lifetime of the Salobo copper mine. Hence, Wheaton holds the rights to 75% of the contained gold in the copper concentrated from the Salobo mine and 70% of the gold extracted as a by-product of the Sudbury nickel mines overmines.
The transactions were bifurcated into two identifiable components (i) the next 17 years. sale of the mineral rights recognized in the income statement under "Other operating income (expenses), net" and, (ii) the deferred revenue (liability) related to the services for gold extraction on the portion in which Vale operates as an agent for Wheaton gold extraction.
The Company received up-front cash proceedsrecognized US$150 in the income statement for the year ended December 31, 2016, related to the sale of US$1,900.mineral rights from the additional transaction in August 2016.
| | | | |
| | F-35 | | |
![]()
Notes to the Financial Statements (Continued)
Expressed in millions of United States dollar, unless otherwise stated
7. Deferred revenue—Gold stream transactionStreaming transactions (Continued)
The original transaction was amended in March 2015 and August 2016 to include in each contract an additional 25% of the gold extracted as by-product over a lifetime of the Salobo copper mine. In the first additive, the Company received up-front proceeds of US$900 and in the second additive, (i) an initial cash payment of US$800 and (ii) an option value resulting from the reduction of the exercise price from US$65.00 to US$43.75 on 10 million warrants from SLW held by the Company since 2013 and maturing in 2023.
Hence, in December 31, 2016 SLW holds the rights to 75% of the contained gold in the copper concentrated from the Salobo mine and 70% of the gold extracted as a by-product of the Sudbury nickel mines.
As the gold is delivered to SLW, Vale receives payment equal to the lesser of: (i) US$400 per ounce of refined gold delivered (which payments are subject to an annual increase of 1% per year commencing on January 1, 2017 for the original and additional transactions and each subsequent year and (ii) the market reference price on the delivery date.
Vale may also receive an additional cash payment contingent on its decision to expand its capacity to process Salobo copper ores to more than 28 Mtpy before 2036. Salobo that were still in ramp-up until September, 2016 and will have a total capacity to process 24 Mtpy of run-of-mine (ROM). The contingent additional cash payment could range from US$113 to US$953 depending on ore grade, timing and size of the expansion.
The transactions were bifurcated into two identifiable components (i) the sale of the mineral rights and, (ii) the services for gold extraction on the portion in which Vale operates as an agent for SLW gold extraction.
The deferred revenue is recognized based on the units of gold mined compared to the total proven and probable reserves of gold traded with SLW. During the year ended December 31, 2016, 2015 and 2014, the Company recognized US$209, US$106 and US$64, respectively, in the statement of income relating to services rendered in the original and additional transactions.
The result on sale of mineral rights from the additional transactions of US$150 and US$230 was recognized in the year ended December 31, 2016 and 2015, respectively, under "Other operating expenses, net".
Critical accounting estimates and judgments
Defining the gain on sale of mineral interest and the deferred revenue portion of the gold transaction requires the use of critical accounting estimates as follows:
![]()
Notes to the Financial Statements (Continued)
Expressed in millions of United States dollar, unless otherwise stated
8. Income taxes
| | | December 31, 2016 | | December 31, 2015 | | ||||||
|---|---|---|---|---|---|---|---|---|---|---|---|
Taxes losses carryforward | | | 6,194 | | | | 6,446 | | | ||
| | | | | | | ||||||
Temporary differences: | | | | | | | | ||||
Employee post retirement obligations | | | 620 | | | | 587 | | | ||
Provision for litigation | | | 215 | | | | 228 | | | ||
Provision for assets losses | | | 1,264 | | | | 692 | | | ||
Fair value of financial instruments | | | 167 | | | | 823 | | | ||
Allocated goodwill | | | (2,247 | ) | | | (2,272 | ) | | ||
Others | | | (570 | ) | | | (270 | ) | | ||
| | | | | | | ||||||
| | | (551 | ) | | | (212 | ) | | |||
| | | | | | | ||||||
Total | | | 5,643 | | | | 6,234 | | | ||
| | | | | | | ||||||
Assets | | | 7,343 | | | | 7,904 | | | ||
Liabilities | | | (1,700 | ) | | | (1,670 | ) | | ||
| | | | | | | ||||||
| | | 5,643 | | | | 6,234 | | | |||
| | | | | | | ||||||
| | | | | | | | | | | ||
| | | | | | | ||||||
Changes in deferred tax are as follows:
| | | Assets | | Liabilities | | Total | | |||||||||
|---|---|---|---|---|---|---|---|---|---|---|---|---|---|---|---|---|
Balance at December 31, 2014 | | | 3,976 | | | | 3,341 | | | | 635 | | | |||
| | | | | | | | | |||||||||
Taxes losses carryforward | | | 4,631 | | | | (36 | ) | | | 4,667 | | | |||
Provision for assets losses | | | (82 | ) | | | (25 | ) | | | (57 | ) | | |||
Fair value of financial instruments | | | (96 | ) | | | | | | (96 | ) | | ||||
Allocated goodwill | | | – | | | | (1,271 | ) | | | 1,271 | | | |||
Others | | | (181 | ) | | | 23 | | | | (204 | ) | | |||
Effect in income statement | | | 4,272 | | | | (1,309 | ) | | | 5,581 | | | |||
Transfers between asset and liabilities | | | 142 | | | | 142 | | | | – | | | |||
Translation adjustment | | | (1,297 | ) | | | (518 | ) | | | (779 | ) | | |||
Other comprehensive income | | | 914 | | | | 14 | | | | 900 | | | |||
Acquisition of subsidiary | | | (11 | ) | | | – | | | | (11 | ) | | |||
Effect of discontinued operations | | | | | | | | | | | ||||||
Income tax | | | (92 | ) | | | – | | | | (92 | ) | | |||
| | | | | | | | | |||||||||
Balance at December 31, 2015 | | | 7,904 | | | | 1,670 | | | | 6,234 | | | |||
| | | | | | | | | |||||||||
Taxes losses carryforward | | | (1,307 | ) | | | 84 | | | | (1,391 | ) | | |||
Provision for assets losses | | | 342 | | | | 44 | | | | 298 | | | |||
Fair value of financial instruments | | | (802 | ) | | | – | | | | (802 | ) | | |||
Allocated goodwill | | | – | | | | (342 | ) | | | 342 | | | |||
Others | | | (258 | ) | | | 27 | | | | (285 | ) | | |||
Effect in income statement | | | (2,025 | ) | | | (187 | ) | | | (1,838 | ) | | |||
Transfers between asset and liabilities | | | 167 | | | | 167 | | | | – | | | |||
Translation adjustment | | | 900 | | | | 36 | | | | 864 | | | |||
Other comprehensive income | | | (19 | ) | | | 14 | | | | (33 | ) | | |||
Effect of discontinued operations | | | | | | | | | | | ||||||
Income tax | | | 627 | | | | – | | | | 627 | | | |||
Transfer to net assets held for sale | | | (211 | ) | | | – | | | | (211 | ) | | |||
| | | | | | | | | |||||||||
Balance at December 31, 2016 | | | 7,343 | | | | 1,700 | | | | 5,643 | | | |||
| | | | | | | | | |||||||||
| | | | | | | | | | | | | | | |||
| | | | | | | | | |||||||||
| | | December 31, 2018 | | December 31, 2017 | | ||
|---|---|---|---|---|---|---|---|
Taxes losses carryforward | | 4,882 | | 4,471 | | ||
Temporary differences: | | | | ||||
Employee post retirement obligations | | 674 | | 684 | | ||
Provision for litigation | | 409 | | 457 | | ||
Timing differences arising on assets | | 1,253 | | 1,268 | | ||
Fair value of financial instruments | | 538 | | 549 | | ||
Allocated goodwill | | (2,328 | ) | (2,433 | ) | ||
Others | | (52 | ) | (77 | ) | ||
| | | | | | | ||
| | 494 | | 448 | | |||
| | | | | | | ||
Total | | 5,376 | | 4,919 | | ||
| | | | | | | ||
| | | | | | | ||
| | | | | | | ||
Assets | | 6,908 | | 6,638 | | ||
Liabilities | | (1,532 | ) | (1,719 | ) | ||
| | | | | | | ||
| | 5,376 | | 4,919 | | |||
| | | | | | | ||
| | | | | | | ||
| | | | | | | ||
| | | | |
| | F-36 | | |
![]()
Notes to the Financial Statements (Continued)
Expressed in millions of United States dollar, unless otherwise stated
8. Income taxes (Continued)
Law 12.973—The Brazilian corporate tax law was amended at the end of 2014 and became effective as from fiscal year 2015. The change provided that profits from foreign subsidiaries are taxableChanges in Brazil, on an accrual basis, applying the differential between the nominal local tax rate and the Brazilian tax rates (34%) considering the profit before tax in local GAAP (Generally Accepted Accounting Principles) and local currency. Accordingly, from January 1st, 2015 the results from foreign subsidiaries are recognized on that basis.
In accordance with article 77 of law 12.973, the losses generated by the foreign subsidiaries, before income taxes and the equity results, may be offset against their future profits, subject to certain conditions.
In 2015, in the first adoption, the Company recognized deferred income tax assets related to accumulated losses of subsidiaries abroad in the amount of US$2,952.
The Company projections shows deferred tax assets substantially being realized in the next five years.are as follows:
| | | Assets | | Liabilities | | Deferred taxes, net |
|---|---|---|---|---|---|---|
Balance at December 31, 2016 | | 7,343 | | 1,700 | | 5,643 |
| | | | | | | |
Utilization of taxes losses carryforward | | (2,143) | | – | | (2,143) |
Timing differences arising on assets | | 103 | | – | | 103 |
Fair value of financial instruments | | 388 | | – | | 388 |
Allocated goodwill | | – | | (109) | | 109 |
Others | | 897 | | | 897 | |
Effect in income statement | | (755) | | (109) | | (646) |
Transfers between asset and liabilities | | 40 | | 40 | | – |
Translation adjustment | | (24) | | 75 | | (99) |
Other comprehensive income | | (68) | | 13 | | (81) |
Effect of discontinued operations | | | | |||
Effect in income statement | | 102 | | – | | 102 |
| | | | | | | |
Balance at December 31, 2017 | | 6,638 | | 1,719 | | 4,919 |
| | | | | | | |
Taxes losses carryforward | | 665 | | | 665 | |
Timing differences arising on assets | | 152 | | – | | 152 |
Fair value of financial instruments | | 147 | | – | | 147 |
Allocated goodwill | | – | | (37) | | 37 |
Others | | (77) | | | (77) | |
Effect in income statement | | 887 | | (37) | | 924 |
Transfers between asset and liabilities | | (70) | | (70) | | – |
Translation adjustment | | (673) | | (102) | | (571) |
Other comprehensive income | | 123 | | 22 | | 101 |
Effect of discontinued operations | | | | |||
Effect in income statement | | 14 | | – | | 14 |
Transfer to net assets held for sale | | (11) | | – | | (11) |
| | | | | | | |
Balance at December 31, 2018 | | 6,908 | | 1,532 | | 5,376 |
| | | | | | | |
| | | | | | | |
| | | | | | | |
The tax loss carryforward dodoes not expire and in the Brazilian jurisdiction theand their compensation is limited to 30% of the taxable income for the year. ForThe local resultsprofits of subsidiaries abroad are also taxed in Brazil and there is no restriction to compensated profits fromon their offset against tax losses generated previously by the foreign subsidiaries against previously recorded deferred tax assets.
b) Income tax reconciliation—Income statement
The total amount presented as income taxes inentity or by the income statement is reconciled to the rate established by law, as follows:Parent Company.
| | | | |
| | F-37 | | |
| | | Year ended December 31 | | |||||||||||||
|---|---|---|---|---|---|---|---|---|---|---|---|---|---|---|---|---|
| | | 2016 | | 2015 | | 2014 | | |||||||||
Net income (loss) before income taxes | | | 7,984 | | | | (17,679 | ) | | | 2,794 | | | |||
Income taxes at statutory rates—34% | | | (2,715 | ) | | | 6,011 | | | | (950 | ) | | |||
Adjustments that affect the basis of taxes: | | | | | | | | | | | ||||||
Income tax benefit from interest on stockholders' equity | | | 87 | | | | 356 | | | | 1,123 | | | |||
Tax incentives | | | 344 | | | | 61 | | | | 95 | | | |||
Results of overseas companies taxed by different rates which differs from the parent company rate | | | – | | | | – | | | | (1,184 | ) | | |||
Equity results | | | 108 | | | | (151 | ) | | | 171 | | | |||
Additions (reversals) of tax loss carryforward | | | (273 | ) | | | 1,498 | | | | (178 | ) | | |||
Unrecognized tax losses of the year | | | (708 | ) | | | (901 | ) | | | – | | | |||
Nondeductible effect of impairment | | | (97 | ) | | | (1,865 | ) | | | (450 | ) | | |||
Others | | | 473 | | | | 240 | | | | (230 | ) | | |||
| | | | | | | | | |||||||||
Income taxes | | | (2,781 | ) | | | 5,249 | | | | (1,603 | ) | | |||
| | | | | | | | | |||||||||
| | | | | | | | | | | | | | | |||
| | | | | | | | | |||||||||
![]()
Notes to the Financial Statements (Continued)
Expressed in millions of United States dollar, unless otherwise stated
8. Income taxes (Continued)
b) Income tax reconciliation—Income statement
The total amount presented as income taxes in the income statement is reconciled to the statutory rate, as follows:
| | | Year ended December 31 | ||||||
|---|---|---|---|---|---|---|---|---|
| | | 2018 | | 2017 | | 2016 | ||
Income before income taxes | | 6,816 | | 7,829 | | 7,984 | ||
Income taxes at statutory rates—34% | | (2,317 | ) | (2,662 | ) | (2,715) | ||
Adjustments that affect the basis of taxes: | | | | |||||
Income tax benefit from interest on stockholders' equity | | 873 | | 728 | | 87 | ||
Tax incentives | | 576 | | 372 | | 344 | ||
Equity results | | 104 | | 35 | | 107 | ||
Additions (reversals) of tax loss carryforward(i) | | 1,510 | | 99 | | (273) | ||
Unrecognized tax losses of the year | | (458 | ) | (432 | ) | (708) | ||
Nondeductible effect of impairment | | (24 | ) | (43 | ) | (97) | ||
Others | | (92 | ) | 408 | | 474 | ||
| | | | | | | | ||
Income taxes | | 172 | | (1,495 | ) | (2,781) | ||
| | | | | | | | ||
| | | | | | | | ||
| | | | | | | | ||
c) Tax incentives
In Brazil, Vale has tax incentives to partially reduce the income tax generated by the operations conducted in the North and Northeast regions whichthat includes iron ore, manganese, copper and nickel. The incentive is calculated based on the taxable income of the incentive activity (tax operating income) and takes into account the allocation of tax operating income into different incentives applicable to different tranches of production during the periods specified for each product, generallyusually 10 years. Most of our incentives are expected to expire up to 2024.2024 and the last recognized tax incentive will expire in 2027. An amount equal to that obtained with the tax saving must be appropriated in retained earnings reserve account in stockholders' equity, and cannot be distributed as dividends to stockholders.
In addition to those incentives, the amount equivalent to 30% of the income tax due, based on the tax operating income can be reinvested onin the purchaseacquisition of new machinery and equipment, subject to subsequent approval by the regulatory agency responsible, Superintendência dode Desenvolvimento da Amazonia (SUDAM) andAmazônia ("SUDAM") and/or the Superintendência dode Desenvolvimento do Nordeste (SUDENE)("SUDENE"). The reinvestment subsidy is accounted in retained earnings reserve account, which restricts the distribution as dividends to stockholders. This tax incentive will expire in 2023.
Vale is subject to the revision of income tax by local tax authorities in a range up to 10 years depending on jurisdiction where we operate.the Company operates.
d) Income taxes—Settlement program ("REFIS")
In 2013, the Company electedThe balance mainly relates to participate in the REFIS a federal tax settlement program, to settle most of the claims related to the collection of income tax and social contribution on equity gains of foreign subsidiaries and affiliates from 2003 to 2012. As
| | | | |
| | F-38 | | |
At December 31, 2016, the balance of US$5,419 (US$458 as current and US$4,961 as non-current) is due in 142 remaining monthly installments, bearing interest at the SELIC rate (Special System for Settlement and Custody) and at December 31, 2015, the balance of US$4,430 (US$345 as current and US$4,085 as non-current) was due in 154 remaining monthly installments.
Accounting policy
The recognition of income taxes as deferred taxes is based on temporary differences between carrying value and the tax basis of assets and liabilities as well as taxes losses carryforwards. The deferred income taxes assets and liabilities are offset when there is a legally enforceable right on the same taxable entity.
The deferred taxes assets arising from taxes losses and temporary differences are not recognized when their recovery amount are not probable.
Income taxes are recognized in the income statement, except for items recognized directly in stockholders' equity. The provision for income tax is calculated individually for each entity in the Group based on Brazilian tax rates, on an accrual basis, by applying the differential between the nominal local tax rates (based on rules in force in the location of the entity) and the Brazilian tax rate.
![]()
Notes to the Financial Statements (Continued)
Expressed in millions of United States dollar, unless otherwise stated
8. Income taxes (Continued)
December 31, 2018, the balance of US$4,349 (US$432 as current and US$3,917 as non-current) is due in 118 remaining monthly installments, bearing interest at the SELIC rate (Special System for Settlement and Custody), while at December 31, 2017, the balance was US$5,375 (US$485 as current and US$4,890 as non-current).
As at December 31, 2018, the SELIC rate was 6.50% per annum (7.00% per annum at December 31, 2017).
Accounting policy
The recognition of income taxes as deferred taxes is based on temporary differences between carrying amount and the tax basis of assets and liabilities as well as tax losses carryforwards. The deferred income tax assets and liabilities are offset when there is a legally enforceable right on the same taxable entity.
The deferred tax assets arising from tax losses and temporary differences are not recognized when is not probable that future taxable profit will be available against which temporary differences and/or tax losses can be utilized.
Income taxes are recognized in the income statement, except for items recognized directly in stockholders' equity. The provision for income tax is calculated individually for each entity of the Company based on Brazilian tax rates, on an accrual basis, by applying the differential between the nominal local tax rates (based on rules enacted in the location of the entity) and the Brazilian tax rate.
Critical accounting estimates and judgments
Deferred tax assets arising from tax losses, negative social contribution basis and temporary differences are registered taking into account the analysis of future performance, considering economic and financial projections, prepared based on internal assumptions and macroeconomic environment, trade and tax scenarios that may be subject to changes in the future. The assumptions of future profits are based on production and sales planning, commodity prices, operational costs restructuring plans, reclamation and planned capital costs.
9. Basic and diluted earnings (loss) per share
The value of basic earnings (loss) per shares and diluted were calculated as follows:
| | | | |
| | F-39 | | |
| | | Year ended December 31 | | |||||||||||||
|---|---|---|---|---|---|---|---|---|---|---|---|---|---|---|---|---|
| | | 2016 | | 2015 | | 2014 | | |||||||||
Basic and diluted earnings (loss) per share from continuing operations: | | | | | | | | | | | ||||||
Income (loss) available to preferred stockholders | | | 1,990 | | | | (4,555 | ) | | | 572 | | | |||
Income (loss) available to common stockholders | | | 3,221 | | | | (7,374 | ) | | | 927 | | | |||
| | | | | | | | | |||||||||
Total | | | 5,211 | | | | (11,929 | ) | | | 1,499 | | | |||
| | | | | | | | | |||||||||
| | | | | | | | | | | | | | | |||
| | | | | | | | | |||||||||
Basic and diluted loss per share from discontinued operations: | | | | | | | | | | | ||||||
Loss available to preferred stockholders | | | (469 | ) | | | (76 | ) | | | (322 | ) | | |||
Loss available to common stockholders | | | (760 | ) | | | (124 | ) | | | (520 | ) | | |||
| | | | | | | | | |||||||||
Total | | | (1,229 | ) | | | (200 | ) | | | (842 | ) | | |||
| | | | | | | | | |||||||||
| | | | | | | | | | | | | | | |||
| | | | | | | | | |||||||||
Basic and diluted earnings per share: | | | | | | | | | | | ||||||
Income (loss) available to preferred stockholders | | | 1,521 | | | | (4,631 | ) | | | 250 | | | |||
Income (loss) available to common stockholders | | | 2,461 | | | | (7,498 | ) | | | 407 | | | |||
| | | | | | | | | |||||||||
Total | | | 3,982 | | | | (12,129 | ) | | | 657 | | | |||
| | | | | | | | | |||||||||
| | | | | | | | | | | | | | | |||
| | | | | | | | | |||||||||
Thousands of shares | | | | | | | | | | | ||||||
Weighted average number of shares outstanding—preferred shares | | | 1,967,722 | | | | 1,967,722 | | | | 1,967,722 | | | |||
Weighted average number of shares outstanding—common shares | | | 3,185,653 | | | | 3,185,653 | | | | 3,185,653 | | | |||
| | | | | | | | | |||||||||
Total | | | 5,153,375 | | | | 5,153,375 | | | | 5,153,375 | | | |||
| | | | | | | | | |||||||||
| | | | | | | | | | | | | | | |||
| | | | | | | | | |||||||||
Basic and diluted earnings (loss) per share from continuing operations | | | | | | | | | | | ||||||
Preferred share (US$) | | | 1.01 | | | | (2.31 | ) | | | 0.29 | | | |||
Common share (US$) | | | 1.01 | | | | (2.31 | ) | | | 0.29 | | | |||
Basic and diluted loss per share from discontinued operations | | | | | | | | | | | ||||||
Preferred share (US$) | | | (0.24 | ) | | | (0.04 | ) | | | (0.16 | ) | | |||
Common share (US$) | | | (0.24 | ) | | | (0.04 | ) | | | (0.16 | ) | | |||
Basic and diluted earnings (loss) per share | | | | | | | | | | | ||||||
Preferred share (US$) | | | 0.77 | | | | (2.35 | ) | | | 0.13 | | | |||
Common share (US$) | | | 0.77 | | | | (2.35 | ) | | | 0.13 | | | |||
The Company does not hold dilutive potential ordinary shares outstanding that could result in dilution of earnings per share.
![]()
Notes to the Financial Statements (Continued)
Expressed in millions of United States dollar, unless otherwise stated
9. Basic and diluted earnings per share
The basic and diluted earnings per share are presented below:
| | | Year ended December 31 | ||||||
|---|---|---|---|---|---|---|---|---|
| | | 2018 | | 2017 | | 2016 | ||
Net income (loss) attributable to Vale's stockholders: | | | | |||||
Net income from continuing operations | | 6,952 | | 6,313 | | 5,211 | ||
Loss from discontinued operations | | (92 | ) | (806 | ) | (1,229) | ||
| | | | | | | | ||
Net income | | 6,860 | | 5,507 | | 3,982 | ||
| | | | | | | | ||
| | | | | | | | ||
| | | | | | | | ||
Thousands of shares | | | | |||||
Weighted average number of shares outstanding—common shares | | 5,182,445 | | 5,197,432 | | 5,197,432 | ||
Basic and diluted earnings per share from continuing operations: | | | | |||||
Common share (US$) | | 1.34 | | 1.21 | | 1.00 | ||
Basic and diluted loss per share from discontinued operations: | | | | |||||
Common share (US$) | | (0.02 | ) | (0.16 | ) | (0.23) | ||
Basic and diluted earnings per share: | | | | |||||
Common share (US$) | | 1.32 | | 1.05 | | 0.77 | ||
The Company does not have potential outstanding shares or other instruments with dilutive effect on the earnings per share.
| | | December 31, 2016 | | December 31, 2015 | | | December 31, 2018 | | December 31, 2017 | | ||||||||
|---|---|---|---|---|---|---|---|---|---|---|---|---|---|---|---|---|---|---|
Trade receivables | | | 3,723 | | | 1,534 | | | ||||||||||
Impairment of trade receivables | | | (60 | ) | | (58 | ) | | ||||||||||
Accounts receivable | | 2,710 | | 2,660 | | |||||||||||||
Expected credit loss | | (62 | ) | (60 | ) | |||||||||||||
| | | | | | | | | | | | ||||||||
| | | 3,663 | | | 1,476 | | | | 2,648 | | 2,600 | | ||||||
| | | | | | | | | | | | | |||||||
| | | | | | | | | | | | ||||||||
Trade receivables related to the steel sector—% | | | 83.44 | % | | 75.32 | % | | ||||||||||
Revenue related to the steel sector—% | | 85.50 | % | 82.90 | % | |||||||||||||
| | | Year ended December 31 | | |||||||||||||
|---|---|---|---|---|---|---|---|---|---|---|---|---|---|---|---|---|
| | | 2016 | | 2015 | | 2014 | | |||||||||
Impairment of trade receivables recorded in the income statement | | | (5 | ) | | | 11 | | | | (13 | ) | | |||
| | | Year ended December 31 | ||||||
|---|---|---|---|---|---|---|---|---|
| | | 2018 | | 2017 | | 2016 | ||
Impairment of accounts receivable recorded in the income statement | | (7 | ) | (4 | ) | (5) | ||
No individualThere is no customer that individually represents over 10% of receivablesaccounts receivable or revenues.
Accounting policy
Account receivables are financial instruments classified in the category loan and receivables and representAccounts receivable is the total amount due from sale of products and services rendered by the Company. The receivables areAccounts receivable consists of financial assets initially recognized at fair value and subsequently measured at amortized cost, netexcept for component of impairment losses, when applicable.provisionally priced commodities sales that are subsequently measured at fair value through profit or loss ("FVTPL").
The portion of accounts receivables measured at amortized cost is subsequently measured using the effective interest ("EIR") method and it is subject to impairment. The Company has established a provision
| | | | |
| | F-40 | | |
![]()
Notes to the Financial Statements (Continued)
Expressed in millions of United States dollar, unless otherwise stated
10. Accounts receivable (Continued)
matrix that is based on its historical credit loss experience, adjusted for forward-looking factors specific to the economic environment and by any financial guarantees related to these accounts receivables.
Commercial credit risk management—For the commercial credit exposure, which arises from sales to final customers, the risk management area, in accordance with the current delegation level, approves or requestrequests the approval of credit risk limits for each counterparty.
Vale attributes an internal credit risk rating for each counterparty using its own quantitative methodology for credit risk analysis, which is based on market prices, external credit ratings and financial information of the counterparty, as well as qualitative information regarding the counterparty's strategic position and history of commercial relations.
Based on the counterparty's credit risk, risk mitigation strategies may be used to manage the Company`s credit risk. The main credit risk mitigation strategies include non-recourse discountsale of receivables, insurance instruments, letters of credit, corporate and bank guarantees, mortgages, among others.
Vale has a diversified accounts receivable portfolio from a geographical standpoint, with Asia, Europe and Brazil the regions with more significant exposures. According to each region, different guarantees can be used to enhance the credit quality of the receivables.
| | | December 31, 2018 | | December 31, 2017 | | ||
|---|---|---|---|---|---|---|---|
Finished products | | 2,797 | | 2,219 | | ||
Work in progress | | 690 | | 648 | | ||
Consumable inventory | | 956 | | 1,059 | | ||
| | | | | | | ||
Total | | 4,443 | | 3,926 | | ||
| | | | | | | ||
| | | | | | | ||
| | | | | | | ||
| | | Year ended December 31 | ||||||
|---|---|---|---|---|---|---|---|---|
| | | 2018 | | 2017 | | 2016 | ||
Reversal (provision) for net realizable value | | 4 | | (86 | ) | (199) | ||
Finished and work in progress product inventory by segments is presented in note 4(c).
Accounting policy
Inventories are stated at the lower of cost and the net realizable value. The inventory production cost is determined on the basis of variable and fixed costs, direct and indirect costs of production, using the average cost method. At each statement of financial position date, inventories are assessed for impairment and a provision for losses on obsolete or slow-moving inventory may be recognized. The write-downs and reversals are included in "Cost of goods sold and services rendered".
| | | | |
| | F-41 | | |
![]()
Notes to the Financial Statements (Continued)
Expressed in millions of United States dollar, unless otherwise stated
Recoverable taxes are presented net of provisions for losses on tax credits.
| | | December 31, 2018 | | December 31, 2017 | | ||
|---|---|---|---|---|---|---|---|
Value-added tax | | 813 | | 887 | | ||
Brazilian federal contributions | | 808 | | 880 | | ||
Others | | 13 | | 43 | | ||
| | | | | | | ||
Total | | 1,634 | | 1,810 | | ||
| | | | | | | ||
| | | | | | | ||
| | | | | | | ||
Current | | 883 | | 1,172 | | ||
Non-current | | 751 | | 638 | | ||
| | | | | | | ||
Total | | 1,634 | | 1,810 | | ||
| | | | | | | ||
| | | | | | | ||
| | | | | | | ||
13. Other financial assets and liabilities
| | | Current | | Non-Current | | ||||||||
|---|---|---|---|---|---|---|---|---|---|---|---|---|---|
| | | December 31, 2018 | | December 31, 2017 | | December 31, 2018 | | December 31, 2017 | | ||||
Other financial assets | | | | | | ||||||||
Financial investments | | 32 | | 18 | | – | | – | | ||||
Loans | | – | | – | | 153 | | 151 | | ||||
Derivative financial instruments (note 25) | | 39 | | 106 | | 392 | | 453 | | ||||
Investments in equity securities (note 14) | | – | | – | | 987 | | – | | ||||
Related parties—Loans (note 31) | | 364 | | 1,898 | | 1,612 | | 2,628 | | ||||
| | | | | | | | | | | ||||
| | 435 | | 2,022 | | 3,144 | | 3,232 | | |||||
| | | | | | | | | | | ||||
| | | | | | | | | | | ||||
| | | | | | | | | | | ||||
Other financial liabilities | | | | | | ||||||||
Derivative financial instruments (note 25) | | 470 | | 104 | | 344 | | 686 | | ||||
Related parties (note 31) | | 1,134 | | 882 | | 960 | | 975 | | ||||
Participative stockholders' debentures | | – | | – | | 1,407 | | 1,233 | | ||||
| | | | | | | | | | | ||||
| | 1,604 | | 986 | | 2,711 | | 2,894 | | |||||
| | | | | | | | | | | ||||
| | | | | | | | | | | ||||
| | | | | | | | | | | ||||
Participative stockholders' debentures
At the time of its privatization in 1997, the Company issued debentures to then-existing stockholders, including the Brazilian Government. The debentures' terms were set to ensure that pre-privatization stockholders would participate in potential future benefits that might be obtained from exploration of mineral resources.
A total of 388,559,056 debentures were issued with a par value of R$0.01 (one cent of Brazilian Real) and are inflation-indexed to the General Market Price Index ("IGP-M"), as set forth in the Issue Deed. The Company paid as remuneration the amount of US$148 and US$147, respectively, for the year ended December 31, 2018 and 2017.
| | | | |
| | F-42 | | |
![]()
Notes to the Financial Statements (Continued)
Expressed in millions of United States dollar, unless otherwise stated
11. Inventories
| | | December 31, 2016 | | December 31, 2015 | | ||||||
|---|---|---|---|---|---|---|---|---|---|---|---|
Product inventory | | | 2,572 | | | | 3,071 | | | ||
Impairment of product inventory | | | (199 | ) | | | (518 | ) | | ||
| | | | | | | ||||||
| | | 2,373 | | | | 2,553 | | | |||
Consumable inventory | | | 976 | | | | 975 | | | ||
| | | | | | | ||||||
Total | | | 3,349 | | | | 3,528 | | | ||
| | | | | | | ||||||
| | | | | | | | | | | ||
| | | | | | | ||||||
Product inventories by segments are presented in note 3(b).
Accounting policy
Inventories are stated at the lower of cost or the net realizable value. The inventory production cost is determined on the basis of variable and fixed costs, direct and indirect costs of production, using the average cost method. An allowance for losses on obsolete or slow-moving inventory is recognized.
12. Recoverable taxes
Recoverable taxes are presented net of provisions for losses on tax credits.
| | | December 31, 2016 | | December 31, 2015 | | ||||||
|---|---|---|---|---|---|---|---|---|---|---|---|
Value-added tax | | | 724 | | | | 755 | | | ||
Brazilian federal contributions | | | 1,599 | | | | 1,125 | | | ||
Others | | | 29 | | | | 25 | | | ||
| | | | | | | ||||||
Total | | | 2,352 | | | | 1,905 | | | ||
| | | | | | | ||||||
| | | | | | | | | | | ||
| | | | | | | ||||||
Current | | | 1,625 | | | | 1,404 | | | ||
Non-current | | | 727 | | | | 501 | | | ||
| | | | | | | ||||||
Total | | | 2,352 | | | | 1,905 | | | ||
| | | | | | | ||||||
| | | | | | | | | | | ||
| | | | | | | ||||||
![]()
Notes to the Financial Statements (Continued)
Expressed in millions of United States dollar, unless otherwise stated
13. Other financial assets and liabilities
| | | Current | | Non-Current | | ||||||||||||||||
|---|---|---|---|---|---|---|---|---|---|---|---|---|---|---|---|---|---|---|---|---|---|
| | | December 31, 2016 | | December 31, 2015 | | December 31, 2016 | | December 31, 2015 | | ||||||||||||
Others financial assets | | | | | | | | | | | | | | ||||||||
Financial investments | | | 18 | | | | 28 | | | | – | | | | – | | | ||||
Loans | | | – | | | | – | | | | 180 | | | | 188 | | | ||||
Derivative financial instruments (note 25) | | | 274 | | | | 121 | | | | 446 | | | | 93 | | | ||||
Related parties (note 31) | | | 71 | | | | 70 | | | | 2 | | | | 1 | | | ||||
| | | | | | | | | | | ||||||||||||
| | | 363 | | | | 219 | | | | 628 | | | | 282 | | | |||||
| | | | | | | | | | | ||||||||||||
| | | | | | | | | | | | | | | | | | | ||||
| | | | | | | | | | | ||||||||||||
Others financial liabilities | | | | | | | | | | | | | | ||||||||
Derivative financial instruments (note 25) | | | 414 | | | | 2,076 | | | | 1,225 | | | | 1,570 | | | ||||
Related parties (note 31) | | | 672 | | | | 475 | | | | 127 | | | | 213 | | | ||||
Participative stockholders' debentures (note 32(b)) | | | – | | | | – | | | | 775 | | | | 342 | | | ||||
| | | | | | | | | | | ||||||||||||
| | | 1,086 | | | | 2,551 | | | | 2,127 | | | | 2,125 | | | |||||
| | | | | | | | | | | ||||||||||||
| | | | | | | | | | | | | | | | | | | ||||
| | | | | | | | | | | ||||||||||||
14. Non-current assets and liabilities held for sale and discontinued operations
| | | December 31, 2016 | | December 31, 2015 | | |||||||||||||||||||||
|---|---|---|---|---|---|---|---|---|---|---|---|---|---|---|---|---|---|---|---|---|---|---|---|---|---|---|
| | | Fertilizers assets (Discontinued operations) (i) | | Nacala | | Shipping assets | | Total | | Nacala | | |||||||||||||||
Assets | | | | | | | | | | | | | | | | | ||||||||||
Accounts receivable | | | 86 | | | | 6 | | | | – | | | | 92 | | | | 3 | | | |||||
Inventories | | | 387 | | | | 2 | | | | – | | | | 389 | | | | – | | | |||||
Other current assets | | | 107 | | | | 114 | | | | – | | | | 221 | | | | 134 | | | |||||
Investments in associates and joint ventures | | | 90 | | | | – | | | | – | | | | 90 | | | | – | | | |||||
Property, plant and equipment and Intangible, net | | | 2,694 | | | | 4,064 | | | | 357 | | | | 7,115 | | | | 3,907 | | | |||||
Other non-current assets | | | 679 | | | | 3 | | | | – | | | | 682 | | | | – | | | |||||
| | | | | | | | | | | | | |||||||||||||||
Total assets | | | 4,043 | | | | 4,189 | | | | 357 | | | | 8,589 | | | | 4,044 | | | |||||
| | | | | | | | | | | | | |||||||||||||||
Liabilities | | | | | | | | | | | | | | | | | ||||||||||
Suppliers and contractors | | | 280 | | | | 41 | | | | – | | | | 321 | | | | 93 | | | |||||
Other current liabilities | | | 192 | | | | 13 | | | | – | | | | 205 | | | | 14 | | | |||||
Other non-current liabilities | | | 559 | | | | 5 | | | | – | | | | 564 | | | | | | ||||||
| | | | | | | | | | | | | |||||||||||||||
Total liabilities | | | 1,031 | | | | 59 | | | | – | | | | 1,090 | | | | 107 | | | |||||
| | | | | | | | | | | | | |||||||||||||||
Net non-current assets held for sale | | | 3,012 | | | | 4,130 | | | | 357 | | | | 7,499 | | | | 3,937 | | | |||||
| | | | | | | | | | | | | |||||||||||||||
| | | | | | | | | | | | | | | | | | | | | | | |||||
| | | | | | | | | | | | | |||||||||||||||
| | December 31, 2017 | | ||
|---|---|---|---|---|
| | Fertilizers | | ||
Assets | | | ||
Accounts receivable | | 90 | | |
Inventories | | 460 | | |
Other current assets | | 110 | | |
Investments in associates and joint ventures | | 83 | | |
Property, plant and equipment and Intangible | | 2,149 | | |
Other non-current assets | | 695 | | |
| | | | | |
Total assets | | 3,587 | | |
| | | | | |
Liabilities | | | ||
Suppliers and contractors | | 324 | | |
Other current liabilities | | 215 | | |
Other non-current liabilities | | 640 | | |
| | | | | |
Total liabilities | | 1,179 | | |
| | | | | |
Net non-current assets held for sale | | 2,408 | | |
| | | | | |
| | | | | |
| | | | | |
a) Discontinued operations (Fertilizers assets)Fertilizers (discontinued operations)
In December 2016,January 2018, the Company entered into an agreement withand The Mosaic Company ("Mosaic") concluded the transaction entered in December 2016, to sell (i) the phosphate assets located in Brazil, except for those mainly related to nitrogen assets located in Cubatão, (Brazil);Brazil; (ii) the control of Compañia Minera Miski Mayo S.A.C., in Peru; (iii) the potassium assets located in Brazil; and (iv) the potash projects in Canada. The Company received US$1,080 in cash and 34.2 million common shares, corresponding to 8.9% of Mosaic's outstanding common shares after the issuance of these shares totaling US$899, based on the Mosaic's quotation at closing date of the transaction and a loss of US$55 was recognized in the income statement from discontinued operations.
Mosaic's shares received were accounted for as a financial investment measured at fair value through other comprehensive income. The Company recognized a gain of US$90 (US$60, net of tax) for the year ended December 31, 2018, in other comprehensive income as "Fair value adjustment to investment in equity securities".
b) Cubatão (part of the fertilizer segment)
In November 2017, the Company entered into an agreement with Yara International ASA to sell its assets located in Cubatão, Brazil. In May 2018, the transaction was concluded and the Company received US$255 in cash and a loss of US$69 was recognized in the income statement from discontinued operations.
| | | | |
| | F-43 | | |
![]()
Notes to the Financial Statements (Continued)
Expressed in millions of United States dollar, unless otherwise stated
14. Non-current assets and liabilities held for sale and discontinued operations (Continued)
The agreed transaction price is US$2.5 billion, of which US$1.25 billion will be paid in cash and US$1.25 billion with 42.3 million common shares to be issued by Mosaic, which at the transaction date represents around 11% of Mosaic's total outstanding common shares. Completion of the transaction is expected for the end of 2017 and is subject to the spin-off of the nitrogen assets from Vale Fertilizantes S.A.; the fulfillment of usual precedent conditions, including the approval of the Administrative Council of Economic Defense (CADE) and other antitrust authorities; and other operational and regulatory matters.
Vale may receive additional earn-out of the transaction up to US$260 in circumstances where the phosphate price (MAP—Monoammonium Phosphate) and the Real exchange rate exceed certain levels during each of the twelve months periods after the completion of the transaction during two years.
The assets located in Cubatão, which are mostly dedicated to the operation with nitrogen, will be transferred from Vale Fertilizantes S.A. to an independent legal entity, for which the Company is actively seeking to identify potential buyers.
Therefore, the fertilizer segment, including Cubatão, is presented as a discontinued operation and the related assets and liabilities were classified as assets and liabilities held for sale, as established by IFRS 5.
As consequence, the net assets of the fertilizers segment was adjusted to reflect the fair value less cost to sell and a loss of US$1,738 (US$1,147 net of tax) was recognized in the income statement from discontinued operations for the year ended December 31, 2016.
At the completion of the transaction, the Company will recycle US$75 of the "Cumulative translation adjustments" to the income statement. For the years ended December 31, 2016, 2015 and 2014 the comprehensive income attributable to Vale's stockholders regarding discontinued operations was a loss of US$131, a gain of US$106 and a loss of US$9, respectively.
The results for the years and the cash flows of discontinued operations of the Fertilizer segment are presented as follows:
Income statement
| | | Year ended December 31 | | | Year ended December 31 | | ||||||||||||||||||||
|---|---|---|---|---|---|---|---|---|---|---|---|---|---|---|---|---|---|---|---|---|---|---|---|---|---|---|
| | | 2016 | | 2015 | | 2014 | | | 2018 | | 2017 | | 2016 | | ||||||||||||
Net income of discontinued operations | | | | | | | | | ||||||||||||||||||
Discontinued operations | | | | | ||||||||||||||||||||||
Net operating revenue | | | 1,875 | | | 2,225 | | | 2,415 | | | | 121 | | 1,746 | | 1,875 | | ||||||||
Cost of goods sold and services rendered | | | (1,887 | ) | | (1,762 | ) | | (2,274 | ) | | | (120 | ) | (1,605 | ) | (1,887 | ) | ||||||||
Operating expenses | | | (130 | ) | | (206 | ) | | (282 | ) | | | (4 | ) | (141 | ) | (130 | ) | ||||||||
Results on measurement or sale of non-current assets | | | (1,738 | ) | | (157 | ) | | (1,053 | ) | | |||||||||||||||
Impairment of non-current assets | | (124 | ) | (885 | ) | (1,738 | ) | |||||||||||||||||||
| | | | | | | | | | | | | | | | ||||||||||||
Operating income (loss) | | | (1,880 | ) | | | 100 | | | (1,194 | ) | | ||||||||||||||
Operating loss | | (127 | ) | (885 | ) | (1,880 | ) | |||||||||||||||||||
Financial Results, net | | | 20 | | | (147 | ) | | (51 | ) | | | (5 | ) | (28 | ) | 20 | | ||||||||
Equity results in associates and joint ventures | | | 3 | | | 6 | | | 4 | | | | – | | (2 | ) | 3 | | ||||||||
| | | | | | | | | | | | | | | | ||||||||||||
Loss before income taxes | | | (1,857 | ) | | | (41 | ) | | | (1,241 | ) | | | (132 | ) | (915 | ) | (1,857 | ) | ||||||
Income taxes | | | 630 | | | (149 | ) | | 403 | | | | 40 | | 102 | | 630 | | ||||||||
| | | | | | | | | | | | | | | | ||||||||||||
Loss from discontinued operations | | | (1,227 | ) | | | (190 | ) | | | (838 | ) | | | (92 | ) | (813 | ) | (1,227 | ) | ||||||
| | | | | | | | | |||||||||||||||||||
Income attributable to noncontrolling interests | | | 2 | | | 10 | | | 4 | | | |||||||||||||||
Net income (loss) attributable to noncontrolling interests | | – | | (7 | ) | 2 | | |||||||||||||||||||
| | | | | | | | | | | | | | | | ||||||||||||
Loss attributable to Vale's stockholders | | | (1,229 | ) | | | (200 | ) | | | (842 | ) | | | (92 | ) | (806 | ) | (1,229 | ) | ||||||
| | | | | | | | | | | | | | | | | |||||||||||
| | | | | | | | | | | | | | | | ||||||||||||
Statement of cash flow
| | | Year ended December 31 | | |||||||
|---|---|---|---|---|---|---|---|---|---|---|
| | | 2018 | | 2017 | | 2016 | | |||
Discontinued operations | | | | | ||||||
Cash flow from operating activities | | | | | ||||||
Loss before income taxes | | (132 | ) | (915 | ) | (1,857 | ) | |||
Adjustments: | | | | | ||||||
Equity results in associates and joint ventures | | – | | 2 | | (3 | ) | |||
Depreciation, amortization and depletion | | – | | 1 | | 347 | | |||
Impairment of non-current assets | | 124 | | 885 | | 1,738 | | |||
Others | | 5 | | – | | (20 | ) | |||
Increase (decrease) in assets and liabilities | | (34 | ) | 114 | | (25 | ) | |||
| | | | | | | | | |||
Net cash provided by (used in) operating activities | | (37 | ) | 87 | | 180 | | |||
Cash flow from investing activities | | | | | ||||||
Additions to property, plant and equipment | | (9 | ) | (305 | ) | (292 | ) | |||
Others | | – | | – | | 11 | | |||
| | | | | | | | | |||
Net cash used in investing activities | | (9 | ) | (305 | ) | (281 | ) | |||
Cash flow from financing activities | | | | | ||||||
Loans and borrowings | | | | | ||||||
Repayments | | – | | (34 | ) | (17 | ) | |||
| | | | | | | | | |||
Net cash used in financing activities | | – | | (34 | ) | (17 | ) | |||
| | | | | | | | | |||
Net cash used in discontinued operations | | (46 | ) | (252 | ) | (118 | ) | |||
| | | | | | | | | |||
| | | | | | | | | |||
| | | | | | | | | |||
| | | | |
| | F-44 | | |
![]()
Notes to the Financial Statements (Continued)
Expressed in millions of United States dollar, unless otherwise stated
14. Non-current assets and liabilities held for sale and discontinued operations (Continued)
| | | Year ended December 31 | | |||||||||||||
|---|---|---|---|---|---|---|---|---|---|---|---|---|---|---|---|---|
| | | 2016 | | 2015 | | 2014 | | |||||||||
Cash flow from discontinued operations | | | | | | | | | | | ||||||
Operating activities | | | | | | | | | | | ||||||
Loss before income taxes | | | (1,857 | ) | | | (41 | ) | | | (1,241 | ) | | |||
Adjustments: | | | | | | | | | | | ||||||
Equity results in associates and joint ventures | | | (3 | ) | | | (6 | ) | | | (4 | ) | | |||
Depreciation, amortization and depletion | | | 347 | | | | 310 | | | | 419 | | | |||
Results on measurement or sale of non-current assets | | | 1,738 | | | | 157 | | | | 1,053 | | | |||
Others | | | (20 | ) | | | 148 | | | | 51 | | | |||
Decrease in assets and liabilities | | | (25 | ) | | | (9 | ) | | | (266 | ) | | |||
| | | | | | | | | |||||||||
Net cash provided by operating activities | | | 180 | | | | 559 | | | | 12 | | | |||
| | | | | | | | | |||||||||
Investing activities | | | | | | | | | | | ||||||
Additions to property, plant and equipment | | | (292 | ) | | | (257 | ) | | | (36 | ) | | |||
Others | | | 11 | | | | (89 | ) | | | 55 | | | |||
| | | | | | | | | |||||||||
Net cash provided (used) in investing activities | | | (281 | ) | | | (346 | ) | | | 19 | | | |||
| | | | | | | | | |||||||||
Financing activities | | | | | | | | | | | ||||||
Repayments | | | (17 | ) | | | (73 | ) | | | (72 | ) | | |||
| | | | | | | | | |||||||||
Net cash used in financing activities | | | (17 | ) | | | (73 | ) | | | (72 | ) | | |||
| | | | | | | | | |||||||||
Net cash provided (used) by discontinued operations | | | (118 | ) | | | 140 | | | | (41 | ) | | |||
| | | | | | | | | |||||||||
| | | | | | | | | | | | | | | |||
| | | | | | | | | |||||||||
b) Coal—Nacala logistic corridor ("Nacala")
In December 2014, the Company signed an agreement with Mitsui & Co., Ltd. ("Mitsui") to sell 50% of its stake in the Nacala corridor and 15% of Vale´s stake in Vale Moçambique which holds the coal assets. After completion of the transaction, Vale will indirectly own 81% of the Moatize mine (Vale Moçambique) and approximately 50% of Nacala Corridor. Since Nacala will be jointly controlled by Vale and Mitsui the related assets and liabilities were classified as non-current assets held for sale with no impact in the income statement.
In September 2016, the Company reviewed the terms related to this transaction, in which Mitsui agreed to contribute up to US$450, being: (i) US$255 for a 15% of Vale's stake in the Moatize coal mine; and (ii) an additional contribution of up to US$195 based on meeting certain conditions, including mine performance. Mitsui will also contribute US$348 for a 50% stake in the equity andquasi-equity instruments of the Nacala and extend a long-term facility of US$165.
As at December 2016, completion of the transaction remains subject to successful completion of the Project Finance and certain government approvals which are expected to occur in 2017.
c) Shipping assets
In June 2016, Vale approved a plan to dispose of its fleet of eleven ships. As a consequence, the referenced assets were reclassified to non-current assets held for sale and a loss of US$66 was recorded in the income statement as "Results on measurement or sale of non-current assets".
![]()
Notes to the Financial Statements (Continued)
Expressed in millions of United States dollar, unless otherwise stated
14. Non-current assets and liabilities held for sale and discontinued operations (Continued)
In the year ended December 31, 2016, the Company concluded the sale of three Very Large Ore Carriers ("VLOC's") for US$269 and four Capesize vessels for US$140. There are four vessels that are still held for sale as at December 31, 2016.
Accounting policy
A non-current asset is classified as held for sale if its carrying amount will be recovered principally through a sale transaction rather than through continuing use.
The criteria for recognition of the non-current assets as held for sale are only considered satisfied when the sale is highly probable and the asset (or disposal group of assets) is available for immediate sale in its present condition.
The Company measures the assets held for sale (or group of assets) at the lower of its carrying amount and fair value less costs to sell. If the carrying amount exceeds the fair value less costs to sell an impairment loss is recognized against income.income statement. Any subsequent reversal of impairment is recognized only to the extent of the loss previously recognized.
The assets and liabilities of a disposal group classified as held for sale are presented separately in the statement of financial position.
The classification as a discontinued operation occurs through disposal, or when the operation meets the criteria to be classified as held for sale if this occurs earlier. A discontinued operation is a component of a GroupCompany business comprising cash flows and operations that may be clearly distinct from the rest of the GroupCompany and that represents an important separate line of business or geographical area of operations.
The result of discontinued operations is presented in a single amount in the income statement, including the results after income tax of these operations less any impairment loss. Cash flows attributable to operating, investing and financing activities of discontinued operations are describeddisclosed in a separate note.
When an operation is classified as a discontinued operation, the income statements of the prior periods are re-presentedrestated as if the operation had been discontinued since the beginning of the comparative period.
Any non-controllingnoncontrolling interest relating to a group disposal group will beheld for sale is presented in the stockholdersstockholders' equity and is not being reclassified as a held for sale.in the statement of financial position.
| | | | |
| | F-45 | | |
![]()
Notes to the Financial Statements (Continued)
Expressed in millions of United States dollar, unless otherwise stated
The significant consolidated entities in each business segment are as follows:
| | | Location | | Main activity/Business | | % Ownership | | % Voting capital | | % Noncontrolling interest | | |||
|---|---|---|---|---|---|---|---|---|---|---|---|---|---|---|
Direct and indirect subsidiaries | | | | | | | ||||||||
Companhia Portuária da Baía de Sepetiba | | Brazil | | Iron ore | | 100.0 | % | 100.0 | % | 0.0 | % | |||
Mineração Corumbaense Reunida S.A. | | Brazil | | Iron ore and manganese | | 100.0 | % | 100.0 | % | 0.0 | % | |||
Minerações Brasileiras Reunidas S.A. ("MBR") | | Brazil | | Iron ore | | 62.5 | % | 98.3 | % | 37.5 | % | |||
Salobo Metais S.A. | | Brazil | | Copper | | 100.0 | % | 100.0 | % | 0.0 | % | |||
PT Vale Indonesia | | Indonesia | | Nickel | | 59.2 | % | 59.2 | % | 40.8 | % | |||
Vale International Holdings GmbH | | Austria | | Holding and research | | 100.0 | % | 100.0 | % | 0.0 | % | |||
Vale Canada Limited | | Canada | | Nickel | | 100.0 | % | 100.0 | % | 0.0 | % | |||
Vale International S.A. | | Switzerland | | Trading and holding | | 100.0 | % | 100.0 | % | 0.0 | % | |||
Vale Malaysia Minerals Sdn. Bhd. | | Malaysia | | Iron ore | | 100.0 | % | 100.0 | % | 0.0 | % | |||
Vale Manganês S.A. | | Brazil | | Manganese and ferroalloys | | 100.0 | % | 100.0 | % | 0.0 | % | |||
Vale Moçambique S.A. | | Mozambique | | Coal | | 80.7 | % | 80.7 | % | 19.3 | % | |||
Vale Nouvelle Caledonie S.A.S. | | New Caledonia | | Nickel | | 95.0 | % | 95.0 | % | 5.0 | % | |||
Vale Oman Distribution Center LLC | | Oman | | Iron ore and pelletizing | | 100.0 | % | 100.0 | % | 0.0 | % | |||
Vale Oman Pelletizing Company LLC | | Oman | | Pelletizing | | 70.0 | % | 70.0 | % | 30.0 | % | |||
As explained in note 14, the Fertilizer Segment is presented as discontinued operations, which includes the following subsidiaries:
| | | Location | | Main activity/Business | | % Ownership | | % Voting capital | | % Noncontrolling interest | | |||
|---|---|---|---|---|---|---|---|---|---|---|---|---|---|---|
Direct and indirect subsidiaries | | | | | | | ||||||||
Compañia Minera Miski Mayo S.A.C. | | Peru | | Fertilizers | | 40.0 | % | 51.0 | % | 60.0 | % | |||
Vale Fertilizantes S.A. | | Brazil | | Fertilizers | | 100.0 | % | 100.0 | % | 0.0 | % | |||
Vale Cubatão Fertilizantes Ltda. | | Brazil | | Fertilizers | | 100.0 | % | 100.0 | % | 0.0 | % | |||
Accounting policy
15. InvestmentsConsolidation and investments in associates and joint ventures—The financial statements reflect the assets, liabilities and transactions of the Parent Company and its direct and indirect controlled entities ("subsidiaries"). The subsidiaries are consolidated when the Company is exposed or has rights to variable returns from its involvement with the investee and has the ability to direct the significant activities of the investee. Intercompany balances and transactions, which include unrealized profits, are eliminated.
The material non-consolidated entities forover which the GroupCompany has joint control ("joint ventures") or significant influence, but not control ("associates") are as follows:
| | | Location | | Principal activity | | % ownership | | % Voting capital | | % Other investors | | |||||||||
|---|---|---|---|---|---|---|---|---|---|---|---|---|---|---|---|---|---|---|---|---|
Joint ventures | | | | | | | | | | | | | ||||||||
Aliança Geração de Energia S.A. (i) | | Brazil | | Energy | | | 55.0 | % | | | 55.0 | % | | | 45.0 | % | | |||
Companhia Coreano-Brasileira de Pelotização | | Brazil | | Pellets | | | 50.0 | % | | | 50.0 | % | | | 50.0 | % | | |||
Companhia Hispano-Brasileira de Pelotização (i) | | Brazil | | Pellets | | | 50.9 | % | | | 51.0 | % | | | 49.1 | % | | |||
Companhia Ítalo-Brasileira de Pelotização (i) | | Brazil | | Pellets | | | 50.9 | % | | | 51.0 | % | | | 49.1 | % | | |||
Companhia Nipo-Brasileira de Pelotização (i) | | Brazil | | Pellets | | | 51.0 | % | | | 51.1 | % | | | 49.0 | % | | |||
Companhia Siderúrgica do Pecém ("CSP") | | Brazil | | Steel | | | 50.0 | % | | | 50.0 | % | | | 50.0 | % | | |||
MRS Logística S.A. | | Brazil | | Logistics | | | 48.16 | % | | | 46.75 | % | | | 51.84 | % | | |||
Samarco Mineração S.A. | | Brazil | | Pellets | | | 50.0 | % | | | 50.0 | % | | | 50.0 | % | | |||
Direct and indirect associates | |
| |
| | | | | | | | | | | ||||||
Henan Longyu Energy Resources Co., Ltd. | | China | | Coal | | | 25.0 | % | | | 25.0 | % | | | 75.0 | % | | |||
VLI S.A. | | Brazil | | Logistics | | | 37.6 | % | | | 37.6 | % | | | 62.4 | % | | |||
The associates and joint venturespresented in note 16. Those investments are accounted for using the equity method.
Unrealized gains on downstream or upstream transactions between the Company and its associates and joint ventures are eliminated proportionately to the Company's interest.
| | | | |
| | F-46 | | |
![]()
Notes to the Financial Statements (Continued)
Expressed in millions of United States dollar, unless otherwise stated
15. Subsidiaries (Continued)
Investments held majorityby other investors in Vale's subsidiaries are classified as noncontrolling interests ("NCI"). The Company treats transactions with noncontrolling interests as transactions with equity owners of the votingCompany as described in note 17.
For purchases or disposals from noncontrolling interests, the difference between the consideration paid and the proportion acquired of the carrying value of net assets of the subsidiary is directly recorded in stockholders' equity in "Results from operation with noncontrolling interest".
Translation from the functional currency to the presentation currency—The income statement and statement of financial position of the subsidiaries for which the functional currency is different from the presentation currency are translated into the presentation currency as follows: (i) assets, liabilities and stockholders' equity, except for the components described in item (iii) are translated at the closing rate at the statement of financial position date; (ii) income and expenses are translated at the average exchange rates, except for specific significant transactions that are translated at the rate at the transaction date and; (iii) capital, capital reserves and treasury stock are translated at the entitiesrate at each transaction date. All resulting exchange differences are accounted underrecognized directly in the comprehensive income as "translation adjustments". When a foreign operation is disposed of or sold, foreign exchange differences that were recognized in equity method due to shareholders' agreements where relevant decisions are shared with other parties.
a) Changes duringrecognized in the yearincome of statement.
Changes in investments 16. Investments in associates and joint ventures
The significant non-consolidated entities of the Company are as follows:
| | | 2016 | | 2015 | | ||||||||||||||||||||||||||
|---|---|---|---|---|---|---|---|---|---|---|---|---|---|---|---|---|---|---|---|---|---|---|---|---|---|---|---|---|---|---|---|
| | | Associates | | Joint ventures | | Total | | Associates | | Joint ventures | | Total | | ||||||||||||||||||
Balance at January 1st, | | | 1,323 | | | | 1,617 | | | | 2,940 | | | | 2,059 | | | | 2,074 | | | | 4,133 | | | ||||||
| | | | | | | | | | | | | | | ||||||||||||||||||
Acquisitions | | | – | | | | – | | | | – | | | | 4 | | | | 580 | | | | 584 | | | ||||||
Additions | | | 1 | | | | 238 | | | | 239 | | | | – | | | | 30 | | | | 30 | | | ||||||
Capitalizations | | | – | | | | – | | | | – | | | | 249 | | | | – | | | | 249 | | | ||||||
Disposals | | | (7 | ) | | | – | | | | (7 | ) | | | 79 | | | | – | | | | 79 | | | ||||||
Translation adjustment | | | 175 | | | | 338 | | | | 513 | | | | (558 | ) | | | (653 | ) | | | (1,211 | ) | | ||||||
Equity results in income statement | | | 69 | | | | 240 | | | | 309 | | | | (137 | ) | | | (308 | ) | | | (445 | ) | | ||||||
Equity results from discontinued operations | | | 3 | | | | – | | | | 3 | | | | 6 | | | | – | | | | 6 | | | ||||||
Equity results in statement of comprehensive income | | | – | | | | – | | | | – | | | | (6 | ) | | | – | | | | (6 | ) | | ||||||
Dividends declared | | | (37 | ) | | | (165 | ) | | | (202 | ) | | | (59 | ) | | | (36 | ) | | | (95 | ) | | ||||||
Impairment (note 19) | | | – | | | | – | | | | – | | | | (314 | ) | | | (132 | ) | | | (446 | ) | | ||||||
Transfer to held for sale | | | (90 | ) | | | – | | | | (90 | ) | | | – | | | | – | | | | – | | | ||||||
Others | | | – | | | | (9 | ) | | | (9 | ) | | | | | | 62 | | | | 62 | | | |||||||
| | | | | | | | | | | | | | | ||||||||||||||||||
Balance at December 31, | | | 1,437 | | | | 2,259 | | | | 3,696 | | | | 1,323 | | | | 1,617 | | | | 2,940 | | | ||||||
| | | | | | | | | | | | | | | ||||||||||||||||||
| | | | | | | | | | | | | | | | | | | | | | | | | | | ||||||
| | | | | | | | | | | | | | | ||||||||||||||||||
| | | Location | | Main activity/Business | | % Ownership | | % Voting capital | | % Noncontrolling interest | | |||
|---|---|---|---|---|---|---|---|---|---|---|---|---|---|---|
Joint ventures | | | | | | | ||||||||
Aliança Geração de Energia S.A. | | Brazil | | Energy | | 55.0 | % | 55.0 | % | 45.0 | % | |||
Companhia Coreano-Brasileira de Pelotização | | Brazil | | Pelletizing | | 50.0 | % | 50.0 | % | 50.0 | % | |||
Companhia Hispano-Brasileira de Pelotização | | Brazil | | Pelletizing | | 50.9 | % | 51.0 | % | 49.1 | % | |||
Companhia Ítalo-Brasileira de Pelotização | | Brazil | | Pelletizing | | 50.9 | % | 51.0 | % | 49.1 | % | |||
Companhia Nipo-Brasileira de Pelotização | | Brazil | | Pelletizing | | 51.0 | % | 51.1 | % | 49.0 | % | |||
Companhia Siderúrgica do Pecém ("CSP") | | Brazil | | Steel | | 50.0 | % | 50.0 | % | 50.0 | % | |||
MRS Logística S.A. | | Brazil | | Logistics | | 48.2 | % | 46.8 | % | 51.8 | % | |||
Nacala Corridor Holding Netherlands B.V. | | Netherlands | | Coal | | 50.0 | % | 50.0 | % | 50.0 | % | |||
Samarco Mineração S.A. | | Brazil | | Pelletizing | | 50.0 | % | 50.0 | % | 50.0 | % | |||
Direct and indirect associates | | | | | | | ||||||||
Henan Longyu Energy Resources Co., Ltd. | | China | | Coal | | 25.0 | % | 25.0 | % | 75.0 | % | |||
VLI S.A. | | Brazil | | Logistics | | 37.6 | % | 37.6 | % | 62.4 | % | |||
| | | | |
| | F-47 | | |
The investments by segments are presented in note 3(b).
![]()
Notes to the Financial Statements (Continued)
Expressed in millions of United States dollar, unless otherwise stated
15.16. Investments in associates and joint ventures (Continued)
a) Changes during the year
Changes in investments in associates and joint ventures as follows:
| | | 2018 | | 2017 | ||||||||||||||
|---|---|---|---|---|---|---|---|---|---|---|---|---|---|---|---|---|---|---|
| | | Associates | | Joint ventures | | Total | | Associates | | Joint ventures | | Total | ||||||
Balance at January 1st, | | 1,441 | | 2,127 | | 3,568 | | 1,437 | | 2,259 | | 3,696 | ||||||
| | | | | | | | | | | | | | ||||||
Additions(i) | | — | | 23 | | 23 | | 1 | | 92 | | 93 | ||||||
Translation adjustment | | (184 | ) | (272 | ) | (456 | ) | (2 | ) | (28 | ) | (30) | ||||||
Equity results in income statement | | 44 | | 261 | | 305 | | 57 | | 41 | | 98 | ||||||
Equity results in statement of comprehensive income | | — | | — | | — | | — | | (152 | ) | (152) | ||||||
Dividends declared | | — | | (291 | ) | (291 | ) | (57 | ) | (226 | ) | (283) | ||||||
Transfer from non-current assets held for sale(ii) | | 87 | | — | | 87 | | — | | — | | — | ||||||
Others | | 4 | | (15 | ) | (11 | ) | 5 | | 141 | | 146 | ||||||
| | | | | | | | | | | | | | ||||||
Balance at December 31, | | 1,392 | | 1,833 | | 3,225 | | 1,441 | | 2,127 | | 3,568 | ||||||
| | | | | | | | | | | | | | ||||||
| | | | | | | | | | | | | | ||||||
| | | | | | | | | | | | | | ||||||
The investments by segments are presented in note 4(c).
b) Acquisitions and divestituredivestitures
2018
Ferrous Resources Limited—In December 2018, the Company entered into an agreement to purchase the control of Ferrous Resources Limited, a company that currently owns and operates iron ore mines closely located to Company's operations in Minas Gerais, Brazil. The purchase price is US$550 and the conclusion of transaction is expected to occur in 2019, subject to conditions precedent.
New Steel—In January 2019 (subsequent event), the Company acquired for the total consideration of US$500 the control of New Steel Global NV, a company that develops innovative iron ore beneficiation technologies and currently owns patents of dry processing concentration in 56 countries.
2017
Nacala Logistic Corridor—In March 2017, the Company concluded the transaction with Mitsui & Co., Ltd. ("Mitsui") to transfer 50% of its stake of 66.7% in Nacala Logistic Corridor, which comprises entities that holds railroads and port concessions located in Mozambique and Malawi, and sell 15% participation in the holding entity of Vale Moçambique, which holds the Moatize Coal Project, for the amount of US$690.
| | | | |
| | F-48 | | |
![]()
Notes to the Financial Statements (Continued)
Expressed in millions of United States dollar, unless otherwise stated
16. Investments in associates and joint ventures (Continued)
After the completion of the transaction, the Company (i) holds 81% of Vale Moçambique and retains the control of the Moatize Coal Project and (ii) shares control of the Nacala Logistic Corridor structure (Nacala BV), with Mitsui.
As a consequence of sharing control of Nacala BV, the Company:
(i) derecognized the assets and liabilities classified as held for sale in the total amount of US$4,144, from which US$4,063 refers to property, plant and equipment and intangibles;
(ii) derecognized US$14 related to cash and cash equivalents;
(iii) recognized a gain of US$447 in the income statement related to the sale and the re-measurement at fair value, of its remaining interest at Nacala BV based on the consideration received;
(iv) reclassified the gain related to the cumulative translation adjustments on to income statements in the amount of US$11;
The result of the transaction regarding the assets from Nacala's logistic corridor was recognized in the income statement as "Impairment and disposal of non-current assets".
The results of the transaction with the coal holding entity was recognized in "Results from operation with noncontrolling interest" in the amount of US$105, directly in Stockholders' Equity.
The consideration received was recognized in the statement of cash flows in "Proceeds from disposal of assets and investments" in the amount of US$435 and "Transactions with noncontrolling stockholders" in the amount of US$255.
After the conclusion of the transaction, Vale has outstanding loan balances with the related parties Nacala BV and Pangea Emirates Ltd due to the deconsolidation of Nacala Logistic Corridor as disclosed in note 31.
2016
Thyssenkrupp Companhia Siderúrgica do Atlântico Ltd ("CSA")—In April 2016, the Company sold 100% of its interest at CSA (26.87%) for a non-significant amount. The transaction resulted in a loss of US$75 loss ondue to recycling the "Cumulative translation adjustments" recognized in the income statement as "Impairment"Equity results and othersother results in associates and joint ventures".
Minas da Serra Geral S.A. ("MSG")—In March 2016, the Company completed the purchase option on additional 50% participation at MSG which was owned by JFE Steel Corporation ("JFE") in the amount of US$17. Vale now holds 100% of MSG's shares.
2015
Energy generation assets—In December 2013, the Company signed agreements with CEMIG Geração e Transmissão S.A. ("CEMIG GT") to incorporate two joint ventures, Aliança Norte Participações S.A. and Aliança Geração de Energia S.A and exchange of assets and shares. The transaction was completed in the first quarter of 2015, in which Vale received cash proceeds of US$97 and recognized a gain of US$18 as "Impairment and others results in associates and joint ventures" and a gain of US$193 as "Results on measurement or sales of non-current assets".
Divestiture of Shandong Yankuang International Coking Co., Ltd. ("Yankuang")—The Company completed the sale of its participation in Yankuang, a producer of coking coal, methanol and other products. In this transaction, Vale recognized a gain of US$79 as "Impairment and others results in associates and joint ventures".
The "Impairment and others results in associates and joint ventures" are as follows:
| | | Year ended December 31 | | |||||||||||||
|---|---|---|---|---|---|---|---|---|---|---|---|---|---|---|---|---|
| | | 2016 | | 2015 | | 2014 | | |||||||||
Samarco provision (note 21) | | | (1,109 | ) | | | – | | | | – | | | |||
Divestiture—Thyssenkrupp Companhia Siderúrgica do Atlântico Ltd | | | (75 | ) | | | – | | | | – | | | |||
Divestiture—Paragominas (i) | | | (36 | ) | | | – | | | | – | | | |||
Divestiture—Shandong Yankuang International Coking Co., Ltd. | | | – | | | | 79 | | | | – | | | |||
Energy generation assets | | | – | | | | 18 | | | | – | | | |||
Divestiture—Vale Florestar Fundo de Investimento em Participações | | | – | | | | – | | | | (30 | ) | | |||
Impairment of investments (note 19) | | | – | | | | (446 | ) | | | (31 | ) | | |||
| | | | | | | | | |||||||||
Total | | | (1,220 | ) | | | (349 | ) | | | (61 | ) | | |||
| | | | | | | | | |||||||||
| | | | | | | | | | | | | | | |||
| | | | | | | | | |||||||||
| | | | |
| | F-49 | | |
![]()
Notes to the Financial Statements (Continued)
Expressed in millions of United States dollar, unless otherwise stated
15.16. Investments in associates and joint ventures (continued)(Continued)
| | | | | | | Investments in associates and joint ventures | | | | Equity results in the income statement | | Dividends received | | |||||||||||||||||||||||||||||||||||||||||||||||||||||||||||||||||||
|---|---|---|---|---|---|---|---|---|---|---|---|---|---|---|---|---|---|---|---|---|---|---|---|---|---|---|---|---|---|---|---|---|---|---|---|---|---|---|---|---|---|---|---|---|---|---|---|---|---|---|---|---|---|---|---|---|---|---|---|---|---|---|---|---|---|---|---|---|---|---|---|---|---|---|---|---|---|---|---|---|
| | | | | | | | | Year ended December 31 | | |||||||||||||||||||||||||||||||||||||||||||||||||||||||||||||||||||||||
| | | | | | | | | | | | | Year ended December 31 | | | | | | | Investments in associates and joint ventures | | Equity results in the income statement | | Dividends received | |||||||||||||||||||||||||||||||||||||||||||||||||||||||||
| | | | | % voting capital | | December 31, 2016 | | December 31, 2015 | | | Year ended December 31 | | | | | | | | | | Year ended December 31 | | Year ended December 31 | |||||||||||||||||||||||||||||||||||||||||||||||||||||||||
| Associates and joint ventures | | % ownership | | 2016 | | 2016 | | 2015 | | 2014 | | 2015 | | 2014 | | % ownership | | % voting capital | | December 31, 2018 | | December 31, 2017 | | 2018 | | 2017 | | 2016 | | 2018 | | 2017 | | 2016 | ||||||||||||||||||||||||||||||||||||||||||||||
Ferrous minerals | | | | | | | | | | | | | | | | | | | | | | | | | | | | | | | | |||||||||||||||||||||||||||||||||||||||||||||||||
Baovale Mineração S.A. | | | 50.00 | | | 50.00 | | | 26 | | | 24 | | | 9 | | | – | | | 4 | | | – | | | – | | | – | | | | 50.00 | | 50.00 | | 23 | | 26 | | 5 | | 7 | | 9 | | 1 | | 1 | | – | ||||||||||||||||||||||||||||
| | | | | | | | | | | | | | | | | | | | | | | |||||||||||||||||||||||||||||||||||||||||||||||||||||||||||
Companhia Coreano-Brasileira de Pelotização | | | 50.00 | | | 50.00 | | | 68 | | | 62 | | | 17 | | | 25 | | | 30 | | | 26 | | | 19 | | | 16 | | | | 50.00 | | 50.00 | | 104 | | 89 | | 69 | | 50 | | 17 | | 32 | | 19 | | 26 | ||||||||||||||||||||||||||||
Companhia Hispano-Brasileira de Pelotização | | | 50.89 | | | 51.00 | | | 59 | | | 57 | | | 15 | | | 14 | | | 24 | | | 27 | | | 16 | | | 11 | | | ||||||||||||||||||||||||||||||||||||||||||||||||
Companhia Ítalo-Brasileira de Pelotização | | | 50.90 | | | 51.00 | | | 69 | | | 50 | | | 16 | | | 21 | | | 25 | | | 9 | | | 14 | | | 5 | | | ||||||||||||||||||||||||||||||||||||||||||||||||
Companhia Nipo-Brasileira de Pelotização | | | 51.00 | | | 51.11 | | | 108 | | | 104 | | | 29 | | | 46 | | | 66 | | | 41 | | | 30 | | | 48 | | | ||||||||||||||||||||||||||||||||||||||||||||||||
Companhia Hispano-Brasileira de Pelotização(i) | | 50.89 | | 51.00 | | 83 | | 82 | | 55 | | 41 | | 15 | | 23 | | 16 | | 27 | ||||||||||||||||||||||||||||||||||||||||||||||||||||||||||||
Companhia Ítalo-Brasileira de Pelotização(i) | | 50.90 | | 51.00 | | 81 | | 80 | | 60 | | 40 | | 16 | | 32 | | 17 | | 9 | ||||||||||||||||||||||||||||||||||||||||||||||||||||||||||||
Companhia Nipo-Brasileira de Pelotização(i) | | 51.00 | | 51.11 | | 148 | | 137 | | 126 | | 93 | | 29 | | 67 | | 29 | | 41 | ||||||||||||||||||||||||||||||||||||||||||||||||||||||||||||
MRS Logística S.A. | | | 48.16 | | | 46.75 | | | 488 | | | 368 | | | 57 | | | 43 | | | 76 | | | 10 | | | 22 | | | 44 | | | | 48.16 | | 46.75 | | 496 | | 517 | | 72 | | 69 | | 57 | | 27 | | 29 | | 10 | ||||||||||||||||||||||||||||
Samarco Mineração S.A. (i) | | | 50.00 | | | 50.00 | | | – | | | – | | | – | | | (167 | ) | | 392 | | | – | | | 146 | | | 401 | | | ||||||||||||||||||||||||||||||||||||||||||||||||
VLI S.A. | | | 37.60 | | | 37.60 | | | 969 | | | 778 | | | 36 | | | 46 | | | 48 | | | – | | | 8 | | | – | | | | 37.60 | | 37.60 | | 857 | | 968 | | 30 | | 29 | | 36 | | 7 | | 19 | | – | ||||||||||||||||||||||||||||
Zhuhai YPM Pellet Co. | | | 25.00 | | | 25.00 | | | 21 | | | 23 | | | – | | | – | | | – | | | – | | | – | | | – | | | | 25.00 | | 25.00 | | 22 | | 23 | | – | | – | | – | | – | | – | | – | ||||||||||||||||||||||||||||
Others | | | | | | | – | | | 13 | | | – | | | (2 | ) | | – | | | – | | | – | | | 1 | | | ||||||||||||||||||||||||||||||||||||||||||||||||||
| | | | | | | | | | | | | | | | | | | | | | | | | | | | | | | | | | | | | | | | | | | | | | ||||||||||||||||||||||||||||||||||||
| | | | | | | 1,808 | | | 1,479 | | | 179 | | | 26 | | | 665 | | | 113 | | | 255 | | | 526 | | | | | | 1,814 | | 1,922 | | 417 | | 329 | | 179 | | 189 | | 130 | | 113 | |||||||||||||||||||||||||||||||||
Coal | | | | | | | | | | | | | | | | | | | | | | | | | | | | | | | | | ||||||||||||||||||||||||||||||||||||||||||||||||
Henan Longyu Energy Resources Co., Ltd. | | | 25.00 | | | 25.00 | | | 285 | | | 306 | | | (4 | ) | | (3 | ) | | 32 | | | – | | | 28 | | | 28 | | | | 25.00 | | 25.00 | | 317 | | 317 | | 16 | | 20 | | (4 | ) | – | | – | | – | ||||||||||||||||||||||||||||
| | | | | | | | | | | | | | | | | | | | | | ||||||||||||||||||||||||||||||||||||||||||||||||||||||||||||
| | | | 317 | | 317 | | 16 | | 20 | | (4 | ) | – | | – | | – | |||||||||||||||||||||||||||||||||||||||||||||||||||||||||||||||
Base metals | | | | | | | | | | | | | | | | | | | | | | | | | | | | | | | | | ||||||||||||||||||||||||||||||||||||||||||||||||
Korea Nickel Corp. | | | 25.00 | | | 25.00 | | | 12 | | | 17 | | | (1 | ) | | (3 | ) | | – | | | 4 | | | – | | | – | | | | 25.00 | | 25.00 | | 14 | | 13 | | 1 | | 1 | | (1 | ) | – | | – | | 4 | ||||||||||||||||||||||||||||
Teal Minerals Inc. | | | 50.00 | | | 50.00 | | | – | | | – | | | (3 | ) | | (129 | ) | | (35 | ) | | – | | | – | | | – | | | ||||||||||||||||||||||||||||||||||||||||||||||||
Others | | | | – | | – | | – | | – | | (3 | ) | – | | – | | – | ||||||||||||||||||||||||||||||||||||||||||||||||||||||||||||||
| | | | | | | | | | | | | | | | | | | | | | | | | | | | | | | | | | | | | | | | | | | | | | ||||||||||||||||||||||||||||||||||||
| | | | | | | 12 | | | 17 | | | (4 | ) | | | (132 | ) | | | (35 | ) | | | 4 | | | – | | | – | | | | | | 14 | | 13 | | 1 | | 1 | | (4 | ) | – | | – | | 4 | ||||||||||||||||||||||||||||||
Others | | | | | | | | | | | | | | | | | | | | | | | | | | | | | | | | | ||||||||||||||||||||||||||||||||||||||||||||||||
Aliança Geração de Energia S.A. | | | 55.00 | | | 55.00 | | | 582 | | | 481 | | | 46 | | | 50 | | | – | | | 39 | | | 30 | | | – | | | ||||||||||||||||||||||||||||||||||||||||||||||||
Aliança Norte Energia Participações S.A. | | | 51.00 | | | 51.00 | | | 148 | | | 81 | | | (6 | ) | | 1 | | | – | | | – | | | – | | | – | | | ||||||||||||||||||||||||||||||||||||||||||||||||
Aliança Geração de Energia S.A.(i) | | 55.00 | | 55.00 | | 486 | | 571 | | 25 | | 27 | | 46 | | 25 | | 29 | | 39 | ||||||||||||||||||||||||||||||||||||||||||||||||||||||||||||
Aliança Norte Energia Participações S.A.(i) | | 51.00 | | 51.00 | | 162 | | 160 | | 15 | | (2 | ) | (6 | ) | – | | – | | – | ||||||||||||||||||||||||||||||||||||||||||||||||||||||||||||
California Steel Industries, Inc. | | | 50.00 | | | 50.00 | | | 185 | | | 157 | | | 33 | | | (27 | ) | | 12 | | | 4 | | | – | | | 6 | | | | 50.00 | | 50.00 | | 247 | | 200 | | 77 | | 42 | | 33 | | 31 | | 27 | | 4 | ||||||||||||||||||||||||||||
Companhia Siderúrgica do Pecém | | | 50.00 | | | 50.00 | | | 527 | | | 225 | | | 25 | | | (307 | ) | | (44 | ) | | – | | | – | | | – | | | | 50.00 | | 50.00 | | – | | 262 | | (243 | ) | (264 | ) | 25 | | – | | – | | – | ||||||||||||||||||||||||||||
Mineração Rio Grande do Norte S.A. | | | 40.00 | | | 40.00 | | | 129 | | | 93 | | | 48 | | | 40 | | | 7 | | | 32 | | | 3 | | | 8 | | | ||||||||||||||||||||||||||||||||||||||||||||||||
Thyssenkrupp Companhia Siderúrgica do Atlântico Ltd. | | | – | | | – | | | – | | | – | | | – | | | (80 | ) | | (60 | ) | | – | | | – | | | – | | | ||||||||||||||||||||||||||||||||||||||||||||||||
Mineração Rio do Norte S.A. | | 40.00 | | 40.00 | | 93 | | 101 | | 2 | | 13 | | 48 | | – | | 41 | | 32 | ||||||||||||||||||||||||||||||||||||||||||||||||||||||||||||
Others | | | | | | | 20 | | | 101 | | | (8 | ) | | (13 | ) | | (76 | ) | | 1 | | | 2 | | | – | | | | | | 92 | | 22 | | (5 | ) | (68 | ) | (8 | ) | – | | – | | 1 | ||||||||||||||||||||||||||||||||
| | | | | | | | | | | | | | | | | | | | | | | | | | | | | | | | | | | | | | | | | | | | | | ||||||||||||||||||||||||||||||||||||
| | | | | | | 1,591 | | | 1,138 | | | 138 | | | (336 | ) | | | (161 | ) | | | 76 | | | 35 | | | 14 | | | | | | 1,080 | | 1,316 | | (129 | ) | (252 | ) | 138 | | 56 | | 97 | | 76 | |||||||||||||||||||||||||||||||
| | | | | | | | | | | | | | | | | | | | | | | | | | | | | | | | | | | | | | | | | | | | | | ||||||||||||||||||||||||||||||||||||
Total | | | | | | | 3,696 | | | 2,940 | | | 309 | | | (445 | ) | | | 501 | | | 193 | | | 318 | | | 568 | | | | | | 3,225 | | 3,568 | | 305 | | 98 | | 309 | | 245 | | 227 | | 193 | |||||||||||||||||||||||||||||||
| | | | | | | | | | | | | | | | | | | | | | | | | | | | | | | | | | | | | | | | | | | | | | | |||||||||||||||||||||||||||||||||||
| | | | | | | | | | | | | | | | | | | | | | | | | | | | | | | | | | | | | | | | | | | | | | ||||||||||||||||||||||||||||||||||||
| | | | |
| | F-50 | | |
![]()
Notes to the Financial Statements (Continued)
Expressed in millions of United States dollar, unless otherwise stated
15.16. Investments in associates and joint ventures (Continued)
c) Summarized financial information
The summarized financial information about relevant associates and joint-ventures for the Company are as follows:
| | | December 31, 2016 | | | December 31, 2018 | | ||||||||||||||||||||||||||||||||||||||||||||
|---|---|---|---|---|---|---|---|---|---|---|---|---|---|---|---|---|---|---|---|---|---|---|---|---|---|---|---|---|---|---|---|---|---|---|---|---|---|---|---|---|---|---|---|---|---|---|---|---|---|---|
| | | Joint ventures | | Associates | | | Joint ventures | | Associates | | ||||||||||||||||||||||||||||||||||||||||
| | | Aliança Geração de Energia | | CSP | | Pelletizing(i) | | MRS Logística | | Henan Longyu | | VLI S.A. | | | Aliança Geração de Energia | | CSP | | Pelletizing(i) | | MRS Logística | | Henan Longyu | | VLI S.A. | | ||||||||||||||||||||||||
Current assets | | | 115 | | | 743 | | | 392 | | | 324 | | | 903 | | | 389 | | | | 186 | | 693 | | 964 | | 263 | | 1,104 | | 679 | | |||||||||||||||||
Non-current assets | | | 1,208 | | | 3,809 | | | 318 | | | 1,709 | | | 456 | | | 4,169 | | | | 938 | | 3,062 | | 296 | | 1,826 | | 392 | | 3,938 | | |||||||||||||||||
| | | | | | | | | | | | | | | | | | | | | | | | | | | | ||||||||||||||||||||||||
Total assets | | | 1,323 | | | 4,552 | | | 710 | | | 2,033 | | | 1,359 | | | 4,558 | | | | 1,124 | | 3,755 | | 1,260 | | 2,089 | | 1,496 | | 4,617 | | |||||||||||||||||
| | | | | | | | | | | | | | | |||||||||||||||||||||||||||||||||||||
| | | | | | | | | | | | | | | |||||||||||||||||||||||||||||||||||||
| | | | | | | | | | | | | | | |||||||||||||||||||||||||||||||||||||
Current liabilities | | | 165 | | | 664 | | | 109 | | | 392 | | | 200 | | | 677 | | | | 83 | | 970 | | 437 | | 359 | | 203 | | 544 | | |||||||||||||||||
Non-current liabilities | | | 100 | | | 2,835 | | | 3 | | | 877 | | | 19 | | | 1,304 | | | | 158 | | 2,785 | | 2 | | 699 | | 26 | | 1,795 | | |||||||||||||||||
| | | | | | | | | | | | | | | | | | | | | | | | | | | | ||||||||||||||||||||||||
Total liabilities | | | 265 | | | 3,499 | | | 112 | | | 1,269 | | | 219 | | | 1,981 | | | | 241 | | 3,755 | | 439 | | 1,058 | | 229 | | 2,339 | | |||||||||||||||||
| | | | | | | | | | | | | | | | | | | | | | | | | | | | ||||||||||||||||||||||||
Stockholders' equity | | | 1,058 | | | 1,053 | | | 598 | | | 764 | | | 1,140 | | | 2,577 | | | ||||||||||||||||||||||||||||||
Stockholders'equity | | 883 | | – | | 821 | | 1,030 | | 1,267 | | 2,278 | | |||||||||||||||||||||||||||||||||||||
| | | | | | | | | | | | | | | | | | | | | | | | | | | | | |||||||||||||||||||||||
| | | | | | | | | | | | | | | | | | | | | | | | | | | | ||||||||||||||||||||||||
Net income (loss) | | | 84 | | | 49 | | | 152 | | | 90 | | | (17 | ) | | | 95 | | | | 45 | | (486 | ) | 609 | | 150 | | 65 | | 79 | | ||||||||||||||||
| | | December 31, 2015 | | | December 31, 2017 | | ||||||||||||||||||||||||||||||||||||||||||||
|---|---|---|---|---|---|---|---|---|---|---|---|---|---|---|---|---|---|---|---|---|---|---|---|---|---|---|---|---|---|---|---|---|---|---|---|---|---|---|---|---|---|---|---|---|---|---|---|---|---|---|
| | | Joint ventures | | Associates | | | Joint ventures | | Associates | | ||||||||||||||||||||||||||||||||||||||||
| | | Aliança Geração de Energia | | CSP | | Pelletizing(i) | | MRS Logística | | Henan Longyu | | VLI S.A. | | | Aliança Geração de Energia | | CSP | | Pelletizing(i) | | MRS Logística | | Henan Longyu | | VLI S.A. | | ||||||||||||||||||||||||
Current assets | | | 65 | | | 265 | | | 350 | | | 324 | | | 883 | | | 503 | | | | 137 | | 759 | | 760 | | 309 | | 1,072 | | 738 | | |||||||||||||||||
Non-current assets | | | 915 | | | 3,057 | | | 313 | | | 1,709 | | | 529 | | | 2,970 | | | | 1,200 | | 3,712 | | 310 | | 2,063 | | 422 | | 4,172 | | |||||||||||||||||
| | | | | | | | | | | | | | | | | | | | | | | | | | | | ||||||||||||||||||||||||
Total assets | | | 980 | | | 3,322 | | | 663 | | | 2,033 | | | 1,412 | | | 3,473 | | | | 1,337 | | 4,471 | | 1,070 | | 2,372 | | 1,494 | | 4,910 | | |||||||||||||||||
| | | | | | | | | | | | | | | |||||||||||||||||||||||||||||||||||||
| | | | | | | | | | | | | | | |||||||||||||||||||||||||||||||||||||
| | | | | | | | | | | | | | | |||||||||||||||||||||||||||||||||||||
Current liabilities | | | 35 | | | 528 | | | 118 | | | 392 | | | 108 | | | 511 | | | | 86 | | 1,060 | | 301 | | 454 | | 226 | | 537 | | |||||||||||||||||
Non-current liabilities | | | 71 | | | 2,344 | | | 9 | | | 877 | | | 80 | | | 893 | | | | 213 | | 2,887 | | 5 | | 844 | | – | | 1,799 | | |||||||||||||||||
| | | | | | | | | | | | | | | | | | | | | | | | | | | | ||||||||||||||||||||||||
Total liabilities | | | 106 | | | 2,872 | | | 127 | | | 1,269 | | | 188 | | | 1,404 | | | | 299 | | 3,947 | | 306 | | 1,298 | | 226 | | 2,336 | | |||||||||||||||||
| | | | | | | | | | | | | | | | | | | | | | | | | | | | ||||||||||||||||||||||||
Stockholders' equity | | | 874 | | | 450 | | | 536 | | | 764 | | | 1,224 | | | 2,069 | | | ||||||||||||||||||||||||||||||
Stockholders'equity | | 1,038 | | 524 | | 764 | | 1,074 | | 1,268 | | 2,574 | | |||||||||||||||||||||||||||||||||||||
| | | | | | | | | | | | | | | | | | | | | | | | | | | | | |||||||||||||||||||||||
| | | | | | | | | | | | | | | | | | | | | | | | | | | | ||||||||||||||||||||||||
Net income (loss) | | | 91 | | | (615 | ) | | | 208 | | | 90 | | | (11 | ) | | | 121 | | | | 49 | | (528 | ) | 442 | | 143 | | 79 | | 77 | | |||||||||||||||
Stand alone numberThe stand-alone financial statements of those entities may differ from numberthe financial information reported herein, since they may be adjusted, when necessary towhich is prepared considering Vale's accounting policies including eventual goodwill, provisional price adjustment etc.and others.
Accounting policy
Joint arrangements investments—Joint arrangements are all entities over which the GroupCompany has shared control with one or more parties. Joint arrangement investments are classified as either joint operations or joint ventures depending on the contractual rights and obligations of each investor.
![]()
Notes to the Financial Statements (Continued)
Expressed in millions of United States dollar, unless otherwise stated
15. Investments in associates and joint ventures (Continued)
The joint operations are recorded in the financial statements to represent the Group's contractual rights and obligations. Accordingly, any jointly held assets, liabilities, revenues and expenses are accounted for individually in the financial statements. The Company does not have material joint operations.
Interests in joint ventures are accounted for using the equity method, after initially being recognized at cost in the consolidated balance sheet. The Group's investment in joint ventures includes the goodwill identified in the acquisition, net of any accumulated impairment loss.
The Group's interest in the profits or losses of its joint ventures is recognized in the income statement and participation in the changes in reserves is recognized in the Group's reserves. When the Group's interest in the losses of an associate or joint venture is equal to or greater than the carrying amount of the investment, including any other receivables, the Group does not recognize additional losses, unless it has incurred obligations or made payments on behalf of the joint venture.
d) Commitments and guarantees
The commitments and guarantees issued the affiliates and joint ventures are presented in note 32.
16. Noncontrolling interest
a) Summarized financial information
The summarized financial information, prior to the eliminations of the intercompany balances and transactions, about subsidiaries with material noncontrolling interest are as follows:
| | | | |
| | F-51 | | |
| | | December 31, 2016 | | ||||||||||||||||||||||||||||
|---|---|---|---|---|---|---|---|---|---|---|---|---|---|---|---|---|---|---|---|---|---|---|---|---|---|---|---|---|---|---|---|
| | | MBR | | PTVI | | VNC | | Compañia Mineradora Miski Mayo S.A.C.(i) | | Others | | Total | | ||||||||||||||||||
Current assets | | | 583 | | | | 576 | | | | 462 | | | | 107 | | | | | | | | | ||||||||
Non-current assets | | | 3,182 | | | | 1,668 | | | | 2,101 | | | | 429 | | | | | | | | | ||||||||
| | | | | | | | | | | | | | | ||||||||||||||||||
Total assets | | | 3,765 | | | | 2,244 | | | | 2,563 | | | | 536 | | | | | | | | | ||||||||
Current liabilities | | | 143 | | | | 145 | | | | 283 | | | | 46 | | | | | | | | | ||||||||
Non-current liabilities | | | 198 | | | | 261 | | | | 1,073 | | | | 99 | | | | | | | | | ||||||||
| | | | | | | | | | | | | | | ||||||||||||||||||
Total liabilities | | | 341 | | | | 406 | | | | 1,356 | | | | 145 | | | | | | | | | ||||||||
Stockholders' equity | | | 3,424 | | | | 1,838 | | | | 1,207 | | | | 391 | | | | | | | | | ||||||||
| | | | | | | | | | | | | | | ||||||||||||||||||
Equity attributable to noncontrolling interests | | | 1,406 | | | | 741 | | | | 40 | | | | 235 | | | | (440 | ) | | | 1,982 | | | ||||||
| | | | | | | | | | | | | | | ||||||||||||||||||
| | | | | | | | | | | | | | | | | | | | | | | | | | | ||||||
| | | | | | | | | | | | | | | ||||||||||||||||||
Net income (loss) | | | 400 | | | | 2 | | | | (807 | ) | | | 3 | | | | | | | | | ||||||||
| | | | | | | | | | | | | | | ||||||||||||||||||
Income (loss) attributable to noncontrolling interests | | | 165 | | | | 1 | | | | (40 | ) | | | 2 | | | | (134 | ) | | | (6 | ) | | ||||||
| | | | | | | | | | | | | | | ||||||||||||||||||
| | | | | | | | | | | | | | | | | | | | | | | | | | | ||||||
| | | | | | | | | | | | | | | ||||||||||||||||||
Dividends paid | | | 653 | | | | – | | | | – | | | | 47 | | | | – | | | | – | | | ||||||
![]()
Notes to the Financial Statements (Continued)
Expressed in millions of United States dollar, unless otherwise stated
16. Noncontrolling interestInvestments in associates and joint ventures (Continued)
The joint operations are recorded in the financial statements to represent the Company's contractual rights and obligations.
Interests in joint ventures are accounted for using the equity method, after initially being recognized at cost. The Company's investment in joint ventures includes the goodwill identified in the acquisition, net of any impairment loss.
The Company's interest in the profits or losses of its joint ventures is recognized in the income statement and participation in the changes in reserves is recognized in the Company's reserves. When the Company's interest in the losses of an associate or joint venture is equal to or greater than the carrying amount of the investment, including any other receivables, the Company does not recognize additional losses, unless it has incurred obligations or made payments on behalf of the joint venture.
Critical accounting estimates and judgments
Judgment is required in some circumstances to determine whether after considering all relevant factors, the Company has either control, joint control or significant influence over an entity. Significant influence includes situations of collective control.
The Company holds the majority of the voting capital in five joint arrangements (Aliança Geração de Energia S.A., Aliança Norte Energia Participações S.A., Companhia Hispano-Brasileira de Pelotização, Companhia Ítalo-Brasileira de Pelotização and Companhia Nipo-Brasileira de Pelotização), but management has concluded that the Company does not have a sufficiently dominant voting interest to have the power to direct the activities of the entity. As a result, these entities are accounted under equity method due to shareholder's agreements where relevant decisions are shared with other parties.
| | | | |
| | F-52 | | |
| | | December 31, 2015 | | ||||||||||||||||||||||||||||
|---|---|---|---|---|---|---|---|---|---|---|---|---|---|---|---|---|---|---|---|---|---|---|---|---|---|---|---|---|---|---|---|
| | | MBR | | PTVI | | VNC | | Compañia Mineradora Miski Mayo S.A.C.(i) | | Others | | Total | | ||||||||||||||||||
Current assets | | | 743 | | | | 567 | | | | 248 | | | | 137 | | | | | | | | | ||||||||
Non-current assets | | | 2,912 | | | | 1,731 | | | | 2,388 | | | | 481 | | | | | | | | | ||||||||
| | | | | | | | | | | | | | | ||||||||||||||||||
Total assets | | | 3,655 | | | | 2,298 | | | | 2,636 | | | | 618 | | | | | | | | | ||||||||
Current liabilities | | | 188 | | | | 151 | | | | 518 | | | | 82 | | | | | | | | | ||||||||
Non-current liabilities | | | 155 | | | | 309 | | | | 2,715 | | | | 101 | | | | | | | | | ||||||||
| | | | | | | | | | | | | | | ||||||||||||||||||
Total liabilities | | | 343 | | | | 460 | | | | 3,233 | | | | 183 | | | | | | | | | ||||||||
Stockholders' equity | | | 3,312 | | | | 1,838 | | | | (597 | ) | | | 435 | | | | | | | | | ||||||||
| | | | | | | | | | | | | | | ||||||||||||||||||
Equity attributable to noncontrolling interests | | | 1,360 | | | | 741 | | | | 55 | | | | 261 | | | | (302 | ) | | | 2,115 | | | ||||||
| | | | | | | | | | | | | | | ||||||||||||||||||
| | | | | | | | | | | | | | | | | | | | | | | | | | | ||||||
| | | | | | | | | | | | | | | ||||||||||||||||||
Net income (loss) | | | 250 | | | | 36 | | | | (1,916 | ) | | | 16 | | | | | | | | | ||||||||
| | | | | | | | | | | | | | | ||||||||||||||||||
Income (loss) attributable to noncontrolling interests | | | 66 | | | | 15 | | | | (373 | ) | | | 10 | | | | (209 | ) | | | (491 | ) | | ||||||
| | | | | | | | | | | | | | | ||||||||||||||||||
| | | | | | | | | | | | | | | | | | | | | | | | | | | ||||||
| | | | | | | | | | | | | | | ||||||||||||||||||
Dividends paid | | | 116 | | | | – | | | | – | | | | 67 | | | | – | | | | – | | | ||||||
| | | December 31, 2014 | | ||||||||||||||||||||||||||||
|---|---|---|---|---|---|---|---|---|---|---|---|---|---|---|---|---|---|---|---|---|---|---|---|---|---|---|---|---|---|---|---|
| | | MBR | | PTVI | | VNC | | Compañia Mineradora Miski Mayo S.A.C.(i) | | Others | | Total | | ||||||||||||||||||
Net income (loss) | | | 145 | | | | 202 | | | | (982 | ) | | | 7 | | | | | | | | | ||||||||
| | | | | | | | | | | | | | | ||||||||||||||||||
Income (loss) attributable to noncontrolling interests | | | 3 | | | | 82 | | | | (191 | ) | | | 4 | | | | (202 | ) | | | (304 | ) | | ||||||
| | | | | | | | | | | | | | | ||||||||||||||||||
| | | | | | | | | | | | | | | | | | | | | | | | | | | ||||||
| | | | | | | | | | | | | | | ||||||||||||||||||
Dividends paid | | | – | | | | 41 | | | | – | | | | – | | | | – | | | | – | | | ||||||
Stand alone number may differ from number reported herein, since they may be adjusted, when necessary to Vale's accounting policies including eventual goodwill, provisional price adjustment, etc.
b) Acquisitions and divestments
2016
There were no significant changes in equity interest in subsidiaries in 2016.
2015
Sale of minority interest in Minerações Brasileiras Reunidas S.A.—In September 2015, the Company sold 36.4% of the total capital of subsidiary Minerações Brasileiras Reunidas S.A. ("MBR") to an affiliate of Banco Bradesco S.A. (related party) for US$1,089. After the sale, Vale holds 62.5% of the total capital. Vale has an option to repurchase the shares after an initial period.
![]()
Notes to the Financial Statements (Continued)
Expressed in millions of United States dollar, unless otherwise stated
a) Summarized financial information
The summarized financial information, prior to the eliminations of the intercompany balances and transactions, about subsidiaries with material noncontrolling interest are as follows:
| | | December 31, 2018 | | ||||||||||||||
|---|---|---|---|---|---|---|---|---|---|---|---|---|---|---|---|---|---|
| | | MBR | | PTVI | | VNC | | Vale Moçambique S.A. | | Others(i) | | Total | | ||||
Current assets | | 581 | | 465 | | 202 | | 303 | | – | | | |||||
Non-current assets | | 2,499 | | 1,567 | | 1,922 | | 1,709 | | – | | | |||||
Related parties—Stockholders | | 721 | | 111 | | 56 | | 22 | | – | | | |||||
| | | | | | | | | | | | | | | ||||
Total assets | | 3,801 | | 2,143 | | 2,180 | | 2,034 | | – | | | |||||
Current liabilities | | 187 | | 165 | | 141 | | 313 | | – | | | |||||
Non-current liabilities | | 282 | | 153 | | 256 | | 79 | | – | | | |||||
Related parties—Stockholders | | 197 | | – | | 766 | | 8,731 | | – | | | |||||
| | | | | | | | | | | | | | | ||||
Total liabilities | | 666 | | 318 | | 1,163 | | 9,123 | | – | | | |||||
Stockholders' equity | | 3,135 | | 1,825 | | 1,017 | | (7,089 | ) | – | | | |||||
| | | | | | | | | | | | | | | ||||
Equity attributable to noncontrolling interests | | 1,254 | | 745 | | 51 | | (1,290 | ) | 87 | | 847 | | ||||
| | | | | | | | | | | | | | | ||||
| | | | | | | | | | | | | | | ||||
| | | | | | | | | | | | | | | ||||
Net income (loss) | | 434 | | 58 | | 351 | | (985 | ) | – | | | |||||
| | | | | | | | | | | | | | | ||||
Net income (loss) attributable to noncontrolling interests | | 174 | | 24 | | 18 | | (190 | ) | 10 | | 36 | | ||||
| | | | | | | | | | | | | | | ||||
| | | | | | | | | | | | | | | ||||
| | | | | | | | | | | | | | | ||||
Dividends paid to noncontrolling interests | | 168 | | – | | – | | – | | 14 | | 182 | | ||||
| | | December 31, 2017 | | |||||||||||||||||||
|---|---|---|---|---|---|---|---|---|---|---|---|---|---|---|---|---|---|---|---|---|---|---|
| | | MBR | | PTVI | | VNC | | Vale Moçambique S.A. | | Compañia Mineradora Miski Mayo S.A.C.(i) | | Others(ii) | | Total | | |||||||
Current assets | | 408 | | 394 | | 251 | | 381 | | 78 | | – | | | ||||||||
Non-current assets | | 3,041 | | 1,586 | | 2,046 | | 1,653 | | 436 | | – | | | ||||||||
Related parties—Stockholders | | 591 | | 147 | | 115 | | 253 | | 6 | | – | | | ||||||||
| | | | | | | | | | | | | | | | | |||||||
Total assets | | 4,040 | | 2,127 | | 2,412 | | 2,287 | | 520 | | – | | | ||||||||
Current liabilities | | 170 | | 128 | | 142 | | 128 | | 36 | | – | | | ||||||||
Non-current liabilities | | 288 | | 237 | | 222 | | 32 | | 97 | | – | | | ||||||||
Related parties—Stockholders | | 226 | | 3 | | 1,318 | | 8,232 | | 9 | | – | | | ||||||||
| | | | | | | | | | | | | | | | | |||||||
Total liabilities | | 684 | | 368 | | 1,682 | | 8,392 | | 142 | | – | | | ||||||||
Stockholders' equity | | 3,356 | | 1,759 | | 730 | | (6,105 | ) | 380 | | – | | | ||||||||
| | | | | | | | | | | | | | | | | |||||||
Equity attributable to noncontrolling interests | | 1,342 | | 735 | | 37 | | (1,101 | ) | 228 | | 73 | | 1,314 | | |||||||
| | | | | | | | | | | | | | | | | |||||||
| | | | | | | | | | | | | | | | | |||||||
| | | | | | | | | | | | | | | | | |||||||
Net income (loss) | | 434 | | (15 | ) | (572 | ) | (659 | ) | (11 | ) | – | | | ||||||||
| | | | | | | | | | | | | | | | | |||||||
Net income (loss) attributable to noncontrolling interests | | 174 | | (6 | ) | (28 | ) | (104 | ) | (6 | ) | (16 | ) | 14 | | |||||||
| | | | | | | | | | | | | | | | | |||||||
| | | | | | | | | | | | | | | | | |||||||
| | | | | | | | | | | | | | | | | |||||||
Dividends paid to noncontrolling interests | | 113 | | – | | – | | – | | – | | 13 | | 126 | | |||||||
| | | | |
| | F-53 | | |
![]()
Notes to the Financial Statements (Continued)
Expressed in millions of United States dollar, unless otherwise stated
17. IntangiblesNoncontrolling interest (Continued)
| | | December 31, 2016 | | ||||||||||||||||||
|---|---|---|---|---|---|---|---|---|---|---|---|---|---|---|---|---|---|---|---|---|---|
| | | MBR | | PTVI | | VNC | | Vale Moçambique S.A. | | Compañia Mineradora Miski Mayo S.A.C.(i) | | Others(ii) | | Total | | ||||||
Net income (loss) | | 400 | | 2 | | (807 | ) | (541 | ) | 3 | | – | | – | | ||||||
| | | | | | | | | | | | | | | | | ||||||
Net income (loss) attributable to noncontrolling interests | | 165 | | 1 | | (40 | ) | (27 | ) | 2 | | (107 | ) | (6 | ) | ||||||
| | | | | | | | | | | | | | | | | ||||||
| | | | | | | | | | | | | | | | | ||||||
| | | | | | | | | | | | | | | | | ||||||
Dividends paid to noncontrolling interests | | 263 | | – | | – | | – | | 11 | | 17 | | 291 | | ||||||
The stand-alone financial statements of those entities may differ from the financial information reported herein, which is prepared considering Vale's accounting policies including eventual goodwill, provisional price adjustment and others.
Changes in intangibles are as follows:
| | | Goodwill | | Concessions | | Right of use | | Software | | Total | | | Goodwill | | Concessions | | Right of use | | Software | | Total | | ||||||||||||||||||||
|---|---|---|---|---|---|---|---|---|---|---|---|---|---|---|---|---|---|---|---|---|---|---|---|---|---|---|---|---|---|---|---|---|---|---|---|---|---|---|---|---|---|---|
Balance at December 31, 2014 | | | 3,760 | | | 2,213 | | | 297 | | | 550 | | | 6,820 | | | |||||||||||||||||||||||||
Balance at December 31, 2016 | | 3,081 | | 3,301 | | 147 | | 342 | | 6,871 | | |||||||||||||||||||||||||||||||
| | | | | | | | | | | | | | | | | | | | | | | | ||||||||||||||||||||
Additions | | | – | | | 549 | | | – | | | 128 | | | 677 | | | | – | | 980 | | – | | 26 | | 1,006 | | ||||||||||||||
Disposals | | | – | | | (20 | ) | | – | | | – | | | (20 | ) | | | – | | (9 | ) | – | | – | | (9 | ) | ||||||||||||||
Amortization | | | – | | | (150 | ) | | (42 | ) | | (155 | ) | | (347 | ) | | | – | | (209 | ) | (2 | ) | (142 | ) | (353 | ) | ||||||||||||||
Impairment (note 19) | | | (81 | ) | | – | | | – | | | – | | | (81 | ) | | |||||||||||||||||||||||||
Translation adjustment | | | (762 | ) | | (778 | ) | | (48 | ) | | (176 | ) | | (1,764 | ) | | | 65 | | (61 | ) | 7 | | 3 | | 14 | | ||||||||||||||
Acquisition of subsidiary | | | 39 | | | – | | | – | | | – | | | 39 | | | |||||||||||||||||||||||||
Merger of Valepar (note 30) | | 964 | | – | | – | | – | | 964 | | |||||||||||||||||||||||||||||||
| | | | | | | | | | | | | | | | | | | | | | | | ||||||||||||||||||||
Balance at December 31, 2015 | | | 2,956 | | | 1,814 | | | 207 | | | 347 | | | 5,324 | | | |||||||||||||||||||||||||
Balance at December 31, 2017 | | 4,110 | | 4,002 | | 152 | | 229 | | 8,493 | | |||||||||||||||||||||||||||||||
| | | | | | | | | | | | | | | | | | | | | | | | ||||||||||||||||||||
Cost | | | 2,956 | | | 2,588 | | | 464 | | | 1,025 | | | 7,033 | | | | 4,110 | | 5,075 | | 241 | | 1,554 | | 10,980 | | ||||||||||||||
| | | | | | | | | | | | | |||||||||||||||||||||||||||||||
Accumulated amortization | | | – | | | (774 | ) | | (257 | ) | | (678 | ) | | (1,709 | ) | | | – | | (1,073 | ) | (89 | ) | (1,325 | ) | (2,487 | ) | ||||||||||||||
| | | | | | | | | | | | | | | | | | | | | | | | ||||||||||||||||||||
Balance at December 31, 2015 | | | 2,956 | | | 1,814 | | | 207 | | | 347 | | | 5,324 | | | |||||||||||||||||||||||||
Balance at December 31, 2017 | | 4,110 | | 4,002 | | 152 | | 229 | | 8,493 | | |||||||||||||||||||||||||||||||
| | | | | | | | | | | | | | | | | | | | | | | | | |||||||||||||||||||
| | | | | | | | | | | | | | | | | | | | | | | | ||||||||||||||||||||
Additions | | | — | | | 1,100 | | | 1 | | | 13 | | | 1,114 | | | | – | | 855 | | – | | 7 | | 862 | | ||||||||||||||
Disposals | | | — | | | (12 | ) | | — | | | — | | | (12 | ) | | | – | | (27 | ) | – | | (2 | ) | (29 | ) | ||||||||||||||
Amortization | | | — | | | (248 | ) | | (2 | ) | | (153 | ) | | (403 | ) | | | – | | (135 | ) | (2 | ) | (99 | ) | (236 | ) | ||||||||||||||
Impairment of discontinued operations (note 14) | | | (30 | ) | | — | | | — | | | — | | | (30 | ) | | |||||||||||||||||||||||||
Translation adjustment | | | 188 | | | 570 | | | 9 | | | 61 | | | 828 | | | | (457 | ) | (634 | ) | (13 | ) | (24 | ) | (1,128 | ) | ||||||||||||||
Transfers | | | — | | | 77 | | | (68 | ) | | 74 | | | 83 | | | |||||||||||||||||||||||||
Effect of discontinued operations | | | | | | | | | | | | | ||||||||||||||||||||||||||||||
Transfer to net assets held for sale | | | (33 | ) | | — | | | — | | | — | | | (33 | ) | | |||||||||||||||||||||||||
| | | | | | | | | | | | | | | | | | | | | | | | ||||||||||||||||||||
Balance at December 31, 2016 | | | 3,081 | | | 3,301 | | | 147 | | | 342 | | | 6,871 | | | |||||||||||||||||||||||||
Balance at December 31, 2018 | | 3,653 | | 4,061 | | 137 | | 111 | | 7,962 | | |||||||||||||||||||||||||||||||
| | | | | | | | | | | | | | | | | | | | | | | | ||||||||||||||||||||
Cost | | | 3,081 | | | 4,467 | | | 222 | | | 1,570 | | | 9,340 | | | | 3,653 | | 5,043 | | 201 | | 923 | | 9,820 | | ||||||||||||||
Accumulated amortization | | | — | | | (1,166 | ) | | (75 | ) | | (1,228 | ) | | (2,469 | ) | | | – | | (982 | ) | (64 | ) | (812 | ) | (1,858 | ) | ||||||||||||||
| | | | | | | | | | | | | | | | | | | | | | | | ||||||||||||||||||||
Balance at December 31, 2016 | | | 3,081 | | | 3,301 | | | 147 | | | 342 | | | 6,871 | | | |||||||||||||||||||||||||
Balance at December 31, 2018 | | 3,653 | | 4,061 | | 137 | | 111 | | 7,962 | | |||||||||||||||||||||||||||||||
| | | | | | | | | | | | | | | | | | | | | | | | | |||||||||||||||||||
| | | | | | | | | | | | | | | | | | | | | | | | ||||||||||||||||||||
a) GoodwillGoodwill——The goodwill arose from the acquisition of iron ore and nickel business.businesses. In 2017, the goodwill was recognized on the acquisition of Vale controlling interest by Valepar, based on the expected future returns on the ferrous segment. As the fundamentals are still valid on the date of the merger of Valepar by Vale, the goodwill was fully recognized. The Company has not recognized the deferred taxes
| | | | |
| | F-54 | | |
![]()
Notes to the Financial Statements (Continued)
Expressed in millions of United States dollar, unless otherwise stated
18. Intangibles (Continued)
over the goodwill, since there are no differences between the tax basis and accounting basis. The Company assesses annually the recoverable amount of the goodwill.
b) ConcessionsConcessions——The concessions refer to the agreements with governments for the exploration and the development of ports and railways. The Company holds railway concessions which are valid over a certain period of time. Those assets are classified as intangible assets and amortized over the shorter of their useful lives and the concession term at the end of which they will be returned to the government.
c) Right of useuse——Refers to intangible identified in the business combination of Vale Canada Limited ("Vale Canada") and to the usufruct contract between the Company and noncontrolling stockholders to use the shares of Empreendimentos Brasileiros de Mineração S.A. (owner of Minerações Brasileiras Reunidas S.A. shares) and intangible assets identified in the business combination of Vale Canada Limited ("Vale Canada"). The amortization of the right of use will expire in 2037 and Vale Canada's intangible assets will end in September of 2046.
Accounting policy
Intangibles are carried at the acquisition cost, net of accumulated amortization and impairment.impairment charges.
The estimated useful lives are as follows:
| | Useful life | |
|---|---|---|
Concessions | | 3 to 50 years |
Right of use | | 22 to 31 years |
Software | | 5 years |
| | | | |
| | F-55 | | |
![]()
Notes to the Financial Statements (Continued)
Expressed in millions of United States dollar, unless otherwise stated
17. Intangibles (Continued)
The estimated useful lives are as follows:
| ||||||
| ||||||
| ||||||
18. 19. Property, plant and equipment
Changes in property, plant and equipment are as follows:
| | | Land | | Building | | Facilities | | Equipment | | Mineral properties | | Others | | Constructions in progress | | Total | | | Land | | Building | | Facilities | | Equipment | | Mineral properties | | Others | | Constructions in progress | | Total | | ||||||||||||||||||||||||||||||
|---|---|---|---|---|---|---|---|---|---|---|---|---|---|---|---|---|---|---|---|---|---|---|---|---|---|---|---|---|---|---|---|---|---|---|---|---|---|---|---|---|---|---|---|---|---|---|---|---|---|---|---|---|---|---|---|---|---|---|---|---|---|---|---|---|
Balance at December 31, 2014 | | | 1,069 | | | 11,654 | | | 10,813 | | | 9,287 | | | 14,929 | | | 10,954 | | | 19,416 | | | 78,122 | | | ||||||||||||||||||||||||||||||||||||||
| | | | | | | | | | | | | | | | | | | |||||||||||||||||||||||||||||||||||||||||||||||
Additions(i) | | | — | | | — | | | — | | | — | | | — | | | — | | | 9,499 | | | 9,499 | | | ||||||||||||||||||||||||||||||||||||||
Disposals | | | (3 | ) | | (8 | ) | | (41 | ) | | (81 | ) | | (152 | ) | | (1,554 | ) | | (22 | ) | | (1,861 | ) | | ||||||||||||||||||||||||||||||||||||||
Assets retirement obligations | | | — | | | — | | | — | | | — | | | (334 | ) | | — | | | — | | | (334 | ) | | ||||||||||||||||||||||||||||||||||||||
Depreciation, amortization and depletion | | | — | | | (547 | ) | | (713 | ) | | (1,066 | ) | | (864 | ) | | (766 | ) | | — | | | (3,956 | ) | | ||||||||||||||||||||||||||||||||||||||
Transfers to non-current assets held for sale | | | — | | | — | | | — | | | — | | | (127 | ) | | — | | | — | | | (127 | ) | | ||||||||||||||||||||||||||||||||||||||
Impairment (note 19) | | | (13 | ) | | (1,828 | ) | | (838 | ) | | (1,100 | ) | | (801 | ) | | (1,985 | ) | | (1,766 | ) | | (8,331 | ) | | ||||||||||||||||||||||||||||||||||||||
Impairment of discontinued operations (note 14) | | | — | | | — | | | — | | | — | | | (181 | ) | | 6 | | | 18 | | | (157 | ) | | ||||||||||||||||||||||||||||||||||||||
Translation adjustment | | | (292 | ) | | (3,383 | ) | | (3,182 | ) | | (1,846 | ) | | (2,404 | ) | | (2,439 | ) | | (5,327 | ) | | (18,873 | ) | | ||||||||||||||||||||||||||||||||||||||
Transfers | | | 5 | | | 3,213 | | | 2,253 | | | 2,112 | | | 238 | | | 2,871 | | | (10,692 | ) | | — | | | ||||||||||||||||||||||||||||||||||||||
Acquisition of subsidiary | | | — | | | — | | | — | | | 1 | | | — | | | 119 | | | — | | | 120 | | | ||||||||||||||||||||||||||||||||||||||
| | | | | | | | | | | | | | | | | | | |||||||||||||||||||||||||||||||||||||||||||||||
Balance at December 31, 2015 | | | 766 | | | 9,101 | | | 8,292 | | | 7,307 | | | 10,304 | | | 7,206 | | | 11,126 | | | 54,102 | | | ||||||||||||||||||||||||||||||||||||||
| | | | | | | | | | | | | | | | | | | |||||||||||||||||||||||||||||||||||||||||||||||
Cost | | | 766 | | | 13,707 | | | 13,152 | | | 12,230 | | | 17,054 | | | 10,617 | | | 11,126 | | | 78,652 | | | ||||||||||||||||||||||||||||||||||||||
Accumulated depreciation | | | — | | | (4,606 | ) | | (4,860 | ) | | (4,923 | ) | | (6,750 | ) | | (3,411 | ) | | — | | | (24,550 | ) | | ||||||||||||||||||||||||||||||||||||||
| | | | | | | | | | | | | | | | | | | |||||||||||||||||||||||||||||||||||||||||||||||
Balance at December 31, 2015 | | | 766 | | | 9,101 | | | 8,292 | | | 7,307 | | | 10,304 | | | 7,206 | | | 11,126 | | | 54,102 | | | ||||||||||||||||||||||||||||||||||||||
Balance at December 31, 2016 | | 724 | | 10,674 | | 9,471 | | 6,794 | | 8,380 | | 7,515 | | 11,861 | | 55,419 | | |||||||||||||||||||||||||||||||||||||||||||||||
| | | | | | | | | | | | | | | | | | | | | | | | | | | | | | | | | | | | ||||||||||||||||||||||||||||||
Additions(i) | | | — | | | — | | | — | | | — | | | — | | | — | | | 5,240 | | | 5,240 | | | | – | | – | | – | | – | | – | | – | | 3,392 | | 3,392 | | |||||||||||||||||||||
Disposals | | | (1 | ) | | (8 | ) | | (9 | ) | | (19 | ) | | (125 | ) | | (384 | ) | | (20 | ) | | (566 | ) | | | – | | (11 | ) | (57 | ) | (67 | ) | (138 | ) | (212 | ) | (151 | ) | (636 | ) | |||||||||||||||||||||
Assets retirement obligation | | | — | | | — | | | — | | | — | | | 311 | | | — | | | — | | | 311 | | | | – | | – | | – | | – | | 425 | | – | | – | | 425 | | |||||||||||||||||||||
Depreciation, amortization and depletion | | | — | | | (517 | ) | | (705 | ) | | (906 | ) | | (795 | ) | | (631 | ) | | — | | | (3,554 | ) | | | – | | (587 | ) | (736 | ) | (814 | ) | (618 | ) | (754 | ) | – | | (3,509 | ) | |||||||||||||||||||||
Transfers to non-current assets held for sale | | | — | | | — | | | — | | | — | | | — | | | (497 | ) | | — | | | (497 | ) | | ||||||||||||||||||||||||||||||||||||||
Impairment (note 19) | | | (1 | ) | | (448 | ) | | (175 | ) | | (110 | ) | | (165 | ) | | (88 | ) | | 70 | | | (917 | ) | | ||||||||||||||||||||||||||||||||||||||
Impairment of discontinued operations (note 14) | | | (53 | ) | | — | | | (65 | ) | | — | | | (1,590 | ) | | — | | | — | | | (1,708 | ) | | ||||||||||||||||||||||||||||||||||||||
Impairment (note 20) | | (20 | ) | – | | – | | (34 | ) | (131 | ) | – | | (86 | ) | (271 | ) | |||||||||||||||||||||||||||||||||||||||||||||||
Translation adjustment | | | 111 | | | 702 | | | 960 | | | 639 | | | 748 | | | 861 | | | 1,731 | | | 5,752 | | | | 79 | | (122 | ) | (105 | ) | (83 | ) | 222 | | 29 | | 38 | | 58 | | |||||||||||||||||||||
Transfers | | | 26 | | | 2,177 | | | 1,253 | | | 978 | | | 230 | | | 1,110 | | | (5,857 | ) | | (83 | ) | | | (65 | ) | 2,146 | | 3,213 | | 1,097 | | 929 | | 1,615 | | (8,935 | ) | – | | |||||||||||||||||||||
Effect of discontinued operations | | | | | | | | | | | | | | | | | | | ||||||||||||||||||||||||||||||||||||||||||||||
Transfer to net assets held for sale | | | (124 | ) | | (333 | ) | | (80 | ) | | (1,095 | ) | | (538 | ) | | (62 | ) | | (429 | ) | | (2,661 | ) | | ||||||||||||||||||||||||||||||||||||||
| | | | | | | | | | | | | | | | | | | | | | | | | | | | | | | | | | | | ||||||||||||||||||||||||||||||
Balance at December 31, 2016 | | | 724 | | | 10,674 | | | 9,471 | | | 6,794 | | | 8,380 | | | 7,515 | | | 11,861 | | | 55,419 | | | ||||||||||||||||||||||||||||||||||||||
Balance at December 31, 2017 | | 718 | | 12,100 | | 11,786 | | 6,893 | | 9,069 | | 8,193 | | 6,119 | | 54,878 | | |||||||||||||||||||||||||||||||||||||||||||||||
| | | | | | | | | | | | | | | | | | | | | | | | | | | | | | | | | | | | ||||||||||||||||||||||||||||||
Cost | | | 724 | | | 16,678 | | | 15,664 | | | 11,953 | | | 16,066 | | | 11,319 | | | 11,861 | | | 84,265 | | | | 718 | | 19,163 | | 18,292 | | 12,840 | | 17,471 | | 12,461 | | 6,119 | | 87,064 | | |||||||||||||||||||||
Accumulated depreciation | | | — | | | (6,004 | ) | | (6,193 | ) | | (5,159 | ) | | (7,686 | ) | | (3,804 | ) | | — | | | (28,846 | ) | | | – | | (7,063 | ) | (6,506 | ) | (5,947 | ) | (8,402 | ) | (4,268 | ) | – | | (32,186 | ) | |||||||||||||||||||||
| | | | | | | | | | | | | | | | | | | | | | | | | | | | | | | | | | | | ||||||||||||||||||||||||||||||
Balance at December 31, 2016 | | | 724 | | | 10,674 | | | 9,471 | | | 6,794 | | | 8,380 | | | 7,515 | | | 11,861 | | | 55,419 | | | ||||||||||||||||||||||||||||||||||||||
Balance at December 31, 2017 | | 718 | | 12,100 | | 11,786 | | 6,893 | | 9,069 | | 8,193 | | 6,119 | | 54,878 | | |||||||||||||||||||||||||||||||||||||||||||||||
| | | | | | | | | | | | | | | | | | | | | | | | | | | | | | | | | | | | | |||||||||||||||||||||||||||||
| | | | | | | | | | | | | | | | | | | | | | | | | | | | | | | | | | | | ||||||||||||||||||||||||||||||
Additions(i) | | – | | – | | – | | – | | – | | – | | 2,823 | | 2,823 | | |||||||||||||||||||||||||||||||||||||||||||||||
Disposals | | (11 | ) | (53 | ) | (93 | ) | (234 | ) | (8 | ) | (79 | ) | (92 | ) | (570 | ) | |||||||||||||||||||||||||||||||||||||||||||||||
Assets retirement obligation | | – | | – | | – | | – | | 446 | | – | | – | | 446 | | |||||||||||||||||||||||||||||||||||||||||||||||
Depreciation, amortization and depletion | | – | | (531 | ) | (655 | ) | (847 | ) | (525 | ) | (653 | ) | – | | (3,211 | ) | |||||||||||||||||||||||||||||||||||||||||||||||
Impairment (note 20) | | – | | (10 | ) | (18 | ) | (21 | ) | – | | (31 | ) | (104 | ) | (184 | ) | |||||||||||||||||||||||||||||||||||||||||||||||
Translation adjustment | | (84 | ) | (1,360 | ) | (1,471 | ) | (560 | ) | (864 | ) | (990 | ) | (468 | ) | (5,797 | ) | |||||||||||||||||||||||||||||||||||||||||||||||
Transfers | | 12 | | 806 | | 1,687 | | 1,176 | | 381 | | 829 | | (4,891 | ) | – | | |||||||||||||||||||||||||||||||||||||||||||||||
| | | | | | | | | | | | | | | | | | | |||||||||||||||||||||||||||||||||||||||||||||||
Balance at December 31, 2018 | | 635 | | 10,952 | | 11,236 | | 6,407 | | 8,499 | | 7,269 | | 3,387 | | 48,385 | | |||||||||||||||||||||||||||||||||||||||||||||||
| | | | | | | | | | | | | | | | | | | |||||||||||||||||||||||||||||||||||||||||||||||
Cost | | 635 | | 18,267 | | 17,611 | | 12,424 | | 16,717 | | 11,697 | | 3,387 | | 80,738 | | |||||||||||||||||||||||||||||||||||||||||||||||
Accumulated depreciation | | – | | (7,315 | ) | (6,375 | ) | (6,017 | ) | (8,218 | ) | (4,428 | ) | – | | (32,353 | ) | |||||||||||||||||||||||||||||||||||||||||||||||
| | | | | | | | | | | | | | | | | | | |||||||||||||||||||||||||||||||||||||||||||||||
Balance at December 31, 2018 | | 635 | | 10,952 | | 11,236 | | 6,407 | | 8,499 | | 7,269 | | 3,387 | | 48,385 | | |||||||||||||||||||||||||||||||||||||||||||||||
| | | | | | | | | | | | | | | | | | | |||||||||||||||||||||||||||||||||||||||||||||||
| | | | | | | | | | | | | | | | | | | |||||||||||||||||||||||||||||||||||||||||||||||
| | | | | | | | | | | | | | | | | | | |||||||||||||||||||||||||||||||||||||||||||||||
Disposals of assets
The Company recognized a loss of US$322 and US$348 in the income statement as "Impairment and disposal of non-current assets" for the year ended December 31, 2018 and 2017, respectively, due to non-viable projects and operating assets written off through sale or obsolescence.
Additionally, in the year ended December 31, 2017, the Company concluded the sale of four VLOC's and two Floating Transfer Stations in the amount of US$391. The Company recognized a loss of US$133 in the income statement as "Impairment and disposal of non-current assets".
Accounting policy
Property, plant and equipment are recorded at the cost of acquisition or construction, net of accumulated depreciation and impairment charges.
| | | | |
| | F-56 | | |
![]()
Notes to the Financial Statements (Continued)
Expressed in millions of United States dollar, unless otherwise stated
18.19. Property, plant and equipment (Continued)
The net book value of property, plant and equipment pledged to secure judicial claims on December 31, 2016 and 2015 were US$35 and US$44, respectively.
Accounting policy
Property, plant and equipment are evaluated at the cost of acquisition or construction, net of amortization and impairment.
Mineral properties developed internally are determined by (i) direct and indirect costs attributed to build the mine site and plant,mining facilities, (ii) financial charges incurred during the construction period, (iii) depreciation of other fixed assets used during construction, (iv) estimated decommissioning and site restoration expenses, and (v) other capitalized expenditures occurred during the development phase (phase when the project demonstrates its economic benefit to the Company, and the Company has ability and intention to complete the project).
The depletion of mineral properties is determined based on the ratio between production and total proven and probable mineral reserves.
Property, plant and equipment, other than mineral properties are depreciated using the straight-line method based on the estimated useful lives, from the date on which the assets become available for their intended use and are capitalized, except for land which is not depreciated.
The estimated useful lives are as follows:
| | | Useful life | ||||
|---|---|---|---|---|---|---|
Buildings | | 15 to 50 years | ||||
Facilities | | 3 to 50 years | ||||
Equipment | | 3 to 40 years | ||||
Others: | | |||||
Locomotives | | 12 to 25 years | ||||
Wagon | | 30 to 44 years | ||||
Railway equipment | | 5 to 33 years | ||||
Ships | | 20 years | ||||
Others | | 2 to 50 years | ||||
The residual values and useful lives of assets are reviewed at the end of each fiscal yearreporting period and adjusted if necessary.
Expenditures and stripping costs
(i) Exploration and evaluation expenditures—Expenditures on mining research are accounted for as operating expenses until the effective proof of economic feasibility and commercial viability of a given field can be demonstrated. From then on, the expenditures incurred are capitalized as mineral properties.
(ii) Expenditures on feasibility studies, new technologies and other researches—The Company also conducts feasibility studies for many businesses which it operates including researching new technologies to optimize the mining process. After these costs are proven to generate future benefits to the Company, the expenditures incurred are capitalized.
(iii) Maintenance costs—Significant industrial maintenance costs, including spare parts, assembly services, and others, are recorded in property, plant and equipment and depreciated through the next programmed maintenance overhaul.
(iv) Stripping Costs—The costs associated with the removal of overburden and other waste materials ("stripping costs") incurred during the development of mines, before production takes place, are capitalized as part of the depreciable cost of the mineral properties. These costs are subsequently amortized over the useful life of the mine.
| | | | |
| | F-57 | | |
![]()
Notes to the Financial Statements (Continued)
Expressed in millions of United States dollar, unless otherwise stated
18.19. Property, plant and equipment (Continued)
a) Mineral reservesPost-production stripping costs are included in the cost of inventory, except when a new project is developed to permit access to a significant ore deposits. In such cases, the cost is capitalized as a non-current asset and is amortized during the extraction of the ore deposits, over the useful life of the ore deposits.
Critical accounting estimates and judgments
Mineral reserves—The estimates of proven and probable reserves are regularly evaluated and updated. These reserves are determined using generally accepted geological estimates. The calculation of reserves requires the Company to take positions onmake assumptions about expected future conditions that are uncertain, including future ore prices, exchange rates, inflation rates, mining technology, availability of permits and production costs. Changes in some of these assumptions could have a significant impact on the proven and probable reserves of the Company.
The estimated volume of mineral reserves is used as basis for the calculation of depletion of the mineral properties, and also for the estimated useful life which is a major factor to quantify the provision for asset retirement obligation, environmental recovery of mines and impairment of long lived asset. Any changes to the estimates of the volume of mine reserves and the useful lives of assets may have a significant impact on the depreciation, depletion and amortization charges and assessments of impairment.
b) Expenditures and stripping costs
(i) Exploration and evaluation expenditures—Expenditures on mining research are accounted for as operating expenses until the effective proof of economic feasibility and commercial viability of a given field can be demonstrated. From then on, the expenditures incurred are capitalized as mineral properties.
(ii) Expenditures on feasibility studies, new technologies and others research—The Company also conducts feasibility studies for many businesses which it operates including researching new technologies to optimize the mining process. After these costs are proven to generate future benefits to the Company, the expenditures incurred are capitalized.
(iii) Maintenance costs—Significant industrial maintenance costs, including spare parts, assembly services, and others, are recorded in property, plant and equipment and depreciated through the next programmed maintenance overhaul.
(iv) Stripping Costs—The cost associated with the removal of overburden and other waste materials ("stripping costs") incurred during the development of mines, before production takes place, are capitalized as part of the depreciable cost of the mineral properties. These costs are subsequently amortized over the useful life of the mine.
Post-production stripping costs are included in the cost of inventory, except when a new project is developed to permit access to a significant ore deposits. In such cases, the cost is capitalized as a non-current asset and is amortized during the extraction of the ore deposits, over the useful life of the ore deposits.
Stripping costs are measured at fixed and variable costs directly and indirectly attributable to its removal and, when applicable, net of any impairment losses measured in the same basis adopted for the cash generating unit of which it belongs.
![]()
Notes to the Financial Statements (Continued)
Expressed in millions of United States dollar, unless otherwise stated
19. 20. Impairment and onerous contracts
The impairment losses (reversals) recognized in the year are presented below:
| | | | | Book value (after impairment) as of December 31, 2016 | | Income statement | | ||||||||||||||||||||||||||||||||||
|---|---|---|---|---|---|---|---|---|---|---|---|---|---|---|---|---|---|---|---|---|---|---|---|---|---|---|---|---|---|---|---|---|---|---|---|---|---|---|---|---|---|
| | | | | Impairment (reversals) | | | | | Income statement | | |||||||||||||||||||||||||||||||
| | | Assets or cash-generating unit | | | | | Impairment (reversals) | | |||||||||||||||||||||||||||||||||
Segments by class of assets | Book value (after impairment) as of December 31, 2016 | 2016 | | 2015 | | 2014 | | | Assets or cash-generating unit | | 2018 | | 2017 | | 2016 | | |||||||||||||||||||||||||
Property, plant and equipment and intangible | | | | | | | | | | | | | | | | | | | | ||||||||||||||||||||||
Iron ore | | North system | | | 160 | | (160 | ) | | 55 | | | – | | | | North system | | | – | | | – | | | (160 | ) | | |||||||||||||
Coal | | Australia | | | 43 | | 27 | | | 635 | | | 343 | | | | Australia | | | – | | | – | | | 27 | | | |||||||||||||
Base metals—nickel | | Newfoundland (VNL) | | | 1,915 | | | 631 | | | 3,460 | | | – | | | | Stobie (VCL) | | | – | | | 133 | | | – | | | ||||||||||||
Base metals—nickel | | Nouvelle Caledonie (VNC) | | | 3,368 | | | 284 | | | 1,462 | | | 238 | | | | Newfoundland (VNL) | | | – | | | – | | | 631 | | | ||||||||||||
Base metals—nickel | | Onça Puma | | | 2,076 | | | – | | | (252 | ) | | (1,617 | ) | | | Nouvelle Caledonie (VNC) | | | – | | | – | | | 284 | | | ||||||||||||
Coal | | Mozambique | | | 1,771 | | | – | | | 2,403 | | | – | | | |||||||||||||||||||||||||
Iron ore | | Midwest system | | | – | | | – | | | 522 | | | – | | | |||||||||||||||||||||||||
Iron ore | | Simandou Project | | | – | | | – | | | – | | | 1,135 | | | |||||||||||||||||||||||||
Several segments | | Other assets | | | – | | | 135 | | | 127 | | | – | | | | Other assets | | | 184 | | | 138 | | | 135 | | | ||||||||||||
| | | | | | | | | | | | | | | | | | | | | | | | |||||||||||||||||||
Impairment of non-current assets | | | | | | 917 | | | 8,412 | | | 99 | | | | | | 184 | | | 271 | | | 917 | | | |||||||||||||||
| | | | | | | | | | | | | | | ||||||||||||||||||||||||||||
Onerous contracts | | | | | | 257 | | | 357 | | | – | | | | | | 393 | | | – | | | 257 | | | |||||||||||||||
| | | | | | | | | | | | | | | | | | | | | | | | |||||||||||||||||||
Impairment of non-current assets and onerous contracts | | | | | | 1,174 | | | 8,769 | | | 99 | | | | | | 577 | | | 271 | | | 1,174 | | | |||||||||||||||
| | | | | | | | | | | | | | | | | | | | | | | | | ||||||||||||||||||
| | | | | | | | | | | | | | | | | | | | | | | | |||||||||||||||||||
Investments in associates and joint ventures | | | | | | | | | | | | ||||||||||||||||||||||||||||||
Iron ore | | Samarco Mineração S.A. | | | – | | | – | | | 132 | | | – | | | |||||||||||||||||||||||||
Base metals—Copper | | Teal Minerals Inc. | | | – | | | – | | | 314 | | | – | | | |||||||||||||||||||||||||
Others | | Vale Soluções em Energia S.A. | | | – | | | – | | | – | | | 31 | | | |||||||||||||||||||||||||
| | | | | | | | | | | | | | | ||||||||||||||||||||||||||||
Impairment of investments in associates and joint ventures | | | | | | – | | | 446 | | | 31 | | | |||||||||||||||||||||||||||
| | | | | | | | | | | | | | | ||||||||||||||||||||||||||||
| | | | | | | | | | | | | | | | | | |||||||||||||||||||||||||
| | | | | | | | | | | | | | | ||||||||||||||||||||||||||||
| | | | |
| | F-58 | | |
The assets, where a trigger of impairment was identified, were tested using fair value less costs of disposal ("FVLCS") model, except for the pelletizing plant that the value in use ("VIU") model was applied. The FVLCS for each Cash Generating Units ("CGU") was assessed considering "Level 3" fair value measurements, as it is derived from valuation techniques that includes inputs that are not based on observable market data.
These cash flows were discounted using a post-tax discount rate ranging from 6% to 10%. The discount rate was based on the weighted average cost of capital ("WACC") that reflected the risks specific to the CGU.
Iron ore and pellets—During 2016, based on new market circumstances, the Company decided to resume Norte´s system pelletizing plant, based on the studies carried out by management that demonstrates its economic feasibility. Accordingly, the Company reversed the full impairments of US$160 recorded in 2013 and 2015.
![]()
Notes to the Financial Statements (Continued)
Expressed in millions of United States dollar, unless otherwise stated
19.20. Impairment and onerous contracts (Continued)
a) Impairment of non-financial assets
The Company has carried out an impairment test for the assets for which triggering event was identified. The recoverable amount is assessed by reference to the higher of value in use ("VIU") and fair value less costs of disposal ("FVLCD").
The recoverable amount of each Cash Generating Unit ("CGU") under the impairment testing was assessed using FVLCD model, through discounted cash flow techniques, which is classified as "level 3" in the fair value hierarchy.
The cash flows were discounted using a post-tax discount rate ranging from 6% to 10%, which represents an estimate of the rate that a market participant would apply having regard to the time value of money and the risks specific to the asset. The Company used its weighted average cost of capital ("WACC") as a starting point for determining the discount rates, with appropriate adjustments for the risk profile of the countries in which the individual CGU operates.
Iron ore and pellets—During 2018, the Company did not identify any changes in the circumstances or indicators that would require reassessment of the carrying amount of the iron ore and pellets CGUs. Of the total goodwill (note 17)18), US$1,2461,841 is allocated to the group of ferrous mineral CGUs. The impairment analysesanalysis based on FVLCSFVLCD model indicateddemonstrates that CGUs recoverable amount exceeds its carrying value; therefore,there was no impairment wasloss in relation to the individual CGUs or goodwill.
In 2016, based on the market circumstances, the Company decided to resume Nortés system pelletizing plant, based on the studies carried out by management that demonstrated its economic feasibility. Accordingly, the Company reversed the full impairments of US$160 recorded in 2013 and 2015.
Coal—Based on the 2018 impairment triggering assessment, the Company has identified trigger of impairment in the Mozambique CGU driven by the lower than planned production volumes during the year. The Company carried out an impairment test based on FVLCD model and concluded that there were no changes in the impairment recognized in 2015.
In 2016, the financial statements.
In 2015, the Company recognized an impairment loss of US$522 due to lack of competitiveness in the Midwest system as a consequence of a complex logistic system associated with a consistent decline in iron ore prices. Accordingly, long-lived assets were fully impaired.
In 2014,mining plans for the Simandou project, Vale recognized an impairment of US$1,135 related to the revocation of Vale's former 51%-owned subsidiary VBG-Vale BSGR Limited ("VBG") mining concessions in Guinea. During the first quarter of 2015, the investment was sold.
Coal—The Coalcoal assets in Australia were impacted mainly by the revision of the future mining plans, which resulted inrevised and an impairment loss of US$27 in 2016 (US$635 in 2015). The impairment of US$343 registered in 2014 relates to Integra and Isaac Plans operations which were sold during the fourth quarter of 2015.
In relation to the coal assets in Mozambique, Vale recognized an impairment loss of US$2,403 in 2015 due to the reduction in estimated future coal prices combined with the increase of logistics costs, which decreased the estimated net recoverable amount of these assets. During 2016, no trigger event was identified for the purpose of impairment reassessing or any additional event or circumstance has changed that would indicate that the impairment recognized in 2015 is no longer applicable.
Nickel—The decrease in long term nickel price projections, that significantly reduced the recoverable values of the VNL and VNC CGUs, combined with significant capital investments in new processing facilities in recent years, resulted in an impairment loss in the amount of US$631 and US$284 (US$3,460 and US$1,462) in 2016 and 2015 year end, respectively.
The assumption of nickel prices used in the FVLCS calculation for the nickel CGUs is in a range (US$ per ton) from 10,500 to 20,000 (13,000 to 20,000 in 2015). Cash flows used are designed based on the life of each UGC and considering a discount rate ranging from 6% to 8% per year.
Of the total goodwill (note 17), US$1,835 is allocated to the group of nickel CGUs. The impairment analyses based on FVLCS model demonstrates that nickel CGUs recoverable amount exceeds its carrying value; therefore no impairment was recognized in the financial statements.income statement.
Nickel (Onça Puma)—In 2014,September 2017, the Federal Court granted an injunction suspending the nickel mining operations at Onça Puma (base metals segment). The Company has appealed this decision to seek a suspension of this injunction, but it is not possible to anticipate when Onça Puma activities will resume. On the assumption that the Company identified thatwill be able to operate this asset in the indicators which causedfuture, the Company carried out an impairment totest based on FVLCD model assuming different returning of operations scenarios and concluded that no impairment loss should be recognized in previous years for Onça Puma were no longer applicable. This was mainly due to Onça Puma's production resuming to normal capacity afterbooked.
Nickel (Others)—In addition, the furnace problems in 2012. The total impairment registered in 2012 was reversed in 2014 and 2015.
b) Onerous contract
The provision recognized in 2016, US$183 is related to the contracts with minimum guaranteed volume for port structureCompany did not identify any changes in the Midwest system and US$74 for supplycircumstances or indicators during 2018 that would require reassessment of manganese ore.the carrying amount of the other Nickel CGUs. Of the
| | | | |
| | F-59 | | |
![]()
Notes to the Financial Statements (Continued)
Expressed in millions of United States dollar, unless otherwise stated
19.20. Impairment and onerous contracts (Continued)
total goodwill (note 18), US$1,812 is allocated to the group of nickel CGUs. The impairment analysis based on FVLCD model demonstrates that there was no impairment loss in relation to the individual CGUs or goodwill.
In 2015,2017, an underground mine in Sudbury (Stobie) was affected by seismic activities and the cost to repair the asset is deemed not recoverable in the current market conditions. Therefore, the Company has placed this asset on "care and maintenance" and an impairment of US$133 was recognized in the income statement.
In 2016, the decrease in long term nickel price projections, that significantly reduced the recoverable amounts of the VNL and VNC CGUs, associated with significant capital investments in new processing facilities in recent years, resulted in impairment losses of US$631 and US$284, respectively.
Other assets—The Company has undertaken a review on the business plan of its biological assets leading to a reduction in the expected operational capacity of these assets. The Company carried out an impairment test based on FVLCD model and an impairment loss of US$184 was recognized in the income statement.
b) Onerous contract
In 2018, the Company recognized a provision related toof US$393 (2016: US$257) for the fluvial transportation contract with minimal guarantee volumecosts in the amountrespect of US$357 alsocertain long-term contracts in the Midwest system.
c) Impairment of investments in associatessystem for fluvial transportation and joint ventures
In 2015, the Company recognized an impairment of US$132 in its investment in Samarco (note 21) and US$314 in Teal Minerals Inc. ("Teal"). Teal recognized an impairment of property, plant and equipment due to the revision of future mining plans and the decrease of the copper price.port structure, with minimum guaranteed volume.
Accounting policy
Impairment of non-Financialnon-financial assets—Non-financial assets are reviewed for impairment whenever events or changes in circumstances indicate that the carrying amount might not be recoverable. An impairment loss is recognized for the amount by which the asset´sasset's carrying value exceeds its recoverable amount. The recoverable amount is the higher of an asset's fair value less costs of disposal ("FVLCS"FVLCD") and value in use ("VIU").
FVLCSFVLCD is generally determined as the present value of the estimated future cash flows expected to arise from the continued use of the asset from a market participant's perspective, including any expansion prospects, and its eventual disposal.prospects. VIU model is determined as the present value of the estimated future cash flows expected to arise from the continued use of the asset in its present form. Value in use is determined by applying assumptions specific to the Group'sCompany's continued use and cannot take into account future development. These assumptions are different to those used in calculating fair value and consequently the VIU calculation is likely to give a different result to a FVLCSFVLCD calculation.
The future cash flows are based on the current life-of-mine plan or long-term production plan for the cash-generating unit.
Assets that have an indefinite useful life and are not subject to amortization, such as goodwill, are tested annually for impairment.
| | | | |
| | F-60 | | |
![]()
Notes to the Financial Statements (Continued)
Expressed in millions of United States dollar, unless otherwise stated
20. Impairment and onerous contracts (Continued)
For the purposes of assessing impairment, assets are grouped at the lowest levels for which there are separately identifiable cash flows (Cash Generating Units (CGUs))(CGU). Goodwill is allocated to Cash Generating Units or Cash Generating Units groups that are expected to benefit from the business combinations in which the goodwill arose and are identified in accordance with the operating segment.
Non-current assets (excluding goodwill) in which the Company recognized impairment in the past are reviewed whenever events or changes in circumstances indicate that the impairment may no longer be applicable. In such cases, an impairment reversal will be recognized.
Onerous Contracts—For onerouscertain long-term contracts, a provision is recognized forwhen the present value of certain long-term contracts where the unavoidable cost of meetingto meet the Company's obligations exceedobligation exceeds the economic benefits tothat could be receive under it.
![]()
Notes to the Financial Statements (Continued)
Expressed in millions of United States dollar, unless otherwise stated
19. Impairment and onerous contracts (Continued)received from those contracts.
Critical accounting estimates and judgments
The Company determines its cash flows based on the budgets approved by management, which require the use of the following key assumptions: (i) mineral reserves and mineral resources measured by internal experts; (ii) costs and investments based on the best estimate of projects as supported by past performance; (iii) sale prices consistent with projections available in reports published by industry considering the market price when appropriate; (iv) the useful life of each cash-generating unit (ratio between production and mineral reserves); and (v) discount rates that reflect specific risks relating to the relevant assets in each cash-generating unit. These assumptions are subject to risk and uncertainty; henceuncertainty. Hence, there is a possibility that changes in circumstances will change these projections, which may impactaffect the recoverable amount of the assets.
20. 21. Loans, borrowings and cash and cash equivalents
a) Net debt
The Company evaluates the net debt with the objective of ensuring the continuity of its business in the long term, being able to generate value to its stockholders, through the payment of dividends and capital gain.
| | | December 31, 2016 | | December 31, 2015 | | ||||||
|---|---|---|---|---|---|---|---|---|---|---|---|
Debt contracts in the international markets | | | 21,130 | | | | 21,671 | | | ||
Debt contracts in Brazil | | | 8,192 | | | | 7,182 | | | ||
| | | | | | | ||||||
Total of loans and borrowings | | | 29,322 | | | | 28,853 | | | ||
| | | | | | | ||||||
| | | | | | | | | | | ||
| | | | | | | ||||||
(-) cash and cash equivalents | | | 4,262 | | | | 3,591 | | | ||
| | | | | | | ||||||
Net debt | | | 25,060 | | | | 25,262 | | | ||
| | | | | | | ||||||
| | | | | | | | | | | ||
| | | | | | | ||||||
b) Cash and cash equivalents
Cash and cash equivalents includes cash, immediately redeemable deposits and short-term investments with an insignificant risk of change in value. They are readily convertible to cash, being US$961 denominatedpart in R$, indexed to the Brazilian Interbank Interest rate ("DI Rate"or"CDI"), US$2,899 and part denominated in US$, mainly time depositsdeposits.
b) Loans and US$402 denominatedborrowings
As at December 31, 2018 and 2017, loans and borrowings are secured by property, plant and equipment and receivables in other currencies.the amount of US$221 and US$275, respectively.
The securities issued through Vale's wholly-owned finance subsidiary Vale Overseas Limited are fully and unconditionally guaranteed by Vale.
| | | | |
| | F-61 | | |
![]()
Notes to the Financial Statements (Continued)
Expressed in millions of United States dollar, unless otherwise stated
20.21. Loans, borrowings and cash and cash equivalents (Continued)
c) Loans and borrowings
(i)i) Total debt
| | | Current liabilities | | Non-current liabilities | | | Current liabilities | | Non-current liabilities | | ||||||||||||||||||||||||
|---|---|---|---|---|---|---|---|---|---|---|---|---|---|---|---|---|---|---|---|---|---|---|---|---|---|---|---|---|---|---|---|---|---|---|
| | | December 31, 2016 | | December 31, 2015 | | December 31, 2016 | | December 31, 2015 | | | December 31, 2018 | | December 31, 2017 | | December 31, 2018 | | December 31, 2017 | | ||||||||||||||||
Debt contracts in the international markets | | | | | | | | | | | ||||||||||||||||||||||||
Floating rates in: | | | | | | | | | | | ||||||||||||||||||||||||
Principal in: | | | | | | |||||||||||||||||||||||||||||
US$ | | | 234 | | | 241 | | | 5,489 | | | 5,174 | | | | 256 | | 649 | | 10,300 | | 16,060 | | |||||||||||
EUR | | | – | | | – | | | 211 | | | – | | | | – | | – | | 1,088 | | 1,140 | | |||||||||||
Fixed rates in: | | | | | | | | | | | ||||||||||||||||||||||||
US$ | | | – | | | 1,191 | | | 13,083 | | | 12,923 | | | ||||||||||||||||||||
EUR | | | – | | | – | | | 1,583 | | | 1,633 | | | ||||||||||||||||||||
R$ | | 492 | | 515 | | 2,940 | | 3,368 | | |||||||||||||||||||||||||
Other currencies | | | 17 | | | 14 | | | 209 | | | 169 | | | | 25 | | 17 | | 127 | | 206 | | |||||||||||
Accrued charges | | | 304 | | | 326 | | | – | | | – | | | | 230 | | 522 | | 8 | | 12 | | |||||||||||
| | | | | | | | | | | | | | | | | | | | ||||||||||||||||
| | | 555 | | | 1,772 | | | 20,575 | | | 19,899 | | | |||||||||||||||||||||
| | | | | | | | | | | |||||||||||||||||||||||||
Debt contracts in Brazil | | | | | | | | | | | ||||||||||||||||||||||||
Floating rates in: | | | | | | | | | | | ||||||||||||||||||||||||
R$, indexed to TJLP, TR, IPCA, IGP-M and CDI | | | 402 | | | 212 | | | 5,621 | | | 4,709 | | | ||||||||||||||||||||
Basket of currencies and US$ indexed to LIBOR | | | 343 | | | 290 | | | 1,217 | | | 1,342 | | | ||||||||||||||||||||
Fixed rates in: | | | | | | | | | | | ||||||||||||||||||||||||
R$ | | | 66 | | | 63 | | | 216 | | | 268 | | | ||||||||||||||||||||
Accrued charges | | | 294 | | | 169 | | | 33 | | | 129 | | | ||||||||||||||||||||
| | | | | | | | | | | |||||||||||||||||||||||||
| | | 1,105 | | | 734 | | | 7,087 | | | 6,448 | | | |||||||||||||||||||||
| | | | | | | | | | | |||||||||||||||||||||||||
| | | 1,660 | | | 2,506 | | | 27,662 | | | 26,347 | | | |||||||||||||||||||||
Total | | 1,003 | | 1,703 | | 14,463 | | 20,786 | | |||||||||||||||||||||||||
| | | | | | | | | | | | | | | | | | | | | |||||||||||||||
| | | | | | | | | | | | | | | | | | | | ||||||||||||||||
The future flows of debt payments principal per nature of funding and interest are as follows:
| | | Principal | | | | | Principal | | Estimated future interest payments(i) | | |||||||||||||||||||||||
|---|---|---|---|---|---|---|---|---|---|---|---|---|---|---|---|---|---|---|---|---|---|---|---|---|---|---|---|---|---|---|---|---|---|
| | | Bank loans | | Capital markets | | Development agencies | | Total | | Estimated future interests payments(i) | | ||||||||||||||||||||||
2017 | | | 59 | | | – | | | 1,002 | | | 1,061 | | | 1,583 | | | ||||||||||||||||
2018 | | | 1,861 | | | 791 | | | 1,172 | | | 3,824 | | | 1,369 | | | ||||||||||||||||
2019 | | | 1,088 | | | 1,000 | | | 1,361 | | | 3,449 | | | 1,211 | | | | 773 | | 831 | | |||||||||||
2020 | | | 1,593 | | | 1,338 | | | 926 | | | 3,857 | | | 1,010 | | | | 1,053 | | 799 | | |||||||||||
2021 | | | 622 | | | 1,342 | | | 912 | | | 2,876 | | | 844 | | | | 1,233 | | 732 | | |||||||||||
Between 2022 and 2025 | | | 1,313 | | | 3,292 | | | 1,212 | | | 5,817 | | | 2,299 | | | ||||||||||||||||
2026 onwards | | | 81 | | | 7,490 | | | 236 | | | 7,807 | | | 5,319 | | | ||||||||||||||||
2022 | | 1,872 | | 662 | | ||||||||||||||||||||||||||||
Between 2023 and 2027 | | 5,109 | | 2,132 | | ||||||||||||||||||||||||||||
2028 onwards | | 5,188 | | 3,794 | | ||||||||||||||||||||||||||||
| | | | | | | | | | | | | | | | | | |||||||||||||||||
| | | 6,617 | | | 15,253 | | | 6,821 | | | 28,691 | | | 13,635 | | | |||||||||||||||||
Total | | 15,228 | | 8,950 | | ||||||||||||||||||||||||||||
| | | | | | | | | | | | | | | | | | | ||||||||||||||||
| | | | | | | | | | | | | | | | | | |||||||||||||||||
| | | | |
| | F-62 | | |
![]()
Notes to the Financial Statements (Continued)
Expressed in millions of United States dollar, unless otherwise stated
20.21. Loans, borrowings and cash and cash equivalents (Continued)
At December 31, 2016, the average annual interest rates by currency are as follows:ii) Reconciliation of debt to cash flows arising from financing activities
| | | Average interest rate(i) | | Total debt | | ||||||
|---|---|---|---|---|---|---|---|---|---|---|---|
Loans and borrowings | | | | | | | | ||||
Floating rates in: | | | | | | | | ||||
US$ | | | 4.92 | % | | | 20,615 | | | ||
R$(ii) | | | 10.94 | % | | | 6,624 | | | ||
EUR (iii) | | | 3.82 | % | | | 1,857 | | | ||
Other currencies | | | 3.35 | % | | | 226 | | | ||
| | | | | | | | | ||||
| | | | | | 29,322 | | | ||||
| | | | | | | | | ||||
| | | | | | | | | | | ||
| | | | | | | | | ||||
| | Loans and borrowings | | ||
|---|---|---|---|---|
December 31, 2017 | | 22,489 | | |
Additions | | 1,225 | | |
Repayments(i) | | (7,841 | ) | |
Interest paid | | (1,121 | ) | |
| | | | | |
Cash flow from financing activities | | (7,737 | ) | |
Effect of exchange rate | | (407 | ) | |
Interest accretion | | 1,121 | | |
| | | | | |
Non-cash changes | | 714 | | |
| | | | | |
December 31, 2018 | | 15,466 | | |
| | | | | |
| | | | | |
| | | | | |
| | | | | | | | | | | Available amount | | ||||||||||||
|---|---|---|---|---|---|---|---|---|---|---|---|---|---|---|---|---|---|---|---|---|---|---|---|
Type | | Contractual currency | | Date of agreement | | Period of the agreement | | Total amount | | December 31, 2016 | | ||||||||||||
Credit lines | | | | | | | | | | | | | | | |||||||||
Revolving credit facilities | | | US$ | | | May 2015 | | | 5 years | | | | 3,000 | | | | 3,000 | | | ||||
Revolving credit facilities | | | US$ | | | July 2013 | | | 5 years | | | | 2,000 | | | | 2,000 | | | ||||
Financing lines | | | | | | | | | | | | | | | |||||||||
BNDES(i) | | | R$ | | | April 2008 | | | 10 years | | | | 2,249 | | | | 88 | | | ||||
BNDES—CLN 150 | | | R$ | | | September 2012 | | | 10 years | | | | 1,196 | | | | 6 | | | ||||
BNDES—S11D e S11D Logística | | | R$ | | | May 2014 | | | 10 years | | | | 1,899 | | | | 629 | | | ||||
Liquidity risk—To mitigate such risk, Vale has a revolving credit facilities to assist the short term liquidity management and to enable more efficiency in cash management, being consistent with the strategic focus on cost of capital reduction. The revolving credit facilities available today were acquired from a syndicate of several global commercial banks.
iii) Funding
In January 2016, the Company drew down part of its revolving credit facilities which were fully amortized in November 2016. There was no outstanding debt on this lines at December 31, 2016.
In June and August 2016, the Company issued through its wholly owned subsidiary Vale Overseas Limited theOverseas' 4.625% guaranteed notes due 2021 and 20262020 totaling US$2,250. These notes bear a coupon of 5.875% and 6.250% per year, respectively, payable semi-annually, and were sold at a price of 100.000% of the principal amount.
![]()
Notes to the Financial Statements (Continued)
Expressed in millions of United States dollar, unless otherwise stated
20. Loans, borrowings and cash and cash equivalents (Continued)
In February 2017 (subsequent event), the Company issued through Vale Overseas Limited guaranteed notes due August 2026 totaling US$1,000. The notes bears 6.250% coupon per year, payable semi-annually, and were sold at a price of 107.793% of the principal amount. The notes will be consolidated with, and form a single series with, Vale Overseas's US$1,000 6.250% notes due 2026 issued on August, 2016, mentioned above. Vale intends to apply the net proceeds from the offering on the earlier redemption of Vale's €750 million notes (due in March 2018), which is expected to occur during March 2017.
iv) Guarantees
As at December 31, 2016 and 2015, loans and borrowings are secured by property, plant and equipment and receivables in the amount of US$472 and US$495, respectively.
The securities issued through Vale's 100%-owned finance subsidiary Vale Overseas Limited are fully and unconditionally guaranteed by Vale.
v) Covenants
Some of the Company's debt agreements with lenders contain financial covenants. The main covenants in those agreements require maintaining certain ratios, such as debt to EBITDA (Earnings before Interest Taxes, Depreciation and Amortization) and interest coverage. The Company has not identified any instances of noncompliance as at December 31, 2016 and 2015.
Accounting policy
Loans and borrowings are initially measured at fair value, net of transaction costs incurred and are subsequently carried at amortized cost and updated using the effective interest rate method. Any difference between the proceeds (net of transaction costs) and the redemption value is recognized in the Income statement over the period of the loan, using the effective interest rate method. The fees paid in obtaining the loan are recognized as transaction costs.
Loans and borrowing costs are capitalized as part of property, plants and equipment if those costs are directly related to a qualified asset. The capitalization occurs until the qualified asset is ready for its intended use. The average capitalization rate is 37%17%. Borrowing costs that are not capitalized are recognized in the income statement in the period in which they are incurred.
Liquidity risk—The revolving credit facilities available today were provided by a syndicate of several global commercial banks. To mitigate liquidity risk, Vale has two revolving credit facilities, which will mature in 2020 and 2022, in the available amount of US$5,000 to assist the short term liquidity management and to enable more efficiency in cash management, being consistent with the strategic focus on cost of capital reduction. As of December 31, 2018 these lines are undrawn.
Some of the Company's debt agreements with lenders contain financial covenants. The primary financial covenants in those agreements require maintaining certain ratios, such as debt to EBITDA and interest coverage. The Company has not identified any instances of noncompliance as at December 31, 2018 and 2017.
| | | | |
| | F-63 | | |
![]()
Notes to the Financial Statements (Continued)
Expressed in millions of United States dollar, unless otherwise stated
21. 22. Liabilities related to associates and joint ventures
Refers to the provision to comply with the obligations under the agreement related to the dam failure ofIn March 2016 Samarco Mineração S.A. ("Samarco"), which is a Brazilian joint venture betweenand its shareholders, Vale S.A. and BHP Billiton Brasil Ltda. ("BHPB"), as follows:
a) Framework agreement
Samarco and its shareholders, Vale S.A. and BHPB, entered into an Agreement ("Framework Agreement") in connection with the US$6.2 billion (R$20.2 billion) lawsuit on March 2, 2016 with the Brazilian federal government, the two Brazilian states affected by the failure (Espírito Santo and Minas Gerais) and other governmental authorities, in connection with the lawsuit related to the Samarco dam failure (note 28d), in order to implement the programs for remediation and compensation of the areas and communities affected by Samarco's dam (Fundão) failure.affected.
The Framework Agreement does not contemplate admission of civil, criminal or administrative liability for the Fundão dam failure.
The Framework Agreement has a 15-year term, renewable for successive one-year periods until all the obligations under the Framework Agreement have been performed.satisfied.
Under the Framework Agreement, Samarco, Vale S.A. and BHPB have agreed to establishestablished a foundation ("Fundação Renova" or "Foundation") to develop and implement social and economic remediation and compensation, to be funded by Samarco as follows: US$614 (R$2.0 billion) in 2016, US$368 (R$1.2 billion) in 2017 and US$368 (R$1.2 billion) in 2018. From 2019 to 2021, annual contributions to the foundation will range from US$245 (R$800) to US$491 (R$1.6 billion) based on the projects approved for the relevant year. From 2022 onwards, the annual contributions will be determined on the basis of the amount of funding necessary to complete remaining programs approved for each relevant year. The foundation will allocate an annual amount of US$74 (R$240) over 15 years to the implementation of compensation programs, and these annual amounts are included in the annual contributions described above for the first six years. Through the end of 2018, Samarco is expected to provide US$153 (R$500) for sewage collection and treatment and solid waste disposal under the terms of the Framework Agreement.
Samarco. To the extent that Samarco does not meet its funding obligations to the foundation, each of Vale S.A. and BHPB will provide, under the terms of the Framework Agreement, funds to the Foundation in proportion to its 50% equity interest in Samarco.
On June 24, 2016, the Renova Foundation ("Foundation") was constituted, under the Framework Agreement, to develop and implement the socio-economic restoration and compensation programs. The Foundation began its operations in August of 2016.
As thea consequence of the dam failure, governmental authorities ordered the suspension of Samarco's operations.
Due to the uncertainties regarding Samarco's future cash flow, Vale S.A. maintains a provision for the obligation to comply with the reparation and compensation programs under the Framework Agreement (pro rata to its proportional equity interest in Samarco).
The changes in the provisions are as follows:
| | | 2018 | | 2017 | | ||
|---|---|---|---|---|---|---|---|
Balance at January 01, | | 996 | | 1,077 | | ||
| | | | | | | ||
Payments | | (290 | ) | (294 | ) | ||
Present value valuation | | 165 | | 182 | | ||
Provision increase | | 403 | | 38 | | ||
Translation adjustment | | (153 | ) | (7 | ) | ||
| | | | | | | ||
Balance at December 31, | | 1,121 | | 996 | | ||
Current liabilities | | 289 | | 326 | | ||
Non-current liabilities | | 832 | | 670 | | ||
| | | | | | | ||
Liabilities | | 1,121 | | 996 | | ||
| | | | | | | ||
| | | | | | | ||
| | | | | | | ||
In 2018, the Fundação Renova reviewed the estimates for the expenditures required to mitigate and compensate for the impacts of the disruption from Samarco's tailing dam. As a result of this revision, Vale S.A. recognized in 2018 an additional provision of US$403 (R$1,523 million), which amounts to the present value of Vale's new estimated secondary responsibility to support the Renova Foundation works and is equivalent to 50% of Samarco's additional obligations over the next 12 years.
In addition to the provision above, Vale S.A. made available in the year ended December 31, 2018 and 2017 the amount of US$84 and US$142, respectively, which was fully used to fund Samarco's working
| | | | |
| | F-64 | | |
![]()
Notes to the Financial Statements (Continued)
Expressed in millions of United States dollar, unless otherwise stated
21.22. Liabilities related to associates and joint ventures (Continued)
b) Estimates used for the provision
Samarco initially expected to resume its operations in the last quarter of 2016. Based on this assumption, Samarco´s cash flow projections indicated that it would be able to generate all or a substantial part of the funding required under the Framework Agreement. This assumption was supported by studies of appropriate technical solutions for the resumption of operations, as well as the progress of the work on the remaining dam structures after the failure and the implementation of the socio-economic and socio-environmental programs contemplated in the Framework Agreement.
In light of the stage of procedures necessary to resume operations and the uncertainties related to the licensing approval by governmental authorities during 2016, Samarco revised its assumption and concluded that was unable to make a reliable estimate of how and when its operations will resume.
Due to the above, as well as additional uncertainties regarding Samarco's cash flow, Vale S.A. recognized a provision on its interim financial statements as of June 30, 2016, for estimated costs in the amount of US$1,732 (R$5,560) which was discounted at a risk-free rate, resulting in US$1,163 (R$3,733) provision, which represents Vale S.A.'s best estimate of the obligation to comply with the reparation and compensation programs under the Framework Agreement, equivalent to its 50% equity interest in Samarco.
In August 2016, Samarco issued non-convertible private debentures which were subscribed equally by Vale S.A. and BHPB, and the resources contributed by Vale S.A. were allocated as follows: (i) US$68 (R$222) was used by Samarco in the reparation programs in accordance with the Framework Agreement, and therefore, applied against the provision of US$1,163 (R$3,733) mentioned above; and (ii) US$71 (R$234) was applied by Samarco's to fund its working capital and was recognized in Vale's income statement as "Impairmentan expense in "Equity results and other results in associates and joint ventures". Vale S.A. intends to make available until June 30, 2019 short-term facilities in the first half of 2017 of up to US$115 (R$375)88 to support Samarco's cash necessity, without any binding obligation to Samarco toin this regard. Such support its operations, without undertaking an obligation to Samarco. Funds for working capital requirements will be released as needed bysimultaneously with BHPB, and pursuant to the shareholderssame amounts, terms and conditions, subject to achievingthe fulfillment of certain milestones.
As a result of constituting the Foundation, most of the reparation and compensation programs were transferred from Samarco. Therefore, Vale S.A. made contributions to the Foundation totaling US$71 (R$ 239) to be used in the programs in accordance with the Framework Agreement.
As a result of the above mentioned, the movements of the provision during the year are as follows:
| ||||||
| ||||||
| ||||||
| ||||||
| ||||||
| ||||||
| ||||||
| ||||||
| ||||||
![]()
Notes to the Financial Statements (Continued)
Expressed in millions of United States dollar, unless otherwise stated
21. Liabilities related to associates and joint ventures (Continued)
At each reporting period, Vale S.A. will reassess the key assumptions used by Samarco in the preparation of the projected future cash flows and will adjust the provision, if required.
c) Relevant information of Samarco
Samarco is a Brazilian entity jointly controlled by Vale S.A. and BHPB, in which each shareholder has a 50% ownership interest.
Samarco operates an integrated enterprise consisting of mining, beneficiation and concentration of low-grade iron ore in the municipality of Mariana, in the State of Minas Gerais, as well as the hauling of such concentrated ore through ore pipelines connecting the its two operating plants located in Minas Gerais and Espírito Santo.
On November 5, 2015, Samarco experienced the failure of an iron ore tailings dam ("Fundão") in the state of Minas Gerais, which affected communities and ecosystems, including the Rio Doce river. Following the dam failure, the state government of Minas Gerais ordered the suspension of Samarco's operations.
The summarized financial information aboutof Samarco are as follows:
| ||||||
| ||||||
| ||||||
| ||||||
| ||||||
| ||||||
| ||||||
| ||||||
| | | December 31, 2018 | | December 31, 2017 | | ||
|---|---|---|---|---|---|---|---|
Current assets | | 54 | | 66 | | ||
Non-current assets | | 3,443 | | 6,016 | | ||
| | | | | | | ||
Total assets | | 3,497 | | 6,082 | | ||
Current liabilities | | 6,069 | | 5,481 | | ||
Non-current liabilities | | 3,934 | | 3,636 | | ||
| | | | | | | ||
Total liabilities | | 10,003 | | 9,117 | | ||
Negative reserves | | (6,506 | ) | (3,035 | ) | ||
Loss | | (1,257 | ) | (930 | ) | ||
Under Brazilian legislation and the terms of the joint venture agreement, Vale does not have an obligation to provide funding to Samarco. As a result,Therefore, Vale's investment in Samarco was reduced to zero.
Since the initial date of the accident, Samarco and its shareholders disbursed the total amount of US$614 (R$2.0 billion) to comply with the obligations under the Framework Agreement.
d) Contingencies related to Samarco accident
(i) Public civil claim filed by the Federal Government and others
The federal government, the two Brazilian states affected by the failure (Espirito Santo and Minas Gerais) and other governmental authorities have initiated a public civil lawsuit against Samarco and its shareholders, Vale S.A. and BHPB, with an estimated value indicated by the plaintiffs of US$6.2 billion (R$20.2 billion).
![]()
Notes to the Financial Statements (Continued)
Expressedimpaired in millions of United States dollar, unless otherwise stated
21. Liabilities related to associates and joint ventures (Continued)
On May 5, 2016, the Framework Agreement, which was signed on March 2, 2016, was ratified by the Federal Regional Court ("TRF"), 1st Region. In June 2016 the Superior Court of Justice ("STJ") in Brazil issued an interim order, suspending the decision of TRF, which ratified the Framework Agreement until the final judgments of the claim.
On August 17, 2016, the TRF of the 1st Region rejected the appeal presented by Samarco, Vale S.A. and BHPB against the interim order, and overruled the judicial decision that ratified the Framework Agreement. This decision of the TRF of the 1st Region, among other measures, confirmed a prior injunction that prohibited the defendants from transferring or conveying any of their interest in its Brazilian iron ore concessions, without, however, limiting their production and commercial activities and ordered a deposit with the court of US$368 (R$1.2 billion) by January 2017. This US$368 (R$1.2 billion) cash deposit was provisionally replaced by the guarantees provided for under the agreements with MPF, as described below.
In January 2017 Samarco, Vale S.A. and BHPB entered into two preliminary agreements with the Federal Prosecutor's Office in Brazil (MPF).
The first agreement ("First Agreement") aims to outline the process and timeline for negotiations of a Final Agreement ("Final Agreement"), expected to occur by June 30th, 2017. This First Agreement sets the ground for conciliation of two public civil actions which aim to establish socio-economic and socio-environmental remediation and compensation programs for the impacts of the Fundão dam failure, respectively: claim nº 023863-07.2016.4.01.3800, filed by the Federal Prosecutors (amounting to US$48 billion (R$155 billion)), as mentioned in item (ii) below, and claim nº 0069758-61.2015.4.01.3400, filed by the Federal Government, the states of Minas Gerais and Espírito Santo and other governmental authorities (amounting to US$6.2 billion (R$ 20.2 billion)). Both claims were filed with the 12th Judicial Federal Court of Belo Horizonte.
The First Agreement provides for: (i) the appointment of experts selected by the Federal Prosecutors and paid for by the companies to conduct a diagnosis and follow the progress of the 41 programs under the Framework Agreement signed on March 2nd, 2016 by the companies and the Federal Government and the states of Minas Gerais and Espírito Santo and other governmental authorities and (ii) holding at least eleven public hearings by April 15th, 2017, five of which are to be held in Minas Gerais, three in Espírito Santo and the remainder in the indigenous territories of the Krenak, Comboios and Caieiras Velhas, in order to allow these communities to take part in the definition of the content of the Final Agreement.
![]()
Notes to the Financial Statements (Continued)
Expressed in millions of United States dollar, unless otherwise stated
21. Liabilities related to associates and joint ventures (Continued)
Under the First Agreement, Samarco, Vale S.A. and BHPB will provide the 12th Judicial Federal Court of Belo Horizonte with a guarantee for fulfillment of the obligations regarding the financing and payment of the socio-environmental and socio-economic remediation programs resulting from the Fundão dam failure, pursuant to the two public civil actions, until the signing of the Final Agreement, amounting to US$675 (R$2.2 billion), of which (i) US$31 (R$100) in financial investments; ii) US$399 (R$1.3 billion) in insurance bonds; and (iii) US$245 (R$800) in assets of Samarco. The guarantee will remain in place until the completion of the negotiations for the Final Agreement or until June 30th, 2017, whichever comes first. In order to implement the First Agreement, it has been requested that the 12th Judicial Federal Court of Belo Horizonte accept such guarantees until the completion of the negotiations and the signing of the Final Agreement, or until the parties reach a new agreement regarding the guarantees. If, by June 30th, the negotiations have not been completed, the Federal Prosecutor's Office may require that the 12th Judicial Federal Court of Belo Horizonte re-institute the order for the deposit of US$368 (R$1.2 billion) in relation to the US$6.2 billion (R$20.2 billion) public civil action, which is currently suspended.
In addition, the Second Agreement (Second Agreement) was signed, which establishes a timetable to make funds available to remediate the social, economic and environmental damages caused by the Fundão dam failure in the municipalities of Barra Longa, Rio Doce, Santa Cruz do Escalvado and Ponte Nova, amounting to US$61 (R$200).
The terms of the two Agreements are subject to ratification by the courts.
(ii) Public civil action filed by Federal Prosecution Office
On May 3, 2016, the Federal Prosecution Office (MPF) filed a public civil action against Samarco and its shareholders and presented several demands, including: (i) the adoption of measures for mitigating the social, economic and environmental impacts resulting from the Fundão dam failure and other emergency measures; (ii) the payment of compensation to the community; and (iii) payments for the collective moral damage. The initial action value claimed by the Federal Prosecution Office (MPF) is US$48 billion (R$155 billion). The first conciliatory hearing was held on September 13, 2016. On November 21, 2016, the court ordered that the defendants be served, and the defendants submitted their defense. Given the negotiations of a potential settlement, the parties jointly requested the suspension of the proceeding, in accordance with the First Agreement.
![]()
Notes to the Financial Statements (Continued)
Expressed in millions of United States dollar, unless otherwise stated
21. Liabilities related to associates and joint ventures (Continued)
(iii) U.S. Securities class action suits
On May 2, 2016, Vale S.A. and certain of its officers were named as defendants in securities class action suits in the Federal Court in New York brought by holders of Vale's American Depositary Receipts under U.S. federal securities laws. The lawsuits allege that Vale S.A. made false and misleading statements or omitted to make disclosures concerning the risks and dangers of the operations of Samarco's Fundão dam and the adequacy of related programs and procedures. The plaintiffs have not specified an amount of alleged damages in these actions. Vale S.A. intends to vigorously and fully defend itself against the allegations. The litigation is at an early stage. On March 7, 2016, the judge overseeing the securities class actions issued an order consolidating these actions and designating lead plaintiffs and counsel. On April 29, 2016, lead plaintiffs filed a Consolidated Amended Complaint that will serve as the operative complaint in the litigation. In July 2016, Vale S.A. and the individual defendants filed a motion to dismiss the Amended Complaint. In August 2016, the plaintiffs submitted their opposition to the motion to dismiss, to which the defendants replied in September 2016. The decision on the motion to dismiss remains pending.
(iv) Criminal lawsuit
On October 20, 2016, the MPF brought a criminal lawsuit in the Brazilian Federal Justice Court against Vale S.A., BHPB, Samarco, VogBr Recursos Hídricos e Geotecnia Ltda. and 22 individuals for alleged crimes against the environment, urban planning and cultural heritage, flooding, landslide, as well as for alleged crimes against the victims of the Fundão dam failure.
On November 16, 2016, the judge received the Federal Prosecutors Office criminal lawsuit and determined the summons of all defendants, granting 30 days each to file their defenses, to count from the day they receive the summon. Vale has already been served and its deadline to present its defense is March 3, 2017.
(v) Other lawsuits
In addition, Samarco and its shareholders were named as a defendant in several other lawsuits brought by individuals, corporations and governmental entities seeking personal and property damages.
These lawsuits and petitions are at early stages, so it is not possible to determine a range of outcomes or reliable estimates of the potential exposure at this time. No contingent liability has been quantifiedfull and no provision was recognized for lawsuits relatedin relation to Samarco´s dam failure.the Samarco's negative reserves.
Critical accounting estimates and judgments
The provision requires the use of assumptions that may be mainly affected by: (i) changes in scope of work required under the Framework Agreement as a result of further technical analysis and the ongoing negotiations with the Federal Prosecution Office, (ii) resolution of uncertainty in respect of the resume the Samarco´s operation;resumption of Samarco's operations; (iii) updates in the discount rate; and (iv) resolution of existing and potential legal claims. As a result, future expenditures may differ from the amounts currently provided and changes to key assumptions could result in a material impact to the amount of the provision in future reporting periods. At each reporting period, Vale S.A. will reassess the key assumptions used by Samarco in the preparation of the projected cash flows and will adjust the provision, if required.
| | | | |
| | F-65 | | |
![]()
Notes to the Financial Statements (Continued)
Expressed in millions of United States dollar, unless otherwise stated
22. Risk management
Vale considers that an effective risk management is key to support the achievement of the company objectives and to ensure the financial strength and flexibility of the company and the business continuity.
Therefore, Vale has developed its risk management strategy in order to provide an integrated approach of the risks the company is exposed to, considering not only the risks generated by variables traded in financial markets (market risk) and those arising from liquidity risk, but also the risk from counterparties obligations (credit risk) and those relating to inadequate or failed internal processes, people, systems or external events (operational risk), among others.
a) Risk management policy
The Board of Directors established a corporate risk management policy defining principles and guidelines applicable to this process in the company and the corresponding governance structure.
This policy determines that corporate risks should be measured and monitored, regularly, in an integrated manner, in order to ensure that the company overall risk level remains aligned with its strategic guidelines.
The Executive Risk Management Committee, created by the Board of Directors, is responsible for supporting the Executive Board in the risk management decisions, issuing opinions and recommendations. It is also responsible for the supervision and revision of the principles and instruments of corporate risk management.
The Executive Board is responsible for the approval of the policy deployment into norms, rules and responsibilities and for reporting to the Board of Directors about such procedures.
The risk management norms and instructions complement the corporate risk management policy and define practices, processes, controls, roles and responsibilities.
The Company may, when necessary, allocate specific risk limits to management activities, including but not limited to, market risk limit, corporate and sovereign credit limit, in accordance with the acceptable corporate risk limit.
b) Liquidity risk management
The liquidity risk arises from the possibility that Vale might not perform its obligations on due dates, as well as face difficulties to meet its cash requirements due to market liquidity constraints.
See note 20 "Loans, borrowing and cash and cash equivalents" for details on the Group's liquidity risk.
![]()
Notes to the Financial Statements (Continued)
Expressed in millions of United States dollar, unless otherwise stated
22. Risk management (Continued)
c) Credit risk management
Vale's exposure to credit risk arises from trade receivables, derivative transactions, guarantees, down payment for suppliers and cash investments. Our credit risk management process provides a framework for assessing and managing counterparties' credit risk and for maintaining our risk at an acceptable level.
(i) Commercial credit risk management
See note 10 "Accounts receivables" for details on commercial credit risk.
(ii) Treasury credit risk management
To manage the credit exposure arising from cash investments and derivative instruments, credit limits are approved to each counterparty with whom we have credit exposure.
Furthermore, we control the portfolio diversification and monitor different indicators of solvency and liquidity of the different counterparties that were approved for trading.
d) Market risk management
Vale is exposed to the behavior of several market risk factors that can impact its cash flow. The assessment of this potential impact arising from the volatility of risk factors and their correlations is performed periodically to support the decision making process regarding the risk management strategy, that may incorporate financial instruments, including derivatives.
The portfolio of these financial instruments is monitored on a monthly basis, enabling financial results surveillance and its impact on cash flow.
Considering the nature of Vale's business and operations, the main market risk factors which the Company is exposed to are:
e) Foreign exchange and interest rate risk
The company's cash flow is subjected to volatility of several currencies, as its product are predominantly priced in US dollar, while most of the costs, disbursements and investments are denominated in other currencies, mainly Brazilian real and Canadian dollar.
In order to reduce the potential impact that arises from this currency mismatch, derivatives instruments may be used as a risk mitigation strategy.
![]()
Notes to the Financial Statements (Continued)
Expressed in millions of United States dollar, unless otherwise stated
22. Risk management (Continued)
Vale implements hedge transactions to protect its cash flow against the market risks that arises from its debt obligations—mainly currency volatility. The hedges cover most of the debts in Brazilian reais and euros. We use swap and forward transactions to convert debt linked to Brazilian real and Euros into US dollar, with volumes, flows and settlement dates similar to those of the debt instruments—or sometimes lower, subject to market liquidity conditions.
Hedging instruments with shorter settlement dates are renegotiated through time so that their final maturity matches—or becomes closer—to the debts' final maturity. At each settlement date, the results of the swap and forward transactions partially offset the impact of the foreign exchange rate in Vale's obligations, contributing to stabilize the cash disbursements in US dollar.
Vale has also exposure to interest rates risks over loans and financings. The US Dollar floating rate debt in the portfolio consists mainly of loans including export pre-payments, commercial banks and multilateral organizations loans. In general, such debt instruments are indexed to the LIBOR (London Interbank Offer Rate) in US dollar. We take advantage of the potential correlation between commodity prices and U.S. dollar floating interest rates as a partial natural hedge for our cash flow.
f) Risk of product and input prices
Vale is also exposed to market risks including commodities price and input price volatilities. In accordance with risk management policy, risk mitigation strategies involving commodities can be used to adjust the cash flow risk profile and reduce Vale's cash flow volatility. For this kind of risk mitigation strategy, Vale uses predominantly forwards, futures or zero-cost collars.
g) Operational risk management
The operational risk management is the structured approach that Vale uses to manage uncertainty related to possible inadequate or failure in internal processes, people, systems and external events, in accordance with the principles and guidelines of ISO 31000.
The main operational risks are periodically monitored, ensuring the effectiveness of preventive and mitigating key controls in place and the execution of the risk treatment strategy (implementation of new or improved controls, changes in the risk environment, risk sharing by contracting insurance, provisioning of resources, etc.).
Therefore, the Company seeks to have a clear view of its major risks, the best cost-benefit mitigation plans and the effectiveness of the controls in place, monitoring the potential impact of operational risk and allocating capital efficiently.
![]()
Notes to the Financial Statements (Continued)
Expressed in millions of United States dollar, unless otherwise stated
22. Risk management (Continued)
h) Capital management
The Company's policy aims at establishing a capital structure that will ensure the continuity of your business in the long term. Within this perspective, the Company has been able to deliver value to stockholders through dividend payments and capital gain, and at the same time maintain a debt profile suitable for its activities, with an amortization well distributed over the years, thus avoiding a concentration in one specific period.
i) Insurance
Vale contracts several types of insurance policies, such as operational risk policy, engineering risks insurance (projects), civil responsibility, life insurance policy for their employees, among others. The coverage of these policies is similar to the ones used in general by the mining industry and is issued in line with the objectives defined by the Company, with the corporate risk management policy and the limitation imposed by the insurance and reinsurance global market. In general, the company's assets directly related with its operations are included in the coverage of insurance policies.
Insurance management is performed with the support of existing insurance committees in the various operational areas of the Company. Among the management instruments, Vale uses captive reinsurance to balance the price on reinsurance contracts with the market, as well as, enable direct access to key international markets of insurance and reinsurance.
![]()
Notes to the Financial Statements (Continued)
Expressed in millions of United States dollar, unless otherwise stated
23. Financial instruments classification
The Company classifies its financial instruments in accordance with the purpose for which they were acquired, and determines the classification and initial recognition according to the following categories:
| | | December 31, 2016 | | December 31, 2015 | | | December 31, 2018 | | December 31, 2017 | |||||||||||||||||||||||||||||||||||||
|---|---|---|---|---|---|---|---|---|---|---|---|---|---|---|---|---|---|---|---|---|---|---|---|---|---|---|---|---|---|---|---|---|---|---|---|---|---|---|---|---|---|---|---|---|---|---|
Financial assets | | Loans and receivables or amortized cost | | At fair value through net income | | Total | | Loans and receivables or amortized cost | | At fair value through net income | | Derivatives designated as hedge accounting | | Total | | | Amortized cost | | At fair value through OCI | | At fair value through profit or loss | | Total | | Loans and receivables or amortized cost | | At fair value through profit or loss | | Total | |||||||||||||||||
Current | | | | | | | | | | | | | | | | | | | | | | | ||||||||||||||||||||||||
Cash and cash equivalents | | | 4,262 | | | – | | | 4,262 | | | 3,591 | | | – | | | – | | | 3,591 | | | 5,784 | | – | | – | | 5,784 | | 4,328 | | – | | 4,328 | ||||||||||
Financial investments | | | 18 | | | – | | | 18 | | | 28 | | | – | | | – | | | 28 | | | – | | – | | 32 | | 32 | | 18 | | – | | 18 | ||||||||||
Derivative financial instruments | | | – | | | 274 | | | 274 | | | – | | | 121 | | | – | | | 121 | | | – | | – | | 39 | | 39 | | – | | 106 | | 106 | ||||||||||
Accounts receivable | | | 3,663 | | | – | | | 3,663 | | | 1,476 | | | – | | | – | | | 1,476 | | | 2,756 | | – | | (108) | | 2,648 | | 2,430 | | 170 | | 2,600 | ||||||||||
Related parties | | | 71 | | | – | | | 71 | | | 70 | | | – | | | – | | | 70 | | | 364 | | – | | – | | 364 | | 1,898 | | – | | 1,898 | ||||||||||
| | | | | | | | | | | | | | | | | | | | | | | | | | | | | | | |||||||||||||||||
| | | 8,014 | | | 274 | | | 8,288 | | | 5,165 | | | 121 | | | – | | | 5,286 | | | 8,904 | | – | | (37) | | 8,867 | | 8,674 | | 276 | | 8,950 | |||||||||||
Non-current | | | | | | | | | | | | | | | | | | | | | | | ||||||||||||||||||||||||
Derivative financial instruments | | | – | | | 446 | | | 446 | | | – | | | 93 | | | – | | | 93 | | | – | | – | | 392 | | 392 | | – | | 453 | | 453 | ||||||||||
Investments in equity securities | | – | | 987 | | – | | 987 | | – | | – | | – | ||||||||||||||||||||||||||||||||
Loans | | | 180 | | | – | | | 180 | | | 188 | | | – | | | – | | | 188 | | | 153 | | – | | – | | 153 | | 151 | | – | | 151 | ||||||||||
Related parties | | | 2 | | | – | | | 2 | | | 1 | | | – | | | – | | | 1 | | | 1,612 | | – | | – | | 1,612 | | 2,628 | | – | | 2,628 | ||||||||||
| | | | | | | | | | | | | | | | | | | | | | | | | | | | | | | |||||||||||||||||
| | | 182 | | | 446 | | | 628 | | | 189 | | | 93 | | | – | | | 282 | | | 1,765 | | 987 | | 392 | | 3,144 | | 2,779 | | 453 | | 3,232 | |||||||||||
| | | | | | | | | | | | | | | | | | | | | | | | | | | | | | | |||||||||||||||||
Total of financial assets | | | 8,196 | | | 720 | | | 8,916 | | | 5,354 | | | 214 | | | – | | | 5,568 | | | 10,669 | | 987 | | 355 | | 12,011 | | 11,453 | | 729 | | 12,182 | ||||||||||
| | | | | | | | | | | | | | | | | | | | | | | | | | | | | | | | ||||||||||||||||
| | | | | | | | | | | | | | | | | | | | | | | | | | | | | | | |||||||||||||||||
Financial liabilities | | | | | | | | | | | | | | | | | | | | | | | ||||||||||||||||||||||||
Current | | | | | | | | | | | | | | | | | | | | | | | ||||||||||||||||||||||||
Suppliers and contractors | | | 3,630 | | | – | | | 3,630 | | | 3,365 | | | – | | | – | | | 3,365 | | | 3,512 | | – | | – | | 3,512 | | 4,041 | | – | | 4,041 | ||||||||||
Derivative financial instruments | | | – | | | 414 | | | 414 | | | – | | | 2,023 | | | 53 | | | 2,076 | | | – | | – | | 470 | | 470 | | – | | 104 | | 104 | ||||||||||
Loans and borrowings | | | 1,660 | | | – | | | 1,660 | | | 2,506 | | | – | | | – | | | 2,506 | | | 1,003 | | – | | – | | 1,003 | | 1,703 | | – | | 1,703 | ||||||||||
Related parties | | | 672 | | | – | | | 672 | | | 475 | | | – | | | – | | | 475 | | | 1,134 | | – | | – | | 1,134 | | 882 | | – | | 882 | ||||||||||
| | | | | | | | | | | | | | | | | | | | | | | | | | | | | | | |||||||||||||||||
| | | 5,962 | | | 414 | | | 6,376 | | | 6,346 | | | 2,023 | | | 53 | | | 8,422 | | | 5,649 | | – | | 470 | | 6,119 | | 6,626 | | 104 | | 6,730 | |||||||||||
Non-current | | | | | | | | | | | | | | | | | | | | | | | ||||||||||||||||||||||||
Derivative financial instruments | | | – | | | 1,225 | | | 1,225 | | | – | | | 1,570 | | | – | | | 1,570 | | | – | | – | | 344 | | 344 | | – | | 686 | | 686 | ||||||||||
Loans and borrowings | | | 27,662 | | | – | | | 27,662 | | | 26,347 | | | – | | | – | | | 26,347 | | | 14,463 | | – | | – | | 14,463 | | 20,786 | | – | | 20,786 | ||||||||||
Related parties | | | 127 | | | – | | | 127 | | | 213 | | | – | | | – | | | 213 | | | 960 | | – | | – | | 960 | | 975 | | – | | 975 | ||||||||||
Participative stockholders' debentures | | | – | | | 775 | | | 775 | | | – | | | 342 | | | – | | | 342 | | | – | | – | | 1,407 | | 1,407 | | – | | 1,233 | | 1,233 | ||||||||||
| | | | | | | | | | | | | | | | | | | | | | | | | | | | | | | |||||||||||||||||
| | | 27,789 | | | 2,000 | | | 29,789 | | | 26,560 | | | 1,912 | | | – | | | 28,472 | | | 15,423 | | – | | 1,751 | | 17,174 | | 21,761 | | 1,919 | | 23,680 | |||||||||||
| | | | | | | | | | | | | | | | | | | | | | | | | | | | | | | |||||||||||||||||
Total of financial liabilities | | | 33,751 | | | 2,414 | | | 36,165 | | | 32,906 | | | 3,935 | | | 53 | | | 36,894 | | | 21,072 | | – | | 2,221 | | 23,293 | | 28,387 | | 2,023 | | 30,410 | ||||||||||
| | | | | | | | | | | | | | | | | | | | | | | | | | | | | | | | ||||||||||||||||
| | | | | | | | | | | | | | | | | | | | | | | | | | | | | | | |||||||||||||||||
| | | | |
| | F-66 | | |
![]()
Notes to the Financial Statements (Continued)
Expressed in millions of United States dollar, unless otherwise stated
23. Financial instruments classification (Continued)
The classification of financial assets and liabilities by currencies are as follows:
| | | December 31, 2016 | | | December 31, 2018 | |||||||||||||||||||||||||||||||||||||||||||
|---|---|---|---|---|---|---|---|---|---|---|---|---|---|---|---|---|---|---|---|---|---|---|---|---|---|---|---|---|---|---|---|---|---|---|---|---|---|---|---|---|---|---|---|---|---|---|---|---|
Financial assets | | R$ | | US$ | | CAD | | AUD | | EUR | | Others currencies | | Total | | | R$ | | US$ | | CAD | | EUR | | Others currencies | | Total | |||||||||||||||||||||
Current | | | | | | | | | | | | | | | | | | | | | | | ||||||||||||||||||||||||||
Cash and cash equivalents | | | 961 | | | 2,899 | | | 45 | | | 25 | | | 56 | | | 276 | | | 4,262 | | | | 2,765 | | 2,883 | | 23 | | 12 | | 101 | | 5,784 | |||||||||||||
Financial investments | | | 1 | | | 17 | | | – | | | – | | | – | | | – | | | 18 | | | | 1 | | 31 | | – | | – | | – | | 32 | |||||||||||||
Derivative financial instruments | | | 104 | | | 170 | | | – | | | – | | | – | | | – | | | 274 | | | | 30 | | 9 | | – | | – | | – | | 39 | |||||||||||||
Accounts receivable | | | 337 | | | 3,310 | | | – | | | – | | | 1 | | | 15 | | | 3,663 | | | | 447 | | 2,197 | | 4 | | – | | – | | 2,648 | |||||||||||||
Related parties | | | 71 | | | – | | | – | | | – | | | – | | | – | | | 71 | | | | – | | 364 | | – | | – | | – | | 364 | |||||||||||||
| | | | | | | | | | | | | | | | | | | | | | | | | | | | | |||||||||||||||||||||
| | | 1,474 | | | 6,396 | | | 45 | | | 25 | | | 57 | | | 291 | | | 8,288 | | | | 3,243 | | 5,484 | | 27 | | 12 | | 101 | | 8,867 | ||||||||||||||
| | | | | | | | | | | | | | | | | |||||||||||||||||||||||||||||||||
Non-current | | | | | | | | | | | | | | | | | | | | | | | ||||||||||||||||||||||||||
Derivative financial instruments | | | 400 | | | 46 | | | – | | | – | | | – | | | – | | | 446 | | | | 380 | | 12 | | – | | – | | – | | 392 | |||||||||||||
Investments in equity securities | | – | | 987 | | – | | – | | – | | 987 | ||||||||||||||||||||||||||||||||||||
Loans | | | 35 | | | 96 | | | 49 | | | – | | | – | | | – | | | 180 | | | | 5 | | 148 | | – | | – | | – | | 153 | |||||||||||||
Related parties | | | 2 | | | – | | | – | | | – | | | – | | | – | | | 2 | | | | – | | 1,612 | | – | | – | | – | | 1,612 | |||||||||||||
| | | | | | | | | | | | | | | | | | | | | | | | | | | | | |||||||||||||||||||||
| | | 437 | | | 142 | | | 49 | | | – | | | – | | | – | | | 628 | | | | 385 | | 2,759 | | – | | – | | – | | 3,144 | ||||||||||||||
| | | | | | | | | | | | | | | | | | | | | | | | | | | | | |||||||||||||||||||||
Total of assets | | | 1,911 | | | 6,538 | | | 94 | | | 25 | | | 57 | | | 291 | | | 8,916 | | | |||||||||||||||||||||||||
Total of financial assets | | 3,628 | | 8,243 | | 27 | | 12 | | 101 | | 12,011 | ||||||||||||||||||||||||||||||||||||
| | | | | | | | | | | | | | | | | | | | | | | | | | | | | | ||||||||||||||||||||
| | | | | | | | | | | | | | | | | | | | | | | | | | | | | |||||||||||||||||||||
Financial liabilities | | | | | | | | | | | | | | | | | | | | | | | ||||||||||||||||||||||||||
Current | | | | | | | | | | | | | | | | | | | | | | | ||||||||||||||||||||||||||
Suppliers and contractors | | | 1,897 | | | 948 | | | 612 | | | 7 | | | 96 | | | 70 | | | 3,630 | | | | 1,791 | | 1,182 | | 292 | | 141 | | 106 | | 3,512 | |||||||||||||
Derivative financial instruments | | | 317 | | | 97 | | | – | | | – | | | – | | | – | | | 414 | | | | 389 | | 81 | | – | | – | | – | | 470 | |||||||||||||
Loans and borrowings | | | 752 | | | 827 | | | 17 | | | – | | | 64 | | | – | | | 1,660 | | | | 532 | | 410 | | 25 | | 36 | | – | | 1,003 | |||||||||||||
Related parties | | | 319 | | | 353 | | | – | | | – | | | – | | | – | | | 672 | | | | 769 | | 365 | | – | | – | | – | | 1,134 | |||||||||||||
| | | | | | | | | | | | | | | | | | | | | | | | | | | | | |||||||||||||||||||||
| | | 3,285 | | | 2,225 | | | 629 | | | 7 | | | 160 | | | 70 | | | 6,376 | | | | 3,481 | | 2,038 | | 317 | | 177 | | 106 | | 6,119 | ||||||||||||||
| | | | | | | | | | | | | | | | | |||||||||||||||||||||||||||||||||
Non-current | | | | | | | | | | | | | | | | | | | | | | | ||||||||||||||||||||||||||
Derivative financial instruments | | | 1,052 | | | 173 | | | – | | | – | | | – | | | – | | | 1,225 | | | | 321 | | 23 | | – | | – | | – | | 344 | |||||||||||||
Loans and borrowings | | | 5,869 | | | 19,790 | | | 209 | | | – | | | 1,794 | | | – | | | 27,662 | | | | 2,948 | | 10,300 | | 127 | | 1,088 | | – | | 14,463 | |||||||||||||
Related parties | | | 127 | | | – | | | – | | | – | | | – | | | – | | | 127 | | | | 65 | | 895 | | – | | – | | – | | 960 | |||||||||||||
Participative stockholders' debentures | | | 775 | | | – | | | – | | | – | | | – | | | – | | | 775 | | | | 1,407 | | – | | – | | – | | – | | 1,407 | |||||||||||||
| | | | | | | | | | | | | | | | | | | | | | | | | | | | | |||||||||||||||||||||
| | | 7,823 | | | 19,963 | | | 209 | | | – | | | 1,794 | | | – | | | 29,789 | | | | 4,741 | | 11,218 | | 127 | | 1,088 | | – | | 17,174 | ||||||||||||||
| | | | | | | | | | | | | | | | | | | | | | | | | | | | | |||||||||||||||||||||
Total of liabilities | | | 11,108 | | | 22,188 | | | 838 | | | 7 | | | 1,954 | | | 70 | | | 36,165 | | | |||||||||||||||||||||||||
Total of financial liabilities | | 8,222 | | 13,256 | | 444 | | 1,265 | | 106 | | 23,293 | ||||||||||||||||||||||||||||||||||||
| | | | | | | | | | | | | | | | | | | | | | | | | | | | | | ||||||||||||||||||||
| | | | | | | | | | | | | | | | | | | | | | | | | | | | | |||||||||||||||||||||
| | | | |
| | F-67 | | |
![]()
Notes to the Financial Statements (Continued)
Expressed in millions of United States dollar, unless otherwise stated
23. Financial instruments classification (Continued)
| | | December 31, 2017 | ||||||||||
|---|---|---|---|---|---|---|---|---|---|---|---|---|
| Financial assets | | R$ | | US$ | | CAD | | EUR | | Others currencies | | Total |
Current | | | | | | | ||||||
Cash and cash equivalents | | 1,790 | | 2,395 | | 48 | | 11 | | 84 | | 4,328 |
Financial investments | | 1 | | 17 | | – | | – | | – | | 18 |
Derivative financial instruments | | 60 | | 46 | | – | | – | | – | | 106 |
Accounts receivable | | 246 | | 2,334 | | 6 | | | 14 | | 2,600 | |
Related parties | | – | | 1,898 | | – | | – | | – | | 1,898 |
| | | | | | | | | | | | | |
| | 2,097 | | 6,690 | | 54 | | 11 | | 98 | | 8,950 | |
Non-current | | | | | | | ||||||
Derivative financial instruments | | 384 | | 69 | | – | | – | | – | | 453 |
Loans | | 5 | | 146 | | – | | – | | – | | 151 |
Related parties | | – | | 2,628 | | – | | – | | – | | 2,628 |
| | | | | | | | | | | | | |
| | 389 | | 2,843 | | – | | – | | – | | 3,232 | |
| | | | | | | | | | | | | |
Total of financial assets | | 2,486 | | 9,533 | | 54 | | 11 | | 98 | | 12,182 |
| | | | | | | | | | | | | |
| | | | | | | | | | | | | |
| | | | | | | | | | | | | |
Financial liabilities | | | | | | | ||||||
Current | | | | | | | ||||||
Suppliers and contractors | | 2,464 | | 1,108 | | 386 | | 49 | | 34 | | 4,041 |
Derivative financial instruments | | 95 | | 9 | | – | | – | | – | | 104 |
Loans and borrowings | | 768 | | 880 | | 18 | | 37 | | – | | 1,703 |
Related parties | | – | | 882 | | – | | – | | – | | 882 |
| | | | | | | | | | | | | |
| | 3,327 | | 2,879 | | 404 | | 86 | | 34 | | 6,730 | |
Non-current | | | | | | | ||||||
Derivative financial instruments | | 638 | | 48 | | – | | – | | – | | 686 |
Loans and borrowings | | 3,379 | | 16,060 | | 207 | | 1,140 | | – | | 20,786 |
Related parties | | 78 | | 897 | | – | | – | | – | | 975 |
Participative stockholders' debentures | | 1,233 | | – | | – | | – | | – | | 1,233 |
| | | | | | | | | | | | | |
| | 5,328 | | 17,005 | | 207 | | 1,140 | | – | | 23,680 | |
| | | | | | | | | | | | | |
Total of financial liabilities | | 8,655 | | 19,884 | | 611 | | 1,226 | | 34 | | 30,410 |
| | | | | | | | | | | | | |
| | | | | | | | | | | | | |
| | | | | | | | | | | | | |
Accounting policy
The Company classifies financial instruments based on its business model for managing the assets and the contractual cash flow characteristics of those assets. The business model test determines the classification based on the business purpose for holding the asset and whether the contractual cash flows represent only payments of principal and interest.
Financial instruments are measured at fair value through profit or loss unless certain conditions are met that permit measurement at fair value through other comprehensive income ("FVOCI") or amortized cost. Gains and losses recorded in other comprehensive income for debt instruments are recognized in profit or loss only on disposal.
| | | | |
| | F-68 | | |
![]()
Notes to the Financial Statements (Continued)
Expressed in millions of United States dollar, unless otherwise stated
23. Financial instruments classification (Continued)
Investments in equity instruments are measured at fair value through profit or loss unless they are eligible to be measured at FVOCI. The Company recognizes equity instruments and gains and losses are never being recycled to profit or loss.
| | | December 31, 2015 | | |||||||||||||||||||||||||||||||||
|---|---|---|---|---|---|---|---|---|---|---|---|---|---|---|---|---|---|---|---|---|---|---|---|---|---|---|---|---|---|---|---|---|---|---|---|---|
Financial assets | | R$ | | US$ | | CAD | | AUD | | EUR | | Others currencies | | Total | | |||||||||||||||||||||
Current | | | | | | | | | | | | | | | | | | | | | | | ||||||||||||||
Cash and cash equivalents | | | 816 | | | | 2,528 | | | | 12 | | | | 54 | | | | 11 | | | | 170 | | | | 3,591 | | | |||||||
Financial investments | | | – | | | | 28 | | | | – | | | | – | | | | – | | | | – | | | | 28 | | | |||||||
Derivative financial instruments | | | 50 | | | | 71 | | | | – | | | | – | | | | – | | | | – | | | | 121 | | | |||||||
Accounts receivable | | | 251 | | | | 1,084 | | | | 125 | | | | 10 | | | | 4 | | | | 2 | | | | 1,476 | | | |||||||
Related parties | | | 70 | | | | – | | | | – | | | | – | | | | – | | | | – | | | | 70 | | | |||||||
| | | | | | | | | | | | | | | | | |||||||||||||||||||||
| | | 1,187 | | | | 3,711 | | | | 137 | | | | 64 | | | | 15 | | | | 172 | | | | 5,286 | | | ||||||||
| | | | | | | | | | | | | | | | | |||||||||||||||||||||
Non-current | | | | | | | | | | | | | | | | | | | | | | | ||||||||||||||
Derivative financial instruments | | | 75 | | | | 18 | | | | – | | | | – | | | | – | | | | – | | | | 93 | | | |||||||
Loans | | | 27 | | | | 103 | | | | 58 | | | | – | | | | – | | | | – | | | | 188 | | | |||||||
Related parties | | | 1 | | | | – | | | | – | | | | – | | | | – | | | | – | | | | 1 | | | |||||||
| | | | | | | | | | | | | | | | | |||||||||||||||||||||
| | | 103 | | | | 121 | | | | 58 | | | | – | | | | – | | | | – | | | | 282 | | | ||||||||
| | | | | | | | | | | | | | | | | |||||||||||||||||||||
Total of assets | | | 1,290 | | | | 3,832 | | | | 195 | | | | 64 | | | | 15 | | | | 172 | | | | 5,568 | | | |||||||
| | | | | | | | | | | | | | | | | |||||||||||||||||||||
| | | | | | | | | | | | | | | | | | | | | | | | | | | | | | | |||||||
| | | | | | | | | | | | | | | | | |||||||||||||||||||||
Financial liabilities | | | | | | | | | | | | | | | | | | | | | | | ||||||||||||||
Current | | | | | | | | | | | | | | | | | | | | | | | ||||||||||||||
Suppliers and contractors | | | 1,499 | | | | 1,389 | | | | 335 | | | | 9 | | | | 115 | | | | 18 | | | | 3,365 | | | |||||||
Derivative financial instruments | | | 911 | | | | 1,165 | | | | – | | | | – | | | | – | | | | – | | | | 2,076 | | | |||||||
Loans and borrowings | | | 434 | | | | 1,992 | | | | 15 | | | | – | | | | 65 | | | | – | | | | 2,506 | | | |||||||
Related parties | | | 475 | | | | – | | | | – | | | | – | | | | – | | | | – | | | | 475 | | | |||||||
| | | | | | | | | | | | | | | | | |||||||||||||||||||||
| | | 3,319 | | | | 4,546 | | | | 350 | | | | 9 | | | | 180 | | | | 18 | | | | 8,422 | | | ||||||||
| | | | | | | | | | | | | | | | | |||||||||||||||||||||
Non-current | | | | | | | | | | | | | | | | | | | | | | | ||||||||||||||
Derivative financial instruments | | | 1,356 | | | | 214 | | | | – | | | | – | | | | – | | | | – | | | | 1,570 | | | |||||||
Loans and borrowings | | | 5,107 | | | | 19,439 | | | | 165 | | | | 3 | | | | 1,633 | | | | – | | | | 26,347 | | | |||||||
Related parties | | | 73 | | | | 140 | | | | – | | | | – | | | | – | | | | – | | | | 213 | | | |||||||
Participative stockholders' debentures | | | 342 | | | | – | | | | – | | | | – | | | | – | | | | – | | | | 342 | | | |||||||
| | | | | | | | | | | | | | | | | |||||||||||||||||||||
| | | 6,878 | | | | 19,793 | | | | 165 | | | | 3 | | | | 1,633 | | | | – | | | | 28,472 | | | ||||||||
| | | | | | | | | | | | | | | | | |||||||||||||||||||||
Total of liabilities | | | 10,197 | | | | 24,339 | | | | 515 | | | | 12 | | | | 1,813 | | | | 18 | | | | 36,894 | | | |||||||
| | | | | | | | | | | | | | | | | |||||||||||||||||||||
| | | | | | | | | | | | | | | | | | | | | | | | | | | | | | | |||||||
| | | | | | | | | | | | | | | | | |||||||||||||||||||||
TableInformation about the Company's exposure to credit risk is set out in note 33.
All financial liabilities are initially measured at fair value, net of Contents
![]()
Notes totransaction costs incurred and are subsequently carried at amortized cost and updated using the Financial Statements (Continued)
Expressed in millions of United States dollar, unless otherwise statedeffective interest rate method. Participative stockholders' debentures and Derivative financial instruments are measured at fair value through profit or loss.
24. Fair value estimate
Due to the short-term cycle, it is assumed that the fair value of cash and cash equivalents balances, financial investments, accounts receivable and accounts payable approximate their book values. For the measurement and determination of fair value, the Company uses various methods including market, income or cost approaches, in order to estimate the value that market participants would use when pricing the asset or liability. The financial assets and liabilities recorded at fair value are classified and disclosed in accordance with the following levels:
Level 1—unadjustedUnadjusted quoted prices on an active, liquid and visible market for identical assets or liabilities that are accessible at the measurement date;
Level 2—quotedQuoted prices (adjusted or unadjusted) for identical or similar assets or liabilities on active markets; and
Level 3—assetsAssets and liabilities, for which quoted prices, do not exist, or where prices or valuation techniques are supported by little or no market activity, unobservable or illiquid.
a)
| | | December 31, 2016 | | December 31, 2015 | | | December 31, 2018 | | December 31, 2017 | ||||||||||||||||||||||||||||||||||||
|---|---|---|---|---|---|---|---|---|---|---|---|---|---|---|---|---|---|---|---|---|---|---|---|---|---|---|---|---|---|---|---|---|---|---|---|---|---|---|---|---|---|---|---|---|---|
| | | Level 2 | | Level 3 | | Total | | Level 2 | | Level 3 | | Total | | | Level 1 | | Level 2 | | Level 3 | | Total | | Level 2 | | Level 3 | | Total | ||||||||||||||||||
Financial assets | | | | | | | | | | | | | | | | | | | | | | ||||||||||||||||||||||||
Financial investments | | 32 | | – | | – | | 32 | | – | | – | | – | |||||||||||||||||||||||||||||||
Derivative financial instruments | | | 405 | | | 315 | | | 720 | | | 214 | | | – | | | 214 | | | | – | | 136 | | 295 | | 431 | | 289 | | 270 | | 559 | |||||||||||
Accounts receivable | | – | | (108) | | – | | (108) | | 170 | | – | | 170 | |||||||||||||||||||||||||||||||
Investments in equity securities | | 987 | | – | | – | | 987 | | – | | – | | – | |||||||||||||||||||||||||||||||
| | | | | | | | | | | | | | | | | | | | | | | | | | | | | ||||||||||||||||||
Total | | | 405 | | | 315 | | | 720 | | | 214 | | | – | | | 214 | | | | 1,019 | | 28 | | 295 | | 1,342 | | 459 | | 270 | | 729 | |||||||||||
| | | | | | | | | | | | | | | | | | | | | | | | | | | | | | |||||||||||||||||
| | | | | | | | | | | | | | | | | | | | | | | | | | | | | ||||||||||||||||||
Financial liabilities | | | | | | | | | | | | | | | | | | | | | | ||||||||||||||||||||||||
Derivative financial instruments | | | 1,008 | | | 449 | | | 1,639 | | | 3,505 | | | 141 | | | 3,646 | | | | – | | 636 | | 178 | | 814 | | 581 | | 209 | | 790 | |||||||||||
Participative stockholders' debentures | | | 775 | | | – | | | 775 | | | 342 | | | – | | | 342 | | | | – | | 1,407 | | – | | 1,407 | | 1,233 | | – | | 1,233 | |||||||||||
| | | | | | | | | | | | | | | | | | | | | | | | | | | | | ||||||||||||||||||
Total | | | 1,783 | | | 449 | | | 2,414 | | | 3,847 | | | 141 | | | 3,988 | | | | – | | 2,043 | | 178 | | 2,221 | | 1,814 | | 209 | | 2,023 | |||||||||||
| | | | | | | | | | | | | | | | | | | | | | | | | | | | | | |||||||||||||||||
| | | | | | | | | | | | | | | | | | | | | | | | | | | | | ||||||||||||||||||
| | | | |
| | F-69 | | |
![]()
Notes to the Financial Statements (Continued)
Expressed in millions of United States dollar, unless otherwise stated
24. Fair value estimate (Continued)
The Company changed its accounting estimate on the calculation of the participative stockholders' debentures from January 1, 2018. The Company has replaced in the calculation the assumption of spot price at the reporting date to the weighted average price traded on the market within the last month of the quarter.
There were no transfers between Level 1 and Level 2, or between Level 2 and Level 3 in the year ended December 31, 2018.
The following table presents the changes in Level 3 assets and liabilities for the year ended December 31, 2018:
| | | Derivative financial instruments | | ||||
|---|---|---|---|---|---|---|---|
| | | Financial assets | | Financial liabilities | | ||
Balance at December 31, 2017 | | 270 | | 209 | | ||
| | | | | | | ||
Gain and losses recognized in income statement | | 25 | | (31 | ) | ||
| | | | | | | ||
Balance at December 31, 2018 | | 295 | | 178 | | ||
| | | | | | | ||
| | | | | | | ||
| | | | | | | ||
Methods and valuation techniques of evaluation
i) Derivative financial instruments
FinancialDerivative financial instruments are evaluated by calculating their present value through yieldthe use of market curves and prices impacting each instrument at the closing dates. The curves and prices used in the calculation for each group of instruments aredates, detailed in the item "market curves" (note 34).
TheFor the pricing method used for Europeanof options, isthe Company often uses the Black & Scholes model. In this model, the fair value of the derivative is determined basically as a function of the volatility inand the price of the underlying asset, the exercisestrike price of the option, the risk free interest rate and period tothe option maturity. In the case of options which incomewhere payoff is a function of the average price of the underlying asset over a certain period during the periodlife of the option, the Company uses Turnbull & Wakeman model. In this model, in addition to the factors that influence the option price in the Black-Scholes model, the formation period of the average price is also considered.
![]()
Notes to the Financial Statements (Continued)
Expressed in millions of United States dollar, unless otherwise stated
24. Fair value estimate (Continued)
In the case of swaps, both the present value of the assetslong and liabilityshort positions are estimated by discounting thetheir cash flowflows by the interest rate ofin the currency in whichrelated currency. The fair value is determined by the swap is denominated. The difference between the present value of the assetslong and short positions of the liabilities generates its fair value.swap in the reference currency.
For the swaps indexed to the Long Term Interest Rate ("TJLP") swaps,TJLP, the calculation of the fair value assumes that TJLP is constant, andthat is, the projections of future cash flowflows in Brazilian Reais are made on the basis ofconsidering the last TJLP disclosed.
Contracts for the purchase or sale of products, inputsForward and costs of selling with future settlementcontracts are priced using the forward yieldfuture curves for each product.of their corresponding underlying assets. Typically, these curves are obtained on the stock exchanges where the productsthese assets are traded, such as the London Metals Exchange ("LME"), the Commodity Exchange ("COMEX") or other providers of market prices. When there is no price for the desired maturity, Vale uses an interpolation between the available maturities.
| | | | |
| | F-70 | | |
![]()
Notes to the Financial Statements (Continued)
Expressed in millions of United States dollar, unless otherwise stated
24. Fair value estimate (Continued)
The fair value forof derivatives classified inwithin level 3 are measuredis estimated using discounted cash flows and option model valuation techniques with main unobservable inputs of discount rates, stock prices and commodities prices.
ii)
Critical accounting estimates and judgments
The fair values of financial instruments that are not traded in active markets are determined using valuation techniques. Vale uses its own judgment to choose between the various methods. Assumptions are based on the market conditions, at the end of the year.
An analysis of the impact if actual results are different from management's estimates is present on note 33 (sensibility34 (sensitivity analysis).
b) Fair value of financial instruments not measured at fair value
The fair value estimate for level 1 is based on market approach considering the secondary market contracts. For loans allocated to level 2, the income approach is adopted and the fair value for both fixed-indexed rate debt and floating rate debt is determined on a discounted cash flowsflow basis using LIBOR future values and Vale's bonds curve.
The fair values and carrying amounts of non-current loans (net of interest)and borrowings are as follows:
Financial liabilities | | Balance | | Fair value | | Level 1 | | Level 2 | | | Balance | | Fair value | | Level 1 | | Level 2 | | ||||||||||||||||
|---|---|---|---|---|---|---|---|---|---|---|---|---|---|---|---|---|---|---|---|---|---|---|---|---|---|---|---|---|---|---|---|---|---|---|
December 31, 2016 | | | | | | | | | | | ||||||||||||||||||||||||
December 31, 2018 | | | | | | |||||||||||||||||||||||||||||
Debt principal | | | 28,691 | | | 27,375 | | | 13,874 | | | 13,501 | | | | 15,228 | | 16,262 | | 10,686 | | 5,576 | | |||||||||||
December 31, 2015 | | | | | | | | | | | ||||||||||||||||||||||||
December 31, 2017 | | | | | | |||||||||||||||||||||||||||||
Debt principal | | | 28,229 | | | 26,233 | | | 12,297 | | | 13,936 | | | | 21,955 | | 23,088 | | 14,935 | | 8,153 | | |||||||||||
| | | | |
| | F-71 | | |
![]()
Notes to the Financial Statements (Continued)
Expressed in millions of United States dollar, unless otherwise stated
25. Derivative financial instruments
a) Derivatives effects on statement of financial position
| | | Assets | | | Assets | ||||||||||||||||||||||||
|---|---|---|---|---|---|---|---|---|---|---|---|---|---|---|---|---|---|---|---|---|---|---|---|---|---|---|---|---|---|
| | | December 31, 2016 | | December 31, 2015 | | | December 31, 2018 | | December 31, 2017 | ||||||||||||||||||||
| | | Current | | Non-current | | Current | | Non-current | | | Current | | Non-current | | Current | | Non-current | ||||||||||||
Derivatives not designated as hedge accounting | | | | | | | | | | | | | | | |||||||||||||||
Foreign exchange and interest rate risk | | | | | | | | | | | | | | | |||||||||||||||
CDI & TJLP vs. US$ fixed and floating rate swap | | | 132 | | | 1 | | | 69 | | | – | | | | 9 | | – | | 38 | | – | |||||||
IPCA swap | | | 7 | | | 61 | | | 2 | | | 16 | | | | 7 | | 84 | | 9 | | 82 | |||||||
Eurobonds swap | | – | | 4 | | – | | 27 | |||||||||||||||||||||
Pré-dolar swap | | | 1 | | | 23 | | | – | | | – | | | | 19 | | 1 | | 22 | | 32 | |||||||
| | | | | | | | | | | | | | | | | | | ||||||||||||
| | | 140 | | | 85 | | | 71 | | | 16 | | | | 35 | | 89 | | 69 | | 141 | ||||||||
Commodities price risk | | | | | | | | | | | | | | | |||||||||||||||
Nickel | | | 4 | | | 2 | | | 50 | | | 11 | | | | 2 | | – | | 22 | | 3 | |||||||
Bunker oil | | | 130 | | | – | | | – | | | – | | | | 1 | | – | | 15 | | – | |||||||
| | | | | | | | | | | | | | | | | | | ||||||||||||
| | | 134 | | | 2 | | | 50 | | | 11 | | | | 3 | | – | | 37 | | 3 | ||||||||
Others | | | – | | | 359 | | | – | | | 66 | | | |||||||||||||||
Others (note 34) | | 1 | | 303 | | – | | 309 | |||||||||||||||||||||
| | | | | | | | | | | | | | | | | | | ||||||||||||
| | | – | | | 359 | | | – | | | 66 | | | | 1 | | 303 | | – | | 309 | ||||||||
| | | | | | | | | | | | | | | | | | | ||||||||||||
Total | | | 274 | | | 446 | | | 121 | | | 93 | | | | 39 | | 392 | | 106 | | 453 | |||||||
| | | | | | | | | | | | | | | | | | | | |||||||||||
| | | | | | | | | | | | | | | | | | | ||||||||||||
| | | Liabilities | | | Liabilities | ||||||||||||||||||||||||
|---|---|---|---|---|---|---|---|---|---|---|---|---|---|---|---|---|---|---|---|---|---|---|---|---|---|---|---|---|---|
| | | December 31, 2016 | | December 31, 2015 | | | December 31, 2018 | | December 31, 2017 | ||||||||||||||||||||
| | | Current | | Non-current | | Current | | Non-current | | | Current | | Non-current | | Current | | Non-current | ||||||||||||
Derivatives not designated as hedge accounting | | | | | | | | | | | | | | | |||||||||||||||
Foreign exchange and interest rate risk | | | | | | | | | | | | | | | |||||||||||||||
CDI & TJLP vs. US$ fixed and floating rate swap | | | 293 | | | 638 | | | 799 | | | 1,131 | | | | 383 | | 98 | | 95 | | 410 | |||||||
IPCA swap | | | 20 | | | 57 | | | 21 | | | 101 | | | | 35 | | 47 | | | 41 | ||||||||
Eurobonds swap | | | 7 | | | 45 | | | 146 | | | 29 | | | | 5 | | – | | 4 | | – | |||||||
Euro Forward | | | 46 | | | – | | | – | | | – | | | |||||||||||||||
Pre dollar swap | | | 5 | | | 32 | | | 93 | | | 72 | | | |||||||||||||||
Pré-dolar swap | | 10 | | 18 | | 5 | | 24 | |||||||||||||||||||||
| | | | | | | | | | | | | | | | | | | ||||||||||||
| | | 371 | | | 772 | | | 1,059 | | | 1,333 | | | | 433 | | 163 | | 104 | | 475 | ||||||||
Commodities price risk | | | | | | | | | | | | | | | |||||||||||||||
Nickel | | | 5 | | | 2 | | | 40 | | | 10 | | | | 8 | | 2 | | – | | – | |||||||
Bunker oil | | | 38 | | | – | | | 924 | | | – | | | | 29 | | – | | – | | – | |||||||
| | | | | | | | | | | | | | | | | | | ||||||||||||
| | | 43 | | | 2 | | | 964 | | | 10 | | | | 37 | | 2 | | – | | – | ||||||||
Others | | | – | | | 451 | | | – | | | 227 | | | |||||||||||||||
| | | | | | | | | | | ||||||||||||||||||||
| | | – | | | 451 | | | – | | | 227 | | | ||||||||||||||||
Derivatives designated as cash flow hedge accounting | | | | | | | | | | | |||||||||||||||||||
Bunker oil | | | – | | | – | | | 50 | | | – | | | |||||||||||||||
Foreign exchange | | | – | | | – | | | 3 | | | – | | | |||||||||||||||
Others (note 34) | | – | | 179 | | – | | 211 | |||||||||||||||||||||
| | | | | | | | | | | | | | | | | | | ||||||||||||
| | | – | | | – | | | 53 | | | – | | | | – | | 179 | | – | | 211 | ||||||||
| | | | | | | | | | | | | | | | | | | ||||||||||||
Total | | | 414 | | | 1,225 | | | 2,076 | | | 1,570 | | | | 470 | | 344 | | 104 | | 686 | |||||||
| | | | | | | | | | | | | | | | | | | | |||||||||||
| | | | | | | | | | | | | | | | | | | ||||||||||||
| | | | |
| | F-72 | | |
![]()
Notes to the Financial Statements (Continued)
Expressed in millions of United States dollar, unless otherwise stated
25. Derivative financial instruments (Continued)
b) Effects of derivatives on the income statement, cash flow and other comprehensive income
| | | Year ended December 31 | | | Gain (loss) recognized in the income statement | | |||||||||||||||||||||||||||||||||||||||||||||||
|---|---|---|---|---|---|---|---|---|---|---|---|---|---|---|---|---|---|---|---|---|---|---|---|---|---|---|---|---|---|---|---|---|---|---|---|---|---|---|---|---|---|---|---|---|---|---|---|---|---|---|---|---|---|
| | | Gain (loss) recognized in the income statement | | Financial settlement inflows(outflows) | | Gain(loss) recognized in other comprehensive income | | | Year ended December 31 | | |||||||||||||||||||||||||||||||||||||||||||
| | | 2016 | | 2015 | | 2014 | | 2016 | | 2015 | | 2014 | | 2016 | | 2015 | | 2014 | | | 2018 | | 2017 | | 2016 | | |||||||||||||||||||||||||||
Derivatives not designated as hedge accounting | | | | | | | | | | | | | | | | | | | | | | | | | |||||||||||||||||||||||||||||
Foreign exchange and interest rate risk | | | | | | | | | | | | | | | | | | | | | | | | | |||||||||||||||||||||||||||||
CDI & TJLP vs. US$ fixed and floating rate swap | | | 869 | | | (1,172 | ) | | (437 | ) | | (513 | ) | | (330 | ) | | 4 | | | – | | | – | | | – | | | | (206 | ) | 152 | | 869 | | |||||||||||||||||
IPCA swap | | | 78 | | | (61 | ) | | (58 | ) | | (25 | ) | | 7 | | | – | | | – | | | – | | | – | | | | (23 | ) | 43 | | 78 | | |||||||||||||||||
Eurobonds swap | | | (19 | ) | | (130 | ) | | (160 | ) | | (142 | ) | | (13 | ) | | 10 | | | – | | | – | | | – | | | | (27 | ) | 36 | | (19 | ) | |||||||||||||||||
Euro forward | | | (46 | ) | | – | | | – | | | – | | | – | | | – | | | – | | | – | | | – | | | | – | | 46 | | (46 | ) | |||||||||||||||||
Pre dollar swap | | | 77 | | | (139 | ) | | (28 | ) | | (90 | ) | | (42 | ) | | 7 | | | – | | | – | | | – | | | ||||||||||||||||||||||||
Pré-dolar swap | | (23 | ) | 36 | | 77 | | ||||||||||||||||||||||||||||||||||||||||||||||
| | | | | | | | | | | | | | | | | | | | | | | | | | | | |||||||||||||||||||||||||||
| | | 959 | | | (1,502 | ) | | | (683 | ) | | | (770 | ) | | | (378 | ) | | | 21 | | | – | | | – | | | – | | | | (279 | ) | 313 | | 959 | | ||||||||||||||
Commodities price risk | | | | | | | | | | | | | | | | | | | | | | | | | |||||||||||||||||||||||||||||
Nickel | | | (42 | ) | | (49 | ) | | 9 | | | (30 | ) | | (62 | ) | | 12 | | | – | | | – | | | – | | | | (25 | ) | 30 | | (42 | ) | |||||||||||||||||
Bunker oil | | | 268 | | | (742 | ) | | (533 | ) | | (799 | ) | | (270 | ) | | (90 | ) | | – | | | – | | | – | | | | 6 | | (80 | ) | 268 | | |||||||||||||||||
| | | | | | | | | | | | | | | | | | | | | | | | | | | | |||||||||||||||||||||||||||
| | | 226 | | | (791 | ) | | | (524 | ) | | | (829 | ) | | | (332 | ) | | | (78 | ) | | | – | | | – | | | – | | | | (19 | ) | (50 | ) | 226 | | |||||||||||||
Others | | | 74 | | | (142 | ) | | | (5 | ) | | | – | | | – | | | – | | | – | | | – | | | – | | | | 32 | | 191 | | 74 | | |||||||||||||||
Derivatives designated as cash flow hedge accounting | | | | | | | | | | | | | | | | | | | | | | | | | |||||||||||||||||||||||||||||
Bunker oil | | | – | | | (439 | ) | | (81 | ) | | – | | | (450 | ) | | (81 | ) | | – | | | 435 | | | (423 | ) | | ||||||||||||||||||||||||
Foreign exchange | | | (3 | ) | | (42 | ) | | (41 | ) | | (3 | ) | | (42 | ) | | (41 | ) | | 2 | | | 17 | | | 8 | | | | – | | – | | (3 | ) | |||||||||||||||||
| | | | | | | | | | | | | | | | | | | | | | | | | | | | |||||||||||||||||||||||||||
| | | (3 | ) | | | (481 | ) | | | (122 | ) | | | (3 | ) | | | (492 | ) | | | (122 | ) | | | 2 | | | 452 | | | (415 | ) | | | – | | – | | (3 | ) | ||||||||||||
| | | | | | | | | | | | | | | | | | | | | | | | | | | | |||||||||||||||||||||||||||
Total | | | 1,256 | | | (2,916 | ) | | | (1,334 | ) | | | (1,602 | ) | | | (1,202 | ) | | | (179 | ) | | | 2 | | | 452 | | | (415 | ) | | | (266 | ) | 454 | | 1,256 | | ||||||||||||
| | | | | | | | | | | | | | | | | | | | | | | | | | | | | ||||||||||||||||||||||||||
| | | | | | | | | | | | | | | | | | | | | | | | | | | | |||||||||||||||||||||||||||
During 2015,
| | | Financial settlement inflows (outflows) | | ||||
|---|---|---|---|---|---|---|---|
| | | Year ended December 31 | | ||||
| | | 2018 | | 2017 | | 2016 | |
Derivatives not designated as hedge accounting | | | | | |||
Foreign exchange and interest rate risk | | | | | |||
CDI & TJLP vs. US$ fixed and floating rate swap | | (135 | ) | (181 | ) | (513 | ) |
IPCA swap | | 7 | | (20 | ) | (25 | ) |
Eurobonds swap | | (3 | ) | (39 | ) | (142 | ) |
Pré-dolar swap | | 10 | | (1 | ) | (90 | ) |
| | | | | | | | |
| | (121 | ) | (241 | ) | (770 | ) | |
Commodities price risk | | | | | |||
Nickel | | 8 | | 4 | | (30 | ) |
Bunker oil | | 49 | | (3 | ) | (799 | ) |
| | | | | | | | |
| | 57 | | 1 | | (829 | ) | |
Others | | (3 | ) | – | | – | |
Derivatives designated as cash flow hedge accounting | | | | | |||
Foreign exchange | | – | | – | | (3 | ) |
| | | | | | | | |
| | – | | – | | (3 | ) | |
| | | | | | | | |
Total | | (67 | ) | (240 | ) | (1,602 | ) |
| | | | | | | | |
| | | | |
| | F-73 | | |
![]()
Notes to the Company implemented bunker oil purchase cash flows protection program and recognized as costFinancial Statements (Continued)
Expressed in millions of goods sold and services rendered andUnited States dollar, unless otherwise stated
25. Derivative financial expense the amounts of US$439 and US$2,477, respectively. In 2016, all derivatives impacts were charged to financial results.instruments (Continued)
| | | Gain (loss) recognized in other comprehensive income | ||||
|---|---|---|---|---|---|---|
| | | Year ended December 31 | ||||
| | | 2018 | | 2017 | | 2016 |
Derivatives designated as cash flow hedge accounting | | | | |||
Foreign exchange | | – | | – | | 2 |
| | | | | | | |
Total | | – | | – | | 2 |
| | | | | | | |
| | | | | | | |
| | | | | | | |
The maturity dates of the derivative financial instruments are as follows:
| | | Last maturity dates |
|---|---|---|
Currencies and interest rates | ||
| | December |
Bunker oil | | June 2019 |
| Nickel | | December |
Others | | December 2027 |
c) Hedge in foreign operations
As at December 31, 2018 the carrying value of the debts designated as instrument hedge of the Company's investment in foreign operations (Vale International S.A. and Vale International Holding GmbH; hedging objects) are US$2,467 and EUR750, respectively. The foreign exchange losses of US$823 (US$543, net of taxes) and US$144 (US$95, net of taxes), were recognized for the year ended December 31, 2018 and 2017, respectively in the "Cumulative translation adjustments" in stockholders' equity. This hedge was highly effective throughout the year ended December 31, 2018.
Accounting policy
The Company uses financial instruments to hedge its exposure to certain market risks arising from operational, financing and investing activities. Derivatives are included within financial assets or liabilities at fair value through profit or loss unless they are designated as effective hedging instruments.
At the beginning of the hedge operations, the Company documents the type of hedge, the relation between the hedging instrument and hedged items, its risk management objective and strategy for undertaking hedge operations. The Company also documents, both at hedge inception and on an ongoing basis that the hedge is expected to continue to be highly effective. The Company adopts the hedge accounting procedure and designates certain derivatives as shows below:
Cash flow hedge—The effective portion of changes in the fair value of derivatives that are designated and qualify as cash flow hedges is recognized in equity within "Unrealized fair value gain (losses)". The gain or loss relating to the ineffective portion is recognized immediately in the income statement. When a hedging instrument expires or is sold, or when a hedge no longer meets the criteria for hedge accounting, any cumulative gain or loss existing in equity at that time remains in equity and is recognized in profit or loss when the transaction is recognized in the income statement.
| | | | |
| | F-74 | | |
![]()
Notes to the Financial Statements (Continued)
Expressed in millions of United States dollar, unless otherwise stated
25. Derivative financial instruments (Continued)
Accounting policyNet investment hedge—Hedges of net investments in foreign operations are accounted for similarly to cash flow hedges. Any gain or loss on the hedging instrument relating to the effective portion of the hedge is recognized in equity within "Cumulative translation adjustments". The gain or loss relating to the ineffective portion is recognized immediately in the income statement. Gains and losses accumulated in equity are included in the statement of income when the foreign operation is partially or fully disposed of or sold.
Derivatives transactions which are not qualified as hedge accounting are presented as economic hedge, as the Company usesat fair value through profit or loss—Certain derivative instruments to manage its financial risks as a way of hedging against these risks. Derivative financial instruments are recognized as assets or liabilities in the balance sheet and are measured at their fair values.do not qualify for hedge accounting. Changes in the fair valuesvalue of derivativesany of these derivative instruments are recordedrecognized immediately in the income statement or in stockholders' equity when the transaction is eligible to be characterized as effective hedge accounting.statement.
On the beginning of the hedge accounting operations, 26. Provisions
| | | Current liabilities | | Non-current liabilities | ||||
|---|---|---|---|---|---|---|---|---|
| | | December 31, 2018 | | December 31, 2017 | | December 31, 2018 | | December 31, 2017 |
Payroll, related charges and other remunerations | | 1,046 | | 1,101 | | – | | – |
Onerous contracts | | 60 | | 102 | | 642 | | 364 |
Environmental obligations(i) | | 100 | | 30 | | 202 | | 79 |
Asset retirement obligations (note 27) | | 85 | | 87 | | 3,030 | | 3,081 |
Provisions for litigation (note 28) | | – | | – | | 1,357 | | 1,473 |
Employee postretirement obligations (note 29) | | 72 | | 74 | | 1,864 | | 2,030 |
| | | | | | | | | |
Provisions | | 1,363 | | 1,394 | | 7,095 | | 7,027 |
| | | | | | | | | |
| | | | | | | | | |
| | | | | | | | | |
The effective components of changesrecognized an obligation in the fair values of derivative financial instruments designated as cash flow hedges are recorded as unrealized fair value gain or losses and recognized in stockholders' equity; and their non-effective components recorded in income statement. The amounts recorded in the statement of comprehensive income, will only be transferred to income statement (costs, operating expenses or financial expenses) when the hedged item is actually realized.
Additional information about derivatives financial instruments
In millions of United States dollars, except as otherwise stated
The risk of the derivatives portfolio is measured using the delta-Normal parametric approach, and considers that the future distribution of the risk factors and its correlations tends to present the same statistic properties verified in the historical data. The value at risk estimate considers a 95% confidence level for a one-business day time horizon.
There was no cash amount deposited as margin call regarding derivative positions on December 31, 2016. The derivative positions described in this document did not have initial costs associated.
The following tables detail the derivatives positions for Vale and its controlled companies as of December 31, 2016, with the following information: notional amount, fair value including credit risk, gains or losses in the period, value at risk and the fair value breakdown by year of maturity.
a) Foreign exchange and interest rates derivative positions
(i) Protection programs for the R$ denominated debt instruments
In order to reduce cash flow volatility, swap transactions were implemented to convert into US$ the cash flows from certain debt instruments denominated in R$ with interest rates linked mainly to CDI, TJLP and IPCA. In those swaps, Vale pays fixed or floating rates in US$ and receives payments in R$ linked to the interest rates of the protected debt instruments.
![]()
Notes to the Financial Statements (Continued)
Expressed in millions of United States dollar, unless otherwise stated
25. Derivative financial instruments (Continued)
The swap transactions were negotiated over-the-counter and the protected items are the cash flows from debt instruments linked to R$. These programs transform into US$ the obligations linked to R$ to achieve a currency offset in the Company's cash flows, by matching its receivables–mainly linked to US$–with its payables.
| | | | | | | | | | | | | | | Financial Settlement Inflows (Outflows) | | | | | | | | | | ||||||||||||||||||||||||||||||
|---|---|---|---|---|---|---|---|---|---|---|---|---|---|---|---|---|---|---|---|---|---|---|---|---|---|---|---|---|---|---|---|---|---|---|---|---|---|---|---|---|---|---|---|---|---|---|---|---|---|---|---|---|---|
| | | Notional | | | | | | Fair value | | Value at Risk | | | | | | | | ||||||||||||||||||||||||||||||||||||
| | | | | | | Fair value by year | | ||||||||||||||||||||||||||||||||||||||||||||||
| | | December 31, 2016 | | December 31, 2015 | | | | | | December 31, 2016 | | December 31, 2015 | | December 31, 2016 | | December 31, 2016 | | ||||||||||||||||||||||||||||||||||||
Flow | | Index | | Average rate | | 2017 | | 2018 | | 2019+ | | ||||||||||||||||||||||||||||||||||||||||||
CDI vs. US$ fixed | | | | | | | | | | | | | (121 | ) | | | (783 | ) | | | (314 | ) | | | 39 | | | | 48 | | | | (170 | ) | | | – | | | ||||||||||||||
Receivable | | | R$ | 6.289 | | | | R$ | 5.239 | | | CDI | | | 106,78 | % | | | | | | | | | | | | | | | | | | | | | | | |||||||||||||||
Payable | | | US$ | 2.105 | | | | US$ | 2.288 | | | Fix | | | 3,78 | % | | | | | | | | | | | | | | | | | | | | | | | |||||||||||||||
TJLP vs. US$ fixed | | | | | | | | | | | | | (622 | ) | | | (1.015 | ) | | | (197 | ) | | | 62 | | | | (207 | ) | | | (102 | ) | | | (313 | ) | | ||||||||||||||
Receivable | | | R$ | 4.360 | | | | R$ | 5.484 | | | TJLP + | | | 1,32 | % | | | | | | | | | | | | | | | | | | | | | | | |||||||||||||||
Payable | | | US$ | 2.030 | | | | US$ | 2.611 | | | Fix | | | 1,69 | % | | | | | | | | | | | | | | | | | | | | | | | |||||||||||||||
TJLP vs. US$ | | | | | | | | | | | | | (55 | ) | | | (63 | ) | | | (2 | ) | | | 5 | | | | (3 | ) | | | (5 | ) | | | (47 | ) | | ||||||||||||||
Receivable | | | R$ | 242 | | | | R$ | 267 | | | TJLP + | | | 0,86 | % | | | | | | | | | | | | | | | | | | | | | | | |||||||||||||||
Payable | | | US$ | 140 | | | | US$ | 156 | | | Libor + | | | –1,23 | % | | | | | | | | | | | | | | | | | | | | | | | |||||||||||||||
R$ fixed rate vs. | | | | | | | | | | | | | (13 | ) | | | (165 | ) | | | (90 | ) | | | 23 | | | | (4 | ) | | | 13 | | | | (22 | ) | | ||||||||||||||
Receivable | | | R$ | 1.031 | | | | R$ | 1.356 | | | Fix | | | 7,69 | % | | | | | | | | | | | | | | | | | | | | | | | |||||||||||||||
Payable | | | US$ | 343 | | | | US$ | 528 | | | Fix | | | –0,73 | % | | | | | | | | | | | | | | | | | | | | | | | |||||||||||||||
IPCA vs. US$ | | | | | | | | | | | | | (51 | ) | | | (105 | ) | | | 1 | | | | 11 | | | | 7 | | | | 5,7 | | | | (64 | ) | | ||||||||||||||
Receivable | | | R$ | 1.000 | | | | R$ | 1.000 | | | IPCA + | | | 6,55 | % | | | | | | | | | | | | | | | | | | | | | | | |||||||||||||||
Payable | | | US$ | 434 | | | | US$ | 434 | | | Fix | | | 3,98 | % | | | | | | | | | | | | | | | | | | | | | | | |||||||||||||||
IPCA vs. CDI | | | | | | | | | | | | | 42 | | | | 2 | | | | (26 | ) | | | 0,4 | | | | (20 | ) | | | (8 | ) | | | 70 | | | ||||||||||||||
Receivable | | | R$ | 1.350 | | | | R$ | 1.350 | | | IPCA + | | | 6,62 | % | | | | | | | | | | | | | | | | | | | | | | | |||||||||||||||
Payable | | | R$ | 1.350 | | | | R$ | 1.350 | | | CDI | | | 98,58 | % | | | | | | | | | | | | | | | | | | | | | | | |||||||||||||||
(ii) Protection program for EUR denominated debt instruments
In order to reduce the cash flow volatility, swap and forward transactions were implemented to convert into US$ the cash flows from certain debt instruments issued in Euros by Vale. In those swaps, Vale receives fixed rates in EUR and pays fixed rates in US$. And in those forwards only the principal amount of the debt is converted from EURUS$229 related to US$.
![]()
Notes to the Financial Statements (Continued)
Expressed in millions of United States dollar, unless otherwise stated
25. Derivative financial instruments (Continued)
The swap and forward transactions were negotiated over-the-counter and the protected items are the cash flows from debt instruments linked to EUR. The financial settlement inflows/outflows are offset by the protected items' losses/gains due to EUR/US$ exchange rate.
| | | | | | | | | | | | | | | Financial Settlement Inflows (Outflows) | | | | | | | | |
|---|---|---|---|---|---|---|---|---|---|---|---|---|---|---|---|---|---|---|---|---|---|---|
| | | Notional | | | | | | Fair value | | Value at Risk | | Fair value by year | ||||||||||
| | | December 31, 2016 | | December 31, 2015 | | | | | | December 31, 2016 | | December 31, 2015 | | December 31, 2016 | | December 31, 2016 | ||||||
Flow | | Index | | Average rate | | 2017 | | 2018 | | 2019+ | ||||||||||||
EUR fixed rate vs. US$ fixed rate swap | | | | | | (52) | | (175) | | (142) | | 10 | | (7) | | (6) | | (39) | ||||
Receivable | | €500 | | €1.000 | | Fix | | 3,75% | | | | | | | | |||||||
Payable | | US$613 | | US$1.302 | | Fix | | 4,29% | | | | | | | | |||||||
| | | | | | | | | | | | | | | Financial Settlement Inflows (Outflows) | | | | |
|---|---|---|---|---|---|---|---|---|---|---|---|---|---|---|---|---|---|---|
| | | Notional | | | | | | Fair value | | Value at Risk | | Fair value by year | ||||||
| | | December 31, 2016 | | December 31, 2015 | | Bought/ Sold | | Average rate (USD/EUR) | | December 31, 2016 | | December 31, 2015 | | December 31, 2016 | | December 31, 2016 | ||
Flow | | 2017 | ||||||||||||||||
Forwards | | €500 | | – | | B | | 1,143 | | (46) | | – | | – | | 5,8 | | (46) |
(iii) Foreign exchange hedging program for disbursements in CAD
In order to reduce the cash flow volatility, forward transactions were implemented to mitigate the foreign exchange exposurecertain environmental obligation that arisesbecame effective from the currency mismatch between revenues denominated in US$ and disbursements denominated in CAD.
The forward transactions were negotiated over-the-counter and the protected item is part of the CAD denominated disbursements. The financial settlement inflows/outflows are offset by the protected items' losses/gains due to CAD/US$ exchange rate. This program is classified under the hedge accounting requirements, and it was settled in the first quarter of 2016.
| | | | | | | | | | | | | | | Financial Settlement Inflows (Outflows) | | | | |
|---|---|---|---|---|---|---|---|---|---|---|---|---|---|---|---|---|---|---|
| | | Notional | | | | | | Fair value | | Value at Risk | | Fair value by year | ||||||
| | | December 31, 2016 | | December 31, 2015 | | Bought/ Sold | | Average rate (CAD/USD) | | December 31, 2016 | | December 31, 2015 | | December 31, 2016 | | December 31, 2016 | ||
Flow | | 2017 | ||||||||||||||||
Forwards | | – | | CAD 10 | | B | | 1,028 | | – | | (3) | | (3) | | – | | – |
b) Commodities derivative positions
(i) Bunker Oil purchase cash flows protection program
In order to reduce the impact of bunker oil price fluctuation on maritime freight hiring/supply and, consequently, reducing the company's cash flow volatility, bunker oil derivatives were implemented. These transactions are usually executed through forward purchases and zero cost-collars.
![]()
Notes to the Financial Statements (Continued)
Expressed in millions of United States dollar, unless otherwise stated
25. Derivative financial instruments (Continued)
The derivative transactions were negotiated over-the-counter and the protected item is part of the Vale's costs linked to bunker oil prices. The financial settlement inflows/outflows are offset by the protected items' losses/gains due to bunker oil prices changes.
| | | | | | | | | | | | | | | Financial Settlement Inflows (Outflows) | | | | |
|---|---|---|---|---|---|---|---|---|---|---|---|---|---|---|---|---|---|---|
| | | Notional (ton) | | | | | | Fair value | | Value at Risk | | Fair value by year | ||||||
| | | December 31, 2016 | | December 31, 2015 | | Bought/ Sold | | Average rate (CAD/USD) | | December 31, 2016 | | December 31, 2015 | | December 31, 2016 | | December 31, 2016 | ||
Flow | | 2017 | ||||||||||||||||
Bunker Oil protection | | | | | | | | | | |||||||||
Forwards | | 0 | | 1.867.500 | | B | | 0 | | – | | (577) | | (536) | | – | | – |
Call options | | 2.856.000 | | 2.041.500 | | B | | 324 | | 130 | | 0 | | – | | 28 | | 130 |
Put options | | 2.856.000 | | 2.041.500 | | S | | 213 | | (14) | | (297) | | (185) | | 3 | | (14) |
| | | | | | | | | | | | | | | | | | | |
Total | | | | | | 116 | | (873) | | | | 116 | ||||||
| | | | | | | | | | | | | | | | | | | |
As at December 31, 2016 and 2015, excludes US$24 and US$101, respectively, of transactions in which the financial settlement occurs subsequently of the closing month.
(ii) Protection programs for base metals raw materials and products
In the operational protection program for nickel sales at fixed prices, derivatives transactions were implemented to convert into floating prices the contracts with clients that required a fixed price, in order to keep nickel revenues exposed to nickel price fluctuations. Those operations are usually implemented through the purchase of nickel forwards.
In the operational protection program for the purchase of raw materials and products, derivatives transactions were implemented, usually through the sale of nickel and copper forward or futures, in order to reduce the mismatch between the pricing period of purchases (concentrate, cathode, sinter, scrap and others) and the pricing period of the final product sales to the clients.
The derivative transactions are negotiated at London Metal Exchange or over-the-counter and the protected item is part of Vale's revenues and costs linked to nickel and copper prices. The financial settlement inflows/outflows are offset by the protected items' losses/gains due to nickel and copper prices changes.
| | | | | | | | | | | | | | | Financial Settlement Inflows (Outflows) | | | | | | |
|---|---|---|---|---|---|---|---|---|---|---|---|---|---|---|---|---|---|---|---|---|
| | | Notional (ton) | | | | | | Fair value | | Value at Risk | | Fair value by year | ||||||||
| | | December 31, 2016 | | December 31, 2015 | | Bought/ Sold | | Average strike (US$/ton) | | December 31, 2016 | | December 31, 2015 | | December 31, 2016 | | December 31, 2016 | ||||
Flow | | 2017 | | 2018 | ||||||||||||||||
Fixed price sales protection | | | | | | | | | ||||||||||||
Nickel forwards | | 11.615 | | 16.917 | | B | | 10.156 | | (1) | | (46) | | (30) | | 4 | | (3) | | 3 |
Raw material purchase protection | | | | | | | | | ||||||||||||
Nickel forwards | | 134 | | 118 | | S | | 10.823 | | 0,11 | | 0,10 | | (0,18) | | 0,04 | | 0,11 | | – |
Copper forwards | | 441 | | 385 | | S | | 5.207 | | (0,14) | | 0,09 | | 0,04 | | 0,06 | | (0,14) | | – |
| | | | | | | | | | | | | | | | | | | | | |
Total | | | | | | (0,03) | | 0,19 | | | | (0,03) | | – | ||||||
| | | | | | | | | | | | | | | | | | | | | |
![]()
Notes to the Financial Statements (Continued)
Expressed in millions of United States dollar, unless otherwise stated
25. Derivative financial instruments (Continued)
c) Silver Wheaton Corp. warrants
The company owns warrants of Silver Wheaton Corp. (SLW), a Canadian company with stocks negotiated in Toronto Stock Exchange and New York Stock Exchange. Such warrants configure American call options and were received as part of the payment regarding the sale of part of gold payable flows produced as a sub product from Salobo copper mine and some nickel mines in Sudbury.
| | | | | | | | | | | | | | | Financial Settlement Inflows (Outflows) | | | | |
|---|---|---|---|---|---|---|---|---|---|---|---|---|---|---|---|---|---|---|
| | | Notional (quantity) | | | | | | Fair value | | Value at Risk | | Fair value by year | ||||||
| | | December 31, 2016 | | December 31, 2015 | | Bought/ Sold | | Average strike (US$/share) | | December 31, 2016 | | December 31, 2015 | | December 31, 2016 | | December 31, 2016 | ||
Flow | | 2023 | ||||||||||||||||
Call options | | 10.000.000 | | 10.000.000 | | B | | 44 | | 44 | | 7 | | – | | 5 | | 44 |
d) Call options from debentures
The company has debentures in which lenders have call options of a specified quantity of Ferrovia Norte Sul ordinary shares, later changed to VLI SA shares. The call option's strike price is given by the debentures' remaining notional in each exercise date.
| | | | | | | | | | | | | | | Financial Settlement Inflows (Outflows) | | | | |
|---|---|---|---|---|---|---|---|---|---|---|---|---|---|---|---|---|---|---|
| | | Notional (quantity) | | | | | | Fair value | | Value at Risk | | Fair value by year | ||||||
| | | December 31, 2016 | | December 31, 2015 | | Bought/ Sold | | Average strike (R$/share) | | December 31, 2016 | | December 31, 2015 | | December 31, 2016 | | December 31, 2016 | ||
Flow | | 2027 | ||||||||||||||||
Call options | | 140.239 | | 140.239 | | S | | 8.419 | | (72) | | (39) | | – | | 5 | | (72) |
(e) Options related to Minerações Brasileiras Reunidas S.A. ("MBR") shares
The Company entered into a contract that has options related to MBR shares. Under certain restrict and contingent conditions, which are beyond the buyer's control, such as illegalitycurrent year due to changes in the law, the contract has a clause that gives the buyer the right to sell back its stake to the Company. It this case, the Company could settle through cash or shares. On the other hand, the Company has the right to buy back this non-controlling interestregulation in the subsidiary.
| | | | |
| | F-75 | | |
| | | | | | | | | | | | | | | Financial settlement Inflows (Outflows) | | | | |
|---|---|---|---|---|---|---|---|---|---|---|---|---|---|---|---|---|---|---|
| | | Notional (quantity, in millions) | | | | | | Fair value | | Value at Risk | | Fair value by year | ||||||
| | | December 3, 2016 | | December 31, 2015 | | Bought / Sold | | Average strike (R$/share) | | December 31, 2016 | | December 31, 2015 | | December 31, 2016 | | December 31, 2016 | ||
Flow | | 2017+ | ||||||||||||||||
Options | | 2.139 | | 2.139 | | B/S | | 1,8 | | 120 | | 15 | | – | | 11 | | 120 |
![]()
Notes to the Financial Statements (Continued)
Expressed in millions of United States dollar, unless otherwise stated
25. Derivative financial instruments (Continued)
f) Embedded derivatives in contracts
The Company has some nickel concentrate and raw materials purchase agreements in which there are provisions based on nickel and copper future prices behavior. These provisions are considered as embedded derivatives.
| | | | | | | | | | | | | | | Financial settlement Inflows (Outflows) | | | | |
|---|---|---|---|---|---|---|---|---|---|---|---|---|---|---|---|---|---|---|
| | | Notional (ton) | | | | | | Fair value | | Value at Risk | | Fair value by year | ||||||
| | | December 31, 2016 | | December 31, 2015 | | Bought / Sold | | Average strike (US$/ton) | | December 31, 2016 | | December 31, 2015 | | December 31, 2016 | | December 31, 2016 | ||
Flow | | 2017 | ||||||||||||||||
Nickel forwards | | 5.626 | | 3.877 | | S | | 10.950 | | 0,3 | | 3,0 | | | | 0,3 | ||
Copper forwards | | 3.684 | | 5.939 | | S | | 5.249 | | 1,5 | | 2,0 | | | | 1,5 | ||
| | | | | | | | | | | | | | | | | | | |
Total | | | | | | 1,9 | | 5,0 | | – | | 2,5 | | 1,9 | ||||
| | | | | | | | | | | | | | | | | | | |
The Company has also a natural gas purchase agreement in which there is a clause that defines that a premium can be charged if the Company's pellet sales prices trade above a pre-defined level. This clause is considered an embedded derivative.
| | | | | | | | | | | | | | | Financial settlement Inflows (Outflows) | | | | | | |
|---|---|---|---|---|---|---|---|---|---|---|---|---|---|---|---|---|---|---|---|---|
| | | Notional (volume/month) | | | | | | Fair value | | Value at Risk | | Fair value by year | ||||||||
| | | December 31, 2016 | | December 31, 2015 | | Bought / Sold | | Average strike (US$/ton) | | December 31, 2016 | | December 31, 2015 | | December 31, 2016 | | December 31, 2016 | ||||
Flow | | 2017 | | 2018+ | ||||||||||||||||
Call options | | 746.667 | | 746.667 | | S | | 179 | | (2,0) | | – | | – | | 1,3 | | (0,0) | | (2,0) |
In August 2014 the Company sold part of its stake in VLI to an investment fund managed by Brookfield Asset Management ("Brookfield"). The sales contract includes a clause that establishes, under certain conditions, a minimum return guarantee on Brookfield's investment. This clause is considered an embedded derivative, with payoff equivalent to that of a put option and estimated pricing based on our own model and assumptions.
| | | | | | | | | | | | | | | Financial settlement Inflows (Outflows) | | | | |
|---|---|---|---|---|---|---|---|---|---|---|---|---|---|---|---|---|---|---|
| | | Notional (quantity) | | | | | | Fair value | | Value at Risk | | Fair value by year | ||||||
| | | December 31, 2016 | | December 31, 2015 | | Bought / Sold | | Average strike (R$/share) | | December 31, 2016 | | December 31, 2015 | | December 31, 2016 | | December 31, 2016 | ||
Flow | | 2027 | ||||||||||||||||
Put option | | 1.105.070.863 | | 1.105.070.863 | | S | | 3,07 | | (182) | | (141) | | – | | 14 | | (182) |
For sensitivity analysis of derivative financial instruments, Financial counterparties' ratings and market curves please see note 33.
![]()
Notes to the Financial Statements (Continued)
Expressed in millions of United States dollar, unless otherwise stated
26. Provisions
| | | Current liabilities | | Non-current liabilities | ||||
|---|---|---|---|---|---|---|---|---|
| | | December 31, 2016 | | December 31, 2015 | | December 31, 2016 | | December 31, 2015 |
Payroll and related charges (i) | | 725 | | 375 | | – | | – |
Onerous contracts (note 19) | | 101 | | – | | 473 | | 306 |
Environment Restoration | | 10 | | 8 | | 111 | | 46 |
Asset retirement obligations (note 27) | | 47 | | 89 | | 2,472 | | 2,385 |
Provisions for litigation (note 28) | | – | | – | | 839 | | 822 |
Employee postretirement obligations (note 29) | | 69 | | 68 | | 1,853 | | 1,750 |
| | | | | | | | | |
Provisions | | 952 | | 540 | | 5,748 | | 5,309 |
| | | | | | | | | |
| | | | | | | | | |
| | | | | | | | | |
27. Asset retirement obligations
Refers to theProvision is made for expected costs for the closure of the mines and deactivation of the related mining assets. Changes in the provision offor asset retirement obligations and long-term interest rates (per annum, used to discount these obligations to present value and to update the provisions) are as follows:
| | | December 31, 2016 | | December 31, 2015 | | December 31, 2018 | | December 31, 2017 | |
|---|---|---|---|---|---|---|---|---|---|
Balance at beginning of the year | | 2,474 | | 3,369 | | 3,168 | | 2,519 | |
| | | | | | | | | | |
Interest expense | | 115 | | 109 | |||||
Present value valuation | | 15 | | 70 | | ||||
Settlements | | (77) | | (88) | | (259 | ) | (60 | ) |
Revisions on cash flows estimates | | 230 | | (135) | | 461 | | 620 | |
Translation adjustment | | 134 | | (781) | | (270 | ) | 96 | |
Effect of discontinued operations | | | | | | ||||
Transfer to net assets held for sale | | (357) | | – | | – | | (77 | ) |
| | | | | | | | | | |
Balance at end of the year | | 2,519 | | 2,474 | | 3,115 | | 3,168 | |
| | | | | | | | | | | |
| | | | | | | | | | |
Current | | 47 | | 89 | | 85 | | 87 | |
Non-current | | 2,472 | | 2,385 | | 3,030 | | 3,081 | |
| | | | | | | | | | |
| | 2,519 | | 2,474 | | 3,115 | | 3,168 | | |
| | | | | | | | | | | |
| | | | | | | | | | |
Long-term interest rates (per annum) | | | | | | ||||
Brazil | | 5.73% | | 7.28% | | 4.94 | % | 5.34 | % |
Canada | | 0.55% | | 0.59% | | 0.77 | % | 0.57 | % |
Other regions | | 1.07% - 8.02% | | 1.12% - 5.91% | | 1.33%–8.59 | % | 0.72%–6.13 | % |
Accounting policy
The provision refers to costs related to mine closure and reclamation, with the completion of mining activities and decommissioning of assets related to mine. When the provision is recognized, the corresponding cost is capitalized as part of property, plant and equipment and it is depreciated on the same basis over the useful life of the related mining asset, and recordedresulting in an expense recognized in the income statement.
The long-term liability is subsequently measureddiscounted at presented value using a long-term risk free discount rate applicable to the liability and the unwinds are recorded in the income statement as financial expenses until the Company makesand is reduced by payments related tofor mine closure and decommissioning of mining assets.
The accrued amounts of these obligations are not deducted from the potential costs covered by insurance or indemnities.
Critical accounting estimates and judgments
Judgment is required to determine key assumptions used on the asset retirement obligation measurement such as, interest rate, cost of closure, useful life of the mining asset considering the current conditions of closure and the projected date of depletion of each mine. Any changes in these assumptions may significantly impact the recorded provision. Therefore, the estimated costs for closure of the mining assets mining.are deemed to be a critical accounting estimate. These estimates are annually reviewed.
| | | | |
| | F-76 | | |
![]()
Notes to the Financial Statements (Continued)
Expressed in millions of United States dollar, unless otherwise stated
27. Asset retirement obligations (Continued)
The accrued amounts of these obligations are not deducted from the potential costs covered by insurance or indemnities.
Critical accounting estimates and judgments
The Company applies judgment and assumptions when measuring its asset retirement obligation. The Company recognizes an obligation under the fair value for asset retirement obligations in the period in which they occur. The Company considers the accounting estimates related to closure costs of a mine as a critical accounting policy because they involve significant values for the provision and are estimated using several assumptions, such as interest rate, cost of closure useful life of the asset considering the current state of closure and the projected date of depletion of each mine. The estimates are reviewed annually.
28. Litigation
Vale is party to labor, civil, tax and other ongoing lawsuits, at administrative and court levels. Provisions for losses resulting from lawsuits are estimated and updated by the Company, based on analysis from the Company's legal consultants.
Changes in provision for litigation are as follows:
| | | Tax litigation | | Civil litigation | | Labor litigation | | Environmental litigation | | Total of litigation provision | |
|---|---|---|---|---|---|---|---|---|---|---|---|
Balance at December 31, 2016 | | 214 | | 84 | | 534 | | 7 | | 839 | |
| | | | | | | | | | | | |
Additions and reversals, net | | 22 | | 17 | | 126 | | 4 | | 169 | |
Payments | | (117 | ) | (3 | ) | (105 | ) | – | | (225 | ) |
Indexation and interest | | 10 | | 35 | | 37 | | (1 | ) | 81 | |
Translation adjustment | | (10 | ) | (2 | ) | (10 | ) | – | | (22 | ) |
Merger of Valepar (note 30)(i) | | 631 | | – | | – | | – | | 631 | |
| | | | | | | | | | | | |
Balance at December 31, 2017 | | 750 | | 131 | | 582 | | 10 | | 1,473 | |
| | | | | | | | | | | | |
Additions and reversals, net | | 17 | | 65 | | 106 | | (3 | ) | 185 | |
Payments | | (5 | ) | (23 | ) | (116 | ) | (2 | ) | (146 | ) |
Additions—discontinued operations | | 21 | | 1 | | 16 | | – | | 38 | |
Indexation and interest | | 23 | | 17 | | (7 | ) | (1 | ) | 32 | |
Translation adjustment | | (114 | ) | (25 | ) | (85 | ) | (1 | ) | (225 | ) |
| | | | | | | | | | | | |
Balance at December 31, 2018 | | 692 | | 166 | | 496 | | 3 | | 1,357 | |
| | | | | | | | | | | | |
| | | | | | | | | | | | |
| | | | | | | | | | | | |
i. Provisions for labor litigation—Consist of lawsuits filed by employees and service suppliers, related to employment relationships mainly in Brazil. The relevant claims are related to payment for overtime work, commuting time, and health and safety conditions. Also the Brazilian national social security institute ("INSS") contingencies are related to legal and administrative disputes between INSS and Vale due to applicability of compulsory social security charges.
b) Contingent liabilities
Contingent liabilities are administrative and judicial claims, with expectation of loss classified as possible, and for which the recognition of a provision is not considered necessary by the Company, based on legal advice. The contingent liabilities are as follows:
| | | Tax litigation | | Civil litigation | | Labor litigation | | Environmental litigation | | Total of litigation provision |
|---|---|---|---|---|---|---|---|---|---|---|
Balance at December 31, 2014 | | 366 | | 118 | | 706 | | 92 | | 1,282 |
| | | | | | | | | | | |
Additions | | 178 | | 55 | | 159 | | – | | 392 |
Reversals | | (199) | | (41) | | (137) | | (4) | | (381) |
Payments | | (50) | | (40) | | (65) | | (59) | | (214) |
Indexation and interest | | 52 | | 13 | | 7 | | 3 | | 75 |
Translation adjustment | | (79) | | (38) | | (223) | | (12) | | (352) |
Additions and reversals of discontinued operations | | 1 | | 12 | | 7 | | – | | 20 |
| | | | | | | | | | | |
Balance at December 31, 2015 | | 269 | | 79 | | 454 | | 20 | | 822 |
| | | | | | | | | | | |
Additions | | 23 | | 96 | | 243 | | 2 | | 364 |
Reversals | | (37) | | (63) | | (122) | | (5) | | (227) |
Payments | | (53) | | (59) | | (103) | | (5) | | (220) |
Indexation and interest | | 9 | | 16 | | 9 | | (3) | | 31 |
Translation adjustment | | 20 | | 21 | | 89 | | 5 | | 135 |
Effect of discontinued operations | | | | | | |||||
Net movements of year | | – | | (1) | | 8 | | (1) | | 6 |
Transfers to net assets held for sale | | (17) | | (5) | | (44) | | (6) | | (72) |
| | | | | | | | | | | |
Balance at December 31, 2016 | | 214 | | 84 | | 534 | | 7 | | 839 |
| | | | | | | | | | | |
| | | | | | | | | | | |
| | | | | | | | | | | |
| | | December 31, 2018 | | December 31, 2017 |
|---|---|---|---|---|
Tax litigation | | 8,641 | | 8,840 |
Civil litigation | | 1,957 | | 1,623 |
Labor litigation | | 1,475 | | 1,952 |
Environmental litigation | | 1,051 | | 2,190 |
| | | | | |
Total | | 13,124 | | 14,605 |
| | | | | |
| | | | | |
| | | | | |
| | | | |
| | F-77 | | |
![]()
Notes to the Financial Statements (Continued)
Expressed in millions of United States dollar, unless otherwise stated
28. Litigation (Continued)
i. Provisions for labor litigation—Consist of lawsuits filed by employees and service suppliers, related to employment relationships mainly in Brazil. The most recurring claims are related to payment of overtime, hours in itinerary, and health and safety. Also the social security in Brazil ("INSS") contingencies are related to legal and administrative disputes between INSS and Vale due to applicability of compulsory social security charges.
b) Contingent liabilities
Contingent liabilities of administrative and judicial claims, with expectation of loss classified as possible, and for which the recognition of a provision is not considered necessary by the Company, based on legal advice are as follows:
| | | December 31, 2016 | | December 31, 2015 |
|---|---|---|---|---|
Tax litigation | | 7,636 | | 5,326 |
Civil litigation | | 1,502 | | 1,335 |
Labor litigation | | 2,418 | | 1,866 |
Environmental litigation | | 1,871 | | 1,381 |
| | | | | |
Total | | 13,427 | | 9,908 |
| | | | | |
| | | | | |
| | | | | |
i—Tax litigation—Our most significant tax-related contingent liabilities result from disputes related to (i) the deductibility of our payments of social security contributions on the net income (CSLL)("CSLL") from our taxable income, (ii) challenges of certain tax credits we deducted from our PIS and COFINS payments, (iii) assessments of CFEM (royalties)("royalties"), and (iv) charges of value-added tax on services and circulation of goods (ICMS)("ICMS"), especially relating to certain tax credits we claimed from the sale and transmission of energy, ICMS charges to anticipate the payment in the entrance of goods to Pará State ICMSand ICMS/penalty charges on our own transportation costs and challenges to other tax credits we claimed.transportation. The changes reported in the period resulted, mainly, from the exclusion of the tax cases related to IPI, PIS and COFINS (isolated fine), IRPJ and ICMS (PRCT) and due to the new proceedings related to PIS, COFINS,IRPJ, CSLL, ICMS, CFEM;ISS and IPTU and the application interest and inflation adjustments into the amounts in dispute.disputed amounts.
ii—Civil litigation—Most of those claims have been filed by suppliers for indemnification under construction contracts, primarily relating to certain alleged damages, payments and contractual penalties. A number of other claims are related to contractual disputes regarding inflation index. The changes reported in the period resulted, mainly from reviewing the process related to commercial divergences of supply contracts.
iii—Labor litigation—Represents individual claims by employees and service providers, primarily involving demands for additional compensation for overtime work, commuting time spent commuting or health and safety conditions; and the Brazilian federalnational social security administrationinstitute ("INSS") regarding contributions on compensation programs based on profits.
iv—Environmental litigation—The most significant claims concern alleged procedural deficiencies in licensing processes, non-compliance with existing environmental licenses or damage to the environment.
![]()
Notes to the Financial Statements (Continued)
Expressed in millions of United States dollar, unless otherwise stated
28. Litigation (Continued)
c) Judicial deposits
In addition to the provisions and contingent liabilities, the Company is required by law to make judicial deposits to secure a potential adverse outcome of certain lawsuits. These court-ordered deposits are monetarily adjusted and reported as non-current assets until a judicial decision to draw the deposit occurs.
| | | December 31, 2016 | | December 31, 2015 | | December 31, 2018 | | December 31, 2017 |
|---|---|---|---|---|---|---|---|---|
Tax litigation | | 193 | | 211 | | 1,069 | | 1,201 |
Civil litigation | | 62 | | 102 | | 60 | | 60 |
Labor litigation | | 691 | | 553 | | 555 | | 712 |
Environmental litigation | | 16 | | 16 | | 32 | | 13 |
| | | | | | | | | |
Total | | 962 | | 882 | | 1,716 | | 1,986 |
| | | | | | | | | | |
| | | | | | | | | |
d) Others
For contingencies related to Samarco Mineração S.A., see note 21.
Accounting policy
A provisionBeside the deposits already made, the Company has bank guarantees for judicial deposits in the amount of US$1.5 billion. The annual cost of these guarantees is 1.5% and it is recognized when the obligation is considered probable and can be measured. The accounting counterpart for the obligation is an expense in income statement. This obligation is updated according to the evolution of the judicial process or interest incurred and can be reversed if the estimate of loss is not considered probable or settled when the obligation is paid.as "financial expenses".
Critical accounting estimates and judgments
By their nature, litigations will be resolved when one or more future event occurs or fails to occur. Typically, the occurrence or not of such events is outside the Company's control. Legal uncertainties involve the exercise of significant estimates and judgments by management regarding the results of future events.
| | | | |
| | F-78 | | |
![]()
Notes to the Financial Statements (Continued)
Expressed in millions of United States dollar, unless otherwise stated
28. Litigation (Continued)
d) Contingencies related to Samarco accident
Given the status of the contingencies related to Samarco accident, it is not possible to provide a range of possible outcomes or a reliable estimate of potential losses for Vale S.A. Consequently, no contingent liability has been quantified and no provision was recognized.
(i) Public civil claim filed by the Federal Government and others and Public civil claim filed by Federal Prosecution Office ("MPF")
In 2016, the federal government, the Brazilian states of Espírito Santo and Minas Gerais and other governmental authorities have initiated a public civil lawsuit against Samarco and its shareholders, with an estimated value indicated by the plaintiffs of US$5.2 billion (R$20.2 billion). In the same year, MPF filed a public civil action against Samarco and its shareholders and presented several claims, including: (i) the adoption of measures for mitigating the social, economic and environmental impacts resulting from the dam failure and other emergency measures; (ii) the payment of compensation to the community; and (iii) payments for the collective moral damage. The action value indicated by MPF is US$40 billion (R$155 billion).
In 2018, the parties entered into an agreement ("Term of Adjustment of Conduct"), which was determined, in summary, (i) the complete extinction of the public civil claim of US$5.2 billion (R$20.2 billion) filed by the Federal Government and others; and (ii) the partial extinction of the public civil claim of US$40 billion (R$155 billion) filed by MPF. In relation to the public civil claim of US$40 billion (R$155 billion), the parties continue to negotiate for the termination of some of their requests, as well as other lawsuits whose objects have already been included in the Term of Adjustment of Conduct.
(ii) United States class action lawsuits
Samarco and its shareholders were named as defendants in securities class action lawsuits in the Federal Court in New York, related to disclosures of risks of the operations of Samarco and others. The plaintiffs have not specified an amount of alleged damages in these actions.
(iii) Criminal lawsuit
In 2016, the MPF brought a criminal lawsuit against Samarco and its shareholders, VogBr Recursos Hídricos e Geotecnia Ltda. and 22 individuals for the consequences related to Fundão dam failure. All prosecution witnesses residing in Brazil have been heard. Currently, the criminal lawsuit awaits for a position from Judiciary and all hearings related to this action are suspended.
e) Contingent assets
In 2015, the Company filed an enforceable action in the amount of US$135 (R$524 million) referring to the final court decision in favor of the Company of the accrued interest of compulsory deposits from 1987 to 1993. Currently it is not possible to estimate the economic benefit inflow as there is a pending judicial decision. Consequently, the asset was not recognized in the financial statements.
| | | | |
| | F-79 | | |
![]()
Notes to the Financial Statements (Continued)
Expressed in millions of United States dollar, unless otherwise stated
28. Litigation (Continued)
In March 2017, the Federal Supreme Court (STF) decided that the ICMS shall not be included in PIS and COFINS tax basis. The related decision is not final because is still pending the judgment of an appeal from the Federal Government. Vale has been discussing this issue in two judicial proceedings, which are covered by taxable events occurred since December 2001. In one of them, Vale reached a favorable final judicial decision on March 18, 2019. In the other case, the Company is awaiting the application of the STF decision by Federal Regional Court of the 2nd Region. The asset was not recognized in the financial statements and the effects of the favorable final judicial decision on March 18, 2019 will be evaluated by the Company.
Accounting policy
A provision is recognized when it is considered probable that an outflow of resources will be required to settle the obligation and can be reliably estimated. The liability is accounted against an expense in the income statement. This obligation is updated based on the developments of the judicial process or interest accretion and can be reversed if the expectation of loss is not considered probable due to changes in circumstances or when the obligation is settled.
Critical accounting estimates and judgments
By nature, litigations will be resolved when one or more future event occurs or fails to occur. Typically, the occurrence or not of such events is outside of the Company's control. Legal uncertainties involve the application of significant estimates and judgments by management regarding the potential outcomes of future events.
a) Employee postretirements obligations
In Brazil, the management of the pension plans is the responsibility of Fundação Vale do Rio Doce de Seguridade Social ("Valia") a nonprofit entity with administrative and financial autonomy. The Brazilian plans are as follows:
Benefit plan Vale Mais ("("Vale Mais") and benefit plan Valiaprev("Valiaprev")—Certain of the Company's employees are participants of plans Vale Mais and Valiaprev plans with components of defined benefitbenefits (specific coverage for death, pensions and disability allowances) and components of defined contributions (for programmable benefits). The defined benefitsbenefit plan is subject to actuarial evaluations. The defined contribution plan represents a fixed amount held on behalf of the participants. Both Vale Mais and Valiaprev were overfunded as at December 31, 20162018 and 2015.2017.
Defined benefit plan ("("Plano BD")—The Plano BD has been closed to new entrants since the year 2000, when the Vale Mais plan was implemented. It is a plan that has defined benefit characteristics, covering almost exclusively retirees and their beneficiaries. It was overfunded as of December 31, 20162018 and 20152017 and the contributions made by the Company are not relevant.
| | | | |
| | F-80 | | |
![]()
Notes to the Financial Statements (Continued)
Expressed in millions of United States dollar, unless otherwise stated
29. Employee benefits (Continued)
Complementary Allowance("Abono complementaçãoo") benefit plan—The Company sponsors a specific group of former employees entitled to receive additional benefits from Valia normalregular payments plus post-retirement benefitbenefits that covers medical, dental and pharmaceutical assistance. The contributions made by the Company finished in 2014. The abono complementaçãocomplementary allowance benefit was overfunded as at December 31, 20162018 and 2015.2017.
Other benefits—The Company sponsors medical plans for employees that meet specific criteria and for employees who use the abono complementaçãocomplementary allowance benefit. Although those benefits are not specific retirement plans, actuarial calculations are used to calculate future commitments. As those benefits are related to health care plans they have the nature of underfunded benefits, and are presented as underfunded plans as at December 31, 20162018 and 2015.2017.
The Foreign plans are managed in accordance with their region. They are divided between plans in Canada, United States of America, United Kingdom, Indonesia, New Caledonia, Japan and Taiwan. Pension plans in Canada are composed of a defined benefit and defined contribution component. Currently the defined benefit plans do not allow new entrants. The foreign defined benefit plans are underfunded as at December 31, 20162018 and 2015.2017.
Employers' disclosure about pensions and other post-retirement benefits on the status of the defined benefit elements of all plans is provided as follows.
i. Change in benefit obligation
| | | Overfunded pension plans | | Underfunded pension plans | | Other benefits | ||
|---|---|---|---|---|---|---|---|---|
Benefit obligation as at December 31, 2016 | | 3,343 | | 4,045 | | 1,296 | ||
| | | | | | | | ||
Service costs | | 7 | | 86 | | 30 | ||
Interest costs | | 360 | | 183 | | 67 | ||
Benefits paid | | (326 | ) | (275 | ) | (65) | ||
Participant contributions | | – | | (12 | ) | – | ||
Effect of changes in the actuarial assumptions | | 64 | | 167 | | 11 | ||
Translation adjustment | | (51 | ) | 276 | | 71 | ||
| | | | | | | | ||
Benefit obligation as at December 31, 2017 | | 3,397 | | 4,470 | | 1,410 | ||
| | | | | | | | ||
Service costs | | 5 | | 101 | | 36 | ||
Interest costs | | 282 | | 158 | | 59 | ||
Benefits paid | | (296 | ) | (272 | ) | (60) | ||
Participant contributions | | – | | (11 | ) | – | ||
Effect of changes in the actuarial assumptions | | 679 | | (164 | ) | (32) | ||
Translation adjustment | | (490 | ) | (353 | ) | (133) | ||
| | | | | | | | ||
Benefit obligation as at December 31, 2018 | | 3,577 | | 3,929 | | 1,280 | ||
| | | | | | | | ||
| | | | | | | | ||
| | | | | | | | ||
| | | | |
| | F-81 | | |
![]()
Notes to the Financial Statements (Continued)
Expressed in millions of United States dollar, unless otherwise stated
29. Employee benefits (Continued)
i. Change in benefit obligation
| | | Overfunded pension plans | | Underfunded pension plans | | Other benefits | | |||||||||
|---|---|---|---|---|---|---|---|---|---|---|---|---|---|---|---|---|
Benefit obligation as at December 31, 2014 | | | 3,728 | | | | 4,521 | | | | 1,498 | | | |||
| | | | | | | | | |||||||||
Service costs | | | 20 | | | | 94 | | | | 28 | | | |||
Interest costs | | | 359 | | | | 178 | | | | 66 | | | |||
Benefits paid | | | (244 | ) | | | (258 | ) | | | (65 | ) | | |||
Participant contributions | | | 1 | | | | – | | | | – | | | |||
Transfers | | | 8 | | | | (8 | ) | | | – | | | |||
Effect of changes in the actuarial assumptions | | | (184 | ) | | | (70 | ) | | | (31 | ) | | |||
Translation adjustment | | | (1,214 | ) | | | (768 | ) | | | (273 | ) | | |||
| | | | | | | | | |||||||||
Benefit obligation as at December 31, 2015 | | | 2,474 | | | | 3,689 | | | | 1,223 | | | |||
| | | | | | | | | |||||||||
Service costs | | | 10 | | | | 76 | | | | (16 | ) | | |||
Interest costs | | | 362 | | | | 175 | | | | 66 | | | |||
Benefits paid | | | (281 | ) | | | (259 | ) | | | (61 | ) | | |||
Participant contributions | | | 1 | | | | – | | | | – | | | |||
Effect of changes in the actuarial assumptions | | | 271 | | | | 117 | | | | 75 | | | |||
Transfer to held for sale | | | (9 | ) | | | – | | | | (59 | ) | | |||
Translation adjustment | | | 515 | | | | 124 | | | | 68 | | | |||
Others | | | – | | | | 123 | | | | – | | | |||
| | | | | | | | | |||||||||
Benefit obligation as at December 31, 2016 | | | 3,343 | | | | 4,045 | | | | 1,296 | | | |||
| | | | | | | | | |||||||||
| | | | | | | | | | | | | | | |||
| | | | | | | | | |||||||||
ii. Evolution of assets fair value
| | | Overfunded pension plans | | Underfunded pension plans | | Other benefits | | | Overfunded pension plans | | Underfunded pension plans | | Other benefits | |||||||||||
|---|---|---|---|---|---|---|---|---|---|---|---|---|---|---|---|---|---|---|---|---|---|---|---|---|
Fair value of plan assets as at December 31, 2014 | | | 5,029 | | | 3,716 | | | – | | | |||||||||||||
Fair value of plan assets as at December 31, 2016 | | 4,694 | | 3,419 | | – | ||||||||||||||||||
| | | | | | | | | | | | | | | |||||||||||
Interest income | | | 491 | | | 151 | | | – | | | | 513 | | 151 | | – | |||||||
Employer contributions | | | 63 | | | 132 | | | 65 | | | | 45 | | 65 | | 65 | |||||||
Participant contributions | | | 1 | | | – | | | – | | | | – | | (12 | ) | – | |||||||
Benefits paid | | | (244 | ) | | (258 | ) | | (65 | ) | | | (326 | ) | (275 | ) | (65) | |||||||
Return on plan assets (excluding interest income) | | | (284 | ) | | (8 | ) | | – | | | | (21 | ) | 174 | | – | |||||||
Transfers | | | 5 | | | (5 | ) | | – | | | |||||||||||||
Translation adjustment | | | (1,626 | ) | | (634 | ) | | – | | | | (77 | ) | 254 | | – | |||||||
| | | | | | | | | | | | | | | |||||||||||
Fair value of plan assets as at December 31, 2015 | | | 3,435 | | | 3,094 | | | – | | | |||||||||||||
Fair value of plan assets as at December 31, 2017 | | 4,828 | | 3,776 | | – | ||||||||||||||||||
| | | | | | | | | | | | | | | |||||||||||
Interest income | | | 512 | | | 151 | | | – | | | | 406 | | 127 | | – | |||||||
Employer contributions | | | 42 | | | 99 | | | 61 | | | | 35 | | 49 | | 60 | |||||||
Participant contributions | | | 1 | | | – | | | – | | | | 2 | | – | | – | |||||||
Benefits paid | | | (281 | ) | | (259 | ) | | (61 | ) | | | (296 | ) | (247 | ) | (60) | |||||||
Return on plan assets (excluding interest income) | | | 281 | | | 71 | | | – | | | | 479 | | (145 | ) | – | |||||||
Transfer to held for sale | | | (13 | ) | | – | | | – | | | |||||||||||||
Translation adjustment | | | 717 | | | 105 | | | – | | | | (717 | ) | (287 | ) | – | |||||||
Others | | | – | | | 158 | | | – | | | |||||||||||||
| | | | | | | | | | | | | | | |||||||||||
Fair value of plan assets as at December 31, 2016 | | | 4,694 | | | 3,419 | | | – | | | |||||||||||||
Fair value of plan assets as at December 31, 2018 | | 4,737 | | 3,273 | | – | ||||||||||||||||||
| | | | | | | | | | | | | | | | ||||||||||
| | | | | | | | | | | | | | | |||||||||||
iii. Reconciliation of assets and liabilities recognized in the statement of financial position
| | | Plans in Brazil | |||||||||||||||
|---|---|---|---|---|---|---|---|---|---|---|---|---|---|---|---|---|---|
| | | December 31, 2018 | | December 31, 2017 | |||||||||||||
| | | Overfunded pension plans | | Underfunded pension plans | | Other benefits | | Overfunded pension plans | | Underfunded pension plans | | Other benefits | |||||
Balance at beginning of the year | | 1,431 | | – | | – | | 1,351 | | – | | – | |||||
| | | | | | | | | | | | | | |||||
Interest income | | 124 | | – | | – | | 152 | | – | | – | |||||
Changes on asset ceiling | | (172 | ) | – | | – | | (45 | ) | – | | – | |||||
Translation adjustment | | (223 | ) | – | | – | | (27 | ) | – | | – | |||||
| | | | | | | | | | | | | | |||||
Balance at end of the year | | 1,160 | | – | | – | | 1,431 | | – | | – | |||||
| | | | | | | | | | | | | | |||||
| | | | | | | | | | | | | | |||||
| | | | | | | | | | | | | | |||||
Amount recognized in the statement of financial position | | | | | | | |||||||||||
Present value of actuarial liabilities | | (3,577 | ) | (334 | ) | (249 | ) | (3,397 | ) | (401 | ) | (258) | |||||
Fair value of assets | | 4,737 | | 162 | | – | | 4,828 | | 239 | | – | |||||
Effect of the asset ceiling | | (1,160 | ) | – | | – | | (1,431 | ) | – | | – | |||||
| | | | | | | | | | | | | | |||||
Liabilities | | – | | (172 | ) | (249 | ) | – | | (162 | ) | (258) | |||||
| | | | | | | | | | | | | | |||||
| | | | | | | | | | | | | | |||||
| | | | | | | | | | | | | | |||||
Current liabilities | | – | | (4 | ) | (19 | ) | – | | – | | (22) | |||||
Non-current liabilities | | – | | (168 | ) | (230 | ) | – | | (162 | ) | (236) | |||||
| | | | | | | | | | | | | | |||||
Liabilities | | – | | (172 | ) | (249 | ) | – | | (162 | ) | (258) | |||||
| | | | | | | | | | | | | | |||||
| | | | | | | | | | | | | | |||||
| | | | | | | | | | | | | | |||||
| | | | |
| | F-82 | | |
![]()
Notes to the Financial Statements (Continued)
Expressed in millions of United States dollar, unless otherwise stated
29. Employee benefits (Continued)
| | | Foreign plan | |||||||||||||||
|---|---|---|---|---|---|---|---|---|---|---|---|---|---|---|---|---|---|
| | | December 31, 2018 | | December 31, 2017 | |||||||||||||
| | | Overfunded pension plans | | Underfunded pension plans | | Other benefits | | Overfunded pension plans | | Underfunded pension plans | | Other benefits | |||||
Amount recognized in the statement of financial position | | | | | | | |||||||||||
Present value of actuarial liabilities | | – | | (3,595 | ) | (1,031 | ) | – | | (4,069 | ) | (1,152) | |||||
Fair value of assets | | – | | 3,111 | | – | | – | | 3,537 | | – | |||||
| | | | | | | | | | | | | | |||||
Liabilities | | – | | (484 | ) | (1,031 | ) | – | | (532 | ) | (1,152) | |||||
| | | | | | | | | | | | | | |||||
| | | | | | | | | | | | | | |||||
| | | | | | | | | | | | | | |||||
Current liabilities | | – | | (16 | ) | (33 | ) | – | | (16 | ) | (36) | |||||
Non-current liabilities | | – | | (468 | ) | (998 | ) | – | | (516 | ) | (1,116) | |||||
| | | | | | | | | | | | | | |||||
Liabilities | | – | | (484 | ) | (1,031 | ) | – | | (532 | ) | (1,152) | |||||
| | | | | | | | | | | | | | |||||
| | | | | | | | | | | | | | |||||
| | | | | | | | | | | | | | |||||
| | | Total | |||||||||||||||
|---|---|---|---|---|---|---|---|---|---|---|---|---|---|---|---|---|---|
| | | December 31, 2018 | | December 31, 2017 | |||||||||||||
| | | Overfunded pension plans | | Underfunded pension plans | | Other benefits | | Overfunded pension plans | | Underfunded pension plans | | Other benefits | |||||
Balance at beginning of the year | | 1,431 | | – | | – | | 1,351 | | – | | – | |||||
| | | | | | | | | | | | | | |||||
Interest income | | 124 | | – | | – | | 152 | | – | | – | |||||
Changes on asset ceiling | | (172 | ) | – | | – | | (45 | ) | – | | – | |||||
Translation adjustment | | (223 | ) | – | | – | | (27 | ) | – | | – | |||||
| | | | | | | | | | | | | | |||||
Balance at end of the year | | 1,160 | | – | | – | | 1,431 | | – | | – | |||||
| | | | | | | | | | | | | | |||||
| | | | | | | | | | | | | | |||||
| | | | | | | | | | | | | | |||||
Amount recognized in the statement of financial position | | | | | | | |||||||||||
Present value of actuarial liabilities | | (3,577 | ) | (3,929 | ) | (1,280 | ) | (3,397 | ) | (4,470 | ) | (1,410) | |||||
Fair value of assets | | 4,737 | | 3,273 | | – | | 4,828 | | 3,776 | | – | |||||
Effect of the asset ceiling | | (1,160 | ) | – | | – | | (1,431 | ) | – | | – | |||||
| | | | | | | | | | | | | | |||||
Liabilities | | – | | (656 | ) | (1,280 | ) | – | | (694 | ) | (1,410) | |||||
| | | | | | | | | | | | | | |||||
| | | | | | | | | | | | | | |||||
| | | | | | | | | | | | | | |||||
Current liabilities | | – | | (20 | ) | (52 | ) | – | | (16 | ) | (58) | |||||
Non-current liabilities | | – | | (636 | ) | (1,228 | ) | – | | (678 | ) | (1,352) | |||||
| | | | | | | | | | | | | | |||||
Liabilities | | – | | (656 | ) | (1,280 | ) | – | | (694 | ) | (1,410) | |||||
| | | | | | | | | | | | | | |||||
| | | | | | | | | | | | | | |||||
| | | | | | | | | | | | | | |||||
| | | | |
| | F-83 | | |
![]()
Notes to the Financial Statements (Continued)
Expressed in millions of United States dollar, unless otherwise stated
29. Employee benefits (Continued)
iii. Reconciliation of assets and liabilities recognized in the statement of financial position
| | | Plans in Brazil | | ||||||||||||||||||||||||||||
|---|---|---|---|---|---|---|---|---|---|---|---|---|---|---|---|---|---|---|---|---|---|---|---|---|---|---|---|---|---|---|---|
| | | December 31, 2016 | | December 31, 2015 | | ||||||||||||||||||||||||||
| | | Overfunded pension plans | | Underfunded pension plans | | Other benefits | | Overfunded pension plans | | Underfunded pension plans | | Other benefits | | ||||||||||||||||||
Balance at beginning of the year | | | 961 | | | | – | | | | – | | | | 1,301 | | | | – | | | | – | | | ||||||
| | | | | | | | | | | | | | | ||||||||||||||||||
Interest income | | | 156 | | | | – | | | | – | | | | 130 | | | | – | | | | – | | | ||||||
Changes on asset ceiling and onerous liability | | | 35 | | | | – | | | | – | | | | (54 | ) | | | – | | | | – | | | ||||||
Translation adjustment | | | 201 | | | | – | | | | – | | | | (416 | ) | | | – | | | | – | | | ||||||
Transfer to held for sale | | | (2 | ) | | | – | | | | – | | | | – | | | | – | | | | – | | | ||||||
| | | | | | | | | | | | | | | ||||||||||||||||||
Balance at end of the year | | | 1,351 | | | | – | | | | – | | | | 961 | | | | – | | | | – | | | ||||||
| | | | | | | | | | | | | | | ||||||||||||||||||
| | | | | | | | | | | | | | | | | | | | | | | | | | | ||||||
| | | | | | | | | | | | | | | ||||||||||||||||||
Amount recognized in the statement of financial position | | | | | | | | | | | | | | | | | | | | ||||||||||||
Present value of actuarial liabilities | | | (3,343 | ) | | | (386 | ) | | | (227 | ) | | | (2,474 | ) | | | (248 | ) | | | (160 | ) | | ||||||
Fair value of assets | | | 4,694 | | | | 257 | | | | – | | | | 3,435 | | | | 214 | | | | – | | | ||||||
Effect of the asset ceiling | | | (1,351 | ) | | | – | | | | – | | | | (961 | ) | | | – | | | | – | | | ||||||
| | | | | | | | | | | | | | | ||||||||||||||||||
Liabilities at end of the year | | | – | | | | (129 | ) | | | (227 | ) | | | – | | | | (34 | ) | | | (160 | ) | | ||||||
| | | | | | | | | | | | | | | ||||||||||||||||||
| | | | | | | | | | | | | | | | | | | | | | | | | | | ||||||
| | | | | | | | | | | | | | | ||||||||||||||||||
Current liabilities | | | – | | | | – | | | | (18 | ) | | | – | | | | – | | | | (19 | ) | | ||||||
Non-current liabilities | | | – | | | | (129 | ) | | | (209 | ) | | | – | | | | (34 | ) | | | (141 | ) | | ||||||
| | | | | | | | | | | | | | | ||||||||||||||||||
Liabilities at end of the year | | | – | | | | (129 | ) | | | (227 | ) | | | – | | | | (34 | ) | | | (160 | ) | | ||||||
| | | | | | | | | | | | | | | ||||||||||||||||||
| | | | | | | | | | | | | | | | | | | | | | | | | | | ||||||
| | | | | | | | | | | | | | | ||||||||||||||||||
| | | Foreign plan | | ||||||||||||||||||||||||||||
|---|---|---|---|---|---|---|---|---|---|---|---|---|---|---|---|---|---|---|---|---|---|---|---|---|---|---|---|---|---|---|---|
| | | December 31, 2016 | | December 31, 2015 | | ||||||||||||||||||||||||||
| | | Overfunded pension plans | | Underfunded pension plans | | Other benefits | | Overfunded pension plans | | Underfunded pension plans | | Other benefits | | ||||||||||||||||||
Amount recognized in the statement of financial position | | | | | | | | | | | | | | | | | | | | ||||||||||||
Present value of actuarial liabilities | | | – | | | | (3,659 | ) | | | (1,069 | ) | | | – | | | | (3,441 | ) | | | (1,063 | ) | | ||||||
Fair value of assets | | | – | | | | 3,162 | | | | – | | | | – | | | | 2,880 | | | | – | | | ||||||
| | | | | | | | | | | | | | | ||||||||||||||||||
Liabilities at end of the year | | | – | | | | (497 | ) | | | (1,069 | ) | | | – | | | | (561 | ) | | | (1,063 | ) | | ||||||
| | | | | | | | | | | | | | | ||||||||||||||||||
| | | | | | | | | | | | | | | | | | | | | | | | | | | ||||||
| | | | | | | | | | | | | | | ||||||||||||||||||
Current liabilities | | | – | | | | (16 | ) | | | (35 | ) | | | – | | | | (17 | ) | | | (32 | ) | | ||||||
Non-current liabilities | | | – | | | | (481 | ) | | | (1,034 | ) | | | – | | | | (544 | ) | | | (1,031 | ) | | ||||||
| | | | | | | | | | | | | | | ||||||||||||||||||
Liabilities at end of the year | | | – | | | | (497 | ) | | | (1,069 | ) | | | – | | | | (561 | ) | | | (1,063 | ) | | ||||||
| | | | | | | | | | | | | | | ||||||||||||||||||
| | | | | | | | | | | | | | | | | | | | | | | | | | | ||||||
| | | | | | | | | | | | | | | ||||||||||||||||||
![]()
Notes to the Financial Statements (Continued)
Expressed in millions of United States dollar, unless otherwise stated
29. Employee benefits (Continued)
| | | Total | | ||||||||||||||||||||||||||||
|---|---|---|---|---|---|---|---|---|---|---|---|---|---|---|---|---|---|---|---|---|---|---|---|---|---|---|---|---|---|---|---|
| | | December 31, 2016 | | December 31, 2015 | | ||||||||||||||||||||||||||
| | | Overfunded pension plans | | Underfunded pension plans | | Other benefits | | Overfunded pension plans | | Underfunded pension plans | | Other benefits | | ||||||||||||||||||
Balance at beginning of the year | | | 961 | | | | – | | | | – | | | | 1,301 | | | | – | | | | – | | | ||||||
| | | | | | | | | | | | | | | ||||||||||||||||||
Interest income | | | 156 | | | | – | | | | – | | | | 130 | | | | – | | | | – | | | ||||||
Changes in asset ceiling/ onerous liability | | | 35 | | | | – | | | | – | | | | (54 | ) | | | – | | | | – | | | ||||||
Translation adjustment | | | 201 | | | | – | | | | – | | | | (416 | ) | | | – | | | | – | | | ||||||
Transfer to held for sale | | | (2 | ) | | | – | | | | – | | | | – | | | | – | | | | – | | | ||||||
| | | | | | | | | | | | | | | ||||||||||||||||||
Balance at end of the year | | | 1,351 | | | | – | | | | – | | | | 961 | | | | – | | | | – | | | ||||||
| | | | | | | | | | | | | | | ||||||||||||||||||
| | | | | | | | | | | | | | | | | | | | | | | | | | | ||||||
| | | | | | | | | | | | | | | ||||||||||||||||||
Amount recognized in the statement of financial position | | | | | | | | | | | | | | | | | | | | ||||||||||||
Present value of actuarial liabilities | | | (3,343 | ) | | | (4,045 | ) | | | (1,296 | ) | | | (2,474 | ) | | | (3,689 | ) | | | (1,223 | ) | | ||||||
Fair value of assets | | | 4,694 | | | | 3,419 | | | | – | | | | 3,435 | | | | 3,094 | | | | – | | | ||||||
Effect of the asset ceiling | | | (1,351 | ) | | | – | | | | – | | | | (961 | ) | | | – | | | | – | | | ||||||
| | | | | | | | | | | | | | | ||||||||||||||||||
| | | | | | | | | | | | | | | | | | | | | | | | | | | ||||||
| | | | | | | | | | | | | | | ||||||||||||||||||
Liabilities at end of the year | | | – | | | | (626 | ) | | | (1,296 | ) | | | – | | | | (595 | ) | | | (1,223 | ) | | ||||||
| | | | | | | | | | | | | | | ||||||||||||||||||
| | | | | | | | | | | | | | | | | | | | | | | | | | | ||||||
| | | | | | | | | | | | | | | ||||||||||||||||||
Current liabilities | | | – | | | | (16 | ) | | | (53 | ) | | | – | | | | (17 | ) | | | (51 | ) | | ||||||
Non-current liabilities | | | – | | | | (610 | ) | | | (1,243 | ) | | | – | | | | (578 | ) | | | (1,172 | ) | | ||||||
| | | | | | | | | | | | | | | ||||||||||||||||||
| | | | | | | | | | | | | | | | | | | | | | | | | | | ||||||
| | | | | | | | | | | | | | | ||||||||||||||||||
Liabilities at end of the year | | | – | | | | (626 | ) | | | (1,296 | ) | | | – | | | | (595 | ) | | | (1,223 | ) | | ||||||
| | | | | | | | | | | | | | | ||||||||||||||||||
| | | | | | | | | | | | | | | | | | | | | | | | | | | ||||||
| | | | | | | | | | | | | | | ||||||||||||||||||
iv. Costs recognized in the income statement
| | | Year ended December 31 | | | Year ended December 31 | ||||||||||||||||||||||||||||||||||||||||||||||||||||
|---|---|---|---|---|---|---|---|---|---|---|---|---|---|---|---|---|---|---|---|---|---|---|---|---|---|---|---|---|---|---|---|---|---|---|---|---|---|---|---|---|---|---|---|---|---|---|---|---|---|---|---|---|---|---|---|---|---|
| | | 2016 | | 2015 | | | 2018 | | 2017 | | 2016 | ||||||||||||||||||||||||||||||||||||||||||||||
| | | Overfunded pension plans | | Underfunded pension plans | | Other benefits | | Overfunded pension plans | | Underfunded pension plans | | Other benefits | | | Overfunded pension plans | | Underfunded pension plans | | Other benefits | | Overfunded pension plans | | Underfunded pension plans | | Other benefits | | Overfunded pension plans | | Underfunded pension plans | | Other benefits | ||||||||||||||||||||||||||
Service cost | | | 10 | | | 76 | | | (16 | ) | | 20 | | | 94 | | | 28 | | | | 5 | | 101 | | 36 | | 7 | | 86 | | 30 | | 10 | | 76 | | (16) | |||||||||||||||||||
Interest on expense on liabilities | | | 362 | | | 175 | | | 66 | | | 359 | | | 178 | | | 66 | | | | 282 | | 158 | | 59 | | 360 | | 183 | | 67 | | 362 | | 175 | | 66 | |||||||||||||||||||
Interest income on plan assets | | | (512 | ) | | (151 | ) | | – | | | (491 | ) | | (151 | ) | | – | | | | (406 | ) | (127 | ) | – | | (513 | ) | (151 | ) | – | | (512 | ) | (151 | ) | – | |||||||||||||||||||
Interest expense on effect of (asset ceiling)/ onerous liability | | | 156 | | | – | | | – | | | 132 | | | – | | | – | | | | 124 | | – | | – | | 152 | | – | | – | | 156 | | – | | – | |||||||||||||||||||
| | | | | | | | | | | | | | | | | | | | | | | | | | | | | | | | | ||||||||||||||||||||||||||
Total of cost, net | | | 16 | | | 100 | | | 50 | | | 20 | | | 121 | | | 94 | | | | 5 | | 132 | | 95 | | 6 | | 118 | | 97 | | 16 | | 100 | | 50 | |||||||||||||||||||
| | | | | | | | | | | | | | | | | | | | | | | | | | | | | | | | | | |||||||||||||||||||||||||
| | | | | | | | | | | | | | | | | | | | | | | | | | | | | | | | | ||||||||||||||||||||||||||
v. Costs recognized in the statement of comprehensive income
| | | Year ended December 31 | ||||||||||||||||||||||||
|---|---|---|---|---|---|---|---|---|---|---|---|---|---|---|---|---|---|---|---|---|---|---|---|---|---|---|
| | | 2018 | | 2017 | | 2016 | ||||||||||||||||||||
| | | Overfunded pension plans | | Underfunded pension plans | | Other benefits | | Overfunded pension plans | | Underfunded pension plans | | Other benefits | | Overfunded pension plans | | Underfunded pension plans | | Other benefits | ||||||||
Balance at beginning of the year | | (163 | ) | (496 | ) | (189 | ) | (153 | ) | (496 | ) | (160 | ) | (113 | ) | (495 | ) | (95) | ||||||||
| | | | | | | | | | | | | | | | | | | | ||||||||
Effect of changes actuarial assumptions | | (679 | ) | 172 | | 32 | | (65 | ) | (167 | ) | (27 | ) | (271 | ) | (117 | ) | (75) | ||||||||
Return on plan assets (excluding interest income) | | 479 | | (144 | ) | – | | – | | 167 | | – | | 281 | | 71 | | – | ||||||||
Change of asset ceiling | | 172 | | – | | – | | 47 | | – | | – | | (36 | ) | – | | – | ||||||||
Others | | (1 | ) | – | | (1 | ) | (3 | ) | – | | (14 | ) | – | | 35 | | – | ||||||||
| | | | | | | | | | | | | | | | | | | | ||||||||
| | (29 | ) | 28 | | 31 | | (21 | ) | – | | (41 | ) | (26 | ) | (11 | ) | (75) | |||||||||
Deferred income tax | | 10 | | (7 | ) | (8 | ) | 7 | | (3 | ) | 12 | | 9 | | 16 | | 17 | ||||||||
| | | | | | | | | | | | | | | | | | | | ||||||||
Others comprehensive income | | (19 | ) | 21 | | 23 | | (14 | ) | (3 | ) | (29 | ) | (17 | ) | 5 | | (58) | ||||||||
Translation adjustments | | 23 | | 11 | | 10 | | 4 | | 4 | | 1 | | (23 | ) | (6 | ) | (7) | ||||||||
Transfers/ disposal | | (7 | ) | (4 | ) | 28 | | – | | (1 | ) | (1 | ) | – | | – | | – | ||||||||
| | | | | | | | | | | | | | | | | | | | ||||||||
Accumulated other comprehensive income | | (166 | ) | (468 | ) | (128 | ) | (163 | ) | (496 | ) | (189 | ) | (153 | ) | (496 | ) | (160) | ||||||||
| | | | | | | | | | | | | | | | | | | | ||||||||
| | | | | | | | | | | | | | | | | | | | ||||||||
| | | | | | | | | | | | | | | | | | | | ||||||||
vi. Risks related to plans
The Administrators of the plans have committed to strategic planning to strengthen internal controls and risk management. This commitment is achieved by conducting audits and assessments of internal controls, which aim to mitigate operational market and credit risks. Risks are presented as follow:
Legal—lawsuits: issuing periodic reports to internal audit and directors contemplating the analysis of lawyers about the possibility of loss (remote, probable or possible), aiming to support the administrative
| | | | |
| | F-84 | | |
![]()
Notes to the Financial Statements (Continued)
Expressed in millions of United States dollar, unless otherwise stated
29. Employee benefits (Continued)
v. Costs recognized in the statement of comprehensive income
| | | Year ended December 31 | | ||||||||||||||||||||||||||||
|---|---|---|---|---|---|---|---|---|---|---|---|---|---|---|---|---|---|---|---|---|---|---|---|---|---|---|---|---|---|---|---|
| | | 2016 | | 2015 | | ||||||||||||||||||||||||||
| | | Overfunded pension plans | | Underfunded pension plans | | Other benefits | | Overfunded pension plans | | Underfunded pension plans | | Other benefits | | ||||||||||||||||||
Balance at beginning of the year | | | (113 | ) | | | (495 | ) | | | (95 | ) | | | (143 | ) | | | (570 | ) | | | (132 | ) | | ||||||
Effect of changes actuarial assumptions | | | (271 | ) | | | (117 | ) | | | (75 | ) | | | 184 | | | | 70 | | | | 31 | | | ||||||
Return on plan assets (excluding interest income) | | | 281 | | | | 71 | | | | – | | | | (284 | ) | | | (8 | ) | | | – | | | ||||||
Change of asset ceiling / costly liabilities (excluding interest income) | | | (36 | ) | | | – | | | | – | | | | 70 | | | | – | | | | – | | | ||||||
Others | | | – | | | | 35 | | | | – | | | | – | | | | 2 | | | | 1 | | | ||||||
| | | | | | | | | | | | | | | ||||||||||||||||||
| | | (26 | ) | | | (11 | ) | | | (75 | ) | | | (30 | ) | | | 64 | | | | 32 | | | |||||||
Deferred income tax | | | 9 | | | | 16 | | | | 17 | | | | 10 | | | | 2 | | | | (9 | ) | | ||||||
| | | | | | | | | | | | | | | ||||||||||||||||||
Others comprehensive income | | | (17 | ) | | | 5 | | | | (58 | ) | | | (20 | ) | | | 66 | | | | 23 | | | ||||||
Translation adjustments | | | (23 | ) | | | (6 | ) | | | (7 | ) | | | 49 | | | | 10 | | | | 14 | | | ||||||
Transfers/ disposal | | | – | | | | – | | | | – | | | | 1 | | | | (1 | ) | | | – | | | ||||||
| | | | | | | | | | | | | | | ||||||||||||||||||
Accumulated other comprehensive income | | | (153 | ) | | | (496 | ) | | | (160 | ) | | | (113 | ) | | | (495 | ) | | | (95 | ) | | ||||||
| | | | | | | | | | | | | | | ||||||||||||||||||
| | | | | | | | | | | | | | | | | | | | | | | | | | | ||||||
| | | | | | | | | | | | | | | ||||||||||||||||||
vi. Risks related to plans
The Administrators of the plans have committed to strategic planning to strengthen internal controls and risk management. This commitment is archived by conducting audits including of internal controls, which aim to mitigate operational market and credit risks. Risks are presented as follow:
Legal—lawsuits: issuing periodic reports to internal audit and directors contemplating the analysis of lawyers about the possibility of loss (remote, probable or possible), aiming to support the administrative decision regarding provisions. Analysis and ongoing monitoring of developments in the legal scenario and its dissemination within the institution in order to subsidize the administrative plans, considering the impact of regulatory changes.
Actuarial—the annual actuarial valuation of the benefit plans comprises the assessment of costs, revenues and adequacy of plan funding. It also considers the monitoring of biometric, economic and financial assumptions (asset volatility, changes in interest rates, inflation, life expectancy, salaries and other).
Market—profitability projections are performed for the various plans and profiles of investments for 10 years in the management study of assets and liabilities. These projections include the risks of investments in various market segments. Furthermore, the risks for short-term market of the plans are monitored monthly through metrics of VaR (Value at Risk) and stress testing. For exclusive investment funds of Valia, the market risk is measured daily by the custodian asset bank.
Credit—assessment of the credit quality of issuers by hiring expert consultants to evaluate financial institutions and internal assessment of payment ability of non-financial companies. For assets of non-financial companies, the assessment is conducted by monitoring of the company until the maturity of the security.
vii. Actuarial and economic assumptions and sensitivity analysis
All calculations involve future actuarial projections about some parameters, such as: salaries, interest, inflation, the trend of social security in Brazil ("INSS") benefits, mortality and disability.
The economic and actuarial assumptions adopted have been taken considering the maturity dates and therefore, in the short term they would not realize.
The following assumptions were adopted in the assessment:
| | | Brazil | |||||||||||
|---|---|---|---|---|---|---|---|---|---|---|---|---|---|
| | | December 31, 2018 | | December 31, 2017 | |||||||||
| | | Overfunded pension plans | | Underfunded pension plans | | Other benefits | | Overfunded pension plans | | Underfunded pension plans | | Other benefits | |
Discount rate to determine benefit obligation | | 8.86% - 9.10% | | 9.10 | % | 9.05% - 9.29% | | 9.74% - 9.85% | | 9.84% | | 9.74% - 9.91% | |
Nominal average rate to determine expense/ income | | 8.86% - 9.10% | | 9.10 | % | N/A | | 9.74% - 9.85% | | 9.84% | | N/A | |
Nominal average rate of salary increase | | 4.00% - 6.08% | | 6.08 | % | N/A | | 4.25% - 6.34% | | 4.25% - 6.34% | | N/A | |
Nominal average rate of benefit increase | | 4.00% | | 6.08 | % | N/A | | 4.85% | | 4.85% | | N/A | |
Immediate health care cost trend rate | | N/A | | N/A | | 7.12% | | N/A | | N/A | | 7.38% | |
Ultimate health care cost trend rate | | N/A | | N/A | | 7.12% | | N/A | | N/A | | 7.38% | |
Nominal average rate of price inflation | | 4.00% | | 4.00 | % | 4.00% | | 4.25% | | 4.25% | | 4.25% | |
| | | | |
| | F-85 | | |
![]()
Notes to the Financial Statements (Continued)
Expressed in millions of United States dollar, unless otherwise stated
29. Employee benefits (Continued)
Credit—assessment of the credit quality of issuers by hiring expert consultants to evaluate financial institutions and internal assessment of payment ability of non-financial companies. For assets of non-financial companies, the assessment is conducted a monitoring of the company until the maturity of the security.
vii. Actuarial and economic assumptions and sensitivity analysis
All calculations involve future actuarial projections about some parameters, such as: salaries, interest, inflation, the trend of INSS benefits, mortality and disability.
The economic and actuarial assumptions adopted have been formulated considering the long-term period for maturity and should therefore be examined accordingly. In the short term they may not necessarily be realized.
In the evaluations were adopted the following assumptions:
| | | Brazil | | ||||||||||||||||||||||
|---|---|---|---|---|---|---|---|---|---|---|---|---|---|---|---|---|---|---|---|---|---|---|---|---|---|
| | | December 31, 2016 | | December 31, 2015 | | ||||||||||||||||||||
| | | Overfunded pension plans | | Underfunded pension plans | | Other benefits | | Overfunded pension plans | | Underfunded pension plans | | Other benefits | | ||||||||||||
Discount rate to determine benefit obligation | | 10.98% - 11.14% | | | 10.98% | | | 10.98% - 11.09% | | | 13.63% | | | | 13.71% | | | | 13.63% | | | ||||
Nominal average rate to determine expense/ income | | 10.98% - 11.14% | | | 10.98% | | | N/A | | | 12.36% | | | | 13.71% | | | | N/A | | | ||||
Nominal average rate of salary increase | | 4.85% - 5.95% | | | 6.95% | | | N/A | | | 8.12% | | | | 8.12% | | | | N/A | | | ||||
Nominal average rate of benefit increase | | 6.00% | | | 6.00% | | | N/A | | | 6.00% | | | | 6.00% | | | | N/A | | | ||||
Immediate health care cost trend rate | | N/A | | | N/A | | | 8.00% | | | N/A | | | | N/A | | | | 9.18% | | | ||||
Ultimate health care cost trend rate | | N/A | | | N/A | | | 8.00% | | | N/A | | | | N/A | | | | 9.18% | | | ||||
Nominal average rate of price inflation | | 4.85% | | | 4.85% | | | 4.85% | | | 6.00% | | | | 6.00% | | | | 6.00% | | | ||||
| | | Foreign | | | Foreign | |||||||||||||||||||||||||||
|---|---|---|---|---|---|---|---|---|---|---|---|---|---|---|---|---|---|---|---|---|---|---|---|---|---|---|---|---|---|---|---|---|
| | | December 31, 2016 | | December 31, 2015 | | | December 31, 2018 | | December 31, 2017 | |||||||||||||||||||||||
| | | Underfunded pension plans | | Other benefits | | Underfunded pension plans | | Other benefits | | | Underfunded pension plans | | Other benefits | | Underfunded pension plans | | Other benefits | |||||||||||||||
Discount rate to determine benefit obligation | | | 3.84% | | | 3.90% | | | 4.00% | | | 3.90% | | | | 3.56 | % | 3.66 | % | 3.26 | % | 3.44% | ||||||||||
Nominal average rate to determine expense/ income | | | 4.01% | | | N/A | | | 4.80% | | | N/A | | | | 3.26 | % | N/A | | 3.84 | % | N/A | ||||||||||
Nominal average rate of salary increase | | | 4.05% | | | N/A | | | 3.90% | | | N/A | | | | 3.20 | % | N/A | | 3.27 | % | N/A | ||||||||||
Nominal average rate of benefit increase | | | N/A | | | 3.00% | | | N/A | | | 3.00% | | | | N/A | | 3.00 | % | N/A | | 3.00% | ||||||||||
Immediate health care cost trend rate | | | N/A | | | 6.30% | | | N/A | | | 6.30% | | | | N/A | | 5.90 | % | N/A | | 5.99% | ||||||||||
Ultimate health care cost trend rate | | | N/A | | | 4.50% | | | N/A | | | 4.50% | | | | N/A | | 4.56 | % | N/A | | 4.56% | ||||||||||
Nominal average rate of price inflation | | | 2.00% | | | 2.00% | | | 2.00% | | | 2.00% | | | | 2.10 | % | 2.10 | % | 2.10 | % | 2.10% | ||||||||||
![]()
Notes to the Financial Statements (Continued)
Expressed in millions of United States dollar, unless otherwise stated
29. Employee benefits (Continued)
For the sensitivity analysis, the Company considers the effect of 1% in nominal discount rate to determine the actuarial liability. The effects of this change invariation on the actuarial liabilities in premise andliability, the assumption adopted the average duration of the plan are as follows:
| | | December 31, 2016 | | | December 31, 2018 | |||||||||||||||||||
|---|---|---|---|---|---|---|---|---|---|---|---|---|---|---|---|---|---|---|---|---|---|---|---|---|
| | | Overfunded pension plans | | Underfunded pension plans | | Other benefits | | | Overfunded pension plans | | Underfunded pension plans | | Other benefits | |||||||||||
Nominal discount rate—1% increase | | | | | | | | | | | | |||||||||||||
Actuarial liability balance | | | 3,069 | | | 3,569 | | | 1,171 | | | | 3,310 | | 3,459 | | 1,114 | |||||||
Assumptions made | | | 11.29% | | | 5.55% | | | 6.33% | | | | 9.98 | % | 5.03 | % | 5.42% | |||||||
Nominal discount rate—1% reduction | | | | | | | | | | | | |||||||||||||
Actuarial liability balance | | | 3,665 | | | 4,583 | | | 1,469 | | | | 3,891 | | 4,471 | | 1,488 | |||||||
Assumptions made | | | 9.56% | | | 3.50% | | | 4.02% | | | | 7.98 | % | 3.03 | % | 3.42% | |||||||
viii. Assets of pension plans
Brazilian plan assets as at December 31, 20162018 and 2015 includes2017 include respectively (i) investments in a portfolio of Vale's stock and other instruments in the amount of US$1813 and US$437 and (ii) Brazilian Federal Government securities in the amount of US$4,1804,199 and US$2,976.4,617.
Foreign plan assets as at December 31, 20162018 and 2015 includes2017 include Canadian Government securities in the amount of US$735674 and US$675,864, respectively.
| | | | |
| | F-86 | | |
![]()
Notes to the Financial Statements (Continued)
Expressed in millions of United States dollar, unless otherwise stated
29. Employee benefits (Continued)
ix. Overfunded pension plans
Assets by category are as follows:
| | | December 31, 2018 | | December 31, 2017 | |||||||||||||||||||
|---|---|---|---|---|---|---|---|---|---|---|---|---|---|---|---|---|---|---|---|---|---|---|---|
| | | Level 1 | | Level 2 | | Level 3 | | Total | | Level 1 | | Level 2 | | Level 3 | | Total | |||||||
Debt securities—Corporate | | – | | 47 | | – | | 47 | | – | | 72 | | – | | 72 | |||||||
Debt securities—Government | | 2,447 | | – | | – | | 2,447 | | 2,757 | | – | | – | | 2,757 | |||||||
Investments funds—Fixed Income | | 2,441 | | – | | – | | 2,441 | | 2,515 | | – | | – | | 2,515 | |||||||
Investments funds—Equity | | 450 | | – | | – | | 450 | | 531 | | – | | – | | 531 | |||||||
International investments | | 25 | | – | | – | | 25 | | 24 | | – | | – | | 24 | |||||||
Structured investments—Private Equity funds | | – | | – | | 159 | | 159 | | – | | – | | 196 | | 196 | |||||||
Structured investments—Real estate funds | | – | | – | | 15 | | 15 | | – | | – | | 15 | | 15 | |||||||
Real estate | | – | | – | | 339 | | 339 | | – | | – | | 365 | | 365 | |||||||
Loans to participants | | – | | – | | 160 | | 160 | | – | | – | | 224 | | 224 | |||||||
| | | | | | | | | | | | | | | | | | |||||||
Total | | 5,363 | | 47 | | 673 | | 6,083 | | 5,827 | | 72 | | 800 | | 6,699 | |||||||
| | | | | | | | | | | | | | | | | | |||||||
| | | | | | | | | | | | | | | | | | |||||||
| | | | | | | | | | | | | | | | | | |||||||
Funds not related to risk plans(i) | | | | | (1,346 | ) | | �� | | | (1,871) | ||||||||||||
| | | | | | | | | | | | | | | | | | |||||||
Fair value of plan assets at end of year | | | | | 4,737 | | | | | 4,828 | |||||||||||||
| | | | | | | | | | | | | | | | | | |||||||
| | | | | | | | | | | | | | | | | | |||||||
| | | | | | | | | | | | | | | | | | |||||||
| | | December 31, 2016 | | December 31, 2015 | | ||||||||||||||||||||||||||||||||||||
|---|---|---|---|---|---|---|---|---|---|---|---|---|---|---|---|---|---|---|---|---|---|---|---|---|---|---|---|---|---|---|---|---|---|---|---|---|---|---|---|---|---|
| | | Level 1 | | Level 2 | | Level 3 | | Total | | Level 1 | | Level 2 | | Level 3 | | Total | | ||||||||||||||||||||||||
Cash and cash equivalents | | | – | | | | – | | | | – | | | | – | | | | 1 | | | | – | | | | – | | | | 1 | | | ||||||||
Debt securities—Corporate bonds | | | – | | | | 117 | | | | – | | | | 117 | | | | – | | | | 94 | | | | – | | | | 94 | | | ||||||||
Debt securities—Government bonds | | | 2,612 | | | | – | | | | – | | | | 2,612 | | | | 1,659 | | | | – | | | | – | | | | 1,659 | | | ||||||||
Investments funds—Fixed Income | | | 2,411 | | | | – | | | | – | | | | 2,411 | | | | 1,799 | | | | – | | | | – | | | | 1,799 | | | ||||||||
Investments funds—Equity | | | 168 | | | | – | | | | – | | | | 168 | | | | 44 | | | | – | | | | – | | | | 44 | | | ||||||||
International investments | | | 12 | | | | – | | | | – | | | | 12 | | | | 29 | | | | – | | | | – | | | | 29 | | | ||||||||
Structured investments—Private Equity funds | | | 217 | | | | – | | | | 140 | | | | 357 | | | | 138 | | | | – | | | | 136 | | | | 274 | | | ||||||||
Structured investments—Real estate funds | | | – | | | | – | | | | 10 | | | | 10 | | | | – | | | | – | | | | 6 | | | | 6 | | | ||||||||
Real estate | | | – | | | | – | | | | 370 | | | | 370 | | | | – | | | | – | | | | 319 | | | | 319 | | | ||||||||
Loans to participants | | | – | | | | – | | | | 260 | | | | 260 | | | | – | | | | – | | | | 249 | | | | 249 | | | ||||||||
| | | | | | | | | | | | | | | | | | | ||||||||||||||||||||||||
Total | | | 5,420 | | | | 117 | | | | 780 | | | | 6,317 | | | | 3,670 | | | | 94 | | | | 710 | | | | 4,474 | | | ||||||||
| | | | | | | | | | | | | | | | | | | ||||||||||||||||||||||||
| | | | | | | | | | | | | | | | | | | | | | | | | | | | | | | | | | | ||||||||
| | | | | | | | | | | | | | | | | | | | | | | ||||||||||||||||||||
Funds not related to risk plans | | | | | | | | | | | | (1,623 | ) | | | | | | | | | | | | (1,039 | ) | | ||||||||||||||
| | | | | | | | | | | | | | | | | | | | | | | | | | | | | | | ||||||||||||
Fair value of plan assets at end of year | | | | | | | | | | | | 4,694 | | | | | | | | | | | | | 3,435 | | | ||||||||||||||
| | | | | | | | | | | | | | | | | | | | | | | | | | | | | | | ||||||||||||
| | | | | | | | | | | | | | | | | | | | | | | | | | | | | | | | | | | ||||||||
| | | | | | | | | | | | | | | | | | | | | | | | | | | | | | | ||||||||||||
Measurement of overfunded plan assets at fair value with no observable market variables (level 3) are as follows:
| | | Private equity funds | | Real estate funds | | Real estate | | Loans to participants | | Total | | | Private equity funds | | Real estate funds | | Real estate | | Loans to participants | | Total | |||||||||||||||||||
|---|---|---|---|---|---|---|---|---|---|---|---|---|---|---|---|---|---|---|---|---|---|---|---|---|---|---|---|---|---|---|---|---|---|---|---|---|---|---|---|---|
Balance as at December 31, 2014 | | | 253 | | | 7 | | | 497 | | | 404 | | | 1,161 | | | |||||||||||||||||||||||
Return on plan assets | | | (84 | ) | | 1 | | | 4 | | | 47 | | | (32 | ) | | |||||||||||||||||||||||
Assets purchases | | | 49 | | | 1 | | | 1 | | | 40 | | | 91 | | | |||||||||||||||||||||||
Assets sold during the year | | | (7 | ) | | – | | | (28 | ) | | (118 | ) | | (153 | ) | | |||||||||||||||||||||||
Translation adjustment | | | (75 | ) | | (3 | ) | | (156 | ) | | (124 | ) | | (358 | ) | | |||||||||||||||||||||||
Transfers in and/ out of Level 3 | | | – | | | – | | | 1 | | | – | | | 1 | | | |||||||||||||||||||||||
| | | | | | | | | | | | | |||||||||||||||||||||||||||||
Balance as at December 31, 2015 | | | 136 | | | 6 | | | 319 | | | 249 | | | 710 | | | |||||||||||||||||||||||
Balance as at December 31, 2016 | | 140 | | 10 | | 370 | | 260 | | 780 | ||||||||||||||||||||||||||||||
| | | | | | | | | | | | | | | | | | | | | | | |||||||||||||||||||
Return on plan assets | | | (19 | ) | | – | | | 3 | | | 33 | | | 17 | | | | 37 | | (2 | ) | 4 | | 29 | | 68 | |||||||||||||
Assets purchases | | | 30 | | | 3 | | | 2 | | | 55 | | | 90 | | | | 31 | | 8 | | 13 | | 75 | | 127 | |||||||||||||
Assets sold during the year | | | (23 | ) | | – | | | (17 | ) | | (121 | ) | | (161 | ) | | | (8 | ) | – | | (17 | ) | (137 | ) | (162) | |||||||||||||
Translation adjustment | | | 26 | | | 1 | | | 63 | | | 46 | | | 136 | | | | (4 | ) | (1 | ) | (5 | ) | (3 | ) | (13) | |||||||||||||
Transfer to held for sale | | | (10 | ) | | – | | | – | | | (2 | ) | | (12 | ) | | |||||||||||||||||||||||
| | | | | | | | | | | | | | | | | | | | | | | |||||||||||||||||||
Balance as at December 31, 2016 | | | 140 | | | 10 | | | 370 | | | 260 | | | 780 | | | |||||||||||||||||||||||
Balance as at December 31, 2017 | | 196 | | 15 | | 365 | | 224 | | 800 | ||||||||||||||||||||||||||||||
| | | | | | | | | | | | ||||||||||||||||||||||||||||||
Return on plan assets | | 15 | | – | | 39 | | 25 | | 79 | ||||||||||||||||||||||||||||||
Assets purchases | | 2 | | 2 | | 7 | | 233 | | – | ||||||||||||||||||||||||||||||
Assets sold during the year | | (26 | ) | – | | (16 | ) | (292 | ) | (334) | ||||||||||||||||||||||||||||||
Translation adjustment | | (28 | ) | (2 | ) | (56 | ) | (30 | ) | (116) | ||||||||||||||||||||||||||||||
| | | | | | | | | | | | ||||||||||||||||||||||||||||||
Balance as at December 31, 2018 | | 159 | | 15 | | 339 | | 160 | | 673 | ||||||||||||||||||||||||||||||
| | | | | | | | | | | | | | | | | | | | | | | | ||||||||||||||||||
| | | | | | | | | | | | | | | | | | | | | | | |||||||||||||||||||
| | | | |
| | F-87 | | |
![]()
Notes to the Financial Statements (Continued)
Expressed in millions of United States dollar, unless otherwise stated
29. Employee benefits (Continued)
x. Underfunded pension plans
Assets by category are as follows:
| | | December 31, 2016 | | December 31, 2015 | | | December 31, 2018 | | December 31, 2017 | |||||||||||||||||||||||||||||||||||||||||||||||||||||||
|---|---|---|---|---|---|---|---|---|---|---|---|---|---|---|---|---|---|---|---|---|---|---|---|---|---|---|---|---|---|---|---|---|---|---|---|---|---|---|---|---|---|---|---|---|---|---|---|---|---|---|---|---|---|---|---|---|---|---|---|---|---|---|---|---|
| | | Level 1 | | Level 2 | | Level 3 | | Total | | Level 1 | | Level 2 | | Level 3 | | Total | | | Level 1 | | Level 2 | | Level 3 | | Total | | Level 1 | | Level 2 | | Level 3 | | Total | |||||||||||||||||||||||||||||||
Cash and cash equivalents | | | – | | | 24 | | | – | | | 24 | | | – | | | 49 | | | – | | | 49 | | | | 3 | | 18 | | – | | 21 | | 4 | | 28 | | – | | 32 | ||||||||||||||||||||||
Equity securities | | | 1,240 | | | – | | | – | | | 1,240 | | | 1,106 | | | – | | | – | | | 1,106 | | | | 1,186 | | 2 | | – | | 1,188 | | 1,364 | | 3 | | – | | 1,367 | ||||||||||||||||||||||
Debt securities—Corporate bonds | | | – | | | 10 | | | – | | | 10 | | | – | | | 12 | | | – | | | 12 | | | ||||||||||||||||||||||||||||||||||||||
Debt securities—Government bonds | | | 83 | | | 736 | | | – | | | 819 | | | 56 | | | 684 | | | – | | | 740 | | | ||||||||||||||||||||||||||||||||||||||
Debt securities—Corporate | | – | | 374 | | – | | 374 | | – | | 338 | | – | | 338 | ||||||||||||||||||||||||||||||||||||||||||||||||
Debt securities—Government | | 116 | | 680 | | – | | 796 | | 141 | | 801 | | – | | 942 | ||||||||||||||||||||||||||||||||||||||||||||||||
Investments funds—Fixed Income | | | 142 | | | 307 | | | – | | | 449 | | | 150 | | | 281 | | | – | | | 431 | | | | 42 | | 296 | | – | | 338 | | 159 | | – | | – | | 159 | ||||||||||||||||||||||
Investments funds—Equity | | | 92 | | | 368 | | | – | | | 460 | | | 86 | | | 356 | | | – | | | 442 | | | | – | | 124 | | – | | 124 | | 8 | | 392 | | – | | 400 | ||||||||||||||||||||||
International investments | | | – | | | 27 | | | – | | | 27 | | | 2 | | | 30 | | | – | | | 32 | | | ||||||||||||||||||||||||||||||||||||||
Structured investments—Private Equity funds | | | – | | | – | | | 187 | | | 187 | | | – | | | – | | | 98 | | | 98 | | | | – | | – | | 213 | | 213 | | 97 | | – | | 197 | | 294 | ||||||||||||||||||||||
Real estate | | | – | | | – | | | 24 | | | 24 | | | – | | | – | | | 20 | | | 20 | | | | – | | – | | 51 | | 51 | | – | | – | | 44 | | 44 | ||||||||||||||||||||||
Loans to participants | | | – | | | – | | | 6 | | | 6 | | | – | | | – | | | 5 | | | 5 | | | | – | | – | | 3 | | 3 | | – | | – | | 5 | | 5 | ||||||||||||||||||||||
Others | | | – | | | – | | | 173 | | | 173 | | | – | | | – | | | 159 | | | 159 | | | | – | | – | | 165 | | 165 | | – | | – | | 195 | | 195 | ||||||||||||||||||||||
| | | | | | | | | | | | | | | | | | | | | | | | | | | | | | | | | | | |||||||||||||||||||||||||||||||
Total | | | 1,557 | | | 1,472 | | | 390 | | | 3,419 | | | 1,400 | | | 1,412 | | | 282 | | | 3,094 | | | | 1,347 | | 1,494 | | 432 | | 3,273 | | 1,773 | | 1,562 | | 441 | | 3,776 | ||||||||||||||||||||||
| | | | | | | | | | | | | | | | | | | | | | | | | | | | | | | | | | | | ||||||||||||||||||||||||||||||
| | | | | | | | | | | | | | | | | | | | | | | | | | | | | | | | | | | |||||||||||||||||||||||||||||||
Measurement of underfunded plan assets at fair value with no observable market variables (level 3) are as follows:
| | | Private equity funds | | Real estate | | Loans to participants | | Others | | Total | | | Private equity funds | | Real estate | | Loans to participants | | Others | | Total | |||||||||||||||||||
|---|---|---|---|---|---|---|---|---|---|---|---|---|---|---|---|---|---|---|---|---|---|---|---|---|---|---|---|---|---|---|---|---|---|---|---|---|---|---|---|---|
Balance as at December 31, 2014 | | | 18 | | | 24 | | | 7 | | | – | | | 49 | | | |||||||||||||||||||||||
Return on plan assets | | | – | | | 5 | | | 1 | | | – | | | 6 | | | |||||||||||||||||||||||
Assets purchases | | | 102 | | | – | | | – | | | 186 | | | 288 | | | |||||||||||||||||||||||
Assets sold during the year | | | (1 | ) | | – | | | – | | | – | | | (1 | ) | | |||||||||||||||||||||||
Translation adjustment | | | (21 | ) | | (8 | ) | | (3 | ) | | (27 | ) | | (59 | ) | | |||||||||||||||||||||||
Transfers in and/ out of Level 3 | | | – | | | (1 | ) | | – | | | – | | | (1 | ) | | |||||||||||||||||||||||
| | | | | | | | | | | | | |||||||||||||||||||||||||||||
Balance as at December 31, 2015 | | | 98 | | | 20 | | | 5 | | | 159 | | | 282 | | | |||||||||||||||||||||||
Balance as at December 31, 2016 | | 187 | | 24 | | 6 | | 173 | | 390 | ||||||||||||||||||||||||||||||
| | | | | | | | | | | | | | | | | | | | | | | |||||||||||||||||||
Return on plan assets | | | 15 | | | – | | | – | | | 9 | | | 24 | | | | 8 | | 1 | | – | | 10 | | 19 | |||||||||||||
Assets purchases | | | 176 | | | – | | | – | | | – | | | 176 | | | | 13 | | 17 | | – | | – | | 30 | |||||||||||||
Assets sold during the year | | | (110 | ) | | – | | | – | | | – | | | (110 | ) | | | (18 | ) | (1 | ) | – | | – | | (19) | |||||||||||||
Translation adjustment | | | 8 | | | 4 | | | 1 | | | 5 | | | 18 | | | | 7 | | 3 | | (1 | ) | 12 | | 21 | |||||||||||||
| | | | | | | | | | | | | | | | | | | | | | | |||||||||||||||||||
Balance as at December 31, 2016 | | | 187 | | | 24 | | | 6 | | | 173 | | | 390 | | | |||||||||||||||||||||||
Balance as at December 31, 2017 | | 197 | | 44 | | 5 | | 195 | | 441 | ||||||||||||||||||||||||||||||
| | | | | | | | | | | | ||||||||||||||||||||||||||||||
Return on plan assets | | 32 | | 3 | | – | | (15 | ) | 20 | ||||||||||||||||||||||||||||||
Assets purchases | | 22 | | 18 | | – | | – | | 40 | ||||||||||||||||||||||||||||||
Assets sold during the year | | (22 | ) | (10 | ) | (1 | ) | – | | (33) | ||||||||||||||||||||||||||||||
Translation adjustment | | (16 | ) | (4 | ) | (1 | ) | (15 | ) | (36) | ||||||||||||||||||||||||||||||
| | | | | | | | | | | | ||||||||||||||||||||||||||||||
Balance as at December 31, 2018 | | 213 | | 51 | | 3 | | 165 | | 432 | ||||||||||||||||||||||||||||||
| | | | | | | | | | | | | | | | | | | | | | | | ||||||||||||||||||
| | | | | | | | | | | | | | | | | | | | | | | |||||||||||||||||||
xi. Disbursement of future cash flow
Vale expects to disburse US$165125 in 20172019 in relation to pension plans and other benefits.
| | | | |
| | F-88 | | |
![]()
Notes to the Financial Statements (Continued)
Expressed in millions of United States dollar, unless otherwise stated
29. Employee benefits (Continued)
xii.
The expected benefit payments, which reflect future services, are as follows:
| | | December 31, 2016 | | | December 31, 2018 | |||||||||||||||||||
|---|---|---|---|---|---|---|---|---|---|---|---|---|---|---|---|---|---|---|---|---|---|---|---|---|
| | | Overfunded pension plans | | Underfunded pension plans | | Other benefits | | | Overfunded pension plans | | Underfunded pension plans | | Other benefits | |||||||||||
2017 | | | 92 | | | 238 | | | 65 | | | |||||||||||||
2018 | | | 98 | | | 237 | | | 67 | | | |||||||||||||
2019 | | | 104 | | | 237 | | | 69 | | | | 259 | | 222 | | 61 | |||||||
2020 | | | 110 | | | 238 | | | 72 | | | | 268 | | 223 | | 63 | |||||||
2021 | | | 117 | | | 238 | | | 74 | | | | 276 | | 223 | | 65 | |||||||
2022 and thereafter | | | 602 | | | 1,208 | | | 402 | | | |||||||||||||
2022 | | 284 | | 223 | | 67 | ||||||||||||||||||
2023 | | 291 | | 224 | | 69 | ||||||||||||||||||
2024 and thereafter | | 1,543 | | 1,116 | | 369 | ||||||||||||||||||
b) Profit sharing program ("PLR")
The Company recorded as cost of goods sold and services rendered and other operating expenses related to the PLRprofit sharing program US$503, US$780 and US$331 and US$42 for the yearyears ended on December 31, 20162018, 2017 and 2015,2016, respectively.
c) Long-term compensation plan
For the long-term awarding of eligible executives, the Company compensation plans includesinclude Matching Program and Performance Share Unit Program—PSU, with three to four years-vesting cycles, respectively, with the aim of encouraging employee's retention and stimulating their performance.
For the Matching program, the participants can acquire Vale's preferredcommon shares in the market without any benefits being provided by Vale. If the shares acquired are held for a period of three years and the participants keep it employment relationship with Vale, the participant is entitled to receive from Vale an award in shares, equivalent to the number of shares originally acquired by the executive. It should be noted that, although a specific custodian of the shares is defined by Vale, the shareshares initially purchased by the executives have no restriction and can be sold at any time. However, if it's done before the end of the three-year-vesting period, they lose the entitlement of receiving the related award paid by Vale.
For PSU program, the eligible executives have the opportunity to receive during a four year-vesting cycle, an award equivalent to the market value of a determined number of common shares and conditioned to Vale's performance factor measured as an indicator of total return to the shareholders (TSR). This award is paid in cash and can occur in cumulative installments of 20% (at the end of 2nd year), 30% (at the end of 3rd year) and 50% (at the end of 4th year), conditioned to the performance factor of each year.
Liabilities of the plans are measured at fair value at every reporting period, based on market rates. Compensation costs incurred are recognized by the defined vesting period of three or four years. AtFor the years ended December 31, 2016, 20152018, 2017 and 20142016 the Company recognized in the income statement the amounts of US$37,95, US$2965 and US$61,37, respectively, related to long termlong-term compensation plan.
| | | | |
| | F-89 | | |
![]()
Notes to the Financial Statements (Continued)
Expressed in millions of United States dollar, unless otherwise stated
29. Employee benefits (Continued)
Accounting policy
Employee benefits
i. Current benefits—wages, vacations and related taxes
Payments of benefits such as wages or accrued vacation, as well as the related social security taxes over those benefits are recognized monthly in income, on an accruals basis.
ii. Current benefits—profit sharing program
The Company has the Annual Incentive Program (AIP) based on Team and business unitsunit's contribution and Company-wide performance through operational cash generation. The Company makes an accrual based on evaluation periodic of goals achieved and Company result, using the accrual basis and recognition of present obligation arising from past events in the estimated outflow of resources in the future. The accrual is recorded as cost of goods sold and services rendered or operating expenses in accordance with the activity of each employee.
iii. Non-current benefits—long-term incentive programs
The Company has established a procedure for awarding certain eligible executives (Matching and Virtual Shares Programs) with the goal of encouraging employee retention and optimum performance. Plan liabilities are measured at each reporting date, at their fair values, based on market prices. Obligations are measured at each reporting date, at fair values based on market prices. The compensation costs incurred are recognized in income during the vesting period as defined.
iv. Non-current benefits—pension costs and other post-retirement benefits
The Company has several retirement plans for its employees.
For defined contribution plans, the Company's obligations are limited to a monthly contribution linked to a pre-defined percentage of the remuneration of employees enrolled in to these plans.
For defined benefit plans, actuarial calculations are periodically obtained for liabilities determined in accordance with the Projected Unit Credit Method in order to estimate the Company's obligation. The liability recognized in the balance sheetstatement of financial position represents the present value of the defined benefit obligation as at that date, less the fair value of plan assets. The Company recognized in the income statement the costs of services, the interest expense of the obligations and the interest income of the plan assets. The remeasurement of gains and losses, return on plan assets (excluding the amount of interest on return of assets, which is recognized in income for the year) and changes in the effect of the ceiling of the active and onerous liabilities are recognized in comprehensive income for the year.
| | | | |
| | F-90 | | |
For overfunded plans, the Company does not recognize any assets or benefits in the balance sheet or income statement until such time as the use of the surplus is clearly defined. For underfunded plans, the Company recognizes actuarial liabilities and results arising from the actuarial valuation.
![]()
Notes to the Financial Statements (Continued)
Expressed in millions of United States dollar, unless otherwise stated
29. Employee benefits (Continued)
For overfunded plans, the Company does not recognize any assets or benefits in the statement of financial position or income statement until such time as the use of the surplus is clearly defined. For underfunded plans, the Company recognizes actuarial liabilities and results arising from the actuarial valuation.
Critical accounting estimates and judgments
Post-retirement benefits for employees
—The amountamounts recognized and disclosed depend on a number of factors that are determined based on actuarial calculations using various assumptions in order to determine costs and liabilities. One of these assumptions is selection and use of the discount rate. Any changes to these assumptions will affect the amount recognized.
At the end of each year the Company and external actuaries review the assumptions that will be used for the following year. These assumptions are used in determining the fair values of assets and liabilities, costs and expenses and the future values of estimated cash outflows, which are recorded in the plan obligations.
30. Stockholders' equity
a) Share capital
Stockholders' equity is represented by commonAs at December 31, 2018, the share capital was US$61,614 corresponding to 5,284,474,782 shares ("ON")issued and preferred non-redeemable shares ("PNA")fully paid without par value. Preferred shares have the same rights as common shares, with the exception of voting rights to elect members of the Board of Directors.
| | | December 31, 2018 | ||||||
|---|---|---|---|---|---|---|---|---|
| Stockholders | | ON | | PNE | | Total | ||
Litel Participações S.A. and Litela Participações S.A. | | 1,075,773,534 | | – | | 1,075,773,534 | ||
BNDES Participações S.A. | | 342,484,176 | | – | | 342,484,176 | ||
Bradespar S.A. | | 296,009,366 | | – | | 296,009,366 | ||
Mitsui & Co., Ltd | | 286,347,055 | | – | | 286,347,055 | ||
Foreign investors—ADRs | | 1,211,272,764 | | – | | 1,211,272,764 | ||
Foreign institutional investors in local market | | 1,235,808,225 | | – | | 1,235,808,225 | ||
FMP—FGTS | | 54,638,358 | | – | | 54,638,358 | ||
PIBB—Fund | | 2,300,038 | | – | | 2,300,038 | ||
Institutional investors | | 332,021,902 | | – | | 332,021,902 | ||
Retail investors in Brazil | | 289,602,980 | | – | | 289,602,980 | ||
Brazilian Government (Golden Share) | | – | | 12 | | 12 | ||
| | | | | | | | ||
Outstanding shares | | 5,126,258,398 | | 12 | | 5,126,258,410 | ||
Shares in treasury | | 158,216,372 | | – | | 158,216,372 | ||
| | | | | | | | ||
Total issued shares | | 5,284,474,770 | | 12 | | 5,284,474,782 | ||
| | | | | | | | ||
| | | | | | | | ||
| | | | | | | | ||
Share capital per class of shares (in millions) | | 61,614 | | – | | 61,614 | ||
Total authorized shares | | 7,000,000,000 | | – | | 7,000,000,000 | ||
The Board of Directors may, regardless of changes to bylaws,by-laws, issue new common shares (authorized capital)(up to the total authorized shares), including the capitalization of profits and reserves to the extent authorized.
| | | | |
| | F-91 | | |
![]()
Notes to the Financial Statements (Continued)
Expressed in millions of United States dollar, unless otherwise stated
30. Stockholders' equity (Continued)
The Company repurchases its shares to hold in treasury for future sale or cancellation. These shares are recorded in a specific account as a reduction of stockholders´ equity at their acquisition value and carried at cost. These programs are approved by the Board of Directors with a determined terms and numbers of typenumber of shares.
Incremental costs directly attributable to the issue of new shares or options are recognized in stockholders' equity as a deduction from the amount raised, net of taxestaxes.
b) Share buyback program
The Company concluded in November 2018, share buyback program for Vale's common shares and their respective ADSs approved by the Board of Directors on July 25, 2018, and repurchased a total of 71,173,683 common shares, at an average price of US$14.05 per share, for a total aggregate purchase price of US$1,000. The shares were acquired in the stock market based on regular trading conditions. The shares acquired are held in treasury for future sale or cancellation.
c) Remuneration to the Company's stockholders
The Company's by-laws determine the minimum remuneration to stockholders of 25% of net income, after appropriations to legal reserve and tax incentive reserve, as follows:
| | 2018 | |
|---|---|---|
Net income of the year | | 6,860 |
Appropriation to legal reserve | | (343) |
Appropriation to tax incentive reserve | | (401) |
| | | |
Net income after appropriations to legal reserve and tax incentive reserve | | 6,116 |
Minimum mandatory remuneration(i) | | 1,529 |
Stockholders' remuneration paid in September, 2018 | | (2,054) |
Appropriation to investments reserve | | (4,062) |
The Company approved in March, 2018, the new policy of stockholders' remuneration of the Company, approved in March 2018, which provides for a semi-annual payment of 30% of Adjusted EBITDA less sustaining capital. In September, 2018, the Company paid stockholders' remuneration in the amount of US$1,876 (US$0.360951164 per share), US$1,659 based on the interest on capital and US$217 based on dividends, for the first half of 2018 approved by Board of Directors on July 25, 2018. This payment comprises the minimum mandatory remuneration for the year ended December 31, 2018.
Following the Brumadinho dam failure (as described on note 3), Vale has determined the suspension of the Shareholder Remuneration Policy and any other deliberation on shares buyback.
| | | | |
| | F-92 | | |
![]()
Notes to the Financial Statements (Continued)
Expressed in millions of United States dollar, unless otherwise stated
30. Stockholders' equity (Continued)
At December 31, 2016The remuneration paid to stockholders based on the on interest on capital and 2015, share capital wasdividends during 2018 and 2017 amounted US$61,614 corresponding to 5,244,316,120 shares issued3,313 (US$0.636637439 per share) and fully paid without par value.US$1,456 (US$0.282400343 per share), respectively.
| | | December 31, 2016 | | |||||||
|---|---|---|---|---|---|---|---|---|---|---|
Stockholders | | ON | | PNA | | Total | | |||
Valepar S.A. | | 1,716,435,045 | | 20,340,000 | | 1,736,775,045 | | |||
Brazilian Government (Golden Share) | | – | | 12 | | 12 | | |||
Foreign investors—ADRs | | 786,067,634 | | 610,880,671 | | 1,396,948,305 | | |||
FMP—FGTS | | 70,662,746 | | – | | 70,662,746 | | |||
PIBB—BNDES | | 741,730 | | 1,171,101 | | 1,912,831 | | |||
BNDESPar | | 206,378,882 | | 66,185,272 | | 272,564,154 | | |||
Foreign institutional investors in local market | | 262,868,264 | | 825,753,408 | | 1,088,621,672 | | |||
Institutional investors | | 104,510,549 | | 133,496,260 | | 238,006,809 | | |||
Retail investors in Brazil | | 37,988,150 | | 309,895,202 | | 347,883,352 | | |||
| | | | | | | | | |||
Shares outstanding | | 3,185,653,000 | | 1,967,721,926 | | 5,153,374,926 | | |||
Shares in treasury | | 31,535,402 | | 59,405,792 | | 90,941,194 | | |||
| | | | | | | | | |||
Total issued shares | | 3,217,188,402 | | 2,027,127,718 | | 5,244,316,120 | | |||
| | | | | | | | | |||
| | | | | | | | | |||
| | | | | | | | | |||
Amounts per class of shares (in millions) | | 38,525 | | 23,089 | | 61,614 | | |||
| | | | | | | | | |||
| | | | | | | | | |||
| | | | | | | | | |||
Total authorized shares | | 3,600,000,000 | | 7,200,000,000 | | 10,800,000,000 | | |||
| | | | | | | | | |||
| | | | | | | | | |||
| | | | | | | | | |||
b)d) Profit reserves
The amount of profit reserves areis distributed as follows:
| | | Investments reserve | | Legal reserve | | Tax incentive reserve | | Additional Remuneration reserve | | Total of profit reserves | | | Legal reserve | | Tax incentive reserve | | Investments reserve | | Additional remuneration reserve | | Total of profit reserves | |||||||||||||||||||
|---|---|---|---|---|---|---|---|---|---|---|---|---|---|---|---|---|---|---|---|---|---|---|---|---|---|---|---|---|---|---|---|---|---|---|---|---|---|---|---|---|
Balance as at December 31, 2014 | | | 16,794 | | | 3,061 | | | 130 | | | – | | | 19,985 | | | |||||||||||||||||||||||
Balance as at December 31, 2016 | | 1,384 | | 377 | | 1,808 | | 634 | | 4,203 | ||||||||||||||||||||||||||||||
| | | | | | | | | | | | | | | | | | | | | | | |||||||||||||||||||
Allocation of Income | | 275 | | 216 | | 3,541 | | – | | 4,032 | ||||||||||||||||||||||||||||||
Dividends and interest on capital of Vale's stockholders | | | (1,500 | ) | | – | | | – | | | – | | | (1,500 | ) | | | – | | – | | – | | (658 | ) | (658) | |||||||||||||
Allocation of loss | | | (10,859 | ) | | (1,176 | ) | | (94 | ) | | – | | | (12,129 | ) | | |||||||||||||||||||||||
Translation adjustment | | | (4,435 | ) | | (900 | ) | | (36 | ) | | – | | | (5,371 | ) | | | (29 | ) | (13 | ) | (140 | ) | 24 | | (158) | |||||||||||||
| | | | | | | | | | | | | | | | | | | | | | | |||||||||||||||||||
Balance as at December 31, 2015 | | | – | | | 985 | | | – | | | – | | | 985 | | | |||||||||||||||||||||||
Balance as at December 31, 2017 | | 1,630 | | 580 | | 5,209 | | – | | 7,419 | ||||||||||||||||||||||||||||||
| | | | | | | | | | | | | | | | | | | | | | | |||||||||||||||||||
Allocation of Income | | | 1,808 | | | 204 | | | 377 | | | 634 | | | 3,023 | | | | 343 | | 401 | | 4,062 | | – | | 4,806 | |||||||||||||
Translation adjustment | | | – | | | 195 | | | – | | | – | | | 195 | | | | (251 | ) | (99 | ) | (907 | ) | – | | (1,257) | |||||||||||||
| | | | | | | | | | | | | | | | | | | | | | | |||||||||||||||||||
Balance as at December 31, 2016 | | | 1,808 | | | 1,384 | | | 377 | | | 634 | | | 4,203 | | | |||||||||||||||||||||||
Balance as at December 31, 2018 | | 1,722 | | 882 | | 8,364 | | – | | 10,968 | ||||||||||||||||||||||||||||||
| | | | | | | | | | | | | | | | | | | | | | | | ||||||||||||||||||
| | | | | | | | | | | | | | | | | | | | | | | |||||||||||||||||||
Investment reserve—aims to ensure the maintenance and development of activities that comprise the Company's operations in an amount not exceeding 50% of distributable annual net income, limited to the share capital amount.
Legal reserve—isIs a legal requirement for Brazilian public companies to retain 5% of the annual net income up to 20% of the capital. The reserve can only be used to compensate losses or to increase capital.
Tax incentive reserve—Results from the option to designate a portion of the income tax for investments in projects approved by the Brazilian Government as well as tax incentives.
Investment reserve—Aims to ensure the maintenance and development of the main activities that comprise the Company's operations and to retain budgeted capital for investments. Based on the Company's by-laws, this reserve is capped to 50% of the annual distributable net income, up to the amount of the share capital. The remaining balance over 50% of the annual distributable net income is retained based on the capital investments budget submitted for approval in the Stockholders' Meeting, pursuant to article 196 of the Law 6,404.
Additional remuneration reserve—Arises from the remuneration proposed by Management that exceeds the mandatory minimum remuneration of 25% of the adjusted net income.
| | | | |
| | F-93 | | |
![]()
Notes to the Financial Statements (Continued)
Expressed in millions of United States dollar, unless otherwise stated
30. Stockholders' equity (Continued)
Tax incentive reserve—results from the option to designate a portion of the income tax for investments in projects approved by the Brazilian Government as well as tax incentives.
Additional remuneration reserve—Results from the portion of management proposed remuneration that exceeds the mandatory minimum remuneration of 25% of the adjusted net income as presented below established in the Company's by-laws.
| | | Retirement benefit obligations | | Cash flow hedge | | Available-for-sale financial instruments | | Conversion shares | | Total gain (losses) | | | Retirement benefit obligations | | Fair value adjustment to investment in equity securities | | Conversion shares | | Total gain (losses) | ||||||||||||||||||
|---|---|---|---|---|---|---|---|---|---|---|---|---|---|---|---|---|---|---|---|---|---|---|---|---|---|---|---|---|---|---|---|---|---|---|---|---|---|
Balance as at December 31, 2014 | | | (845 | ) | | | (453 | ) | | | (2 | ) | | | (413 | ) | | | (1,713 | ) | | ||||||||||||||||
Balance as at December 31, 2016 | | (809 | ) | – | | (338 | ) | (1,147) | |||||||||||||||||||||||||||||
| | | | | | | | | | | | | | | | | | | | | ||||||||||||||||||
Other comprehensive income | | | 70 | | | 447 | | | 1 | | | – | | | 518 | | | | (46 | ) | – | | – | | (46) | ||||||||||||
Translation adjustment | | | 72 | | | – | | | – | | | 131 | | | 203 | | | | 10 | | – | | – | | 10 | ||||||||||||
| | | | | | | | | | | | | | | | | | | | | ||||||||||||||||||
Balance as at December 31, 2015 | | | (703 | ) | | | (6 | ) | | | (1 | ) | | | (282 | ) | | | (992 | ) | | ||||||||||||||||
Balance as at December 31, 2017 | | (845 | ) | – | | (338 | ) | (1,183) | |||||||||||||||||||||||||||||
| | | | | | | | | | | | | | | | | | | | | ||||||||||||||||||
Other comprehensive income | | | (70 | ) | | 7 | | | 1 | | | – | | | (62 | ) | | | 41 | | 60 | | – | | 101 | ||||||||||||
Translation adjustment | | | (36 | ) | | (1 | ) | | – | | | (56 | ) | | (93 | ) | | | 49 | | – | | – | | 49 | ||||||||||||
| | | | | | | | | | | | | | | | | | | | | ||||||||||||||||||
Balance as at December 31, 2016 | | | (809 | ) | | | – | | | – | | | (338 | ) | | | (1,147 | ) | | ||||||||||||||||||
Balance as at December 31, 2018 | | (755 | ) | 60 | | (338 | ) | (1,033) | |||||||||||||||||||||||||||||
| | | | | | | | | | | | | | | | | | | | | | |||||||||||||||||
| | | | | | | | | | | | | | | | | | | | | ||||||||||||||||||
d) Remuneration tof) Vale's corporate governance restructuring in 2017
At the Company'sGeneral Extraordinary Stockholders' Meeting, held on June 27, 2017, stockholders
approved the corporate restructuring of the Company proposed by Valepar S.A. (former controlling stockholder). The corporate restructuring was based on (i) conversion of Vale class "A" preferred shares into common shares; (ii) amendment of Vale's by-laws, determineso as to adjust to Novo Mercado rules; and (iii) the minimum remuneration to stockholdersmerger of 25%Valepar S.A. into Vale.
(i) Conversion of net income, after adjustments from Brazil's legal requirements which based on our adjusted net income as shown below resulted in R$3,459 (US$1,061). In December, 2016 R$857 (US$250) was anticipated and the remaining balance of R$2,602 (US$811) was accounted for in short term liability as "Dividends and interest on capital". Additionally, in our by-laws preferred shares and merger of Valepar S.A.
At the General Extraordinary Stockholders' Meeting, held on June 27, 2017, stockholders approved the voluntary conversion of Vale class A are entitled to receive priority dividends corresponding to (i) at least 3% (three percent) of the shareholders' equity share value, calculated"A" preferred shares into common shares ("ON"), based on the financial statements used as referenceconversion rate of 0.9342 common shares for each Vale class "A" preferred share.
On August 11, 2017, the paymentvoluntary conversion period expired and an aggregate of dividends or (ii) 6% (six percent) calculated over1,660,581,830 preferred shares (excluding treasury shares), corresponding to 84.4% of the parttotal outstanding preferred shares, were converted into common shares.
At the Extraordinary Stockholders' Meeting of capital represented by this class of shares, whichever is the higher among them. Accordingly, management proposed and the Board of DirectorsValepar S.A, held on August 14, 2017, stockholders approved the proposalmerger of Valepar with and into Vale. Thereafter, Valepar ceases to exist and, as consequence, its stockholders hold direct interests in Vale, through the 1.2065 Vale common shares received for additional dividends payments of R$2,065 (US$634)each Valepar share held by them. As a result, Vale issued 173,543,667 new common shares to equalize preferredValepar's stockholders, all registered and common share remuneration. The amountwithout par value.
On August 14, 2017, the merger was classifiedaccounted in Vale's stockholders' equity as "Additional Remuneration reserve" until it is approved in the annual general meeting. All remuneration paid and proposed during the year wascapital reserve, based on interest on equity.the accounting appraisal report of Valepar's net assets, amounting to US$1,158.
| | | | |
| | F-94 | | |
![]()
Notes to the Financial Statements (Continued)
Expressed in millions of United States dollar, unless otherwise stated
30. Stockholders' equity (Continued)
The proposal of stockholders' remuneration was calculatedimpacts arising from the merger in R$. The equivalent amount in US$the Company's assets and liabilities are as follows:
| | | |||
|---|---|---|---|---|
| | |||
| | |||
| | |||
Current liabilities | 20 | |||
Provisions for litigation | | 631 | ||
Taxes payable | | 130 | ||
| | | | ||
Net assets | | 1,158 | ||
| | | | ||
| ||||
| ||||
| ||||
| | | | ||
| | | | ||
| ||||
| ||||
| ||||
| ||||
| ||||
| ||||
At the Extraordinary Stockholders' Meeting and at the Special Stockholders' Meeting, held on October 18, 2017, preferred stockholders approved the conversion of all Class "A" preferred shares into common shares of the Company, in the proportion of 0.9342 common share for each class "A" preferred share. During the period from October 20, 2017 until November 21, 2017, inclusive, the stockholders holding Vale's Class "A" preferred shares dissenting with regard to the resolution of the Special Meeting, had the right to withdraw from the Company, receiving R$24.26 per share which is the equivalent of Vale stockholders' equity per share at December 31, 2016. At the end of this period, 10,397 common shares were converted into treasury shares (corresponding to 11,130 preferred shares).
At the Extraordinary Stockholders' Meeting held on December 21, 2017 stockholders' approved the migration of the Company to the special listing segment of B3 S.A. ("Novo Mercado"), following the conversion of the class "A" preferred shares into common shares.
The amounts paidstockholders' equity corresponds to stockholders, by nature5,284,474,770 common shares and 12 preferred shares special class ("PNE" or "Golden shares"), and there were no changes in the amount of remuneration, are as follows:share capital.
| | | Dividends | | Interest on capital | | Total | | Amount per share | | | Share position before conversion | | Conversion of the preferred shares | | Issue of new shares | | Share position after conversion | |||||||||||||||
|---|---|---|---|---|---|---|---|---|---|---|---|---|---|---|---|---|---|---|---|---|---|---|---|---|---|---|---|---|---|---|---|---|
Amounts paid in 2014 | | | | | | | | | | | ||||||||||||||||||||||
First installment—April | | | – | | | 2,100 | | | 2,100 | | | 0.407499945 | | | ||||||||||||||||||
Second installment—October | | | 717 | | | 1,383 | | | 2,100 | | | 0.407499945 | | | ||||||||||||||||||
Shares outstanding | | | | | ||||||||||||||||||||||||||||
ON | | 3,185,653,000 | | 1,838,235,414 | | 173,543,667 | | 5,197,432,081 | ||||||||||||||||||||||||
PNA/PNE | | 1,967,721,926 | | (1,967,721,914 | ) | – | | 12 | ||||||||||||||||||||||||
| | | | | | | | | | | | | | | | | | | | ||||||||||||||
Total | | | 717 | | | 3,483 | | | 4,200 | | | | | |||||||||||||||||||
| | 5,153,374,926 | | (129,486,500 | ) | 173,543,667 | | 5,197,432,093 | |||||||||||||||||||||||||
Shares in treasury | | | | | ||||||||||||||||||||||||||||
ON | | 31,535,402 | | 55,507,287 | | – | | 87,042,689 | ||||||||||||||||||||||||
PNA | | 59,405,792 | | (59,405,792 | ) | – | | – | ||||||||||||||||||||||||
| | | | | | | | | | ||||||||||||||||||||||||
Total issued shares | | 5,244,316,120 | | (133,385,005 | ) | 173,543,667 | | 5,284,474,782 | ||||||||||||||||||||||||
| | | | | | | | | | | | | | | | | | | | | |||||||||||||
| | | | | | | | | | | | | | | | | | | | ||||||||||||||
Amounts paid in 2015 | | | | | | | | | | | ||||||||||||||||||||||
First installment—April | | | – | | | 1,000 | | | 1,000 | | | 0.194047593 | | | ||||||||||||||||||
Second installment—October | | | 500 | | | – | | | 500 | | | 0.097023796 | | | ||||||||||||||||||
| | | | | | | | | | | | ||||||||||||||||||||||
Total | | | 500 | | | 1,000 | | | 1,500 | | | | | |||||||||||||||||||
| | | | | | | | | | | | ||||||||||||||||||||||
| | | | | | | | | | | | | | | | ||||||||||||||||||
| | | | | | | | | | | | ||||||||||||||||||||||
Amounts paid in 2016 | | | | | | | | | | | ||||||||||||||||||||||
First installment—December | | | – | | | 250 | | | 250 | | | 0.048511898 | | | ||||||||||||||||||
| | | | | | | | | | | | ||||||||||||||||||||||
Total | | | – | | | 250 | | | 250 | | | | | |||||||||||||||||||
| | | | | | | | | | | | ||||||||||||||||||||||
| | | | | | | | | | | | | | | | ||||||||||||||||||
| | | | | | | | | | | | ||||||||||||||||||||||
e) New shareholders' agreement—Subsequent event.g) Shareholders Agreement
On February 20,the date of the merger of Valepar into Vale, August 14, 2017, the Company announced thatformer Controlling Shareholders of Valepar executed a new shareholders' agreement was filed at("Vale Agreement") that binds only 20% of the Company's headquarters, executed by Litel Participações S.A., Litela Participações S.A., Bradespar S.A., Mitsui & Co., Ltd. and BNDES Participações S.A.—BNDESPAR ("Valepar Agreement"), as shareholders of Valepar S.A. ("Valepar"), jointly referred to as "Shareholders", which shall enter into force after the expiration of Valepar's current Shareholders' Agreement on May 10, 2017.totality
| | | | |
| | F-95 | | |
![]()
Notes to the Financial Statements (Continued)
Expressed in millions of United States dollar, unless otherwise stated
30. Stockholders' equity (Continued)
The Valepar Agreement, along with the standard provisions in connection with voting rights and right of first refusal for the acquisition of the Shareholders' shares, provides for the submission to the Company of a proposal for the purpose of enabling the listing of Vale on BM&FBOVESPA's Novo Mercado special segment (Brazil) and making Vale a company without defined control ("Proposal"). The Proposal is binding on the Shareholders, and it is subject to approval by the Company's corporate bodies. The Valepar Agreement will have a term of 6 months, counting from the date it takes effect.
The transaction envisaged by the Proposal is composed of a series of indivisible and interdependent steps, whose effectiveness is subject to the successful performance of the other steps. The Proposal comprises, beyond the performance of all acts and procedures imposed by the applicable legal provisions and rules:
(i) Voluntary conversion of Vale class A preferred shares into common shares, based on the conversion rate of 0.9342 common shares for each Vale class A preferred share, based on the average closing price of the common shares and preferred shares over the last 30 trading sessions on the BM&FBOVESPA prior to February 17, 2017 (inclusive), weighted by the volume of shares traded in such trading sessions;
(ii) Amendment of Vale's bylaws, so as to adjust it, as much as possible, to BM&FBOVESPA's Novo Mercado special segment rules so Vale may be effectively listed on such special segment;
(iii) The merger of Valepar into Vale at an exchange ratio that contemplates a 10% increase in the number of shares held by the shareholders of Valepar compared to Valepar's current shareholding interest, and represents a dilution of approximately 3% of the shareholding interest held by the other shareholders in Vale.
In line with the provisions of item "iii" above, Valepar's shareholders will receive 1.2065 Vale common shares for each Valepar share held by them. As a result, Vale will issue 173,543,667 new common shares, all registered and without par value, in favor of Valepar's shareholders. Consequently, Valepar's shareholders will own a total of 1,908,980,340 Vale common shares after the merger of Valepar.
The goodwill balance carried on Valepar's financial statements and its potential tax benefit use by Vale will not be subject to capitalization in favor of Valepar's shareholders, but will be for the benefit of all Vale's shareholders. Valepar will hold at the time of the merger enough cash and cash equivalents to fully settle its liabilities.
The implementation of the Proposal is subject to (i) the approval of the Proposal, including the merger of Valepar into Vale, by Valepar's and Vale's corporate bodies; and (ii) the acceptance by at least 54.09% of class A preferred shares of the voluntary conversion, as mentioned in item "i" above, within the maximum term of 45 days from the shareholders' meeting decision on the matter, resulting in a combined shareholding interest held by the Shareholders of less than 50% of Vale's total common shares. Valepar and the Shareholders will not exercise their voting right at Vale's shareholders' meetings that consider the voluntary conversion of the Vale class A preferred shares into common shares and the merger of Valepar.
![]()
Notes to the Financial Statements (Continued)
Expressed in millions of United States dollar, unless otherwise stated
30. Stockholders' equity (Continued)
The holders of American Depositary Shares representing class A preferred shares of Vale will be able to elect voluntary conversion into American Depositary Shares representing common shares of Vale, on the same terms available to holders of class A preferred shares. Class A preferred shares, and preferred ADSs, that do not elect voluntary conversion will remain outstanding.
On the date of effectiveness of the merger of Valepar into Vale, if the merger is approved, the Shareholders will execute a new shareholders' agreement ("Vale Agreement") that will bind only 20% of the totality of Vale's common shares issued by Vale, and will be in force until November 9, 2020, with no provision for renewal.
For 6 months from the date of entry into force of the Vale Agreement, the Shareholders will be obligated not to transfer, by any means, either directly or indirectly, Vale shares they receive as a result of the implementation of the Proposal ("Lock-Up"), except for (i) the transfer of Vale's shares by the Shareholders to their affiliates and their current shareholders, provided that such transferred shares shall remain subject to the Lock-Up, and (ii) the transfer of shares held by the Shareholders prior to the merger of Valepar.
Accounting policy
Stockholder's remuneration—The stockholder's remuneration is paid on dividends and interest on capital. This remuneration is recognized as a liability in the financial statements of the Company based on bylaws. Any amount above the minimum compulsorymandatory remuneration approved by the bylawsby-laws shall only be recognized in current liabilities on the date that is approved by stockholders.
The Company is permitted to distribute interest attributable to stockholders' equity. The calculation is based on the stockholders' equity amounts as stated in the statutory accounting records and the interest rate applied may not exceed the Brazilian Government Long-term Interest Rate ("TJLP") determined by the Central Bank of Brazil. Also, such interest may not exceed 50% of the net income for the year or 50% of retained earnings plus profit reserves as determined by Brazilian corporate law.
The benefit to the Company, as opposed to making a dividend payment, is a reduction in the income tax burden because this interest charge is tax deductible in Brazil. Income tax of 15% is withheld on behalf of the stockholders relative to the interest distribution. Under Brazilian law, interest attributed to stockholders' equity is considered as part of the annual minimum mandatory dividend. This notional interest distribution is treated for accounting purposes as a deduction from stockholders' equity in a manner similar to a dividend and the tax deductibility recorded in the income statement.
The Company's related parties are subsidiaries, joint ventures, associates, stockholders and its related entities and key management personnel of the Company. Transactions between the parent company and its subsidiaries are eliminated on consolidation and are not disclosed in this note.
Related party transactions were made by the Company on terms equivalent to those that prevail in arm´s-length transactions, with respect to price and market conditions that are no less favorable to the Company than those arranged with third parties.
Purchases, accounts receivable and other assets, and accounts payable and other liabilities relate largely to amounts charged by joint ventures and associates related to the pelletizing plants operational lease and railway transportation services.
| | | | |
| | F-96 | | |
![]()
Notes to the Financial Statements (Continued)
Expressed in millions of United States dollar, unless otherwise stated
31. Related parties (Continued)
Information about related party transactions and effects on the financial statements is set out below:
a) Transactions with related parties are made by the Company at arm´s-length, observing the price and usual market conditions and therefore do not generate any undue benefit
| | | Year ended December 31 | |||||||||
|---|---|---|---|---|---|---|---|---|---|---|---|
| | | 2018 | |||||||||
| | | Joint Ventures | | Associates | | Major stockholders | | Total | |||
Net operating revenue | | 352 | | 309 | | 207 | | 868 | |||
Cost and operating expenses | | (2,269 | ) | (39 | ) | – | | (2,308) | |||
Financial result | | 115 | | – | | (115 | ) | – | |||
| | | Year ended December 31 | |||||||||
|---|---|---|---|---|---|---|---|---|---|---|---|
| | | 2017 | |||||||||
| | | Joint Ventures | | Associates | | Major stockholders | | Total | |||
Net operating revenue | | 399 | | 337 | | 146 | | 882 | |||
Cost and operating expenses | | (1,943 | ) | (29 | ) | (29 | ) | (2,001) | |||
Financial result | | 118 | | (14 | ) | (819 | ) | (715) | |||
| | | Year ended December 31 | |||||||||
|---|---|---|---|---|---|---|---|---|---|---|---|
| | | 2016 | |||||||||
| | | Joint Ventures | | Associates | | Major stockholders | | Total | |||
Net operating revenue | | 166 | | 345 | | 141 | | 652 | |||
Cost and operating expenses | | (916 | ) | (51 | ) | (37 | ) | (1,004) | |||
Financial result | | (29 | ) | 1 | | (882 | ) | (910) | |||
Net operating revenue relates to their counterparties or losssale of iron ore to the Company.
In the normal course of operations, Vale enters into contracts with related parties (associates, joint venturessteelmakers and stockholders), relatedright to use capacity on railroads. Cost and operating expenses mostly relate to the sale and purchaseoperational leases of products and services, loans, derivatives, leasing of assets, sale of raw material and railway transportation services.the pelletizing plants.
| | | | |
| | F-97 | | |
![]()
Notes to the Financial Statements (Continued)
Expressed in millions of United States dollar, unless otherwise stated
31. Related parties (Continued)
Theb) Outstanding balances of thesewith related party transactions and their effects on the financial statements are as follows:parties
| | | | | | | | | | | Assets | | ||||||||||||||||||||||||||||||
|---|---|---|---|---|---|---|---|---|---|---|---|---|---|---|---|---|---|---|---|---|---|---|---|---|---|---|---|---|---|---|---|---|---|---|---|---|---|---|---|---|---|
| | | December 31, 2016 | | December 31, 2015 | | ||||||||||||||||||||||||||||||||||||
| | | Cash and cash equivalents | | Derivative financial instruments | | Accounts receivable | | Related parties | | Cash and cash equivalents | | Derivative financial instruments | | Accounts receivable | | Related parties | | ||||||||||||||||||||||||
Banco Bradesco S.A. | | | 522 | | | | 324 | | | | – | | | | – | | | | 37 | | | | 66 | | | | – | | | | – | | | ||||||||
Banco do Brasil S.A. | | | 57 | | | | 34 | | | | – | | | | – | | | | 395 | | | | 16 | | | | – | | | | – | | | ||||||||
Companhia Coreano-Brasileira de Pelotização | | | – | | | | – | | | | – | | | | 5 | | | | – | | | | – | | | | – | | | | 6 | | | ||||||||
Companhia Hispano-Brasileira de Pelotização | | | – | | | | – | | | | 1 | | | | – | | | | – | | | | – | | | | 1 | | | | 4 | | | ||||||||
Companhia Ítalo-Brasileira de Pelotização | | | – | | | | – | | | | – | | | | 8 | | | | – | | | | – | | | | – | | | | 8 | | | ||||||||
Companhia Nipo-Brasileira de Pelotização | | | – | | | | – | | | | – | | | | 15 | | | | – | | | | – | | | | – | | | | 9 | | | ||||||||
Companhia Siderúrgica do Pecem | | | – | | | | – | | | | 37 | | | | – | | | | – | | | | – | | | | – | | | | – | | | ||||||||
Consórcio Rebocadores da Baia de São Marcos | | | – | | | | – | | | | 10 | | | | – | | | | – | | | | – | | | | 15 | | | | – | | | ||||||||
Mitsui & Co., Ltd. | | | – | | | | – | | | | 4 | | | | – | | | | – | | | | – | | | | 1 | | | | – | | | ||||||||
MRS Logística S.A. | | | – | | | | – | | | | – | | | | 24 | | | | – | | | | – | | | | – | | | | 17 | | | ||||||||
VLI | | | – | | | | – | | | | 9 | | | | 12 | | | | – | | | | – | | | | 34 | | | | 10 | | | ||||||||
Others | | | – | | | | – | | | | 46 | | | | 9 | | | | – | | | | – | | | | 27 | | | | 17 | | | ||||||||
| | | | | | | | | | | | | | | | | | | ||||||||||||||||||||||||
Total | | | 579 | | | | 358 | | | | 107 | | | | 73 | | | | 432 | | | | 82 | | | | 78 | | | | 71 | | | ||||||||
| | | | | | | | | | | | | | | | | | | ||||||||||||||||||||||||
| | | | | | | | | | | | | | | | | | | | | | | | | | | | | | | | | | | ||||||||
| | | | | | | | | | | | | | | | | | | ||||||||||||||||||||||||
| | | December 31, 2018 | | December 31, 2017 | |||||||||||||||||||
|---|---|---|---|---|---|---|---|---|---|---|---|---|---|---|---|---|---|---|---|---|---|---|---|
| | | Joint Ventures | | Associates | | Major stockholders | | Total | | Joint Ventures | | Associates | | Major stockholders | | Total | |||||||
Assets | | | | | | | | | |||||||||||||||
Cash and cash equivalents | | – | | – | | 1,256 | | 1,256 | | – | | – | | 817 | | 817 | |||||||
Accounts receivable | | 110 | | 42 | | 3 | | 155 | | 73 | | 55 | | 3 | | 131 | |||||||
Dividends receivable | | 132 | | – | | – | | 132 | | 112 | | 14 | | – | | 126 | |||||||
Loans | | 1,976 | | – | | – | | 1,976 | | 4,526 | | – | | – | | 4,526 | |||||||
Derivatives financial instruments | | – | | – | | 297 | | 297 | | – | | – | | 284 | | 284 | |||||||
Other assets | | 25 | | – | | – | | 25 | | 17 | | – | | – | | 17 | |||||||
Liabilities | | | | | | | | | |||||||||||||||
Supplier and contractors | | 221 | | 21 | | 24 | | 266 | | 192 | | 35 | | 201 | | 428 | |||||||
Loans | | – | | 1,325 | | 2,650 | | 3,975 | | – | | 1,245 | | 4,508 | | 5,753 | |||||||
Derivatives financial instruments | | – | | – | | 112 | | 112 | | – | | – | | 109 | | 109 | |||||||
Other liabilities | | 769 | | – | | – | | 769 | | 612 | | – | | 16 | | 628 | |||||||
Major stockholders
Refers to regular financial instruments with large financial institutions of which the stockholders are part of the controlling "shareholders' agreement".
Coal segment transactions
In March 2018, Nacala BV, a joint venture between Vale and Mitsui on the Nacala's logistic corridor, closed the project financing and repaid a portion of the shareholders' loans from Vale, in the amount of US$2,572. The outstanding receivable of US$1,976 carries interest at 7.44% p.a.
The loan from associates mainly relates to the loan from Pangea Emirates Ltd, part of the group of shareholders which owns 15% interest on Vale Moçambique which carries interest at 6.54% p.a.
| | | | |
| | F-98 | | |
![]()
Notes to the Financial Statements (Continued)
Expressed in millions of United States dollar, unless otherwise stated
31. Related parties (Continued)
| | | | | | | | | | | Liabilities | | ||||||||||||||||||||||||||||||
|---|---|---|---|---|---|---|---|---|---|---|---|---|---|---|---|---|---|---|---|---|---|---|---|---|---|---|---|---|---|---|---|---|---|---|---|---|---|---|---|---|---|
| | | December 31, 2016 | | December 31, 2015 | | ||||||||||||||||||||||||||||||||||||
| | | Derivative financial instruments | | Others liabilities | | Related parties | | Loans and borrowings | | Derivative financial instruments | | Others liabilities | | Related parties | | Loans and borrowings | | ||||||||||||||||||||||||
Aliança Geração de Energia S.A. | | | – | | | | 16 | | | | 38 | | | | – | | | | – | | | | 11 | | | | – | | | | – | | | ||||||||
Banco Bradesco S.A. | | | 250 | | | | – | | | | – | | | | 6 | | | | 205 | | | | 54 | | | | – | | | | 370 | | | ||||||||
Banco do Brasil S.A. | | | 45 | | | | – | | | | – | | | | 2,568 | | | | 250 | | | | – | | | | – | | | | 2,625 | | | ||||||||
BNDES | | | 72 | | | | – | | | | – | | | | 4,432 | | | | 39 | | | | – | | | | – | | | | 4,066 | | | ||||||||
BNDES Participações S.A. | | | – | | | | – | | | | – | | | | 414 | | | | – | | | | – | | | | – | | | | 371 | | | ||||||||
Companhia Coreano-Brasileira de Pelotização | | | – | | | | 3 | | | | 59 | | | | – | | | | – | | | | 4 | | | | 70 | | | | – | | | ||||||||
Companhia Hispano-Brasileira de Pelotização | | | – | | | | 39 | | | | 14 | | | | – | | | | – | | | | 37 | | | | 7 | | | | – | | | ||||||||
Companhia Ítalo-Brasileira de Pelotização | | | – | | | | – | | | | 99 | | | | – | | | | – | | | | 3 | | | | 64 | | | | – | | | ||||||||
Companhia Nipo-Brasileira de Pelotização | | | – | | | | 3 | | | | 146 | | | | – | | | | – | | | | 9 | | | | 112 | | | | – | | | ||||||||
Consórcio Rebocadores da Baía de São Marcos | | | – | | | | – | | | | – | | | | – | | | | – | | | | 8 | | | | – | | | | – | | | ||||||||
Ferrovia Centro-Atlântica S.A. | | | – | | | | – | | | | 83 | | | | – | | | | – | | | | – | | | | 68 | | | | – | | | ||||||||
Mitsui & Co., Ltd. | | | – | | | | 17 | | | | – | | | | – | | | | – | | | | 11 | | | | – | | | | – | | | ||||||||
MRS Logística S.A. | | | – | | | | 25 | | | | – | | | | – | | | | – | | | | 23 | | | | – | | | | – | | | ||||||||
Sumic Nickel Netherland B.V | | | – | | | | – | | | | 353 | | | | – | | | | – | | | | – | | | | 352 | | | | – | | | ||||||||
VLI | | | – | | | | 3 | | | | – | | | | – | | | | – | | | | – | | | | – | | | | – | | | ||||||||
Others | | | – | | | | 38 | | | | 7 | | | | – | | | | – | | | | 30 | | | | 15 | | | | – | | | ||||||||
| | | | | | | | | | | | | | | | | | | ||||||||||||||||||||||||
Total | | | 367 | | | | 144 | | | | 799 | | | | 7,420 | | | | 494 | | | | 190 | | | | 688 | | | | 7,432 | | | ||||||||
| | | | | | | | | | | | | | | | | | | ||||||||||||||||||||||||
| | | | | | | | | | | | | | | | | | | | | | | | | | | | | | | | | | | ||||||||
| | | | | | | | | | | | | | | | | | | ||||||||||||||||||||||||
![]()
Notes to the Financial Statements (Continued)
Expressed in millions of United States dollar, unless otherwise stated
31. Related parties (Continued)
| | | Year ended December 31 | | |||||||||||||||||||||||||||||||||||||||||||
|---|---|---|---|---|---|---|---|---|---|---|---|---|---|---|---|---|---|---|---|---|---|---|---|---|---|---|---|---|---|---|---|---|---|---|---|---|---|---|---|---|---|---|---|---|---|---|
| | | 2016 | | 2015 | | 2014 | | |||||||||||||||||||||||||||||||||||||||
| | | Net operating revenue | | Costs and expenses | | Financial result | | Net operating revenue | | Costs and expenses | | Financial result | | Net operating revenue | | Costs and expenses | | Financial result | | |||||||||||||||||||||||||||
Aliança Geração de Energia S.A. | | | – | | | | (132 | ) | | | – | | | | 12 | | | | – | | | | – | | | | – | | | | – | | | | – | | | |||||||||
Banco Bradesco S.A.(i) | | | – | | | | – | | | | 205 | | | | – | | | | – | | | | (75 | ) | | | – | | | | – | | | | (24 | ) | | |||||||||
Banco do Brasil S.A.(i) | | | – | | | | – | | | | (456 | ) | | | – | | | | – | | | | (374 | ) | | | – | | | | – | | | | (110 | ) | | |||||||||
Baovale Mineração S.A. | | | – | | | | (17 | ) | | | – | | | | – | | | | (24 | ) | | | – | | | | – | | | | – | | | | – | | | |||||||||
BNDES(i) | | | – | | | | – | | | | (558 | ) | | | – | | | | – | | | | (372 | ) | | | – | | | | – | | | | (199 | ) | | |||||||||
BNDES Participações S.A.(i) | | | – | | | | – | | | | (73 | ) | | | – | | | | – | | | | (50 | ) | | | – | | | | – | | | | (41 | ) | | |||||||||
California Steel Industries, Inc. | | | 12 | | | | – | | | | – | | | | – | | | | – | | | | – | | | | 183 | | | | (215 | ) | | | – | | | |||||||||
Companhia Coreano-Brasileira de Pelotização | | | – | | | | (62 | ) | | | (6 | ) | | | – | | | | (80 | ) | | | – | | | | – | | | | (97 | ) | | | – | | | |||||||||
Companhia Hispano-Brasileira de Pelotização | | | – | | | | (43 | ) | | | (4 | ) | | | – | | | | (50 | ) | | | – | | | | – | | | | (47 | ) | | | – | | | |||||||||
Companhia Ítalo-Brasileira de Pelotização | | | – | | | | (49 | ) | | | (8 | ) | | | – | | | | (66 | ) | | | – | | | | – | | | | (49 | ) | | | – | | | |||||||||
Companhia Nipo-Brasileira de Pelotização | | | – | | | | (114 | ) | | | (11 | ) | | | – | | | | (106 | ) | | | – | | | | – | | | | (155 | ) | | | – | | | |||||||||
Companhia Siderúrgica do Atlântico | | | – | | | | (6 | ) | | | – | | | | – | | | | – | | | | – | | | | – | | | | – | | | | – | | | |||||||||
Companhia Siderúrgica do Pecem | | | 132 | | | | (29 | ) | | | – | | | | – | | | | – | | | | – | | | | – | | | | – | | | | – | | | |||||||||
Ferrovia Centro Atlântica S.A. | | | 36 | | | | (28 | ) | | | (2 | ) | | | 47 | | | | (39 | ) | | | (1 | ) | | | 59 | | | | (61 | ) | | | – | | | |||||||||
Ferrovia Norte Sul S.A. | | | 16 | | | | – | | | | – | | | | – | | | | – | | | | – | | | | – | | | | – | | | | – | | | |||||||||
Mitsui & Co., Ltd. | | | 141 | | | | (37 | ) | | | – | | | | 187 | | | | – | | | | – | | | | 111 | | | | (35 | ) | | | – | | | |||||||||
MRS Logística S.A. | | | – | | | | (464 | ) | | | – | | | | – | | | | (489 | ) | | | – | | | | – | | | | (593 | ) | | | – | | | |||||||||
Samarco Mineração S.A. | | | 22 | | | | – | | | | 1 | | | | 127 | | | | – | | | | – | | | | 210 | | | | – | | | | – | | | |||||||||
VLI | | | 275 | | | | (22 | ) | | | – | | | | 251 | | | | – | | | | – | | | | 350 | | | | – | | | | 8 | | | |||||||||
Others | | | 18 | | | | (1 | ) | | | 2 | | | | 55 | | | | (44 | ) | | | 8 | | | | 102 | | | | (42 | ) | | | 19 | | | |||||||||
| | | | | | | | | | | | | | | | | | | | | |||||||||||||||||||||||||||
Total | | | 652 | | | | (1,004 | ) | | | (910 | ) | | | 679 | | | | (898 | ) | | | (864 | ) | | | 1,015 | | | | (1,294 | ) | | | (347 | ) | | |||||||||
| | | | | | | | | | | | | | | | | | | | | |||||||||||||||||||||||||||
| | | | | | | | | | | | | | | | | | | | | | | | | | | | | | | | | | | | | | | |||||||||
| | | | | | | | | | | | | | | | | | | | | |||||||||||||||||||||||||||
c) The key management personnel remuneration is as follows:
| | | Year ended December 31 | | | Year ended December 31 | |||||||||||||||||||
|---|---|---|---|---|---|---|---|---|---|---|---|---|---|---|---|---|---|---|---|---|---|---|---|---|
| | | 2016 | | 2015 | | 2014 | | | 2018 | | 2017 | | 2016 | |||||||||||
Short-term benefits | | | | | | | | | | | | |||||||||||||
Wages or pro-labor | | | 8 | | | 8 | | | 11 | | | |||||||||||||
Wages | | 8 | | 10 | | 8 | ||||||||||||||||||
Direct and indirect benefits | | | 4 | | | 6 | | | 7 | | | | 11 | | 10 | | 4 | |||||||
Bonus | | | – | | | 8 | | | 12 | | | |||||||||||||
Profit sharing program ("PLR") | | 10 | | 8 | | – | ||||||||||||||||||
| | | | | | | | | | | | | | | |||||||||||
| | | 12 | | | 22 | | | 30 | | | | 29 | | 28 | | 12 | ||||||||
Long-term benefits | | | | | | | | | | | | |||||||||||||
Shares based | | | 1 | | | 1 | | | 1 | | | | 3 | | 5 | | 1 | |||||||
Termination of position | | | 5 | | | 6 | | | – | | | |||||||||||||
Severance | | 20 | | 19 | | 5 | ||||||||||||||||||
| | | | | | | | | | | | | | | |||||||||||
| | | 18 | | | 29 | | | 31 | | | | 52 | | 52 | | 18 | ||||||||
| | | | | | | | | | | | | | | | ||||||||||
| | | | | | | | | | | | | | | |||||||||||
TableThe amounts described above include the Board of Contents
![]()
Notes toDirectors and the Financial Statements (Continued)
Expressed in millions of United States dollar, unless otherwise statedExecutive Officers.
32. Commitments
a) Base metals operationsContractual obligations
i) Nickel Operations—New Caledonia
In regardsThe table below presents the annual minimum future payments, which are required and non-cancelable, related to the construction and installationcontractual obligations of the nickel plantCompany as of December 31.
| | | 2019 | | 2020 | | 2021 | | 2022 | | 2023 and thereafter | | Total | |||||
|---|---|---|---|---|---|---|---|---|---|---|---|---|---|---|---|---|---|
Operating lease | | 250 | | 201 | | 189 | | 166 | | 1,692 | | 2,498 | |||||
Purchase obligations | | 2,677 | | 1,445 | | 548 | | 463 | | 2,194 | | 7,327 | |||||
| | | | | | | | | | | | | | |||||
Total minimum payments required | | 2,927 | | 1,646 | | 737 | | 629 | | 3,886 | | 9,825 | |||||
| | | | | | | | | | | | | | |||||
| | | | | | | | | | | | | | |||||
| | | | | | | | | | | | | | |||||
Operating lease—The Company has operating lease agreements in New Caledonia, place with third parties related to port structures and port operations, transportation services, energy plants and property leases for its operational facilities.
Vale Canada Limited ("Vale Canada") provided guarantees in respect of a special financing arrangement, structured under French tax law, to BNP Paribas (agentalso has long-term agreements for the benefitexploration and processing of certain French institutional tax investors). The guarantees relateiron ore with its joint ventures, such as the agreements to lease finance payments due from Vale Nouvelle-Calédonie S.A.S. ("VNC") to a special purpose company held bypelletizing plants in Brazil. The leases have varying terms and on renewal, the French tax investors in respect of certain assetsterms of the plant. Consistent with VNC's commitments underleases are renegotiated. The minimum future payments have been calculated considering the financing structure, these assets were substantially complete as atnon-cancellable period of the lease agreements.
The total amount of operational leasing expenses for the year ended on December 31, 2012. Vale Canada has committed that these assets will operate for a five year period following substantial completion. Vale Canada believes the likelihood of the guarantees being called upon is remote.
ii) Nickel Operations—Indonesia
In October 2014, Vale subsidiary PT Vale Indonesia Tbk ("PTVI"), a public company in Indonesia, renegotiated its agreement with the Government to operate (known as the Contract of Work ("CoW")). The renegotiation included an undertaking by PTVI to further divest 20% of its shares to Indonesian participants (approximately 20% of PTVI's shares already being registered on the Indonesian stock exchange) within five years. This undertaking will be fulfilled by PTVI's existing major shareholders, being Vale Canada2018, 2017 and Sumitomo Metal Mining, Co., Ltd., on a pro rata basis.
iii) Nickel Operations—Canada
The subsidiaries Vale Canada, Vale Newfoundland & Labrador Limited ("VNLL")2016 were US$1,044, US$805 and the Province of Newfoundland and Labrador (the "Province") signed a Development Agreement with respect to the development and operation of the Voisey's Bay mine along with certain other obligations with respect to processing in the Province and the export of nickel and copper concentrate. On December 19, 2014, the Sixth Amendment to the Development Agreement was executed. The Sixth Amendment includes operational and other key commitments in the Development Agreement. As such, under the Development Agreement, as amended, VNLL has a potential obligation secured by letters of credit and other security, which may become due and payable in the event that certain commitments in relation to the construction of the underground mine are delayed or not met.US$532, respectively.
| | | | |
| | F-99 | | |
In the course of the operations the Company has provided other letters of credit, guarantees and surety bonds in the amount of US$1.1 billion that are associated with items such as environment reclamation, asset retirement obligation commitments, insurance, electricity commitments, post-retirement benefits, community service commitments and import and export duties.
![]()
Notes to the Financial Statements (Continued)
Expressed in millions of United States dollar, unless otherwise stated
32. Commitments (Continued)
b) Participative stockholders' debentures
At the time of its privatization in 1997, Vale issued debentures to then-existing stockholders, including the Brazilian Government. The debentures' terms were set to ensure that pre-privatization stockholders would participate in potential future benefits that might be obtained from exploiting mineral resources.
A total of 388,559,056 debentures were issued with a par value of R$0.01 (one cent of Brazilian Real), whose value will be inflation-indexed the General Market Price Index ("IGP-M"), as set out in the Issue Deed. The Company paid as semiannual remuneration the amount of US$84 (R$268) and US$65 (R$209), respectively, for the year ended December 31, 2016 and 2015.
c) Others commitments
The table below sets forth the annual minimum, required and non-cancelable, future payments related to the contractual obligations assumed by the Company as of December 31.
| | | 2017 | | 2018 | | 2019 | | 2020 | | 2021 and thereafter | | |||||||||||||||
|---|---|---|---|---|---|---|---|---|---|---|---|---|---|---|---|---|---|---|---|---|---|---|---|---|---|---|
Operating lease | | | 149 | | | | 134 | | | | 131 | | | | 130 | | | | 485 | | | |||||
Purchase obligations | | | 2,572 | | | | 363 | | | | 186 | | | | 140 | | | | 1,127 | | | |||||
| | | | | | | | | | | | | |||||||||||||||
Total minimum payments required | | | 2,721 | | | | 497 | | | | 317 | | | | 270 | | | | 1,612 | | | |||||
| | | | | | | | | | | | | |||||||||||||||
| | | | | | | | | | | | | | | | | | | | | | | |||||
| | | | | | | | | | | | | |||||||||||||||
Operating lease—Vale has operating lease agreements with its joint ventures Companhia Coreano-Brasileira de Pelotização, Companhia Hispano-Brasileira de Pelotização, Companhia Ítalo-Brasileira de Pelotização and Companhia Nipo-Brasileira de Pelotização (together "pelletizing companies"), in which Vale leases their pelletizing plants. These renewable operating lease agreements have last between 3 and 10 years. The minimum future payments have been calculated considering that all contracts will be renewed automatically.
The Company also has operating leases for the exploration and processing of iron ore with joint ventures, port operations with third parties and property leases for its operational facilities with third parties.
The total amount of operational leasing expenses for the year ended on December 31, 2016, 2015 and 2014 were US$266, US$329 and US$348, respectively.
Purchase obligations—The purchase obligations derive mainly from take or pay contracts, contractsMainly relate to agreements for the acquisition of fuel, energy and the acquisition of raw materials and services.
d)b) Guarantees provided
As of December 31, 2016,2018, corporate guarantees provided by Vale (within the limit of its direct or indirect interest) for the companies Norte Energia S.A. and Companhia Siderúrgica do Pecém S.A. totaledwere US$361331 and US$1,4501,404, respectively.
The net book value of property, plant and equipment pledged to secure judicial claims on December 31, 2018 and 2017 were US$6 and US$15, respectively.
![]()
NotesThe Company´s subsidiary PT Vale Indonesia Tbk ("PTVI"), a public company in Indonesia, has an agreement in place with the Government of Indonesia to operate its mining licenses which includes a commitment to divest an additional 20% of PTVI's shares to Indonesian participants by October 2019 (approximately 20% of PTVI's shares are already registered on the Financial Statements (Continued)
Expressed in millions of United States dollar, unless otherwise statedIndonesian Stock Exchange). The existing major shareholders, Vale Canada and Sumitomo Metal Mining, Co., Ltd., will comply with the divestment obligation on a pro rata basis.
33. AdditionalVale considers that an effective risk management is key to achieve the Company's objectives and to ensure people and environmental safety, financial stability and flexibility of the Company as well as the going concern of its business.
Therefore, Vale has developed its risk management strategy in order to provide an integrated approach of the risks that the company is exposed to, considering not only the risks generated by variables traded in financial markets (market risk) and those arising from liquidity risk, but also risk from counterparties obligations (credit risk); those that are related to governance, business model and external environment (strategic risks); risks relating to inadequate or failed internal processes, people, health, safety, environmental and social (operational risk); information about derivatives financial instrumentssecurity (cybernetic risk) and internal and external compliance (compliance risk).
a) Sensitivity analysisCorporate risk management policy
The Board of derivative financial instruments
The following tables present the potential value of the instruments given hypothetical stress scenarios for the main marketDirectors established a corporate risk factors that impact the derivatives positions. The scenarios were defined as follows:
| | | | |
| | F-100 | | |
| Instrument | | Instrument's main risk events | | Scenario I | | Scenario II | | Scenario III | | |||||||||
|---|---|---|---|---|---|---|---|---|---|---|---|---|---|---|---|---|---|---|
CDI vs. US$ fixed rate swap | | R$ depreciation | | | (121 | ) | | | (658 | ) | | | (1.195 | ) | | |||
| | US$ interest rate inside Brazil decrease | | | (121 | ) | | | (134 | ) | | | (146 | ) | | ||||
| | Brazilian interest rate increase | | | (121 | ) | | | (124 | ) | | | (127 | ) | | ||||
Protected item: R$ denominated debt | | R$ depreciation | | | n.a. | | | | – | | | | – | | | |||
TJLP vs. US$ fixed rate swap | | R$ depreciation | | | (622 | ) | | | (1.115 | ) | | | (1.609 | ) | | |||
| | US$ interest rate inside Brazil decrease | | | (622 | ) | | | (648 | ) | | | (676 | ) | | ||||
| | Brazilian interest rate increase | | | (622 | ) | | | (675 | ) | | | (723 | ) | | ||||
| | TJLP interest rate decrease | | | (622 | ) | | | (660 | ) | | | (700 | ) | | ||||
Protected item:R$ denominated debt | | R$ depreciation | | | n.a. | | | | – | | | | – | | | |||
TJLP vs. US$ floating rate swap | | R$ depreciation | | | (55 | ) | | | (88 | ) | | | (120 | ) | | |||
| | US$ interest rate inside Brazil decrease | | | (55 | ) | | | (57 | ) | | | (60 | ) | | ||||
| | Brazilian interest rate increase | | | (55 | ) | | | (59 | ) | | | (62 | ) | | ||||
| | TJLP interest rate decrease | | | (55 | ) | | | (58 | ) | | | (61 | ) | | ||||
Protected item: R$ denominated debt | | R$ depreciation | | | n.a. | | | | – | | | | – | | | |||
R$ fixed rate vs. US$ fixed rate swap | | R$ depreciation | | | (13 | ) | | | (102 | ) | | | (190 | ) | | |||
| | US$ interest rate inside Brazil decrease | | | (13 | ) | | | (25 | ) | | | (38 | ) | | ||||
| | Brazilian interest rate increase | | | (13 | ) | | | (41 | ) | | | (66 | ) | | ||||
Protected item:R$ denominated debt | | R$ depreciation | | | n.a. | | | | – | | | | – | | | |||
IPCA vs. US$ fixed rate swap | | R$ depreciation | | | (51 | ) | | | (168 | ) | | | (285 | ) | | |||
| | US$ interest rate inside Brazil decrease | | | (51 | ) | | | (58 | ) | | | (66 | ) | | ||||
| | Brazilian interest rate increase | | | (51 | ) | | | (78 | ) | | | (102 | ) | | ||||
| | IPCA index decrease | | | (51 | ) | | | (64 | ) | | | (77 | ) | | ||||
Protected item: R$ denominated debt | | R$ depreciation | | | n.a. | | | | – | | | | – | | | |||
IPCA vs. CDI swap | | Brazilian interest rate increase | | | 42 | | | | (3 | ) | | | (41 | ) | | |||
| | IPCA index decrease | | | 42 | | | | 19 | | | | (2 | ) | | ||||
Protected item: R$ denominated debt linked to IPCA | | IPCA index decrease | | | n.a. | | | | (19 | ) | | | 2 | | | |||
EUR fixed rate vs. US$ fixed rate swap | | EUR depreciation | | | (52 | ) | | | (216 | ) | | | (380 | ) | | |||
| | Euribor increase | | | (52 | ) | | | (58 | ) | | | (64 | ) | | ||||
| | US$ Libor decrease | | | (52 | ) | | | (71 | ) | | | (92 | ) | | ||||
Protected item:EUR denominated debt | | EUR depreciation | | | n.a. | | | | 216 | | | | 380 | | | |||
EUR Forward | | EUR depreciation | | | (46 | ) | | | (177 | ) | | | (308 | ) | | |||
| | Euribor increase | | | (46 | ) | | | (46 | ) | | | (46 | ) | | ||||
| | US$ Libor decrease | | | (46 | ) | | | (46 | ) | | | (46 | ) | | ||||
Protected item:EUR denominated debt | | EUR depreciation | | | n.a. | | | | 177 | | | | 308 | | | |||
![]()
Notes to the Financial Statements (Continued)
Expressed in millions of United States dollar, unless otherwise stated
33. Risk management (Continued)
This policy determines that the first line of defense, that is, the owners of the control activities related to the identified risks and testing assignees of the business units, projects, administrative and support are direct responsible for identifying, assessing, remediating, monitoring and managing risk events under an integrated approach.
The Executive Risk Management Committee is the main body of the risk management structure, and is responsible to provide recommendations regarding Vale's Risk Management System and to support the Executive Board on the risk monitoring activities and with the related deliberations needed on its corporate management.
The Executive Board is in-charge for the approval of the policy deployment into rules and responsibilities directed to management and control of risks through issuing of internal normative documents.
Internal normative documents related risk management complement the corporate risk management policy and define practices, processes, controls, roles and assignments.
b) Liquidity risk management
The liquidity risk arises from the possibility that Vale might not perform its obligations on due dates, as well as face difficulties to meet its cash requirements due to market liquidity constraints.
See note 21 "Loans, borrowings and cash and cash equivalents" for details on the Company's liquidity risk.
c) Credit risk management
Vale's exposure to credit risk arises from trade receivables, derivative transactions, guarantees, down payment for suppliers and cash investments. Our credit risk management process provides a framework for assessing and managing counterparties' credit risk and for maintaining our risk at an acceptable level.
(i) Commercial credit risk management
See note 10 "Accounts receivable" for details on commercial credit risk.
(ii) Treasury credit risk management
To manage the credit exposure arising from cash investments and derivative instruments, credit limits are approved to each counterparty with whom the Company has credit exposure.
Furthermore, the Company controls the portfolio diversification and monitors different indicators of solvency and liquidity of the different counterparties that were approved for trading.
| | | | |
| | F-101 | | |
![]()
Notes to the Financial Statements (Continued)
Expressed in millions of United States dollar, unless otherwise stated
33. Risk management (Continued)
d) Market risk management
Vale is exposed to several market risk factors that can impact its cash flow. The assessment of this potential impact arising from the volatility of risk factors and their correlations is performed periodically to support the decision making process regarding the risk management strategy, that may incorporate financial instruments, including derivatives.
The portfolio of these financial instruments is monitored on a monthly basis, enabling financial results surveillance and its impact on cash flow.
Considering the nature of Vale's business and operations, the main market risk factors which the Company is exposed to are:
Foreign exchange and interest rate risk
The company's cash flow is subjected to volatility of several currencies, as its product are predominantly priced in US dollar, while most of the costs, disbursements and investments are denominated in other currencies, mainly Brazilian real and Canadian dollar.
In order to reduce the potential impact that arises from this currency mismatch, derivatives instruments may be used as a risk mitigation strategy.
Vale implements hedge transactions to protect its cash flow against the market risks that arises from its debt obligations—mainly currency volatility. The hedges cover most of the debt denominated in Brazilian reais and Euros. The Company uses swap and forward transactions to convert debt linked to Brazilian real and Euros into US dollar, with volumes, flows and settlement dates similar to those of the debt instruments—or sometimes lower, subject to market liquidity conditions.
Hedging instruments with shorter settlement dates are renegotiated through time so that their final maturity matches—or becomes closer—to the debts` final maturity. At each settlement date, the results of the swap and forward transactions partially offset the impact of the foreign exchange rate in Vale's obligations, contributing to stabilize the cash disbursements in US dollar.
Vale has also exposure to interest rate risks over loans and financings. The US Dollar floating rate debt in the portfolio consists mainly of loans including export pre-payments, commercial banks and multilateral organizations loans. In general, such debt instruments are indexed to the LIBOR (London Interbank Offer Rate) in US dollar.
| | | | |
| | F-102 | | |
![]()
Notes to the Financial Statements (Continued)
Expressed in millions of United States dollar, unless otherwise stated
33. Risk management (Continued)
Risk of product and input prices
Vale is also exposed to market risks related to volatility in commodity and input prices. In accordance with risk management policy, risk mitigation strategies involving commodities may be used to reduce Vale's cash flow volatility. The risk mitigation strategy may incorporate derivative instruments, predominantly forwards, futures and options.
e) Strategic risk management
Vale addresses the risks related to the execution of established business strategies considering the internal and external environment, as well as risks related to internal procedures and conduct consistent with the Company's values, mission and strategic objectives.
f) Operational risk management
Vale acts managing operational risks primarily guaranteeing the satisfactory management of health, safety and the environment, but also acts preventing material losses, maintenance of its productive capacity and good relationship with communities.
g) Cybernetic risk management
Vale invests in information security technology to mitigate risks of theft, breach or violation of information privacy, availability of its technology assets and data integrity on the Company's systems.
h) Compliance risk management
Vale manage risks associated with the ongoing compliance with legal requirements, standards and other regulations related to the Company's business, including the standards required on reporting and disclosing information to the market.
i) Capital management
The Company's policy aims at establishing a capital structure that will ensure the continuity of the business in the long term. Within this perspective, the Company has been able to maintain a debt profile suitable for its activities, with an amortization well distributed over the years, thus avoiding a concentration in one specific period.
j) Insurance
Vale contracts several types of insurance policies, such as operational risk policy, engineering risks insurance (projects), civil responsibility, life insurance policy for their employees, among others. The coverage of these policies is similar to the ones used in general by the mining industry and is issued in line with the objectives defined by the Company, with the corporate risk management policy and the limitation imposed by the insurance and reinsurance global market.
| | | | |
| | F-103 | | |
![]()
Notes to the Financial Statements (Continued)
Expressed in millions of United States dollar, unless otherwise stated
33. Risk management (Continued)
Insurance management is performed with the support of focal points in the various operational areas of the Company. Among the management instruments, Vale uses captive reinsurance to balance the price on reinsurance contracts with the market, as well as, enable direct access to key international markets of insurance and reinsurance.
34. Additional information about derivatives financial instruments
The risk of the derivatives portfolio is measured using the delta-Normal parametric approach, and considers that the future distribution of the risk factors and its correlations tends to present the same statistic properties verified in the historical data. The value at risk estimate considers a 95% confidence level for a one-business day time horizon.
The following tables detail the derivatives positions for Vale and its controlled companies as of December 31, 2018, with the following information: notional amount, fair value including credit risk, gains or losses in the period, value at risk and the fair value breakdown by year of maturity.
a) Foreign exchange and interest rates derivative positions
(i) Protection programs for the R$ denominated debt instruments
In order to reduce cash flow volatility, swap transactions were implemented to convert into US$ the cash flows from certain debt instruments denominated in R$ with interest rates linked mainly to CDI, TJLP and IPCA. In those swaps, Vale pays fixed or floating rates in US$ and receives payments in R$ linked to the interest rates of the protected debt instruments.
The swap transactions were negotiated over-the-counter and the protected items are the cash flows from debt instruments linked to R$. These programs transform into US$ the obligations linked to R$ to achieve
| | | | |
| | F-104 | | |
![]()
Notes to the Financial Statements (Continued)
Expressed in millions of United States dollar, unless otherwise stated
34. Additional information about derivatives financial instruments (Continued)
a currency offset in the company's cash flows, by matching its receivables—mainly linked to US$—with its payables.
| | | Notional | | | | | | Fair value | | Financial Settlement Inflows (Outflows) | | Value at Risk | | Fair value by year | | ||||||||||||||||||||||
|---|---|---|---|---|---|---|---|---|---|---|---|---|---|---|---|---|---|---|---|---|---|---|---|---|---|---|---|---|---|---|---|---|---|---|---|---|---|
| Flow | | December 31, 2018 | | December 31, 2017 | | Index | | Average rate | | December 31, 2018 | | December 31, 2017 | | December 31, 2018 | | December 31, 2018 | | 2019 | | 2020 | | 2021+ | | ||||||||||||||
CDI vs. US$ fixed rate swap | | (46 | ) | (33 | ) | (28 | ) | 6 | | (13 | ) | (21 | ) | (12 | ) | ||||||||||||||||||||||
Receivable | | | R$ | 1,581 | | | | R$ | 3,540 | | | CDI | | 98.70 | % | | | | | | | | |||||||||||||||
Payable | | | US$ | 456 | | | | US$ | 1.104 | | | Fix | | 3.12 | % | | | | | | | | |||||||||||||||
TJLP vs. US$ fixed rate swap | | (370 | ) | (381 | ) | (102 | ) | 20 | | (306 | ) | (21 | ) | (43 | ) | ||||||||||||||||||||||
Receivable | | | R$ | 2,303 | | | | R$ | 2,982 | | | TJLP + | | 1.20 | % | | | | | | | | |||||||||||||||
Payable | | | US$ | 994 | | | | US$ | 1.323 | | | Fix | | 1.54 | % | | | | | | | | |||||||||||||||
TJLP vs. US$ floating rate swap | | (56 | ) | (53 | ) | (5 | ) | 2 | | (56 | ) | – | | – | | ||||||||||||||||||||||
Receivable | | | R$ | 181 | | | | R$ | 216 | | | TJLP + | | 0.84 | % | | | | | | | | |||||||||||||||
Payable | | | US$ | 107 | | | | US$ | 123 | | | Libor + | | –1.24 | % | | | | | | | | |||||||||||||||
R$ fixed rate vs. US$ fixed rate swap | | (8 | ) | 24 | | 10 | | 19 | | 9 | | 46 | | (63 | ) | ||||||||||||||||||||||
Receivable | | | R$ | 1,078 | | | | R$ | 1,158 | | | Fix | | 7.05 | % | | | | | | | | |||||||||||||||
Payable | | | US$ | 351 | | | | US$ | 385 | | | Fix | | –0.62 | % | | | | | | | | |||||||||||||||
IPCA vs. US$ fixed rate swap | | (80 | ) | (34 | ) | 6 | | 7 | | (33 | ) | (10 | ) | (37 | ) | ||||||||||||||||||||||
Receivable | | | R$ | 1,315 | | | | R$ | 1,000 | | | IPCA + | | 6.55 | % | | | | | | | | |||||||||||||||
Payable | | | US$ | 434 | | | | US$ | 434 | | | Fix | | 3.98 | % | | | | | | | | |||||||||||||||
IPCA vs. CDI swap | | 89 | | 85 | | 1 | | – | | 5 | | 48 | | 36 | | ||||||||||||||||||||||
Receivable | | | R$ | 1,350 | | | | R$ | 1,350 | | | IPCA + | | 6.62 | % | | | | | | | | |||||||||||||||
Payable | | | R$ | 1,350 | | | | R$ | 1,350 | | | CDI | | 98.59 | % | | | | | | | | |||||||||||||||
(ii) Protection program for EUR denominated debt instruments
In order to reduce the cash flow volatility, swap transactions were implemented to convert into US$ the cash flows from certain debt instruments issued in Euros by Vale. In those swaps, Vale receives fixed rates in EUR and pays fixed rates in US$.
The swap transactions were negotiated over-the-counter and the protected items are the cash flows from debt instruments linked to EUR. The financial settlement inflows/outflows are offset by the protected items' losses/gains due to EUR/US$ exchange rate.
| | | Notional | | | | | | Fair value | | Financial Settlement Inflows (Outflows) | | Value at Risk | | Fair value by year | | ||||||||||||||||||||||
|---|---|---|---|---|---|---|---|---|---|---|---|---|---|---|---|---|---|---|---|---|---|---|---|---|---|---|---|---|---|---|---|---|---|---|---|---|---|
| Flow | | December 31, 2018 | | December 31, 2017 | | Index | | Average rate | | December 31, 2018 | | December 31, 2017 | | December 31, 2018 | | December 31, 2018 | | 2019 | | 2020 | | 2021+ | | ||||||||||||||
EUR fixed rate vs. US$ fixed rate swap | | | | | | | | | | (1 | ) | 23 | | (3 | ) | 8 | | (7 | ) | (5 | ) | 9 | | ||||||||||||||
Receivable | | | € | 500 | | | | € | 500 | | | Fix | | 3.75 | % | | | | | | | | |||||||||||||||
Payable | | | US$ | 613 | | | | US$ | 613 | | | Fix | | 4.29 | % | | | | | | | | |||||||||||||||
| | | | |
| | F-105 | | |
![]()
Notes to the Financial Statements (Continued)
Expressed in millions of United States dollar, unless otherwise stated
34. Additional information about derivatives financial instruments (Continued)
b) Commodities derivative positions
(i) Bunker Oil purchase cash flows protection program
In order to reduce the impact of bunker oil price fluctuation on maritime freight hiring/supply and, consequently, reducing the company's cash flow volatility, bunker oil hedging transactions were implemented, through options contracts.
The derivative transactions were negotiated over-the-counter and the protected item is part of Vale's costs linked to bunker oil prices. The financial settlement inflows/outflows are offset by the protected items' losses/gains due to bunker oil price changes.
| | | | | | | | | | | | | | | Financial settlement Inflows (Outflows) | | | | | | ||||||||||
|---|---|---|---|---|---|---|---|---|---|---|---|---|---|---|---|---|---|---|---|---|---|---|---|---|---|---|---|---|---|
| | | | | | | | | | | | | | | | | Fair value by year | | ||||||||||||
| | | Notional (ton) | | | | | | Fair value | | Value at Risk | | ||||||||||||||||||
| | | Bought / Sold | | Average strike (US$/ton) | | ||||||||||||||||||||||||
| Flow | | December 31, 2018 | | December 31, 2017 | | December 31, 2018 | | December 31, 2017 | | December 31, 2018 | | December 31, 2018 | | 2019 | | ||||||||||||||
Call options | | | 2,100,000 | | | – | | B | | 520 | | 1 | | – | | 40 | | 1 | | 1 | | ||||||||
Put options | | | 2,100,000 | | | – | | S | | 297 | | (29 | ) | – | | 9 | | 9 | | (29 | ) | ||||||||
| | | | | | | | | | | | | | | | | | | | | | | ||||||||
Total | | | | | | | | 28 | | – | | 49 | | 10 | | 28 | | ||||||||||||
| | | | | | | | | | | | | | | | | | | | | | | ||||||||
| | | | | | | | | | | | | | | | | | | | | | | ||||||||
| | | | | | | | | | | | | | | | | | | | | | | ||||||||
(ii) Protection programs for base metals raw materials and products
In the operational protection program for nickel sales at fixed prices, derivative transactions were implemented to convert into floating prices the contracts with clients that required a fixed price, in order to keep nickel revenues exposed to nickel price fluctuations. Those operations are usually implemented through the purchase of nickel forwards.
In the operational protection program for the purchase of raw materials and products, derivative transactions were implemented, usually through the sale of nickel and copper forward or futures, in order to reduce the mismatch between the pricing period of purchases (concentrate, cathode, sinter, scrap and others) and the pricing period of the final product sales to the clients.
The derivative transactions are negotiated at London Metal Exchange or over-the-counter and the protected item is part of Vale's revenues and costs linked to nickel and copper prices. The financial
| | | | |
| | F-106 | | |
![]()
Notes to the Financial Statements (Continued)
Expressed in millions of United States dollar, unless otherwise stated
34. Additional information about derivatives financial instruments (Continued)
settlement inflows/outflows are offset by the protected items' losses/gains due to nickel and copper prices changes.
| | | | | | | | | | | | | | | Financial settlement Inflows (Outflows) | | | | | | | | |||||||||
|---|---|---|---|---|---|---|---|---|---|---|---|---|---|---|---|---|---|---|---|---|---|---|---|---|---|---|---|---|---|---|
| | | Notional (ton) | | | | | | Fair value | | Value at Risk | | Fair value by year | | |||||||||||||||||
| | | Bought / Sold | | Average strike (US$/ton) | | |||||||||||||||||||||||||
| Flow | | December 31, 2018 | | December 31, 2017 | | December 31, 2018 | | December 31, 2017 | | December 31, 2018 | | December 31, 2018 | | 2019 | | 2020+ | | |||||||||||||
Fixed price sales protection | | | | | | | | |||||||||||||||||||||||
Nickel forwards | | 7,244 | | 9,621 | | B | | 12,166 | | (10 | ) | 24 | | 7 | | 2 | | (8 | ) | (2 | ) | |||||||||
Raw material purchase protection | | | | | | | | |||||||||||||||||||||||
Nickel forwards | | 120 | | 292 | | S | | 12,242 | | – | | – | | 1 | | – | | – | | – | | |||||||||
Copper forwards | | 81 | | 79 | | S | | 6,142 | | – | | – | | – | | – | | – | | – | | |||||||||
| | | | | | | | | | | | | | | | | | | | | | | |||||||||
Total | | | | | | (10 | ) | 24 | | 8 | | 2 | | (8 | ) | (2 | ) | |||||||||||||
| | | | | | | | | | | | | | | | | | | | | | | |||||||||
| | | | | | | | | | | | | | | | | | | | | | | |||||||||
| | | | | | | | | | | | | | | | | | | | | | | |||||||||
c) Freight derivative positions
In order to reduce the impact of maritime freight price volatility on the company's cash flow, freight hedging transactions were implemented, through Forward Freight Agreements (FFAs). The protected item is part of Vale's costs linked to maritime freight spot prices. The financial settlement inflows/outflows of the FFAs are offset by the protected items' losses/gains due to freight price changes.
The FFAs are contracts traded over the counter and can be cleared through a Clearing House, in this case subject to margin requirements.
| | | | | | | | | | | | | | | Financial settlement Inflows (Outflows) | | | | | | ||||||||
|---|---|---|---|---|---|---|---|---|---|---|---|---|---|---|---|---|---|---|---|---|---|---|---|---|---|---|---|
| | | | | | | | | | | | | | | | | Fair value by year | | ||||||||||
| | | Notional (days) | | | | | | Fair value | | Value at Risk | | ||||||||||||||||
| | | Bought / Sold | | Average strike (US$/day) | | ||||||||||||||||||||||
| Flow | | December 31, 2018 | | December 31, 2017 | | December 31, 2018 | | December 31, 2017 | | December 31, 2018 | | December 31, 2018 | | 2019 | | ||||||||||||
Freight forwards | | 480 | | – | | B | | 14,509 | | 1 | | – | | (3 | ) | – | | 1 | | ||||||||
d) Wheaton Precious Metals Corp. warrants
The company owns warrants of Wheaton Precious Metals Corp. ("Wheaton"), a Canadian company with stocks negotiated in Toronto Stock Exchange and New York Stock Exchange. Such warrants configure American call options and were received as part of the payment regarding the sale of part of gold payable flows produced as a sub product from Salobo copper mine and some nickel mines in Sudbury.
| | | | | | | | | | | | | | | Financial settlement Inflows (Outflows) | | | | | | ||||||||
|---|---|---|---|---|---|---|---|---|---|---|---|---|---|---|---|---|---|---|---|---|---|---|---|---|---|---|---|
| | | | | | | | | | | | | | | | | Fair value by year | | ||||||||||
| | | Notional (quantity) | | | | | | Fair value | | Value at Risk | | ||||||||||||||||
| | | Bought / Sold | | Average strike (US$/share) | | ||||||||||||||||||||||
| Flow | | December 31, 2018 | | December 31, 2017 | | December 31, 2018 | | December 31, 2017 | | December 31, 2018 | | December 31, 2018 | | 2023 | | ||||||||||||
Call options | | 10,000,000 | | 10,000,000 | | B | | 44 | | 8 | | 39 | | – | | 1 | | 8 | | ||||||||
| | | | |
| | F-107 | | |
![]()
Notes to the Financial Statements (Continued)
Expressed in millions of United States dollar, unless otherwise stated
34. Additional information about derivatives financial instruments (Continued)
e) Debentures convertible into shares of Valor da Logística Integrada ("VLI")
The company has debentures in which lenders have the option to convert the outstanding debt into a specified quantity of shares of VLI owned by the company.
| | | | | | | | | | | | | | | Financial settlement Inflows (Outflows) | | | | | | ||||||||
|---|---|---|---|---|---|---|---|---|---|---|---|---|---|---|---|---|---|---|---|---|---|---|---|---|---|---|---|
| | | | | | | | | | | | | | | | | Fair value by year | | ||||||||||
| | | Notional (quantity) | | | | | | Fair value | | Value at Risk | | ||||||||||||||||
| | | Bought / Sold | | Average strike (R$/share) | | ||||||||||||||||||||||
| Flow | | December 31, 2018 | | December 31, 2017 | | December 31, 2018 | | December 31, 2017 | | December 31, 2018 | | December 31, 2018 | | 2027 | | ||||||||||||
Conversion options | | 140,239 | | 140,239 | | S | | 8,006 | | (59 | ) | (57 | ) | – | | 4 | | (59 | ) | ||||||||
f) Options related to Minerações Brasileiras Reunidas S.A. ("MBR") shares
The Company entered into a stock sale and purchase agreement that has options related to MBR shares. Mainly, the Company has the right to buy back this non-controlling interest in the subsidiary. Moreover, under certain restrict and contingent conditions, which are beyond the buyer's control, such as illegality due to changes in the law, the contract has a clause that gives the buyer the right to sell back its stake to the Company. It this case, the Company could settle through cash or shares.
| | | | | | | | | | | | | | | Financial settlement Inflows (Outflows) | | | | | | ||||||||
|---|---|---|---|---|---|---|---|---|---|---|---|---|---|---|---|---|---|---|---|---|---|---|---|---|---|---|---|
| | | | | | | | | | | | | | | | | Fair value by year | | ||||||||||
| | | Notional (quantity, in millions) | | | | | | Fair value | | Value at Risk | | ||||||||||||||||
| | | Bought / Sold | | Average strike (R$/share) | | ||||||||||||||||||||||
| Flow | | December 31, 2018 | | December 31, 2017 | | December 31, 2018 | | December 31, 2017 | | December 31, 2018 | | December 31, 2018 | | 2019+ | | ||||||||||||
Options | | 2,139 | | 2,139 | | B/S | | 1.7 | | 279 | | 251 | | – | | 15 | | 279 | | ||||||||
g) Embedded derivatives in contracts
The Company has some nickel concentrate and raw material purchase agreements in which there are provisions based on nickel and copper future prices behaviour. These provisions are considered as embedded derivatives.
| | | | | | | | | | | | | | | | | Fair value by year | | |||||||
|---|---|---|---|---|---|---|---|---|---|---|---|---|---|---|---|---|---|---|---|---|---|---|---|---|
| | | Notional (ton) | | | | | | Fair value | | Value at Risk | | |||||||||||||
| | | Bought / Sold | | Average strike (US$/ton) | | |||||||||||||||||||
| Flow | | December 31, 2018 | | December 31, 2017 | | December 31, 2018 | | December 31, 2017 | | December 31, 2018 | | 2019 | | |||||||||||
Nickel forwards | | 3,763 | | 2,627 | | S | | 11,289 | | 2 | | 1 | | 1 | | 2 | | |||||||
Copper forwards | | 2,035 | | 2,718 | | S | | 6,172 | | – | | – | | – | | – | | |||||||
| | | | | | | | | | | | | | | | | | | |||||||
Total | | | | | | 2 | | 1 | | 1 | | 2 | | |||||||||||
| | | | | | | | | | | | | | | | | | | |||||||
| | | | | | | | | | | | | | | | | | | |||||||
| | | | | | | | | | | | | | | | | | | |||||||
| | | | |
| | F-108 | | |
![]()
Notes to the Financial Statements (Continued)
Expressed in millions of United States dollar, unless otherwise stated
34. Additional information about derivatives financial instruments (Continued)
The Company has also a natural gas purchase agreement in which there´s a clause that defines that a premium can be charged if the Company's pellet sales prices trade above a pre-defined level. This clause is considered an embedded derivative.
| | | | | | | | | | | | | | | Financial settlement Inflows (Outflows) | | | | | | | | |||||||||
|---|---|---|---|---|---|---|---|---|---|---|---|---|---|---|---|---|---|---|---|---|---|---|---|---|---|---|---|---|---|---|
| | | Notional (volume/month) | | | | | | Fair value | | Value at Risk | | Fair value by year | | |||||||||||||||||
| | | Bought / Sold | | Average strike (US$/ton) | | |||||||||||||||||||||||||
| Flow | | December 31, 2018 | | December 31, 2017 | | December 31, 2018 | | December 31, 2017 | | December 31, 2018 | | December 31, 2018 | | 2019 | | 2020+ | | |||||||||||||
Call options | | 746,667 | | 746,667 | | S | | 233 | | (1 | ) | (2 | ) | – | | 1 | | – | | (1 | ) | |||||||||
In August 2014 the Company sold part of its stake in Valor da Logística Integrada ("VLI") to an investment fund managed by Brookfield Asset Management ("Brookfield"). The sales contract includes a clause that establishes, under certain conditions, a minimum return guarantee on Brookfield's investment. This clause is considered an embedded derivative, with payoff equivalent to that of a put option.
| | | | | | | | | | | | | | | Financial settlement Inflows (Outflows) | | | | | | ||||||||
|---|---|---|---|---|---|---|---|---|---|---|---|---|---|---|---|---|---|---|---|---|---|---|---|---|---|---|---|
| | | | | | | | | | | | | | | | | Fair value by year | | ||||||||||
| | | Notional (quantity) | | | | | | Fair value | | Value at Risk | | ||||||||||||||||
| | | Bought / Sold | | Average strike (R$/share) | | ||||||||||||||||||||||
| Flow | | December 31, 2018 | | December 31, 2017 | | December 31, 2018 | | December 31, 2017 | | December 31, 2018 | | December 31, 2018 | | 2019+ | | ||||||||||||
Put option | | 1,105,070,863 | | 1,105,070,863 | | S | | 3.88 | | (103 | ) | (133 | ) | – | | 10 | | (103 | ) | ||||||||
h) Sensitivity analysis of derivative financial instruments
The following tables present the potential value of the instruments given hypothetical stress scenarios for the main market risk factors that impact the derivative positions. The scenarios were defined as follows:
| Instrument | | Instrument's main risk events | | Probable | | Scenario I | | Scenario II | ||
|---|---|---|---|---|---|---|---|---|---|---|
CDI vs. US$ fixed rate swap | | R$ depreciation | | (46 | ) | (154 | ) | (262) | ||
| | US$ interest rate inside Brazil decrease | | (46 | ) | (50 | ) | (53) | |||
| | Brazilian interest rate increase | | (46 | ) | (46 | ) | (46) | |||
Protected item: R$ denominated debt | | R$ depreciation | | n.a. | | – | | – | ||
| | | | |
| | F-109 | | |
![]()
Notes to the Financial Statements (Continued)
Expressed in millions of United States dollar, unless otherwise stated
34. Additional information about derivatives financial instruments (Continued)
| Instrument | | Instrument's main risk events | | Probable | | Scenario I | | Scenario II | ||
|---|---|---|---|---|---|---|---|---|---|---|
TJLP vs. US$ fixed rate swap | | R$ depreciation | | (370 | ) | (614 | ) | (858) | ||
| | US$ interest rate inside Brazil decrease | | (370 | ) | (378 | ) | (386) | |||
| | Brazilian interest rate increase | | (370 | ) | (379 | ) | (388) | |||
| | TJLP interest rate decrease | | (370 | ) | (379 | ) | (388) | |||
Protected item: R$ denominated debt | | R$ depreciation | | n.a. | | – | | – | ||
TJLP vs. US$ floating rate swap | | R$ depreciation | | (56 | ) | (82 | ) | (108) | ||
| | US$ interest rate inside Brazil decrease | | (56 | ) | (56 | ) | (57) | |||
| | Brazilian interest rate increase | | (56 | ) | (56 | ) | (57) | |||
| | TJLP interest rate decrease | | (56 | ) | (56 | ) | (57) | |||
Protected item: R$ denominated debt | | R$ depreciation | | n.a. | | – | | – | ||
R$ fixed rate vs. US$ fixed rate swap | | R$ depreciation | | (8 | ) | (85 | ) | (161) | ||
| | US$ interest rate inside Brazil decrease | | (8 | ) | (18 | ) | (28) | |||
| | Brazilian interest rate increase | | (8 | ) | (25 | ) | (40) | |||
Protected item: R$ denominated debt | | R$ depreciation | | n.a. | | – | | – | ||
IPCA vs. US$ fixed rate swap | | R$ depreciation | | (80 | ) | (194 | ) | (308) | ||
| | US$ interest rate inside Brazil decrease | | (80 | ) | (83 | ) | (87) | |||
| | Brazilian interest rate increase | | (80 | ) | (87 | ) | (93) | |||
| | IPCA index decrease | | (80 | ) | (84 | ) | (87) | |||
Protected item: R$ denominated debt | | R$ depreciation | | n.a. | | – | | – | ||
IPCA vs. CDI swap | | Brazilian interest rate increase | | 89 | | 71 | | 55 | ||
| | IPCA index decrease | | 89 | | 79 | | 70 | |||
Protected item: R$ denominated debt linked to IPCA | | IPCA index decrease | | n.a. | | (79 | ) | (70) | ||
EUR fixed rate vs. US$ fixed rate swap | | EUR depreciation | | (1 | ) | (170 | ) | (340) | ||
| | Euribor increase | | (1 | ) | (6 | ) | (11) | |||
| | US$ Libor decrease | | (1 | ) | (16 | ) | (33) | |||
Protected item: EUR denominated debt | | EUR depreciation | | n.a. | | 170 | | 340 | ||
Bunker Oil protection | | | | | ||||||
Options | | Bunker Oil price decrease | | (28 | ) | (126 | ) | (283) | ||
Protected item: Part of costs linked to bunker oil prices | | Bunker Oil price decrease | | n.a. | | 126 | | 283 | ||
Maritime Freight protection | | | | | ||||||
Forwards | | Freight price decrease | | 1 | | (1 | ) | (3) | ||
Protected item: Part of costs linked to maritime freight prices | | Freight price decrease | | n.a. | | 1 | | 3 | ||
Nickel sales fixed price protection | | | | | ||||||
Forwards | | Nickel price decrease | | (10 | ) | (29 | ) | (48) | ||
Protected item: Part of nickel revenues with fixed prices | | Nickel price fluctuation | | n.a. | | 29 | | 48 | ||
Purchase protection program | | | | | ||||||
Nickel forwards | | Nickel price increase | | – | | – | | – | ||
Protected item: Part of costs linked to nickel prices | | Nickel price increase | | n.a. | | – | | – | ||
Copper forwards | | Copper price increase | | – | | – | | – | ||
Protected item: Part of costs linked to copper prices | | Copper price increase | | n.a. | | – | | – | ||
Wheaton Precious Metals Corp. warrants | | WPM stock price decrease | | 8 | | 2 | | – | ||
Conversion options—VLI | | VLI stock value increase | | (59 | ) | (94 | ) | (138) | ||
Options—MBR | | Iron ore price decrease | | 279 | | 186 | | 105 | ||
| | | | |
| | F-110 | | |
![]()
Notes to the Financial Statements (Continued)
Expressed in millions of United States dollar, unless otherwise stated
34. Additional information about derivatives financial instruments (Continued)
| Instrument | | Instrument's main risk events | | Scenario I | | Scenario II | | Scenario III | | |||||||||
|---|---|---|---|---|---|---|---|---|---|---|---|---|---|---|---|---|---|---|
Bunker Oil protection | | | | | | | | | | | | |||||||
Forwards and options | | Bunker Oil price decrease | | | 116 | | | | (11 | ) | | | (154 | ) | | |||
Protected item: Part of costs linked to bunker oil prices | | Bunker Oil price decrease | | | n.a. | | | | 11 | | | | 154 | | | |||
Nickel sales fixed price protection | | | | | | | | | | | | |||||||
Forwards | | Nickel priced decrease | | | (1 | ) | | | (30 | ) | | | (59 | ) | | |||
Protected item: Part of nickel revenues with fixed prices | | Nickel price fluctuation | | | n.a. | | | | 30 | | | | 59 | | | |||
Purchase protection program | | | | | | | | | | | | |||||||
Nickel forwards | | Nickel price increase | | | 0,1 | | | | (0,2 | ) | | | (0,6 | ) | | |||
Protected item: Part of costs linked to nickel prices | | Nickel price increase | | | n.a. | | | | 0,2 | | | | 0,6 | | | |||
Copper forwards | | Copper price increase | | | (0, 1 | ) | | | (0,7 | ) | | | (1, 4 | ) | | |||
Protected item: Part of costs linked to copper prices | | Copper price increase | | | n.a. | | | | 0,7 | | | | 1,4 | | | |||
SLW warrants | | SLW stock price decrease | | | 44 | | | | 23 | | | | 8 | | | |||
VLI call options | | VLI stock value increase | | | (72 | ) | | | (109 | ) | | | (151 | ) | | |||
Options regarding non-controlling interest in subsidiary | | Subsidiary stock value decrease | | | 121 | | | | 34 | | | | (21 | ) | | |||
| Instrument | | Main risks | | Scenario I | | Scenario II | | Scenario III | | | Main risks | | Probable | | Scenario I | | Scenario II | |||||||||||
|---|---|---|---|---|---|---|---|---|---|---|---|---|---|---|---|---|---|---|---|---|---|---|---|---|---|---|---|---|
Embedded derivatives—Raw material purchase (nickel) | | Nickel price increase | | | 0,3 | | | (15 | ) | | (31 | ) | | | Nickel price increase | | 2 | | (8 | ) | (19) | |||||||
Embedded derivatives—Raw material purchase (copper) | | Copper price increase | | | 2 | | | (4 | ) | | (9 | ) | | | Copper price increase | | – | | (3 | ) | (6) | |||||||
Embedded derivatives—Gas purchase | | Pellet price increase | | | (2 | ) | | (4 | ) | | (7 | ) | | | Pellet price increase | | (1 | ) | (2 | ) | (5) | |||||||
Embedded derivatives—Guaranteed minimum return (VLI) | | VLI stock value decrease | | | (182 | ) | | (303 | ) | | (473 | ) | | | VLI stock value decrease | | (103 | ) | (229 | ) | (442) | |||||||
b)i) Financial counterparties' ratings
The transactions of derivative instruments, cash and cash equivalents as well as investments are held with financial institutions whose exposure limits are periodically reviewed and approved by the delegated authority. The financial institutionsinstitutions' credit risk is performed through a methodology that considers, among other information, ratings provided by international rating agencies.
| | | | |
| | F-111 | | |
![]()
Notes to the Financial Statements (Continued)
Expressed in millions of United States dollar, unless otherwise stated
33.34. Additional information about derivatives financial instruments (Continued)
The table below presents the ratings in foreign currency published by agencies Moody's and S&P regarding the main financial institutions that we had outstanding positions as of December 31, 2016.2018.
Long term ratings by counterparty | | Moody's | | S&P |
|---|---|---|---|---|
ANZ Australia and New Zealand Banking | | Aa3 | | AA– |
| Banco ABC | | Ba3 | | BB– |
| Banco Bradesco | | Ba3 | | BB– |
| Banco do Brasil | | Ba3 | | BB– |
| Banco de Credito del Peru | | Baa1 | | BBB+ |
| Banco do Nordeste | | Ba3 | | BB– |
| Banco Safra | | Ba3 | | BB– |
| Banco Santander | | A2 | | A |
| Banco Votorantim | | Ba3 | | BB– |
| Bank of America | | A3 | | A– |
| Bank of China | | A1 | | A |
| Bank of Mandiri | | Baa2 | | BB+ |
| Bank of Nova Scotia | | Aa2 | | |
| | Baa2 | | BB+ |
| Bank of Tokyo Mitsubishi UFJ | | A1 | | A– |
| Banpará | | – | | BB– |
| Barclays | | Baa3 | | BBB |
| BBVA | | A3 | | A– |
| BNP Paribas | | Aa3 | | A |
| BTG Pactual | | Ba3 | | |
| ||||
| | Ba3 | | |
| | Aa2 | | A+ |
| China Construction Bank | | A1 | | A |
| CIMB Bank | | A3 | | A– |
| Citigroup | | Baa1 | | BBB+ |
| Credit Agricole | | A1 | | A+ |
| Credit Suisse | | Baa2 | | BBB+ |
| Deutsche Bank | | A3 | | BBB+ |
| Goldman Sachs | | A3 | | BBB+ |
| HSBC | | A2 | | A |
| Intesa Sanpaolo Spa | | Baa1 | | BBB |
| Itaú Unibanco | | Ba3 | | |
| | | ||
| | | ||
| | | ||
| | | A– | |
| Morgan Stanley | | A3 | | BBB+ |
National Australia Bank NAB | | Aa3 | | AA– |
| National Bank of | | Aa3 | | A |
| National Bank of Oman | | Baa3 | | – |
| Natixis | | A1 | | A+ |
| Rabobank | | Aa3 | | A+ |
Royal Bank of | | Aa2 | | AA– |
| Societe Generale | | A1 | | A |
| | | ||
| ||||
| ||||
| ||||
|
| ||||
| ||||
| ||||
| | A2 | | BBB+ |
| ||||
| | A1 | | |
| ||||
| ||||
| ||||
| ||||
| ||||
| ||||
| | Aa3 | | |
| Unicredit | | Baa1 | | BBB |
| | | | |
| | F-112 | | |
| ||||
![]()
Notes to the Financial Statements (Continued)
Expressed in millions of United States dollar, unless otherwise stated
33.34. Additional information about derivatives financial instruments (Continued)
c)j) Market curves
The curves used on the pricing of derivatives instruments were developed based on data from BM&F, Central Bank of Brazil, London Metals Exchange and Bloomberg.
(i) Products
Nickel
Maturity | | Price (US$/ton) | | Maturity | | Price (US$/ton) | | Maturity | | Price (US$/ton) | | |||||||||
|---|---|---|---|---|---|---|---|---|---|---|---|---|---|---|---|---|---|---|---|---|
SPOT | | | 10.010 | | | JUN17 | | | 10.064 | | | DEC17 | | | 10.155 | | | |||
JAN17 | | | 9.984 | | | JUL17 | | | 10.080 | | | DEC18 | | | 10.316 | | | |||
FEB17 | | | 10.002 | | | AUG17 | | | 10.096 | | | DEC19 | | | 10.452 | | | |||
MAR17 | | | 10.022 | | | SEP17 | | | 10.110 | | | DEC20 | | | 10.591 | | | |||
APR17 | | | 10.036 | | | OCT17 | | | 10.128 | | | | | | | |||||
MAY17 | | | 10.052 | | | NOV17 | | | 10.143 | | | | | | | |||||
| Nickel | ||||||||||
|---|---|---|---|---|---|---|---|---|---|---|
| Maturity | | Price (US$/ton) | | Maturity | | Price (US$/ton) | | Maturity | | Price (US$/ton) |
| SPOT | | 10,595 | | JUN19 | | 10,777 | | DEC19 | | 10,943 |
| JAN19 | | 10,637 | | JUL19 | | 10,809 | | DEC20 | | 11,231 |
| FEB19 | | 10,663 | | AUG19 | | 10,838 | | DEC21 | | 11,516 |
| MAR19 | | 10,692 | | SEP19 | | 10,865 | | DEC22 | | 11,799 |
| APR19 | | 10,720 | | OCT19 | | 10,891 | | | ||
| MAY19 | | 10,749 | | NOV19 | | 10,916 | | | ||
Copper
Maturity | | Price (US$/lb) | | Maturity | | Price (US$/lb) | | Maturity | | Price (US$/lb) | | |||||||||
|---|---|---|---|---|---|---|---|---|---|---|---|---|---|---|---|---|---|---|---|---|
SPOT | | | 2,51 | | | JUN17 | | | 2,51 | | | DEC17 | | | 2,51 | | | |||
JAN17 | | | 2,51 | | | JUL17 | | | 2,51 | | | DEC18 | | | 2,50 | | | |||
FEB17 | | | 2,51 | | | AUG17 | | | 2,51 | | | DEC19 | | | 2,50 | | | |||
MAR17 | | | 2,51 | | | SEP17 | | | 2,52 | | | DEC20 | | | 2,49 | | | |||
APR17 | | | 2,51 | | | OCT17 | | | 2,51 | | | | | | | |||||
MAY17 | | | 2,51 | | | NOV17 | | | 2,51 | | | | | | | |||||
| Copper | ||||||||||
|---|---|---|---|---|---|---|---|---|---|---|
| Maturity | | Price (US$/lb) | | Maturity | | Price (US$/lb) | | Maturity | | Price (US$/lb) |
| SPOT | | 2.63 | | JUN19 | | 2.71 | | DEC19 | | 2.70 |
| JAN19 | | 2.71 | | JUL19 | | 2.70 | | DEC20 | | 2.70 |
| FEB19 | | 2.71 | | AUG19 | | 2.70 | | DEC21 | | 2.69 |
| MAR19 | | 2.71 | | SEP19 | | 2.70 | | DEC22 | | 2.70 |
| APR19 | | 2.71 | | OCT19 | | 2.70 | | | ||
| MAY19 | | 2.71 | | NOV19 | | 2.70 | | | ||
Bunker Oil
Maturity | | Price (US$/ton) | | Maturity | | Price (US$/ton) | | Maturity | | Price (US$/ton) | | |||||||||
|---|---|---|---|---|---|---|---|---|---|---|---|---|---|---|---|---|---|---|---|---|
SPOT | | | 332 | | | JUN17 | | | 318 | | | DEC17 | | | 312 | | | |||
JAN17 | | | 328 | | | JUL17 | | | 317 | | | DEC18 | | | 304 | | | |||
FEB17 | | | 324 | | | AUG17 | | | 316 | | | DEC19 | | | 291 | | | |||
MAR17 | | | 322 | | | SEP17 | | | 315 | | | DEC20 | | | 280 | | | |||
APR17 | | | 321 | | | OCT17 | | | 314 | | | | | | | |||||
MAY17 | | | 320 | | | NOV17 | | | 313 | | | | | | | |||||
| Bunker Oil | ||||||||||
|---|---|---|---|---|---|---|---|---|---|---|
| Maturity | | Price (US$/ton) | | Maturity | | Price (US$/ton) | | Maturity | | Price (US$/ton) |
| SPOT | | 334 | | JUN19 | | 307 | | DEC19 | | 270 |
| JAN19 | | 327 | | JUL19 | | 302 | | DEC20 | | 267 |
| FEB19 | | 322 | | AUG19 | | 297 | | DEC21 | | 238 |
| MAR19 | | 319 | | SEP19 | | 291 | | DEC22 | | 213 |
| APR19 | | 315 | | OCT19 | | 283 | | | ||
| MAY19 | | 311 | | NOV19 | | 276 | | | ||
| Maritime Freight (Capesize 5TC) | ||||||||||
|---|---|---|---|---|---|---|---|---|---|---|
| Maturity | | Price (US$/day) | | Maturity | | Price (US$/day) | | Maturity | | Price (US$/day) |
| SPOT | | 14,797 | | JUN19 | | 15,096 | | DEC19 | | 20,350 |
| JAN19 | | 16,175 | | JUL19 | | 16,817 | | Cal 2020 | | 15,613 |
| FEB19 | | 12,225 | | AUG19 | | 16,817 | | Cal 2021 | | 13,350 |
| MAR19 | | 13,233 | | SEP19 | | 16,817 | | Cal 2022 | | 13,433 |
| APR19 | | 13,521 | | OCT19 | | 20,350 | | | ||
| MAY19 | | 13,896 | | NOV19 | | 20,350 | | | ||
| | | | |
| | F-113 | | |
![]()
Notes to the Financial Statements (Continued)
Expressed in millions of United States dollar, unless otherwise stated
33.34. Additional information about derivatives financial instruments (Continued)
(ii) Foreign exchange and interest rates
| US$—Brazil Interest Rate | ||||||||||
|---|---|---|---|---|---|---|---|---|---|---|
| Maturity | | Rate (% p.a.) | | Maturity | | Rate (% p.a.) | | Maturity | | Rate (% p.a.) |
| 02/01/19 | | 4.24 | | 12/02/19 | | 3.61 | | 04/01/22 | | 3.68 |
| 03/01/19 | | 3.83 | | 01/02/20 | | 3.60 | | 07/01/22 | | 3.73 |
| 04/01/19 | | 3.55 | | 04/01/20 | | 3.63 | | 10/03/22 | | 3.69 |
| 05/02/19 | | 3.50 | | 07/01/20 | | 3.64 | | 01/02/23 | | 3.73 |
| 06/03/19 | | 3.47 | | 10/01/20 | | 3.64 | | 04/03/23 | | 3.74 |
| 07/01/19 | | 3.48 | | 01/04/21 | | 3.67 | | 07/03/23 | | 3.72 |
| 08/01/19 | | 3.52 | | 04/01/21 | | 3.66 | | 10/02/23 | | 3.74 |
| 09/02/19 | | 3.47 | | 07/01/21 | | 3.65 | | 01/02/24 | | 3.82 |
| 10/01/19 | | 3.53 | | 10/01/21 | | 3.67 | | 07/01/24 | | 3.73 |
| 11/01/19 | | 3.60 | | 01/03/22 | | 3.67 | | 01/02/25 | | 3.85 |
US$—Brazil Interest Rate
Maturity | | Rate (% p.a.) | | Maturity | | Rate (% p.a.) | | Maturity | | Rate (% p.a.) | | |||||||||||||||
|---|---|---|---|---|---|---|---|---|---|---|---|---|---|---|---|---|---|---|---|---|---|---|---|---|---|---|
02/01/17 | | | 9,28 | | | | 12/01/17 | | | | 2,96 | | | | 04/01/20 | | | | 3,47 | | | |||||
03/01/17 | | | 5,93 | | | | 01/02/18 | | | | 3,04 | | | | 07/01/20 | | | | 3,60 | | | |||||
04/03/17 | | | 4,54 | | | | 04/02/18 | | | | 2,94 | | | | 10/01/20 | | | | 3,57 | | | |||||
05/02/17 | | | 3,98 | | | | 07/02/18 | | | | 2,93 | | | | 01/04/21 | | | | 3,75 | | | |||||
06/01/17 | | | 3,63 | | | | 10/01/18 | | | | 2,95 | | | | 04/01/21 | | | | 3,85 | | | |||||
07/03/17 | | | 3,32 | | | | 01/02/19 | | | | 3,03 | | | | 07/01/21 | | | | 3,92 | | | |||||
08/01/17 | | | 3,22 | | | | 04/01/19 | | | | 3,03 | | | | 10/01/21 | | | | 4,00 | | | |||||
09/01/17 | | | 3,11 | | | | 07/01/19 | | | | 3,17 | | | | 01/03/22 | | | | 4,16 | | | |||||
10/02/17 | | | 3,04 | | | | 10/01/19 | | | | 3,27 | | | | 01/02/23 | | | | 4,55 | | | |||||
11/01/17 | | | 3,01 | | | | 01/02/20 | | | | 3,41 | | | | 01/02/24 | | | | 5,18 | | | |||||
| US$ Interest Rate | ||||||||||
|---|---|---|---|---|---|---|---|---|---|---|
| Maturity | | Rate (% p.a.) | | Maturity | | Rate (% p.a.) | | Maturity | | Rate (% p.a.) |
| 1M | | 2.52 | | 6M | | 2.78 | | 11M | | 2.78 |
| 2M | | 2.62 | | 7M | | 2.78 | | 12M | | 2.78 |
| 3M | | 2.79 | | 8M | | 2.78 | | 2Y | | 2.71 |
| 4M | | 2.79 | | 9M | | 2.78 | | 3Y | | 2.67 |
| 5M | | 2.79 | | 10M | | 2.78 | | 4Y | | 2.69 |
US$ Interest Rate
Maturity | | Rate (% p.a.) | | Maturity | | Rate (% p.a.) | | Maturity | | Rate (% p.a.) | | |||||||||||||||
|---|---|---|---|---|---|---|---|---|---|---|---|---|---|---|---|---|---|---|---|---|---|---|---|---|---|---|
1M | | | 0,77 | | | | 6M | | | | 1,13 | | | | 11M | | | | 1,19 | | | |||||
2M | | | 0,82 | | | | 7M | | | | 1,15 | | | | 12M | | | | 1,19 | | | |||||
3M | | | 1,00 | | | | 8M | | | | 1,16 | | | | 2Y | | | | 1,47 | | | |||||
4M | | | 1,06 | | | | 9M | | | | 1,17 | | | | 3Y | | | | 1,73 | | | |||||
5M | | | 1,10 | | | | 10M | | | | 1,18 | | | | 4Y | | | | 1,92 | | | |||||
| TJLP | ||||||||||
|---|---|---|---|---|---|---|---|---|---|---|
| Maturity | | Rate (% p.a.) | | Maturity | | Rate (% p.a.) | | Maturity | | Rate (% p.a.) |
| 02/01/19 | | 6.98 | | 12/02/19 | | 6.98 | | 04/01/22 | | 6.98 |
| 03/01/19 | | 6.98 | | 01/02/20 | | 6.98 | | 07/01/22 | | 6.98 |
| 04/01/19 | | 6.98 | | 04/01/20 | | 6.98 | | 10/03/22 | | 6.98 |
| 05/02/19 | | 6.98 | | 07/01/20 | | 6.98 | | 01/02/23 | | 6.98 |
| 06/03/19 | | 6.98 | | 10/01/20 | | 6.98 | | 04/03/23 | | 6.98 |
| 07/01/19 | | 6.98 | | 01/04/21 | | 6.98 | | 07/03/23 | | 6.98 |
| 08/01/19 | | 6.98 | | 04/01/21 | | 6.98 | | 10/02/23 | | 6.98 |
| 09/02/19 | | 6.98 | | 07/01/21 | | 6.98 | | 01/02/24 | | 6.98 |
| 10/01/19 | | 6.98 | | 10/01/21 | | 6.98 | | 07/01/24 | | 6.98 |
| 11/01/19 | | 6.98 | | 01/03/22 | | 6.98 | | 01/02/25 | | 6.98 |
TJLP
Maturity | | Rate (% p.a.) | | Maturity | | Rate (% p.a.) | | Maturity | | Rate (% p.a.) | | |||||||||||||||
|---|---|---|---|---|---|---|---|---|---|---|---|---|---|---|---|---|---|---|---|---|---|---|---|---|---|---|
02/01/17 | | | 7,50 | | | | 12/01/17 | | | | 7,50 | | | | 04/01/20 | | | | 7,50 | | | |||||
03/01/17 | | | 7,50 | | | | 01/02/18 | | | | 7,50 | | | | 07/01/20 | | | | 7,50 | | | |||||
04/03/17 | | | 7,50 | | | | 04/02/18 | | | | 7,50 | | | | 10/01/20 | | | | 7,50 | | | |||||
05/02/17 | | | 7,50 | | | | 07/02/18 | | | | 7,50 | | | | 01/04/21 | | | | 7,50 | | | |||||
06/01/17 | | | 7,50 | | | | 10/01/18 | | | | 7,50 | | | | 04/01/21 | | | | 7,50 | | | |||||
07/03/17 | | | 7,50 | | | | 01/02/19 | | | | 7,50 | | | | 07/01/21 | | | | 7,50 | | | |||||
08/01/17 | | | 7,50 | | | | 04/01/19 | | | | 7,50 | | | | 10/01/21 | | | | 7,50 | | | |||||
09/01/17 | | | 7,50 | | | | 07/01/19 | | | | 7,50 | | | | 01/03/22 | | | | 7,50 | | | |||||
10/02/17 | | | 7,50 | | | | 10/01/19 | | | | 7,50 | | | | 01/02/23 | | | | 7,50 | | | |||||
11/01/17 | | | 7,50 | | | | 01/02/20 | | | | 7,50 | | | | 01/02/24 | | | | 7,50 | | | |||||
| BRL Interest Rate | ||||||||||
|---|---|---|---|---|---|---|---|---|---|---|
| Maturity | | Rate (% p.a.) | | Maturity | | Rate (% p.a.) | | Maturity | | Rate (% p.a.) |
| 02/01/19 | | 6.41 | | 12/02/19 | | 6.53 | | 04/01/22 | | 8.17 |
| 03/01/19 | | 6.42 | | 01/02/20 | | 6.55 | | 07/01/22 | | 8.35 |
| 04/01/19 | | 6.43 | | 04/01/20 | | 6.70 | | 10/03/22 | | 8.43 |
| 05/02/19 | | 6.44 | | 07/01/20 | | 6.91 | | 01/02/23 | | 8.53 |
| 06/03/19 | | 6.44 | | 10/01/20 | | 7.16 | | 04/03/23 | | 8.64 |
| 07/01/19 | | 6.45 | | 01/04/21 | | 7.36 | | 07/03/23 | | 8.70 |
| 08/01/19 | | 6.46 | | 04/01/21 | | 7.59 | | 10/02/23 | | 8.79 |
| 09/02/19 | | 6.46 | | 07/01/21 | | 7.77 | | 01/02/24 | | 8.86 |
| 10/01/19 | | 6.49 | | 10/01/21 | | 7.95 | | 07/01/24 | | 8.98 |
| 11/01/19 | | 6.52 | | 01/03/22 | | 8.08 | | 01/02/25 | | 9.1 |
| | | | |
| | F-114 | | |
![]()
Notes to the Financial Statements (Continued)
Expressed in millions of United States dollar, unless otherwise stated
33.34. Additional information about derivatives financial instruments (Continued)
BRL Interest Rate
Maturity | | Rate (% p.a.) | | Maturity | | Rate (% p.a.) | | Maturity | | Rate (% p.a.) | | |||||||||||||||
|---|---|---|---|---|---|---|---|---|---|---|---|---|---|---|---|---|---|---|---|---|---|---|---|---|---|---|
02/01/17 | | | 13,92 | | | | 12/01/17 | | | | 11,70 | | | | 04/01/20 | | | | 11,27 | | | |||||
03/01/17 | | | 13,51 | | | | 01/02/18 | | | | 11,59 | | | | 07/01/20 | | | | 11,32 | | | |||||
04/03/17 | | | 13,13 | | | | 04/02/18 | | | | 11,37 | | | | 10/01/20 | | | | 11,34 | | | |||||
05/02/17 | | | 12,92 | | | | 07/02/18 | | | | 11,21 | | | | 01/04/21 | | | | 11,35 | | | |||||
06/01/17 | | | 12,70 | | | | 10/01/18 | | | | 11,15 | | | | 04/01/21 | | | | 11,40 | | | |||||
07/03/17 | | | 12,53 | | | | 01/02/19 | | | | 11,07 | | | | 07/01/21 | | | | 11,45 | | | |||||
08/01/17 | | | 12,28 | | | | 04/01/19 | | | | 11,10 | | | | 10/01/21 | | | | 11,48 | | | |||||
09/01/17 | | | 12,10 | | | | 07/01/19 | | | | 11,12 | | | | 01/03/22 | | | | 11,50 | | | |||||
10/02/17 | | | 11,94 | | | | 10/01/19 | | | | 11,17 | | | | 01/02/23 | | | | 11,62 | | | |||||
11/01/17 | | | 11,81 | | | | 01/02/20 | | | | 11,22 | | | | 01/02/24 | | | | 11,59 | | | |||||
Implicit Inflation (IPCA)
Maturity | | Rate (% p.a.) | | Maturity | | Rate (% p.a.) | | Maturity | | Rate (% p.a.) | | |||||||||||||||
|---|---|---|---|---|---|---|---|---|---|---|---|---|---|---|---|---|---|---|---|---|---|---|---|---|---|---|
02/01/17 | | | 7,53 | | | | 12/01/17 | | | | 5,44 | | | | 04/01/20 | | | | 5,04 | | | |||||
03/01/17 | | | 7,15 | | | | 01/02/18 | | | | 5,33 | | | | 07/01/20 | | | | 5,09 | | | |||||
04/03/17 | | | 6,79 | | | | 04/02/18 | | | | 5,16 | | | | 10/01/20 | | | | 5,10 | | | |||||
05/02/17 | | | 6,59 | | | | 07/02/18 | | | | 5,04 | | | | 01/04/21 | | | | 5,10 | | | |||||
06/01/17 | | | 6,38 | | | | 10/01/18 | | | | 4,98 | | | | 04/01/21 | | | | 5,15 | | | |||||
07/03/17 | | | 6,21 | | | | 01/02/19 | | | | 4,91 | | | | 07/01/21 | | | | 5,19 | | | |||||
08/01/17 | | | 5,98 | | | | 04/01/19 | | | | 4,93 | | | | 10/01/21 | | | | 5,22 | | | |||||
09/01/17 | | | 5,81 | | | | 07/01/19 | | | | 4,94 | | | | 01/03/22 | | | | 5,24 | | | |||||
10/02/17 | | | 5,66 | | | | 10/01/19 | | | | 4,97 | | | | 01/02/23 | | | | 5,37 | | | |||||
11/01/17 | | | 5,54 | | | | 01/02/20 | | | | 5,00 | | | | 01/02/24 | | | | 5,37 | | | |||||
EUR Interest Rate
Maturity | | Rate (% p.a.) | | Maturity | | Rate (% p.a.) | | Maturity | | Rate (% p.a.) | | |||||||||||||||
|---|---|---|---|---|---|---|---|---|---|---|---|---|---|---|---|---|---|---|---|---|---|---|---|---|---|---|
1M | | | –0,38 | | | | 6M | | | | –0,25 | | | | 11M | | | | –0,21 | | | |||||
2M | | | –0,35 | | | | 7M | | | | –0,23 | | | | 12M | | | | –0,20 | | | |||||
3M | | | –0,33 | | | | 8M | | | | –0,22 | | | | 2Y | | | | –0,16 | | | |||||
4M | | | –0,29 | | | | 9M | | | | –0,22 | | | | 3Y | | | | –0,10 | | | |||||
5M | | | –0,26 | | | | 10M | | | | –0,21 | | | | 4Y | | | | –0,02 | | | |||||
CAD Interest Rate
Maturity | | Rate (% p.a.) | | Maturity | | Rate (% p.a.) | | Maturity | | Rate (% p.a.) | | |||||||||||||||
|---|---|---|---|---|---|---|---|---|---|---|---|---|---|---|---|---|---|---|---|---|---|---|---|---|---|---|
1M | | | 0,94 | | | | 6M | | | | 1,10 | | | | 11M | | | | 0,54 | | | |||||
2M | | | 0,94 | | | | 7M | | | | 0,92 | | | | 12M | | | | 0,49 | | | |||||
3M | | | 0,95 | | | | 8M | | | | 0,79 | | | | 2Y | | | | 1,11 | | | |||||
4M | | | 1,02 | | | | 9M | | | | 0,69 | | | | 3Y | | | | 1,26 | | | |||||
5M | | | 1,07 | | | | 10M | | | | 0,61 | | | | 4Y | | | | 1,41 | | | |||||
Currencies—Ending rates
| | | | | | | | | | | | | |||||||||||||
|---|---|---|---|---|---|---|---|---|---|---|---|---|---|---|---|---|---|---|---|---|---|---|---|---|
CAD/US$ | | | 0,7443 | | | | US$ | /BRL | | | | 3,2591 | | | EUR/US$ | | | 1,0472 | | | ||||
| Implicit Inflation (IPCA) | ||||||||||
|---|---|---|---|---|---|---|---|---|---|---|
| Maturity | | Rate (% p.a.) | | Maturity | | Rate (% p.a.) | | Maturity | | Rate (% p.a.) |
| 02/01/19 | | 3.74 | | 12/02/19 | | 3.87 | | 04/01/22 | | 4.03 |
| 03/01/19 | | 3.75 | | 01/02/20 | | 3.88 | | 07/01/22 | | 4.12 |
| 04/01/19 | | 3.77 | | 04/01/20 | | 3.81 | | 10/03/22 | | 4.11 |
| 05/02/19 | | 3.78 | | 07/01/20 | | 3.88 | | 01/02/23 | | 4.14 |
| 06/03/19 | | 3.78 | | 10/01/20 | | 3.90 | | 04/03/23 | | 4.18 |
| 07/01/19 | | 3.79 | | 01/04/21 | | 3.93 | | 07/03/23 | | 4.19 |
| 08/01/19 | | 3.79 | | 04/01/21 | | 3.98 | | 10/02/23 | | 4.22 |
| 09/02/19 | | 3.79 | | 07/01/21 | | 4.01 | | 01/02/24 | | 4.25 |
| 10/01/19 | | 3.83 | | 10/01/21 | | 4.04 | | 07/01/24 | | 4.30 |
| 11/01/19 | | 3.85 | | 01/03/22 | | 4.05 | | 01/02/25 | | 4.35 |
![]()
Members of the Board of Directors, Fiscal Council, Advisory Committees and Executive Officers
| EUR Interest Rate | ||||||||||
|---|---|---|---|---|---|---|---|---|---|---|
| Maturity | | Rate (% p.a.) | | Maturity | | Rate (% p.a.) | | Maturity | | Rate (% p.a.) |
| 1M | | (0.41) | | 6M | | (0.28) | | 11M | | (0.24) |
| 2M | | (0.38) | | 7M | | (0.26) | | 12M | | (0.23) |
| 3M | | (0.36) | | 8M | | (0.25) | | 2Y | | (0.17) |
| 4M | | (0.32) | | 9M | | (0.25) | | 3Y | | (0.08) |
| 5M | | (0.29) | | 10M | | (0.24) | | 4Y | | 0.05 |
| CAD Interest Rate | ||||||||||
|---|---|---|---|---|---|---|---|---|---|---|
| Maturity | | Rate (% p.a.) | | Maturity | | Rate (% p.a.) | | Maturity | | Rate (% p.a.) |
| 1M | | 2.30 | | 6M | | 2.34 | | 11M | | 1.24 |
| 2M | | 2.29 | | 7M | | 2.00 | | 12M | | 1.13 |
| 3M | | 2.31 | | 8M | | 1.74 | | 2Y | | 2.29 |
| 4M | | 2.32 | | 9M | | 1.54 | | 3Y | | 2.31 |
| 5M | | 2.33 | | 10M | | 1.37 | | 4Y | | 2.35 |
| Currencies—Ending rates | ||||||||||
|---|---|---|---|---|---|---|---|---|---|---|
| CAD/US$ | | 0.7341 | | US$/BRL | | 3.8748 | | EUR/US$ | | 1.1452 |
| | | | |
| | |||
| | |