
UNITED STATES
SECURITIES AND EXCHANGE COMMISSION
Washington, D.C. 20549
________________________________
FORM 20-F
[ ] REGISTRATION STATEMENT PURSUANT TO SECTION 12(b) OR (g) OF THE SECURITIES EXCHANGE ACT OF 1934
or
[X] ANNUAL REPORT PURSUANT TO SECTION 13 OR 15(d) OF THE SECURITIES EXCHANGE ACT OF 1934
For the fiscal year endedDecember 31, 20082013
or
[ ] TRANSITION REPORT PURSUANT TO SECTION 13 OR 15(d) OF THE SECURITIES EXCHANGE ACT OF 1934
or
[ ] SHELL COMPANY REPORT PURSUANT TO SECTION 13 OR 15(d) OF THE SECURITIES EXCHANGE ACT OF 1934
Commission file number1-339650-55139
QUATERRA RESOURCES INC.
(Exact name of Registrant as specified in its charter)
British Columbia, Canada
(Jurisdiction of incorporation or organization)
1100 – 1199 West Hastings Street, Vancouver, British Columbia, Canada V6E 3T5
(Address of principal executive offices)
Scott B. Hean, Chief Financial Officer
1100 – 1199 West Hastings Street, Vancouver, British Columbia, Canada V6E 3T5
Phone (604) 681-9059 and Fax (604) 688-4670
(Name, telephone, e-mail and/or facsimile number and address of company contact person)
________________________________
Securities registered or to be registered pursuant to Section 12(b) of the Act:None
Securities registered or to be registered pursuant to Section 12(g) of the Act:NoneCommon Shares, no par value
Securities for which there is a reporting obligation pursuant to Section 15(d) of the Act:None
Indicate the number of outstanding shares of each of the issuer’s classes of capital or common stock as of the close of
the period covered by the annual report.87,463,483193,479,416 common shares
Indicate by check mark if the registrant is a well-known seasoned issuer, as defined in Rule 405 of the Securities Act.
[ ] Yes [X] No
If this report is an annual or transition report, indicate by check mark if the registrant is not required to
file reports pursuant to Section 13 or 15(d) of the Securities Exchange Act of 1934.
[ ] Yes [X] No
Indicate by check mark whether the registrant: (1) has filed all reports required to be filed by Section 13 or 15(d) of the
Securities Exchange Act of 1934 during the preceding 12 months (or for such shorter period that the registrant was required
to file such reports), and (2) has been subject to such filing requirements for the past 90 days. [X]
[X] Yes [ ] No
Indicate by check mark whether the registrant has submitted electronically and posted on its corporate web site, if any, every Interactive Data File required to be submitted and posted pursuant to Rule 405 of Regulation S-T (§232.405 of this chapter) during the preceding 12 months (or for such shorter period that the registrant was required to submit and post such files).
[ ] Yes [ ] No
Indicate by check mark whether the registrant is a large accelerated filer, an accelerated filer or a non-accelerated filer. See
definition of “accelerated filer and large accelerated filer” in Rule 12b-2 of the Exchange Act.
Large accelerated filer [ ] Accelerated filer [X] Non-accelerated filer [ ]
| Large accelerated filer [ ] | Accelerated filer [ ] | Non-accelerated filer [X] |
Indicate by check mark which basis of accounting the registration has used to prepare the financial statements included in
this filing:
U.S. GAAP [ ]
International Financial Reporting Standards as issued by the International Accounting Standards board [X]
Other [ ]Other [X]
If “Other” has been checked in response to the previous question, indicate by check mark which financial statement item the
registrant has elected to follow.
Item 17 [X][ ]
Item 18 [ ]
If this is an annual report, indicate by check mark whether the registrant is a shell company (as defined in Rule 12b-2 of the
Exchange Act). [ ] Yes [X] No
TABLE OF CONTENTS
CAUTIONARY STATEMENT REGARDING FORWARD-LOOKING INFORMATION
This annual report contains forward-looking statements about our operations and planned future activities within the meaning of the safe harbor for such statements under the Private Securities Litigation Reform Act of 1995. Statements that are not historical fact and relate to predictions, expectations, belief, plans, projections, objectives, assumptions, future events, or future performance may be “forward-looking statements.” Forward-looking statements may be identified by such terms as “believes”, “anticipates”, “expects”, “estimates”, “may”, “could”, “would”, “will”, “plan” or similar words. You are cautioned not to place undue reliance on forward-looking statements. Forward-looking statements are subject to a variety of risks and uncertainties which could cause actual events or results to differ from those reflected in the forward-looking statements, including, without limitation:
our ability to finance the continued exploration of our mineral properties;
our history of losses and expectation of future losses;
our ability to obtain adequate financing for our planned explorationdevelopment activities;
uncertainty of production at our mineral exploration properties;
the lack of Proven Mineral Reserves or Probable Mineral Reserves;
the impact of governmental regulations, including environmental regulations; and
commodity price fluctuations.
These forward-looking statements are based on the beliefs of our management as well as on assumptions made by and information currently available to us at the time such statements were made. We undertake no obligation to update forward-looking statements should circumstances or estimates or opinions change.
DIFFERENCES IN UNITED STATES AND CANADIAN REPORTING PRACTICES
We prepareFinancial Information
All financial information in this annual report is prepared in accordance with International Financial Reporting Standards, (“IFRS”) as issued by International Accounting Standards Board (“IASB”). IFRS differs in some respects from United States generally accepted accounting principles, (“U.S. GAAP”), and thus our financial statements which are filed with this annual report on Form 20-F in accordance withmay not be comparable to financial statements of United States companies. The term Canadian generally accepted accounting principles (“Canadian GAAP”), refers to the accounting principles and are subject to Canadian auditingstandards before the adoption of IFRS.
Resource and auditor independence standards. They may not be comparable to financial statementsReserve Estimates
None of the United States companies,Company’s properties have Mineral Reserves. Disclosure about the Company’s exploration properties in this Annual Report on Form 20-F uses the term “Mineral Resources”, “Measured Mineral Resources”, “Indicated Mineral Resources” and “Inferred Mineral Resources”, which typically report according to United States generally accepted accounting principles (“US GAAP”). Significant differences betweenare Canadian GAAPgeological and US GAAP are described in Note 16 of our consolidated financial statements in Item 17 of this annual report.
In addition, disclosure about exploration activities and certain mining terms is different underas defined in accordance with National Instrument 43-101 (“NI 43-101”), standards of disclosure for mineral projects of the Canadian standards than underSecurities Administrators, set out in the Canadian Institute of Mining (CIM) Standards. These terms are not defined in the U.S. Securities and Exchange Commission (“SEC”) standards.(SEC) Industry Guide 7,Description of Property by Issuers Engaged or to be engaged in Significant Mining Operations, and are normally not permitted to be used in reports and registration statements filed with the SEC. Accordingly, information contained in this annual report containingAnnual Report on Form 20-F contain descriptions of our mineral deposits that may not be comparable to similar information made public by United StatesU.S. companies subject to the reporting and disclosure requirements under the United States federal securities laws.laws and the rules and regulations thereunder.
Cautionary Note to U.S. Readers concerning estimates of Measured Mineral Resources and Indicated Mineral Resources:This Annual Report on Form 20-F may use the terms “Mineral Resources,” “Measured Mineral Resource” and “Indicated Mineral Resource.” The Company advises U.S. investors that while such terms are recognized and permitted under Canadian regulations, the SEC does not recognize them. U.S. investors are cautioned not to assume that any part or all of the Mineral Resources in these categories will ever be converted into Mineral Reserves.
- ii -
Cautionary Note to U.S. Readers concerning estimates of Inferred Mineral Resources:This Annual Report on Form 20-F may use the term “Inferred Mineral Resource.” The Company advises U.S. investors that while such a term is recognized and permitted under Canadian regulations, the SEC does not recognize it. “Inferred Mineral Resources” have a great amount of uncertainty as to their existence, and great uncertainty as to their economic and legal feasibility. It cannot be assumed that all or any part of an inferred Mineral Resource will ever be upgraded to a higher category. Under Canadian rules estimates of Inferred Mineral Resources may not form the basis of feasibility or other economic studies. U.S. investors are cautioned not to assume that any part of all of the Inferred Mineral Resources exist, or is economically or legally mineable.
EMERGING GROWTH COMPANY STATUS
The Company is an “emerging growth company” as defined in section 3(a) of the U.S. Securities Exchange Act of 1934 (as amended by the U.S. Jumpstart Our Business Startups Act (the “JOBS Act”), enacted on April 5, 2012), and the Company will continue to qualify as an “emerging growth company” until the earliest to occur of: (a) the last day of the fiscal year during which the Company has total annual gross revenues of US$1,000,000,000 (as such amount is indexed for inflation every five years by the SEC) or more; (b) the last day of the fiscal year of the Company following the fifth anniversary of the date of the first sale of common equity securities of the Company pursuant to an effective registration statement under the U.S. Securities Act of 1933, as amended; (c) the date on which the Company has, during the previous three-year period, issued more than US$1,000,000,000 in non-convertible debt; or (d) the date on which the Company is deemed to be a ‘large accelerated filer’, as defined in Rule 12b–2 of the U.S. Securities Exchange Act of 1934, as amended. The Company expects that it will continue to qualify as an emerging growth company for the foreseeable future.
GLOSSARY OF GEOLOGIC AND MINING TERMS
| Anomaly: | A geological feature distinguished by geological, geochemical or geophysical means, which is detectably different than the general surroundings and is sometimes of potential economic value. |
| Breccia: | Rock consisting of more or less angular fragments in a matrix of finer-grained material or cementing material. |
| Diamond drill: | A type of drill in which the cutting is done by abrasion using diamonds embedded in a matrix rather than by percussion. The drill cuts a core of rock which is recovered in long cylindrical sections. |
| Dilution: | Process whereby unwanted gangue or waste rock is mixed with ore during mining. |
| Epithermal: | A class of ore deposits that form generally less than 1 km from surface. These deposits, which can host economic quantities of gold, silver, copper, lead and zinc are formed as a result of the precipitation of ore minerals from up-welling hydrothermal fluids. There are several classes of epithermal deposits that are defined on the basis of fluid chemistry and resulting alteration and ore mineralogy. Fluid chemistry is largely controlled by the proximity to igneous intrusive rocks and as a result igneous fluid content. |
| Extrusive Rock: | Igneous rock that has solidified on the earth’s surface from volcanic action. |
| Fluid inclusion: | A cavity, with or without negative crystal faces, containing one or two fluid phases, and possibly one or more minute crystals, in a host crystal. If two fluid phases are present, the vapor phase (bubble) may show Brownian motion. |
| Folds: | Flexures in bedded or layered rock formed when forces are applied gradually to rocks over a long period of time. |
| Fracture: | Breaks in a rock, usually due to intensive folding or faulting. |
| Gambusino: | An individual miner working without machinery. |
| Gangue: | Term used to describe worthless minerals or rock waste mixed in with the valuable minerals. |
| Gouge: | The finely ground rock that result from the abrasion along a fault surface. |
- iii -
| Grade: | The concentration of each ore metal in a rock sample, usually given as weight percent. Where extremely low concentrations are involved, the concentration may be given in grams per tonne (g/t) or ounces per ton (oz/t). The grade of an ore deposit is calculated, often using sophisticated statistical procedures, as an average of the grades of a very large number of samples collected from throughout the deposit. |
| Hectare: | A square of 100 metres on each side. |
| Indicated Mineral Resource: |
|
| Inferred Mineral Resource: |
|
- iii -
reasonably assumed, but not verified, geological and grade continuity. The estimate is based on limited information and sampling gathered through appropriate techniques from locations such as outcrops, trenches, pits, workings and drill holes. | |
| Lithology: | The physical characteristics of a rock or a rock formation. |
| Mafic: | A term used to describe ferromagnesian minerals. Rocks composed mainly of ferromagnesian minerals are correctly termed melanocratic. |
| Massive: | A term used to describe sulfide ores containing more than 50% volume of sulphide. |
| Measured Mineral | |
| Resource: | A Measured Mineral Resource is that part of a Mineral Resource for which quantity, grade or quality, densities, shape, physical characteristics are so well established that they can be estimated with confidence sufficient to allow the appropriate application of technical and economic parameters, to support production planning and evaluation of the economic viability of the deposit. The estimate is based on detailed and reliable exploration, sampling and testing information gathered through appropriate techniques from locations such as outcrops, trenches, pits, workings and drill holes that are spaced closely enough to confirm both geological and grade continuity. |
| Mineral Deposit or | |
| Mineralized Material: | A mineralized body which has been intersected by sufficient closely spaced drill holes and or underground sampling to support sufficient tonnage and average grade of metal(s) to warrant further exploration-development work. This deposit does not qualify as a commercially mineable ore body (Reserves), as prescribed under SEC standards, until a final and comprehensive economic, technical, and legal feasibility study based upon the test results is concluded. |
| Mineral | |
| Resource: | A Mineral Resource is a concentration or occurrence of natural, solid, inorganic or fossilized organic material in or on the earth’s crust in such form and quantity and of such a grade or quality that it has reasonable prospects for economic extraction. The location, quantity, grade, geological characteristics and continuity of a Mineral Resource are known, estimated or interpreted from specific geological evidence and knowledge. |
| Mineral Reserve: | A Mineral Reserve is the economically mineable part of a Measured or Indicated Mineral Resource demonstrated by at least a Preliminary Feasibility Study. This Study must include |
- iv -
adequate information on mining, processing, metallurgical, economic and other relevant factors that demonstrate, at the time of reporting, that economic extraction can be justified. A Mineral Reserve includes diluting materials and allowances for losses that may occur when the material is mined. | |
| Mineralization: | Usually implies minerals of value occurring in rocks. |
| Ore: | A natural aggregate of one or more minerals which may be mined and sold at a profit, or from which some part may be profitably separated. |
| Probable Mineral | |
Reserve: | A Probable Mineral Reserve is the economically mineable part of an Indicated, and in some circumstances a Measured, Mineral Resource demonstrated by at least a Preliminary Feasibility Study. This study must include adequate information on mining, processing, metallurgical, economic, and other relevant factors that demonstrate, at the time of reporting, that economic extraction can be justified. |
| Properties as | |
prospects: | A property is a claim owned by a company and a prospect is a claim in which a company holds an interest. |
- iv -
| Proven Mineral Reserve: | A Proven Mineral Reserve is the economically mineable part of a Measured Mineral Resource demonstrated by at least a Preliminary Feasibility Study. This study must include adequate information on mining, processing, metallurgical, economic, and other relevant factors that demonstrate, at the time of reporting, that economic extraction is justified. |
| Reserve(s): | A natural aggregate of one or more minerals which, at a specified time and place, may be mined and sold at a profit, or from which some part may be profitably separated. |
| Reverse | |
circulation drill: | A rotary percussion drill in which the drilling mud and cuttings return to the surface through the drill pipe. |
| Tailings: | Material rejected from a mill after recoverable valuable minerals have been extracted. |
GLOSSARY OF ABBREVIATIONS
| Ag: | Silver | |
| Ag gm/t: | Silver grade measured in grams per metric tonne | |
| AMR: | Advance minimum royalty payments | |
| Au: | Gold | |
| Au gm/t: | Gold grade measured in grams per metric tonne | |
| Ba: | Barium | |
| Co: | Cobalt | |
| CSAMT: | Controlled source audio-frequency magneto telluric geophysical survey | |
| Cu: | Copper | |
| EIS: | Environmental Impact Statement | |
| Fe: | Iron | |
| 43-101: | Canadian National Instrument 43-101 | |
| gpm: | gallons per minute | |
| gpt: | grams per tonne | |
| g/t: | grams per tonne | |
| IP: | Induced Polarization geophysical survey | |
| m.y: | Million years | |
| Ni: | Nickel | |
| NSR: | Net smelter return royalty | |
| Oz: | Troy ounce |
- v -
| oz/t or opt: | Ounces per ton. | |
| Pb: | Lead | |
| Pd: | Palladium | |
| PGE: | Platinum Group Element | |
| PGM: | Platinum group minerals | |
| PPB: | Parts per billion | |
| PPM: | Parts per million | |
| Pt: | Platinum | |
| S: | Sulphur | |
| TD: | Total depth of a drill hole. | |
| tpd: | Tonnes per day | |
| U3O8: | Uranium oxide known as “yellow cake”. | |
| VLF: | Very low frequency electromagnetic geophysical survey | |
| VMS: | Volcanogenic massive sulphide |
- v -
CONVERSION TABLES
| Conversion Table | ||||
| Imperial | Metric | |||
| 1 Acre | = | 0.404686 | Hectares | |
| 1 Foot | = | 0.304800 | Metres | |
| 1 Mile | = | 1.609344 | Kilometres | |
| 1 Ton | = | 0.907185 | Tonnes | |
| 1 Ounce (troy)/ton | = | 34.285700 | Grams/Tonne | |
| Precious metal units and conversion factors | Precious metal units and conversion factors | Precious metal units and conversion factors | |||||||||||||||||||
| ppb | - Part per billion | 1 | ppb | = | 0.0010 | ppm | = | 0.000030 oz/t | - Part per billion | 1 | ppb | = | 0.0010 | ppm | = | 0.000030 | oz/t | ||||
| ppm | - Part per million | 100 | ppb | = | 0.1000 | ppm | = | 0.002920 oz/t | - Part per million | 100 | ppb | = | 0.1000 | ppm | = | 0.002920 | oz/t | ||||
| oz | - Ounce (troy) | 10,000 | ppb | = | 10.0000 | ppm | = | 0.291670 oz/t | - Ounce (troy) | 10,000 | ppb | = | 10.0000 | ppm | = | 0.291670 | oz/t | ||||
| oz/t | - Ounce per ton (avdp.) | 1 | ppm | = | 1.0000 | ug/g | = | 1.000000 g/tonne | - Ounce per ton (avdp.) | 1 | ppm | = | 1.0000 | ug/g | = | 1.000000 | g/tonne | ||||
| g | - Gram | - Gram | |||||||||||||||||||
| g/tonne | - gram per metric ton | 1 | oz/t | = | 34.2857 | ppm | - gram per metric ton | 1 | oz/t | = | 34.2857 | ppm | |||||||||
| mg | - milligram | 1 | Carat | = | 41.6660 | mg/g | - milligram | 1 | Carat | = | 41.6660 | mg/g | |||||||||
| kg | - kilogram | 1 | ton (avdp.) | = | 907.1848 | kg | - kilogram | 1 | ton (avdp.) | = | 907.1848 | kg | |||||||||
| ug | - microgram | 1 | oz (troy) | = | 31.1035 | g | - microgram | 1 | oz (troy) | = | 31.1035 | g | |||||||||
- vi -
PART I
ITEM 1. IDENTITY OF DIRECTORS, SENIOR MANAGEMENT AND ADVISERS
Not applicable.
ITEM 2. OFFER STATISTICS AND EXPECTED TIMETABLE
Not applicable.
ITEM 3. KEY INFORMATION
A. Selected Financial Data
The following table sets forth our selected consolidated financial data for the five years ended December 31, 2008 prepared in accordance with Canadian GAAP and corresponding information prepared in accordance with US GAAP. This information should be read in conjunction with our consolidated financial statements included in Item 17 this annual report.
| (Expressed in Canadian dollars) | Fiscal year ended December 31 | ||||||||||||||
| Canadian GAAP | 2008 | 2007 | 2006 | 2005 | 2004 | ||||||||||
| Sales or operating revenues | Nil | Nil | Nil | Nil | Nil | ||||||||||
| Net (loss) | (6,834,181 | ) | (7,303,204 | ) | (3,830,534 | ) | (788,060 | ) | (685,952 | ) | |||||
| (Loss) per common share | (0.08 | ) | (0.09 | ) | (0.05 | ) | (0.01 | ) | (0.01 | ) | |||||
| Total assets | 34,397,289 | 24,198,211 | 17,304,544 | 5,855,847 | 3,727,071 | ||||||||||
| Net assets | 29,953,008 | 22,491,941 | 17,063,017 | 5,527,409 | 3,492,483 | ||||||||||
| Capital stock | 48,318,994 | 36,875,448 | 27,861,058 | 15,172,975 | 12,672,761 | ||||||||||
| Common shares outstanding | 87,463,483 | 83,167,005 | 78,104,820 | 65,522,200 | 57,347,200 | ||||||||||
| Dividends per common share | Nil | Nil | Nil | Nil | Nil | ||||||||||
| Fiscal year ended December 31 | |||||||||||||||
| US GAAP | 2008 | 2007 | 2006 | 2005 | 2004 | ||||||||||
| Sales or operating revenues | Nil | Nil | Nil | Nil | Nil | ||||||||||
| Net (loss) | (19,226,463 | ) | (15,217,588 | ) | (6,476,885 | ) | (1,960,598 | ) | (996,820 | ) | |||||
| (Loss) per common share | (0.22 | ) | (0.19 | ) | (0.09 | ) | (0.03 | ) | (0.02 | ) | |||||
| Total assets | 8,887,616 | 11,087,462 | 12,144,179 | 2,098,964 | 1,754,124 | ||||||||||
| Net assets | 4,625,258 | 9,381,192 | 11,866,652 | 2,976,395 | 2,115,007 | ||||||||||
| Capital stock | 48,318,994 | 36,875,448 | 27,861,058 | 15,172,975 | 12,672,761 | ||||||||||
| Common shares outstanding | 87,463,483 | 83,167,005 | 78,104,820 | 65,522,200 | 57,347,200 | ||||||||||
| Dividends per common share | Nil | Nil | Nil | Nil | Nil | ||||||||||
Exchange Rate Data
- Unless otherwise indicated, all monetary references herein are denominated in Canadian Dollars. References to “$” or “Dollars” are to Canadian Dollars and references to “US$” or “U.S. Dollars” are to United States Dollars.
- 1 -The following table sets forth our selected consolidated financial data for the five years ended December 31, 2013 prepared in accordance with IFRS as issued by IASB for the years ended December 31, 2013, 2012, 2011 and 2010 and Canadian GAAP for the years ended December 31, 2009. This information should be read in conjunction with our consolidated financial statements included in Item 17 of this annual report.
| Fiscal year ended December 31, | ||||||||||||
| IFRS | 2013 | 2012 | 2011 | 2010 | ||||||||
| Sales or operating revenues | Nil | Nil | Nil | Nil | ||||||||
| Net (loss) for the year | (28,817,916 | ) | (4,853,976 | ) | (11,264,539 | ) | (2,769,248 | ) | ||||
| (Loss) per common share - basic and diluted | (0.17 | ) | (0.03 | ) | (0.08 | ) | (0.02 | ) | ||||
| Total assets | 46,237,523 | 73,312,971 | 73,610,822 | 65,460,923 | ||||||||
| Net assets | 43,816,046 | 71,855,193 | 71,733,234 | 64,564,355 | ||||||||
| Capital stock | 116,135,532 | 115,816,740 | 111,923,521 | 95,800,950 | ||||||||
| Number of common shares outstanding | 193,479,416 | 162,990,836 | 152,353,283 | 136,464,161 | ||||||||
| Derivative liability - warrants | 1,191,784 | 774,673 | - | - | ||||||||
| Cash dividends per common share | NIl | Nil | Nil | Nil | ||||||||
| Fiscal year ended December 31, | |||
| Canadian GAAP(1) | 2009 | ||
| Sales or operating revenues | Nil | ||
| Net (loss) for the year | (6,988,414 | ) | |
| (Loss) per common share - basic and diluted | (0.08 | ) | |
| Total assets | 41,872,497 | ||
| Net assets | 40,993,110 | ||
| Capital stock | 63,168,843 | ||
| Number of common shares outstanding | 111,459,371 | ||
| Long-term debt | - |
(1) The adoption of IFRS by the Company did not require restatement of fiscal years prior to 2010.
Exchange Rate Data
For the past five fiscal years ended December 31, 2008,2013, the average rates (calculatedcalculated by using the average of the exchange rates on the last day of each month during the period) and for each of the previous six months, the high and low exchange rates for Canadian dollars expressed in terms of U.S. dollars (i.e., U.S. dollars required to purchase one Canadian dollar):. The information was provided by the Bank of Canada:
- 7 -
| Financial Year | Average Exchange Rate |
| 2008 | 0.9381 |
| 2007 | 0.9309 |
| 2006 | 0.8818 |
| 2005 | 0.8254 |
| 2004 | 0.7682 |
| Financial Year | Average Exchange Rate |
| 2013 | 0.9699 |
| 2012 | 0.998917 |
| 2011 | 0.988667 |
| 2010 | 1.0295 |
| 2009 | 1.14075 |
Financial Month | Exchange Rate | |
| High | Low | |
| February 2009 | 0.8203 | 0.7868 |
| January 2009 | 0.8459 | 0.7844 |
| December 2008 | 0.8360 | 0.7710 |
| November 2008 | 0.8694 | 0.7782 |
| October 2008 | 0.9428 | 0.7727 |
| September 2008 | 0.9673 | 0.9262 |
Financial Month | Exchange Rate | |
| High | Low | |
| February 2014 | 0.9130 | 0.8977 |
| January 2014 | 0.9422 | 0.8952 |
| December 2013 | 0.9454 | 0.9348 |
| November 2013 | 0.9602 | 0.9435 |
| October 2013 | 0.9724 | 0.9564 |
| September 2013 | 0.9768 | 0.9494 |
On March 24, 2009,2014, the ending exchange rate for the conversion of one U.S. dollar into one Canadian dollar was 0.81056 U.S.1.1195.
B. Capitalization and Indebtedness
Not applicable.
C. Reasons for the Offer and Use of Proceeds
Not applicable.
D. Risk Factors
RISK FACTORS
WeInvesting in common stock of Quaterra Resources Inc. (the “Company” or Quaterra”) involves a high degree of risk. Before deciding to purchase, hold or sell the Company’s common stock, you should carefully consider the risks described below in addition to the cautionary statements and risks described elsewhere and the other information contained in this 20-F and in the Company’s other filings with securities regulatory authorities. The risks and uncertainties described below are not the Company’s only ones. Additional risks and uncertainties not presently known to Quaterra or that Quaterra currently deems immaterial may also impair the Company’s business operations. If any of these known or unknown risks or uncertainties actually occurs with material adverse effects on Quaterra, the Company’s business, financial condition, results of operations and/or liquidity could be seriously harmed, which could cause the Company’s actual results to vary materially from recent results or from the Company’s anticipated future results. In addition, the trading price of the Company’s common stock could decline due to any of these known or unknown risks or uncertainties, and you could lose all or part of your investment.
The Company may not have sufficient funds to complete further exploration programs.
We have limited financial resources (working capital deficiency of $504,419 at December 31, 2008), doThe Company does not generate operating revenue and must finance our exploration activity by other means, including financingsuch as raising funds through the sale of equity, debt, or debt financing. Weproperty interests. The Company cannot provide any assurance that additional funding will be available for further exploration of ourthe Company’s projects or to fulfill our anticipated obligations under our existing property agreements. As reflected in Note 1of December 31, 2013, the Company had working capital deficiency of $193,943 which includes a US$600,000 loan owed to ourMr. Thomas Patton, Chairman of the board, and, as of March 24, 2014, the Company has cash on hand of approximately $700,000.
Although management is confident that it will be able to raise sufficient funds there is no assurance at the date these consolidated financial statements ourwere approved that these financing initiatives will be successful. The lack of sufficient committed funding for the next 12 months indicates a material uncertainty, which casts substantial doubt over the Company’s ability to continue as a going concernconcern. These consolidated financial statements do not include the adjustments that would result if the Company is dependentunable to continue as a going concern.
- 8 -
Management has planned levels of exploration spending on our abilitythe Company’s properties with an expectation that future capital raises would provide the necessary funding, which includes equity financing, joint venture partners’ contributions, and/or realizing the carrying amount through the sale of mineral property interests.
Future equity transactions could cause dilution of present and prospective shareholders.
Historically, the Company has financed operations through private placements. In order to obtain financing. If we failfinance future operations and development efforts, the Company may raise funds through the issuance of common shares or the securities convertible into common shares through private placements or public offerings. The common shares in these financings often are sold at a discount to obtain additional financing, wemarket prices, and the exercise price of the warrants sometimes is at or may be lower than market prices. The Company cannot predict the size of future issues of common shares or the issue of securities convertible into common shares or the effect, if any, that issues and sales of the Company’s common shares will have on the market price of its common shares. Any transaction involving the issue of common shares, or securities or convertible into common shares, could result in dilution, possibly substantial, to delaypresent and prospective holders of common shares, either at the time of the financing or cancel further explorationsubsequently when restrictions if any expire and the common shares are resold into the public markets. Similarly, the Company cannot predict the value of our properties, and we could lose allany asset sale nor its effect on the market price of our interest in our properties.its common shares.
We haveThe Company has a history of losses and expectexpects to incur losses for the foreseeable future.
We haveThe Company has incurred losses during each of the prior three periodsfive years in the amounts of $6,834,181, for the year ended December 31, 2008, $7,303,304 for the year ended December 31, 2007, and $3,830,534 for the year ended December 31, 2006.$55,194,093. As of December 31, 2008, we2013, the Company had an accumulated deficit of $28,627,483. We expect$91,799,520. Quaterra expects to continue to incur losses unless and until such time as one or more of ourthe properties enter into commercial production and generate sufficient revenues to fund ourthe Company’s continuing operations.
OurThe Company’s exploration programs may not result in a commercial mining operation.
Mineral exploration involves significant risk because few properties that are explored contain bodies of ore that would be commercially economic to develop into producing mines. OurQuaterra’s mineral properties are without a known body of commercial ore and ourthe proposed programs are an exploratory search for ore. WeThe Company cannot provide any assurance that our current exploration programs will result in any commercial mining operation. If the exploration programs do not result in the discovery of commercial ore, wethe Company will be required to acquire additional properties and write-off all of our investments in our existing properties.
- 2 -
We doThe Company does not have Proven Mineral Reserves or Probable Mineral Reserves.
We haveThe Company has not established the presence of any Proven Mineral Reserves or Probable Mineral Reserves (as such terms are defined in National InstrumentNI 43-101 of the Canadian Securities Administrators); please refer to “Disclosure of Mineral Resources” in the Preliminary Notes to this annual report) at any of ourQuaterra’s mineral properties. WeThe Company cannot provide any assurance that future feasibility studies will establish Proven Mineral Reserves or Probable Mineral Reserves at ourQuaterra’s properties. The failure to establish Proven Mineral Reserves or Probable Mineral Reserves could restrict ourthe Company’s ability to successfully implement ourits strategies for long-term growth.
OurMineral resource estimates are subject to updates which may differ from prior estimates and adversely affect the value of the Company’s properties.
The estimating of mineralization is a subjective process and the accuracy of estimates is a function of the quantity and quality of available data, the accuracy of statistical computations, and the assumptions used and judgments made in interpreting engineering and geological information. There is significant uncertainty in any mineralization estimate, and the actual deposits encountered and the economic viability of mining a deposit may differ significantly from our estimates. From time to time, Quaterra obtains updated resource estimates and technical reports related to the Company’s mineral properties.
The Company’s future business and financial condition are dependent upon resource prices.
Resource prices have fluctuated widely, particularly in recent years, and are affected by numerous factors beyond ourthe Company’s control. These include international economic and political trends, inflation, currency exchange fluctuations, interest rates, global or regional consumption patterns, speculative activities and increased production due to new and improved extraction and production methods. These factors may negatively affect the marketability of any ore or minerals discovered at, and extracted from, ourQuaterra’s properties. If, because of a sustained decline in prices, financing were not available to meet cash operating costs, the feasibility of continuing operations would be evaluated and if warranted, would be discontinued.
Our- 9 -
The Company’s common share price has been and may continue to be subject to volatility.
U.S. and Canadian securities markets since 2008in recent years have experienced high levels of price and volume volatility, and the market price of securities of many companies have experience wide fluctuation in price which have not necessarily been related to the operating performance underlying assets values or prospects of such companies. Factors unrelated to ourQuaterra’s financial performance or prospects include macroeconomic developments in North America and globally, and market perceptions of the attractiveness of particular industries. OurThe Company’s share price, financial condition, and results of operations are all also likely to be significantly affected by short-term changes in uranium, gold, silver and copper prices. Continual fluctuations in metal prices may occur. As a result of any of these factors, the market price of ourthe Company’s shares at any given point in time may be subject to wide swings unrelated to any direct action by ourQuaterra’s operations.
Some of ourthe Company’s directors and officers may have conflicts of interest due to their involvement with other natural resource companies.
Some ourthe Company’s directors and officers are directors or officers of other natural resource or mining-related companies and these associations may give rise to conflicts of interest from time to time. As a result of these conflicts of interest, weQuaterra may miss the opportunity to participate in certain transactions, which may have a material, adverse effect on ourthe Company’s financial position.
WeThe Company may experience difficulty attracting and retaining qualified management to grow ourQuaterra’s business.
We areThe Company is dependent on the services of key executives including ourthe Chief Executive Officer and other highly skilled and experienced executives and personnel focused on advancing our corporate objectives as well as the identification of new opportunities for growth and funding. Due to ourthe Company’s relatively small size, the loss of these persons or ourthe Quaterra’s inability to attract and retain additional highly skilled employees required for our activities may have a material adverse effect on ourthe Company’s business and financial condition.
WeThe Company may be limited in ourits ability to manage growth.
Should wethe Company be successful in ourits efforts to develop mineral properties or to raise capital for such development or for the development of other mining ventures, weit may experience significant growth in operations. Any expansion of ourthe Company’s business would place demands on our management, operational capacity, and financial resources. We anticipateThe Company anticipates that weit will need to recruit qualified personnel in all areas of operations. There can be no assurance that weQuaterra will be effective in retaining our current personnel or attracting and retaining additional qualified personnel, expanding our operational capacity or otherwise managing growth. The failure to manage growth effectively could have a material adverse effect on the ourCompany’s business, financial condition and results of operations.
- 3 -
Environmental and other regulatory requirements may limit ourthe Company’s operations and increase our expenses.
OurThe Company’s operations are subject to environmental regulations promulgated by various Canadian, U.S., and Mexican government agencies. Claims and current and future operations will be governed by laws and regulations governing mineral concession acquisition, prospecting, development, mining, production, exports, taxes, labor standards, occupational health, waste disposal, toxic substances, land use, environmental protection, mine safety and other matters. Companies such as ours that engage in exploration activities often experience increased costs and delays in production and other schedules as a result of the need to comply with applicable laws, regulations and permits. Issuance of permits for ourQuaterra’s exploration activities is subject to the discretion of government authorities, and wethe Company may be unable to obtain or maintain such permits. Permits required for future exploration or development may not be obtainable on reasonable terms or on a timely basis. Existing and possible future laws, regulations and permits governing operations and activities of exploration companies, or more stringent implementation thereof, could have a material adverse impact us and cause increases in capital expenditures or require abandonment or delays in exploration.
Operating hazards associated with mining may expose usthe Company to liability.
Mining operations generally involve a high degree of risk, including hazards such as unusual or unexpected geological formations. Operations in which we havethe Company has an interest are subject to all the hazards and risks normally incidental to exploration, development and production of minerals, any of which could result in work stoppages, damage to or destruction of mines and other producing facilities, damage to or loss of life and property, environmental damage and possible legal
- 10 -
liability for any or all damage or loss. WeThe Company currently dodoes not maintain standard insurance policies on ourQuaterra’s properties. WeThe Company may become subject to liability for cave-ins and other hazards for which we cannot be fully insureinsured or against which wethe Company may elect not to insure where premium costs are disproportionate to ourthe Company’s perception of the relevant risks. For example, we arethe Company is not currently covered by any form of political risk insurance or any form of environmental liability insurance. The payment of such insurance premiums and the incurring of such liabilities would reduce the funds available for exploration activities.
OurThe Company’s properties may be subject to uncertain title.
The acquisition of title to resource properties or interest therein is a very detailed and time consuming process. Title to and the area of resource concessions may be disputed. We haveThe Company has investigated title to all of ourits mineral properties and, to the best of ourthe Company’s knowledge, title to all of ourQuaterra’s properties are in good standing. The properties may be subject to prior, and in some cases, not fully ascertainable unregistered agreements or transfers, and title may be affected by undetected defects. Title may be based upon interpretation of a country’s laws, which laws may be ambiguous, inconsistently applied and subject to reinterpretation or change.
Enforcement of judgments or bringing actions outside the United States against usthe Company and ourits directors and officers may be difficult.
We areQuaterra is organized under the lawlaws of and headquartered in British Columbia, Canada, and the majority of ourthe Company’s directors and officers are not citizens or residents of the U.S. In addition, a substantial part of ourthe Company’s assets are located outside the U.S. and Canada. As a result, it may be difficult or impossible for you to (a) enforce in courts outside the U.S. judgments against usthe Company and a majority of ourQuaterra’s directors and officers, obtained in U.S. courts based upon the civil liability provisions of U.S. federal securities laws or (b) bring in courts outside the U.S. an original action against usthe Company and ourits directors and officers to enforce liabilities based upon such U.S. securities laws.
ITEM 4. INFORMATION ON THE COMPANY
A. History and Development of the Company
Our legalQuaterra was incorporated under the Company Act (British Columbia) on May 11, 1993 originally under the name Acquaterre Mineral Development Ltd. On November 30, 1993, the Company changed its name to Aquaterre Mineral Development Ltd. and commercial name isultimately became Quaterra Resources Inc. We operate as a corporation pursuant toon October 23, 1997. Quaterra’s domicile is British Columbia, Canada and the laws of the Province of British ColumbiaCompany operates under the British Columbia Business Corporations Act. We originally were incorporated on May 11, 1993 underAct SBC 2002 Chapter 57.
On March 4, 1997, the name Aquaterre Mineral Development Ltd. Company increased its authorized capital from 20,000,000 common shares without par value to 100,000,000 common shares without par value.
On October 23, 1997, we changed our name to Quaterra Resources Inc.the Company consolidated its issued and consolidated ourun-issued share capital on the basis of five pre-consolidation shares for one post-consolidation share, and increased its authorized capital to 100,000,000 common shares without par value.
On August 3, 1998, the Company cancelled its previous form of Articles and adopted a new form of Articles.
On April 25, 2005, the Company completed the transition procedures in accordance with the Business Corporations Act (British Columbia), (the “New Act”).
On June 17, 2005, the Company increased the number of common shares which were authorized to issue to an unlimited number of common shares and, on June 13, 2005, cancelled its former Articles and adopted new Articles to take advantage of provisions of the New Act. The New Act was adopted in British Columbia on March 29, 2004 replacing the Company Act (the “Former Act”). The New Act requires the provisions formerly required in the Memorandum to be in the Company’s Articles. The New Act eliminates the requirement for a five-for-one split.Memorandum.
Our principal place of businessThe Company’s registered office is located at 1710 – 1177 West Hastings Street, Vancouver, B.C. V6E 2L3. Telephone (604) 641-2764. The Company’s head office is located at 1100 – 1199 West Hastings Street, Vancouver, British Columbia, Canada V6E 3T5 and3T5. Telephone: (604) 684-9384, Facsimile: (604) 641-2740. The Company’s website is www.quaterra.com.We are not including the information contained on our telephone number is (604) 681-9059. Our registered agent in the Provincewebsite as part of, British Columbia is Jeffrey T.K. Fraser Law Corp., Suite 950, 1199 West Hastings Street, Vancouver, British Columbia, Canada, V6E 3T5. Our agent for service of process in the United States is CT Corporation System 520 Pike Street, Suite 985, Seattle, WA 98101.or incorporating it by reference into, this Annual Report on Form 20-F.
- 411 -
Since our incorporation, substantially all our capital has been deployed to development of our exploration stage business. We have not undertaken any material mergers or acquisitions other than in the ordinary course of business. There have been no public takeover offers by third parties with respect to our shares and we have made no public takeover offers with respect to another company’s shares.
B. Business Overview
We areOn January 1, 2011, the Company entered into an exploration stage company focusedoption agreement with North Exploration LLC to acquire 41 mining claims in White Pine County, Nevada, known as Butte Valley property. The Company can earn a 100% interest in the claims by making staged payments totaling US$1 million. The Company has an option at any time to purchase the property for the difference between US$1 million and the sum of amounts previously paid or if the full amounts have been paid under the above the sum of US$1. The property is subject to 2.5% NSR upon commencement of commercial production of which 1% can be bought down for US$1 million.
On February 7, 2011 Quaterra completed a private placement of 3,293,407 units for gross proceeds of US$6.0M (C$5,994,000) received from Goldcorp pursuant to the IFA. Each unit consisted of one common share and one-half of one share purchase warrant with an exercise price of $2.27 per full warrant expiring February 7, 2013.
On April 27, 2011, Quaterra completed the purchase of the Yerington property from Arimetco, Inc. Assets purchased include 4.2 square miles of patented claims and fee mineral properties centered on explorationthe former Anaconda open pit copper mine containing an historic resource estimate in excess of four billion pounds of copper, and development8,600 acre feet per year of water rights. This property, together with 9.3 and 13.2 square miles of unpatented claims at Yerington and nearby MacArthur respectively, provides the Company with a significant land position in the center of a copper camp. Quaterra has paid the remaining cash acquisition cost and has released 250,000 common shares of the Company stock previously issued and under escrow.
On May 12, 2011, pursuant to its January 1, 2011 option, Quaterra announced its acquisition of the Butte Valley porphyry copper prospect, located in White Pine County, Nevada. The property consists of approximately 45 square miles of mineral propertiesrights obtained by optioning and staking a total of 1,483 unpatented U.S. lode claims.
On May 26, 2011, the Company entered into a mining lease with an option to purchase agreement with Majuba Mining Ltd. to earn an interest in North America. We currently are exploringcertain unpatented mining claims in Lyon County, Nevada, for copper, uranium, molybdenum,US$1.61 million. The Company is required to incur a total of US$300,000 exploration work on or before the third anniversary and precious metalsany difference between the actual expenditures and US$300,000 is required to be paid in the United States and Mexico. Our exploration efforts are directedevent that less than US$300,000 is so expended. The project is subject to 3% NSR upon commencing commercial production of which 1% can be bought at propertiesUS$1,500,000.
On June 15, 2011, the Company entered into an option agreement with potential to host large base metal, precious metal, and uranium deposits. When identifying prospects, we consider the following criteria: infrastructure; environment and location that is favorable for building a mine; large tonnage and/or high grade potential; significant, unrealized upside; and opportunityNevada Alaska Mining Co., Inc. to acquire a 100% interest under reasonable terms.in certain mining claims in Esmeralda County, Nevada for US$1 million over ten years. A 2% NSR is required upon commercial production.
We made several acquisitions during the year. On July 22, 2008, we acquired4, 2011, Quaterra announced that it has finalized an option agreement with La Cuesta International, Inc. (LCI) to acquire a 100% interest in the Cave Peak molybdenumMicroondas prospect fromlocated in Zacatecas State, Mexico, about 17 kilometers south-southeast of Rio Grande. Quaterra has the right to earn a 100% interest in the property by making semi-annual lease/pre-production payments and paying a 1% Net Smelter Return royalty (“NSR”) payment that is capped at US$5 million. A portion of the property carries an uncapped 2% NSR royalty. Quaterra, at its option, may issue to LCI 20,000 common shares or its cash equivalent on or before June 12, 2012.
On August 1, 2011, the Company entered into an option agreement with a private owner to acquire a 100% interest in certain mining claims situated in Lyon County, Nevada for US$500,000. The Company has an option at any time to purchase the property for the difference between US$500,000 and the sum of the amount previously paid.
On October 20, 2011, Quaterra added two properties to the Goldcorp IFA: El Calvo gold, located in the central Mexican state of San Luis Potosi, and Microondas gold-silver, located in Zacatecas State, of Texas. The prospect covers three breccia pipes, one of which contains significant molybdenum mineralization. Mexico.
On September 30, 2008 we completedOctober 26, 2011, as contemplated by their June 17, 2010 agreement, Quaterra entered into a joint venture agreement with EXMINGrande Portage Resources Ltd. for the Herbert Glacier gold project located near Juneau, Alaska. Grande Portage has acquired a 65% interest and the Company retains a 35% interest in this project. Each party has agreed to bear its proportionate share of costs for the further exploration and development of the project.
On March 21, 2012, Quaterra entered into an Amended and Restated Investment Framework Agreement (“ARIFA”) with Goldcorp Inc. (“Goldcorp”) of Vancouver, B.C. This agreement extends the IFA entered into with Goldcorp on EXMIN’s East Durango concession. We haveJanuary 29, 2010 through the first quarter of 2013.
- 12 -
On April 12, 2012 received $2.48 million from Goldcorp to fund additional exploration on certain properties in Mexico by issuing 4 million shares at the price of $0.62 per share.
On October 2, 2012, the Company sold its Butte Valley copper project to Freeport-McMoRan Exploration Corporation of Phoenix, Arizona for gross proceeds of US$2 million.
On December 28, 2012, Quaterra completed a private placement of 6,541,571 units at the price of US$0.35 per unit for gross proceeds of US$2,289,550. Each unit consisted of one common share and one share purchase warrant with an exercise price of US$0.53 per warrant expiring December 28, 2014.
On March 20, 2013, the Company entered into an exclusive exploration agreement with Desert Pearl Farms, LLC for an option to purchase the surface rights, mineral rights and surface water rights to the Hunewill Ranch property in Lyon County, Nevada. To earn the exclusive right to conduct mineral exploration on the property, the Company is required to make annual payment of US$1,480,000 over a period of 8 years. The Company has the option to purchase the property at any time during the 8-yr period (Option Period).
On March 28, June 5 and July 4, 2013, the Company borrowed a total of US$800,000 unsecured loans at an interest rate of 10% per annum from its Chairman of the board, Mr. Thomas Patton. As of December 31, 2013, US$200,000 was repaid and the balance of US$600,000 was amended on March 18, 2014 to a demand basis with a 40-day notice period.
On June 10, 2013, Quaterra and Goldcorp entered into an amendment agreement with respect to the Investment Framework Agreement (IFA) dated January 29, 2010. This amendment agreement extended the expiration for designation of Advanced Properties to January 2016 from January 2014 and also modified certain earn-in requirements after a property has been selected as an Advanced Property: 1) Lowered spending requirement to earn a 75% interest in EXMIN’s East Durango property. The East Durango property consists2% NSR royalty to $1 million over first three years (from $2 million over two years); 2) Lowered the minimum annual expenditure requirement after three years to $250,000 thousand from $1 million; 3) allowed Goldcorp to pool expenditures from other projects to one project to meet the earn-in requirement described above.
On July 29, 2013, the Company received an acquisition bonus of US$1,000,000 ($1,038,000) from Freeport-McMoRan related to the sale of the 11,181 hectare Tecolote concession which abutsButte Valley property in October 2012.
Effective July 31, 2013, the Company implemented changes to management and is directly northcomposition of Quaterra’s Mirasol-Americas projects. the Board of Directors
On September 13, 2013, Quaterra completed a private placement of 29,810,000 units at the price of US$0.10 per unit for gross proceeds of US$2,981,000. Each unit consisted of one common share and one share purchase warrant with an exercise price of US$0.15 per warrant expiring September 13, 2016.
On September 19, 2013, Quaterra sold three properties (Sabino, Marijo, and El Calvo) in central Mexico to Goldcorp. for a total cash consideration of US$375,000. Quaterra retained a 2% net smelter returns royalty (“NSR”) on each of the three properties capped at USD$2,000,000 per property.
On November 24, 2008 we secured12, 2013, the Company entered into an exclusive exploration and option agreement with Yerington Mining LLC for a property known as Yerington Mining property located in Lyon County, Nevada. To earn the Willow Creek Discovery Group, LLCrights to acquire 100%conduct mineral exploration on the property, the Company is required to make an annual payment of US$200,000 (2013 payment made) in the Willow Creek porphyry molybdenum prospectfirst two years and then US$100,000 on each anniversary date until November 12, 2021. These payments also provide the Company the exclusive right to purchase the property during this 8 year period (the option period).
On November 19, 2013, the Company entered into an amendment agreement with La Cuesta International, Inc. with respect to the Santo Domingo property, pursuant to which the Company issued 347,150 common shares in southwestern Montana. Willow Creek is a North American assetsatisfaction of two property payments.
On November 19, 2013, the Company entered into an amendment agreement with La Cuesta International, Inc. with respect to the Microondas property, pursuant to which the Company issued 321,430 common shares in a major mineral belt where we have the opportunity to earn a 100% interest and make a significant near-term discovery in an area with excellent infrastructuresatisfaction of two property payments.
For more information about our business, please refer to Item 4.D “Property, Plants and Equipment” below.
- 13 -
C. Organizational Structure
- 5 -Inter-corporate Relationships

| Note | Quaterra Alaska, Inc. is 100% owned by Quaterra Resources Inc. and holds | |
| Note | Quaterra International Limited is 100% owned by Quaterra Resources Inc. and QTA International Nieves Limited is 100% owned by Quaterra International Limited. | |
| Note 3: | Minera Agua Tierra S.A. de C.V. is 100% owned by | |
| Note | Minera Stockwork de Plata, S.A. de C.V. is 100% owned by QTA International Nieves Limited and holds the following claims: Reduccion Crestones, Las Americas, Americas, Mirasol, Cerro Blanco, Jaboncillo, Carolina, Falcon, Los Azafranes, Sara, Onix, Marijo, Coyote 4, Tajo, Crestones and Inde. | |
| Note 5: | Quaterra Blackberry Nieves (BVI) JV Corp. is |
- 14 -
Note 6: | Minera Cerro Gregorio, SA de CV is 100% owned by Quaterra Blackberry Nieves (BVI) JV Corp. and holds |
D. Property, Plants and Equipment
GENERAL DEVELOPMENT OF THE BUSINESS
MacArthur, Nevada, USA
Acquisition and Staking of Mineral Claims
The MacArthur property consists of 897 unpatented lode claims totaling approximately 18,533 acres on lands administered by the US Bureau of Land Management (“BLM”). The total reflects the addition of 345 claims transferred from Quaterra’s wholly owned subsidiary, Singatse Peak Services LLC (SPS) to Quaterra’s MacArthur project in July 2012. A significant number of the claims are held by means of a mineral lease with option to purchase, executed on August 27, 2005 and subsequently amended. The agreement gives Quaterra the right to purchase the claims from North Exploration LLC (“North”) by making 3 annual payments of $524,000 (option balance) plus interest at the rate of 6% per annum by January 15, 2013. The second of these three annual payments was paid January 11, 2012. The third payment was renegotiated on December 14, 2012 to defray the final option balance by making a $100,000 payment plus $31,440 in interest prior to January 15, 2013 to extend the lease and option to January 15, 2014. The final payment was subsequently spilt and delayed to July 1, 2014 for US$212,000 with the payment of $36,940 interest to be paid on March 31, 2014 and the reaming US$212,000 plus interest by January 15, 2015. Quaterra’s purchase is subject to a two percent Net Smelter Return (NSR) royalty with a royalty buy down option of $1,000,000 to purchase one percent of the NSR, leaving a perpetual one percent NSR. The agreement with North is in good standing.
Expenditures to Date
Acquisition costs incurred by the Company to December 31, 2013 were $3,363,308 (2012 - $3,077,838) and exploration expenditures were $19,501,476 (2012 - $18,783,675) for a total of $22,864,784 (2012 - $21,861,513).
Location, Access and Infrastructure
The MacArthur Copper Project is located near the geographic center of Lyon County, Nevada, USA along the northeastern flank of the Singatse Range approximately seven miles northwest of the town of Yerington, Nevada. The project is accessible from Yerington by approximately five miles of paved roads and two miles of maintained gravel road. A 100-foot wide gravel haul road that accessed the MacArthur open pit copper mine during the 1990s leads 5 miles south to the Yerington Mine. Beyond the MacArthur pit area are several existing historic two-track dirt roads that provide access throughout the property. Topographic coverage is on US Geological Survey “Mason Butte” and “Lincoln Flat” 7.5’ topographic quadrangles. The nearest major city is Reno, Nevada approximately 75 miles to the northwest.
History
The MacArthur project has been the subject of exploration and drilling by several operators who have contributed to the current database of more than 740 holes totaling approximately 282,000 feet. During the late 1940s, Consolidated Copper Mines attracted the interest of the US Bureau of Mines to conduct 7,680 feet of trenching in 1948 and followed up with the completion eight core holes for 3,414 feet in 1950. The Anaconda Company (“Anaconda”) began investigations at MacArthur including 33 shallow drill holes during 1955, 1956, and 1957. In 1963, Bear Creek Mining Company (“Bear Creek”) optioned claims and drilled at least fourteen air rotary holes, the deepest to 663 feet. At least four holes for 1,237 feet were drilled to satisfy claim staking location work. During 1967 to 1968, The Superior Oil Company optioned the claims formerly held by Bear Creek and drilled eleven holes as rotary pre-collar, core finish, for 13,116 feet testing the concept that a deep primary sulfide-bearing porphyry copper ore shell might underlie the MacArthur oxide mineralization heretofore tested no deeper than 663 feet. During the early 1970s, Anaconda conducted an extensive trenching and rotary drilling program consisting of more than 280 rotary holes totaling approximately 56,000 feet over and adjacent to the present day MacArthur pit.
Metech Pty. Ltd., of Perth, Australia was commissioned to prepare an ore reserve and mining planning study of the MacArthur deposit in 1989 The Metech study initiated the purchase of the Anaconda Yerington district properties by Arimetco International (“Arimetco”). Arimetco mined a total of six million tons at an estimated grade of 0.36 % total copper using open pit methods from the MacArthur deposit in the period of 1995 to 1998. Due to financial difficulties resulting
- 15 -
primarily from the low price of copper, Arimetco sought protection under Chapter 11 of the U. S. bankruptcy Code in January 1997 and suspended all operations in 2000. After Arimetco’s departure, the mining claims over the deposit were allowed to expire. No consistent, large-scale mining has occurred on the site.
Quaterra acquired the MacArthur property in August, 2005. The acquisition was motivated by Quaterra’s belief in the potential of the property to host a copper deposit capable of sustaining a large run-of-mine heap leach operation using a solution extraction/electrowinning (SXEW) process for low cost production. The Company initiated exploration drilling in April 2007 and by November 2011, completed a total of 203,775 feet of drilling in 402 holes on the property. The drilling program has defined a widespread blanket of acid soluble copper oxide and chalcocite mineralization above primary copper mineralization that is believed to be the fringes of a major copper porphyry system.
Geology
The MacArthur copper deposit forms part of the Yerington mining district which includes at least three, large, porphyry copper deposits (Yerington, Ann Mason, Bear), as well as two large IOCG deposits (Pumpkin Hollow, and Minnesota). Mineralization ranges from disseminated porphyry copper occurrences to skarn, limestone replacement, and vein type deposits.
The Yerington area is underlain by early Mesozoic volcanic and sedimentary rocks now exposed along uplands in the Singatse Range in the west and the Wassuk Range to the east. These Mesozoic rocks were intruded by two Middle Jurassic batholiths, an older granodiorite (Yerington Batholith) and younger quartz monzonite (Bear Quartz Monzonite) that comprise the majority of outcropping rocks in the district. The batholiths were themselves intruded by another Middle Jurassic quartz monzonite event moderately to steeply north dipping quartz-biotite-hornblende porphyry dike swarms, associated with copper mineralization, striking north-northwesterly across the entire mining district. The Mesozoic section is overlain by Early to Middle Tertiary volcanics deposited ash flow tuffs prior to the advent of normal, faulting associated with Late Tertiary basin-and-range extension that displaced and tilted all of the above-mentioned rocks. These faults dip east and are curved, concave upward, so that the dip of the fault flattens eastward. Net displacements are in an east-west direction. The geologic section is completed by post-faulting conglomerates and alluvium.
At MacArthur, the older granodiorite underlies most of the northern and western parts of the Company’s claim block. Along the east part of the claim block quartz monzonite is dominant and underlies the MacArthur pit. In bench walls at the MacArthur Pit, the quartz monzonite hosts conspicuous light brown limonite alteration banding (averaging 4 to 6 per foot) sub-parallel to the steeply north dipping, west-northwest trending quartz porphyry dikes. Along the eastern portions of the property, including the eastern third of the MacArthur pit, quartz monzonite assumes a light gray color due to widespread sodic-calcic alteration. A “border-phase quartz monzonite” commonly lies at the contact between the granodiorite and the quartz monzonite. The border-phase quartz monzonite is finer-grained than the quartz monzonite and has more abundant potassium feldspar.
Quartz porphyry dikes that host a large portion of the primary copper mineralization at Anaconda’s Yerington mine are associated with all copper occurrences in the district. The porphyry dikes at MacArthur are classified by dominate mafic minerals into quartz biotite porphyry and quartz hornblende porphyry, each subdivided further based on composition and alteration. Dikes contain feldspar crystals and either hornblende or biotite crystals set in an aphanitic matrix. The structures are typically ridge-formers with widths to 50 feet, dip steeply to the north, and follow a penetrative north-northwest (S60°E to S80°E) structural fabric. Narrow (<10 feet) fine grained, post porphyry andesite dikes follow the same NNW structural fabric.
Both Jurassic and Tertiary age andesite dikes in the walls of the MacArthur Pit can be traced from bench to bench and projected across the pit floors. The Jurassic dikes are commonly very fine grained, dactylitic plagioclase-bearing porphyries that pinch and swell as they fill fractures and intrude the hornblende and biotite quartz porphyry dikes. Tertiary hornblende andesite dikes are similar, but coarser grained than the Jurassic andesite dikes, containing abundant, acicular, black hornblende phenocrysts and occasionally plagioclase phenocrysts. Mid-Tertiary ash flow tuff units unconformably overlay the Mesozoic intrusive rocks in the southeast and western margins of the property.
Mineralization
The MacArthur deposit is part of a large, partially defined porphyry copper system that has been complicated by complex faulting and possible post-mineral tilting. Events leading to the current geometry and distribution of known mineralization include 1) emplacement of primary porphyry copper mineralization; 2) supergene enrichment resulting in the formation of a widespread, tabular zone of secondary chalcocite mineralization below outcrops of totally oxidized rocks called a leached
- 16 -
cap; 3) oxidation of outcropping and near-surface parts of this chalcocite blanket, as well as oxidation of the primary porphyry sulfide system coupled with partial remobilization of copper to form the upper zone of oxide copper now exposed in the MacArthur pit and throughout the MacArthur property. Oxide, chalcocite, and primary copper mineralization on the MacArthur property is hosted in both granodiorite and quartz monzonite, and in lesser amounts within quartz biotite-hornblende (monzonite) porphyry dikes, all of middle Jurassic age. Oxide copper is also hosted in northwest striking andesite dikes less than one to ten feet wide with contacts forming favorable loci for mineralization. Andesite dikes make up less than approximately one to two percent of the host rocks on the property. Fracturing and ground preparation supplied the passage ways for the copper to migrate.
Copper oxide minerals are exposed throughout Quaterra’s MacArthur property, particularly in MacArthur pit walls as primarily green and greenish-blue chrysocolla CuSiO3.2H20 along with black neotocite, aka copper wad (Cu, Fe, Mn) SiO2, azurite Cu3(OH2)(CO3) and malachite Cu2(OH2)CO3, while tenorite (CuO) was identified with the electron microprobe (Schmidt, 1996). Copper-enriched limonite was identified by Anaconda as the mineral delafossite (CuFeO2). Chalcocite has been identified in drill holes below the MacArthur pit and in drilling throughout the property. The sulfides digenite (Cu9S5) and covellite (CuS) have been identified petrographically in drill cuttings from the western part of the property. The oxide copper mineralization is strongly fracture controlled, coating joint and fracture surfaces and within shears and faults. Both green and black copper oxides are frequently found on 1-5 millimeter fractures, as coatings and selvages and may be mixed with limonite. The fractures trend overall N60°W to N80°W (bearing 300° to 280° azimuth) and generally dip to the north. Limited turquoise is found on the property, mainly in one- to five-millimeter veinlets. On a minor scale, oxide copper mineralization replaces feldspar phenocrysts in the igneous host units, favoring andesite.
A significant amount of chalcocite has been intersected in drillholes. Chalcocite is seen on drill chips or drill core coating pyrite and chalcopyrite as weak to strong coatings and is strongest when occurring around the MacArthur fault. Chalcopyrite is present as disseminations and veinlets, with or without chalcocite. As much of the historic drilling was stopped at shallow (<400 foot) depths, the scope and extent of chalcopyrite mineralization have not been fully defined.
Both copper oxide and chalcocite mineralization occur over approximately 9,000 feet east-west by 4,500 feet north-south. Copper oxides are structurally controlled coating fractures, joint surfaces, and developed as green or black “streaks” within shears and faults over several feet. Chalcocite may similarly be seen as grayish “streaks” within shears. Oxide mineralization exhibits a generally flat-lying geometry extending with good continuity 150 feet below surface and less continuously up to 600 feet below surface. Chalcocite mineralization generally occurs as flat-lying zones 50 feet or more in thickness, mixed with or below oxide mineralization.
Primary chalcopyrite mineralization occurs irregularly with chalcocite and as porphyry style disseminations or as veinlets in quartz monzonite associated with potassic alteration below both the oxide and chalcocite mineralization. Quaterra’s drilling program in the Gallagher area has delineated a zone of chalcopyrite mineralization that extends over a north-south distance of 2,500 feet. The primary sulfide zone has a defined width of 500 feet and extends to a depth of approximately 650 feet.
Porphyry copper style sulfide mineralization below the low-angle MacArthur fault zone at the North Porphyry Target has been defined over a distance of 2,500 feet between holes QM-68 and QM-164. Veinlet and disseminated primary chalcopyrite mineralization intercepted at a depth of 485 feet in QM-68 assayed 1.19% copper over a thickness of 110 feet. The same zone in QM-70 averaged 0.82% copper over a thickness of 60 feet at a depth of 420 feet and correlates to a thickness of 15 feet averaging 1.20% at a depth of 770 feet in hole QM-72. QM-100 intersected the sulfide mineralization with 0.58% copper over 65 feet. Approximately 1,000 feet to the north, hole QM-164 intercepted 64 feet of disseminated chalcopyrite mineralization in sodic altered granodiorite averaging 1.31% copper at a depth of 1,673 feet. The intercept includes a high grade zone of 29 feet averaging 2.21% . Mineralized zones within potassic halos in holes QM-165 to the west and in QM-163 to the east are consistent with those that could fringe a porphyry copper center.
Exploration and Drilling Results
Quaterra acquired the digitized Anaconda exploration and drilling data package in August 2006 and commenced a review of the deposit geology and mineralization model using Datamine software. The data was used to assess the required drilling and sampling to complete a technical report on the MacArthur Project with the objective of preparing a NI 43-101 compliant resource estimate.
The lateral zonation of supergene copper minerals visible at the surface, a possible chalcocite blanket to the north of the pit, and a large, pervasive phyllic alteration zone to the north and west of the mine workings, all suggested to Quaterra that the MacArthur deposit could have a potential for growth; both in the form of copper oxides and as primary sulfides in a related porphyry system.
- 17 -
In April 2007, the Company commenced a drilling program to twin approximately 10% of the shallow holes that defined the previously explored copper oxide mineralization at MacArthur and to identify extensions of copper oxide and chalcocite mineralization in the vicinity of the open pit. The 20-month drilling program totaled 80,100 feet in 173 holes including 23,900 feet of core in 49 holes and 56,200 feet of reverse circulation drilling in 124 holes. The drilling successfully targeted a deeper chalcocite zone in step-out holes from the pit, expanded the known oxide mineralization, and encountered a large, underlying tabular blanket of mixed oxide-chalcocite mineralization that overlies primary chalcopyrite mineralization verified by deeper drillholes in the western and northern margins of the drilled area.
Drilling on the MacArthur project was suspended through most of 2009 pending receipt of a Plan of Operations (POO) drilling permit. On October 28th the Company received the approval of the MacArthur POO and the BLM Record of Decision with a Finding of No Significant Impact (FONSI). The POO environmental assessment anticipates a total surface disturbance of 200 acres as a result of drilling activities throughout much of the project area.
Quaterra initiated a second phase of reverse circulation and deep core drilling in early December 2009. Completed in August 2010, the program tested the northern extension to higher grade acid soluble copper mineralization on 500 foot centers northwest of the pit in-filled on 500 ft centers an undrilled area west of the pit. In the southern Gallagher area, the program confirmed a band of continuous near surface oxide mineralization ranging in thickness from 15 to 60 feet over a distance of 1,900 feet between holes QM-155 and 156.
Three deep holes tested IPR anomalies to the north and northwest of the MacArthur pit where earlier drill holes intersected ore grade porphyry copper style sulfide mineralization below the low-angle MacArthur fault zone over a strike length of 1,000 feet. Hole QM-100, located 1,400 feet north of QM-68, intercepted porphyry-style chalcopyrite/biotite-chlorite veining at a depth 1,203 feet that assayed 0.58% copper over a thickness of 65 feet below the shallow-dipping MacArthur fault zone. QM-109, spotted on an IPR anomaly, failed to reach projected depth due to fractured, caving ground while QM-99 intersected massive pyrite impregnated breccia and scattered zones of secondary biotite and chlorite alteration; common elements of a porphyry system.
A total of 81,560 feet were drilled in 153 holes including 69,890 feet in 147 RC holes and 11,760 feet in 6 core holes during the 2011 drilling program. The program had the twin goals of enlarging and upgrading the status of the inferred resources through step-out and infill drilling and exploring for primary sulfide mineralization related to a copper porphyry system at depth.
The infill program encountered high grades of continuous chalcocite and copper oxide mineralization in zones averaging 40 feet or more in thickness along the western and northern margins of the deposit in the area referred to as the “Ridge Zone”. To test the high-angle mineralized structures that form an important component of the acid-soluble copper deposit, the program was completed on 250-foot centers in areas with higher grade potential and encountered some of the highest grades and best intercepts of acid soluble copper mineralization ever drilled on the property. Hole QM-187, drilled 2,000 feet north of the MacArthur pit, intersected 90 feet of predominantly chalcocite mineralization averaging 1.66% total copper (TCu) starting at a depth of 310 feet. This intercept includes 40 feet assaying 3.49% TCu. Hole QM-180 along the northwestern margin of the zone intercepted 40 feet averaging 1.37% TCu at a depth of 360 feet.
Exploration for a deep porphyry system at MacArthur intercepted one of the best primary copper intercepts yet identified on the project with 64 feet of disseminated chalcopyrite mineralization in sodic altered granodiorite averaging 1.31% TCu at a depth of 1,673 feet. The intercept includes a high grade zone of 29 feet averaging 2.21% TCu. QM-164 also intercepted a shallower zone of both vein and disseminated chalcopyrite at a depth of 685 feet that averages 0.34% TCu over a thickness of 96.5 feet. QM-164 extended the mineralized zone identified in QM-100 a distance of 1,000 feet to the north where it remains open for extension.
Geophysics
Quaterra Resources contracted three surveys at the MacArthur project in 2011 and 2012. A borehole geophysical survey and a surface IP/resistivity (IPR) survey were carried out by Zonge International in 2011. A detailed helicopter magnetic survey was flown by Geosolutions Pty. Ltd. in 2012. These surveys supplement previous geophysical work on the property that includes: a 2009 IPR survey carried out by Zonge; a 2007 helicopter magnetic survey carried out by EDCON-PRJ; a series of historic aeromagnetic surveys (1966 to 1975) available in analog form from the Anaconda Archives; and a series of historic IPR surveys (1963 – 1964) carried out by Kennecott Exploration Services/Bear Creek Mining Company and Superior Oil.
- 18 -
The mineralized system at MacArthur has an anomalous IP and resistivity response first detected in the Kennecott and Superior Oil IPR surveys in the 1960’s. The Quaterra 2009 and 2011 IPR surveys confirmed the reliability of the earlier surveys and further defined the depth extent of the IP anomalies. The 2009 and 2011 Quaterra surveys confirmed that the 1963-64 Kennecott data is of good quality and is useful for mapping anomalous IP zones within the upper 1,000-1,200 feet from the surface. Below this depth, the older data cannot effectively resolve the bottom of the IP anomalies nor determine if any of the anomalies extend to great depths.
The 2009 and 2011 data sets show this increased depth of exploration is important. Portions of the IP response are flat lying with limited depth extent. However both the 2009 and 2011 surveys have identified anomalous IP responses with depth extent in excess of 2000 feet and possibly feeder zones of the near surface zones. In 2011 two borehole IP surveys were run that demonstrate Quaterra’s ability to explore for deep sulfide responses below the depth of exploration of surface techniques. The modern data maps subtle low resistivity features which are interpreted to be porphyry alteration systems and have identified anomalous IP responses that extend under post-mineral volcanic cover to the north and west of the main MacArthur system. These buried anomalies are high priority drill targets.
Two high resolution helicopter magnetic surveys were flown over the MacArthur project in 2007 (EDCON-PRJ) and 2012 (Geosolutions). The modern, high resolution data has a broad frequency bandwidth and will be used for 3D modeling and exploring beneath the magnetic volcanic cover.
Sampling, Analysis and Security of Samples
Quaterra has explored the MacArthur property with both reverse circulation (RC) and diamond core drilling methods. Reverse circulation holes were drilled by Diversified Drilling LLC, Missoula, Montana, USA, DeLong Construction Inc., Winnemucca, Nevada, USA and by Leach Drilling Inc., Silver Springs, Nevada, USA. During 2007-2008 the core drilling was contracted to Kirkness Diamond Drilling of Dayton, Nevada, USA and Kirkness Brothers Diamond Drilling (aka KB Drilling Co, Inc) of Carson City, Nevada, USA. Major Drilling America, Inc., Salt Lake City, Utah, conducted core drilling during 2009-2010. Core drilling during 2011 was contracted to Ruen Drilling Inc, Clark Fork, Idaho, USA. The RC crews ran one 10-12 hour shift per day; the core drill crews operated 24 hours per day.
The MacArthur drilling program is supervised in the field by the project geologist for monitoring recovery, proper sample handling and accuracy in labeling. Drill core (HQ diameter) and reverse circulation samples are delivered from the drilling rigs to the core and sample storage facility in Yerington by the drillers at the end of each 12 hour shift for logging and sampling by the project geologists.
At the core storage/logging facility, core is photographed, measured, core recovery calculated, and the rock types, alteration minerals, textural features, structures, veining, and mineralized zones documented. Sample intervals on the first three holes were fixed at 5 feet. In subsequent drill holes the sample intervals are taken at each of the core runs marked by the driller’s blocks. Exceptions are where full recovery occurs in numerous, short core runs in intervals less than about 6 feet, or where the geologists visually selected sample intervals based on rock type or structure. Sample intervals are measured and marked with permanent marker, orange ribbon and aluminum tag that is stapled to the core tray showing the sample number. Where the core sample is coherent a line is drawn with permanent marker along the stick so that it is sawn in half perpendicular to the “grain” in order to get a representative split. The core is stored on pallets to be picked up by the analytical laboratory.
When core from the project arrives at the laboratory, it is split, using a core saw, into halves and one half of each interval is placed into a sample bag that is marked with the sample number. The sample is then dried, crushed to –10 mesh, rotary split to 1,000 grams, pulverized to –150 mesh, and split to 350 gram pulps. The pulps are assayed for total copper using a 2 gram-3 acid volumetric ore grade atomic-absorption (AA) spectroscopy analysis. The solution from the total Cu analysis is assayed by inductively coupled plasma (ICP) spectrometry for 34 elements. The acid soluble copper oxide (asCu) content of the sample is then analyzed by using a weak, sulfuric acid solution leach of a 1 gram pulp. The acid leachable copper sulfide content is analyzed by using ambient temperature concentrated sulfuric acid and hydrated ferric sulphate to determine Ferric Sulfate Soluble Copper (FSCu) content. Internal quality assurance and quality control procedures include the insertion of standards and duplicates into the sample sequences. Rejects from the previously analyzed samples are also sent to another accredited laboratory for check analyses. The remaining half core is placed back into the core box in its original position and the core boxes are returned to the Yerington core storage/logging facility by the laboratory truck, where it is then stacked and stored in order and by hole number. Reject and pulps are also returned with the core to the Yerington facility for archiving.
American Assay Laboratories (AAL) located in Sparks, Nevada prepared and assayed samples from the MacArthur drilling program in 2007. AAL is ISO/IEC 17025 certified and participates in CANMET, PTP MAL certification analyses twice a year and in GEOSTATS, SMA, and IOAG testing twice a year. Core samples from subsequent programs have been prepared
- 19 -
and analyzed by ISO17025 compliant ALS Chemex Laboratories in Sparks, Nevada and Skyline Assayers and Laboratories (Skyline) in Tucson, Arizona.
The MacArthur reverse circulation drilling program is supervised in the field by the project geologist for sample accuracy, proper handling and accuracy in labeling. Methods and procedures for splitting and packaging of samples are conducted such that the quality of the sample splitting meets or exceeds standards required under NI 43-101 and a chain of custody starts with the drillers collecting, splitting and bagging of RC drill cuttings.
For logging of drilled lithologies, a continuous chip sample is collected in a plastic chip tray over five foot intervals and stored for logging by the project geologists. A 5/16 continuous split of five foot sample intervals is collected for assaying from 5.2 inch diameter drill holes through a wet splitter mounted on the rig. The samples are placed in sample bags and transported from the drilling rig to the Company’s storage facility in Yerington at the end of each 12 hour shift. The samples are then inventoried by Company personnel, dried, placed on pallets, wrapped in plastic and shipped via United Parcel Service to the Skyline laboratory in Tucson, Arizona for sample preparation and assaying. Rejects and pulps are returned to the Yerington facility for archiving.
Skyline Assayers & Laboratories is accredited by the American Association for Laboratory Accreditation (A2LA - certificate no. 2953.01) in the Chemical field of Testing. Skyline is a recognized industry leader for all types of base metal, ferrous and non-ferrous analysis including high quality ore-grade assays, sequential copper analyses of ores, and umpire assays of metallurgical products. The Tucson laboratory has provided analytical service to the copper mining industry for over 70 years.
At Skyline, the RC samples are crushed to plus 75% passing a -10 mesh, split and pulverized at the Skyline laboratories for assay using analytical techniques as described for the core drilling program. Internal quality assurance and quality control procedures include the insertion of standards into the sample sequences. Rejects from the previously analyzed samples are sent to ALS Chemex Laboratories in Sparks, Nevada for check assays.
Mineral Resources
Tetra Tech completed an updated National Instrument (“NI”) 43-101 compliant independent resource estimate for the MacArthur PEA. At a 0.12% cutoff, the tonnage of the measured oxide and chalcocite resource was 71,829 million tons at 0.218% copper containing 313 million lbs. of copper, the indicated oxide and chalcocite resource was 87,264 million tons at 0.208% copper containing 362 million lbs. of copper, and the inferred oxide and chalcocite resource was 243.4 million tons at 0.201% copper containing 979.5 million lbs. of copper.
MacArthur’s indicated sulfide resource at a 0.15% cutoff is 1.1 million tons averaging 0.292% copper containing 6.4 million pounds of copper and the inferred sulfide resource was 134.9 million tons averaging 0.283% copper containing 764 million lbs. of copper.
PrincipalMACARTHUR COPPER PROJECT1,2,3,4
| Oxide and Chalcocite Material | Primary Material | ||||||
| Cutoff | Tons | Average | Contained | Cutoff | Tons | Average | Contained |
| Grade | Grade | Copper | Grade | Grade | Copper | ||
| (%TCu) | (x1000) | (%TCu) | (lbs x 1000) | (%TCu) | (x1000) | (%TCu) | (lbs x 1000) |
| Measured Copper Resources | Measured Copper Resources | ||||||
| 0.25 | 15,929 | 0.350 | 111,599 | 0.25 | |||
| 0.20 | 33,472 | 0.283 | 189,518 | 0.20 | |||
| 0.15 | 58,388 | 0.237 | 276,993 | 0.18 | |||
| 0.12 | 71,829 | 0.218 | 313,174 | 0.15 | N/A | N/A | N/A |
| Indicated Copper Resources | Indicated Copper Resources | ||||||
| 0.25 | 13,930 | 0.379 | 105,478 | 0.25 | 507 | 0.416 | 4,216 |
| 0.20 | 31,949 | 0.290 | 185,049 | 0.20 | 670 | 0.369 | 4,938 |
| 0.15 | 67,271 | 0.229 | 308,639 | 0.18 | 796 | 0.340 | 5,414 |
| 0.12 | 87,264 | 0.208 | 362,320 | 0.15 | 1,098 | 0.292 | 6,408 |
- 20 -
| Inferred Copper Resources | Inferred Copper Resources | ||||||
| 0.25 | 43,695 | 0.366 | 311,108 | 0.25 | 53,060 | 0.423 | 449,312 |
| 0.20 | 82,610 | 0.293 | 483,929 | 0.20 | 89,350 | 0.341 | 609,188 |
| 0.15 | 166,930 | 0.232 | 774,889 | 0.18 | 101,375 | 0.323 | 654,680 |
| 0.12 | 243,417 | 0.201 | 979,510 | 0.15 | 134,900 | 0.283 | 764,074 |
1Independent qualified person, Dr. Rex Bryan, prepared and supervised the preparation of these mineral resources.
2All estimated resources are shown using a 0.12% and 0.15% copper cutoff for oxide and sulfide respectively
3Minor rounding errors may occur
4Amended NI 43-101 Technical Report Preliminary Economic Assessment - Issue date: 17 January 2014 Effective Date: 23 May 2012
Tetra Tech used 0.12% Cu (or TCu) as the base case cutoff grade for the leachable resource while applying a base case a 0.15% Cu cutoff grade for the primary sulfide resources. Both of these values are believed representative of actual operating cutoff grades in use as of the date of this report. It is the conclusion of Tetra Tech that the MacArthur Mineral Resources meet current CIM definitions for classified resources.
The updated mineral resource estimate was generated using drill hole sample assays results and the interpretation of a geologic model which relates to the spatial distribution of copper in the MacArthur deposit. Interpolation characteristics have been defined based on geology, drill hole spacing and geostatistical analysis of the data. A block size of 25 feet by 25 feet by 20 feet and an assay composite length of 10 feet were defined to best reflect both the drill hole spacing and current geologic model.
The database provided by Quaterra contained the pertinent drill hole and assay information for the MacArthur Copper deposit. The database contained 737 drill holes of which 676 drill holes from Quaterra and Anaconda (sometimes referred to as the Metech holes) were used. The 61 holes removed included holes with limited or no information on the assays (Pangea Gold 1991, Superior, USBM 1952, Anaconda 1955-57), and six Quaterra holes outside the model limits. Of the 676 holes used, there are 280 Anaconda (Metech) RC holes and 396 Quaterra holes (58 core and 338 RC holes). These drill holes traversed 257,895 feet, producing 51,258 total copper sample assay values at a nominal five feet in length. The variables available in the database are for total copper from Quaterra and Anaconda intervals, and acid-soluble copper, a limited number of ferric sulfate soluble (QLT) copper assays and a very limited number of cyanide leach copper assays from Quaterra holes.
A total of twenty-two (21 directional and a omni-directional) variograms were calculated using MicroModel® for each MinZone within each area. The program searches along each direction for data pairs within a 12.5 -degree window angle and 5-feet tolerance band. All experimental variograms are inspected so that spatial continuity along a primary, secondary and tertiary direction can be modeled. Each variogram model was then validated using the “jackknifing” method. This method sequentially removes values and then uses the remaining composites to krige the missing value using the proposed variogram.
To classify the total copper resources Tetra Tech used an approach that takes into account the spatial distribution of the drilling, the distance to the nearest data points used to estimate a block, and finally the relative kriging error generated by the estimate. Tetra Tech has found this approach to be very robust and provide highly reproducible results.
The Qualified Person for the updated MacArthur resource estimate is Dr. Rex Clair Bryan with Tetra Tech.
Metallurgy
The MacArthur Project has a long history of metallurgical testing from 1976 through 2011 including bottle roll and column leach testing and full scale heap leach operations. Anaconda performed the first test work in 1976 and multiple subsequent owners continued test work through 2011. The most comprehensive test work was performed by Quaterra during 2010 and 2011. Quaterra contracted METCON Research of Tucson, Arizona to run a substantial number of bottle roll leach tests along with 32 column leach tests, on samples from 27 large diameter (PQ) size core drill holes. These drill holes provided reasonable representivity of the MacArthur Project mineral resources. The testwork, both historic and that most recently performed, shows the mineralized material is amenable to standard heap leaching with good copper extraction.
Considering both recent and historical test work, along with information from previous mining operations at the MacArthur site, the design basis for the M3 MacArthur Copper Project May 23, 2012 Preliminary Economic Assessment (PEA) considers a ROM heap leach operation with processing of the pregnant leach solution (PLS) through traditional solvent
- 21 -
extraction / electrowinning (SX/EW). Copper extraction is predicted to range between 60 and 70 percent depending on material type. Acid consumption projections range between 30 and 35 pounds of acid per ton of material. The historic MacArthur Pit contains 133 million tons of oxide material which is predicted to yield 70% copper extraction with acid consumption of 30 pounds of acid per ton of material leached. Material from the MacArthur pit is predominately mined and processed over the first 7 years of operation.
The leach pad will be constructed using an HDPE liner system meeting Nevada requirements (NR 455). Conventional solvent extraction will be used. Electrowinning will include permanent mother blank stainless steel technology and harvesting of Grade A copper cathode on a 7 day pull schedule. All process facilities will incorporate proven industry standard designs and equipment.
The Qualified Person for the metallurgical portion of the MacArthur Copper Project PEA is Dr. Richard Jolk of Tetra Tech.
Preliminary Economic Assessment
M3 Engineering & Technology Corp. (“M3”) of Tucson, Arizona completed a preliminary economic assessment (“PEA”) for the MacArthur project on May 23, 2012. The PEA was amended and restated on January 27, 2014. The study concluded that the project has potential for development as a large-scale copper oxide heap leach operation that would provide long-term cash flows for a relatively modest capital outlay. The PEA set out the following key project parameters:
Mine operating costs were provided by Independent Mining Consultants Inc. (“IMC”) of Tucson, Arizona, based on an average 41,000 ton per day mine plan.
The project financials were enhanced by including in the above cash flows a sulfuric acid plant at the site compared to purchasing and transporting acid to the site. An on-site acid plant provides more long term certainty for the highest operating cost item (sulfuric acid), reduces the requirement for purchased electric power, and would leverage future consolidation and development of other oxide deposits in the District.
The SX/EW capital cost estimate was prepared based on recent M3 in-house information of similar SX/EW facilities. It includes the heap leach pads, SX/EW facility and tank farm based on a design flow rate of 10,400 gal/min. Additional upfront capital costs were included for mining equipment and infrastructure improvements (power, water, roads) needed at the site. Capital costs are considered accurate to -20% to +25%.
The Qualified Person for the preliminary economic assessment is Mr. Rex Henderson with M3. The Qualified Person for the mining portion of the report is Herb Welhener of IMC. The NI43-101 MacArthur Copper Project may 23, 2013 PEA is available at www.sedar.com.
Future Plans
The results of the PEA are being used to determine what additional drilling will be required to bring the project to a prefeasibility status and to evaluate the potential to integrate the MacArthur resource into a larger operation that includes the Yerington Copper resource. This stage of a project generally includes additional infill and condemnation drilling, metallurgical testing and geotechnical work as well as environmental studies, permitting and engineering.
Some of the options being considered to add additional value to the project include:
- 22 -
Yerington Copper Project – Nevada, USA
Acquisition and Staking of Claims
The Yerington Copper project property totals approximately 11 square miles. The project mineral rights consist of 2,768 acres of fee mineral properties and patented mining claims as well as 201 unpatented lode and placer claims totaling 4,153 acres on lands administered by the US Department of Interior, Bureau of Land Management (BLM). The total reflects the transfer of 345 claims from Quaterra’s wholly owned subsidiary, Singatse Peak Services LLC (SPS) to Quaterra Alaska’s MacArthur project in July 2012.
On May 1, 2007, SPS received the bankruptcy court approval for the acquisition of certain assets of Arimetco, Inc. (Arimetco) in the Yerington Mining District, subject to completion of due diligence. The purchase price comprised US$500,000 cash, 250,000 of the Company’s common shares and a 2% net smelter return royalty capped at US$7.5 million dollars on production from any claims owned by the Company in the Yerington and MacArthur mine areas.
Private land, patented claims, and 23 unpatented mining claims related to the Yerington Copper project were acquired by SPS from the Arimetco bankruptcy court in April, 2011. The acquisition followed three years of due-diligence studies and negotiations with state and federal agencies and the receipt of Bona Fide Prospective Purchaser (BFPP) letters from the US Environmental Agency (EPA), the Nevada Division of Environmental Protection (NDEP) and the BLM to protect SPS from liability emanating from activities of the former mine owners and operations.
Singatse Peak Services (SPS) purchased the Anaconda Mine and MacArthur Mine properties along with the appurtenant ground water rights in 2011. SPS owns a total of 8,621 acre-feet/yr of primary ground water rights which have senior priority standing. The purchased water rights are primary ground water rights specifically permitted for mining and milling. These water rights have significant value. Recent sales of primary ground water in Mason Valley Nevada have sold for over $3,000 per ac-ft.
Private properties related to the Arimetco acquisition are located in Township 13 North, Range 25 East in Sections 4, 5, 8, 9, 16, 17, and 21, and patented claims are located within Township 13 North, Range 25 East in Sections 16, 17, 19, 21, 31, and 32 and in Township 13 North, Range 24 East in Sections 22-25 and 36. An additional 434 unpatented claims in Sections 1, 2, 11-13, 22- 27, 35, and 36 Township 13 North, Range 24 East and in Sections 4- 9, 16- 21, and 30-32 Township 13 North, Range 25 East, Mount Diablo Base & Meridian were staked prior to or subsequent to the acquisition by SPS.
Expenditures to Date
Acquisition costs incurred by the Company to December 31, 2013 were $3,368,518 (2012 - $3,193,862) and exploration expenditures were $7,047,920 (2012 - $6,521,961) for a total of $10,416,438 (2012 - $9,715,823).
Location, Access and Infrastructure
The Yerington Copper Property Interests is located near the geographic center of Lyon County, Nevada, US, along the eastern flank of the Singatse Range. The property centers on the historical Yerington open pit mine, flanked on the west by Weed Heights, Nevada (a small private community; the original company town of The Anaconda Company) and on the east by the town of Yerington, Nevada. The property is easily accessed from Yerington by a network of paved roads that were used as principal transportation and access routes during the former operating period of the Yerington Mine. SPS controls approximately 8,600 acre feet of groundwater rights and the Yerington pit contains an estimated 37,000 acre feet of water. Power is available on site at the Yerington Mine area. Nevada Energy operates a 30 million kW propane-fired, electrical generating power plant within ten miles of the site. The power infrastructure at the Yerington Mine site is expected to be readily available for a future mining operation due to the historical mine operations at the site. Topographic coverage is on US Geological Survey “Yerington” and “Mason Butte” 7.5’ topographic quadrangles. The nearest major city is Reno, Nevada, approximately 80 miles to the northwest.
- 23 -
History
Recorded production in the Yerington mining district dates back to 1883 (Moore, 1969) as prospectors were attracted to and investigated colorful oxidized copper staining throughout the Singatse Range. Knopf (1914) reported that oxidized copper cropped out at the historic Nevada-Empire mine located above the south center of the present-day Yerington open pit. Knopf does not show or reference other mines or prospects that are underlain by the Yerington open pit footprint, as gravel and alluvial cover obscure bedrock over an approximate 0.75 mile radius around the Nevada-Empire Mine.
Information is sparse for the period from Knopf’s reporting in 1914 until World War II, although it is likely that lessees worked the Nevada-Empire during spikes in the copper price. Private reports (Hart, 1915 and Sales, 1915) describe ore shipments and planned underground exploration from a northwest striking, southwest dipping structure at the historic Montana-Yerington Mine area located approximately one mile west of the present-day Yerington pit.
During the 1940s, The Anaconda Company (Anaconda), at that time one of world’s major copper producers, outlined a 60-million-ton resource over the Yerington pit. During the early 1950s, the US government, citing the need for domestic copper production, offered “start-up” subsidies to Anaconda to open a copper mine in the Yerington district. Anaconda sank two approximately 400-foot-deep shafts in the present-day open pit and drove cross cuts to obtain bulk samples of oxidized rock for metallurgical study. Anaconda began operating the Yerington Mine in 1952 and mined continuously through 1979, producing approximately 1.744 billion pounds of copper from an ore body that contained 162 million tons averaging 0.54% Cu. Approximately 104 million tons of this total were oxidized copper ore that was “vat-leached” with sulfuric acid in 13,000-ton cement vats on a seven day leach cycle. Sulfide ores were concentrated on site in a facility that was dismantled and sold following termination of mining in 1979.
In 1976, all assets of The United StatesAnaconda Company, including the Yerington Mine, were purchased by the Atlantic Richfield Company (ARCO) who in 1979 shut down dewatering pumps in the pit and closed the Yerington Mine due to low copper prices. In 1982, ARCO sold the entire Yerington Mine complex and Weed Heights town site to Mr. Don Tibbals of Yerington, Nevada, who scrapped the plant and equipment. At closure, before dewatering pumps were shut off, the Yerington mine plan hosted a pre-stripped, non NI 43-101 compliant historic “reserve” of 98 million tons averaging 0.36% Cu containing approximately 696 million pounds of copper (K. L. Howard, Jr., Anaconda Internal Memo, 1979) within the ultimate pit design. The (Howard, 1979) estimate was prepared from a geologic section calculation using a 0.2 %TCu cut-off grade. Although the 1979 estimate contained no classification for measured, indicated, or inferred resources as defined by NI 43-101, the total estimate compares favorably to Tetra Tech NI43-101 compliant independent resource estimate completed in February 2012. An additional 22.8 million tons of material containing 136.8 million pounds copper was identified adjacent to the pit in this historic estimate. The (Howard, 1975) memo addressing this material is considered reliable because it cites mine reconciliation calculations and geologic projections from drill holes using a 0.2% Cu grade cut-off in an internal Anaconda memo by T. Leigh to W.C. Norem (1979).
In 1989, Arimetco Inc. (Arimetco) purchased the mine property from Tibbals, commissioned a 50,000-pound-per-day solvent extraction/electrowinning plant, and began heap leaching “sub-grade” dump rock stripped from the Yerington pit by Anaconda. Arimetco also added an unknown tonnage of “vat leach tailings” (minus 3/8 inch oxidized tailings leached during Anaconda’s operation) to some heap leach pads (HLP's) as well as trucking oxidized ore from the MacArthur property located approximately five miles north of the Yerington mine site. Arimetco produced some 95 million pounds of copper from 1989 to 1999 before declaring bankruptcy due to low copper prices and abandoning the property.
Soil and groundwater contamination, alleged to stem from the former mining operations at Yerington, have been identified on the property. As a result, a portion of the property acquired by SPS in 2011 is now under the jurisdiction of the EPA. Liability for the contamination on site is the responsibility of a third party which is actively engaged in remedial investigation and remediation activities under the supervision of the EPA.
In order to establish SPS’s position and rights, the acquisition by SPS of the Arimetco properties required a series of rigorous environmental, legal, and technical due diligence studies. The Chambers Group Inc. and Golder Associates Inc. completed a Phase 1 Environmental Site Assessment Report to allow SPS to establish liability protection as a bona fide prospective purchaser (BFPP). Prior to closing on the property, SPS received letters from the Nevada Department of Environmental Protection (NDEP), US Bureau of Land Management (BLM) and the USEPA indicating the post-closing requirements then applicable to the Site for SPS to maintain its defense to liability as a BFPP regarding the activities of the former mine owners and operators.
In September 2012, SPS reached a voluntary agreement with the U.S. Environmental Protection Agency (EPA) to participate in upgrading the system which manages fluids from the historic mining operation at the Yerington mine site. In exchange for
- 24 -
SPS's participation in this work, the Company obtained a site-wide 'Covenant Not to Sue' for the contamination left at the site by former owners and operators of the historic mine operations.
The agreement provides for immediate environmental improvements to the site and allows SPS to continue exploration at the site while working cooperatively with the EPA, Nevada Department of Environmental Protection and the community. The Agreement's 'Covenant Not to Sue' strengthens SPS's 'Bona Fide Prospective Purchaser Defense' against liability resulting from the contamination at the site prior to SPS's purchase.
The first phase of the fluid management project was completed in Q4 of 2012. The Company co-funded the repairs to the on-site fluid management system (FMS) by the EPA as well as the relining of one of the system ponds. During Phase 2 of the project, the Company completed a study of the FMS to determine what additional repairs or other modifications are necessary to ensure that the system is capable of handling the fluids from the former mine operations for a period of five years. The Study was completed by the Company’s contractor in June 2013. EPA decided not to implement the 5-year capacity alternative recommended in the Study. Rather, EPA decided to build now ponds to address the FMS capacity issues. The Company decided not to fund construction of the additional ponds. Rather, the Company agreed to provide property at the site to construct the new ponds.
During 2014, SPS will prepare a Final Report and anticipates that EPA will issue a Notice of Completion for the work performed under the Agreement. Following the Notice of Completion, SPS believes it does not have further obligations under the Agreement, except for those as a landowner and as a BFPP. The cost to be incurred during 2014 to complete SPS’s obligations under the Agreement is estimated at US$50,000.
Geology and Mineralization
The Yerington property includes both the Yerington Deposit (Yerington Mine) and a portion of the Bear Deposit which represent two of three known porphyry copper deposits in the Yerington copper district. The porphyry systems are hosted in middle Jurassic intrusive rocks of the Yerington Batholith. Unless noted otherwise, the following discussions refer to the Yerington Deposit
Mineralized porphyry dikes associated with three phases of intrusive activity related to the Yerington Batholith form an elongate body of mineralization that extends 6,600 feet along a strike of N118ºE. The mineralization has an average width of 2,000 feet and has been defined by drilling to an average depth of 250 feet below the Yerington Mine pit bottom at the 3,800-ft elevation. Because of the economic constraints of low copper prices at the time, many of the 558 historic Anaconda drill holes used in the SPS study were stopped in mineralization and very few were drilled below the 3,400-ft level where the porphyry system remains nearly unexplored.
Only four historic holes have actually explored the deep vertical projection of copper mineralization in the pit. Three of the holes were drilled along a single N-S oriented section through the center of the pit. According to M. T. Einaudi in an internal 1970 Anaconda report. the deep drilling program defined a series of nested, concave upward, grade shells that are elongated down the N 70º dip of the dikes with the 0.2% Cu zone extending to approximately the 2,600-ft level; an overall dip distance of 2,200 feet. Although the program encountered an increasing ratio of pyrite to chalcopyrite, there was no indication of a “barren core”, the porphyry dikes showed a “remarkable continuity” down dip and molybdenum mineralization became more abundant with increasing depth.
The orientation of the Yerington Deposit is due to mid-Tertiary extensional faulting that rotated the near vertically-emplaced batholith 60° to 90° westerly. The west to east dilation-displacement positioned the porphyry copper deposit on its side, resulting in a cross section of the of the porphyry system visible in the pit with its top toward the west end. Mining has revealed an alteration geometry displaying the original pyrite-rich cap (present-day leached sericite-limonite on the west end of the Yerington pit, grading downward easterly to quartz-sericite-pyrite alteration and potassic alteration in the central portion of the pit, continuing to a soda-flooded root zone at the eastern end).
Secondary oxide copper formed much of the upper Yerington Deposit. Chrysocolla was the dominant copper oxide mineral, occurring as fracture coatings and fillings to a depth of approximately 400 feet below the surface. Below the 4,100-ft level, chalcopyrite is the dominant copper sulfide mineral with minor bornite primarily hosted in A-type quartz veins in the older porphyry dikes. The un-mined mineralized material below the current pit bottom is primarily of chalcopyrite mineralization.
- 25 -
Exploration and Drilling Results
Exploration work on the Yerington Copper project commenced with a technical review of all available historical information relating to mineralization in and around the Yerington pit. A huge inventory of Anaconda data was available at the Anaconda Collection – American Heritage Center, University of Wyoming at Laramie. Approximately 10,000 pages of drill hole records from the library were scanned. The records included drill hole lithology, assays, and/or survey coordinates for almost 800 drill holes. Although some holes contained only lithologic or assay summary information, 558 holes contained adequate detailed assay, hole location and orientation information to be used in a resource estimation. Core from historical drilling left on site by Anaconda was photographed, described and selected intervals from 45 Anaconda core holes were shipped to Skyline Labs for re-assay.
Information obtained from the review of historical information was used to guide a two-pronged program of drilling during the last half of 2011. A total of 21,856 feet were drilled in 42 holes. The core holes and four RC holes were drilled to twin Anaconda core holes, while the remaining RC holes were targeted for expansion of mineralization laterally and below historic drill intercepts along the perimeter of the Yerington pit to support a NI 43-101 compliant resource estimate and technical report.
The data review and drilling results of the 2011 program clearly indicated that mineralization at Yerington is open to depth and along strike. Many of the historic holes in the pit were stopped in mineralization. Drill hole intercepts along the western edge of the pit are some of the best in the SPS database. Twin hole SP-04, drilled by SPS at the northwest end of the pit, intercepted 524.5 feet averaging 0.35%TCu starting at a depth of 228 feet including 88 feet of 0.69%TCu at a depth of 265 feet. Exploration hole SP-36, located along south central margin of the pit intercepted 95 feet averaging 0.28% TCu at a depth of 230 feet. Details of the 2011 drilling program are in the NI 43-101 compliant technical report for the Yerington Copper Project completed by Tetra Tech, Inc. of Golden, Colorado in February 2012.
A drilling program to sample residuals (historic dumps and tailings) at the Yerington site was completed in September 2012. A total of 9,585 feet of sonic drilling in 95 holes have provided material for the characterization of the vat leach tails, heap leach pads, and the W-3 sub-grade waste dump. The samples have been sent to Metcon Labs in Tucson, Arizona for metallurgical testing. These residual resources, historically estimated to total 124 million tons of mineralized material, reflect a notable potential to enhance the MacArthur project once they become NI 43-101 compliant.
In September 2012, SPS reached a voluntary agreement with the U.S. Environmental Protection Agency (EPA) to participate in upgrading the system which manages fluids from the historic mining operation at the Yerington mine site. In exchange for SPS's participation in this work, the Company obtained a site-wide 'Covenant Not to Sue' for the contamination left at the site by former owners and operators of the historic mine operations.
The agreement provides for immediate environmental improvements to the site and allows SPS to continue exploration at the site while working cooperatively with the EPA, Nevada Department of Environmental Protection and the community. The Agreement's 'Covenant Not to Sue' strengthens SPS's 'Bona Fide Prospective Purchaser Defense' against liability resulting from the contamination at the site prior to SPS's purchase.
The first phase of the fluid management project was completed in Q4 of 2012. The Company co-funded the repairs to the on-site fluid management system (FMS) by the EPA as well as the relining of one of the system ponds. During Phase 2 of the project, the Company completed a study of the FMS to determine what additional repairs or other modifications are necessary to ensure that the system is capable of handling the fluids from the former mine operations for a period of five years. The Study was completed by the Company’s contractor in June 2013. EPA decided not to implement the 5-year capacity alternative recommended in the Study. Rather, EPA decided to build now ponds to address the FMS capacity issues. The Company decided not to fund construction of the additional ponds. Rather, the Company agreed to provide property at the site to construct the new ponds.
During 2014, SPS will prepare a Final Report and anticipates that EPA will issue a Notice of Completion for the work performed under the Agreement. Following the Notice of Completion, SPS believes it does not have further obligations under the Agreement, except for those as a landowner and as a BFPP. The cost to be incurred during 2014 to complete SPS’s obligations under the Agreement is estimated at US$50,000.
Sampling, Analysis and Security of Samples
Tetra Tech’s review of sample preparation, handling, analyses, and security procedures for the Yerington drilling and sampling program has determined that the Company’s current practices meet NI 43-101 and CIM defined requirements.
- 26 -
Samples taken during the period from 1952 to 1979, when Anaconda operated the Yerington Mine, including samples used for the determination of mine head grades, lithology, densities, and metallurgical performance were determined by Tetra Tech to be representative of the deposit. While no details are available regarding Anaconda’s exact assaying protocol and quality control during the period the Yerington copper mine was operating, public records of profit and cost confirmed that the techniques and procedures implemented conformed to industry standards for that era.
SPS explored the Yerington Mine Copper property with both RC and diamond core drilling methods. The drilling program was supervised in the field by the project geologist for monitoring recovery, proper sample handling and accuracy in labeling. Approximately 4,300 samples were collected during the 2011 program and shipped for sample analyses. The samples were analyzed for total copper (TCu), gold, and a 47 element trace element package. Samples representing oxide mineralization and acid soluble sulfide copper were also analyzed for acid soluble copper and for ferric sulfate soluble copper. Rock quality designations (RQD) and magnetic susceptibility measurements were taken on all core which was photographed following geologic logging.
The RC samples are collected in a conventional manner via a cyclone and standard wet splitter, placed in cloth bags that are pre-marked by SPS personnel at five-foot intervals and include a numbered tag inserted into a plastic bag bearing the hole number and footage interval. Collected samples, weighing approximately 15 to 20 pounds each, are wire tied and then loaded onto a ten-foot trailer with wood bed allowing initial draining and drying. Each day SPS personnel or the drillers at the end of their shift, haul the samples to SPS’s secure sample preparation warehouse in Yerington, Nevada where the samples are dried, loaded on plastic lined pallets, weighed, and trucked by Skyline Assayers & Laboratories (Skyline) personnel to Skyline’s sample preparation facility in Battle Mountain, Nevada. A chain of custody form accompanies all shipments from Yerington to Battle Mountain. Once Skyline preps each sample in its Battle Mountain facility, approximately 50 gram sample pulps are air-freighted to Skyline’s analytical laboratory in Tucson, Arizona for analyses and assay.
Samples from the core drilling program are handled in a similar manner. Core samples with a diameter of approximately 2.75 -inches (HQ) are placed in wax-impregnated, ten-foot capacity cardboard boxes and delivered to SPS's secure sample warehouse in Yerington, Nevada by the drill crew following each 12-hour shift. The core is logged by a SPS geologist who marks appropriate sample intervals (one to nominal five feet) with colored flagging tape. Lines are marked along the length of core with red wax crayons to indicate where the core piece should be sawed. Each core box, bearing a label tag showing drill hole number, box number, and box footage interval, is then photographed. Rock quality designations (RQD), magnetic susceptibility, and recovery measurements are taken. Core is then loaded on a pallet, shrink wrapped, and secured with wire bands for trucking by Skyline personnel to Skyline’s sample preparation facility in Battle Mountain, Nevada. The core is sawed in half by Skyline personnel, one half designated for sample preparation/assay, the second half placed in its core box for return to SPS. Chain of custody procedures for core shipments picked up by Skyline at the SPS core shed follow the format for RC samples.
Drilling samples from the Yerington Copper Project were analyzed by Skyline in Tucson, Arizona, which is accredited by the American Association for Laboratory Accreditation (A2LA - certificate no. 2953.01) and by ISO17025-compliant ALS Minerals Laboratories in Sparks, Nevada. SPS implements a quality assurance and quality control assay protocol whereby either one blank or one standard is inserted with every ten samples into the assay stream. Rejects from the previously analyzed samples are sent to ALS Minerals in Reno, Nevada for check assays.
Mineral Resources
Tetra Tech, Inc. of Golden, Colorado completed a NI 43-101 compliant independent resource estimate and technical report update for the mineralization in and around the historic Yerington Mine in November of 2013 which supersedes its previous report completed in February 2012. The updated resource is based upon an additional 232 historic Anaconda holes unavailable when the previous report was completed. The current resource now includes over 800 boreholes.
These additional holes are well distributed throughout the deposit and provided infill and extensional information to the previously used data, allowing upgrades in classification, improved grade estimate and a new resource definition.
The increases to the February 2012 resource are as follows. Using a 0.12% TCu copper cutoff, measured and indicated oxide and chalcocite resources increased 28% in tons, 9% in grade, and 37% in pounds of contained copper while the inferred resource increased 5% in tons, 14% in grade, and 21% in contained copper. Using a 0.15% TCu copper cutoff, the primary measured and indicated resources increased 12% in tons, 12% in grade, and 25% in contained copper while the inferred resource increased 4% in tons, 11% in grade, and 13% in contained copper.
- 27 -
Using a cutoff grade of 0.12%, the Yerington Mine’s measured and indicated acid-soluble oxide/chalcocite mineralization includes a measured and indicated resource of 23.5 million tons averaging 0.25% TCu (118 million pounds of copper) and an inferred resource of 25.9 million tons of 0.23% TCu (118 million pounds of copper). Using a cutoff of 0.15% TCu, the measured and indicated primary copper resource contains 105 million tons averaging 0.30% TCu (633 million pounds of copper) and an inferred primary copper resource of 128 million tons of 0.23% TCu (600 million pounds of copper).
The updated tons, grades, and pounds are presented in the table below as well as the percent increase from the February 2012 resource estimate.
YERINGTON COPPER PROJECT RESOURCES USING SELECTIVE CUTOFF FOR OXIDE AND SULFIDE1,2,3
| % CHANGE FROM 2012 | |||||||
| MEASURED | Cutoff | 2013 ESTIMATE | ESTIMATE4 | ||||
| %Cu | Tonsx1000 | Grade | Lbsx1000 | Tonsx1000 | Grade | Lbsx1000 | |
| Oxide and Chalcocite Material | 0.12 | 6,500 | 0.25 | 33,000 | 8% | 10% | 17% |
| Sulfide (Primary Material) | 0.15 | 31,000 | 0.33 | 205,000 | -3% | 10% | 8% |
| Combined | 0.12,0.15 | 37,500 | 0.32 | 238,000 | -1% | 10% | 9% |
| % CHANGE FROM 2012 | |||||||
| INDICATED | Cutoff | 2013 ESTIMATE | ESTIMATE4 | ||||
| %Cu | Tonsx1000 | Grade | Lbsx1000 | Tonsx1000 | Grade | Lbsx1000 | |
| Oxide and Chalcocite Material | 0.12 | 17,000 | 0.25 | 85,000 | 37% | 9% | 47% |
| Sulfide (Primary Material) | 0.15 | 74,000 | 0.30 | 428,000 | 19% | 15% | 35% |
| Combined | 0.12,0.15 | 90,000 | 0.29 | 513,000 | 22% | 12% | 37% |
| % CHANGE FROM 2012 | |||||||
| MEASURED + INDICATED | Cutoff | 2013 ESTIMATE | ESTIMATE4 | ||||
| %Cu | Tonsx1000 | Grade | Lbsx1000 | Tonsx1000 | Grade | Lbsx1000 | |
| Oxide and Chalcocite Material | 0.12 | 23,500 | 0.25 | 118,000 | 28% | 9% | 37% |
| Sulfide (Primary Material) | 0.15 | 105,000 | 0.30 | 633,000 | 12% | 12% | 25% |
| Combined | 0.12,0.15 | 128,000 | 0.29 | 751,000 | 14% | 11% | 26% |
| % CHANGE FROM 2012 | |||||||
| INFERRED | Cutoff | 2013 ESTIMATE | ESTIMATE4 | ||||
| %Cu | Tonsx1000 | Grade | Lbsx1000 | Tonsx1000 | Grade | Lbsx1000 | |
| Oxide and Chalcocite Material | 0.12 | 25,900 | 0.23 | 118,000 | 5% | 14% | 21% |
| Sulfide (Primary Material) | 0.15 | 128,000 | 0.23 | 600,000 | 4% | 11% | 13% |
| Combined | 0.12,0.15 | 154,000 | 0.23 | 718,000 | 4% | 10% | 14% |
1Independent qualified person, Dr. Rex Bryan, prepared and supervised the preparation of these mineral resources.
2All estimated resources are shown using a 0.12% and 0.15% copper cutoff for oxide and sulfide respectively.
3Minor rounding errors may occur
4NI 43-101 Technical Report, Feb. 17, 2012
Based on benchmarking of the Yerington Deposit to similar deposits, Tetra Tech has determined that reasonable base case cutoff grades for the leachable (oxide/chalcocite) SX/EW recoverable copper and for flotation recoverable primary sulfide resources are 0.12% TCu and 0.15% TCu, respectively.
The results of the 2013 NI 43-101-compliant resource estimate compare favorably to the estimates of copper remaining in and around the Yerington pit after the mine shut down (K.L. Howard, Jr., Anaconda Internal Memo, 1979). The 1979 estimate contained no classification for measured, indicated, or inferred, so direct comparison can only be made when considering all classes of the current estimate, but was reported at 121 million tons with an average grade of 0.34% TCu.
The 1979 estimate cited approximately 84% of the total contained copper (696 million pounds of copper in 97.8 million tons with an average grade of 0.356% Cu) as being within the original Anaconda pit design, suggesting that a significant portion of the Yerington resource may be mined without a pushback or major changes to the upper walls of the Anaconda pit.
- 28 -
The current Tetra Tech resource estimate is based upon SPS's 2011 drilling as well as 792 historic drill holes taken from approximately 10,000 scanned pages of assay and/or geologic data which were reviewed and digitally recorded by SPS personnel and from 57 Anaconda cross sections in use at the time of mine closure. The digital data entry was validated by Tetra Tech against historic sections and was considered to be compliant, based upon results of 18 twin holes and 5,446 feet of core from Anaconda holes which were assayed by SPS. The twinned drill intercepts statistically confirmed that the new compliant data support use of the historical data, as did the new core assays which were well within the expected norms for corroborating the old with new data.
The Tetra Tech resource estimate is included with a description of the project history, geology, mineralization, sampling procedures, and laboratory Quality Assurance/Quality Control procedures. The NI 43-101 Technical Report is available at www.sedar.com. The Qualified Person for the Yerington Copper Project resource estimate and the technical report is Rex Clair Bryan, Ph.D., Sr. Geostatistician for Tetra Tech, Golden Colorado.
Future Work Plans
Quaterra believes the Yerington Copper Project has potential for significant additional copper resources. Historic and current drilling data indicate that horizontal and vertical limits to the mineralization at the Yerington Mine have not yet been found. Additional exploration and in-fill drilling is planned to both expand and upgrade the current NI 43-101 compliant copper resources of the project.
Future drilling will target the pit area below the 3,000 feet level where only four deep historic holes (D158, D152, D174, and V2-28-33) have actually explored the deep vertical projection of mineralization. Three of five holes drilled along a N-S oriented section through the pit during the period of 1969 -1970 defined a series of nested, concave upward, grade shells that are elongated down the N 70º dip of the dikes with the 0.2% Cu zone extending to approximately the 2,600 level; an overall dip distance of 2,200 feet. Although the program encountered an increasing ratio of pyrite to chalcopyrite, there was no indication of a “barren core”, and the porphyry dikes showed a “remarkable continuity” down dip. The drilling data also established a 250 to 500 foot thick zone of fracture hosted and disseminated molybdenum mineralization that wraps around the sulfide zone near the chalcopyrite/ chalcopyrite-pyrite transition. IP geophysics in the pit area is also being considered to target deep holes to explore this keel of the Yerington porphyry system.
A review of historic information and additional metallurgical testing is planned for both the residuals and core from sulfide mineralized zones below the pit and oxide copper mineralization in the vicinity of the mine. The test results will be used in an economic assessment of the property and an assessment of the merits of a possible integration of the MacArthur and Yerington operations.
Bear Deposit – Yerington, Nevada, USA
Acquisition and Staking of Mineral Claims
The Bear Deposit covers an area of at least 2 square miles. A portion of the Bear Deposit that lies below the northeast corner of the Yerington Mine property was acquired in the SPS purchase of Arimetco’s Yerington assets from bankruptcy court. In December of 2013, Quaterra announced four option agreements covering 1,305 acres of private land north and east of the Yerington Mine Site that further covers the Bear copper deposit. Under the terms of the agreement Quaterra has an exclusive right to explore these parcels and has an option to purchase the properties and the appurtenant surface water rights and supplemental storage water rights. Private properties related to the option agreements are located in Township 13 North, Range 25 East in Sections 2, 3, 10, and 11 and Township 14 North, Range 25 East in Sections 29, 32, 33, and 34.
Expenditures to date
Acquisition costs incurred to December 31, 2013 were $340,646 and exploration expenditures were $12,366 for a total of $353,012. There were no acquisition or exploration expenditures at the Bear Deposit prior to 2013.
Location, Access, and Infrastructure
The Bear Copper Deposit is located near the geographic center of Lyon County, Nevada, US, along the eastern flank of the Singatse Range and extending eastward towards the Walker River. It lies just northeast of the historical Yerington open pit mine and north of the town of Yerington. The property is easily accessed by a network of paved and dirt roads. Topographic coverage is on the US Geological Survey “Mason Butte” 7.5’ topographic quadrangle.
- 29 -
History
The Bear Deposit was discovered in 1961 by Anaconda condemnation drilling in the sulfide tailings disposal area and was further delineated by Phelps Dodge in the 1960’s and 1970’s. Currently the deposit is open in several directions and has never been consolidated under a singer owner. A portion of Quaterra’s holdings was not previously accessible by Anaconda or Phelps Dodge and is adjacent to the highest grade mineralization discovered during exploration of the area.
Quaterra has collected data from the Anaconda Collection – American Heritage Center, University of Wyoming at Laramie -from 49 drill holes totaling 126,400 feet that define a porphyry copper system covering an area of at least 2 square miles. Approximately 25% of this area, controlled by Anaconda in the 1960s, has an estimated 500MT of mineralized material with an average copper grade of 0.40% (Dilles and Proffett, 1995). This estimate is not NI 43-101 compliant. The reference for this estimate does not include information regarding cut-off grade or methods used for the calculation and does not delineate categories for a resource. The estimate is considered reliable as it was calculated by the principal geologist with Anaconda (one of the world’s premiere copper companies of the time) who was responsible for the Bear drilling program in 1967.
Geology and Mineralization
The Bear Deposit is a large porphyry copper system that occurs below 500 to 1,000 feet of valley fill and Tertiary age volcanics. The mineralization of the deposit occurs predominantly in Jurassic age Quartz Monzonite, Border Phase Quartz Monzonite, and Quartz Monzonite porphyry dikes. There does not seem to be any preference between to the Jurassic rock type and the sulfide occurrence. Copper mineralization occurs most commonly as chalcopyrite with minor bornite within platings and veinlets with fresh feldspar and shreddy biotite. No copper oxide mineralization is present and only minor occurrences of chalcocite have been noted. Molybdenite is a common sulfide within the deposit, occurring most commonly with the best sulfide mineralization. However, molybdenite has been analyzed on only about 20% of the core samples and more studies are necessary to better determine the molybdenite occurrence.
The deposit is displaced by the gently east-dipping normal fault known as the Bear fault. The fault is defined by strongly sheared dark clay gouge with andesite and sulfide fragments. On the western part of the deposit the mineralization occurs within the upper hanging wall of the fault while to the east the mineralization occurs deeper within the lower footwall.
Future Plans
The large size of the Bear deposit and potential for higher grades than district averages (drill holes have been defined with 150 feet grading 0.8% copper or more) make the project a high priority target for future drilling. Together with molybdenum mineralization representing a potentially significant by-product credit, the partially defined porphyry copper system clearly merits an exploration drilling program to expand and upgrade the historic data for definition of a NI 43-101 compliant resource.
Nieves Silver Project, Mexico
Property Description and Acquisition
The Nieves Project is located in the Francisco R. Murguía Municipality of the Zacatecas Mining District near the southeastern boundary of the Sierra Madre Occidental Physiographic Province in central Mexico. The Property is located approximately 150 km northwest of the state capital of Zacatecas and 90 km north of the mining community of Fresnillo. The property consists of 18 concessions covering approximately 12,064.1 ha. The concessions are registered in the name Minera Cerro Gregorio, as of August 5, 2011, a Mexican company wholly owned by Quaterra. The Nieves Property is jointly owned by Quaterra (50%) and Blackberry Ventures 1, LLC. (“Blackberry”) (50%).
Kennecott Exploration Company (“Kennecott”) acquired the Nieves property on January 16th, 1995, through an option agreement with Mexican concessionaires by making specified option payments over five years, and advance minimum royalty payments. On March 13th, 1998, Kennecott transferred its rights under the Nieves option to Western Copper Holdings Ltd. (“Western”) in consideration for an uncapped 2% NSR on certain core concessions and a 1% NSR on others. Western assigned its rights to the Nieves Project to Quaterra on March 26, 1999. The Nieves concessions are subject to a maximum 3% NSR to the original concession holders, which the Company may purchase at any time for US$2 million. Kennecott’s royalties on the property were later sold to Royal Gold Inc. on January 24, 2007.
On April 10th, 2003, Quaterra completed a limited partnership financing with Blackberry Ventures 1, LLC (Blackberry), whereby Blackberry could earn a 50% interest in the Property by funding two exploration programs of US$750,000 each.
- 30 -
The initial payment of US$750,000 received in the 2003 Fiscal Year was expended on a 5,300-meter drill program on the Nieves Property. During the 2004 Fiscal Year, Blackberry elected to continue by advancing a further US$750,000 towards a follow-up drill program completed in May 2005, thereby earning a 50% interest in the Property. The partners signed a joint venture agreement in 2006 and have jointly contributed to all exploration costs subsequently incurred.
There are no known significant environmental liabilities related to the current exploration of the Nieves Property. The areas of primary mineral exploration are generally flat-lying, sparsely populated with a few cultivated areas and the remaining land area used for the periodic grazing of livestock. Minimal rehabilitation measures such as stabilizing slopes and planting local flora in areas of disturbance is usually sufficient to satisfy the ecological authorities, the Instituto de Investigaciones Forestales, Agricolas y Pecuarias (“INIFAP”), a government office based in Calera, Zacatecas.
There is little to no surface water for exploration or mining activities but an abundance of ground water exists and the ownership of mineral rights generally allows access to ground water as needed. There are no significant factors or risks that may affect access, title, or the right or ability to perform work on the property. Exploration drilling has been conducted under a permit issued by the Secretaria de Medio Ambiente y Recursos Naturales (SEMARNAT). The permit expired on October 15, 2012, but may be renewed by application.
Since inception to December 31, 2013, the Company had incurred $1,754,434 (2012 - $1,623,310) for acquisition costs and $4,811,803 (2012 - $4,692,483) for exploration expenditures giving a total of $6,566,237 (2012 - $6,315,793) for its interest in Nieves. The Company’s joint venture partner, Blackberry JV had spent, including the company’s administration fee, US$7,024,128 for its 50% interest in Nieves.
Location, Access and Infrastructure
Quaterra/Blackberry JV exploration activities are coordinated from the small town of Nieves (now re-named Francisco R. Murguia) where they maintain an office and a house. The town of Nieves is accessed via a 17 km paved road from Highway 49. The nearest major population and service centre to Nieves is the mining town of Fresnillo located 90 km to the south. Fresnillo has a population of approximately 75,000 and services the Fresnillo Mine operated by Peñoles. Fresnillo offers a professional work force experienced in mining and related activities in addition to most other supplies and services. International airports are located within approximately a three hour drive of the property in the city of Zacatecas to the south, and in Torreõn (Coahuila State) to the north. Road access is excellent with the main paved highway to Nieves running along the northern portion of the property. A network of dirt roads and trails provide access to the historical mining operations and extend southward to all areas of the property. Drill and access roads can be built easily as most of the Nieves Property is flat-lying with only a few dry creek beds.
The Nieves property lies within the Mexican Altiplano or Mesa Central region. This region is flanked to the west by the Sierra Madre Occidental and to the east by the Sierra Madre Oriental mountain ranges. The Altiplano is dominated by broad alluvium filled plains between rolling to rugged mountain ranges and hills reaching up to 3,000m above mean sea level and average elevations in valleys of approximately 1,700m. Elevations on the Nieves property range from 1,900m. to 2,000m. The terrain is generally flat-lying with a prominent north-south trending ridge along the eastern portion of the property with moderate to vertical slopes. There is very little human habitation on the property, with only a few widely scattered farm houses, although the town of Nieves directly borders the property to the northeast.
The La Quinta field office, as well as core logging, cutting and storage facilities are located on the Nieves Property. Other infrastructure in the area includes: (1) a power line adequate to support a small mill (eg. 100 tonnes per day), (2) a spur of the main Zacatecas rail line that connects the city of Rio Grande, located 18 km to the south, and (3) operating smelters in San Luis Potosi (copper and zinc, approximately 350 km to the south) and in Torreõn, Coahuila state (Peñoles lead-zinc smelter, approximately 200 km north).
History
The first discovery on the area covered by the Nieves Property was the Santa Rita Vein in 1560 by Spanish explorers. Soon after in 1574 the Concordia vein was discovered. The Santa Rita and Concordia-San Gregorio-Dolores veins were the focus of mining by the Spanish and Mexican miners until 1880 when an English company, the Mexican Rosario Mining Company, and two Californian companies, the Almaden Mining Company and the Concordia M. and M. Company, worked in the area. These companies worked primarily on the Concordia vein while a small independent miner Gonzáles Piñera worked concurrently on the San Gregorio vein. Prior to the 1910 revolution, which halted all production in the Nieves District, total ore production in the District was estimated at 50,000 tonnes. The only production reported is from the Concordia Mine where 5,414 tonnes at a grade of 4,065 g/t silver were produced.
- 31 -
Between 1910 and 1978 several companies attempted to de-water, sample, and re-open the historical workings in the Concordia and Santa Rita mines, and were largely unsuccessful. The Santa Rita vein and refurbished mill and flotation plant were purchased by Fomento Minero in 1978; they operated the mine until 1987. Fomento Minero also sank three shafts and deepened a historic shaft along the Concordia-San Gregorio vein system during the 1970’s. The flotation mill was capable of running 100 tonnes/day during this time and was fed 50% tailings and 50% ore with an average head grade of 130 g/t silver, 2% lead, 2.4% zinc and 2.5% antimony, according to Consejo Recursos Minerales. Today, all that remains on the site are the building foundations, abandoned shafts and power lines.
In the early 1990’s, a group of Mexican concessionaires assembled a land position that Kennecott optioned on January 16th, 1995. Exploration work completed by Kennecott included geologic mapping, surface sampling, geophysical surveying and reverse circulation (RC) drilling of the Gregorio North, California and Orion West veins. The drilling intersected several zones of significant silver mineralization hosted by two distinct styles of mineralization. Drill hole NV08 in the California area intercepted two separate 2m intervals of high grade silver vein mineralization that returned assay values of 367 g/t and 795 g/t silver at depths of 108m and 116m, respectively. In contrast, drill hole NV03 intersected a large low grade zone of silver mineralization at a depth of 180m depth that averaged 82 g/t silver over 28m. Drill hole NV03 also encountered a high grade silver vein at 148m depth that returned 254 g/t silver over 2m. Drill hole NV06 also encountered a large zone of low-grade silver mineralization that returned 67 g/t silver over 68m.
After acquiring the Nieves option from Kennecott in 1998, Western Copper (Western) drilled 5 RC holes testing the California vein system. The holes were drilled in the area around hole NV08. Western also twinned hole NV08 and reproduced similar assay values for the intercepts reported by Kennecott including 890 g/t silver over 1.0m in drill hole WCNV01. Holes drilled to intercept mineralization below drill hole NV08 returned assay values of 841 g/t silver over 0.45m, 109 g/t silver over 0.8m, and 1,081 g/t silver over 0.35m in drill hole WCNV04.
Systematic drilling began after Quaterra bought the property from Western in 1999. Since Kennecott imitated exploration drilling in 1995, a total of 61,608 meters have been drilled in 205 holes, all but thirteen of which were completed during the Quaterra/Blackberry earn-in and JV.
Geology
The Nieves Property lies on the western flank of the Central Altiplano in Mexico, just east of the Sierra Madre Occidental ranges. Basement rocks underlying the western Altiplano are a Mesozoic assemblage of marine sedimentary and submarine volcanic rocks belonging to the Guerrero Terrane that sit unconformably on Precambrian continental rocks.
The late Cretaceous to early Tertiary Laramide Orogeny folded and thrust faulted the basement rocks throughout area and preceded the emplacement of mid-Tertiary plutons and related dykes and stocks. Unconformably overlying the Mesozoic basement rocks in the western Altiplano are units from the late Cretaceous to Tertiary, Sierra Madre Occidental magmatic arc. These rocks consist of a “lower volcanic complex” comprising an assemblage of late Cretaceous to Tertiary volcanic, volcaniclastic, conglomerate, and limestone rocks unconformably overlain by a Tertiary “upper volcanic supergroup” of caldera related, rhyolite ash-flow tuffs and flows. Eocene to Oligocene intrusions occur throughout the Altiplano and are related to the later felsic volcanic event. A final stage of NE-SW extensional tectonics accompanied by major strike-slip fault movement during the Miocene developed much of the basin and range topography currently exhibited in the area. Subsequent erosion of the ranges has covered most of the valleys.
The Mesozoic section on the Nieves property is represented by a thick sequence of fine laminar grey to dark green argillite beds up to 1m thick belonging to the late Cretaceous Caracol Formation which is host to silver mineralization on the property. The argillite beds are more abundant to the south in the Santa Rita area and to the west in the Concordia area. The Mesozoic section is isoclinally folded with an axial plane cleavage. Fold axes strike east-northeast to east and beds strike east-west and dip steeply south to near vertical.
Tertiary clastic rocks unconformably overlie the Caracol Formation on the east side of the Nieves Property. The shallow dipping Tertiary clastic section includes a 1 to 10m thick conglomerate composed of rounded to sub-rounded limestone boulders in a sandstone groundmass. Above the limestone conglomerate there is up to 130m of conglomeratic sandstone with thin bands of calcareous conglomerate. Overlying the conglomerate is 40m to 50m of Tertiary volcanic rocks composed of rhyodacitic to andesitic welded tuff. A thin 1.5 to 2m unit of grey to dark grey basalt occurs above the tuff and is in turn overlain by at least 56m of porphyritic rhyolite flows striking north-northwest and dipping northeast. These flows underlie a prominent north trending ridge on the east side of the Nieves property and are the host rock for manganese-calcite veins and breccia mineralization previously exploited by local miners.
- 32 -
The oldest structures on the Nieves Property are the folds which affect the Mesozoic argillite beds. These structures are likely related to compression during the Laramide Orogeny in the Cretaceous. Thrust faults are also common features of structures attributed to the Laramide Orogeny and several have been suspected to occur on the Nieves Property. Post-Laramide structures affected both the Mesozoic Caracol Formation sedimentary rocks and the Tertiary volcanic and sedimentary rocks. These structures include: (1) faults that strike 330° to 000° and dip moderately northeast to east with east plunging slicken-sides, (2) faults that strike 170° to 180° and dip steeply to the west, and (3) major vein structures that strike 240° to 270° and dip 60° to 90° to the south.
Mineralization
Silver mineralization on the Nieves Property is classified as low-sulphidation epithermal mineralization and is the primary exploration target. Epithermal silver veins are the dominant type of deposit within the Altiplano Region of Mexico that includes world-class examples such as Pachuca, Zacatecas, Fresnillo, and Guanajuato. The closest example is the Fresnillo deposit, located 90 km to the south of the Nieves Property. The Fresnillo deposit includes mantos and chimneys, stockworks, disseminated mineralization, and veins that show vertical mineralogical zonation. Typically in these veins, the high-grade silver (gold) zone is constrained in elevation within the vein structure to up to 500m vertically, or between 180 to 750m depths below which the veins becomes dominated by base-metal sulfides and progressively lower in precious metal content.
The most economically significant mineralization at Nieves occurs in anastomosing carbonate-quartz-sulphide vein systems and stockworks that have been defined over a total strike length of 3.8 kilometers by 54,814 meters of drilling in 187 holes. The system develops to a maximum true width of in excess of 200 meters and has a proven down dip extent of approximately 525 meters.
The carbonate-quartz-sulphide veins contain the best grades of silver, gold, lead and zinc. They consist of calcite that is partially to totally replaced by grey to white, chalcedonic, fine-grained quartz veins and veinlets. Individual veins are from centimetres to 1.5 m wide with up to 50% sulphide minerals. Sulphides include pyrite, stibnite, sphalerite, galena, chalcopyrite and the silver sulphosalt freibergite, as well as minor proustite, pyrargyrite, and jamesonite.
The central and most important of the three vein systems is the Concordia-San Gregorio-Dolores system which includes both the La Quinta and Gregorio North zones. Mineralization along the Concordia-San Gregorio-Dolores vein has a known total strike length of 1300 meters and a true width up to 100 meters. The mineralized zone in the Gregorio North area is approximately 1200 meters long and up to 200 meters wide. The La Quinta and Gregorio North zones are the subject of the August 9, 2012 Caracle Creek 43-101 compliant resource estimate but only the La Quinta zone is included in a proposed open pit as shown in the October 31, 2012 preliminary economic assessment.
The attitude and size of the mineralized zones along the Santa Rita zone to the south and California vein system to the north are not well understood at this stage of exploration. Drilling along the Santa Rita system suggests that the mineralized zone is at least 750 meters long and may be up to 340 meters wide. The mineralized zone along the California vein system is at least 550 meters long and may be up to 130 meters wide.
Recent drilling has expanded the size of mineralized zones along all vein systems and additional drilling may significantly enhance the resources and economics of the project. Many of the vein systems are open along strike and all remain open to depth. Because some zones could be terminated along strike by late vertical fault structures, the discovery of strike extensions to the Nieves vein systems will only require continued drilling guided by the promising results of surface geophysical surveys.
Exploration and Drilling Results
Exploration between 2003 and 2010 by Quaterra and Blackberry included air photograph interpretation, surface sampling, geologic mapping, two geophysical surveys, six drill programs and three 43-101 independent technical reports, two of which include 43-101 compliant resource estimates, all prepared by Caracle Creek International Consulting Inc. of Toronto, Ontario (“Caracle Creek”).
In April 2011, Quaterra contracted Mira Geoscience to invert ground magnetic data from the Nieves Property. The results indicated that the geophysics model was poorly constrained due to insufficient data particularly along the western edge of the magnetic low anomaly. In December, 2011, Zonge International (Zonge) was contracted to conduct additional ground magnetometer surveying along 14 N-S lines with a spacing of 200m between lines. The survey extended the magnetic low an additional 1200 meters west for a total E-W length of 2200m.
- 33 -
In June and July 2011, Zonge conducted IPR surveys along 9 lines that indicated that several of the vein systems including the Santa Rita, Dolores, Nino and Orion veins extended to the western edge of the existing survey coverage. The coverage was extended in the first quarter of 2012, with a survey consisting of six lines totalling 28.4 line-kilometers, of vector CSAMT and CSIP and nine follow-up lines of pole-dipole IPR totalling 16.5 line-kilometers. The six lines of vector CSAMT/CSIP were spaced 400 meters apart and covered 1,000 hectares west of the main veins in the area of the enigmatic magnetic low.
The geophysical anomalies were followed up by surface mapping and sampling. The most interesting area identified to date is West Santa Rita, where the mapping identified two groups of narrow, sub-parallel 2 to 30 centimeters wide calcite-quartz veinlets, some of which contain strong gold and silver mineralization. Gold values range from nil to 8.11 g/t over 0.2 m and silver values range from nil up to 253 g/t over 0.4 m. Outcrop in the area is sparse but at least one sample from a fault zone coinciding with the anomalous IP zone defining the Nino vein is anomalous in gold and silver.
Quaterra and Blackberry completed two more phases of drilling (VII and VIII) between March 2010 and October 2011, consisting of 73 drill holes and totalling 18,547 m. Most of the drilling concentrated on the Concordia-Dolores-San Gregorio vein system, but significant amount of drilling is located in the California and Santa Rita vein systems as well.
The drill program was very successful at increasing the size of known mineralized zones along all the major vein systems. Mineralization along the Concordia vein system was extended an additional 400 m, to a total of approximately 1,300 m. The length of known mineralization along the California vein system was increased to a total of approximately 550 m and it remains open to the east. Phase VII and VIII drill programs were successful in doubling the strike length of the Gregorio North mineralized zone located north of the San Gregorio vein, extending the strike length of the mineralized zone to approximately 1200 m. A total of 15 drill holes systematically tested the Santa Rita vein system over 500 m along strike, and the total length of mineralization was extended to approximately 750 m and remains open to the west.
The best intersections include 149 g/t Ag and 0.11 g/t Au over 31.25 m, which includes 6320 g/t Ag and 1.82 g/t Au over 0.25 m in drill hole QTA123 along the Concordia West vein, 104 g/t Ag over 19 m, including 6410 g/t Ag over 0.1 m and 5960 g/t over 0.1 m in drill hole QTA137 along the California vein, and 152.2 g/t Ag and 0.12 g/t Au over 57 m in drill hole QTA144 in the Concordia West area.
The results of the program were the subject of a fourth technical report and the third NI 43-101 compliant independent resource estimate prepared for the Nieves project by Caracle Creek. The most recent estimate, dated August 9, 2012, was incorporated into the October 31, 2012 preliminary economic assessment (“PEA”) for the Nieves project by M3 Engineering & Technology Corp. (“M3”) of Tucson, Arizona.
During preparation of the PEA, Quaterra tested the strike extension of mineralization at Nieves with 8 core holes totaling 3,060 meters. Hole QTA 190 was collared to test an induced polarization (IP) anomaly on the Orion vein, a 2 kilometer westward extension of the Gregorio vein. The hole intersected 0.8 meters of 1,865 grams per tonne (g/t) silver (54.5 oz/ton) which is part of a larger vein interval starting at 243.6 meters averaging 341 g/t silver (10.0 oz/ton). Holes QTA 191 and QTA 192, drilled 200 meters west and east of QTA 190, intersected 0.85 meters of 289 g/t silver and 1.1 meters of 284 g/t silver respectively. The new zone is open laterally and at depth.
Three holes (QTA 185-187) tested coincident IP and geochemical gold anomalies on the western extension of the Santa Rita vein. Holes QTA 186 and QTA 187 intersected 5.1 meter intervals averaging 0.7 g/t gold and 0.55 g/t gold respectively. The gold anomalies may represent the upper levels of deeper and as yet undiscovered silver mineralization.
Wildcat holes QTA 188 and QTA 189, drilled 2 kilometers further west from holes QTA 185-187 to test anomalous vein occurrences, did not intersect significant mineralization.
Sampling, Analysis and Security of Samples
Quaterra and Blackberry have drilled 192 holes on the Nieves property. All but 10 holes completed by Quaterra in 1999-2000 were core holes. Major Drillingof Mexico S.A. de C.V. was the drill contractor for drill programs completed during 1999 to 2006 and B.D.W. International Drilling of Mexico S.A. de C.V. has been the drilling contractor since 2006.
Drill hole orientations are generally perpendicular to the strike of the overall structural trend of the vein(s) targeted. HQ (63.5 mm) was the standard drill core diameter. NQ (47.6 mm) was used locally as an extension (a tail) where drill conditions were difficult. Drill hole locations are surveyed using a RTK Trimble (model R8), double frequency GPS with
- 34 -
precision to 1 cm. Down-hole survey readings were recorded on average approximately every 50 or 100m depending on the length of the hole using an Eastman Single Shot instrument. Survey results have been corrected for magnetic declination (+9º).
All drilling is conducted under the supervision of Quaterra personnel. The compound containing the core logging and core storage facility is protected by a chain link fence with locked gate. The individual storage rooms are locked toprevent access to the core logging and core cutting areas. The onsite geology office is a separate building within the compound and is also kept locked. The main working office is located in the town of Nieves within a locked house compound and also serves as a field house for the geologists. Paper and digital maps, cross-sections and long sections are stored in the Nieves field house office.
Core boxes were collected from the drill site and brought to the core storage facility on the Nieves Property for logging and sampling by the project or assistant geologists on a daily basis. The drill core is washed and core recovery estimated. Rock types, alteration minerals, textural and structural features, veining, and mineralized zones are documented. Sample intervals are measured, marked with permanent marker, and given a sample number and sample tag by the geologists. From this point, technicians core saw the core into halves where one half of each interval is placed with the sample tag into a sample bag and marked with the sample number. The other half is placed back into the core box in its original position and the core boxes are then stacked on racks and stored in order and by hole number in their core storage facility. Where the veins are coherent they are sawed in half perpendicular to the “grain” to get a representative split. Samples are placed into individual plastic bags marked with a unique sample identification number and with a sample tag placed into the bag. Sample ID numbers and meterages are also written on the core trays.
Samples are then packaged into sealed sacks and taken by Quaterra employees to ALS Chemex Laboratories in Guadalajara for preparation. No employees, officers, directors or associates of Quaterra or Blackberry JV are involved in the preparation of the samples.
Standard and blank samples are also included with the primary core samples for analysis. Standards are inserted directly into the sample sequence with a frequency of ~ 1 in 50. Blanks are inserted directly into the sample sequence with a frequency of ~ 1 in 25. The final prepared samples are shipped to the ALS laboratory in Vancouver, Canada for analysis. All samples were analyzed using a 41 element ICP method (ME-ICP41), in addition to analyzing gold and silver by standard fire assay (ME-GRA21). Lead and zinc values over 10,000 ppm and silver values over 100 ppm were re-assayed by atomic-absorption methods (ME-OG62). The Company is unaware of any known drilling, sampling or recovery factors that could materially impact the accuracy and reliability of the results. The Company believes the sampling procedure is appropriate for the type of mineralization being assayed such that samples are representative and there is no sampling bias.
ALS Chemex is an ISO 9001:2008, ISO 17025:2005 and Standard Council of Canada accredited laboratory with preparation and analytical laboratories operating in over 16 countries. Samples are sent to ALS Chemex in Guadalajara for preparation using their PREP-32 procedure. Upon receipt samples are dried, weighed and crushed. Two hundred and fifty grams of material is split and pulverized to at least 85% passing 75 microns. Reject material is retained at ALS Chemex in Guadalajara.
Samples were analyzed using fire assay – gravimetric finish method in addition to ICP. Silver was analyzed with two methods including aqua regia digest and a combination of ICP-AES (Inductively Coupled Plasma – Atomic Emission Spectroscopy) finish and fire assay and gravimetric finish. Gold was analyzed with fire assay and gravimetric finish. The rest of the elements were analyzed with aqua regia digestion and ICP-AES finish. In the aqua regia digest and ICP-AES finish, the samples are digested in aqua regia in a graphite heating block. After cooling, the solution is diluted to 12.5 ml with deionized water, mixed and analyzed by ICP-AES. The results are corrected for inter-element spectral interferences. In the fire assay and gravimetric finish, the samples are decomposed with fire assay fusion, during which the sample is fused with a mixture of lead oxide, sodium carbonate, borax, silica and other reagents to produce a lead button, which is cupelled to remove the lead. The remaining gold and silver bead is separated in dilute nitric acid, annealed and weighed as gold. Silver is determined by the difference in weights.
Internal quality assurance and quality control (QA/QC) procedures such as the insertion of blanks and standards into the sample sequences were not utilized by Quaterra and Blackberry JV during initial phases of exploration. Routine analysis of standard reference material (standards) began in 2007 with the insertion of a commercially prepared standard. Duplicate sampling began in 2008, and continued through the 2011 drill program. Duplicate samples were packaged and shipped using the same security protocols as the primary drill core samples and submitted to Skyline Assayers & Laboratories (“Skyline”) in Tucson, Arizona. Skyline is ISO 17025 accredited including analyses for Au and Ag by fire assay (including gravimetric methods), which is the method of analyses used for the submitted samples.
- 35 -
A review of the Nieves data in the October 16, 2012 M3 technical report concluded that the data quality is adequate at this stage of the project and can be used in 3D modelling for the purpose of resource estimation. The quality control review indicates that there were no major problems in the core shack such as sample mix ups or contamination. The slightly high failure rate of core duplicates is probably an indication of the nature of the ore that is characterized by narrow veinlets.
The failure rates of external standard (KM2653) are high for silver, but this is due to the different analytical method and not the poor quality of the data, which is suggested by the performance of the laboratory standards. Also, silver analyzed with the ME-ICP41 method is slightly biased high and silver analyzed with the ME-GRA21 method is slightly biased low, but these biases are not always consistent with the laboratory standard, suggesting that the problem is with the external standard. In the previous phases silver was analyzed with the same methods and a commercially available certified standard (CDN-SE-1) was used and performed well for silver. Recommendations for future programs include the use of an external standard with a similar certified value as the silver grades at Nieves that is certified for the same analytical method and has similar matrix.
The average gold value in phases at Nieves is 0.058 g/t including all data and 0.22 g/t including only data above the detection limit. The quality of the Au assay data is considered adequate to include Au in the resource calculation at this stage of the project, especially because the grade of Au is fairly low and it is not the main commodity at Nieves. Also, Au analyzed with ICP-OES and gravimetric method is comparable. Recommendations for future programs include using fire assay and instrument finish (AAS or ICP) for Au assays and that a certified standard with a low grade value, same analytical method and similar matrix is inserted and that the frequency of the quality control samples be increased to include one standard, one blank and one core duplicate with every twenty samples.
Metallurgical Testing
Preliminary metallurgical testwork on the composite sample from the Nieves property was completed in June 2010 by G & T Metallurgical Services Ltd. Approximately 100 kg of coarse crush material was composited from reject core material from selected intervals in 12 holes drilled through the La Quinta mineralization in 2009-2010. The sample was determined to contain ~ 79 g/t Ag (theoretical grade of 83 g/t Ag). Freibergite was the major silver phase present in the sample. Ore hardness tests indicated that the sample was moderately soft with a Bond work index of 10.8 kWh/tonne. Open circuit floatation tests showed that~ 86% of the Ag can be recovered into a final concentrate with a grade of ~ 2.3 kg/tonnes Ag. Rougher tests suggested that Ag recovery was relatively independent of primary grind size between 67 and 104µm K80. Additional testwork was recommended to investigate coarser primary grind sizes. Rougher tests also indicated that silver recovery could also be increased by using a collector such as EROPHINE 3418A which would increase the selectivity of Ag over pyrite. Open circuit cleaner tests suggest that regrinding the rougher concentrate to 20µm K80 had no significant benefit on silver metallurgy. However, increasing the pH of the cleaner circuit to 10 significantly improved the Ag grade in the final concentrate. For the purposes of the preliminary economic assessment, design parameters of 86% silver recovery with a final concentrate grade of 2,300 g/t were used.
Mineral Resource Estimate
Caracle Creek completed an updated NI43-101 independent mineral resource estimate for the Nieves project in June 2012. A summary of the resource estimate within the Concordia and San Gregorio vein systems using a reporting cut-off grade of 15 g/t Ag is shown below:
| Vein | Zone | Resource Class | Quantity Tonnes (t)1,2 | Grade3 Ag (g/t) | Grade4 Au (g/t) | Ag (oz) 5 | Au (oz)5 |
| Concordia | La Quinta | Indicated | 33,040,000 | 50.1 | 0.04 | 53,220,000 | 42,500 |
| Concordia | La Quinta | Inferred | 39,260,000 | 32.0 | 0.02 | 40.390,000 | 25,200 |
| San Gregorio | North | Inferred | 18,770,000 | 27.0 | 0.08 | 16,293,900 | 48,300 |
1 Reported at a cut-off grade of 15 g/t Ag. Mineral resources are not mineral reserves and do not have demonstrated
economic viability.
2 Tonnes have been rounded to the nearest 10,000.
3 Ag grade has been rounded to one (1) significant digit.
4 Au grade has been rounded to two (2) significant digits.
5 Ounces have been rounded to nearest 100. One (1) troy ounce = 31.103 grams.
- 36 -
The mineral resource is based on drilling information as of June 22nd, 2012. The database includes collars, assays, survey and lithology information from 8 drill holes from programs of previous operators between 1995 and 1996, 10 drill holes drilled by Quaterra between 1999 and 2000, as well as 174 drill holes drilled by Quaterra and Blackberry between 2004 and 2012. The estimation used geostatistical block modeling methods constrained by a mineralised wireframe. GEMCOM’s GEMS resource modeling software V.6.3 was used to generate the block model and perform the grade estimation. Grades for Ag & Au were estimated using the inverse distance method of interpolation. The mineral resources were classified according to the CIM Standard Definition for Mineral Resources and Mineral Reserves (December 2005) guidelines and reported in accordance with the Canadian Securities Administrators National Instrument 43-101.
The mineralized domains were constructed primarily from the Ag grade assay data. The La Quinta mineralized domain was defined using 99 drill holes and 5072 samples. The Gregorio North mineralized domain was defined using 25 drill holes and 1729 samples. The drill holes were drilled in a sectional pattern with a drill hole spacing ranging from 20 - 100 meters, in the La Quinta area, and 20 - 175 meters in the Gregorio North area. The mineralized domain was projected 100 meters beyond the last drill hole. Due to the potential for bulk open pit mining, a grade cut-off was not used when constructing the mineralized domain. However, if the last assay in the interval was less than 0.1 g/t Au, then it was not included in the mineralized domain unless it had a significant Ag grade component of 10 g/t Ag. The estimation parameters set for the mineral resources were not allowed to interpolate through un-sampled intervals. An Ag value of 0.1 g/t (Half Detection Limit) was assigned to the missing intervals.
The Qualified Person responsible for the updated Nieves project resource estimate is Jason Baker, P. Eng., of Caracle Creek. Zsuzsanna Magyarosi Ph.D., also of Caracle Creek, is the Qualified Person responsible for the QA/QC evaluation. Doris M. Fox M.Sc., P. Geo., also of Caracle Creek, is the Qualified Person responsible for the site visit and sampling procedures.
Preliminary Economic Assessment
M3 Engineering & Technology Corp. (“M3”) of Tucson, Arizona used the Caracle Creek mineral resource estimate to complete a preliminary economic assessment (“PEA”) for the Nieves project October 31, 2012. The PEA was amended and restated on January 7, 2014. The study concluded that the project has potential for development as an open pit silver mine that would produce 55.5 million ounces of silver over 10-year mine life.
The PEA set out the following key project parameters:
An open pit mine centered on the Concordia vein that contains a total of 35.4 million tonnes of mineable material. The pit includes 28.3 million tonnes of higher grade material averaging 65 g/t silver and 0.045 g/t gold (at a cutoff of 30.5 g/t silver); and 7.1 million tonnes of lower grade material averaging 24 g/t (at a cutoff of 21.3 g/t silver). The open pit mine plan was developed based on an indicated resource of 33.0 million tonnes at 50.1g/t silver and an inferred resource of 39.3 million tonnes at 32.0 g/t silver, using a cutoff of 15 g/t..
Recovery of 55.5 million ounces of silver and 41,000 ounces of gold over the 10-year mine life at an average mining rate of 3.5 million tonnes per year. Silver recoveries of 86% were based on testwork completed to date.
Initial capital expenditure of US$231.6 million with a sustaining capital cost of $64.1 million. Capital costs are considered accurate to +/- 35%.
Average life-of-mine operating costs of $14.98 per ounce of payable silver.
An after tax net present value (NPV) of $77.1 million at an 8% discount rate and a base case silver price of $27 per ounce and a before tax NPV of $142.32 million. At a silver price of $32.40 the after tax NPV is $204 million. The project breaks even at a silver price of about $21.37 per ounce (about $15.25 after payback).
An after tax internal rate of return (IRR) of 15.7% with a 4.4-year pay back and a before tax IRR of 21.9% with a 3.4-year pay back.
The mine plan for the Nieves project is an open pit that straddles the Concordia vein and includes three pit phases. A 35.4 -million tonne mineralized zone would be mined at a rate of 10,000 tonnes per day resulting in a ten year mine life and at a 5.4:1 (waste to ore) strip ratio. The pit includes 28.3 million tonnes of higher grade material averaging 65 g/t silver and 0.045 g/t gold (at a cutoff of 30.5 g/t silver); and 7.1 million tonnes of lower grade material averaging 24 g/t silver (at a cutoff of 21.3 g/t silver). The San Gregorio zone was not included in the mine plan but may become viable with additional drilling.
- 37 -
The financial analysis is based on a silver price of $27 per ounce and a gold price of $1,300 per ounce, rounded numbers which are both less than the SEC-recommended three-year historical price through the end of August. The analysis includes deductions for all royalty payments and a contingency of 20%. No credits are assumed for lead or zinc. Sensitivities were run for the price of silver, operating cost and initial capital cost.
The Qualified Person for the preliminary economic assessment is Joshua Snider P.E. with M3 Engineering & Technology Corp., Tucson, Arizona. The Qualified Person for the mining portion of the PEA is Jeffery Choquette P.E. of Butte, Montana, and for metallurgy Thomas L. Drielick P.E. M3 Engineering & Technology Corp., Tucson, Arizona.
The PEA emphasizes that additional exploration and drilling could both expand the current pit and upgrade the San Gregorio inferred resource which was not included in this study. The San Gregorio inferred resource includes 16.3 million ounces of silver and 48,300 ounces of gold using a cutoff of 15 grams. Vein systems to the north and south of the pit also have potential for additional resources.
Future Work Plans
No drilling was accomplished during 2013. Detailed cross sections have been completed to assist in optimizing the location of additional drill holes, both within and adjacent to the defined resource and to the west around the new Orion vein discovery. In addition to the Orion discovery, the presence of a possible buried intrusive further to the west is suggested by Landsat imagery and government magnetic data.
A contract to purchase 318 hectares (785 acres) of surface rights west of the proposed pit has been finalized, with the last of four payments due in April 2014.
The Company continues to look for a buyer of all or part of its 50% interest in the Nieves project.
Herbert Gold Project, Alaska
Property Description and Acquisition
The Herbert Gold project is an early stage, partially drill-tested, high-grade, gold mineralized mesothermal quartz vein system in the historic Juneau Gold Belt of southeast Alaska. The project consists of 91 unpatented lode claims located 32 km north of Juneau along the eastern shore of the Lynn Canal on Federal lands administered by the U.S. Forest Service. The area has a land use designation on current land use plans as semi-remote recreation with a minerals overlay. Forest lands within this designation are open to mineral exploration and development, and guidelines allow reasonable access in accordance with the provisions of an approved Plan of Operations. Exploration at the project has proceeded under approved Plan of Operations from the U.S. Forest Service. A City/Borough of Juneau exploration permit has been granted effective through February 2013.
The Herbert Gold claim block consists of three claim groups. A core group of 17 claims was acquired by Juneau Exploration and Development Inc. (JEDI) from Echo Bay Exploration Inc. in 1997. Quaterra and JEDI signed a mining lease agreement in April 2007, with an effective date of November 1, 2007, at which time 67 additional claims were staked and an area of interest around the core claims agreed upon. A final set of 7 claims was added by Quaterra in February 2008 bringing the current total to 91 active claims. There is no distinction between the claims within the agreements and all claims lie within the proscribed area of interest. The lease includes a sliding scale NSR on production, up to five percent (5%) where the price of gold exceeds $601 per troy ounce, and a minimum annual advance production royalty of up to a maximum of $30,000 after the tenth anniversary of the effective date payable to JEDI.
On June 16, 2010 Quaterra optioned the Herbert Gold property to Grande Portage Resources (GPR). The option agreement granted the right to earn 65% in the Herbert Gold project if: a) GPR spent at least $750,000 before June 15, 2011 to earn 51% b) GPR spent an additional $500,000 before June 15, 2012 to earn the full 65%. GPR has fulfilled both of these obligations and is fully vested at 65%. On October 24, 2011 GPR and Quaterra signed a Joint Venture Agreement outlining the collective responsibilities between the JV participants. Funding is on a pro-rata basis, with standard dilution applying in the event either party declines to participate.
- 38 -
Expenditures to Date
Acquisition costs incurred to December 31, 2013 were $150,615 and exploration expenditures were $1,579,962 for a total of $1,730,577. Acquisition costs incurred to December 31, 2012 were $136,492 and exploration expenditures were $1,512,046 for a total of $1,648,538.
Location, Access and Infrastructure
The Herbert project area lies on the western flanks of the Coast Range Mountains. Terrain is generally rugged within the project area, with elevations extending from 40 m to 1200 m above sea level. Topographic relief ranges from moderate to rugged. Vegetation ranges from dense alder brush to bare rock. Herbert Glacier terminates at the eastern edge of the claim block and the glacier's rapid retreat in the past 30 years is responsible for recent exposure of uncommonly large areas of bare rock at low elevations.
Exploration field work is currently limited to summer and fall months, but no seasonal restrictions are anticipated for future operations. Access to the project area is currently by helicopter from Juneau but the main public paved highway (Route 7) from Juneau passes 5.5 km west of the project area where it crosses the Herbert River. Topographically there is no obvious impediment for road access from the highway to the project area along a route parallel to the Herbert River.
Juneau is a regional mining center supporting active mining operations at Greens Creek and Kensington. As such it is well supplied with qualified support personnel for any future mining operation at the project site. Other nearby communities including Haines and Skagway add to the potential employment base. The Alaska Marine Highway and commercial aviation are the primary forms of transportation among the three communities.
Electric power lines along Route 7 terminate just north of Dotson's Landing approximately 3 km south of the highway/ Herbert River junction. Tidewater access is likely at Dotson's Landing approximately 10 km from the project, of which the first 4.5 km would be on public paved roads.
History
The Juneau area hosts multiple high-grade gold deposits that were active from 1883 through to 1943 and so it is likely the Herbert Gold area was originally prospected during this time. Houston Oil and Minerals found gold mineralization in outcrops recently exposed by retreating ice and drilled the prospect in 1986. The program consisted of 9 BQ diameter core holes totalling 502 meters. Echo Bay Mines drilled an additional 1,100 m in 10 holes in 1988. Historic data is a little vague as to whether there was some additional shallow "winkie" drilling also completed in 1988, with possibly as much as 230 m completed in 12 holes. Although encouraging results were returned, for unknown reasons Echo Bay abandoned the project.
In 1997 as part of Echo Bay's divestiture of its Alaskan properties, a group of three local prospectors (JEDI) successfully purchased the core claims of the Herbert Gold project. Quaterra reviewed the property in 2006 and subsequently signed a Mining Lease with JEDI effective November 1, 2007. A field program in the summer of 2007, managed by the Hawley Resource Group (HRG) resulted in the collection of 299 rock chip, soil, and stream silt samples and the initiation of property wide geologic mapping. In 2010 the property was optioned to GPR.
After acquiring an option in 2010, Grand Portage initiated detailed geologic mapping and analysis of aerial photographs over the southern two-thirds of the most intensely mineralized part of the Herbert Gold property. The work investigated three high angle east-west trending vein-faults identified as the Floyd, Deep Trench, and Main structures. The Deep Trench and Main structures were mapped over strike-lengths of about 2,100 meters and vertical distances of several hundred meters. The work also identified attractive targets in subsidiary structures such as the Ridge vein and other vein-faults, tentatively named Goat Creek and North.
The 2010 field work also included a 16-hole exploration drilling program totaling 2,600 meters. Initial testing of the Main, Ridge, and Deep Trench Veins was conducted from 5 platforms. Hole 10C-1 intercepted 1.14 meters that averaged 17.1 g/t Au in the Main Vein and 6.17 g/t Au over a thickness of 0.86 meters in a newly discovered vein. Drill hole 10D-2 intercepted a quartz-sulfide vein of about 4 meters true thickness with an intercept of 6.55 g/t Au over 1.15 m. Other significant intercepts were reported in the Ridge Vein (.85 m averaging 6.85 g/t Au in hole 10A-4) and in the Deep Trench Vein (.52 meters averaging 9.4 g/t Au in hole 10B-1). The drilling program tracked Herbert's Main Vein for about 750 meters and tested the vein at three general locations.
- 39 -
GPR drilled a total of 5,181 meters at the Herbert project in 30 holes during the 2011 field season. The program intersected high grade gold mineralization in 5 separate zones, four of which were new discoveries. The Deep Trench Vein was tested by 16 holes from the E, F, and G platforms. Hole 11E-2, drilled at an angle of minus 62 degrees, intersected the vein with a true width of 8.76 meters averaging 33.8 g/t gold at a downhole depth of 137.1 meters. The western most platform on Deep Trench vein, the F platform, also showed impressive values in drill hole 11F-3. At a depth of 40.0 meters, 11F-3 intercepted a brecciated quartz vein that assayed 11.53 g/t Au of gold over 3.52 meters. Significant values were seen in all of the holes testing the vein from the G platform. Trench samples taken from the vein near the E platform encountered gold values with screened assays up to 40.1g/t Au. The drilling results together with surface exposures extended mineralization in the Deep Trench Vein over a vertical distance of at least 400 meters and a strike length of almost 1000 meters. Mineralization remains open at depth.
Thirteen holes drilled in 2011 tested the Main and Ridge Vein systems. Hole 11I-4, drilled at an angle of -64 degrees to a total depth of 171.3 meters intersected the Main Vein with a true thickness of 0.95 meters averaging 73.9 g/t gold and 93.1 g/t silver at a downhole depth of 141.2 meters. This intercept occurs near the western limit of exploration on the Main Vein immediately beneath the major contact between the intrusive host and low-grade meta-sediments and volcanics. The mineralization appears to represent a new target type defined by bonanza grade mineralization produced by the sudden changes in geochemistry, and possibly pressure and temperature at the quartz diorite intrusive contact. Grande Portage completed its 2011 fieldwork by identifying several deep targets to be drilled in the 2012 season.
The first NI 43-101 Technical Report ever prepared for the Herbert Gold project was completed May 28, 2012 by Nicholas Van Wyck and William Burnett of Yukuskokon Professional Services, LLC (YPS). The report includes all exploration and drilling data compiled through the 2011 field season to describe the geology and mineralization of the project and outlines the sampling, assaying and analysis used for the preparation of the database.
Geology and Mineralization
Through 1989, the Juneau gold belt has produced approximately 6.7 million ounces of gold. This production represented nearly 75% of Alaska's total lode gold production until new mines at Fort Knox and Pogo in the Alaska interior reduced this percentage. Historic production from the Juneau mining district was mainly from mesothermal quartz veins and stringer lodes localized in greenschist to amphibolite-facies metasedimentary and intrusive rocks. As are typical of these types of deposits worldwide, mineralized veins in the Juneau district are known to extend significant distances along strike and down-dip.
Mineralization at the Herbert project consists of mesothermal quartz-carbonate-gold-base metal veining that is similar to other mines throughout the district. Gold-quartz veins are hosted in weakly foliated, NW trending quartz diorite caught between two NW-trending faults separating the quartz diorite from gneiss and tonalite to NE and phyllites and metagraywackes to the SW. The four principal veins from south to north and are the Floyd, Deep Trench, Main, and Goat veins. Minor veins include the North, Ridge and Lake. The principal veins strike N80E and dip steeply to the north, with a minor subsidiary NE orientation. On the surface, veins and their hydrothermally altered walls erode easily to form prominent linear zones with strike lengths of over 900 meters. The cumulative strike length of all mapped veins at present is over 3,700 m. Current drilling and exposures in creek bottoms indicate that the structural zones hosting the veins are as much as 20 meters wide, while the veins themselves have drill intercepts with corrected true thicknesses of at least 8 meters in places, although most are on the order of 1-2 meters thick. Some of the veins contain visible gold and exhibit local high grade gold values.
Exploration and Drilling Results
A total of 127 diamond drill holes and four trenches have investigated the Herbert Gold Property since drilling began on the project in August 2010. The 2012 drilling campaign was designed to upgrade the previously identified inferred resources to indicated resources and to test extensions of mineralization in the Main and Deep Trench veins as well as new targets in the Goat and Ridge veins.
Grande Portage initiated the 2012 drilling campaign with a two rig program in June. Spring Valley Drilling Inc. and Core One Enterprises LLC. completed 8,805meters of core drilling in 62 holes. The program in-filled the drill hole spacing of the Main and Deep Trench Veins to a nominal 25 meters and tested the open strike extents of both structures while completing a successful test of the Goat Creek Vein.
Seven holes were drilled from pad J on the Goat Creek structure in 2012. Hole 12J-3 intersected visible gold in a sheared quartz vein with a 2.05 meter intercept of 79.4 g/t gold which includes 0.8 meters of 192.5 g/t gold. Hole 12J-4 encountered an average of 12.66 g/t gold over 1.10 meters in the structure. The Goat Creek vein was discovered in 2011 by a single
- 40 -
wildcat hole collared on a linear feature which paralleled the other well-mineralized east-west veins. The feature can be traced on surface for nearly 1,000 meters.
The results from the 2012 infill drilling campaign were used for the updated NI43-101-compliant resource estimate by D.R. Webb of DRW Geological Consultants Ltd. (see “Mineral Resource Estimate” section). When compared to the April 2012 resource estimate, the recent campaign resulted in the conversion of 52.3% of the tonnes and 74.4% of the ounces from the inferred to indicated resource category. At the same time the grade increased by 42.2% compared to last April’s resource estimate. At a 3.0 g/t cut off, 56.0% of the tonnes and 81.7% of the ounces were converted to the indicated resource category, with an increase in grade of 46.2% . The program also delineated a higher grade shoot within the Deep Trench vein which contains the highest grade resource discovered to date of 407,100 tonnes averaging 8.12 g/t Au (at a 2 g/t Au cut-off), and 232,300 tonnes averaging 12.42 g/t Au (at a 3 g/t Au cut-off). This high-grade mineralization is open to the east and at depth.
Sampling, Analysis and Security of Samples
All core samples from the Herbert Gold drilling program are removed via helicopter from the drill pad to a secure hanger area and from there by truck to the project core logging and sample prep facility in Juneau. This facility consists of two lockable 40-foot shipping containers situated behind a residence in a graded parking area. The surrounding area is residential with multifamily housing units and business in the immediate area. The area is not fenced and is easily accessible to the public. The containers are owned by one of the underlying claim owners and so steps have been taken to maintain a clear custody of core samples by the operator including storage of the core in a locked container.
Core is first logged and selected intervals marked for sampling. A rock saw outside the core facility is used to saw the core in half. One half is bagged and stored prior to shipping to the assay lab, while the remainder of the core is archived on the core storage site. Samples are locked before being shipped to the assay lab in Fairbanks by air shipment. The samples are shipped to the lab quickly and are not stockpiled on site for any length of time. Future program will include security seals on sample bags and a designated storage area for split samples prior to shipping.
Core samples from 2010 and 2011 were air freighted to the ALS facilities in Fairbanks, AK for sample preparation. Incompetent, friable, clay-rich or crumbly samples were bagged in plastic bags and then placed in the standard canvas bags so there would be no possible loss of free gold in the cloth. Core samples were weighed, coarse crushed, split and pulverized. Pulps were then shipped to ALS in Reno, NV for analyses. For both 2010 and 2011, base metals and trace elements were analysed by ICP - AES (ALS prep code: ME-ICP61). This method uses a four acid dissolution method and is primarily designed as an exploration geochemistry analytical package. Initially, 2010 gold assays were by conventional fire assay techniques (ALS prep code: Au-ICP21), consisting of fire assay of a 30 g sample of the pulp with the pellet then dissolved in acid and "finished" by AES. This analytical method is typically used for exploration projects. Later in the 2010 season, 34 samples with anomalous gold values were check assayed using the metallic screen method (ALS prep code: Au-SCR21). In 2011 metallic screen assays were used for all submitted samples in addition to conventional fire assays.
There is no relationship between the assay lab (ALS) and either GPR or Quaterra. ALS Minerals laboratories are registered or are pending registration to ISO 9001:2008, and a number of their analytical facilities have received ISO 17025 accreditations for specific laboratory procedures.
After the completion of two seasons of exploration on the project, deficiencies were identified in the May 28, 2012 technical report concerning methods used for quality control and quality assurance. There were no external standards being used nor was there a program of duplicate analyses. Although analytical blanks were submitted into the sample stream, the source of the blank material was problematical. The authors of the technical report do consider however, that the data from the 2010-2011 field season is still valid based largely on the good agreement between the original data and the later check assays. Recommendations for correcting deficiencies in the adequacy of sample preparation, security, and analytical procedures were implemented prior to commencement of the 2012 drilling program.
Metallurgical Testing
Metallurgical testing on mineralized material from the Herbert Gold project confirms that the gold in this system returns recoveries up to 91 % Au and 78% Ag using a combination of gravity concentration and cyanide leach of the gravity tailings. The ores also contain variable percentages of sulfides such as arsenopyrite, galena and sphalerite, and sodium cyanide consumption was high.
The U.S. Bureau of Mines collected a 240-pound metallurgical sample of gold mineralized vein material from the project for analysis and beneficiation tests in 1988. A gravity separation test recovered 88.8 % of the gold and 80.7 % of the silver. In
- 41 -
2010 a sample prepared from cannibalized drill core was tested for "Bond Ball Grindability" and gold recoveries. The results cite a calculated value of 15.7 kw-hr/tonne for work index (WI) and combined gold and silver recoveries of 91 and 78 % respectively using gravity concentration followed by cyanidization of the concentrates and tails (G&T Metallurgical Services, Ltd., 2011). The report recommends further metallurgical testing to understand the large consumption of sodium cyanide in the process. Though the metallurgical study consisted of representative material from core, the material collected was uniformly from relatively low-grade material recovered during the 2010 drilling campaign and did not include the high-grade with visible gold drilled during the 2011 season. As testing of the project continues, increased knowledge will allow a better consideration of the range and size of the sampling program required for additional metallurgical sampling. A bulk sample between 10 and 100 tonnes will permit a far more comprehensive mill design and a gravity only recovery test by Falcon (or equivalent) would provide better parameters for designing of the mill.
The regional characteristics of ores from past mining operations in the Juneau district are quite consistent, containing a very high percentage of free milling gold with the remainder of the gold reporting with the base metal sulphides. It is reasonable to expect, based on these regional characteristics and the character of the core samples obtained to date, that mineralized material from the Herbert Gold project will behave similarly.
Mineral Resource Estimate
GPR and Quaterra released an updated NI 43-101 complaint resource estimate for the Herbert Gold Project on February 28, 2013. The updated estimate by D.R. Webb P. Geol. of DRW Geological Consultants Ltd. used the digital database derived from a total of 127 diamond drill holes and four trenches that includes the results from the 2012 infill drilling campaign. Based on operating cost estimates for a 250 tonne per day mining operation, the May 28, 2012 YPS Herbert Gold Technical Report selected a 2.0 g/t as appropriate for base case cut-off. At a cut-off of 2 g/t Au, the February 28, 2013 estimate contains an indicated resource of 821,100 tonnes grading 6.91 grams per tonne gold (g/t) containing 182,400 ounces of gold in the Deep Trench and Main veins. At the same 2 g/t Au cut-off, the Deep Trench and five veins that have had limited drill testing contain an inferred resource of 51,600 tonnes grading 7.73 g/t gold for a total of 12,800 ounces of gold. The mineralization is open at depth and along strike.
A summary of the February 28, 2012 resource estimate is shown below:
Herbert Gold Project
Mineral Resource Estimate (February 2013)
| Cutoff Grade | Av. Grade | Au | |
| (g/t Au) | Tonnes | (g/t Au) | (Ounces) |
| Total Indicated Gold Resources | |||
| 2.0 | 821,100 | 6.91 | 182,400 |
| 2.5 | 637,900 | 8.25 | 169,200 |
| 3.0 | 532,400 | 9.34 | 159,800 |
| Total Inferred Gold Resources | |||
| 2.0 | 51,600 | 7.73 | 12,800 |
| 2.5 | 42,100 | 8.99 | 12,200 |
| 3.0 | 38,600 | 9.55 | 11,900 |
The resources are classified according to their proximity to the sample locations and are reported, as required by NI 43-101, according to the CIM Definition Standards for Mineral Resources and Mineral Reserves. Indicated resources comprise blocks that are situated within 60 meters of assays derived from drill holes or trenches. Resource blocks located between 60 and 200 meters of assays are considered inferred. Metallic or screened assays were used in all instances where they were available (921 samples). All other assays are standard one assay ton results reported using ICP finish or where over limit (>10 g/t) are reported using gravimetric finish.
MapInfo’s 3D solid generation routine was used to construct three dimensional models from a series of cross sections for each of eight different zones where correlations in apparent gold assays, alteration zones, and multi-element data appear down-dip on section and between sections. Some areas of the Main vein provided multiple options for correlations that were permissive by geology and sample geochemistry. The Deep Trench vein was remarkable in the simplicity and consistency of a very planar orientation of the correlations.
- 42 -
An Inverse Distance Squared (ID2) method using a block model approximately 8m x 1.5m x 6m was applied to the Main and Deep Trench veins. Smaller solids (such as the Deep Trench Vein Hanging Wall) were modeled using smaller block sizes down to 2m x 2m x 2m. Blocks required a minimum of three and a maximum of 12 composites within a 180m x 180m x 180m search ellipsoid, oriented parallel to the vein. The raw and composited assay data for the veins display a mixture of three populations on the lognormal probability plots. These can be modeled smoothly without any obvious outliers that can over-influence the estimation and to account for the nugget effect. Statistical studies showed that capping or averaging was not indicated. The resource remains open in multiple directions along these defined veins.
D.R. Webb P. Geol. is the Qualified Person responsible for the reserve and resource calculations while D.G. Dupre P. Geo. is the Qualified Person responsible for all other aspects of the Technical Report which is being prepared and will be filed within 45 days of the February 28, 2013 release. Quality-control data, generated during the various drill programs conducted at the Herbert Property, are being independently verified by Mr. Dupre and Dr. Webb as part of the project review.
Future Work Plans
Although no drilling was performed during 2013 due to a lack of funds, all wooden drilling platforms were dismantled and flown to an offsite location as specified in the operating permit and the third year of baseline environmental water studies was completed.
The objective of future drilling will be to extend the known mineralization down dip and along strike. Preliminary resource estimates are strongly influenced by high-grade shoots along the veins and there is no geological evidence that the grades of the shoots could not have continuity to great depths. The resource remains open in multiple directions along these defined veins in addition to there being several highly prospective structures spread over the property. With 4 (or possibly five) high grade mineral shoots now identified in 3 of 6 vein systems on the property and only 10% of the known property yet investigated by drilling, the Herbert Gold project retains attractive untested potential for significant resource growth.
Approval of the 2014 Operating Plan by the US Forest Service was received on February 27, 2014. This will permit drilling to be carried out from June 16 to October 31, 2014, if the JV elects to do so. The company is currently in the process of monetizing non-core assets, including its 35% interest in the Herbert project. In the event that Grande Portage decides to drill before Quaterra has monetized its interest, the Company will be subject to dilution if it elects not to participate.
Uranium Claims, USA
During 2012 and 2013, the Company aggressively marketed the Company’s uranium assets. One bid was received and on March 14, 2014, the Company closed a transaction to sell its uranium properties and assets located in the states of Arizona, Utah and Wyoming for gross proceeds of $500,000 after regulatory approval. The transaction provides working capital and will free-up time and resources for the Company to focus on its Yerington-district copper properties.
Acquisition and Staking of Uranium Claims
WeQuaterra commenced uranium exploration in Arizona in June 2005 with the acquisition of 99 unpatented lode mining claims from North Exploration LLC (“North”) that cover several uranium breccia pipe targets in the Arizona Strip district. Under the terms of the North agreement, we may acquirethe Company acquired a 100% interest in any or all of the North claims by making staged payments over a five-year period totaling US$500,000 and issuing 600,000 common shares. The North Properties are subject to a 2% production royalty on each Property, 1% of which may be purchased by usQuaterra for US$1 million. The North agreementacquisition also included an option to acquire other properties in Utah and Wyoming that are prospective for both uranium and vanadium.
In mid 2006, wemid-2006, Quaterra signed a letter agreement with Nu Star Exploration LLC (“Nustar”)(Nustar) to lease 18 Claims covering 4 additional breccia pipe targets in the district. The terms of the Nustar lease areincluded an upfront payment of US$20,000, a first anniversary payment of US$30,000, a second anniversary payment of US$40,000 and a final third anniversary payment of US$100,000. The final payment was renegotiated and reduced to $50,000 payable in two payments of $25,000. The first of the two payments is deferred until such time when the withdrawal by the Department of the Interior be lifted and exploration and mining activities be allowed to continue. The last of the two payments is due on the first anniversary of the lifting of the withdrawal. The Nustar Claims are subject to a 4 %4% Yellowcake royalty, 75% of which wethe Company can buy back for US$500,000 per Claim group (thereby reducing the royalty from 4% to 1%).
- 6 -
WeQuaterra staked an additional 550 mining Claims on the Arizona Strip in 2006 and another 1,450 claims were perfected in early 2007 to cover more than 200 high and moderate priority anomalies identified by an airborne VTEM geophysical survey. Our
- 43 -
On July 20, 2009 a decision by the US Department of the Interior (“DOI”) segregated 1 million acres of federal lands in the Arizona Strip for two years pending a review for a possible withdrawal of the district from mineral rights now include 2,568 unpatentedentry. On January 9, 2012, the DOI announced a Public Land Order to withdraw approximately one million acres of Federal land for a twenty year period. The stated effect of the withdrawal order is to withdraw the acreage from new mining claims and 3sites under the 1872 Mining Law, subject to valid existing rights and does not prohibit previously approved uranium mining, or development of new projects that could be approved on claims and sites with valid existing rights.
Quaterra prioritized and selectively reduced the Company’s mineral properties in response to the segregation and subsequent withdrawal order. The optimized land position consists of 516 unpatented claims that control 140 VTEM anomalies. The properties cover Quaterra’s best breccia pipe targets with a maintenance cost that can be supported while the withdrawal is contested in Federal District Court. The withdrawal affects all but 8 of Quaterra’s unpatented claims on federal lands in the district but does not affect future exploration or development on the Company’s 1,320 acres of State leases in Arizona.
In early 2010, Arizona state Mineral Exploration Permits (MEPs) totaling approximately 3,200 acres were acquired through an option agreement with Eagle Hill Exploration, Eagle Hill Arizona Uranium LLC, and Snowden Resources Corp. Additional MEPs were acquired by the Company in 2011 and some were abandoned in 2012 and 2013 making a current total of 1,320 acres of Arizona state land now under lease by Quaterra. When combined with 16.4 square miles covered by 516 unpatented federal claims, the Company’s land position covers approximately 18.5 square miles in the heart of the Arizona State Mineral leases that together form a total project area of approximately 85 square miles.Strip uranium district. The properties consist of many individual and scattered claim blocks that have been selectively staked over targets with some surface expression of a possible collapse structure, with favorable VTEM geophysical signatures and within areas of known mineralized occurrences.
Expenditures to Date
Acquisition costs incurred to December 31, 20082013 were $3,534,618$5,073,585 and exploration expenditures were $6,982,347$8,015,529 for a total of $10,516,965.$13,089,114. Acquisition costs incurred to December 31, 20072012 were $2,956,192$4,962,589 and exploration expenditures were $3,519,528$7,867,075 for a total of $6,475,720.$12,829,664.
During the year ended December 31, 2013, the Company impaired and abandoned these uranium properties due to its inability to carry on exploration activities and prolonged legal processes resulting in impairment charge of $12,589,114. Location, Access and Infrastructure
OurQuaterra’s Arizona Uranium property is located in the northern Arizona Strip uranium district in Coconino and Mohave Counties. The property occupies the southwest corner of the Colorado Plateau physiographic province in northwestern Arizona just south of the Utah state line (Figure 4.1) .line. It is bounded to the west by the Grand Wash Cliffs and to the east by the Echo Cliffs. The area is characterized by a broad and featureless expanse of range land that becomes deeply incised by canyons of four major drainages.
Access to the property is provided by maintained county roads, mine access roads and a network of BLM recognized dirt roads and jeep trails used by ranchers and prospectors as well as State and Federal authorities for land management. Nearly all of the surface and mineral rights with the exception of the Arizona Statestate lands are Federal and managed by the Bureau of Land Management with a field office in St. George, Utah.

Figure 4.1: Location map of the Arizona Strip Uranium Property
History
Uranium mineralization was first discovered on the Arizona strip in a mineralized breccia pipe in 1947. The uranium occurred in association with copper mineralization at the Orphan mine two miles west of the visitor’s center on the south rim
- 7 -
of the Grand Canyon. The first uranium ore was shipped by the Golden Crown Mining Company in 1956 to a buying station in Tuba City. Before closing in 1969, the Orphan operation produced a reported total of 4.4 million lbs of uranium in material averaging 0.42% U3O8 and 6.7 million lbs of copper. (Baillieul,(Baillieu, T.A. and Zollinger, R.C. (1980) NURE Grand Canyon Quadrangle, Arizona PGJ-020, 41p.).
The relationship of uranium to copper mineralization initiated an investigation of several small copper deposits in the region. Uranium was identified in the Hack Canyon copper mine on the northern Arizona strip in the 1950s but it was not until 1974 when Western Nuclear discovered uranium ore bodies in the Hack 1 and Hack 2 breccia pipes that industry began to focus attention on the emerging district. Energy Fuels Nuclear Inc. (“Energy Fuels”)(EFN) acquired the Hack Canyon ore bodies in 1980 and initiated an intense campaign of land acquisition and exploration that over the next ten years discovered seven ore bodies. With the entrance of Pathfinder Mines and Union Pacific Resources, at least three additional mineralized breccia pipes were
- 44 -
added to the district. Several more were in earlier stages of discovery when in the early 1990s the price of uranium dropped below the cost of production.
The Arizona Strip historically represents some of the highest grade mineralization and most profitable per pound uranium production in the United States. Energy FuelsEFN breccia pipe uranium mines were some of last hard rock uranium producers in the US prior to the price decline of the 1990s. Since 1980, the Arizona Strip has produced in excess of 1920 million pounds of uranium, averaging 0.65% U3O8 from seven mines.eight breccia pipes. Of these, mines, Hack Canyon I, II, and III, Pigeon and Hermit are mined out and have been reclaimed, Pinenut andKanab North is under reclamation Arizona 1 (owned by Dennison Mines) are currentlyEnergy Fuels Inc.) resumed production in the final phases of developmentJanuary 2010 and pending permittingPinenut (Euergy Fuels) returned to commence production and Kanab North has been placed on a standby with reserves remaining.in June, 2013.
Geology and Mineralization
The canyon walls of northern Arizona expose numerous breccia pipes that are characteristic of the collapse structures that host uranium mineralization in the Arizona strip. Initiated by the roofThe collapse of cavernscavern roofs in the Mississippian Redwall Limestone forms a pipe of breccia forms through the subsequent collapse of overlying sediments through mechanical and chemical processes to form a vertical column of breccia. Breccia pipes in the region average 200 to 400 feet in width and can extend upward over 3,000 feet from the Redwall Limestone to the upper Triassic sequence. (Figure 4.2) .
Figure 4.2: Diagrammatic Stratigraphic Section of the Arizona Strips showing a Characteristic collapse breccia pipe. (After W.J. Breed, 1974).
- 8 -
Many northern Arizona brecciaBreccia pipes exhibit several common morphological features that are used to identify the structures at the surface and to position drill holes at depth (Figure 4.3) .depth. The cylindrical area of vertically displaced breccia in the center of the pipe is generally referred to as the “pipe throat.” The amount of vertical displacement in the throat ranges from 50 to several hundred feet and often decreases up section. The internal geometry of the throat can be complicated by the later formation of “pipe in pipe” structures. These internal features are the result of late stage (often post-mineral) collapse due to continued dissolution of carbonates in the lower reaches of the pipe throat. They may result in the dispersal and elimination of economic accumulations of uranium mineralization in the pipe.
The throat of a breccia pipe is seldom visible at the surface when not exposed in canyon walls. Where covered by the Triassic Moenkopi siltstone or recent alluvium, the only evidence of a pipe structure may be a large circular structure of gently inward dipping beds or even more subtle circular anomalies formed by ring fractures and vegetation. These features are caused by the dissolution of evaporites in the Permian Toroweap and Kaibab Formations (PKfm) along the margins of the throat during the formation of the pipe. As the evaporites are removed, a pronounced structural depression or “collapse cone” develops in the overlying strata above the Coconino sandstone. Many of the collapse cones are characterized by a thick section of Moenkopi siltstone that fills the cone near the upper Kaibab horizon. Although breccia pipes often have some structural symmetry at different levels, the throat of a pipe is not always in the center of a collapse cone and circular depressions are not always related to pipes.

Figure 4.3: Morphology of a typical northern Arizona Strip breccia pipe.
Uranium mineralization in breccia pipes of the northern district occurs predominantly within the pipe throat and below the upper Hermit contact. Mineralization is also present in ring fractures along the margins of the throat, and in the underlying Supai Group, but significant accumulations at this level areis less common on the north rim than in the southern district. Economic concentrations of mineralization often occur over a vertical distance of more than 600 feet in the pipe throat. Scattered mineralization can extend well below the upper contact of the Esplanade Sandstone.
Uranium occurs primarily as pitchblende in voids between sand grains and replacing rock fragments of a reduced sandstone dominant breccia derived from the Coconino Sandstone. Calcite and gypsum are common cementing minerals. Associated trace elements include copper, arsenic, nickel, lead, zinc and silver. The mineralized breccia often contains abundant bitumen that is considered an important reducing agent for the geochemical system. Uranium is generally thought to have been transported to the pipe by oxidizing ground waters in the Coconino Sandstone and deposited in a “trap” of porous sandstone breccia within the non porous pipe walls of Hermit siltstone and above a relatively tight base of siltstone dominant breccia. Finely disseminated pyrite is common in the mineralized zone and may contribute to the reducing environment necessary for the deposition of uranium. Immediately above the mineralization, pyrite becomes massive and forms a “cap” of pyrite after marcasite that can exceed 50 feet in thickness.
The USGS Open File Report (OFR-89-550) shows the mapped locations of 1,296 pipes in northern Arizona. More than 90% of mapped pipes are shown within the deeper canyons of the region where they are exposed by erosion of the younger strata. Because of their scenic value, these canyons have been withdrawn from exploration and mining. However, the same
- 9 -
density of pipes is probable at depth in the surrounding district where the number of known pipes decreases dramatically below the cover of successive layers of younger sediments until fewer than 2 pipes are evident over a surface area of 500 square miles in the upper Triassic sequence (Figure 4.4) . Clearly, thesequence. The upper level of stoping by collapse varies and many pipes may occur at depth within the district and remain “hidden”hidden with no surface evidence of a pipe throat. If these structures penetrate the Coconino Sandstone, an ore body may exist with no pipe feature at the surface.
Figure 4.4: Diagrammatic Cross Section of the Northern Arizona Strip Uranium District Showing the approximate frequency and relative distribution of solution collapse breccia pipes within various stratigraphic horizons.
Hidden or “blind” pipes may be the most numerous types of mineralized structures. Until the discovery of A-1, the Hack 2 mine was the only “hidden”blind pipe ever discovered in the district. Hack 2 was also the largest deposit ever mined in the district with approximately 7 million pounds of U3O8U3O8 produced. The number of pipes identified to date may represent only a small fraction of the number of mineralized hidden pipes that lie waiting to be discovered at depth. With continued exploration, the Arizona Strip may soon become one of the more significant producing uranium districts in the United States.
Recent Exploration and Drilling Results
The discovery of new deposits in a mature district requires a determined and innovative approach combined with the latest exploration technology. WeQuaterra initiated uranium exploration on the Arizona Strip in 2006 with methods that have been proven by years ofbased upon past experience withof Energy Fuels Nuclear. Geologic mapping, aerial photography and satellite imagery have been and continue to be used extensively to identify breccia pipe targets. When a target was located, surface time-domain electromagnetic geophysical surveys had significant success in defining areas of thickened (conductive) siltstone within the surface structure. Shallow drill holes are used define a collapse cone and to target deep holes to test for mineralization in the pipe throat. Most of the obvious targets identified by these methods have been located and drill tested by companies exploring the northern district in the 1980s. However, extensive areas remained unexplored because of the time and expense required by the surface geophysical surveys.
Since commencing on the Arizona Strip, we haveQuaterra has drilled 98,403100,162 feet in 105104 shallow and 41 deep holes that investigated 25 targets (Table 4.1) .26 targets. The program had limited success until weQuaterra contracted Geotech Ltd. to conduct the first extensive test of an airborne time-domain electromagnetic system (VTEM) in the district in early 2007. The VTEM system identified most of the known breccia pipes and more than 200 moderate to high priority targets on ourthe Company’s property with similar geophysical signatures but with little or no outcropping evidence of a collapse feature. The similarities to known structures and the sheer number of targets suggested that many of the anomalies could be hiddenbind pipes.
- 10 -
Table 4.1:

The first VTEM target tested by us resulted in the discovery of the first new mineralized breccia pipe found on the Arizona Strip in 18 years. Discovery Hole A-01-31 intercepted a thickness of 57 feet averaging 0.33% U3O8U3O8 at a depth of1,034of 1,034 feet. The intercept includes a higher grade interval of 28 feet averaging 0.58% U3O8.TheU3O8. The drill-hole data indicate that the A-1 structure is a hidden breccia pipe. Upward collapse of the A-1 pipe stopped more than 400 feet below the surface. A list of all drill intercepts at A-1 are shown in Table 4.2.
The A-1 discovery proved the concept of airborne geophysical detection of hidden pipes. The discovery represents the only hidden pipe discovered in 28 years. Many of the future discoveries in the district will probably be hidden breccia pipes and they could also be some of the most important.
Hack 2, the largest and one of the highest grade uranium deposits ever discovered on the Arizona Strip, may have this status precisely because it is a hidden pipe. When internal collapse causing the upward growth of breccia pipes continues after ore deposition, the uranium deposit can be destroyed as mineralization is displaced and disseminated downward through the structure.
- 11 -
Table 4.2:

WeQuaterra followed up on the discovery of the A-1 mineralized pipe with a drilling program in 2008 dedicated to testing several more of the many airborne geophysical anomalies on ourQuaterra’s properties. The first hole to test the second geophysical anomaly identified a new breccia pipe with high-grade uranium mineralization at A-20. Discovery Hole A-20-01 intercepted a thickness of 34.5 feet averaging 0.37% U3O8U3O8 at a depth of 1,442 feet, including a high-grade zone of 6.5 feet averaging 0.63% U3O8U3O8 at a depth of 1,443 feet. The hole also intercepted a deeper zone of 13.0 feet averaging 0.46% at a depth of 1,567 feet that includes a higher grade interval of 10.0 feet averaging 0.58% ...
The relative size of the A-20 pipe can notcannot yet be determined, but it may be comparable to the larger breccia pipes in the district. Only three holes have been completed in the structure, one exited the pipe above the favorable mineralized horizon and two have penetrated pipe breccia. The discovery underscored
Since commencing the validity of the technique and raised expectations for the more than 200 moderatedrilling program to high prioritytarget VTEM anomalies remaining on our property. All intercepts are shownQuaterra has achieved a 70% success ratio in Table 4.3.
- 12 -
Table 4.3:
its exploration results. Near surface structures were identified in all but three of seven additional VTEM targets tested during the year.
The A-18 target, located midway between and about half a mile from ourthe Company’s mineralized Ollie and A20 pipes, is in an ideala suitable position for a single development to access all three targets. To date, five deep and two shallow holes have been completed that define a 40-foot-deep structural depression at the upper Fossil Mountain horizon. The deep holes have encountered up to eight feet of altered Hermit shale and a strongly altered section of Coconino sandstone that are indicative of close proximity to a pipe throat.
Drilling at the A51 target, located 1.5 miles west of ourthe A1 discovery provided similar encouragement. Three shallow holes and four deep holes defined a 60-foot-deep structure at the upper Fossil Mountain horizon and more than 20 feet of alteration in the Hermit shale. A gamma log of one deep hole showed a radiometric anomaly over a thickness of 15 feet in the Toroweap Formation. The holes are believed to have encountered the outer margins of a breccia pipe structure.
While waiting to complete a down-hole survey, one rig was moved to the Ollie prospect to re-enter and probe an old hole drilled by Energy Fuels Nuclear in 1990. The probe identified an intercept in hole JH2618-04 of 52.5 feet averaging 0.24% eU3O8 at a depth of 1,342.5 feet, including 27.0 feet averaging 0.36% eU3O8 at a depth of 1,359.5 feet. A down-hole TEM survey (using technology that was nonexistent during the EFN program) identified a significant anomaly to the south of the
- 46 -
drilled area which suggests that a large section of the Ollie pipe may remain untested. The down-hole TEM proved exceptionally valuable in locating the pyrite cap and providing information to target additional drill holes.
The A-21 VTEM target may also be a pipe, but deep drilling has failed to encounter the throat below the upper Coconino horizon. Three shallow and two deep holes have defined approximately 30 feet of structural closure in the Kaibab Formation and up to five feet of altered Hermit Shale below the lower Coconino contact indicating the proximity of a pipe structure. Additional shallow drilling will be required to target the pipe throat at depth.
Our land positionSampling, Analysis and Security of Samples
The Company uses the industry standard gamma logging method for grade determinations of uranium mineralization in drill holes. The process requires systematic calibration of the logging tools for precision and accuracy. Grades are reported as equivalent “U3O8” based on an assumed direct correlation between gamma-ray intensity, as measured by the gamma logging tools, and uranium content. The techniques for gamma log interpretation has been found to represent in-situ grades for uranium mineralization in the district as established by Energy Fuels Nuclear Inc. during their exploration and mining operations conducted on the Arizona Strip, selectively stakedStrip.
Down hole logging for the drill holes is contracted to control airborne geophysical anomalies, has given usStrata Data, Casper, Wyoming and Century Geophysical Corp. with verification by Geophysical Logging Service of Prescott, Arizona. The down-hole gamma logging tools are routinely calibrated by probing standardized test pits in Grand Junction, Colorado. Mr. Ken Sweet, Geophysical Consultant, of Denver Colorado provides QA/QC and final interpretation of the process.
Geophysical Logging Service uses a unique advantageborehole NaI detector manufactured by Mt. Sopris in Golden, Colorado for initial grade calculations. It is of the type 2PGA1000 which is a standard for uranium logging. It uses a large crystal, 22.22 mm in diameter and 76.2 mm long. As a back up an HLP-2375 tool is used, also manufactured by Mt. Sopris. The HLP tool is a smaller diameter and can be used small drill holes.
The tools are calibrated in Grand Junction Colorado, nominally every 3-6 months. When ore grade mineralization is encountered the tool will be calibrated more often. In general, variation with this tool is insignificant within a year and requiring less than a 1% calibration change. There are 4 calibration pits in Grand Junction; 0.231%, 0.452%, 1.22%, and 2.63% U3O8. The calibration pits are constructed of natural uranium ore. Corrections are made for hole diameter, the type of drilling pipe, and fluid in the search for breccia pipes. The success of our 2008 drilling program has provenhole. Because the validitygrades and thicknesses of the geophysical targets and added significantlymineralized section are determined by down hole logging tools, the Company uses rotary drilling for exploration on the project. Drill cuttings from the program are often limited to the prospective valueupper 400 feet of the many anomalies remaininghole. Circulation of the samples to the surface is often lost in the deeper evaporite dominant sections. Samples of the cuttings are collected in plastic boxes and archived in locked storage facilities.
When mineralization is intersected, spot core is collected when possible to compare to the interpreted gamma response. In some cases corrections need to be testedmade for disequilibrium as established by closed-can analysis or direct neutron activation that compares the chemical values of core vs. the interpreted gamma grades. The gamma response has the advantage of sampling a large volume, on our properties.the order of 60 cm. Data is sampled at 0.5 foot or closer spacing. All core from the program is placed in boxes marked for depths, logged by the Company geologist and kept in the Company’s storage facilities in Kanab, Utah.
For hole deviation, a Mt. Sopris 2DVA-1000 borehole deviation probe is used. It consists of a 3 axis flux gate magnetometer and a 3 axis accelerometer. The tool is calibrated on the surface using a “Jig” to hold it in a known orientation. The data is recorded continually along the hole.
Induction logs are used in conjunction with the gamma probe to provide additional lithologic information. Correlation of the interpreted lithologies between drill holes in a target area can reveal structural deformation related to a possible breccia pipe.
Mineral Resources
There are no resources or reserves on the Company’s Arizona Strip properties that comply with the CIM Standards on Mineral Resources and Reserves Definitions and Guidelines as adopted by CIM Council on August 20, 2000.
Future Work Plans
On January 9, 2012, the U.S. Department of the Interior (“DOI”) announced a Public Land Order to withdraw approximately one million acres of Federal land for a twenty year period. The stated effect of the order is to withdraw the acreage from new
- 1347 -
Future Work Plansmining claims and sites under the 1872 Mining Law, subject to valid existing rights and does not prohibit previously approved uranium mining, or development of new projects that could be approved on claims and sites with valid existing rights. The Company’s A-1, A-20, and Ollie deposits have mineralization exposed in drillholes that may qualify the underlying claims as having valid existing rights, The withdrawal order affects Quaterra’s unpatented claims on Federal lands but does not affect future exploration or development on the Company’s 1,320 acres of State leases within the district.
A limited drilling program to test someOn April 18, 2012, Quaterra, together with co-Plaintiff the Board of our higher priority breccia pipe targets is plannedSupervisors, Mohave County, Arizona, (Arizona Coalition) filed a lawsuit in the United States District Court for the State of Arizona Strip. The sizenaming as Defendants the United States Department of the program will be dependent onInterior and the strengthBureau of Land Management.
The basis of the uranium marketlawsuit is that the United States Government, through the Secretary of the Interior and availability of funding for the project. We presently have a total of 27 breccia pipe targets that are fully permitted for exploration of which 16 are bonded and ready for drilling. The drilling program to date has identified 3 mineralized breccia pipes and three targets classified as “probable pipes”; all of which are consider high priority for future drilling.
MacArthur, Nevada, USA
Acquisition and Staking of Copper Claims
The MacArthur property consists of 409 unpatented lode claims totaling approximately 8,450 acres on lands administered by the US Bureau of Land Management, (BLM) (Figure 4.5). did not adhere to mandated statutory procedures when it issued a decision to close more than one million acres of Federal land to all mining in Northern Arizona. Specifically, the suit alleges that the facts and science demonstrated that mining would not harm the Grand Canyon watershed and that the withdrawal of Federal lands regardless of this evidence was arbitrary and capricious; the decision arbitrarily withdraws over one million acres to address subjective sensibilities which enjoy no legal protection; the Secretary did not comply with the procedural requirements of the National Environmental Policy Act; and, the Secretary did not address scientific controversies and failed to coordinate with Local Governments in making his decision.
The claims are held by meansremedy sought is a judicial declaration that the withdrawal Order is unlawful and setting it aside together with issuance of a permanent injunction enjoining the Defendants from implementing any aspects of the Withdrawal. A decision finding that the Secretary failed to follow the criteria and procedures for a withdrawal and setting the withdrawal aside would restore the public lands to the status quo ante and allow Quaterra to proceed to develop the mineral lease with optiondeposits that it has lawfully claimed and worked.
Pursuant to purchase, executed on August 27, 2005, followed by two amendments dated January 15, 2007 and August 6, 2007, with North. We havean order of the right to purchase the claims from North by making a net payment of US$2,070,000 by January 15, 2010. The gross final payment of $2,420,000 will be reduced by US$350,000United States District Court for the purchaseState of Arizona dated July 19, 2012, the PIT claims. Our purchase is subjectcase filed by Quaterra Alaska against Secretary Salazar was assigned to a two percent Net Smelter Return (NSR) royalty with a royalty buy down optionbe heard by Judge Campbell of $1,000,000 to purchase one percent of the NSR, leaving a perpetual one percent NSR.
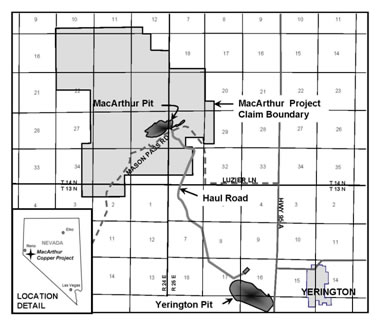
Figure 4.5: Location map of the MacArthur Copper project
Expenditures to Date
Acquisition costs incurred to December 31, 2008 were $812,380this Court. Similar cases filed by Gregory Yount, National Mining Association and exploration expenditures were $7,452,228 for a total of $8,264,608. Acquisition costs incurred to December 31, 2007 were $525,713 and exploration expenditures were $2,407,015 for a total of $2,932,728.
Location, Access and Infrastructure
The MacArthur Copper Property is located near the geographic center of Lyon County, Nevada, USA along the northeastern flank of the Singatse Range approximately seven miles northwest of the town of Yerington, Nevada. The
- 14 -
property is accessible from Yerington by approximately five miles of paved roads and two miles of maintained gravel road. A 100-foot wide gravel haul road that accessed the MacArthur open pit copper mine during the 1990s leads 5 miles south to the Yerington Mine. Beyond the MacArthur pit area are several existing historic two-track dirt roads that provide access throughout the property. Topographic coverage is on US Geological Survey “Mason Butte” and “Lincoln Flat” 7.5’ topographic quadrangles. The nearest major city is Reno, Nevada approximately 75 miles to the northwest.
History
Over the history of the MacArthur project, several operators have contributed to the current drillhole database of more than 300 holes (Table 4.4) .
| Table 4.4: | |||
| Exploration Drilling History | |||
| MacArthur Copper Project | |||
| January 2009 | |||
| Operator | Drill ProgramDate | Number of | Feet Drilled |
| Range | Holes Drilled | ||
| U.S. Bureau of Mines | 1947-50 | 8 | 3,414 |
| Anaconda Company | 1955-57 | 14 | 3,690 |
| Bear Creek Mining Company | 1963-?? | Unknown | Unknown |
| Superior Oil Company | 1967-68 | 11 | 13,116 |
| Anaconda Company | 1972-73 | 280 | 55,809 |
| Pangea Explorations, Inc. | 1987-1991 | 15 | 2,110 |
| Arimetco International, Inc. | Unknown | Unknown | Unknown |
| Total | 328 | 78,139 |
During the late 1940s, Consolidated Copper Mines consolidated various claims into a single package that became known as MacArthur, and then attracted the interest of the US Bureau of Mines during their investigation and development of domestic mineral resources. The Bureau of Mines completed 7,680 feet of trenching in 1948 and followed up with eight diamond drillholes for 3,414 feet in 1950 (Matson, 1952). Five of the US Bureau of Mines’ holes (#1-5) fall within the northern segment of the present day MacArthur open pit where green copper-stained croppings predominated (Table 4.5) . Holes #6-8 were collared in an area of widespread iron oxide staining approximately 2,000 feet north of the MacArthur pit. Oxide copper intersected in the southern holes #1-5 whilst secondary, sooty, chalcocite enrichment was found in the northern holes #6-8. Following the US Bureau of Mines exploration and drilling, Consolidated Copper abandoned their claims.
During the middle 1950s, Anaconda, by then operating the Yerington Mine, acquired leases and began investigations at MacArthur including 33 shallow drillholes (only 11 exceeding 100 feet) during 1955, 1956, and 1957. Six Anaconda holes (#’s 12, 14-17, and 19) fall within the current MacArthur pit limits. Key interval assay results from the holes exceeding 100 feet in depth are shown in Table 4.6 (Anaconda Collection-American Heritage Center). Anaconda, likely searching for shallow oxide feed for their Yerington mine, abandoned the claims sometime after 1957.
- 15 -
Table 4.6:Anaconda Company 1955-1957 Drilling HighlightsMacArthur Copper ProjectJanuary 2009
In 1963, Bear CreekNorthwest Mining Company (Bear Creek) optioned claims on the MacArthur property that included leases on the Gallagher area to the west (within our current claim position) and staked additional claims. Bear Creek completed large-scale geologic mapping, rock chip (and float) grid sampling, alteration mapping, Induced Polarization (IP) and audio magneto-telluric geophysical surveys, and drilled at least fourteen air rotary holes, the deepest to 663 feet. At least four holes for 1,237 feet were drilled to satisfy claim staking location work. Exploration drilling was targeted on limonite cappings and on IP anomalies. Bear Creek drilled north and west of the MacArthur pit boundaries, focusing most of their attention and drilling in the Gallagher area.
During 1967 to 1968, The Superior Oil Company (Superior) optioned the claims formerly held by Bear Creek and drilled eleven holes as rotary pre-collar, core finish, for 13,116 feet testing the concept that a deep primary sulfide-bearing porphyry copper ore shell might underlie the MacArthur oxide mineralization heretofore tested no deeper than 663 feet. Two of Superior’s holes were collared along the current north margin of the MacArthur pit while the remainder fall within our claim boundaries. Superior failed to meet objectives and abandoned the claims in the late 1960s.
During the early 1970s, with the Yerington mine nearing the end of its life, Anaconda acquired a land position and launched an extensive trenching and rotary drilling program (over 225 rotary holes for approximately 46,000 feet in 1972 and 55 rotary holes for approximately 9,809 feet in 1973) over and adjacent to the present day MacArthur pit. The result was a resource approaching 13 million tons of plus 0.4 percent Cu (1972 data only), described as an oxidized low-grade copper deposit which has been locally enriched by exotic copper (Heatwole, 1978). Anaconda’s resource calculations were developed into the mine plan supporting the 5.5 million tons at 0.30 percent Cu mined from the MacArthur pit by Arimetco during 1995-1997.
During 1987 to 1991, Pangea located 304 unpatented lode claims and conducted an aggressive gold evaluation of the MacArthur area from the present day MacArthur pit westerly to the Gallagher area. Pangea’s program included over 549 rock chip samples, geologic and alteration mapping, followed by trenching two target areas (Adams, 1987). Eight trenches for 1,420 ft were cut and sampled in the Gallagher area and four additional trenches for 720 ft located in an undefined “north target”. Table 4.7 details some of Pangea’s exploration drilling results. Anomalous gold values (41 samples exceeding 0.5 g / tonne Au) led to a 15-hole / 2,110-foot reverse circulation drilling program with 1,310 feet in seven holes testing the Gallagher area. Pangea found the drilling results discouraging (best gold value of 0.026 oz / short ton over five feet) and abandoned the property thereafter.
| Table 4.7: | |||
| Pangea Exploration 1987-1991 Drilling Highlights | |||
| MacArthur Copper Project | |||
| January 2009 | |||
| Hole ID | Interval | Interval Length | Gold Grade |
| (ft) | (ft) | (oz/ton) | |
| MAC 91-1 | 20-45 | 25 | .012 |
| 165-175 | 10 | .013 | |
- 161 -
| MAC 91-2 | 100-110 | 10 | .012 |
| 130-145 | 15 | .016 | |
| MAC 91-3 | 75-90 | 15 | .013 |
| MAC 91-4 | 45-55 | 10 | .011 |
| 145-155 | 10 | .015 | |
| MAC 91-5 | 90-100 | 10 | .011 |
| MAC 91-6 | 85-95 | 10 | .021 |
| 100-110 | 10 | .014 | |
| 85-110 | 25 | .014 | |
| MAC 91-7 | 5-15 | 10 | .015 |
| 55-75 | 20 | .016 | |
| MAC 91-8 | 105-115 | 10 | .016 |
| MAC 91-9 | 75-85 | 10 | .015 |
| MAC 91-10 | 60-80 | 20 | .014 |
| MAC 91-11 | 20-30 | 10 | .011 |
Metech Pty. Ltd., of Perth, Australia was commissioned to prepare an ore reserve and mining planning study of the MacArthur deposit in 1989. Metech digitized the Anaconda data set which consisted of 11,529 assay intervals from 290 drill holes. The Metech study developed a statistically controlled Kriged ore body model of the MacArthur deposit within defined zones of mineralization. The study reported the definition of a (non 43-101 compliant) overall “geologic reserve” of 63.2 million tons grading 0.26% TCu at a 0.18% TCu cut-off.
In 1989 Arimetco International (“Arimetco”) purchased the Anaconda Yerington district properties and consolidated a major land position consisting of over 8,500 acres including 85 patented claims. Arimetco entered the district to extract copper by heap leaching methods, with initial production from the Anaconda Yerington mine oxide stockpile and Yerington mine vat leach tailings. Arimetco’s leach pads were located on the Yerington mine dump and tailings sites approximately five miles south of the MacArthur property. During evaluation and mining of the MacArthur mine, Arimetco drilled an unknown number of holes as a check on Anaconda’s 1972 to 1973 drilling. Anaconda’s drilling and resource calculations provided the mine planning data for Arimetco’s MacArthur mine.
Arimetco mined a total of six million tons at an estimated grade of 0.36 % total copper using open pit methods from the MacArthur deposit in the period of 1995 to 1998. The low-grade oxide ore was trucked to heaps at the Yerington site where it was successfully processed with operations to remove copper from the Yerington mine tailings using a solvent extraction electro-winning process. Due to financial difficulties resulting primarily from the low price of copper, Arimetco sought protection under Chapter 11 of the U. S. bankruptcy Code in January 1997 and suspended all operations in 2000. After Arimetco’s departure, the mining Claims over the deposit were allowed to expire. No consistent, large-scale mining has occurred on the site.
Geology
The MacArthur copper deposit forms part of the Yerington mining district which includes at least three, large, porphyry copper deposits (Yerington, Ann Mason, Bear-Lagomarsino), as well as two large IOCG deposits (Pumpkin Hollow, and Minnesota). Mineralization ranges from disseminated porphyry copper occurrences to skarn, limestone replacement, and vein type deposits.
The Yerington area is underlain by early Mesozoic volcanic and sedimentary rocks now exposed along uplands in the Singatse Range in the west and the Wassuk Range to the east. These Mesozoic rocks were intruded by two Middle Jurassic batholiths, an older granodiorite (Yerington Batholith) and younger quartz monzonite (Bear Quartz Monzonite) that comprise the majority of outcropping rocks in the district. These batholiths were themselves intruded by another Middle Jurassic quartz monzonite event moderately to steeply north dipping quartz-biotite-hornblende porphyry dike swarms, associated with copper mineralization, striking north-northwesterly across the entire mining district.
Early to Middle Tertiary volcanics deposited ash flow tuffs prior to the advent of normal, faulting associated with Late Tertiary basin-and-range extension that displaced and tilted all of the above-mentioned rocks. These faults dip east and are curved, concave upward, so that the dip of the fault flattens eastward. Net displacements are in an east-west direction. The geologic section is completed by post-faulting conglomerates and alluvium section.
At MacArthur, the older granodiorite underlies most of the northern and western parts of our claim block. The intrusive weathers as an irregularly orange stained, medium olive green, fine to medium grained rock. Greenish epidote and minor orange limonite staining are present to common. Megascopic rock constituents include ~50 percent plagioclase, ~20 percent orthoclase, <20 percent quartz, 5 to 20 percent mafics (hornblende), 1 to 10 percent epidote, (and minor magnetite and other opaques) overprinted by irregular orange limonite alteration.
- 17 -
The quartz monzonite, cropping out along the east part of the claim block and underlying the MacArthur pit, is beige to light gray to off white, fine to medium grained, hard but well-fractured, with minor textural variants. Megascopic constituents include ~30 percent orthoclase, ~30 percent plagioclase, ~ 20 percent quartz, and 5 to 10 percent hornblende. In bench walls at the MacArthur Pit, quartz monzonite hosts conspicuous light brown limonite alteration banding (averaging 4 to 6 per foot) sub-parallel to the steeply north dipping, west-northwest trending quartz porphyry dikes. Along the eastern portions of the property, including the eastern third of the MacArthur pit, quartz monzonite assumes a light gray color due to widespread sodic-calcic alteration.
A phase referred to as the “border-phase quartz monzonite” commonly lies at the contact between the granodiorite and the quartz monzonite. The border-phase quartz monzonite is finer-grained than the quartz monzonite and has more abundant potassium feldspar. The border-phase may represent a contact zone between the quartz monzonite and granodiorite or may represent another Middle Jurassic intrusive event.
Quartz porphyry dikes that host a large portion of the primary copper mineralization at Anaconda’s Yerington mine are associated with all copper occurrences in the district. The porphyry dikes at MacArthur are classified by dominate mafic minerals into quartz biotite porphyry and quartz hornblende porphyry, each subdivided further based on composition and alteration. Dikes contain feldspar crystals and either hornblende or biotite crystals set in an aphanitic matrix. The structures are typically ridge-formers with widths to 50 feet, dip steeply to the north, and follow a penetrative north-northwest (S60°E to S80°E) structural fabric. Narrow (<10 feet) fine grained andesite dikes, post porphyry diking, follow the same NNW structural fabric.
Jurassic age andesite dikes in the walls of the MacArthur Pit can be traced from bench to bench and projected across the pit floors. Andesite dikes are commonly very fine grained, plagioclase-bearing porphyries that pinch and swell as they fill fractures. Fist-sized pillows may be a weathering product. Andesite dikes intrude the hornblende and biotite quartz porphyry dikes.
Tertiary hornblende andesite dikesAssociation against Secretary Salazar have also been identified onassigned to Judge Campbell. In August, the MacArthur property. These dikes are similar, but coarser grained thancases were consolidated for trial. The DOI filed a motion to dismiss the Jurassic andesite dikes, containing abundant, acicular, black hornblende phenocrysts and occasionally plagioclase phenocrysts.
The Mesozoic intrusive rocks are unconformably overlain by a series of nine Mid-Tertiary ash flow tuff units. Our claims partly cover one of the units, the Guild Mine Member, a crystal rich ash flow tuff dated at 27.1 to 25.1 Ma (Proffett and Proffett, 1976).
Mineralization
The MacArthur deposit is part of a large, partially defined porphyry copper system that has been complicated by complex faulting and possible post-mineral tilting. Events leading to the current geometry and distribution of known mineralization include 1) emplacement of primary porphyry copper mineralization; 2) supergene enrichment resulting in the formation of a widespread, tabular zone of secondary chalcocite mineralization below outcrops of totally oxidized rocks called a leached cap; and 3) oxidation of outcropping and near-surface parts of this chalcocite blanket coupled with partial remobilization of copper to form the upper zone of oxide copper now exposed in the MacArthur pit.
Based on drilling to date, the copper deposit is a 50-150 foot thick, tabular zone of secondary copper (oxides and chalcocite) covering an area of approximately 1.5 square miles. This mineralized zone has been only partially delineated and remains open for extension to the north, west and south. The flat-lying zones of oxide copper mirror topography, exhibit strong fracture control and range in thickness from 50 to 100 feet. Secondary chalcocite mineralization forms a blanket up to 50 feet thick that is mixed with and underlies the oxide copper. Primary chalcopyrite mineralization has been intersected in several locations mixed with and below the chalcocite. The extent of the primary copper is unknown as most of the drill holes bottomed at 400 feet or less.
Copper oxide mineralization is visible in the MacArthur open pit where a total of twelve, 7-meter high benches step down toward the northeast following the original topography. The excavation exposes copper mineralization including chrysocolla, copper wad (neotocite), pitch limonite (vitreous, goethite) and minor amounts of malachite and azurite all hosted in medium grained, biotite, quartz monzonite. Although copper wad (neotocite) and chrysocolla are exposed in the pit walls throughout most of the pit area, the copper wad is more abundant near the western end of the pit while chrysocolla is more common near the east end. “Pitch” limonite, (goethite) after chalcopyrite occurs sporadically as individual disseminations as well as along hairline veinlets containing biotized hornblende.
- 18 -
A significant amount of chalcocite has been intersected in drillholes. Chalcocite is seen on drill chips coating pyrite and chalcopyrite as weak to strong coatings and is strongest when pooled around the MacArthur fault. Chalcopyrite is present as disseminations and veinlets, with or without chalcocite. As much of the historic drilling was stopped at shallow (<400 foot) depths, the scope and extent of chalcopyrite mineralization has not been fully defined. Hole QM-040, drilled at the western end of the northern most section of drill holes intercepted a drilled thickness of 260 feet of predominantly chalcocite mineralization (with moderate amounts of chalcocite coating chalcopyrite) below the MacArthur fault averaging 0.38% TCu at a depth of 140 feet, including 20 feet assaying 1.48% TCu. The hole bottomed in mineralization at a total depth of 400 feet.
Both copper oxide and chalcocite mineralization occur over approximately 9,000 feet east-west by 4,500 feet north-south as defined by drilling. Copper oxides are structurally controlled coating fractures, joint surfaces, and developed as green or black “streaks” within shears and faults over several feet. Oxide mineralization occurs as a general, flat-lying geometry extending down as much as 150 feet or deeper below surface. Chalcocite mineralization forms a flat-lying blanket, up to 50 feet thick, mixed with and below oxide mineralization.
Primary chalcopyrite mineralization occurs irregularly with chalcocite and as porphyry style disseminations or as veinlets in quartz monzonite below both the oxide and chalcocite mineralization where it is associated with potassic alteration. Our drilling program in the Gallagher area has delineated a zone of chalcopyrite mineralization that extends over a north-south distance of 2,500 feet. The primary sulfide zone has a defined width of 500 feet and extends to a depth of approximately 650 feet.
Chalcopyrite mineralization has also been identified north of the pit in association with pervasive sericite and magnetite in quartz monzonite. The chalcopyrite mineralized zone (partially enriched with chalcocite) in hole QM-068 averages 1.15 % TCu over a drilled thickness of 115 feet at a depth of 470 feet. The zone is believed to have the potential of developing down-dip to the north toward a possible porphyry center at depth.
Exploration and Drilling Results
We acquired the digitized Anaconda exploration and drilling data package in August 2006 and commenced a review of the deposit geology and mineralization model using Datamine software. The data was used to assess the required drilling and sampling to complete a technical report on the MacArthur Project with the objective of preparing a 43-101 compliant resource estimate.
The lateral zonation of supergene copper minerals visible at the surface, a possible chalcocite blanket to the north of the pit, and a large, pervasive phyllic alteration zone to the north and west of the mine workings, all suggested that the MacArthur deposit could have a significant potential for growth; both in the form of copper oxides and as primary sulfides in a related porphyry system.
In April 2007, we commenced a drilling program to twin approximately 10% of the shallow holes that defined the previously explored copper oxide mineralization at MacArthur and to identify extensions of copper oxide and chalcocite mineralization in the vicinity of the open pit. The program also included 5 deep core holes to investigate the potential for primary copper mineralization in relation to a primary copper porphyry system at depth.
The 20-month drilling program totaled 80,100 feet in 173 holes including 23,900 feet of core in 49 holes and 56,200 feet of reverse circulation drilling in 124 holes. Although limited to a maximum disturbance of 5 acres under a Notice of Intent permit, the program was designed to maximize the use of existing roads and disturbances. The drilling successfully targeted a deeper chalcocite zone in step-out holes from the pit, expanded the known oxide mineralization, and encountered a large, underlying tabular blanket of mixed oxide-chalcocite mineralization that remains open for extension by additional drilling. The 50-150 foot thick zone of secondary copper has been defined over an area of approximately 1.5 square miles. The chalcocite blanket is associated with and overlies primary chalcopyrite mineralization verified by our deeper drillholes in the western and northern margins of the drilled area. The primary copper mineralization in the northern area is a target for a possible porphyry center. A complete list for all drill hole intercepts for the project may be found in the February 17, 2009 Tetra Tech 43-101 technical report filed on Sedar at www.sedar.com.
- 19 -
A helicopter-borne aeromagnetic survey conducted over the project early in 2008 coupled with an inversion of historical IPR data presents a geophysical interpretation of the MacArthur project area is both indicative of mineralization presently identified on the project and encouraging for future growth of the deposit though additional drilling. High magnetic anomalies located at the southwest and northeast margins of the drilled areas present attractive targets for the discovery of primary sulfide mineralization. The North Porphyry target to the northeast is further substantiated by both coincident IP and low resistivity anomalies. Limited drilling near the North Porphyry target and in the Gallagher prospect to the southwest has intersected significant widths of chalcopyrite mineralization. The strongest part of both anomalies remain untested as does a large area of subdued magnetic response due partially to the intense leaching of the near surface rocks that resulted in the formation of the oxide copper and chalcocite zones.
In October 2008, we contracted Tetra Tech, Inc. of Golden, Colorado, to complete a NI43-101 compliant independent resource estimate and technical report for the MacArthur Copper Project. The Tetra Tech estimate gave MacArthur project an initial measured and indicated oxide/chalcocite resourceof 57.36 million tons averaging 0.239% total copper (TCu) that contains 273.6 million pounds of copper. An inferred oxide/chalcociteresource of 75.8 million tons averaging 0.283% TCu contains 429.3 million pounds of copper. Aninferred primary sulfide resource of 6.4 million tons averaging 0.539% TCu contains 68.9 million pounds of copper. The base case cutoff grade for the leachable (oxide/chalcocite) resources is 0.18% TCu. The base case cutoff grade for the primary sulfide resource is 0.30% TCu. Both of these values are representative of actual cutoff grades in use as of the date of the report. Table 4.8 presents a summary of measured, indicated and inferred resources at various cutoff grades.
Table 4.8:
| MACARTHUR COPPER PROJECT –YERINGTON, NEVADA MEASURED COPPER RESOURCES January 2009 | ||||
| Cutoff Grade %TCu | Tons (x1000) | Average Grade %TCu | Contained Coppe (lbs x 1000) | |
| Oxide and Chalcocite Material (MinZone 10 and 20) | 0.50 | 307 | 0.585 | 3,594.28 |
| 0.40 | 957 | 0.486 | 9,309.09 | |
| 0.35 | 1,695 | 0.437 | 14,812.69 | |
| 0.30 | 3,044 | 0.386 | 23,486.70 | |
- 20 -
| 0.25 | 5,889 | 0.331 | 38,942.61 | |
| 0.20 | 11,470 | 0.278 | 63,708.34 | |
| 0.18 | 14,170 | 0.261 | 73,969.30 | |
| 0.15 | 17,186 | 0.244 | 83,970.00 | |
Primary Material (MinZone 30) | 0.50 | N/A | N/A | N/A |
| 0.40 | ||||
| 0.35 | ||||
| 0.30 | ||||
| 0.25 | ||||
| 0.20 | ||||
| 0.18 | ||||
| 0.15 |
| MACARTHUR COPPER PROJECT –YERINGTON, NEVADA INDICATED COPPER RESOURCES January 2009 | ||||
| Cutoff Grade %TCu | Tons (x1000) | Average Grade %TCu | Contained Copper (lbs x 1000) | |
Oxide and Chalcocite Material (MinZone 10 and 20) | 0.50 | 598 | 0.628 | 7,505.20 |
| 0.40 | 1,518 | 0.516 | 15,661.55 | |
| 0.35 | 2,390 | 0.463 | 22,139.62 | |
| 0.30 | 4,022 | 0.406 | 32,638.77 | |
| 0.25 | 8,728 | 0.332 | 58,021.47 | |
| 0.20 | 27,608 | 0.255 | 140,754.35 | |
| 0.18 | 43,195 | 0.231 | 199,683.85 | |
| 0.15 | 72,111 | 0.204 | 294,730.71 | |
Primary Material (MinZone 30) | 0.50 | 2 | 0.562 | 22.48 |
| 0.40 | 7 | 0.473 | 66.26 | |
| 0.35 | 27 | 0.392 | 211.73 | |
| 0.30 | 84 | 0.342 | 574.22 | |
| 0.25 | 204 | 0.300 | 1,224.82 | |
| 0.20 | 481 | 0.254 | 2,441.56 | |
| 0.18 | 565 | 0.245 | 2,762.85 | |
| 0.15 | 730 | 0.226 | 3,305.44 | |
- 21 -
| MACARTHUR COPPER PROJECT –YERINGTON, NEVADA MEASURED + INDICATED COPPER RESOURCES January 2009 | ||||
| Cutoff Grade %TCu | Tons (x1000) | Average Grade %TCu | Contained Copper (lbs x 1000) | |
Oxide and Chalcocite Material (MinZone 10 and 20) | 0.50 | 905 | 0.613 | 11,099.48 |
| 0.40 | 2,475 | 0.504 | 24,970.64 | |
| 0.35 | 4,085 | 0.452 | 36,952.31 | |
| 0.30 | 7,066 | 0.397 | 56,125.46 | |
| 0.25 | 14,617 | 0.332 | 96,964.08 | |
| 0.20 | 39,078 | 0.262 | 204,462.69 | |
| 0.18 | 57,365 | 0.239 | 273,653.15 | |
| 0.15 | 89,297 | 0.212 | 378,700.71 | |
Primary Material (MinZone 30) | 0.50 | 2 | 0.562 | 22.48 |
| 0.40 | 7 | 0.473 | 66.26 | |
| 0.35 | 27 | 0.392 | 211.73 | |
| 0.30 | 84 | 0.342 | 574.22 | |
| 0.25 | 204 | 0.300 | 1,224.82 | |
| 0.20 | 481 | 0.254 | 2,441.56 | |
| 0.18 | 565 | 0.245 | 2,762.85 | |
| 0.15 | 730 | 0.226 | 3,305.44 | |
| MACARTHUR COPPER PROJECT –YERINGTON, NEVADA INFERRED COPPER RESOURCES January 2009 | ||||
| Cutoff Grade %TCu | Tons (x1000) | Average Grade %TCu | Contained Copper (lbs x 1000) | |
Oxide and Chalcocite Material (MinZone 10 and 20) | 0.50 | 3,988 | 0.971 | 77,468.26 |
| 0.40 | 6,932 | 0.744 | 103,111.97 | |
| 0.35 | 9,416 | 0.646 | 121,668.91 | |
| 0.30 | 15,772 | 0.515 | 162,380.18 | |
| 0.25 | 29,287 | 0.401 | 234,916.85 | |
| 0.20 | 57,484 | 0.313 | 359,765.78 | |
| 0.18 | 75,832 | 0.283 | 429,335.65 | |
| 0.15 | 114,426 | 0.243 | 555,424.47 | |
Primary Material (MinZone 30) | 0.50 | 4,538 | 0.593 | 53,802.53 |
| 0.40 | 5,633 | 0.567 | 63,844.42 | |
| 0.35 | 5,842 | 0.560 | 65,395.35 | |
| 0.30 | 6,398 | 0.539 | 68,932.05 | |
| 0.25 | 9,101 | 0.459 | 83,601.79 | |
| 0.20 | 12,418 | 0.398 | 98,747.94 | |
| 0.18 | 14,367 | 0.370 | 106,172.13 | |
| 0.15 | 18,116 | 0.327 | 118,587.34 | |
Tetra Tech’s resource calculation is based on 449 Quaterra and Anaconda drill holes containing 134,255.6 feet and 26,727 sample assay values. The MacArthur geologic model was used to guide the statistical and geostatistical analysis of the copper assay data for the resource estimate. The analysis of the copper assays further confirmed the geologic divisions made by us in the geologic model. Copper grades were estimated in the individual blocks of the model measuring 25 by 25 feet by 20 feet high, by ordinary, whole-block kriging. The rock model was then assigned a tonnage factor based on the historic information that indicates an average in-place bulk density of 12.5 cubic-feet per ton. The tonnage factors were based on a number of tests from the core and, in Tetra Tech’s opinion, are representative of the various rock units, and are acceptable for estimation of the in-place geologic resources.
- 22 -
The copper resources were estimated using whole block kriging techniques and oriented search ellipsoids based on the individual variograms and were then classified into measured, indicated, and inferred categories by a combination of kriging variance, number of points used in the estimate, and number of sectors used.
The location of the various categories of resource blocks in the estimate reflects the density of drill holes on the project. Measured and indicated resource blocks are predominantly in or adjacent to the MacArthur pit where the drill hole spacing is the tightest. Inferred resource blocks trace the wider-spaced, 500 foot by 500 foot drilling pattern to the north and west of the pit. Several isolated areas containing indicated resource blocks are also estimated where one or more angle holes have been drilled from the same location in the wider spaced pattern.
The technical report concludes that significant potential for development of additional mineral resources are present within and adjacent to the current drill-hole pattern at MacArthur. The report recommends more infill drilling within the known oxide/chalcocite resource area, including a 2,000 foot by 2,000 foot area west of the pit, step-out drilling to enlarge the oxide/chalcocite resource to the north, south and west and deep drilling to evaluate the potential for additional primary sulfide mineralization at depth.
The Tetra Tech resource estimate is included with a description of the project history, geology, mineralization, sampling procedures, and laboratory Quality Assurance/Quality Control procedures. The NI43-101 Technical Report is available at www.sedar.com. The Qualified Person for the MacArthur Copper Project resource estimate and the technical report is Mr. John W. Rozelle, P.G., Principal Geologist for Tetra Tech, Golden Colorado.
Future Work Plans
Our future plans for the MacArthur project include reducing drillhole spacing, preliminary metallurgical testwork, initiating mine planning and baseline environmental studies, continued surface geologic mapping, and securing adequate supplies of water and power. These items are required for the project to proceed toward feasibility.
Near term plans are dependent on approval of the Plan of Operation / Environmental Assessment (expected Spring 2009) by the Bureau of Land Management. Plan approval will allow us to initiate a comprehensive reverse circulation and core drilling program designed to expand oxide and chalcocite mineralization and continue to test for underlying sulfide chalcopyrite mineralization. Priority drilling will seek to expand higher-grade sulfide copper intersected along the northernmost drill fence, some 5,000 feet north of the MacArthur pit. Drilling will infill the current 500 foot hole spacing and is planned in the area west of the pit where drill density coverage is poor to absent over an approximate 2,000 foot by 2,000 foot area.
Attention will also be directed to metallurgical leach column tests with oxide-bearing host rock readily sourced from the MacArthur Pit. Large diameter drilling will be necessary to obtain adequate sample material from the non-outcropping chalcocite and chalcopyrite mineralization.
Yerington Porphyry Copper Mine – Nevada, USA
On May 1, 2007, we received the approval of the appropriate U.S. court to the acquisition by a subsidiary of Quaterra of all Arimetco assets in the Yerington Mining District. The purchase price comprises US$500,000 cash, 250,000 of our common shares and a 2% net smelter return royalty capped at US$7.5 million dollars on production from any claims owned by us in the Yerington and MacArthur mine areas.
Our review of the Arimetco assets in the Yerington Mining District has progressed slowly but steadily. The Chambers Group Inc. and Golder Associates Inc. completed a Phase I Environmental Site Assessment Report (ESA) in April of 2008 as part of our due diligence. The purpose of this Phase I ESA is to identify conditions indicative of releases or threatened releases of hazardous substances so that we may establish liability protection as a bona fide prospective purchaser. This report is essential to obtain requested environmental protections for past mining related activities.
The original 180 day review period which began on July 13, 2007 was extended for an additional 120 day period to June 17, 2009.
Expenditures to Date
Acquisition costs incurred to December 31, 2008 were $1,338,894 and exploration expenditures were $689,125 for a total of $2,028,019. Acquisition costs incurred to December 31, 2007 were $970,978 and exploration expenditures were $285,100 for a total of $1,256,078.
- 23 -
Future Work Plans
Subject to successful completion of due diligence, we plan to explore the property as part of an ongoing exploration drilling program at MacArthur.
Duke Island, Alaska
Acquisition
In March and April 2001, Avalon Development conducted reconnaissance scale pan concentrate and grab rock sampling on behalf of us and staked 45 federal claims and 6 state claims. We increased our property position during subsequent field programs, to include a total of 129 unpatented Federal lode mining Claims covering 2,580 acres, and 11 state of Alaska mining claims covering 1,280 acres in the Ketchikan quadrangle in Township 80 South, Range 93 East. Mineral rights in this part of Alaska are administered by the U.S. Forest Service and the Alaska Department of Natural Resources. The Duke Island Project is located within the Tongass National Forest on multiple-use lands open to mineral development.
Expenditures to Date
Acquisition costs incurred to December 31, 2008 were $169,370 and exploration expenditures were $2,227,446 for a total of $2,396,816. Acquisition costs incurred to December 31, 2007 were $129,570 and exploration expenditures were $1,722,717 for a total of $1,852,287.
Location, Access and Infrastructure
The Duke Island project is in the Ketchikan quadrangle in Township 80 South, Range 93 East. The project is accessible via boat, small float plane and helicopter. There is tidewater access to the southeast end of the Property at Judd Harbor and the central portion of the Property via Hall Cove. The city of Ketchikan (population 14,000) is located 30 miles to the north and is the regional commercial hub for this part of southeast Alaska. The city hosts an all-season deep water port, international airport, commercial fixed wing and helicopter services, and most of the support industry required for mineral exploration.
History and Recent Work
Early exploration on Duke Island is limited to a drilling program in the late 1950’s by Columbia Iron Mining, a subsidiary of United States Steel. The program tested two areas for potential magnetite mineralization. Nine vertical drill holes are reported to have been drilled to a depth of 500 feet to ascertain the magnetite content of the ultramafic rocks (Irvine, 1974). Six holes were drilled on the southeast side of Hall Cove and three in the Judd Harbor area. Precise locations of these holes are uncertain and no assay data of any kind is available to us. The potential for PGE mineralization was not addressed during these efforts.
In 1972, Clark and Greenwood collected 22 rock samples for PGE assays as part of a regional sampling and petrology study. In 1989 Bureau of Mines geologists collected 24 samples for assay. Eleven additional samples were collected by the Bureau of Mines in 1995. None of these efforts led to discovery of significant mineralization at Duke Island.
In early 2001 Avalon Development Corp. identified several geologically promising PGE exploration targets in Alaska which prompted us to acquire mining claims at Duke Island. In March and April 2001, Avalon Development conducted reconnaissance scale pan concentrate and grab rock sampling and staked 45 federal Claims and 6 state Claims. Follow-up work was conducted in July which resulted in discovery of Cu-Ni-PGE sulfide mineralization hosted in pyroxenites on the north end of our claims. Subsequent rock sampling, soil sampling and 11,200 line-feet of dipole-dipole induced polarization geophysics were completed on the projectPlaintiff’s claim in September and the motion was heard in October. On January 8, 2013, the court denied the government’s effort to dismiss Quaterra, except for the NEPA claims and also denied the government’s motion to dismiss the Arizona Coalition on the NEPA claims. The district court held that the Coalition had standing to pursue its NEPA claims against BLM.
Geology and Mineralization
The Duke Island complex consists of two separate, well-exposed, ultramafic bodies interpreted to be partsSince the commencement of the same intrusive bodywithdrawal process, the Company has not expended significant amounts on the Arizona uranium claims pending the court decision and has suspended plans to continue to develop uranium claims on Federal land while the issues are resolved politically or judicially.
The uranium in this district represents significant potential domestic supply of energy and many jobs at depth (Figure 4.5) . Both intrusivesa time when both are comprised of a dunite and peridotite core surrounded by concentric zones of olivine clinopyroxenite, hornblende-magnetite clinopyroxenite, and gabbro. The presence of dominantly ultramafic cumulates likely resulted from concentrationcritical to the needs of the mafic minerals by flow, settling, and entrapment from a mafic magma, rather than an origin as an unusual ultramafic magma.U.S.
- 24 -

Figure4.5:GeneralgeologyofDukeIslandshowinglocationofRavenandMarquiszones(AvalonDevelopment,2006)
A series of northwest and northeast trending faults appear to post-date emplacement of the Duke Island ultramafic body. The most significant of these structures is the Hall Cove – Grave Point structure which trends northeast along the trace of Hall Cove. Field relationships suggest this structure has an unknown amount of southeast-side down relative displacement. Ultramafic rocks of the Judd Harbor portion of the complex are exposed between the Bite Cove and Judd Harbor faults suggesting the ultramafic blocks occupy a horst block between the two structures. Copper-nickel-PGE mineralization discovered to date appears to be controlled by northwest trending structures although its relationship to the Hall Cove, Bite Cove and Judd Harbor structures is unknown.
Copper and nickel occurs as chalcopyrite and pentlandite in massive to disseminated pyrrhotite. Sulfide mineralization is primarily hosted in clinopyroxenite as interstitial blebs, pods and net-textured masses. There is little correlation between PGE content and sulfide content. PGE enriched intervals occur in sulfide rich intervals, but there are also numerous sulfide rich intervals with no appreciable PGE content.
Geochemical, geological and geophysical data from the project suggest that sulfide mineralization at Duke Island extends for over 14.5 kilometers along strike and up to 3.8 kilometers across strike with the ultimate dimensions of the system remaining open to expansion. Prior to discovery of significant accumulations of massive, semi-massive and disseminated sulfide mineralization, the mafic-ultramafic intrusive was considered to be a classic zoned Ural-Alaska type complex of mid-Cretaceous age.
Many of the zoned ultramafic complexes in the Koryak-Kamchatka and Southeast Alaska belts are described and mapped as plug or pipe-like, concentrically zoned intrusions, which are dome-like bodies originating from diapiric injection of ultramafic magmas-a type notably absent of economic nickel sulfide occurrences. The copper, nickel and iron contents at Duke Island are significantly elevated relative to most Ural–Alaska complexes. The geometry and the abundance of sulfide mineralization present on the property have many characteristics of layered mafic intrusive complexes. Similar intrusives host some of the world’s largest copper-nickel systems.
- 25 -
Drilling and Exploration
During November and December 2001, we contracted with Layne Drilling to complete 4 diamond drill holes (447 meters, 1,467 feet) in the Marquis zone (Figure 3). The holes were drilled from two drill pads approximately 750 feet apart centered on a coincident rock geochemical and IP geophysical anomaly. The drill targets are associated with a highly conductive IP anomaly flanked by extensive chargeability anomalies to the northeast and southwest. Massive sulfides with highly anomalous copper and lesser nickel and PGE values were encountered in all holes (Table 4.9).
Table 4.9:Significant Drill Results from the Marquis ZoneDuke Is. ProjectDecember 2001
| Hole Number | From Ft | To Ft | Thickness Ft | Cu (Wt Avg ppm) | Pt (Wt Avg ppb) | Pd (Wt Avg ppb) |
| DK0101 | 0 | 298 | 298 | 1,270 | 47 | 59 |
| Includes | 177 | 258.3 | 81.3 | 2,170 | 50 | 64 |
| DK0102 | 4 | 81 | 77 | 2,375 | 64 | 83 |
| DK0103 | 0 | 252 | 252 | 1,328 | 62 | 72 |
| DK0104 | 0 | 188 | 188 | 1,649 | 85 | 130 |
| Includes | 165 | 167 | 2 | 12,500 | 187 | 386 |
In January 2002 Perry Remote Sensing was retained to conduct a preliminary Landsat Thematic Mapping analysis of the Duke Island Prospect. The spectral image of iron-oxide stained sulfide-bearing rocks at the Marquis zone was used for ground truth to determine if surface outcrops of other potentially mineralized areas exist on Duke Island. The TM imagery identified two other obvious targets to the southwest and southeast of the Marquis zone. A total of 43 rock samples were collected in June 2002 in the southwestern TM anomaly, now known as the Monte zone. Approximately fifty percent of these samples (21 samples) returned values in excess of 1,000 ppm copper. Values for Pt, Pd, Ni and Co were generally lower than seen in the Marquis zone with maximum values of 310 ppb, 468 ppb, 784 ppm and 237 ppm, respectively.
In July 2002 AeroQuest Ltd. (“Aeroquest”) flew combined airborne magnetics and 6-channel electromagnetics over the Duke Island Project. A total of 890.5 line kilometers of survey was completed with most of this total along 200 meter-spaced lines. The survey revealed that areas of known sulfide mineralization generally fall within broad zones of anomalous conductivity that extend well beyond the limits of outcropping sulfides. A total of 459 high priority anomalies were identified by Aeroquest, including 311 Type 1 anomalies with positive in-phase response and a distinct, probable hardrock source and 148 Type 2 anomalies with a negative inphase and positive quadrature response (conductive magnetic anomalies).
The largest zone of conductive anomalies occurs on the north side of the Marquis Zone and extends for 2.5 kilometers in an east-west direction. Magnetic and EM data also suggest that gabbroic units extending 1-2 miles to the north-northeast from the summit of Mt. Lazaro are underlain by highly conductive and variably magnetic rocks and that sulfide mineralization may underlie the gabbro body, significantly increasing the size potential of the Duke Island system.
Consulting geophysicist Joe Inman of Salt Lake City, Utah prioritized the airborne EM anomalies and an initial ground follow-up of airborne EM anomalies was begun in September 2003. A total of 45 rock grab samples and 66 shovel soil samples were collected. Sampling was concentrated on the northeast Marquis, Raven and Potato Patch zones. These target areas also exhibit strongly conductive electromagnetic signatures that suggest the presence of sulfide mineralization. Anomalous copper values up to 136 ppm were recovered from soils in the northeast Marquis zone; however, additional soil sampling due east of the Marquis discovery returned highly anomalous copper (to 359 ppm) with grab rock samples returning values up to 984 ppm copper. No previous sulfide mineralization was known from this area and no surface outcrops of sulfide mineralization have been found to explain these soil and rock anomalies.
- 26 -
In addition, the 2003 field work expanded the size of known sulfide mineralization at the Potato Patch zone and also expanded the size of known sulfide mineralization at the Raven zone. Previous work at the Raven zone returned copper values up to 2.2% from a small area of outcrops surrounded by low, swampy topography. Soil sampling completed in 2003 returned copper values up to 4,320 ppm and Pt + Pd values up to 439 ppb from covered swampy terrain immediately south of outcropping sulfide mineralization. Sulfide mineralization at Raven was extended to over 650 meters south of the original Raven discovery outcrops and remains open to expansion in all directions.
During reconnaissance work completed in 2003 a new zone of disseminated copper sulfide mineralization was discovered at tidewater on Cape Northumberland on the extreme southern tip of Duke Island. While copper values (up to 352 ppm) did not reach percent-levels, the Northumberland zone is unique in that it represents the only sulfide mineralization discovered to date which is not located within the NW-SE trending belt of mineralization extending from the East Judd to Raven prospects. The significance of the sulfide mineralization at Northumberland and its extent are unknown.
In late May and early June 2004 Clark Jorgenson of Big Sky Geophysics was contracted to conduct a ground based HCP-EM (Max-Min), magnetometer, and gravimeter survey of the Marquis and Raven prospects. Big Sky completed 20,000 line-feet (6.1 line km) of survey over the Marquis and Raven prospects. Results from this survey indicated three strong Max-Min conductive anomalies, two moderately conductive anomalies, and three weakly conductive anomalies at the Marquis prospect. The strong conductive anomalies are located coincident with the IP resistivity low and with an interpreted dip to the northeast. The weakly conductive anomalies are located to the northeast of the IP anomaly and dip to the southwest. There is an increase in rock density which starts in the western side of the Marquis prospect and trends east toward Knob Hill. At the Raven prospect Big Sky identified two weak Max-Min conductors on the western survey line. These are coincident with relative rock density highs that form two ellipsoids elongated W-E, one centered on the main Raven prospect and the other to the south separated by a density low. The shape and location of the relative density highs are somewhat coincident with the airborne EM conductivity highs and airborne magnetic highs previously identified at the Raven prospect.
In mid June 2005 we contracted Aurora Geosciences to conduct a 48,030 line-feet (14.6 line km) ground based gravimetric survey of the Marquis, Raven, Potato Patch, Scarp, and Lookout prospects along with the Northeast and Far Northeast areas. Results from this survey confirmed the 2004 gravity survey results and the expanded grids revealed local gravity highs in all of the surveyed areas. Local increases in density may reflect significant sulfide accumulation. Gravity field results from each prospect relative to each other show a general increase in the corrected Bouguer anomaly from west to east (-92.4 mgals to -74 mgals) perhaps showing the increasing thickness of the ultramafic package over the modeled feeder for the intrusion at the head of Hall Cove.
During August-September 2005 we contracted Connors Drilling to complete 7 NQ2 core drill holes at the Marquis, Potato Patch, and Raven prospects totaling 4,504 feet. Two holes were collared northeast of holes DK0101 through DK0104 and aimed southwest back toward the Marquis IP anomaly and the previous drill holes in the Marquis prospect. Both holes intercepted semi-massive to massive sulfide at depth in the hole indicating that the sulfide horizon is north dipping.
Hole DK0501 (AZ 225, -60, TD 654) intercepted semi-massive to massive sulfides at 238 feet down hole. This hole intercepted clinopyroxenite from surface to TD. Co and Ni values positively correlate with Cu and S values. Cu:Ni ratios for mineralized intervals averaged 2.17 (Table 4.10) . This hole did not exit mineralization.
Table 4.10:Significant Drill Results from the Marquis, Potato Patch, and Raven prospectsDuke Is. ProjectSeptember 2005
| Hole | From | To | Thickness | Cu | Pt | Pd |
| Number | Ft | Ft | Ft | (Wt Avg ppm) | (Wt Avg ppb) | (Wt Avg ppb) |
| DK0501 | 326 | 425.5 | 99.5 | 2,320 | 68 | 72 |
| Includes | 376 | 394 | 18 | 4,520 | 100 | 111 |
| Includes | 404 | 424 | 20 | 3,625 | 123 | 133 |
- 27 -
| DK0502 | No Significant Intercepts | |||||
| DK0503 | 37.5 | 186.5 | 149 | 2,086 | 5 | 1 |
| DK0504 | No Significant Intercepts | |||||
| DK0506 | 8 | 395 | 387 | 2,035 | 56 | 59 |
| Includes | 33 | 75 | 42 | 3,801 | 331 | 313 |
| Includes | 8 | 92 | 84 | 2,531 | 211 | 219 |
Note: Holes DK0505 and DK0507 were not visibly mineralized and have not been submitted for geochemical analyses.
Avalon Development Corp completed a technical report on the Duke Island project for us in August 2006. The report concluded that mineralization identified at Duke Island had the potential to elevate the Project to one of the most important new discoveries in North America. The report recommended extensive geochemical sampling and geologic mapping of the Monte prospect and other prospective areas. It also recommended a thorough review of all petrological, geochemical and lithologic data to help guide future exploration efforts including a 14,500 foot drilling program with specific exploration holes to test the Marquis, Raven, Scarp, and Lookout targets.
A detailed review of the Duke Island data in 2007 suggested that sulfide mineralization may be related to an elongate sill complex, not a Ural Alaska ultramafic intrusive. The Duke Island complex appears favorable for hosting additional areas of mineralization with possibly higher sulfide concentrations and better metal grades in more basal and more dynamically active portions of the ultramafic contact zones. A low-lying area with essentially no outcrop to the north and east of earlier drilling presented an attractive target where numerous moderate to strong airborne EM conductors remain untested.
We contracted Fugro Airborne Surveys Inc. in early 2008 to conduct a 20-square-mile HeliGeoTEM survey for the identification of new drilling targets on the Duke Island project. The airborne time domain survey defined a strong conductive anomaly with a “wine glass” shaped profile adjoining the Marquis, Far North and Zone A targets. The anomaly is approximately 4,000 feet wide by 5,000 feet long with an additional 2,000 foot extension along the southern edge. The profile axis is oriented northwest-southeast with Zone A located at a position near the “wine glass” base and the Marquis and Zone A targets forming the edges of the “wine glass”.
The southwestern margin of the anomaly corresponds to a thick section of massive to semi-massive sulfides encountered by our past drill holes exploring the Marquis target. Because of the large size of the “wine glass” anomaly, we followed up the program with a surface gravity and natural source audio-magneto telluric (NSAMT) survey for better definition of specific drill targets. The survey also covered other EM anomalies including the Monte, Lookout, Far Northeast and Northeast to identify areas of more massive and possibly higher grade sulfide mineralization. Processing and inversions of the gravity and NSAMT data are in progress.
Future Work Plans
If processing of the surface gravity and natural source audio-magneto telluric (NSAMT) surveys can define a compelling target at Duke Island, the company plans to conduct a limited drilling program when funds are available. A program of 3,000-5,000 feet of core drilling in 2 or 3 deep holes is envisioned for the project to investigate the axis of the wine glass anomaly where modeling is beginning to indicate the potential for a massive sulfide body.
Big Bar, Alaska
Staking of Big Bar
We staked seven 160 acre State of Alaska claims at the Big Bar Volcanogenic massive sulfide prospect in October of 2000 (Table 4.11) . All 40-acre claims located in the Cape Nome Recording District, Alaska.
Table 4.11:List of Quaterra Unpatented Mining ClaimsBig Bar ProjectMarch 2009
- 28 -
| No. | Claim Name | Twnshp | Rng | Sec | Meridian | ADL# |
| 1 | KR1S17W5NE | 1S | 17W | 5 | Kateel River | 637507 |
| 2 | KR1S17W5SE | 1S | 17W | 4,5 | Kateel River | 637508 |
| 3 | KR1S17W4SE | 1S | 17W | 4 | Kateel River | 637509 |
| 4 | KR1S17W4SW | 1S | 17W | 4 | Kateel River | 637510 |
| 5 | KR1S17W4NW | 1S | 17W | 4 | Kateel River | 637511 |
| 6 | KR1S17W9NE | 1S | 17W | 9 | Kateel River | 637512 |
| 7 | KR1S17W9NW | 1S | 17W | 9 | Kateel River | 637513 |
Expenditures to Date
Acquisition costs incurred to December 31, 2008 were $23,575 and exploration expenditures were $728,977 for a total of $752,552. Acquisition costs incurred to December 31, 2007 were $21,632 and exploration expenditures were $728,140 for a total of $749,772.
Location, Access and Infrastructure
The Big Bar property is located 110 miles northeast of Nome, Alaska. The property controls 1,120 acres of State of Alaska mineral rights classified as Open-to-Mineral-Entry in Sections 4, 5, and 9, T.1 S., R.17 W., Kateel River Meridian. Access to the prospect is by helicopter and the nearest improved airstrip is 16 miles to the northwest at Independence on the Kugruk River.
History and Recent Work
The Big Bar claims cover one of the most significant anomalies identified by Anaconda Minerals Company in a stream sediment and soil geochemical reconnaissance survey over a large part of the Seward Peninsula during the period of 1982 to 1984. Several stream sediment samples from the southern Kiwalik Mountain area were found to be anomalous in copper, lead, zinc, gold, cadmium, and arsenic. Soil samples were then collected from the drainage basin to follow-up on the stream sediment anomalies.
During the 1983 field season, Anaconda conducted geologic mapping and a detailed geochemical sampling program on a 3,900 by 3,000 foot soil sample grid. Sample spacing along strike was 330 feet and 165 feet along dip. The program defined a copper anomaly greater than 200 ppm that was over 3,900 feet long and 165 to 330 feet wide. Copper values within this anomaly were locally greater than 1,000 ppm. A zinc anomaly greater than 200 ppm in soils overlaps the copper anomaly to the west but is roughly parallel and displaced downslope from it to the east. The lead soil anomaly (greater than 100 ppm) is irregular and more discontinuous than the copper anomaly. Both the east and west limits of the anomaly are on slopes where downslope migration of surficial materials is to be expected but copper values greater than 200 ppm extended to both the northwest and southeast limits of the sample grid. Gossans collected as float from the anomaly contain up to .06 g/t Au, 1.6 opt Ag, 4260 ppm Cu and 3900 ppm Zn.
The close similarities between the Big Bar prospect and massive sulfide prospects in the Ambler District encouraged a follow-up program by Anaconda in the 1984 field season. Anaconda continued detailed geologic mapping, expanded and tightened the geochemical grid, and completed some reconnaissance geophysical surveys (IP, MAXMIN, EM, gravity, and magnetics). One distinct IP anomaly, coincident with a magnetic high, was identified upslope of the copper anomaly. The Anaconda Minerals Company was dissolved in the spring of 1985 and the mining claims were dropped via non-performance of annual labor.
Geology and Mineralization
Big Bar is a volcanogenic massive sulfide occurrence in an interlayered metavolcanic and metasedimentary sequence that strikes northwest and dips moderately south. The interbedded sequence includes metapelitic schist, white to tan siliceous muscovite schist, and muscovite-quartz-feldspar schist. The felsic schist contains apple green muscovite and up to 50 % feldspar porphyroblasts. The mineralized schists are highly oxidized and limonitic blebs and streaks are common along the foliation. Only a few remnants of pyrite and chalcopyrite are observed at the surface. Exposure is primarily frost-riven rubble although one non-mineralized felsic schist outcrop is present upslope of the defined mineralization.
- 29 -
The metamorphic assemblage that hosts this prospect is peripheral to the Devonian Kiwalik Mountain gneiss. The assemblage appears to contain metatuff and metarhyolite components that resemble lithologies in the Ambler district of the southern Brooks Range. The metavolcanic-bearing assemblage of the Kiwalik Mounatin area has only locally been separately mapped along Independence Creek. This assemblage flanks Kiwalik Mountain to the east, south, west and northwest. The prospect is highly oxidized. Quartz-sericite-pyrite alteration may be present in unoxidized parts of the prospect.
Exploration and Drilling
We staked the Big Bar prospect in August, 2000 and initiated field work the following field season with surface reconnaissance, sampling and a gravity geophysical survey conducted by Allan Spector and Associates Ltd. of Toronto, Canada. The survey collected gravity data on 200 foot intervals along four NW-SE oriented lines 400 feet apart and extending across the anomalous area defined by Anaconda. The survey delineated 3 high density zones, including two zones that correlated to higher copper geochem values and anomalous magnetics.
During the second quarter of 2006, we conducted a three-hole, 1,470 foot core drilling program to test a strike length of approximately 1000 feet near the center of the geochemical anomaly at Big Bar. The holes intersected uneconomic zones of disseminated pyrite and stringer sulfides but no massive sulfide mineralization.
Our initial phase of drilling examined only a small portion of the Big Bar anomaly. The geology of the drilled section suggests a good environment for massive sulfide mineralization, but does not give a clear indication of where the sulfides may have accumulated. To evaluate the possibility of massive sulfides at depth or in adjacent areas, we contracted Fugro Airborne Surveys Corp. in September 2006 to conduct an 85-line mile airborne EM-magnetometer survey covering an area of 15.5 square miles centered over the geochemical anomaly.
Future Work Plans
Future plans for work on the Big Bar project will be based on the results of a field check of a number of anomalies identified by airborne EM survey. The work will consist of geochemical sampling and a review of possible outcrops in the area to determine if additional work is merited on the property.
Principal Property Interests In Mexico
Nieves Silver Project, Mexico
Acquisition of Nieves
No modern exploration took place until 1994, when a Kennecott/RTZ study of satellite photos noted a color anomaly covering an area approximately 9 kilometers in diameter. Effective January 16, 1995, Kennecott Exploration Company (“Kennecott”) entered into an option agreement with the Mexican concessionaires that allowed Kennecott to explore and acquire the Property by making specified option payments over five years. Kennecott subsequently completed geophysical surveys and drilled eight holes, six of which contained significant silver mineralization.
On March 13, 1998, Kennecott Exploration Company transferred its rights under the Nieves option to Western Silver Corporation (“Western”) in consideration for an uncapped 2% net smelter return royalty (“NSR”) on certain core Claims and a 1% NSR royalty on others. Western completed an additional five holes at the La California vein, all of which hit significant narrow widths of silver with 3 containing at least one narrow intercept of +800 g/t silver. Western subsequently assigned its rights to the Nieves Project as specified in the “Underlying Agreement” to the Company on March 26, 1999, in consideration for 1,444,460 common shares of the Company at a deemed price of CAD$0.20 per share (CAD$288,892). In addition, the Company issued 360,000 common shares at a deemed price of CAD$0.20 per share (CAD$72,000) to the concessionaires in lieu of the US$50,000 option payment otherwise due under the terms of the Underlying Agreement.
On April 10, 2003, the Company completed a US$1.5 million limited partnership financing with Blackberry Ventures I, LLC (“Blackberry”), whereby Blackberry could earn a 50% interest in the Property by funding two exploration programs of US$750,000 each. The initial payment of US$750,000 received in the 2003 Fiscal Year was expended on a 5,300-metre drill program on the Nieves Property. During the 2004 Fiscal Year, Blackberry elected to continue by advancing a further US$750,000 towards a follow-up drill program completed in May 2005, thereby earning a 50% interest in the Property. The partners signed a joint venture agreement in January 2006 and have jointly contributed to all exploration costs subsequently incurred.
Expenditures to Date
Since inception to December 31, 2008, the Company had incurred $1,355,726 for acquisition costs and $1,734,890 for exploration expenditures giving a total of $3,090,616 for its 50% interest in Nieves. The Company’s joint venture partner, Blackberry had spent, including the Company’s administration fee, US$3,183,951 for its 50% interest in Nieves.
Since inception to December 31, 2007, the Company had incurred $1,302,933 for acquisition costs and $1,102,956 for exploration expenditures giving a total of $2,405,889 for its 50% interest in Nieves. The Company’s joint venture partner, Blackberry had spent, including the Company’s 10% administration fee, US$2,229,172 for its 50% interest in Nieves.
Location, Access and Infrastructure
The Nieves property is located in Zacatecas State, Mexico, approximately 150 kilometres northwest of the state capital of Zacatecas and 90 kilometres north of Fresnillo, Mexico’s largest silver mine. The Nieves property lies within the Mexican Altiplano or “Mesa Central” region. This region is flanked to the west by the Sierra Madre Occidental and to the east by the Sierra Madre Oriental mountain ranges. The Altiplano in this region is dominated by broad alluvium filled plains between rolling to rugged mountain ranges and hills reaching up to 3000 meters above sea level. The property has excellent road access with the main paved highway to Nieves running along the northern portion of the Property.
- 30 -
Nieves is the business centre for the Quaterra exploration activities. The nearest major population and services centre to Nieves is the mining town of Fresnillo. Fresnillo offers a substantial professional work force experienced in mining and mining related activities in addition to most other supplies and services. Access to Fresnillo and to the nearest international airport in Zacatecas is via paved highway. There is a power line adequate to support a 100 tonne per day mill in place and an existing mill structure on the Property at the Santa Rita vein area which may be refurbished. There are two operating smelters within 350 kilometres of the property.
History and Recent Work
Quaterra and its equal partner, Blackberry Ventures 1, LLC, completed 30 holes totaling 16,367 meters between 2004 and 2006. An independent technical report completed in November 2006 recommended a 10,000-meter drilling program to infill zones along the Concordia-San Gregorio vein system and to test other targets on the large land block. A 16-hole, 5,388.8-meter drilling program, primarily consisting of infill holes on the Concordia vein, was completed between September and December 2007.
The partners completed a 24 core hole drilling program totaling 6,173 meters from May to August 2008 which was successful in defining both high-grade vein and potential bulk-mineable silver mineralization along the Concordia vein system over a horizontal distance of 400 meters, a depth of 150-200 meters and an average true thickness of 40 meters. These holes, in combination with previous holes completed by the joint venture, provide approximately 50-meter drill coverage both along strike and down dip on a 400 meter section of the Concordia vein. True thicknesses are about 80% of intercept widths reported.
All holes contained significant mineralization except QTA-60. Hole QTA-65, drilled 50 meters east and 50 vertical meters above hole QTA-48 (47.48 meters averaging 142 g/t silver, including a 4.67 meter interval with 777 g/t silver), intersected 42.35 meters beginning at 62 meters averaging149 g/t silver, including 4.12 meters averaging 743 g/t silver. Hole QTA-74, drilled 50 meters east and about 100 vertical meters below the QTA-55 intercept, cut 38.00 meters averaging 157 g/t silver, including a 3.9 meter intercept averaging 581 g/t silver.
The Concordia vein system represents a series of sub-parallel veins and veinlets that have been defined by mapping and drilling over a strike length of 1,100 meters. The area of mineralization which the joint venture has drilled is open to the east and west.
Geology and Mineral Deposits
The Nieves project occurs within a northwest trending mineral belt known as the Faja de Plata, which hosts many of the world’s premier silver deposits. Silver mineralization on the Nieves property is best classified as low-sulphidation epithermal mineralization. There are three west-southwest bearing, steep south-dipping vein systems which, from south to north, are the Santa Rita-El Rosario; Concordia-Delores-San Gregorio; and the La California veins. The Santa Rita and Concordia-Delores-San Gregorio veins have historic production and are marked by numerous shafts, pits, dumps and old buildings. Mining ceased in 1910, with the onset of the Mexican Revolution. Several small-scale efforts to re-open the mines occurred thereafter but no modern exploration took place until 1994. Historic production focused on narrow bonanza veins, and production grades were in excess of 4,000-g/t silver.
The mineral occurrences in the Santa Rita and Concordia-Delores-San Gregorio veins are hosted in two to ten meter thick shear zones with reverse offset and secondary fault splays in the footwall. The sheeted < 2 meter wide silver-gold bearing veins were deposited during a period of distention and normal offset in Oligocene time. There are three types of veins: silica breccia, quartz-sulfide and ferroan carbonate. Sulfide content varies from minor to 50% pyrite-stibnite-sphalerite-chalcopyrite-galena; marcasite is present in the silica breccia veins. Identified silver minerals are tetrahedrite-pyrargyrite. A sulfidation alteration halo of 2-5% disseminated pyrite that weathers to an acid leached “bleached” white clay alteration surrounds the mineralized shears. This alteration is geochemically anomalous in gold-arsenic-antimony with erratic silver-copper-lead-zinc. An Eocene-Oligocene paleo-erosion surface in the northwest corner of the district indicates that the historic mines have exploited only the upper third of the epithermal mineral system.
- 31 -
The Concordia-Cerro San Gregorio zone, based on alteration and geophysics, has dimensions of 2.5 kilometers by 1.5 kilometers and generally trends northeasterly. La California zone is about 2.5 kilometers long by 250 meter wide. The Santa Rita zone also trends northeasterly and is approximately 2 kilometers long by 600 meters wide.
Exploration and Drilling Results
On March 2, 2009, the Company and 50% joint-venture partner Blackberry Ventures 1, LLC, announced that Caracle Creek International Consulting Inc. of Toronto, Canada, had completed a NI43-101 compliant independent resource estimate for its Nieves silver property in northern Zacatecas, Mexico.
Estimated mineral resources1Concordia vein system, Nieves Property
| Category | Tonnes | Ag (g/t) | Au (g/t) | Ag (oz2) | Au (oz2) |
| Indicated | 2,897,571 | 110.231 | 0.126 | 10,269,203 | 11,701 |
| Inferred | 2,256,596 | 96.562 | 0.115 | 7,005,797 | 8,373 |
1) Prepared by Michelle Stone, P.Geo., Caracle Creek International Consulting Inc., an independent Qualified Person within the meaning of NI 43-101, using a reporting cut-off grade of 60 g/t Ag. The resource model was developed using Gemcom Surpac (v6.1).2) 1 troy ounce = 31.103 grams.
The Nieves property has an initial indicated resource of 2.9 million tons averaging 110.2 g/t silver and containing 10.26 million ounces of silver. An inferred resource of 2.3 million tons averaging 96.6 g/t silver contains an additional 7.0 million ounces of silver. A summary of indicated and inferred resources at various cutoff grades is shown in Table 1-1.
The Caracle Creek report concludes that the resource displays strong continuity along strike and down dip and that mineralization continues beyond the extent of current drilling. The report recommends additional drilling to the west and east along the Concordia vein at a drill spacing of 100 metres or less to expand the mineralization and closer spaced drilling on 10-20 metre centres to define the extent of high grade mineralization (+500 g/t silver).
The data and methodology utilized for the resource estimate is as follows:
The resource model has been generated from a database containing a total of 44 diamond drill and 2 reverse circulation holes collared from the surface. Drill holes were oriented to intersect the mineralized zone at a spacing of 50-60m down to approximately 250m depth. Below this depth drill hole spacing is irregular. All drilling was conducted from the hangingwall side of the Property and planned to intersect perpendicular to the orientation of the mineralized domain.
Drill hole samples were analyzed for silver and gold at ALS Chemex in Vancouver. All sample results were monitored with an appropriate QA/QC program. Bulk density was measured on core and pulp samples through the mineralized zone by ALS Chemex.
The zone which hosts the mineralization at Nieves has been interpreted using a combination of geological information and sample grade results in the drilling data. This “mineralized domain” includes thin, discrete hangingwall and footwall veins in addition to the Concordia vein and strikes approximately 250° for a distance of approximately 835m, dips -65º to the south and extends to a depth of at least 900m. The thickness of the mineralized domain ranges from several metres to approximately 80m, with an average thickness of about 20m (true). The mineralized domain is open to the east, west and down dip.
Sample data was composited to 2m intervals. The presence of potential outlier sample data was evaluated and appropriate top cuts were applied for silver (371.2 g/t) and gold (0.4175 g/t). The grade of blocks measuring 10m by 5m by 2m were estimated using inverse distance squared.
A technical report on the Nieves Property will be filed with SEDAR.
- 32 -
Table 1-1Estimated mineral resources1Concordia vein system, Nieves Property
| Ag range (g/t) | Classification | Tonnes | Ag (g/t) | Au (g/t) | Ag (oz2) | Au (oz2) |
| 0.0 -> 15.0 | Indicated | 133,189 | 8.348 | 0.046 | 35,749 | 198 |
| Inferred | 1,477,235 | 8.074 | 0.050 | 383,484 | 2,365 | |
| 15.0 -> 30.0 | Indicated | 326,164 | 22.400 | 0.071 | 234,901 | 748 |
| Inferred | 2,988,093 | 22.790 | 0.049 | 2,189,450 | 4,714 | |
| 30.0 -> 60.0 | Indicated | 863,267 | 46.909 | 0.082 | 1,301,973 | 2,270 |
| Inferred | 4,587,616 | 44.857 | 0.063 | 6,616,366 | 9,240 | |
| 60.0 -> 90.0 | Indicated | 1,258,964 | 74.543 | 0.101 | 3,017,304 | 4,084 |
| Inferred | 1,275,489 | 72.304 | 0.100 | 2,965,086 | 4,102 | |
| 90.0 -> 120.0 | Indicated | 754,187 | 103.125 | 0.123 | 2,500,575 | 2,990 |
| Inferred | 507,865 | 103.329 | 0.122 | 1,687,208 | 1,998 | |
| 120.0 -> 150.0 | Indicated | 388,788 | 134.132 | 0.144 | 1,676,647 | 1,799 |
| Inferred | 250,484 | 134.991 | 0.136 | 1,087,134 | 1,092 | |
| 150.0 -> 300.0 | Indicated | 480,704 | 188.975 | 0.175 | 2,920,646 | 2,709 |
| Inferred | 221,639 | 176.033 | 0.164 | 1,254,409 | 1,171 | |
| 300.0 -> 500.0 | Indicated | 14,927 | 320.946 | 0.258 | 154,029 | 124 |
| Inferred | 1,117 | 332.728 | 0.280 | 11,949 | 10 |
| |
|
Las Americas – Mirasol, Mexico
Land Acquisition at Mirasol –Americas-Tecolotes Project
Quaterra’s Mexican subsidiary, Minera Agua Tierra, is the 100% owner of thirteen concessions totaling 82,926 hectares (320.18 square miles) that were staked in 2006 and 2007. The project initially consisted of two separate land blocks until mapping in 2008 suggested that the open area between Americas and Mirasol was also prospective. The intervening area was staked forming one land block.
The Tecolotes concession consists of 11,181 hectares and is a joint venture announced on September 30, 2008 between Quaterra and EXMIN SA de CV, a subsidiary of EXMIN Resources Inc. Under the terms of the agreement, Quaterra may earn a 75% interest in the concession by spending US$500,000 in exploration and making annual payments to EXMIN totaling US$100,000 over a four year period.
Expenditures to Date
Acquisition costs incurred to December 31, 2008 were $349,961 and exploration expenditures were $1,679,426 for a total of $2,029,387. Acquisition costs incurred to December 31, 2007 were $314,742 and exploration expenditures were $367,322 for a total of $682,064
Location, Access and Infrastructure
The Mirasol and Americas projects are located in the Municipality of Simon Bolivar, Durango, Mexico, about midway between the cities of Durango and Torreon in the central part of the Mexico Silver Belt or Faja de Plata. Mirasol is located on the SW margin of the Ahuichila graben, a distensional tectonic feature that formed in Eocene time.
History and Recent Work
In 2007, a 1:5,000-scale geologic map of the original Mirasol and Cerro Concessions identified a seven by five kilometer area of silicified and brecciated limestone with quartz-calcite veinlets and accessory fluorite-alunite-stibnite-cinnabar. A 5,050-meter, 38-hole RC “scout” drill program was completed late in 2007 to test the large alteration area at depth and probe for potential feeder zones. None of the holes intersected significant mineralization.
In the fourth quarter of 2008, six widely spaced reconnaissance core holes totaling 2,515 meters were completed at the Las Americas prospect to evaluate a series of northwesterly striking epithermal quartz veins.
One of the holes contained significant silver mineralization. Hole AMD-3 intersected 32 meters of 28 g/t silver in the Marimar vein beginning at a depth of 80 meters, including 2.5 meters averaging 222 g/t silver (8.2 feet averaging 6.5 oz/ton). The Marimar vein is 300 meters east of the other known veins and surrounded by post-mineral alluvium.
In addition, continued mapping and sampling in the Mirasol concession, which is adjacent to Americas, identified a new gold prospect at Loma Aguila. A low-lying zone of silicified limestone outcrop and rubblecrop covering an area of about 100 meters by 150 meters in the midst of a flat alluvial plain contains anomalous to ore-grade gold mineralization, with 31 of 139 rock chip samples (22%) containing gold values greater than 0.1 ppm gold. Six samples contain greater than 1 g/t gold including a high value of 2.78 g/t. The showing is interpreted to be part of a hydrothermal feeder vent at a deeper erosional level than other mineralized showings in adjacent areas.
- 33 -
Geology and Mineral Deposits
The Mirasol prospect consists of a gently dipping sequence of Cretaceous limestone overlain by Eocene Conglomerate and Miocene andesite to rhyodacite tuff to the south. A 1:5,000-scale geologic map of the original Mirasol and Cerro Concessions completed in 2007 identified a seven by five kilometer area of silicified and breciated limestone with quartz-calcite veinlets and accessory fluorite-alunite-stibnite-cinnabar.
The Americas prospect is in the far west portion of the Mirasol concession and is an extension of Hecla Mining’s San Sebastian hydrothermal system. The property encompasses an elongate, northeasterly-trending zone of hydrothermally altered rhyodacite and several large white silica “crestones” or veins that are up to 30 meters in width and outcrop up to a kilometer along strike. There are numerous old mercury mines with ruins, dumps and open pits up to 40 meters wide, 75 meters long and 25 to 35 meters deep. The mercury occurs in both the oxidized altered rhyolite as native mercury and in the white silica as finely disseminated cinnabar.
Future Plans
Additional mapping, sampling and geophysical surveys are planned for both the Americas and Mirasol prospects, with drilling tentatively scheduled to begin in the second half of 2009.
Los Crestones
Staking of Crestones
In 2003, the Company staked 2,100 hectares at Crestones and in 2006 staked an additional 3,547 hectares.
Expenditures to Date
Acquisition costs incurred to December 31, 2008 were $84,334 and exploration expenditures were $1,392,870 for a total of $1,477,204. Acquisition costs incurred to December 31, 2007 were $78,097 and exploration expenditures were $1,368,426 for a total of $1,446,523.
Location, Access and Infrastructure
The exploration concessions are located on the southwest side of a medium sized granitic pluton on the eastern edge of the Sierra Madre Occidental in northern Durango state of west-central Mexico (Figure 2). The Property is between the latitudes of 25.92° and 25.96° north and 105.09° and 105.13° west longitude. The town of Inde is about 10 kilometers to the southwest of the property while the larger town of Santa Maria del Oro is located about 20 kilometers to the northwest. The city of Durango is a five hour drive to the south. Access to the Property is very good with a paved highway from Santa Maria del Oro, through Inde and on to the town of Vetarron, 2km more on dirt road leads to the turn off to El Pajaro, another 7km to the north and on the edge of the property. A local dirt road gives access to most of the property. Electric power lines service all the small towns mentioned above.
History and Recent Work
Between 2004 and 2006, detailed mapping and sampling programs were completed. The work delineated a hot spring gold-silver target with widespread silicification, flat-lying silica sinter aprons and quartz veining along high-angle, graben faults. Rock chip samples show anomalous Au-Ag values with occasional spikes up to ore grade; and strongly anomalous mercury, arsenic and antimony values which are typical of the upper levels of hot spring-related gold silver mineral systems. The level of exposure is clearly above the boiling zone and the gold numbers are consistent with those found in the top of epithermal gold systems.
The Company completed a thirteen hole 6,163.4 meter core drilling program during 2007. Six holes totaling 3,043.4-meters were completed during the second quarter. An additional seven holes totaling 3,120 meters were completed during the third quarter. The first six drill-holes of the program did not intersect the targeted breccia feeder vents; the second phase of the program produced similar results with only a few low-grade mineralized intercepts within the hydrothermal breccia. Weakly disseminated sphalerite-galena-sulfosalts occur in silicified limestone, quartz porphyry, and hornfels. The silica breccia commonly contains minor to 5% disseminated pyrite-marcasite and minor to 5% stibnite. The mixed clast and silicified limestone breccias contain disseminated pyrite-marcasite and minor sphalerite-galena. Coarse sphalerite-galena has been observed in fault gouge.
Geology and Mineral Deposits
Crestones displays geologic characteristics that are broadly similar to both the Magistral de Oro district, located 20 kilometers northwest and the Inde District that lies 12 km west. Magistral de Oro has a recorded production of greater than 1.0 million ounces gold and the Inde district has produced 0.5 million ounces of gold from one mine as well as significant silver-lead-zinc production from numerous small mines. All three districts have prominent aeromagnetic highs that represent oxidized intermediate to felsic intrusive stocks. The mineralization in all three districts is interpreted to be genetically related to these intrusives. Granodiorite is the host rock at Magistral de Oro. Bufa Inde, a prominent peak in the center of the Inde District, is a quartz porphyry stock. Both granodiorite and quartz porphyry occur at Los Crestones.
Future Work Plans
Exploration at Crestones is complicated by the fact that a series of listric faults have offset the entire hydrothermal system to the northeast for an undetermined distance. Possible additional exploration is dependent on receiving title to two adjacent claims at Inde. When this occurs the area will be mapped and if the results are encouraging, an IP survey may be carried out in the alluvium filled valley between Crestones and Inde to look for the downward continuation of Crestones mineral system.
Wassuk Project, Nevada
| ||
|
- 34 -
Other Properties
Our other properties, include thelisted by commodity, include:
Copper +/- gold: Yerington District (Wassuk), Reveille, Goldfield East and Poker Brown in Nevada; SW Tintic Gray Hills, Peg Leg, Carbon County, Herbert Glacier,in Utah.
Gold +/- silver: Central Mexico (Americas/Mirasol, Jaboncillo, Onix, Azafran, Tian, Lupita, Almoloya);
Molybdenum: Cave Peak, Copper Canyon, Majuba HillTexas;
Uranium: Tidwell, Sinbad, and Willow Creek properties in the USA,Shootaring, Utah and Las Americas, Jaboncillos, Cerro Blanco, Inde and La Reforma properties in Mexico. Each of these properties are newly acquired and all are in the initial stages of exploration. Basin, Wyoming;
Data from prior activities is limited or in the process of being acquired and studied. OurThe Company’s total expenditures to date with respect to these other properties arehave been minimal.
ITEM 4A. UNRESOLVED STAFF COMMENTS
None.
- 48 -
ITEM 5. OPERATING AND FINANCIAL REVIEW AND PROSPECTS
The information in this section is presented in accordance with Canadian GAAP.International Financial Reporting Standards, (“IFRS”) as issued by International Accounting Standards Board. The following discussion of our financial condition and results of operations for the fiscal years ended December 31 2008, 2007 and 2006 and should be read in conjunction with our consolidated financial statements and related notes included in Item 17 of this annual report including Note 16 which contains a reconciliation to US GAAP.report.
Critical Accounting Estimates
The accounting estimates believed to require the most difficult, subjective or complex judgments, and which are the most critical to our reporting of results of operations and financial position, are as follows:
Mineral Properties
We capitalize all costs related to the acquisition and exploration of mineral properties on a property by property basis, net of recoveries until such time as these mineral properties are placed into commercial production, sold or abandoned. If commercial production is achieved from a mineral property, the related deferred costs will be amortized prospectively on a unit-of-production basis over the estimated life of the ore reserves. If a mineral property is abandoned, the related deferred costs are written down and expensed. From time to time, we may acquire or dispose of all or part of the mineral property interests under the terms of property option agreements. As such options are exercisable entirely at the discretion of the optionee, option payments are recorded as property costs or recoveries when paid or received.
Long-lived assets, such as equipment and deferred exploration, are reviewed for impairment at each reporting period or more frequently as economic events indicate that the carrying amount of an asset may not be recoverable.
On an ongoing basis, we evaluate each mineral property for potential impairment based on results obtained to date to determine the nature of exploration, other assessment and development work, if any, that is warranted in the future and the potential for recovery of the deferred costs. If there is little prospect of future work on a property being carried out within a three-year period from completion of previous activities, the deferred costs related to that property are written down to the estimated amount recoverable unless there is persuasive evidence that an impairment allowance is not required.
- 35 -
Stock-based Compensation Expense
From time to time, we may grant share purchase options to directors, officers, employees and consultants. We use the Black-Scholes option pricing model to estimate the fair value for these options. This model, and other models which are used to value options, require inputs such as expected volatility, expected life to exercise and interest rates. Changes to any of these inputs could cause a significant change in the stock-based compensation expense charged in a period.
Convertible NotesFair value of derivative liabilities
Convertible notes are classified as debt until converted to equity. Debt instruments issued with detachable warrants would be allocated to a debt and equity component based on relativeThe fair value of each component. Aderivative liabilities that are not traded in an active market is determined by using a valuation technique. Management makes estimates and utilizes assumptions in determining the fair value is assigned tofor share-based payments, warrants, and the conversion feature only if(gain) loss on the effective conversion rate is less than the market pricerevaluation of the common stock at the commitment date.derivative liability;
Income Taxes
We useIncome tax comprises current and deferred tax. Income tax is recognized in net income (loss), except to the liability method which takes into account the differences between financial statement treatment and tax treatment of certain transactions, assets and liabilities. extent related to items recognized directly in equity or in other comprehensive loss.
Deferred tax assets and liabilities areis recognized for the future tax consequences attributable toin respect of temporary differences arising between the financial statement carrying amountstax bases of existing assets and liabilities and their respectivecarrying amounts in the consolidated financial statements. Deferred tax bases. Valuation allowancesis determined on a non-discounted basis using tax rates and laws that have been enacted or substantively enacted by the reporting date and are establishedexpected to reduceapply when the deferred tax asset or liability is settled. Deferred tax assets when thereare recognized to the extent that it is potentialprobable that some or all of the assets will notcan be realized. Estimates of future taxable income and the continuation of ongoing prudent tax planning arrangements have been considered in assessing the utilization of available tax losses. Changes in circumstances and assumptions and clarifications of uncertain tax regimes may require changes to the valuation allowances associated with our future tax liabilities.recovered.
- 49 -
A. Operating Results
Year ended December 31, 2008 compared to year ended December 31, 20072013 versus 2012
For the year ended December 31, 2008, we2013 (“2013”), the Company reported a net loss of $6,834,181$28,817,916 compared to a net loss of $7,303,204$4,853,976 for prior year, the previous year. The decreased loss in 2008 wasdifferences are mainly attributabledue to the decreased stock-based compensation expenseimpairments for mineral properties in the United States and central Mexico plus unrealized non cash fair value gain on derivative liabilities and loss on disposal of $2,958,838mineral properties. To preserve cash, the Company has reduced its general administration and corporate activities, and focused on supporting its exploration and development activities in 2008 compared $4,502,163 in 2007, offset by changes in foreign exchange gains and losses.its Nevada copper assets. Other general fluctuations are discussed below:
Exploration Costs
Exploration costs represent expenditures to undertake and support exploration activities on our properties. If they do not have characteristics of property, plant and equipment, they are expensed as incurred. Exploration costs charged to operations during 20082013 were $633,741$67,448 compared to $229,334$182,852 for the prior year resulting from a reduced exploration activity level in Mexico.
General Administrative Expenses
General administrative expenses include overheads associated with administering the Company’s regulatory requirements and supporting the exploration activities.
Other and Non-Cash Items
- 50 -
Gain (loss) on sale of mineral property: On September 19, 2013, the Company sold three properties in central Mexico to Goldcorp for US$375,000 plus applicable taxes. At the date of disposal the total capitalized exploration expenditures for these three properties were $3,225,818 which was written down to nil and resulted in a loss on disposal of $2,774,114. In October 2012, the Company sold its Butte Valley copper project to Freeport for US$2,000,000, and realized $820,712 gain. In July 2013, the Company received an additional US$1,000,000 ($1,038,000) from Freeport as a contingent bonus from the sale of Butte Valley. | ||
General exploration costs: These costs represent expenditures to undertake and support exploration activities on the Company’s properties, including costs incurred prior to the Company obtaining the rights to the mineral properties. In addition, if the expenditures are deemed not to be specifically related to individual properties or not recoverable, they are expensed as incurred. | ||
Impairments: due to the current market condition, the Company has abandoned inactive non-core mineral properties so as to focus its effort and resources in its copper properties in the Yerington District. As a result, $26,212,984 impairments were recorded in the year ended December 31, 2013. In 2013, management assessed the Company’s ability to continue exploration activities on all of its mineral properties and made a decision to focus exploration efforts only on certain key properties and allow other claims to lapse. Accordingly, the following mineral properties were fully impaired to net loss: | ||
| (i) | Uranium properties – $12,589,114 | |
| (ii) | Missouri Flat – $117,860 | |
| (iii) | Copper Canyon – $576,533 | |
| (iv) | All Mexico properties other than Nieves – $12,929,477. | |
Interest income (expenses): interest earned varies based on the timing, type and amount of equity placements and resultant fluctuations in cash. The interest expense in 2013 was related to the unsecured loans from the Company’s Chairman. As of December 31, 2013, US$600,000 remained unpaid. On March 18, 2014, the loans were converted to a demand basis with a 40-day notice period. | ||
2012 versus 2011
For the year ended December 31, 2012, we reported a net loss of $4,853,976 compared to a net loss of $11,264,539 for the previous year. The decreased loss in 2012 was mainly attributable to $4,183,224 impairments and $2,846,707 stock-based compensation recorded in 2011. Other general fluctuations are discussed below:
Exploration Costs
Exploration costs represent expenditures to undertake and support exploration activities on our properties. If they do not have characteristics of property, plant and equipment, they are expensed as incurred. Exploration costs charged to operations during 2012 were $182,852 compared to $506,297 for the prior year resulting from an increase in the consideration of potential properties in Mexico.
General Administrative Expenses
General administrative expenses include overheads associated with administering and financing our exploration activities.
General administrative expenses were $3,700,226$3,371,294 (excluding stock-based compensation and amortization), an increase of $1,653,411$329,884 compared to $2,046,815$3,701,178 in 2007.2011. The higher costs in 2011 resulted from the increased support required for advancing the MacArthur and Uranium mineral properties including the retention of additional personnel, the rising regulatory costs associated with increased regulatory requirements in Canada and the United States, and general and administration expenditures to support our expanded operations.
- 3651 -
Investor relations and communication increased $103,283 from $324,214 in 2007 to $427,497 in 2008 resulting from higher road shows, trade shows and conferences in 2008.
Regulatory and transfer agent fees increased $66,680 from $147,674 in 2007 to $214,354 in 2008 resulting from US regulatory filing fees pursuant to the listing of our common sharestravel expenses provision accrued in the United States.
Salariesprior years and benefits increased by $186,005 from $263,544 in 2007 to $449,549 in 2008 resulting from added personnel in the US subsidiary and increased benefit coverage for US employees.
The increases were partially offset by reduced travel expenses.
Other and Non-Cash Items
Interest income reduced by $193,129 from $248,684 in 2007 to $55,555 in 2008 due to lower average cash balances
5% fee on expenditures on its central Mexico properties under the Goldcorp IFA agreement.
We charge a 10% administration fee
Interest and financingCompany’s properties, including costs wereincurred prior to the Company obtaining the rights to the mineral properties. In addition, if the expenditures are deemed not to be specifically related to the convertible notes issued in November and December 2008.
Stock-based compensation decreased by $1,543,325 from $4,502,163 in 2007 to $2,958,838 in 2008 primarily due to the vesting provision for the 2008 grant. individual properties or not recoverable, they are expensed as incurred.
Amortization: increased by $34,714 from $43,309 for 2007 to $78,023 for 2008. This is due to the purchase of computers and vehicles held in a subsidiary.
Year ended December 31, 2007 compared to year ended December 31, 2006
For the year ended December 31, 2007, we had a net loss of $7,303,204 compared to a net loss of $3,830,534 for the year ended December 31, 2006. Stock based compensation was $4,502,163 for 2007 (2006: $3,045,004) as additional stock options were granted and expense recognized accordingly. Removing the stock based compensation results in a net loss of $2,801,041 for 2007 and $785,530 for 2006.
The increase of $2,015,511, in the net loss for 2007, excluding stock based compensation can be explained as follows:
Administration and office expenses costs increased by $100,480 from $221,940 for 2006 to $322,420 for 2007. This is due to an increase in administration fees of Manex Resource Group Inc. from $5,000 to $10,000 per month from January to October and decreased to $8,000 per month in November and December and increased activity in respect to the day to day running of our company.
Consulting services increased by $366,541 from $105,815 for 2006 to $472,356 for 2007. This is increase is due to the contract of consultants in respect to compliance with the Sarbanes-Oxley act (“SOX”) necessary for listing on Amex. There was also an increase in activity in respect to the day to day running of our company and the commissioning of consultants for exploration purposes.
- 37 -
Investor relations and communications costs increased by $163,834 from $160,380 for 2006 to $324,214 for 2007. This is due to the fees paid during 2007 to O & M Partners to provide investor relations as well as the attendance by our management at several trade shows and the upgrade of the promotional booth and literature for these conferences and the production and distribution of the Annual General Meeting (“AGM”) brochure in 2007
Professional fees increased by $160,214 from $139,712 for 2006 to $299,926 for 2007. This is due to increased legal, accounting and auditing expenses of our increased activity as a result of being a U.S. reporting company with shares listed on the NYSE Amex starting in 2008.
Regulatory fees and transfer agent fees increased by $115,384 from $32,290 for 2006 to $147,674 for 2007. This is due to increased in TSX.V filing fees for a publicly listed company, which is based on the issued and outstanding share capital and a timing difference in the payment of these fees.
Salaries and benefits costs increased by $202,560 from $60,984 for 2006 compared to $263,544 for 2007. This increase is due to the increased remuneration of our President in 2007.
Travel and promotion costs increased by $96,319 from $71,679 for 2006 to $167,998 for 2007. This is due to the increased travel of the VP Exploration as well as increased travel by other consultants to inspect and report on potential newfive properties in the United States. ThereStates totaling $4,183,224 was also an increase in travel for trade shows, and meetings with analysts and other prominent industry experts.
Other and Non-Cash Items
Interest income increased by $162,696 from $85,988 for 2006 to $248,684 for 2007. This iswritten down due to considerably larger average cash balances maintained by us in 2007 following financings.
We reported a net foreign currency losslack of $778,126 for 2007 compared to a gain $79,449 for 2006.
Significant current assetsexploration merit. The Company conducted impairment test and liabilities held in US dollarsconcluded no impairment write-down was required as atof December 31, 20072012.
A Joint Venture administration fee of $47,859 was received for 2007 comparedthe losses of two vehicle s in Mexico in 2011. $38,525 was written off in 2011 due to $542,975 in 2006. This is reflectiveone of the increased work performed on the joint venture in 2007 compared to 2006.
Amortization costs increased by $33,318 from $9,991 for 2006 to $43,309 for 2007. This is due to the purchase of fixed assets and the depreciation of these assets.
B. Liquidity and Capital Reserves
We have limited financial resources and finances our operations by raising capital inAs at March 24, 2014, the Company has cash of $700,000 including the funds received from the uranium sale. The Company is considering alternative ways to raise funds including equity markets. We will need to rely onfinancing or the sale of such securities and/or enter intothe optioning of its mineral property interests via joint venture agreements with third parties to provide working capital and to finance ourits mineral property acquisition and exploration activities. The Company continues to take steps to minimize costs including reduction in management remuneration. Since we dothe Company does not generate any revenue from operations, ourits long-term profitability will be directly related to the success of ourits mineral property acquisition, divestment and exploration activities.
On November 27March 14, 2014, the Company closed a transaction to sell its uranium properties and December 19, 2008, we closedassets located in the firststates of Arizona, Utah and second tranchesWyoming for gross proceeds of $500,000.The transaction provides working capital and will free-up time and resources for the Company to focus on its Yerington-district copper properties.
On September 13, 2013, the Company announced the closing of a private placement of units comprising one convertible promissory note (“Notes”) and one common share purchase warrant for gross proceeds of US$2,619,673. The Notes bear interest at a rate of 10% per annum maturing 24 months from date of issuance or upon conversion or redemption.
At2,981,000. Details please refer to note 8 in the audited consolidated financial statements for the year ended December 31, 2008, we had a working capital deficiency2013. Among the total share issue costs of $504,419 compared$106,455, $24,637 finder’s fees were paid in cash with regard to a working capital surplusthe sale of $2,866,527some of the units. All senior management and Directors of the Company participated.
On July 29, 2013, the Company received US$1,000,000 from Freeport as at December 31, 2007. an acquisition bonus arising out of the Butte Valley property sale announced on October 4, 2012 which was contingent on Freeport acquiring certain other mineral properties.
The proceeds have been used to continue advancing its Yerington copper projects and general corporate expenditures.
- 52 -
During the year ended December 31, 2008, we raised $557,690 through2013, the exerciseCompany expended $2,430,403 (2012 - $3,517,730) cash in operating activities with allocations of stock options35% in professional and consulting expenses, 31% in personnel costs, 25% in administration and general office expenses, 5% in travel and shareholder communications, and 4% in transfer agent and regulatory fees.
The Company also had $4,205,935 (2012 - $13,397,677) in mineral property acquisition and exploration costs: allocated as 51% in Yerington district copper projects, 26% in central Mexico, 6% each in Nieves and Uranium, 2% in Herbert Gold, and 9% in other U.S. properties. The Company has decided to focus its efforts on Yerington copper projects and continue to monetize its non-core assets. As of March 24, 2014, the Company had received gross proceedsUS$95,497 as a reimbursement of US$11,144,000 from a non-brokered private placement in April 2008 and US$2,619,673 from convertible notes. Subsequentshared exploration costs up to December 31, 2008, we closed the third tranchedate.
The ability of the convertible notes forCompany to continue its exploration programs is dependent on the continuing success of its programs and on generating sufficient additional proceedsfunding to support those exploration programs. Management is continuing to consider ways to monetize its non-core exploration properties. The business of US$1,170,300.mining exploration involves a high degree of risk and there is no assurance that current exploration projects will result in future profitable mining operations. The Company has no source of revenue, and has significant cash requirements to meet its administrative overhead, pay its liabilities, and maintain its mineral interests.
- 38 -
We spent $4,108,832 (2007 - $2,014,535) in operations in 2008, purchased an additional $105,592 (2007 - $172,187) in equipment, $178,212 (2007 - $59,594) in reclamation bonds and spent $13,366,464 (2007 - $9,132,683) on mineral properties.
As we are inOn February 6, 2014 the exploration stage, our operations have been and may continue to be funded by the sale of equity to investors. Although we havebeen successful in raising funds in the past through issuingCompany voluntarily withdrew its common shares from listing on the NYSE MKT. The withdrawal from listing on the NYSE MKT and convertible notes, it is uncertain whether we will be able to continue this financing due to difficult conditions. Management is renegotiating mineral option payments and discussing with various parties who are interested in participating in our properties and exploration activities.subsequent listing on the OTCQX market under the symbol “QTRRF” does not affect the listing of the shares on the TSX Venture Exchange.
C. Research and Development, Patents and Licenses, etc.
We do not have a research and development policy, nor do we hold any patents, licenses, or other intellectual property.
D. Trend Information
Mineral property expenditures can vary from quarter to quarter depending when option payments are due and the stage of the exploration program. For example, drilling may slow down for a period of time when results are analyzed, resulting in lower costs during that period.
We have had no revenue from mining operations since our inception. Income was generated through management fees on certain properties and interest earned on banker’s acceptance investments.
E. Off- Balance Sheet Arrangements
None.
F. Tabular Disclosure of Contractual Obligations
The following table outlines our contractual and optional obligations at December 31, 2008:2013:
| Less than 1 | More than 5 | ||||||||||||||
| Total | year | 1-3 years | 4-5 years | years | |||||||||||
| Mineral properties(a) | $ | 14,580,374 | $ | 2,115,362 | $ | 6,582,072 | $ | 3,824,520 | $ | 2,058,420 | |||||
| Office Lease(b) | 558,777 | 183,777 | $ | 375,000 | - | - | |||||||||
| Service agreement(c) | 15,000 | 15,000 | - | - | - | ||||||||||
| Total | $ | 15,154,151 | $ | 2,314,139 | $ | 6,957,072 | $ | 3,824,520 | $ | 2,058,420 |
| Total | 1 Year | 2-3 Years | 4-5 years | > 5 years | ||||||||||||
| Mineral properties(a) | $ | 6,864,025 | $ | 942,583 | $ | 1,657,217 | $ | 2,111,118 | $ | 2,153,107 | ||||||
| Office lease(b) | 407,627 | 144,395 | 263,232 | - | - | |||||||||||
| Loan payables | 689,038 | 689,038 | - | - | - | |||||||||||
| $ | 7,960,690 | $ | 1,776,016 | $ | 1,920,449 | $ | 2,111,118 | $ | 2,153,107 |
| (a) | We are required to make option payments and other expenditure commitments to maintain the properties and earn interest. | |
| (b) | During | |
|
- 53 -
G. Safe Harbour
The safe harbor provided in Section 27A of the Securities Act of 1933, as amended, and Section 21E of the Securities Exchange Act of 1934, as amended, shall apply to forward-looking information provided pursuant to Item 5.F. Please see “Cautionary Statement on Forward LookingRegarding Forward-Looking Information” at the outset of this annual report.
- 39 -
ITEM 6. DIRECTORS, SENIOR MANAGEMENT AND EMPLOYEES
A. Directors and senior management
The following tables and biographies set forth information about our directors and executive officers:
| Name | Age | Positions Held | Period as Director or Officer | Jurisdiction of Residence |
| Director & | Since | |||
| Thomas C. Patton | Director | Since 1998 | Washington, U.S. | |
| Director | Since | |||
| John Kerr | Director | Since 1993 | British Columbia, Canada | |
| LeRoy Wilkes | 71 | Director | Since 2006 | Colorado, U.S. |
| Anthony Walsh | 62 | Director | Since 2012 | British Columbia, Canada |
| Todd Hilditch | 46 | Director | Since 2012 | British Columbia, Canada |
| Michael Berry | 66 | Director | Since 2013 | Whippany, New Jersey |
| Lawrence Page, Q.C | Since 1995 | British Columbia, Canada | ||
| Eugene Spiering | Since 2006 | British Columbia, Canada | ||
| Scott Hean | Chief Financial Officer | Since 2006 | British Columbia Canada | |
Steven Dischler
Mr. Dischler graduated from the University of Wisconsin in 1981 (BS) and from the University of Arizona in 1984 (MS). Both of his degrees are in Mining Engineering. From 2007 through 2011, Mr. Dischler was a Project General Manager and Strategy Manager for a global oil company, BP. In his roles at BP he was responsible for managing major capital projects up to $250MM (US) and for managing a portfolio of legacy mining sites across the western US for the company. In prior roles Mr. Dischler was a consultant for 25 years which included permitting and development of major mining sites at numerous locations in the US. Mr. Dischler is a registered Professional Engineer in 8 states and has been a member of the Society of Mining Engineers since 1978.
Dr. Thomas Patton
Dr. Patton graduated from the University of Washington in 1971 (Ph.D.) and has worked with both junior and senior mining companies. He served as the President and Chief Operating Officer for Western Silver Corporation from January 1998 to May 2006. Among his accomplishments at Western Silver were the discovery and delineation of the class Peñasquito silver-gold-lead zinc deposit in Zacatecas, Mexico and the subsequent sale of the company to Glamis Gold Ltd. Prior to joining Western Silver, Dr. Patton held senior positions with Rio Tinto PLC and Kennecott Corporation, where he served as Senior Vice President, Exploration and Business Development. Dr. Patton is a member of the Society of Economic Geologists and the American Institute of Mining & Metallurgical Engineers.
- 54 -
Tracy Stevenson
Mr. Stevenson received a B.S. Accounting Magna Cum Laude from the University of Utah and is a member of the Advisory Board of the University Of Utah David Eccles School Of Business.Utah. He has international experience in finance, mergers and acquisitions, strategic planning, corporate governance, auditing, administration and information systems and technology. He worked for Rio Tinto plc, the world’s second largest mining company, and related companies for 26 years, where he held a number of senior leadership positions. Mr. Stevenson was the global head of information systems and shared services for Rio Tinto. He also served for four years as Executive Vice President, Chief Financial Officer and a director of Comalco Ltd., an Australia-based international aluminum company partially owned by Rio Tinto, and a further four years as Chief Financial Officer and a director of Kennecott Corporation, a diversified North American mining company owned by Rio Tinto. He also has public accounting experience with Coopers & Lybrand (now PriceWaterhouseCoopers)Price Waterhouse Coopers). Mr. Stevenson also serves as a director of Vista Gold Corp.
Dr. Thomas Patton
Dr. Patton graduated from the University of Washington in 1971 (Ph.D.) and has worked with both junior and senior mining companies. He served as the President and Chief Operating Officer for Western Silver Corporation from January 1998 to May 2006. Among his accomplishments at Western Silver were the discovery and delineation of the world class Peñasquito silver-gold-lead zinc deposit in Zacatecas, Mexico and the subsequent sale of the company to Glamis Gold Ltd. Prior to joining Western Silver, Dr. Patton held senior positions with Rio Tinto PLC and Kennecott Corporation, where he served as Senior Vice President, Exploration and Business Development. Dr. Patton Mr. Stevenson is also a founding member of the Society of Economic GeologistsBedrock Resources, LLC, a private resources financial advisory firm and the American Institute of Mining & Metallurgical Engineers.
Dr. Robert Gayton
Dr. Gayton graduated from the University of British Columbia in 1962 withSOS Investors, a Bachelor of Commerce and in 1964 earned the chartered accountant (C.A.) designation. Dr. Gayton joined the Faculty of Business Administration at the University of British Columbia in 1965, beginning 10 years in the academic world, including time at the University of California, Berkeley, earning a Ph.D. in Business. Dr. Gayton has directed the accounting and financial matters of public companies in the resource and non-resource fields since 1987. Dr. Gayton also serves as a director of these nine companies: Amerigo Resources Ltd.; Nevsun Resources Ltd.; Eastern Platinum Limited; Western Copper Corp.; Silvercorp Metals Inc.; Trans National Minerals Inc.; B2Gold Corp; Palo Duro Energy Inc.; and Intrinsyc Software International, Inc.private resources investment firm.
- 40 -
John R Kerr
John R. Kerr graduated from the University of British Columbia in 1964 with a Bachelor of Applied Science (B. ASc) degree in Geological Engineering. He has participated in the mining industry continuously since graduation as an exploration geologist. Mr. Kerr has gained experience in recognition and identification of mineral potential in a diversified field of geological environments. Mr. Kerr also serves as director of Pacific Coast Nickel Corp. andBravada Gold Corporation. He currently operates a geological consulting practice out of Vancouver, B.C., with projects located in all areas of North America.
LeRoy Wilkes
Mr. Wilkes was President of Washington Group International’s mining business unit where he was responsible for the operating and financial performance of the unit’s international operations in the coal, metals and industrial minerals markets. He has 38 years of mining experience in the precious metals, coal industrial metals, and base metals mining and processing. Prior to joining the Washington Group, Mr. Wilkes served as executive vice-president and chief operating officer of Santa Fe Pacific Gold Corporation of Albuquerque, New Mexico from 1988 to 1995. Mr. Wilkes also previously served as executive vice-president of Washington Corporation of Missoula, Montana, responsible for merger and acquisition activities. He earlier served as vice-president and general manager of Kennecott Ridgeway Mining Company of Ridgeway, South Carolina, and director of business development of Anaconda Minerals Co. of Denver, Colorado. He has held management and supervisory positions at surface and underground mines producing molybdenum, copper, limestone, lead silver and zinc. Mr. Wilkes has a degree in mining engineering from the Montana School of Mines. Mr. Wilkes also serves as a director and chairman of the Board of Sabina Gold & Silver Corp.
Anthony Walsh
Mr. Walsh graduated from Queen’s University (Canada) in 1973 and became a member of The Canadian Institute of Chartered Accountants in 1976. Mr. Walsh has over 20 years’ experience in the field of exploration, mining and development. From 2008 to 2011, Mr. Walsh was President and CEO and a Director of Sabina Gold & Silver Corp. From 1995 to 2007, Mr. Walsh was President and Chief Executive Officer of Miramar, from 1993 to 1995 was the Senior Vice-President and Chief Financial Officer of a computer leasing company and from 1989 to 1992 was Chief Financial Officer and Senior Vice-President, Finance of International Corona Resources Ltd., a gold producer Mr. Walsh is currently Chairman of Stornoway Diamonds Ltd. and serves as a director of several other public companies, namely: Sabina Gold & Silver Corp., Dundee Precious Metals Ltd., Avala Resources Ltd., Nova Gold Ltd., and TMX Group Ltd.
Todd Hilditch
Mr. Hilditch is President, Chief Executive Officer and a Director of Terraco Gold Corp., a TSXV-listed gold exploration company focussed in the western United States. He is a Director of Sama Resources Inc., a TSXV-listed base metals company focussed in West Africa, and was its President and Chief Executive Officer until 2010. Until 2010, Mr. Hilditch was President, Chief Executive Officer and a Director of Salares Lithium Inc., which was acquired by Australia-based Talison Lithium Limited, the world's largest lithium producer and a TSE-listed company. Mr. Hilditch is the President and owner of Rock Management Consulting Ltd., a private mining management services and consulting company.
Michael Berry
Dr. Berry served as a professor of investments at the Colgate Darden Graduate School of Business Administration at the University of Virginia, and as the Wheat First Endowed Chair at James Madison University. He has managed small- and mid-cap value portfolios for Heartland Advisors and Kemper Scudder. For the past decade he has been a highly regarded lecturer at the Federal Reserve Bank of the United States of America and is a well-known author and speaker in the Discovery Investing world. He is co-developer of the Discovery Investing Scoreboard software which ranks companies
- 55 -
relative to their discovery potential. He publishes Morning Notes which discusses geopolitical, technological and economic trends and their effect on capital markets, and identifies opportunities in the area of natural resources, high technology, infrastructure development and biotech.
Lawrence Page, Q.C.
Lawrence Page, Q.C. obtained his law degree from the University of British Columbia in 1964 and was called to the Bar of British Columbia in 1965. He has been admitted to the Bar of Ontario for the purpose of acting as counsel in specified litigation. Mr. Page was awarded the distinction of Queen’s Counsel in 1988. Mr. Page practices on his own in Vancouver in the areas of commercial litigation, native law, natural resource law and corporate and securities law. He is the principal of the Manex Resource Group, which provides administrative, financial, corporate and geological services to a number of public companies in the mineral resource sector, including us.Quaterra. Mr. Page also serves as a director of five public companies: Duncastle Gold Corp.;, Valterra Resource Corporation; Fortune River Resource Corp.;Corporation, Southern Silver Exploration Corp.;, Bravada Gold Corporation and Bravo Venture Group Inc.Homestake Resource Corporation.
Eugene Spiering
Mr. Spiering has a Bachelor of Science-Geology degree from the University of Utah. He has over 2830 years of experience in the mining exploration industry. Mr. Spiering previously held the position of Vice President, Exploration at Rio Narcea Mines Ltd., where he managed a team that discovered twothe El Valle and Corcoesto gold deposits and completed the final definition of onethe Carles and Salave gold deposits and the Aguablanca nickel deposit in Spain. Prior to his tenure at Rio Narcea, Mr. Spiering held the position of senior geologist with Energy Fuels Nuclear, Inc. where hishe participated in the discovery of the Arizona 1 and Hermit uranium deposits. His responsibilities with Energy Fuels included drilling supervision, geologic mapping, and ore reserve calculations related to uranium exploration in northern Arizona and gold exploration in the western US and Venezuela.
LeRoy Wilkes
Mr. WilkesSpiering is a graduate mining engineer frommember of the Montana SchoolSociety of Mines. He recently retired as presidentEconomic Geologists, the Society for Mining, Metallurgy & Exploration, the American Association of Washington Group International’sPetroleum Geologists, and is a Fellow member of the Australasian Institute of Mining Business Unit. As leader of this group, he participated in developing mining projects throughout the world, including Latin America, Canada, Europe and the United States. Mr. Wilkes was also the Chief Operating Officer of Santa Fe Pacific Gold Corporation during the expansion of its Nevada operations. He was also involved in the development of such projects as Greens Creek, Alaska; Stillwater, Montana; and Las Pelameres in Chile, while serving as Senior Vice President of Business Development for Anaconda Minerals. Mr. Wilkes also serves as a director of Sabina Silver Corporation and Copper Mesa Mining Corp.Metallurgy.
Scott B. Hean
Mr. Hean graduated from Simon Fraser University in 1973 and from the Ivey School of Business, London, Ontario, in 1975. He completed the Institute of Corporate Directors Director Education program in May 2006. Currently, Mr. Hean is director and past chair of the audit committee for Sabina Gold & Silver Corp. and chair of the audit committee for Formation Metals Ltd. He has been CFO of the Company since 2006. Previously he held senior management and executive positions with Bank of Montreal as Senior Vice President and Managing Director responsible for financing in the natural resources sectors in North America and with J.P. Morgan of New York, where he was involved in financing oil and gas companies. Currently, Mr. Hean is director and past chair of the audit committee for Sabina Silver Corporation, a director and chair of the audit committee of Great Quest Metals, Inc., and a director of Southern Silver Exploration Corp., all TSX-Venture listed companies. In the non-profit sector, he serves as a director and chair of the Bill Reid Trust, a not for profit organization concerning the work of the internationally renowned Haida artist, Bill Reid. HeReid and has served on numerous not-for-profit Boards, including Outward Bound Canada and B.C. Children’s Hospital.
Dr. Charles Hawley
Dr. Hawley graduated with a Bachelor of Arts degree from Hanover College, Indiana in 1951 and earned a Ph.D in geology from the University of Colorado in 1963. He worked for the U.S. Geological Survey from 1952-1968. Dr. Hawley has been working within the exploration and mine development field in Alaska’s private sector since 1969.
- 41 -
B. Compensation
Executive Officers
The following table sets forth the compensation paid to executive officers for the fiscal year ended December 31, 2008.2013.
| Name | Salary | All other Compensation | Total |
| Thomas C. Patton President & CEO | $146,414 | $1,304,442 | $1,450,856 |
| Eugene Spiering VP of Exploration | $166,667 | $9,763 | $176,430 |
| Scott Hean CFO | $69,958 | -0- | $69,958 |
| Charles Hawley, VP, Exploration, Alaska | $9,840 | -0- | $9,840 |
| Name | Salary ($) | Bonus ($) | Securities Under Options Granted (#) | Share-Bsed Payment Under Options ($)(3) | All other Compensation | Total ($) |
| Thomas C. Patton Chairman | 50,000 | nil | 450,000 | 54,000 | nil | 104,000 |
| Eugene Spiering VP of Exploration | 150,000 | nil | 190,000 | 22,800 | 2,446 | 172,800 |
| Scott Hean(1) CFO | 12,500 | nil | 320,000 | 38,400 | 89,074 | 139,974 |
| Steve Dischler(2) President & CEO | 257,750 | nil | 900,000 | 66,682 | nil | 324,432 |
| (1) | Consulting fees paid to Atherton Enterprises, a company owned by Mr. Scott Hean in consideration of Mr. Hean’s |
- 56 -
services as Chief Financial Officer. Effective December 1, 2013, Mr. Hean became a salaried employee of the Company. | ||
| (2) | Share-based payment under options for Mr. Dischler reflected the 300,000 options vested during the year. | |
| (3) | The assumptions used to calculate share-based payment were risk-free interest rate 1.72%, expected share price volatility 96%, expected option life 5 years, forfeiture rate 0%, and expected dividend yield 0%. |
We granted stock options on JuneSeptember 19, 20082013 under our Incentive Stock Option Plan at an exercise price of $3.30$0.16 per share for a five year term to the executive officers named above in the following amounts: Dr. Thomas Patton received 300,000;450,000 options; Mr. Spiering received 150,000190,000 options; Mr. Hean received 100,000320,000 options, and Dr. HawleyMr. Dischler received 40,000.900,000 options.
Board of Directors
In the fiscal year ended December 31, 2008, each of ourThe Company previously approved annual compensation to non-executive directors other than the including payment of $500 per meeting attended, $500 per travel day and annual fees as follows:
| Independent Directors | $12,000 |
| Chairman of the Board of Directors | $24,000 |
| Chairman of the Audit Committee | $15,000 |
| Chairman of any other committee | $13,500 |
As approved by a resolution of the Board of Directors, received an annual fee of $12,000 for their service as well as a $500 fee per Board of Directors meeting attended and $500 per day for each day of travel. Each non-executive director also received 60,000no directors’ fees were paid or accrued in 2013. The Company granted stock options on JuneSeptember 19, 2008,2013 under our Incentive Stock Option Plan at an exercise price of $3.30$0.16 per share. The Chairman ofshare for a five year term to the Board, Mr.directors in the following amounts: Tracy Stevenson received an annual fee of $24,000 and $500 per meeting attended and $500 per day for each day of travel. Mr. Stevenson also200,000 options; John Kerr received 150,000 options on March 31, 2008 at an exercise price of $3.45 per share and 75,000 options on June 19, 2008 at an exercise price of $3.30 per share.
In addition, the Chairman of the Audit Committee, Robert Gayton, received an annual fee of $15,000 and $500 per meeting attended and $500 per day for each travel day. The Chairman of the Corporate Governance Nomination and Compensation Committee,180,000 options; LeRoy Wilkes received an annual fee of $13,500 as well as $500 per meeting attended180,000 options; Anthony Walsh received 180,000 options; Todd Hilditch received 180,000 options; and $500 per day for each day of travel.
All stock options issued expire after five years and were issued under our Incentive Stock Option Plan.
As of January 1, 2009, all director fees have been suspended due to economic conditions.Michael Berry received 130,000 options.
C. Board Practices
Term of Office
Our directors are elected annually at our annual general meeting and each officer holds such office for one year, until the next annual general meeting of shareholders, or until replaced by his or her predecessor.
Service Contracts
During the most recently completed financial year, threefive of our executive directorsofficers had service contracts in place which provide for benefits upon termination of employment.
Thomas Patton– In January 2009,2010, Dr. Thomas Patton entered into an employment agreement with usthe Company and ourits subsidiary, Quaterra Alaska, Inc. for a period of five years which replaced a prior employment agreement dated January 1, 2007.2009. Under the employment agreement, Dr. Patton is entitled to receive an annual base salary of $150,000. DueUpon the expiration of one year following the date of the employment agreement and each year thereafter, the Company will review Dr. Patton’s salary with a view to current economic conditions, Dr. Patton has agreedits increase, giving consideration to reduce his salary to $1 effective January 16, 2009 until such further time as we agree in writing.the Company’s financial position and the scope of its activities. Dr. Patton may be eligible to participate in future stock option grants. WeThe Company may endterminate the employment of Dr. Patton only for breach of the employment agreement or for cause. Dr. Patton is entitled to two monthsmonths’ notice of such discharge. Upon a change of control, as defined in the employment agreement including through acquisition of 20% or more of our common shares,If Dr. Patton has the right to terminate the employment agreement and receive 100% of the compensation due him for the unexpired term of the employment agreement.
- 42 -
Eugene Spiering – On December 1, 2008, Eugene Spiering entered into an employment agreement with us which replaced prior employment agreements dated January 1, 2006, as renewed by renewal agreements dated January 1, 2007 and January 1, 2008. Under the employment agreement, Mr. Spiering is entitled to receive an annual base salary of $200,000. Due to current economic conditions, Mr. Spiering has agreed to reduce his salary to $100,000 effective December 1, 2008 until such further time as we agree in writing. Upon the expiration of one year following the date of the employment agreement and each year thereafter, we will review Mr. Spiering’s salary with a view to increase, giving consideration to our financial position and the scope of our activities. Mr. Spiering may be eligible to participate in future stock option grants. If Mr. Spiering becomes disabled and unable to perform his regular duties, he shall be entitled to receive his full salary for two months. Upon a change of control, as defined in the employment agreement, including through acquisitionDr. Patton has the right to terminate the employment agreement and receive an amount of 20%money equal to his annual salary for two (2) years, that amount being $300,000.
Lawrence Page:On July 15, 2011, Lawrence Page, Q.C. entered into a consulting agreement with the Company for a period of five years, whereby Mr. Page provides corporate secretarial services to the Company and is entitled to receive an annual fee of $50,000. Mr. Page may be eligible to participate in future stock option grants. Upon a change of control, as defined in the agreement, Mr. Page has the right to terminate the agreement and receive an amount of money equal to his annual salary for two (2) years, that amount being $100,000. Mr. Page resigned as a director on July 31, 2013 but continues to serve the Company as Corporate Secretary.
- 57 -
Steven Dischler:On October 24, 2011, Steven Dischler entered into an employment agreement with the Company for a period of five years for his position as Vice President, General Manager, Yerington District. Mr. Dischler was appointed President and a director of the Company on July 31, 2013. Pursuant to the agreement, Mr. Dischler earns an annual salary of US$250,000, is entitled to participate in future stock option grants, and may only have his employment terminated by the Company for breach of the employment agreement or morefor cause. Upon a change of our common shares,control, as defined in the employment agreement, Mr. Dischler has the right to terminate the employment agreement and receive an amount of money equal to his annual salary for two (2) years, that amount being US$500,000.
Scott Hean:Scott Hean and his wholly-owned company entered into a services agreement with the Company effective January 1, 2010 for a term of five years. Pursuant to the agreement, Mr. Hean earns an annual salary of $175,000, is entitled to participate in future stock option grants, and may only have his employment terminated by the Company in the event of default. Upon a change of control, as defined in the agreement, Mr. Hean has the right to terminate the services agreement and receive an amount of money equal to his annual salary for two (2) years, that amount being $350,000. Effective December 1, 2013, Mr. Hean became a full time employee of the Company with a salary of $150,000.
Eugene Spiering:Eugene Spiering entered into an employment agreement with the Company effective January 1, 2010 for a term of five years. Pursuant to the agreement, Mr. Spiering earns an annual salary of $200,000, is entitled to participate in future stock option grants, and may only have his employment terminated by the Company for breach of the employment agreement or for cause. Upon a change of control, as defined in the employment agreement, Mr. Spiering has the right to terminate the employment agreement and receive 100%an amount of the compensation due himmoney equal to his annual salary for the unexpired term of the employment agreement.two (2) years, that amount being $400,000.
Committees
Our Board of Directors has established an Audit Committee and a Corporate, Governance, Nomination and Compensation Committee.
Audit Committee –The–The Company’s Board of Directors has a separately-designated standing audit committee established in accordance with Section 3(a)(58)(A) of the Securities Exchange Act of 1934, as amended. The members of the Audit Committee are Robert Gayton, LeRoy WilkesAnthony Walsh, Todd Hilditch and John Kerr. The Company’s Board of Directors has determined that each of Messrs. Walsh, Hilditch, and Kerr allare independent (as provided for under Rule 10A-3 of whomthe Exchange Act) and are independent.financially literate. The Audit Committee is responsible for assisting directors to meet their responsibilities, providing better communication between directors and external auditors;auditors, enhancing the independence of the external auditor, increasing the credibility and objectivity of financial reports, and strengthening the role of the directors, facilitating in-depth discussions among directors, management, and the external auditor. The Audit Committee meets at least four times during a year. A copy of the Audit Committee Charter is available through our website at www.quaterraresources.com.
Corporate Governance, Nomination and Compensation Committee– The members of the Corporate Governance Nomination Compensation Committee (the “CGNCC”) are LeRoy Wilkes, Lawrence Page,Anthony Walsh, and John Kerr. LeRoy Wilkes and John KerrTodd Hilditch all of whom are independent directors and theindependent. The Board of Directors has determined that the composition of the CGNCC ensures an objective process for determining compensation of executive officers. The CGNCC meets regularly and considers matters of governance and compensation. The CGNCC seeksmay seek the advice of third party independent consultants as may be required in particular circumstances and submits reports to the full Board of Directors on a regular basis.
D. EMPLOYEES
During the fiscal years ended December 31, 2008, 20072013, 2012 and 2006,2011, we had direct employees as outlined below. Prior to 2007, the majority of our workforce were independent contractors rendering services to the different subsidiaries.
| Company | 2008 | 2007 | 2006 | 2013 | 2012 | 2011 |
| Quaterra Resources Inc. | 3 | 2 | 4 | |||
| Quaterra Alaska Inc. | 7 | 3 | 1 | 9 | 10 | 11 |
| Minera Agua Tierr S.A. de C.V. | Nil | Nil | ||||
| Quaterra International Limited | Nil | Nil | ||||
| Total | 10 | 5 | 3 | 13 | 14 | 15 |
- 43 -
We entered into anrenewed the service agreement with related party Manex Resource Corp.Group Inc. (“Manex”) in June 2008February 9, 2012 (as amended on September 1, 2013 and March 1, 2014) whereby Manex provides administrative, accounting, secretarial and investor relation secretarial
- 58 -
services to us. The basic fee for office space, and office infrastructure is $14,000 per month and other services rendered are based on hourly rates specified in the agreement.agreement is $19,667 per month commencing March 1, 2014. We also reimburse Manex for office supplies including paper, courier, postage, parking, filing fees and other out-of-pocket expenses. During the three years ended December 31, 2008,2013, we paid Manex the following:
| For Fiscal Year Ended December 31, | |||||||||
| 2008 | 2007 | 2006 | |||||||
| Office space & administration | $ | 247,110 | $ | 116,000 | $ | 60,000 | |||
| Accounting | 173,460 | 71,986 | 35,391 | ||||||
| Corporate Secretary | 108,303 | 73,824 | 53,439 | ||||||
| Investor relations | 32,425 | 39,794 | 24,938 | ||||||
| 15% (10%) charges on recovery | 12,535 | 19,753 | - | ||||||
| $ | 573,833 | $ | 321,358 | $ | 173,768 | ||||
| Fiscal year ended December 31 | |||||||||
| 2013 | 2012 | 2011 | |||||||
| Office space and administration | $ | 237,948 | $ | 267,124 | $ | 241,552 | |||
| Accounting | 165,864 | 164,088 | 163,799 | ||||||
| Corporate Secretray | 56,591 | 100,454 | 103,387 | ||||||
| 15% charges on recovery | 2,621 | 3,683 | 5,839 | ||||||
| $ | 463,024 | $ | 535,349 | $ | 514,577 | ||||
Manex is located at the same address as our company at suite 1100, 1199 West Hastings Street, Vancouver, British Columbia. Manex is a private company controlled by Lawrence Page, one of our directors.the Company’s Corporate Secretary.
E. SHARE OWNERSHIP
All persons listed in subsection 6.B above beneficially own an aggregate of 1,538,1988,330,234 Common shares or 1.76%4.31% of our common shares outstanding. Dr. Thomas Patton beneficially owns 1,197,0005,214,762 or 1.37%2.70% of our common shares and he has the right to exercise or redeem various stock options share purchase warrants and convertible promissory notes, that if fully exercised and redeemed he wouldwill beneficially own 2,485,2166,624,762 common shares of the companyCompany or 2.84%3.42% of our outstanding shares. No other director or officer beneficially owns greater than 1% of our common shares.
We grant stock options to directors, officers, employees and consultants who provide services to us, including our subsidiaries, pursuant to our Incentive Stock Option Plan. The purpose of the Incentive Stock Option Plan is to provide increased incentive to contribute to our future success and prosperity, thus enhancing the value of our shares for the benefit of all the shareholders and increasing our ability to attract and retain skilled and motivated individuals in the service of us. Our Incentive Stock Option Plan is a “rolling” plan through which the maximum number of issuable shares underlying options is equal to 10% of our outstanding shares. As of December 31, 2008,2013, there were 7,200,50016,310,000 options outstanding and 5,898,000 exercisable under the Incentive Stock Option Plan.
ITEM 7. MAJOR SHAREHOLDERS AND RELATED PARTY TRANSACTIONS
A. Major Shareholders
We are not aware of any beneficial shareholder holding greater than 5% of our common shares as of the date of this annual report or during the prior three years.years, other than:
| Goldcorp Inc. | 10,294,825 common shares | 5.32% |
As of December 31, 2008,2013, approximately 60%54% of our common shares were held in Canada and approximately 39%45% of our common shares were held in the U.S., with the balance held in various other countries.
There are no arrangements known to us that may, at a subsequent date, result in a change in control.
B. Related Party Transactions
We are partyDuring fiscal 2013, we paid consulting fees of $88,542 paid to Atherton Enterprises, a services agreement with Manex Resource Corp., which is controlledcompany owned by Lawrence Page, one of our directors. Please see Item 6.D. "Employees" above. WeScott Hean (CFO) and, and we also paid legal fees of $18,802$15,029 to a law firm of which Lawrence Page is the principal.
The Company renewed the service agreement with related party Manex Resource Corp. (“Manex”) on February 9, 2012 (as amended on September 1, 2013 and March 1, 2014) which replaces a prior service agreement dated June 9, 2008, whereby Manex provides administrative, accounting, and secretarial services to the Company. Manex is a private company controlled by Lawrence Page, Corporate Secretary of the Company. The basic fee for office space and office infrastructure is $8,000 per month and $11,667 for other services rendered specified in the agreement. The Company also reimburses Manex for office supplies including paper, courier, postage, parking, filing fees and other out-of-pocket expenses. During the year ended December 31, 2013 the Company paid $463,024 to Manex. Manex is located at the same address as the Company at
- 4459 -
suite 1100, 1199 West Hastings Street, Vancouver, British Columbia, V6E 3T5. We believe the terms of the Manex agreement are similar to that which would be obtainable from an unrelated party.
As of December 31, 2013 the Chairman of the Board of the Company had advanced a total of US$800,000 (the “loans”) to the Company for operating expenditures. The loans are unsecured and are repayable within nine months at an annual interest rate of 10%. As of March 24, 2014, the principal of the loan remains US$600,000. The Chairman had reduced his cash remuneration to $1 per year since December 2012 with no accrual, and starting September 1, 2013, he was paid $150,000 per year. Commencing January 16, 2014, the chairman voluntarily reduced his salary by 50% with the rest 50% accrued.
C. Interests of Experts and Counsel
Not applicable.
ITEM 8. FINANCIAL INFORMATION
Financial Statements
The consolidated balance sheetsstatements of financial position of Quaterra Resources Inc. as of December 31, 20082013 and 20072012 and the consolidated statements of operationscomprehensive loss, changes in equity and cash flows of Quaterra Resources Inc. for the years ended December 31, 2008, 20072013, 2012 and 2006,2011, as well as the auditors’ report thereon, are presented at Item 17 of this annual report.
Legal Proceedings
As described in “Future Work Plans” as part of the Arizona Uranium Claims, USA discussion under Item 4D above, the Company has initiated a lawsuit against the U.S. Department of the Interior and Bureau of Land Management. As of March 14, 2014, the Company completed the sale of the Arizona Uranium Claims. On March 14, 2014, the Company closed a transaction to sell its uranium properties and assets located in the states of Arizona, Utah and Wyoming for gross proceeds of $500,000 and we have no further involvement in this litigation.
From time to time, we may be a party to pending or threatened legal proceedings and arbitrations that are routine and incidental to our business. Based upon information presently available, and in light of legal and other defenses available to us, our management does not consider the liability from any threatened or pending litigation to be material.
Dividends
We have never declared or paid any cash dividends on our common stock and we do not anticipate paying any cash dividends in the foreseeable future.
Significant Changes
Except as otherwise disclosed in this annual report, including under Item 5. “Operating and Financial Review and Prospects”, there has been no significant change in our financial position since December 31, 2008.2013.
ITEM 9. THE OFFER AND LISTING
A. Offer and listing details
Our common shares have traded on the TSX Venture Exchange since November 14, 1997 under the symbol QTA. Our common shares also have traded on the NYSE AmexMKT (previously known as the American Stock Exchange) sinceNYSE AMEX) from March 4, 2008 until February 6, 2014 under the symbol QMM.
On February 7, 2014, our shares began trading on the OTCQX under the symbol QTRRF. The following table set forth the price history of our common shares for the periods indicated.
| TSX Venture Exchange (C$) | NYSE Amex (US$) | |||
| High | Low | High | Low | |
| Fiscal Year Ended December 31, 2008 | 4.18 | 0.47 | 3.97 | 0.36 |
| Fiscal Year Ended December 31, 2007 | 4.16 | 1.98 | - | - |
| Fiscal Year Ended December 31, 2006 | 2.75 | 0.37 | - | - |
| Fiscal Year Ended December 31, 2005 | 0.50 | 0.22 | - | - |
| Fiscal Year Ended December 31, 2004 | 0.85 | 0.28 | - | - |
| Fiscal Year Ended December 31, 2008 | ||||
| First Quarter | 4.18 | 2.90 | 3.97 | 3.05 |
| Second Quarter | 3.85 | 2.60 | 3.83 | 2.50 |
| Third Quarter | 3.48 | 1.50 | 3.49 | 1.51 |
| Fourth Quarter | 1.80 | 0.47 | 1.84 | 0.36 |
| Fiscal Year Ended December 31, 2007 | ||||
| First Quarter | 3.00 | 1.98 | - | - |
| Second Quarter | 4.16 | 2.60 | - | - |
| Third Quarter | 3.84 | 2.21 | - | - |
- 4560 -
| Fourth Quarter | 3.99 | 2.66 | - | - |
| February 2009 | 0.81 | 0.55 | 0.66 | 0.42 |
| January 2009 | 0.99 | 0.54 | 0.85 | 0.42 |
| December 2008 | 0.70 | 0.47 | 0.55 | 0.40 |
| November 2008 | 0.80 | 0.50 | 0.70 | 0.36 |
| October 2008 | 1.80 | 0.60 | 1.84 | 0.45 |
| September 2008 | 2.31 | 1.50 | 2.20 | 1.42 |
| TSX Venture Exchange (C$) | NYSE MKT (US$) | OTCQX (US$) | ||||
| High | Low | High | Low | |||
| Fiscal Year Ended December 31, 2013 | 0.36 | 0.065 | 0.37 | 0.07 | - | - |
| Fiscal Year Ended December 31, 2012 | 0.74 | 0.32 | 0.71 | 0.32 | - | - |
| Fiscal Year Ended December 31, 2011 | 2.08 | 0.54 | 2.21 | 0.50 | - | - |
| Fiscal Year Ended December 31, 2010 | 2.50 | 1.05 | 2.42 | 1.01 | - | - |
| Fiscal Year Ended December 31, 2009 | 2.05 | 0.41 | 2.28 | 0.30 | - | - |
| Fiscal Year Ended December 31, 2013 | ||||||
| First Quarter | 0.36 | 0.20 | 0.37 | 0.19 | - | - |
| Second Quarter | 0.23 | 0.09 | 0.22 | 0.09 | - | - |
| Third Quarter | 0.17 | 0.09 | 0.17 | 0.09 | - | - |
| Fourth Quarter | 0.15 | 0.065 | 0.15 | 0.07 | - | - |
| Fiscal Year Ended December 31, 2012 | ||||||
| First Quarter | 0.74 | 0.46 | 0.71 | 0.45 | - | - |
| Second Quarter | 0.60 | 0.34 | 0.55 | 0.35 | - | - |
| Third Quarter | 0.40 | 0.32 | 0.46 | 0.32 | - | - |
| Fourth Quarter | 0.54 | 0.32 | 0.60 | 0.33 | - | - |
| February 2014 | 0.09 | 0.045 | - | - | - | - |
| February 7-28, 2014 | - | - | - | - | 0.0795 | 0.05 |
| February 1-6, 2014 | - | - | 0.08 | 0.04 | - | - |
| January 2014 | 0.11 | 0.06 | 0.10 | 0.05 | - | - |
| December 2013 | 0.10 | 0.07 | 0.11 | 0.07 | - | - |
| November 2013 | 0.115 | 0.065 | 0.10 | 0.07 | - | - |
| October 2013 | 0.15 | 0.105 | 0.15 | 0.10 | - | - |
| September 2013 | 0.17 | 0.15 | 0.17 | 0.15 | - | - |
B. Plan of Distribution
Not applicable.
C. Markets
See subsection 9.A. “Offer and Listing Details” above.
D. Selling Shareholders
Not applicable.
E. Dilution
Not applicable.
F. Expenses of the Issue
Not applicable.
- 61 -
ITEM 10. ADDITIONAL INFORMATION
A. Share Capital
Not applicable.
B. Memorandum and Articles of Association
Incorporation
We are governed by Articles dated June 13, 2005.2005 and amended December 11, 2007. Our Articles are on file with the Office of the British Columbia Registrar of Companies under Certificate of Incorporation No. BC0446713. Under the provisions of theBusiness Corporations Act(BC), we have the capacity and the rights, powers, and privileges of an individual of full capacity. There are no restrictions in our Articles on the business that we can carry on or the powers we can exercise.
Powers and Functions of the Directors
Under Article 17, a director is obligated to disclose a potential interest in a contract or transaction being considered by us, and may not vote on a contract or transaction with a disclosable interest, but the director shall be counted in the quorum at the meeting of the Board of Directors at which the contract or transaction is approved.
Under Article 13, the Board of Directors may, in the absence of an independent quorum, vote compensation to themselves.
Under Article 8, there are no limitations on borrowing powers exercisable by our Board of Directors.
There are no provisions in our Articles for the retirement or non-retirement of a director under an age limit.
There is no requirement in our Articles for a director to hold any of our common shares.
- 46 -
Rights and Restrictions Attached to the Common Shares
Our common shares rank equally as to dividend rights, voting rights, profits, and liquidation rights. The common shares are not subject to redemption or sinking fund provisions, liability to further capital calls, nor any provisions discriminating against any existing or prospective holder of such shares as a result of such shareholder owning a substantial number of shares.
Alteration of Share Rights
In accordance with theBusiness Corporations Act(BC) and our Articles, a special resolution is required to change the rights of common shares, and must be (a) passed at a general meeting by a majority of not less than 2/3 of the voting common shareholders; or (b) consented to in writing by all common shareholders.
Annual General Meetings
Articles 10 and 11 of our Articles, together with applicable corporate and securities laws, contain the conditions governing the manner in which annual and extraordinary general meetings of shareholders are called, including notice, proxy solicitation, and quorum requirements. Annual general meetings are called and scheduled upon decision by the Board of Directors. The Board of Directors may convene an extraordinary general meeting of the shareholders. Our Articles are silent as to the abilityHolders of shareholders tocommon shares may not requisition an extraordinary meeting however, underof the Business Corporations Act (BC) a meeting can be requisitioned by shareholders holding in the aggregate at least 20% of our common shares.shareholders. All meetings may be attended by registered shareholders or persons who hold powers of attorney or proxies given to them by registered shareholders.
Foreign Ownership Limitation
Our Articles do not contain limitations on the rights of non-residents, foreigners, or other groups to own common shares.
- 62 -
Change of Control
There are no provisions in our Articles that would have the effect of delaying, deferring or preventing a change in control, or that operate only with respect to a merger, acquisition or corporate restructuring involving us or any of our subsidiaries.
Share Ownership Reporting Obligation
Our Articles do not containcontains provisions governing the threshold above which shareholder ownership must be disclosed.
Differences between Canadian and U.S. Law
The securities laws of the Province of British Columbia require disclosure of shareholdings by (i) persons who are our directors or senior officers; and (ii) a person who has direct or indirect beneficial ownership of, control or direction over, or a combination of direct or indirect beneficial ownership of and control or direction over our securities carrying more than 10% of the voting rights attached to all of our outstanding voting securities.
��The threshold of share ownership percentage requiring disclosure of ownership is higher in the home jurisdiction of British Columbia than the U.S. where U.S. securities law prescribes a 5% threshold for ownership disclosure.
Capital Changes
There are no conditions imposed by our Articles governing changes in our share capital that are more stringent than is required by law.
C. Material Contracts
We have not entered into any material contracts other than in the ordinary course of business and other than those described in Item 4. “Information on the Company” or elsewhere in this annual report.
- 47 -
D. Exchange Controls
There currently are no laws, decrees, regulations, or other legislation in Canada that restrict the export or import of capital, or impose foreign exchange controls or affect the remittance of interest, dividends, or other payments to non-resident holders of our common shares, other than the withholding tax requirements described under subsection E. “Taxation” below. Canada has no system of exchange controlscontrols.
There are no limitations imposed by Canadian law or our Articles on the right of non-resident to hold our common shares, other than as provided by theInvestment Canada Act, as amended (the “Act”), as amended by theNorth American Free Trade Agreement Implementation Act(Canada), and theWorld Trade Organization (WTO) Agreement Implementation Act. The Act requires notification and, in certain cases, advance review and approval by the Government of Canada of the acquisition by a “non-Canadian” of “control of a Canadian business”, all as defined in the Act. Generally, the threshold for review will be higher in monetary terms for a member of the WTO or NAFTA.
E. Taxation
We encourage you to consult with your own tax advisors about the Canadian and U.S. federal, state, provincial, local, and foreign tax consequences of purchasing, owning, and disposing of our common shares. |
Certain Canadian Federal Income Tax Consequences
The discussion under this heading summarizes the principal Canadian federal income tax consequences of acquiring, holding and disposing of shares of common shares for a shareholder who is not a resident of Canada but is a resident of the United States and who will acquire and hold a corporation’s common shares as capital property for the purposes of the Income Tax Act (Canada) (the “Canadian Tax Act”). This summary does not apply to a shareholder who carries on business in Canada through a “permanent establishment” situated in Canada or performs independent personal services in Canada through a fixed base in Canada if the shareholder’s holding is effectively connected with such permanent establishment or fixed base. This summary is based on the provisions of the Canadian Tax Act and the regulations thereunder and on an
- 63 -
understanding of the administrative practices of Canada Customs & Revenue Agency, and takes into account all specific proposals to amend the Canadian Tax Act or regulations made by the Minister of Finance of Canada as of the date hereof.This discussion is general only and is not, nor is it intended to provide a detailed analysis of the income tax implications of any particular shareholder’s interest. Investors are advised to obtain independent advice from a shareholder’s own Canadian and U.S. tax advisors with respect to income tax implications pertinent to their particular circumstances.The provisions of the Canadian Tax Act are subject to income tax treaties to which Canada is a party, including the Canada-United States Income Tax Convention (1980), as amended (the “Convention”).
Dividends on Common Shares and Other Income
Under the Canadian Tax Act, a non-resident of Canada is generally subject to Canadian withholding tax at the rate of 25 percent on dividends paid or deemed to have been paid to him or her by a corporation resident in Canada. The corporation is responsible for the withholding of tax at the source. The Convention limits the rate to 15 percent if the shareholder is a resident of the United States and the dividends are beneficially owned by and paid to such shareholder and to 5 percent if the shareholder is also a corporation that beneficially owns at least 10 percent of the voting stock of the payor corporation.
The amount of a stock dividend (for tax purposes) would generally be equal to the amount by which the paid up or stated capital of the corporation had increased by reason of the payment of such dividend. The corporation will furnish additional tax information to shareholders in the event of such a dividend. Interest paid or deemed to be paid on the corporation’s debt securities held by non-Canadian residents may also be subject to Canadian withholding tax, depending upon the terms and provisions of such securities and any applicable tax treaty.
The Convention generally exempts from Canadian income tax dividends paid to a religious, scientific, literary, educational or charitable organization or to an organization constituted and operated exclusively to administer a pension, retirement or employee benefit fund or plan, if the organization is a resident of the United States and is exempt from income tax under the laws of the United States.
Dispositions of Common Shares
Under the Canadian Tax Act, a taxpayer’s capital gain or capital loss from a disposition of a common share is the amount, if any, by which his or her proceeds of disposition exceed (or are exceeded by, respectively) the aggregate of his or her adjusted cost base of the share and reasonable expenses of disposition. The capital gain or loss must be computed in Canadian currency using a weighted average adjusted cost base for identical properties. The capital gains net of losses included in income since October 17, 2000 is 50%. The amount by which a shareholder’s capital loss exceeds the capital gain in a year may be deducted from a capital gain realized by the shareholder in the three previous years or any subsequent year, subject to certain restrictions in the case of a corporate shareholder.
- 48 -
Under the Canadian Tax Act, a non-resident of Canada is subject to Canadian tax on taxable capital gains, and may deduct allowable capital losses realized on a disposition of “taxable Canadian property.” Common shares of a corporation will constitute the taxable Canadian property of a shareholder at a particular time if the shareholder used the shares in carrying on business in Canada, or if at any time in the five years immediately preceding the disposition, 25% or more of the issued shares of any class or series in the capital stock of the corporation belonged to one or more persons in a group comprising the shareholder and persons with whom the shareholder and persons with whom the shareholder did not deal at arm’s length and in certain other circumstances.
The Convention relieves United States residents from liability for Canadian tax on capital gains derived on a disposition of shares, unless: (i) the value of the shares is derived principally from “real property” in Canada, including the right to explore for or exploit natural resources and rights to amounts computed by reference to production; (ii) the shareholder was resident in Canada for 120 months during any period of 20 consecutive years preceding, and at any time during the 10 years immediately preceding, the disposition and the shares were owned by him when he ceased to be resident in Canada; or (iii) the shares formed part of the business property of a “permanent establishment” that the holder has or had in Canada within the 12 months preceding the disposition.
Certain United States Federal Income Tax Consequences
The following is a discussion of material United States federal income tax consequences generally applicable to a U.S. Holder (as defined below) of our common shares. This discussion does not cover any state, local or foreign tax consequences. This discussion is based upon the sections of the Internal Revenue Code of 1986, as amended (“the Code”), Treasury Regulations, published Internal Revenue Service (“IRS”) rulings, published administrative positions of the IRS and
- 64 -
court decisions that are currently applicable, any or all of which could be materially and adversely changed, possibly on a retroactive basis, at any time. In addition, the discussion does not consider the potential effects, both adverse and beneficial, or recently proposed legislation which, if enacted, could be applied, possibly on a retroactive basis, at any time.
U.S. Holders
As used herein, a U.S. Holder includes a holder of common shares who is a citizen or resident of the United States, a corporation (or an entity which has elected to be treated as a corporation under Treasury Regulations)Regulations created or organized in or under the laws of the United States or of any political subdivision thereof, any estate other than a foreign estate (as defined in the Code) or, a trust subject to the primary supervision of a court within the United States and control of a United States fiduciary as described in the Code. This summary does not address the tax consequences to, and U.S. Holder does not include, persons subject to special provisions of federal income tax law, such as tax-exempt organizations, qualified retirement plans, financial institutions, insurance companies, real estate investment trusts, regulated investment companies, broker-dealers, non-resident alien individuals, persons or entities that have a “functional currency” other than the U.S. dollar, shareholders who hold common shares as part of a straddle, hedging or conversion transaction, and shareholders who acquired their common shares through the exercise of employee stock options or otherwise as compensation for services. This summary is limited to U.S. Holders who own common shares as capital assets. This summary does not address the consequences to a person or entity holding an interest in a shareholder or the consequences to a person of the ownership, exercise or disposition of any options, warrants or other rights to acquire common shares.
Distribution on Common Shares
U.S. Holders receiving dividend distributions (including constructive dividends) with respect to common shares are required to include in gross income for United States federal income tax purposes the gross amount of such distributions equal to the U.S. dollar value of such distributions on the date of receipt (based on the exchange rate on such date), to the extent that the corporation has current or accumulated earnings and profits, without reduction for any Canadian income tax withheld from such distributions. Such Canadian tax withheld may be credited, subject to certain limitations, against the U.S. Holder’s United States federal income tax liability or, alternatively, may be deducted in computing the U.S. Holder’s United States federal taxable income (see more detailed discussion at “Foreign Tax Credit” below). To the extent that distributions exceed current or accumulated earnings and profits of the corporation, they will be treated first as a return of capital up to the U.S. Holder’s adjusted basis in the common shares and thereafter as gain from the sale or exchange of the common shares. Dividend income will be taxed at marginal tax rates applicable to ordinary income while preferential tax rates for long-term capital gains are applicable to a U.S. Holder which is an individual, estate or trust. There are currently no preferential tax rates for long-term capital gains for a U.S. Holder which is a corporation.
- 49 -
In the case of foreign currency received as a dividend that is not converted by the recipient into U.S. dollars on the date of receipt, a U.S. Holder will have a tax basis in the foreign currency equal to its U.S. dollar value on the date of receipt. Gain or loss may be recognized upon a subsequent sale of other disposition of the foreign currency, including the exchange for U.S. dollars.
Dividends paid on the common shares of a corporation will not generally be eligible for the dividends received deduction provided to corporations receiving dividends from certain United States corporations. A U.S. Holder which is a corporation may, under certain circumstances, be entitled to a 70% deduction of the United States source portion of dividends received from a corporation (unless the corporation qualifies as a “foreign personal holding company” or a “passive foreign investment company”, as defined below) if such U.S. Holder owns shares representing at least 10% of the voting power and value of the corporation. The availability of this deduction is subject to several complex limitations which are beyond the scope of this discussion.
Foreign Tax Credit
A U.S. Holder who pays (or has withheld from distributions) Canadian income tax with respect to the ownership of common shares may be entitled, at the option of the U.S. Holder, to either a deduction or a tax credit for such foreign tax paid or withheld. Generally, it will be more advantageous to claim a credit because a credit reduces United States Federal income taxes on a dollar-for-dollar basis, while a deduction merely reduces the taxpayer’s income subject to tax. This election is made on a year-by-year basis and applies to all foreign income taxes (or taxes in lieu of income tax) paid by (or withheld from) the U.S. Holder during the year. There are significant and complex limitations which apply to the credit, among which
- 65 -
is the general limitation that the credit cannot exceed the proportionate share of the U.S. Holder’s United States income tax liability that the U.S. Holder’s foreign source income bears to his/her or its worldwide taxable income. The various items of income and deduction must be classified into foreign and domestic sources. Complex rules govern this classification process. In addition, this limitation is calculated separately with respect to specific classes of income such as “passive income”, “high withholding tax interest”, “financial services income”, “shipping income”, and certain other classifications of income. Dividends distributed will generally constitute “passive income” or, in the case of certain U.S. Holders, “financial services income” for these purposes. The availability of the foreign tax credit and the application of the limitations on the credit are fact specific and holders and prospective holders of common shares of should consult their own tax advisors regarding their individual circumstances.
For individuals whose entire income from sources outside the United States consists of qualified passive income whose total amount of creditable foreign taxes paid or accrued during the taxable year does not exceed US$300 (US$600 in the case of a joint return) and for whom an election is made under section 904(j), the limitation on credit does not apply.
Disposition of Common Shares
A U.S. Holder will recognize gain or loss upon the sale of common shares equal to the difference, if any, between (i) the amount of cash plus the fair market value of any property received, and (ii) the tax basis in the common shares. Preferential tax rates apply to long-term capital gains of U.S. Holders which are individuals, estates, or trusts. This gain or loss will be capital gain or loss if the common shares are capital assets in the hands of the U.S. Holder, which will be a short-term or long-term capital gain or loss depending upon the holding period of the U.S. Holder. Gains and losses are netted and combined according to special rules in arriving at the overall capital gain or loss for a particular tax year. Deductions for net capital losses are subject to significant limitations. For U.S. Holders which are not corporations, any unused portion of such net capital loss may be carried over to be used in later tax years until such net capital loss is thereby exhausted, but individuals may not carry back capital losses. For U.S. Holders which are corporations (other than corporations subject to Subchapter S of the Code), an unused net capital loss may be carried back three years from the loss year and carried forward five years from the loss year to be offset against capital gains until such net capital loss is thereby exhausted.
Foreign Personal Holding Company
If at any time during a taxable year more than 50% of the total combined voting power or the total value of the our outstanding shares is owned, actually or constructively, by five or fewer individuals who are citizens or residents of the United States and 60% (50% after the first tax year) or more of our gross income for such year was derived from certain passive sources, then we would be treated as a “foreign personal holding company.” In that event, U.S. Holders that hold common shares would be required to include in gross income for such year their allocable portions of such passive income to the extent we do not actually distribute such income.
- 50 -
We do not believe we currently have the status of a “foreign personal holding company”. However, there can be no assurance that we will not be considered a foreign personal holding company for any future taxable year.
Passive Foreign Investment Company
As a foreign corporation with U.S. Holders, we potentially could be treated as a passive foreign investment company (“PFIC”), as defined in Section 1297 of the Code, depending upon the percentage of our income which is passive, or the percentage of our assets which are held for the purpose of producing passive income. We do not believe we currently are a PFIC.
The rule governing PFICs can have significant tax effects on U.S. Holders of foreign corporations. These rules do not apply to non-U.S. Holders. Section 1297 of the Code defines a PFIC as a corporation that is not formed in the United States and, for any taxable year, either (i) 75% or more of its gross income is “passive income”, which includes interest, dividends and certain rents and royalties or (ii) the average percentage, by fair market value (or, if the corporation is a controlled foreign corporation or makes an election, by adjusted tax basis), of its assets that produce or are held for the production of “passive income” is 50% or more. The taxation of a US Holder who owns stock in a PFIC is extremely complex and is therefore beyond the scope of this discussion. U.S. Holders should consult with their own tax advisors with regards to the impact of these rules.
Controlled Foreign Corporation
If more than 50% of the voting power of all classes of our common shares entitled to vote is owned, actually or constructively, by citizens or residents of the United States, United States partnerships, corporations, or estates or trusts other
- 66 -
than foreign estates or trusts, each of whom own actually or constructively own 10% or more of the total combined voting power of all classes of our capital stock (“United States Shareholders”), then we would be a “controlled foreign corporation” (CFC). We do not believe we currently are a CFC.
The CFC classification would affect many complex results, one of which is that certain income of a CFC would be subject to current U.S. tax. The United States generally taxes United States Shareholders of a CFC currently on their pro rata shares of the Subpart F income of the CFC. Such United States Shareholders are generally treated as having received a current distribution out of the CFC’s Subpart F income and are also subject to current U.S. tax on their pro rata shares of the CFC’s earnings invested in U.S. property. The foreign tax credit described above may reduce the U.S. tax on these amounts. In addition, under Section 1248 of the Code, gain from the sale or exchange of shares by a U.S. Holder of common shares of a corporation which is or was a United States Shareholder at any time during the five-year period ending with the sale or exchange is treated as ordinary income to the extent of earnings and profits of the corporation (accumulated only while the shares were held by the United States Shareholder and while the corporation was a CFC attributable to the shares sold or exchanged). If a foreign corporation is both a PFIC and a CFC, the foreign corporation generally will not be treated as a PFIC with respect to the United States Shareholders of the CFC. This rule generally will be effective for taxable years of United States Shareholders beginning after 1997 and for taxable years of foreign corporations ending with or within such taxable years of United States Shareholders. The PFIC provisions continue to apply in the case of a PFIC that is also a CFC with respect to the U.S. Holders that are less than 10% shareholders.
F. Dividends and Paying Agents
Not applicable.
G. Statement by Experts
Not applicable.
H. Documents on Display
Any document referred to in this annual report may be inspected at our principal executive officersoffices at Suite 1100, 1199 West Hastings Street, Vancouver, British Columbia Canada V6E 3T5 during regular business hours.
Various documents referenced in this annual report also are included as exhibits to this annual report in accordance with Item 19 of this Form 20-F. We are required to file periodic reports and other information with the SEC. You may read and copy any materials we file with the SEC at its Public Reference Room at 100 F Street, NE, Washington, DC 20549, on official business days during the hours of 10:00 am to 3:00 pm.20549. Please call the SEC at 1-800-SEC-0330 for further
- 51 -
information on the operation of the Public Reference Room. The SEC further maintains an internet website at www.sec.gov that contains reports and other information about issuers like us who file electronically with the SEC.
In addition, we file various documents on the Canadian Securities Administrator’s System for Electronic Document Analysis and Retrieval (SEDAR) at www.sedar.com as required by applicable Canadian law and stock exchanges.
I. Subsidiary Information
Not applicable.
ITEM 11. QUANTITATIVE AND QUALITATIVE DISCLOSURES ON MARKET RISK
Not applicable.The significant market risks to which the Company is exposed are currency, interest rate and other price risk.
Currency risk
The Company operates internationally and is exposed to foreign currency risk from fluctuations in exchange rates between the Canadian dollar and various currencies, primarily US dollars and Mexican pesos. The Company has not hedged its exposure to foreign currency fluctuations.
The Company is exposed to currency risk as follows:
- 67 -
| December 31, 2013 | December 21, 2012 | ||||||||||||
| US | Pesos | US | Pesos | ||||||||||
| Cash | $ | 809,466 | 70,656 | $ | 1,715,415 | 183,410 | |||||||
| Other receivables and restricted cash | 34,500 | - | 69,000 | - | |||||||||
| Due from exploration partners | 45,510 | - | 616,899 | - | |||||||||
| Reclamation bond | 171,160 | - | 171,160 | - | |||||||||
| Accounts payable and accrued liabilities | (306,991 | ) | (74,114 | ) | (343,686 | ) | (760,178 | ) | |||||
| Loan payable | (638,160 | ) | - | - | - | ||||||||
| Derivative liabilities - warrants | (1,102,970 | ) | - | (784,988 | ) | - | |||||||
| Net foreign exposure | $ | (987,485 | ) | (3,458 | ) | $ | 1,443,800 | (576,768 | ) | ||||
Based on the above net foreign currency exposures as at December 31, 2013, and assuming all other variables remain constant, a 5% weakening or strengthening of the Canadian dollar against a) the US dollar would result in a change of $49,374 (2012 - $73,930) in the Company’s loss; and b) the Mexican peso would have no material impact in the Company’s loss for the year.
Interest rate risk
The Company’s cash and cash equivalents are held in bank accounts that earn interest at variable interest rates. Due to the short-term nature of these financial instruments, fluctuations in market rates do not have a significant impact on the estimated fair value as of December 31, 2013. The Company manages interest rate risk by maintaining an investment policy that focuses primarily on preservation of capital and liquidity.
Other price risk
Other price risk is the risk that the future cash flows of a financial instrument will fluctuate due to changes in market prices, other than those arising from currency risk or interest rate risk. The Company’s marketable securities are carried at market value and are therefore directly affected by fluctuations in the market value of the underlying securities. The Company’s sensitivity analysis suggests that a 10% change in market prices would have no material impact on the value of the Company’s marketable securities.
ITEM 12. DESCRIPTION OF SECURITIES OTHER THAN EQUITY SECURITIES
Not applicable.
- 52 -
PART II
ITEM 13.DEFAULTS, DIVIDEND ARREARAGES AND DELINQUENCIES
None.
ITEM 14. MATERIAL MODIFICATIONS TO THE RIGHTS OF SECURITY HOLDERS AND USE OF PROCEEDS
Effective June 18, 2008,12, 2013, in accordance with the vote of shareholders at the 20082013 Annual General Meeting on June 18, 2008,12, 2013, we adopted a rights plan applicable to our common shares (the “Rights Plan”). This Rights Plan replaced an earlier shareholder rights plan dated June 18, 2008. Under the Rights Plan, we issued one right for no consideration in respect of each outstanding common share. All common shares we subsequently issue during the term of the Rights Plan will have one right represented for each common share. The term of the Rights Plan is through the first annual meeting of shareholders held after June 18, 2013.12, 2018. The rights issued under the Rights Plan become exercisable only if a party acquires 20% or more of our common shares without complying with the Rights Plan or without a waiver from our Board of Directors.
Each right entitles the registered holder to purchase from us on the occurrence of certain events, one common share at the price of $100CDN$100 per share, subject to adjustment (the “Exercise Price”). If a “Flip-in Event” as defined in the Rights Plan occurs, each right would then entitle the registered holder to receive, upon payment of the Exercise Price, that number of
- 68 -
common shares that have a market value at the date of that occurrence equal to twice the Exercise Price. The rights are not exercisable until the “Separation Time” as defined in the Rights Plan.
The purpose of the Rights Plan is to ensure, to the extent possible, that all shareholders are treated equally and fairly in connection with any take-over bid or similar proposal to acquire our common shares. Take-over bids may be structured in such a way as to be coercive or discriminatory in effect, or may be initiated at a time when it will be difficult for our Board of Directors to prepare an adequate response. Such offers may result in shareholders receiving unequal or unfair treatment, or not realizing the full or maximum value of their investment in us. The Rights Plan discourages the making of any such offers by creating the potential of significant dilution to any offeror who does so.
An offeror can avoid that potential by making an offer that either: (i) qualifies as a “Permitted Bid” under the Rights Plan, and therefore meets certain specified conditions (including a minimum deposit period of 90 days) which aim to ensure that all shareholders are treated fairly and equally; or (ii) does not qualify as a “Permitted Bid” but is negotiated with and has been exempted by our Board of Directors from the application of the Rights Plan in light of the opportunity to bargain for agreed terms and conditions to the offer that are believed to be in the best interests of shareholders.
Under current Canadian securities laws, any party wishing to make a formal take-over bid for our common shares is required to leave the offer open for acceptance for at least 35 days. To qualify as a “Permitted Bid” under the Rights Plan, however, a take-over bid must remain open for acceptance for not less than 90 days. The Board of Directors believes that the statutory minimum period of 35 days may be insufficient for the directors to: (i) evaluate a take-over bid (particularly if the consideration consists, wholly or in part, of shares of another issuer); (ii) explore, develop and pursue alternative transactions that could better maximize shareholder value; and (iii) make reasoned recommendations to the shareholders. The additional time afforded under a “Permitted Bid” is intended to address these concerns by providing the Board of Directors with a greater opportunity to assess the merits of the offer and identify other possible suitors or alternative transactions, any by providing other bidders or proponents of alternative transactions with time to come forward with competing, and potentially superior, proposals.
ITEM 15. CONTROLS AND PROCEDURES
Disclosure Controls and Procedures
Our management carried out an evaluation, under the supervision and with the participation of our Chief Executive Officer and Chief Financial Officer, of the effectiveness of our disclosure controls and procedures (as such term is defined in Rule 13a-15(e) under the Securities and Exchange Act of 1934, as amended) as of the end of the fiscal year covered by this report. Based on the evaluation, our Chief Executive Officer and Chief Financial Officer concluded that, as of December 31, 2008,2013, our disclosure controls and procedures were effective.
- 53 -
Management’s Annual Report on Internal Control Over Financial Reporting
Our management’s report onmanagement is responsible for establishing and maintaining adequate internal control over financial reporting (“ICFR”) as such term is defined in Rule 13a-15(f) or Rule 15d-15(f) promulgated under the Exchange Act. Management (under the supervision and with the participation of the Chief Executive Officer and the Chief Financial Officer) assessed the effectiveness of our ICFR as of December 31, 2013, using the framework set formforth in Internal Control - Integrated Framework issued by the Committee of Sponsoring Organizations of the Treadway Commission (the COSO 1992 framework). Based on page 59 under Item 17this assessment, our management concluded that our ICFR were effective as of this annual report.December 31, 2013.
TheThis annual report does not include an attestation report of Smythe Ratcliffe LLP, our independent registered public accounting firm on management’s assessment ofregarding our internal control over financial reporting is set forth on page 60 under Item 17 of this annual report.ICFR. Our management's report was not subject to attestation by our registered independent public accounting firm because we are not an accelerated filer or large accelerated filer and exempt as an Emerging Growth Company.
Changes in Internal Control Over Financial Reporting
There were no changes in our internal control over financial reporting during the fiscal year ended December 31, 20082013 that have materially affected, or are reasonably likely to materially affect, our internal control over financial reporting.
- 69 -
Item 16A. Audit Committee financial expert
Our Board of Directors has designated Dr. Robert Gayton asdetermined that Anthony Walsh is an “audit committee financial expert” serving on ourthe Audit Committee of the Company within the criteria prescribed under SEC and NYSE AmexMKT rules. Our Board of Directors has determined that Dr. GaytonAnthony Walsh is an “independent” director as that term is defined under NYSE AmexMKT rules.
Item 16B. Code of Ethics
We have adopted a Code of Business Conduct and Ethics for all our directors, officers, and employees. It includes a Code of Ethical Conduct for Financial Managers that applies to our principal executive officer, principal financial officer, principal accounting officer or controller, or persons performing similar functions. The Code of Business Conduct and Ethics is available in the Governance section of our website at www.quaterraaresources.com. All applicable amendments to and waivers of the Code of Business Conduct Ethics governing our principal executive officer, principal financial officer, principal accounting officer or controller, or persons performing similar functions will be posted on our website and furnished to the SEC on Form 6-K.
Item 16C.Principal Accountant Fees and Services
The following table shows the aggregate fees billed to us by our principal accountant Smythe Ratcliffe LLP, Chartered Accountants, in each of the last two fiscal years.
| Year ended December 31, | Year ended December 31, | |||
| 2008 | 2007 | 2013 | 2012 | |
| Audit Fees | $39,000 | $24,500 | $52,000 | $101,000 |
| Audit-Related Fees | $5,400 | $7,600 | Nil | $900 |
| Tax Fees | $2,800 | $2,750 | $6,000 | $3,000 |
| All Other Fees | $24,380 | $3,040 | - | |
Audit feesare the aggregate fees billed by the Company’s independent auditor for the audit of the Company’s annual consolidated financial statements, reviews of interim consolidated financial statements and attestation services that are provided in connection with statutory and regulatory filings or engagements. Audit-related feesare fees charged by the Company’s independent auditor for assurance and related services that are reasonably related to the performance of the audit or review of financial statements and are not reported under “Audit Fees”. Tax feesare fees for professional services rendered by the Company’s independent auditors for tax compliance and tax advice on actual or contemplated transactions. | |
|
The Audit Committee recommends to the Board of the Directors the external auditor to perform audit, review, and attestation services. The Audit Committee pre-approves all non-audit services provided by our external auditors, and pre-approved the tax fees and the all other fees listed in the table above.
Item 16D.Exemptions from the listing standards for Audit Committees
Not applicable.
Item 16E.Purchases of Equity Securities by the Issuer and Affiliated Purchasers
None.
Item 16F. Change in Registrant’s Certifying Accountant
Not applicable.
- 5470 -
Item 16G. Corporate Governance
Our common shares are listed on the NYSE Amex.Not applicable.
Item 16H. Mine Safety Disclosure
Pursuant to Section 1101503(a) of the NYSE AmexDodd-Frank Wall Street Reform and Consumer Protection Act (The “Dodd-Frank Act”), issuers that are operators, or that have a subsidiary that is an operator, of a coal or other mine in the United States are required to disclose in their periodic reports filed with the SEC information regarding specified health and safety violations, orders and citations, related assessments and legal actions, and mining-related fatalities. During the fiscal year ended December 31, 2013, the Company Guide permitshad no such specified health and safety violations, orders or citations, related assessments or legal actions, mining-related fatalities, or similar events in relation to the exchange to consider the laws, customs and practices of foreign issuers in relaxing listing criteria and to grant exemptions from listing criteria based on these considerations. The sole significant way in which our governance practices differ from those followed by U.S. domestic companiesCompany’s United States operations requiring disclosure pursuant to NYSE Amex listing standards relates to the shareholder meeting quorum requirement. The NYSE Amex minimum quorum requirement for a shareholder meeting is one-thirdSection 1503(a) of the outstanding shares of common stock. In addition, a company listed on the NYSE Amex is required to state its quorum requirement in its bylaws. Our quorum requirement is set forth in our Articles. A quorum for a meeting of our shareholders is one person present in person, being a shareholder entitled to vote thereat or a duly appointed proxy holder for an absent shareholder so entitled.Dodd-Frank Act.
- 55 -
PART III
ITEM 17. FINANCIAL STATEMENTS
Index to Consolidated Financial Statements:
ITEM 18. FINANCIAL STATEMENTS
Not applicable.
ITEM 19.EXHIBITS
The following documents are filed as exhibits to this annual report on Form 20-F:
| Exhibit | |
| Number | Description of Exhibit |
| 1 | Articles of Quaterra Resources Inc., dated December 13, 2007 (incorporated by reference to Exhibit 3.1 to the Company’s Registration Statement on Form 8-A (0-55319) filed February 5, 2014). |
| 2 | Shareholder Rights Plan, dated June 12, 2013 (incorporated by reference to Exhibit 4.1 to the Company’s Registration Statement on Form 8-A (0-55319) filed February 5, 2014). |
| 4 | |
| 8 | |
| 12.1 | |
| 12.2 |
- 5671 -
| Exhibit | |
| Number | Description of Exhibit |
| 13.1 | |
| 13.2 |

SIGNATURES
The registrant hereby certifies that it meets all of the requirements for filing on Form 20-F and that it has duly caused and authorized the undersigned to sign this annual report on its behalf.
QUATERRA RESOURCES INC.
| Dated: March 31, 2014 | By: | /s/ Scott Hean |
| Scott B. Hean | ||
| Chief Financial Officer |
- 73 -
![]()
(An Exploration Stage Company)
Audited Consolidated Financial Statements
December 31, 2008
2013
(Expressed in Canadian Dollars)
- 57 -
Management’s Responsibility for Financial Reporting - Canada
The accompanyingmanagement of Quaterra Resources Inc. is responsible for the integrity and fair presentation of the financial information contained in this annual report. Where appropriate, the financial information, including consolidated financial statements, reflects amounts based on management’s best estimates and judgments. The consolidated financial statements have been prepared by the management of Quaterra Resources Inc. in accordance with Canadian generally accepted accounting principles and have been approvedInternational Financial Reporting Standards, as issued by the Board of Directors. The integrity and objectivity of these consolidated financial statements are the responsibility of management.
In support of this responsibility, management maintains a system of internal controls to provide reasonable assurance as to the reliability of financialInternational Accounting Standards Board. Financial information and the safeguarding of assets. The consolidated financial statements include amounts that are based on the best estimates and judgment of management.
The Board of Directors is responsible for ensuring that management fulfills its responsibility for financial reporting and internal control. The Board of Directors exercises this responsibility principally through the Audit Committee. The Audit Committee consists of three outside directors who are not involvedpresented elsewhere in the daily operations of the Company. The functions of the Audit Committee include the review of the quarterly and annual consolidated financial statements, review of the adequacy of the system of internal controls, review any relevant accounting, financial and security regulatory matters, and recommend the appointment of the external auditors. The Audit Committee meets at least quarterlyreport is consistent with management to satisfy itself that management’s responsibilities are properly discharged and to review the consolidated financial statements prior to their presentation to the Board of Directors for approval.
The external auditors, Smythe Ratcliffe LLP, conducted an independent examination,disclosed in accordance with Canadian generally accepted auditing standards, and expressed their opinion on the consolidated financial statements. Their examination included tests and procedures to provide reasonable assurance that the consolidated financial statements are, in all material respects, presented fairly and in accordance with Canadian generally accepted accounting principles. The external auditors have free and full access to the Audit Committee with respect to their findings concerning the fairness of financial reporting and the adequacy of internal controls.
- 58 -
Management’s Report on Internal Control over Financial Reporting – United States
The management of the CompanyManagement is responsible for establishing and maintaining adequate internal control over financial reporting. The Company’sManagement has established and maintains a system of internal accounting control designed to provide reasonable assurance that assets are safeguarded from loss or unauthorized use, financial information is reliable and accurate and transactions are properly recorded and executed in accordance with management’s authorization. This system includes established policies and procedures, the selection and training of qualified personnel and an organization providing for appropriate delegation of authority and segregation of responsibilities. Any system of internal control over financial reporting, is a processno matter how well designed, to provide reasonable assurance regarding the reliability of financial reporting and the preparation of financial statements for external purposes in accordance with generally accepted accounting principles.
Management conducted an evaluation of the effectiveness of the internal controls over financial reporting based on the framework in Internal Control - Integrated Framework issued by the Committee of Sponsoring Organizations of the Treadway Commission. Because of itshas inherent limitations, internal control over financial reporting may not prevent or detect misstatements.limitations. Therefore, even those systems determined to be effective can provide only reasonable assurance with respect to financial statement preparation and presentation. Also, projections
The Board of any evaluationDirectors oversees management’s responsibility for financial reporting and internal control systems through an Audit Committee, which is composed entirely of effectivenessindependent directors. The Audit Committee meets periodically with management and the independent auditors to future periodsreview the scope and results of the annual audit and to review the consolidated financial statements and related financial reporting and internal control matters before the consolidated financial statements are subjectapproved by the Board of Directors and submitted to the risk that controls may become inadequate because of changes in conditions, or that the degree of compliance with the policies or procedures may deteriorate.Company’s shareholders.
Management assessed the effectiveness of the Company’s internal control over financial reporting as at December 31, 2008. Based on management’s assessment and those criteria, management has concluded that the internal control over financial reporting as at December 31, 2008 was effective.
The effectiveness of the Company’s internal control over financial reporting has been audited by Smythe Ratcliffe LLP, an independent auditors, as statedregistered public accounting firm, appointed by the shareholders, has audited the Company’s consolidated financial statements in theiraccordance with Canadian generally accepted auditing standards and the standards of the Public Company Accounting Oversight Board (United States) and has expressed its opinion in the independent auditors’ report.
| “ | “Scott Hean” (signed) | |
| Steven Dischler | Scott Hean | |
| President and Chief Executive Officer | Chief Financial Officer | |
| March 24, 2014 | ||
| Vancouver, British Columbia, Canada | ||
- 59 -75
REPORT OF THE INDEPENDENT AUDITORSAUDITORS’ REPORT
To the Shareholders of Quaterra Resources Inc.
We have audited the accompanying consolidated balance sheetsfinancial statements of Quaterra Resources Inc., which comprise the consolidated statements of financial position as at December 31, 20082013 and 20072012, and the consolidated statements of operations,comprehensive loss, changes in equity and cash flows and shareholders’ equity for the years ended December 31, 2008, 20072013, 2012 and 2006. These2011, and a summary of significant accounting policies and other explanatory information.
Management's Responsibility for the Consolidated Financial Statements
Management is responsible for the preparation and fair presentation of these consolidated financial statements in accordance with International Financial Reporting Standards, as issued by the International Accounting Standards Board, and for such internal control as management determines is necessary to enable the preparation of consolidated financial statements that are the responsibility of the Company's management. free from material misstatement, whether due to fraud or error.
Auditors’ Responsibility
Our responsibility is to express an opinion on these consolidated financial statements based on our audits.
We conducted our audits in accordance with Canadian generally accepted auditing standards and the standards of the Public Company Accounting Oversight Board (United States). Those standards require that we comply with ethical requirements and plan and perform anthe audit to obtain reasonable assurance about whether the consolidated financial statements are free offrom material misstatement.
An audit includes examining, on a test basis,involves performing procedures to obtain audit evidence supportingabout the amounts and disclosures in the consolidated financial statements. The procedures selected depend on the auditors’ judgment, including the assessment of the risks of material misstatement of the consolidated financial statements, whether due to fraud or error. In making those risk assessments, the auditor considers internal control relevant to the entity's preparation and fair presentation of the consolidated financial statements in order to design audit procedures that are appropriate in the circumstances. An audit also includes assessingevaluating the appropriateness of accounting principlespolicies used and significantthe reasonableness of accounting estimates made by management, as well as evaluating the overall presentation of the consolidated financial statement presentation.statements.
We believe that the audit evidence we have obtained in our audits is sufficient and appropriate to provide a basis for our audit opinion.
Opinion
In our opinion, thesethe consolidated financial statements present fairly, in all material respects, the financial position of the CompanyQuaterra Resources Inc. as at December 31, 20082013 and 20072012, and the results of its operationsfinancial performance and its cash flows for the years ended December 31, 2008, 20072013, 2012 and 2006 in conformity with Canadian generally accepted accounting principles.
We have also audited,2011 in accordance with the standards of the Public Company Accounting Oversight Board (United States), the effectiveness of the Company’s internal control over financial reportingInternational Financial Reporting Standards, as of December 31, 2008 based on criteria established in Internal Control – Integrated Framework issued by the CommitteeInternational Accounting Standards Board.
Emphasis of Sponsoring Organizations forMatter
Without qualifying our opinion, we draw attention to note 1 in the Treadway Commission and our report dated March 24, 2009 expresses an unqualified opinion.
“Smythe Ratcliffe LLP” (signed)
Chartered Accountants
Vancouver, CanadaMarch 24, 2009
COMMENTS BY AUDITORS FOR UNITED STATES READERS – US Reporting Difference
In the United States, reporting standards for auditors require the addition of an explanatory paragraph (following the opinion paragraph) when theconsolidated financial statements, are affected bywhich describes matters and conditions and eventsthat indicate the existence of material uncertainties that cast substantial doubt onabout the Company’s ability to continue as a going concern, such as described in note 1 to the consolidated financial statements. Our report to the shareholders dated March 24, 2009, is expressed in accordance with Canadian reporting standards, which do not permit a reference to such events and conditions in the auditors’ report when these are adequately disclosed in the financial statements.concern.
“"Smythe Ratcliffe LLP”LLP" (signed)
Chartered Accountants
Vancouver, Canada
March 24, 20092014
- 60 -76
REPORT OF INDEPENDENT AUDITORS
To the Board of Directors of
(i) Initial payment of US $20,000 (paid)(ii) US$20,000 on or before February 15, 2008 (paid)(iii) US$20,000 on or before February 15, 2009 (paid)(iv) US$40,000 on or before February 15, 2010(v) US$50,000 on or before February 15, 2011(vi) US$50,000 on or before February 15, 2012(vii) US$100,000 on or before February 15, 2013(viii) US$100,000 on or before February 15, 2014(ix) US$100,000 on or before February 15, 2015(x) US$250,000 on or before February 15, 2016(xi) US$250,000 on or before February 15, 2017
Alternatively, the Company may acquire the property at any time by paying US$1,000,000 less any previously paid amounts. The property is subject to a 2% NSR, 1% of which the Company may purchase for US $1,000,000.
Pursuant to another agreement made in August 2007, the Company acquired the right to earn an interest in furthercertain unpatented mining claims, which also formforms part of the S.W.South West Tintic Claims in Juab County, Utah. To earn a 100% interest, the Company iswas required to make the following payments:US$1,000,000 option payments (US$60,000 paid) over ten years.
(i) Initial payment of US $254,410 (paid)(ii) US$5,000 deposit (paid)(iii) U $275,000 promissory note on or before August 29, 2008 (paid)(iv) US$275,000 promissory note on or before August 29, 2009
The US$550,000 promissory note has a term of two years, with no interest. The Company has guaranteed full payment of this note. The Company repaid US$275,000 on August 29, 2008. The remaining US$275,000 ($334,950) is due on August 29, 2009.
- 81 -94
| Quaterra Resources Inc. |
| Notes to Consolidated Financial Statements |
| For the years ended December 31, |
| (Expressed in Canadian dollars) |
|
|
vii. Wassuk Copper Project (formerly Majuba Hill)Effective May 29, 2009, subsequently amended; the Company signed an earn-in agreement with Freeport-McMoRan Exploration Corporation (“FMEC”) of Phoenix, Arizona, for the property. Under the terms of the agreement, FMEC has the exclusive right and option to acquire a 70% ownership interest in this property by making a US$275,000 property payment (paid) and by spending US$4,725,000 on exploration over five years.
The property is subject to a 2% NSR on commencement of commercial production, which may be reduced to 1% for US$1,000,000.
| g) | Goldfield East Claims, Nevada |
On June 15, 2011, the Company entered into an option agreement with Nevada Alaska Mining Co., Inc. to acquire a 100% interest in certain mining claims in Esmeralda County, Nevada, for US$1,000,000 over ten years:
| (i) | US$20,000 upon execution (paid) | |
| (ii) | US$20,000 each on or before June 15, 2012 (paid) and 2013 (paid) | |
| (iii) | US$40,000 on or before June 15, 2014 | |
| (iv) | US$50,000 each on or before June 15, 2015 and 2016 | |
| (v) | US$100,000 each on or before June 15, 2017, 2018 and 2019 | |
| (vi) | US$250,000 each on or before June 15, 2020 and 2021. |
The property is subject to a 2% NSR on commencement of commercial production.
| h) | Poker Brown Project, Nevada |
On August 24, 2012, the Company entered into an option agreement with Nevada Alaska Mining Co., Inc. to acquire a 100% interest in certain mining claims in Pershing County, Nevada, for US$1,000,000 payable over ten years as follows:
| (i) | US$20,000 upon execution (paid) | |
| (ii) | US$20,000 each on or before August 24, 2013 (paid) and 2014 | |
| (iii) | US$40,000 on or before August 24, 2015 | |
| (iv) | US$50,000 each on or before August 24, 2016 and 2017 | |
| (v) | US$100,000 each on or before August 24, 2018, 2019 and 2020 | |
| (vi) | US$250,000 each on or before August 24, 2021 and 2022. |
A 2.5% NSR is required upon commercial production of which 0.5% can be purchased at US$500,000.
95
| Quaterra Resources Inc. |
| Notes to Consolidated Financial Statements |
| For the years ended December 31, 2013, 2012 and 2011 |
| (Expressed in Canadian dollars) |
| 6. | Mineral properties, continued |
| i) | Reveille Property, Nevada |
Pursuant to an agreement made in August 2010, the Company entered into a lease with an option to purchase certain mining claims known as the Reveille claims in Nye County, Nevada. The total consideration is US$1,000,000 over ten years as follows:
| (i) | US$20,000 each execution (paid) and on or before July 31, 2011 (paid) and 2012 (paid) | |
| (ii) | US$40,000 on or before November 30, 2013 (paid) | |
| (iii) | US$50,000 each on or before July 31, 2014 and 2015 | |
| (iv) | US$100,000 each on or before July 31, 2016 and 2017 | |
| (v) | US$100,000 on or before July 31, 2018 | |
| (vi) | US$250,000 each on or before July 31, 2019 and 2020. |
The property is subject to a 2% NSR on commencement of commercial production of which 1% can be bought down for US$1,000,000.
| j) | Herbert Gold Project, Alaska |
Pursuant to a joint venture agreement in June 2010 with Grande Portage Resources Ltd. (“Grande Portage”), the Company maintains a 35% interest in the Herbert Gold property while Grande Portage earned a 65% interest by having spent US$1,250,000 by June 15, 2012. The two parties bear their proportionate share of the costs for the further exploration and development of the property. If any party does not contribute their proportionate share of such costs, then the joint venture agreement includes a dilution formula whereby if any party's interest is reduced to 10% or less, its interest will be automatically converted into a 1% NSR, which may be acquired by the other party at any time for US$1,000,000.
Pursuant to an agreement made in DecemberNovember 2007, the Company, acquiredand subsequent to June 2010 the right to earn an interest in certain mining claims, known as the Majuba Hill in Mineral County, Nevada. To earn a 100% interest, the Companyjoint venture between Quaterra and Grande Portage, is required to make stagedannual payments totaling US $3,000,000 by December 10, 2015of US$12,000 from November 2007 to 2011 (paid), US$20,000 from November 2012 (paid to date) to 2017, and US$30,000 from November 2018 and every consecutive anniversary thereafter.
The property is subject to a NSR on commencement of commercial production as follows:
| (i) | 3.0% on gold prices less than US$400/ounce | |
| (ii) | 3.5% on gold prices between US$401/ounce and US$500/ounce | |
| (iii) | 4.0% on gold prices between US$501/ounce and US$600/ounce | |
| (iv) | 5.0% on gold prices above US$601/ounce. |
| k) | Cave Peak Molybdenum Prospect, Texas |
(i) Initial payment of US $100,000 (paid)(ii)Pursuant to an option agreement made in March 2007, the Company may acquire a 100% interest in certain prospect permits. The option payments are as follows: US$100,000230,000 on or before December 10, 2008 (US$55,000 was paid; the balance was renegotiated and due June 30, 2009)(iii)March 27, 2010 (paid); US$100,000150,000 on or before December 10, 2009(iv)March 27, 2011 (paid by FMEC); and US$250,000220,000 on or before December 10,March 27, 2012 (paid by FMEC).
96
| Quaterra Resources Inc. |
| Notes to Consolidated Financial Statements |
| For the years ended December 31, 2013, 2012 and 2011 |
| (Expressed in Canadian dollars) |
| 6. | Mineral properties, continued |
| k) | Cave Peak Molybdenum Prospect, Texas, continued |
On July 24, 2009, the Company acquired a mining lease with the state of Texas for 19 years for a total of US$120,462 (US$30,462 paid); US$35,000 is due upon the submittal of an initial plan of operations to conduct exploration; and US$55,000 on submittal of a supplemental plan of operations to conduct mining. If production has not commenced before one year of the date of the lease, the lease will be terminated unless delay payments are made on anniversary dates during the lease term as follows:
| (i) | US$26,190 on July 24, 2010 (paid) | |
| (ii) | US$26,190 on each anniversary date between 2011 and 2013 (all paid by FMEC) | |
| (iii) | US$39,280 on each anniversary date between 2014 and 2018 | |
| (iv) | US$78,560 on each anniversary date between 2019 and 2023 | |
| (v) | US$104,750 on each anniversary date between 2024 and 2027. |
Effective November 1, 2010,(v) as amended February 3, 2012, the Company entered into an option agreement with FMEC, which allows FMEC to earn 70% of this property by paying future land and lease holding costs and by spending US$250,000 on or before December 10, 2011(vi) US$500,000 on or before December 10, 2012(vii) US$500,000 on or before December 10, 2013(viii) US$500,000 on or before December 10, 2014(ix) US$700,000 on or before December 10, 2015
The Company must also incur cumulative US$1,000,000 cumulative5,000,000 in exploration expenditures by December 10, 2012. Should31, 2016. Except for the Company incur less than US$1,000,000 the Company must pay the shortfall to the vendor by December 10, 2012.2011 land holding costs, which are a firm commitment, all other exploration expenditures are optional.
On commencement of mining operations theThis property is subject to a production royalty of 6.25% on commencement of commercial production with an annual advanced minimum royalty (“AMR”) of US$500,000.
| l) | Nieves Silver Concessions, Mexico |
The Company owns equal interest in the Nieves silver property located in northern Zacatecas, Mexico with its US-based joint venture partner, Blackberry Ventures 1, LLC (“Blackberry”). All work plans are made in consultation with the joint venture partner, Blackberry, which contributes its share of ongoing exploration costs plus a 10% administration fee. As at December 31, 2013, Blackberry owed $49,468 (2012 - $613,753) for their share of exploration expenditures, which has subsequently been received by the Company.
The Nieves concessions are subject to a maximum 3% NSR 1% ofto the original concession holders, which the Company may purchase at any time for US$1,000,000.
2,000,000. In addition, other properties include Big Bar, Carbon County, and Peg Leg properties inKennecott Exploration Company, the United States, and Jaboncillos, Cerro Blanco, Inde Durango, La Reforma, Carolina, and Azafranes properties in Mexico. All these properties areoptionor in the initial stagesUnderlying Agreement, retained a 2% NSR on certain core claims and 1% on certain peripheral claims. On January 24, 2007, this NSR was purchased by Royal Gold Inc. Commencing January 26, 2004; an AMR payment of exploration.US$75,000 is due to the concession holders until the commencement of commercial production.
(i) Realization97
| Quaterra Resources Inc. |
| Notes to Consolidated Financial Statements |
| For the years ended December 31, 2013, 2012 and 2011 |
| (Expressed in Canadian dollars) |
| 6. | Mineral properties, continued |
| m) | Goldcorp – Investment Framework Agreement (“IFA”) |
On January 29, 2010, the Company entered into an IFA with Goldcorp to fund the Company’s mining properties in central Mexico totaling US$10,000,000 over a two year period. In April 2012, the IFA was extended to January 29, 2013 for $2,480,000 through the issue of 4,000,000 common shares of the Company to Goldcorp.
During the year ended December 31, 2013, the IFA was further amended to extend the expiration for designation of Advanced Exploration Properties from January 2014 to January 2016. The amended terms include: i) lowering spending requirements to earn a 2% NSR from $2,000,000 over the first two years to $1,000,000 over the first three years; ii) lowering the minimum annual expenditure requirement after three years from $1,000,000 to $250,000; iii) allowing Goldcorp to pool expenditures from other projects to one project to meet the earn-in requirement described above.
On September 18, 2013, the Company announced the sale of three of its properties in central Mexico to Goldcorp for a total cash consideration of US$435,000 ($451,074) including taxes, which resulted in a loss of $2,774,114. The Company will retain a 2% NSR on each property for a maximum amount of US$2,000,000 per property.
| n) | Impairments |
In 2013, management assessed the Company’s ability to continue exploration activities on all of its mineral properties and made a decision to focus exploration efforts only on certain key properties and allow other claims to lapse. Accordingly, the following mineral properties were fully impaired to net loss:
| (i) | Uranium properties – $12,589,114 | |
| (ii) | Missouri Flat – $117,860 | |
| (iii) | Copper Canyon – $576,533 | |
| (iv) | All Mexico properties other than Nieves – $12,929,477. |
| o) | Realization of assets |
The Company’s investment in and expenditures on mineral property interests comprise a significant portion of the Company’s assets. Realization of the Company’s investment in the assets is dependent on establishing legal ownership of the property interest, and on the attainment of successful commercial production or from the proceeds of its disposal. The recoverabilityattainment of the amounts shown for the mineral property interestcommercial production is in turn dependent upon the existence of economically recoverable reserves, the ability of the Company to obtain necessary financing to complete the development of the property interest, and upon future profitable production or proceedsproduction.
98
| Quaterra Resources Inc. |
| Notes to Consolidated Financial Statements |
| For the years ended December 31, 2013, 2012 and 2011 |
| (Expressed in Canadian dollars) |
| 6. | Mineral properties, continued |
| p) | Title to mineral properties |
Title to mineral properties involves certain inherent risks due to the difficulties of determining the validity of certain claims as well as the potential for problems arising from the disposition thereof.
(j) Title
frequently ambiguous conveyance history of many mineral properties. Although the Company has taken steps to ensure the title to the mineral property in which it has an interest, in accordance with industry standards for the current stage of exploration of such properties, these procedures may not guarantee the Company’s title. Property title may be subject to unregistered prior agreements or transfers and title may be affected by undetected defects.
| q) | Environmental matters |
- 82 -The Company is subject to the laws and regulations relating to environmental matters in all jurisdictions in which it operates, including provisions relating to property reclamation, discharge of hazardous material and other matters. With the exception of the Yerington property, the Company may also be held liable should environmental problems be discovered that were caused by former owners and operators. The Company conducts its mineral exploration activities in compliance with applicable environmental protection legislation.
| 7. | Derivative liability – warrants |
During the year ended December 31, 2013, the Company issued 29,810,000 share purchase warrants (2012 -6,541,571) as part of a private placement offering (Note 8).
As these warrants have an exercise price denominated in a currency that is different from the Company’s functional currency, they are classified as derivative liabilities and carried at their fair values. Any changes in the fair value from period to period are recorded as a gain or loss in the results of operations for the year.
The fair value of each warrant was estimated to be US$0.089 on the date issued and subsequently remeasured at December 31, 2013 to be US$0.037 using the Black-Scholes option pricing model assuming an expected volatility of 100%, a risk-free interest rate of 1.07%, a dividend yield of 0% and an expected term of 2.7 years.
The fair value of each warrant issued in 2012 was estimated at US$0.12 on the date issued and subsequently re-measured at December 31, 2012 with no changes in fair value using the Black-Scholes option pricing model assuming an expected volatility of 85%, a risk-free interest rate of 1.10%, a dividend yield of 0% and an expected term of 2 years.
The subsequent re-measurement of the warrants issued in 2012 as at December 31, 2013 was calculated using the Black-Scholes option pricing model using an expected volatility of 91%, a risk-free interest rate of 1.07%, a dividend yield of 0% and an expected term of one year.
Option pricing models require the input of subjective assumptions including the expected price volatility, which was determined based on the historical volatility over the estimated life of the warrants. Changes in the assumptions can materially affect the fair value estimate.
99
| Quaterra Resources Inc. |
| Notes to Consolidated Financial Statements |
| For the years ended December 31, |
| (Expressed in Canadian dollars) |
| 7. |
|
(k) Environmental
Environmental legislation is becoming increasingly stringentThe following table sets out the changes in derivative liability warrants during the years ended December 31, 2013 and costs and expenses of regulatory compliance are increasing. The impact of new and future environmental legislation on the Company’s operations may cause additional expenses and restrictions. If the restrictions adversely affect the scope of exploration and development on the mineral property interest, the potential for production on the property may be diminished or negated.2012:
| Number of | Fair value | Weighted average | |||||||||||
| warrants | assigned | exercise price | |||||||||||
| At December 31, 2012 | 6,541,571 | $ | 774,673 | USD | 0.53 | ||||||||
| Issuance of derivative warrants | 29,810,000 | 2,781,003 | USD | 0.15 | |||||||||
| Change in fair value estimates | - | (2,363,892 | ) | ||||||||||
| At December 31, 2013 | 36,351,571 | $ | 1,191,784 | USD | 0.22 | ||||||||
| 8. |
|
| |
| |
| |
|
| ||
The Company |
One whole non-transferable warrant allows the holder the right to purchase one common share at a price of US$0.75. The warrants expire 24 months from date of issuance. The warrants contain a provision that in the event the Company’s common shares trade at a closing price of greater than US$1.00 per share for a period of 10 consecutive days at any time after issue of the warrant, the Company may accelerate the expiry date of the warrants by providing notice to the holders thereof and in such case the warrants will expire on the thirtieth day after notice.
As of December 31, 2008, 4,362,791 of the above warrants were issued of which 1,921,458 expire on November 27, 2010 and 2,441,333 expire on December 18, 2010.
- 83 -
| |
|
| December 31, 2008 | |||
| Present value of convertible notes on issue | $ | 2,929,161 | |
| Interest on debt | 17,567 | ||
| Additional debt accretion | 6,642 | ||
| Liability component of convertible notes | $ | 2,953,370 | |
| Equity component of convertible notes | $ | 259,164 |
| ||
| ||
| b) | On | |
| ||
- 84 -
|
|
| December 31, 2008 | December 31, 2007 | ||||||||||||
| Weighted | Weighted | ||||||||||||
| Number of | Average | Number of | Average | ||||||||||
| Warrants | Exercise Price | Warrants | Exercise Price | ||||||||||
| Outstanding, beginning of the year | – | $ | – | 2,623,928 | $ | 2.25 | |||||||
| Issued pursuant to | |||||||||||||
| Private placement | 1,741,250 | $ | 4.13 | – | $ | – | |||||||
| Convertible notes | 4,362,791 | $ | 0.91 | – | $ | – | |||||||
| Cancelled or expired | – | $ | – | (143,143 | ) | $ | 2.25 | ||||||
| Exercised | – | $ | – | (2,480,785 | ) | $ | 2.25 | ||||||
| Outstanding, end of the year | 6,104,041 | $ | 1.83 | – | $ | – | |||||||
| ||
| ||
| c) | On December | |
| d) | On April 12, 2012, the | |
The original IFA entered into January 29, 2010 provided Goldcorp with an option to acquire a certain interest in the Company’s |
| December 31, 2008 | December 31, 2007 | ||||||||||||
| Weighted | Weighted | ||||||||||||
| Number of | Average | Number of | Average | ||||||||||
| Options | Exercise Price | Options | Exercise Price | ||||||||||
| Outstanding, beginning of year | 5,559,500 | $ | 1.99 | 5,427,000 | $ | 0.92 | |||||||
| Granted | 2,390,000 | $ | 3.31 | 2,261,000 | $ | 3.29 | |||||||
| Exercised | (749,000 | ) | $ | 0.74 | (2,108,500 | ) | $ | 0.84 | |||||
| Forfeited | – | $ | – | (20,000 | ) | $ | 3.33 | ||||||
| Outstanding, end of year | 7,200,500 | $ | 2.56 | 5,559,500 | $ | 1.99 | |||||||
- 85 -100
| Quaterra Resources Inc. |
| Notes to Consolidated Financial Statements |
| For the years ended December 31, |
| (Expressed in Canadian dollars) |
| 9. |
|
Stock |
The Company has a stock option plan (the “Plan”), which is approved by the shareholders annually. The Plan is designed to attract and retain individuals and to reward them for current and expected future performance. Options generally are granted for a maximum term of five years and expire 90 days following the termination of the optionee’s agreement. The exercise price for the options is set at the closing market price of the common shares on the grant date. The vesting period of options vary with terms determined by the board of directors. Under the Plan, the Company is authorized to grant stock options of up to 10% of the number of common shares issued and outstanding of the Company at any given time.
The following table presents changes in stock options for the years ended December 31, 2013 and 2012:
| December 31, 2013 | December 31, 2012 | ||||||||||||
| Weighted Average | Weighted Average | ||||||||||||
| Number of Options | Exercise Price | Number of Options | Exercise Price | ||||||||||
| Outstanding, beginning of year | 14,010,000 | $ | 1.16 | 11,460,000 | $ | 1.53 | |||||||
| Granted | 3,955,000 | $ | 0.16 | 3,695,000 | $ | 0.47 | |||||||
| Expired | (1,655,000 | ) | $ | (2.47 | ) | (1,145,000 | ) | $ | 2.61 | ||||
| Outstanding, end of year | 16,310,000 | $ | 0.78 | 14,010,000 | $ | 1.16 | |||||||
| Exercisable, end of year | 15,710,000 | $ | 0.81 | 13,635,000 | $ | 1.17 | |||||||
101
| Quaterra Resources Inc. |
| Notes to Consolidated Financial Statements |
| For the years ended December 31, 2013, 2012 and 2011 |
| (Expressed in Canadian dollars) |
| 9. | Share-based payments, continued |
| a) | Stock options, continued |
The following table summarizes information about the stock options outstanding by expiry dates:
| Exercise | Options Outstanding | ||||||||||||
| price | Fair Value | Expire Date | December 31, 2013 | December 31, 2012 | |||||||||
| $ 3.45 | $ 2.05 | March 31, 2013 | - | 150,000 | |||||||||
| $ 3.30 | $ 1.87 | June 19, 2013 | - | 905,000 | |||||||||
| $ 0.98 | $ 0.52 | November 9, 2014 | 1,705,000 | 1,745,000 | |||||||||
| $ 1.02 | $ 0.51 | November 9, 2014 | 2,095,000 | 2,095,000 | |||||||||
| $ 2.00 | $ 1.22 | January 14, 2015 | - | 40,000 | |||||||||
| $ 1.80 | $ 0.85 | April 1, 2015 | 100,000 | 100,000 | |||||||||
| $ 1.76 | $ 0.97 | April 22, 2015 | 200,000 | 200,000 | |||||||||
| $ 1.29 | $ 0.75 | August 9, 2015 | 1,535,000 | 1,605,000 | |||||||||
| $ 1.55 | $ 0.90 | October 6, 2015 | 65,000 | 65,000 | |||||||||
| $ 1.51 | $ 0.90 | November 3, 2015 | 100,000 | 100,000 | |||||||||
| $ 0.60 | $ 0.12 | December 31, 2015 | 400,000 | 400,000 | |||||||||
| $ 1.60 | $ 0.96 | March 24, 2016 | 275,000 | 305,000 | |||||||||
| $ 1.25 | $ 0.74 | August 9, 2016 | 2,635,000 | 2,800,000 | |||||||||
| $ 0.90 | $ 0.51 | October 24, 2016 | 300,000 | 300,000 | |||||||||
| $ 0.50 | $ 0.32 | March 27, 2017 | 100,000 | 100,000 | |||||||||
| $ 0.45 | $ 0.28 | June 28, 2017 | 2,845,000 | 3,100,000 | |||||||||
| $ 0.16 | $ 0.12 | September 19, 2018 | 3,955,000 | - | |||||||||
| Total stock options outstanding | 16,310,000 | 14,010,000 | |||||||||||
The weighted average remaining contractual life for options outstanding and exercisable aton December 31, 2008:2013 was 2.73 (2012 – 2.91) years and 2.65 (2012 – 2.90) years, respectively.
| Options Outstanding | Options Exercisable | |||||
| Weighted | Weighted | |||||
| Weighted | Average | Weighted | Average | |||
| Average | Remaining | Average | Remaining | |||
| Number | Exercise Price | Contractual Life | Expiry Date | Number | Exercise Price | Contractual Life |
| 95,000 | $ 0.62 | 0.23 | March 25, 2009 | 95,000 | $ 0.62 | 0.23 |
| 285,200 | $ 0.35 | 1.60 | August 9, 2010 | 285,200 | $ 0.35 | 1.60 |
| 200,000 | $ 0.40 | 2.02 | January 9, 2011 | 200,000 | $ 0.40 | 2.02 |
| 125,000 | $ 1.04 | 2.23 | March 27, 2011 | 125,000 | $ 1.04 | 2.23 |
| 75,000 | $ 1.00 | 2.38 | May 19, 2011 | 75,000 | $ 1.00 | 2.38 |
| 100,000 | $ 1.12 | 2.44 | June 12, 2011 | 100,000 | $ 1.12 | 2.44 |
| 1,439,300 | $ 1.55 | 2.57 | July 28, 2011 | 1,439,300 | $ 1.55 | 2.57 |
| 100,000 | $ 1.55 | 2.64 | August 23, 2011 | 100,000 | $ 1.55 | 2.64 |
| 100,000 | $ 1.50 | 2.73 | September 25, 2011 | 100,000 | $ 1.50 | 2.73 |
| 100,000 | $ 2.05 | 3.22 | December 18, 2011 | 100,000 | $ 2.05 | 3.22 |
| 75,000 | $ 2.65 | 3.03 | January 11, 2012 | 75,000 | $ 2.65 | 3.03 |
| 25,000 | $ 2.70 | 3.14 | February 21, 2012 | 25,000 | $ 2.70 | 3.14 |
| 2,011,000 | $ 3.33 | 3.55 | July 20, 2012 | 2,011,000 | $ 3.33 | 3.55 |
| 80,000 | $ 3.33 | 3.60 | August 7, 2012 | 80,000 | $ 3.33 | 3.60 |
| 200,000 | $ 3.45 | 4.25 | March 31, 2013 | 200,000 | $ 3.45 | 4.25 |
| 2,190,000 | $ 3.30 | 4.47 | June 19, 2013 | 887,500 | $ 3.30 | 4.47 |
| 7,200,500 | $ 2.56 | 3.40 | 5,898,000 | $ 2.40 | 3.40 | |
On February 3, 2014, 90,000 stock options at a weighted exercise price of $0.65 expired unexercised due to forfeiture.
The fair value of options granted was calculated usingCompany uses the following weighted average assumptions in the Black-Scholes option pricing model withto fair value the following weighted average assumptions:options granted:
| Years ended December 31, | |||||||||
| 2008 | 2007 | 2006 | |||||||
| Risk–free interest rate | 3.84% | 4.57% | 4.02% | ||||||
| Expected share price volatility | 85.79% | 89.42% | 121.60% | ||||||
| Expected option life in years | 3.0 | 3.0 | 3.5 | ||||||
| Forfeiture rate | 0% | 0% | 0% | ||||||
| Expected dividend yield | 0% | 0% | 0% | ||||||
| December 31, 2013 | December 31, 2012 | December 31, 2011 | ||||||||
| Weighted average share price | $ | 0.16 | $ | 0.44 | $ | 1.26 | ||||
| Risk-free interest rate | 1.72% | 1.11% | 1.13% | |||||||
| Expected share price volatility | 96% | 82% | 89% | |||||||
| Expected option life in years | 5.0 | 3.9 | 4.0 | |||||||
| Forfeiture rate | 0% | 0% | 0% | |||||||
| Expected dividend yield | 0% | 0% | 0% |
- 86 -102
| Quaterra Resources Inc. |
| Notes to Consolidated Financial Statements |
| For the years ended December 31, |
| (Expressed in Canadian dollars) |
| 9. |
|
Stock |
Volatility was determined based on the historical volatility over the estimated lives of the options.
The share-based payments expense is incurred as follows:
| Years ended December 31, | ||||||||||
| 2013 | 2012 | 2011 | ||||||||
| Consultants | $ | 96,559 | $ | 368,835 | $ | 1,078,605 | ||||
| Directors and officers | 336,745 | 460,455 | 1,018,476 | |||||||
| Employees | 26,673 | 217,227 | 749,626 | |||||||
| $ | 459,977 | $ | 1,046,517 | $ | 2,846,707 | |||||
| b) | Share purchase warrants |
The numberfollowing table presents changes in warrants for the years ended December 31, 2013 and 2012:
| December 31, 2013 | December 31, 2012 | ||||||||||||
| Number of | Weighted Average | Number of | Weighted Average | ||||||||||
| Warrants | Exercise Price | Warrants | Exercise Price | ||||||||||
| Outstanding, beginning of year | 8,188,274 | $ | 0.88 | 9,009,512 | $ | 1.94 | |||||||
| Issued | 29,810,000 | $ | 0.15 | 6,541,571 | $ | 0.53 | |||||||
| Expired | (1,646,703 | ) | $ | 2.27 | (7,362,809 | ) | $ | 1.87 | |||||
| Outstanding, end of year | 36,351,571 | $ | 0.23 | 8,188,274 | $ | 0.88 | |||||||
The following summarizes information about the share purchase warrants as of options issuedDecember 31, 2013 and the fair value of options expensed included in the statements of operations are as follows:2012:
| December 31, 2008 | December 31, 2007 | December 31, 2006 | |||||||||||||||||
| Number | Number | Number | |||||||||||||||||
| of Options | Stock–based | of Options | Stock–based | of Options | Stock–based | ||||||||||||||
| Issued | Compensation | Issued | Compensation | Issued | Compensation | ||||||||||||||
| Consulting | 975,000 | $ | 933,628 | 1,155,000 | $ | 2,260,416 | 1,315,000 | $ | 1,476,044 | ||||||||||
| Directors and officers | 1,095,000 | 1,606,898 | 855,000 | 1,745,631 | 725,000 | 749,697 | |||||||||||||
| Employees | 320,000 | 418,312 | 251,000 | 496,116 | 870,000 | 819,263 | |||||||||||||
| Total | 2,390,000 | $ | 2,958,838 | 2,261,000 | $ | 4,502,163 | 2,910,000 | $ | 3,045,004 | ||||||||||
| Expiry date | Exercise price | December 31, 2013 | December 31, 2012 | ||||||||||
| February 7, 2013 | $ | 2.27 | - | 1,646,703 | |||||||||
| December 28, 2014 | USD | 0.53 | 6,541,571 | 6,541,571 | |||||||||
| September 13, 2016 | USD | 0.15 | 29,810,000 | - | |||||||||
| 36,351,571 | 8,188,274 |
| 10. |
|
Key management comprises directors and executive officers. Certain executive officers are entitled to termination benefits equal to up to two years’ gross salary amounting to $1,600,000 in the event of a change of control. The Company has no post-employment benefits and other long-term employee benefits.
103
| Quaterra Resources Inc. |
| Notes to Consolidated Financial Statements |
| For the years ended December 31, 2013, 2012 and 2011 |
| (Expressed in Canadian dollars) |
| 10. | Compensation of key management, continued |
Compensation awarded to key management was as follows:
| Years ended December 31, | ||||||||||
| 2013 | 2012 | 2011 | ||||||||
| Salaries and employee benefits | $ | 607,322 | $ | 918,297 | $ | 805,770 | ||||
| Directors' fees | - | 126,971 | 110,294 | |||||||
| Share-based payments (note 9(a)) | 336,745 | 460,455 | 1,018,476 | |||||||
| $ | 944,067 | $ | 1,505,723 | $ | 1,934,540 | |||||
Per a board resolution in May 2013, until further notice, directors’ fees were suspended and no longer accrued.
| 11. | Related party transactions |
The Company’s related parties consist of companies owned by executive officers or directors. The following fees and expenses were incurred in the normal course of operations:
| Years ended December 31, | ||||||||||
| 2013 | 2012 | 2011 | ||||||||
| Manex Resources Group(a) | $ | 463,024 $ | 535,349 | $ | 514,577 | |||||
| Lawrence Page Q.C. Law Corp(b) | 14,187 | 4,115 | 6,410 | |||||||
| Atherton Enterprises Ltd.(c) | 88,542 | 157,880 | 175,000 | |||||||
| $ | 565,753 $ | 697,344 | $ | 695,987 | ||||||
| a) | Manex Resources Group (“Manex”) is a private company owned by the Corporate Secretary that provides general office and administrative services. As of December 31, 2013, $nil (2012 - $26,374) was still owing in due to related parties. | |
|
| ||
| c) | Atherton Enterprises Ltd. is a private company owned by an officer that provides CFO services to the Company. Effective December 1, 2013, Mr. Scott Hean became a salaried employee of the Company. |
| 12. | Loan payable |
During the year ended December 31, 2013, the former President and CEO of the Company, Tom Patton, advanced three loans to the Company in the principal amount of US$800,000 of which US$200,000 was repaid. The loans are unsecured, bear annual interest at 10% per annum and are repayable as follows:
| a) | US$500,000 due on demand; | |
| b) | US$100,000 due on December 5, 2013 |
The principal and interest amount owing at December 31, 2013 amounted to $689,038 (US$638,160). The loans were re-negotiated in March 2014 so that the entire balance of US$600,000 is now due on demand with a 40-day notice period.
104
| Quaterra Resources Inc. |
| Notes to Consolidated Financial Statements |
| For the years ended December 31, 2013, 2012 and 2011 |
| (Expressed in Canadian dollars) |
| 13. | Commitments |
| a) | On February 9, 2012, the Company renewed its service agreement with Manex for its Vancouver head office administration and corporate services at a monthly rate of $15,750 for office rent plus accounting and administration services provided at agreed market rates for a five-year term expiring August 31, 2017. The service agreement was amended September 1, 2013 to reduce the fee for services to a monthly rate of $11,667 and again on March 1, 2014 to reduce office rent to $8,000 per month. The Company may terminate the agreement by paying Manex the lesser of $96,000 or a total fee owing for the remainder of the term. | |
| b) | On March 1, 2011, the Company’s US subsidiary entered into a lease agreement for its premises located in the city of Yerington, Nevada. The initial term of the lease is three years with an option to extend for an additional three years. The lease is currently extended to February 28, 2015 at US$3,400 per month. | |
| c) | As of December 31, 2013, the Company had the following commitments related to its office premises in Vancouver, British Columbia and Yerington, Nevada: |
| December 31, 2014 | $ | 146,522 | |||
| December 31, 2015 | 103,232 | ||||
| December 31, 2016 | 96,000 | ||||
| December 31, 2017 | 64,000 | ||||
| $ | 409,754 |
| 14. | Supplemental cash flow information |
| For the years ended | December 31, | December 31, | December 31, | |||||||
| 2013 | 2012 | 2011 | ||||||||
| Non-cash items | ||||||||||
| Mineral property expenditures included in accounts payable | $ | 139,860 | $ | 302,366 | $ | 1,415,599 | ||||
| Non-cash share issue costs | $ | - | $ | - | $ | - | ||||
| Shares received for mineral properties | $ | - | $ | - | $ | - | ||||
| Shares issued for mineral properties | $ | 95,000 | $ | - | $ | - |
105
| Quaterra Resources Inc. |
| Notes to Consolidated Financial Statements |
| For the years ended December 31, 2013, 2012 and 2011 |
| (Expressed in Canadian dollars) |
| 15. | Deferred income taxes |
| a) | A reconciliation of income tax provision computed at Canadian statutory rates to the reported income tax provision is provided as follows: |
| 2013 | 2012 | 2011 | ||||||||
| Loss for the year | $ | 28,817,916 $ | 4,853,976 | $ | 11,264,539 | |||||
| Canadian statutory tax rate | 26.0% | 25.0% | 26.5% | |||||||
| Income tax benefit computed at statutory rates | 7,492,658 | 1,213,494 | 2,985,103 | |||||||
| Foreign tax rates different from statutory rates | (36,163 | ) | 224,933 | 266,896 | ||||||
| Temporary differences | (12,239 | ) | 887,107 | 311,553 | ||||||
| Change in timing differences | (2,996,296 | ) | 427,291 | (1,316,464 | ) | |||||
| Rate difference between current and deferred taxes | 68,671 | (66,920 | ) | 45,108 | ||||||
| Foreign exchange gains or losses | 1,600,854 | (531,660 | ) | 345,176 | ||||||
| Permanent differences | (120,846 | ) | (284,224 | ) | (820,811 | ) | ||||
| Unused tax losses and tax offsets not recognized in tax asset | (5,996,639 | ) | (1,870,021 | ) | (1,816,561 | ) | ||||
| $ | - | $ | - | $ | - |
Effective April 1, 2013, the British Columbia provincial tax increased from 10% to 11% and the Canadian federal corporate tax rate remained unchanged at 15%. The overall increase in tax rates has resulted in an increase in the Company’s statutory tax rate from 25% to 26%.
| b) | The tax effected items that give rise to significant portions of the deferred income tax assets and deferred income tax liabilities at December 31, 2013 and 2012 are presented below: |
| 2013 | 2012 | ||||||
| Deferred tax assets | |||||||
| Tax losses carried forward | $ | 1,838,546 | $ | 5,915,207 | |||
| Tax value over book value of equipment | - | 59,294 | |||||
| Deferred tax assets | 1,838,546 | 5,974,501 | |||||
| Deferred tax liability | |||||||
| Book value over tax value of mineral properties | (1,838,546 | ) | (5,974,501 | ) | |||
| Net deferred tax assets | $ | - | $ | - |
106
| Quaterra Resources Inc. |
| Notes to Consolidated Financial Statements |
| For the years ended December 31, 2013, 2012 and 2011 |
| (Expressed in Canadian dollars) |
| 15. | Deferred income taxes, continued |
| c) | The Company recognizes tax benefits on losses or other deductible amounts generated in countries where it is probable the deferred tax assets will be recovered. The Company’s unrecognized deductible temporary differences and unused tax losses for which no deferred tax asset is recognized consist of the following amounts: |
| December 31, | December 31, | ||||||
| 2013 | 2012 | ||||||
| Non-capital losses | $ | 42,394,557 | $ | 22,770,000 | |||
| Share issue costs | 947,700 | 709,000 | |||||
| Tax value over book value of mineral properties | 7,864,928 | 5,915,000 | |||||
| Tax value over book value of equipment | 641,500 | 134,000 | |||||
| Tax value over book value of investments | 37,400 | 33,000 | |||||
| Unrecognized deductible temporary differences | $ | 51,886,085 | $ | 29,561,000 |
The Company’s unused non-capital losses expire as follows:
| Canada | United States | Mexico | ||||||||
| 2014 - 2018 | $ | 643,000 | $ | - | $ | 7,111,000 | ||||
| 2019 - 2023 | - | 979,000 | 16,700,000 | |||||||
| 2024 - 2032 | 18,334,000 | 5,193,000 | - | |||||||
| Total | $ | 18,977,000 | $ | 6,172,000 | $ | 23,811,000 |
| 16. | Segmented information |
The Company has one business segment, the exploration of mineral properties. The Company’s significant non-current assets are distributed by geographic locations as follows:
| December 31, 2013 | December 31, 2012 | ||||||||||||
| Property | Mineral | Property | Mineral | ||||||||||
| equipment | property | equipment | property | ||||||||||
| Mexico | $ | 78,142 | $ | 6,566,237 | $ | 116,722 | $ | 21,337,506 | |||||
| U.S.A | 72,232 | 38,298,949 | 108,154 | 48,828,055 | |||||||||
| Total | $ | 150,374 | $ | 44,865,186 | $ | 224,876 | $ | 70,165,561 | |||||
| 17. | Capital management and financial instruments |
The Company considers its capital under management to consist of shareholders’ equity. The Company manages the capital structure and makes adjustments in light of changes in economic conditions and the risk characteristics of the Company’s assets.
107
| Quaterra Resources Inc. |
| Notes to Consolidated Financial Statements |
| For the years ended December 31, 2013, 2012 and 2011 |
| (Expressed in Canadian dollars) |
| 17. | Capital management and financial instruments, continued |
The Company’s objectives of capital management are intended to ensure the entity’s ability to support the Company’s normal operating requirements on an ongoing basis, continue the development and exploration of its mineral properties, and support any expansionary plans.
To effectively manage the entity’s capital requirements, the Company has in place a planning and budgeting process to help determine the funds required to ensure the Company has the appropriate liquidity to meet its operating and growth objectives.
There were no changes in the Company’s approach to capital management during the year ended December 31, 2013.
The Company designates the fair value of financial instruments according to the following:
| Level 1 - | Unadjusted quoted prices in active markets that are accessible at the measurement date for identical, unrestricted assets or liabilities. | |
| Level 2 - | Quoted prices in markets that are not active, or inputs that are observable, either directly or indirectly, for substantially the full term of the asset or liability. | |
| Level 3 - | Prices or valuation techniques that require inputs that are both significant to the fair value measurement and unobservable (supported by little or no market activity). |
The Company’s activities expose it to a variety of risks arising from financial instruments. These risks and management’s objectives, policies and procedures for managing these risks are disclosed as follows.
The following is a summary classification of financial instruments as of December 31, 2013 and 2012:
| Other | Total | |||||||||||||||
| Loans and | Available-for- | Held-for- | financial | carrying | ||||||||||||
| December 31, 2013 | receivables | sale | trading | liabilities | value | |||||||||||
| Financial assets | ||||||||||||||||
| Cash | $ | - | $ | - | $ | 894,265 | $ | - | $ | 894,265 | ||||||
| Restricted cash | 42,444 | 42,444 | ||||||||||||||
| Amounts due from exploration partners | 49,468 | 49,468 | ||||||||||||||
| Marketable securities | 4,167 | 4,167 | ||||||||||||||
| Reclamation bonds | 182,046 | 182,046 | ||||||||||||||
| Financial liabilities | ||||||||||||||||
| Accounts payable and accrued liabilities | (540,655 | ) | (540,655 | ) | ||||||||||||
| Loan payable | (689,038 | ) | (689,038 | ) | ||||||||||||
| Derivative liability - warrants | (1,191,784 | ) | (1,191,784 | ) | ||||||||||||
| $ | 273,958 | $ | (1,187,617 | ) | $ | 894,265 | $ | (1,229,693 | ) | $ | (1,249,087 | ) |
108
| Quaterra Resources Inc. |
| Notes to Consolidated Financial Statements |
| For the years ended December 31, 2013, 2012 and 2011 |
| (Expressed in Canadian dollars) |
| 17. | Capital management and financial instruments, continued |
| Total | ||||||||||||||||
| Loans and | Available- | Held-for- | Other financial | carrying | ||||||||||||
| December 31, 2012 | receivables | for-sale | trading | liabilities | value | |||||||||||
| Financial assets | ||||||||||||||||
| Cash | $ | - | $ | - | $ | 1,795,555 | $ | - | $ | 1,795,555 | ||||||
| Restricted cash | 80,148 | 80,148 | ||||||||||||||
| Amounts due from joint venture partners | 613,753 | 613,753 | ||||||||||||||
| Marketable securities | 12,333 | 12,333 | ||||||||||||||
| Reclamation bonds | 170,287 | 170,287 | ||||||||||||||
| Financial liabilities | ||||||||||||||||
| Accounts payable and accrued liabilities | (656,115 | ) | (656,115 | ) | ||||||||||||
| Due to related parties | (26,990 | ) | (26,990 | ) | ||||||||||||
| Derivative liability - warrants | (774,673 | ) | (774,673 | ) | ||||||||||||
| $ | 864,188 | $ | (762,340 | ) | $ | 1,795,555 | $ | (683,105 | ) | $ | 1,214,298 |
Fair value
The Company’s marketable securities measured at fair value were categorized in Level 1 at $4,167 (2012 -$12,333). The fair value of the Company’s marketable securities is based on active market prices at the reporting date.
The derivative liability is measured at fair value and categorized in Level 2 at $1,191,784 (2012 - $774,673). The fair value of the derivative liability is based on the Black-Scholes option pricing model inputs disclosed in note 7, as determined at the reporting date.
The recorded amount for cash, restricted cash, amount due from exploration partners, amounts due from and to related parties, and accounts payable and accrued liabilities approximate their fair values due to their short-term nature. The carrying values of the reclamation bonds approximate their fair values, as these balances are redeemable on demand.
Market risk
Market risk is the risk that the fair value or future cash flows of a financial instrument will fluctuate due to changes in market prices. Market risk comprises three types of risks: currency risk, interest rate risk and other price risk.
Currency risk
The Company operates internationally and is exposed to foreign currency risk from fluctuations in exchange rates between the Canadian dollar and various currencies, primarily US dollars and Mexican pesos. The Company has not hedged its exposure to foreign currency fluctuations.
109
| Quaterra Resources Inc. |
| Notes to Consolidated Financial Statements |
| For the years ended December 31, 2013, 2012 and 2011 |
| (Expressed in Canadian dollars) |
| 17. | Capital management and financial instruments, continued |
Market risk, continued
Currency risk, continued
The Company is exposed to currency risk as follows:
| December 31, 2013 | December 21, 2012 | ||||||||||||
| US | Pesos | US | Pesos | ||||||||||
| Cash | $ | 809,466 | 70,656 | $ | 1,715,415 | 183,410 | |||||||
| Other receivables and restricted cash | 34,500 | - | 69,000 | - | |||||||||
| Due from exploration partners | 45,510 | - | 616,899 | - | |||||||||
| Reclamation bond | 171,160 | - | 171,160 | - | |||||||||
| Accounts payable and accrued liabilities | (306,991 | ) | (74,114 | ) | (343,686 | ) | (760,178 | ) | |||||
| Loan payable | (638,160 | ) | - | - | - | ||||||||
| Derivative liabilities - warrants | (1,102,970 | ) | - | (784,988 | ) | - | |||||||
| Net foreign exposure | $ | (987,485 | ) | (3,458 | ) | $ | 1,443,800 | (576,768 | ) | ||||
Based on the above net foreign currency exposures as at December 31, 2013 and 2012, and assuming all other variables remain constant, a 5% weakening or strengthening of the Canadian dollar against a) the US dollar would result in a change of $49,374 (2012 - $73,930) in the Company’s loss; and b) the Mexican peso would have no material impact in the Company’s loss for the year.
Interest rate risk
The Company’s cash is held in bank accounts that earn interest at variable interest rates. Due to the short-term nature of these financial instruments, fluctuations in market rates do not have a significant impact on the estimated fair value as of December 31, 2013. The Company manages interest rate risk by maintaining an investment policy that focuses primarily on preservation of capital and liquidity.
Other price risk
Other price risk is the risk that the future cash flows of a financial instrument will fluctuate due to changes in market prices, other than those arising from currency risk or interest rate risk. The Company’s marketable securities are carried at market value and are therefore directly affected by fluctuations in the market value of the underlying securities. The Company’s sensitivity analysis suggests that a 10% change in market prices would have no material impact on the value of the Company’s marketable securities.
Credit risk
Credit risk is the risk of a financial loss to the Company if a customer or counterparty to a financial instrument fails to meet its contractual obligations.
110
| Quaterra Resources Inc. |
| Notes to Consolidated Financial Statements |
| For the years ended December 31, 2013, 2012 and 2011 |
| (Expressed in Canadian dollars) |
| 17. | Capital management and financial instruments, continued |
Market risk, continued
Credit risk, continued
The Company’s financial instruments that are exposed to credit risk and for which the balances represent the maximum exposure to credit risk are cash, restricted cash, amounts due from exploration partners, and taxes and other receivables. The Company manages its credit risk on cash and restricted cash by maintaining these balances at Canadian chartered banks and financial institutions that have high credit ratings assigned by international credit ratings agencies. The Company’s credit risk associated with amounts due from exploration partners is minimized as a result of a strong and continuing working relationship with the partners. Taxes receivables include balances due from the Canadian federal government.
At December 31, 2012, management assessed the probability of recovering the non-current taxes receivable and determined that the probability of recovery was remote and, accordingly, recognized an impairment loss of $895,769 (2011 - $nil).
Liquidity risk
Liquidity risk is the risk that the Company will not be able to meet its financial obligations as they fall due. The Company manages liquidity risk by forecasting cash flows from operations and anticipated investing and financing activities and through the management of its capital structure. Accounts payable and accrued liabilities of $540,654 are due in the first quarter of fiscal 2014 and US$600,000 loans payable are due on demand.
| 18. | Subsequent events |
| a) | On February 6, 2014, after the close of trading, the Company’s shares were delisted from the NYSE MKT following its voluntary delisting announced on January 17, 2014. The delisting from the NYSE MKT will not affect the listing of the shares on the TSX Venture Exchange. On February 7, 2014, the Company’s common shares commenced trading on the OTCQX market under the symbol “QTRRF”. | |
| ||
| ||
|
The above transactions are conducted in the normal course of business and were measured at the amount of consideration established and agreed by the parties.
- 87 -
| |
|
| Mineral | Office | Service | |||||||||||
| Property – Cash (a) | Lease (b) | Agreement (c) | Total | ||||||||||
| Year ending December 31, 2009 | $ | 2,115,362 | $ | 183,777 | $ | 15,000 | $ | 2,314,139 | |||||
| Year ending December 31, 2010 | 3,741,696 | 150,000 | 3,891,696 | ||||||||||
| Year ending December 31, 2011 | 1,360,506 | 150,000 | 1,510,506 | ||||||||||
| Year ending December 31, 2012 | 1,479,870 | 75,000 | 1,554,870 | ||||||||||
| Year ending December 31, 2013 | 1,760,010 | – | 1,760,010 | ||||||||||
| Year ending December 31, 2014 | 2,064,510 | – | 2,064,510 | ||||||||||
| Year ending December 31, 2015 | 1,090,110 | – | 1,090,110 | ||||||||||
| Year ending December 31, 2016 | 420,210 | – | 420,210 | ||||||||||
| Year ending December 31, 2017 | 420,210 | – | 420,210 | ||||||||||
| Year ending December 31, 2018 | 127,890 | – | 127,890 | ||||||||||
| $ | 14,580,374 | $ | 558,777 | $ | 15,000 | $ | 15,154,151 |
| ||
| ||
|
| |
| |
|
- 88 -
| |
| |
|
| 2008 | 2007 | 2006 | ||||||||
| Cash Items | ||||||||||
| Interest received | $ | 54,808 | $ | 263,818 | $ | 70,999 | ||||
| Interest paid | $ | – | $ | – | $ | – | ||||
| Income tax paid | $ | – | $ | – | $ | – | ||||
| Share issue costs | $ | 555,319 | $ | 6,316 | $ | 61,524 | ||||
| Non–Cash Items | ||||||||||
| Mineral property expenditures included in accounts payable | $ | 864,514 | $ | 900,613 | $ | 155,522 | ||||
| Non–cash share issue costs | $ | – | $ | – | $ | 482,154 | ||||
| Shares issued for finders' fees | $ | – | $ | – | $ | 510,097 | ||||
| Shares issued for mineral properties | $ | – | $ | 1,281,000 | $ | 606,000 | ||||
| Cash and cash equivalents | ||||||||||
| Cash | $ | 524,590 | $ | 2,411,052 | $ | 414,933 | ||||
| Term deposits and bankers acceptance | – | 978,848 | 8,697,799 | |||||||
| $ | 524,590 | $ | 3,389,900 | $ | 9,112,732 |
- 89 -
| |
|
| 2008 | |||
| 2009 | $ | 235,000 | |
| 2010 | 228,000 | ||
| 2014 | 284,000 | ||
| 2015 | 360,000 | ||
| 2026 | 698,000 | ||
| 2027 | 1,985,000 | ||
| 2028 | 3,000,000 | ||
| $ | 6,790,000 |
In addition, the Company has tax losses of approximately $7,540,000 that may be applied against future taxable income in Mexico, which expire in stages over a 10-year period; and tax losses of approximately $2,200,000 that may be applied against future taxable income in the United States over a 20-year period.
The future benefits of these losses and deductions have not been recorded in the accounts as their realization is not more likely than not. A reconciliation of income tax provision computed at Canadian statutory rates to the reported income tax provision is provided as follows:
| 2008 | 2007 (Note 18 | ) | 2006 ( Note 18 | ) | ||||||
| Loss for the year | $ | (6,834,181 | ) | $ | (7,303,204 | ) | $ | (3,830,534 | ) | |
| Statutory income tax rate | 31% | 34.12% | 34.12% | |||||||
| Income tax benefit computed at statutory rates | $ | 2,118,596 | $ | 2,491,853 | $ | 1,306,881 | ||||
| Foreign tax rates different from statutory rates | 13,351 | (5,780 | ) | (97 | ) | |||||
| Exploration expense | 530,356 | (15,782 | ) | (43,452 | ) | |||||
| Stock–based compensation | (917,240 | ) | (1,536,138 | ) | (1,038,955 | ) | ||||
| Share issuance costs | 73,671 | 43,190 | 42,759 | |||||||
| Other differences | 25,743 | (9,505 | ) | (2,487 | ) | |||||
| Unrecognized tax losses | (1,844,477 | ) | (967,838 | ) | (264,649 | ) | ||||
| $ | – | $ | – | $ | – |
Significant components of the Company’s future income tax assets and liabilities, after applying substantively enacted corporate income tax rates, are as follows:
- 90 -
|
| 2008 | 2007 | 2006 | ||||||||
| Future income tax assets | ||||||||||
| Tax losses carried forward | $ | 4,750,565 | $ | 6,629,549 | $ | 3,305,438 | ||||
| Book value over tax value of mineral properties | (1,057,787 | ) | (3,155,277 | ) | (1,026,786 | ) | ||||
| Tax value over book value of equipment | 11,168 | 7,906 | 2,786 | |||||||
| Share issuance costs | 188,647 | 103,135 | 165,016 | |||||||
| Future income tax assets | 3,892,593 | 3,585,313 | 2,446,454 | |||||||
| Valuation allowance for future income tax assets | (3,892,593 | ) | (3,585,313 | ) | (2,446,454 | ) | ||||
| Future income tax liabilities, net | $ | – | $ | – | $ | – |
| |
|
| December 31, 2008 | December 31, 2007 | |||||||||||||||||||||||
| Mineral | Reclamation | Mineral | Reclamation | |||||||||||||||||||||
| Equipment | Property | Bond | Total | Equipment | Property | Bond | Total | |||||||||||||||||
| Canada | $ | 9,563 | $ | – | $ | – | $ | 9,563 | $ | 22,335 | $ | – | $ | – | $ | 22,335 | ||||||||
| Mexico | 59,875 | 6,873,055 | – | 6,932,930 | 56,276 | 4,693,257 | – | 4,749,533 | ||||||||||||||||
| U.S.A | 138,584 | 26,012,016 | 317,704 | 26,468,304 | 101,841 | 14,861,449 | 139,492 | 15,102,782 | ||||||||||||||||
| Total | $ | 208,022 | $ | 32,885,071 | $ | 317,704 | $ | 33,410,797 | $ | 180,452 | $ | 19,554,706 | $ | 139,492 | $ | 19,874,650 | ||||||||
- 91 -
| ||
| ||
| ||
| ||
| ||
| ||
- 92 -111
|
|
| December 31, 2008 | December 31, 2007 | ||||||
| Total assets – Canadian GAAP | $ | 34,397,289 | $ | 24,198,211 | |||
| Expensed expenditures on mineral properties | (25,509,673 | ) | (13,110,749 | ) | |||
| Total Assets – US GAAP | $ | 8,887,616 | $ | 11,087,462 | |||
| Total liabilities – Canadian GAAP | $ | 4,444,281 | $ | 1,706,270 | |||
| Liability component of convertible notes | (176,961 | ) | – | ||||
| Total liabilities – US GAAP | 4,267,320 | 1,706,270 | |||||
| Total shareholders' equity – Canadian GAAP | 29,953,008 | 22,491,941 | |||||
| Equity component of convertible notes | 181,923 | – | |||||
| Accretion expense on convertible notes | (4,962 | ) | – | ||||
| Expenditures on mineral properties | (25,509,673 | ) | (13,110,749 | ) | |||
| Total shareholders' equity – US GAAP | 4,620,296 | 9,381,192 | |||||
| Total Liability and Shareholders¹ Equity – US GAAP | $ | 8,887,616 | $ | 11,087,462 |
| Years ended December 31, | ||||||||||
| 2008 | 2007 | 2006 | ||||||||
| Loss for the year – Canadian GAAP | $ | (6,834,181 | ) | $ | (7,303,204 | ) | $ | (3,830,534 | ) | |
| Expenditures on mineral properties | (12,398,924 | ) | (7,914,384 | ) | (2,646,351 | ) | ||||
| Accretion expense on convertible notes | (4,962 | ) | – | – | ||||||
| Net loss for period – US GAAP | (19,238,067 | ) | (15,217,588 | ) | (6,476,885 | ) | ||||
| Deficit, beginning of year – US GAAP | (34,904,051 | ) | (19,686,463 | ) | (13,209,578 | ) | ||||
| Deficit, end of year – US GAAP | $ | (54,142,118 | ) | $ | (34,904,051 | ) | $ | (19,686,463 | ) | |
| Net loss per share – Canadian GAAP | $ | (0.08 | ) | $ | (0.09 | ) | $ | (0.05 | ) | |
| Net loss per share – US GAAP | $ | (0.22 | ) | $ | (0.19 | ) | $ | (0.09 | ) | |
| Weighted average number of share outstanding | 86,304,153 | 79,971,435 | 69,964,072 | |||||||
- 93 -
|
| Years ended December 31, | ||||||||||
| 2008 | 2007 | 2006 | ||||||||
| Operating activities – Canadian GAAP | $ | (4,108,832 | ) | $ | (2,014,535 | ) | $ | (1,047,348 | ) | |
| Adjustments for expenditures on mineral properties | (12,398,924 | ) | (7,914,384 | ) | (2,646,351 | ) | ||||
| Cash used in operating actitivies – US GAAP | (16,507,756 | ) | (9,928,919 | ) | (3,693,699 | ) | ||||
| Investing activities – Canadian GAAP | (13,213,283 | ) | (9,832,158 | ) | (3,341,860 | ) | ||||
| Reclassification of expenditures on mineral properties | 12,398,924 | 7,914,384 | 2,646,351 | |||||||
| Cash used in investing actitivies – US GAAP | (814,359 | ) | (1,917,774 | ) | (695,509 | ) | ||||
| Cash provided by financing activities – Canadian & US | ||||||||||
| GAAP | 13,890,522 | 6,881,465 | 11,715,138 | |||||||
| Effect of foreign exchange on cash | 566,283 | (757,604 | ) | 504 | ||||||
| (Decrease) increase in cash during the year | (2,865,310 | ) | (5,722,832 | ) | 7,326,434 | |||||
| Cash, beginning of year | 3,389,900 | 9,112,732 | 1,786,298 | |||||||
| Cash, end of year – US GAAP | $ | 524,590 | $ | 3,389,900 | $ | 9,112,732 | ||||
Recent Accounting Pronouncements
| ||
|
- 94 -
| ||
| ||
| ||
| ||
| ||
| ||
- 95 -
ITEM 18. FINANCIAL STATEMENTS
Not applicable.
ITEM 19. EXHIBITS
The following documents are filed as exhibits to this annual report on Form 20-F:
- 96 -
SIGNATURES
The registrant hereby certifies that it meets all of the requirements for filing on Form 20-F and that it has duly caused and authorized the undersigned to sign this annual report on its behalf.
- 97 -