| · | we do not currently have strong brand recognition or relationships in the real estate development and management business; we may not be able to obtain all necessary government approvals or all requisite permits and approvals from relevant government authorities in relation to the redevelopment of the land, or to successfully redevelop the land in a timely manner; | · | we may not be able to obtain all necessary government approvals or all requisite permits and approvals from relevant government authorities in relation to the redevelopment of the land, or to successfully redevelop the land in a timely manner; |
| · | we face intense competition from real estate developers that are already in the business for years; |
| · | our experience and expertise gained from our manufacturing business may not be particularly relevant or applicable to a real estate development and management business; and |
| · | we may not be able to generate enough revenues to offset our costs in our real estate development and management business. |
We signed an agreement with a property developer in Shenzhen--Shenzhen Fangda Property Development Company Limited (“Fangda”) to cooperate in reconstructing and redeveloping the Shenzhen factory in November 2017, and we signed a supplementary agreement with Fangda in July 2018. Fangda is a wholly owned subsidiary of Fangda Group Co., Ltd. (“Fangda Group”), which is listed on the Shenzhen Stock Exchange. Under the terms of the agreement, Fangda is responsible for applying for necessary government approvals and for financing and handling the redevelopment project, including facilitating the obtaining of necessary governmental approvals. WeThere were changes in the local district planning and regulations, and we currently anticipate completing the approval process in 2019;2022; however, there can be no assurance that we will be successful in obtaining all necessary approvals. If we are not successful in the implementation of our property development project, our growth, business, financial condition and results of operations could be adversely affected.
We May Not Have Adequate Financing, Whether Through Bank Loans Or Other Arrangements, To Fund The Redevelopment Of Our Shenzhen Factory Site, And Capital Resources May Not Be Available On Commercially Reasonable Terms, Or At All.
Although we have entered into an agreement for redevelopment of the Shenzhen factory under which Fangda will bear the costs of redevelopment, there can be no assurance that Fangda will have the funds available to redevelop the Shenzhen factory. If Fangda either does not have sufficient available capital or is unwilling to bear the costs of redevelopment of the Shenzhen factory, we will be required to undertake the redevelopment. Property development is capital intensive, and we do not currently have the necessary capital to fund the redevelopment project. If it were to be necessary, we would finance our property redevelopment from our cash on hand, bank facilities and other sources. We cannot assure you that lenders will grant us sufficient financing in the future to fully fund the redevelopment project or that funding will be available from other sources. Further, the financing policies of the PRC government relating to the property development sector have varied. It is possible that the PRC government may further tighten financing policies on PRC financial institutions for the property development sector. These property-related financing policies may limit our ability and flexibility to use bank borrowings to finance our property redevelopment project.
Fangda or We May Fail To Obtain, Or Experience Material Delays In Obtaining, Requisite Certificates, Licenses, Permits Or Governmental Approvals For Redevelopment Of Our Shenzhen Factory, And As A Result Our Redevelopment Plans, Business, Results Of Operations And Financial Condition May Be Materially And Adversely Affected.
Property development in the PRC is heavily regulated. Property developers in China must abide by various laws and regulations, including implementation rules promulgated by local governments to enforce these laws and regulations. During various stages of our property redevelopment project, we/Fangda will be required to obtain and maintain various certificates, licenses, permits and governmental approvals, including but not limited to qualification certificates, land use rights certificates, construction land planning permits, construction works planning permits, construction works commencement permits, pre-sale permits and completion certificates. Before the government authorities issue any certificate, license or permit, we/Fangda must also meet specific conditions. We cannot assure you that we/Fangda will be able to adapt to new PRC land policies that may come into effect from time to time with respect to the property development industry or that we/Fangda will not encounter other material delays or difficulties in fulfilling the necessary conditions to obtain all necessary certificates, licenses or permits for our property development in a timely manner, or at all, in the future. If we/Fangda fail to obtain or encounter significant delays in obtaining the necessary certificates, licenses or permits we will not be able to continue with our redevelopment plans, and our business, results of operations and financial condition may be adversely affected. Our Income From The Rental and Management Segment Will Drop In August 2019, Upon ExpirationHas Dropped Due To The Termination Of The Lease Agreement For The Rental Of Our Shenzhen Factory.
We currently derivePreviously, we derived a majority of our rental income from the rental of our Shenzhen factory facility, which generates approximately $107,000 per month.facility. That lease expires in August 2019, and management does not intendwas terminated as at January 31, 2019. The Company has leased out part of the Shenzhen factory to renew the lease.a third party from April 1, 2021 to March 31, 2022. Assuming appropriate governmental approvals are obtained, of which there can be no assurance, development of the Shenzhen factory site willis expected to begin at that time and itin early 2023. It will be several years before development is completed and before we will have any revenues relating to the redevelopment of the Shenzhen factory property. During that time there will not be rents generated from our Shenzhen factory facility.facility, other than from the above-mentioned lease. However, we believe that we will have sufficient cash reserves plus cash flow from the rental of factory space at Xinxing and from manufacturing for our operations to continue and to meet the Company’s liquidity requirements.
We Have Not Paid Dividends Since 2007 And May Not Pay Dividends In The Future. We have not paid dividends on our common stock since 2007, and we may not be able to declare dividends, or the Board of Directors may decide not to declare dividends, in the future. We will determine the amounts of any dividends when and if they are declared, in the future at the time of declaration. Certain Legal Consequences of Foreign Incorporation and Operations Judgments Against The Company And Management May Be Difficult To Obtain Or Enforce. We are a holding corporation organized as an International Business Company under the laws of the British Virgin Islands (“BVI”), and our principal operating subsidiaries are organized under the laws of Hong Kong and the laws of the PRC. Our principal executive offices are located in Hong Kong and the PRC. Outside the United States, it may be difficult for investors to enforce judgments obtained against us in actions brought in the United States, including actions predicated upon the civil liability provisions of United States federal securities laws. In addition, most of our officers and directors reside outside the United States, and the assets of these persons are located outside the United States. As a result, it may not be possible for investors to effect service of process within the United States upon these persons or to enforce against the Company or these persons judgments predicated upon the liability provisions of United States federal securities laws. Our Hong Kong counsel and our British Virgin Islands counsel have advised that there is substantial doubt as to the enforceability against us or any of our directors or officers in original actions or in actions for enforcement of judgments of United States courts in claims for liability based on the civil liability provisions of United States federal securities laws.
No treaty exists between Hong Kong or the British Virgin Islands and the United States providing for the reciprocal enforcement of foreign judgments. However, the courts of Hong Kong and the British Virgin Islands are generally prepared to accept a foreign judgment as evidence of a debt due. An action may then be commenced in Hong Kong or the British Virgin Islands for recovery of this debt. A Hong Kong or British Virgin Islands court will only accept a foreign judgment as evidence of a debt due if:
| · | the judgment is for a liquidated amount in a civil matter; the judgment is final and conclusive; the judgment is not, directly or indirectly, for the payment of foreign taxes, penalties, fines or charges of a like nature (in this regard, a Hong Kong court is unlikely to accept a judgment for an amount obtained by doubling, trebling or otherwise multiplying a sum assessed as compensation for the loss or damage sustained by the person in whose favor the judgment was given); the judgment was not obtained by actual or constructive fraud or duress; the foreign court has taken jurisdiction on grounds that are recognized by the common law rules as to conflict of laws in Hong Kong or the British Virgin Islands; the proceedings in which the judgment was obtained were not contrary to natural justice (i.e. the concept of fair adjudication); the proceedings in which the judgment was obtained, the judgment itself and the enforcement of the judgment are not contrary to the public policy of Hong Kong or the British Virgin Islands; the person against whom the judgment is given is subject to the jurisdiction of a foreign court; and the judgment is not on a claim for contribution in respect of damages awarded by a judgment, which fall under Section 7 of the Protection of Trading Interests Ordinance, Chapter 7 of the Laws of Hong Kong. | · | the judgment is final and conclusive; |
| · | the judgment is not, directly or indirectly, for the payment of foreign taxes, penalties, fines or charges of a like nature (in this regard, a Hong Kong court is unlikely to accept a judgment for an amount obtained by doubling, trebling or otherwise multiplying a sum assessed as compensation for the loss or damage sustained by the person in whose favor the judgment was given); |
| · | the judgment was not obtained by actual or constructive fraud or duress; |
| · | the foreign court has taken jurisdiction on grounds that are recognized by the common law rules as to conflict of laws in Hong Kong or the British Virgin Islands; |
| · | the proceedings in which the judgment was obtained were not contrary to natural justice (i.e. the concept of fair adjudication); |
| · | the proceedings in which the judgment was obtained, the judgment itself and the enforcement of the judgment are not contrary to the public policy of Hong Kong or the British Virgin Islands; |
| · | the person against whom the judgment is given is subject to the jurisdiction of a foreign court; and |
| · | the judgment is not on a claim for contribution in respect of damages awarded by a judgment, which fall under Section 7 of the Protection of Trading Interests Ordinance, Chapter 7 of the Laws of Hong Kong. |
Enforcement of a foreign judgment in Hong Kong or the British Virgin Islands may also be limited or affected by applicable bankruptcy, insolvency, liquidation, arrangement and moratorium, or similar laws relating to or affecting creditors’ rights generally, and will be subject to a statutory limitation of time within which proceedings may be brought.
In the PRC, the recognition and enforcement of foreign judgments are provided for under PRC Civil Procedure Law. PRC courts may recognize and enforce foreign judgments in accordance with the requirements of PRC Civil Procedure Law based either on treaties between China and the country where the judgment is made or on reciprocity between jurisdictions. China does not have any treaties or other form of reciprocity with the United States or the British Virgin Islands that provide for the reciprocal recognition and enforcement of foreign judgments. In addition, according to the PRC Civil Procedure Law, courts in the PRC will not enforce a foreign judgment against us or our directors and officers if they decide that the judgment violates the basic principles of PRC law or national sovereignty, security or public interest. As a result, it is uncertain whether and on what basis a PRC court would enforce a judgment rendered by a court in the United States or in the British Virgin Islands. Because We Are Incorporated In The British Virgin Islands, You May Not Have The Same Protections As Shareholders Of U.S. Corporations. We are organized under the laws of the British Virgin Islands. Principles of law relating to matters affecting the validity of corporate procedures, the fiduciary duties of our management, directors and controlling shareholders and the rights of our shareholders differ from, and may not be as protective of shareholders as, those that would apply if we were incorporated in a jurisdiction within the United States. Our directors have the power to take certain actions without shareholder approval, including amending our Memorandum or Articles of Association, which are the terms used in the British Virgin Islands for a corporation’s charter and bylaws, respectively, and approving certain fundamental corporate transactions, including reorganizations, certain mergers or consolidations and the sale or transfer of assets. In addition, there is doubt that the courts of the British Virgin Islands would enforce liabilities predicated upon United States federal securities laws.
Future Issuances Of Preference Shares Could Materially And Adversely Affect The Holders Of Our Common Shares Or Delay Or Prevent A Change Of Control. Our Memorandum and Articles of Association provide the ability to issue an aggregate of 10,000,000 shares of preferred stock in four classes. While no preferred shares are currently issued or outstanding, we may issue preferred shares in the future. Future issuance of preferred shares could materially and adversely affect the rights of the holders of our common shares, dilute the common shareholders’ holdings or delay or prevent a change of control.
Our Shareholders Do Not Have The Same Protections Or Information Generally Available To Shareholders Of U.S. Corporations Because The Reporting Requirements For Foreign Private Issuers Are More Limited Than Those Applicable To Public Corporations Organized In The United States. We are a foreign private issuer within the meaning of rules promulgated under the Securities Exchange Act of 1934 (the “Exchange Act”). We are not subject to certain provisions of the Exchange Act applicable to United States public companies, including: the rules under the Exchange Act requiring the filing with the SEC of quarterly reports on Form 10-Q or current reports on Form 8-K, the sections of the Exchange Act regulating the solicitation of proxies, consents or authorizations with respect to a security registered under the Exchange Act and the sections of the Exchange Act requiring insiders to file public reports of their stock ownership and trading activities and establishing insider liability for profits realized from any “short-swing” trading transaction (i.e., a purchase and sale, or sale and purchase, of the issuer’s equity securities within six months or less). Because we are not subject to these rules, our shareholders are not afforded the same protections or information generally available to investors in public companies organized in the United States.
Our Board’s Ability To Amend Our Charter Without Shareholder Approval Could Have Anti-Takeover Effects That Could Prevent A Change In Control. As permitted by the laws of the British Virgin Islands, our Memorandum and Articles of Association may be amended by our Board of Directors without shareholder approval. This includes amendments to increase or reduce our authorized capital stock. Our Board’s ability to amend our charter documents without shareholder approval could have the effect of delaying, deterring or preventing a change in control of Bonso, including a tender offer to purchase our common shares at a premium over the current market price.
We Have Not Paid Dividends Since 2007 And May Not Pay Dividends In The Future. We have not paid dividends on our common stock since 2007, and we may not be able to declare dividends, or the Board of Directors may decide not to declare dividends, in the future. We will determine the amounts of any dividends when and if they are declared, in the future at the time of declaration.
Item 4. Information on the Company
History and Development of the Company
Bonso Electronics International Inc. was formed on August 8, 1988 as a limited liability International Business Company under the laws of the British Virgin Islands under the name “Golden Virtue Limited.” On September 14, 1988, we changed our name to Bonso Electronics International Inc. We operate under the BVI Business Companies Act.
For a description of our current operating subsidiaries, see “Organizational Structure,” below. Our corporate administrative offices are located at Cragmuir Chambers, Road Town, Tortola, British Virgin Islands and corporate administrative matters are conducted through our registered agent, HWRHarneys Corporate Services Limited, located at P.O. Box 71, Road Town, Tortola, British Virgin Islands. Our principal executive offices are located at Unit 1404, 14/F, Cheuk Nang Centre, 9 Hillwood Road, Tsimshatsui, Kowloon, Hong Kong. Our telephone number is (852) 2605-5822, our facsimile number is (852) 2691-1724, our e-mail address is info@bonso.com and our website is www.bonso.com. Organizational Structure 
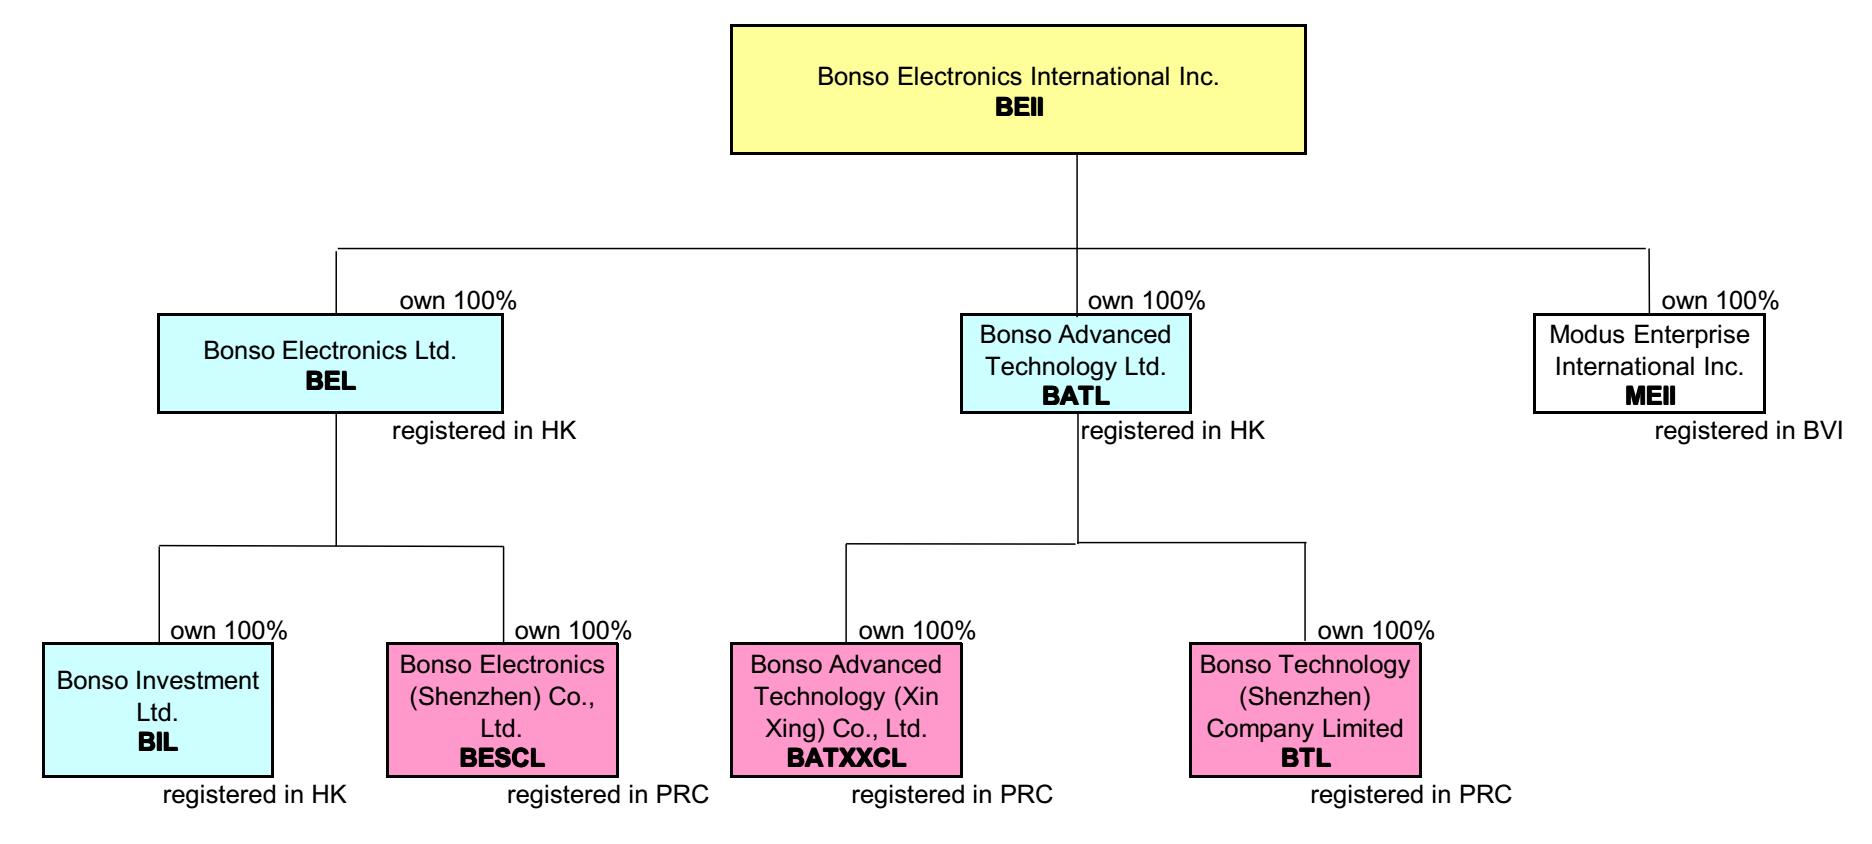
We have two wholly-owned Hong Kong subsidiaries, Bonso Electronics Limited (“BEL”) and Bonso Advanced Technology Limited (“BATL”). Both BEL and BATL were organized under the laws of Hong Kong and are responsible for the design, development, manufacture and sale of our products.
BEL has one active Hong Kong subsidiary, Bonso Investment Limited (“BIL”). BIL was organized under the laws of Hong Kong and has been used to acquire and hold our investment properties in Hong Kong and China.
BEL also has one active PRC subsidiary, Bonso Electronics (Shenzhen) Company, Limited (“BESCL”), which is organized under the laws of the PRC and was used to manufacture our products until January 2014. BESCL leased its factory to a third party from August 2013 to August 2019; however, the tenant terminated the lease as at January 31, 2019, and is receiving a monthly rental income of approximately RMB709,000 ($107,000) as of July 2018. the Company was unable to lease the factory. Effective with the transfer of manufacturing operations to Xinxing, we ceased manufacturing in this subsidiary and its principal business today is leasing our former manufacturing facilitysubsidiary. Subject to a third party. After the end of this rental agreement, subject to having receivedreceiving the necessary governmental approvals, Fangdawe will commence reconstruction of the existing Shenzhen factory into a high-rise industrial and commercial complex.
complex through our agreement with a property developer in Shenzhen (“Fangda”), which is described below under “Business Overview.”BATL has two active PRC subsidiaries, Bonso Advanced Technology (Xinxing) Company, Limited (“BATXXCL”), which is organized under the laws of the PRC and is used to acquire and hold our new manufacturing facility in Xinxing, Guangdong, China, and Bonso Technology (Shenzhen) Company Limited (“BTL”), in Shenzhen, PRC, to providewhich provides product design and distribution services for the Group.
We also have a wholly-owned British Virgin Islands subsidiary, Modus Enterprise International Inc. (“Modus”MEII”), which owned 100%owns100% of Bonso USA,Modus Pets, Inc. (“MPI”). MPI, which has been dormant since 2009 and was formally deregistered duringorganized under the fiscal year ended March 31, 2017. laws of the United States in November 2020, will be utilized for selling products through Amazon Marketplace in the USA.Business Overview Since inception, Bonso Electronics International Inc. has designed, developed, produced and sold electronic sensor-based and wireless products for private label original equipment manufacturers (individually “OEM” or, collectively, “OEMs”), original brand manufacturers (individually “OBM” or, collectively, “OBMs”) and original design manufacturers (individually, “ODM” or, collectively, “ODMs”).
Since 1989, we have manufactured all of our products in China in order to take advantage of the lower overhead costs and competitive labor rates. From 1989 until 2013, all of our production took place in our Shenzhen factory; however, during the fiscal year ended March 31, 2013 we began production in our Xinxing factory. We moved all production processes from our Shenzhen factory to the Xinxing factory during the fiscal year ended March 31, 2014, and we rented out the old Shenzhen factory to a third party as a source of rental income.
We have two factoriesfactory properties in China and our business operations are organized based upon the products we offer. Our manufacturing operations are conducted at our factory in Xinxing. We operate in four business segments: Scales—manufactured at our factory in Xinxing; Pet Electronic Products—manufactured at our factory in Xinxing; Rental and Management—involves the leasing of our factory in Shenzhen, and the leasing of both factory space and equipment at our Xinxing facility; and Others—principally includes the activities of (i) tooling and mould charges for scales and pet electronic products, and (ii) sales of scrap materials. | · | Scales—manufactured at our factory in Xinxing23 |
| · | Pet Electronic Products—manufactured at our factory in Xinxing |
| · | Rental and Management—involves the leasing of our factory in Shenzhen, and the leasing of both factory space and equipment at our Xinxing facility |
| · | Others—principally includes the activities of (i) tooling and mould charges for scales and pet electronic products, and (ii) sales of scrap materials. |
The following table sets forth the percentage of net sales for each of the product lines mentioned above for the fiscal years ended March 31, 2016, 20172019, 2020 and 2018: | | | Year ended March 31, | | | Product Line | | 2016 | | | 2017 | | | 2018 | | | Scales and Others | | | 88 | % | | | 83 | % | | | 68 | % | | Pet Electronic Products | | | 6 | % | | | 9 | % | | | 16 | % | | Rental and Management | | | 6 | % | | | 8 | % | | | 16 | % | | Total | | | 100 | % | | | 100 | % | | | 100 | % |
2021:| | | Year ended March 31, | | Product Line | | 2019 | | 2020 | | 2021 | | Scales and Others | | | 67 | % | | | 45 | % | | | 42 | % | | Pet Electronic Products | | | 14 | % | | | 48 | % | | | 51 | % | | Rental and Management | | | 19 | % | | | 7 | % | | | 7 | % | | Total | | | 100 | % | | | 100 | % | | | 100 | % |
Our primary business has been the design, development, production and sale of electronic sensor-based scales and wirelesspet electronic products. Effective with the transfer of manufacturing operations to our factory in Xinxing we leased our factory in Shenzhen to a third party. This lease marked our entry into the “Rental and Management” business, into which we have been expanding and intend to expand further in the future. The lease with the third party for the Shenzhen Factory terminates in August 2019. We have engaged consultants to assist us in obtaining the necessary governmental approvals to permit us to redevelop the Shenzhen factory into a high-end commercial complex, containing retail space, office space and some residential space. In July 2017, we signed a letter of intent, and in November 2017, we signed the definitive agreement with a property developer in Shenzhen (Fangda)(“Fangda”) to cooperate in reconstructing and redeveloping the Shenzhen factory. Fangda is a wholly owned subsidiary of Fangda Group Co., Ltd. (“Fangda Group”), which is listed on the Shenzhen Stock Exchange. In July 2018, we signed a supplementary agreement with Fangda to modify our approach in obtaining government approvals. Under the terms of the agreement, Fangda is responsible for applying for necessary government approvals and for financing and handling the redevelopment project. The agreement provides that both companies will share the redeveloped property after reconstruction/redevelopment is completed with Bonso holding a 45% interest in the total floor area. However, the final sharing ratio is subject to government approval toof the total floor area. Fangda is in the process of obtaining necessary governmental approvals. We anticipate completingexpect that Fangda will obtain all necessary approvals by the approval process in 2019;end of calendar year 2022; however, there can be no assurance that weit will be successful in obtaining all necessary approvals. If we are successful in obtaining the necessary governmental approvals for the redevelopment, we believe that the rental income derived from leasing the redeveloped property will be a significant contributing factor to our profit in the future. In addition, since October 2016 we have leased excess space and equipment in our Xinxing facility to third parties in order to supplement our manufacturing revenues, and in June 2018, we completed construction of two additional buildings at our Xinxing facility that are being leased to third parties. See “Property, Plant and Equipment – China.”
Our principal capital expenditures on property, plant and equipment, including investment property over the last three years are set forth below: | | | On March 31, | | | | | 2016 | | | 2017 | | | 2018 | | | Property, plant & equipment and land use rights | | $ | 939,000 | | | $ | 289,000 | | | $ | 364,000 | |
| | | On March 31, | | | | 2019 | | 2020 | | 2021 | | Property, plant & equipment and including investment property | | $ | 592,000 | | | $ | 1,124,000 | | | $ | 700,000 | | | | | | | | | | | | | | | |
Our capital expenditures include construction-in-progress,, leasehold improvement and the purchase of machinery used in the production of certain of our products. All of the foregoing capital expenditures were financed principally from internally generated funds, except for three motor vehicles purchased with capital leases.
Management of the Company believes that is in the best interest of the Company and our shareholders to further expand the Rental and Management segment. SinceFrom 2013 to January 31, 2019, the Company has leased its entire Shenzhen facility, consisting of seven buildings for a total of approximately 375,000 square feet, to an unaffiliated third party, and it is also currently leasing an aggregate of approximately 193,000 square feet of its Xinxing facility to unaffiliated third parties. In addition, theparty. The Company, through its partner, Fangda, is currently in the process of applying for the required permits to redevelop the Shenzhen facility into a high-end commercial complex, containing retail space, office space and some residential space, all of which is intended to be leased out. The Company is also leasing an aggregate of approximately 243,000 square feet of its Xinxing facility to unaffiliated third parties and is currently constructing an additional building for lease at that location. Management believes that the Rental and Management segment will increase and constitute a more significant part of our total revenues in the future. Scales, Pet Electronic Products and Other Segments
Products. Our sensor-based scale products include bathroom, kitchen, office, jewelry, laboratory, postal and industrial scales that are used in consumer, commercial and industrial applications. These products accounted for 88%66% of revenue for the fiscal year ended March 31, 2016, 83%2019, 44% for 20172020 and 68%41% for 2018.2021. We believe that our sensor-based scale products will continue to be a major portion of our scales revenue as we are able to secure orders from our major customers.
During the fiscal year ended March 31, 2013, the Company began to produce certain pet electronic products that are sold to wholesalers and pet shops. The Company also sells its pet electronic products through online platforms including a bark control device.Taobao, Tmall, Alibaba and Amazon. These products accounted for 6%14% of revenue for the fiscal year ended March 31, 2016, 9%2019, 48% for 20172020 and 16%51% for 2018.
2021.We also receive revenue from certain customers for the development and manufacture of tooling and moulding for scales and pet electronic products although most of the tools and moulds whichthat we produce are used by us for the manufacture of our products. We also generate some sales of scrap materials. These revenues accounted for approximately 1% of net sales for each of the last three fiscal years.
The following table sets forth the percentage of net revenue for each of the product lines mentioned above for the fiscal years ended March 31, 2016, 20172019, 2020 and 2018:
| | | Fiscal Year Ended March 31, | | | Product Line | | 2016 | | | 2017 | | | 2018 | | | Scales and Others | | | 88 | % | | | 83 | % | | | 68 | % | | Pet Electronic Products | | | 6 | % | | | 9 | % | | | 16 | % | Total | | | 94 | % | | | 92 | % | | | 84 | % |
2021:| | | Fiscal Year Ended March 31, | | Product Line | | 2019 | | 2020 | | 2021 | | Scales | | | 66 | % | | | 44 | % | | | 41 | % | | Pet Electronic Products | | | 14 | % | | | 48 | % | | | 51 | % | | Other | | | 1 | % | | | 1 | % | | | 1 | % | | Total | | | 81 | % | | | 93 | % | | | 93 | % |
Business Strategy – Scales and Pet Electronic Products . With respect to our scales and pet electronic products business, we believe that our future growth depends upon our ability to strengthen our customer base by enhancing and diversifying our products, increasing the number of customers and expanding into additional markets while maintaining or increasing sales of our products to existing customers, and focusing upon the production and sale of higher margin products. Our future growth and our ability to maintain and increase profitability are also dependent upon our ability to control production costs and increase production capacity. Our strategy to achieve these goals is as follows:
Increased Focus upon Manufacturing and Selling Higher Margin Products and the Elimination or Decrease in the Production and Sale of Lower Margin Products. During the fiscal year ended March 31,Since 2015 in seeking to return to profitability, we analyzed our product mix and concluded that we were most likely to return to profitability if we eliminatedhave focused upon eliminating the production and sale of lower margin products that require the employment of larger numbers of workers and the commitment of substantial resources to carry or stock raw materials and components inventory. We advised our largest customerIn addition, the Company is able to generate a higher margin for these low margin electronic scaleits products that without substantial price increases, we would not be in position to continue manufacturing thesesold through online platforms where the products in the calendar year beginning January 1, 2015. That customer did not agreeare sold directly to the price increases that we requested, and has shifted this business to alternative suppliers.end users without a middleman. With the decrease in the production and sale of lower margin products and increase in the sale of higher margin products, the Company increased its gross profit margin from 21.9% for the fiscal year ended March 31, 2015, to 32.7% for the fiscal year ended March 31, 2016, 40.5% for the fiscal year ended March 31, 2017, and 39.6% for the fiscal year ended March 31, 2018.
2018, 39.6% for the fiscal year ended March 31, 2019, 56.6% for the fiscal year ended March 31, 2020 and 61.9% for the fiscal year ended March 31, 2021.Product Enhancement and Diversification. We continually seek to improve and enhance our existing products in order to provide a longer product life cycle and to meet increasing customer demands for additional features. Our research and development staff is currently working on a variety of projects to enhance our existing scale, products and in the postal scale/meter area.and pet electronic products. Further, we are developing certain pet electronic products for distribution into the China market. See “Product Research and Development” and “Competition,” below. Maintaining and Expanding Business Relations with Existing Customers. We promote relationships with our significant customers through regular communication, including visiting certain of our customers in their home countries and providing direct access to our manufacturing and quality control personnel. This access, together with our concern for quality, has resulted in a relatively low level of defective products. Moreover, we believe that our emphasis on timely delivery, good service and low cost has contributed, and will continue to contribute, to good relations with our customers and increased orders. Further, we solicit suggestions from our customers for product enhancement and when feasible, attempt to develop and incorporate the enhancements suggested by our customers into our products.
Controlling Production Costs . In 1989, recognizing that labor cost was a major factor permitting effective competition in the consumer electronic products industry, we relocated all of our manufacturing operations to China to take advantage of the large available pool of lower-cost manufacturing labor. Continuing this approach and recognizing that labor costs are significantly lower in Xinxing than in Shenzhen, we moved all of our manufacturing from Shenzhen to Xinxing, and there was a reduction in our labor costs as a result. In addition, we have continued to shift production and manufacturing of various parts and components to third party suppliers, including plastic injection molded parts and metal parts. In some cases, we have entered into agreements with third parties in which they lease our equipment and part of our manufacturing facility from us, and then manufacture parts and components that we use in assembling our final products. Those third parties provide the workers and supervisors, and the necessary raw materials. We lease our machinery or equipment, a portion of our dormitory and manufacturing facilities for their workers and supervisory staff and our meals or cafeteria services for the third party’s workers and staff. There are other third-party contractors that utilize their own equipment and their own facilities in manufacturing specific components or parts for us. We are actively seeking to control production costs by such means as redesigning our existing products in order to decrease material and labor costs, controlling the number of our employees, increasing the efficiency of workers by providing regular training and tools and redesigning the flow of our production lines. Xinxing Manufacturing Facility . In November 2006, Bonso entered into a land purchase agreement to acquire 133,500 square meters of land use right for future expansion in Xinxing, China. In July 2015, the Company entered into an agreement to sell approximately 23,500 square meters of that land use right, leaving the Company with approximately 110,000 square meters. The office building on the Xinxing site was completed in February 2015, and its leasehold renovations were completed in January 2016. All manufacturing operations have been moved from Shenzhen to Xinxing. We intend to carefully monitor our capacity needs and to expand or reduce capacity as necessary in the future. ExcessWe are renting excess space in this facility is currently being rented out to third parties. Customers and Marketing. We sell our products primarily in the United States and Europe. Customers for our products are primarily OEMs, OBMs and ODMs, which market the products under their own brand names. We market our products to OEMs, OBMs and ODMs through our sales staff at trade shows, via e-mail and via e-mail, our websitewebsite. In addition, we market our pet electronic products to end users worldwide through online platforms. We have made sales through this medium primarily to end users in the United States, Europe and facsimile.China. We are considering expanding our online sales to include products other than pet electronic products.Net export sales to customers in the United States and Europe constituting 10% or more of total revenue of the Company consisted of the following for each of the three years ended March 31, 2016, 20172019, 2020 and 2018.2021. | | | Year ended March 31, | | | | 2019 | | 2020 | | 2021 | | | | $ in thousands | | % | | $ in thousands | | % | | $ in thousands | | % | | United States of America | | | 3,184 | | | | 32 | | | | 7,453 | | | | 57 | | | | 9,732 | | | | 62 | | | Germany | | | 3,760 | | | | 38 | | | | 3,613 | | | | 28 | | | | 3,666 | | | | 24 | | | Total | | | 6,944 | | | | 70 | | | | 11,066 | | | | 85 | | | | 13,398 | | | | 86 | |
Year ended March 31,
| | | 2016 | | | 2017 | | | 2018 | | | | | $ in thousands | | | % | | | $ in thousands | | | % | | | $ in thousands | | | % | | | United States of America | | | 14,062 | | | | 55 | | | | 10,356 | | | | 55 | | | | 4,807 | | | | 42 | | | Germany | | | 4,568 | | | | 18 | | | | 2,797 | | | | 15 | | | | 3,621 | | | | 31 | | | Netherlands | | | 1,901 | | | | 8 | | | | 2,299 | | | | 12 | | | | 87 | | | | 1 | | | Total | | | 20,531 | | | | 81 | | | | 15,452 | | | | 82 | | | | 8,515 | | | | 74 | |
We maintain a marketing and sales team of thirteenseven people. Also, our experienced engineering teams work directly with our customers to develop and tailor our products to meet the customers’ specific needs. We market our products primarily through a combination of direct contact by our experienced in-house technical sales staff and through trade shows, e-mail and via e-mail, our website and facsimile.website. Commission payments of approximately $13,000$25,000 were paid to the sales team during the fiscal year ended March 31, 2018 (2017: $nil; 2016: $nil)2021 (2020: $34,000; 2019: $11,000).
We hire third-party agents to handle sales and customer service for some of our online selling platforms. Commission payments of approximately $930,000 were paid to agents during the fiscal year ended March 31, 2021 (2020: $802,000; 2019: 26,000).Our major sensor-based electronic scale products and pet electronic productstop customers and their percentage of sales revenue for the prior three fiscal years are below:
Percent of Sales –Revenue– Year ended March 31, | Customer | | 2016 | | | 2017 | | | 2018 | | | Customer A | | | 15 | % | | | 14 | % | | | 31 | % | | Customer B | | | 7 | % | | | 8 | % | | | 14 | % | | Customer C | | | 8 | % | | | 13 | % | | | 14 | % | Customer D(1) | | | 56 | % | | | 45 | % | | | 10 | % |
| Customer | | 2019 | | 2020 | | 2021 | | Customer A | | | 37 | % | | | 27 | % | | | 23 | % | | Customer C | | | 12 | % | | | 9 | % | | | 9 | % | | Customer B | | | 10 | % | | | 2 | % | | | 4 | % | | Customer E(1) | | | 10 | % | | | — | % | | | — | % | | | | | | | | | | | | | | |
(1) ThisRental income from this customer is no longer purchasing from usended as of June 2017.
February 2019.Component Parts and Suppliers . We purchase over 1,000 different component parts from more than 100 major suppliers and are not dependent upon any single supplier for key components. We purchase components for our products primarily from suppliers in Japan, Taiwan, Hong Kong and China.
The price of oil and other raw materials has increased resulting in an increase of our component part prices. We have taken steps to reduce our exposure to any inability to obtain components by forecasting with an increased buffer rate and placing orders for components earlier to allow for longer delivery lead times. Because of these actions, we do not expect to experience any difficulty in obtaining needed component parts for our products. The price level of certain raw materials has increased ineach year since the fiscal year ended March 31, 2017 compared to that in the fiscal year ended March 31, 2016 and increased in the fiscal year ended March 31, 2018 compared to the fiscal year ended March 31, 2017.
2016.Quality Control. We have received ISO 9001:2015 certification from BSI Assurance UK Limited. The ISO 9001:2015 certification was awarded to our subsidiary, Bonso Advanced Technology (Xinxing) Company Limited. ISO 9001 is one of the ISO 9000 series of quality system standards developed by the International Organization for Standardization, a worldwide federation of national standards bodies. ISO 9001 provides a model for quality assurance (and continuous improvement) in product development, manufacturing, installation and servicing that focuses on meeting customer requirements. We have also received certification on the management system for medical devices of ISO13485: 2003,2016, which ensures that we have implemented and maintained a quality system for the design and manufacture of medical devices and allows us to develop and manufacture safe and effective medical devices.
The European Union has enacted the Restriction of the Use of Certain Hazardous Substances in Electrical and Electronic Equipment Directive (“RoHS”). RoHS prohibits the use of certain substances, including lead, in certain products. We believe that we are in compliance with RoHS and have a supply of compliant components from suppliers.
The Company provides to certain customers an additional one to two percent of certain products ordered in lieu of a warranty, which are recognized as cost of sales when these products are shipped to customers from our facility. In addition, certain products sold by the Company are subject to a limited product quality warranty. The Company accrues for estimated incurred but unidentified quality issues based upon historical activity and known quality issues if a loss is probable and can be reasonably estimated. The standard limited warranty period is one to three years. Quality returns, refunds, rebates and discounts are recorded net of sales if they are within the warranty period. All sales are based upon firm orders with fixed terms and conditions, which generally cannot be modified. Historically, we have not experienced material differences between our estimated amounts of quality returns, refunds, rebates and discounts and the actual results. Our contracts do not contain price protection or similar privileges in relation to the sale of goods.
Patents, Licenses, Trademarks, Franchises, Concessions and Royalty Agreements. We have obtained a trademark registration in Hong Kong and China for the marks BONSO and MODUS in connection with certain electronic apparatus. We rely on a combination of patent, trademark and trade secret laws, employee and third-party non-disclosure agreements and other intellectual property protection methods to protect our proprietary rights. There can be no assurance that third parties will not assert infringement or other claims against us with respect to any existing or future products. We cannot assure you that licenses would be available if any of our technology were successfully challenged by a third party, or if it became desirable to use any third-party technology to enhance the Company’s products. Litigation to protect our proprietary information or to determine the validity of any third-party claims could result in a significant expense to us and divert the efforts of our technical and management personnel, whether or not such litigation is determined in our favor.
While we have no knowledge that we are infringing upon the proprietary rights of any third party, there can be no assurance that such claims will not be asserted in the future with respect to existing or future products. Any such assertion by a third party could require us to pay royalties, to participate in costly litigation and defend licensees in any such suit pursuant to indemnification agreements or to refrain from selling an alleged infringing product or service.
Product Research and Development. The major responsibility of the product design, research and development personnel is to develop and produce designs to the satisfaction of, and in accordance with, the specifications provided by the OEMs, OBMs and ODMs. We believe our engineering and product development capabilities are important to the future success of our business. As an ODM, we take specifications that are provided to us by the customer and design a product to meet those specifications. Some of our product design, research and development activities are customer funded and are under agreements with specific customers for specific products. To reduce costs, we conduct our research and development at our facilities in China. We principally employ Chinese engineers and technicians at costs that are substantially lower than those that would be required in Hong Kong. At March 31, 2018,2020, we employed 911 individuals in Hong Kong and China for our engineering staff, who are at various times engaged in research and development.
Competition. The manufacture and sale of electronic sensor-based and wireless products is highly competitive. Competition is primarily based upon unit price, product quality, reliability, product features and management’s reputation for integrity. Accordingly, reliance is placed on research and development of new products, line extensions and technological quality and other continuous product improvement. There can be no assurance that we will enjoy the same degree of success in these efforts in the future. Research and development expenses aggregated approximately $200,000, $158,000$175,000, $213,000 and $152,000$229,000 during the fiscal years ended March 31, 2016, 20172019, 2020 and 2018,2021, respectively.
Seasonality. Generally, theThe first calendar quarter of each year is typically the slowest sales period because our manufacturing facilities in China are closed for two weeks for the Chinese New Year holidays to permit employees to travel to their homes in China. In addition, sales during the first calendar quarter of scales products usually dip following the increase in sales during the Christmas season. A greater number of our sales of scales products occur between the months of July and October for shipment in preparation for the Christmas holiday. Throughout the remainder of the year, our products do not appear to be subject to significant seasonal variation. However, past sales patterns may not be indicative of future performance. Transportation. Typically, we sell products either F.O.B. Hong Kong, Yantian (Shenzhen) or Nansha (Guangzhou), which means that our customers are responsible for the transportation of finished products from Hong Kong, Yantian (Shenzhen) or Nansha (Guangzhou) to their final destination. Transportation of components and finished products to and from the point of shipment is by truck. To date, we have not been materially affected by any transportation problems. However, transportation difficulties affecting air cargo or shipping, such as an extended closure of ports that materially disrupts the flow of our customers’ products to their destination, mainly the United States and Europe, could materially and adversely affect our sales and margins if, as a result, our customers delay or cancel orders or seek concessions to offset expediting charges they incurred pending resolution of the problems causing the port closures.
For products sold through online platforms, the Company ships to customers directly by door-to-door courier services from our factory to customers located in China. For products sold through the Amazon selling platform, goods are supplied to Amazon fulfillment centers, and are shipped by Amazon with Fulfillment by Amazon service.Government Regulation. We are subject to comprehensive and changing foreign, federal, provincial, state and local environmental requirements, including those governing discharges into the air and water, the handling and disposal of solid and hazardous waste and the remediation of contamination associated with releases of hazardous substances. We believe that we are in compliance with current environmental requirements. Nevertheless, we use hazardous substances in our operations and, as is the case with manufacturers in general, if a release of hazardous substances occurs on or from our properties we may be held liable and may be required to pay the cost of remediation. The amount of any resulting liability could be material.
Foreign Operations. Our products are manufactured at our factory located in China. While China has been granted permanent most favored nation trade status in the United States through its entry into the World Trade Organization, controversies between the United States and China have arisen that threaten the status quo involving trade between the United States and China. The U.S. government has recently imposed tariffs on certain foreign goods, including some of the Company’s products, and has indicated a willingness to impose tariffs on imports of other products. Related to this action, certain foreign governments, including China, have instituted retaliatory tariffs on certain U.S. goods, and have indicated a willingness to impose additional tariffs on U.S. products. It remains unclear what the U.S. government or foreign governments will or will not do with respect to recent or future tariffs or other international trade agreements and policies. A trade war or other governmental action related to tariffs or international trade agreements or policies has the potential to adversely impact our supply chain and foreign demand for our products and, thus, to have a material adverse effect on our business and results of operations. During the fiscal year ended March 31, 2018,2021, the United States accounted for approximately 42%62% of net export sales of our manufactured products as opposed to 55%57% and 32% for each of the years ended March 31, 20172020 and 2016.
2019.Sovereignty over Hong Kong reverted to China on July 1, 1997. The 1984 Sino-British Joint Declaration, the 1990 Basic Law of Hong Kong, the 1992 United States-Hong Kong Policy Act and other agreements provide some indication of the business climate we believe will continue to exist in Hong Kong. Hong Kong remains a Special Administrative Region (“SAR”) of China, with certain autonomies from the Chinese government. Hong Kong is a full member of the World Trade Organization. It has separate customs territory from China, with separate tariff rates and export control procedures. It has a separate intellectual property registration system. The Hong Kong Dollar is legal tender in the SAR, freely convertible and not subject to foreign currency exchange controls by China. The SAR government has sole responsibility for tax policies, though the Chinese government must approve the SAR’s budgets. Notwithstanding the provisions of these international agreements, we cannot be assured of the continued stability of political, legal, economic or other conditions in Hong Kong. No treaty exists between Hong Kong and the United States providing for the reciprocal enforcement of foreign judgments. Accordingly, Hong Kong courts might not enforce judgments predicated on the federal securities laws of the United States, whether arising from actions brought in the United States or, if permitted, in Hong Kong.
Adequacy of Facilities. We believe our manufacturing complex will be adequate for our reasonably foreseeable needs.
Rental and Management Segment
Since 2014, when we leased our Shenzhen manufacturing facility to a third party, we have gradually been developing a rental and management segment of our business. We currently lease approximately 568,000261,000 square feet of space in Xinxing, as well as machinery to third parties for an aggregate gross monthly income of approximately RMB936,000,RMB 338,000, or $141,000.$51,000. During the fiscal year ended March 31, 2018,2021, rental and management income accounted for approximately 16%7% of our net income. A description of the leases of factory space and equipment that we have entered into is set forth below under “Real Property.” Real Property . Property. A description of our real properties follows:
Hong Kong. We own a residential property in Hong Kong, which is located at Savanna Garden, House No. 27, Tai Po, New Territories, Hong Kong. House No. 27 consists of approximately 2,475 square feet plus a 177 square foot terrace and a 2,308 square foot garden area. The use of House No. 27 is provided as quarters to Mr. Anthony So, the Chairman and Chief Executive Officer of the Company.
China. Our Shenzhen factory in China is located at Shenzhen in the DaYang Synthetical Development District, close to the border between Hong Kong and China. This factory consists of one factory building, which contains approximately 186,000 square feet, two workers’ dormitories, containing approximately 103,000 square feet, a canteen and recreation center of approximately 26,000 square feet, an office building consisting of approximately 26,000 square feet and two staff quarters for supervisory employees, consisting of approximately 34,000 square feet, for a total of approximately 375,000 square feet. The Company entered into a rental agreement in June 2013 to rent out the Shenzhen factory to a third party from August 2013 to AugustJuly 31, 2019. We receivedHowever, in December 2018, the local environmental protection bureau ordered the tenant to cease production of its primary products as a monthly rental incomeresult of approximately $99,000 until August 2016, when it increasedthe imposition of higher pollution standards resulting from the conversion two years ago of a nearby industrial factory to approximately $107,000 until August 2019.
residential buildings. The tenant terminated the lease agreement as at January 31, 2019 and relocated. The Company has leased out part of the Shenzhen factory to a third party since April 1, 2021.We have engaged consultants to assist us in obtaining the necessary governmental approvals to permit us to redevelop the Shenzhen factory into a high-end commercial complex, containing retail space, office space and some residential space. In November 2017, we entered into an agreement with Fangda, a property developer in Shenzhen. Fangda has taken over the process to facilitate and obtain the necessary governmental approvals. We anticipate completingthat Fangda will complete the approval process in 2019;2022; however, there can be no assurance that weit will be successful in obtaining all necessary approvals. If we areFangda is successful in obtaining the necessary governmental approvals for the redevelopment, we believe that the rental income derived from leasing the redeveloped property will be a significant contributing factor to our profit in the future.
In addition, we ownNovember 2018, the Company paid approximately RMB6,035,000, or approximately $905,000, to a third party for a residential unit in Shenzhen. This unit, namely Unit 302, 5th Building, Hua Qiang City, is located at Feng Tang Road in Fu Hai, Bao An, Shenzhen. This unit, consisting of 1,354 square feet, is located near our existing Shenzhen factory and is utilized as quarters for the senior officers of the Company during their visits and monitoring of the redevelopment of the Shenzhen factory. We owned two office units in Beijing, namely Units 12 and 13 on the third floor, Block A of Sunshine Plaza in Beijing, China. Unit 12 consists of 1,102 square feet and Unit 13 consists of 1,860 square feet. One unit is rented to an unaffiliated third party for an aggregate monthly rental of approximately RMB 18,450, or approximately $3,000, while the other unit is rented to another unaffiliated third party for an aggregate monthly rental of approximately RMB 13,500, or approximately $2,000.
The two office units were sold in December 2020.Our Xinxing factory is located in Xinxing High-Tech Industrial Estate, Xinxing, Yunfu City, Guangdong, China. This factory land area is approximately 1,185,000 square feet, with six factory buildings consisting of approximately 421,000 square feet, three dormitories consisting of an aggregate of approximately 85,00086,000 square feet, a canteen consisting of 15,000 square feet and an office building consisting of 49,00050,000 square feet. The Company entered into afollowing table summarizes all the rental agreement in July 2013agreements with respect to rent out approximately 13,000 square feetportions of theour Xinxing factory building, plus some machines and equipment,that we are renting to a third party from July 2013 to June 2016. We received a monthly rental income of approximately RMB 43,000, or approximately $7,000, under that rental agreement. The rental agreement was renewed in July 2016 and extended to June 2019 for the machines and equipment only, for which the Company receives a monthly rental income of approximately RMB 26,000, or approximately $4,000.
The Company entered into a rental agreement in January 2015 to rent out approximately 46,000 square feet of the factory building, as well as some machines and equipment, to another third party from January 2015 to December 2020. We receive a monthly rental income of approximately RMB 54,000, or approximately $8,000, under that rental agreement.
The Company entered into a rental agreement in September 2015 to rent out approximately 28,000 square feet of the factory building to another third party from September 2015 to February 2019. We receive a monthly rental income of approximately RMB 26,000, or approximately $4,000, under that rental agreement. In July 2016, the Company entered into another rental agreement to rent out another 28,000 square feet of the factory building to this third party from July 2016 to February 2019. In June 2018, the Company entered into another rental agreement to rent out another 42,000 square feet of the factory building to this third party and its related companies from June 2018 to June 2024. The total floor area rented to this third party and its related companies is approximately 99,000 square feet. We receive a total monthly rental income of approximately RMB 101,000, or approximately $15,000 under that rental agreement.
The Company entered into a rental agreement in October 2016 to rent out approximately 29,000 square feet of the factory building to another third party from October 2016 to September 2018. We receive a monthly rental income of approximately RMB 27,000, or approximately $4,000, under that rental agreement. It has not been determined whether this lease will be renewed and, if so, on what terms.
The Company entered into a rental agreement in January 2017 to rent out approximately 19,000 square feet of the factory building to another third party from January 2017 to December 2022. We receive a monthly rental income of approximately RMB 19,000, or approximately $3,000, under that rental agreement.
The Company entered into a rental agreement in February 2017 to rent out approximately 43,000 square feet of the factory building to another third party from February 2017 to February 2026. We receive a monthly rental income of approximately RMB 46,000, or approximately $7,000, under that rental agreement.
In addition, the Company entered into a rental agreement in June 2018 to rent out approximately 21,000 square feet of the factory building to another third party from June 2018 to June 2024. We receive a monthly rental income of approximately RMB 29,000, or approximately $4,000, under that rental agreement.
parties.| Tenant | Leased assets | Area in square feet | From | To | Current Monthly Rent in RMB | Remarks | | Tenant A | factory space, machines and equipment | 42,440 | Jan 01, 2021 | Dec 31, 2026 | 62,192 | | | Tenant B | machines and equipment | | Jul 01, 2020 | Jun 30, 2023 | 16,506 | | | Tenant C | factory space | 41,979 | Oct 01, 2016 | Sep 30, 2024 | 52,200 | | | Tenant D | factory space | 64,799 | Feb 14, 2017 | Feb 13, 2026 | 77,853 | | | Tenant E | factory space | 18,891 | Jun 15, 2017 | Dec 31, 2022 | 21,236 | | | Tenant F | factory space | 51,171 | Jun 15, 2018 | Jun 14, 2024 | 62,505 | | | Tenant G | factory space | 11,883 | Sep 14, 2019 | Aug 12, 2025 | 13,800 | | | Tenant H | factory space | 1,991 | Nov 06, 2019 | Jun 05, 2024 | 2,590 | | | Tenant I | factory space | 7,535 | Mar 01, 2020 | Feb 13, 2026 | 8,750 | | | Tenant J | factory space | 20,189 | Jun 13, 2020 | May 12, 2028 | 20,632 | | | Total | | 260,878 | | | 338,264 | |
The Company entered into a rental agreement in December 2016 to rent out 957 square feet of an apartment unit in Shenzhen to a third party from December 2016 to November 2018. We receivereceived a monthly rental income of approximately RMB 2,800, or approximately $400 under that rental agreement, and we expect to renew thisagreement. The rental agreement was renewed up to November 2019 with a monthly rental income of approximately RMB 3,000, or approximately $400. Since the same rent.
termination of the rental agreement in November 2019, the Company has utilized the apartment as staff quarters.Item 4A. Unresolved Staff Comments
Item 5. Operating and Financial Review and Prospects
The following discussion and analysis should be read in conjunction with Item 3. – “Key Information – Selected Financial Data” and the Consolidated Financial Statements and Notes to Consolidated Financial Statements included elsewhere in this Annual Report.
During the fiscal year ended March 31, 2018, the Company experienced decreased2021, we increased revenues from our scales, and pet electronic products segments and increased revenues from our rental and management segment. Our overall sales or turnover decreased duesegment, as compared to the loss of one of our major manufacturing customers as of June 2017.
fiscal year ended March 31, 2020.We derive our revenues principally from the sale of sensor-based scales and pet electronic products manufactured in China, which together represent 68%93% of total revenue for the fiscal year ended March 31, 2018.2021. As mentioned in Item 3. – “Key Information – Risk Factors,” we are dependent upon a limited number of major customers for a significant portion of our revenues. Our revenues and business operation are subject to fluctuation if there is a loss of orders from any of our largest customers. Further, the pricing of our scale products is becoming increasingly competitive, especially to our customers in the United States and Germany, who together contributed approximately 73%86% of our revenue during the fiscal year ended March 31, 2018.
2021.During the fiscal year ended March 31, 2018,2021, we derived approximately $1,800,000$1,032,000 of rental and management income from leasing our facilitiesreal properties to third parties.
Net revenue, incomeincome/(loss) from operations and net incomeincome/(loss) were approximately $25,370,000, $3,302,000$9,992,000, ($540,000) and $2,871,000,($463,000), respectively, for the fiscal year ended March 31, 2016, $18,952,000, $3,166,0002019, $13,096,000, $362,000 and $2,795,000,$398,000, respectively, for the fiscal year ended March 31, 20172020 and $11,523,000, $238,000$15,590,000, $1,206,000 and $4,000,$1,771,000, respectively, for the fiscal year ended March 31, 2018.
2021.Labor costs per worker are increasing in China. In Xinxing, Guangdong, PRC, the minimum wage was RMB 1,010 (or approximately $164)$160) per month beginning in May 1, 2013, RMB 1,210 (or approximately $181) per month beginning in May 1, 2015, and since July 1, 2018 it has been RMB 1,410 (or approximately $213). We believe that future increases in labor costs in China would have a significant effect on our total production costs and results of operations. Our labor costs represented approximately 13.2%12.0% of our total production costs in the fiscal year ended March 31, 2018,2021, compared to 10.6%14.3% in the fiscal year ended March 31, 20172020 and 12.1%14.0% in the fiscal year ended March 31, 2016.2019. Total labor costs decreased from approximately $1,196,000$844,000 in the fiscal year ended March 31, 20172019 to approximately $919,000$814,000 in the fiscal year ended March 31, 2018.2020 and $715,000 in the fiscal year ended March 31, 2021. The decrease in overall labor costs was the result of a lowerincreased production level required due to reduced revenue.efficiency in the fiscal years ended March 31, 2020 and 2021. There can be no assurance that labor costs will not increase in the future or that any additionalfuture increase in labor costs will not have a material adverse effect upon our results of operations.
We have continued to shift production and manufacturing of various parts and components to third party suppliers, including plastic injection molded parts and metal parts. In some cases, we have entered into agreements with third parties in which they lease our equipment from us, and then manufacture parts and components that we use in assembling our final products. Those third parties provide the workers and supervisors, and the necessary raw materials. We lease our machinery or equipment, our dormitory and manufacturing facilities for their workers and supervisory staff and our meals or cafeteria services for the third party’s workers and staff. There are other third-party contractors that utilize their own equipment and their own facilities in manufacturing specific components or parts for us.
We have not experienced significant difficulties in obtaining raw materials for our products, and management does not anticipate any such difficulties in the foreseeable future. Prices of raw materials increased during the fiscal year ended March 31, 2011, but did not vary significantly during the fiscal years ended March 31, 2012, 2013 and 2014. The price of some of the raw materials utilized by the Company fluctuates directly with the price of oil, and the price of raw materials decreased slightly inhas increased over each of the last five fiscal year ended March 31, 2015, compared to that in the fiscal year ended March 31, 2014, decreased in the fiscal year ended March 31, 2016 compared to 2015, increased in the fiscal year ended March 31, 2017 compared to 2016 and increased in the fiscal year ended March 31, 2018 compared to 2017.years. There can be no assurance that raw material costs will not fluctuate or that any additionalfuture increase in raw material costs will not have a material adverse effect upon our results of operations.
In 2014 we analyzed our product mix and concluded that it would be advisable to eliminate the production and sale of lower margin products that require the employment of larger numbers of workers and the commitment of substantial resources to carry or stock raw materials and components inventory. With the decrease in the production and sale of lower margin products and the increase in sale of higher margin products through online platforms, the Company has increased its gross profit margin from 21.9% for the fiscal year ended March 31, 2015, to 39.6%61.9% for the fiscal year ended March 31, 2018.2021.
The following table presents selected statement of operations data expressed in thousands of United States Dollars and as a percentage of revenue for the fiscal years indicated below: | Statement of Operations Data | | Year Ended March 31, | | | | 2019 | | 2020 | | 2021 | | | | | $‘000 | | | | | % | | | | | $’000 | | | | % | | | | $’000 | | | | % | | | | | | | | | | | | | | | | | | | | | | | | | | | | | | | Net revenue - scales and others | | | 6,686 | | | | | 66.9 | | | | | 5,936 | | | | 45.3 | | | | 6,555 | | | | 42.0 | | | Net revenue - pet electronic products | | | 1,410 | | | | | 14.1 | | | | | 6,259 | | | | 47.8 | | | | 8,002 | | | | 51.4 | | | Net revenue - rental and management | | | 1,896 | | | | | 19.0 | | | | | 901 | | | | 6.9 | | | | 1,033 | | | | 6.6 | | | | | | | | | | | | | | | | | | | | | | | | | | | | | | | Net revenue - subtotal | | | 9,992 | | | | | 100.0 | | | | | 13,096 | | | | 100.0 | | | | 15,590 | | | | 100.0 | | | | | | | | | | | | | | | | | | | | | | | | | | | | | | | Cost of revenue - scales and others | | | (4,340 | ) | | | | (43.4 | ) | | | | (3,194 | ) | | | (24.4 | ) | | | (2,282 | ) | | | (14.6 | ) | | Cost of revenue - pet electronic products | | | (915 | ) | | | | (9.2 | ) | | | | (1,757 | ) | | | (13.4 | ) | | | (2,834 | ) | | | (18.2 | ) | | Cost of revenue - rental and management | | | (780 | ) | | | | (7.8 | ) | | | | (739 | ) | | | (5.6 | ) | | | (824 | ) | | | (5.3 | ) | | | | | | | | | | | | | | | | | | | | | | | | | | | | | | Cost of revenue - subtotal | | | (6,035 | ) | | | | (60.4 | ) | | | | (5,690 | ) | | | (43.4 | ) | | | (5,940 | ) | | | (38.1 | ) | | | | | | | | | | | | | | | | | | | | | | | | | | | | | | Gross profit - scales and others | | | 2,346 | | | | | 23.5 | | | | | 2,742 | | | | 20.9 | | | | 4,273 | | | | 27.4 | | | Gross profit - pet electronic products | | | 495 | | | | | 5.0 | | | | | 4,502 | | | | 34.4 | | | | 5,168 | | | | 33.2 | | | Gross profit - rental and management | | | 1,116 | | | | | 11.2 | | | | | 162 | | | | 1.3 | | | | 209 | | | | 1.3 | | | | | | | | | | | | | | | | | | | | | | | | | | | | | | | Gross profit - subtotal | | | 3,957 | | | | | 39.6 | | | | | 7,406 | | | | 56.6 | | | | 9,650 | | | | 61.9 | | | | | | | | | | | | | | | | | | | | | | | | | | | | | | | Selling, general and administrative expenses | | | (4,605 | ) | | | | (4.6 | ) | | | | (7,479 | ) | | | (57.1 | ) | | | (8,924 | ) | | | (57.3 | ) | | | | | | | | | | | | | | | | | | | | | | | | | | | | | | Other income, net | | | 108 | | | | | 1.1 | | | | | 435 | | | | 3.3 | | | | 480 | | | | 3.1 | | | | | | | | | | | | | | | | | | | | | | | | | | | | | | | (Loss) / income from operations | | | (540 | ) | | | | (5.4 | ) | | | | 362 | | | | 2.8 | | | | 1,206 | | | | 7.7 | | | | | | | | | | | | | | | | | | | | | | | | | | | | | | | Non-operating income / (expenses), net | | | 77 | | | | | 0.8 | | | | | 36 | | | | 0.3 | | | | (49 | ) | | | (0.3 | ) | | | | | | | | | | | | | | | | | | | | | | | | | | | | | | (Loss) / income before income taxes | | | (463 | ) | | | | (4.6 | ) | | | | 398 | | | | 3.0 | | | | 1,157 | | | | 7.4 | | | | | | | | | | | | | | | | | | | | | | | | | | | | | | | Income tax credit | | | — | | | | | — | | | | | — | | | | — | | | | 614 | | | | 4.0 | | | | | | | | | | | | | | | | | | | | | | | | | | | | | | | Net (loss) / income | | | (463 | ) | | | | (4.6 | ) | | | | 398 | | | | 3.0 | | | | 1,771 | | | | 11.4 | | | | | | | | | | | | | | | | | | | | | | | | | | | | | |
| Statement of Operations Data | | Year Ended March 31, | | | | | 2016 (1) | | | 2017 (1) | | | 2018 | | | | | | $’000 | | | % | | | | $’000 | | | % | | | | $’000 | | | % | | | | | | | | | | | | | | | | | | | | | | | | | | Net revenue - scales | | | 22,378 | | | | 88.2 | | | | 15,814 | | | | 83.4 | | | | 7,862 | | | | 68.2 | | | Net revenue - pet electronic products | | | 1,514 | | | | 6.0 | | | | 1,662 | | | | 8.8 | | | | 1,861 | | | | 16.2 | | | Net revenue - rental and management | | | 1,478 | | | | 5.8 | | | | 1,476 | | | | 7.8 | | | | 1,800 | | | | 15.6 | | | | | | | | | | | | | | | | | | | | | | | | | | | | | Net revenue - subtotal | | | 25,370 | | | | 100.0 | | | | 18,952 | | | | 100.0 | | | | 11,523 | | | | 100.0 | | | | | | | | | | | | | | | | | | | | | | | | | | | | | Cost of revenue - scales | | | (15,270 | ) | | | (60.1 | ) | | | (9,428 | ) | | | (49.7 | ) | | | (4,809 | ) | | | (41.7 | ) | | Cost of revenue - pet electronic products | | | (1,032 | ) | | | (4.1 | ) | | | (991 | ) | | | (5.3 | ) | | | (1,139 | ) | | | (9.9 | ) | | Cost of revenue - rental and management | | | (779 | ) | | | (3.1 | ) | | | (855 | ) | | | (4.5 | ) | | | (1,010 | ) | | | (8.8 | ) | | | | | | | | | | | | | | | | | | | | | | | | | | | | Cost of revenue - subtotal | | | (17,081 | ) | | | (67.3 | ) | | | (11,274 | ) | | | (59.5 | ) | | | (6,958 | ) | | | (60.4 | ) | | | | | | | | | | | | | | | | | | | | | | | | | | | | Gross profit - scales | | | 7,108 | | | | 28.1 | | | | 6,386 | | | | 33.7 | | | | 3,053 | | | | 26.5 | | | Gross profit - pet electronic products | | | 482 | | | | 1.9 | | | | 671 | | | | 3.5 | | | | 722 | | | | 6.3 | | | Gross profit - rental and management | | | 699 | | | | 2.7 | | | | 621 | | | | 3.3 | | | | 790 | | | | 6.8 | | | | | | | | | | | | | | | | | | | | | | | | | | | | | Gross profit - subtotal | | | 8,289 | | | | 32.7 | | | | 7,678 | | | | 40.5 | | | | 4,565 | | | | 39.6 | | | | | | | | | | | | | | | | | | | | | | | | | | | | | Selling, general and administrative expenses | | | (6,948 | ) | | | (27.4 | ) | | | (5,066 | ) | | | (26.7 | ) | | | (4,669 | ) | | | (40.5 | ) | | Other income, net | | | 1,961 | | | | 7.7 | | | | 554 | | | | 2.9 | | | | 342 | | | | 3.0 | | | | | | | | | | | | | | | | | | | | | | | | | | | | | Income from operations | | | 3,302 | | | | 13.0 | | | | 3,166 | | | | 16.7 | | | | 238 | | | | 2.1 | | | | | | | | | | | | | | | | | | | | | | | | | | | | | Non-operating (expenses) / income, net | | | (121 | ) | | | (0.5 | ) | | | 229 | | | | 1.2 | | | | (234 | ) | | | (2.1 | ) | | | | | | | | | | | | | | | | | | | | | | | | | | | | Income before income taxes | | | 3,181 | | | | 12.5 | | | | 3,395 | | | | 17.9 | | | | 4 | | | | 0.0 | | | Income tax expense | | | (310 | ) | | | (1.2 | ) | | | (600 | ) | | | (3.2 | ) | | | 0 | | | | 0.0 | | | | | | | | | | | | | | | | | | | | | | | | | | | | | Net income | | | 2,871 | | | | 11.3 | | | | 2,795 | | | | 14.7 | | | | 4 | | | | 0.0 | | | | | | | | | | | | | | | | | | | | | | | | | | | |
(1) Certain amounts in the statement of operations for the fiscal yearsFiscal year ended March 31, 2016 and 2017 have been reclassified2021 compared to conform to the presentationfiscal year ended March 31, 2020 Net Revenue. Our revenue increased approximately $2,494,000, or 19,0%, from approximately $13,096,000 for the fiscal year ended March 31, 2018. Net Revenue. Our revenue decreased2020 to approximately $7,429,000, or 39.2%, from approximately $18,952,000$15,590,000 for the fiscal year ended March 31, 2017 to approximately $11,523,000 for the fiscal year ended March 31, 2018.2021. The decreaseincrease was mainly relateddue to a decreasean increase overall demand for our pet electronic products and electronic scales.The increase in sales revenue of approximately $7,952,000 in our scales segment, offsetting increases of approximately $199,000 from the pet electronic products segment and approximately $324,000 from the rental and management segment. The decrease in sales revenue from scales segment was primarily due to the loss of a major customer who stopped purchasing from the Company as of June 2017.
an increase in overall demand for scale products.The revenue increase in the pet electronic products segment was due to increasedan increase demand for our products from customers selling into the U.S. and the PRC. pet products.The revenue increase in the rental and management segment was due to an increase in factory floor area beingspace leased out.
Gross Profit . Profit. Gross profit as a percentage of revenue decreased towas approximately 39.6%61.9% during the fiscal year ended March 31, 2018,2021, as compared to approximately 40.5%56.6% during the fiscal year ended March 31, 2017.2020. The lowerincrease in gross profit margin was primarily the result of an increase in labor costs and manufacturing costs as a percentage of revenue during the fiscal year ended March 31, 2018, as compared to that during the fiscal year ended March 31, 2017.from higher margin products.Selling, General and Administrative Expenses . Expenses. Selling, general and administrative expenses decreasedincreased by approximately $397,000,$1,445,000, or 7.8%19.3%, from approximately $5,066,000$7,479,000 for the fiscal year ended March 31, 20172020 to approximately $4,669,000$8,924,000 for the fiscal year ended March 31, 2018.2021. The decreaseincrease was primarily the result of a decreasean increase in selling expenses relating to promotion and logistics of approximately $43,000 due to fewer shipments made during the fiscal year ended March 31, 2018, a reduction of repair and maintenance expenses of approximately $66,000, a reduction in charitable donations of approximately $61,000 and a reduction of motor vehicle expenses of $41,000 during the fiscal year ended March 31, 2018, as compared to those during the fiscal year ended March 31, 2017. In addition, there was a loss from forward contracts of approximately $70,000 during the fiscal year ended March 31, 2017, whereas there was no such loss during the fiscal year ended March 31, 2018. our products sold through Amazon Marketplace.Other Income, Net. Other income, net decreasedincreased by approximately $212,000$45,000 or 38.3%10.3% from approximately $554,000$435,000 for the fiscal year ended March 31, 20172020 to approximately $342,000$480,000 for the fiscal year ended March 31, 2018.2021. The decreaseincrease was primarily the result of a gain onfrom disposal of intangible assets of approximately $79,000 and a gaintwo office units in Beijing.Income / (Loss) from deregistration of subsidiaries of approximately $22,000 during the fiscal year ended March 31, 2017, whereas there were no such gains during the fiscal year ended March 31, 2018.
Income from Operations. As a result of the factors described above, income from operations decreasedincreased by 92.5%233.1% from a profit of approximately $3,166,000$362,000 for the fiscal year ended March 31, 20172020 to a profit of approximately $238,000$1,206,000 for the fiscal year ended March 31, 2018.
2021.Non-operating (Expenses) / Income, Net. Non-operating (expenses) / income, net decreased approximately $463,000$85,000 or 202.2%236.1% from a gainan income of approximately $229,000$36,000 for the fiscal year ended March 31, 20172020 to a loss of approximately $234,000$49,000 for the fiscal year ended March 31, 2018.2021. The decrease was primarily the result of a decrease in interest income and an increase in foreign exchange loss ofloss.Income Tax Credit. Income tax credit was approximately $611,000 from a gain of approximately $258,000 during$614,000 for the fiscal year ended March 31, 2017 to a loss of approximately $353,000 during2021 and $nil for the fiscal year ended March 31, 2018, as a result of the appreciation of the Chinese Renminbi against the United States Dollar during the fiscal year ended March 31, 2018, which offset an increase in interest income of approximately $183,000 resulting from more deposits placed for earning interest income during the fiscal year ended March 31, 2018. Income Tax Expense. Income tax expense was $nil during the fiscal year ended March 31, 2018, as compared to an income tax expense of $600,000 during the fiscal year ended March 31, 2017. The decrease in income tax expense was the result of reduced income from operations recorded during the fiscal year ended March 31, 2018 and the utilization of tax losses from prior years to offset taxable income.
2020.Net Income / (Loss). As a result of the factors described above, consolidated net income decreasedincreased from net income of approximately $2,795,000$398,000 for the fiscal year ended March 31, 20172020 to net income of approximately $4,000$1,771,000 for the fiscal year ended March 31, 2018, a decrease2021, an increase in income of approximately $2,791,000,$1,373,000, or 99.9%345.0%. Foreign Currency Translation Adjustments, Net of Tax. Foreign currency translation adjustments, net of tax, increased from a loss of approximately $1,410,000$985,000 for the fiscal year ended March 31, 20172020 to a gain of approximately $2,062,000$1,051,000 for the fiscal year ended March 31, 2018,2021, an increase of approximately $3,472,000,$2,036,000, or 246.2%206.7%. The increased foreign currency translation gain, net of tax, was primarily the result of the fluctuationappreciation of theassets denominated in Chinese RenminbiYuan as Chinese Yuan appreciated against the United States Dollar. Comprehensive Income / (Loss). As a result of the factors described above, our comprehensive income increased from a loss of approximately $1,385,000$587,000 for the fiscal year ended March 31, 20172020 to a gain of approximately $2,066,000$2,822,000 for the fiscal year ended March 31, 2018,2021, an increase of approximately $681,000,$3,409,000, or 49.2%580.7%. Fiscal year ended March 31, 20172020 compared to fiscal year ended March 31, 2016 2019Net Revenue . Our revenue decreasedincreased approximately $6,418,000,$3,104,000, or 25.3%31.1%, from approximately $25,370,000$9,992,000 for the fiscal year ended March 31, 20162019 to approximately $18,952,000$13,096,000 for the fiscal year ended March 31, 2017.2020. The decreaseincrease was mainly related to aan increase in revenue generated from online sales of pet electronic products in excess of the decrease in sales revenue of approximately $6,564,000 in ourfrom scales segment, and a decrease of approximately $2,000 from ourthe rental and management segment, offsetting an increase of approximately $148,000 from the pet electronic products segment. The decrease in sales revenue from ourthe scales segment was primarily due to a lower demand for our products, especially from one of our major customers. We had sales of approximately $8,472,000 to this customer during the fiscal year ended March 31, 2017, compared to approximately $14,145,000 during the fiscal year ended March 31, 2016.
electronic scales.The revenue increase in the pet electronic products segment was due to an increased demand for those products.
products sold through online channels.The revenue decrease in the rental and management segment was due to the termination of the rental agreement with the tenant for our Shenzhen factory as of January 31, 2019. Gross Profit. Gross profit as a percentage of revenue was approximately 56.6% during the fiscal year ended March 31, 2017 was2020, as compared to approximately $2,000 less than that39.6% during the fiscal year ended March 31, 2016.2019. The decreaseincrease in gross profit margin was aprimarily the result of the difference in foreign exchange rate between the Chinese Renminbiincreased sales of pet electronic products with higher margin through online platforms. Selling, General and the United States Dollar, as the revenue in rentalAdministrative Expenses. Selling, general and management denominated in Chinese Renminbi duringadministrative expenses increased by approximately $2,874,000, or 62.4%, from approximately $4,605,000 for the fiscal year ended March 31, 2017 exceeded the revenue denominated in Chinese Renminbi during2019 to approximately $7,479,000 for the fiscal year ended March 31, 2016.
Gross Profit. Gross profit as a percentage of revenue increased to approximately 40.5% during the fiscal year ended March 31, 2017, as compared to approximately 32.7% during the fiscal year ended March 31, 2016.2020. The higher gross marginincrease was primarily the result of an increase in the portionselling expenses relating to promotion and shipping of our product mix which consistsproducts sold through online platforms and an increase in research and development expenses due to an increase in the number of higher gross margin products such as laboratory scales and industrial scales.
Selling, General and Administrative Expenses. Selling, general and administrative expenses decreasedengineers employed.Other Income, Net. Other income, net increased by approximately $1,882,000,$327,000 or 27.1%,302.8% from approximately $6,948,000$108,000 for the fiscal year ended March 31, 20162019 to approximately $5,066,000$435,000 for the fiscal year ended March 31, 2017.2020. The decreaseincrease was primarily the result of a decreasean increase in salaries and related costs of approximately $388,000 due to a reduction in the number of employees resulting from lower sales revenuegovernment subsidies received during the fiscal year ended March 31, 2017, and2020. Management does not anticipate receiving these increased subsidies in the result of a one-time compensation expense of approximately $801,000 due to stock options granted during the fiscal year ended March 31, 2016, whereas no such compensation expense was recorded during the fiscal year ended March 31, 2017.
Other future.Income Net. Other income, net decreased approximately $1,407,000, or 71.7%, from approximately $1,961,000 for the fiscal year ended March 31, 2016 to approximately $554,000 for the fiscal year ended March 31, 2017. The decrease was the result of a gain on disposal of property, plant and equipment of approximately $718,000 during the fiscal year ended March 31, 2016 from the sale of a residential property in Shenzhen to a third party, and a gain on disposal of intangible assets of approximately $519,000 during the fiscal year ended March 31, 2016 from the sale of a land use right on part of the land at our Xinxing facility, whereas there were no such gains during the fiscal year ended March 31, 2017.
Income/ (Loss) from Operations. As a result of the factors described above, income from operations decreasedincreased by 4.1%167.0% from a profitloss of approximately $3,302,000$540,000 for the fiscal year ended March 31, 20162019 to a profit of approximately $3,166,000$362,000 for the fiscal year ended March 31, 2017.
2020.Non-operating (Expenses) / Income, Net. Non-operating (expenses) / income, net increaseddecreased approximately $350,000,$41,000 or 289.3%,53.2% from a lossan income of approximately $121,000$77,000 for the fiscal year ended March 31, 20162019 to a gainan income of approximately $229,000$36,000 for the fiscal year ended March 31, 2017.2020. The increasedecrease was primarily the result of an increase in foreign exchange gainincreased interest expense due to the increased utilization of approximately $281,000 from a loss of approximately $23,000bank loans during the fiscal year ended March 31, 2016 to a gain of approximately $258,000 during2020.Income Tax Expense. Income tax expense was $nil for both the fiscal year ended March 31, 2017,2020 and a decrease in interest expense of approximately $76,000 because of less utilization of banking facilities during the fiscal year ended March 31, 2017.
Income Tax Expense. Income tax expense was approximately $600,000 during the fiscal year ended March 31, 2017, as compared to an income tax expense of $310,000 during the fiscal year ended March 31, 2016. The increase in income tax expense was the result of increased taxable profits in our subsidiaries in China during the fiscal year ended March 31, 2017.
2019.Net Income / (Loss). As a result of the factors described above, consolidated net income decreasedincreased from a net loss of approximately $2,871,000$463,000 for the fiscal year ended March 31, 20162019 to net income of approximately $2,795,000$398,000 for the fiscal year ended March 31, 2017, a decrease2020, an increase in income of approximately $76,000,$861,000, or 2.6%186.0%. Foreign Currency Translation Adjustments, Net of Tax. Foreign currency translation adjustments, net of tax, increaseddecreased from a loss of approximately $850,000$1,113,000 for the fiscal year ended March 31, 20162019 to a loss of approximately $1,410,000$985,000 for the fiscal year ended March 31, 2017, an increase2020, a decrease of approximately $560,000,$128,000, or 65.9%11.5%. The increaseddecreased foreign currency translation loss, net of tax, was primarily the result of depreciation ofthe reduced fluctuation in currency exchange for assets denominated in Chinese Renminbi after translationRMB translated to United States Dollars.
USD from March 31, 2019 to March 31, 2020.Comprehensive Income. Income / (Loss). As a result of the factors described above, our comprehensive incomeloss decreased from a loss of approximately $2,021,000$1,576,000 for the fiscal year ended March 31, 20162019 to a loss of approximately $1,385,000$587,000 for the fiscal year ended March 31, 2017,2020, a decrease of approximately $636,000$989,000, or 31.5%62.8%.
Although we believe that the impact of inflation on our business was minimal during the fiscal yearsyear ended March 31, 2016 and 2017 due to the lower price of oil, we believe that inflation has affecteddid affect our business during the fiscal yearyears ended March 31, 2018. The2019, 2020 and 2021. Although the minimum wage in Xinxing, PRC was increased from RMB 1,010 per month (or approximately $160) to RMB 1,210 per month (or approximately $181) as of May 1, 2015, and then tohas been stable at RMB 1,410 per month (or approximately $213) as ofsince July 1, 2018. We2018, we believe that inflation will continue to increase our operating costs and the cost of raw materials and that it will have a significant impact upon us in the future. We have generally been able to modify and improve our product designs so that we could either increase the prices of our products or lower the production costs in order to keep pace with inflation. Oil prices have been volatile in recent years. If oil prices increase, it will likely result in an increase in the cost of components to us, as well as an increase in our operating expenses, which will have a material adverse effect upon our business and results of operations. Further, the increase in labor costs in 2018 and the increase in other operating costs in the PRC has had a material impact on our profitability.
The companies comprising the Group are subject to tax on an entity basis on income arising in, or derived from, Hong Kong and the PRC. The current rate of taxation of the subsidiary operating in Hong Kong is 16.5%. However, BATL, which operates in Hong Kong, is subject to a Hong Kong profits tax rate of 8.25% on its first HKD 2 million of estimated assessable profits and at 16.5% on the remaining estimated assessable profits. The Group is not subject to income taxes in the British Virgin Islands.
The tax rate for our subsidiary in the PRC has been 25% since 2012. There is no tax payable in Hong Kong on offshore profit or on dividends paid to Bonso Electronics Limited by its subsidiaries or to us by Bonso Electronics Limited. Therefore, our overall effective tax rate may be lower than that of most United States corporations; however, this advantage could be materially and adversely affected by changes in the tax laws of the British Virgin Islands, Hong Kong or China.
Efforts by the Chinese government to increase tax revenues could result in decisions or interpretations of the tax laws by the Chinese tax authorities that are unfavorable to us and which increase our future tax liabilities or deny our expected refunds. Changes in Chinese tax laws or their interpretation or application may subject us to additional Chinese taxation in the future.
No reciprocal tax treaty regarding withholding taxes exists between the United States and the British Virgin Islands. Under current British Virgin Islands law, dividends, interest or royalties paid by us to individuals are not subject to tax as long as the recipient is not a resident of the British Virgin Islands. If we were to pay a dividend, we would not be liable to withhold any tax, but shareholders would receive gross dividends, irrespective of their residential or national status.
Contractual arrangements we have entered into among us and our subsidiaries in different locations may be subject to scrutiny by respective tax authorities, and a finding against the Company and its subsidiaries may result in additional tax liabilities that could substantially reduce our consolidated net income. We could face material and adverse tax consequences if respective tax authorities determine that the contractual arrangements among our subsidiaries and Bonso do not represent an arm’s length price and adjust Bonso’s or its subsidiaries’ income. Our consolidated net income may be materially and adversely affected if our affiliated entities’ tax liabilities increase. Dividends, if any, paid to any United States resident or citizen shareholder are treated as dividend income for United States federal income tax purposes. Such dividends are not eligible for the 70%50% dividends-received deduction allowed to United States corporations on dividends from a domestic corporation under Section 243 of the United States Internal Revenue Code of 1986, as amended (the “Internal Revenue Code”). Various Internal Revenue Code provisions impose special taxes in certain circumstances on non-United States corporations and their shareholders. You are urged to consult your tax advisor with regard to such possibilities and your own tax situation.
In addition to United States federal income taxation, shareholders may be subject to state and local taxes upon their receipt of dividends.
Foreign Currency Exchange Rates
We sell most of our products to international customers. Our principal export markets are North America (mainly the United States), Europe (mainly Germany) and Asia. Other markets are other European countries (such as the United Kingdom), Australia and Africa. Sales to international customers are made directly by us to our customers. We sell all of our products in United States Dollars and Chinese Renminbi and pay for our material components principally in United States Dollars, Hong Kong Dollars and Chinese Renminbi. Most factory expenses incurred are paid in Chinese Renminbi. Because the Hong Kong Dollar is pegged to the United States Dollar, in the past our only material foreign exchange risk arose from potential fluctuations in the Chinese Renminbi and a devaluation in United States Dollars. For the reasons discussed in the paragraphs below, management believes that it may be possible that there will be some fluctuation in the coming year. During the fiscal year ended March 31, 2018,2021, we experienced a foreign currency exchange loss of approximately $353,000.$31,000. A summary of our debts from our banking facilities utilized as at March 31, 20172020 and 2018 which2021 that were subject to foreign currency risk is as follows:
| | | March 31, 2017 | | | March 31, 2018 | | | | | $ in thousands | | | $ in thousands | | | | | | | | | | | Hong Kong dollars and Chinese Renminbi | | | 277 | | | | 99 | |
| | | March 31, 2020 | | March 31, 2021 | | | | | $ in thousands | | | | $ in thousands | | | | | | | | | | | | | Hong Kong dollars | | | 1,937 | | | | 992 | |
The amount above is due within one year.
Fluctuations in the value of the Hong Kong Dollar have not been significant since October 17, 1983, when the Hong Kong government tied the value of the Hong Kong Dollar to that of the United States Dollar. However, there can be no assurance that the value of the Hong Kong Dollar will continue to be tied to that of the United States Dollar. China adopted a floating currency system on January 1, 1994, unifying the market and official rates of foreign exchange. China approved current account convertibility of the Chinese Renminbi on July 1, 1996, followed by formal acceptance of the International Monetary Fund’s Articles of Agreement on December 1, 1996. These regulations eliminated the requirement for prior government approval to buy foreign exchange for ordinary trade transactions, though approval is still required to repatriate equity or debt, including interest thereon. From 1994 until July 2005, the Chinese Renminbi had remained stable against the United States Dollar at approximately 8.28 to 1.00 United States Dollar. On July 21, 2005, the Chinese currency regime was altered to link the RMB to a “basket of currencies,” which includes the United States Dollar, Euro, Japanese Yen and Korean Won. Under the rules, the RMB was allowed to move 0.3% on a daily basis against the United States Dollar. The People's Bank of China, on May 21 2007, widened the RMB trading band from 0.3% daily movement against the United States Dollar to 0.5%0.5%. On June 20, 2010, the People's Bank of China increased the flexibility of the exchange rate and between June 30, 2010 and December 31, 2013, the value of the Renminbi appreciated approximately 12.0% against the United States Dollar, although the value of the Renminbi depreciated approximately 2.5% against the United States Dollar in 2014. In August 2015, the People's Bank of China changed the way it calculates the mid-point price of Renminbi against the United States Dollar, requiring the market-makers who submit for reference rates to consider the previous day's closing spot rate, foreign-exchange demand and supply as well as changes in major currency rates. As a result, in 2015, the value of the Renminbi depreciated approximately 5.8% against the United States Dollar, and from December 31, 2015 through May 20, 2016, the value of the Renminbi further depreciated approximately 1.1% against the United States Dollar. From May 20, 2016 to July 14, 2017, the value of Renminbi further depreciated approximately 3.5% against the United States Dollar, and from July 2017 to July, 14, 2018 it has appreciated by approximately 1.2% against the U.S. Dollar. From July 2018 to July 2019, it depreciated by approximately 2.8% against the U.S Dollar and from July 2019 to July 2020 it depreciated by approximately 1.6% against the U.S. Dollar. From July 2020 to July 2021 it appreciated by approximately 7.5% against the U.S. Dollar. There remains significant international pressure on the PRC government to adopt a more flexible currency policy, which could result in greater fluctuations of the Renminbi against the United States Dollar. Accordingly, it is difficult to predict how market forces or PRC or U.S. government policy may impact the exchange rate between the Renminbi and the United States Dollar in the future. As of July 14, 2018,15, 2021, the RMB was valued at 6.69266.4604 per United StatesU.S. Dollar as compared to 6.77656.9871 per United StatesU.S. Dollar as of July 14, 2017. 15, 2020.To manage our exposure to foreign currency and translation risks, we may purchase currency exchange forward contracts, currency options or other derivative instruments, provided such instruments may be obtained at suitable prices.
Liquidity and Capital Resources
We have financed our growth and cash needs to date primarily from internally generated funds and bank debt. We do not use off-balance sheet financing arrangements, such as securitization of receivables or obtaining access to assets through special purpose entities, as sources of liquidity. Our primary uses of cash have been to fund expansions and upgrades ofto our manufacturing facilities.facilities and purchases of equipment and tooling. Operating activities generated approximately $2,786,000$1,984,000 of net cash for the fiscal year ended March 31, 2018,2021, as compared to approximately $3,145,000$1,158,000 of net cash for the fiscal year ended March 31, 2017.2020. This decreaseincrease in the amount of cash generated by operating activities was primarily attributable to the decreasean increase in net income for the fiscal year ended March 31, 2018.
generated by operations.As of March 31, 2018,2021, we had approximately $8,751,000$10,060,000 in cash and cash equivalents, as compared to approximately $3,745,000$9,111,000 in cash and cash equivalents as of March 31, 2017.2020. Working capital at March 31, 20182021 was approximately $7,016,000,$7,987,000, as compared to approximately $2,499,000$5,712,000 at March 31, 2017.2020. The increase in working capital was primarily the result of the receipta reduction of approximately $3,199,000 from Fangda as a deposit pursuant to the agreement regarding redevelopment of the Shenzhen manufacturing facility.bank loans and accounts payable. We believe there are no material restrictions (including foreign exchange controls) on the ability of our subsidiaries to transfer funds to us in the form of cash dividends, loans, advances or product/material purchases. We believe our working capital is sufficient for our present requirements.
As of March 31, 2018,2021, we had approximately $794,000$1,279,000 in net trade receivables, as compared to approximately $1,213,000$811,000 as of March 31, 2017.2020. This decreaseincrease of approximately $419,000$468,000 was primarily attributable to reduced net sales.
an increase in sales to customers during the year.As of March 31, 2018,2021, we had approximately $1,012,000$1,097,000 in inventories, as compared to approximately $1,018,000$1,178,000 as of March 31, 2017.2020. This decrease of approximately $6,000$81,000 was primarily attributable to the reductionreduced raw materials kept in stock levels required for the manufacturing of our products .
warehouse.As of March 31, 2018,2021, we had a total of approximately $1,023,000$597,000 in notes and accounts payable, as compared to approximately $1,317,000$775,000 as of March 31, 2017.2020. The decrease of approximately $294,000$178,000 was primarily attributable to lower net sales, less utilization of banking facilities and effortsearlier payments to provide earlier repayments to suppliers .
suppliers.As of March 31, 2018,2021, we had in place general banking facilities with one financial institution with amounts available aggregating approximately $5,128,000 (2017: $5,306,000)(2020: $5,128,000). Such facility includes the ability to obtain overdrafts, letters of credit, short-term notes payable, factoring, short-term loans, long-term loans and financial instruments including forward contracts.instruments. As of March 31, 2018,2021, we had utilized approximately $99,000$992,000 from this general banking facility. Interest on this indebtedness fluctuates with the prime rate and the Hong Kong Interbank Offer Rate as set by the Hong Kong Bankers Association, and the People’s Bank of China’s loan benchmark interest rate.Association. The bank credit facility is collateralized by our bank guarantee, and an investment property of the Company.Company and the rental assignment over such property, a life insurance contract and a listed debt instrument. Our bank credit facility is due for renewal annually. We anticipate that the banking facilitiesfacility will be renewed on substantially the same terms and our utilization in the next year will remain at a similar level as that in the current year. During the fiscal years ended March 31, 20172020 and 2018,2021, we paid a total of approximately $37,000$64,000 and $10,000,$33,000, respectively, in interest on indebtedness.
Our current ratio increased from 1.481.93 as of March 31, 20172020 to 2.612.47 as of March 31, 2018.2021. Our quick ratio increased from 1.281.74 as of March 31, 20172020 to 2.372.27 as of March 31, 2018.
2021.As of March 31, 2018, 2021, we expect to spend approximately $358,000$1,015,000 on additional construction, leasehold improvements, new machinery and tooling in our Xinxing manufacturing facility in the next twelve months.
Although we have experienced a decrease in sales as a result of a major customer ceasing to purchase from us as of June 2017, weWe believe that our cash flows from operations, our current cash balance and funds available under our working capital and credit facilities will be sufficient to meet our working capital needs and planned capital expenditures for at least the next 12 to 24 months. However, a further decrease in the demand for our products or increase in our costs of goods sold or expenses may affect our internally generated funds, and we would further look to our banking facilities, as well as to leasing out of excess space at our Xinxing facility, to meet our working capital demands.
The following table sets forth information with respect to our commitments as of March 31, 2018:
| | | | | | Payments due by Period | | | | | Total | | | Within 1 year | | | 2 to 3 years | | | 4 to 5 years | | | More than 5 years | | | | | $ in thousands | | | $ in thousands | | | $ in thousands | | | $ in thousands | | | $ in thousands | | | Notes payable and bank overdrafts and loans | | | 99 | | | | 99 | | | | - | | | | - | | | | - | | | Operating leases | | | 29 | | | | 29 | | | | - | | | | - | | | | - | | Capital leases(1) | | | 63 | | | | 30 | | | | 33 | | | | - | | | | - | | | Construction in Xinxing, and mould | | | 358 | | | | 358 | | | | - | | | | - | | | | - | | | Income tax liabilities | | | - | | | | - | | | | - | | | | - | | | | - | | | Total | | | 549 | | | | 516 | | | | 33 | | | | - | | | | - | |
(1) Includes interest payment.
2021:| | | | | Payments due by Period | | | | Total | | Within 1 year | | 2 to 3 years | | 4 to 5 years | | More than 5 years | | | | $ in thousands | | $ in thousands | | $ in thousands | | $ in thousands | | $ in thousands | | Bank loans | | | 992 | | | | 992 | | | | — | | | | — | | | | — | | | Construction in Xinxing, and mould | | | 1,015 | | | | 1,015 | | | | — | | | | — | | | | — | | | Income tax liabilities | | | 165 | | | | 165 | | | | — | | | | — | | | | — | | | Total | | | 2,172 | | | | 2,172 | | | | — | | | | — | | | | — | |
For a discussion of interest rates on our notes payable and bank loans, see Item 11. – “Qualitative and Quantitative Disclosures About Market Risk,” below.
Critical Accounting Policies
The methods, estimates and judgments we use in applying our most critical accounting policies have a significant impact on the results we report in our financial statements. The SEC has defined the most critical accounting policies as the ones that are most important to the portrayal of our financial condition and results and require us to make our most difficult and subjective judgments, often as a result of the need to make estimates of matters that are inherently uncertain. Based on this definition, our most critical policies include valuation of inventories, revenue recognition, impairment of long-lived assets, stock-based compensation, allowance for trade receivablesexpected credit losses and income and deferred income taxes.
Below, we discuss these policies further, as well as the estimates and judgments involved. We believe that our other policies either do not generally require us to make estimates and judgments that are as difficult or as subjective, or it is less likely that they would have a material impact on our reported results of operations for a given period. For a discussion of all our significant accounting policies, see footnote 1 to the Consolidated Financial Statements included elsewhere in this Annual Report.
Inventories are stated at the lower of cost or net realizable value with cost determined on a first-in, first-out basis. Net realizable value is the price at which inventories can be sold in the normal course of business after allowing for the costs of completion and disposal. The Company continuously reviews slow-moving and obsolete inventory and assesses any inventory obsolescence based on inventory levels, material composition and expected usage as of that date.
Revenue Recognition Effective April 1, 2018, the Company adopted the new guidance of ASC Topic 606, “Revenue from Contracts with Customers (Topic 606)”, which supersedes the revenue recognition requirements in ASC Topic 605, “Revenue Recognition”. Topic 606 requires the Company to recognize revenue to depict the transfer of promised goods or services to customers in an amount that reflects the consideration to which the entity expects to be entitled in exchange for those goods or services. The Company applies the following steps to recognize revenues: (1) identify the contract with a customer; (2) identify the performance obligations in the contract; (3) determine the transaction price; (4) allocate the transaction price to the performance obligations in the contract; and (5) recognize revenue when, or as, the Company satisfies a performance obligation. NoProduct sales The Company’s revenue from contracts with customers is derived from product revenue principally from the sales of electronic scales and pet electronic products directly to customers. The Company sells goods to customers based on purchase orders received from the customers. The Company has determined there is one performance obligation for each model included in the purchase orders. The performance obligation is considered to be met and revenue is recognized unless there is persuasive evidence of an arrangement,when the price to the buyer is fixed or determinable, delivery has occurred and collectabilitycustomer obtains control of the sales price is reasonably assured. Revenue is recognized when title and risk of loss transfers to the customer,goods, which is generally when the product ispoint at which products are leaving the portports of Hong Kong, Shenzhen or GuangzhouNansha (Guangzhou), or when risks and rewards are transferred to the customer. The Company did not recognize any revenue from contracts with customers for performance obligations satisfied over time during the year ended March 31, 2021. The timing of revenue recognition is not impacted by the new standard. The transaction price is generally in the form of a fixed price which is agreed with the customer at contract inception. The transaction price is recorded net of any sales return, surcharges and value-added taxes on gross sales. The Company allocates the transaction price to each performance obligation based on the purchase orders. Customers are required to pay over an agreed-upon credit period, usually between 15 to 119 days. In certain circumstances, the Company will request a deposit from a customer. Customers’ deposits are settled as designated by ourpart of the outstanding bill upon receiving an acknowledgement from customers. Shipping costs billedFor the remaining balance of the outstanding bill, the customer is required to ourpay over an agreed-upon credit period, usually between 0 to 15 days. Return rights The Company does not generally provide its customers are included within revenue. Associated costs are classified in costwith a right of sales.
return or production protection. Each customer is required to perform a product quality check before accepting delivery of goods. The Company provides to certain customers an additional one to two percent of the quantity of certain products ordered in lieu of a warranty, which areis recognized as cost of sales when these products are shipped to customers from ourthe Company’s facilities. In addition, certain products sold byDuring the year ended March 31, 2020, the Company are subjectbegan to sell its products through Amazon’s online platform. Customers purchasing products through Amazon have a limited product quality warranty.30-day right of return from the date of receipt of the product. The Company accruesrecorded a refund liability of approximately $29,000 at March 31, 2021 (2020: $69,000; 2019: $nil) for estimated incurred but unidentified quality issuesthese expected returns, which was based upon historical activityon the average monthly returns received for Amazon sales. Value-added taxes and known quality issues if a loss is probablesurcharges The Company presents revenue net of value-added taxes (“VAT”) and can be reasonably estimated. The standard limited warranty period is one to three years. Quality returns, refunds, rebatessurcharges incurred. Surcharge are sales related taxes representing the City Maintenance and discountsConstruction Tax and Education Surtax. VAT, business taxes and surcharges collected from customers, net of VAT paid for purchases, are recorded net of sales if theyas a liability in the consolidated balance sheets until these are within the warranty period. All sales are based upon firm orders with fixed terms and conditions, which generally cannot be modified. Historically, we have not experienced material differences between our estimated amounts of quality returns, refunds, rebates and discounts and the actual results.
Rental income is recognized accordingpaid to the rental agreements. Rentaltax authorities.Outbound freight and handling costs
The Company accounts for product outbound freight and handling costs as fulfillment activities and presents the associated costs in selling, general and administrative expenses in the period in which it sells the product.
Disaggregation of revenue The Company disaggregates its revenue from different types of contracts with customers by principal product categories, as the Company believes it best depicts the nature, amount, timing and uncertainty of its revenue and cash flows. See Note 19 to our Consolidated Financial Statements included elsewhere in this Annual Report for product revenues by segment. Contract balances The Company did not recognize any contract asset as of March 31, 2020 or March 31, 2021. The timing between the recognition of revenue and receipt of payment is not significant. The Company’s contract liabilities consist of deposits received from customers. As of March 31, 2020 and 2021, the balances of the contract liabilities are approximately $12,000 and $317,000, respectively. All contract liabilities at the beginning of the year ended March 31, 2021 were recognized as revenue during the year ended March 31, 2021 and all contract liabilities as of the end of the year ended March 31, 2021 are expected to be realized in the following year. Lease income for non-uniform rent payments isincludes minimum rents which are recognized on an accrual basis over the terms of the related leases on a straight-line basis throughoutbasis. Lease revenue recognition commences when the lease term.
lessee is given possession of the leased space and there are no contingencies offsetting the lessee’s obligation to pay rent. Impairment of Long-Lived Assets and Intangible Assets
Long-lived assets held and used by the Company and intangible assets are reviewed for impairment whenever events or changes in circumstances indicate that the carrying amount of such assets may not be recoverable. The Company evaluates recoverability of assets to be held and used by comparing the carrying amount of an asset to future net undiscounted cash flows to be generated by the asset. If such assets are considered to be impaired, the impairment loss is measured by the amount by which the carrying amount of the assets exceeds the fair value of the assets calculated using a discounted future cash flows analysis.
The Company follows the guidance of ASC 718, “Accounting“Accounting for Stock Options and Other Stock-Based Compensation.” ASC 718 requires companies to record compensation expense for share-based awards issued to employees and directors in exchange for services provided. The amount of the compensation expense is based on the estimated fair value of the awards on their grant dates and is recognized over the required service periods. Our share-based awards include stock options and restricted stock awards. The estimated fair value underlying our calculation of compensation expense for stock options is based on the Black-Scholes pricing model. Forfeitures of share-based awards are estimated at the time of grant and revised, if necessary, in subsequent periods if our estimates change based on the actual amount of forfeitures we have experienced.
and Expected Credit LossesAllowance is made against trade receivables to the extent that collection is considered to be doubtful. This allowance is primarily determined from our monthly aging analysis. It also requires judgment regarding the collectability of certain receivables, as certain receivables may be identified as collectible that are subsequently uncollectible and which could result in a subsequent write-off of the related receivable to the statement of operations. Most of the Company’s trade receivables are generally unsecured. To determine the necessity of a provision, the Company analyzes the age of the receivables and the customer’s ability to pay based on past payment history, financial statements and various information of the customer. Any change in the collectability of accounts receivable that were not previously provided for could significantly change the calculation of such provision and the results of our operations.
Income and Deferred Income Taxes
The Company complies with ASC 740 which prescribes a recognition threshold and measurement attributes for the financial statement recognition and measurement of a tax position taken or expected to be taken in a tax return. ASC 740 also provides guidance on derecognition, classification, interest and penalties, accounting in interim periods, disclosure and transition. Only tax positions that meet the more-likely-than-not recognition threshold at the effective date may be recognized or continue to be recognized upon adoption of ASC 740. The Company’s accounting policy is to treat interest and penalties as a component of income taxes.
Amounts in the consolidated financial statements related to income taxes are calculated using the principles of ASC 740 and ASU 2013-11 “Presentation“Presentation of an Unrecognized Tax Benefit When a Net Operating Loss Carryforward, a Similar Tax Loss, or a Tax Credit Carryforward Exists.Exists.” ASC 740 requires recognition of deferred tax assets and liabilities for the expected future tax consequences of events that have been included in the financial statements or tax returns. Under this method, deferred tax assets and liabilities are determined based on the temporary differences between the financial reporting basisbases and the tax basisbases of assets and liabilities using enacted tax rates in effect for the year in which the differences are expected to reverse. Future tax benefits, such as net operating loss carry forwards, are recognized as deferred tax assets. Recognized deferred tax assets are reduced by a valuation allowance if, based on the weight of available evidence, it is more likely than not that some portion or all of the deferred tax asset will not be realized.
We continue to be dependent upon a limited number of customers for a significant portion of our revenues, and the loss of any of these customers could have a material adverse effect upon us and our results of operations.operationstyle . As of March 31, 2018,2021, our backlog of manufacturing orders was approximately $1,641,000$1,326,000 as compared to approximately $2,891,000$1,328,000 as of March 31, 2017.2020. We expect that the demand for our products in the fiscal year ending March 31, 20192022 will be similar to that in the fiscal year ended March 31, 2018.
2021. Off-Balance Sheet Arrangements
We do not have any off-balance sheet arrangements that have, or are reasonably likely to have, a current or future effect on our financial condition, changes in financial condition, revenues or expenses, results of operations, liquidity, capital expenditures or capital resources that are material to investors.
Recent Accounting Pronouncements The new accounting pronouncements in the United States that may be relevant to the Group are as follows: In May 2014, the FASB issued ASU 2014-09, "Revenue from Contracts with Customers" ("ASU 2014-09"). The objective of this Update is to remove inconsistencies and weaknesses in revenue requirements, and to simplify the preparation of financial statements by reducing the number of requirements to which an entity must refer. The new standard supersedes virtually all present U.S. GAAP guidance on revenue recognition and requires the use of more estimates and judgments than the prior standards, as well as additional disclosures. In August 2015, the FASB issued ASU 2015-14, "Revenue from Contracts with Customers (Topic 606): Deferral of the Effective Date", deferring the effective date for one year to interim and annual periods beginning after December 15, 2017. Early adoption is also permitted as of the original effective date (interim and annual periods beginning after December 15, 2016) and retrospective application is required. The Company will adopt ASU 2014-09, and its related clarifying ASUs, as of April 1, 2018. The Company anticipates adopting the standard using the modified retrospective transition approach. Under this approach, the new standard would apply to all new contracts initiated on or after April 1, 2018. For existing contracts that have remaining obligations as of April 1, 2018, any difference between the recognition criteria in these ASUs and the Company’s current revenue recognition practices would be recognized using a cumulative effect adjustment to the opening balance of retained earnings. Our product revenues are generally recognized upon delivery to the customer, which is when the control transfers to the customer. The majority of the Company’s customer contracts, which may be in the form of purchase orders, contracts or purchase agreements, contain performance obligations for delivery of agreed upon products. Delivery of all performance obligations contained within a contract with a customer typically occurs at the same time. The Company has also determined that it will makeRecently adopted accounting policy elections to 1) treat shipping and handling activities that occur after the customer obtains control of the goods as fulfillment costs and 2) exclude sales (and similar) taxes from the measurement of the transaction price. We have no open contracts as of March 31, 2018, therefore, there will be no cumulative effect of applying the new standards. We do not expect the adoption of these ASUs to have a material impact on our consolidated financial statements. In January 2016, the FASB issued ASU 2016-01, "Financial Instruments—Overall (Subtopic 825-10): Recognition and Measurement of Financial Assets and Financial Liabilities" ("ASU 2016-01"). The amendments in this update supersede the guidance to classify equity securities with readily determinable fair values into different categories (that is trading or available-for-sale) and require equity securities (including other ownership interests, such as partnerships, unincorporated joint ventures and limited liability companies) to be measured at fair value with changes in the fair value recognized through net income. For public business entities, the amendments in this Update are effective for fiscal years beginning after December 15, 2017, including interim periods within those fiscal years. We do not expect the adoption of ASU 2016-01 to have a material impact on our consolidated financial statements.
In February 2016, the FASB issued ASU 2016-02, "Leases (Subtopic 842)" ("ASU 2016-02"). This Update is to increase transparency and comparability among organizations by recognizing lease assets and lease liabilities on the balance sheet and disclosing key information about leasing arrangements. For public business entities, this Update is effective for fiscal years beginning after December 15, 2018, including interim periods within those fiscal years. The Company is evaluating the new pronouncement to determine the impact it may have on its consolidated financial statements.
pronouncements:In June 2016, the FASB issued ASU 2016-13, "Financial Instruments—Credit Losses (Topic 326): Measurement of Credit Losses on Financial Instruments"Instruments" ("ASU 2016-13"), which improves financial reporting by providing timelier recording of credit losses on loans and other financial instruments held by financial institutions and other organizations. The ASU requires an organization to measure all expected credit losses for financial assets held at the reporting date based on historical experience, current conditions and reasonable and supportable forecasts. Forward-looking information will now be used to better inform credit loss estimates. This ASU is effective for interim and annual periods beginning after December 15, 2019 and early adoption is permitted. TheEffective April 1, 2020, the Company is currently evaluatingadopted ASU 2016-13, which did not have a material impact on the impact of this ASU on itsCompany’s consolidated financial statements. In August 2016,2018, the FASB issued ASU 2016-15, "Statement2018-13, “Fair Value Measurement (Topic 820): Disclosure Framework - Changes to the Disclosure Requirements for Fair Value Measurement,” ("ASU 2018-13") which is part of Cash Flowsthe FASB disclosure framework project to improve the effectiveness of disclosures in the notes to the financial statements. The amendments in the new guidance remove, modify and add certain disclosure requirements related to fair value measurements covered in Topic 820, “Fair Value Measurement.” The new standard is effective for fiscal years, and interim periods within those fiscal years, beginning after December 15, 2019. Effective April 1, 2020, the Company adopted ASU 2018-13, which did not have a material impact on the Company’s consolidated financial statements. In October 2018, the FASB issued ASU No. 2018-17, “Consolidation: Targeted Improvements to Related Party Guidance for Variable Interest Entities,” ("ASU 2018-17") which modifies the guidance related to indirect interests held through related parties under common control for determining whether fees paid to decision makers and service providers are variable interest. ASU 2018-17 is effective for fiscal years, and interim periods within those fiscal years, beginning after December 15, 2019 and early adoption is permitted. Effective April 1, 2020, the Company adopted ASU 2018-17, which did not have a material impact on the Company’s consolidated financial statements. In November 2018, the FASB issued ASU No. 2018-19, “Codification Improvements to Topic 326, Financial Instruments—Credit Losses,” (“ASU 2018-19”) which clarifies and improves guidance related to credit losses, hedging, and recognition and measurement. Same as ASU 2016-13, this ASU is effective for interim and annual periods beginning after December 15, 2019 and early adoption is permitted. Effective April 1, 2020, the Company adopted ASU 2018-19, which did not have a material impact on the Company’s consolidated financial statements. Recent accounting pronouncements not yet adopted: In December 2019, the FASB issued ASU No. 2019-12, “Income Taxes (Topic 230)" ("740): Simplifying the Accounting for Income Taxes”. ASU 2016-15"). This Update addresses eight specific cash flow issues with2019-12 will simplify the objectiveaccounting for income taxes by removing certain exceptions to the general principles in Topic 740. The amendments also improve consistent application of reducing theand simplify GAAP for other areas of Topic 740 by clarifying and amending existing diversity in practice.guidance. For public business entities, the amendments in this Update isASU are effective for fiscal years, and interim periods within those fiscal years, beginning after December 15, 2020. For all other entities, the amendments are effective for fiscal years beginning after December 15, 2017, including2021, and interim periods within those fiscal years. We do not expectyears beginning after December 15, 2022. The Company is evaluating the impact of the adoption of ASU 2016-152019-12, but does not expect it to have a material impact on ourincome taxes as reported in its consolidated financial statements. In October 2016,2020, the FASB issued ASU 2016-16, No. 2020-10, "Income Taxes (Topic 740)Codification Improvements" ("(“ASU 2016-16"2020-10”). This Update, which improves consistency by amending the accounting forAccounting Standards Codification to include all disclosure guidance in the income tax consequencesappropriate disclosure sections and clarifies the application of intra-entity transfers of assetsvarious provisions in the Codification by amending and adding new headings, cross referencing to other than inventory. For public business entities, this Update isguidance, and refining or correcting terminology. The amendments are effective for fiscal yearsannual periods beginning after December 15, 2017, including interim periods within those fiscal years. We do not expect2020 for public business entities. The Company is evaluating the impact of the adoption of ASU 2016-162020-10, but does not expect it to have a material impact on our consolidated financial statements. In November 2016, the FASB issued ASU 2016-18, "Statement of Cash Flows (Topic 230)" ("ASU 2016-18"). This Update requires that a statement of cash flows explain the change during the period in the total of cash, cash equivalents, and amounts generally described as restricted cash or restricted cash equivalents. For public business entities, this Update is effective for fiscal years beginning after December 15, 2017, including interim periods within those fiscal years. We do not expect the adoption of ASU 2016-18 to have a material impact on our consolidated financial statements
In February 2017, the FASB issued ASU 2017-05, "Other Income—Gains and Losses from the De-recognition of Nonfinancial Assets (Subtopic 610-20)" ("ASU 2017-05"). This Update clarifies the Scope of Asset De-recognition Guidance and Accounting for Partial Sales of Nonfinancial Assets, which clarifies the scope of the nonfinancial asset guidance in Subtopic 610-20. This ASU also clarifies that the de-recognition of all businesses and nonprofit activities (except those related to conveyances of oil and gas mineral rights or contracts with customers) should be accounted for in accordance with the de-recognition and deconsolidation guidance in Subtopic 810-10. The amendments in this ASU also provide guidance on the accounting for what often are referred to as partial sales of nonfinancial assets within the scope of Subtopic 610-20 and contributions of nonfinancial assets to a joint venture or other non-controlled investee. The amendments in this ASU are effective for annual reporting periods beginning after December 15, 2017, including interim reporting periods within that reporting period. Public entities may apply the guidance earlier but only as of annual reporting periods beginning after December 15, 2016, including interim reporting periods within that reporting period. We do not expect the adoption of ASU 2017-05 to have a material impact on our consolidated financial statements.
In May 2017, the FASB issued ASU 2017-09, "Compensation—Stock Compensation (Topic 718) Scope of Modification Accounting" ("ASU 2017-09"). The requirement provides guidance on determining which changes to the terms and conditions of share-based payment awards require an entity to apply modification accounting under Topic 718. For public business entities, this ASU should be effective for annual periods, including interim periods within those annual periods, beginning after December 15, 2017. We do not expect the adoption of ASU 2017-09 to have a material impact on our consolidated financial statements.
In July 2017, the FASB issued ASU 2017-11, "Earnings Per Share (Topic 260) (Part I) Accounting for Certain Financial Instruments with Down Round Features, (Part II) Replacement of the Indefinite Deferral for Mandatorily Redeemable Financial Instruments of Certain Nonpublic Entities and Certain Mandatorily Redeemable Noncontrolling Interests with a Scope Exception" ("ASU 2017-11"). The amendments require companies to disregard the down round feature when assessing whether the instrument is indexed to its own stock, for purposes of determining liability or equity classification. Companies that provide earnings per share (EPS) data will adjust their basic EPS calculation for the effect of the feature when triggered (i.e., when the exercise price of the related equity-linked financial instrument is adjusted downward because of the down round feature) and will also recognize the effect of the trigger within equity. For public business entities, this ASU should be effective for annual periods, including interim periods within those annual periods, beginning after December 15, 2018. We are currently evaluating the impact the adoption of ASU 2017-11 will have on the Company’s consolidated financial statements.
In September 2017, the FASB issued ASU 2017-13, "Revenue Recognition (Topic 605), Revenue from Contracts with Customers (Topic 606), Leases (Topic 840), and Leases (Topic 842)" ("ASU 2017-13"): Amendments to SEC Paragraphs Pursuant to the Staff Announcement at the July 20, 2017 EITF Meeting and Rescission of Prior SEC Staff Announcements and Observer Comments. The amendments in ASU 2017-13 amend the early adoption date option for certain companies related to the adoption of ASU 2014-09 and ASU 2016-02. The effective date is the same as the effective date and transition requirements for the amendments for ASU 2014-09 and ASU 2016-02.
In February 2018, the FASB issued ASU 2018-02, "Income Statement—Reporting Comprehensive Income (Topic 220)" ("ASU 2018-02"). The amendments in this Update allow a reclassification from accumulated other comprehensive income to retained earnings for stranded tax effects resulting from the Tax Cuts and Jobs Act. Consequently, the amendments eliminate the stranded tax effects resulting from the Tax Cuts and Jobs Act and will improve the usefulness of information reported to financial statement users. However, because the amendments only relate to the reclassification of the income tax effects of the Tax Cuts and Jobs Act, the underlying guidance that requires that the effect of a change in tax laws or rates be included in income from continuing operations is not affected. The amendments in this Update also require certain disclosures about stranded tax effects. Public business entities should apply the amendments in ASU 2018-02 for fiscal years beginning after December 15, 2018, and interim periods within those fiscal years. Early adoption of the amendments in this Update is permitted. We are currently evaluating the impact of adopting ASU 2018-02 on the Company’s consolidated financial statements.
In July 2018, the FASB issued ASU 2018-11, "Leases (Topic 842): Targeted Improvements" ("ASU 2018-11"). The ASU provides (1) an optional transition method that entities can use when adopting ASC 842 and (2) a “practical expedient that permits lessors to not separate nonlease components from the associated lease component if certain conditions are met.” The amendments in this Update related to separating components of a contract affect the amendments in Update 2016-02, which are not yet effective but can be early adopted. For public business entities, this Update is effective for fiscal years beginning after December 15, 2018, including interim periods within those fiscal years. The Company is evaluating the new pronouncement to determine the impact it may have on its consolidated financial statements.
We believe there is no additional new accounting guidance adopted, but not yet effective that is relevant to the readers of our financial statements. However, there are numerous new proposals under development which, if and when enacted, may have a significant impact on our financial reporting.
Item 6. Directors, Senior Management and Employees
Directors and Senior Management
Our Board of Directors and executive officers are listed below: Name | Age | Position with Bonso | Anthony So | 74
77 | Chairman of the Board, Chief Executive Officer and Director | | Andrew So | 32
35 | Deputy Chairman of the Board, President, Chief OperatingExecutive Officer and Director | | Albert So | 40
43 | Director, Chief Financial Officer, Treasurer, Financial Controller and Secretary | | Kim Wah Chung | 60
63 | Director, Director of Engineering and Research and Development | | Woo-Ping Fok | 69
72 | Director | | Henry F. Schlueter | 67
70 | Director and Assistant Secretary | | | | | | |
ANTHONY SO is the founder of Bonso. He has been our Chairman of the Board of Directors since July 1988. He was appointed as the Chief Executive Officer and President on November 16, 2006, and served in those capacities until March 20, 2015 when Andrew So was appointed President. On March 15, 2019, Mr. Anthony So resigned from the position of Chief Executive Officer. Mr. So received his BSE degree in civil engineering from National Taiwan University in 1967 and a Master degree in Business Administration (“MBA”) from the Hong Kong campus of the University of Hull, Hull, England in 1994. Mr. So has been Chairman of the Hong Kong GO Association since 1986 and also served as Chairman of the Alumni Association of National Taiwan University for the 1993-1994 academic years. Mr. So has served as a trustee of the Chinese University of Hong Kong, New Asia College since 1994. ANDREW SO joined the Company in August 2009 and has been a director since February 25, 2012. Mr. So currently holds the position of Chief OperatingExecutive Officer, and oversees the Company’s daily operations, and has also held the positions of Deputy Chairman of the Board and President since March 20, 2015. Andrew So was appointed as the Chief Executive Officer on March 15, 2019. Mr. So graduated with distinctions in 2008 from the University of Toronto, Canada, with a Bachelor of Commerce degree (BComm). From 2008 to 2009, prior to his employment with the Company, Mr. So worked as a Derivatives Analyst at State Street Trust Company Canada, Toronto, Canada. Mr. So graduated from the MBA Program of Hong Kong University of Science and Technology in the Fall of 2014. ALBERT SO was appointed as the Chief Financial Officer and Secretary of the Company on March 27, 2009. He was appointed Treasurer and Financial Controller of the Company on March 20, 2015. Mr. So was previously employed as the Financial Controller of the Company in January 2008 and as a management trainee of the Company in November 2004. Mr. So has been a director since March 1, 2013. Prior to his employment as a management trainee of the Company, Mr. So was a student. Mr. So is a Certified Management Accountant and Financial Risk Manager, and received a Master degree in Business Administration from Heriot-Watt University, Edinburgh, United Kingdom, and a Bachelor degree in Mathematics from Simon Fraser University in Burnaby, British Columbia, Canada. KIM WAH CHUNG has been a director since September 21, 1994. Mr. Chung has been employed by us since 1981 and currently holds the position of Director of Engineering and Research and Development. Mr. Chung is responsible for all research projects and product development. Mr. Chung’s entire engineering career has been spent with Bonso, and he has been involved in all of our major product developments. Mr. Chung graduated with honors in 1981 from the Chinese University of Hong Kong with a Bachelor of Science degree in electronics. WOO-PING FOK was elected to our Board of Directors on September 21, 1994. Mr. Fok has practiced law in Hong Kong since 1991 and is a Consultant with Messrs. C.K. Mok & Co. Mr. Fok’s major areas of practice include conveyancing and real property law, corporations and business law, commercial transactions and international trade with a special emphasis in China trade matters. Mr. Fok was admitted to the Canadian Bar as a Barrister & Solicitor in December 1987 and was a partner in the law firm of Woo & Fok, a Canadian law firm with its head office in Edmonton, Alberta, Canada. In 1991, Mr. Fok was qualified to practice as a Solicitor of England & Wales, a Solicitor of Hong Kong and a Barrister & Solicitor of Australian Capital Territory. HENRY F. SCHLUETER has been a director since October 2001 and has been our Assistant Secretary since October 6, 1988. Since 1992, Mr. Schlueter has been the Managing Director of Schlueter & Associates, P.C., a law firm, practicing in the areas of securities, mergers and acquisitions, finance and corporate law. Mr. Schlueter has served as our United States corporate and securities counsel since 1988. From 1989 to 1991, prior to establishing Schlueter & Associates, P.C., Mr. Schlueter was a partner in the Denver, Colorado office of Kutak Rock (formerly Kutak, Rock & Campbell), and from 1984 to 1989, he was a partner in the Denver office of Nelson & Harding. Mr. Schlueter is a member of the American Institute of Certified Public Accountants, the Colorado and Denver Bar Associations and the Wyoming State Bar. Mr. Schlueter is registered with the Hong Kong Law Society as a Foreign Lawyer. Anthony So, the Company’s Chief Executive Officer and Chairman of the Board of Directors is the father of Andrew So, the Company’s President and Chief OperatingExecutive Officer, and Albert So, the Company’s Chief Financial Officer, Treasurer and Secretary. No arrangement or understanding exists between any such director or officer and any other persons pursuant to which any director or executive officer was elected as a director or executive officer. Our directors are elected annually and serve until their successors take office or until their death, resignation or removal. The executive officers serve at the pleasure of the Board of Directors.
The aggregate amount of compensation paid by us and our subsidiaries during the year ended March 31, 20182021 to all directors, former directors and officers as a group for services in all capacities was approximately $1,294,000.$1,477,000. Total compensation for the benefit of Anthony So was approximately $643,000, for the benefit of Kim Wah Chung was approximately $170,000,$171,000, for the benefit of Andrew So was approximately $259,000,$370,000, for the benefit of Albert So was approximately $162,000 and$232,000, for the benefit of Henry F. Schlueter was an aggregate of approximately $60,000.$60,000, and for the benefit of Woo-Ping Fok was an aggregate of approximately $1,000. One of the properties of the Company in Hong Kong is also provided to Mr. Anthony So for his accommodation. The approximately $60,000$1,000 listed as having been paid for the benefit of Mr. SchlueterFok was paid to hisa law firm, SchlueterC. K. Mok & Associates, P.C.Co., for legal services rendered. The amount for the year ended March 31, 2018,2021 included unpaid vacation payments of approximately $43,000, $10,000, $10,000$11,000, $14,000 and $10,000$11,000 for Mr. Anthony So, Mr. Kim Wah Chung, Mr. Andrew So and Mr. Albert So, respectively.
We did not set aside or accrue any amounts to provide pension, retirement or similar benefits for directors and officers for the fiscal year ended March 31, 2018,2021, other than contributions to our Provident Fund Plan, which aggregated $18,000 for officers and directors.
We have employment agreements with Anthony So and Kim Wah Chung. Mr. So’s employment agreement provides for a maximum salary of approximately $800,000 per year plus bonus, and Mr. Chung’s employment agreement provides for a maximum salary of approximately $200,000 per year plus bonus. The initial term of the employment agreements expired on March 31, 2013 (“Initial Term”); however, the employment agreements have been renewed under a provision in the agreements that provides for automatic renewal for successive one-year periods, unless at least 90 days prior to the expiration of the Initial Term or any renewal term, either party gives written notice to the other party specifically electing to terminate the agreement. One of the properties of the Group in Hong Kong is also provided to Mr. So as part of his compensation. Mr. So’s employment agreement contains a provision under which the Company will be obligated to pay Mr. So all compensation for the remainder of his employment agreement and five times his annual salary and bonus compensation if a change of control, as defined in his employment agreement, occurs. Options of Directors and Senior Management
The following table provides information concerning options owned by the directors and senior management at July 14, 2018.
Name | | Number of Common Shares Subject to Stock Options | | | Exercise Price Per Share | | Expiration Date | | Anthony So | | | 150,000 | | | $ | 1.50 | | March 31, 2020 | | | | | 150,000 | | | $ | 1.50 | | March 31, 2025 | | | | | | | | | | | | | Andrew So | | | 125,000 | | | $ | 1.50 | | March 31, 2020 | | | | | 125,000 | | | $ | 1.50 | | March 31, 2025 | | | | | | | | | | | | | Albert So | | | 60,000 | | | $ | 1.50 | | March 31, 2020 | | | | | 60,000 | | | $ | 1.50 | | March 31, 2025 | | | | | | | | | | | | | Kim Wah Chung | | | 40,000 | | | $ | 1.50 | | March 31, 2020 | | | | | 40,000 | | | $ | 1.50 | | March 31, 2025 | | | | | | | | | | | | | Woo-Ping Fok | | | 25,000 | | | $ | 1.50 | | March 31, 2020 | | | | | 25,000 | | | $ | 1.50 | | March 31, 2025 | | | | | | | | | | | | | Henry F. Schlueter | | | 25,000 | | | $ | 1.50 | | March 31, 2020 | | | | | 25,000 | | | $ | 1.50 | | March 31, 2025 |
15, 2021.| Name | | Number of Common Shares Subject to Stock Options | | Exercise Price Per Share | | Expiration Date | | Anthony So | | | 150,000 | | | $ | 1.50 | | | March 31, 2025 | | Andrew So | | | 125,000 | | | $ | 1.50 | | | March 31, 2025 | | Albert So | | | 60,000 | | | $ | 1.50 | | | March 31, 2025 | | Kim Wah Chung | | | 40,000 | | | $ | 1.50 | | | March 31, 2025 | | Woo-Ping Fok | | | 25,000 | | | $ | 1.50 | | | March 31, 2025 | | Henry F. Schlueter | | | 25,000 | | | $ | 1.50 | | | March 31, 2025 |
Directors Except as mentioned above, our directors do not receive any additional monetary compensation for serving in their capacities as directors. All directors are reimbursed for all reasonable expenses incurred in connection with their services as a director. Employee retirement benefits
| (a) | With effect from January 1, 1988, BEL, a wholly-owned foreign subsidiary of the Company in Hong Kong, implemented a defined contribution plan (the “Plan”) with a major international assurance company to provide life insurance and retirement benefits for its employees. All permanent full-time employees who joined BEL before December 2000, excluding factory workers, are eligible to join the provident fund plan. Eligible employees of the Plan are required to contribute 5% of their monthly salary, while BEL is required to contribute from 5% to 10% based on the eligible employee’s salary, depending on the number of years of the eligible employee’s service.
The Mandatory Provident Fund (the “MPF”) was introduced by the Hong Kong Government and commenced in December 2000. BEL joined the MPF by implementing a plan with a major international assurance company. All permanent Hong Kong full time employees who joined BEL on or after December 2000, excluding factory workers, are eligible to join the MPF. Eligible employees’ and the employer’s contributions to the MPF are both at 5% of the eligible employee’s monthly salary and are subject to a maximum mandatory contribution of HK$1,000 (US$128) monthly. The maximum mandatory contribution was increased to HK$1,250 (US$160) monthly starting from June 1, 2012. The maximum mandatory contribution was increased to HK$1,500 (US$192) per month starting from June 1, 2014.
Pursuant to the relevant PRC regulations, the Group is required to make contributions for each employee, at rates based upon the employee’s standard salary base as determined by the local Social Security Bureau, to a defined contribution retirement scheme organized by the local Social Security Bureau in respect of the retirement benefits for the Group’s employees in the PRC. |
The Mandatory Provident Fund (the “MPF”) was introduced by the Hong Kong Government and commenced in December 2000. BEL joined the MPF by implementing a plan with a major international assurance company. All permanent Hong Kong full time employees who joined BEL on or after December 2000, excluding factory workers, are eligible to join the MPF. Eligible employees’ and the employer’s contributions to the MPF are both at 5% of the eligible employee’s monthly salary and are subject to a maximum mandatory contribution of HK$1,000 (US$128) monthly. The maximum mandatory contribution was increased to HK$1,250 (US$160) monthly starting from June 1, 2012. The maximum mandatory contribution was increased to HK$1,500 (US$192) per month starting from June 1, 2014.
Pursuant to the relevant PRC regulations, the Group is required to make contributions for each employee, at rates based upon the employee’s standard salary base as determined by the local Social Security Bureau, to a defined contribution retirement scheme organized by the local Social Security Bureau in respect of the retirement benefits for the Group’s employees in the PRC.
| (b) | The contributions to each of the above schemes are recognized as employee benefit expense when they are due and are charged to the consolidated statement of income (loss). The Group’s total contributions to the above schemes for the years ended March 31, 2016, 20172019, 2020 and 20182021 amounted to approximately $293,000, $267,000$264,000, $258,000 and $255,000,$149,000, respectively. The Group has no other obligation to make payments in respect of retirement benefits of the employees. |
All directors hold office until our next annual meeting of shareholders or until their respective successors are duly elected and qualified or their positions are earlier vacated by resignation or otherwise. All executive officers are appointed by the Board and serve at the pleasure of the Board. There are no director service contracts providing for benefits upon termination of employment or directorship.
NASDAQ Exemptions and Home Country Practices
NASDAQ Marketplace Rule 4350 provides that foreign private issuers may elect to follow certain home country corporate governance practices so long as they provide NASDAQ with a letter from outside counsel in their home country certifying that the issuer 's corporate governance practices are not prohibited by home country law. On July 19, 2005, we submitted a letter to NASDAQ certifying that certain of Bonso’s corporate governance practices are not prohibited by the relevant laws of the British Virgin Islands. We will follow British Virgin Island law in respect to the following requirements: ·A majority of Bonso’s Board of Directors will not be independent;
·Bonso will not have a nominating committee;
·Bonso will not have a compensation committee;
·Bonso’s independent directors will not meet in executive session; and
·Bonso’s audit committee may have only one member.
Mr. Woo-Ping Fok is the sole member of the Audit Committee and Mr. Schlueter serves as an ad hoc member. Mr. Fok is “independent” as defined in the NASDAQ listing standards, and Mr. Schlueter may not be considered “independent” since his law firm serves as Bonso’s United States counsel. The Audit Committee was established to: (i) review and approve the scope of audit procedures employed by our independent auditors; (ii) review and approve the audit reports rendered by our independent auditors; (iii) approve the audit fee charged by the independent auditors; (iv) report to the Board of Directors with respect to such matters; (v) recommend the selection of independent auditors; and (vi) discharge such other responsibilities as may be delegated to it from time to time by the Board of Directors. Effective as of June 30, 2015, the Board of Directors adopted an amended charter for its Audit Committee.
At March 31, 2018,2021, we employed a total of 266210 persons (8 in Hong Kong and 202 in China), as compared to 286 persons217 at March 31, 2017, 415 persons at March 31, 2016 and 528 persons at March 31, 2015; 8 employees20209 (8 in Hong Kong (8and 209 in 2017, 2016 and 2015) and 258China). Our number of employees in China (278 in 2017, 407 in 2016 and 520 in 2015).has decreased each year since March 31, 2015 when we employed 528 persons. Employees are not covered by collective bargaining agreements. We consider our global labor practices and employee relations to be good. The following table shows the number of shares of common stock beneficially owned by our directors and executive officers as of July 14, 2018:
| Name | | Shares of Common Stock Owned of Record | | | Options Held | | | Total Number of Shares of Common Stock Beneficially Owned | | | Percent of Beneficial Ownership(1) | | | Anthony So | | | 2,281,770 | (2) | | | 300,000 | (3) | | | 2,581,770 | | | | 51.5 | % | | Andrew So | | | 453,000 | | | | 250,000 | (4) | | | 703,000 | | | | 14.2 | % | | Albert So | | | 250,000 | | | | 120,000 | (5) | | | 370,000 | | | | 7.7 | % | | Kim Wah Chung | | | 93,700 | | | | 80,000 | (6) | | | 173,700 | | | | 3.6 | % | | Woo-Ping Fok | | | 66,507 | | | | 50,000 | (7) | | | 116,507 | | | | 2.5 | % | | Henry F. Schlueter | | | 0 | | | | 50,000 | (8) | | | 50,000 | | | | 1.0 | % | | All Directors and Officers as a group (6 persons) | | | 3,144,977 | | | | 850,000 | | | | 3,994,977 | | | | 71.8 | % |
15, 2021: | Name | | Shares of Common Stock Owned of
Record | | Options Held | | Total Number of
Shares of Common Stock Beneficially Owned | | Percent of Beneficial Ownership(1) | | Anthony So | | | 2,431,770 | (2) | | | 150,000 | (3) | | | 2,581,770 | | | | 51.6 | % | | | Andrew So | | | 493,540 | | | | 125,000 | (4) | | | 618,540 | | | | 12.4 | % | | | Albert So | | | 269,459 | | | | 60,000 | (5) | | | 329,459 | | | | 6.7 | % | | | Kim Wah Chung | | | 133,700 | | | | 40,000 | (6) | | | 173,700 | | | | 3.6 | % | | | Woo-Ping Fok | | | 91,507 | | | | 25,000 | (7) | | | 116,507 | | | | 2.4 | % | | | Henry F. Schlueter | | | 9,567 | | | | 25,000 | (8) | | | 34,567 | | | | 0.7 | % | | | All Directors and Officers as a group (6 persons) | | | 3,429,543 | | | | 425,000 | | | | 3,854,543 | | | | 73.0 | % | |
(1) The number of shares outstanding is 4,712,3004,857,187 shares, with 5,543,6395,828,205 total number of shares issued, of which 831,339971,018 shares are held in treasury. The calculations herein are based on the number of shares outstanding of 4,712,300. 4,857,187.(2) Includes 1,143,421 shares of common stock owned of record by a corporation that is wholly owned by a trust of which Mr. So is the sole beneficiary. (3) Includes options to purchase 150,000 shares of common stock at an exercise price of $1.50 per share expiring on March 31, 2020 and options to purchase 150,000 shares of common stock at an exercise price of $1.50 per share expiring on March 31, 2025. (4) Includes options to purchase 125,000 shares of common stock at an exercise price of $1.50 per share expiring on March 31, 2020 and, options to purchase 125,000 shares of common stock at an exercise price of $1.50 per share expiring on March 31, 2025. (5) Includes options to purchase 60,000 shares of common stock at an exercise price of $1.50 per share expiring on March 31, 2020 and options to purchase 60,000 shares of common stock at an exercise price of $1.50 per share expiring on March 31, 2025. (6) Includes options to purchase 40,000 shares of common stock at an exercise price of $1.50 per share expiring on March 31, 2020 and options to purchase 40,000 shares of common stock at an exercise price of $1.50 per share expiring on March 31, 2025. (7) Includes options to purchase 25,000 shares of common stock at an exercise price of $1.50 per share expiring on March 31, 2020 and options to purchase 25,000 shares of common stock at an exercise price of $1.50 per share expiring on March 31, 2025. (8) Includes options to purchase 25,000 shares of common stock at an exercise price of $1.50 per share expiring on March 31, 2020 and options to purchase 25,000 shares of common stock at an exercise price of $1.50 per share expiring on March 31, 2025.
Stock Option and Bonus Plans The 1996 Stock Option Plan
In October 1996, our stockholders adopted the 1996 Stock Option Plan (the “Employees’ Plan”), which provided for the grant of options to purchase an aggregate of not more than 400,000 shares of our common stock. In January 2000, our shareholders approved the proposal of the Board of Directors to increase from 400,000 to 900,000 in the aggregate the number of options to purchase common stock under the Employees’ Plan. The purpose of the Employees’ Plan is to make options available to management and employees in order to encourage them to secure or increase on reasonable terms their stock ownership and to encourage them to remain with the Company.
The Employees’ Plan is administered by a committee appointed by the Board of Directors which determines the persons to be granted options under the Employees’ Plan, the number of shares subject to each option, the exercise price of each option and the option period, subject to the requirement that no option may be exercisable more than ten years after the date of grant. The exercise price of an option may be less than the fair market value of the underlying shares of common stock. No options granted under the Employees’ Plan are transferable by the optionee other than by will or the laws of descent and distribution, and each option will be exercisable during the lifetime of the optionee only by such optionee.
The exercise price of an option granted pursuant to the Employees’ Plan may be paid in cash, by the surrender of options, in common stock, in other property, including the optionee’s promissory note, or by a combination of the above, at our discretion.
During the fiscal year ended March 31, 2018, no options were granted under the Employees’ Plan and as of July 14, 2018, there were no options outstanding which were issued under that plan.
The 2004 Stock Option Plan On March 23, 2004, our stockholders adopted the 2004 Stock Option Plan (the “2004 Plan”), which provided for the grant of up to six hundred thousand (600,000) shares of the Company’s common stock in the form of stock options, subject to certain adjustments as described in the 2004 Plan. At the Annual Meeting of Shareholders held on March 20, 2015, the shareholders approved an amendment to the 2004 Plan to increase the number of shares that could be granted from 600,000 to 850,000. The purpose of the 2004 Plan is to induce key employees to remain in the employ of the Company and to encourage such employees to secure or increase on reasonable terms their common stock ownership in the Company. The Company believes that the 2004 Plan promotes continuity of management and increased incentive and personal interest in the welfare of the Company.
The 2004 Plan is administered by a committee appointed by the Board of Directors, which consists of at least two but not more than three members of the Board, one of whom shall be a non-employee of the Company. The committee members currently are Anthony So and Woo-Ping Fok. The committee determines the specific terms of the options granted, including the employees to be granted options under the plan, the number of shares subject to each option grant, the exercise price of each option and the option period, subject to the requirement that no option may be exercisable more than 10 years after the date of grant. The exercise price of an option may be less than the fair market value of the underlying shares of common stock. No options granted under the plan will be transferable by the optionee other than by will or the laws of descent and distribution, and each option will be exercisable during the lifetime of the optionee only by the optionee. The exercise price of an option granted pursuant to the 2004 Plan may be paid in cash, by the surrender of options, in common stock, in other property, including a promissory note from the optionee, or by a combination of the above, at the discretion of the Committee. As of March 31, 2018,July 15, 2015, 850,000 options, all with an exercise price of $1.50 per share, had been granted to officers and directors of the Company under the 2004 Plan, allPlan. Options for 425,000 shares were exercised during the fiscal year ended March 31, 2020, resulting in the issuance of which remained284,566 shares of common stock and the surrender of 140,434 options in connection with cashless exercises. The options for 425,000 shares that remain outstanding as of July 14, 2018.March 31, 2021 will expire on March 31, 2025 if not previously exercised. On September 7, 2004, our stockholders adopted the 2004 Stock Bonus Plan (the “Stock Bonus Plan”), which authorizes the issuance of up to five hundred thousand (500,000) shares of the Company’s common stock in the form of a stock bonus. The purpose of the Stock Bonus Plan is to: (i) induce key employees to remain in the employ of the Company or of any subsidiary of the Company; (ii) encourage such employees to secure or increase their stock ownership in the Company; and (iii) reward employees, non-employee directors, advisors and consultants for services rendered, or to be rendered, to or for the benefit of the Company or any of its subsidiaries. The Company believes that the Stock Bonus Plan will promote continuity of management and increased incentive and personal interest in the welfare of the Company.
The Stock Bonus Plan is administered by a committee appointed by the Board of Directors which consists of at least two but not more than three members of the Board, one of whom shall be a non-employee of the Company. The Committee members currently are Anthony So and Woo-Ping Fok. The Committee has the authority, in its sole discretion: (i) to determine the parties to receive bonus stock, the times when they shall receive such awards, the number of shares to be issued and the time, terms and conditions of the issuance of any such shares; (ii) to construe and interpret the terms of the Stock Bonus Plan; (iii) to establish, amend and rescind rules and regulations for the administration of the Stock Bonus Plan; and (iv) to make all other determinations necessary or advisable for administering the Stock Bonus Plan. As of March 31, 2018,2021, no shares had been granted under the Stock Bonus Plan.
Item 7. Major Shareholders and Related Party Transactions
We are not directly or indirectly owned or controlled by any foreign government or by another corporation. The following table sets forth, as of July 14, 2018,15, 2021, beneficial ownership of our common stock by each person, to the best of our knowledge, known to own beneficially 5% or more of our common stock outstanding as of such date. Except as otherwise indicated, all shares are owned directly and hold equal voting rights.
Name | | Shares of Common Stock Owned | | | Options to Purchase Common Stock | | | Percent of Beneficial Ownership(1) | | | Anthony So | | | 2,281,770 | (2) | | | 300,000 | | | | 51.5 | % | | Andrew So | | | 453,000 | | | | 250,000 | | | | 14.2 | % | | Albert So | | | 250,000 | | | | 120,000 | | | | 7.7 | % | | CAS Corporation | | | 290,654 | (3) | | | - | | | | 6.2 | % |
| Name | | Shares of Common Stock Owned | | Options to Purchase Common Stock | | Percent of Beneficial Ownership(1) | | Anthony So | | | 2,431,770 | (2) | | | 150,000 | | | | 51.6 | % | | Andrew So | | | 493,000 | | | | 125,000 | | | | 12.4 | % | | Albert So | | | 269,459 | | | | 60,000 | | | | 6.7 | % | | CAS Corporation | | | 290,654 | (3) | | | — | | | | 6.0 | % |
| (1) | The number of shares outstanding is 4,712,3004,857,187 shares, with 5,543,6395,828,205 total number of shares issued, of which 831,339971,018 shares are held in treasury. The calculations above are based upon the number of shares outstanding of 4,712,300.4,857,187. |
| (2) | Includes 1,143,421 shares of common stock owned of record by a corporation that is wholly owned by a trust of which Mr. So is the sole beneficiary. |
| (3) | According to the Schedule 13D filed by CAS Corporation on December 11, 2007. |
There are no arrangements known to us whichthat may at a subsequent date result in a change in control of the Company.
Related Party Transactions
During the fiscal years ended March 31, 2016, 2017 and 2018, weWe paid Schlueter & Associates, P.C. an aggregate of approximately $60,000 $62,000in each of the fiscal years ended March 31, 2019, 2020 and $60,000, respectively,2021 for legal fees. Mr. Henry F. Schlueter, a director of the Company, is the Managing Director of Schlueter & Associates, P.C. During the fiscal year ended March 31, 2015, Anthony So, our Chairman and Chief Executive Officer, made an interest-free loan to Bonso Advanced Technology Limited, a subsidiary of Bonso Electronics International Inc., in the principal amount of HK$4,200,000 (approximately US$538,000 as of the date of the loan). The loan iswas payable in 48 equal monthly installments of HK$87,500 each (approximately US$11,000), which commenced on October 31, 2014. As of March 31, 2018,2019, the Company had repaid approximately $471,000 to Mr. Anthony So, and the balancethis loan in its entirety. One of the loan due to Mr. Anthony So was approximately $67,000. During the fiscal year ended March 31, 2015, one of theCompany’s subsidiaries in Shenzhen, PRC, entered into a rental agreement with a director and stockholder,rents an apartment unit located in Shenzhen from Mr. Anthony So, a director of the Company, for three apartment units located in Shenzhen, PRC for office usage. Mr. Anthony So is the sole owner of these three apartment units.staff quarters. The monthly rental payment was approximately $2,000. Starting from August 1, 2016, rental of two offor the apartment units was no longer required and the rental agreement was terminated; a new rental agreement for one apartment unit for staff quarters was executed, for a monthly rental payment ofis approximately $270. The total rental payment paid to Mr. Anthony So during the fiscal year ended March 31, 20182021 was approximately $3,000 (2017: $9,000; 2016: $24,000)$4,000 (2020: $3,000; 2019: $3,000).
During The rental agreement for this apartment unit terminates on July 31, 2022.One of the fiscal year ended March 31, 2015, one of theCompany’s subsidiaries in Xinxing, PRC entered into a rental agreement with a director and stockholder, Mr. Andrew So, forrents an apartment unit located in Xinxing PRCfrom Mr. Andrew So, our President and Chief Executive Officer and a director of the Company, for staff quarters. Mr. Andrew So is the sole owner of this apartment unit. TheSince December 1, 2018, the monthly rental payment ishas been approximately $450,$600, and the total rental payment paid to Mr. Andrew So during the fiscal year ended March 31, 20182021 was approximately $5,000 (2017: $5,000; 2016: $5,000)$2,000 (2020: $7,000; 2019: $6,000). During the fiscal year ended March 31, 2016, one of the subsidiaries in Shenzhen, PRC entered into a The rental agreement with a director and stockholder, Mr. Anthony So, for one apartment unit located in Shenzhen, PRC for staff quarters. Mr. Anthony So is the sole owner of this apartment unit. Starting from April 1, 2017, rental of this apartment unit terminated on July 31, 2021, and was no longer required and the rental agreement was terminated. The monthly rental payment was approximately $330, and the total rental payment paid to Mr. Anthony So during the fiscal year ended March 31, 2018 was $nil (2017: $4,000; 2016: $2,000) for this unit.
not renewed.In February 2017,2018, Mr. Henry F. Schlueter, a director of the Company, sold 24,000 shares of the Company’s common stock to the Company at a purchase price of $2.39 per share, pursuant to the Company’s repurchase program. In February 2018, Mr. Schlueter sold an additional 10,000 shares of the Company’s common stock to the Company at a purchase price of $3.48 per share.share, pursuant to the Company’s repurchase program. See Item 16E. – “Purchases of Equity Securities by the Issuer and Affiliated Purchasers.” Interests of Experts and Counsel
Item 8. Financial Information
Our Consolidated Financial Statements are set forth under Item 18. – “Financial Statements.”
Item 9. The Offer and Listing
Offer and Listing Details
Our common stock is traded only in the United States over-the-counter market. It is quoted on the NASDAQ Capital Market under the trading symbol “BNSO.” The following table sets forth, for the periods indicated, the range of high and low closing sales prices per share reported by NASDAQ. The quotations represent prices between dealers and do not include retail markup, markdown or commissions and may not necessarily represent actual transactions. The following table sets forth the high and low sale prices for each of the last five years: | Period | | High | | | Low | | April 1, 2013 to March 31, 2014 | | $ | 2.94 | | | $ | 1.33 | | April 1, 2014 to March 31, 2015 | | $ | 2.10 | | | $ | 1.11 | | April 1, 2015 to March 31, 2016 | | $ | 3.25 | | | $ | 1.00 | | April 1, 2016 to March 31, 2017 | | $ | 4.25 | | | $ | 1.23 | | | April 1, 2017 to March 31, 2018 | | $ | 4.10 | | | $ | 1.96 | |
| Period | | High | | Low | | | April 1, 2015 to March 31, 2016 | | | $ | 3.25 | | | $ | 1.00 | | | | April 1, 2016 to March 31, 2017 | | | $ | 4.25 | | | $ | 1.23 | | | | April 1, 2017 to March 31, 2018 | | | $ | 4.10 | | | $ | 1.96 | | | | April 1, 2018 to March 31, 2019 | | | $ | 5.04 | | | $ | 1.62 | | | | April 1, 2019 to March 31, 2020 | | | $ | 3.06 | | | $ | 1.72 | | | | April 1, 2020 to March 31, 2021 | | | $ | 10.44 | | | $ | 1.94 | |
The following table sets forth the high and low sale prices during each of the quarters in the two-year period ended June 30, 2018. | Period | | High | | | Low | | July 1, 2016 to September 30, 2016 | | $ | 3.35 | | | $ | 1.30 | | October 1, 2016 to December 31, 2016 | | $ | 4.25 | | | $ | 1.32 | | January 1, 2017 to March 31, 2017 | | $ | 3.34 | | | $ | 2.01 | | April 1, 2017 to June 30, 2017 | | $ | 2.84 | | | $ | 2.30 | | | July 1, 2017 to September 30, 2017 | | $ | 3.02 | | | $ | 1.96 | | | October 1, 2017 to December 31, 2017 | | $ | 3.31 | | | $ | 2.06 | | | January 1, 2018 to March 31, 2018 | | $ | 4.10 | | | $ | 2.42 | | | April 1, 2018 to June 30, 2018 | | $ | 5.04 | | | $ | 2.73 | |
2021.| Period | | High | | Low | | | July 1, 2019 to September 30, 2019 | | | $ | 2.76 | | | $ | 2.05 | | | | October 1, 2019 to December 31, 2019 | | | $ | 2.65 | | | $ | 1.72 | | | | January 1, 2020 to March 31, 2020 | | | $ | 2.75 | | | $ | 2.00 | | | | April 1, 2020 to June 30, 2020 | | | $ | 2.79 | | | $ | 1.94 | | | | July 1, 2020 to September 30, 2020 | | | $ | 5.60 | | | $ | 2.44 | | | | October 1, 2020 to December 31, 2020 | | | $ | 10.44 | | | $ | 3.65 | | | | January 1, 2021 to March 31, 2021 | | | $ | 8.00 | | | $ | 4.72 | | | | April 1, 2021 to June 30, 2021 | | | $ | 12.70 | | | $ | 5.80 | |
The following table sets forth the high and low sale prices during each of the most r ecentrecent six months. | Period | | High | | | Low | | January 2018 | | $ | 3.68 | | | $ | 2.42 | | February 2018 | | $ | 4.10 | | | $ | 3.10 | | March 2018 | | $ | 4.10 | | | $ | 2.58 | | April 2018 | | $ | 3.48 | | | $ | 2.78 | | May 2018 | | $ | 3.42 | | | $ | 2.88 | | June 2018 | | $ | 5.04 | | | $ | 3.19 | |
| Period | | High | | Low | | | January 2021 | | | $ | 8.00 | | | $ | 5.21 | | | | February 2021 | | | $ | 7.73 | | | $ | 4.72 | | | | March 2021 | | | $ | 7.28 | | | $ | 4.86 | | | | April 2021 | | | $ | 12.70 | | | $ | 5.95 | | | | May 2021 | | | $ | 7.20 | | | $ | 5.80 | | | | June 2021 | | | $ | 9.40 | | | $ | 6.36 | |
On July 14, 2018,15, 2021, the closing price of our common stock was $3.60.$6.94. Of the 5,543,6395,828,205 shares of common stock issued as of July 14, 2018, 4,712,30015, 2021, 4,857,187 shares were outstanding, 1,873,5891,883,156 shares were held in the United States by 143131 holders of record and 831,339971,018 shares were held by the Company as treasury stock. We have 156146 shareholders of record. Transfer and Warrant Agent The transfer agent and registrar for the common stock is Computershare, 8742 Lucent Boulevard, Suite 225, Highlands Ranch, Colorado 80129.
Item 10. Additional Information
Our authorized capital is $170,000, consisting of 23,333,334 shares of common stock, $0.003 par value per share, and 10,000,000 authorized shares of preferred stock, $0.01 par value, divided into 2,500,000 shares each of class A preferred stock, class B preferred stock, class C preferred stock and class D preferred stock. Information with respect to the number of shares of common stock outstanding at the beginning and at the end of the last three fiscal years is presented in the Consolidated Statements of Changes in Stockholders’ Equity for the fiscal years ended March 31, 2016, 20172019, 2020 and 20182021 included herein in Item 18. At July 14, 2018,15, 2021, there were 5,543,6395,828,205 shares of our common stock issued, 4,712,3004,857,187 shares were outstanding and 831,339971,018 shares were held by the Company in treasury. All shares were fully paid. In addition, we had outstanding 850,000425,000 options to purchase common stock as follows: Number of Options | Exercise Price per Share | Expiration Date | 425,000 | $ 1.50 | March 31, 2020 | 425,000 | $ 1.50 | March 31, 2025 |
| Number of Options | | Exercise Price per Share | | Expiration Date | | | 425,000 | | | $ | 1.50 | | | March 31, 2025 | | | | | | | | | | |
At July 14, 2018,15, 2021, there were no shares of our preferred stock outstanding.
Memorandum and Articles of Association
We are registered in the British Virgin Islands and have been assigned company number 9032 in the register of companies. Our registered agent is HWRHarneys Corporate Services Limited at Craigmuir Chambers, P.O. Box 71, Road Town, Tortola, British Virgin Islands. The object or purpose of the Company is to engage in any act or activity that is not prohibited under British Virgin Islands law as set forth in Paragraph 4 of our Memorandum of Association. As an International Business Company, we are prohibited from doing business with persons resident in the British Virgin Islands, owning real estate in the British Virgin Islands or acting as a bank or insurance company. We do not believe that these restrictions materially affect our operations.
Paragraph 57(c) of our Amended Articles of Association (the “Articles”) provides that a director may be counted as one of a quorum in respect of any contract or arrangement in which the director is materially interested; however, if the agreement or transaction cannot be approved by a resolution of directors without counting the vote or consent of any interested director, the agreement or transaction may only be validated by approval or ratification by a resolution of the members. Paragraph 53 of the Articles allows the directors to vote compensation to themselves in respect of services rendered to the Company. Paragraph 66 of the Articles provides that the directors may by resolution exercise all the powers of the Company to borrow money and to mortgage or charge its undertakings and property or any part thereof, to issue debentures, debenture stock and other securities whenever money is borrowed or as security for any debt, liability or obligation of ours or of any third party. Such borrowing powers can be altered by an amendment to the Articles. There is no provision in the Articles for the mandatory retirement of directors. Directors are not required to own shares of the Company in order to serve as directors.
Our authorized share capital is $170,000, divided into 23,333,334 shares of common stock, $0.003 par value, and 10,000,000 authorized shares of preferred stock, $0.01 par value. Holders of our common stock are entitled to one vote for each whole share on all matters to be voted upon by shareholders, including the election of directors. Holders of our common stock do not have cumulative voting rights in the election of directors. All of our common shares are equal to each other with respect to liquidation and dividend rights. Holders of our common shares are entitled to receive dividends if and when declared by our Board of Directors out of funds legally available therefor under British Virgin Islands law. In the event of our liquidation, all assets available for distribution to the holders of our common stock are distributable among them according to their respective holdings. Holders of our common stock have no preemptive rights to purchase any additional unissued common shares. No shares of our preferred stock have been issued; however, the Board of Directors has the ability to determine the rights, preferences and restrictions of the preferred stock at their discretion.
Paragraph 7 of the Memorandum of Association provides that without prejudice to any special rights previously conferred on the holders of any existing shares, any share may be issued with such preferred, deferred or other special rights or such restrictions, whether in regard to dividend, voting, return of capital or otherwise, as the directors may from time to time determine.
Paragraph 10 of the Memorandum of Association provides that if at any time the authorized share capital is divided into different classes or series of shares, the rights attached to any class or series may be varied with the consent in writing of the holders of not less than three-fourths of the issued shares of any other class or series of shares which may be affected by such variation.
Paragraph 105 of the Articles of Association provides that our Memorandum and Articles of Association may be amended by a resolution of members or a resolution of directors. Thus, our Board of Directors without shareholder approval may amend our Memorandum and Articles of Association. This includes amendments to increase or reduce our authorized capital stock. Our ability to amend our Memorandum and Articles of Association without shareholder approval could have the effect of delaying, deterring or preventing a change in control of the Company, including a tender offer to purchase our common shares at a premium over the then current market price. Provisions in respect of the holding of general meetings and extraordinary general meetings are set out in Paragraphs 68 through 77 of the Articles and under the International Business Companies Act. The directors may convene meetings of the members at such times and in such manner and places as the directors consider necessary or desirable, and they shall convene such a meeting upon the written request of members holding more than 30% of the votes of our outstanding voting shares.
British Virgin Islands law and our Memorandum and Articles of Association impose no limitations on the right of nonresident or foreign owners to hold or vote our securities. There are no provisions in the Memorandum and Articles of Association governing the ownership threshold above which shareholder ownership must be disclosed.
A copy of our Memorandum and Articles of Association, as amended, was filed as an exhibit to our Registration Statement on Form F-2 (SEC File No. 333-32524).
filed with the SEC.Material Contracts
The following summarizes each material contract, other than contracts entered into in the ordinary course of business, to which Bonso or any subsidiary of Bonso is a party, for the two years immediately preceding the filing of this report:
We signed a Banking Facilities Letter dated February 27, 2018April 4, 2019 with Hang Seng Bank for an approximately HK$40.0 million (or approximately US$5.1 million) letter of credit, trust receipt facility, export D/P bills, export trade loan, factoring, overdraft facility, term loans and financial instruments including forward contracts. A copy of this Banking Facilities Letter is attachedwas filed with the SEC on August 15, 2019 as Exhibit 4.1 to thisthe Company’s Annual Report on Form 20-F as Exhibit 4.1 and is incorporated herein by this reference.
In November 2017, we signed an agreement with a property developer in Shenzhen (Fangda) to cooperate in reconstructing and redeveloping the Shenzhen factory. Under the terms of the agreement, Fangda is responsible for applying for necessary government approvals and for financing and handling the redevelopment project. Under the agreement, both companies will share the redeveloped property after reconstruction/redevelopment is completed with Bonso holding a 45% interest in the total floor area. In July 2018, we signed a supplementary agreement with Fangda to modify our approach in obtaining government approvals. A summarySummaries of the November 2017 agreement wasand the supplementary agreement were filed as Exhibit 99.1 to the Company’s Current Report on Form 6-K which was filed with the United States Securities and Exchange CommissionSEC on March 27, 2018, and a summary ofExhibit 4.2 to the supplementary agreement is attached to thisCompany’s Annual Report on Form 20-F as Exhibit 4.2.for the fiscal year ended March 31, 2018 which was filed with the SEC on August 15, 2018, respectively. Both agreements are incorporated herein by this reference.
There are no exchange control restrictions on payments of dividends on our common stock or on the conduct of our operations either in Hong Kong, where our principal executive offices are located, or the British Virgin Islands, where we are incorporated. Other jurisdictions in which we conduct operations may have various exchange controls. Taxation and repatriation of profits regarding our China operations are regulated by Chinese laws and regulations. With respect to our PRC subsidiaries, with the exception of a requirement that approximately 11%10% of profits be reserved for future developments and staff welfare, there are no restrictions on the payment of dividends and the removal of dividends from China once all taxes are paid and assessed and losses, if any, from previous years have been made good. To date, these controls have not had, and are not expected to have, a material impact on our financial results. There are no material British Virgin Islands laws that impose foreign exchange controls on us or that affect the payment of dividends, interest or other payments to holders of our securities who are not residents of the British Virgin Islands. British Virgin Islands law and our Memorandum and Articles of Association impose no limitations on the right of nonresident or foreign owners to hold or vote our securities.
No reciprocal tax treaty regarding withholding exists between the United States and the British Virgin Islands. Under current British Virgin Islands law, dividends, interest or royalties paid by us to individuals are not subject to tax as long as the recipient is not a resident of the British Virgin Islands. If we were to pay a dividend, we would not be liable to withhold any tax, but shareholders would receive gross dividends, if any, irrespective of their residential or national status.
Dividends, if any, paid to any United States resident or citizen shareholder are treated as dividend income for United States federal income tax purposes. Such dividends are not eligible for the 70%50% dividends-received deduction allowed to United States corporations on dividends from a domestic corporation under Section 243 of the Internal Revenue Code. Various Internal Revenue Code provisions impose special taxes in certain circumstances on non-United States corporations and their shareholders. You are urged to consult your tax advisor with regard to such possibilities and your own tax situation.
A foreign corporation will be treated as a passive foreign investment company (“PFIC”) for United States federal income tax purposes if, after applying relevant look-through rules with respect to the income and assets of subsidiaries, 75% or more of its gross income consists of certain types of passive income or 50% or more of the gross value of its assets is attributable to assets that produce passive income or are held for the production of passive income. For this purpose, passive income generally includes dividends, interest, royalties, rents (other that rents and royalties derived in the active conduct of a trade or business), annuities and gains from assets that produce passive income. We presently believe that we are not a PFIC and do not anticipate becoming a PFIC. This is, however, a factual determination made on an annual basis and is subject to change. If we were to be classified as a PFIC in any taxable year, (i) U.S. holders would generally be required to treat any gain on sales of our shares held by them as ordinary income and to pay an interest charge on the value of the deferral of their United States federal income tax attributable to such gain; and (ii) distributions paid by us to our United States holders could also be subject to an interest charge. In addition, we would not provide information to our United States holders that would enable them to make a “qualified electing fund” election under which, generally, in lieu of the foregoing treatment, our earnings would be currently included in their United States federal income.
In addition to United States federal income taxation, shareholders may be subject to state and local taxes upon their receipt of dividends.
You may read and copy documents referred to in this Annual Report on Form 20-F that have been filed with the SEC at the SEC’s Public Reference Room, 450 Fifth Street, N.W., Washington, D.C. You may obtain information on the operation of the Public Reference Room by calling the SEC at 1-800-SEC-0330. You can also obtain copies of our SEC filings by going to the SEC’s website at http://www.sec.gov.
The SEC allows us to “incorporate by reference” the information we file with the SEC. This means that we can disclose important information to you by referring you to another document filed separately with the SEC. The information incorporated by reference is considered to be part of this Annual Report on Form 20-F.
Item 11. Quantitative and Qualitative Disclosures About Market Risk
We are exposed to a certain level of interest rate risk and foreign currency exchange risk.
Our interest rate risk primarily arises from our bank borrowings and our general banking facilities. As at March 31, 2018,2021, we had utilized approximately $99,000$992,000 of our total banking facilities of approximately $5,128,000. Based on the maturity profile and composition of our long-term debt and general banking facilities, including the fact that our banking facilities are at variable interest rates, we estimate that changes in interest rates will not have a material impact on our operating results or cash flows. We intend to manage our interest rate risk through appropriate borrowing strategies. We have not entered into interest rate swap or risk management agreements; however, it is possible that we may do so in the future. A summary of our debts as at March 31, 2018 which2021 that were subject to variable interest rates is as below:
| | | March 31, | | Interest | | | | 2018 | | Rate | | Notes payable | | $ | 99,000 | | HIBOR(1) +2.50% | Short term loans (2) | | $ nil | | HIBOR(1) +2.25% | Long term loans (2) | | $ nil | | HIBOR(1) +2.00% | | | | | | | |
| | | March 31, | | Interest | | | | 2021 | | Rate | | Notes payable | | $ | 25,000 | | | | HIBOR(1) +2.50% | | | Short term loans(2) | | $ | 500,000 | | | | HIBOR(1) +2.25% | | | Long term loans(2) | | $ | 467,000 | | | | HIBOR(1) +2.00% | | | | | | | | | | | |
(1) HIBOR is the Hong Kong Interbank Offer Rate. (2) A clause in the banking facility states that the term loans are subject to review any time and also subject to the bank's overriding right of repayment on demand, including the right to call for cash cover on demand for prospective and contingent liabilities. Therefore, all long-term loans were classified as current liabilities in the consolidated balance sheets.
A change in the interest rate of 1% will increase or decrease the interest expense of the Company by approximately $2,000.
$12,000.For further information concerning our banking facilities, the interest rates payable and repayment terms, please see Note 7 to our Consolidated Financial Statements included elsewhere in this Annual Report.
Foreign Currency Exchange Rates
For a discussion of our Foreign Currency Exchange Risk, See Item 5. – “Operating and Financial Review and Prospects - Foreign Currency Exchange Rates.”
Item 12. Description of Securities Other Than Equity Securities
Item 13. Defaults, Dividend Arrearages and Delinquencies
Item 14. Material Modifications to the Rights of Security Holders and Use of Proceeds
Item 15. Controls and Procedures
The Company’s management directed that an evaluation of our disclosure controls and procedures, as defined in paragraph (e) of Rule 13a-15 or 15d-15 under the Exchange Act, be conducted as of March 31, 2018.2021. Our Company's internal control over financial reporting is a process designed under the supervision of the Chief Executive Officer, the Chief Operating Officer and the Chief Financial Officer to provide reasonable assurance regarding the reliability of financial reporting and the preparation of financial statements for external purposes in accordance with generally accepted accounting principles. Our internal control over financial reporting includes those policies and procedures that:
| · | pertain to the maintenance of records that, in reasonable detail, accurately and fairly reflect the transactions and dispositions of our assets; provide reasonable assurance that transactions are recorded as necessary to permit preparation of financial statements in accordance with generally accepted accounting principles, and that receipts and expenditures of our Company are being made only in accordance with authorizations of our management and directors; and provide reasonable assurance regarding prevention or timely detection of unauthorized acquisition, use or disposition of assets that could have a material effect on the financial statements. | · | provide reasonable assurance that transactions are recorded as necessary to permit preparation of financial statements in accordance with generally accepted accounting principles, and that receipts and expenditures of our Company are being made only in accordance with authorizations of our management and directors; and |
| · | provide reasonable assurance regarding prevention or timely detection of unauthorized acquisition, use or disposition of assets that could have a material effect on the financial statements. |
There are inherent limitations in the effectiveness of any internal control, including the possibility of human error and the circumvention or overriding of controls. Accordingly, even effective internal controls can provide only reasonable assurances with respect to financial statement preparation. Also, projections of any evaluation of effectiveness to future periods are subject to the risk that controls may become inadequate because of changes in conditions, or that the degree of compliance with the policies or procedures may deteriorate.
In making this assessment, management used the criteria established in 2013 Internal Control—Integrated Framework issued by the Committee of Sponsoring Organizations of the Treadway Commission (COSO). Based on the assessment, the Company’s management, including its Chief Operating Officer and Chief Financial Officer, have concluded that, as of March 31, 2018,2021, there were certain material weaknesses in our internal controls over financial reporting related to our financial closing process, the lack of trained accounting personnel and the failure to enter certain transactions into the accounting records on a timely basis. All of these weaknesses were identified in the Form 20-F that we filed during the previous year. As a result of that evaluation and other assessments and observations, management concluded that both our internal controls over financial reporting and disclosure controls and procedures for the fiscal year ended March 31, 2018,2021, were ineffective.
· | We have not maintained effective internal control over the financial closing process to provide reasonable assurance that the financial statements (including our interim financial statements) are prepared in accordance with Generally Accepted Accounting Principles (GAAP). |
| § | a sufficient number of experienced personnel in our accounting and finance departments to provide reasonable assurance that transactions were being recorded, and adequate supervisory reviews and monitoring activities over financial reporting matters and controls performed, as necessary to permit the preparation of the financial statements (including our interim financial statements) in accordance with GAAP; |
| § | timely and accurate preparation and review of period-end account analyses and timely disposition of any required adjustments; and |
| § | adequate training of and communication to employees regarding their duties and control responsibilities within the accounting and finance organization to ensure that processes and control activities were being carried out appropriately. |
During the fiscal year ended March 31, 2014, we identified additional material weaknesses, relating to the conduct of our year-end inventory count, and the approval of loans to an officer and director in violation of Section 13(k) adopted under the Exchange Act as more particularly described below. We have taken certain remedial actionsnot maintained effective internal control over the financial closing process to address theseprovide reasonable assurance that the financial statements (including our interim financial statements) are prepared in accordance with Generally Accepted Accounting Principles (GAAP).
We did not have: a sufficient number of experienced personnel in our accounting and finance departments to provide reasonable assurance that transactions were being recorded, and adequate supervisory reviews and monitoring activities over financial reporting matters and management does not believecontrols performed, as necessary to permit the preparation of the financial statements (including our interim financial statements) in accordance with GAAP; timely and accurate preparation and review of period-end account analyses and timely disposition of any required adjustments; and adequate training of and communication to employees regarding their duties and control responsibilities within the accounting and finance organization to ensure that these material weaknesses exist as of March 31, 2018.processes and control activities were being carried out appropriately.
Notwithstanding the identified material weaknesses, management believes the consolidated financial statements included in this Annual Report on Form 20-F fairly present in all material respects our financial condition, results of operations and cash flows at and for the periods presented in accordance with U.S. GAAP.
In response to the material weaknesses described above, management intends to do the following: Provide further training and communication to its accounting staff with regard to the recording of transactions in the accounting records, and closing procedures and practices.
Increase supervisory review and monitoring activities over financial reporting matters and controls.
| · | Provide further training and communication to its accounting staff with regard to the recording of transactions in the accounting records, and closing procedures and practices. |
Consider hiring either an additional experienced accountant with U.S. GAAP experience or outside consultants to work with the Company and its accounting staff. | · | Increase supervisory review and monitoring activities over financial reporting matters and controls. |
| · | Consider hiring either an additional experienced accountant with U.S. GAAP experience or outside consultants to work with the Company and its accounting staff. |
If the remedial measures described above are insufficient to address any of the identified material weaknesses or are not implemented effectively, or additional deficiencies arise in the future, material misstatements in our interim or annual financial statements may occur in the future. We are currently working to implement enhanced controls, as discussed above, to address the material weaknesses in our internal control over financial reporting and to remedy the ineffectiveness of our disclosure controls and procedures. A key element of our remediation effort is the ability to recruit and retain qualified individuals to support our remediation efforts. While our Audit Committee and Board of Directors have been supportive of our efforts by supporting the hiring of various individuals in finance, as well as funding efforts to improve our financial reporting system, improvement in internal control will be hampered if we cannot recruit and retain more qualified professionals. Among other things, any unremediated material weaknesses could result in material post-closing adjustments in future financial statements. Furthermore, any such unremediated material weaknesses could have the effects described above in the Risk Factor captioned “We have identified material weaknesses in our internal control over financial reporting which could, if not remediated, result in material misstatements in our financial statements.” Management believes that the remediation items listed above, if executed, will ensure that data and reports can be relied upon for the purpose of accurately and timely recording transactions in accordance with GAAP. However, we have experienced material weaknesses in our internal controls for several years and, to date, management has been unable to implement effective remediation measures.
Changes in Internal Controls
There were no changes in the Company’s internal controls during the period covered by this Report that have materially affected or are reasonably likely to materially affect our internal control over financial reporting.
Item 16A. Audit Committee Financial Expert
Henry F. Schlueter is an ad hoc member of the Company’s Audit Committee and is deemed to be a financial expert. Mr. Schlueter, the Company’s outside securities counsel, may not be deemed to be “independent” within the definition of “independence” published by NASDAQ.
We have adopted a code of ethics that applies to our Chief Executive Officer and Chief Financial Officer. We intend to disclose any changes in, or waivers from, our code of ethics by filing a Form 6-K. Stockholders may request a free copy in print form from our Chief Financial Officer at:
Bonso Electronics International, Inc.
Unit 1404, 14/F, Cheuk Nang Centre
9 Hillwood Road, Tsimshatsui
Kowloon
Hong Kong Item 16C. Principal Accountant Fees and Services
Audit Committee’s Pre-approval Policies and Procedure
The Audit Committee must pre-approve the audit and non-audit services performed by the independent auditor in order to assure that the provision of such services does not impair the auditor's independence. Before the Company or any of its subsidiaries engage the independent auditor to render a service, the engagement must be either:
· | • specifically approved by the Audit Committee; or |
· | • entered into pursuant to this Pre-Approval Policy. |
The term of any pre-approval is 12 months from the date of pre-approval, unless the Audit Committee specifically provides for a different period. The Audit Committee may periodically revise the list of pre-approved services.
The Audit Committee may delegate pre-approval authority to one or more of its members. The member or members to whom such authority is delegated shall report any pre-approval decisions to the Audit Committee at its next scheduled meeting. The Audit Committee may not delegate to management the Audit Committee's responsibilities to pre-approve services performed by the independent auditor.
The Audit Committee must specifically pre-approve the terms of the annual audit services engagement. The Audit Committee shall approve, if necessary, any changes in terms resulting from changes in audit scope, Company structure or other matters. In addition to the annual audit services engagement approved by the Audit Committee, the Audit Committee may grant pre-approval for other audit services, which are those services that only the independent auditor reasonably can provide.
The Audit Committee may grant pre-approval to those permissible non-audit services classified as other services that it believes would not impair the independence of the auditor, including those that are routine and recurring services.
The Audit Committee may consider the amount or range of estimated fees as a factor in determining whether a proposed service would impair the auditor's independence. Where the Audit Committee has approved an estimated fee for a service, the pre-approval applies to all services described in the approval. However, in the event the invoice in respect of any such service is materially in excess of the estimated amount or range, the Audit Committee must approve such excess amount prior to payment of the invoice. The Audit Committee expects that any requests to pay invoices in excess of the estimated amounts will include an explanation as to the reason for the overage. The Company’s independent auditor will be informed of this policy.
The Company’s management shall inform the Audit Committee of each service performed by the independent auditor pursuant to this Pre-Approval Policy. Requests or applications to provide services that require separate approval by the Audit Committee shall be submitted to the Audit Committee by both the independent auditor and the Chief Financial Officer and must include a joint statement as to whether, in their view, the request or application is consistent with the SEC’s and the Public Company Accounting Oversight Board (United States)’s rules on auditor independence.
All audit related services, tax services and other services indicated below were pre-approved by the Audit Committee.
The aggregate fees billed by MSPC Certified Public Accountants and Advisors, P.C. for professional services rendered for the audit of the Company’s annual consolidated financial statements for the fiscal years ended March 31, 2021 were approximately $150,000, and the aggregate fees billed by Moore Stephens CPA Limited for professional services rendered for the audit of the Company’s annual consolidated financial statements for the fiscal year ended March 31, 2018 and 20172020 were approximately $160,000 and $190,000, respectively. $150,000.Audit Related Fees There were no fees billed by Moore Stephens CPA LimitedMSPC Certified Public Accountants and Advisors, P.C. for professional services rendered for assurance and related services that were reasonably related to the performance of the audit and are not reported above under “Audit Fees” for the fiscal year ended March 31, 20182021 or for the fiscal year ended March 31, 2017. 2020 by Moore Stephens CPA Limited.Tax Fees
The aggregate fees billed for professional services rendered for tax compliance for the fiscal years ended March 31, 20182021 and 20172020 were approximately $8,000$4,000 and $3,600,$5,000, respectively.
The aggregateNo other fees were incurred or billed to us by Moore Stephens CPA Limitedour auditors for agreed-upon procedures rendered during the fiscal years ended March 31, 2018 and 2017 were approximately $nil and $10,000, respectively.
2021 or 2020.Item 16D. Exemptions from the Listing Standards for Audit Committees
Pursuant to NASDAQ Marketplace Rule 4350(a), a foreign private issuer may follow its home country practice in lieu of Rule 4350, which sets forth the qualitative Listing Requirements for NASDAQ listed companies. Rule 4350 requires, among other things, that a listed company have at least three members on its audit committee. The Company currently has an audit committee consisting of two directors, one of whom is deemed to be “independent” as defined in NASDAQ Marketplace Rule 4200. The Company has obtained a letter from independent counsel in the British Virgin Islands certifying that having a single member audit committee is not prohibited by British Virgin Island law. See Item 6. – “Directors, Senior Management and Advisors - NASDAQ Exemptions and Home Country Practices.”
Item 16E. Purchases of Equity Securities by the Issuer and Affiliated Purchasers
In August of 2001, the Company's Board of Directors authorized a program for the Company to repurchase up to $500,000 of its common stock. This repurchase program does not obligate the Company to acquire any specific number of shares or acquire shares over any specified period of time. On November 16, 2006 and on September 17, 2015, the Company's Board of Directors authorized an additional $1,000,000 and an additional $1,500,000, respectively, for the Company’s repurchase of its common stock under the same repurchase program. On April 25, 2018, the Board of Directors approved the expenditure of an additional $3,000,000 to repurchase shares of the Company’s common stock, bringing the aggregate amount available for repurchases to $6,000,000. As of March 31, 2018,2021, the Company has repurchased 782,0171,005,018 shares of its common stock and expended approximately $2,501,000$3,174,000 to repurchase those shares. Effective April 25, 2018, with the adoption of the above-mentioned increase, the Company had up to approximately $3,499,000 available to fund additional repurchases of the Company’s common stock. As of March 31, 2018,2021, the Company had 4,795,6224,857,187 shares of its common stock issued and outstanding.
The following table contains the Company’s purchases of equity securities in the fiscal year ended March 31, 2018. | Issuer Purchases of Equity Securities | | | Period | | (a) Total Number of Shares (or Units) Purchased | | | (b) Average Price Paid per Share (or Unit) | | | (c) Total Number of Shares (or Units) Purchased as Part of Publicly Announced Plans or Programs | | | (d) Maximum Number (or Approximate Dollar Value) of Shares (or Units) that May Yet Be Purchased Under the Plans or Programs | | | April 1, 2017 to April 30, 2017 | | | 17,300 | | | $ | 2.46 | | | | 17,300 | | | $ | 1,025,000 | | | May 1, 2017 to May 31, 2017 | | | 11,159 | | | $ | 2.51 | | | | 11,159 | | | $ | 997,000 | | | June 1, 2017 to June 30, 2017 | | | 2,000 | | | $ | 2.45 | | | | 2,000 | | | $ | 992,000 | | | July 1, 2017 to July 31, 2017 | | | 16,542 | | | $ | 2.47 | | | | 16,542 | | | $ | 951,000 | | | August 1, 2017 to August 31, 2017 | | | 28,711 | | | $ | 2.23 | | | | 28,711 | | | $ | 887,000 | | | September 1, 2017 to September 30, 2017 | | | 29,722 | | | $ | 2.27 | | | | 29,722 | | | $ | 820,000 | | | October 1, 2017 to October 31, 2017 | | | 7,335 | | | $ | 2.44 | | | | 7,335 | | | $ | 802,000 | | | November 1, 2017 to November 30, 2017 | | | 25,286 | | | $ | 2.53 | | | | 25,286 | | | $ | 738,000 | | | December 1, 2017 to December 31, 2017 | | | 21,413 | | | $ | 2.43 | | | | 21,413 | | | $ | 686,000 | | | January 1, 2018 to January 31, 2018 | | | 1,310 | | | $ | 3.36 | | | | 1,310 | | | $ | 681,000 | | | February 1, 2018 to February 29, 2018 | | | 48,422 | | | $ | 3.40 | | | | 48,422 | | | $ | 516,000 | | | March 1, 2018 to March 31, 2018 | | | 4,298 | | | $ | 4.00 | | | | 4,298 | | | $ | 499,000 | | | TOTAL | | | 213,498 | | | $ | 2.66 | | | | 213,498 | | | $ | 499,000 | |
* From April 1, 2018 to July 14, 2018, the Company repurchased an additional 83,322 shares of its common stock for an aggregate purchase price of approximately $262,000.
2021.| Issuer Purchases of Equity Securities | | Period | | (a) Total Number of Shares (or Units) Purchased | | (b) Average Price Paid per Share (or Unit) | | (c) Total Number of Shares (or Units) Purchased as Part of Publicly Announced Plans or Programs | | (d) Maximum Number (or Approximate Dollar Value) of Shares (or Units) that May Yet Be Purchased Under the Plans or Programs | | April 1, 2020 to April 30, 2020 | | | 3,077 | | | $ | | | 2.01 | | | | 3,077 | | | $ | 3,009,000 | | | May 1, 2020 to May 31, 2020 | | | 3,000 | | | $ | | | 2.03 | | | | 3,000 | | | $ | 3,003,000 | | | June 1, 2020 to June 31, 2020 | | | 7,266 | | | $ | | | 2.36 | | | | 7,266 | | | $ | 2,986,000 | | | July 1, 2020 to July 31, 2020 | | | — | | | $ | | | — | | | | — | | | $ | 2,986,000 | | | August 1, 2020 to August 31, 2020 | | | — | | | $ | | | — | | | | — | | | $ | 2,986,000 | | | September 1, 2020 to September 30, 2020 | | | 224 | | | $ | | | 3.62 | | | | 224 | | | $ | 2,985,000 | | | October 1, 2020 to October 31, 2020 | | | 22,281 | | | $ | | | 4.53 | | | | 22,281 | | | $ | 2,884,000 | | | November 1, 2020 to November 30, 2020 | | | 2,487 | | | $ | | | 4.36 | | | | 2,487 | | | $ | 2,873,000 | | | December 1, 2020 to December 31, 2020 | | | 10,944 | | | $ | | | 4.34 | | | | 10,944 | | | $ | 2,826,000 | | | January 1, 2021 to January 31, 2021 | | | — | | | $ | | | — | | | | — | | | $ | 2,826,000 | | | February 1, 2021 to February 28, 2021 | | | — | | | $ | | | — | | | | — | | | $ | 2,826,000 | | | March 1, 2021 to March 31, 2021 | | | — | | | $ | | | — | | | | — | | | $ | 2,826,000 | | | TOTAL | | | 49,279 | | | $ | | | 3.84 | | | | 49,279 | | | $ | 2,826,000 | |
As of July 14, 2018,15, 2021, 34,000 repurchased shares had been removed from the total number of shares issued. The Company (through its subsidiary) had repurchased and held an aggregate of 831,3391,005,018 shares of its common stock. The Company may from time to time repurchase additional shares of its common stock under this program. Item 16F. Changes in Registrant’s Certifying Accountants.
Not applicable to Bonso.
On March 29, 2021, Moore Stephens CPA Limited resigned and the Company engaged MSPC Certified Public Accountants and Advisors, P.C. as its independent public accountants for the fiscal year ended March 31, 2021. The resignation of Moore Stephens CPA Limited and the engagement of MSPC Certified Public Accountants and Advisors, P.C. as the Company’s auditors for the fiscal year ended March 31, 2021, was disclosed in a Form 6-K filed with the SEC on March 31, 2021. Item 16G. Corporate Governance.
For a discussion of the ways in which the Company’s corporate governance differs from those followed by domestic companies under the NASDAQ Marketplace listing requirements, see Item 6. – “Directors, Senior Management and Advisors - NASDAQ Exemptions and Home Country Practices,” above.
Item 16H. Mine Safety Disclosure.
Not applicable to Bonso.
Item 17. Financial Statements
Item 18. Financial Statements
The following Financial Statements are filed as part of this Annual Report: Contents |
| | Pages | | Report of Independent Registered Public Accounting Firm | F-1
| | F-2 to F-4 | | | | | | | | Consolidated Balance Sheets as of March 31, 20172020 and 2018 2021 | F-2
| | F-5 | | | | | | | | Consolidated Statements of Operations and Comprehensive Income for the years ended March 31, 2015, 20172019, 2020 and 2018 | F-3
| | F-6 | | | | | | | | Consolidated Statements of Changes in Stockholders’ Equity for the years ended
March 31, 2016, 20172019, 2020 and 2018
| F-4
| | F-7 | | | | | | | | Consolidated Statements of Cash Flows for the years ended
March 31, 2016, 20172019, 2020 and 2018
| F-5
| | F-8 | | | | | | | | Notes to Consolidated Financial Statements | F-6
| | F-9 to F-45 | |
_________________________
The registrant hereby certifies that it meets all of the requirements for filing on Form 20-F and that it has duly caused and authorized the undersigned to sign this Annual Report on its behalf
| Dated: August 16, 2021 | BONSO ELECTRONICS INTERNATIONAL INC. | | | | By: | /s/ Andrew So | | | Andrew So, Chief Executive Officer and Director
|
| Dated: August 16, 2021 | | | | | | | Dated: August 15, 2018By: | /s/ AnthonyAlbert So | | | | Anthony So, Chairman of the Board, Chief Executive Officer and Director | | | | | | | | Dated: August 15, 2018 | /s/ Albert So | | | | Albert So, Chief Financial Officer, Treasurer and Secretary
|
Bonso Electronics International Inc. (Incorporated in the British Virgin Islands) Consolidated Financial Statements March 31, 2021 Bonso Electronics International Inc. Index to Consolidated Financial Statements
Bonso Electronics International Inc.(Incorporated in the British Virgin Islands)
Consolidated Financial Statements
March 31, 2018
Bonso Electronics International Inc.
Index to Consolidated Financial Statements
Contents
| | Pages
| | | | Report of Independent Registered Public Accounting Firm | | F-2 - F-4 | Consolidated Balance Sheets as of March 31, 20172020 and 2018 2021 | | F-3
F-5 | Consolidated Statements of Operations and Comprehensive Income for the years ended March 31, 2016, 20172019, 2020 and 20182021 | | F-4
F-6 | Consolidated Statements of Changes in Stockholders’ Equity for the years ended March 31, 2016, 20172019, 2020 and 20182021 | | F-5
F-7 | Consolidated Statements of Cash Flows for the years ended March 31, 2016, 20172019, 2020 and 2018 2021 | | F-6
F-8 | Notes to Consolidated Financial Statements | F-9 - F-45 |
Report of Independent Registered Public Accounting Firm To the Board of Directors and Stockholders of Bonso Electronics International Inc. Opinion on the Financial Statements We have audited the accompanying consolidated balance sheet of Bonso Electronics International Inc. and Subsidiaries (the “Company”) as of March 31, 2021, and the related consolidated statements of operations and comprehensive Income, changes in stockholders’ equity and cash flows for the year then ended, and the related notes (collectively referred to as the “financial statements”). In our opinion, the consolidated financial statements present fairly, in all material respects, the financial position of the Company as of March 31, 2021, and the results of its operations and its cash flows for the year then ended, in conformity with accounting principles generally accepted in the United States of America. Basis for Opinion These consolidated financial statements are the responsibility of the Company’s management. Our responsibility is to express an opinion on the Company’s consolidated financial statements based on our audit. We are a public accounting firm registered with the Public Company Accounting Oversight Board (United States) (“PCAOB”) and are required to be independent with respect to the Company in accordance with the U.S. federal securities laws and the applicable rules and regulations of the Securities and Exchange Commission and the PCAOB. We conducted our audit in accordance with the standards of the PCAOB. Those standards require that we plan and perform the audit to obtain reasonable assurance about whether the consolidated financial statements are free of material misstatement, whether due to error or fraud. The Company is not required to have, nor were we engaged to perform, an audit of its internal control over financial reporting. As part of our audit, we are required to obtain an understanding of internal control over financial reporting but not for the purpose of expressing an opinion on the effectiveness of the Company’s internal control over financial reporting. Accordingly, we express no such opinion. Our audit included performing procedures to assess the risks of material misstatement of the consolidated financial statements, whether due to error or fraud, and performing procedures that respond to those risks. Such procedures included examining, on a test basis, evidence regarding the amounts and disclosures in the consolidated financial statements. Our audit also included evaluating the accounting principles used and significant estimates made by management, as well as evaluating the overall presentation of the consolidated financial statements. We believe that our audit provides a reasonable basis for our opinion. Critical Audit Matters The critical audit matters communicated below are matters arising from the current period audit of the consolidated financial statements that were communicated or required to be communicated to the audit committee and that: (1) relate to the accounts or disclosures that are material to the consolidated financial statements and (2) involved our especially challenging, subjective, or complex judgments. The communication of critical audit matters does not in any way alter our opinion on the consolidated financial statements, taken as a whole, and we are not, by communicating the critical audit matters below, providing separate audit opinions on the critical audit matters or the accounts or disclosures to which they relate. Revenue Recognition As discussed in Note 1(l) to the consolidated financial statements, the Company recognizes revenue from contracts with customers in accordance with Accounting Standards Codification (“ASC”) 606. Due to the significance of revenue to the consolidated financial statements, we identified revenue recognition as a critical audit matter. Recognizing revenue in accordance with ASC 606 requires a five step process as detailed in Note 1 to the consolidated financial statements. To determine that the Company satisfied the five steps, we performed a number of audit procedures, including direct confirmation with customers and agents (through whom the Company sells products online), and examination of invoices and shipping documents. We reviewed contracts with agents and purchase orders of customers to verify the contractual terms were followed and properly accounted for under ASC 606. We also traced customer payments to bank accounts and performing cut-off testing to insure that revenue was recognized in the proper period. Deferred Income Tax Assets The Company estimates its income tax provision (benefit) on an entity basis, as each of the companies included in the consolidated financial statements files a tax return on an individual company basis. As detailed in Note 8 to the consolidated financial statements, the Company’s deferred tax asset primarily arises from net operating loss carryforwards. To determine the realizability of the deferred tax asset, the Company prepared a forecast of the expected taxable results for each of its entities for the following five fiscal years, including any relevant business and tax strategies. Based on this forecast, the Company has established a valuation allowance of approximately $3,197,000 against the gross deferred tax asset of $3,976,000. Our audit procedures surrounding the deferred tax asset and its realizability included testing the reconciliation from reported income(loss) to taxable income(loss) to determine that the tax laws were applied properly, checking the mathematical accuracy of the forecast of taxable income(loss), evaluating the reasonableness of the assumptions and tax strategies used in the forecast of taxable income(loss) and performing a sensitivity analysis. /s/ MSPC Certified Public Accountants and Advisors, P.C. MSPC Certified Public Accountants and Advisors, P.C. We have served as the Company’s auditor since 2021.
New York, New York August 16, 2021
Report of Independent Registered Public Accounting Firm
To the Board of Directors and Stockholders of Bonso Electronics International Inc.
Opinion on the Consolidated Financial Statements We have audited the accompanying consolidated balance sheets of Bonso Electronics International Inc. and subsidiaries (the “Company”) as of March 31, 2017 and 2018,2020, and the related consolidated statements of operations and comprehensive income, changes in stockholders’ equity, and cash flows for each of the two years in the three-year period ended March 31, 2018,2020, and the related notes (collectively referred to as the “consolidated financial statements”). In our opinion, the consolidated financial statements present fairly, in all material respects, the consolidated financial position of the Company as of March 31, 2017 and 2018,2020, and the consolidated results of its operations and its cash flows for each of the threetwo years in the period ended March 31, 2018,2020, in conformity with accounting principles generally accepted in the United States of America. These consolidated financial statements are the responsibility of the Company’s management. Our responsibility is to express an opinion on the Company’s consolidated financial statements based on our audits. We are a public accounting firm registered with the Public Company Accounting Oversight Board (United States) (“PCAOB”) and are required to be independent with respect to the Company in accordance with the U.S. federal securities laws and the applicable rules and regulations of the Securities and Exchange Commission and the PCAOB. We conducted our audits in accordance with the standards of the PCAOB. Those standards require that we plan and perform the audit to obtain reasonable assurance about whether the consolidated financial statements are free of material misstatement, whether due to error or fraud. The Company is not required to have, nor were we engaged to perform, an audit of its internal control over financial reporting. As part of our audits, we are required to obtain an understanding of internal control over financial reporting, but not for the purpose of expressing an opinion on the effectiveness of the Company’s internal control over financial reporting. Accordingly, we express no such opinion. Our audits included performing procedures to assess the risks of material misstatement of the consolidated financial statements, whether due to error or fraud, and performing procedures that respond to those risks. Such procedures included examining, on a test basis, evidence regarding the amounts and disclosures in the consolidated financial statements. Our audits also included evaluating the accounting principles used and significant estimates made by management, as well as evaluating the overall presentation of the consolidated financial statements. We believe that our audits provide a reasonable basis for our opinion.
/s/ Moore Stephens CPA Limited Moore Stephens CPA Limited Certified Public Accountants
We have servedbegan serving as the Company'sCompany’s auditor since 2009 .in 2009. In 2021, we became the predecessor auditor.
Hong Kong August 17, 2020
Bonso Electronics International Inc. Consolidated Balance Sheets (Expressed in United States Dollars) | | | | | | March 31, | | | | | Note | | | 2017 | | | 2018 | | | | | | | | $ in thousands | | | $ in thousands | | | Assets | | | | | | | | | | | | | | | | | | | | | | Current assets | | | | | | | | | | | Cash and cash equivalents | | | | | | 3,745 | | | | 8,751 | | | Trade receivables, net | | | 2 | | | | 1,213 | | | | 794 | | | Other receivables, deposits and prepayments | | | | | | | 1,600 | | | | 745 | | | Inventories, net | | | 3 | | | | 1,018 | | | | 1,012 | | | Income tax recoverable | | | 8 | | | | - | | | | 5 | | | Financial instruments at fair value | | | 9 | | | | 167 | | | | 78 | | | | | | | | | | | | | | | | | Total current assets | | | | | | | 7,743 | | | | 11,385 | | | | | | | | | | | | | | | | | | | | | | | | | | | | | | | Investment in life insurance contract | | | 10 | | | | 144 | | | | 149 | | | | | | | | | | | | | | | | | Property, plant and equipment, net | | | 4 | | | | 10,294 | | | | 10,434 | | | | | | | | | | | | | | | | | Intangible assets, net | | | 6 | | | | 2,785 | | | | 2,787 | | | | | | | | | | | | | | | | | Total assets | | | | | | | 20,966 | | | | 24,755 | | | | | | | | | | | | | | | | | Liabilities and stockholders’ equity | | | | | | | | | | | | | | | | | | | | | | | | | | | | Current liabilities | | | | | | | | | | | | | | | | | | | | | | | | | | | | Notes payable - secured | | | 7 | | | | 134 | | | | 99 | | | Bank loans - secured | | | 7 | | | | 143 | | | | - | | | Accounts payable | | | | | | | 1,183 | | | | 924 | | | Accrued charges and deposits | | | | | | | 3,018 | | | | 3,178 | | | Income tax liabilities | | | 8 | | | | 533 | | | | - | | | Payable to affiliated parties | | | 15 | | | | 54 | | | | 73 | | | Current portion of capital lease obligations | | | 11(a) | | | | 44 | | | | 28 | | | Loan from affiliated party - current portion | | | 15 | | | | 135 | | | | 67 | | | | | | | | | | | | | | | | | Total current liabilities | | | | | | | 5,244 | | | | 4,369 | | | | | | | | | | | | | | | | | | | | | | | | | | | | | | | Capital lease obligations - non current portion | | | 11(a) | | | | 60 | | | | 32 | | | | | | | | | | | | | | | | | Loan from affiliated party - non current portion | | | 15 | | | | 67 | | | | - | | | | | | | | | | | | | | | | | Long-term loan | | | 20 | | | | - | | | | 2,527 | | | | | | | | | | | | | | | | | Long-term deposit received | | | 20 | | | | - | | | | 738 | | | | | | | | | | | | | | | | | Total liabilities | | | | | | | 5,371 | | | | 7,666 | | | | | | | | | | | | | | | | | Commitments and contingent liabilities | | | 12 | | | | | | | | | | | | | | | | | | | | | | | | | Stockholders’ equity | | | | | | | | | | | | | | Common stock par value $0.003 per share | | | | | | | | | | | | | | - authorized shares - 23,333,334 | | | | | | | | | | | | | - issued shares: March 31, 2017: 5,577,639; March 31, 2018: 5,543,639. - outstanding shares: March 31, 2017: 5,009,120; March 31, 2018: 4,795,622. | | | | | | | 17 | | | | 17 | | | Additional paid-in capital | | | | | | | 22,566 | | | | 22,474 | | | Treasury stock at cost: March 31, 2017: 568,519; March 31, 2018: 748,017. | | | | | | | (1,929 | ) | | | (2,409 | ) | | Accumulated deficit | | | | | | | (6,033 | ) | | | (6,029 | ) | | Accumulated other comprehensive income | | | | | | | 974 | | | | 3,036 | | | | | | | | | | | | | | | | | | | | | | | | 15,595 | | | | 17,089 | | | | | | | | | | | | | | | | | | | | | | | | | | | | | | | Total liabilities and stockholders’ equity | | | | | | | 20,966 | | | | 24,755 | | | | | | | | | | | | | | | | | | |
| | | | March 31, | | | | | 2020 | | 2021 | | | | | $ in thousands | | $ in thousands | | Assets | | | | | | | | | | | | | | Current assets | | | | | | | | | | | Cash and cash equivalents | | | | 9,111 | | | | 10,060 | | | Trade receivables, net | | | | 811 | | | | 1,279 | | | Other receivables, deposits and prepayments | | | | 692 | | | | 466 | | | Inventories | | | | 1,178 | | | | 1,097 | | | Income tax recoverable | | | | 5 | | | | 5 | | | Financial instruments at fair value | | | | 54 | | | | 504 | | | | | | | | | | | | | | Total current assets | | | | 11,851 | | | | 13,411 | | | | | | | | | | | | | | | | | | | | | | | | | Investment in life insurance contract | | | | 158 | | | | 163 | | | | | | | | | | | | | | Financial instruments at amortized cost | | | | 523 | | | | 523 | | | | | | | | | | | | | | Property, plant and equipment, net | | | | 9,439 | | | | 9,500 | | | | | | | | | | | | | | Intangible assets, net | | | | 1,930 | | | | 1,813 | | | | | | | | | | | | | | Deferred tax asset | | | | — | | | | 779 | | | | | | | | | | | | | | Right-of-use assets | | | | 300 | | | | 232 | | | | | | | | | | | | | | Total assets | | | | 24,201 | | | | 26,421 | | | | | | | | | | | | | | Liabilities and stockholders’ equity | | | | | | | | | | | | | | | | | | | | | | Current liabilities | | | | | | | | | | | | | | | | | | | | | | Notes payable – secured | | | | — | | | | 25 | | | Bank loans – secured | | | | 1,937 | | | | 967 | | | Accounts payable | | | | 775 | | | | 572 | | | Contract liabilities | | | | 12 | | | | 317 | | | Accrued charges and deposits | | | | 3,174 | | | | 3,165 | | | Refund liabilities | | | | 69 | | | | 29 | | | Payable to affiliated parties | | | | 80 | | | | 79 | | | Income tax payable | | | | — | | | | 165 | | | Lease liabilities | | | | 92 | | | | 105 | | | | | | | | | | | | | | Total current liabilities | | | | 6,139 | | | | 5,424 | | | | | | | | | | | | | | | | | | | | | | | | | Lease liabilities (non-current) | | | | 213 | | | | 127 | | | | | | | | | | | | | | Long-term loan | | | | 2,438 | | | | 2,773 | | | | | | | | | | | | | | Long-term deposit received | | | | 647 | | | | 701 | | | | | | | | | | | | | | Total liabilities | | | | 9,437 | | | | 9,025 | | | | | | | | | | | | | | Commitments and contingent liabilities | | | | | | | | | | | | | | | | | | | | | | Stockholders’ equity | | | | | | | | | | | Preferred stock par value $0.03 per share | | | | | | | | | | | - $0.01 par value (authorized: 10,000,000 shares; no shares issued and outstanding as of March 31, 2020 and 2021) | | | | | | | | | | | Common stock par value $0.003 per share | | | | | | | | | | | - authorized shares - 23,333,334 | | | | | | | | | | - issued shares: March 31, 2020: 5,828,205; March 31, 2021: 5,828,205.
- outstanding shares: March 31, 2020: 4,906,466; March 31, 2021: 4,857,187. | | | | 17 | | | | 17 | | | Additional paid-in capital | | | | 22,795 | | | | 22,795 | | | Treasury stock at cost: March 31, 2020: 921,739; March 31, 2021: 971,018. | | | | (2,892 | ) | | | (3,082 | ) | | Accumulated deficit | | | | (6,094 | ) | | | (4,323 | ) | | Accumulated other comprehensive income | | | | 938 | | | | 1,989 | | | | | | | | | | | | | | | | | | 14,764 | | | | 17,396 | | | | | | | | | | | | | | Total liabilities and stockholders’ equity | | | | 24,201 | | | | 26,421 | | | | | | | | | | | | |
See notes to these consolidated financial statements. Bonso Electronics International Inc. Consolidated Statements of Operations and Comprehensive Income (Expressed in United States Dollars)
| | | | | | Years ended March 31, | | | | | Note | | | 2016 | | | 2017 | | | 2018 | | | | | | | | $ in thousands | | | $ in thousands | | | $ in thousands | | | | | | | | | | | | | | | | | Net revenue | | | 19 | | | | 25,370 | | | | 18,952 | | | | 11,523 | | | Cost of revenue | | | | | | | (17,081 | ) | | | (11,274 | ) | | | (6,958 | ) | | | | | | | | | | | | | | | | | | | | Gross profit | | | | | | | 8,289 | | | | 7,678 | | | | 4,565 | | | | | | | | | | | | | | | | | | | | | Selling, general and administrative expenses | | | | | | | (6,948 | ) | | | (5,066 | ) | | | (4,669 | ) | | Other income, net | | | 21 | | | | 1,961 | | | | 554 | | | | 342 | | | | | | | | | | | | | | | | | | | | | Income from operations | | | 19 | | | | 3,302 | | | | 3,166 | | | | 238 | | | Non-operating (expenses) / income, net | | | 22 | | | | (121 | ) | | | 229 | | | | (234 | ) | | | | | | | | | | | | | | | | | | | | Income before income taxes | | | | | | | 3,181 | | | | 3,395 | | | | 4 | | | Income tax expense | | | 8 | | | | (310 | ) | | | (600 | ) | | | - | | | | | | | | | | | | | | | | | | | | | Net income | | | | | | | 2,871 | | | | 2,795 | | | | 4 | | | | | | | | | | | | | | | | | | | | | Other comprehensive (loss) / income, net of tax: | | | | | | | | | | | | | | | | | | Foreign currency translation adjustments, net of tax | | | | | | | (850 | ) | | | (1,410 | ) | | | 2,062 | | | | | | | | | | | | | | | | | | | | | Comprehensive income | | | | | | | 2,021 | | | | 1,385 | | | | 2,066 | | | | | | | | | | | | | | | | | | | | | | | | | | | | | | | | | | | | | | | Net income attributable to common shareholders | | | | | | | 2,871 | | | | 2,795 | | | | 4 | | | | | | | | | | | | | | | | | | | | | | | | | | | | | | | | | | | | | | | Net earnings per share | | | | | | | | | | | | | | | | | | - basic | | | 18 | | | $ | 0.55 | | | $ | 0.54 | | | $ | 0.00 | | | | | | | | | | | | | | | | | | | | Weighted average number of shares outstanding in calculating net earnings per share | | | | | | | | | | | | | | | | | | - basic | | | 18 | | | | 5,173,431 | | | | 5,143,648 | | | | 4,910,357 | | | | | | | | | | | | | | | | | | | | | | | | | | | | | | | | | | | | | | | Net earnings per share | | | | | | | | | | | | | | | | | | - diluted | | | 18 | | | $ | 0.55 | | | $ | 0.53 | | | $ | 0.00 | | | | | | | | | | | | | | | | | | | | Weighted average number of shares outstanding in calculating net earnings per share | | | | | | | | | | | | | | | | | - diluted | | | 18 | | | | 5,173,431 | | | | 5,316,393 | | | | 5,290,904 | | | | | | | | | | | | | | | | | | | | | | |
| | | | Years ended March 31, | | | | | 2019 | | 2020 | | 2021 | | | | | $ in thousands | | $ in thousands | | $ in thousands | | | | | | | | | | | Net revenue | | | | 9,992 | | | | 13,096 | | | | 15,590 | | | Cost of revenue | | | | (6,035 | ) | | | (5,690 | ) | | | (5,940 | ) | | | | | | | | | | | | | | | | | Gross profit | | | | 3,957 | | | | 7,406 | | | | 9,650 | | | Selling, general and administrative expenses | | | | (4,605 | ) | | | (7,479 | ) | | | (8,924 | ) | | Other income, net | | | | 108 | | | | 435 | | | | 480 | | | (Loss) / income from operations | | | | (540 | ) | | | 362 | | | | 1,206 | | | Non-operating income / (expenses), net | | | | 77 | | | | 36 | | | | (49 | ) | | | | | | | | | | | | | | | | | (Loss) / income before income taxes | | | | (463 | ) | | | 398 | | | | 1,157 | | | Income tax benefit | | | | — | | | | — | | | | 614 | | | | | | | | | | | | | | | | | | Net (loss) / income | | | | (463 | ) | | | 398 | | | | 1,771 | | | | | | | | | | | | | | | | | | Other comprehensive (loss) / income, net of tax: | | | | | | | | | | | | | | | Foreign currency translation adjustments, net of tax | | | | (1,113 | ) | | | (985 | ) | | | 1,051 | | | | | | | | | | | | | | | | | | Comprehensive (loss) / income | | | | (1,576 | ) | | | (587 | ) | | | 2,822 | | | | | | | | | | | | | | | | | | Net (loss) / income attributable to common shareholders | | | | (463 | ) | | | 398 | | | | 1,771 | | | | | | | | | | | | | | | | | | Net (loss) / earnings per share | | | | | | | | | | | | | | | - basic | | | ($ | 0.10 | ) | | $ | 0.09 | | | $ | 0.36 | | | | | | | | | | | | | | | | | | Weighted average number of shares outstanding in calculating net earnings per share | | | | | | | | | | | | | | | - basic | | | | 4,703,224 | | | | 4,646,966 | | | | 4,880,422 | | | | | | | | | | | | | | | | | | Net (loss) / earnings per share | | | | | | | | | | | | | | | - diluted | | | ($ | 0.10 | ) | | $ | 0.08 | | | $ | 0.34 | | | | | | | | | | | | | | | | | | Weighted average number of shares outstanding in calculating net earnings per share | | | | | | | | | | | | | | | - diluted | | | | 4,703,224 | | | | 4,816,736 | | | | 5,145,260 | | | | | | | | | | | | | | | | |
See notes to these consolidated financial statements. Bonso Electronics International Inc. Consolidated Statements of Changes in Stockholders’ Equity (Expressed in United States Dollars)
| | | Common stock | | | | | | Treasury stock | | | | | | Accumulated | | | | | | | | | | | | | | | | | | | | | | | | | | other | | | | | | | | | | | | | | | | | | | | | | | | | | comprehensive | | | | | | | | | | | | | | Additional | | | Treasury | | | | | | | | | income-foreign | | | Total | | | | | Shares | | | Amount | | | paid-in | | | Shares | | | Amount | | | Accumulated | | | currency | | | stockholders’ | | | | | Issued | | | outstanding | | | capital | | | held | | | outstanding | | | deficit | | | adjustments | | | equity | | | | | | | | $ in thousands | | | $ in thousands | | | | | | $ in thousands | | | $ in thousands | | | $ in thousands | | | $ in thousands | | | | | | | | | | | | | | | | | | | | | | | | | | | | | Balance, April 1, 2015 | | | 5,577,639 | | | | 17 | | | | 21,765 | | | | 330,736 | | | | (1,462 | ) | | | (11,699 | ) | | | 3,234 | | | | 11,855 | | | Net income | | | - | | | | - | | | | - | | | | - | | | | - | | | | 2,871 | | | | - | | | | 2,871 | | | Share-based compensation (Note 14(f)) | | | - | | | | - | | | | 801 | | | | - | | | | - | | | | - | | | | - | | | | 801 | | | Shares repurchased (Note 13(a)) | | | - | | | | - | | | | - | | | | 73,472 | | | | (99 | ) | | | - | | | | - | | | | (99 | ) | | Foreign currency translation adjustments | | | - | | | | - | | | | - | | | | - | | | | - | | | | - | | | | (850 | ) | | | (850 | ) | | | | | | | | | | | | | | | | | | | | | | | | | | | | | | | | | | | | Balance, March 31, 2016 | | | 5,577,639 | | | | 17 | | | | 22,566 | | | | 404,208 | | | | (1,561 | ) | | | (8,828 | ) | | | 2,384 | | | | 14,578 | | | Net income | | | - | | | | - | | | | - | | | | - | | | | - | | | | 2,795 | | | | - | | | | 2,795 | | | Shares repurchased (Note 13(a)) | | | - | | | | - | | | | - | | | | 164,311 | | | | (368 | ) | | | - | | | | - | | | | (368 | ) | | Foreign currency translation adjustments | | | - | | | | - | | | | - | | | | - | | | | - | | | | - | | | | (1,410 | ) | | | (1,410 | ) | | | | | | | | | | | | | | | | | | | | | | | | | | | | | | | | | | | | Balance, March 31, 2017 | | | 5,577,639 | | | | 17 | | | | 22,566 | | | | 568,519 | | | | (1,929 | ) | | | (6,033 | ) | | | 974 | | | | 15,595 | | | Net income | | | - | | | | - | | | | - | | | | - | | | | - | | | | 4 | | | | - | | | | 4 | | | Shares repurchased (Note 13(a)) | | | - | | | | - | | | | - | | | | 213,498 | | | | (572 | ) | | | - | | | | - | | | | (572 | ) | | Removal of treasury shares from the total number of shares issued (Note 13(a)) | | | (34,000 | ) | | | - | | | | (92 | ) | | | (34,000 | ) | | | 92 | | | | - | | | | - | | | | - | | | Foreign currency translation adjustments | | | - | | | | - | | | | - | | | | - | | | | - | | | | - | | | | 2,062 | | | | 2,062 | | | | | | | | | | | | | | | | | | | | | | | | | | | | | | | | | | | | | Balance, March 31, 2018 | | | 5,543,639 | | | | 17 | | | | 22,474 | | | | 748,017 | | | | (2,409 | ) | | | (6,029 | ) | | | 3,036 | | | | 17,089 | | | | | | | | | | | | | | | | | | | | | | | | | | | | | | | | | | | | | | | | | | | | | | | | | | | | | | | | | | | | | | | | | | | | | | | | | | | | | | | | | | | | | | | | | | | | | | | | | | | | | | | |
| | | | Common stock | | | | | | | | Treasury stock | | | | | | | | | | | | | | | | | |
Shares
Issue | | | | Amount
outstanding | | | | Additional
paid-in
capital | | | | Treasury
Shares
held | | | |
Amount
outstanding | | | |
Accumulated
deficit | | | | Accumulated other comprehensive income-foreign
currency
adjustments | | | | Total
stockholders’
equity | | | | | | | | | | $ in thousands | | | | $ in thousands | | | | | | | | $ in thousands | | | | $ in thousands | | | | $ in thousands | | | | $ in thousands | | | | | | | | | | | | | | | | | | | | | | | | | | | | | | | | | | | | | Balance, March 31, 2018 | | | 5,543,639 | | | | 17 | | | | 22,474 | | | | 748,017 | | | | (2,409 | ) | | | (6,029 | ) | | | 3,036 | | | | 17,089 | | | Net loss | | | — | | | | — | | | | — | | | | — | | | | — | | | | (463 | ) | | | — | | | | (463 | ) | | Shares repurchased (Note 13(a)) | | | — | | | | — | | | | — | | | | 124,849 | | | | (364 | ) | | | — | | | | — | | | | (364 | ) | | Foreign currency translation adjustments | | | — | | | | — | | | | — | | | | — | | | | — | | | | — | | | | (1,113 | ) | | | (1,113 | ) | | | | | | | | | | | | | | | | | | | | | | | | | | | | | | | | | | | | Balance, March 31, 2019 | | | 5,543,639 | | | | 17 | | | | 22,474 | | | | 872,866 | | | | (2,773 | ) | | | (6,492 | ) | | | 1,923 | | | | 15,149 | | | Net income | | | — | | | | — | | | | — | | | | — | | | | — | | | | 398 | | | | — | | | | 398 | | | Shares repurchased (Note 13(a)) | | | — | | | | — | | | | — | | | | 48,873 | | | | (119 | ) | | | — | | | | — | | | | (119 | ) | | Options exercised (Note 14(c)) | | | 284,566 | | | | — | | | | 321 | | | | — | | | | — | | | | — | | | | — | | | | 321 | | | Foreign currency translation adjustments | | | — | | | | — | | | | — | | | | — | | | | — | | | | — | | | | (985 | ) | | | (985 | ) | | | | | | | | | | | | | | | | | | | | | | | | | | | | | | | | | | | | Balance, March 31, 2020 | | | 5,828,205 | | | | 17 | | | | 22,795 | | | | 921,739 | | | | (2,892 | ) | | | (6,094 | ) | | | 938 | | | | 14,764 | | | Net income | | | — | | | | — | | | | — | | | | — | | | | — | | | | 1,771 | | | | — | | | | 1,771 | | | Shares repurchased (Note 13(a)) | | | — | | | | — | | | | — | | | | 49,279 | | | | (190 | ) | | | — | | | | — | | | | (190 | ) | | Foreign currency translation adjustments | | | — | | | | — | | | | — | | | | — | | | | — | | | | — | | | | 1,051 | | | | 1,051 | | | | | | | | | | | | | | | | | | | | | | | | | | | | | | | | | | | | | Balance, March 31, 2021 | | | 5,828,205 | | | | 17 | | | | 22,795 | | | | 971,018 | | | | (3,082 | ) | | | (4,323 | ) | | | 1,989 | | | | 17,396 | | | | | | | | | | | | | | | | | | | | | | | | | | | | | | | | | | | |
See notes to these consolidated financial statements. Bonso Electronics International Inc. Consolidated Statements of Cash Flows (Expressed in United States Dollars) | | | Years Ended March 31, | | | | | 2016 | | | 2017 | | | 2018 | | | | | $ in thousands | | | $ in thousands | | | $ in thousands | | | | | | | | | | | | | | Cash flows from operating activities | | | | | | | | | | | Net income | | | 2,871 | | | | 2,795 | | | | 4 | | | | | | | | | | | | | | | | | Adjustments to reconcile net income to net cash provided by operating activities: | | | | | | | | | | | | | | Depreciation | | | 1,047 | | | | 1,046 | | | | 1,099 | | | Amortization | | | 288 | | | | 271 | | | | 277 | | | (Gain) / loss on disposal of property, plant and equipment | | | (718 | ) | | | - | | | | 12 | | | Gain on disposal of intangible assets | | | (519 | ) | | | (79 | ) | | | - | | | Write-down of inventories | | | 30 | | | | 156 | | | | 569 | | | Write off of property, plant and equipment | | | - | | | | 2 | | | | 2 | | | Gain from deregistration of subsidiaries | | | - | | | | (22 | ) | | | - | | | Change in cash surrender value of life insurance contract | | | (4 | ) | | | (4 | ) | | | (5 | ) | | Change in fair value of financial instruments | | | (46 | ) | | | 61 | | | | 7 | | | Dividend income from financial instruments at fair value | | | - | | | | (1 | ) | | | (4 | ) | | Gain from sale of financial instruments at fair value | | | - | | | | (3 | ) | | | (58 | ) | | Compensation expense for stock options granted | | | 801 | | | | - | | | | - | | | Interest expense | | | - | | | | - | | | | 62 | | | | | | | | | | | | | | | | | Changes in assets and liabilities: | | | | | | | | | | | | | | Trade receivables | | | 294 | | | | (300 | ) | | | 498 | | | Other receivables, deposits and prepayments | | | 435 | | | | (163 | ) | | | 965 | | | Inventories | | | 1,268 | | | | 649 | | | | (563 | ) | | Income tax recoverable | | | 39 | | | | - | | | | - | | | Accounts payable | | | (2,290 | ) | | | (1,318 | ) | | | (419 | ) | | Accrued charges and deposits | | | 36 | | | | (136 | ) | | | 122 | | | Payable to affiliated parties | | | 13 | | | | (25 | ) | | | 19 | | | Income tax liabilities | | | 310 | | | | 216 | | | | (539 | ) | | Long-term deposit received | | | - | | | | - | | | | 738 | | | | | | | | | | | | | | | | | Net cash provided by operating activities | | | 3,855 | | | | 3,145 | | | | 2,786 | | | | | | | | | | | | | | | | | Cash flows from investing activities | | | | | | | | | | | | | | Proceeds from disposal of property, plant and equipment | | | 805 | | | | - | | | | 4 | | | Acquisition of property, plant and equipment | | | (823 | ) | | | (289 | ) | | | (364 | ) | | Proceeds from disposal of intangible assets | | | 342 | | | | 120 | | | | - | | | Acquisition of financial instruments at fair value | | | (134 | ) | | | (163 | ) | | | (517 | ) | | Payments made upon expiry of forward contracts | | | - | | | | (225 | ) | | | - | | | Proceeds from sale of financial instruments at fair value | | | 391 | | | | 146 | | | | 657 | | | Dividends received from financial instruments at fair value | | | - | | | | 1 | | | | 4 | | | | | | | | | | | | | | | | | Net cash generated from / (used in) investing activities | | | 581 | | | | (410 | ) | | | (216 | ) | | | | | | | | | | | | | | | | Cash flows from financing activities | | | | | | | | | | | | | | Capital lease payments | | | (31 | ) | | | (49 | ) | | | (44 | ) | | Advance from notes payable | | | 4,370 | | | | 1,721 | | | | 467 | | | Repayment of notes payable | | | (4,963 | ) | | | (2,820 | ) | | | (502 | ) | | Repayment of bank loans | | | (2,870 | ) | | | (363 | ) | | | (143 | ) | | Payment to affiliated party | | | (134 | ) | | | (135 | ) | | | (135 | ) | | Stock repurchase | | | (99 | ) | | | (368 | ) | | | (572 | ) | | Advance from long-term loan | | | - | | | | - | | | | 2,465 | | | | | | | | | | | | | | | | | Net cash used in financing activities | | | (3,727 | ) | | | (2,014 | ) | | | 1,536 | | | | | | | | | | | | | | | | | | | | | | | | | | | | | | | Net increase in cash and cash equivalents | | | 709 | | | | 721 | | | | 4,106 | | | Effect of exchange rate changes on cash and cash equivalents | | | (189 | ) | | | (523 | ) | | | 900 | | | Cash and cash equivalents, beginning of year | | | 3,027 | | | | 3,547 | | | | 3,745 | | | | | | | | | | | | | | | | | Cash and cash equivalents, end of year | | | 3,547 | | | | 3,745 | | | | 8,751 | | | | | | | | | | | | | | | | | Supplemental disclosure of cash flow information | | | | | | | | | | | | | | Cash paid during the year for: | | | | | | | | | | | | | | Interest | | | 113 | | | | 37 | | | | 10 | | | Income tax | | | - | | | | 360 | | | | 562 | | | | | | | | | | | | | | | | | Income tax refund received | | | 39 | | | | - | | | | - | | | | | | | | | | | | | | | | Non-cash investing activities: | | | | | | | | | | | | | | Property, plant and equipment acquired under capital lease | | | 116 | | | | - | | | | - | | | | | | | | | | | | | | | | | Non-cash financing activities: | | | | | | | | | | | | | | Compensation expense for stock options granted | | | 801 | | | | - | | | | - | |
| | | Years Ended March 31, | | | | 2019 | | 2020 | | 2021 | | | | $ in thousands | | $ in thousands | | $ in thousands | | | | | | | | | | Cash flows from operating activities | | | | | | | | | | | | | | Net (loss) / income | | | (463 | ) | | | 398 | | | | 1,771 | | | | | | | | | | | | | | | | | Adjustments to reconcile net income to net cash provided by operating activities: | | | | | | | | | | | | | | Depreciation | | | 859 | | | | 841 | | | | 812 | | | Amortization | | | 275 | | | | 264 | | | | 269 | | | (Gain) / loss on disposal of property, plant and equipment | | | (5 | ) | | | 3 | | | | (237 | ) | | Write-down of inventories | | | 73 | | | | 87 | | | | 108 | | | Change in cash surrender value of life insurance contract | | | (4 | ) | | | (5 | ) | | | (5 | ) | | Change in fair value of financial instruments | | | (4 | ) | | | 5 | | | | (17 | ) | | Dividend income from financial instruments at fair value | | | (1 | ) | | | (4 | ) | | | (4 | ) | | Coupons received from financial instruments at amortized cost | | | — | | | | (79 | ) | | | (48 | ) | | (Gain) / loss from sale of financial instruments at fair value | | | (16 | ) | | | 1 | | | | (6 | ) | | Loss from redemption of financial instruments at amortized cost | | | — | | | | 4 | | | | — | | | Interest expense | | | 116 | | | | 114 | | | | 125 | | | | | | | | | | | | | | | | | Changes in assets and liabilities: | | | | | | | | | | | | | | Trade receivables | | | 166 | | | | (230 | ) | | | (462 | ) | | Other receivables, deposits and prepayments | | | (586 | ) | | | (203 | ) | | | 214 | | | Inventories | | | 18 | | | | (513 | ) | | | 62 | | | Right-of-use assets | | | — | | | | (308 | ) | | | 90 | | | Deferred tax asset | | | — | | | | — | | | | (779 | ) | | Accounts payable | | | (407 | ) | | | 379 | | | | (248 | ) | | Contract liabilities | | | 17 | | | | (5 | ) | | | 305 | | | Accrued charges and deposits | | | 4 | | | | 20 | | | | (28 | ) | | Refund liabilities | | | — | | | | 69 | | | | (40 | ) | | Payable to affiliated parties | | | (23 | ) | | | 24 | | | | (1 | ) | | Income tax liabilities | | | — | | | | — | | | | 165 | | | Lease liabilities | | | — | | | | 308 | | | | (90 | ) | | Long-term deposit received | | | (46 | ) | | | (45 | ) | | | 54 | | | Long-term loan | | | 42 | | | | 33 | | | | (26 | ) | | | | | | | | | | | | | | | | Net cash provided by operating activities | | | 15 | | | | 1,158 | | | | 1,984 | | | | | | | | | | | | | | | | | Cash flows from investing activities | | | | | | | | | | | | | | Proceeds from disposal of property, plant and equipment | | | 5 | | | | 32 | | | | 909 | | | Acquisition of property, plant and equipment | | | (578 | ) | | | (260 | ) | | | (700 | ) | | Acquisition of financial instruments at fair value | | | (226 | ) | | | (68 | ) | | | (613 | ) | | Acquisition of financial instruments at amortized cost | | | — | | | | (1,007 | ) | | | — | | | Coupons received from financial instruments at amortized cost | | | — | | | | 59 | | | | 48 | | | Proceeds from sale of financial instruments at fair value | | | 223 | | | | 110 | | | | 188 | | | Proceeds from redemption of financial instruments at amortized cost | | | — | | | | 500 | | | | — | | | Dividends received from financial instruments at fair value | | | 1 | | | | 4 | | | | 4 | | | | | | | | | | | | | | | | | Net cash used in investing activities | | | (575 | ) | | | (630 | ) | | | (164 | ) | | | | | | | | | | | | | | | | Cash flows from financing activities | | | | | | | | | | | | | | Finance lease payments | | | (28 | ) | | | (28 | ) | | | (5 | ) | | Advance from notes payable | | | 237 | | | | 14 | | | | 52 | | | Repayment of notes payable | | | (336 | ) | | | (14 | ) | | | (27 | ) | | Advance from bank loans | | | 641 | | | | 1,769 | | | | — | | | Repayment of bank loans | | | (196 | ) | | | (278 | ) | | | (970 | ) | | Payment to affiliated party | | | (67 | ) | | | — | | | | — | | | Stock repurchase | | | (364 | ) | | | (119 | ) | | | (190 | ) | | Proceeds from options exercised | | | — | | | | 323 | | | | — | | | | | | | | | | | | | | | | | Net cash (used in) / generated from financing activities | | | (113 | ) | | | 1,667 | | | | (1,140 | ) | | | | | | | | | | | | | | | | Net (decrease) / increase in cash and cash equivalents | | | (673 | ) | | | 2,195 | | | | 680 | | | Effect of exchange rate changes on cash and cash equivalents | | | (551 | ) | | | (611 | ) | | | 269 | | | Cash and cash equivalents, beginning of year | | | 8,751 | | | | 7,527 | | | | 9,111 | | | | | | | | | | | | | | | | | Cash and cash equivalents, end of year | | | 7,527 | | | | 9,111 | | | | 10,060 | | | | | | | | | | | | | | | | | Supplemental disclosure of cash flow information | | | | | | | | | | | | | | Cash paid during the year for: | | | | | | | | | | | | | | Interest | | | 23 | | | | 64 | | | | 33 | | | Income tax | | | — | | | | — | | | | — | |
See notes to these consolidated financial statements.statements
Bonso Electronics International Inc.
Notes to Consolidated Financial Statements (Expressed in United States Dollars)
| 1 | Description of business and significant accounting policies |
Bonso Electronics International Inc. and its subsidiaries (collectively, the “Company” or “Group”) are engaged in the designing, manufacturing and selling of a comprehensive line of electronic scales and weighing instruments, pet electronics products and other products. Further, the Group also rents or leases both factory facilities and equipment not being currently used to third parties. The consolidated financial statements have been prepared in United States dollars and in accordance with generally accepted accounting principles in the United States of America. The preparation of consolidated financial statements requires management to make estimates and assumptions that affect the reported amounts of assets and liabilities and disclosure of contingent assets and liabilities at the dates of the consolidated financial statements and the reported amounts of revenues and expenses during the reporting periods. Significant estimates made by management include valuation of inventories, allowance for trade receivables,expected credit losses, stock-based compensation, expected useful life of long-lived assets, valuation allowance for deferred tax assets, incremental borrowing rate to calculate lease liabilities and the impairment of long-lived assets.right-of-use (“ROU”) assets and historical average sales return to calculate refund. Actual results could differ from those estimates. Certain figuresCOVID-19 Considerations For the month after the outbreak of COVID-19, domestic business activities in China were disrupted by a series of emergency quarantine measures taken by the government. In February 2020, the Company’s plant and offices in People’s Republic of China (“PRC”) were temporarily suspended for the years ended March 31, 2016 and 2017, have been reclassified to conformtwo weeks according to the presentationinstruction of the local government, related to COVID-19. Emergency quarantine measures and travel restrictions caused business disruptions across China. The evolution of quarantine measures and travel restrictions resulted in negative consequences for our business operations including, but not limited to, the temporary closure of the Company’s factory and operations beginning in early February, limited support from the Company’s employees, delayed access to raw material supplies and inability to deliver products to customers on a timely basis. The travel restrictions imposed as a result of the COVID-19 pandemic had a material negative impact on the Company’s operations. The Company is not able to send its sales and marketing teams to visit our overseas customers and potential customers. And the Company’s promotion events like trade exhibitions are limited due to travel restrictions in China. Under normal circumstances, the Company’s management regularly travels from Hong Kong to the Shenzhen office and Xinxing factory. The inability to travel regularly has affected the Company’s operations. Bonso Electronics International Inc. Notes to Consolidated Financial Statements (Expressed in United States Dollars) | 1 | Description of business and significant accounting policies (Continued) |
The extent to which COVID-19 negatively impacts our business results is highly uncertain and cannot be accurately predicted. The magnitude of this negative effect on the continuity of our business operation and supply chains in China remains uncertain. These uncertainties impede our ability to conduct our daily operations and could materially and adversely affect our business, financial condition and results of operations. The Company did not record any asset impairments, inventory charges or bad debt provision related to COVID-19 during the year ended March 31, 2018. The Company had operating income2021 (2020: $nil). However, if the customer demand is persistently weak in coming months or we are instructed to suspend the operations of approximately $3,302,000, $3,166,000 and $238,000our plants in the fiscal years ended March 31, 2016, 2017 and 2018, respectively. As of March 31, 2018,PRC, the Company had positive working capital of approximately $7,016,000 and the accompanying consolidated financial statements were prepared on a going concern basis. Management believes the Company will have sufficient working capitalmay need to meet its financing requirements based upon their experience and their assessment of the Company’s projected performance, credit facilities and banking relationships.
record such charges.The significant accounting policies are as follows:
| (a) | Principles of consolidation |
The consolidated financial statements include the financial statements of the Company and its subsidiaries after elimination of inter-company accounts and transactions. Acquisitions of companies have been consolidated from the date on which control of the net assets and operations was transferred to the Company. Acquisitions of companies are accounted for using the purchase method of accounting.
| (b) | Cash and cash equivalents |
Cash and cash equivalents are short-term, highly liquid investments with original maturities of three months or less. Cash equivalents are stated at cost, which approximates fair value because of the short-term maturity of these instruments. The Company has no cash equivalents as of March 31, 20172020 and 2018.2021.
Bonso Electronics International Inc. Notes to Consolidated Financial Statements (Expressed in United States Dollars)
| 1 | Description of business and significant accounting policies (Continued) |
Inventories are stated at the lower of cost,, as determined on a first-in, first-out basis, or net realizable value. Costs of inventories include purchase and related costs incurred in bringing the products to their present location and condition. Net realizable value is the estimated selling price in the ordinary course of business, less reasonably predictable costs of completion, disposal and transportation. The Company routinely reviews its inventories for their salability and for indications of obsolescence to determine if inventory carrying values are higher than net realizable value. Some of the significant factors the Company considers in estimating the net realizable value of its inventories include the likelihood of changes in market and customer demand and expected changes in market prices for its inventories.
| (d) | Trade receivables and allowance for expected credit losses |
Trade receivables are recorded at the invoiced amount, net of allowances for doubtful accounts and sales returns.returns, if any. The allowance for doubtful accounts is the Company’s best estimate of the amount of probable credit losses in the Company’s existing trade receivables. Bad debt expense is included in the administrative and general expenses.
The Company recognizes an allowance for doubtful receivablesexpected credit losses to ensure accounts and other receivables are not overstated due to uncollectibility. Allowance for doubtful receivables is maintained for all customers based on a variety of factors, including the length of time the receivables are past due, significant one-time events and historical experience. An additional allowance for individual accounts is recorded when the Company becomes aware of customers’ or other debtors’ inability to meet their financial obligations, such as bankruptcy filings or deterioration in the customer’s or other debtor’s operating results or financial position. If circumstances related to customers or debtors change, estimates of the recoverability of receivables will be further adjusted.
| (e) | Income taxes and deferred income taxes |
Amounts in the consolidated financial statements related to income taxes are calculated using the principles of Accounting Standards Codification (“ASC”) 740 and Accounting Standards Updates (“ASU”) 2013-11 “Presentation of an Unrecognized Tax Benefit When a Net Operating Loss Carryforward, a Similar Tax Loss, or a Tax Credit Carryforward Exists”. ASC 740 requires recognition of deferred tax assets and liabilities for the expected future tax consequences of events that have been included in the financial statements or tax returns. Under this method, deferred tax assets and liabilities are determined based on the temporary differences between the financial reporting bases and tax bases of assets and liabilities using enacted tax rates in effect for the year in which the differences are expected to reverse. Future tax benefits, such as net operating loss carry forwards, are recognized as deferred tax assets. Recognized deferred tax assets are reduced by a valuation allowance if, based on the weight of available evidence, it is more likely than not that some portion or all of the deferred tax assets will not be realized.
The Company complies with ASC 740 “Income Taxes”for uncertainty in income taxes recognized in financial statements. ASC 740 prescribes a recognition threshold and measurement attributes for the financial statement recognition and measurement of a tax position taken or expected to be taken in a tax return. ASC 740 also provides guidance on derecognition, classification, interest and penalties, accounting in interim periods, disclosure and transition. The Company’s accounting policy is to treat interest and penalties as components of income taxes. The Company’s income tax returns through the fiscal yearsyear ended March 31, 20172020 have been assessed by the tax authorities.
Bonso Electronics International Inc. Notes to Consolidated Financial Statements (Expressed in United States Dollars)
| 1 | Description of business and significant accounting policies (Continued) |
| (f) | Lease prepayments and intangibleIntangible assets |
Lease prepayments represent the cost of land use rights in the People’s Republic of China (“PRC”). Land use rights held by the Company are included in intangible assets. The granted useful life of the land use rights is 50 years. They are stated at cost and amortized on a straight-line basis over a maximum period of 30 years, in accordance with the business licenses of 30 years.
expiring in 2024. | (g) | Property, plantplants and equipment, net |
| (i) | Property, plant and equipment are stated at cost less accumulated depreciation. Leasehold land and buildings are depreciated on a straight-line basis over 15 to 5066 years, representing the shorter of the remaining term of the lease or the expected useful life to the Company. |
| (ii) | Other categories of property, plant and equipment are carried at cost and depreciated using the straight-line method over their expected useful lives to the Company. The principal estimated useful lives for depreciation are: |
| Plant and machinery | - 10 years | |
| Furniture, fixtures and equipment | - 5 to10to 10 years | |
| (iii) | Assets under construction are not depreciated until construction is completed and the assets are ready for their intended use. |
| (iv) | The cost of major improvements and betterments is capitalized, whereas the cost of maintenance and repairs is expensed in the year when it is incurred. |
| (v) | Any gain or loss on disposal is included in the consolidated statements of operations and comprehensive income. |
Bonso Electronics International Inc.
Notes to Consolidated Financial Statements
(Expressed in United States Dollars)
1 | Description of business and significant accounting policies (Continued) |
| (h) | Impairment of long-lived assets including intangible assets |
Long-lived assets held and used by the Company and intangible assets are reviewed for impairment whenever events or changes in circumstances indicate that the carrying amount of such assets may not be recoverable. The Company evaluates recoverability of assets to be held and used by comparing the carrying amount of an asset to future net undiscounted cash flows to be generated by the asset. If such assets are considered to be impaired, the impairment loss is measured by the amount by which the carrying amount of the assets exceeds the fair value of the assets calculated using a discounted future cash flows analysis. Provisions for impairment made on other long-lived assets are disclosed in the consolidated statements of operations and comprehensive income. | (i) | Financial instrument at amortized cost |
Held-to-maturity debt securities are purchased from a financial institution and pledged as collateral for certain secured bank loans, which are stated at amortized cost. Interest income, including amortization of the premium and discount arising at acquisition, are included in earnings. Bonso Electronics International Inc. Notes to Consolidated Financial Statements (Expressed in United States Dollars) | 1 | Description of business and significant accounting policies (Continued) |
| (j) | Financial instruments at fair value |
The Company lostcomplies with ASC 820, “Fair Value Measurements” (“ASC 820”). ASC 820 clarifies the definition of fair value, prescribes methods for measuring fair value and establishes a major customer during 2017,fair value hierarchy to classify the inputs used in measuring fair value as a result,follows: Level 1-Inputs are unadjusted quoted prices in active markets for identical assets or liabilities available at the Company performed an assessment ofmeasurement date. Level 2-Inputs are unadjusted quoted prices for similar assets and liabilities in active markets, quoted prices for identical or similar assets and liabilities in markets that are not active, inputs other than quoted prices that are observable and inputs derived from or corroborated by observable market data. Level 3-Inputs are unobservable inputs which reflect the value ofreporting entity's own assumptions on what assumptions the property, plant and equipment and intangible assetsmarket participants would use in Xinxing, PRC, and no provision for impairment was made bypricing the Company (2017: $nil; 2016: $nil)asset or liability based on the assessment.
best available information. (i) | Capital and operating leases(k) | Leases |
CostsThe Company determines if an arrangement is a lease at inception of the contract. Leases are recorded in respect“right-of-use (ROU) assets” and "lease liabilities" in the Company's consolidated balance sheets. ROU assets represent the Company’s right to use an underlying asset during the lease term and lease liabilities represent the Company’s obligation to make lease payments arising from the lease. ROU assets and lease liabilities are recognized at commencement date based on the present value of lease payments over the lease term. For leases in which the rate implicit in the lease is not readily determinable, the Company uses its incremental borrowing rate based on the information available at commencement date for determining the present value of lease payments. Lease term includes the effects of options to extend or terminate the lease when it is reasonably certain that the Company will exercise that option. Lease expense for operating leases are charged against incomelease arrangements is recognized on a straight-line basis over the lease term. Leasing agreements, On April 1, 2019, the date of initial application, the Company adopted, “Leases” (Topic 842), using the modified retrospective method. The modified retrospective method provides a method of recognizing those leases which transferhad not expired as of the date of adoption of April 1, 2019. The prior period consolidated financial statements have not been retrospectively adjusted and continue to be reported under Topic 840.
The Company elected the practical expedient permitted under the transition guidance under Topic 842, which amongst other matters, allowed the Company (i) not to apply the recognition requirements to short-term leases (leases with a lease term of 12 months or less), (ii) not to reassess whether any expired or existing contracts are or contain leases, (iii) not to reassess the lease classification for any expired or existing leases, (iv) not to reassess initial direct costs for any existing leases, and (v) not to separate lease and non-lease components for the allocation of lease costs. The adoption resulted in the recognition of ROU assets of $407,000 and lease liabilities of $407,000 for operating leases as of April 1, 2019. The adoption had no impact on opening balance of accumulated deficit. Refer to note 11 to the consolidated financial statements for details.
The Company substantially allreviews ROU assets for impairment whenever events or changes in circumstances indicate that the benefits and risks of ownership of an asset, are treated as if the asset had been purchased outright. The assets are included in property, plant and equipment (“capital leases”) and the capital element of the lease commitments is shown as an obligation under capital leases. The lease rentals are treated as consisting of capital and interest elements. The capital element is applied to reduce the outstanding obligation and the interest element is charged against profit so as to give a consistent periodic rate of charge on the remaining balance outstanding at the end of each accounting period. Assets held under capital leases are depreciated over the useful lives of the equivalent owned assets or the lease term, whichever is shorter. Bonso Electronics International Inc. Notes to Consolidated Financial Statements (Expressed in United States Dollars) | 1 | Description of business and significant accounting policies (Continued) |
NoEffective April 1, 2018, the Company adopted the new guidance of ASC Topic 606, “Revenue from Contracts with Customers (Topic 606)”, which supersedes the revenue recognition requirements in ASC Topic 605, “Revenue Recognition”. Topic 606 requires the Company to recognize revenue to depict the transfer of promised goods or services to customers in an amount that reflects the consideration to which the entity expects to be entitled in exchange for those goods or services. The Company applies the following steps to recognize revenues: (1) identify the contract with a customer; (2) identify the performance obligations in the contract; (3) determine the transaction price; (4) allocate the transaction price to the performance obligations in the contract; and (5) recognize revenue when, or as, the Company satisfies a performance obligation. Product sales The Company’s revenue from contracts with customers is derived from product revenue principally from the sales of electronic scales and pet electronic products directly to customers. The Company sells goods to customers based on purchase orders received from the customers. The Company has determined there is one performance obligation for each model included in the purchase orders. The performance obligation is considered to be met and revenue is recognized unless there is persuasive evidence of an arrangement,when the price to the buyer is fixed or determinable, delivery has occurred and collectibilitycustomer obtains control of the sales price is reasonably assured. Revenue is recognized when title and risk of loss are transferred to customers,goods, which is generally the point at which products are leaving the ports of Hong Kong, Shenzhen or Nansha (Guangzhou), as designated by our customers. Shipping costs billedor when risks and rewards are transferred to the Company’scustomer. The Company did not recognize any revenue from contracts with customers for performance obligations satisfied over time during the year ended March 31, 2021.
The transaction price is generally in the form of a fixed price which is agreed with the customer at contract inception. The transaction price is recorded net of any sales return, surcharges and value-added taxes on gross sales. The Company allocates the transaction price to each performance obligation based on the purchase orders. Customers are included within revenue. Associated costsrequired to pay over an agreed-upon credit period, usually between 15 to 119 days. In certain circumstances, the Company will request a deposit from a customer. Customers’ deposits are classifiedsettled as part of costthe outstanding bill upon receiving an acknowledgement from customers. For the remaining balance of sales.
the outstanding bill, the customer is required to pay over an agreed-upon credit period, usually between 0 to 15 days.Return rights The Company does not generally provide its customers with a right of return or production protection. Each customer is required to perform a product quality check before accepting delivery of goods. The Company provides to certain customers an additional one to two percent of the quantity of certain products ordered in lieu of a warranty, which is recognized as cost of sales when these products are shipped to customers from the Company’s facilities. In addition, certain products sold by the Company are subject to a limited product quality warranty. The Company accrues for estimated incurred but unidentified quality issues based upon historical activity and known quality issues if a loss is probable and can be reasonably estimated. During the fiscal year ended March 31, 2018,2020, the Company began to sell its products through Amazon’s online platform. Customers purchasing products through Amazon have a 30-day right of return from the date of receipt of the product. The Company recorded $nila refund liability of approximately $29,000 at March 31, 2021 (2020: $69,000; 2019: $nil) for such accrual (2017: $nil, 2016: $nil). The standard limited warranty period is one to three years. Qualitythese expected returns, refunds, rebates and discounts are recorded net of sales at the time of sale and estimatedwhich was based on past history. All sales are based upon firm orders with fixed terms and conditions, which generally cannot be modified. Historically, the Company has not experienced material differences between its estimated amounts of qualityaverage monthly returns refunds, rebates and discounts and the actual results. In all contracts, there is no price protection or similar privilege in relation to the sale of goods.received for Amazon sales.
Rental income is recognized according to the rental agreements. Rental income for non-uniform rent payments is recognized on a straight-line basis throughout the lease term.
Bonso Electronics International Inc. Notes to Consolidated Financial Statements (Expressed in United States Dollars)
| 1 | Description of business and significant accounting policies (Continued) |
(k) | (l) | Revenue recognition (Continued) |
Value-added taxes and surcharges The Company presents revenue net of value-added taxes (“VAT”) and surcharges incurred. Surcharge are sales related taxes representing the City Maintenance and Construction Tax and Education Surtax. VAT, business taxes and surcharges collected from customers, net of VAT paid for purchases, are recorded as a liability in the consolidated balance sheets until these are paid to the tax authorities. Outbound freight and handling costs The Company accounts for product outbound freight and handling costs as fulfillment activities and presents the associated costs in selling, general and administrative expenses in the period in which it sells the product.
Disaggregation of revenue The Company disaggregates its revenue from different types of contracts with customers by principal product categories, as the Company believes it best depicts the nature, amount, timing and uncertainty of its revenue and cash flows. See Note 19 for product revenues by segment. Contract balances The Company did not recognize any contract asset as of March 31, 2020 and March 31, 2021. The timing between the recognition of revenue and receipt of payment is not significant. The Company’s contract liabilities consist of deposits received from customers. As of March 31, 2020 and 2021, the balances of the contract liabilities are approximately $12,000 and $317,000, respectively. All contract liabilities at the beginning of the year ended March 31, 2021 were recognized as revenue during the year ended March 31, 2021 and all contract liabilities as of the end of the year ended March 31, 2021 are expected to be realized in the following year. Lease income includes minimum rents which are recognized on an accrual basis over the terms of the related leases on a straight-line basis. Lease revenue recognition commences when the lessee is given possession of the leased space and there are no contingencies offsetting the lessee’s obligation to pay rent. | (m) | Research and development costs |
Research and development costs include salaries, utilities and contractor fees that are directly attributable to the conduct of research and development progress primarily related to the development of new design of products. Research and development costs are expensed as incurred. Research and development costs of approximately $200,000, $158,000$175,000, $213,000 and $152,000$229,000 were charged to operations for the years ended March 31, 2016, 20172019, 2020 and 2018, respectively, are expensed in the financial period in which they are incurred.
Advertising costs are expensed as incurred and are included within selling, general and administrative expenses. Advertising costs were approximately $12,000, $10,000$21,000, $103,000 and $18,000$30,000 for the fiscal years ended March 31, 2016, 20172019, 2020 and 2018,2021, respectively. Bonso Electronics International Inc. Notes to Consolidated Financial Statements (Expressed in United States Dollars) | 1 | Description of business and significant accounting policies (Continued) |
| (o) | Foreign currency translations |
| (i) | The Company’s functional currency is the United States dollar. Transactions denominated in non-United States dollar currencies of foreign subsidiaries where the United States dollar is the functional currency are translated into United States dollars at the exchange rates existing at date of transaction. The translation of local currencies into United States dollars at the balance sheet date creates transaction adjustments which are included in net income. Exchange differences are recorded in the statements of operations and comprehensive income. |
| (ii) | The financial statements of foreign subsidiaries, where non-United States dollar currencies are the functional currencies, are translated into United States dollars using exchange rates in effect at period end for assets and liabilities and average exchange rates during each reporting period for the statement of operations. Adjustments resulting from translation of these financial statements are reflected as a separate component of stockholders’ equity in accumulated other comprehensive income. |
(n) | (p) | Stock options and warrants |
Stock options have been granted to employees, directors and non-employee directors. Upon exercise of the options, a holder can acquire shares of common stock of the Company at an exercise price determined by the board of directors. The options are exercisable based on the vesting terms stipulated in the option agreements or plan.
The Company follows the guidance of ASC 718, “Accounting for Stock Options and Other Stock-Based Compensation”. ASC 718 requires companies to record compensation expense for share-based awards issued to employees and directors in exchange for services provided. The amount of the compensation expense is based on the estimated fair value of the awards on their grant dates and is recognized over the required service periods. Our share-based awards include stock options and restricted stock awards. The estimated fair value underlying our calculation of compensation expense for stock options is based on the Black-Scholes pricing model. Forfeitures of share-based awards are estimated at the time of grant and revised, if necessary, in subsequent periods if our estimates change based on the actual amount of forfeitures we have experienced.
Bonso Electronics International Inc.
Notes to Consolidated Financial Statements
(Expressed in United States Dollars)
1 | Description of business and significant accounting policies (Continued) |
(o)(q) | Fair value of financial instruments |
The carrying amounts of financial instruments including cash and cash equivalents, trade receivables, net, other receivables, deposits and prepayments, other current assets, accounts payable and accrued charges and deposits, and other current liabilities approximate fair value due to the relatively short-term maturity of these instruments. The carrying value of long-term debt approximates fair value based on prevailing borrowing rates currently available for loans with similar terms and maturities.
The Company periodically retires treasury shares that it acquires through share repurchases and returns those shares to the status of authorized but unissued. The Company accounts for treasury stock transactions under the cost method. For each reacquisition of common stock, the number of shares and the acquisition price for those shares is added to the existing treasury stock count and total value, respectively, and recognized as a deduction from equity. When treasury shares are retired, the Company’s policy is to allocate the excess of the repurchase price over the par value of shares acquired to additional paid-in capital, with any remaining amount being charged to retained earnings. (q) | Recent accounting pronouncements |
In May 2014, the FASB issued ASU 2014-09, “Revenue from Contracts with Customers” ("ASU 2014-09"). The objective of this Update is to remove inconsistencies and weaknesses in revenue requirements, and to simplify the preparation of financial statements by reducing the number of requirements to which an entity must refer. The new standard supersedes virtually all present U.S. GAAP guidance on revenue recognition and requires the use of more estimates and judgments than the prior standards, as well as additional disclosures. In August 2015, the FASB issued ASU 2015-14, "Revenue from Contracts with Customers (Topic 606): Deferral of the Effective Date", deferring the effective date for one year to interim and annual periods beginning after December 15, 2017. Early adoption is also permitted as of the original effective date (interim and annual periods beginning after December 15, 2016) and retrospective application is required. The Company will adopt ASU 2014-09, and its related clarifying ASUs, as of April 1, 2018. The Company anticipates adopting the standard using the modified retrospective transition approach. Under this approach, the new standard would apply to all new contracts initiated on or after April 1, 2018. For existing contracts that have remaining obligations as of April 1, 2018, any difference between the recognition criteria in these ASUs and the Company’s current revenue recognition practices would be recognized using a cumulative effect adjustment to the opening balance of retained earnings. Our product revenues are generally recognized upon delivery to the customer, which is when the control transfers to the customer. The majority of the Company’s customer contracts, which may be in the form of purchase orders, contracts or purchase agreements, contain performance obligations for delivery of agreed upon products. Delivery of all performance obligations contained within a contract with a customer typically occurs at the same time. The Company has also determined that it will make accounting policy elections to 1) treat shipping and handling activities that occur after the customer obtains control of the goods as fulfillment costs and 2) exclude sales (and similar) taxes from the measurement of the transaction price. We have no open contracts as of March 31, 2018, therefore, there will be no cumulative effect of applying the new standards. We do not expect the adoption of these ASUs to have a material impact on our consolidated financial statements.
Bonso Electronics International Inc. Notes to Consolidated Financial Statements (Expressed in United States Dollars)
| 1 | Description of business and significant accounting policies (Continued) |
(q) | (s) | Recent accounting pronouncements (Continued) |
In January 2016, the FASB issued ASU 2016-01, "Financial Instruments—Overall (Subtopic 825-10): Recognition and Measurement of Financial Assets and Financial Liabilities" ("ASU 2016-01"). The amendments in this update supersede the guidance to classify equity securities with readily determinable fair values into different categories (that is trading or available-for-sale) and require equity securities (including other ownership interests, such as partnerships, unincorporated joint ventures and limited liability companies) to be measured at fair value with changes in the fair value recognized through net income. For public business entities, the amendments in this Update are effective for fiscal years beginning after December 15, 2017, including interim periods within those fiscal years. We do not expect the adoption of ASU 2016-01 to have a material impact on our consolidated financial statements.
In February 2016, the FASB issued ASU 2016-02, "Leases (Subtopic 842)" ("ASU 2016-02"). This Update is to increase transparency and comparability among organizations by recognizing lease assets and lease liabilities on the balance sheet and disclosing key information about leasing arrangements. For public business entities, this Update is effective for fiscal years beginning after December 15, 2018, including interim periods within those fiscal years. The Company is evaluating the new pronouncement to determine the impact it may have on its consolidated financial statements.
Recently adopted accounting pronouncements In June 2016, the FASB issued ASU 2016-13, "Financial Instruments—Credit Losses (Topic 326): Measurement of Credit Losses on Financial Instruments" ("ASU 2016-13"), which improves financial reporting by providing timelier recording of credit losses on loans and other financial instruments held by financial institutions and other organizations. The ASU requires an organization to measure all expected credit losses for financial assets held at the reporting date based on historical experience, current conditions and reasonable and supportable forecasts. Forward-looking information will now be used to better inform credit loss estimates. This ASU is effective for interim and annual periods beginning after December 15, 2019 and early adoption is permitted. TheEffective April 1, 2020, the Company is currently evaluatingadopted ASU 2016-13, which did not have a material impact on the impact of this ASU on itsCompany’s consolidated financial statements.
In August 2016,2018, the FASB issued ASU 2016-15, "Statement2018-13, “Fair Value Measurement (Topic 820): Disclosure Framework - Changes to the Disclosure Requirements for Fair Value Measurement,” ("ASU 2018-13") which is part of Cash Flows (Topic 230)" ("ASU 2016-15"). This Update addresses eight specific cash flow issues with the objectiveFASB disclosure framework project to improve the effectiveness of reducingdisclosures in the existing diversitynotes to the financial statements. The amendments in practice. For public business entities, this Updatethe new guidance remove, modify and add certain disclosure requirements related to fair value measurements covered in Topic 820, “Fair Value Measurement.” The new standard is effective for fiscal years, and interim periods within those fiscal years, beginning after December 15, 2017, including2019. Effective April 1, 2020, the Company adopted ASU 2018-13, which did not have a material impact on the Company’s consolidated financial statements. In October 2018, the FASB issued ASU No. 2018-17, “Consolidation: Targeted Improvements to Related Party Guidance for Variable Interest Entities,” ("ASU 2018-17") which modifies the guidance related to indirect interests held through related parties under common control for determining whether fees paid to decision makers and service providers are variable interest. ASU 2018-17 is effective for fiscal years, and interim periods within those fiscal years. We doyears, beginning after December 15, 2019 and early adoption is permitted. Effective April 1, 2020, the Company adopted ASU 2018-17, which did not expect the adoption of ASU 2016-15 to have a material impact on ourthe Company’s consolidated financial statements. In November 2018, the FASB issued ASU No. 2018-19, “Codification Improvements to Topic 326, Financial Instruments—Credit Losses,” (“ASU 2018-19”) which clarifies and improves guidance related to credit losses, hedging, and recognition and measurement. Same as ASU 2016-13, this ASU is effective for interim and annual periods beginning after December 15, 2019 and early adoption is permitted. Effective April 1, 2020, the Company adopted ASU 2018-19, which did not have a material impact on the Company’s consolidated financial statements. Bonso Electronics International Inc. Notes to Consolidated Financial Statements (Expressed in United States Dollars)
| 1 | Description of business and significant accounting policies (Continued) |
(q) | (s) | Recent accounting pronouncements (Continued) |
Recent accounting pronouncements not yet adopted In October 2016,December 2019, the FASB issued ASU 2016-16, "No. 2019-12, “Income Taxes (Topic 740)" (": Simplifying the Accounting for Income Taxes” (“ASU 2016-16"2019-12”). This Update improvesASU 2019-12 will simplify the accounting for income taxes by removing certain exceptions to the income tax consequencesgeneral principles in Topic 740. The amendments also improve consistent application of intra-entity transfersand simplify GAAP for other areas of assets other than inventory.Topic 740 by clarifying and amending existing guidance. For public business entities, the amendments in this Update isASU are effective for fiscal years, and interim periods within those fiscal years, beginning after December 15, 2020. For all other entities, the amendments are effective for fiscal years beginning after December 15, 2017, including2021, and interim periods within those fiscal years. We do not expectyears beginning after December 15, 2022. The Company is evaluating the impact of the adoption of ASU 2016-162019-12, but does not expect it to have a material impact on ourincome taxes as reported in its consolidated financial statements.
In November 2016,October 2020, the FASB issued ASU 2016-18, No. 2020-10, "Statement of Cash Flows (Topic 230)" Codification Improvements" ("“ASU 2016-18"2020-10”). This Update requires that a statement of cash flows explain, which improves consistency by amending the change during the periodAccounting Standards Codification to include all disclosure guidance in the totalappropriate disclosure sections and clarifies the application of cash, cash equivalents,various provisions in the Codification by amending and amounts generally described as restricted cashadding new headings, cross referencing to other guidance, and refining or restricted cash equivalents. For public business entities, this Update iscorrecting terminology. The amendments are effective for fiscal yearsannual periods beginning after December 15, 2017, including interim periods within those fiscal years. We do not expect2020 for public business entities. The Company is evaluating the impact of the adoption of ASU 2016-182020-10, but does not expect it to have a material impact on our consolidated financial statements.
In February 2017, the FASB issued ASU 2017-05, "Other Income—Gains and Losses from the De-recognition of Nonfinancial Assets (Subtopic 610-20)" ("ASU 2017-05"). This Update clarifies the Scope of Asset De-recognition Guidance and Accounting for Partial Sales of Nonfinancial Assets, which clarifies the scope of the nonfinancial asset guidance in Subtopic 610-20. This ASU also clarifies that the de-recognition of all businesses and nonprofit activities (except those related to conveyances of oil and gas mineral rights or contracts with customers) should be accounted for in accordance with the de-recognition and deconsolidation guidance in Subtopic 810-10. The amendments in this ASU also provide guidance on the accounting for what often are referred to as partial sales of nonfinancial assets within the scope of Subtopic 610-20 and contributions of nonfinancial assets to a joint venture or other non-controlled investee. The amendments in this ASU are effective for annual reporting periods beginning after December 15, 2017, including interim reporting periods within that reporting period. Public entities may apply the guidance earlier but only as of annual reporting periods beginning after December 15, 2016, including interim reporting periods within that reporting period. We do not expect the adoption of ASU 2017-05 to have a material impact on our consolidated financial statements.
In May 2017, the FASB issued ASU 2017-09, "Compensation—Stock Compensation (Topic 718) Scope of Modification Accounting" ("ASU 2017-09"). The requirement provides guidance on determining which changes to the terms and conditions of share-based payment awards require an entity to apply modification accounting under Topic 718. For public business entities, this ASU should be effective for annual periods, including interim periods within those annual periods, beginning after December 15, 2017. We do not expect the adoption of ASU 2017-09 to have a material impact on our consolidated financial statements.
Bonso Electronics International Inc.
Notes to Consolidated Financial Statements
(Expressed in United States Dollars)
1 | Description of business and significant accounting policies (Continued) |
(q) | Recent accounting pronouncements (Continued) |
In July 2017, the FASB issued ASU 2017-11, "Earnings Per Share (Topic 260) (Part I) Accounting for Certain Financial Instruments with Down Round Features, (Part II) Replacement of the Indefinite Deferral for Mandatorily Redeemable Financial Instruments of Certain Nonpublic Entities and Certain Mandatorily Redeemable Noncontrolling Interests with a Scope Exception" ("ASU 2017-11"). The amendments require companies to disregard the down round feature when assessing whether the instrument is indexed to its own stock, for purposes of determining liability or equity classification. Companies that provide earnings per share (EPS) data will adjust their basic EPS calculation for the effect of the feature when triggered (i.e., when the exercise price of the related equity-linked financial instrument is adjusted downward because of the down round feature) and will also recognize the effect of the trigger within equity. For public business entities, this ASU should be effective for annual periods, including interim periods within those annual periods, beginning after December 15, 2018. We are currently evaluating the impact the adoption of ASU 2017-11 will have on the Company’s consolidated financial statements.
In September 2017, the FASB issued ASU 2017-13, “Revenue Recognition (Topic 605), Revenue from Contracts with Customers (Topic 606), Leases (Topic 840), and Leases (Topic 842)” ("ASU 2017-13"): Amendments to SEC Paragraphs Pursuant to the Staff Announcement at the July 20, 2017 EITF Meeting and Rescission of Prior SEC Staff Announcements and Observer Comments. The amendments in ASU 2017-13 amend the early adoption date option for certain companies related to the adoption of ASU 2014-09 and ASU 2016-02. The effective date is the same as the effective date and transition requirements for the amendments for ASU 2014-09 and ASU 2016-02.
In February 2018, the FASB issued ASU 2018-02, “Income Statement—Reporting Comprehensive Income (Topic 220)” ("ASU 2018-02"). The amendments in this Update allow a reclassification from accumulated other comprehensive income to retained earnings for stranded tax effects resulting from the Tax Cuts and Jobs Act. Consequently, the amendments eliminate the stranded tax effects resulting from the Tax Cuts and Jobs Act and will improve the usefulness of information reported to financial statement users. However, because the amendments only relate to the reclassification of the income tax effects of the Tax Cuts and Jobs Act, the underlying guidance that requires that the effect of a change in tax laws or rates be included in income from continuing operations is not affected. The amendments in this Update also require certain disclosures about stranded tax effects. Public business entities should apply the amendments in ASU 2018-02 for fiscal years beginning after December 15, 2018, and interim periods within those fiscal years. Early adoption of the amendments in this Update is permitted. We are currently evaluating the impact of adopting ASU 2018-02 on the Company’s consolidated financial statements.
In July 2018, the FASB issued ASU 2018-11, “Leases (Topic 842): Targeted Improvements” ("ASU 2018-11"). The ASU provides (1) an optional transition method that entities can use when adopting ASC 842 and (2) a “practical expedient that permits lessors to not separate nonlease components from the associated lease component if certain conditions are met.” The amendments in this Update related to separating components of a contract affect the amendments in Update 2016-02, which are not yet effective but can be early adopted. For public business entities, this Update is effective for fiscal years beginning after December 15, 2018, including interim periods within those fiscal years. The Company is evaluating the new pronouncement to determine the impact it may have on its consolidated financial statements.
We believe there is no additional new accounting guidance adopted, but not yet effective that is relevant to the readers of our financial statements. However, there are numerous new proposals under development which, if and when enacted, may have a significant impact on our financial reporting. Bonso Electronics International Inc. Notes to Consolidated Financial Statements (Expressed in United States Dollars)
| 2 | Allowance for doubtful accounts |
Allowance for doubtful accounts amounted to $nil as of March 31, 2018 (2017:2021 (2020: $nil). Most of the Company’s trade receivables are generally unsecured.
The components of inventories are as follows: | | | March 31, | | | | | 2017 | | | 2018 | | | | | $ in thousands | | | $ in thousands | | | | | | | | | | | Raw materials | | | 442 | | | | 275 | | | Work in progress | | | 317 | | | | 237 | | | Finished goods | | | 259 | | | | 500 | | | | | | | | | | | | | | | | 1,018 | | | | 1,012 | | | | | | | | | | | |
| | | March 31, | | | | 2020 | | 2021 | | | | $ in thousands | | $ in thousands | | | | | | | | Raw materials | | | 357 | | | | 267 | | | Work in progress | | | 429 | | | | 391 | | | Finished goods | | | 392 | | | | 439 | | | | | | | | | | | | | | | | 1,178 | | | | 1,097 | |
During the fiscal years ended March 31, 2016, 20172019, 2020 and 2018,2021, based upon material composition and expected usage, provisions for inventories of approximately $30,000, $156,000$73,000, $87,000 and $569,000,$108,000, respectively, were charged to the consolidated statements of operations under cost of revenue.
| 4 | Property, plant and equipment, net |
Property, plant and equipment, net, consisted of the following: | | | March 31, | | | | | 2017 | | | 2018 | | | | | $ in thousands | | | $ in thousands | | | Cost | | | | | | | | Buildings | | | 16,285 | | | | 17,863 | | | Construction-in-progress | | | 62 | | | | 260 | | | Plant and machinery | | | 9,810 | | | | 9,932 | | | Furniture, fixtures and equipment | | | 1,273 | | | | 1,468 | | | Motor vehicles | | | 626 | | | | 643 | | | | | | | | | | | | | | | | 28,056 | | | | 30,166 | | | Less: accumulated depreciation | | | (17,762 | ) | | | (19,732 | ) | | | | | | | | | | | | | | | 10,294 | | | | 10,434 | | | | | | | | | | | |
| | | March 31, | | | | 2020 | | 2021 | | | | $ in thousands | | $ in thousands | | Cost | | | | | | Buildings | | | 16,857 | | | | 17,278 | | | Construction-in-progress | | | 604 | | | | 1,041 | | | Plant and machinery | | | 9,642 | | | | 9,829 | | | Furniture, fixtures and equipment | | | 1,544 | | | | 1,879 | | | Motor vehicles | | | 577 | | | | 586 | | | | | | | | | | | | | | | | 29,224 | | | | 30,613 | | | Less: accumulated depreciation | | | (19,785 | ) | | | (21,113 | ) | | | | | | | | | | | | | | | 9,439 | | | | 9,500 | | | | | | | | | | | |
Bonso Electronics International Inc. Notes to Consolidated Financial Statements (Expressed in United States Dollars)
| 4 | Property, plant and equipment, net (Continued) |
During the fiscal years ended March 31, 2016, 20172019, 2020 and 2018,2021, depreciation expenses charged to the consolidated statements of operations amounted to approximately $1,047,000, $1,046,000$859,000, $841,000 and $1,099,000,$814,000, respectively. As at March 31, 20172020 and 2018,2021 fully depreciated assets that were still in use by the Company amounted to $8,761,000approximately $15,800,000 and $9,853,000,$15,875,000, respectively.
As at March 31, 2020 and 2021, property, plant and equipment, net that were leased out amounted to approximately $2,750,000 and $2,714,000, respectively.Property, plant and equipment in Xinxing were assessed for impairment according to the policy described in note 1(h). The Company concluded that no impairment to property, plant and equipment in Xinxing was required as at March 31, 2018.
| 5 | Interests in subsidiaries |
Particulars of principal subsidiaries as of March 31, 20172020 and 20182021 are as follows: | Name of company | | Place of
incorporation and kind of
legal entity | | Particulars of
issued capital/
registered capital | | Percentage of capital held by the Company | | Principal activities | | | | | | | | 2020 | | 2021 | | | Bonso Electronics Limited *
(“BEL”) | | Hong Kong,
limited liability company | | HK$5,000,000 (US$641,026)
| | | 100% | | | | 100% | | | Investment holding, providing management and administrative support to the Group companies | Bonso Investment Limited
(“BIL”) | | Hong Kong,
limited liability company | | HK$3,000,000 (US$384,615)
| | | 100% | | | | 100% | | | Investment holding and property investment | Bonso Electronics (Shenzhen) Company, Limited
(“BESCL”) | | PRC,
limited liability company | | US$12,621,222 | | | 100% | | | | 100% | | | Investment holding and property rental | Bonso Advanced Technology Limited *
(“BATL”) | | Hong Kong,
limited liability company | | HK$1,000,000
(US$128,205) | | | 100% | | | | 100% | | | Investment holding and trading of scales and pet electronics products | Bonso Advanced Technology (Xinxing) Company, Limited
(“BATXXCL”) | | PRC,
limited liability company | | US$10,000,000 | | | 100% | | | | 100% | | | Production of scales and pet electronics products and property rental | Bonso Technology (Shenzhen) Company, Limited
(“BTL”) | | PRC,
limited liability company | | HK$200,000
| | | 100% | | | | 100% | | | Product development | | Modus Pets Inc. (“MPI”) | | Neveda, USA | | US$75,000 | | | — | | | | 100% | | | Trading of scales and pet electronics products |
| Name of company | | Place of incorporation and kind of legal entity | | Particulars of issued capital/ registered capital | | | Percentage of capital held by the Company | | Principal activities | | | | | | | | | 2017 | | | 2018 | | | Bonso Electronics Limited * (“BEL”) | | Hong Kong, limited liability company | | | | | | | 100% | | | | 100% | | Investment holding, providing management and administrative support to the Group companies | | | | | | | | | | | | | | | | | | Bonso Investment Limited (“BIL”) | | Hong Kong, limited liability company | | | | | | | 100% | | | | 100% | | Investment holding and property investment | | | | | | | | | | | | | | | | | | Bonso Electronics (Shenzhen) Company, Limited (“BESCL”) | | PRC, limited liability company | | US$12,621,222 | | | | 100% | | | | 100% | | Investment holding and property rental | | | | | | | | | | | | | | | | | | Bonso Advanced Technology Limited * (“BATL”) | | Hong Kong, limited liability company | | | HK1,000,000 (US$128,205 | ) | | | 100% | | | | 100% | | Investment holding and trading of scales and pet electronics products | | | | | | | | | | | | | | | | | | Bonso Advanced Technology (Xinxing) Company, Limited (“BATXXCL”) | | PRC, limited liability company | | US$10,000,000 | | | | 100% | | | | 100% | | Production of scales and pet electronics products and property rental | | | | | | | | | | | | | | | | | | Bonso Technology (Shenzhen) Company, Limited (“BTL”) | | PRC, limited liability company | | HK$200,000 | | | | 100% | | | | 100% | | Product development | | | | | | | | | | | | | | | | | |
* Shares directly held by the Company Bonso Electronics International Inc. Notes to Consolidated Financial Statements (Expressed in United States Dollars)
Intangible assets are analyzed as follows: | | | March 31, | | | | | 2017 | | | 2018 | | | | | $ in thousands | | | $ in thousands | | | | | | | | | | | Cost | | | 5,740 | | | | 6,348 | | | Less: accumulated amortization | | | (2,955 | ) | | | (3,561 | ) | | | | | | | | | | | | | | | 2,785 | | | | 2,787 | |
| | | Amount | | | $ in thousands | | Cost at March 31, 2019 | | 5,951 | | Addition | | - | | Effect of exchange rate | | (385) | | Cost at March 31, 2020 | | 5,566 | | Addition | | - | | Effect of exchange rate | | 468 | | Cost at March 31, 2021 | | 6,034 | | | | Accumulated Amortization at March 31, 2019 | | (3,613) | | Addition | | - | | Amortization | | (264) | | Effect of exchange rate | | 241 | | Accumulated Amortization at March 31, 2020 | | (3,636) | | Addition | | - | | Amortization | | (269) | | Effect of exchange rate | | (316) | | Accumulated Amortization at March 31, 2021 | | (4,221) | | | | Net book value at March 31, 2019 | | 2,338 | | | | Net book value at March 31, 2020 | | 1,930 | | | | Net book value at March 31, 2021 | | 1,813 |
Bonso Electronics International Inc. Notes to Consolidated Financial Statements (Expressed in United States Dollars) | 6 | Intangible assets, net (Continued) |
The components of intangible assets are as follows: | | | March 31, | | | | | 2017 | | | 2018 | | | | | $ in thousands | | | $ in thousands | | | | | | | | | | | Land use right of factory land in Shenzhen, Guangdong, PRC | | | 1,326 | | | | 1,274 | | | Land use right of factory land in Xinxing, Guangdong, PRC | | | 1,459 | | | | 1,513 | | | | | | | | | | | | | | | | 2,785 | | | | 2,787 | |
| | | March 31, | | | | 2020 | | 2021 | | | | $ in thousands | | $ in thousands | | | | | | | | Land use right of factory land in Shenzhen, Guangdong, PRC | | | 780 | | | | 663 | | | Land use right of factory land in Xinxing, Guangdong, PRC | | | 1,150 | | | | 1,150 | | | | | | | | | | | | | | | | 1,930 | | | | 1,813 | |
Amortization expense in relation to intangible assets was approximately $288,000, $271,000$275,000, $264,000 and $277,000$269,000 for each of the fiscal years ended March 31, 2016, 20172019, 2020 and 2018,2021, respectively.
As of March 31, 2018,2021, future minimum amortization expenses in respect of intangible assets are as follows: | Year ending March 31, | | $ in thousands | | | | | | | | 2019 | | | 293 | | | 2020 | | | 293 | | | 2021 | | | 293 | | | 2022 | | | 293 | | | 2023 | | | 293 | | | Thereafter | | | 1,322 | | | | | | | | | Total | | | 2,787 | |
Year ending
March 31, | | $ in thousands | | | | | | | 2022 | | | | 279 | | | | 2023 | | | | 279 | | | | 2024 | | | | 279 | | | | 2025 | | | | 210 | | | | 2026 | | | | 96 | | | | Thereafter | | | | 670 | | | | | | | | | | | | Total | | | | 1,813 | |
In November 2017, the Company signed an agreement with a property developer in Shenzhen - Shenzhen Fangda Property Development Company Limited (“Fangda”) to cooperate in reconstructing and redeveloping the Shenzhen factory. The redevelopment will be on the factory land in Shenzhen.Bonso Electronics International Inc. Notes to Consolidated Financial Statements (Expressed in United States Dollars)
As of March 31, 2018,2021, the Company had general banking facilities for bank overdrafts, letters of credit, notes payable and term loans. The facilities are interchangeable with total amounts available of approximately $5,128,000 (2017: $5,306,000)(2020: $5,128,000). The general banking facilities utilized by the Company are denominated in United States dollars, Hong Kong dollars and Chinese Yuan.
The Company’s general banking facilities, expressed in United States dollars, are further detailed as follows: | | | Amount available | | | Amount utilized | | | Amount unutilized | | Terms of banking facilities as of | | | | March 31, | | | March 31, | | | March 31, | | March 31, 2018 | | | | 2017 | | | 2018 | | | 2017 | | | 2018 | | | 2017 | | | 2018 | | Interest | Repayment | | | | $ in thousands | | | $ in thousands | | | $ in thousands | | rate | terms |
Import and export facilities
| | | | | | | | | | | | | | | | | | | | | | | | | | | | | | | | | | | | | | | | | | | | Combined limit | | | 2,564 | | | | 2,564 | | | | 134 | | | | 99 | | | | 2,430 | | | | 2,465 | | | | | | | | | | | | | | | | | | | | | | | | | | | | | | | | | Including sub-limit of: | | Notes payable | | | 2,308 | | | | 2,308 | | | | 134 | | | | 99 | | | | 2,174 | | | | 2,209 | | HIBOR* +2.5% | Repayable in full within 120 days | | Bank overdrafts | | | 641 | | | | 641 | | | | - | | | | - | | | | 641 | | | | 641 | | Prime rate + 1% | Repayable on demand | | | | | | | | | | | | | | | | | | | | | | | | | | | | | | Other facilities | | | | | | | | | | | | | | | | | | | | | | | | | | | | Export Documentary Credits | | | 641 | | | | 641 | | | | - | | | | - | | | | 641 | | | | 641 | | | | | Short Term Loans | | | 1,923 | | | | 1,923 | | | | - | | | | - | | | | 1,923 | | | | 1,923 | | (Note A) | Revolving loan repayable in 30 days | Long Term Loans (1) | | | 178 | | | | - | | | | 143 | | | | - | | | | 35 | | | | - | | (Note B) | Term loans repayable monthly over 3 years. | | | | | | | | | | | | | | | | | | | | | | | | | | | | | | | | | 5,306 | | | | 5,128 | | | | 277 | | | | 99 | | | | 5,029 | | | | 5,029 | | | |
| | | Amount available | | Amount utilized | | Amount unutilized | | Terms of banking
facilities as of | | | | March 31, | | March 31, | | March 31, | | March 31, 2021 | | | | 2020 | | 2021 | | 2020 | | 2021 | | 2020 | | 2021 | | Interest | | Repayment | | | | $ in thousands | | $ in thousands | | $ in thousands | | rate | | Terms | | Import and export facilities | | | | | | | | | | | | | | | | | | | | | | | | | | | | | | | | | | | | | | | | | | | | | | | | | | | | | | | Combined limit | | | 2,564 | | | | 2,564 | | | | 937 | | | | 492 | | | | 1,627 | | | | 2,072 | | | | | | | | | | | | | | | | | | | | | | | | | | | | | | | | | | | | | Including sub-limit of: | | Notes payable | | | 2,308 | | | | 2,308 | | | | — | | | | 25 | | | | 2,308 | | | | 2,283 | | | HIBOR* +2.5% | | Repayable in full within 120 days | | Bank overdrafts | | | 641 | | | | 641 | | | | — | | | | — | | | | 641 | | | | 641 | | | Prime rate +1% | | Repayable on demand | | Long term loans (1) | | | 1,214 | | | | 1,214 | | | | 937 | | | | 467 | | | | 277 | | | | 747 | | | HIBOR* +2% | | Term loans repayable
monthly over 3 years. | | | | | | | | | | | | | | | | | | | | | | | | | | | | | | | | Other facilities | | | | | | | | | | | | | | | | | | | | | | | | | | Export documentary credits | | | 641 | | | | 641 | | | | — | | | | — | | | | 641 | | | | 641 | | | | | | | Revolving loan | | | 1,923 | | | | 1,923 | | | | 1,000 | | | | 500 | | | | 923 | | | | 1,423 | | | HIBOR* +2.25% | | Repayable until redemption of a listed debt instrument | | | | | | | | | | | | | | | | | | | | | | | | | | | | | | | | | | | 5,128 | | | | 5,128 | | | | 1,937 | | | | 992 | | | | 3,191 | | | | 4,136 | | | | | |
Note A: HIBOR* +2.25% for revolving loans in Hong Kong.
Note B: HIBOR* +2% for term loans in Hong Kong.
(1) A clause in the banking facilities states that the term loans are subject to review any time and also subject to the bank's overriding right to repayment on demand, including the right to call for cash cover on demand for prospective and contingent liabilities. Therefore, all long-term loans were classified as current liabilities in the consolidated balance sheets. As of March 31, 2018, the2021, $274,000 of long-term loans became current as they are repayable within one year in accordance with the repayment schedule.
* HIBOR is the Hong Kong Interbank Offer Rate Bonso Electronics International Inc. Notes to Consolidated Financial Statements (Expressed in United States Dollars)
| 7 | Banking facilities (Continued) |
One of the properties of the Company located in Hong Kong with a net book value of approximately $953,000$677,000 as of March 31, 2018,2021, the rental assignment over such property, and the rights, interests and benefits of a life insurance contract with a book value of approximately $149,000$163,000 and a listed debt instrument with a book value of approximately $523,000 are arranged as securities to the banks for the banking facilities arrangement.
The Prime Rate and HIBOR were 5.00% and 0.98%0.13% per annum, respectively, as of March 31, 2018.2021. The Prime Rate is determined by the Hong Kong Bankers Association of Banks and is subject to revision from time to time. Interest rates are subject to change if the Company defaults on the amount due under the facility or draws in excess of the facility amounts, or at the discretion of the banks.
The weighted average interest rates of borrowings of the Company are as follows: | | | During the fiscal year ended March 31, | | | | 2020 | | 2021 | | | | | | | | Bank overdrafts | | | 6.00 | % | | | 6.00 | % | | Notes payable | | | 4.71 | % | | | 2.85 | % | | Term loans | | | 4.06 | % | | | 2.78 | % | | Revolving loan | | | 4.29 | % | | | 2.50 | % |
| | | During the fiscal year ended March 31, | | | | | 2017 | | | 2018 | | | | | | | | | | | Bank overdrafts | | | 6.00 | % | | | 6.00 | % | | Notes payable | | | 3.13 | % | | | 3.42 | % | | Term Loan in Hong Kong | | | 2.59 | % | | | 2.69 | % |
Bonso Electronics International Inc. Notes to Consolidated Financial Statements (Expressed in United States Dollars)
| (a) | The subsidiaries comprising the Group are subject to tax on an entity basis on income arising in or derived from Hong Kong and the PRC. The Company is not subject to income taxes in the British Virgin Islands. |
The subsidiariesBIL and BEL operating in Hong Kong are subject to the Hong Kong profits tax rate of 16.5% (2017(2020 and 2016:2019: 16.5%). BATL operating in Hong Kong is subject to the Hong Kong profits tax rate of 8.25% (2020: 8.25%; 2019: 8.25%) on the first HKD 2 million of the estimated assessable profits and at 16.5% on the estimated assessable profits above HKD 2 million. BIL has no assessable profits while BATL and BEL have notax losses brought forward which are available for set-off against the assessable profits for the year ended March 31, 2018.
All subsidiaries registered in the PRC are subject to a tax rate of 25% (2017(2020 and 2016:2019: 25%).
Bonso Electronics International Inc.
Notes to Consolidated Financial Statements
(Expressed in United States Dollars)
| (b) | Income is subject to taxation in the various countries in which the Company and its subsidiaries operate. The (loss) / income before income taxes by geographical location is analyzed as follows: |
| | | 2016 | | | 2017 | | | 2018 | | | 2019 | | 2020 | | 2021 | | | | $ in thousands | | | $ in thousands | | | $ in thousands | | | | $ in thousands | | | | $ in thousands | | | | $ in thousands | | | | | | | | | | | | | | | | | | | | | | | | | | Hong Kong | | | 3,933 | | | | 693 | | | | 221 | | | | (813 | ) | | | 819 | | | | 2,360 | | | PRC | | | (167 | ) | | | 2,531 | | | | (406 | ) | | | 168 | | | | (408 | ) | | | (1,072 | ) | | Others | | | (585 | ) | | | 171 | | | | 189 | | | | 182 | | | | (13 | ) | | | (131 | ) | | | | | | | | | | | | | | | | | | | | | | | | | | | | Total | | | 3,181 | | | | 3,395 | | | | 4 | | | | (463 | ) | | | 398 | | | | 1,157 | | | | | | | | | | | | | | | | | | | | | | | | | | | |
Others mainly include the (loss)income / income(loss) from BVI. Bonso Electronics International Inc. Notes to Consolidated Financial Statements (Expressed in United States Dollars) | (c) | Income tax expensebenefit / (expense) comprises the following: |
| | | 2016 | | | 2017 | | | 2018 | | | | | $ in thousands | | | $ in thousands | | | $ in thousands | | | | | | | | | | | | | | Current income tax expense | | | (310 | ) | | | (600 | ) | | | - | | | | | | | | | | | | | | | |
| | | | 2019 | | | | 2020 | | | | 2021 | | | | | | $ in thousands | | | | $ in thousands | | | | $ in thousands | | | | | | | | | | | | | | | | | Current income tax expense | | | — | | | | — | | | | (165 | ) | | Deferred income tax benefit | | | — | | | | — | | | | 779 | | | | | | | | | | | | | | | | | Total | | | — | | | | — | | | | 614 | |
The components of the income tax expensebenefit / (expense) by geographical location are as follows:
| | | 2016 | | | 2017 | | | 2018 | | | | | $ in thousands | | | $ in thousands | | | $ in thousands | | | | | | | | | | | | | | Hong Kong | | | (310 | ) | | | (5 | ) | | | - | | | PRC | | | - | | | | (595 | ) | | | - | | | | | | | | | | | | | | | | | Total | | | (310 | ) | | | (600 | ) | | | - | | | | | | | | | | | | | | | |
Bonso Electronics International Inc.
Notes to Consolidated Financial Statements
(Expressed in United States Dollars)
| | | 2019 | | 2020 | | 2021 | | | | | $ in thousands | | | | $ in thousands | | | | $ in thousands | | | | | | | | | | | | | | | | | Hong Kong | | | — | | | | — | | | | (12 | ) | | PRC | | | — | | | | — | | | | 626 | | | | | | | | | | | | | | | | | Total | | | — | | | | — | | | | 614 | |
At the end of the accounting periods, the income tax liabilities / (recoverable) arerecoverable is as follows: | | | 2020 | | 2021 | | | | | $ in thousands | | | | $ in thousands | | | | | | | | | | | | | Current income tax recoverable | | | 5 | | | | 5 | |
| | | 2017 | | | 2018 | | | | | $ in thousands | | | $ in thousands | | | | | | | | | | | Current income tax liabilities / (recoverable) | | | 533 | | | | (5 | ) | | | | | | | | | | |
| (d) | Deferred tax assets comprise the following: |
| | | 2017 | | | 2018 | | | | | $ in thousands | | | $ in thousands | | | | | | | | | | | Tax loss carry forwards | | | 4,270 | | | | 4,607 | | | Less: Valuation allowance | | | (4,270 | ) | | | (4,607 | ) | | | | | | | | | | | | | | | - | | | | - | |
| | | 2020 | | 2021 | | | | $ in thousands | | $ in thousands | | | | | | | | Tax loss carry forwards | | | 4,235 | | | | 4,235 | | | Decrease in tax loss | | | — | | | | (259 | ) | | Less: Valuation allowance | | | (4,235 | ) | | | (3,197 | ) | | | | | | | | | | | | | | | — | | | | (779 | ) |
As of March 31, 20172020 and 2018,2021, the Company had accumulated tax losses amounting to approximately $24,410,000$23,722,000 and $25,928,000$22,228,000 (the tax effect thereon is approximately $4,270,000$4,235,000 and $4,607,000)$3,976,000), respectively, subject to the final agreement by the relevant tax authorities, which may be carried forward and applied to reduce future taxable income which is earned in or derived from Hong Kong and other jurisdictions. Realization of deferred tax assets associated with tax loss carry forwards is dependent upon generating sufficient taxable income prior to their expiration. A valuation allowance is established against such tax losses when management believes it is more likely than not that a portion may not be utilized. As of March 31, 2018,2021, the Company’s accumulated tax losses of approximately $3,868,000$3,627,000 will expire from 20192022 to 2023. Bonso Electronics International Inc. Notes to Consolidated Financial Statements (Expressed in United States Dollars) | (e) | Changes in valuation allowance are as follows: |
| | | 2016 | | | 2017 | | | 2018 | | | | | $ in thousands | | | $ in thousands | | | $ in thousands | | | | | | | | | | | | | | Balance, April 1 | | | 4,459 | | | | 4,459 | | | | 4,270 | | | (Credited) / charged to income tax expense | | | - | | | | (189 | ) | | | 337 | | | | | | | | | | | | | | | | | Balance, March 31 | | | 4,459 | | | | 4,270 | | | | 4,607 | | | | | | | | | | | | | | | |
Bonso Electronics International Inc.
Notes to Consolidated Financial Statements
(Expressed in United States Dollars)
| | | 2019 | | 2020 | | 2021 | | | | $ in thousands | | $ in thousands | | $ in thousands | | | | | | | | | | Balance, April 1 | | | 4,607 | | | | 4,203 | | | | 4,235 | | | Charged / (credited) to income tax expense | | | (404 | ) | | | 32 | | | | (1,038 | ) | | | | | | | | | | | | | | | | Balance, March 31 | | | 4,203 | | | | 4,235 | | | | 3,197 | |
| (f) | The actual income tax credit / (expense)expense attributable to earnings for the fiscal years ended March 31, 2016, 20172019, 2020 and 20182021 differed from the amounts computed by applying the Hong Kong statutory tax rate in accordance with the relevant income tax law as a result of the following: |
| | | 2019 | | 2020 | | 2021 | | | | | $ in thousands | | | | $ in thousands | | | | $ in thousands | | | | | | | | | | | | | | | | | Income / (loss) before income taxes | | | (463 | ) | | | 398 | | | | 1,157 | | | | | | | | | | | | | | | | | Income tax (expense) / benefit on pretax income at statutory rate | | | 55 | | | | (44 | ) | | | (170 | ) | Effect of different tax rates of subsidiaries
operating in other jurisdictions | | | 8 | | | | 28 | | | | 89 | | | Profit not subject to income tax | | | 9 | | | | 18 | | | | 44 | | | Expenses not deductible for income tax purposes | | | (163 | ) | | | (56 | ) | | | (18 | ) | | Increase / (decrease) in valuation allowance | | | (404 | ) | | | 32 | | | | — | | | Tax effect of future temporary differences | | | — | | | | — | | | | (6 | ) | | Tax benefit from expected realization of tax loss | | | — | | | | — | | | | 779 | | | Tax losses not recognized | | | — | | | | — | | | | (280 | ) | | Utilization of tax losses | | | 495 | | | | 22 | | | | 176 | | | | | | | | | | | | | | | | | Total income tax benefit | | | — | | | | — | | | | 614 | |
| | | 2016 | | | 2017 | | | 2018 | | | | | $ in thousands | | | $ in thousands | | | $ in thousands | | | | | | | | | | | | | | Income before income taxes | | | 3,181 | | | | 3,395 | | | | 4 | | | | | | | | | | | | | | | | | Income tax expense on pretax income at statutory rate | | | (525 | ) | | | (560 | ) | | | (1 | ) | | Effect of different tax rates of subsidiaries operating in other jurisdictions | | | (95 | ) | | | (52 | ) | | | 128 | | | Profit not subject to income tax | | | 387 | | | | 472 | | | | 61 | | | Expenses not deductible for income tax purposes | | | (255 | ) | | | (686 | ) | | | (167 | ) | | (Decrease) / increase in valuation allowance | | | - | | | | (189 | ) | | | 337 | | | Under provision in prior year | | | - | | | | 5 | | | | - | | | Utilization of tax losses / (tax losses recognized) | | | 178 | | | | 410 | | | | (358 | ) | | | | | | | | | | | | | | | | Total income tax expense | | | (310 | ) | | | (600 | ) | | | - | | | | | | | | | | | | | | | |
The statutory rate of 8.25% or 16.5% used above is that of Hong Kong, where the Company’s main business is located.
| (g) | The Company complies with ASC 740 and assessed the tax position during the fiscal year ended March 31, 20182021 and concluded that such prior yearthe Company had no accrued penalties related to uncertain income tax liability was no longer required.positions under accrued charges and deposits (2020: $nil). |
The Company’s accounting policy is to treat interest and penalties as components of income taxes. As of March 31, 2018, the Company had no accrued penalties related to uncertain tax positions (2017: $nil).
Bonso Electronics International Inc. Notes to Consolidated Financial Statements (Expressed in United States Dollars)
| 9 | Financial instruments at fair value |
The Company complies with ASC 820, “Fair Value Measurements” (“ASC 820”). ASC 820 clarifies the definition of fair value, prescribes methods for measuring fair value and establishes a fair value hierarchy to classify the inputs used in measuring fair value as follows:
Level 1-Inputs are unadjusted quoted prices in active markets for identical assets or liabilities available at the measurement date.
Level 2-Inputs are unadjusted quoted prices for similar assets and liabilities in active markets, quoted prices for identical or similar assets and liabilities in markets that are not active, inputs other than quoted prices that are observable and inputs derived from or corroborated by observable market data.
Level 3-Inputs are unobservable inputs which reflect the reporting entity's own assumptions on what assumptions the market participants would use in pricing the asset or liability based on the best available information.
The Company entered into forward contracts with a bank, and the bank would pay the Company if the Chinese Yuan appreciated against the USD. If the Chinese Yuan depreciated against the USD, the Company would need to pay the bank, but would be able to buy more Chinese Yuan as a result. During the fiscal year ended March 31, 2017, the forward contracts matured and payments of approximately $225,000 have been made.
During the fiscal year ended March 31, 2018,2021, the Company purchased listed shares in Hong Kong and the United States for trading purposepurposes for approximately $517,000 (2017: $163,000)$613,000 (2020: $68,000). During the fiscal year ended March 31, 2018,2021, a gain from disposal of financial assets at fair value of approximately $58,000$6,000 was recorded (2017: $3,000)(2020: loss of $1,000). A revaluation lossgain of approximately $7,000$17,000 was recorded during the fiscal year ended March 31, 2018 (2017:2021 (2020: revaluation gainloss of $4,000)$5,000).
At the end of the accounting period, the fair value of the following assets werewas as follows: | | | March 31, 2020 | | March 31, 2021 | | $ in thousands | | | | | | | | | | | | | | | | | | | | Level 1 | | Level 2 | | Level 3 | | Total | | Level 1 | | Level 2 | | Level 3 | | Total | | Equity investments | | | 54 | | | | — | | | | — | | | | 54 | | | | 504 | | | | — | | | | — | | | | 504 | |
| | | March 31, 2017 | | | March 31, 2018 | | | $ in thousands | | | | | | | | | | | | | | | | | | | | | | | | | | | | Level 1 | | | Level 2 | | | Level 3 | | | Total | | | Level 1 | | | Level 2 | | | Level 3 | | | Total | | | Equity investments | | | 167 | | | | - | | | | - | | | | 167 | | | | 78 | | | | - | | | | - | | | | 78 | |
The fair value of equity investments is determined based on quoted price in active markets.
Bonso Electronics International Inc.
Notes to Consolidated Financial Statements
(Expressed in United States Dollars)
| 10 | Investment in life insurance contract
|
Investment in life insurance contract represents the carrying amount (surrender value) of the contract if it is to be terminated by the Company. There is one life insurance contract as of March 31, 20172020 and March 31, 2018,2021, with a carrying amount of approximately $144,000$158,000 and $149,000,$163,000, respectively. All premiums of this contract have already been paid during the fiscal year ended March 31, 2012. The face amount (death benefit) of this contract is $1,000,000. During the fiscal year ended March 31, 2018,2021, we recorded a gain of approximately $5,000 for the change in valuation (2017: $4,000)(2020: $5,000). Bonso Electronics International Inc. Notes to Consolidated Financial Statements (Expressed in United States Dollars)
During the year ended March 31, 2014, the Company entered into capital lease obligations amounting to approximately $123,000 for two motor vehicles. During the year ended March 31, 2016, the Company entered into an additional capital lease obligation amounting to approximately $116,000 for one motor vehicle. During the year ended March 31, 2018, one capital lease obligation amounting to approximately $69,000 for a motor vehicle was fully repaid.
Future minimum payments under capitalOperating leases as of March 31, 2018 with an initial term of more than one year are as follows:
| Future minimum payments under capital leases for the years ending March 31, | | Principal repayment | | | Interest payment | | | Total obligations | | | | | $ in thousands | | | $ in thousands | | | $ in thousands | | | | | | | | | | | | | | 2019 | | | 28 | | | | 2 | | | | 30 | | | 2020 | | | 27 | | | | 1 | | | | 28 | | | 2021 | | | 5 | | | | 0 | | | | 5 | | | | | | | | | | | | | | | | | | | | 60 | | | | 3 | | | | 63 | | | | | | | | | | | | | | | |
Bonso Electronics International Inc.
Notes to Consolidated Financial Statements
(Expressed in United States Dollars)
As of March 31, 2018,2021, the Company leases a factory in Shenzhen, two commercial units in Beijing and part of production facilities and machines in Xinxing under rental agreements to third parties. The Company will need to pay a cancellation fee of approximately $90,000$105,000 if the Company decides to terminate all the rental agreements before their expiry.
The Shenzhen factory is rented out to a third party from AugustApril 1, 20132021 to August 1, 2019.March 31, 2022. Part of the production facilities in Xinxing are rented out to various third parties up to February 13, 2026. Certain tenants have an option to early terminate their tenancy agreements. The expectedagreements, and the future minimum rental payments to be received are as follows: | Year ending March 31, | | $ in thousands | | | | | | | | 2019 | | | 1,436 | | | 2020 | | | 454 | | | | | | | | | | | | 1,890 | |
| | | | | Year ending March 31, | | $ in thousands | | | | | | | | | | | 2022 | | | | 105 | | | | | | | | | | | | | | | | 105 | |
As of March 31, 2018, the future minimum lease commitment payables in respect of non-cancellable operating leases for one office and two staff quarters in Shenzhen and a staff quarter in Xinxing are as follows:
| Year ending March 31, | | $ in thousands | | | | | | | | 2019 | | | 29 | | | | | | | | | | | | 29 | | | | | | | |
Rental expenses for all operating leases of one office premise in Shenzhen, two staff quarters in Shenzhen and a staff quarter in Xinxing amounted to approximately $119,000, $100,000 and $95,000 for the fiscal years ended March 31, 2016, 2017 and 2018, respectively.
Bonso Electronics International Inc. Notes to Consolidated Financial Statements (Expressed in United States Dollars) Operating leases (Continued) The Company leases one office and one staff quarter in Shenzhen and one staff quarter in Xinxing. Operating lease assets and obligations are reflected within right-of-use asset, and lease liability, respectively, on the consolidated balance sheets. The discount rate implicit within the leases is generally not determinable and therefore the Company determines the discount rate based on its incremental borrowing rate. The incremental borrowing rate for the leases is determined based on lease term and currency in which lease payments are made, adjusted for impacts of collateral. The weighted average discount rate used to measure the operating lease liabilities as of March 31, 2021 was 4.05%. | | | | Year ended March 31, 2021 | | Office | | | $ in thousands | | Assets | | | | | | Right-of-use assets | | | 232 | | | | | | | | Liabilities | | | | | | Current portion of operating lease liabilities | | | 105 | | | Non-current portion of operating lease liabilities | | | 127 | | | | | | | | | | 232 | |
Maturities of lease liabilities are as follows: | | | | | Year ending March 31, | | $ in thousands | | | 2022 | | | | 111 | | | | 2023 | | | | 111 | | | | 2024 | | | | 19 | | | | | | | | | | | | | | | | 241 | | | | Less: imputed interest | | | | (9 | ) | | | | | | | | | | | Total lease cost | | | | 232 | |
Supplemental cash flow and other information related to leases is as follows: | March 31, 2021 | | $ in thousands | | | | | Total lease liabilities | | | 232 | | | Cash payment for amount included in the measurement of lease liabilities | | | 241 | | | Weighted average remaining lease term (years) | | | 2.1 | | | Weighted average discount rate | | | 4.05 | % |
Bonso Electronics International Inc. Notes to Consolidated Financial Statements (Expressed in United States Dollars) 12 Commitments and contingent liabilities
Capital expenditures contracted at the balance sheet date but not yet provided for are as follows: | | | March 31, | | | | 2020 | | 2021 | | | | $ in thousands | | $ in thousands | | | | | | | | Construction in Xinxing, Guangdong, PRC | | | 40 | | | | 1,015 | | | | | | | | | | | | | | | | 40 | | | | 1,015 | |
| | | March 31, | | | | | 2017 | | | 2018 | | | | | $ in thousands | | | $ in thousands | | | | | | | | | | | Construction in Xinxing, Guangdong, PRC | | | 31 | | | | 358 | | | Mould | | | 22 | | | | - | | | | | | | | | | | | | | | | 48 | | | | 358 | |
As of March 31, 2018,2021, the Company entered into contractor agreements on buildings and leasehold improvements on the manufacturing facility in Xinxing, the PRC for a total consideration of $604,000.$1,951,000. As of March 31, 2018, $246,0002021, $936,000 has been paid, and the remaining balance of $358,000$1,015,000 is to be paid in accordance with the progress of the construction.
| (b) | Contingent liabilities |
The Company has entered into an employment agreement with a director, Anthony So. Mr. So’s employment agreement provides for a maximum yearly salary of approximately $800,000 plus bonus. The initial term of the employment agreement expired on March 31, 2013 (“Initial Term”); however, the employment agreement has been renewed under a provision in the agreement that provides for automatic renewal for successive one year periods, unless at least 90 days prior to the expiration of the Initial Term or any renewal term, either party gives written notice to the other party specifically electing to terminate the agreement. Mr. So’s employment agreement contains a provision under which the Company will be obligated to pay Mr. So all compensation for the remainder of his employment agreement and five times his annual salary and bonus compensation if a change of control, as defined in his employment agreement, occurs. Bonuses shall be determined by the Board of Directors in their sole discretion.
Bonso Electronics International Inc. Notes to Consolidated Financial Statements (Expressed in United States Dollars)
| (a) | Repurchase of common stock |
In August of 2001, the Company's Board of Directors authorized a program for the Company to repurchase up to $500,000 of its common stock. This repurchase program does not obligate the Company to acquire any specific number of shares or acquire shares over any specified period of time. No stock had been repurchased when, on November 16, 2006, the Company's Board of Directors authorized another $1,000,000 for the Company to repurchase its common stock under the same repurchase program. This authorization to repurchase shares increased the amount authorized for repurchase from $500,000 to $1,500,000. On September 17, 2015, the Company’s Board of Directors authorized an additional $1,500,000 to repurchase its common stock under the same repurchase program, bringing the amount authorized for repurchase to $3,000,000. On April 25, 2018, the Company’s Board of Directors authorized an additional $3,000,000 to repurchase its common stock under the same repurchase program, bringing the amount authorized for repurchase to $6,000,000. The Board of Directors believed that the common stock was undervalued and that the repurchase of common stock would be beneficial to the Company's stockholders. The Company (through its subsidiary) has repurchased an aggregate of 782,0171,005,018 shares of its common stock, including 213,49849,279 shares ($572,000)190,000) that were repurchased during the fiscal year ended March 31, 2018, 164,3112021, including 48,873 shares ($368,000)119,000) that were repurchased during the fiscal year ended March 31, 2017,2020, and 73,472124,849 shares ($99,000)364,000) that were repurchased during the fiscal year ended March 31, 2016. 34,0002019. No shares ($92,000) repurchased were removed from the total number of shares issued during the fiscal year ended March 31, 2018 (2017:2021 (2020: nil, 2016:2019: nil). The Company may from time to time repurchase shares of its common stock under this program.
The Company has authorized share capital of $100,000 for 10,000,000 shares of preferred stock, with par value of $0.01 each, divided into 2,500,000 shares each of class A preferred stock, class B preferred stock, class C preferred stock and class D preferred stock. Shares may be issued within each class from time to time by the Company’s Board of Directors in its sole discretion without the approval of the stockholders, with such designations, power preferences, rights, qualifications, limitations and restrictions as the Board of Directors shall fix and as have not been fixed in the Company’s Memorandum of Association. The Company has not issued any shares of preferred stock as of March 31, 2018.
No dividends were declared by the Company for each of the fiscal years ended March 31, 2016, 20172019, 2020 and 2018,2021, respectively. Bonso Electronics International Inc. Notes to Consolidated Financial Statements (Expressed in United States Dollars)
| 14 | Stock option and bonus plans |
(a) | 1996 Stock Option Plan |
In October 1996, the Company’s Board of Directors approved the 1996 Stock Option Plan and 1996 Non-Employee Directors’ Stock Option Plan. Under the 1996 Stock Option Plan, the Company may grant options of common stock to certain employees and directors of the Company for a maximum of 900,000 shares. The 1996 Stock Option Plan is administered by a committee appointed by the Board of Directors which determines the terms of options granted, including the exercise price, the option periods and the number of shares to be subject to each option. The exercise price of options granted under the 1996 Stock Option Plan may be less than the fair market value of the common shares on the date of grant. The maximum term of options granted under the 1996 Stock Option Plan is 10 years. The right to acquire the common shares is not assignable except for certain conditions stipulated in the 1996 Stock Option Plan.
Under the 1996 Non-Employee Directors’ Stock Option Plan, the non-employee directors were automatically granted stock options on the third business day following the day of each annual general meeting of the Company to purchase shares of common stock. The maximum number of authorized shares under the 1996 Non-Employee Directors’Stock Option Plan was 600,000. The exercise price of all options granted under the 1996 Non-Employee Directors’ Stock Option Plan shall be one hundred percent of the fair market value per share of the common shares on the date of grant. The maximum term of options granted under the 1996 Non-Employee Directors’ Stock Option Plan is 10 years. No stock option may be exercised during the first six months of its term except for certain conditions provided in the 1996 Non-Employee Directors’ Stock Option Plan. The right to acquire the common shares is not assignable except for under certain conditions stipulated in the 1996 Non-Employee Directors’ Stock Option Plan.
In April 2003, the Company issued options to certain directors and non-employee directors of the Company to purchase an aggregate of 372,500 shares of common stock of the Company at an exercise price of $1.61. The exercise prices of these options were equal to the fair market value at the time of grant. The options expired on March 31, 2013. No such options were exercised during the ten year term ended March 31, 2013.
In March 2004, the Company issued options to certain non-employee directors of the Company to purchase an aggregate of 40,000 shares of common stock of the Company at an exercise price of $6.12. The exercise prices of these options were equal to the fair market value at the time of grant. The options expired on March 25, 2014. No such options were exercised during the ten year term ended March 31, 2014.
In September 2004, the Company issued options to certain non-employee directors of the Company to purchase an aggregate of 40,000 shares of common stock of the Company at an exercise price of $6.20. The exercise prices of these options were equal to the fair market value at the time of grant. The options expired on September 12, 2014. No such options were exercised up to September 12, 2014.
In December 2005, the Company issued options to certain non-employee directors of the Company to purchase an aggregate of 30,000 shares of common stock of the Company at an exercise price of $4.50. The exercise prices of these options were equal to the fair market value at the time of grant. The options expired on December 4, 2015. No such options were exercised up to December 4, 2015.
On November 16, 2006, the Board of Directors of the Company voted to rescind the Company’s 1996 Non-Employee Directors’ Stock Option Plan (the “Non-Employee Directors’ Plan”). All options previously granted under the Non-Employee Directors’ Plan have expired pursuant to their terms of grant.
During the fiscal years ended March 31, 2016, 2017 and 2018, no shares or share options were granted under the 1996 Stock Option Plan.
Bonso Electronics International Inc.
Notes to Consolidated Financial Statements
(Expressed in United States Dollars)
14 | Stock option and bonus plans (Continued) |
(b)(a) | 2004 Stock Bonus Plan |
On September 7, 2004, the Company’s stockholders adopted the 2004 Stock Bonus Plan (the “Stock Bonus Plan”) which authorizes the issuance of up to five hundred thousand (500,000) shares of the Company’s common stock in the form of stock bonus.
The purpose of this Stock Bonus Plan is to (i) induce key employees to remain in the employment of the Company or of any subsidiary of the Company; (ii) encourage such employees to secure or increase their stock ownership in the Company; and (iii) reward employees, non-employee directors, advisors and consultants for services rendered or to be rendered to or for the benefit of the Company or any of its subsidiaries. The Company believes that the Stock Bonus Plan will promote continuity of management and increase incentive and personal interest in the welfare of the Company.
The Stock Bonus Plan is administered by a committee appointed by the Board of Directors which consists of at least two but not more than three members of the Board, one of whom shall be a non-employee of the Company. The existing Committee members are Mr. Anthony So and Mr. Woo Ping Fok. The Committee has the authority, in its sole discretion: (i) to determine the parties to receive bonus stock, the times when they shall receive such awards, the number of shares to be issued and the time, terms and conditions of the issuance of any such shares; (ii) to construe and interpret the terms of the Stock Bonus Plan; (iii) to establish, amend and rescind rules and regulations for the administration of the Stock Bonus Plan; and (iv) to make all other determinations necessary or advisable for administering the Stock Bonus Plan. As of March 31, 2021, no shares had been granted under the Stock Bonus Plan.
Bonso Electronics International Inc. Notes to Consolidated Financial Statements (Expressed in United States Dollars)
| 14 | Stock option and bonus plans (Continued) |
(c) | (b) | 2004 Stock Option Plan |
On March 23, 2004, the Company’s stockholders adopted the 2004 Stock Option Plan (the “2004 Plan”) which provides for the grant of up to six hundred thousand (600,000) shares of the Company’s common stock in the form of stock options, subject to certain adjustments as described in the 2004 Plan. At the Annual Meeting of Stockholders held on March 20, 2015, the stockholders approved an amendment to the 2004 Plan to increase the number of shares that could be granted from 600,000 to 850,000.
The purpose of the 2004 Plan is to secure key employees to remain in the employment of the Company and to encourage such employees to secure or increase on reasonable terms their common stock ownership in the Company. The Company believes that the 2004 Plan promotes continuity of management and increased incentive and personal interest in the welfare of the Company.
The 2004 Plan is administered by a committee appointed by the Board of Directors which consists of at least two but not more than three members of the Board, one of whom shall be a non-employee of the Company. The current committee members are Mr. Anthony So and Mr. Woo Ping Fok. The committee determines the specific terms of the options granted, including the employees to be granted options under the plan, the number of shares subject to each option grant, the exercise price of each option and the option period, subject to the requirement that no option may be exercisable more than 10 years after the date of grant. The exercise price of an option may be less than the fair market value of the underlying shares of common stock. No options granted under the plan will be transferable by the optionee other than by will or the laws of descent and distribution, and each option will be exercisable during the lifetime of the optionee only by the optionee.
The exercise price of an option granted pursuant to the 2004 Plan may be paid in cash, by the surrender of options, in common stock, in other property, including a promissory note from the optionee, or by a combination of the above, at the discretion of the committee.
On As of July 15, 2015, 850,000 options, all with an exercise price of $1.50 per share, had been granted to officers and directors of the Company under the 2004 Plan, all of which remainedPlan. Options for 425,000 shares were exercised during the fiscal year ended March 31, 2020. The options for 425,000 shares that were outstanding as of March 31, 2018. The options for 425,000 shares will expire on March 31, 2020, and options for 425,000 shares2021 will expire on March 31, 2025. Options granted under the 2004 Plan vest immediately and may contain such other terms as the Board of Directors or a committee appointed to administer the plan may determine. Bonso Electronics International Inc. Notes to Consolidated Financial Statements (Expressed in United States Dollars)
| 14 | Stock option and bonus plans (Continued) |
(d) | (c) | A summary of the stock options activity is as follows: |
| | | | | | | Number of options | | Weighted
average
exercise price | | | | | | | | | Outstanding at March 31, 2019 | | | | 850,000 | | | $ | 1.50 | | | | Exercised | | | | (425,000 | ) | | $ | 1.50 | | | | | | | | | | | | | | | | Outstanding at March 31, 2020 | | | | 425,000 | | | $ | 1.50 | | | | | | | | | | | | | | | | Outstanding at March 31, 2021 | | | | 425,000 | | | $ | 1.50 | |
| | | | | | | | Number | | | Weighted average exercise | | | | | of options | | | price | | | | | | | | | | | Balance, March 31, 2016, 2017 and 2018 | | | 850,000 | | | $ | 1.50 | | | | | | | | | | | |
Mr. Anthony So exercised his 150,000 options on March 9, 2020 on a cash basis. Mr. Kim Wah Chung exercised his 40,000 options on March 9, 2020 on a cash basis. Mr. Woo-Ping Fok exercised his 25,000 options on March 9, 2020 on a cash basis. Mr. Henry Schlueter exercised his 25,000 options on a cashless basis on March 27, 2020, and received 9,567 shares of common stock and surrendered options to acquire 15,433 shares in connection with his cashless exercise. Mr. Andrew So exercised his 125,000 options on a cashless basis on March 9, 2020, and received 40,540 shares of common stock and surrendered options to acquire 84,460 shares in connection with his cashless exercise. Mr. Albert So exercised his 60,000 options on a cashless basis on March 9, 2020, and received 19,459 shares of common stock and surrendered options to acquire 40,541 shares in connection with his cashless exercise. All options were exercised with an exercise price of $1.50. During the fiscal year ended March 31, 2020, option holders exercised 425,000 options in total and received 284,566 shares of common stock and surrendered options to acquire 140,434 shares in connection with the cashless exercises. (e) | (d) | The following table summarizes information about all stock options of the Company outstanding as at March 31, 2018:2021: |
| | | Number | | Weighted average | | Exercisable | | Weighted average | | outstanding at | | remaining life | | shares at | | exercise price | | March 31, 2021 | | (years) | | March 31, 2021 | | | | | | | | | | | | | | | | | | $ | 1.50 | | | | 425,000 | | | | 4.0 | | | | 425,000 | |
| | | | Number | | | Weighted average | | | Exercisable | | | Weighted average | | | outstanding at | | | remaining life | | | shares at | | | exercise price | | | March 31, 2018 | | | (years) | | | March 31, 2018 | | | | | | | | | | | | | | | $ | 1.50 | | | | 850,000 | | | | 4.5 | | | | 850,000 | | | | | | | | | | | | | | | | | |
The intrinsic value of options outstanding and exercisable was $1.63approximately $2,253,000 on March 31, 2018.2021. The intrinsic value represents the pre-tax intrinsic value (the difference between the closing stock price of the Company’s common stock on the balance sheet date and the exercise price for both the outstanding and exercisable options) that would have been received by the option holders if all options had been exercised on March 31, 2018.
2021.New shares will be issued by the Company upon future exercise of stock options. Bonso Electronics International Inc. Notes to Consolidated Financial Statements (Expressed in United States Dollars)
14 | Stock option and bonus plans (Continued) |
(f) | Stock-based compensation expense is recognized on a straight-line basis over the respective vesting periods, or at the time of option granting if there are no vesting periods. The fair value of the options granted was estimated on the date of granting using the Black-Scholes option-pricing model with the following assumptions used for grants during the applicable periods: |
| | | For the Fiscal Year Ended March 31, | | | | 2016 | 2017 | 2018 | | | | | | | | | Risk-free interest rate (1) | 1.63% to 2.36% | N/A | N/A | | | Expected life (years) (2) | 4.71 to 9.71 | N/A | N/A | | | Expected dividend yield (3) | 0% | N/A | N/A | | | Volatility (4) | 73.63% | N/A | N/A | | | Fair value of options at grant date per share | $0.81 to $1.08 | N/A | N/A | | | | | | |
(1) Risk-free interest rate
Risk-free interest rate for periods within the contractual life of the option is based upon the interest rate on U.S. Treasury zero-coupon bonds issued with remaining terms similar to the expected term of the options granted.
(2) Expected life (years)
Assumption of the expected term was based on the vesting and contractual terms and employee demographics.
(3) Expected dividend yield
The dividend yield was estimated by the Company based on its expected dividend policy over the expected term of the options.
(4) Volatility
The volatility assumption was estimated based on historical volatility of the Company’s share price applying the guidance provided by ASC 718.
The Company recorded the related compensation expense of approximately $801,000, $nil and $nil in selling, general and administrative expenses during the fiscal years ended March 31, 2016, 2017 and 2018.
Bonso Electronics International Inc.
Notes to Consolidated Financial Statements
(Expressed in United States Dollars)
| 15 | Related party transactions |
| (a) | The Company paid emoluments, commissions and/or consultancy fees to its directors and officers as follows: |
| Year ended | | Mr. Anthony | | Mr. Kim Wah | | Mr. Woo-Ping | | Mr. Andrew | | March 31, | | So | | Chung | | Fok | | So | | | Director | | Director | | Director | | Director and Chief
Executive Officer | | | | | $ in thousands | | $ in thousands | | $ in thousands | | $ in thousands | | | | | | | | | | | | | 2019 | | | $643 (i), (iii) | | $171 (iii) | | Nil | | $249 (iii) | | 2020 | | | $643 (i), (iii) | | $171 (iii) | | Nil | | $265 (iii) | | 2021 | | | $643 (i), (iii) | | $171 (iii) | | $1(iv) | | $370 (iii) |
| Year ended | Mr. Anthony | Mr. Kim Wah | Mr. Woo-Ping | | Mr. Andrew | | | March 31, | So | Chung | Fok | | So | | Director, Chief Executive Officer | Director | Director | | Director and Chief
Operating Officer | | | $ in thousands | $ in thousands | $ in thousands | | $ in thousands | | | | | | | | | | | 2016 | $857 (i), (iii) | $170 (iii) | Nil | | | $249 | | | 2017 | $643 (i), (iii) | $171 (iii) | Nil | | | $249 | | | 2018 | $643 (i), (iii) | $170 (iii) | Nil | | $259 (iii) | |
| | | Mr. Henry | | Mr. Albert | | | | Schlueter | | So | | | | | | | Director and Assistant Secretary | | | Director, Chief Financial Officer and Secretary | | | | | | | $ in thousands | | | $ in thousands | | | | | | | | | | | | | 2019 | | | $ | 60 | (ii) | | $152 (iii) | | | 2020 | | | $ | 60 | (ii) | | $162 (iii) | | | 2021 | | | $ | 60 | (ii) | | $232 (iii) |
| Mr. Henry | | Mr. Albert | | | Schlueter | | So | | Director and Assistant Secretary | | Director, Chief Financial Officer and Secretary | | | $ in thousands | | $ in thousands | | | | | | | | | 2016 | $60 (ii) | | $181(iii) | | | 2017 | $62 (ii) | | | $152 | | | 2018 | $60 (ii) | | $162 (iii) | |
The emoluments paid to the Company’s directors and officers were included in the salaries and related costs, while the consultancy fees or professional fees paid to Schlueter & Associates, P.C., were included in the administration and general expenses.
| (i) | Apart from the emoluments paid by the Company as shown above, one of the properties of the Company in Hong Kong is also provided to Mr. Anthony So for his accommodation. |
| (ii) | The amounts for the years ended March 31, 2016, 20172019, 2020 and 20182021 represented professional fees paid to Schlueter & Associates, P.C., the Company’s SEC counsel, in which Mr. Henry Schlueter is one of the principals. |
| (iii) | The amount for the year ended March 31, 2016, included unpaid vacation payments of approximately $57,000, $10,000 and $12,000 for Mr. Anthony So, Mr. Kim Wah Chung and Mr. Albert So, respectively. The amount for the year ended March 31, 2017,2019, included unpaid vacation payments of approximately $43,000 and $11,000 for Mr. Anthony So and Mr. Kim Wah Chung, respectively. The amount for the year ended March 31, 2018,2020, included unpaid vacation payments of approximately $43,000, $10,000, $10,000$11,000, $16,000 and $10,000 for Mr. Anthony So, Mr. Kim Wah Chung, Mr. Andrew So and Mr. Albert So, respectively. The amount for the year ended March 31, 2021, included unpaid vacation payments of approximately $43,000, $11,000, $14,000 and $11,000 for Mr. Anthony So, Mr. Kim Wah Chung, Mr. Andrew So and Mr. Albert So, respectively. |
| (iv) | The amounts for the year ended March 31, 2021 represented professional fees paid to C. K. Mok & Co. For professional services provided by Mr. Fok. |
Bonso Electronics International Inc. Notes to Consolidated Financial Statements (Expressed in United States Dollars)
| 15 | Related party transactions (Continued) |
During the fiscal year ended March 31, 2015, one of the subsidiaries in Hong Kong borrowed an interest-free loan of approximately $538,000 from a director and stockholder, Mr. Anthony So,, to provide working capital. This loan is to be repaid in 48 equal installments. As ofDuring the fiscal year ended March 31, 2018,2019, the Companysubsidiary had repaid a total of approximately $471,000 to Mr. Anthony So and the balanceapproximately $67,000. This loan had been fully repaid as of loan due to Mr. Anthony so was approximately $67,000.
March 31, 2019.During the fiscal year ended March 31, 2015, one of the subsidiaries in Shenzhen, PRC entered into a rental agreement with a director and stockholder, Mr. Anthony So, for three apartment units located in Shenzhen, PRC for office usage. Mr. Anthony So is the sole owner of these three apartment units. The monthly rental payment was approximately $2,000. Starting from August 1, 2016, rental of two of the apartment units was no longer required and the rental agreement was terminated, and a new rental agreement for one apartment unit for staff quarters was in place, for a monthly rental payment of $270. The total rental payment paid to Mr. Anthony So during the fiscal year ended March 31, 20182021 was approximately $3,000 (2017: $9,000; 2016: $24,000)$4,000 (2020: $3,000; 2019: $3,000).
During the fiscal year ended March 31, 2015, one of the subsidiaries in Xinxing, PRC entered into a rental agreement with a director and stockholder, Mr. Andrew So, for an apartment unit located in Xinxing, PRC for staff quarters. Mr. Andrew So is the sole owner of this apartment unit. The monthly rental payment iswas approximately $450,$450. Starting from December 1, 2018, the monthly rental payment was approximately $600. The agreement ended on July 31, 2020, and the total rental payment paid to Mr. Andrew So during the fiscal year ended March 31, 20182021 was approximately $5,000 (2017: $5,000; 2016: $5,000)$2,000 (2020: $7,000; 2019: $6,000). During the fiscal year ended March 31, 2016, one of the subsidiaries in Shenzhen, PRC entered into a rental agreement with a director and stockholder, Mr. Anthony So, for one apartment unit located in Shenzhen, PRC for staff quarters. Mr. Anthony So is the sole owner of this apartment unit. Starting from April 1, 2017, rental of this apartment unit was no longer required and the rental agreement was terminated. The monthly rental payment was approximately $330, and the total rental payment paid to Mr. Anthony So during the fiscal year ended March 31, 2018 was $nil (2017: $4,000; 2016: $2,000) for this unit.
In February 2017, a non-employee director of the Company, Henry F. Schlueter, sold 24,000 shares of the Company’s common stock to the Company at a purchase price of $2.39 per share, pursuant to the Company repurchase program. In February 2018, a non-employee director of the Company, Henry F. Schlueter, sold 10,000 shares of the Company’s common stock to the Company at a purchase price of $3.48 per share, pursuant to the Company repurchase program.
Bonso Electronics International Inc. Notes to Consolidated Financial Statements (Expressed in United States Dollars)
| 16 | Concentrations and credit risk |
The Company operates principally in the PRC (including Hong Kong) and grants credit to its customers in this geographic region. Although the PRC is economically stable, it is always possible that unanticipated events in foreign countries could disrupt the Company’s operations.
Financial instruments that potentially subject the Company to a concentration of credit risk consist of cash and trade receivables. The Company does not require collateral to support financial instruments that are subject to credit risk.
AtOn March 31, 20172020 and 2018,2021, the Company had credit risk exposure of uninsured cash and deposits with maturities of less than one year in banks of approximately $3,745,000$9,111,000 and $8,751,000,$10,060,000, respectively.
A substantial portion, 56%37%, 45%27% and 31%23% of revenue, was generated from one customer for the years ended March 31, 2016, 20172019, 2020 and 2018,2021, respectively.
The net sales to customersrevenue representing at least 10% of total net total salesrevenue are as follows: | | | Year Ended March 31, | | | | 2019 | | 2020 | | 2021 | | | | $ in thousands | | % | | $ in thousands | | % | | $ in thousands | | % | | | | | | | | | | | | | | | | Customer A | | | 3,715 | | | | 37 | | | | 3,573 | | | | 27 | | | | 3,633 | | | | 23 | | | Customer C | | | 1,225 | | | | 12 | | | | 1,239 | | | | 9 | | | | 1,386 | | | | 9 | | | Customer B | | | 1,027 | | | | 10 | | | | 313 | | | | 2 | | | | 619 | | | | 4 | | | Customer E # | | | 996 | | | | 10 | | | | — | | | | — | | | | — | | | | — | | | | | | | | | | | | | | | | | | | | | | | | | | | | | | | | 6,963 | | | | 69 | | | | 5,125 | | | | 38 | | | | 5,638 | | | | 36 | |
| | | Year Ended March 31, | | | | | 2016 | | | 2017 | | | 2018 | | | | | $ in thousands | | | % | | | $ in thousands | | | % | | | $ in thousands | | | % | | | | | | | | | | | | | | | | | | | | | | | Customer A | | | 3,874 | | | | 15 | | | | 2,729 | | | | 14 | | | | 3,579 | | | | 31 | | | Customer B | | | 1,738 | | | | 7 | | | | 1,563 | | | | 8 | | | | 1,662 | | | | 14 | | | Customer C | | | 1,969 | | | | 8 | | | | 2,435 | | | | 13 | | | | 1,599 | | | | 14 | | | Customer D * | | | 14,145 | | | | 56 | | | | 8,472 | | | | 45 | | | | 1,115 | | | | 10 | | | | | | | | | | | | | | | | | | | | | | | | | | | | | | | | 21,726 | | | | 86 | | | | 15,199 | | | | 80 | | | | 7,955 | | | | 69 | |
* That# Rental income from this customer has stopped purchasing from usended as of June 2017.
February 2019.The following customers had balances of at least 10% of the total trade receivables at the respective balance sheet dates set forth below: | | | March 31, | | | | 2020 | | 2021 | | | | $ in thousands | | % | | $ in thousands | | % | | | | | | | | | | | | Customer C | | | 241 | | | | 30 | | | | 343 | | | | 27 | | | Customer B | | | 133 | | | | 16 | | | | 160 | | | | 12 | | | Customer A | | | 99 | | | | 12 | | | | 298 | | | | 23 | | | Customer F | | | 95 | | | | 12 | | | | 197 | | | | 15 | | | | | | | | | | | | | | | | | | | | | | | | | | | | 70 | | | | | | | | 77 | |
| | | March 31, | | | | | 2017 | | | 2018 | | | | | $ in thousands | | | % | | | $ in thousands | | | % | | | | | | | | | | | | | | | | | Customer A | | | 328 | | | | 28 | | | | 234 | | | | 30 | | | Customer C | | | 455 | | | | 39 | | | | 200 | | | | 25 | | | Customer E | | | - | | | | - | | | | 113 | | | | 14 | | | Customer B | | | 162 | | | | 14 | | | | - | | | | - | | | | | | | | | | | | | | | | | | | | | | | | | | | | 81 | | | | | | | | 69 | | | | | | | | | | | | | | | | | | | |
At March 31, 20172020 and 2018,2021, these customers accounted for 81%70% and 69%77%, respectively, of net trade receivables. The trade receivables have repayment terms of not more than twelve months.
Bonso Electronics International Inc. Notes to Consolidated Financial Statements (Expressed in United States Dollars)
| 17 | Employee retirement benefits and severance payment allowance |
| (a) | With effect from January 1, 1988, BEL, a wholly-owned foreign subsidiary of the Company in Hong Kong, implemented a defined contribution plan (the “Plan”) with a major international insurance company to provide life insurance and retirement benefits for its employees. All permanent full time employees who joined BEL before December 2000, excluding factory workers, are eligible to join the Plan. Each eligible employee that chooses to participate in the Plan is required to contribute 5% of their monthly salary, while BEL is required to contribute from 5% to 10% depending on the eligible employee’s salary and number of years in service. |
The Mandatory Provident Fund (the “MPF”) was introduced by the Hong Kong Government and commenced in December 2000. BEL joined the MPF by implementing a plan with a major international insurance company. All permanent Hong Kong full time employees who joined BEL on or after December 2000, excluding factory workers, must join the MPF, except for those who joined the Plan before December 2000. Both the employee’s and employer’s contributions to the MPF are 5% of the eligible employee’s monthly salary and are subject to a maximum mandatory contribution of HK$1,000 (US$128) per month. Both the maximum mandatory employee’s and employer’s contributions per month increased to HK$1,250 (US$160) since June 1, 2012, and then later to HK$1,500 (US$192) since June 1, 2014.
Pursuant to the relevant PRC regulations, the Company is required to make contributions for each employee, at rates based upon the employee’s standard salary base as determined by the local Social Security Bureau, to a defined contribution retirement scheme organized by the local Social Security Bureau in respect of the retirement benefits for the Company’s employees in the PRC.
| (b) | The contributions to each of the above schemes are recognized as employee benefit expenses when they are due and are charged to the consolidated statement of operations. The Company’s total contributions to the above schemes for the years ended March 31, 2016, 20172019, 2020 and 20182021 amounted to $293,000, $267,000$264,000, $258,000 and $255,000,$149,000, respectively. The Company has no other obligation to make payments in respect of retirement benefits of the employees. |
| (c) | According to the New Labor Law in the PRC which was effective on January 1, 2008, a company is required to provide one month’s salary for each year of service as a severance payment. The Company recognized a total provision of $396,000$568,000 as of March 31, 20182021 for severance payments for staff in the PRC (2017: $297,000, 2016: $317,000)(2020: $444,000, 2019: $437,000). The accrued severance payment allowance is reviewed every year. |
Bonso Electronics International Inc. Notes to Consolidated Financial Statements (Expressed in United States Dollars)
Basic net earnings per share is computed by dividing net income available to common shareholders by the weighted average number of common shares outstanding during the period. Diluted net earnings per share gives effect to all dilutive potential common shares outstanding during the period. The weighted average number of common shares outstanding is adjusted to include the number of additional common shares that would have been outstanding if the dilutive potential common shares had been issued. In computing the dilutive effect of potential common shares, the average stock price for the period is used in determining the number of treasury shares assumed to be purchased with the proceeds from the exercise of options. | | | Year Ended March 31, | | | | 2019 | | 2020 | | 2021 | | | | | | | | | | (Loss) / income available to common stockholders ($ in thousands) | | $ | (463 | ) | | $ | 398 | | | $ | 1,771 | | | | | | | | | | | | | | | | | Basic weighted average common shares outstanding | | | 4,703,224 | | | | 4,646,966 | | | | 4,880,422 | | | | | | | | | | | | | | | | | Basic net (loss) / earnings per share | | $ | (0.10 | ) | | $ | 0.09 | | | $ | 0.36 | | | | | | | | | | | | | | | | | | | | | | | | | | | | | | | Basic weighted average common shares outstanding | | | 4,703,224 | | | | 4,646,966 | | | | 4,880,422 | | | Effect of dilutive securities – Options | | | — | | | | 169,770 | | | | 264,838 | | | | | | | | | | | | | | | | | Diluted weighted average common and potential common shares outstanding | | | 4,703,224 | | | | 4,816,736 | | | | 5,145,260 | | | | | | | | | | | | | | | | | Diluted net (loss) / earnings per share | | $ | (0.10 | ) | | $ | 0.08 | | | $ | 0.34 | |
| | | Year Ended March 31, | | | | | 2016 | | | 2017 | | | 2018 | | | | | | | | | | | | | | Income available to common stockholders ($ in thousands) | | $ | 2,871 | | | $ | 2,795 | | | $ | 4 | | | | | | | | | | | | | | | | | Basic weighted average common shares outstanding | | | 5,173,431 | | | | 5,143,648 | | | | 4,910,357 | | | | | | | | | | | | | | | | | Basic net earnings per share | | $ | 0.55 | | | $ | 0.54 | | | $ | 0.00 | | | | | | | | | | | | | | | | | | | | | | | | | | | | | | | Basic weighted average common shares outstanding | | | 5,173,431 | | | | 5,143,648 | | | | 4,910,357 | | | Effect of dilutive securities – Options | | | - | | | | 172,745 | | | | 380,547 | | | | | | | | | | | | | | | | | Diluted weighted average common and potential common shares outstanding | | | 5,173,431 | | | | 5,316,393 | | | | 5,290,904 | | | | | | | | | | | | | | | | | Diluted net earnings per share | | $ | 0.55 | | | $ | 0.53 | | | $ | 0.00 | | | | | | | | | | | | | | | |
Bonso Electronics International Inc. Notes to Consolidated Financial Statements (Expressed in United States Dollars)
| 19 | Business segment information |
| (a) | The Company has four business segments, Scales, Pet Electronics Products, Rental and Management and Others for the fiscal years ended March 31, 20172020 and 2018.2021. The Chief Operating Decision Maker, identified as the Chief Executive Officer and Chief Financial Officer, reviews these segment results when making decisions about allocating revenues and assessing the performance of the Company. |
Scales operations principally involve production and marketing of sensor-based scales products. These include bathroom, kitchen, office, jewelry, laboratory, postal and industrial scales that are used in consumer, commercial and industrial applications. Revenue from scale products was 68% (2017: 83%42% (2020: 45%) of overall revenue of the Company for the fiscal year ended March 31, 2018,2021, and the Company expects that the revenue will decreasecontinue to contribute a similar level of revenue for the next 12 months as onemonths. The “Others” segment is a residual, which principally includes the activities of our major customers has discontinued purchasing from us effective June 2017. (i) tooling and mould charges for scales and pet electronics products, and (ii) sales of scrap materials.
Pet Electronics Products principally involve development and production of pet-related electronics products that are used in consumer applications. Revenue from pet electronics products was 16% (2017: 9%51% (2020: 48%) of overall revenue of the Company for the fiscal year ended March 31, 2018,2021, and the Company expects that the revenue from pet electronics products will continue to contribute a similar level of revenue for the next 12 months.
Rental and Management involve leasing out part of our factories and machinery to third parties. The management decided to identify and expand the rental and management segment during the fiscal year ended March 31, 2018 with the signing of an agreement with Fangda, a property developer in Shenzhen, to cooperate in reconstructing and redeveloping the Shenzhen factory to generate more rental revenue in the future. Revenue from rental and management was 16% (2017: 8%7% (2020: 7%) of overall revenue of the Company for the fiscal year ended March 31, 2018, and2021. The Shenzhen factory was rented to a third party with a lease term from August 1, 2013 to August 1, 2019; however, the rent terminated as at January 31, 2019. The Company expects that the revenue from rental and management will increasecontinue to contribute a similar level of revenue for the next 12 months with additional revenue from leasing out two new factory buildings in our Xinxing facility.
The “Others” segment is a residual, which principally includes the activities of (i) tooling and mould charges for scales and pet electronics products, and (ii) sales of scrap materials.
The segment information in the years ended March 31, 2016 and 2017 have been restated in order to conform with the change in segment reporting in the year ended March 31, 2018.
months.The following table sets forth the percentage of net sales for each of the product lines mentioned above for the fiscal years ended March 31, 2016, 2017,2019, 2020, and 2018: 2021:| | | Year ended March 31, | | Product Line | | 2019 | | 2020 | | 2021 | | Scales and Others | | | 67 | % | | | 45 | % | | | 42 | % | | Pet Electronics Products | | | 14 | % | | | 48 | % | | | 51 | % | | Rental and Management | | | 19 | % | | | 7 | % | | | 7 | % | | Total | | | 100 | % | | | 100 | % | | | 100 | % |
| | | Year ended March 31, | | | Product Line | | 2016 | | | 2017 | | | 2018 | | | Scales and Others | | | 88 | % | | | 83 | % | | | 68 | % | | Pet Electronics Products | | | 6 | % | | | 9 | % | | | 16 | % | | Rental and Management | | | 6 | % | | | 8 | % | | | 16 | % | | Total | | | 100 | % | | | 100 | % | | | 100 | % |
The accounting policies of the Company’s reportable segments are the same as those described in the description of business and significant accounting policies. Bonso Electronics International Inc. Notes to Consolidated Financial Statements (Expressed in United States Dollars)
| 19 | Business segment information (Continued) |
| (a) | (Continued)Summarized financial information by business segment as of March 31, 2019, 2020 and 2021 is as follows: |
| | | Net revenue | | Cost of revenue | | Operating income / (loss) | | Identifiable assets as of March 31, | | Depreciation and amortization | | Capital expenditure | | | | $ in thousands | | $ in thousands | | $ in thousands | | $ in thousands | | $ in thousands | | $ in thousands | | | | | | | | | | | | | | | | 2019 | | | | | | | | | | | | | | Scales and Others | | | 6,686 | | | | 4,340 | | | | (74 | ) | | | 8,244 | | | | 540 | | | | 236 | | | Pet Electronics Products | | | 1,410 | | | | 915 | | | | (16 | ) | | | 1,739 | | | | 115 | | | | 67 | | | Rental and Management | | | 1,896 | | | | 780 | | | | (450 | ) | | | 4,716 | | | | 479 | | | | 289 | | | | | | | | | | | | | | | | | | | | | | | | | | | | | Total operating segments | | | 9,992 | | | | 6,035 | | | | (540 | ) | | | 14,699 | | | | 1,134 | | | | 592 | | | Corporate | | | — | | | | — | | | | — | | | | 7,787 | | | | — | | | | — | | | | | | | | | | | | | | | | | | | | | | | | | | | | | Group | | | 9,992 | | | | 6,035 | | | | (540 | ) | | | 22,486 | | | | 1,134 | | | | 592 | |
| | | | | | | | | | | | | | | 2020 | | | | | | | | | | | | | | Scales and Others | | | 5,936 | | | | 3,194 | | | | 548 | | | | 5,026 | | | | 325 | | | | 543 | | | Pet Electronics Products | | | 6,259 | | | | 1,757 | | | | 767 | | | | 5,298 | | | | 343 | | | | 572 | | | Rental and Management | | | 901 | | | | 739 | | | | (953 | ) | | | 4,026 | | | | 437 | | | | 9 | | | | | | | | | | | | | | | | | | | | | | | | | | | | | Total operating segments | | | 13,096 | | | | 5,690 | | | | 362 | | | | 14,350 | | | | 1,105 | | | | 1,124 | | | Corporate | | | — | | | | — | | | | — | | | | 9,851 | | | | — | | | | — | | | | | | | | | | | | | | | | | | | | | | | | | | | | | Group | | | 13,096 | | | | 5,690 | | | | 362 | | | | 24,201 | | | | 1,105 | | | | 1,124 | | | | | | | | | | | | | | | | | | | | | | | | | | | | | 2021 | | | | | | | | | | | | | | | | | | | | | | | | | | Scales and Others | | | 6,555 | | | | 2,283 | | | | 1,010 | | | | 4,591 | | | | 285 | | | | 142 | | | Pet Electronics Products | | | 8,002 | | | | 2,834 | | | | 1,118 | | | | 5,700 | | | | 354 | | | | 176 | | | Rental and Management | | | 1,033 | | | | 823 | | | | (922 | ) | | | 4,096 | | | | 442 | | | | 382 | | | | | | | | | | | | | | | | | | | | | | | | | | | | | Total operating segments | | | 15,590 | | | | 5,940 | | | | 1,206 | | | | 14,387 | | | | 1,081 | | | | 700 | | | Corporate | | | — | | | | — | | | | — | | | | 11,255 | | | | — | | | | — | | | | | | | | | | | | | | | | | | | | | | | | | | | | | Group | | | 15,590 | | | | 5,940 | | | | 1,206 | | | | 25,642 | | | | 1,081 | | | | 700 | | | | | | | | | | | | | | | | | | | | | | | | | | | |
Summarized financial information by business segment as of March 31, 2016, 2017 and 2018 is as follows:
| | | Net sales | | | Operating income / (loss) | | | Identifiable assets as of March 31 | | | Depreciation and amortization | | | Capital expenditure | | | | | $ in thousands | | | $ in thousands | | | $ in thousands | | | $ in thousands | | | $ in thousands | | | | | | | | | | | | | | | | | | | 2016 | | | | | | | | | | | | | | | | | | | | | | | | | | | | | | | | | | Scales & Others | | | 22,378 | | | | 2,922 | | | | 13,311 | | | | 614 | | | | 880 | | | Pet Electronics Products | | | 1,514 | | | | 197 | | | | 901 | | | | 41 | | | | 59 | | | Rental and Management | | | 1,478 | | | | 183 | | | | 4,714 | | | | 680 | | | | - | | | | | | | | | | | | | | | | | | | | | | | | | Total operating segments | | | 25,370 | | | | 3,302 | | | | 18,926 | | | | 1,335 | | | | 939 | | | Corporate | | | - | | | | - | | | | 4,095 | | | | - | | | | - | | | | | | | | | | | | | | | | | | | | | | | | | Group | | | 25,370 | | | | 3,302 | | | | 23,021 | | | | 1,335 | | | | 939 | | | | | | | | | | | | | | | | | | | | | | | | | | | | | | | | | | | | | | | | | | | | | | 2017 | | | | | | | | | | | | | | | | | | | | | | | | | | | | | | | | | | | | | | | | | | | | Scales & Others | | | 15,814 | | | | 2,916 | | | | 10,355 | | | | 515 | | | | 262 | | | Pet Electronics Products | | | 1,662 | | | | 307 | | | | 1,089 | | | | 54 | | | | 27 | | | Rental and Management | | | 1,476 | | | | (57 | ) | | | 5,465 | | | | 748 | | | | - | | | | | | | | | | | | | | | | | | | | | | | | | Total operating segments | | | 18,952 | | | | 3,166 | | | | 16,909 | | | | 1,317 | | | | 289 | | | Corporate | | | - | | | | - | | | | 4,057 | | | | - | | | | - | | | | | | | | | | | | | | | | | | | | | | | | | Group | | | 18,952 | | | | 3,166 | | | | 20,966 | | | | 1,317 | | | | 289 | |
2018 | | | | | | | | | | | | | | | | | | | | | | | | | | | | | | | | | | Scales & Others | | | 7,862 | | | | 208 | | | | 8,211 | | | | 479 | | | | 79 | | | Pet Electronics Products | | | 1,861 | | | | 49 | | | | 1,944 | | | | 113 | | | | 19 | | | Rental and Management | | | 1,800 | | | | (19 | ) | | | 5,622 | | | | 784 | | | | 266 | | | | | | | | | | | | | | | | | | | | | | | | | Total operating segments | | | 11,523 | | | | 238 | | | | 15,777 | | | | 1,376 | | | | 364 | | | Corporate | | | - | | | | - | | | | 8,978 | | | | - | | | | - | | | | | | | | | | | | | | | | | | | | | | | | | Group | | | 11,523 | | | | 238 | | | | 24,755 | | | | 1,376 | | | | 364 | | | | | | | | | | | | | | | | | | | | | | | |
Operating income by segment equals total operating revenues less expenses directly attributable to the generation of the segment’s operating revenues. Identifiable assets by segment are those assets that are used in the operation of that segment. Corporate assets consist principally of cash and cash equivalents, investment in life insurance contracts, intangible assets and other identifiable assets not related specifically to individual segments. Bonso Electronics International Inc. Notes to Consolidated Financial Statements (Expressed in United States Dollars)
| 19 | Business segment information (Continued) |
| (b) | The Company primarily operates in Hong Kong and the PRC. The manufacture of components and their assembly into finished products and research and development areis carried out in the PRC. As the operations are integrated, it is not practicable to distinguish the net income derived among the activities in Hong Kong and the PRC. |
Total property,Property, plant and equipment, net by geographical areas are as follows: | | | March 31, | | March 31, | | | | 2020 | | 2021 | | | | | $ in thousands | | | | $ in thousands | | | Hong Kong | | | 797 | | | | 750 | | | The PRC | | | 8,642 | | | | 8,750 | | | | | | | | | | | | | Property, plant and equipment, net | | | 9,439 | | | | 9,500 | | | | | | | | | | | |
| | | March 31, | | | March 31, | | | | | 2017 | | | 2018 | | | | | $ in thousands | | | $ in thousands | | | Hong Kong | | | 1,126 | | | | 1,092 | | | The PRC | | | 9,168 | | | | 9,342 | | | | | | | | | | | | | Total property, plant and equipment | | | 10,294 | | | | 10,434 | | | | | | | | | | | |
| (c) | The following is a summary of net revenue by geographical areas constituting 10% or more of total revenue of the Company for the years ended March 31, 2016, 20172019, 2020 and 2018:2021: |
| | | Year ended March 31, | | | | 2019 | | 2020 | | 2021 | | | | $ in thousands | | % | | $ in thousands | | % | | $ in thousands | | % | | | | | | | | | | | | | | | | United States | | | 3,184 | | | | 32 | | | | 7,453 | | | | 57 | | | | 9,732 | | | | 62 | | | Germany | | | 3,760 | | | | 38 | | | | 3,613 | | | | 28 | | | | 3,666 | | | | 24 | | | The PRC | | | 2,265 | | | | 23 | | | | 1,288 | | | | 10 | | | | 1,403 | | | | 9 | | | | | | | | | | | | | | | | | | | | | | | | | | | | | | | | 9,209 | | | | 93 | | | | 12,354 | | | | 95 | | | | 14,801 | | | | 95 | |
| | | Year ended March 31, | | | | | 2016 | | | 2017 | | | 2018 | | | | | $ in thousands | | | % | | | $ in thousands | | | % | | | $ in thousands | | | % | | | | | | | | | | | | | | | | | | | | | | | United States | | | 14,062 | | | | 55 | | | | 10,356 | | | | 55 | | | | 4,807 | | | | 42 | | | Germany | | | 4,568 | | | | 18 | | | | 2,797 | | | | 15 | | | | 3,621 | | | | 31 | | | The PRC | | | 2,737 | | | | 11 | | | | 1,590 | | | | 8 | | | | 2,054 | | | | 18 | | | Netherlands | | | 1,901 | | | | 8 | | | | 2,299 | | | | 12 | | | | 87 | | | | 1 | | | | | | | | | | | | | | | | | | | | | | | | | | | | | | | | 23,268 | | | | 92 | | | | 17,042 | | | | 90 | | | | 10,569 | | | | 92 | | | | | | | | | | | | | | | | | | | | | | | | | | | |
Bonso Electronics International Inc. Notes to Consolidated Financial Statements (Expressed in United States Dollars)
| 19 | Business segment information (Continued) |
| (d) | The following is a summary of net revenue by customers constituting 10% or more of total revenue of the Company for the years ended March 31, 2016, 20172019, 2020 and 2018:2021: |
| | | | | Year Ended March 31, | | | | | | 2019 | | 2020 | | 2021 | | Customers | | Segment | | $ in thousands | | % | | $ in thousands | | % | | $ in thousands | | % | | Customer A | | Scales | | | 3,715 | | | | 37 | | | | 3,573 | | | | 27 | | | | 3,633 | | | | 23 | | | Customer C | | Scales | | | 1,225 | | | | 12 | | | | 1,239 | | | | 9 | | | | 1,386 | | | | 9 | | | Customer B | | Scales and Pet Electronics Products | | | 1,027 | | | | 10 | | | | 313 | | | | 2 | | | | 619 | | | | 4 | | | Customer E | | Rental and Management | | | 996 | | | | 10 | | | | — | | | | — | | | | — | | | | — | | | | | | | | | | | | | | | | | | | | | | | | | | | | | | | | | | | | 6,963 | | | | 69 | | | | 5,125 | | | | 38 | | | | 5,638 | | | | 36 | |
| | | | Year Ended March 31, | | | | | | 2016 | | | 2017 | | | 2018 | | | Customers | Segment | | $ in thousands | | | % | | | $ in thousands | | | % | | | $ in thousands | | | % | | | | | | | | | | | | | | | | | | | | | | | | Customer A | Scales | | | 3,874 | | | | 15 | | | | 2,729 | | | | 14 | | | | 3,579 | | | | 31 | | Customer B | Scales & Pet Electronics Products | | | 1,738 | | | | 7 | | | | 1,563 | | | | 8 | | | | 1,662 | | | | 14 | | | Customer C | Scales | | | 1,969 | | | | 8 | | | | 2,435 | | | | 13 | | | | 1,599 | | | | 14 | | | Customer D | Scales | | | 14,145 | | | | 56 | | | | 8,472 | | | | 45 | | | | 1,115 | | | | 10 | | | | | | | | | | | | | | | | | | | | | | | | | | | | | | | | | | 21,726 | | | | 86 | | | | 15,199 | | | | 80 | | | | 7,955 | | | | 69 | |
| 20 | Long-term loan and long-term deposit received |
In November 2017, the Company signed an agreement with a property developer in Shenzhen--Shenzhen -- Fangda to cooperate in reconstructing and redeveloping the Shenzhen factory. Fangda is a wholly owned subsidiary of Fangda Group Co., Ltd. (“Fangda Group”), which is listed on the Shenzhen Stock Exchange. During the year ended March 31, 2018, the Company received approximately $3,199,000 from Fangda as a deposit according to the agreement. The Company will return this deposit in full (without interest) to Fangda when the redeveloped property is completed and the Company’s share of the redeveloped property is transferred to the Company, which is expected to take place in March 2023. The Company has treated this deposit as a long-term loan and discounted it up to March 2023. This liability is presented as a long-term loan of approximately $2,773,000 (2020: $2,438,000) and long-term deposit received of approximately $701,000 (2020: $647,000) in our consolidated balance sheet as of March 31, 2018.2021. Bonso Electronics International Inc. Notes to Consolidated Financial Statements (Expressed in United States Dollars)
Other income, net consisted of the following:
| | | Year Ended March 31, | | | | | 2016 | | | 2017 | | | 2018 | | | | | $ in thousands | | | $ in thousands | | | $ in thousands | | | | | | | | | | | | | | Gain on disposal of property, plant and equipment | | | 718 | | | | - | | | | - | | | Gain on disposal of intangible assets | | | 519 | | | | 79 | | | | - | | | Gain from deregistration of subsidiaries | | | - | | | | 22 | | | | - | | | Other gains | | | 724 | | | | 453 | | | | 342 | | | | | | | | | | | | | | | | | Other income, net | | | 1,961 | | | | 554 | | | | 342 | |
| | | Year Ended March 31, | | | | 2019 | | 2020 | | 2021 | | | | $ in thousands | | $ in thousands | | $ in thousands | | | | | | | | | | Gain on disposal of property, plant and equipment # | | | 5 | | | | — | | | | 237 | | | Government subsidies | | | 16 | | | | 227 | | | | 75 | | | Gain from investment in financial instruments | | | 45 | | | | 83 | | | | 75 | | | Other gains | | | 42 | | | | 125 | | | | 93 | | | | | | | | | | | | | | | | | Other income, net | | | 108 | | | | 435 | | | | 480 | |
# Land appreciation tax is calculated from the appreciation of the value of the land occupied by the property. During the fiscal year ended March 31, 2021, land appreciation tax of approximately $205,000 was charged during the disposal of properties, and the gain on disposal of property was net of this land appreciation tax. | 22 | Non-operating (expenses)income / income,(expenses), net |
Non-operating (expenses)income / income,(expenses), net comprises the following: | | | Year Ended March 31, | | | | 2019 | | 2020 | | 2021 | | | | $ in thousands | | $ in thousands | | $ in thousands | | Interest income | | | 237 | | | | 175 | | | | 140 | | | Interest expense | | | (139 | ) | | | (181 | ) | | | (158 | ) | | Foreign exchange (loss) / gain | | | (21 | ) | | | 42 | | | | (31 | ) | | | | | | | | | | | | | | | | Non-operating income / (expenses), net | | | 77 | | | | 36 | | | | (49 | ) |
| | | Year Ended March 31, | | | | | 2016 | | | 2017 | | | 2018 | | | | | $ in thousands | | | $ in thousands | | | $ in thousands | | | | | | | | | | | | | | Interest income | | | 15 | | | | 8 | | | | 191 | | | Interest expense | | | (113 | ) | | | (37 | ) | | | (72 | ) | | Foreign exchange (loss) / gain | | | (23 | ) | | | 258 | | | | (353 | ) | | | | | | | | | | | | | | | | Non-operating (expenses) / income, net | | | (121 | ) | | | 229 | | | | (234 | ) | | | | | | | | | | | | | | |
| 23 | Financial instruments at amortized cost |
For the year ended March 31, 2020, the Company purchased held-to-maturity debt securities with maturities of one year and three years from a financial institution and pledged them as collateral against certain secured bank loans. As of March 31, 2021, the carrying value of long-term held-to-maturity debt securities was $523,000. The gross unrealized holding loss of the held-to-maturity debt securities was $20,000 as of March 31, 2021. | 24 | Accrued charges and deposits |
Accrued charges and deposits consisted of the following: | | | March 31, | | | | 2020 | | 2021 | | | | $ in thousands | | $ in thousands | | | | | | | | Provision for individual income tax underpaid penalty | | | 1,893 | | | | 1,893 | | | Accrued provision for severance payment | | | 444 | | | | 568 | | | Accrued audit fee | | | 160 | | | | 160 | | | Accrued salary and wages | | | 313 | | | | 124 | | | Other | | | 364 | | | | 420 | | | | | | | | | | | | | | | | 3,174 | | | | 3,165 | | | | | | | | | | | |
FromThe company has entered into a lease agreement to lease out part of the Shenzhen factory to a third party starting from April 1, 20182021 up to June 30, 2018, the Company repurchased an additional 83,322 sharesMarch 31, 2022, with a monthly payment of its common stock for an aggregate purchase price ofRMB 112,500 (or approximately $262,000. F-45
F-45
|
|
|